CARS 2021: Computer Assisted Radiology and Surgery ...
119
ABSTRACTS CARS 2021: Computer Assisted Radiology and Surgery Proceedings of the 35th International Congress and Exhibition Munich, Germany, June 21–25, 2021 Ó CARS 2021 Preface CARS 2021 and Rethinking the Hospital and OR of the Future In addition to the traditional CARS topics and presentations, this year’s CARS Congress is revisiting and widening its scope towards both, the Digital Operating Room of the Future and the Hospital of the Future. This is expressed in the CARS 2021 overall theme: ‘‘Rethinking the Hospital and OR’’. In past CARS Congresses these themes have been addressed only as focused events, the ‘‘Hospital of the Future’’ as early as in 1995 [1] and the ‘‘OR 2020—The Operating Room of the Future’’ in CARS 2004 in close cooperation with Kevin Cleary and other colleagues in the USA [2], see Fig. 1. This resulted for example, also in the foundation of WG 24 DICOM in Surgery and the IHE Surgery domain. CARS being mainly concerned about the presence and future of the clinical domains of radiology and surgery recognizes, however, that fundamental developments in IT impact not only these two specific disciplines, but also the hospital of the future and even the healthcare system as a whole, in which radiology and surgery are expected to play a major role. Specifically, the goal of a newly established workshop for CARS 2021 ‘‘OR 2030 and Beyond’’ is to identify the clinical and technical requirements for the next generation operating room. OR 2030 is a sequel to OR 2020 [2] but also addressing themes of related devel- opments. The next 10 years with the horizon of 2030 are selected as a target timeframe, but with a possible glance also at what might be expected beyond this period. Below are some of the proposed themes the OR 2030 initiative will focus on in corresponding four working groups: • Group 1: Surgical robotics. • Group 2: Intraoperative imaging. • Group 3: Surgical informatics. • Group 4: Machine intelligence. Surgical robotics Advanced robotic systems for surgery continue to develop and will no doubt play a larger role in the future operating room. Robotic devices may also be one part of the digital ‘‘surgical cockpit’’ of the future. These devices may also be integrated with advanced imaging modalities or even be controlled by imaging data. This group will discuss these and related topics. Fig. 1 Surgical workflow simulation in a virtual OR [2] 123 Int J CARS (2021) 16 (Suppl 1):S1–S119 https://doi.org/10.1007/s11548-021-02375-4
-
Upload
khangminh22 -
Category
Documents
-
view
2 -
download
0
Transcript of CARS 2021: Computer Assisted Radiology and Surgery ...

ABSTRACTS
CARS 2021: Computer Assisted Radiology and SurgeryProceedings of the 35th International Congress and ExhibitionMunich, Germany, June 21–25, 2021
� CARS 2021
Preface
CARS 2021 and Rethinking the Hospital and OR
of the Future
In addition to the traditional CARS topics and presentations, this
year’s CARS Congress is revisiting and widening its scope towards
both, the Digital Operating Room of the Future and the Hospital of
the Future. This is expressed in the CARS 2021 overall theme:
‘‘Rethinking the Hospital and OR’’.
In past CARS Congresses these themes have been addressed only
as focused events, the ‘‘Hospital of the Future’’ as early as in 1995 [1]
and the ‘‘OR 2020—The Operating Room of the Future’’ in CARS
2004 in close cooperation with Kevin Cleary and other colleagues in
the USA [2], see Fig. 1. This resulted for example, also in the
foundation of WG 24 DICOM in Surgery and the IHE Surgery
domain.
CARS being mainly concerned about the presence and future of
the clinical domains of radiology and surgery recognizes, however,
that fundamental developments in IT impact not only these two
specific disciplines, but also the hospital of the future and even the
healthcare system as a whole, in which radiology and surgery are
expected to play a major role.
Specifically, the goal of a newly established workshop for CARS
2021 ‘‘OR 2030 and Beyond’’ is to identify the clinical and technical
requirements for the next generation operating room. OR 2030 is a
sequel to OR 2020 [2] but also addressing themes of related devel-
opments. The next 10 years with the horizon of 2030 are selected as a
target timeframe, but with a possible glance also at what might be
expected beyond this period. Below are some of the proposed themes
the OR 2030 initiative will focus on in corresponding four working
groups:
• Group 1: Surgical robotics.
• Group 2: Intraoperative imaging.
• Group 3: Surgical informatics.
• Group 4: Machine intelligence.
Surgical robotics
Advanced robotic systems for surgery continue to develop and will no
doubt play a larger role in the future operating room. Robotic devices
may also be one part of the digital ‘‘surgical cockpit’’ of the future.
These devices may also be integrated with advanced imaging
modalities or even be controlled by imaging data. This group will
discuss these and related topics.
Fig. 1 Surgical workflow simulation in a virtual OR [2]
123
Int J CARS (2021) 16 (Suppl 1):S1–S119
https://doi.org/10.1007/s11548-021-02375-4

Intraoperative imaging
Intraoperative imaging is becoming more and more widely used in the
operating room, from the ubiquitous C-arm to advanced systems such
as cone-beam CT and intraoperative MRI. This group will discuss
existing and new imaging modalities, including novel visualization
methods and tools, and their role in the operating room. Image fusion
and the use of multi-modality imaging will also be covered.
Surgical informatics
Surgical informatics is the collection, organization, and retrieval of
biomedical information relevant to the care of the patient. This topic
will not only include surgical data science but also surgical workflow,
since a starting point for analyzing surgical procedures could be the
workflow, and corresponding surgical simulation for education and
training. Standards and common interfaces, including communica-
tions architectures for the OR, should also be discussed here.
Machine intelligence and CARS
As computational power, the availability of data sets, computational
modeling methods and tools, and algorithmic advances continue to
increase, machine intelligence is playing a large role in medicine.
This working group will discuss how these advances will impact the
future surgical workflow, surgical simulation, and the operating room.
Synergistic interaction and collaboration between humans and intel-
ligent machines is expected to be the major focus of this group.
In addition to the above workshop activities, some members of the
CARS community have also been concerned about healthcare
strategies for the employment of modern technologies, which aim at
striking the right balance between quality, access for all and cost of
healthcare [1], i.e. ‘‘The Iron Triangle of Health Care’’. Developments
in technology relating to CARS greatly influence the result of these
endeavours, but other factors coming from economics, hospital
management and architecture, sociology, epidemiology, philosophy,
etc. must also be considered.
If these observations deserve high importance ratings, it may be
opportune to design and investigate possible future healthcare sce-
narios for different points in time. Specifically, to address those
questions with respect to CARS that provoke thoughts on the future of
healthcare for all stakeholders involved, i.e. the healthcare providers,
healthcare industry and patients. Below are some examples of major
themes and corresponding working groups which are planned to
become part of CARS 2021 and beyond:
• Group 1: Smart Hospital.
• Group 2: Cross-disciplinary Care.
Smart hospital
With the implementation of intelligent sensors, trackers, natural lan-
guage and gesture processing systems that are based on digital
infrastructure information, a smart and assistive hospital becomes a
realizable prospect. This group will not only discuss what type of data
would be of particular interest and by which means information and
knowledge (i.e. appropriate models) could be gathered, but also how
intelligent systems based on these categories of understanding could
improve patient care, or how they could impact the work profile of
healthcare workers.
Cross-disciplinary care
The integration of different disciplines to improve patient care pays
off not only in the operating room, e.g. during hybrid approaches, but
is also proven efficient for other indications, for example for trauma
management. Reuniting different medical fields and orchestrating
them for the realization of patient centered approaches could revo-
lutionize healthcare. This would require assistive methods and tools, a
modification of the hospital design as well as platforms for cross-
disciplinary collaboration, see Fig. 2. This group will discuss these
and related topics.
Finally, we should like to thank the enablers of the hybrid CARS
2021 Congress, in particular our Munich colleagues Nassir Navab,
Hubertus Feussner, Daniel Ostler, Alois Knoll and Tim Luth and all
their assistants, but also the authors who submitted a video version of
their presentations. As we expect a stimulating discussion on the
aforementioned topics during the virtual part of CARS 2021 Con-
ference, we look forward continuing the discussion (in-presence) on
the ‘‘Hospital and OR of the Future’’ in subsequent workshops (ex-
ploratory) later in the year 2021 and beyond.
Heinz U. Lemke, PhD and Dirk Wilhelm, MD
Munich, May 2021
References
[1] S. Dangelat, H. Lngruber, W. Kroy, W. D. Rauh, H. Ruden, H.
U. Lemke (1995) Hospital of the Future—the Good, the Bad and
the Ugly, Proceedings of CAR’95 Berlin, Springer.
[2] K. Cleary, S.K. Mun (2005) OR 2020 workshop report:
Operating room of the future, Article in International Congress
Series, May 2005, https://doi.org/10.1016/j.ics.2005.03.279.
Published by Elsevier B.V.
(3) C. Amato, L. McCanne, R. Yang, D. Ostler, O. Ratib, D.
Wilhelm, L. Bernhard (2021) The Hospital of the Future,
Proceedings of CARS 2021 Munich, Springer.
Fig. 2 Instead of treating patients in different departments separately,
an integrated cross-disciplinary approach is anticipated for the
hospital of the future [3]
S2 Int J CARS (2021) 16 (Suppl 1):S1–S119
123

CARS 2021
Computer Assisted Radiology and Surgery
Proceedings of the 35th International Congress and ExhibitionMunich, Germany, June 21–25, 2021
Int J CARS (2021) 16 (Suppl 1):S1–S119 S3
123

CARS 2021
Computer Assisted Radiology and Surgery
Proceedings of the 35th International Congress and ExhibitionMunich, Germany, June 21–25, 2021
Editors:
Professor Heinz U. Lemke, PhDInternational Foundation for
Computer Assisted Radiology and Surgery
Klettgaustrasse 20
79790 Kuessaberg, Germany
Professor Leonard Berliner, MDStaten Island University Hospital
Northwell Health
Department of Radiology
475 Seaview Avenue
Staten Island, NY 10305, USA
Professor Cristian A. Line, PhDRochester Institute of Technology
Biomedical Modeling, Visualization and
Image-guided Navigation Laboratory
160 Lomb Memorial Dr.
Rochester, NY 14623, USA
Professor Kensaku Mori, PhDNagoya University
Graduate School of Information Science
Information and Communications Headquarter
1 Furo-cho, Chikusa-ku
Nagoya 464-8601, Japan
Professor Dirk Wilhelm, MDKlinikum rechts der Isar der TUM
Klinik und Poliklinik fur Chirurgie
Ismaninger Str. 22
81675 Munich, Germany
Professor Hiroyuki Yoshida, PhDHarvard Medical School
Massachusetts General Hospital
Department of Radiology
Suite 400C, 25 Chardon Street
Boston, MA 02114, U.S.A.
Managing Editor (Editorial Office):
Franziska SchweikertInternational Foundation for
Computer Assisted Radiology and Surgery
Klettgaustrasse 20
79790 Kuessaberg, Germany
S4 Int J CARS (2021) 16 (Suppl 1):S1–S119
123

CARS 2021 President
Dirk Wilhelm, MDKlinikum rechts der Isar der TUM, Munich (DE)
CARS 2021 General Chairs
Hubertus Feussner, MDKlinikum rechts der Isar der TUM, Munich (DE)
Alois Knoll, PhDTechnical University of Munich, Garching (DE)
Alexander Lenz, PhDTechnical University of Munich, Garching (DE)
Tim Luth, PhDTechnical University of Munich, Garching (DE)
Petra Mela, PhDTechnical University of Munich, Garching (DE)
Nassir Navab, PhDTechnical University of Munich, Garching (DE)
Daniel Ostler, MScKlinikum rechts der Isar der TUM, Munich (DE)
Thomas Wendler, PhDTechnical University of Munich, Garching (DE)
CARS 2021 Scientific Medical Committee
Rickmer F. Braren, MDKlinikum rechts der Isar der TUM, Munich (DE))
Rudiger von Eisenhart-Rothe, MDKlinikum rechts der Isar der TUM, Munich (DE)
Marcus Makowski, MDKlinikum rechts der Isar der TUM, Munich (DE))
Bernhard C. Meyer, MDKlinikum rechts der Isar der TUM, Munich (DE)
Barbara Wollenberg, MDKlinikum rechts der Isar der TUM, Munich (DE)
CARS Congress Organizing Committee
Christos Angelopoulos, DDSColumbia University, New York, NY (US)
Elizabeth Beckmann, BScLanmark, Beaconsfield (GB)
Leonard Berliner, MDStaten Island University Hospital, New York, NY (US)
Ulrich Bick, MDCharite—University Medicine Berlin (DE)
Davide Caramella, MDUniversity of Pisa (IT)
Kevin Cleary, PhDChildren’s National Medical Center, Washington, DC (US)
Mario A. Cypko, PhDGerman Heart Institute Berlin (DE)
Takeyoshi Dohi, PhDTokyo Denki University (JP)
Kunio Doi, PhDChicago, IL (US)
Volkmar Falk, MD, PhDGerman Heart Institute Berlin (DE)
Allan G. Farman, PhD, DScChicago, IL (US)
Hubertus Feussner, MDKlinikum rechts der Isar, Munich (DE)
Guy Frija, MDGeorges Pompidou European Hospital, Paris (FR)
Miguel A. Gonzalez Ballester, PhDICREA-Pompeu Fabra University, Barcelona (ES)
Makoto Hashizume, MD, PhD, FACSKitakyushu Koga Hospital, Fukuoka (JP)
Yoshihiko Hayakawa, PhDKitami Institute of Technology, Hokkaido (JP)
Javier Herrero Jover, MD, PhDCentro Medico Teknon, Barcelona (ES)
David HilderbrandLakeway, TX (US)
Pierre Jannin, PhDUniversity of Rennes (FR)
Leo Joskowicz, PhDThe Hebrew University of Jerusalem (IL)
Shoji Kido, MD, PhDOsaka University Graduate School of Medicine (JP)
Heinz U. Lemke, PhD (Chair)International Foundation for CARS, Kuessaberg (DE)
Kensaku Mori, PhDNagoya University (JP)
Yoshihiro Muragaki, MD, PhDTokyo Women’s Medical University (JP)
Nassir Navab, PhDTechnical University Munich, Garching (DE)
Terry M. Peters, PhDRobarts Research Institute, London, ON (CA)
Osman M. Ratib, MD, PhD, FAHAUniversity Hospital of Geneva (CH)
Hans G. Ringertz, MD, PhDKarolinska Hospital, Stockholm (SE)
Yoshinobu Sato, PhDNara Institute of Science and Technology (JP)
Ramin Shahidi, PhDStanford University Medical Center (US)
Akinobu Shimizu, PhDTokyo University of Agriculture and Technology (JP)
Gabriele von Voigt, PhDLeibniz University Hannover (DE)
Dirk F. Wilhelm, MDKlinikum rechts der Isar der TUM, Munich (DE)
Hiroyuki Yoshida, PhDHarvard Medical School, Boston, MA (US)
Int J CARS (2021) 16 (Suppl 1):S1–S119 S5
123

Past Presidents
CAR ‘89 Heinz Oeser, MDBerlin (DE)
CAR ‘91 Auguste Wackenheim, MDStrasbourg (FR)
CAR ‘93 J. Oscar M.C. Craig, MDLondon (GB)
CAR ‘95 Alexander R. Margulis, MDSan Francisco (US)
CAR ‘97 Takahiro Kozuka, MDOsaka (JP)
CAR ‘98 Herbert Kaufmann, MDBerlin (DE)
CARS ‘99 Raffaella de Dominicis, MDFlorence (IT)
CARS 2000 Pierre Rabischong, MD, PhDMontpellier (FR)
CARS 2001 Toyomi Fujino, MD, PhDTokyo (JP)
CARS 2002 Kiyonari Inamura, PhDHyogo (JP)
CARS 2003 H.K. Huang, DSc, FRCR (Hon.)Los Angeles, CA (US)
CARS 2004 Karl-Heinz Hohne, PhDHamburg (DE)
CARS 2005 Martin Lipton, MD, FACR, FAHALos Angeles, CA (US)
CARS 2006 Hans G. Ringertz, MD, PhDStockholm (SE)
CARS 2007 Madjid Samii, MDHannover (DE)
CARS 2008 Javier Herrero Jover, MD, PhDBarcelona (ES)
CARS 2009 Bernard L. Crowe, BA, MPHCanberra, NSW (AU)
CARS 2010 Osman M. Ratib, MD, PhDGeneva (CH)
CARS 2011 Michael M. Vannier, MDChicago, IL (US)
CARS 2012 Davide Caramella, MDPisa (IT)
CARS 2013 Nassir Navab, PhDMunich (DE)
CARS 2014 Makoto Hashizume, MD, PhD, FACSFukuoka (JP)
CARS 2015 Javier Herrero Jover, MD, PhDBarcelona (ES)
CARS 2016 Davide Caramella, MDPisa (IT)
CARS 2017 Javier Herrero Jover, MD, PhDBarcelona (ES)
CARS 2018 Volkmar Falk, MD, PhDBerlin (DE)
CARS 2019 Pierre Jannin, PhDRennes (FR)
CARS 2020 Hubertus Feussner, MDMunich (DE)
Program Committee
Purang Abolmaesumi, PhDUniversity of British Columbia, Vancouver, BC (CA)
Samir Aboul-Hosn, MD, PhDHospital Plato, Barcelona (ES)
Reza Aghaeizadeh Zoroofi, PhDUniversity of Tehran (IR)
Asma’a Al-Ekrish, MDKing Saud University, Riyadh (SA)
Paul R. Algra, MD, PhDMedical Center Alkmaar (NL)
Russell J. Andrews, MDNASA Ames Research Center, Los Gatos, CA (US)
Christos Angelopoulos, DDSColumbia University, New York, NY (US)
Yoshinori Arai, PhD, DDSNihon University, Atsugi (JP)
Jumpei Arata, PhDKyushu University, Fukuoka (JP)
Eiichiro Ariji, DDS, PhDAichi-Gakuin University School of Dentistry, Nagoya (JP)
Paulo M. Azevedo-Marques, PhDUniversity of Sao Paulo, Ribeirao Preto (BR)
Frits H. Barneveld Binkhuysen, MD, PhDMeander Medical Center, Soest (NL)
John S.H. Baxter, PhDUniversity of Rennes (FR)
Erwin Bellon, PhDUniversity Hospitals Leuven (BE)
Dirk Beyersdorff, MDUniversity Hospital Hamburg-Eppendorf (DE)
Silvio Diego Bianchi, MDUniversity of Torino (IT)
Ulrich Bick, MDCharite—University Medicine Berlin (DE)
Uldis Bite, MDMayo Clinic, Rochester, MN (US)
Mario Ceresa, PhDPompeu Fabra University, Barcelona (ES)
Kiyoyuki Chinzei, PhDAIST, Tsukuba (JP)
Kevin Cleary, PhDChildren’s National Medical Center, Washington, DC (US)
D. Louis Collins, PhDMcGill University, Montreal, QC (CA)
Marcos Costa Kurzhals, PhDInternational University of Catalunya, Barcelona (ES)
Mario A. Cypko, PhDGerman Heart Institute Berlin (DE)
Andreas Dietz, MD, PhDUniversity Hospital Leipzig (DE)
Adrienn Dobai, MDSemmelweis University, Budapest (HU)
Kunio Doi, PhDChicago, IL (US)
Andre J. Duerinckx, MD, PhDHoward University College of Medicine, Washington, DC (US)
Georg Eggers, MD, DMD, PhDWeinheim Head Center (DE)
Randy E. Ellis, PhDQueen’s University, Kingston, ON (CA)
S6 Int J CARS (2021) 16 (Suppl 1):S1–S119
123

Masahiro Endo, MD, PhDShizuoka Cancer Center (JP)
Uwe Engelmann, PhDCHILI GmbH, Dossenheim/Heidelberg (DE)
Giuseppe Esposito, MDGeorgetown University Hospital, Washington, DC (US)
Caroline Essert, PhDUniversity of Strasbourg (FR)
Allan G. Farman, PhD, DScChicago, IL (US)
Mansoor Fatehi, MDFederico II University, Tehran (IR)
Josep Fernandez-Bayo, PhDUDIAT Diagnostic Center, Sabadell (ES)
Gabor Fichtinger, PhDQueen’s University, Kingston, ON (CA)
Martin Fiebich, PhDUniversity of Applied Sciences, Giessen (DE)
Michael H. Friebe, PhDOtto-von-Guericke-University, Magdeburg (DE)
Masakatsu G. Fujie, PhDWaseda University, Tokyo (JP)
Hiroshi Fujita, PhDGifu University Graduate School of Medicine (JP)
Shigekazu Fukuda, PhDNational Institute of Radiological Sciences, Chiba (JP)
Pablo Garcia Tahoces, PhDUniversity of Santiago de Compostela (ES)
Bernard Gibaud, PhDUniversity of Rennes (FR)
Maryellen L. Giger, PhDThe University of Chicago, IL (US)
Enrique J. Gomez-Aguilera, PhDPolytechnic University of Madrid (ES)
Miguel A. Gonzalez Ballester, PhDICREA-Pompeu Fabra University, Barcelona (ES)
Lixu Gu, PhDShanghai Jiaotong University (CN)
Horst K. Hahn, PhDFraunhofer MEVIS, Bremen (DE)
Hideaki Haneishi, PhDChiba University (JP)
Stefan Haßfeld, MD, MDSUniversity Hospital Dortmund (DE)
Yoshihiko Hayakawa, PhDKitami Institute of Technology, Hokkaido (JP)
Vicente Hernandez-Soler, MD, DDSValencia University, Alicante (ES)
Kenneth R. Hoffmann, PhDState University of New York at Buffalo, NY (US)
Hiroshi Honda, MD, PhDKyushu University, Fukuoka (JP)
Jaesung Hong, PhDDaegu Gyeongbuk Inst. of Science and Technology (KR)
Hidetaka Hontani, PhDNagoya Institute of Technology (JP)
Yimin Hu, PhDCancer Institute Hospital, Beijing (CN)
Juan A. Hueto Madrid, MDVall d’Hebron University Hospital, Barcelona (ES)
Koji Ikuta, PhDThe University of Tokyo (JP)
Hiroshi Iseki, MD, PhDWaseda University, Tokyo (JP)
Masayori Ishikawa, PhDHokkaido University, Sapporo (JP)
Hiroyasu Iso, MDOsaka University Graduate School of Medicine (JP)
Stephan Jacobs, MDGerman Heart Institute Berlin (DE)
Yulei Jiang, PhDThe University of Chicago, IL (US)
Nobuyuki Kanematsu, PhDNational Institute of Radiological Sciences, Chiba (JP)
Akitoshi Katsumata, DDS, PhDAsahi University, Gifu (JP)
Shigehiko Katsuragawa, PhDTeikyo University, Omuta (JP)
Zafrulla Khan, DDS, MSJames Graham Brown Cancer Center, Louisville, KY (US)
Bob B. Kiaii, MD, FRCSLondon Health Sciences Centre, ON (CA)
Shoji Kido, MD, PhDOsaka University Graduate School of Medicine (JP)
Ron Kikinis, MDHarvard Medical School, Boston, MA (US)
Young Soo Kim, MD, PhDHanyang University Medical Center, Seoul (KR)
Yasutomi Kinosada, MD, PhDGifu University Graduate School of Medicine (JP)
Masaki Kitajima, MD, PhDInternational University of Health and Welfare, Tokyo (JP)
Etsuko Kobayashi, PhDTokyo Women�s Medical University (JP)
Yo Kobayashi, PhDWaseda University, Tokyo (JP)
Cornelia Kober, PhDHamburg University of Applied Sciences (DE)
Yoshie Kodera, PhDNagoya University Graduate School of Medicine (JP)
Masahiko Koizumi, MDOsaka University Hospital (JP)
Christian Krettek, MDMedical School Hannover (DE)
Tomohiro Kuroda, PhDKyoto University Hospital (JP)
Florent Lalys, PhDTherenva SAS, Rennes (FR)
Heinz U. Lemke, PhDInternational Foundation for CARS (DE)
Lilian L.Y. Leong Fung, MBBSHong Kong College of Radiologists (HK)
Qiang Li, PhDChinese Academy of Sciences, Shanghai (CN)
Hongen Liao, PhDTsinghua University School of Medicine, Beijing (CN)
Cristian A. Linte, PhDRochester Institute of Technology (US)
Brent J. Liu, PhDUniversity of Southern California, Los Angeles, CA (US)
Xiongbiao Luo, PhDXiamen University (CN)
Ivan Macia Oliver, PhDVICOMTech, San Sebastian (ES)
Francisco Macule Beneyto, MDHospital Clinic, Barcelona (ES)
Koutaro Maki, DDS, PhDShowa University School of Dentistry, Tokyo (JP)
Rudiger Marmulla, MDUniversity Hospital of Heidelberg (DE)
Ken Masamune, PhDTokyo Women’s Medical University (JP)
Int J CARS (2021) 16 (Suppl 1):S1–S119 S7
123

Yoshitaka Masutani, PhDHiroshima City University (JP)
Yasushi Matsumura, MD, PhDOsaka University Hospital (JP)
Andreas Melzer, MD, DDSUniversities Dundee and St. Andrews (GB)
Mamoru Mitsuishi, PhDThe University of Tokyo (JP)
Carlos Monserrat-Aranda, PhDPolytechnic University of Valencia (ES)
Xavier Morandi, MD, PhDUniversity of Rennes (FR)
Kensaku Mori, PhDNagoya University (JP)
Parvin Mousavi, PhDQueen’s University, Kingston, ON (CA)
Seong K. Mun, PhDArlington Innovation Center Health Research (US)
Yoshihiro Muragaki, MD, PhDTokyo Women’s Medical University (JP)
Kikkeri S. Nagesh, MDSR.V. Dental College, Bangalore (IN)
Janne J. Nappi, PhDHarvard Medical School, Boston, MA (US)
Valery Naranjo Ornedo, PhDPolytechnic University of Valencia (ES)
Kwan-Hoong Ng, PhDUniversity of Malaya, Kuala Lumpur (MY)
Christopher Nimsky, MDUniversity Hospital Giessen and Marburg (DE)
Robert M. Nishikawa, PhDUniversity of Pittsburgh (US)
Fridtjof Nusslin, PhDTechnical University Munich (DE)
Steffen Oeltze-Jafra, PhDOtto-von-Guericke-University, Magdeburg (DE)
Isao Ohnishi, MD, PhDInternational University of Health and Welfare, Chiba (JP)
Yoshiharu Ohno, MD, PhDKobe University Graduate School of Medicine (JP)
Minoru Ono, MD, PhDThe University of Tokyo (JP)
Kaan Orhan, DDS, PhDAnkara University Faculty of Dentistry (TR)
Jose B. Pagador Carrasco, PhDMinimally Invasive Surgery Centre Jesus Uson (ES)
Javier Pascau, PhDUniversity Carlos III, Madrid (ES)
Ewa Pietka, PhDSilesian University of Technology, Gliwice (PL)
Andreas Pommert, PhDUniversity Hospital Hamburg-Eppendorf (DE)
Henri Primo, MSPrimo Medical Imaging Informatics, Chicago, IL (US)
Jorg Raczkowsky, PhDUniversity of Karlsruhe (DE)
Klaus Radermacher, PhDHelmholtz-Institute for Biomedical Engineering, Aachen (DE)
Stephen J. Riederer, PhDMayo Clinic, Rochester, MN (US)
Maria J. Ruperez-Moreno, PhDPolytechnic University of Valencia (ES)
Jose M. Sabater Navarro, PhDUniversity Miguel Hernandez, Elche (ES)
Hidetoshi Saitoh, PhDTokyo Metropolitan University of Health Sciences (JP)
Luisa F. Sanchez Peralta, PhDMinimally Invasive Surgery Centre Jesus Uson (ES)
Patricia Sanchez-Gonzalez, PhDPolytechnic University of Madrid (ES)
Warren S. Sandberg, MD, PhDVanderbilt University Medical Center, Nashville, TN (US)
Duygu Sarikaya, PhDUniversity of Rennes (FR)
Richard M. Satava, MDUniversity of Washington Medical Center, Seattle, WA (US)
Yoshinobu Sato, PhDNara Institute of Science and Technology (JP)
Kurt Alexander Schicho, MD, PhDVienna General Hospital (AT)
Wolfgang Schlegel, PhDGerman Cancer Research Center, Heidelberg (DE)
Robert A. Schmidt, MDUniversity of Chicago, IL (US)
Armin Schneider, PhDKlinikum rechts der Isar, Munich (DE)
Alexander Schramm, MD, DDS, PhDBundeswehrkrankenhaus Ulm (DE)
Rainer Schubert, MDUniversity for Health Sciences, Hall (AT)
Dirk Schulze, MD, DMDDigitales Diagnostikzentrum Breisgau, Freiburg (DE)
Achim Schweikard, PhDUniversity of Lubeck (DE)
Ramin Shahidi, PhDStanford University Medical Center (US)
Mitsuo Shimada, MD, PhDTokushima University (JP)
Akinobu Shimizu, PhDTokyo University of Agriculture and Technology (JP)
Amber Simpson, PhDQueen’s University, Kingston, ON (CA)
Eduardo Soudah, PhDPolytechnic University of Catalonia, Barcelona (ES)
Stefanie Speidel, PhDNational Center for Tumor Diseases, Dresden (DE)
Matthaus Stohr, MDUniversity Hospital Leipzig (DE)
Geert J. Streekstra, PhDAcademic Medical Center, Amsterdam (NL)
Nobuhiko Sugano, MD, PhDOsaka University Graduate School of Medicine (JP)
Kazuro Sugimura, MDKobe University Graduate School of Medicine (JP)
Tae Suk Suh, PhDThe Catholic University of Korea, Seoul (KR)
Iori Sumida, PhDOsaka University Graduate School of Medicine (JP)
Russell H. Taylor, PhDJohns Hopkins University, Baltimore, MD (US)
Ulf K.-M. Teichgraber, MD, PhDUniversity Hospital Jena (DE)
Bart M. ter Haar Romeny, PhDEindhoven University of Technology (NL)
Klaus D. Toennies, PhDOtto-von-Guericke-University, Magdeburg (DE)
Thomas Tolxdorff, PhDCharite—University Medicine Berlin (DE)
Noriyuki Tomiyama, MD, PhDOsaka University Graduate School of Medicine (JP)
Fukai Toyofuku, PhDKyushu University, Fukuoka (JP)
S8 Int J CARS (2021) 16 (Suppl 1):S1–S119
123

Jocelyne Troccaz, PhDUniversity of Grenoble, La Tronche (FR)
Jayaram K. Udupa, PhDUniversity of Pennsylvania, Philadelphia, PA (US)
Tamas Ungi, PhDQueen’s University, Kingston, ON (CA)
Michiel W.M. van den Brekel, MD, PhDThe Netherlands Cancer Institute, Amsterdam (NL)
Eric vanSonnenberg, MDSt. Joseph’s Hospital and Medical Cent., Phoenix, AZ (US)
Gabriele von Voigt, PhDLeibniz University Hannover (DE)
Kirby G. Vosburgh, PhDCIMIT, Boston, MA (US)
Shinichi Wada, PhDNiigata University Faculty of Medicine (JP)
Andreas Wahle, PhDThe University of Iowa (US)
Stefan Weber, PhDUniversity of Berne (CH)
Michael Wich, MDUnfallkrankenhaus Berlin (DE)
Dirk Wilhelm, MDKlinikum rechts der Isar der TUM, Munich (DE)
Takaharu Yamazaki, PhDSaitama Institute of Technology (JP)
Guang-Zhong Yang, PhDShanghai Jiao Tong University (CN)
Byung-Ju Yi, PhDHanyang University, Ansan (KR)
Hiroyuki Yoshida, PhDHarvard Medical School, Boston, MA (US)
Toshiki Yoshimine, MDOsaka University Graduate School of Medicine (JP)
Int J CARS (2021) 16 (Suppl 1):S1–S119 S9
123

Computer Assisted Radiology and Surgery—35th International Congress and Exhibition
Chairs: Ulrich Bick, MD (DE), Dirk Wilhelm, MD (DE)
S10 Int J CARS (2021) 16 (Suppl 1):S1–S119
123

Image reconstruction using end-to-end deep learning
for low-dose CT
D. Bauer1, C. Ulrich1, A. K. Golla1, T. Russ1, C. Tonnes1, J.
Leuschner2, M. Schmidt2, L. Schad1, F. Zollner1
1Heidelberg University, Chair in Computer Assisted Clinical
Medicine, Mannheim, Germany 2University of Bremen, Center
for Industrial Mathematics, Bremen, Germany
Keywords Image Reconstruction, Computed Tomography (CT),
Low-dose, Deep Learning
Purpose
The development of techniques for dose reduction is a major research
topic in CT imaging, as it reduces the potential risk of cancer
induction from CT radiation. To reduce the CT dose it is necessary to
lower the overall photon count. However, this leads to a deterioration
of image quality, as the acquired projection data is noisy. Classical
iterative reconstruction algorithms are able to provide images of
increased quality compared to a conventional filtered back projection
(FBP). However, they do not perform robustly with heavily under-
sampled data and the computation is time-intensive due to repeated
forward and back projection operations.
We present a fast end-to-end deep learning reconstruction method
trained on the Low-Dose Parallel Beam (LoDoPaB)-CT challenge
dataset [1]. The network performs the entire image reconstruction
from the sinogram to the image. The network imitates all typical steps
of a conventional image reconstruction. The sinogram is refined and
filtered before being back projected into the image space, where the
images are further refined. We compare the reconstructions of our
network to the FBP and to a learned iterative method called Learned
Primal–Dual, which won the LoDoPaB-CT challenge.Methods
The concept of our network is based on the iCT-Net by Li et al. [2],
which in turn is inspired by the common filtered back projection. The
reconstruction process is learned end-to-end, i.e. the network input is
the sinogram and the output is the reconstructed image. The full
network architecture is displayed in Fig. 1.
First, disturbances in the raw measurement data, such as excessive
noise or beam hardening, are suppressed as much as possible via
3 9 3 convolutions (refining layers). Using 10 9 1 convolutions, the
corrected sinogram is then filtered (filtering layers). The filtered
sinogram has the same size as the input sinogram. Afterwards, a back
projection step projects the refined and filtered sinogram data into the
image space. This is realized by a d 9 1 convolution with N2 output
channels without padding, where d is the number of detectors in the
sinogram and N is the output image size. This convolution corre-
sponds to a fully connected layer for each viewing angle, as it
connects every detector element with every pixel in the image space.
Thus, this network can be trained with sinograms acquired with dif-
ferent beam geometries, such as fan beam and parallel beam.
Afterwards, the results for each view are reshaped to NxN sized
images and rotated according to the acquisition angle. The rotated
images are linearly interpolated and cropped to maintain an image
size of NxN. The back projected image is then obtained by combining
all views with a 1 9 1 convolution. Finally, a U-Net is used for
further refinement of the image output.
As training data for our network we used the 35,820 sample pairs
of the publicly available LoDoPaB dataset. A sample pair consists of
a 362 9 362 pixel CT image and a low-dose sinogram with 513
projection beams in parallel-beam geometry and 1000 projection
angles. Simulated Poisson-distributed noise was added to the sino-
gram based on a photon count of 4096 per detector pixel before
attenuation. To considerably lower the GPU memory requirements,
we downsampled the sinograms to 500 projection angles. Training
was performed with a SSIM loss function. The reconstructions were
evaluated using the peak signal-to-noise ratio (PSNR) and structural
similarity (SSIM) on 3678 challenge sample pairs.Results
In Fig. 2 a reconstructed slices using the filtered back projection and
our network are compared to the ground truth. The FBP is very noisy
due to the noise in the sinogram data. In contrast, the reconstruction of
our network is virtually noise free, as can be seen by the homoge-
neous liver. Slight over-smoothing is observed, which might lead to
blurring of objects. To avoid this, we will consider to reduce the
impact of the U-Net in the future. The SSIM and PSNR evaluation
metrics for the FBP, our network and Learned Primal–Dual are shown
in Table 1. Much higher SSIM and PSNR demonstrate that our net-
work provides superior reconstructions compared to the FBP. While
our network is only slightly worse than Learned Primal–Dual in terms
of SSIM, the PSNR is substantially lower. The quality of our
reconstruction could be increased if we used the full 1000 views
instead of only 500. Furthermore, for training we only used the
simulated noisy sinograms of the LoDoPaB dataset. To enhance the
performance of our network, the (non-public) noiseless sinograms
could be used to pre-train the refining and filtering layers. Although
our approach slightly underperformed compared to a state-of-the-art
method for high noise scenarios, we expect our network to provide
competitive results even with very sparse projection data. We will
investigate this in a subsequent study.
Fig. 1 End-to-end CT reconstruction network architecture
Fig. 2 Reconstructions using the filtered back projection and our
network compared to the ground truth
Table 1 SSIM and PSNR evaluation metrics for different recon-
struction techniques
Method PSNR : SSIM :
FBP 30.2 ± 2.6 0.73 ± 0.13
Our network 33.7 ± 2.8 0.85 ± 0.12
Learned primal–dual 36.3 ± 3.7 0.87 ± 0.12
Int J CARS (2021) 16 (Suppl 1):S1–S119 S11
123

Conclusion
We presented an end-to-end deep learning CT reconstruction algo-
rithm, which was superior to a common FBP for low-dose image
reconstruction. In the future the ability of the network to mitigate
metal artefacts will be investigated, by training it with sinograms
containing simulated metal signals.
References
[1] Leuschner J, Schmidt M, Baguer DO, Maaß P (2019) The
lodopab-ct dataset: A benchmark dataset for low-dose CT
reconstruction methods. arXiv preprint arXiv:1910.01113.
[2] Li Y, Li K, Zhang C, Montoya J, Chen GH (2019) Learning to
reconstruct computed tomography images directly from sino-
gram data under a variety of data acquisition conditions. IEEE
transactions on medical imaging, 38(10), 2469-2481.
Micro-CT-assisted cross-modality super-resolution
of clinical CT: utilization of synthesized training dataset
T. Zheng1, H. Oda2, S. Nakamura2, M. Mori3, H. Takabatake4, H.
Natori5, M. Oda6, K. Mori1,7,8
1Nagoya University, Graduate School of Informatics, Nagoya, Japan2Nagoya University, Graduate School of Medicine, Nagoya, Japan3Sapporo Kosei General Hospital, Sapporo, Japan 4Sapporo Minami-
sanjo Hospital, Sapporo, Japan 5Keiwakai Nishioka Hospital,
Sapporo, Japan 6Nagoya University, Information
and Communications, Nagoya, Japan 7Nagoya University,
Information Technology Center, Nagoya, Japan 8National Institute
of Informatics, Research Center of Medical BigData, Tokyo, Japan
Keywords Unpaired super-resolution, Microstructure reconstruction,
Multi-modality image synthesis, Lung cancer CT
Purpose
This paper proposes an unsupervised super-resolution (SR) method,
which increases clinical CT resolution into the micro-focus X-ray CT
(lCT)-level. Due to the resolution limit of clinical CT, it is chal-
lenging to observe pathological information at the alveoli level. lCT
scanning allows the acquisition of lung with much higher resolution.
Thus, SR of clinical CT volumes to lCT-level is expected to help
diagnosis of lung disease.
Typical SR methods require pairs of low-resolution (LR) and high-
resolution (HR) dataset for training. Unfortunately, aligning paired
clinical CT (LR) and lCT (HR) volumes of human tissues is infea-
sible. Thus, we resuire an unsupervised SR method, which utilizes
unpaired dataset of LR an HR images. Previous unsupervised method
named SR-CycleGAN [1] is be hard to convergence in the training
phase, because SR-CycleGAN needs to perform SR and domain
translation in a single network. We tackle this problem by proposing a
two-stage approach. First stage is building corresponding lCT and
clinical CT pairs dataset by synthesizing clinical CT volumes from
lCT volumes. Second stage, we use simulated clinical CT—lCT
volume pairs from the dataset to train an FCN (fully convolutional
network) for SR of clinical CT volumes. Proposed method outper-
formed SR-CycleGAN both quantitatively and qualitatively.
The contributions of our proposed method are: (1) trans-modality
super-resolution from clinical CT to lCT-level utilizing synthesizing
training dataset and (2) an SR approach for clinical CT to lCT-level
that works without any paired clinical CT—lCT data.
Methods
OverviewGiven a set of clinical CT volumes and lCT volumes, the method
would learn to perform SR of a clinical CT volume x into a lCT—
like SR volume xSR. The method consists of two stages. The first
stage is building synthesized clinical CT—lCT dataset D using a
synthesizing network. The second stage is a SR network trained on
the dataset D, which learns a mapping from clinical volumes x (LR
volumes) to lCT volumes y (HR volumes).
For inference, a clinical CT volume x is input into the SR network
and we will obtain volume xSR as the SR output.
Stage 1: Building synthesized clinical CT—lCT dataset
We design a synthesizing network which generates synthesize clinical
CT-like volumes from lCT volumes. The synthesizing network is
designed following CycleGAN [2] with additional loss terms based on
SSIM. We train the synthesizing network using clinical CT and
downsampled lCT volumes. We use trained synthesizing network for
synthesizing clinical CT-like volumes x’ from lCT volumes y. Large
amount of paired x’ and y forms synthesized clinical CT—lCT
dataset D.Stage 2: Training SR network using synthesized clinical CT—
lCT datasetBy building synthesized clinical CT—lCT dataset D, we are able to
train a SR network f using clinical CT-like volumes x’ as input and
lCT volumes y as corresponding ground truth. We use an FCN as the
network for SR. We use pixel-wise l2 loss as loss function between
network output f(x’) and ground truth y to train the network.
To perform SR of a clinical CT volume, the clinical CT volume is
splitted into patches of n 9 n (pixels) as input into trained SR net-
work. Then we obtain SR output of 8n 9 8n (pixels). We combine
multiple SR outputs as the final SR result of the whole CT volume.Results
In stage 1, we used eight clinical CT volumes and six lCT volumes.
In stage 2, we used nine lCT volumes. For training each network in
stage 1 and stage 2, 2000 2D patches were extracted from each
clinical CT and lCT volume. The clinical CT volumes were acquired
from lung cancer patients, with resolution 0.625 9
0.625 9 0.6 mm3/voxel. The lCT volumes were of lung specimens
resected from lung cancer patients, with resolutions in the range of
(42–52) 9 (42–52) 9 (42–52) lm3/voxel. We implemented our
proposed method with PyTorch.
The size of patches extracted from the clinical CT volumes were
set as 32 9 32 pixels, while patches extracted from the lCT volumes
were set as 256 9 256 pixels. SR was conducted eight-times
enlargement for each axis (32 9 32 to 256 9 256 pixels).
We utilized two clinical CT volumes for qualitative evaluation.
We compare the SR results with the previous method SR-CycleGAN
[1]. We used four lCT volumes for quantitative evaluation, as shown
in Table 1. The qualitative results are shown in Fig. 1. Compared
with the SR-CycleGAN, the edge of tube structures are clearly shown
in the SR results of the proposed method.
Table 1 Quantitative evaluation of previous method [1] and proposed
method
Previous method [1] Proposed method
PSNR 11.79 13.2
SSIM 0.36 0.68
S12 Int J CARS (2021) 16 (Suppl 1):S1–S119
123

Conclusion
We proposed a SR method from clinical CT volumes to lCT level
with synthesis of the training dataset. To the best of our knowledge,
our proposed method is the first study that performs unsupervised SR
with synthesized dataset.
Future work includes introduction of a more precise quantitative
evaluation approach. Quantitative evaluation approach was conducted
by evaluating how well synthesized clinical CT can be reconstructed
to lCT. We plan to make clinical CT—lCT volume pairs by taking
clinical CT volumes of lung specimen.
References
[1] Zheng T, Oda H, Moriya T, Sugino T, Nakamura S, Oda M,
Mori M, Takabatake H, Natori H, Mori K (2020) Multi-modality
super-resolution loss for GAN- based super-resolution of clinical
CT images using micro CT image database. Prcoc. SPIE,
Medical Imaging: 11313–3
[2] Zhu J.Y, Park T, Isola P, Efros A.A (2017) Unpaired image-to-
image translation using cycle-consistent adversarial networks.
Proceedings of the IEEE International Conference on Computer
Vision: 2223–2232
IRDBB: Archiving and communication model
of curated imaging data for research and machine
learning
J. Spaltenstein1, G. Pasquier2, N. van Dooren1, P. Mildenberger3, B.
Gibaud2, O. Ratib1
1University of Geneva, Radiology and medical informatics, Geneve,
Switzerland 2University of Rennes, Faculte de Medecine, Rennes,
France 3Johannes Gutenberg-Universitat, Klinik fur Radiologie,
Mainz, Germany
Keywords DICOM, Imaging Database, Imaging biobanks, Big Data
Purpose
With the development of a growing number of Artificial Intelligence
(AI) and autonomous image analysis tools, there is a growing need for
IT platforms that provide a structured approach to data management
and communication of curated imaging data that can serve for
development and testing of a new generation of Deep Learning AI
tools. Our goal was to develop an image archiving platform for
DICOM and non-DICOM data that can be well referenced and
retrieved using a classifier tool based on an ontology that can be
adapted and designed to explicitly define all the information that is
used for different analysis and research protocols.Methods
A tailored implementation of such a model was developed for a
platform dedicated to sharing imaging data, along with the associated
dosimetric data pertaining to the radiation doses absorbed by specific
organs. This platform called Imaging and Radiation Dose Biobank
(IRDBB) was designed to support a multicentric European project
(MEDIRAD ref.) for the development and validation of simulation
models to measure the effects of low radiation dose in the context of
medical procedures, see Fig. 1. An interactive platform allows users
to assign specific ontology References to each dataset by which the
data can be retrieved in selected cohorts based on a well-defined
syntax.Results
A first instance of such a model was implemented to host imaging
data and analysis results in a common sharable database.
This IRDBB platform consists of the following components:
• A web server (IRDBB_UI) which manages user features for
uploading of images and database requests;
• The open-source KHEOPS image archive platform that also
provides DICOMweb access to the images for third-party analysis
software and results reporting systems.
• A FHIR repository used to manage non-DICOM data;
• A semantic data manager, referred to as the Semantic Translator,
used to translate the metadata of the imported images into a
semantic graph whose elements (i.e. nodes and arcs) are classified
according to the OntoMEDIRAD ontology designed specifically
to standardize the semantics of information used by the
MEDIRAD project;
• A semantic database implemented using the Stardog3 RDF
triplestore;
• An Identity and Access Manager (IAM) implemented using
Redhat’’s Keycloak software.
Data generated by different groups of the project as well as results
derived from specific analysis and modeling tools are hosted on the
IRDBB server and can be retrieved through specific query templates
based on the defined ontology.
A special extension to the platform called the ‘‘Report Provider’’
allows selected sets of data to be used by a remote server that
Fig. 1 SR results of proposed method and previous method (SR-
CycleGAN). Upper half: generating synthesized clinical CT from
lCT and training the SR network. Lower half: SR results. Compared
with SR-CycleGAN, the edges of tube structures such as bronchus are
clearly shown in the results of the proposed method (red arrows)
Fig. 1 General architecture of IRDBB architecture
Int J CARS (2021) 16 (Suppl 1):S1–S119 S13
123

performs specific analysis or processing functions that may return
results in different format (i.e. graphs, tables, derived images or
DICOM structured reports). This mechanism was specifically
designed to allow data to be sent and processed by remote AI or
image processing platforms.Conclusion
The current implementation of our model of curated imaging data for
research and machine learning has shown its ability to serve for
multidisciplinary research and for the development of analysis tools
on a variety of imaging data. It demonstrates the need for classifi-
cation and curation of imaging data based on a standard ontology that
defines the semantics used to query and retrieve data for specific
research purposes. The web-based KHEOPS archive provides con-
venient access to the imaging data as well as web-services destined to
analysis and AI tools residing on remote platforms.
This work serves as a proof of concept of a new architecture of
large imaging databases (Big Data) that are becoming essential for
future developments of AI and machine learning systems.
Investigation of visibility of head-mounted display
for vascular observation
T. Shinohara1, A. Morioka1, N. Nakasako1
1Kindai University, Kinokawa-shi, Japan
Keywords visibility, head-mounted display, display resolution, vas-
cular observation
Purpose
Three-dimensional (3D) representations of objects help us intuitively
understand their shapes. The 3D representation of medical images
obtained using several modalities, including computed tomography
(CT) and magnetic resonance imaging, is indispensable for morpho-
logical and anatomical diagnoses and surgical treatments. However,
organs with complicated structures, such as vasculatures, remain
difficult to observe even if they are three-dimensionally displayed on
an ordinal two-dimensional (2D) monitor. This is because their depth
of the 3D representations is hardly recognized on the 2D monitor. A
head-mounted display (HMD) is often used for medical purposes,
such as image guidance and augmented reality in surgery. One of the
advantages of using the HMD is to represent objects stereoscopically
such that their depth can be easily recognized. In our previous study,
we proposed a vascular virtual handling system [1] using which
physicians can observe the vasculature stereoscopically using the
HMD as the blood vessels appear more realistically, and handle blood
vessels using a 3D pointing device for endovascular intervention
assistance. An experiment to find a pseudo lesion embedded into the
cerebral artery showed that the visibility of this system for vascular
observation was superior to that of the system using an ordinal 2D
monitor instead of the HMD [2]. This result indicates that the
stereoscopic representation effectively represents objects with com-
plicated structures such as vasculatures. This paper investigates the
visibility of the HMD for vascular observation in more detail through
an experiment similar to that in our previous study. Particularly, the
relevance of the lesion size to the visibility of the HMD was inves-
tigated using pseudo lesions of three different sizes.Methods
The HMD used in this study has a sensor to track head movement so
that the user’s viewpoint can change according to the head position
and its attitude. Changing the viewpoint provides a sense of reality as
if the blood vessels appear to be realistic such that the blood vessel is
intuitively observed. In this study, the visibility of the HMD for
vascular observation was investigated through an experiment to find a
pseudo lesion embedded into the cerebral artery as shown in Fig. 1.
The pseudo lesion was a cube with an edge length that was 0.9 times
larger than the blood vessel’s diameter at the position. Pseudo lesions
of three different sizes were used in this study to investigate the
relevance of the lesion size to the visibility of the HMD. The edge
length of the small, medium, and large pseudo lesions were approx-
imately 2, 4, and 6 mm, respectively. An examinee sought the pseudo
lesion by translating, rotating, and scaling the vasculature. The time
taken by the examinee to find the pseudo lesion was used as a measure
of visibility. The examinees included 12 males and females in their
twenties who were students in the department of science and engi-
neering, not medicine. The same experiment was carried out using the
2D monitor instead of the HMD to compare the visibility of the HMD.
Six examinees used the HMD before using the 2D monitor, while the
other six examinees used the 2D monitor before using the HMD,
considering the habituation effect. The display resolutions of the
HMD and the 2D monitor were 1080 9 1200 pixels per eye and
1920 9 1080 pixels, respectively.Results
Table 1 shows the average times taken for the 12 examinees to find
the pseudo lesions of the three different sizes using the HMD and the
2D monitor. The time taken for the examinee to find the small-sized
pseudo lesions using the HMD was significantly shorter than that
using the 2D monitor (p\ 0.05). The times taken for the examinee to
find the pseudo lesions of the other two sizes using the HMD were not
significantly different from those using the 2D monitor, suggesting
that smaller objects are more visible when using the HMD than the
2D monitor. This might be because the stereoscopic representation of
objects by the HMD enables depth recognition of objects.Conclusion
This study investigated the visibility of the HMD for vascular
observation through an experiment to find pseudo lesions of three
different sizes embedded into the cerebral artery using the HMD. The
time taken to find the small pseudo lesion using the HMD was
Fig. 1 Cerebral artery and embedded pseudo lesion (inside red
circle)
Table 1 Average times (mean [s] ± standard deviation) taken by the
12 examinees to find the pseudo lesions of three different sizes using
HMD and 2D monitor
Size of lesion Small sizea Medium size Large size
HMD 90.4 ± 69.9 67.5 ± 87.0 40.6 ± 67.3
2D monitor 218.7 ± 192.0 50.6 ± 52.9 54.0 ± 51.6
a p\ 0.05
S14 Int J CARS (2021) 16 (Suppl 1):S1–S119
123

significantly shorter than that using the 2D monitor, suggesting that
the stereoscopic representation is effective for observing small deli-
cate objects such as the vasculature. This finding indicates that the
HMD is also useful for the diagnosis of medical images. We aim to
investigate the availability and superiority of the HMD to the 2D
monitor in observing medical images for diagnosis and surgery under
a more realistic clinical situation in the future.
References
[1] Shinohara T, Nishida Y, Nakasako N, Ogura N (2018) Vascular
virtual handling in three-dimensional image for endovascular
intervention assistance. International Journal of Computer
Assisted Radiology and Surgery 13 (Suppl 1): S29-S30
[2] Shinohara T, Fukata K, Nakasako N (2019) Considering
visibility of vascular virtual handling system for endovascular
intervention assistance. International Journal of Computer
Assisted Radiology and Surgery 14 (Suppl 1): S6-S7
Dimensionality reduction for mass spectrometry
imaging
R. Ellis1, E. Ritcey1, R. Theriault1
1Queen’s University, School of Computing, Kingston, Canada
Keywords Mass spectrometry, Digital Pathology, Image Processing,
Breast Cancer
Purpose
This works aims to provide pathologists with real-time use of ana-
lytical chemistry in histopathologic studies, with specific application
to breast cancer. Breast cancer is one of the most common forms of
cancer among women in North America. Although lumpectomies are
a generally successful procedure, the current absence of intraoperative
margin analysis has resulted in a high re-excision rate for the surgery.
Desorption electrospray ionization [1] is a method for Mass Spec-
trometry Imaging (MSI) that enables rapid analysis of tissue under
ambient pressure and without causing damage to the tissue. A large
challenge with the processing of MSI results is the sheer volume of
data produced; an MSI scan of a 5 mm 9 5 mm tissue sample may
have 500 9 500 9 1000 entries. This challenges typical pre-pro-
cessing techniques as well as the application of artificial intelligence
techniques in a precise and efficient manner. As a result, the majority
of MSI analysis for visualization has been univariate, investigating
individual molecules as potential biomarkers for breast cancer. Recent
work suggests application of multivariate techniques may assist in
tissue identification in the large dimensionality space. Our goal was to
implement dimensionality reduction techniques for MSI data to
achieve reduced computation times while maintaining the quality of
multivariate cancer versus benign tissue analysis. This could enable
real-time clinical applications of multivariate techniques for breast
cancer analysis and detection.Methods
The data used for this study included 9 slices of thin excised breast
tumor from 8 patients for which we had both complete histology and
MSI data. The samples contained a mixture of cancerous and benign
tissue. The sizes of the images ranged from 170 9 122 pixels to
190 9 318 pixels. Each pixel of each MSI image initially contained
1000 mass–charge abundances. Alignment of mass spectra across the
images produced a single mass spectrum with mass–charge values
consistent across all samples; this increased the dimension of each
mass spectra to 3240 mass–charge abundances.
Seven reduction methods were extensively tested; the method we
present had the best performance in terms of amount of reduction and
computation time. The reduction began with decimation of the data
by removing the 90% least abundant mass–charge values across each
MSI acquisition. A graph clustering method in a proximal gradient
descent framework was performed on the decimated data to segment
the foreground, with background pixels removed. Non-negative
matrix factorization (NMF) with Nonnegative Double Singular Value
Decomposition (NNDSVD) initialization was performed on the
foreground pixels. The 15 most relatively abundant mass–charge
values from the top four components of the factorization were
selected as important features for tissue subspace identification. The
union of the important features of each sample formed the final fea-
ture space. The methods used in [2] were used to produce distance
maps for the reduced data to show the presence of benign and
malignant tissue in each image via multivariate analysis of the
reduced data.
The same pipeline, without reduction, was also performed on the
original, aligned data set referred to as the full data. Distance maps
were produced from the foreground pixels by using the same multi-
variate techniques that were used on the reduced data. The distance
maps were used as a control to compare the distance maps produced
by the reduced data. Comparison of the distance maps were made
quantitatively by calculating the mutual information (MI) similarity
value between the cancer components of the distance maps.Results
Our method produced a 94% dimensionality reduction, reducing the
number of mass–charge abundances from 3240 to 197 abundances.
The reduction is visualized in Fig. 1. Mass–charge values greater than
640 Da were removed in the reduction while ions ranging from 77 Da
to 638 Da were selected as important features for tissue identification.
On a laptop computer, this produced a 75% reduction in total com-
putation time (Table 1) while maintaining quality of the distance
maps (Fig. 2). Statistical comparison via MI of the distance methods
are presented in Table 2. The MI value was on average 0.98 and did
not decrease below 0.93, suggesting nearly identical distance maps
between full data and reduced data.Conclusion
This work demonstrated a dimensionality reduction pipeline for MSI
data that had very limited effects on multivariate analysis for tissue
identification. The reduction-selected 197 mass–charge values were
effective at distinguishing malignant from presumably benign tissue.
This unsupervised reduction method identified ions in the range of
77 Da to 638 Da as being important features for detection. The range
of selected mass–charge values suggests that fatty acids may play a
part in distinguishing benign and malignant regions in excised breast
tissue.
Table 1 Computation times, in s, for creating the distance maps with
the reduced data and with full data on a laptop computer
Computation time (s)
Reduced 531
Full 2244
Fig. 1 The mass–charge values in the full dataset and the reduced
dataset
Int J CARS (2021) 16 (Suppl 1):S1–S119 S15
123

This work was conducted to investigate how dimensionality
reduction might enable decreased run time and clinical application of
MSI analysis. Future work could include using a larger sample size
and investigation of how a mix of cancer types performs with
dimensionally reduced data. This pipeline could be applied to other
tissue types to further investigate its applicability in a clinical setting.
The selected mass–charge values require further investigation,
preferably with analytical chemistry techniques, to investigate their
biological significance and potential for biomarker discovery. This
method could be used to implement fast run times without loss of
valuable information for tissue identification in breast cancer surg-
eries and to enable diagnosis in a clinical setting, which is yet to be
seen in breast cancer surgery.
References
[1] Takats Z, Wiseman JM, Gologan B, Cooks RG: Mass spec-
trometry sampling under ambient conditions with desorption
electrospray ionization. Science 306(5695):471–473, 2004.
[2] Theriault RL, Kaufmann M, Ren KYM, Varma S, Ellis RE.
Metabolomics Patterns of Breast Cancer Tumors Using Mass
Spectrometry Imaging. Int J Comput Assist Radiol Surg,
accepted Dec. 2020.
KHEOPS: Open source platform for storage
and sharing of imaging biobanks
J. Spaltenstein1, N. Roduit1, G. Pasquier1, N. van Dooren1, S. Cicciu1,
O. Ratib1
1University of Geneva, Geneva, Switzerland
Keywords DICOM, Imaging Database, Open Source, Big Data
Purpose
To provide an Open-Source web-based platform for storage, com-
munication, wide distribution, processing and analysis of large
collections of medical images.Methods
We developed an Open-Source framework to support open-access and
research repositories of medical images geared specifically toward
multi-centric collaborative initiatives featuring [1]:
• Fully DICOM-compliant image archive
• Open databank of medical images and multimodality imaging
biomarkers
• Facilitate sharing of curated and consented data between research
groups
• User-friendly cockpit for the management and sharing of images
by users
• Imbedded HTML5 viewer (OHIF) as well as links to popular
open-source viewers (OsiriX/Horos, Weasis)
• Open web-based APIs for developers of image analysis and data
mining tools.
Its highly secured and flexible cockpit allows user to manage and
exchange data through a simple paradigm of ‘‘shared albums’’ that
consists of subset of data from multiple sources. The use of unique
and revocable tokens allows users to manage and monitor the use of
their shared data. A companion data anonymization gateway (KAR-
NAK) was developed to allow template-based deidentification of
imaging data before exporting them from clinical settings to a
KHEOPS platform.Results
This platform provides a flexible means for data sharing that gives
access to Big Data repositories for machine learning and Radiomics.
Its flexible cockpit allows user to easily handle and manage imaging
collections and to exchange them through a simple concept of ‘‘shared
albums’’. The use revocable tokens assigned by the owners of the data
allows to easily share and monitor the use of their shared data. Special
attention was given to facilitating the integration with existing insti-
tutional PACS as well as existing imaging databanks through a
customizable anonymization gateway called KARNAK. Each insti-
tution can thereby define its own templates of data anonymization
according to institutional rules and regulations defined by local ethic
committees for each research study.
This platform was already downloaded and installed in several
research centers and academic institutions worldwide. The platform
was implemented in academic hospitals together with KARNAK
anonymization gateway allowing researchers to gather cohorts of
imaging data extracted from clinical PACS networks.
Using a web-based, zero-footprint open source viewer (OHIF
viewer) the users can preview and analyze images from any imaging
modality (including pathology images) on any platform including
tablets and smartphones.
The platform architecture was specifically designed to allow
image analysis and AI tools to be easily implemented by facilitating
access to the image data through a simple interface allowing users to
send an encrypted token of a given image set to a remote analysis
process that can be hosted on a remote server to perform a specific
Table 2 A summary of the mutual information (MI) similarity val-
ues, calculated for each tissue sample
Mutual information
Min 0.9306
Max 0.9934
Mean 0.9742
Median 0.9832
Fig. 2 For three tissue samples: the top row contains the histology,
the middle row contains the distance maps produced from the full
data, the bottom row contains the distance maps produced from the
reduced data
S16 Int J CARS (2021) 16 (Suppl 1):S1–S119
123

image processing return numerical or image-based results. Several AI
analysis tools developed by third party partners were tested through
this interface allowing the AI analysis process to remain on a dedi-
cated server with adequate processing and numerical capacity while
images remained on the local KHEOPS server.Conclusion
The web-based KHEOPS platform accessible on any device provides
a cost-effective solution for securely hosting and sharing imaging data
for research. Its user-friendly cockpit interface allows researchers to
manage their own datasets and share them among selected community
of participants. This platform is already being adopted by different
national and international projects. It provides a cost-effective solu-
tion for securely hosting and sharing imaging data for research.
References
[1] Spaltenstein J, van Dooren N, Pasquier G, Roduit N, Brenet M,
Pasquier G, Gibaud B, Mildenberger P; Ratib O (2020) A
multicentric IT platform for storage and sharing of imaging-
based radiation dosimetric data.’’ Int J Comput Assist Radiol
Surg 15(10): 1639–1643.
A three-dimensional guidance based on fiber optical
shape sensing, electromagnetic tracking
and preoperative data for endovascular procedures
S. Jackle1, A. Lange1, V. Garcıa-Vazquez2, T. Eixmann3, F.
Matysiak4, M. Sieren5, H. Schulz-Hildebrandt3,6,7, G. Huttmann3,6,7,
F. Ernst2, S. Heldmann1, T. Patz8, T. Preusser8,9
1Fraunhofer MEVIS, Lubeck, Germany 2Universitat zu Lubeck,
Institute of Robotic and Cognitive Systems, Lubeck, Germany3Universitat zu Lubeck, Institute of Biomedical Optics, Lubeck,
Germany 4University Hospital Schleswig–Holstein, Department
of Surgery, Lubeck, Germany 5University Hospital Schleswig–
Holstein, Department for Radiology and Nuclear Medicine, Lubeck,
Germany 6Medical Laser Lubeck GmbH, Lubeck, Germany 7German
Center for Lung Research (DZL), Großhansdorf, Germany8Fraunhofer MEVIS, Bremen, Germany 9Jacobs University, Bremen,
Germany
Keywords Fiber optical shape sensing, Electromagnetic tracking,
endovascular navigation, endovascular aneurysm repair
Purpose
In endovascular aortic repair (EVAR) procedures, two-dimensional
(2D) fluoroscopy and conventional digital subtraction angiography
together with the administration of contrast agent is the gold standard
guidance for medical instruments inside the patient’s body. These
image modalities require X-ray exposure and the depth information is
missing. Moreover, contrast agent is potentially kidney damaging for
the patient. To overcome these drawbacks, a three-dimensional (3D)
guidance based on tracking systems and preoperative data is intro-
duced and evaluated using a realistic vessel phantom.Methods
A model for obtaining the 3D shape position based on fiber optical
shape sensing (FOSS), one electromagnetic (EM) sensor and a pre-
operative computed tomography (CT) scan was developed. This
guidance method includes several steps. First the reconstructed shape
is located in the preoperative CT scan with the EM sensor. As a result,
the shape has the correct position and direction, but has the wrong
rotation along the direction. Then, the shape is prealigned to the
centerline path of the vessel to get an estimation of the correct
rotation. Finally, the shape is registered to the vessel volume to obtain
the accurate located shape. For evaluation, a stentgraft system (En-
durant II AAA, Medtronic, Dublin, Ireland) was used. After
dissembling it, a multicore fiber (FBGS Technologies GmbH) cov-
ered with a metallic capillary tube and one Aurora Micro 6 degree-of-
freedom EM sensor (length: 9 mm, diameter: 0.8 mm; Northern
Digital Inc.) was integrated in the front part. Moreover, a custom-
made phantom with a 3D printed vascular system was created. An
introducer sheath (Medtronic SentrantTM Introducer Sheath, Med-
tronic, Dublin, Ireland) was inserted into the right common femoral
artery of the phantom to facilitate the insertion of the stentgraft sys-
tem. In the experiment, the stentgraft system was inserted into the
aorta and pushed back approximately 2 cm steps between the mea-
surements. At those five insertion depths data measurements of the
tracking systems were done as well as image acquisitions for
obtaining the ground truth.Results
In the five different measurements we obtained average errors from
1.81 to 3.13 mm, maximum errors from 3.21 to 5.46 mm and tip
errors from 2.67 to 4.58 mm for the located shapes obtained with the
guidance method. These errors are influenced both by the shape
reconstruction (average errors from 0.51 to 1.26 mm, maximum
errors from 1.00 to 4.05 mm) and the EM sensor accuracy
(1.13–1.50 mm). Due to twist introduced by the introducer sheath the
shape reconstruction errors are higher as in previous studies whereas
the EM sensor errors are comparable. Despite the twisted shape, the
errors of the located shape did not increase much for most mea-
surements in comparison to the errors of the reconstructed shape and
accurately located shapes were obtained with the introduced
approach.Conclusion
In this work, a 3D guidance method for a stentgraft system based on
FOSS, the pose of one EM sensor and a preoperative CT scan was
introduced and evaluated in an realistic experiment. The evaluation of
the novel introduced guidance approach resulted in low errors and
these results are promising for using this approach as guidance in
EVAR procedures. Thus, future work will focus on further evalua-
tions of the developed guidance in EVAR procedures. For this
purpose, such an intervention will be conducted by navigating the
stentgraft itself. This would facilitate the stentgraft placement in
EVAR procedures.
An end-to-end unsupervised affine and deformable
registration framework for multi-structure medical
image registration
Z. Chen1, X. Gao1, G. Zheng1
1Shanghai Jiao Tong University, School of Biomedical Engineering,
Shanghai, China
Keywords Unsupervised deep learning, Affine Image registration,
Deformable Image registration, Multi-structure Registration
Purpose
Image registration is the process of determining a geometrical
transformation that aligns coordinates in two or more images so that
the attributes associated with different coordinates can be viewed and
analyzed jointly. It plays an increasingly important role in medical
image analysis due to its wide range of applications, including
tracking relative positions of instruments and anatomy during surgery,
integrating multimodal information like CT/MRI or atlas segmenta-
tion. Intensity based and handcrafted feature based methods are
commonly used traditional registration methods, but these processes
Int J CARS (2021) 16 (Suppl 1):S1–S119 S17
123

are inconvenient and time-consuming. Recently, unsupervised deep
learning based methods show good performance and generalization
ability in many registration tasks, while they still face a big challenge
in dealing with multi-structure task [1, 2]. On the other hand, global
and local registration effects are hard to balance. Therefore we pro-
pose an end-to-end deep learning based unsupervised framework for
simultaneously affine and deformable image registration and evaluate
it on a 3D multi-structure registration task.Methods
The proposed framework consists of two components: an affine net-
work used to learn global transformation for coarse registration and a
deformable network used to learn local deformation. The affine net-
work is a deep convolutional network, which could learn 12 affine
transformation parameters representing rotation, translation, scaling
and shearing between the original fixed image and moving image. In
order to enlarge receptive fields and get as much global information as
possible, more convolutional layers and down-sampling operations
are used in this network. Coarsely warped image is obtained by
warping the moving image with the learned affine transformation.
Next, a U-Net like deformable network is built to learn voxel-wise
registration deformable field and then get the finally warped image. In
the encoder stage, the network can learn and stack local features with
different resolutions. And in the decoder stage, successive deconvo-
lutional layers, convolutional layers and skip connections help the
network use different resolution features to predict the displacement
of each voxel. These two stages are then concatenated into an end-to-
end network. The detailed process is depicted in Fig. 1. The similarity
metric function can be mean square error (MSE) or normalized cross-
correlation (NCC). And the smooth regularization function works on
the gradients of deformable field. The overall loss function is
designed as the weighed sum of the similarity between coarsely
warped image and fixed image, smooth regularization and the simi-
larity between finally warped image and the same fixed image, since
every single part of the framework should be effective and the
deformable field should be smooth enough to prevent distortions.
Experiments are designed to evaluate the performance of our
framework. We include 30 hip CTs and evaluate on left femur, right
femur and pelvis respectively. In details, for each structure, we have
20 train data, 9 test data and 1 fixed data. Before training, random
affine transformation is done on train dataset for data augmentation,
which could greatly improve the effectiveness of affine registration.
Then in the training stage, all of input data pairs are centered first to
ensure that they have overlaps, which is beneficial for the optimiza-
tion process. Evaluation metrics used in our experiments includes
Dice similarity coefficient, average surface distance (ASD) and
residual mean square distance (RMS).
Results
Table 1 provides an overview of quantitative results for this multi-
structure task in which for each evaluation metric, Before, Affine and
Overall represent the corresponding values before registration, after
only affine transformation and the overall performance by our pro-
posed framework respectively. A mean overall Dice of 0.97 ± 0.01,
0.96 ± 0.01 and 0.92 ± 0.01 was found for left femur, right femur
and pelvis respectively. Notably, an obvious improvement is achieved
after the Affine transformation stage and the deformable part has a
further approximate 10% increase of Dice over Affine. Meanwhile
our method has an average 0.82 ± 0.12 mm, 1.05 ± 0.20 mm and
1.46 ± 0.21 mm ASD. Furthermore, an average RMS of
1.35 ± 0.17 mm, 1.57 ± 0.25 mm, 2.53 ± 0.31 mm was found for
the three different structures.Conclusion
Image registration is always an important subject in medical image
analysis, but current registration methods still face challenges, such as
multi-structure tasks and simultaneously global and local registration.
We propose an unsupervised end-to-end affine and deformable reg-
istration framework to deal with different structure registration task.
Experiments have demonstrated the effectiveness and generalization
performance of our framework, which is mainly attributed to the
framework can learn global and local deformation at the same time.
And it has great potential to solve multi-structure registration prob-
lems. Even though we evaluated the framework on a 3D registration
task, it can actually solve n-D registration task. Above all, our pro-
posed framework has been proved to be effective to work as an
efficient tool for multi-structure medical image registration.
References
[1] Jaderberg M, Simonyan K, Zisserman A (2015) Spatial trans-
former networks. Advances in neural information processing
systems, 28, 2017–2025.
[2] Balakrishnan G, Zhao A, Sabuncu MR, Guttag J, Dalca AV
(2019) Voxelmorph: a learning framework for deformable
medical image registration. IEEE transactions on medical
imaging, 38(8), 1788–1800.
Fig. 1 Schematic representation of the proposed end-to-end frame-
work for multi-structure registration. Three weighted losses are
computed to optimize the parameters, specifically including the
smooth loss of the deformable field, the other two similarity losses
between the fixed Image and the warped Image of StageIand Stage II.
Evaluation metrics including Dice, ASD, RMS
Table 1 Results of our experiments
Methods Left femur Right femur Pelvis
Dice Before 0.29 ± 0.16 0.34 ± 0.20 0.31 ± 0.12
Affine 0.90 ± 0.01 0.89 ± 0.01 0.76 ± 0.04
Overall 0.97 ± 0.01 0.96 ± 0.01 0.92 ± 0.01
ASD Before 14.22 ± 5.10 13.15 ± 5.79 11.11 ± 3.85
Affine 1.73 ± 0.29 1.82 ± 0.22 3.27 ± 0.41
Overall 0.82 ± 0.12 1.05 ± 0.20 1.46 ± 0.21
RMS Before 16.91 ± 5.84 15.87 ± 6.63 14.02 ± 4.41
Affine 2.29 ± 0.33 2.40 ± 0.25 4.34 ± 0.49
Overall 1.35 ± 0.17 1.57 ± 0.25 2.53 ± 0.31
For each metric with each structure, the table shows three evaluation
methods
S18 Int J CARS (2021) 16 (Suppl 1):S1–S119
123

COVID-19 lung infection and normal region
segmentation from CT volumes using FCN with local
and global spatial feature encoder
M. Oda1,2, Y. Hayashi1, Y. Otake3,4, M. Hashimoto5, T. Akashi6, K.
Mori1,2,4
1Nagoya University, Graduate School of Informatics, Nagoya, Japan2Nagoya University, Information and Communications, Nagoya,
Japan 3Nara Institute of Science and Technology, Graduate School
of Science and Technology, Nara, Japan 4National Institute
of Informatics, Research Center for Medical Bigdata, Tokyo, Japan5Keio University School of Medicine, Department of Radiology,
Tokyo, Japan 6Juntendo University, Department of Radiology, Tokyo,
Japan
Keywords COVID-19, segmentation, infection and normal regions,
fully convolutional network
Purpose
This paper proposes an automated lung infection and normal regions
segmentation method from lung CT volumes of COVID-19 cases.
Novel coronavirus disease 2019 (COVID-19) spreads over the world
causing the large number of infected patients and deaths. The total
number of COVID-19 cases are more than 89 million in the world by
January 10, 2021. To provide appropriate treatments to patients, rapid
and accurate inspection method is required. Reverse transcriptase
polymerase chain reaction testing (RT-PCR) is commonly used to
diagnose COVID-19 cases. However, its sensitivity ranges from 42%
to 71%. In contrast, the sensitivity of chest CT image-based COVID-
19 diagnosis is reported as 97%. Therefore, CT image-based diag-
nosis is promising to provide accurate diagnosis results. To provide
more accurate and rapid diagnosis results to patients, computer aided
diagnosis (CAD) system for viral pneumonia including COVID-19 is
necessary. Such CAD system employs a segmentation method of
infection (ground-glass opacity and consolidation) and normal regions
in the lung. Segmentation results of them enables quantitative analysis
of lung condition.
We propose an automated segmentation method of infection and
normal regions from lung CT volumes of COVID-19 cases. Our
original contribution is proposal of a 3D fully convolutional network
(FCN) utilizing a local and global spatial feature encoder for accurate
segmentation of infection regions that have various sizes and shapes.
U-Net accurately segments lung normal regions because the shapes of
the regions are similar among patients. However, infection regions
have variations of sizes and shapes. Such variations are difficult to
learn by U-Net or common segmentation FCNs. We utilize 3D ver-
sions of dilated convolutions [1] and dense pooling connections [2] in
our 3D FCN to effectively encode spatial information to feature
values. By using our FCN, lung infection and normal regions are
accurately segmented.Methods
3D FCN model for segmentationEncoder-decoder style FCNs such as U-Net are commonly used in
segmentation. The encoder extracts feature values from images.
Commonly, convolution kernels of small sizes and max pooling are
used in encoders. However, use of small convolution kernels cause
loss of global spatial information. Furthermore, max pooling also
loses spatial information.
To reduce loss of such spatial information in the encoder, we
introduce dilated convolutions [1] and dense pooling connections [2].
We use 3D dilated convolutions of different dilation rates that are
connected parallelly (called as 3D dilated convolution block) to uti-
lize local and global spatial information. Our 3D FCN has 3D U-Net
like structure. We replace a 3D convolution layer in the encoder with
the 3D dilated convolution block. We also replace 3D max poolings
in the encoder with the 3D version of dense pooling connections to
reduce loss of spatial information.
3D FCN trainingWe employ a 3D patch-based process to reduce GPU memory use. CT
volumes for training are resized and clipped with 32 9 32 9 32
voxel strides to make 64 9 64 9 64 voxel patches. Data augmenta-
tions including translation, rotation, and elastic deformation are
applied to the patches. Pairs of patches of CT volumes and the cor-
responding annotation volumes are used to train the 3D FCN. The
annotation volume contains infection and normal regions in the lung,
and outside body regions.
SegmentationA CT volume for testing is resized and clipped to 64 9 64 9 64
voxel patches. The patches are fed to the trained 3D FCN to obtain
segmentation result patches. The patches are reconstructed to obtain a
segmentation result in the same size as original CT volume.Results
We applied the proposed segmentation method to 20 CT volumes of
COVID-19 patients. Specifications of the CT volumes are: image size
is 512 9 512 pixels, slice number is 56 to 722, pixel spacing is 0.63
to 0.78 mm, and slice thickness is 1.00 to 5.00 mm. Annotation
volumes were checked by a radiologist. In the training of the 3D FCN,
the minibatch size and training epoch number were set as 2 and 50.
The generalized dice loss was used as a loss function.
Fig. 1 CT image, ground truth regions, and segmentation results by
the proposed 3D FCN. Red and green regions are infection and
normal regions. Top and bottom columns show axial and coronal
slices
Int J CARS (2021) 16 (Suppl 1):S1–S119 S19
123

We evaluated segmentation performance in a fivefold cross vali-
dation. Dice coefficients of the proposed 3D FCN were 0.744 and
0.864 for infection and normal regions, respectively. As a compar-
ison, we used 3D U-Net as the segmentation model and obtained
0.732 and 0.840 for infection and normal regions. Segmentation
results by the proposed 3D FCN are shown in Fig. 1.
The proposed 3D FCN achieved higher segmentation accuracies
compared to the 3D U-Net. Image features of infection regions that
have large variations in their sizes and shapes are difficult to extract
by the encoder in the 3D U-Net. The use of dilated convolutions and
dense pooling connections improved feature extraction performance
of the encoder by utilizing local and global spatial features. Therefore,
we obtained higher segmentation accuracies by the proposed 3D
FCN.Conclusion
We proposed an automated lung infection and normal regions seg-
mentation method from CT volumes of COVID-19 cases. We
developed a 3D FCN for segmentation that has an improved encoder
for feature extraction from regions that have various sizes and shapes.
3D patch-based process was employed in our segmentation to reduce
GPU memory use. In our experiments using 20 CT volumes of
COVID-19 patients, the proposed 3D FCN achieved higher seg-
mentation accuracies compared to the 3D U-Net. Future work
includes use of multiple patch sizes as the input of the 3D FCN and
improvement of the decoder in the 3D FCN.
References
[1] Yu F, Koltun V (2016) Multi-scale context aggregation by
dilated convolutions. International Conference on Learning
Representations (ICLR)
[2] Playout C, Duval R, Cheriet F (2018) A multitask learning
architecture for simultaneous segmentation of bright and red
lesions in fundus images. MICCAI 11071:101–108
CNN-based joint non-correspondence detection
and registration of retinal optical coherence
tomography images
J. Andresen1, T. Kepp1, J. Ehrhardt1, C. von der Burchard2,
J. Roider2, H. Handels1
1University of Lubeck, Institute of Medical Informatics, Lubeck,
Germany 2Christian-Albrechts-University of Kiel, Department
of Ophthalmology, Kiel, Germany
Keywords Image registration, Non-correspondence detection, Optical
coherence tomography, Macular degenerati
Purpose
Neovascular age-related macular degeneration (nAMD) is a retinal
disease that causes vision loss due to abnormal blood vessel growth
originating from the choroid. Injections of vascular endothelial
growth factor inhibitors can slow down this process and even lead to
amelioration of disease status. The monitoring of nAMD is performed
using opical coherence tomography (OCT). An algorithm that regis-
ters OCT images of different time points could help to detect changes
of pathologies and assist nAMD monitoring.
Due to the dynamic behaviour of the disease one patient’s status
may change drastically from one visit to another which leads to non-
corresponding regions in the OCT images. Intra- and subretinal fluids
(IRF and SRF), for example, are important biomarkers for nAMD
progression that appear as dark spots on OCT images. Direct regis-
tration of pathological images can lead to severe registration errors
since intensity differences are erroneously accounted for by image
deformations. We therefore present a convolutional neural network
(CNN) for joint registration and non-correspondence detection in
OCT images of nAMD patients. Our CNN registers intra-patient OCT
images from different time points and simultaneously segments
regions of missing correspondences. The network is trained using an
image distance measure, a regularizer and the Mumford-Shah func-
tional described in [1] as loss function and can handle a wide variation
of deformations. The resulting segmentations of non-corresponding
regions are shown to reflect pathological fluids inside the retina.Methods
The proposed network for joint registration and non-correspondence
detection is a y-shaped U-Net. Both decoders are connected with the
encoder part of the network via skip connections. The first decoder
outputs a vector field that is interpreted as a stationary velocity field.
The matrix exponential of the vector field is calculated resulting in a
diffeomorphic transformation that warps the baseline image to match
the follow-up image. The second decoder outputs the segmentation of
non-corresponding regions which are excluded from the distance
computation during the registration. Input to the network are rigidly
pre-registered, corresponding B-scans of baseline and follow-up OCT
images.
Training is performed by minimizing a loss function composed of
the mean squared error image distance evaluated on corresponding
image regions (masking with the segmentation output), curvature
regularization to smooth the deformation field and another regularizer
favouring small segmentations with smooth boundaries according to
the Mumford-Shah functional [1].
Weak supervision during the training of the registration task is
introduced by an additional loss term that determines the Dice loss
between retina segmentations of follow-up and baseline [2]. The
segmentations were created by a medical expert who delineated the
inner limiting membrane and the Bruch’s membrane manually. No
manual segmentations are required for application of the trained
network.
The network is trained on 193 image pairs (9650 B-scans) from 42
nAMD patients for which the acquisition times of baseline and fol-
low-up image are no longer apart than five months. The images were
taken with a Heidelberg Spectralis OCT device with a B-scan reso-
lution of 496 9 512 pixels and cropped to the central 384 A-scans.
The data is split on patient level into training, validation and test
datasets. Five-fold crossvalidation is performed and for each fold the
network is trained for 300 epochs with a batch size of 10, Adam
optimization and a learning rate of 1e-4.Results
The mean Dice score between the manual retina segmentations
improved from 0.903 before to 0.961 after the baseline was trans-
formed with the deformation output of the CNN. Our CNN is thus
able to improve the spatial alignment between OCT-images of the
same patient. The mean absolute error between the images improved
from 7.75e-2 to 5.54e-2. To evaluate the segmentation output of the
network, the mean absolute error between the registered images was
calculated inside and outside the segmented regions. The error was
5.28e-2 in the corresponding regions and 3.61e-1 in the non-corre-
sponding regions.
Figure 1 shows exemplar results of our registration and segmen-
tation network. The figure shows that, depending on disease activity,
the segmented regions either reflect growth or shrinkage of patholo-
gies like retinal fluids. For patients with pathologies that are only
visible in one of the images the segmentations directly align with
these pathologies. This shows great potential of our network to be
used for unsupervised pathology detection in retinal OCT images with
the advantage of generating sharply delineated segmentations.Conclusion
We presented the first results of a CNN designed to simultaneously
register intra-patient OCT B-scans from different time points and
S20 Int J CARS (2021) 16 (Suppl 1):S1–S119
123

segment regions where there is no correspondence between baseline
and follow-up image. We show that CNN-based registration of OCT
images profits from a Mumford-Shah segmentation of non-corre-
sponding regions, as previously described in [1] for a variational
registration approach. Our approach allows the end-to-end training of
the registration-segmentation task. The trained network allows fast
registration of OCT image slices and the resulting segmentations
align with pathology changes. Our approach shows great potential for
the monitoring of nAMD progression.
References
[1] Chen K, Derksen A, Heldmann S, Hallmann M and Berkels B
(2015) Deformable image registration with automatic non-cor-
respondence detection. International Conference on Scale Space
and Variational Methods in Computer Vision: 360–371
[2] Hering A, Kuckertz S, Heldmann S, Heinrich M P (2019)
Enhancing label-driven deep deformable image registration with
local distance metrics for state-of-the-art cardiac motion track-
ing. Bildverarbeitung fur die Medizin 2019: 309–314
An ensemble of deep learning models to segment
the optic disc in eye fundus images
M. Ali1,2, M. Jabreel1, M. Abdel-Nasser1, A. Valls1, M. Baget
Bernaldiz2,3
1Universitat Rovira i Virgili—URV, Department of Computer
Engineering and Mathematics, Tarragona, Spain 2Institut Investigacio
Sanitaria Pere Virgili (IISPV), Tarragona, Spain 3 University Hospital
Sant Joan de Reus, Ophthalmology, Reus, Spain
Keywords Fundus image, optic disc segmentation, deep learning,
opthalmology
Purpose
Optic disc (OD) assessment is essential for diagnosing glaucomatous
damage and progression. Automated OD segmentation systems can
handle a huge number of images and reduce human errors in
screening. The focus of this work is to develop a reliable, accurate,
and full automated system for segmenting OD in eye fundus images
collected from Hospital Sant Joan de Reus (SJR) based on deep
learning and ensemble techniques. The developed system has been
also validated on two public datasets to demonstrate its reliability.Methods
To develop a reliable and efficient OD segmentation system, we
employ accurate individual deep learning-based segmentation models
and an aggregation function to determine the largest consistency
among the conflicting segmentation masks. As shown in Fig. 1, the
input image is fed into three individual OD segmentation models, and
then the resulting segmentation masks are aggregated to produce the
final segmentation mask (final prediction).
In this study, we developed three accurate OD segmentation
models based on state-of-the-art deep convolutional neural networks
(CNNs) for image segmentation. Specifically, three networks, namely
DoubleU-Net [1], DeepLabv3 ? , and gated skip connections (GSCs)
[2], are used here to build the individual OD segmentation models.
We briefly introduce each model below:
DoubleU-Net includes two U-Net stacked architectures in
sequence, two encoders, and two decoders. The first encoder and
decoder are used in the lightweight model VGG-19 and the second is
used in the U-Net network. DeepLabv3 ? is an extension of
DeepLabv3, which has a faster and stronger encoder-decoder network
that can refine the semantic segmentation results, especially along
with object boundaries. It can also extract feature vectors with Atrous
convolution at various resolutions. GSCs is based on a U-shaped CNN
which contains a contracting path and an expanding path, five encoder
and five decoder blocks with a gated skip connection mechanism on
the features received from the encoder layers.
In the aggregation step, we explored and tested various aggrega-
tion functions to construct the ensemble, finding that the median
operator yields the best results. The SJR dataset contains 105 images:
Fig. 1 Joint registration and non-correspondence detection results.
Each row shows results for one patient. The first three columns show
baseline B-scan, follow-up B-scan and registered baseline B-scan.
The fourth column shows the follow-up image with the deformation
field’s magnitude overlaid (masked with manual retina segmenta-
tions). The fifth column shows the segmentation result of non-
corresponding regions. Retinal fluids are exemplarily indicated with
white arrows
Fig. 1 Proposed system
Int J CARS (2021) 16 (Suppl 1):S1–S119 S21
123

70 for training and 35 for testing. We trained the models on the SJR
training set (100 epochs) and used the binary-cross entropy objective
function with Adam optimizer (a learning rate of 0.001, and a batch
size of (2). The training set was augmented 20 times to improve the
generalization of the OD segmentation models by applying horizontal
and vertical flip, Hue, and rotation processes on the images.Results
Table 1 presents the results of our system in terms of the intersection-
over-union (IoU), Dice Score, Recall, and area under the curve
(AUC). We achieved IoU and Dice scores of 0.955 and 0.954,
respectively. Our system outperforms all compared models in all the
evaluation metrics. Our system has been also evaluated on two pub-
licly available datasets: IDRID (https://idrid.grand-challenge.
org/Data/) and Drishti-GS (https://cvit.iiit.ac.in/projects/
mip/drishti-gs). With IDRID, it obtained IoU and Dice scores of
0.959 and 0.958, respectively. It is remarkable that it achieved a 2.5
improvement on the IoU score on IDRID Leaderboard. With Drishti-
GS dataset, our method achieved an IoU and Dice scores of 0.967,
which are better than the ones of the related work and standard
medical image segmentation models, such as U-Net and DoubleU-
Net.Conclusion
The proposed system produces accurate segmentation of the OD,
which may reduce human errors for ophthalmologists in the detection
of eye pathologies. We have demonstrated that the use of an ensemble
of models improves the quality of the segmentation, reaching values
above 0.95 in the usual indicators. In fact, the proposed model
achieves accurate yet reliable segmentation results with the in-house
dataset and two other public datasets (IoU[ 0.95 and Dice[ 0.96).Acknowledgements
This work has been funded by the research project PI18/00169 from
Instituto de Salud Carlos III & FEDER funds. The University Rovira i
Virgili also supports this work with project 2019PFR-B2-61.
References
[1] Jha D, Riegler M, Johansen D, Halvorsen P, Johansen H (2020)
Doubleu-Net: A deep convolutional neural network for medical
image segmentation. Proceedings of the IEEE conference on
Computer Based Medical Systems (CBMS), pp. 558–564.
[2] Jabreel, M, Abdel-Nasser, M (2020). Promising crack segmen-
tation method based on gated skip connection. Electronics
Letters, 56(10), 493–495.
DRR to C-arm X-ray image translation with application
to trauma surgery
M. Himstedt1, S. Hager1, S. Heldmann1, A. Petersik2, E. Zahringer2,
H. Gottschling2, S. Manuel2, T. Lieth2, J. Modersitzki1
1Fraunhofer MEVIS, Lubeck, Germany 2Stryker Trauma &
Extremities, SOMA Research, Schonkirchen, Germany
Keywords Deep learning, Generative adversarial network, Trauma
surgery, Image guided interventions
Purpose
Deep neural networks (DNNs) leverage high-quality segmentation,
registration as well as 2D-3D mapping for image-guided trauma
surgery. However, the limited amount of readily available C-arm X-ray
images (CXR) hampers the training of deep networks. Fortunately, the
presence of numerous CT scans motivates the utilization of synthetic
images for training. Thanks to their 3D representations CT scans
enable to generate 2D digitally reconstructed radiographs (DRR) sim-
ulating various sensor and imaging pose settings. Yet these models
learnt using DRRs are observed to perform worse compared to those
being trained on real X-ray images due to their distinct imag-
ing characteristics. Thus, an DRR-to-CXR translation is
proposed allowing high-quality inference for subsequent tasks based
on more realistic training data. This paper presents first results
obtained with generative adversarial networks (GAN) incorporating
the lack of corresponding CXRs and CT scans.Methods
Image translation enables to transform images from a domain A into
another domain B. Generative adversarial networks have
been demonstrated to achieve outstanding results for this
task. As the input DRR a of domain A and CXR b of domain B are
not paired, our approach makes use of CycleGAN. A generator
GAB translates a to the CXR domain B and GBA vice versa
with |GBA (GAB (a) - a)| and |GAB (GBA (b) - b)| being forward
and backward cycle losses respectively. For a more detailed deriva-
tion of CycleGAN, the reader is referred to the original paper [1].
We make use of a U-Net-based generator architecture consisting of
9 downsampling blocks. The discriminator is fixed to a patch-
based architecture classifying overlapping regions of 70 9 70 pixels.
The input DRR images are preprocessed before being passed to
the GAN. In particular, we apply an image complement to the raw
intensities as well as a fixed circular cutout as it is common for
CXRs (see Fig. 1). Omitting these steps results in a less stable train-
ing and a degraded synthesises quality. Due to the lack of
corresponding DRRs and CXRs for evaluation we generate a paired
dataset as follows. Real X-ray images are downsampled (factor 0.5)
and upscaled (to original size) while applying a Gaussian filter
(r = 5). This allows to simulate reduced textures and lower resolu-
tions, particularly for bone structures.Results
For training our GAN we incorporate 100 samples with a size
of 512 9 512 pixels for each domain which are expanded to NA =
968 DRRs and NB = 968 CXRs respectively by means of image
augmentation (random rotations and translations).
The experiment paired utilizes a set of 100 paired samples being
generated as detailed previously. Thanks to the paired images we are
able to compare synthesized to References images. Within the sec-
ond experiment unpaired our GAN is applied to an additional set of
100 samples. The output is evaluated by comparing input to recon-
structed images obtained based on a full-cycle run. Quantitative
examinations for the proposed methods are carried out using com-
mon metrics for GAN evaluations. In particular, we use MAE, SSIM
and PSNR. Results are achieved using a modified PyTorch imple-
mentation of CycleGAN [1] (see Table 1). The goal of
the first experiment is to examine the image differences
Table 1 Performance comparison in SJR dataset
Method Evaluation metrics
IOU Dice Recall AUC
U-Net 0.924 0.919 0.875 0.937
DeepLabV3? 0.941 0.938 0.901 0.95
DoubleU-Net 0.944 0.942 0.95 0.975
GSCs 0.951 0.949 0.929 0.965
Proposed system 0.955 0.954 0.952 0.976
S22 Int J CARS (2021) 16 (Suppl 1):S1–S119
123

of paired raw images (a, b) compared to the synthesized CXR GA-
B (a) and real CXR b. The second experiment additionally utilizes
real DRRs, however, as the images a and b are unpaired, the evalu-
ation is limited to measuring the reconstruction error given a and
GBA (GAB (a)) and vice versa for b.
Based on our experimental evaluation, we can state that synthe-
sized CXRs GAB (a) are closer to real CXRs b than
DRRs a (paired: a, b vs. GAB (a), b). The more detailed bone tex-
tures missing on DRRs become clearly visible on synthetic
CXRs (see Fig. 1). Our GAN is able to generalize from various
anatomical regions and acquisition poses. In addition to transfer-
ring contrast and intensity distributions it enables to
reconstruct fine details of CXR images.Conclusion
The presented approach allows to synthesize intraoperative
CXRs from rendered DRRs given a limited amount of real unpaired
data. This enables us to generate a large number
of realistic paired samples for training networks addressing chal-
lenging tasks such as CXR segmentation as well as 2D-
3D registration and mapping of bone structures which will be evalu-
ated in our future work. Only a subset of the DRRs used for
training contain fractures. For robustness, we will further expand this
data ensuring that all putative bone fractures and anatomical
variations are incorporated.FundingThis work has been funded by the federal ministry of economic
affairs and energy of Germany (BMWi, Funding
number: 01MK20012Q).
References
[1] Zhu J-Y, Park T, Isola P, Efros AA (2017) Unpaired Image-to-
Image Translation using Cycle-Consistent Adversarial Net-
works, arXiv:1703.10593
Thyroid nodule volume estimation and RF ablation
using 3D matrix ultrasound: a phantom study
T. Boers1, S. J. Braak2, M. Versluis3, S. Manohar1
1University of Twente, Multi-modality Medical Imaging, Enschede,
Netherlands 2Ziekenhuisgroep Twente, Radiology, Enschede,
Netherlands 3University of Twente, Physics of Fluids, Enschede,
Netherlands
Keywords Radiofrequency Ablation, Ultrasound, 3D, Thyroid nodule
Purpose
The use of 2D ultrasound is well established for thyroid nodule
assessment, however it offers a limited field of view that may lead to
inaccurate thyroid nodule classification and reduced radiofrequency
(RF) ablation effectiveness and an increase in complications. Real
time 3D ultrasound offers an increased field of view by using three
planes. This can potentially improve the clinical workflow, owing to
assumed better volume estimation and improved nodule edge RF
ablation. Here we assess the performance of a new 3D ‘‘matrix’’
transducer for thyroid nodule volume estimation and US-guided RF
ablation, in comparison with a currently used 2D ultrasound approach.Methods
Twenty thyroid nodule phantoms underwent volume estimation and
ablation guided by either one of two US-transducer types: a linear
transducer (2D) and a real time 3D matrix (3D matrix) transducer. For
volume estimation, the respective software-based calliper measure-
ments of both transducer approaches were used, to calculate an
ellipsoid volume approximating the volume of the nodule. Addi-
tionally, the 3D matrix transducer used its volume estimation tool.
Thereafter, with one of two transducers, 10 phantoms were ablated.
We used the transisthmic approach, evading the imaginary danger
triangle that houses the recurrent laryngeal nerve and that has to
remain clear of ablation, as well as the multiple overlapping shots
technique in order to mimic the clinical ablation protocol closely.
After ablation all 20 phantoms were cut into slices perpendicular to
the RF ablation needle direction. The slices were photographed and
analysed using Matlab running an in-house created pixel-based
analysis algorithm. The algorithm calculates the volume of each
nodule as well as the percentage of the nodule ablated and the ablated
volume outside the nodule. The calculated total volume of each
nodule was then used as the ground truth to which the US volume
estimations were compared. Kruskal–Wallis tests were performed
with a significance threshold of 0.05.
Table 1 Experimental results for paired and unpaired experiments
respectively
MAE ± std
[0, 255]
SSIM ± std
[0, 1]
PSNR ± std
[db]
Paired
a, b 2.245 ± 0.710 0.833 ± 0.054 27.858 ± 3.660
GAB (a), b 0.801 ± 0.157 0.982 ± 0.008 40.948 ± 2.124
Unpaired
a, GAB (a) 0.722 ± 0.591 0.953 ± 0.043 38.723 ± 4.847
a, GBA (GAB (a)) 0.697 ± 0.156 0.987 ± 0.005 40.537 ± 1.742
b, GBA (b) 0.942 ± 0.429 0.954 ± 0.029 36.964 ± 2.936
b, GAB (GBA (b)) 0.781 ± 0.221 0.976 ± 0.020 38.984 ± 1.449
Values are means with ± 1r std. GAB (a) refers to the CXR syn-
thesized based on DRR a. GAB (GBA (b)) is the reconstructed image
of b after a full cycle. Large values for SSIM/PSNR and low values
for MAE are better
Fig. 1 Examples of synthetic CXR generation. a–c Refer to the
paired experiment, d–f to the unpaired experiment. a Is a simulated
DRR, d a real DRR, b, e synthetic CXRs generated using our GAN,
c is the real CXR for reference and f an example im-
age of the CXR target domain. Note that there is no correspond-
ing real CXR as reference for the unpaired dataset
Int J CARS (2021) 16 (Suppl 1):S1–S119 S23
123

Results
We found that the matrix transducer volumes had a lower median
difference with the ground truth compared to the standard 2D B-mode
imaging (median differences 0.4 mL vs. 2.2 mL). The 3D matrix
guided ablation resulted in a similar ablation percentage when com-
pared to the 2D approach (76.7% vs. 80.8%). A 3D matrix guided
ablation result of a nodule phantom can be seen in Figure 1. Although
the 3D matrix and 2D guided ablations achieved higher ablation
percentages, they also lead to ablated volumes outside the nodule
(5.1 mL and 4.2 mL, respectively). Of the locations outside the
nodules some of the danger triangles showed minor ablations (2/10
and 4/10, respectively). It is important to note that the 2D approach
results were from a second batch of 10 phantoms wherein the median
ablation percentages were found to be 13.4% higher than the first 10
phantoms, thus indicating a learning curve in the phantom ablation
procedure.Conclusion
This study has shown that 3D matrix transducer volume estimation is
more accurate than the 2D transducer. Furthermore, 3D matrix
transducer guidance during RF ablation is non-inferior to the current
2D transducer approach in ablating the nodule while staying clear of
the nearby critical structures.
With the increased accuracy in volume estimation for the matrix
transducer, diagnosis and follow-up results may aid in improved
nodule classification. The longest-axis cut-off points in the TI-RADS
protocols can be replaced with volume cut-off points that can be
followed with more accuracy, potentially reducing the number of
unnecessary biopsies.
The 3D matrix technology allows for simultaneous visualization of
the perpendicular as well as the tangential plane relative to the needle
giving the clinician a direct view of the needle position with respect to
the nodule edge. This will potentially aid in ablating closer to the
periphery of the nodule and thereby reducing vital peripheral nodular
tissue ablation. However, this technology has to be developed further,
due to the need for manual scrolling in the 3D matrix view and its
potential learning curve.
Development and evaluation of a 3D annotation
software for interactive COVID-19 lesion
segmentation in chest CT
S. Bendazzoli1*, I. Brusini1,2*, M. Astaraki1,3, M. Persson4, J. Yu5, B.
Connolly5, S. Nyren5, F. Strand3,6, O. Smedby1, C. Wang1*
1 Department of Biomedical Engineering and Health Systems, KTH
Royal Institute of Technology, Stockholm, Sweden 2 Department
of Neurobiology, Care Sciences and Society, Karolinska Institute,
Stockholm, Sweden 3 Department of Oncology-Pathology, Karolinska
University Hospital, Stockholm, Sweden 4 Department of Physics,
KTH Royal Institute of Technology, Stockholm, Sweden 5
Department of Radiology, Karolinska Institute, Stockholm, Sweden 6
Imaging and Physiology, Karolinska University Hospital, Stockholm,
Sweden
*Contributed equally
Keywords: COVID-19, lesion segmentation, CT, semi-automatic
Purpose
We present a novel interactive tool for COVID-19 lesion segmenta-
tion, implemented within the software Mialab (http://mialab.org). The
proposed workflow allows to segment both the lungs and the COVID-
19 lesions from input CT scans, by alternating automatic and manual
steps within an intuitive user interface. This semi-automatic pipeline
can thus speed up and aid the creation of ground-truth lesion masks,
which may also be later employed for training automatic AI-based
segmentation methods in a supervised fashion.Methods
The present pipeline combines automatic segmentation methods with
interactive manual editing and refinement, and it can be divided into
four steps. First, a lung segmentation is produced by applying a shape
model-based level set segmentation algorithm [1]. Secondly, the
automatically segmented lung masks can be manually edited using a
set of five interactive tools: a magnet tool, a brush tool, a spline-
interpolation tool, a thin plate spline polyline tool and a smart click-
and-drag tool. Additional information about the tools and their usage
can be found at http://mialab.org/portfolio-item/covid-19/. A thresh-
old-based level set segmentation algorithm is then applied to obtain a
preliminary automatic segmentation of the COVID-19 lesions.
Finally, the output lesion segmentations can undergo a final interac-
tive editing step using the previously-mentioned tools.
The proposed software was tested on ten COVID-19 cases from
the open access COVID-19 CT Lung and Infection SegmentationDataset [2]. Six annotators were recruited and split into two groups
according to their level of expertise: three radiologists (Expert Group)
and three annotators with a technical background (Novice Group).
We computed the intra-class correlation coefficient (ICC model A,
1)—which evaluates the agreement in the lesion volumetric measures
for the six annotators together, as well as for the Expert Group only
and the Novice Group only. Moreover, for each of the ten segmented
cases, we generated a Novice Group’s and an Expert Group’s con-
sensus segmentation by performing voxel-wise majority voting within
each group. We then computed the Dice coefficient, 95th percentile
Hausdorff Distance and Jaccard coefficient between the consensus
segmentations.
A further analysis of the spatial overlap between the lesions was
then performed by calculating the generalized conformity index
(GCI) both globally and within each annotator group.
The results from the enrolled annotators were then compared with
the reference segmentation already provided as part of the dataset [2].
A Bland–Altman plot was used to investigate the volumetric agree-
ment between the reference and the present annotators’
segmentations. Moreover, their voxel-wise agreement was analyzed
Fig. 1 Ablation results using 3D matrix guidance. The dashed line
indicates the ablation needle orientation. The green circle indicates an
area ablated closely to the edge, with a small rim of unablated tissue
and minimal ablation outside the nodule. The blue triangle indicates
the danger triangle with zero ablation outside the nodule. The yellow
circle indicates an edge of the nodule fully ablated as well as the area
outside of the nodule showing ablation
S24 Int J CARS (2021) 16 (Suppl 1):S1–S119
123

by computing the Dice coefficient, using the segmentation results
from both all annotators together and for each separate expertise
group.Results
The agreement within and between annotator groups is presented in
Table 1. The highest volumetric agreement was obtained within the
Expert Group, and the lowest within the Novice Group.
The two consensus segmentations obtained through majority-
voting showed a Dice coefficient of 0.845 ± 0.113 (mean ± standard
deviation), a 95th percentile Hausdorff distance of
44.714 ± 21.5 mm, and a Jaccard coefficient of 0.746 ± 0.164.
Furthermore, a GCI of 0.588 ± 0.155 was obtained for the global
analysis, i.e. considering all six annotators together. On the other
hand, the Expert group and Novice Group alone showed a GCI of
0.650 ± 0.195 and 0.545 ± 0.149, respectively.
Figure 1 shows the comparison of the consensus segmentations in
some example slices from cases 2 and 10 of the dataset, which
resulted, respectively, in a high and a low disagreement between the
two groups.
The results obtained from the present annotators were also com-
pared with the reference segmentation mask, obtaining a rather high
agreement (see Figure 2). The biggest volume differences were
observed between the reference with the Expert Group, rather than the
Novice Group.
Furthermore, a slightly higher voxel-wise agreement was found
between the reference segmentation and the Novice Group with a
Dice coefficient of 0.719 ± 0.129, against 0.689 ± 0.141 obtained
between the reference and the Expert Group.
The overall required annotation time resulted to be equal to
23 ± 12 min (mean ± standard deviation across all raters and all 10
cases). The Expert and Novice Groups reported an annotation time of,
respectively, 23 ± 10 min and 22 ± 14 min.Conclusion
The proposed semi-automatic tool led to promising results when
tested by both expert radiologists and users with a technical back-
ground, suggesting the possibility of applying it in a vast range of
applications within the scientific community. The pipeline was also
shown to significantly speed up the segmentation process compared to
a fully manual approach, thus helping to overcome the time efficiency
issue of ground truth lesion mask creation.
Table 1 Summarized volume measurements across all annotators
(‘‘Global’’ column), across the annotators with a medical background
(‘‘Expert Group’’), across the annotators with a technical background
(‘‘Novice Group’’), as well as between the Expert and Novice groups
(‘‘Inter-group’’)
Metric Global Expert
group
Novice
group
Inter-
group
Mean Volume ±
standard deviation
[mL]
278.0 ± 292.2 295.6 ± 318.8 260.4 ± 267.4 –
Mean Absolute
Volume Difference
[mL]
54.7 38.4 48.9 73.0
Mean Relative
Volume Difference
23.0% 18.4% 17.7% 24.5%
ICC (A, 1)
(95% confidence
interval)
0.899
(0.785
* 0.969)
0.955
(0.878
* 0.987)
0.886
(0.707
* 0.967)
0.926
(0.746
* 0.981)
The intra-class correlation coefficient (ICC) and its confidence
interval were calculated using the ICC (A, 1) model
Fig. 1 Segmentation results in some example slices from all three
image views, i.e. axial (left column), coronal (center) and sagittal
(right). The results are shown for cases 2 (top) and 10 (bottom), which
resulted, respectively, in a high and a low agreement between Expert
and Novice Groups. For each case, both the original CT image slice
and its overlaid segmentation masks are reported. Green areas
correspond to regions labeled as lesions only in the Expert consensus
segmentation, red areas are labeled as lesions only by the Novice
Group consensus, while yellow regions correspond to an intersection
between the two groups
Fig. 2 Bland–Altman plot describing the agreement between the
available reference segmentation and both the Expert Group (in
black) and Novice Group (in red) segmentations
Int J CARS (2021) 16 (Suppl 1):S1–S119 S25
123

References
[1] Leventon ME, Grimson WE, Faugeras O (2002) Statistical
shape influence in geodesic active contours. In5th IEEE EMBS
International Summer School on Biomedical Imaging, 15 (pp.
8-pp). IEEE.
[2] Ma J, Wang Y, An X, Ge C, Yu Z, Chen J, Zhu Q, Dong G, He
J, He Z, Nie Z. Towards efficient covid-19 ct annotation: A
benchmark for lung and infection segmentation. arXiv preprint
arXiv:2004.12537. 2020 Apr 27.
Dental implant planning, guide design and accuracy
evaluation using free and open source software:
an in vivo study
D. Trikeriotis1, A. Theodoropoulou1, M. Mountricha1
1Private Practice, Athens, Greece
Keywords guide implantology, surgical guide implants, open source
software, 3d printing
Purpose
To explore the possibility of using and developing free and open
source software in which the whole sequence of preparation of the
working layout, implant planning, guide design and calculation of
accuracy without postoperative computed tomography could be per-
formed. Such a sequence could be acronymized as PIGA sequence
derived from the initials of Preparation, Implant, Guide and Accu-
racy. The literature related to open-source solutions in dentistry
appears limited [1]. In this context, the 3D Slicer software (
http://www.slicer.org) that is a free and open source software plat-
form for medical image informatics, image processing, and three-
dimensional visualization was selected for evaluation.Methods
27 partially edentulous patients seeking implant therapy, 9 men (mean
age 50.5, range 40–68 years) and 18 women (mean age 49, range
21–62 years), underwent CBCT followed by a conventional impres-
sion and scan of the preoperative plaster cast with an intra-oral
scanner (Medit i500). DICOM images and a 3D model were imported
to 3D Slicer 4.11.0. Data was processed by using modules of the
software package. Except for modules of import and addition, 18
more modules were used—each one in more than one of the 4 steps
followed (Figure 1). Surgical simulation was harmonized with the
sizes and lengths of components of the related guided system.
A total of 22 tooth supported and 10 tooth-mucosa supported
surgical guides were 3D printed (PLA, da Vinci 1.0 Pro) and tested
preoperatively as regards to seating on the teeth and tissues and
availability of intermaxillary space. Master tubes were sterilized in an
autoclave and surgical guides had a high-level disinfection by using
ortho-phthalaldehyde 0.55% (exposure time 12–30 min at C 20 �C)
according to the guidelines of CDC. 51 dental implants were placed
(Xive, Dentsply) following the half-guided surgical protocol. After
guided sleeve-on-drilling, the implants were placed freehand under
direct bone visualization after incision.
The calculation of the placement accuracy in the RAS anatomical
coordinate system was performed in 8 of the 27 patients after 12
implants were placed. These 8 cases met the following criteria: a)
delayed dental implant placement into healed sockets and b) absence
of changes in dentition during the time interval until restoration. At
the time of restoration, an extra-oral scan (Medit i500) of the
impression with implants identical to those placed and fixed to the
transfer coping pickups was taken and imported into 3D Slicer for the
calculation of accuracy. The registration process performed during the
fourth step as well as the first step was monitored with numerical
accuracy (Figure 2). MS excel software package was used for
statistics.Results
A digital workflow of implant planning, guide design and accuracy
calculation without postoperative computed tomography was
possible.
The mean linear deviation measured at the sagittal, coronal and
axial plane found at the entry point was 1.03 mm (95% CI: 0.662 to
1.4 mm), 0.47 mm (95% CI: 0.3 to 0.64 mm) and 0.58 mm (95% CI:
0.461 to 0.699 mm), respectively and at the apex 1.1 mm (95% CI:
0.744 to 1.46 mm), 1.05 mm (95% CI: 0.722 to 1.38 mm) and
Fig. 1 Schematic workflow of 3D Slicer-based Preparation of the
working layout, dental Implant planning, surgical Guide design and
Accuracy calculation (PIGA sequence). Dashed lines emphasize the
potential multiple use of modules during digital workflow
Fig. 2 The output model of a 3-point fiducial registration of the
scanned imported model (green) to the CT anatomy model (white). At
the bottom of the figure the deviations (mm) of registered points at the
sagittal, coronal and axial plane (RAS anatomical coordinate system)
as seen in the Markups module
S26 Int J CARS (2021) 16 (Suppl 1):S1–S119
123

0.79 mm (95% CI: 0.518 to 1.06 mm), respectively (Table 1). The
most frequent deviation was the ‘‘Distal’’ (9/12 implants) at the entry
point and the ‘‘Coronal’’ (7/12 implants) at the apex.
The mean summed linear distance deviation at the entry point and
the apex found was 1.39 mm (95% CI: 1.13 to 1.65 mm) and
1.88 mm (95% CI: 1.66 to 2.1 mm), respectively. The mean angular
deviation found was 5.7 degrees (95% CI: 4.54 to 6.86 degrees)
(Table 2).Conclusion
The results regarding the accuracy of half-guided dental implant
placement were consistent with literature [2]. 3D Slicer could be used
in static computer-aided implant surgery as an alternative to com-
mercial dental software. Although the presented workflow seems
complex and time consuming there is, however, a great potential for
improvements following a proper collaboration of software engineers
and clinicians so that a Slicer-based IGA workflow can be gener-
ated in order for it to be clinically usable.
References
[1] Chrusciel-Nogalska M, Smektała T, Tutak M, Sporniak-Tutak
K, Olszewsk R (2017) Open-source software in dentistry: A
systematic review. International Journal of Technology
Assessment in Health Care 33(4):487–493
[2] Kuhl S, Zurcher S, Mahid T, Muller-Gerbl M, Filippi A, Cattin
P (2013) Accuracy of full guided versus half-guided implant
surgery. Clin Oral Implants Res 24(7):763–769
AI-based 3D-reconstruction of the colon from
monoscopic colonoscopy videos—first results
R. Hackner 1, S. Walluscheck1,2, E. Lehmann3, M. Raithel4, V.
Bruns1, T. Wittenberg1,2
1Fraunhofer Institute for Integrated Circuits IIS, Erlangen, Germany2University Erlangen, Erlangen, Germany 3E & L medical systems,
Erlangen, Germany 4Malteser Waldkrankenhaus, Erlangen, Germany
Keywords colonoscopy, 3D-reconstruction, deep neural networks,
depth maps
Purpose
For an improved image-based documentation of a screen-
ing colonoscopy it is desirable to determine which parts of the colon
walls were seen during the examination and which sites potentially
still need to be viewed. So-called panoramic images, being large-
scale, wallpaper-like images of the colon wall, are one possibility
for such an enhanced documentation. Procedures already exist for the
real-time creation of panoramic images of the urinary bladder floor or
the oesophagus. Nevertheless, these approaches implicitly assume
a simple and fixed geometry, such as a hemisphere or a tube. How-
ever, as the colon—in contrast to the bladder or the oesophagus—is
an organ with a much more complex (partially tubular, partially flat,
partially hemisphere) and dynamic geometry, these methods cannot
be applied. In order to obtain adequate panoramas of the colon wall, a
partial or fully 3D reconstruction of the colon geometry is necessary.Methods
Recently, deep-neural-network (DNN) based methods have
been suggested and evaluated for various tasks in the field of image
analysis in gastroscopy, such as automated adenoma and polyp
detection, or differentiation of Barrett’’s oesophagus. For the 3D
reconstruction of the colon, or sections thereof, DNN-based methods
can be applied that approximate depth maps in the form of point
clouds from temporally sequential image pairs from colono-
scopic grids. These depth maps and 3D- segments can then
be assembled, registered and fused in successive steps [1].
For the first step of approximating depth maps, three deep neural
networks with different architectures, namely ‘‘V-Net’’, ’’U-
Net’’, and ‘‘modified U-Net’’ (with a ResNet encoder) were con-
structed and evaluated. For training and validation, a set
of 3600 successively acquired monoscopic image pairs (captured
at t and t ? Dt) from a synthetically created (digital) colon mod-
el (see details below) with known camera geometry were used. Using
this data, each of the three networks was trained using 200 training
epochs, and the achieved results were quantitatively evaluated
against the known ground truth from the colon model. Additionally,
the depth maps predicted for real endoscopy images were qualita-
tively evaluated, s. Fig. 1. Based on the intermediate results, the
network that visually achieves the best results (U-Net with
ResNet Encoder) was trained for 2.000 epochs on the 3.600 training
image pairs and evaluated on 100 validation image pairs. For all
Table 1 Linear deviations at the sagittal, coronal and axial planes of
the RAS anatomical coordinate system in relation to intra-oral
orientation
Table 2 Summed linear deviation at the entry point and the apex and
angular deviation
Fig. 1 3D modelling of the depth of a colon section (left) and as-
sociated known ground truth from the digital data model (right)
Int J CARS (2021) 16 (Suppl 1):S1–S119 S27
123

experiments an Adam optimizer with learning rate r = 1e - 5,
a mean squared loss function and batch size b = 16 was applied.
For the generation of sufficient synthetic colon data
for the training of a deep neural network [2], a custom texture was
designed using Blender. Voronoi textures were used to simulate
vessel structures and fractal Perlin noise (‘‘Musgrave texture’’) to
obtain a slightly bumpy surface that allows a more natural impression.
This also leads to more light scattering. The Musgrave texture orig-
inates from an algorithm initially designed to model landscapes.
The mucus layer of the synthetic colon was modelled by using a
BSDF glass shader with a refraction index that matches the one of
water.Results
For evaluation of the networks, the mean square error (MSE, L2-
Norm) and the mean absolute errors (MAE, L1-Norm) were em-
ployed to compare the resulting depth maps predicted by the
DNN against the a priori-known ground-truth depth maps of the 100
test image pairs. The modified U-Net architec-
ture with the ResNet Encoder reaches quantitative results
of MSE = 0.000017 and MAE = 0.001634 over all 100 test data sets.Conclusion
The obtained results (see Fig. 1) suggest that an approximation of
depth maps of the colon from monocular image pairs using
a ’’modified U-Net’’ is possible in real time and leads to highly
acceptable results, which can be used for a consecutive 3D colon
reconstruction.
References
[1] Freedman D, Blau Y, Katzir L, Amit A, Shimshoni I,
Veikherman D, Golany T, Gordon A, Corrado G, Matias Y
(2020) Detecting Deficient Coverage in Colonoscopies. IEEE
Trans. on Biomed. Eng. 39(11) pp. 3451–3462.
[2] Hackner R, Walluscheck S, Lehmann E, Bruns V, Eixel-
berger T, Wittenberg T (2021): A Geometric and Textural
Model of the Colon as Ground Truth for Deep-Learn-
ing Based 3D-Reconstruction. Accepted, to appear. In: Ch.
Palm, et al. (Eds.) Bildverarbeitung fur die Medizin 2021.
Informatik aktuell. Springer Vieweg, Wiesbaden.
Image-based decision support system for catheter-based
pulmonary valve replacement
J. Yan1, S. Ching2, A. Wilson1, A. Lasso3, C. Herz2, A. Enquobahrie1,
M. A. Jolley2, V. S. Arikatla1
1Kitware, Inc, Medical Computing Group, Carrboro, United States2Children’s Hospital of Philadelphia, Department of Anesthesiology
and Critical Care Medicine, Philadelphia, United States 3Queen’s
University, Laboratory for Percutaneous Surgery, Kingston, Canada
Keywords pulmonary valve, finite element analysis, image process-
ing, experimental validation
Purpose
Transcatheter Pulmonary Valve Replacement (TPVR) using self-ex-
panding devices has evolved into a promising alternative to open
surgical valve replacement in patients status post repair of Tetralogy
of Fallot (TOF). However, determining patient candidacy and
matching the optimal device to an individual patient remains chal-
lenging due to the complex, dynamic, and heterogeneous nature of the
surgically repaired right ventricular outflow tract (RVOT). Current
decision making is based on manually derived metrics, and laborious
3D printing based strategies, both of which erroneously assume that
the vessel is rigid in the setting of device implant. Image based
computational modeling holds promise for informing this process. We
describe the ongoing development of an interactive image-based
modeling tool, which now incorporates realistic finite element (FEM)-
based mechanics, to support the future identification of patients
suitable for TPVR as well as selection of the best fit device for an
individual patient.Methods
We used custom open-source software to interactively place virtual
models of transcatheter pulmonary valve (TCPV) into image based
RVOT models. Existing CT scans of five sheep prior to and after the
TCPV implantation in both end-systole and end-diastole were utilized
for modeling [1]. Pre-implant images were imported into 3D Slicer
[2] and the right ventricular (RV) and pulmonary artery (PA) blood
pool are segmented using 3D threshold paint or grow cut algorithms
as in our prior work [1]. The blood pool is then dilated to create a
shell representation of the RV and PA (Fig. 1a). The segmented
models are then imported into TetWild, to generate high-quality
tetrahedral meshes. Finally, a finite element analysis of the device
deployment process is conducted using FEBio, similar to prior
modeling of self expanding devices performed using commercial
packages. A frictionless contact model in FEBio, Sliding node-on-
facet contact, is used to model the interaction between the vessels and
the device. Two nonlinear hyperelastic models, Mooney-Rivlin and
neo-Hookean, are adopted as the materials for the vessel tissues and
the device, respectively. Prior to the deployment, the device is first
compressed into a cylindrical catheter positioned coaxially. The
compression is driven by the prescribed displacement on the outer
surface of the catheter, and a frictional contact between the catheter
and the device. To deploy the device into the vessel, a frictionless
contact is defined between the device and the vessel, and two ends of
the catheter are sequentially expanded as demonstrated in Fig. 1b, c.
This approach can effectively avoid the sudden release of the high
potential energy in the compressed device that could otherwise cause
convergence issues in contact problems. However, when using this
quasi-static analysis, the device needs to be fixed at certain mesh
nodes to eliminate the rigid-body degree of freedom.
In order to assess device fit from resulting models, we developed
quantitative metrics to evaluate whether a device is adequately sealed
and properly anchored in both systole and diastole, while avoiding
overcompression which could lead to device failure or erosion of the
device into the vessel. Quantification is calculated both automatically
and graphically. Deformation and stress measures of the device and
vessel in the post-deployment state is shown in Figure 1b, c.Results
We conducted FE analysis of a self-expanding TCPV replacement in
five RVOT models. With the deployment strategy described above,
FEBio was able to converge the challenging nonlinear contact
Fig. 1 Modeling Workflow. A) RVOT shell creation (orange) in 3D
Slicer; B) FEM modeling of release of distal device; C) Release of
both proximal and distal device. Color scale represents principle
stress
S28 Int J CARS (2021) 16 (Suppl 1):S1–S119
123

problems in all five cases, and generate visually realistic results.
Fig. 1 shows the configurations of one systolic case with 41,000 and
73,000 tetrahedral elements in the vessel and the device, respectively.
Penetration of device into the vessel wall in the converged state is
about 25% of the wire diameter.Conclusion
We have preliminarily demonstrated the feasibility of incorporating
FEM into an evolving open-source based workflow for assessment of
patient candidacy for TCPV replacement using self-expanding devi-
ces into native outflow tracts in TOF. This is significant considering
the complex vessel geometries and the significant difference of mesh
sizes and stiffness between the vessels and the device. We are now
working to validate pre-implant modeling in comparison to actual
device implants in the same surgical model. Evolution of this mod-
eling may inform patient selection and optimal device for TCPV in
congenital heart disease. In addition, the general framework is
applicable to all self-expanding devices, such as many in clinical use
for transcatheter aortic valve replacement.
References
[1] Jolley MA, Lasso A, Nam HH, Dinh PV, Scanlan AB, Nguyen
AV, Ilina A, Morray B, Glatz AC, McGowan FX, Whitehead K,
Dori Y, Gorman JH 3rd, Gorman RC, Fichtinger G, Gillespie
MJ. (2019) Toward predictive modeling of catheter-based pul-
monary valve replacement into native right ventricular outflow
tracts. Catheter Cardiovasc Interv. 15;93(3):E143-E152.
[2] Fedorov A, Beichel R, Kalpathy-Cramer J, Finet J, Fillion-
Robin C, Pujol S, Bauer C, Jennings D, Fennessy F, Sonka M,
Buatti J, Aylward S, Miller JV, Pieper S, Kikinis R. (2012) 3D
slicer as an image computing platform for the quantitative
imaging network. Magn Reson Imaging. 30(9):1323–1341.
FEM-based patient-individual modelling and
simulation of knee joint motion
E. Theilen1, C. V. Dresky1, L. Walczak1, K. Izadpanah2, T. Lange3, S.
Bendak2, D. Gehring4, J. Ketterer4, C. Huber5, J. Georgii1
1Fraunhofer Institute for Digital Medicine MEVIS, Bremen, Germany2Medical Center—University of Freiburg, Department of Orthopedics
and Trauma Surgery, Freiburg, Germany 3Medical Center—
University of Freiburg, Department of Radiology, Medical Physics,
Freiburg, Germany 4University of Freiburg, Department of Sport
and Sport Science, Freiburg, Germany 5Stryker Leibinger GmbH &
Co. KG, R&D Robotics, Freiburg, Germany
Keywords biomechanics, knee joint, finite element method, patient-
specific modelling
Purpose
The knowledge about the patient-specific knee joint kinematics is
crucial for the decision on therapeutic measures in order to restore
stability und functionality after a cruciate ligament rupture. To
achieve best possible approximation to the patient’s native pre-trau-
matic knee joint condition, a dynamic three-dimensional knee joint
model based on the finite element method (FEM) is presented for the
assessment of the individual biomechanics. In this approach the knee
joint model is automatically derived from segmented MR images of
the patient and from knee motion (flexion and rotation) captured by a
motion tracking system (Vicon). The vision is to establish computer-
assisted ligament reconstruction planning in clinical routines.Methods
For the development of the patient-specific knee model, MR images
using either GRE or SPACE sequences with fat saturation are
considered for the main knee structures: bones and the respective
articular cartilages (i.e., femur, tibia, patella), menisci (i.e., medial
and lateral meniscus), ligaments (i.e., anterior cruciate, posterior
cruciate, medial collateral, lateral collateral and patellar ligament) and
quadriceps tendon. All structures are manually segmented by clinical
experts.
These developments have been inspired by the research investi-
gated by [1]. In the present approach an automatic model generation
has been conducted to fit into the clinical workflow. For a proper finite
element (FE) model, thorough preprocessing of the structure seg-
mentations is required to be able to neatly define contact conditions.
The automatic procedure ensures reasonable geometries and that the
structures do not overlap each other. Accordingly, a FE-model fea-
turing tetrahedral meshes is automatically generated to fit into the
open-source FEBio software [2] for non-linear implicit finite element
simulations. In order to align the motion of flexion and rotation from
the motion tracking system (Vicon) to the MR data of the patient’s
knee, a point-based registration has been performed. Thus, the cap-
tured patient-individual motion can be prescribed as boundary
conditions to the femur while fixing the tibia.
For contact conditions of ligaments/tendon attached to bone at
their proximal and distal ends, all ligament/tendon nodes in their
intersection to the corresponding bone are detected automatically and
defined to match the motion of the attached bone. Frictionless non-
linear contact conditions allow structures to slide across each other
without penetration.
Furthermore, in the FE-model bones are considered to be rigid, so
only their surface meshes are required. Articular cartilages are
assumed to be linear, elastic and isotropic; and the menisci are
modelled as linearly elastic and transversely isotropic material. The
meniscal horn attachments on the tibial plateau are represented by
linear springs. The behavior of the ligaments/tendon are described by
transversely isotropic Mooney-Rivlin material using a fully-coupled
formulation featuring initial strains defined from data available in
literature.Results
Figure 1 top row shows the result of the FE simulation of a knee
flexion up to 20� and subsequent external rotation up to 28� of a
healthy adult volunteer. The bottom row shows the stresses in the
Fig. 1 FEM-simulation of a knee joint up to 20� flexion with
subsequent external rotation up to 28� (top row) and the correspond-
ing stresses [MPa] in ACL and medial meniscus at 20� knee flexion
and 28� external rotation (bottom row)
Int J CARS (2021) 16 (Suppl 1):S1–S119 S29
123
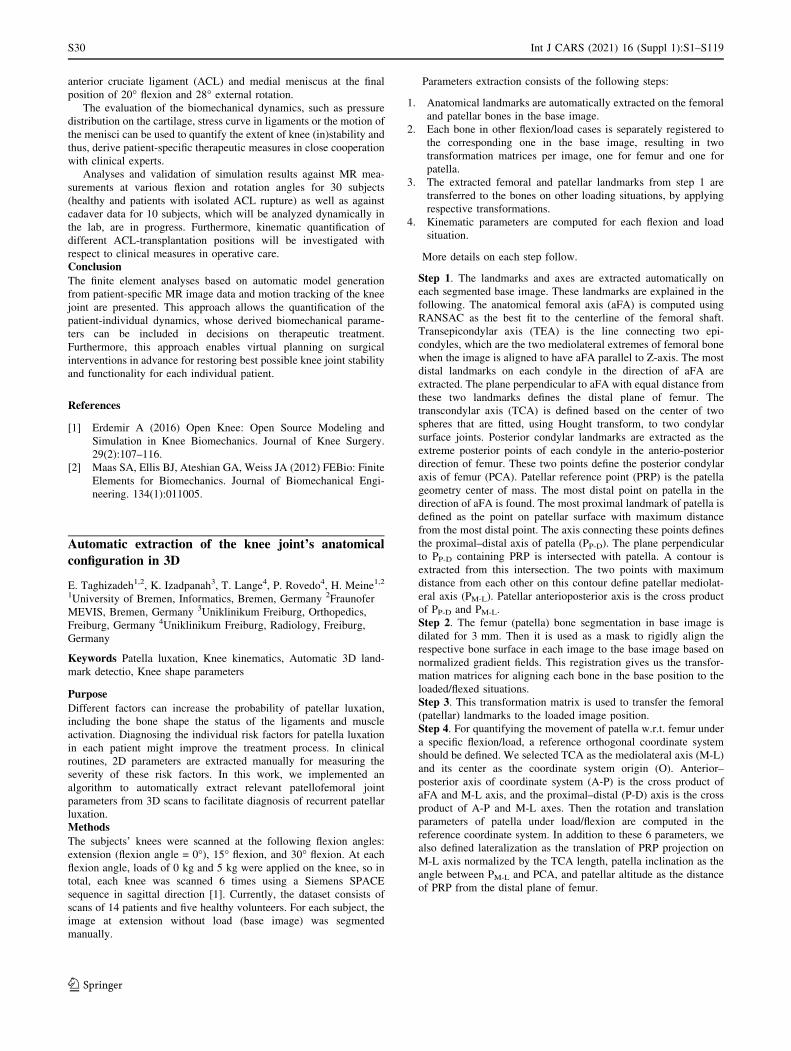
anterior cruciate ligament (ACL) and medial meniscus at the final
position of 20� flexion and 28� external rotation.
The evaluation of the biomechanical dynamics, such as pressure
distribution on the cartilage, stress curve in ligaments or the motion of
the menisci can be used to quantify the extent of knee (in)stability and
thus, derive patient-specific therapeutic measures in close cooperation
with clinical experts.
Analyses and validation of simulation results against MR mea-
surements at various flexion and rotation angles for 30 subjects
(healthy and patients with isolated ACL rupture) as well as against
cadaver data for 10 subjects, which will be analyzed dynamically in
the lab, are in progress. Furthermore, kinematic quantification of
different ACL-transplantation positions will be investigated with
respect to clinical measures in operative care.Conclusion
The finite element analyses based on automatic model generation
from patient-specific MR image data and motion tracking of the knee
joint are presented. This approach allows the quantification of the
patient-individual dynamics, whose derived biomechanical parame-
ters can be included in decisions on therapeutic treatment.
Furthermore, this approach enables virtual planning on surgical
interventions in advance for restoring best possible knee joint stability
and functionality for each individual patient.
References
[1] Erdemir A (2016) Open Knee: Open Source Modeling and
Simulation in Knee Biomechanics. Journal of Knee Surgery.
29(2):107–116.
[2] Maas SA, Ellis BJ, Ateshian GA, Weiss JA (2012) FEBio: Finite
Elements for Biomechanics. Journal of Biomechanical Engi-
neering. 134(1):011005.
Automatic extraction of the knee joint’s anatomical
configuration in 3D
E. Taghizadeh1,2, K. Izadpanah3, T. Lange4, P. Rovedo4, H. Meine1,2
1University of Bremen, Informatics, Bremen, Germany 2Fraunofer
MEVIS, Bremen, Germany 3Uniklinikum Freiburg, Orthopedics,
Freiburg, Germany 4Uniklinikum Freiburg, Radiology, Freiburg,
Germany
Keywords Patella luxation, Knee kinematics, Automatic 3D land-
mark detectio, Knee shape parameters
Purpose
Different factors can increase the probability of patellar luxation,
including the bone shape the status of the ligaments and muscle
activation. Diagnosing the individual risk factors for patella luxation
in each patient might improve the treatment process. In clinical
routines, 2D parameters are extracted manually for measuring the
severity of these risk factors. In this work, we implemented an
algorithm to automatically extract relevant patellofemoral joint
parameters from 3D scans to facilitate diagnosis of recurrent patellar
luxation.Methods
The subjects’ knees were scanned at the following flexion angles:
extension (flexion angle = 0�), 15� flexion, and 30� flexion. At each
flexion angle, loads of 0 kg and 5 kg were applied on the knee, so in
total, each knee was scanned 6 times using a Siemens SPACE
sequence in sagittal direction [1]. Currently, the dataset consists of
scans of 14 patients and five healthy volunteers. For each subject, the
image at extension without load (base image) was segmented
manually.
Parameters extraction consists of the following steps:
1. Anatomical landmarks are automatically extracted on the femoral
and patellar bones in the base image.
2. Each bone in other flexion/load cases is separately registered to
the corresponding one in the base image, resulting in two
transformation matrices per image, one for femur and one for
patella.
3. The extracted femoral and patellar landmarks from step 1 are
transferred to the bones on other loading situations, by applying
respective transformations.
4. Kinematic parameters are computed for each flexion and load
situation.
More details on each step follow.
Step 1. The landmarks and axes are extracted automatically on
each segmented base image. These landmarks are explained in the
following. The anatomical femoral axis (aFA) is computed using
RANSAC as the best fit to the centerline of the femoral shaft.
Transepicondylar axis (TEA) is the line connecting two epi-
condyles, which are the two mediolateral extremes of femoral bone
when the image is aligned to have aFA parallel to Z-axis. The most
distal landmarks on each condyle in the direction of aFA are
extracted. The plane perpendicular to aFA with equal distance from
these two landmarks defines the distal plane of femur. The
transcondylar axis (TCA) is defined based on the center of two
spheres that are fitted, using Hought transform, to two condylar
surface joints. Posterior condylar landmarks are extracted as the
extreme posterior points of each condyle in the anterio-posterior
direction of femur. These two points define the posterior condylar
axis of femur (PCA). Patellar reference point (PRP) is the patella
geometry center of mass. The most distal point on patella in the
direction of aFA is found. The most proximal landmark of patella is
defined as the point on patellar surface with maximum distance
from the most distal point. The axis connecting these points defines
the proximal–distal axis of patella (PP-D). The plane perpendicular
to PP-D containing PRP is intersected with patella. A contour is
extracted from this intersection. The two points with maximum
distance from each other on this contour define patellar mediolat-
eral axis (PM-L). Patellar anterioposterior axis is the cross product
of PP-D and PM-L.
Step 2. The femur (patella) bone segmentation in base image is
dilated for 3 mm. Then it is used as a mask to rigidly align the
respective bone surface in each image to the base image based on
normalized gradient fields. This registration gives us the transfor-
mation matrices for aligning each bone in the base position to the
loaded/flexed situations.
Step 3. This transformation matrix is used to transfer the femoral
(patellar) landmarks to the loaded image position.
Step 4. For quantifying the movement of patella w.r.t. femur under
a specific flexion/load, a reference orthogonal coordinate system
should be defined. We selected TCA as the mediolateral axis (M-L)
and its center as the coordinate system origin (O). Anterior–
posterior axis of coordinate system (A-P) is the cross product of
aFA and M-L axis, and the proximal–distal (P-D) axis is the cross
product of A-P and M-L axes. Then the rotation and translation
parameters of patella under load/flexion are computed in the
reference coordinate system. In addition to these 6 parameters, we
also defined lateralization as the translation of PRP projection on
M-L axis normalized by the TCA length, patella inclination as the
angle between PM-L and PCA, and patellar altitude as the distance
of PRP from the distal plane of femur.
S30 Int J CARS (2021) 16 (Suppl 1):S1–S119
123

Results
We analyzed seven shape parameters and nine kinematic parameters
(times five for each flexed/loaded case). For almost all parameters, the
variance of variables among patients were larger than the healthy
cases. As an example, the patella translation along I-S axis of the
reference coordinate system is shown in figure 1, for different flexion
angles when 5 kg load was applied.Conclusion
We developed a pipeline to automatically extract clinically relevant
landmarks and derived relevant parameters that represent shape and
kinematics of the patellofemoral joint. Our results showed that the
variance of parameters was larger among patients compared to
healthy cases. This was expected for patients with patellar instability.
Our work confirmed and, moreover, quantified these variations.
Our dataset consists of knee scans of patients with one or more
risk factors, such as trochlea dysplasia and patella alta, as such the
parameter distributions is not monomodal. Grouping patients based
on the risk factors would facilitate better understanding of the patellar
luxation and risk factors.
As part of our future work, we will increase the number of cases
for reporting an in depth statistical analysis of kinematic parameters.
References
[1] Lange A, Taghizadeh E, Knowles B. R, Sudkamp N. P, Zaitsev
M, Meine H, Izadpanah K (2019) Quantification of patellofe-
moral cartilage deformation and contact area changes in
response to static loading via high-resolution MRI with
prospective motion correction. Journal of Magnetic Resonance
Imaging 50 (5): 1561–1570.
The healthcare system of the futureD. Wilhelm1, D. Ostler2, C. Amato3, L. Bernhard2, O. Ratib4
1Klinikum rechts der Isar, Technical University Munich, Surgery,
Munchen, Germany 2Research Group MITI, Klinikum rechts der Isar,
Munich, Germany 3CannonDesign, Los Angeles, Germany4University of Geneva, Radiology, Geneva, Switzerland
Keywords Robotics, Artificial Intelligence, Healthcare System,
Transsectoral care
Purpose
The aim of this work is to assess upcoming technologies in respect to
a future vision of the healthcare system and to predict potential
developments for the upcoming period of time.Methods
The results and thoughts which we present herein do originate from
expert discussions and studies of the available literature. Also, aspects
which were elaborated during the finalization of the ‘‘White paper on
the Digitalization in Surgery’’ of the German society of surgeons are
included. Still, the presented theses are speculative and not based on a
fully scientific background.Results
Preventive medicineWhile in former times health was taken for granted and medical
support was only requested in case of already present health related
problems prevention of health is gaining attraction. Prevention affects
both medical care, as well as private life in the form of healthy eating,
weight control or daily sportive activities. Health trackers, wearables
and smart devices already measure our heart rate, daily activity and
stress level. The data together with detailed stratification of individual
genomic and phenotypic profile, when analyzed by AI algorithms, can
identify very early on health alterations which require preventive
treatment.
Data collection and storageIt is assumed that the healthcare of the future will completely rely on
a global data network and no longer be that personal and bilateral as it
is today. Although we assume the contact of patients to their health
providers will still represent the central pillar of healthcare it will not
only be enabled by data and AI methods based on this, data will foster
all healthcare related processes to the next level. A continuous per-
sonalized data flow thus forms the basis of care and will be fed with
uncertified and certified information. This data flow is not restricted to
the health-related environment, to medical departments or hospitals
for example, but will be ubiquitous, will say, accompanies the patient
everywhere and for his entire life. The capacity of collecting and
curating large amount of data of each individual person can signifi-
cantly empower the patients in their participation and awareness of
their health status and assist them in adopting proper prevention and
treatment strategies. The availability of comprehensive personal data
of each individual person will allow for the generation of avatars or
digital twins, that then can be used for modelling and evaluation of
specific treatments regimes or even for preventive measures.
Artificial intelligenceAI represents the new panacea for the healthcare system and will
expand from image dominated fields, e.g. in radiology and derma-
tology, to all other medical fields, as soon as data of adequate size and
structure are available. AI will most likely be used to support our
medical decision making and improve medical care by augmented
approaches based on global knowledge and integration of large vol-
ume of data that single individual care-providers cannot achieve. AI
already serves for physicians to re-become omniscient, as for example
for defining the optimal cancer therapy and also for intraoperative
decision making. In the near future, we can reasonably predict that AI
will reduce the need for extreme specialization in healthcare and will
allow for a more general and coordinated health approach. With
constant feed-back from clinical results and patient reported outcomes
the accuracy of AI-based decisions could further be improved and
then provide a solid basis for augmented care approaches.
RoboticsRobots will become integral part of the healthcare system of the
future. Whilst today they are predominantly used as master–slave
systems in surgery, autonomous service and care robots (carebots) are
supposed to play a much more relevant role in the coming decades.
Autonomous nursing robots and automated devices are ideally suited
to perform less demanding and repetitive tasks, saving time for the
Fig. 1 Left: the violin plot of patella translation in the direction of
I-S axis of the reference coordinate system, for healthy subjects
(blue), and patients (green). Right: I-S translation is the magnitude of
the red arrow. Here the knee of a patient when it is extended (gray
bones) is shown. Patella movement is depicted for a 30� flexion angle
under a 5 kg load (blue patella)
Int J CARS (2021) 16 (Suppl 1):S1–S119 S31
123

staff which then can be used for personal interaction with patients.
But robotic technology will also contribute to the autonomy and
flexibility of healthcare and we argue that self-navigating systems,
capable of autonomously changing their position and adapt to specific
frameworks and logistics, could bring a great advantage in optimizing
treatment and monitoring procedures. The effective integration of
robotics into surgical therapy will require a comprehensive stan-
dardization of surgical procedures and the support of a cognitive and
highly ‘‘intelligent’’ environment. Accordingly, the cross linking of
the different technologies inside the healthcare system will become a
driving force and will foster the optimal usage and efficiency of
implemented systems.
The buildings of the healthcare system of the futureWe assume the healthcare system of the future will evolve from
highly separated and specialized centers to a patient centered and
health oriented omnipresent environment. This will span globally and
include all areas, as for example home, working space or even mobile,
while traveling. Only with smart capabilities that allow for a com-
prehensive monitoring of the patient�s health status everywhere and at
any time health problems can be detected the earliest possible. In this
respect, the home and living environment of each individual will
become a main area for less intrusive healthcare and wellbeing sup-
port systems mainly because this is where patients spend most of their
time here and due to its privacy supporting sensitive examinations of
vital signs. We also believe that there will be a seamless transition
between home and hospital/medical departments, as care and diag-
nosis will already start in private areas.Conclusion
The healthcare system of the future will be driven by technology,
robots and artificial intelligence. Nevertheless, it will be more patient
centred than it is today and patient satisfaction and maintaining ‘‘the
human touch’’ will become core aspects. The maintenance of health
and prevention of disease will serve as its main added value and will
be enabled by a broad serration of all medical fields and the inte-
gration of non-medical environments.
Innovation design for image guided therapies
with disruption in mind—novel methodology
for exploration, evaluation and impact generation
M. Friebe1
1Otto-von-Guericke-University, Medical Faculty, HealthTec
Innovation Lab, Magdeburg, Germany
Keywords Healthcare Innovation, Clinical Translation, Biodesign,
Purpose Launchpad
Purpose
A core problem of today’s university based research—also in our
dedicated area of Image Guided Therapies and Minimal-Invasive-
Procedures—is that we are mainly focusing on creating research
papers and that our research output is often judged by the amount of
papers and citations. This value system encourages research activities
on incremental innovations that come with a relatively low risk of
failure and that can lead to a publishable result in a relatively short
time. Disruptions can be defined as technologies or processes that lead
to a significant ([ 10x) quality improvement or reduction in cost.
Many published results today show improvements of some percent
points in a very narrowly defined area. We do not want to stop these
improvements and we do believe that these developments come with
a value. They are however not typically leading to completely novel
approaches and are not typically solving the huge challenges that we
are facing in health delivery (chronic diseases, inequalities, urban–
rural delivery differences, increasing cost, healthcare instead of
sickcare, and many more). Exponential technologies (AI, Big Data,
Deep Learning, advanced sensors/wearables, robotics) will cause a
paradigm shift in healthcare delivery and eventually not only lead to
different development value propositions, but will also see different
roles for different stakeholders (e.g. an empowered patient).
Healthcare is in need of INNOVATION and technologies for the
digital transformation will cause unpredictable, but most likely very
significant workflow changes in healthcare delivery and associated
business models and will also need to follow different development
criteria and value propositions [1, 2].Methods
Our lab follows a novel approach for innovation generation with a
clear focus on identifying and validating disruptive approaches based
on UNMET CLINICAL NEEDS. We have also created a 5 ECTS
interdisciplinary (students from Engineering, Natural Sciences,
Medicine) lecture that provides attendees with much needed 21st
century skills to address future health challenges and innovation
needs. For this novel Innovation approach we combined several
innovation methodologies including the BIODESIGN and the PUR-
POSE LAUNCHPAD teachings. The job of the researchers (and
students) is to invest a lot of their initial work in identifying the
UNMET CLINICAL NEEDS, analyze and properly understand the
underlying problems, ideate possible solutions, and validate the
problem/solution with the stakeholders. A focus on future develop-
ments needs to be based on patient empathy around an UNMET
CLINICAL NEED. The role of university based research cannot stop
with the publication of a paper. It needs to primarily focus on pro-
viding a value to the patient and society. For that we need to teach our
researchers the basics of translation, which includes economic issues,
future forecasting, and actual implementation of a validated
idea/concept (see Figs. 1, 2).
To develop patient/society related products and concepts we will
need to understand the underlying clinical problem including the
Fig. 1 Development approach that starts with an UNMET CLIN-
ICAL NEED (the need to improve) and includes research as well as
translation to actually create a benefit for the patient and society
Fig. 2 Interdisciplinary Teams—goal to IDENTIFY, IDEATE
around an Unmet Clinical Need—and be DISRUPTIVE
S32 Int J CARS (2021) 16 (Suppl 1):S1–S119
123

current ways of diagnosing and treating it in combination with
technological forecasting capabilities and an economic understanding.
We have designed a new approach based on an adapted Stanford
BIODESIGN approach of IDENTIFYING UNMET CLINICAL
NEEDS, IDEATE solutions for these needs, iterate with the stake-
holders and subsequently work on IMPLEMENTATION as start-up
companies. This is combined with other VALIDATION models and
experiments (PURPOSE LAUNCHPAD methodology, Alexander
Osterwalder’s Value and Business Model Canvas, Exponential Can-
vas and Massive Transformative Purpose approaches) to properly
understand the problem, the future opportunities and to create and
validate ideas through Minimal Viable Prototypes.
Research in general is future oriented and in the particular field of
HEALTHTEC INNOVATION should consider the effects and pos-
sibilities of new technologies and their effect and needs to work on
TRANSLATING the results of research into clinical practice. As
INNOVATION is a combination of technical solutions with identi-
fying the clinical need it is also necessary to understand regulatory
issues and health-economics. The Future of healthcare will be data
driven and will combine personal health records with a more com-
prehensive data and management structure requiring integrated
devices, forensic information, advanced learning tools, and many
more to eventually provide a digital twin that will then be able to
manage, predict, and recommend personalized health related proce-
dures and actions.
We believe that we need to combine technological depth with
more broader skills and a novel approach of exploring and validating
clinical problems. The paper will present the details of the innovation
approach that includes:
• several future oriented innovation tools;
• the need to work in interdisciplinary innovation teams in an
exploration and validation phase;
• the need to think disruptive with a goal significantly improve the
quality, user and clinical experience, and dramatically reduce the
potential cost of device or process;
• uses the PURPOSE LAUNCHPAD meta-methodology for Explo-
ration (Biodesign: Identify), Evaluation (Biodesign: Ideate and
partly Implement), and subsequent Impact Generation (Biodesign:
Implement), Ethics and Exponential Canvas, Massive Transfor-
mative Purpose, Blue Ocean, Innovation Segment Concept,
Exponential Technology Canvas, Value Proposition and Business
Model Canvas, and associated entrepreneurial tools;
• get introduced to basics in economy, team and project manage-
ment, ethics and empathy and other 21st century soft skills;
Results
This approach was used in our lab in the recent past to start many
clinical research projects and produced many papers, patents, and
start-ups. We also have started a database of unmet clinical needs that
we will make public domain in the coming months.Conclusion
Incremental Innovation will continue to be very important for
research activities in our field, but we believe that researchers and
students should be introduced to disruptive innovation approaches.
They should also know basics of management, economics,
entrepreneurship, and clinical translation activities to identify and
work on ideas that have a significant impact. The methodology that
we are using could be a base for more disruption.
References
[1] Friebe M (2020) Healthcare in need of innovation: exponential
technology and biomedical entrepreneurship as solution
providers. Proc. SPIE 11315, Medical Imaging 2020: Image-
Guided Procedures, Robotic Interventions, and Modeling,
113150T (16 March 2020); https://doi.org/10.1117/12.2556776
[2] Friebe M (2017) Exponential Technologies ? Reverse Innova-
tion = Solution for Future Healthcare Issues? What Does It
Mean for University Education and Entrepreneurial Opportuni-
ties? Open Journal of Business and Management, 5, 458–469.
https://doi.org/10.4236/ojbm.2017.53039
Technology and global surgery: materials and methods
to achieve the United Nations healthcare-related
sustainable development goals for 2030
R. Andrews1
1NASA Ames Research Center, Nanotechnology & Smart Systems,
Los Gatos, United States
Keywords global surgery, mass casualty disaster, resilient & mobile
hospitals, e-health & telemedicine
Purpose
In 2015 the United Nations (UN) issued 17 Sustainable Development
Goals (SDGs) for 2030, Goal # 3 being ‘‘Ensure healthy lives and
promote well-being for all at all ages’’. Improved global surgery is
essential to achieve SDG #3:
1. One-third of all deaths worldwide result from lack of surgery—
10 times the deaths due to malaria, tuberculosis, or HIV/AIDS.
By 2030, the cost of lack of surgery in low- and middle-income
countries (LMICs)—in terms of GDP lost—will approach US
$1.5 trillion annually. For every dollar invested in global surgery,
the long-term savings are greater than 20-fold.
2. Natural disasters annually cost over US $500 billion and force
over 26 million people into poverty. Annual deaths from
earthquakes alone exceed the number killed in traffic accidents
in North America and the European Union combined.
3. Man-made or ‘‘un-natural’’ disasters (infrastructure failures,
transportation accidents, terrorist/warfare events) kill several
hundred thousand people each year worldwide. Deaths and
injuries from terrorist events in particular have increased in the
past decade.
For daily care, lack of both surgical resources and resilient
infrastructure (e.g. power outages) are frequent contributors to
avoidable morbidity/mortality. In India alone, deaths due to lack of
surgery for acute abdomen number 50,000 yearly; avoidable deaths
from trauma, stroke, difficult childbirth, etc., number in the hundreds
of thousands annually.
An estimated 20,000 people died each day immediately following
the 2010 Haiti earthquake due to lack of basic surgery. Mass casualty
disaster (MCD) response in LMICs presently depends on international
organizations (e.g. UN, World Health Organization (WHO), Red
Cross) and other groups (e.g. military, faith-based). These groups—
separate from the ongoing local healthcare system—require bureau-
cratic authorizations before mobilization: it is typically a week before
medical personnel reach an MCD site. This is far beyond the 12- to
24-hours essential to reduce morbidity/mortality from trauma [1, 2].
Figure 1 illustrates parallels in disaster management and global
surgery.
Healthcare delivery resembles smartphones—sophisticated hard-
ware and optimized software as well as a global network are essential
for effective operation. Computer-assisted technology can address the
need for surgery worldwide.
Int J CARS (2021) 16 (Suppl 1):S1–S119 S33
123

Methods
Trauma and stroke centers (TSCs) evolved in high-income countries
(HICs) with evidence that immediate 24/7/365 treatment dramatically
improved morbidity/mortality. TSCs are part of the ongoing health-
care system—not a separate entity. The universal humanitarian
response to MCDs suspends political, cultural, and socioeconomic
barriers that hinder a coordinated response to other global crises:
groups frequently at odds with each other unite during an MCD.
MCD response—like TSCs—can be integrated into ongoing
healthcare systems with Mass Casualty Centers (MCCs). Each MCC,
like a TSC, is staffed by specialists from all aspects of emergency
response—available 24/7/365. Integrating the civilian and military
medical resources improves efficiency and minimizes duplication.
MCCs in LMICs can be staffed (at least initially) by local physicians
and nurses working side-by-side with HIC physicians and nurses (on a
rotating basis), following the ‘‘twinning’’ model for partnering med-
ical centers in LMICs and HICs.
Computer-assisted technology has enhanced both daily healthcare
and MCD response to both natural and un-natural (man-made) MCDs.
A common electronic health record and data collection platform
across MCCs enhances standardization of guidelines, training, and
quality assurance. Telemedicine can reduce morbidity/mortality and
expense in both daily care and MCDs—and also provide immediate
24/7/365 telesurgical guidance. Battery-powered CT scanners provide
resilient infrastructure during both power outages (common in
LMICs) and MCDs. Mobile operating rooms—portable by heli-
copter—enable surgery anywhere worldwide within hours. Drones
and robots improve both daily healthcare (e.g. transport blood prod-
ucts, lab specimens, vaccines) and MCD response (e.g. identify the
living buried in rubble, triage medical resources to maximize benefit).
Resilient, full-service, 24/7/365 MCCs augment the healthcare
resources of the region served during non-MCD times (like TSCs in
HICs): they provide radiology, blood bank, laboratory, critical care,
etc. Groups with resources to optimize cost-effective, immediate care
include:
1. The International Virtual eHospital (IVeH) has developed
telemedicine programs for Albania, Cabo Verde, the Philippines,
and the North Atlantic Treaty Organization (NATO).
2. The Apollo Telemedicine Network Foundation (ATNF), based in
India, provides daily telemedicine consultation services to over
30 countries (mostly in sub-Saharan Africa).
3. The Center for Robot-Assisted Search and Rescue (CRASAR) at
Texas A&M University provides immediate free robots and
drones for MCD response.
Results
The initial MCC sites are Iquique (northern Chile) and Peshawar
(northwest Pakistan). In Iquique, a joint meeting was held in 2018
with the local health authorities, the military (Chilean Iquique Air
Force Base), and the Chilean Ministry for Emergency Response
(ONEMI). In 2019, meetings were held with the Ministry of Health
and the Chilean Naval Hospital Director.
In Peshawar, neurosurgeon Tariq Khan over the past decade has
opened two hospitals, a medical school (100 students/year), a nursing
school (50 students/year), and a ground ambulance service. Com-
munity-based trauma prevention and rehabilitation programs have
been implemented; the Peshawar Chapter of the ThinkFirst Trauma
Injury Prevention Program (begun in the USA in 1986) received the
2019 International Achievement Award. The Military Commander for
the Pakistan’’s Northern Region supports the MCC project—meetings
were held before the COVID-19 pandemic. Meetings with the Sur-
geon General of Pakistan are planned for 2021, and the MCC Project
is coordinating with the Pakistani National Vision for Surgical Care
2025 and NSOAP (National Surgical, Obstetric, and Anesthesia Plan
of the WHO) projects.Conclusion
Technical advances in resilient and mobile imaging and surgery,
electronic data collection and analysis, telemedicine/telesurgery,
robots/drones make improvement in both daily healthcare and MCD
response not only feasible but economically essential.
MCCs implement universal standards for medical/surgical train-
ing, and provide an unmatched global platform for research. They
foster camaraderie between physicians and staff from various LMICs
and HICs, and development of cost-effective medical/surgical tech-
niques. MCCs advance healthcare and economic progress in LMICs
and can be key to realizing many healthcare-related SDGs for 2030.
There are substantial political and socioeconomic benefits—be-
yond the healthcare benefits—of integrated MCCs as a means to
leverage technology for improved global surgery.References
[1] Khan T, Quintana L, Aguilera S, Garcia R, Shoman H, Caddell
L, Latifi R, Park KB, Garcia P, Dempsey R, Rosenfeld JV,
Scurlock C, Crisp N, Samad L, Smith M, Lippa L, Jooma R,
Andrews R (2019). Global health, global surgery, and mass
casualties: I. Rationale for integrated mass casualty centres.
BMJ Global Health 2019;4:e001943. https://doi.org/10.1136/
bmjgh-2019-001943
[2] Aguilera S, Quintana L, Khan T, Garcia R, Shoman H, Caddell
L, Latifi R, Park KB, Garcia P, Dempsey R, Rosenfeld JV,
Scurlock C, Crisp N, Samad L, Smith M, Lippa L, Jooma R,
Andrews R (2020). Global health, global surgery, and mass
casualties: II. Mass casualty centre resources, equipment, and
implementation. BMJ Global Health 2020;5:e001945.
https://doi.org/10.1136/bmjgh-2019-001945.
Task allocation using wearable devices for managing
mixed human–robot teams within the OR wing
L. Bernhard1, D. Wilhelm1
1Klinikum rechts der Isar, Technische Universitat Munchen,
Department of Surgery, Research Group MITI, Munchen, Germany
Keywords mobile robots, task allocation, human–robot collaboration,
wearables
Purpose
Mobile robotic systems are a promising technology for addressing
many challenges that today’s inpatient facilities are facing. This
relates to supporting understaffed clinical teams, taking on non-er-
gonomic or monotonous tasks, and improving overall efficiency of the
system. We refer to such mobile robots for the hospital as au-tonomously self-navigating clinical assistance systems (ASCAS) and
are working toward laying the groundwork for integrating these
systems into the clinics of tomorrow. Since, for ethical and
Fig. 1 Timeline of key events in disaster management and global
surgery policy since 1960. NSOAP: National Surgical, Obstetric, and
Anesthesia Plan; UN: United Nations; WHA: World Health Assem-
bly. BMJ Global Health 2019;4:e001493. https://doi.org/10.1136/
bmjgh-2019-001493
S34 Int J CARS (2021) 16 (Suppl 1):S1–S119
123

technological reasons, we do not believe in the vision of a fully
automated hospital, we see ASCAS systems as a means to support
clinicians, not replace them. We center our concepts around what is
best for patients and clinicians, while economic factors are only
considered secondarily. As a result, and contrary to holistic automa-
tion, humans and robots will need to collaborate as teams within the
hospital, which introduces the problem of workload balancing
between both sides. Though similar problems have been described in
the context of other domains, we argue that the application to the
hospital deserves special consideration due to unique characteristics
regarding highly dynamic workflows and responsibility towards the
patient. In this extended abstract, we present a first approach
regarding workload balancing by means of task allocation in mixed
human–robot teams collaborating within the operating room wing
(OR wing).Methods
Within the framework of the research project AURORA, we are
currently developing a robotic assistant for the OR that is meant to
support the circulating nurses and the surgical team as a whole, by
executing tasks within the non-sterile area of the operating theater,
such as fetching sterilely packaged materials and adjusting medical
devices. According to our vision, the human circulators and the
AURORA robots are forming a team, from here on referred to as
human–robot circulator team (HRCT), that may receive task
assignments from several sources, including the sterilely dressed
surgical team, non-sterile OR staff, technical assistants or even other
robotic systems.
As a foundation for further investigations on how to allocate tasks
intelligently within such an HRCT, we analyzed the tasks and
workflows that are currently being executed by (human) circulators in
the OR. For that, we recorded circulator activity during 15 chole-
cystectomies and 5 sigma resections conducted at the surgical
department of a university hospital.Results
We identified several tasks that are reasonable candidates for both
robotic or human execution (beyond those provided by our AURORA
robot), including cleaning, moving of objects, disposal of waste and
phone management. We also found that the priority and frequency of
these tasks may vary significantly depending on the patient condition,
OR phase and current overall workload. We concluded that, since
there is overlap in human and robot capabilities, a context-aware
workload balancing mechanism is required to make best use of the
available resources in any given situation and also avoid confusion
regarding current responsibilities of individual HRCT members.
Additionally, we consider avoidance of some of these tasks by
implementation of alternative technologies (automated phone man-
agement) as a valid option.
Our task allocation concept considers the following scenario: an
HRCT, consisting of multiple human team members of different
adeptness and multiple ASCAS systems with different capabilities, is
responsible for assisting multiple ORs in parallel and therefore needs
to distribute its resources in an intelligent way. Especially in situa-
tions of high demand or staff shortage, the choice of task allocation
may impact patient wellbeing and staff workload significantly. Con-
sequently, we propose that task allocation should consider these
aspects during matchmaking (i.e. task assignment to individual HRCT
members), instead of assigning tasks randomly or on a first-in-first-out
basis.
Let’s assume that a given task can, per se, be executed either by a
human or a robot. How can intelligently be decided who the task
should be assigned to? We argue that patient wellbeing should be the
most important influence on this decision. For example, in situations
where materials are required urgently to manage an adverse event
during surgery, it should be considered whether the task of fetching
these materials can be executed faster by a human or robot. However,
as long as there is no disadvantage for the patient, we also want to
ease the workload of human HRCT members to improve staff satis-
faction. Therefore, the execution of, e.g. monotonous or heavy-lifting
tasks should be assigned to robotic team members, if currently
available. Finally, in cases where patient well-being or staff ergo-
nomics are not significantly affected, we want to optimize efficiency
of the overall workflow to benefit economic interests of the hospital.
We envision the HRCT task allocation process as follows: A task
manager module receives incoming task assignments and is respon-
sible for creating a schedule, i.e. the execution plan that dictates
which task shall be executed at what time by an available resource
(Clearly, this entails much more than the decision whether to allocate
the tasks to a human or a robot, however, we will exclude these
aspects in the context of this abstract). According to the schedule, the
tasks are then dispatched to HRCT members. While robotic team
members receive task assignments via standard communication
interfaces and protocols (e.g. WIFI and JSON), we propose to use
wearable devices for human team members. An incoming task
assignment will be displayed on the wearable and the circulator can
confirm execution begin via touch or voice interaction. Thus, the task
manager is now aware of the circulator currently being occupied and
considers this information when updating the schedule. However, in
case of an unexpected event with high priority, the circulator may
receive the request to pause the current task and execute the new,
more urgent task first. The circulator can choose to accept or decline
this request, depending on whether an interruption of the initial task is
possible or not. As soon as the circulator finishes a task, the successful
execution must be reported back to the task manager. Again, this can
be achieved using the wearable device.Conclusion
In this extended abstract, we introduced the problem of HRCT task
allocation and discussed in which order patient well-being, staff
ergonomics and the hospital’’s economic interests should be an
influence on this. Furthermore, we proposed an early concept how we
believe wearable devices can be used for allocating tasks to human
HRCT members. In the future, we aim at integrating these results into
our ANTS-OR scheduling framework to offer support for mixed
human–robot teams.
The hospital of the futureC. Amato1, L. McCanne1, R. Yang1, D. Ostler2, O. Ratib3, D.
Wilhelm2,4, L. Bernhard2
1CannonDesign, Los Angeles, California, USA 2Research Group
MITI, Klinikum rechts der Isar, Technical University Munich,
Germany 3Department of Radiology and Medical Informatics,
University of Geneva, Switzerland 4Department of Surgery, Klinikum
rechts der Isar, Technical University Munich, Germany
Purpose
Current healthcare systems around the world are characterized by the
organizational principles of segmentation and separation of medical
specialties. They are structured into departments and facilities which
are not tightly linked to the rest of the healthcare ecosystem. With our
new hospital concept, called Patient Hub, we envision a one-stop
truly patient-centric, department-less facility, where all critical
functions occur on one floor and which could serve not only as a
model for the hospital, but also for the general healthcare system of
the future.Methods
The effectiveness and added value of our proposed hospital archi-
tecture was benchmarked against a traditional design using a 3D
simulation software and by assessing workflow efficiency and patient
satisfaction for an exemplary scenario around a patient being diag-
nosed and treated for rectal cancer.
Int J CARS (2021) 16 (Suppl 1):S1–S119 S35
123

Workflow simulation
Using the 3D simulation software FlexSim HealthcareTM (FlexSim
Software Products, Inc., Orem, Utah, USA) we developed dynamic
models for comparing various quality measures between our two
different settings. We focused on measuring:
• The time spent on each step of patient clinical pathways
• Estimated bottlenecks and waiting times
• Distance and number of patient transfers
• Required staff size
• Number of waiting rooms and other spaces
Results
The Patient Hub ConceptToday’s hospital buildings are often versions of the 1960s bed-tower-
on-diagnostic-and-treatment podium model similar to a Kaiser
Permenente hospital, which are separated in several departments and
in which the patient is incrementally moved around from place to
place to receive care instead of bringing the care to the patient.
Our Patient Hub concept is a radical departure from this design
and envisions a transformative ‘‘one of a kind’’, truly patient-centric,
department-less facility. We propose a highly centralized clinical
layout, where all relevant medical fields of expertise are available
within the same space surrounding the patient (see Figure 1). They
form clusters which contain functionalities of equal classes, for
example inpatient or outpatient care. The centralized clinical layout
brings together staff from all specialties to encourage clinical col-
laboration and care coordination. The Patient Hub co-locates
outpatient, inpatient, rehabilitation, wellness and prevention, ancillary
support spaces, and R&D all under one roof. It is no longer a site for
the treatment of the sick rather than a health-oriented all-encom-
passing facility.
By avoiding copies of functionalities in every department (e.g.
waiting rooms) the Patient-hub concept allows for the saving of
space, for complexity reduction of patient pathways, and for easy
implementation of new treatment concepts. While keeping this
functional patient-hub design with all required functionalities being
logically distributed on one floor, different levels of the building can
be adapted to different patient needs and treatment forms (Figure 2).
Comparison to traditional hospital layoutNumeric results of the actual workflow simulations are given in
Table 1, whereas a more detailed description of the simulation and
results will be presented during the congress.
DiscussionOur (preliminary) results on a simple patient scenario are promising,
since a considerable improvement for every selected parameter can be
observed. In more complicated situations and workflows we believe
the benefits of the new patient-centric layout will become even more
obvious—due to the reduction of bottlenecks and resulting
improvements of target parameters relevant for patient experience.
As of now, the proposed concepts mainly focus on architecturaldesign and a translation to the real world will certainly require many
more building blocks, such as AI, big data and robotics. In particular,
we envision the entire infrastructure, including technical devices,
spaces and functional units to become adaptive, mobile and intelli-
gent. While we plan to incorporate such considerations into future
work, we advocate a very deliberate use of technology, goverened by
the paradigm of bringing care to the patient and to increase patient
satisfaction. Lastly, our simulation results show significant increases
in efficiency throughout the facility, with less required staff members
and less time required per patient.Conclusion
With the Patient Hub concept we envisioned breaking the traditional
departmental organization and topological distribution in isolated
clusters of today’s hospitals and improving patient experience and
satisfaction while optimizing the efficiency of therapeutic and diag-
nostic procedures. We further introduced a more structured approach
to design and experiment with the disruptive and innovative archi-
tecture of future healthcare facilities.
Fig. 1 Re-imagined healthcare paradigm: changing from incremental
‘‘patient to care’’ towards a re-imagined ‘‘care to patient’’ approach
Fig. 1 Patient Hub functional stacking and 3D massing
Table 1 Results of workflow simulation comparison
Parameter Result
Number of ‘‘stops’’ or patient ‘‘hand-offs’’
between staff and departments—(traveling
from different specialty areas to and from
Medical/Surgical Ward/ICU)
55% reduction
Average elevator travel waiting time 85% reduction
Elevator Trips 80% reduction
Reception personnel and waiting rooms needed 50% reduction
Trips to administration for interview, receive
data and instructions
75% reduction
Patient transfer travel distance horizontal 45% reduction
Staff support/commons spaces typically found
and repeated in different departments
(lounges, conference rooms, offices, etcetera)
40% space savings
Universal, one stop patient room (Multi-acuity) 35% increase in
room size
S36 Int J CARS (2021) 16 (Suppl 1):S1–S119
123

25th Annual Conference of the InternationalSociety for Computer Aided Surgery
Chairs: Kensaku Mori, PhD (JP), Cristian A. Linte, PhD (US)
Int J CARS (2021) 16 (Suppl 1):S1–S119 S37
123

Combining augmented reality and 3D printing
to improve orthopedic oncological surgeries
A. Pose Dıez de la Lastra1,2, R. Moreta Martınez1,2, J. A. Calvo
Haro2,3,4, L. Mediavilla Santos2,3,4, R. Perez Mananes2,3,4, J.
Pascau1,2
1Universidad Carlos III de Madrid, Departamento de Bioingenierıa e
Ingenierıa Aeroespacial, Leganes, Spain 2Instituto de Investigacion
Sanitaria Gregorio Maranon, Madrid, Spain 3Hospital General
Universitario Gregorio Maranon, Servicio de Cirugıa Ortopedica y
Traumatologıa, Madrid, Spain 4Universidad Complutense de Madrid,
Departamento de Cirugıa, Facultad de Medicina, Madrid, Spain
Keywords Augmented reality, 3D printing, Orthopedic oncology,
Microsoft Hololens
Purpose
Orthopedic oncology treats tumors affecting bones and soft tissues. In
many cases, it involves their complete surgical resection, ensuring a
safety margin of healthy tissue. However, these surgeries are a real
challenge to clinicians, since local recurrence rate is 27% and the five-
year survival rate, 50% [1].
During the last decade, surgical navigation improved tumor
resection accuracy, decreasing local occurrence, and enhancing sur-
gical outcomes. Nevertheless, traditional navigation systems do not
always adapt to this kind of interventions. They display real-time
navigation information on external screens, requiring the surgeon to
move his attention away from the patient.
Three-dimensional printing (3DP) and augmented reality (AR)
have recently increased their adoption in many medical areas with
exciting benefits. 3DP allows creating patient-specific anatomical
biomodels for surgical planning and patient communication. AR
enables the simultaneous interaction with real and virtually projected
3D elements during medical training or surgery. These two tech-
nologies could overcome the limitations identified for surgical
navigation by displaying relevant patient information on-site during
surgical procedures.
In this study, we propose a system that combines both technolo-
gies to improve orthopedic oncological surgeries. This solution was
developed as an AR-based application for Microsoft HoloLens 2. It
displays the internal anatomical structures overlaid on the patient
using two 3D-printed tools: a reference marker and a surgical guide.
They are designed to fit in a unique position of the bone that sur-
rounds the tumor, thus enabling automatic registration. We assessed
this solution on a patient with an undifferentiated pleomorphic sar-
coma on the right deltoid, measuring the precision with a 3D-printed
phantom obtained from the patient data and evaluating the perfor-
mance during the actual surgical intervention.Methods
An AR-based HoloLens application was developed on Unity plat-
form. The app uses the camera and Vuforia� development kit to
identify a two-dimensional 3D-printed reference marker that contains
a known black and white pattern. Once the marker is identified, vir-
tual models are projected over the patient to guide the surgeon during
the tumor identification facilitating the resection. Three virtual
models (tumor, surrounding bone, and surgical guide) can be dis-
played with user-selected transparency.
The bone and the tumor were segmented from the CT of the
patient using 3D Slicer platform. The surgical guide was created using
MeshMixer software as a negative of the bone’s surface, with a
support to fix the AR marker. The surgical guide was printed in
BioMed Clear V1 resin material (class II biocompatible material) on a
Form 2 stereolithography 3D printer. Both the guide and the AR
marker were sterilized before surgery with ethylene oxide (EtO) at
558C and 378C, respectively. The relative coordinates of the
biomodels and the marker were computed and stored using a
previously developed 3D Slicer module. Once the marker is detected,
the virtual models are automatically displayed in the correct position
with respect to the patient.
Prior to the surgery, the precision of the system was evaluated at
the laboratory using patient-specific phantom, 3D-printed in PLA
with an Ultimaker 3 Extended 3D printer, containing the tumor and
the surrounding bone. We also 3D printed a version of the surgical
guide in resin. Both phantom and guide included eight and four
conical holes respectively (Ø 4 mm 9 3 mm depth) as reference
landmarks for the experiment. We used a Polaris Spectra optical
tracking system and a pointer to record the reference fiducials’
positions, allowing to calculate the registration (phantom’landmarks)
and two precision values: surgical guide placement error
(guide’landmarks) and the AR tracking error. We virtually augmented
14 randomly distributed spheres (Ø 3 mm) on the phantom’s surface
to measure the AR error. Two users selected with the pointer the
position of each conical hole or sphere (guided by the AR app). The
error corresponded to the distance between the pointer position and
the known sphere coordinates. Each user repeated the process five
times.Results
The errors obtained on the phantom are summarized in Table 1. The
mean surgical guide placement error was 1.34 ± 0.39 mm, and the
overall AR error 2.38 ± 0.90 mm. Both values are slightly better than
recent literature in AR surgical guidance with Hololens 1 [2].
In the surgical room, the surgical guides fitted as planned in the
target area on the patient’s bone, and the AR marker could be cor-
rectly detected by Hololens 2. Hence, we could calculate a successful
registration between the AR system and the patient’s anatomy, pro-
jecting the virtual biomodels overlayed on the patient in their
expected location (see Figure 1). Surgeons’ feedback on the intu-
itiveness and comfortability of the system was very positive. They
believe that this AR solution could increase the accuracy of the
procedure and boost their confidence to verify that the tumor has been
correctly resected.Conclusion
The results obtained in both scenarios demonstrate the benefits that
the combination of AR and 3DP can bring to orthopedic oncological
surgeries. The laboratory results show precision values in concor-
dance with current literature, and surgeons’ feedback endorses the
applicability of our proposal from the clinical perspective, promoting
further research on this area. More cases with different tumor con-
ditions will be studied to warranty the usability of the system. This
work establishes a baseline for developing more AR and 3DP systems
for surgical guidance in orthopedic oncology in the future.Acknowledgements
I would like to thank my parents for their endless support, thanks
to my companions for their guidance and advice, and thanks to Luis
for everything.
Table 1 Mean surgical guide placement error and augmented reality
tracking error per user
User 1 User 2 Overall
Surgical guide placement error (mm)
Mean 1.34 1.33 1.34
SD 0.31 0.46 0.39
Augmented reality tracking error (mm)
Mean 2.43 2.31 2.38
SD 0.86 0.95 0.90
S38 Int J CARS (2021) 16 (Suppl 1):S1–S119
123

References
[1] Clark MA, Fisher C, Judson I, Thomas JM (2005) Soft-Tissue
Sarcomas in Adults. N Engl J Med 353:701–711.
https://doi.org/10.1056/NEJMra041866
[2] Moreta-Martinez R, Garcıa-Mato D, Garcıa-Sevilla M, Perez-
Mananes R, Calvo-Haro J, Pascau J (2018) Augmented reality in
computer-assisted interventions based on patient-specific 3D
printed reference. Health Technol Lett 5:162–166.
https://doi.org/10.1049/htl.2018.5072
Development of an electromagnetic catheter tracking
system using TMR sensor for superselective intra-
arterial chemotherapy
R. Nagano1, K. Hara2, A. Ishijima1, N. Tomii1, K. Nakagawa3, Y.
Akagi3, M. Yamazaki3, H. Tsukihara2, E. Kobayashi1, T. Ohya4, I.
Sakuma1,2,3
1The University of Tokyo, Graduate School of Engineering,
Department of Precision Engineering, Tokyo, Japan 2The University
of Tokyo, Medical Device Development and Regulation Research
Center, Tokyo, Japan 3The University of Tokyo, Graduate School
of Engineering, Department of Bioengineering, Tokyo, Japan4Yokohama City University, Graduate School of Medicine,
Department of Oral and Maxillofacial Surgery, Yokohama, Japan
Keywords Tunneling magnetoresistance, Electromagnetic tracking,
Catheter navigation, Oral cancer
Purpose
Superselective intra-arterial chemotherapy is an effective treatment for
oral cancer in that surgeons can provide a high concentration of anti-
cancer drugs into the tumor-feeding arteries through a catheter [1]. In
general, X-ray fluoroscopy is used to track the position and orientation
of the catheter’’s tip for inserting it into the targeted artery. However, it
requires X-ray exposure and administration of contrast agents. Elec-
tromagnetic tracking is often used to track medical instruments inside a
human body [2]. Although electromagnetic wave is less invasive than
X-ray, the size of conventional coil sensors is too large ([ 5.5 mm) to
fit inside the catheter (\ 1.3 mm) for superselective intra-arterial
chemotherapy. For this purpose, tunneling magneto-resistance (TMR)
sensor (* 0.3 mm) that measures magnetic fields based on the tun-
neling magnetoresistance effect is a promising candidate to use as a
magnetic sensor in the electromagnetic system. However, its nonlinear
field-voltage characteristics needs to be considered to implement TMR
sensors in an electromagnetic tracking system. Here, we proposed a
TMR sensor based electromagnetic tracking system considering its
nonlinear field-voltage characteristics and evaluated the position esti-
mation accuracy of the system.Methods
The TMR sensor based electromagnetic tracking system consists of a
field generator and a TMR sensor device. For the field generator, six
inductors were driven simultaneously with different frequencies. The
magnetic field strength of the six inductors was limited to ± 398
A/m, so as not to exceed the range in which the field-voltage char-
acteristics of the TMR sensor were bijective. For the TMR sensor
device, we used a custom-made three axis TMR sensor (ABA03,
Daido Steel, JP). The output voltages were converted to magnetic
field values by a quadratic function fitted nonlinear fields-voltage
characteristics. The converted magnetic field values were decom-
posed into each frequency using phase detection. Calibration was
performed to compensate fields distortion before position calculation.
Magnetic fields distortions are caused by eddy currents in surrounding
conductive materials and mutual induction between inductors. The
magnetic fields’’ values were compensated by a predetermined cali-
bration matrix. The calibration matrix was determined by measuring
the magnetic fields at 45 known positions and minimizing the dif-
ference between the measured values and theoretical values with the
least-squares method.
The position estimation accuracy of the system was evaluated by
the experimental setup shown in Fig. 1. The inductors used in the
experiment were 100 mm in diameter with 6060 turns. The inductor
frequencies were set to 355, 435, 602, 748, 881, 1061 Hz. The sensor
device was located at 45 points using positioning pins within
100 mm 9 200 mm 9 100 mm. The position of the sensor device
was calculated by using the Levenberg–Marquardt method which
searches for a point where the compensated measurement value
matches the theoretical value. The estimated position was iteratively
updated until the position difference became less than 0.1 mm. The
errors between the estimated sensor position and the positioning pins
were evaluated (N = 4).
Fig. 1 HoloLens view during the surgery after the tumor resec-
tion. The virtual bone and tumor are projected overlaid on the patient
in the correct position. A virtual panel allows controlling the
transparency of the virtual biomodels
Fig. 1 Position estimation of a TMR sensor with developed tracking
system
Int J CARS (2021) 16 (Suppl 1):S1–S119 S39
123

Results
The results are shown in Table 1 and Fig. 1. The mean error of 45
points was 1.24 mm. The smallest error was 0.18 mm at (242.5, 75.0,
0.0), while the largest error was 4.62 mm at (242.5, - 100, 100). The
errors tended to increase as the distance from the inductors increased.
The mean error of 22 points on the Z = 0.0 mm plane was 0.85 mm,
while the mean error of 23 points on the Z = 100.0 mm plane was
1.53 mm. For each axis, the mean error was 0.74 mm for the x-axis,
0.55 mm for the y-axis, 0.55 mm for the z-axis.
The mean standard deviation of 45 points was 0.49 mm. The
smallest standard deviation was 0.10 mm at (142.5, 75.0, 0.0), while
the largest standard deviation was 2.11 mm at (242.5, - 50.0, 100.0).
The standard deviations also tended to increase as the distance from
the inductors increased. The mean standard deviation of 22 points on
the Z = 0.0 mm plane was 0.33 mm, while the mean standard devi-
ation of 23 points on the Z = 100.0 mm plane was 0.70 mm. For each
axis, the mean standard deviation was 0.38 mm for the x-axis,
0.27 mm for the y-axis, 0.29 mm for the z-axis.Conclusion
We have constructed and evaluated the position estimation accuracy
of an electromagnetic tracking system using a TMR sensor. The mean
error of sensor position estimation was 1.24 mm. Although the
accuracy of sensor orientation has not been evaluated, TMR sensor is
a promising candidate to use as a magnetic sensor for an electro-
magnetic tracking system in superselective intra-arterial
chemotherapy. (Funding availability: Grant-in-Aid for Scientific
Research (B) (JSPS KAKENHI Grant Number JP 20H04553), JSPS,
Japan)
References
[1] Tohnai I, Fuwa N, Hayashi Y, Kaneko R, Tomaru Y, Hibino Y,
Ueda M (1998) New superselective intra-arterial infusion via
superficial temporal artery for cancer of the tongue and tumour
tissue platinum concentration after carboplatin (CBDCA) infu-
sion. Oral oncology 34(5):387–390
[2] Andria G, Attivissimo F, Di Nisio A, Lanzolla AML, Larizza P,
Selicato S (2019) Development and performance evaluation of
an electromagnetic tracking system for surgery
navigation. Measurement 148:106916.
Developing an MRI-compatible concentric tube robot
for intracerebral hemorrhage evacuation in the bore
of the magnet
Y. Chen1, I. Godage2, S. Sengupta3, D. Sigounas4, C. Kellner5, K.
Sharma6, C. Oluigbo6, A. Carpenter7, K. Cleary6
1University of Arkansas, Fayetteville, United States 2DePaul
University, Chicago, United States 3Vanderbilt University, Nashville,
United States 4George Washington University, Washington, United
States 5Mount Sinai, New York, United States 6Children’s National
Hospital, Washington, United States 7Georgetown University,
Washington, United States
Keywords robotics, interventions, MRI, hemorrhage
Purpose
The goal of this project is to develop and evaluate a minimally
invasive MRI compatible concentric tube robot for intracerebral
hemorrhage (ICH) evacuation under interventional MRI (iMRI).
While the current standard for ICH evacuation uses CT imaging, we
aim to explore whether ICH evacuation under iMRI is feasible and
could provide a new treatment paradigm for these procedures. The
advantages of MRI versus CT for the brain include the delineation of
white matter tracts in optimizing a surgical corridor to the hemor-
rhage; greatly enhanced visualization of underlying pathology, critical
structures, and hemorrhage heterogeneity impacting the degree of
evacuation; and lack of radiation which means multiple scans can be
acquired during the procedure.
About 1 in 50 people suffer from ICH in their lifetime and is the
leading cause of long-term disability in the United States. ICH occurs
when blood leaked from a ruptured vessel accumulates and forms a
blood clot (hematoma) in the brain parenchyma, which can compress
local structures. The 30-day mortality for ICH is about 40% with half
of all deaths occurring in the acute phase, especially in the first 48 h.
Blood spilled outside of the intracranial vessels is toxic to the sur-
rounding brain, causing inflammation and secondary brain injury.
This manifests as edema seen immediately after the hemorrhage and
increases rapidly over the first 24 h. The aim of surgical intervention
is decompression to relieve the mass effect exerted by the hematoma
on the brain. Traditional surgical techniques do not always offer
clinical benefit and often disrupt more normal brain in the operative
approach than the volume of brain that could be saved by evacuating
the clot. These deleterious effects motivate improved treatments to
save at-risk brain tissue. Therefore, a minimally invasive approach
under MRI guidance may offer increased accuracy and the ability to
decompress the brain with less disruption to normal brain in
approaching the hematoma.Methods
Our system concept is shown in the figure 1 which includes (1) an
MRI-compatible concentric tube robotic system positioned on a
6-DoF supporting arm; (2) a navigation workstation to visualize the
cannula and brain/hematoma MRI images; and (3) a user input device
for the clinician to control the concentric tube robot to evacuate the
clot.
The robot will be fabricated using 3D printing techniques and
incorporate novel MRI-safe actuators capable of accurate movement
in the bore of the magnet. Actively tracked microcoils mounted on the
aspiration cannula will enable sub-millimeter position feedback for
accurate cannula localization. Real-time image feedback from MRI
will enable intraoperative monitoring for deploying the aspiration
Table 1 Errors and standard deviations (STD) of 45 points
Mean Median Min. Max.
Error
(mm)
Euclidean
norm
All (45points) 1.24 0.88 0.18 4.62
Z = 0 (22
points)
0.85 0.53 0.18 3.54
Z = 100 (23
points)
1.53 1.19 0.29 4.62
X-axis All (45points) 0.74 0.45 0.08 3.71
Y-axis All (45points) 0.55 0.33 0.06 3.06
Z-axis All (45points) 0.55 0.26 0.04 3.60
SD
(mm)
Euclidean
norm
All (45points) 0.49 0.41 0.10 2.21
Z = 0 (22
points)
0.33 0.29 0.10 0.72
Z = 100 (23
points)
0.70 0.54 0.16 2.21
X-axis All (45points) 0.38 0.24 0.05 2.62
Y-axis All (45points) 0.27 0.21 0.05 0.96
Z-axis All (45points) 0.29 0.26 0.02 0.80
S40 Int J CARS (2021) 16 (Suppl 1):S1–S119
123

cannula deployment within the hematoma. MRI will also help mon-
itor the treatment outcome to avoid incomplete or overly aggressive
hemorrhage evacuation.Results
We have created a prototype MRI-compatible concentric tube robot
for ICH aspiration. It consists of an MR-safe actuation unit that
applies the translational and rotational motions to the concentric
tubes. The robot is mounted on top of a 6-DOF stereotactic supporting
arm to enable the correct orientation towards the hematoma. We have
tested the concentric tube robot workspace in ICH models, segmented
from brain images from 20 patients provided by Vanderbilt University
Medical School under an approved IRB protocol, and found the
aspiration cannula could reach and cover all the hematomas. A
benchtop targeting accuracy characterization study was performed
using an electromagnetic tracker (Aurora, Northern Digital, Inc.). The
experimental results indicated the prototype has a targeting accuracy
of 1.26 ± 1.22 mm [1]. The MRI-guided phantom study showed that
the robot successfully reached the desired target with real-time MRI
guidance and evacuated approximately 11.3 ml of phantom hema-
toma in 9 min. The complete setup was tested in a 3T MR scanner
and no image distortions or safety hazards were observed based on
ASTM standards tests.Conclusion
We will build on the prototype system described above to expand its
capabilities including real-time MRI guided concentric tube robot
control and efficient hemorrhage evacuation with intraoperative
monitoring. Future work will also include cadaver tests and swine
animal studies.References
[1] Chen Y, Godage IS, Sengupta S, Liu CL, Weaver KD, Barth EJ
(2019) MR-conditional steerable needle robot for intracerebral
hemorrhage removal. International journal of computer assisted
radiology and surgery, 14(1), pp. 105–115.
Real-time automated performance metrics for
mastoidectomy surgical simulation
E. Simpson1, S. Agrawal1,2,3,4, H. Ladak1,2,3,4
1Western University, Electrical and Computer Engineering, London,
Canada 2Western University, Department of Otolaryngology-Head
and Neck Surgery, London, Canada 3Western University, Department
of Medical Biophysics, London, Canada 4Western University, School
of Biomedical Engineering, London, Canada
Keywords Metrics, Mastoidectomy, Simulation, Bone drilling
Purpose
Mastoidectomy (temporal bone drilling) is difficult to master and
requires significant training. Cadaveric practice material is expensive
and difficult to obtain, resulting in the closure of many temporal bone
courses in North America. Additionally, an expert surgeon must be
present to evaluate the drilled cadaveric sample. These requirements
hinder the accessibility of surgical training in otology. An adjunct to
cadaveric practice is a virtual reality simulator designed for temporal
bone drilling. Western University, University of Calgary, and Stan-
ford University have developed a virtual surgical environment called
CardinalSim that allows the user to view and drill patient-specific
digital models of anatomical structures as well as receive intuitive
haptic (touch) feedback from simulated tools. Whilst CardinalSim
removes the need for cadaveric material and provides summative
feedback automatically, it does not yet provide formative feedback
and an expert is required to monitor the training session. Hence, the
purpose of this work is to implement real-time metrics to provide
formative feedback.Methods
Software technologies including voxel representation, ray-casting,
and asynchronous scheduling were employed to create an automated
real-time metric system. Algorithms have been developed to
dynamically monitor and evaluate CardinalSim’’s virtual surgical
environment, haptic tool, and digital anatomical structures in real-
time. User drilling interaction is sequenced into a series of drilling
strokes that contain information regarding the applied pressure, bone
mass removed, and time required for removal. These data points are
recorded to volatile memory and analyzed for indication of poor
surgical practice. After the user completes a drill stroke (signified by
de-actuating the haptic tool), the stroke is further analyzed to calcu-
late metrics and statistics pertaining to the overall surgical procedure
progress.
This version of CardinalSim allows the user to initiate an evalu-
ated procedure by importing and signifying critical structures and the
evaluation metrics to process. Calculated metric data are presented to
the user as raw values, visual queues, and textual feedback in the form
of numerical fields, colour indicators, and a progress-feed. These
user-interface elements can be displayed as a side-panel next to the
surgical view or as a secondary view on an additional display. In order
to maintain user-interface reliability and performance, an asyn-
chronous system was developed that ensures every data point is
recorded and the most recently analyzed data are displayed to the
user. Finally, when concluding the virtual procedure, a post-operative
report is displayed.Results
Real-time automated metrics have been developed to identify poor
practices such as sporadic or hesitant drilling, drilling whilst the drill
burr is not visible, drilling forcibly with the bottom-side of the burr,
and using a burr that is either too large or too coarse (see Figure 1).
Overall procedure progress has also been quantified to provide the
total amount of volume removed, length of time spent drilling, length
of time taken to drill out critical landmark structures, average force
applied, and average distance between removed bone material.
Metrics that indicate poor practice have been evaluated with
various acceptance tests wherein a user with adept surgical knowl-
edge processes the corresponding poor and proper actions to verify
that the system can detect and record them effectively. This was
furthered by thorough alpha and ad-hoc testing in virtual user envi-
ronments and workflows during the agile development phase.
Numerical-based metrics such as those involving volume were veri-
fied by processing pre-programmed surgical scenes generated outside
of CardinalSim to ensure known values were obtained. Numerical-
based metrics involving time and force were tested by comparing the
results to external monitoring applications such as those included with
the haptic arm.
Fig. 1 (Left) Schematic diagram of the 3D-printed robot inside the
MRI scanner. The top inset shows the AtamA patient transfer and
head stabilization system. The left bottom inset shows the robot
module mounted on a passive supporting arm. (Right) The surgeon
sits inside the MRI control room and uses a joystick (right hand) to
manipulate the aspiration cannula and a proportional vacuum
regulator (left hand) to control the aspiration under MRI guidance
Int J CARS (2021) 16 (Suppl 1):S1–S119 S41
123

The asynchronous design resulted in no noticeable performance
impact on the simulator when compared to the same system with
metrics disabled. During testing, frames per second was reduced by
an average of 3% while metric calculation was occurring. Thus, user
metric feedback was able to formulate and display as the user inter-
acts with the system in real-time.
Clinical residents are currently being recruited to participate in a
validation study to determine efficacy of the metrics in discriminating
surgical performance.Conclusion
Real-time automated metrics have been developed to identify poor
practice (sporadic or hesitant drilling, drilling whilst the drill burr is
not visible, drilling forcibly with the bottom-side of the burr, and
using a burr that is either too large or too coarse) and highlight overall
procedure progress (total amount of volume removed, the length of
time spent drilling, the length of time taken to drill out critical
landmark structures, average force applied, and average distance
between removed bone material). The user receives formative feed-
back as raw values, visual queues, and text in the form of numerical
fields, colour indicators, and a progress-feed. Real-time performance
was maintained with the use of an asynchronous sequencing and
analysis design that dynamically monitors user interaction. The
addition of a real-time automated metric feedback system will allow
users to learn mastoidectomy when an expert surgeon is not present,
thus saving valuable human resources.
3D cryo-balloon catheter orientation reconstruction
based on automatically detected structures in 2D
X-ray fluoroscopy
D. Bertsche1, T. Dahme1, W. Rottbauer1, V. Rasche1, I.
Vernikouskaya1
1Ulm University Medical Center, Clinic of Internal Medicine II, Ulm,
Germany
Keywords cryo-balloon ablation, pulmonary vein isolation, 3D
reconstruction, image fusion
Purpose
Cryoablation is a popular treatment for atrial fibrillation. The mainly
X-ray fluoroscopy (XR)-guided procedure is performed by placing the
cryo-balloon (CB) in the pulmonary vein ostia and filling the CB with
refrigerant to electrically isolate the veins from the atrium by annular
scarring. High variability of pulmonary veins (PV) and acute angu-
lation of PV challenges proper CB positioning [1]. However, to
achieve sufficient PV isolation, the CB must be in optimal position in
relation to the PV. Insufficient isolation may require re-intervention.
To facilitate correct CB positioning, visualization of the CB location
in relation to the target structure might be helpful. In this work, we
propose to reconstruct the 3D CB orientation from automatically
detected radio-opaque marker and catheter shaft in biplane XR fluo-
roscopy to visualize the CB position relative to the patient specific left
atrium. Based on the position of the radio-opaque marker and the
course of the catheter shaft, detected in the biplane XR fluoroscopy
using two neural networks, the CB orientation was reconstructed in
3D and fused with the patient specific 3D model of the left atrium and
its centerlines. The CB orientation in relation to the target structures
could achieve improved navigation during the procedure or may
enable accurate pre-procedural planning for re-intervention.Methods
The radio-opaque XR marker and the cryo-balloon catheter shaft were
automatically segmented in corresponding biplane fluoroscopic ima-
ges using neural networks of U-net architecture [2]. The segmented
marker and catheter shaft masks were post-processed to obtain: (1) a
single seed point as the center of the detected marker contour and (2)
the spline fitted catheter centerline from analytical graph of the
skeletonized networks output. Based on the automatically detected
structures in biplane images the 3D orientation of the CB was
reconstructed. The marker position was reconstructed based on
epipolar geometry from (1). From (2), a direction vector was fitted
using minimal averaged Euclidean distance measurement (Fig. 1a).
According to the projection geometries, the direction vectors were
translated in order to obtain initialization by the previously recon-
structed marker position. Using the cross product, the normal to the
plane spanned by the projection vector and direction vector was
calculated for both of the C-arm configurations. The cross product of
the normals provided the 3D catheter direction (Fig. 1b). CB model
including an ellipsoid, marker, and catheter were constructed in
consideration of the specifications of Arctic Front Advance ProTM
(Medtronic, Minneapolis, USA). Since the CB model is rotationally
Fig. 1 CardinalSim surgical view with metrics
Fig. 1 a Biplane XR marked with automatically detected marker
(orange), catheter shaft (blue), and fitted line (red). b From the
projection vector (solid line) and the catheter orientation (dotted line),
initialized by 3d marker position (orange blob), the normal (dashed
line) was determined for frontal (red) and lateral (yellow) view,
yielding the 3d catheter orientation (orange solid line)
S42 Int J CARS (2021) 16 (Suppl 1):S1–S119
123

symmetric, there are only 2 landmarks required for proper 3D-3D
registration of the CB model to the XR fluoroscopies. A paired-point
registration between CB model and XR fluoroscopy was done using
the marker center and CB center. Further, 3D CT-based surface
models of the left atrium (LA) including the PV ostia were generated.
Besides the surface model of the LA, its PV centerlines were gen-
erated. Co-registration of the LA model and XR angiography of the
LSPV was performed manually.Results
The automatic localization of the CB marker and catheter shaft using
U-net could be achieved with high accuracy. The only limitation
results from tricky catheter orientation and overlay of interfering
structures, especially contrast agent injection. Figure 2 shows an
example of the reconstructed catheter orientation and the aligned CB
model as 2D overlays in a) and as 3D model b). As can be seen in
Figure 2a, the model aligned to the reconstructed structures match the
marker and catheter shaft in both biplane XR-projections. Further, the
anatomic overlay enables the recognition of the relevant anatomy. By
alignment of the CB model to the reconstructed orientation in com-
bination with the registered 3D model of the LA and its centerlines,
the position and orientation of the interventional tool within the
patients’’ specific anatomy can be visualized (Fig. 2b).Conclusion
The presented approach yields a visualization of the CB in relation to
the patient specific target structure. Limitation of the detection
method requires further work to ensure the robustness of the recon-
struction algorithm, e.g. in single-frame detection failure or if
opposite catheter orientation direction is detected. However, the
automatic detection of CB structures is the basis on the way to real-
time visualization. In an intraprocedural environment the CB position
potentially might be verified or adjusted by alignment of the
reconstructed catheter with the PV centerline. Therefore, the correct
manual registration is essential. Further application may consist in
documenting the intervention and subsequently pre-procedural plan-
ning in case of re-intervention. Further evaluation needs to be done
regarding the deviation in case of highly angulated catheters. Nev-
ertheless, the presented approach provides a basis for a simple
procedure to likely facilitate correct CB positioning during PV
ablation, which is expected to be further refined.Acknowledgements
The project on which this report is based was funded by the Federal
Ministry of Education and Research under the funding code
13GW0372C. Responsibility for the content of this publication lies
with the author.
References
[1] Andrade JG, Dubuc M, Guerra PG, Macle L, Mondesert B,
Rivard L, Roy D, Talajic M, Thibault B, Khairy P (2012) The
biophysics and biomechanics of cryoballoon ablation. Pacing
and clinical electrophysiology, 35(9):1162–1168
[2] Vernikouskaya I, Rottbauer W, Rasche V (2020) Real-time
catheter tip segmentation and localization in 2D X-ray fluo-
roscopy using deep convolutional neural network. In CARS
Proceedings 2020, Int J Comput Assist Radiol Surg 15(Suppl 1):
S67-S69
Model-based surgery—evaluation of preoperative
characteristics
T. Vogel1, M. Berlet1, D. Ostler1, M. Kranzfelder1, H. Feussner1, D.
Wilhelm1
1Klinikum rechts der Isar, Technical University of Munich, MITI—
Minimally invasive Interdisciplinary Therapeutical Intervention,
Department of Surgery, Munich, Germany
Keywords cognitive surgery, prediction, surgery, workflow
Purpose
Cognitive surgery is the goal of extensive scientific efforts. This term
includes, among other things, the possibility of predicting the course
of certain steps during a surgical procedure. This implies two central
aspects. First, it must be defined which steps a surgery consists of at
all, and second, it must be defined which parameters are crucial to
predict the course of a certain phase of the surgery. The assumption is
therefore that there are parameters such as laboratory values and
biometric measurements that influence the individual course. So the
main problem is to find a way to define these appropriate parameters
using statistical methods and to determine which combination is
optimal here.Methods
We selected the laparoscopic cholecystectomy as a representative,
and daily performed procedure with a high degree of standardization,
in order to find a procedure that is suitable to define crucial param-
eters. For this purpose, an existing database of 201 laparoscopic
cholecystectomies was used. From each surgical phase, the duration
of the dissection phase was determined and tested for the suitability of
19 parameters (age, height, sodium, potassium, weight, AP, bilirubin,
GGT, GPT, GOT, albumin, CRP, Quick, PTT, leukocytes, gender,
gallbladder stone size, platelets, and thickness of abdominal fat).
A ‘‘long’’ dissection was arbitrarily defined as one that lasts longer
than 05’’33’’‘‘ (median of the entire collective). The collective was
initially divided into two groups K1 and K2. K1 was used to find
Fig. 2 CB model (yellow) aligned to the reconstructed marker and
catheter shaft (orange) with respect to the LA model (blue) and its
centerlines overlaid on the biplane XR (a) and as registered 3d model
(b)
Int J CARS (2021) 16 (Suppl 1):S1–S119 S43
123

suitable marker combinations, which were then to be validated with
K2.
The definition was done in two steps. First, receiver operating
characteristic (ROC) analysis was used to determine appropriate
cutoff values for each marker, which were determined by optimizing
the product of sensitivity and specificity. In a second step, the found
cutoff values were combined by an R-script to evaluate which com-
binations of parameters could perform an even better prediction for a
patient with a preparation time of more than 050330’ or. This was
again done by optimizing the product of sensitivity and specificity,
involving testing for combinations of one, two, or up to eight
parameters. Tests were considered positive if half or more of the
parameters suggested a longer dissection time. The constellations
with the best product of sensitivity and specificity were then tested
with the second collective K2.Results
ROC analysis of the 19 parameters studied revealed intermediate
sensitivities and specificities for several parameters, but none was
higher than 74 and 72%, respectively. Thus, no single parameter was
suitable to predict with certainty whether the respective patient would
have a longer preparation time.
When the parameters were combined with the cuttoff values
found, the combination of the six values ‘height\ 177 cm’,
‘sodium[ 142 mmol/l’, ‘potassium\ 4.5 mmol/l’, ‘body weight[80 kg’, ‘AP[ 66 U/l’, ‘Quick[ 105%’, and ‘abdominal fat thick-
ness\ 4 cm’ was the optimal combination to separate patients with a
long preparation time from those with a short one. (Sensitivity 88%,
Specificity 74.5%).
The tests found in the optimization phase were then applied to the
remaining K2 collective. Here, the optimal combination of the six
parameters described above yielded a sensitivity of only 68 and a
specificity of 55%.Conclusion
It is still difficult to define which parameters are crucial for an
appropriate patient model in cognitive surgery. Here we describe an
approach to this problem using the well-established method of ROC
analysis. Since the separation of a patient collective with respect to
gallbladder dissection time during laparoscopic cholecystectomy is
improved when several parameters are combined, this method seems
promising. However, it still requires some validation and optimization
as well as testing in the context of other surgical procedures. There is
an urgent need for valid patient models to advance cognitive surgery.
Retrospective analysis of procedures already performed is an
important means to design such models, and appropriate approaches
are crucial.
Magnetic nanoparticle detector for laparoscopic
surgery: assessment of detection sensitivity
M. Horstman—van de Loosdrecht1, L. Molenaar1, E. Krooshoop1, B.
ten Haken1, J. Meijerink2, L. Alic1, I. Broeders3,4
1University of Twente, Magnetic Detection & Imaging, Enschede,
Netherlands 2Radboud University Medical Center, Operating Rooms
and MITeC, Nijmegen, Netherlands 3Meander Medical Center,
Surgery, Amersfoort, Netherlands 4University of Twente, Robotics
and Mechatronics, Enschede, Netherlands
Keywords Magnetic detection, Laparoscopic surgery, Sentinel lymph
node, Magnetic nanoparticle
Purpose
Sentinel lymph node biopsy (SLNB) is a minimally invasive proce-
dure developed to detect and remove sentinel lymph nodes (SLNs) to
select treatment regimes in a variety of tumor types. An SLN is one of
the first lymph nodes draining from a primary tumor and it therefore
has the highest probability of containing metastases. The detected
SLNs are surgically removed and pathologically investigated to
identify potential metastases. Consequently, when identified during
surgery and free of tumor cells, removing all regional lymph nodes
becomes obsolete decreasing the burden to the patient. Magnetic
SLNB is enabled by injection of superparamagnetic iron oxide
nanoparticles (SPIONs) combined with a handheld probe detecting
the SPIONs. Additionally, a pre-operative MRI scan can be used for
intraoperative guidance and a post-operative MRI scan can be used to
confirm that all SLNs were removed. For abdominal tumors, such as
prostate cancer, (robot-assisted) laparoscopic surgery is standard care.
The main challenge when developing a detector for a laparoscopic
procedure is the combination of diameter of the detector (limited by
the use of trocars) and sufficient detection depth. A laparoscopic
differential magnetometer (LapDiffMag) was developed to enable
magnetic laparoscopic SLNB, and assessed on its clinical perfor-
mance regarding (depth) sensitivity.Methods
To detect magnetic nanoparticles, differential magnetometry (Diff-
Mag) was used [1]. This patented nonlinear detection method is
SPION-specific and is influenced minimally by surrounding tissue
and surgical instruments made of steel. LapDiffMag utilizes excita-
tion coils to activate magnetic nanoparticles and detection coils to
acquire the consequent magnetization of the particles. To maintain
sufficient depth sensitivity after decreasing the diameter of the
detector, the excitation and detection part of the system were sepa-
rated [2]. Excitation coils were designed large and placed underneath
the patient, while the detection coils in the probe are kept small
enough to fit through a standard 12 mm trocar (Figure 1: setup).
However, with this new setup, the detection coils move through the
excitation field, leading to disturbances in SPION detection. This was
solved by active compensation, a way to actively cancel-out the
excitation field perceived by the detection coils, facilitated by an
additional set of compensation coils [2]. To assess performance of the
LapDiffMag, we used Magtrace� magnetic nanoparticles (a CE-cer-
tified and FDA-approved tracer for SLNB) in the following
experiments:
• Identification of minimum iron content detectable by LapDiff-
Mag: various amounts of Magtrace� (2.8, 5.6, 7, 9.8, 14, 28, 42,
56, 84, 112, 252, and 504 lg iron) were positioned directly in
front of the probe.
Fig. 1 LapDiffMag situated in an operating room. The excitation coil
is shown in green, the detection probe in blue, and the control unit in
yellow. The number (42) displayed, and the pitch of the sound
represent either the amount of particles close to the probe or the
distance between probe and sample
S44 Int J CARS (2021) 16 (Suppl 1):S1–S119
123

• Assessment of depth sensitivity of LapDiffMag: a sample
containing 504 lg iron was measured at various distances to the
detection probe in air.
Results
An advantage of LapDiffMag is that it potentially can be used in a
regular operating room during laparoscopic surgery, in contrast to
other magnetic methods such as an MRI scan or EMG measurement.
Strength of the signal detected by the LapDiffMag system is pre-
sented on a screen and as a sound with a pitch corresponding to the
strength of the signal detected. The minimum detectable amount of
iron by LapDiffMag was found to be 9.8 lg, representing the sensi-
tivity of the system. Detection depth of LapDiffMag for a sample
containing 504 lg iron was found to be 10 mm.Conclusion
LapDiffMag demonstrated promising first results in terms of iron
sensitivity and detection depth. It is a new route for laparoscopic
magnetic SLNB that has the potential to facilitate abdominal cancer
treatment strategies.References
[1] Visscher M, Waanders S, Krooshoop H J G, ten Haken B
(2014), Selective detection of magnetic nanoparticles in
biomedical applications using differential magnetometry, Jour-
nal of Magnetism and Magnetic Materials, 365: 31–39
[2] van de Loosdrecht M M, Waanders S, Krooshoop H J G, ten
Haken B (2018), Separation of excitation and detection coils for
in vivo detection of superparamagnetic iron oxide nanoparticles,
Journal of Magnetism and Magnetic Materials, 493: 165362
Spatial information considered module based
on attention mechanism for self-supervised depth
estimation from laparoscopic image pairs
W. Li1, Y. Hayashi1, M. Oda2, T. Kitasaka3, K. Misawa4, K. Mori1,5,6
1Nagoya University, Graduate School of Informatics, Nagoya, Japan2Nagoya University, Information Strategy Office, Information
and Communications, Nagoya, Japan 3Aichi Institute of Technology,
Faculty of Information Science, Toyota, Japan 4Aichi Cancer Center
Hospital, Department of Gastroenterological Surgery, Nagoya, Japan5Nagoya University, Information Technology Center, Nagoya, Japan6National Institute of Informatics, Research Center of Medical
Bigdata, Nagoya, Japan
Keywords Depth estimation, Laparoscopic surgery, Abdominal sur-
gery, Self-supervised learning
Purpose
Recently, robotic surgical system has been developed as a powerful
tool for assisting minimally invasive surgery. Depth estimation is
useful to generate surgical navigation information in robot-assisted
laparoscopic surgery system. Due to the development of deep learning
and its wide application in depth estimation, the accuracy of depth
maps predicted by self-supervised deep learning have been greatly
improved by introducing a left–right depth consistency loss compared
to traditional methods. However, continuous convolution operations
in the feature encoder module lead to the loss of spatial information of
input images and blur depth estimation at object boundaries estimated
in depth images after feature decoder module. In order to maintain
high-resolution representations, this paper proposes an attention-
based contextual module for self-supervised learning in depth esti-
mation task.
Methods
The basic self-supervised strategy is followed by the previous method
[1]. At the training phase, we input the rectified stereo image pairs,
corresponding to the left and right laparoscopic color images, into the
network. Then the left one is used to predict the stereo disparity maps.
Based on the left color image and right disparity map, we reconstruct
the fake right color image. While in a similar way, the left recon-
structed image will also be predicted by the right color image and left
disparity map. The depth maps are obtained from the stereo disparity
maps using the extrinsic parameters of the stereo cameras. However,
spatial information of original image is lost in the previous network
[1] that is based on the standard architecture with chained convolution
layers.
The proposed attention-based contextual module consists of three
major blocks: the attention-based block, the dense atrous convolution
(DAC) block and the spatial pyramid pooling (SPP) block. Generally,
depth estimation is realized at pixel level by finding an accurate
correspondence between image pairs under this self-supervised
strategy. Therefore, a cross-dimension interaction attention-based
block is adopted to learn contextual representations of features with
similar semantic similarity at the first of this module. This attention-
based block is made up of three parallel branches. The first two
branches build a channel attention mechanism together. The final
branch is used to construct spatial attention mechanism by the channel
pooling layer. Then, we introduce DAC block and SPP block into the
proposed module.
These two blocks are both to reduce the loss of spatial information
after chained convolution operations. DAC block contains four cas-
cade branches with different number of atrous convolution that
employs different receptive fields, and encodes the high-level feature
maps. SPP is also adopted to compress features into four scales where
the low-dimensional feature maps are up sampled to the same size as
input feature map in final. We design the two parallel branches for
these two blocks instead of a chained architecture in the previous
method to reduce the loss of spatial information. We integrate these
methods into a module to predict depth for medical images. More-
over, this module can be plugged into classic backbone network easily
and the experiments show it can improve the performance of previous
method [1].Results
The proposed method was implemented in Pytorch. We used the
stereoscopic image pairs dataset from the Hamlyn Centre Laparo-
scopic/Endoscopic Video Datasets [2]. This training dataset includes
18,624 rectified image pairs, and testing dataset includes 5231 recti-
fied image pairs. They are both collected in partial nephrectomy using
da Vinci robotic assisted system with stereo-laparoscope. We per-
formed an ablation study by changing components of our module. The
experimental result showed that combination of all components leads
to improve performance. Moreover, we replaced the backbone in the
previous method with the U-Net and repeat the experiments to
evaluate the performance of the proposed module on different back-
bones. And the proposed module leaded to an improvement on
different backbones.
The mean SSIM and PSNR of testing stereo image pairs were
shown in Table 1. Our experimental results showed that the proposed
module improved about 5.25% in PSNR and about 2.72% in SSIM,
comparing with the previous method [1]. Meanwhile, the spatial
information of the input image was retained with chained convolution
layers, as shown green boxes in Fig. 1.Conclusion
In this work, we proposed a novel attention-based contextual module
for self-supervised depth estimation method from stereo laparoscopic
images. This module tried to tackle the limitation of previous method
that consecutive convolution operations that lead to a low-represen-
tation and loss of spatial information of images. The module is made
Int J CARS (2021) 16 (Suppl 1):S1–S119 S45
123

up of three blocks. The attention-based block is chosen according to
the consideration of high accuracy requirement for depth estimation at
the pixel level. DAC and SPP are designed into two parallel branches
instead of traditional chain structure. Experimental results showed
that the proposed module improved the accuracy of the disparity map
and retained the spatial information of the input image compared with
the previous method.
References
[1] Clement G, Aodha O, Brostow G (2017) Unsupervised
monocular depth estimation with left–right consistency. Pro-
ceedings of the IEEE Conference on Computer Vision and
Pattern Recognition: 270–279
[2] Ye M, Johns E, Handa A, Zhang L, Pratt P, Yang GZ (2017)
Self-supervised siamese learning on stereo image pairs for depth
estimation in robotic surgery. Hamlyn Symposium on Medical
Robotics
Real-time deformation simulation of hollow organs
based on XPBD with small time steps and air mesh
for surgical simulation
S. Li1, Y. Hayashi1, M. Oda2, K. Misawa3, K. Mori1
1Nagoya University, Graduate School of Informatics, Nagoya, Japan2Nagoya University, Information Strategy Office, Information
and Communications, Nagoya, Japan 3Aichi Cancer Center,
Department of Gastroenterological Surgery, Nagoya, Japan
Keywords Real-time, Deformation simulation, Hollow organs, Sur-
gical simulation
Purpose
With the development of computer technologies, surgical simulator is
gradually utilized for the surgical skill training. Since most organs of
the human body are deformable, the deformation simulation of them
is fundamental to a surgical simulator. For providing high-quality user
experience, the simulation also needs to be real-time. Although some
research has been carried out on this topic, there are few studies that
are focused on hollow organs. Target organs in organ deformation
simulation studies are commonly solid, such as the liver and kidneys,
or hollow but treated as solid, such as the gallbladder. Obviously, the
deformation of hollow organs may not be simulated in the same way.
Therefore, in this paper, a fast, simple, and robust method is proposed
to simulate the deformation of hollow organs in real-time. We pro-
posed a novel double-layer model to simulate hollow organs
deformation and adopted extended position-based dynamics (XPBD)
with small time steps [1] to simulate deformation and air mesh [2] to
prevent self-collision. We tested our method on a stomach model.Methods
Double-layer model
A general organ model usually consists of only a single-layer
surface mesh without thickness. To obtain the volume mesh, which is
necessary for the simulation, all the inner space is tessellated and
assumed solid regardless of whether the organ is solid or not in
reality. For more appropriate simulation of hollow organs, a hollow
model would be better instead of a solid one. Therefore, we proposed
a novel double-layer hollow model. By increasing the thickness of the
surface in a single-layer model, we obtained a double-layer model
that consists of an outer surface and an inner surface. The space inside
the inner surface represents the hollow structure and the space
between the outer and inner surfaces represents the wall of hollow
organs. We tetrahedralized the ‘‘wall’’ part to get the volume mesh for
deformation simulation. The ‘‘hollow’’ part was also tetrahedralized,
which is called air mesh and will be explained in later paragraphs.
Basic deformation simulation
XPBD with small time steps [1] is popular in physical simulation
recently. It can provide robust and visually plausible deformation in
real time, which is crucial in surgical simulation. Furthermore, it is
also extensible by adopting different types of constraints to achieve
various effects. Therefore, we adopted XPBD with small time steps as
our deformation simulation framework. We built distance constraints
along each edge in the volume mesh of the ‘‘wall’’ part in our model,
which can conserve the distance between two vertices of one edge. To
conserve the volume of organ, we also gave each tetrahedron in the
‘‘wall’’ part a signed volume constraint. Compared with general
volume constraint, signed volume constraint prevents tetrahedrons
from inversion naturally, which is common when the model is
severely distorted. XPBD with distance constraint and signed volume
constraint enables to perform the basic deformation simulation of
hollow organs.
Self-collision prevention
Along with the double-layer model, self-collision prevention
method is also introduced. The self-collision refers to the collision
between different parts of the model itself. In solid organ models,
self-collision is rare due to the solid shape. However, since there are
no constraints inside the hollow interior space in a double-layer
model, self-collision will occur. Therefore, we introduced air mesh
[2] to solve this problem. The ‘‘hollow’’ part was tetrahedralized and
called air mesh. We add unilateral volume constraints to tetrahedrons
in the air mesh and integrated it into the XPBD framework. During
the simulation, when the volume of a tetrahedron in the air mesh is
negative which means it is inverted, unilateral volume constraint
makes its volume back to zero. The self-collision problem is solved
robustly and naturally in this way without increasing too much
computational burden.
Table 1 Comparison of proposed module on different backbone
networks by SSIM and PSNR
Methods Mean SSIM
(Left)
Mean SSIM
(Right)
Mean PSNR
(Left)
Mean PSNR
(Right)
Baseline [1] 0.85 0.84 18.3 18.08
Baseline
(DAC ? SPP)
0.86 0.85 19.16 18.8
Baseline
(full module)
0.87 0.86 19.34 18.94
U-Net 0.84 0.83 17.66 17.58
U-Net
(DAC ? SPP)
0.85 0.84 18.13 18.26
U-Net
(full module)
0.86 0.86 18.67 18.9
Fig. 1 Example and comparison of previous method [1] and
proposed method. a original left image of stereo image pairs,
b disparity maps estimated by the previous method, c disparity maps
estimated by the previous with the proposed module, d disparity maps
with color maps, and e reconstructed left image. Green boxes indicate
the results of the previous method with and without the proposed
module in the same area
S46 Int J CARS (2021) 16 (Suppl 1):S1–S119
123

Results
We tested our method on a PC with Intel Core i7-8700 K CPU,
NVIDIA GeForce RTX 3080 GPU, and 64.0 GB RAM. We generated
a stomach model from stomach region segmented from a CT volume.
The processed double-layer stomach model has 10,316 vertices,
35,424 tetrahedrons in volume mesh, and 33,315 tetrahedrons in air
mesh. Unity was chosen as our engine because it facilitates rapid
development. We let the model free fall onto a frictionless tray and
simulated the deformation. The deformation simulation and self-
collision prevention procedures were computed parallelly on GPU.
The average processing time per frame was 5.65 ms. We also com-
pared the results of single-layer solid model, double-layer hollow
model with air mesh, and double-layer hollow model without air
mesh. The comparison is shown in Fig. 1. Compared with the sim-
ulation of a single-layer solid model, the simulation of a double-layer
hollow model is more plausible and closer to the real deformation of a
hollow organ. Compared with the simulation without air mesh, the
simulation with air mesh solves the self-collision problem well.Conclusion
This paper aims to simulate the deformation of hollow organs in real
time for the further application in surgical simulation. We proposed a
fast, simple, and robust method based on a novel double-layer model,
XPBD with small time steps, and air mesh. We tested our method
with a stomach model and achieved a favorable result. A limitation of
this work is that constraints of the deformation simulation are too
simple to show the complex physical properties, like anisotropy and
heterogeneity. We will work on it in future.
References
[1] Macklin M, Storey K, Lu M, Terdiman P, Chentanez N, Jeschke
S, Muller M (2019) Small steps in physics simulation. SCA’19:
Proceedings of the 18th annual ACM SIGGRAPH/Eurographics
Symposium on Computer Animation
[2] Muller M, Chentanez N, Kim T-Y, Macklin M (2015) Air
Meshes for Robust Collision Handling. ACM Trans
Graph 34:133:1–133:9. https://doi.org/10.1145/2766907
Active positioning arm with high RCM changeability
using parallel sliding mechanism for minimally invasive
surgery
Y. Yi1, B. S. Cheon2, S. Cho1, D. S. Kwon1,3
1Korea Advanced Institute of Science and Technology, Mechanical
Engineering, Daejeon, South Korea 2Korea Advanced Institute
of Science and Technology, Robotics Program, Daejeon, South Korea3EasyEndo Surgical Inc., Daejeon, South Korea
Keywords Active positioning arm, Minimally invasive surgery,
Parallel sliding mechanism, RCM Changeability
Purpose
Minimally Invasive Surgery (MIS) robot systems have a remote
center of motion (RCM) in which a surgical instrument conducts a
fulcrum motion around a point of incision. It is generally considered
that there is no lateral motion to RCM point, however, in real surgery,
there are many cases in MIS the RCM point moves. For example, the
RCM point may be moving because of heavy breathing, strong
heartbeat, and movement of the patient [1]. Moreover, the RCM point
is changed to get additional sight of the lesion in arthroscopic surgery
and vitreoretinal surgery.
Many active positioning arms (APAs) for RCM have been
developed over many years and can be classified into two categories,
depending on whether the RCM point is defined and mechanically
locked based on the kinematics of the mechanism (e.g. link) or not
[2]. APAs that the RCM point is mechanically locked are strong
against external forces that are related to safety. However, it is dif-
ficult to set these arms to move RCM point while preventing
interference among robot arms or between robot arms and surgeons.
This is because the more change of inertia makes the larger work-
space for moving RCM point. On the other hand, APAs that control
virtual RCM point without any kinematic constraints have an
advantage to freely move RCM point, but they are vulnerable to
external forces.
It is necessary for APA to have a strong structure against external
forces but move RCM point with the less change of inertia of APA. In
this paper, we propose a simple but novel APA using parallel sliding
mechanism for MIS. This mechanism makes 2-degree of freedom
(pitch rotation and translation) by the relative motion of sliders so that
the proposed APA has a strong structure but is able to move RCM
point with the less change of inertia.
This work was supported in part by the National Research Foun-
dation of Korea through the Framework of International Cooperation
Program under Grant 2019K2A9A2A06025429 and Grant FY2019, in
part by the Korea Medical Device Development Fund grant funded by
the Korea Government (the Ministry of Science and ICT, the Ministry
of Trade, Industry and Energy, the Ministry of Health & Welfare,
Republic of Korea, the Ministry of Food and Drug Safety) under
Project 202012D18.Methods
The proposed APA has one motor for roll, two motors for parallel
sliding mechanism, and one motor for translation of instrument. The
upper slider and lower slider move independently in parallel along
with the upper and lower ball screws respectively. Both sliders are
connected with the link as shown in Fig. 1.
The kinematics for RCM roll rotation is not dealt with in method
section because the proposed APA has the same kinematics as other
mechanisms.
1. Kinematics and control method of parallel sliding mechanism
The control variables for parallel sliding mechanism in this APA
are X1 and X2 which are the distance the lower and upper slider
move respectively as shown in Fig. 1. We can easily show the
Fig. 1 The simulation results. The upper two images are the result of
single-layer solid model. The middle two images are the result of
double-layer hollow model with air mesh. The lower two images are
the result of double-layer hollow model without air mesh. The red
circles denote the self-collision parts
Int J CARS (2021) 16 (Suppl 1):S1–S119 S47
123

kinematics of parallel sliding mechanism for RCM pitch rotation
as follows:
X1 ¼ H1 tan hpitch
� �; hpitch 6¼ 0� �
ð1ÞX2 ¼ X1 þ L1 sin hpitch
� �þ L2 sin a0ð Þ � sin að Þð Þ ð2Þ
where a = cos-1 ((L1cos(hpitch)-H2)/L2) and hpitch is the angle
change of tool in RCM pitch rotation. a0, H1, H2, L1, L2 are all
constant and these constants are determined considering the envi-
ronment of operation and workspace.
There are two control methods in parallel sliding mechanism, one is
RCM pitch rotation and the other is RCM translation. For RCM pitch
rotation, we control X1 and X2 following the above equation (1) and
(2). Relative motion between 2 sliders (hpitch = 0, X1 = X2) makes
RCM pitch rotation. For RCM translation, we give the same input to
the X1 and X2 (X1 = X2, X1 = 0). Then, there is no change of
hpitch and it makes only translation of RCM point.
2. RCM Changeability
To evaluate quantitively how efficiently APA changes RCM
point, we suggest a new criterion, RCM Changeability.
RCM Changeability = Displacement of RCM point/Displacementof COM of active positioning arm
RCM changeability means that how much APA moves to move
RCM point. The inertia change of APA determines the energy to
move APA, interference among APAs. The change of inertia is
related to the displacement of the center of mass (COM) so that the
equation of RCM changeability consists of the displacement of RCM
point and the displacement of COM of APA.Results
In this section, we compare the double parallelogram mechanism
which most of APAs use and the proposed parallel sliding mechanism
with RCM changeability. We only consider the one-dimensional
movement of RCM point and COM assuming the kinematics of RCM
roll rotation, the total mass of APA and workspace of APA is the
same.
Let the movement of RCM point is Dx. For the double parallel-
ogram mechanism, the movement of COM and RCM point is the
same because the entire APA has to be moved. Consequently, the
RCM changeability is 1. In contrast to the double parallelogram, only
part of the proposed APA moves to change RCM point. The ratio of
the mass of moving part to total mass is 0.236 so that movement of
COM is 0.236 9 Dx. Therefore, RCM changeability of parallel
sliding mechanism is 4.237.Conclusion
This paper proposed APA for MIS that can move RCM point by using
the parallel sliding mechanism. We validated the proposed mecha-
nism based on RCM changeability and the result shows that the
parallel sliding mechanism change less inertia of APA to move RCM
point than the double parallelogram mechanism.
References
[1] Pham CD, Coutinho F, Leite AC, Lizarralde F, From PJ,
Johansson R (2015) Analysis of Moving Remote Center of
Motion for Robotics-Assisted Minimally Invasive Surgery.
IEEE/RSJ International Conference on Intelligent Robots and
Systems (IROS)
[2] Kuo CH, Dai JS, Dasgupta P (2012), Kinematic design
considerations for minimally invasive surgical robots: an
overview. The International Journal of Medical Robotics and
Computer Assisted Surgery; 8:127–145
Needle puncture analysis using audio excitations
during tissue insertions
M. Sabieleish1, K. Heryan2, A. Boese1, M. Friebe1, A. Illanes1
1Otto-von-Guericke Universitat, Medical Faculty, INKA—Innovation
Laboratory for Image Guided Therapy, Magdeburg, Germany 2AGH
University of Science and Technology, Department of Measurement
and Electronics, Krakow, Poland
Keywords needle puncture, audio guidance, audio processing, needle
interventions
Purpose
Accurate percutaneous needle tip localization is essential during
minimally invasive procedures (MIPs). Usually, less experienced
surgeons face more complications during MIP-related interventions
and have more difficulties localizing the needle tip. Biological
punctures created during needle insertion procedures could deliver
valuable information that can be used to localize the needle tip.
Various imaging technologies are used to enhance accuracy and
support the clinician. However, these technologies face limitations,
such as image artifacts affecting the procedure’s accuracy and effi-
cacy. Increasing the accuracy of image-based needle guidance could
be achieved with complementary sensors to provide additional
guidance information. However, most of these specialized sensors are
placed on the needle tip, resulting in direct contact with the biological
tissue leading to increased risks, complexity, costs, and sterilization
issues.
An audio-based technique has recently been introduced [1],
showing promising results for different applications. However, the
relationship between soft tissue events created by the needle tip and
the audio signal excitation is still not well understood. A first study
has been performed [2] to better understand audio excitation using
force as a reference. It showed that force and audio dynamics are
strongly related during needle insertion.
This work aims to study the factors that can influence and affect
the audio signals recorded during a needle puncture and verify if
tissue-related audio dynamics can be identified. One of the main
challenges for audio event characterization is understanding the
transfer function (TF) between the audio wave generated from the
needle tip/tissue interaction at the contact zone and the received audio
signal at the tool’s proximal end. This work proposes a study of the
dynamics related to the TF and punctures to analyze tissue-related
audio dynamics’ identifiability.Methods
An automatic experimental setup for needle insertions was created to
acquire the audio signals. A microphone attached to the proximal end
of a short bevel steel rod (1.6 mm diameter, 140 mm length, 45� tip)
via a 3D printed adapter was used for recording. The rod simulates a
simplified needle to perform insertions in two plastic tissues of dif-
ferent thicknesses. Two layers of each plastic were fixed in a 3D-
printed tissue holder immersed in a gelatin phantom at a depth of
3 cm and 5.5 cm the first and second layers, respectively. The
Fig. 1 Developed active positioning arm using parallel sliding
mechanism for MIS and its kinematic chain
S48 Int J CARS (2021) 16 (Suppl 1):S1–S119
123

insertions were performed automatically using a testing machine
(Zwicki, Zwick GmbH & Co.KG, Ulm) at an insertion velocity of
5 mm/s that recorded the axial needle insertion force. The audio and
force frequencies sampling was 16000 Hz and 100 Hz, respectively.
The signals were synchronized using a simultaneous trigger event
visible in both the force and audio signals.
The setup aimed to test the effect of the TF modification on the
audio signal by adding weights to the needle shaft and subsequently
analyzing the impact of the tissue type on the audio excitation.
Moreover, the setup was used to test the influence of puncture depth
on audio dynamics.
For signal analysis, a dataset of 20 recordings/tissue/needle setup
was generated. Continuous Wavelet Transformation (CWT) was used.
As shown in Fig. 1, two main features were extracted from the CWT
of the audio excitation resulting from a needle puncture: the fre-
quency at which the maximum energy event occurs (Max.time-freq
energy) and the dominant frequency observed in the normalized CWT
spectrum that can be extracted at each time instant (see the last row of
Fig. 1). Our goal was to observe the influence of the TF modification
and a puncture excitation when different tissue types are punctured at
different depths.Results
Table 1 shows the average and the standard deviation values for the
Max.time-freq energy feature for different insertions. It is possible to
observe that the thicker tissue (tissue (2) produces higher maximal
frequency responses than the thinner one. We can also observe that
the TF modification strongly affects the extracted maximal frequency
feature for both tissues. Additionally, another important observation is
that this feature is not affected by the depth of the layer. For both
tissues, the maximal frequency energy feature does not significantly
change during the first and second punctures (layers 1 and 2,
respectively).
Figure 2 shows the dominant frequency analysis results. Each row
of the displayed matrix represents the probability distribution of each
needle insertion’s dominant frequencies. This feature’’s behavior is
similar to the previously analyzed feature. The modification of the TF
results mainly in the apparition of new frequency dynamics around
the frequency scale 45. For both tissues, there are no significant
changes between the first and second punctures.
The final fundamental observation is that when the TF is fixed, the
dominant frequency behavior depends on the tissue punctured and not
on the depth. This is very important since it demonstrates that it is
possible to identify tissue puncture-related dynamics for automatic
insertions. Nevertheless, any modification on the TF could limit tissue
puncture identification.Conclusion
An analysis of different dynamics involved in the audio excitation
during the needle insertion process was performed in this work. The
most important conclusion of this work is that it is possible to identify
tissue-related dynamics under a fixed TF and differentiate between
two punctured tissues. These results show that needle audio guidance
could be possible for automatic needle insertion.
References
[1] Illanes A, Suhn T, Esmaeili N, Maldonado I, Schaufler A, Chen
CH, Boese A, Friebe M (2019) Surgical Audio Guidance
SurAG: Extracting Non-Invasively Meaningful Guidance
Information During Minimally Invasive Procedures. In 2019
IEEE 19th International Conference on Bioinformatics and
Bioengineering (BIBE) (pp. 567–570). IEEE.
[2] Illanes A, Boese A, Friebe M, Hansen C (2020) Feasibility
Check: Can Audio Be a Simple Alternative to Force-Based
Feedback for Needle Guidance?. In International Conference on
Medical Image Computing and Computer-Assisted Intervention
(pp. 24–33). Springer, Cham.
Fig. 1 Example of a puncture event (rectangle) and the computed
CWT illustrating the extracted features
Table 1 Max.time-freq energy mean and standard deviation (SD) for
all setups
Data Mean ± Std [Hz]
1st tissue, 1st puncture, One weight 730.5 ± 6.9
1st tissue, 1st puncture, Three weights 650 ± 10.7
1st tissue, 2nd puncture, One weight 750 ± 6.9
1st tissue, 2nd puncture, Three weights 550 ± 13.6
2nd tissue, 1st puncture, One weight 800 ± 5.2
2nd tissue, 1st puncture, Three weights 1069 ± 0.8
2nd tissue, 2nd puncture, One weight 700 ± 6.2
2nd tissue, 2nd puncture, Three weights 1000 ± 5.9
Fig. 2 Dominant frequency analysis results for both tissues during
needle insertion
Int J CARS (2021) 16 (Suppl 1):S1–S119 S49
123

Passive needle tracking using phase imaging for MR-
guided interventions
A. Mahran1,2, P. Moreira1,2, K. Tuncali1,2, J. Tokuda1,2
1Brigham and Women’s Hospital, Radiology, Boston, United States2Harvard Medical School, Boston, United States
Keywords Device tracking, Interventional MRI, Needle detection,
MRI guided intervention
Purpose
Percutaneous interventions under intraoperative magnetic resonance
imaging (MRI) guidance have been used in various applications such
as aspiration, biopsy, and thermal ablations [1]. Intraoperative MRI is
useful in identifying target sites thanks to its superior soft-tissue
contrast, and locating the needle with respect to the target site in near
real-time based on the susceptibility artifact at the needle on the
image. The ability to visualize both the target site and needle
simultaneously potentially allows closed-loop control of the needle to
achieve accurate placement of the needle into the target site using
imaging guidance software and/or a needle-guiding robot. However,
distinguishing the intensity generated by the susceptibility artifact at
the needle is challenging to perform in real-time MRI. There have
been two categories of approaches to address this technical challenge,
including active and passive tracking [2]. Active tracking localizes
the needle using a small MR receiver coil or additional sensors fitted
to the needle. Although active tracking provides robust and accurate
localization, it requires specialized hardware and additional safety
considerations associated with it. Passive needle tracking, in contrast,
localizes the needle by detecting image features, e.g. the needle
artifact, bright spots produced by MR-visible markers. While passive
tracking does not require specialized hardware, automatic detection of
image features is not always reliable due to their inconsistent
appearances on the image. In this study, we hypothesize that the MRI
phase information can yield more distinct and consistent features
around the needle than the commonly-used magnitude image, because
of its direct correlation with local magnetic homogeneity; hence it
helps to improve the accuracy of passive needle tracking. The phase
image can be obtained as part of the standard scan output and
therefore is available at no extra acquisition time or change in scan-
ning parameters. This study proposes a new approach to passive
device tracking by generating positive-contrast images from MRI
phase images.Methods
We implemented and evaluated the real-time MRI-based needle
tracking algorithm during insertions into biological tissues. The
algorithm uses a multi-step approach described in Fig 1, such as: (1)
A mask is generated from the magnitude image to eliminate the noisy
background in the phase images, (2) the phase image is unwrapped,
(3) a high pass filter is applied to increase the signal-to-noise ratio in
the background field, and (4) A hessian matrix is used for the needle
tip localization.
Mask Generation: It is known that areas with large susceptibility
(i.e. air-tissue interfaces) are prone to artifacts because phase image
measures the weighted summation of the magnetic properties of the
surrounding tissue. A binary threshold was used in the magnitude
image to mask out the areas with high susceptibility borders in the
phase image. This eliminates the noisy phase in the air and bone
surrounding the phantom and reduces computational time.
Phase Unwrapping: The original phase signal is encoded in such a
way that it can only measure phase values in the range of [- p, ?2p]
causing the signal to fold over in the opposite direction. This wrap-
ping operation makes the signal difficult to interpret because of the
random 2p jumps. Phase unwrapping is a process used to recover the
continuous phase values from the wrapped one by detecting phase
jumps and correctly adding appropriate 2p radians. In the proposed
tracking algorithm, the phase unwrapping is achieved using the Phase
Region expanding labeler for Unwrapping Discrete Estimates (PRE-
LUDE) technique.
Estimation and Removal of Background Field: Further filtering is
needed to increase signal-to-noise ratio and reduce artifacts. We
implemented a Gaussian high pass filter which serves two functions:
it helps remove background field inhomogeneities since they have
low spatial frequencies and enhance field inhomogeneity produced by
the needle tip. The implemented Gaussian high pass filter has the
following equation:
Hðu; vÞ ¼ 1 � e�D2ðu;vÞ=2D02
where with a kernel size of 128 9 128 and the cut off distance D0
experimentally tuned to 5.
Detecting Needle Tip position: To detect the needle tip from the
processed image, A blob detector is employed based on the eigen-
value of the hessian matrix. The advantage of the hessian process is
the ability to delineate the high intensity clusters. After the filter is
passed, the needle tip is selected based on the peak local maxima.
Experimental Protocol: In this study, we preformed needle insertion
experiments to validate the tracking accuracy and computational time
of our proposed method. A MRI-compatible 18-Gauge biopsy needle
was repeatedly inserted and retracted linearly with varying speed
along an ex vivo tissue. Magnitude and phase images were acquired
using a T2-weighted gradient echo sequence (5 mm slice thickness,
FOV of 300 9 300 mm, and 256 9 128 matrix). The tracking algo-
rithm was implemented in 3D Slicer. The algorithm was evaluated
using Sagittal (110 frames) and Coronal (110 frames) images acquired
in different needle insertion sequences. The needle tip was tracked in
all 220 image frames and the results were compared to the needle
locations manually tracked offline using the magnitude images. The
root mean square error (RMSE) between the needle tip locations
tracked by the algorithm and the one manually tracked and the mean
computational time required to track the needle in each image frame
were calculated.Results
The root mean square error of the automated needle tip compared to
the manually segmented needle tip was 1.88 mm on average. Despite
the coronal slices containing bone tissue, which causes a strong
susceptibility artifact, the algorithm was able to consistently track the
needle tip. The discrepancy between the algorithm and the manual
tracking is within the expected range due to the limitations of man-
ually segmenting the needle tip, such as artifact size and visibility of
the needle tip in some frames. The average computational time was
0.72 s. It is worth noting that the computation time was mostly due to
the phase-unwrapping step and conversion of data format due to the
reliance on the multiple image processing library; we expect that
those steps could be potentially eliminated or optimized in the future
implementation to achieve a shorter computational time.
Fig. 1 Workflow of needle tip detection
S50 Int J CARS (2021) 16 (Suppl 1):S1–S119
123

Conclusion
We demonstrated the use of phase imaging for MR guided device
tracking. Our method was able to consistently detect the needle tip
without any change in the scan parameters or additional input from
the operator. We are currently integrating this method with a closed-
loop scan plane control module. The proposed system will allow the
information from the device tracking to be used directly to re-adjust
the scan plane position and orientation to follow the needle trajectory
autonomously.
References
[1] Campbell-Washburn AE, Faranesh AZ, Lederman RJ, Hansen
MS (2015) MR sequences and rapid acquisition for MR guided
interventions. Magnetic resonance imaging clinics of North
America, 23(4), 669
[2] Bock M, Wacker FK (2008) MR-guided intravascular interven-
tions: techniques and applications. Journal of Magnetic
Resonance Imaging: An Official Journal of the International
Society for Magnetic Resonance in Medicine, 27(2), 326–338
Design of a human–machine interface between sterile
and non-sterile environment of the OR for the usage
of a robotic circulating nurse
C. Muller1, L. Bernhard1, D. Ostler1, D. Wilhelm1,2
1Research Group MITI, Klinikum rechts der Isar, Technical
University Munich, Munich, Germany 2Technical University Munich,
Faculty of Medicine, Department of Surgery, Klinikum rechts der
Isar, Munich, Germany
Keywords User interface, Circulating nurse, Operating room, Robotic
Purpose
This extended abstract presents the work-in-progress of a research
project whose overall goal is the integration of a Robotic Circulating
Nurse (RCN) into the operating room (OR) environment. Specifically,
a human–machine interface is to be developed for this purpose, which
includes the communication of the sterile OR staff with the envi-
ronment. It should fit as seamlessly as possible into the surgical
workflow, which means it should not complicate communication.
Within the AURORA project of the MITI research group of the
TUM, a concept of a robotic assistant in the non-sterile OR envi-
ronment is being developed, which takes over tasks of a circulating
nurse to reduce the workload of the staff. The so-called circulating
nurse (CN) is non-sterile OR staff who has an assistant function and
whose responsibilities include handing out sterile items and operating
medical devices.
Concepts of robotic OR nurses for handling surgical instruments
were among others examined in [1]. However, robotic surgical nurses,
which have been developed so far all are located in the sterile area
and their tasks are limited to the handling of a predefined and small
number of sterile instruments. Further tasks in the non-sterile area,
such as those of a human CN, cannot be fulfilled.
For the implementation of an RCN, as in the AURORA project, a
human–machine interface is required that can comprehensively cover
the complex communication between the sterile and non-sterile OR
environment and which allows for seamless integration of this new
technology without causing additional workload.Methods
An important first step is to determine the basic requirements for the
interface. Through field observations in the OR and user interviews,
the communication of the sterile staff with their environment is
analyzed. Particular emphasis is placed on the generation of tasks
regarding the human CN. Suitable protocols and questionnaires are
designed for this purpose.
Based on the information collected, the communication will then
be described in detail and thus narrowed down. Through a compre-
hensive structuring, for example a clustering into different task types,
a further, important prerequisite for the feasibility of a human–ma-
chine interface will be created.
In order to develop possible communication techniques, literature
research and analysis of existing products is carried out.
Based on the developed and structured communication, exemplary
use cases and a suitable dialogue design will be modeled.
Results
In order to realize the goal described above, the provision of a
human–machine interface for a non-sterile RCN, the framework
condition is defined, that an RCN can only take over a subset of the
tasks of a human CN. To enable such a partial integration in a
meaningful way, instead of directly communicating with a concrete
RCN, an OR-bound, universal interface is developed, which includes
any communication of the sterile OR staff with the environment,
including the RCN, but also the permanent staff or other devices in
the future.
The advantage of an interface, that is permanently present in the
OR and is independent of the target instance, is that the work orders
of several ORs can be simultaneously collected and prioritized. Fur-
thermore, this concept enables a work order to be subsequently
delegated either to a robot or a human, regardless of how the work
order is acquired.
The core functionality is defined as the generation of work orders,
which are fed by three types of information sources, namely verbal
communication, non-verbal communication and context-sensitivity.
Verbal communication includes keywords, freely formulated
requests and also further inquiries and suggestions from the system.
Non-verbal communication on the system side includes the visual
presentation of images and writing. On the staff side, non-verbal
communication includes haptic and gestures interacting with the
environment. Concerning the interaction with the environment, its
visual perception is required to a certain extent. For example, the
instrumenting nurse might present the packaging of a used sterile item
and verbally request further items, which requires the precise iden-
tification of the packaging.
Specifically with non-verbal communication, one of the most
important requirements is to maintain the integrity of the sterile area.
Sterile haptic communication and visual presentation of images and
writing are made possible, for example, by sterile wireless terminals
such as tablets. Another possibility of sterile, non-verbal communi-
cation is the clever combination of visual presentation and gestures
using modern technologies such as augmented reality and interactive
laser projection.
Context-sensitivity requires, on the one hand, the learning of
possible surgery situations and their temporal or causal sequence and,
on the other hand, the automated recognition of which of these situ-
ations is present at a given time. This is done in consideration of
previously manually defined framework conditions such as the nature
of the surgery and based on comprehensive process models. With help
of the knowledge of the present and likely following situation, a more
meaningful generation of work orders can take place. A work order
can either be generated solely on the basis of the present and predicted
situations or from a combination of these situations with explicitly
requesting communication on the part of the sterile OR staff.
Such context recognition and prediction was conceptualized and
implemented in the research project ‘‘IVAP 2025’’ [2]. From the
recognized context, work orders can also be assigned an urgency,
which is an important step in prioritizing the handling of multiple
work orders.
Int J CARS (2021) 16 (Suppl 1):S1–S119 S51
123

Conclusion
Currently, field observations in the OR are already being conducted.
In the analysis of task generation for the CN, particular attention is
paid to the sources of information described above. Accordingly, a
protocol was designed, which on the one hand records verbally and
non-verbally communicated work orders, and on the other hand, also
records non-communicated work orders resulting from the situation.
Each generated work order is supplemented with further meta-infor-
mation, such as client, urgency level and phase of the surgery. This is
followed by the description and structuring of the collected infor-
mation as explained above.
For the exploration of possible communication techniques,
detailed research of the interaction models of existing linguistic,
visual, haptic and gesture-based assistance systems is carried out.
These are now widely used in the home and automotive sectors, for
example, and can take on numerous tasks.
The presentation will cover first results from literature research
and findings from OR field observation data that has been collected
and analyzed to date.
References
[1] Jacob M, Li Y–T, Akingba G, Wachs J (2012): Gestonurse: a
robotic surgical nurse for handling surgical instruments in the
operating room. Journal of robotic surgery 6 (1): 53–63
[2] Ostler D, Marahrens N, Kohn N, Koller S, Kranzfelder M,
Feussner H, Wilhelm D (2018) IVAP 2025—Towards the
collaborative operating room. 13th Russian-German Conference
on Biomedical Engineering (RGC)
Towards holographic navigation for paediatric nephron
sparing wilms tumour surgery: a technical feasibility
study
Q. Eyck1, M. Fitski1, L. van der Steeg1, M. Wijnen1
1Princess Maxima Centre, pediatric oncology surgery, Utrecht,
Netherlands
Keywords Augmented Reality, HoloLens 2, Nephron sparing sur-
gery, Pediatric surgery
Purpose
A small part of patients suffering from Wilms tumours (WT) can be
treated with open nephron sparing surgery (NSS). During this pro-
cedure intraoperative ultrasound is used to visualise the exact size of
the tumour. Unfortunately, approximately 30% of the NSS procedures
still result in a positive surgical margin. New visualization techniques
may help us reduce this percentage.
The size and infiltration of the tumour can be visualized intraop-
eratively with new techniques such as holographic navigation based
on Augmented Reality (AR). The HoloLens 2 projects an overlay of
the preoperative imaging in AR onto the open surgical field. Using
AR surgical navigation technology, our goal is to reduce positive
surgical margins during NSS. Therefore, we have developed an AR
application which determines the required overlay with a combination
of two algorithms; a registration algorithm based on anatomical
landmarks and a tracking algorithm based on QR-code recognition.
These self-developed algorithms are validated in this feasibility study.
The clinically maximally allowed error for this validation was
determined to be five mm by our surgical team.Methods
The validation of this self-developed AR application is twofold. We
measure the accuracy of the tracking through QR-code recognition
and we estimate the accuracy of the resulting registration based on a
3D-printed kidney phantom.
In order to measure the accuracy of the QR-code recognition, a
calibration setup was built in which the HoloLens was placed onto a
3D-printed bearer and the QR-code could be moved manually in two
different directions. The HoloLens 2 measured the moved distance of
the QR-code, which was compared with the actual movement.
Additionally, we investigated the minimal workable size of the QR-
code without limiting the tracking quality. Three different sizes were
used, 5 9 5 cm, 4.5 9 4.5 cm, and 4 9 4 cm.
The accuracy of the registration algorithm was derived through a
phantom study in which ten volunteers participated. None of our
volunteers had prior experience with the AR application. A short
introduction on how to use the HoloLens 2 was given and eye-cali-
bration was performed. The volunteers were asked to perform the
registration by pinpointing five anatomical landmarks onto the kidney
phantom using a surgical pointer, as is shown in figure 1. After
mapping of the anatomical landmarks, the holographic 3D model is
automatically registered onto the 3D printed phantom. Subsequently,
six randomly placed positional markers are highlighted on top of the
holographic visualization. The volunteers were asked to mark these
holographic positional markers in the real world with a marker. These
marked positions were compared with the actual position using a 3D-
printed calibration mold, which allowed us to quantify the amount of
misalignment between the holographic 3D model and the corre-
sponding 3D printed model.Results
We measured the movement of a moving QR-code with three dif-
ferent dimensions (5 9 5, 4.5 9 4.5 and 4 9 4 cm) in two directions.
The mean error and the standard deviation of the movement in the
X-axis was 0.29 mm (2.2 mm), 4.04 mm (4.6), and 11.54 mm (3.8)
respectively. For the movement in the Z-axis the mean error and
standard deviation was 0.47 mm (3.6), 4.18 mm (5.6), and 13.57 (8.2)
respectively. There was a significant difference in mean error between
the 5 9 5 cm and 4.5 9 4.5 cm QR-codes and the 5 9 5 cm and
4 9 4 cm QR-codes (p\ 0.001).
The accuracy of the registration was measured as a mean distance
between the holographic and actual position. This distance varied
between volunteers but these differences were statistical not
Fig. 1 The holographic overlay of the kidney (salmon), tumour
(cyan), artery (red), and a positional marker (purple) on top of the 3D
printed model are shown. Additionally, the QR-code used for tracking
and the QR-code placed onto the surgical pointer (blue) are visible.
The surgical pointer is used to pinpoint the anatomical landmark for
the HoloLens 2. There is a slight offset of the overlay due to a
difference in height of the camera of the HoloLens 2 and the eyes of
the user
S52 Int J CARS (2021) 16 (Suppl 1):S1–S119
123

significant (0.056 B p C 0.963). Unfortunately, one positional mar-
ker was excluded from the measurements due to a complete
misalignment of the holographic marked position and actual position.
The mean distance error per volunteer is given in table 1. Three of the
50 holographic marked positions were placed with a distance greater
than 5 mm of the actual position by two different volunteers. Only
one volunteer obtained a mean error above the clinical error of five
mm.Conclusion
The accuracy obtained by our surgical navigation AR application is
within the clinically allowed error and therewith we believe this
technique may be feasible for clinical use. The results show that the
QR-code tracking capacity of our application is sufficient and that
volunteers are capable to apply the anatomical landmark based reg-
istration satisfactory. Further implementation of this technique during
nephron sparing surgery is recommended. However, intraoperative
surgical workload and usability needs to be assessed beforehand.
Therefore, we recommend performing a surgical phantom study to
further explore this technique in pediatric oncologic surgery.
Image guided decision making for the suspension
of patient specific scaphoid replacement
P. Honigmann1,2,3, M. Haefeli2,4, J. G. Oonk2, G. J. Strijkers2, J.
G. Dobbe2, S. D. Strackee5, G. J. Streekstra2,6
1Kantonsspital Baselland, Hand Surgery, Liestal, Switzerland2Amsterdam UMC, University of Amsterdam, Department
of Biomedical Engineering and Physics, Amsterdam Movement
Sciences, Amsterdam, Netherlands 3Medical Additive Manufacturing,
Department of Biomedical Engineering, University Basel, Basel,
Switzerland 4Kantonsspital Graubunden, Hand Surgery, Chur,
Switzerland 5Amsterdam UMC, University of Amsterdam,
Department of Plastic, Reconstructive and Hand Surgery, Amsterdam
Movement Sciences, Amsterdam, Netherlands 6Amsterdam UMC,
University of Amsterdam, Department of Radiology, Academic
Medical Center, University of Amsterdam, Amsterdam Movement
Sciences, Amsterdam, Netherlands
Keywords Scaphoid, Patient specific, Prosthesis, Wrist
Purpose
When aiming for motion preserving procedures in carpal pathologies,
patient specific design of carpal bone replacement is one option to
maintain individual anatomy. To restore carpal motion and kine-
matics, a correct fixation of the individualized implant is mandatory.
We present an image-based decision-making process to achieve the
best suspension.Methods
Initial cadaver tests in which we assessed the kinematics of a cus-
tomized Scaphoid replacement using 4D-CT showed good results in
terms of movement and stability of the prosthesis. Based on these
data we performed the implantation of a patient specific scaphoid
prosthesis in a patient who had a failed reconstruction of a Scaphoid
pseudoarthrosis.
Due to a Scaphoidpseudoarthrosis on the contralateral side, the
prosthesis was designed according to a patented [1] shape based on a
polygon model of the non-united Scaphoid and adapted according to
the necessary carpal height needed. The SLS 3D-printed Titanium
patient specific prosthesis was implanted using a fibre tape augmented
palmaris longus tendon graft fixed to the Trapezium and to the
Lunate. Care was taken not to overtighten the suspension to allow for
carpal movement. Carpal alignment and stability was checked intra-
operatively using fluoroscopy.
Conventional X-rays and 4D-CT scans were taken during follow
up visit.
Results
Intraoperatively, the patient specific prosthesis provided good primary
stability of the carpus before carry out the suspension. With the
suspension, the implant seemed to be more stable and the carpal
alignment stable, especially the scapho-lunate interval. The postop-
erative clinical course was uneventful and the patient recovered very
well from the intervention. Conventional X-rays after 6 and 12 weeks
showed a good stability of the prosthesis. To assess carpal kinematics,
we performed a 4D-CT scan 12 weeks postoperatively.
The fixation technique of the prosthesis provided sufficient sta-
bility during flexion/extension and radial-/ulnar abduction. The carpal
alignment was stable but a dorsal intercalated segment instability of
the Lunate remained.Conclusion
A patient specific design of the Scaphoid replacement is mandatory
for good primary stability documented intraoperatively using fluo-
roscopy. Postoperatively, conventional X-rays were sufficient to
check for the position of the prosthesis. For the assessment of carpal
alignment and—kinematics and especially decision making to change
the suspension, 4D CT imaging was the helpful tool.
When aiming for the best reconstruction of carpal kinematics
using a customized prosthesis of the Scaphoid, the correct alignment
of the Lunate needs to be considered. We therefore modified the
suspension technique using the anatomical front and back ligament
reconstruction (ANAFAB) developed by Michael J. Sandow [2] to
reconstruct the dorsal intrinsic and palmar extrinsic ligaments
according to the findings of the 4D CT scans. Further investigations
will show if this is going to improve stability of the lunate as well.
References
[1] Honigmann P, Schumacher R, Marek R, Buttner F, Thieringer F,
Haefeli M (2018) A three-dimensional printed patient-specific
scaphoid replacement: a cadaveric study. Journal of Hand Sur-
gery (European Volume), vol. 79, pp. 175319341875763–6,
2018.
[2] Sandow M, Fisher T (2019) Anatomical anterior and posterior
reconstruction for scapholunate dissociation: preliminary out-
come in ten patients. J Hand Surg Eur Vol. 2020
May;45(4):389–395. https://doi.org/10.1177/17531934198
86536. Epub 2019 Nov 13. PMID: 31718405.
Table 1 The mean distance and standard deviation of all 5 marked
positions per volunteer
Volunteer Mean error (mm) (SD)
1 2.80 (0.99)
2 2.75 (0.92)
3 2.87 (1.11)
4 3.01 (0.95)
5 2.27 (1.60)
6 5.19 (4.30)
7 3.93 (2.19)
8 2.86 (1.00)
9 2.98 (1.26)
10 2.95 (0.80)
Mean of all observers 3.16 (1.82)
Int J CARS (2021) 16 (Suppl 1):S1–S119 S53
123

Augmented reality for improved PSI placement
in pelvic tumour resections
M. Garcıa-Sevilla1,2, R. Moreta-Martinez1,2, D. Garcıa-Mato1,2, A.
Pose-Dıez-de-la-Lastra1,2, R. Perez-Mananes2,3, J. Calvo-Haro2,3, J.
Pascau1,2
1Universidad Carlos III de Madrid, Departamento de Bioingenierıa e
Ingenierıa Aeroespacial, Leganes, Spain 2Instituto de Investigacion
Sanitaria Gregorio Maranon, Madrid, Spain 3Hospital General
Universitario Gregorio Maranon, Servicio de Cirugıa Ortopedica y
Traumatologıa, Madrid, Spain
Keywords Augmented reality, Pelvic tumour, Patient-specific
instruments, 3D-printing
Purpose
Pelvic tumour resections are challenging due to the bone complexity
and the proximity to vital structures. In these surgeries, achieving
optimal resection margins is crucial to avoid adverse clinical out-
comes and local recurrence. However, the probability of obtaining
adequate margins following the conventional approach and under
ideal conditions is only 52% [1].
In recent years, intraoperative navigation has proved to success-
fully assist in these interventions. The preoperative surgical plan can
be easily translated to the operating room, and tumour and anatomical
structures can be located accurately thanks to the real-time visual
feedback. However, surgical navigation hardware can be expensive
and requires experience, a large space in the operating room, and an
operator.
Patient-specific instruments (PSIs) have reported similar accuracy
to surgical navigation [2]. They are easier to use, more convenient,
and faster. They also allow surgeons to focus on the surgical field
rather than looking at a screen. However, PSI placement can only be
checked subjectively, and therefore correct guidance cannot be veri-
fied. As PSIs are customized tools designed to fit in a particular region
of the patient’s bone, they are highly dependent on the morphology of
the bone surface. For instance, the correct placement of a PSI in the
iliac crest can become very challenging, as it covers a large area that
presents a homogeneous shape. In contrast, the supra-acetabular area
is more characteristic, thus less prone to errors.
In this work, we propose augmented reality (AR) guidance to
assist in the correct placement of PSIs for pelvic tumour resections.
Specifically, we focus on type I resections, where two PSIs are placed,
one in the supra-acetabular region and one in the iliac crest. Using a
reference marker placed on the supra-acetabular PSI, we can display
the bone and iliac crest PSI models in their correct position. These
models are then used as guidance for placement.Methods
We conducted an experiment with a bone phantom and a total of 12
PSIs (6 for the supra-acetabular region and 6 for the iliac crest). The
pelvic bone used for the phantom was segmented from the CT of a
patient using 3D Slicer platform. The design of the PSIs and the
phantom was carried out in Meshmixer software (Autodesk, Inc.,
USA). The PSIs were designed in different locations and with varying
shapes inside their target area. Finally, we printed all the models in
PLA using the Ultimaker 3 Extended (Ultimaker B.V., Netherlands)
desktop 3D printer.
We created two versions of the phantom, a normal and a realistic
one. The first one was simply the printed bone, whereas the realistic
one included a silicone layer unequally distributed across the surface.
This layer simulated the tissue present in real scenarios, where the
bone surface is not entirely exposed.
A smartphone AR application was developed for guiding PSI
placement (Figure 1) using Unity platform and Vuforia development
kit. The application uses the internal camera to detect a cubic marker
(3D-printed) presenting a known black-and-white pattern. This
marker is placed on the supra-acetabular PSI through a socket. The
application detects the marker and, based on the location of the supra-
acetabular PSI in the virtual plan, displays the relative position of the
bone (used to verify the placement of the supra-acetabular PSI) and
the PSIs overlaid on the simulated surgical field.
In order to record the placement of the PSIs in the bone and
compare it with the virtual plan, we used the Polaris Spectra (NDI,
Waterloo, Canada) optical tracking system. A dynamic reference
frame was attached to the phantom and registration was performed
using pinholes included in the phantom design. Each PSI also con-
tained 4 pinholes to record their position using the optical tracker.
A total of 3 users placed the 6 pairs of PSIs, both manually and
using AR. The process was repeated twice, one for each version of the
phantom. We recorded the position of the 4 pinholes in each PSI after
their placement and measured the time required for each method. The
mean distance between the recorded points in every PSI and their
position in the virtual plan was computed for posterior analysis.Results
Table 1 shows the mean, standard deviation, and maximum distances
of the PSIs to their virtual plan for each method and each phantom
type. The results obtained when using AR for guidance present lower
mean values (below 2 mm) than freehand placement in both phan-
toms. The variability is also reduced, especially for the iliac crest
PSIs, where maximum errors of almost 1 cm are reduced to 2.37 mm.
The realistic phantom presents higher errors in all cases. The use of
AR for placement increased the total time in approximately 1 min.Conclusion
The results obtained prove the benefits of using AR for PSI place-
ment. The time added to the procedure is negligible while providing
precision and avoiding high errors. The results also highlight the
importance of using realistic phantoms to better resemble real sce-
narios. It is easy to find the correct placement with a smooth bone
surface (from which PSIs are designed) but this is usually not the case
in real interventions.
To conclude, AR is an effective tool to improve PSI placement.
Further studies should be conducted to ensure its feasibility and
accuracy inside the OR.
Fig. 1 PSI placement in the phantom using the AR app for guidance
S54 Int J CARS (2021) 16 (Suppl 1):S1–S119
123

Acknowledgements
Supported by projects PI18/01625, and IND2018/TIC-9753.
References
[1] Cartiaux O, Docquier PL, Paul L, Francq BG, Cornu OH, Del-
loye C, Raucent B, Dehez B, Banse X (2008) Surgical
inaccuracy of tumor resection and reconstruction within the
pelvis: an experimental study. Acta Orthop 79:695–702.
https://doi.org/10.1080/17453670810016731
[2] Wong KC, Sze KY, Wong IOL, Wong CM, Kumta SM (2016)
Patient-specific instrument can achieve same accuracy with less
resection time than navigation assistance in periacetabular
pelvic tumor surgery: a cadaveric study. Int J Comput Assist
Radiol Surg 11:307–316. https://doi.org/10.1007/
s11548-015-1250-x
Identification of implant type from total knee
arthroplasty images based on machine learning
M. Kishino1, T. Yamazaki1, F. Itami1, T. Tomita2, K. Sugamoto2
1Saitama Institute of Technology, Information Systems, Fukaya,
Saitama, Japan 2Osaka University Graduate School of Medicine,
Orthopaedic Biomaterial Science, Suita, Osaka, Japan
Keywords discrimination performance, total knee arthroplasty ima-
ges, machine learning, convolutional neural network
Purpose
Accurate assessment of 3D kinematics after total knee arthroplasty
(TKA) is very important for understanding the complexity of knee
joint mechanics after surgery and for evaluating the outcome of
surgical techniques. To achieve 3D kinematic analysis of TKA, 2D/
3D registration techniques, which use X-ray fluoroscopic images and
computer aided design (CAD) model of the knee implants, have been
applied to clinical cases. In most conventional techniques, although
the accuracy of 3D TKA kinematic analysis for clinical application
has been achieved, the analysis or measurement process requires
some manual operations and is still labor-intensive and time-con-
suming work.
For such a serious problem of manual operations for clinical
application, we have developed some elemental techniques [1] for full
automation of 3D TKA kinematic measurement based on 2D/3D
registration using a single-plane fluoroscopic image and CAD model
of the knee implant. As one of them, to automatically identify the type
of knee implant from X-ray fluoroscopic image is important. Such an
automatic identification of implant type is thought to be also useful
for supporting TKA diagnosis using simple X-ray radiograph.
In this study, therefore, we conduct a basic investigation of dis-
crimination performance of implant type based on machine learning,
using many kinds of TKA silhouette images. Specifically, we examine
the identification effect by Mahalanobis distance in conventional
machine learning, and also the discrimination performance by con-
volutional neural network (CNN) and its visualization by gradient-
weighted class activation mapping (Grad-CAM) [2].Methods
To identify the implant type from TKA silhouette images, in this
study, discrimination method by Mahalanobis distance in conven-
tional machine learning (pattern recognition) and discrimination one
by CNN (deep learning) were used respectively.
In order to validate the discrimination performance of implant type
using each method, two experiments using synthetic images (com-
puter simulation test) and real X-ray images were performed.
In the first experiment using synthetic images, four type of knee
implant CAD model (F, N, P and V type) were used, and a set of 441
synthetic silhouette images were created for each implant type in
known typical orientations using perspective projection model.
Therefore, a total of 1764 (4 9 441) synthetic silhouette images were
created for femoral and tibial component, respectively. For identifi-
cation of implant type from synthetic images using conventional
machine learning (pattern recognition), two features which are
effective for identification (in this study, contour complexity, and area
ratio of implant silhouette relative to bounding box image) were
utilized. In order to verify the identification effect by Mahalanobis
distance which considers the distribution of the data, the identification
using Euclidean distance was also performed. For identification of
implant type from synthetic images using CNN, a simple network
which has one convolution (and pooling) layer and two features map
(3 9 3 filter size), AlexNet and VGG16 were used respectively. To
ensure the validity for each method, fivefold cross validation was
applied using 1764 synthetic silhouette images.
In the second experiment using real X-ray images, three type of
knee implant silhouette images (number of images for A, B and C
type are 325, 325, and 301 images) were collected, and a total of 951
real X-ray images were used. As a discrimination method to identify
the implant type from actual X-ray images, CNN, that is, a simple
network which has one convolution (and pooling) layer and two
features map (3 9 3 filter size), AlexNet and VGG16 were used
respectively. To ensure the validity for each CNN method, tenfold
cross validation was applied using 951 real X-ray images.Results
The results of the experiment for synthetic images using conventional
machine learning are summarized in Table 1. The number of
misidentified images using the Mahalanobis distance compared to the
Euclidean distance was reduced for each implant type, and the
identification rate (discrimination performance) was improved from
71.2% to 83.7% for femoral component and from 33.0% to 71.9% for
tibial component. As results of the experiment for synthetic images
using CNN, there were no misidentified images in all networks (a
simple network, AlexNet and VGG16), and the identification rate
(discrimination performance) was 100% for femoral and tibial com-
ponent. Fig. 1 shows representative four type of knee implant
silhouette images (F, N, P and V type) and example for the results of
Grad-CAM visualization identified using VGG16.
As results of the experiment for real X-ray images using CNN,
identification rates using a simple network, AlexNet and VGG16 were
94.5%, 99.7% and 99.6% for femoral component, and 95.8%, 100%
and 99.9% for tibial component, respectively. In addition, the results
Table 1 Distances of the recorded points in every PSI (iliac crest and
supra-acetabular) to their planned position for each placement method
(freehand or AR) and each phantom (normal or realistic)
Normal Phantom Realistic Phantom
Freehand AR Freehand AR
Iliac crest
Mean 2.4 1.17 3.26 1.52
Std 1.67 0.42 1.88 0.39
Max 6.18 2.18 9.48 2.37
Supra-acetabular
Mean 1.07 0.92 2.14 1.66
Std 0.36 0.25 0.88 0.53
Max 1.8 1.44 4.56 2.61
Int J CARS (2021) 16 (Suppl 1):S1–S119 S55
123

of Grad-CAM visualization identified using each network showed a
reasonable and explainable heatmap pattern.Conclusion
In this study, to automatically identify the implant type from TKA
silhouette images, a basic investigation of discrimination performance
of implant type based on machine learning was conducted.
In the result of the experiment for synthetic images, the identifi-
cation effect by Mahalanobis distance in conventional machine
learning was confirmed as shown in Table 1. The reason for this
identification effect is thought that the distribution of two features
used in this study is close to a Gaussian distribution. While, as results
of the experiment for synthetic images using CNN, there were no
misidentified images in all networks, and the identification rate
(discrimination performance) was 100%.
In the result of the experiment for real X-ray images using CNN,
for all networks used in this study, the identification rate was very
high. In particular, identification rates using AlexNet and VGG16
were close to 100%, and this suggests that automatic identification of
the implant type from actual X-ray images is possible.
References
[1] Yamazaki T, Tomita T, Sato Y, Yoshikawa H, Sugamoto K
(2019) Robust 3D kinematic measurement of femoral compo-
nent using machine learning. Proc. IJCARS 14(1):S156–157
[2] Selvaraju R.R, Cogswell M, Das A, Vedantam R, Parikh D,
Batra D (2020) Grad-CAM: visual explanations from deep
networks via gradient-based Localization. IJCV 128:336–359
Blood vessel regions segmentation from laparoscopic
videos using fully convolutional networks with multi
field of view input
S. Morimitsu1, S. Yamamoto1, T. Ozawa1, T. Kitasaka2,
Y. Hayashi1, M. Oda3, M. Ito4, N. Takeshita4, K. Misawa5,
K. Mori1,6,7
1Nagoya University, Graduate School of Informatics, Nagoya, Japan2Aichi Institute of Technology, School of Information Science,
Toyota, Japan 3Nagoya University, Information and Communications,
Nagoya, Japan 4National Cancer Center Hospital East, Chiba, Japan5Aichi Cancer Center Hospital, Nagoya, Japan 6Nagoya University,
Information Technology Center, Nagoya, Japan 7Research Center
for Medical Bigdata, National Institute of Informatics, Tokyo, Japan
Keywords Blood vessel segmentation, Multi field of view, U-Net,
Laparoscopic video
Purpose
Laparoscopic surgery is widely performed as minimally invasive
surgery. This surgery is generally difficult compared with the con-
ventional open surgery. Therefore, surgical assistance systems for
laparoscopic surgery have been studied. In these systems, scene
recognition from laparoscopic videos is important to generate surgical
assistance information. There are many research on laparoscopic
scene analysis such as surgical instruments and anatomical structures
segmentation. Our research group conducted segmentation of the
inferior mesenteric artery (IMA) regions, which are important
anatomical structures in laparoscopic colorectal surgery, from
laparoscopic videos using U-Net [1] and convLSTM U-Net [2]. In
this method, we introduced long short-term memory (LSTM) to
U-Net for improving segmentation accuracy along time axis. The
results showed that the convLSTM U-Net enabled stable segmenta-
tion along the time axis. However, this method was sensitive to
changes of blood vessel size in the images. The segmentation accu-
racy was affected by change of distance between the laparoscopic
camera and the blood vessels due to the camera movement in the
same surgical scene. In this paper, to reduce this problem, we intro-
duce a multi field of view (FOV) framework to fully convolutional
networks (FCNs) for segmentation.Methods
In the proposed method, we input multiple images having different
FOV sizes to the FCN. Multi FOV images are generated by clopping
and resizing the original laparoscopic images. This operation simu-
lates distance changes between the laparoscopic camera and the blood
vessels. Images contains variations of blood vessel sizes are gener-
ated. We input three different FOV images to FCN. Size of these three
Table 1 Number of misidentified images for each implant type and
identification rate for synthetic images using conventional machine
learning
Types of
components
Distance type Number of misidenti-
fied images
Identification
rate (%)
F-
type
N-
type
P-
type
V-
type
Femoral
component
Euclidean
distance
74 148 202 84 71.2
Mahalanobis
distance
30 126 123 9 83.7
Tibial
component
Euclidean
distance
184 225 376 396 33.0
Mahalanobis
distance
123 122 105 147 71.9
Fig. 1 Representative four type of knee implant silhouette images (F,
N, P and V type) and example for the results of Grad-CAM
visualization identified using VGG16
S56 Int J CARS (2021) 16 (Suppl 1):S1–S119
123

images are 512 9 512 pixels, 256 9 256 pixels, and 128 9 128
pixels. We utilize U-Net with dilated convolution as the FCN. U-Net
has encoder and decoder parts. We add a dilated convolution layer
before the decoder part. Furthermore, we extend this FCN to handle
multi FOV inputs. Our multi-input U-Net has three encoder parts to
process three FOV input images, respectively. Feature maps obtained
from these encoders are concatenated and fed to the dilated convo-
lution layer. Skip connections are made between the encoder part
corresponding to the largest image input and decoder part.
We train the proposed network using laparoscopic images and
manually segmented IMA regions for training. We use Dice loss as
loss function and Adam as optimizer in the training. Data augmen-
tation using rotation, scaling, and Gaussian blur is used to increase the
training data. In the inference using the trained network, we input
laparoscopic images for inference and obtain segmentation results.Results
We extracted the IMA from laparoscopic videos using the proposed
method. Dataset was created by selecting frames in which IMA is
appeared from 37 laparoscopic videos of laparoscopic sigmoid
colectomy and laparoscopic high anterior resection for rectal cancer.
Total number of frames in the dataset was 2566 frames. For evalua-
tion, we performed fivefold cross validation. Mean Dice coefficients
of extraction results by U-Net [1], convLSTM U-Net [2], and the
proposed multi input U-Net were 0.386, 0.476 and 0.426, respec-
tively. An example of extraction results is shown in Fig. 1.
The blue regions in this figure indicate the extracted IMA regions.
These results showed that the proposed method could extract the IMA
regions from laparoscopic videos. The proposed method correctly
segmented IMA regions even if the distance between the laparoscopic
camera and IMA region changes, as shown in Fig. 1. We consider that
the proposed method was robust to size changes of the blood vessels
in the scene by using multi FOV input. However, mean Dice coeffi-
cient was reduced compared with the previous method [2]. Since each
encoder provides different feature maps, imposing different weights
to encoders will improve segmentation accuracy.Conclusion
In this paper, we reported the blood vessel segmentation method using
multi field of view input from laparoscopic videos. The experimental
results showed that the proposed method could extract IMA regions
from laparoscopic video. Especially, the proposed method correctly
segmented IMA regions even if the distance between the laparoscopic
camera and IMA region changes. Future work includes improvement
of segmentation accuracy using weighing of the feature maps
obtained from each encoder.Acknowledgements
Parts of this research were supported by the AMED Grant Numbers
18he1802002h402, 19he2102001h0701, 20he2102001h0702,
JP19lk1010036, JP20lk1010036 and the MEXT/JSPS KAKENHI
Grant Numbers 17H00867, 17K20099, 26108006
References
[1] Morimitsu S, Itoh H, Ozawa T, Oda H, Kitasaka T, Sugino T,
Hayashi Y, Takeshita N, Ito M, Oda M, Mori K (2019) Auto-
matic segmentation of attention-aware artery region in
laparoscopic colorectal surgery. Int J CARS 14(Sup.1):s41–42
[2] Morimitsu S, Yamamoto S, Ozawa T, Kitasaka T, Hayashi Y,
Oda M, Ito M, Takeshita N, Misawa K, Mori K (2020) Blood
vessel segmentation from laparoscopic video using ConvLSTM
U-Net. Int J CARS 15(Sup.1): S63-S64
Soft tissue needle punctures—a study using acoustic
emission and force
A. Illanes1, M. Sabieleish1, K. Heryan2, A. Boese1, M. Friebe1
1Otto-von-Guericke Universitat, Medical Faculty, INKA—Innovation
Laboratory for Image Guided Therapy, Magdeburg, Germany 2AGH
University of Science and Technology, Department of Measurement
and Electronics, Krakow, Poland
Keywords needle puncture, audio guidance, force feedback, needle
interventions
Purpose
Percutaneous needle insertion is one of the most common minimally
invasive procedures. Needle punctures are required in several appli-
cations such as laparoscopic access, biopsies, or regional anesthesia.
The clinician’s experience and accompanying medical imaging are
essential to complete these procedures safely. Imaging, however, may
come with inaccuracies due to artifacts, mainly generated by the
needle device.
Sensor-based solutions have been proposed to improve accuracy
by acquiring additional guidance information from the needle itself or
the needle path. This typically requires sensors to be embedded in the
needle tip, leading to direct sensor-tissue contact, associated steril-
ization issues, and added complexity and cost.
A novel concept for acquiring additional complementary infor-
mation for guiding minimally invasive instruments was previously
suggested and presented by our group [1], using an audio sensor
connected to the proximal end of a tool to capture interactions
between the tip the tissue. The obtained signal can then be processed
to extract useful guidance information that can then be mapped to
provide feedback to surgeons during minimally invasive procedures.
We were able to show promising results for monitoring medical
interventional devices such as needles and guide wires. It was also
demonstrated that audio could contain valuable information for
monitoring tip/tissue interaction by studying the relationship between
force and audio during needle punctures [2]. This study has been
extended in this presented work to show that the obtained relationship
between force and audio does not depend on the needle insertion
velocity. Significant signal-to-signal correlations are obtained
between audio and force during a puncture event occurring at four
different velocities.Methods
For the signal analysis, the previous dataset [1] was used, where audio
signals were recorded using a stethoscope connected to a microphone
attached to the proximal end of a needle via a 3D printed adapter. This
dataset consists of 80 audio recordings acquired during automatic
insertion of an 18G 200 mm length biopsy needle (ITP, Germany)
into an ex vivo porcine tissue phantom. The insertion was performed
automatically using a testing machine (Zwicki, Zwick GmbH &
Co.KG, Ulm) at an insertion velocity of 3 mm/s that recorded the
axial needle insertion force. The audio and force frequencies sampling
was 44100 Hz and 100 Hz, respectively. The acquisition of force and
audio was synchronized using a trigger event visible in both signals.Fig. 1 An example of extraction results by U-Net, convLSTM
U-Net, and proposed multi input U-Net
Int J CARS (2021) 16 (Suppl 1):S1–S119 S57
123

Using the same setup, experiments at three other velocities, 6, 10, and
14 mm/s, were also performed. Thirty new audio and force recordings
were generated per velocity.
For relating force and audio signal dynamics, indicators from both
signals are first extracted. The audio signal is processed using a
bandpass filter followed by homomorphic envelope extraction. An
indicator for enhancing the force signal’s curvature information was
extracted using a 2nd-degree polynomial fitting inside a sliding
window [2] and then by computing the homomorphic envelope.
Finally, a signal-to-signal correlation by computing the Pearson
coefficient is performed between the audio and force indicators.
Results
Table 1 shows the average and standard deviation of the Pearson
coefficients obtained from the four tested velocities’ audio and force
indicators. It is possible to observe that the average Pearson coeffi-
cient for all the velocities is predominantly over 0.5, arriving to 0.71
and 0.72 for the extreme lower and higher velocities.
Fig. 1 displays a further analysis concerning the obtained corre-
lations, where the accumulative histograms of the Pearson coefficients
of insertions at each velocity are displayed. This analysis confirms the
results shown in Table 1. For all the insertion velocities, more than
80% of the recordings show Pearson coefficients between the audio
and force indicators over 0.5. Mainly for 3 mm/s and 14 mm/s
insertion velocities, more than 85% of the correlations are even over
0.6. These correlations are high, considering the completely different
nature between audio and force sensors.
Fig. 2 shows examples of high correlations between the audio and
force indicators for the 6 mm/s and 14 mm/s velocities. For both
recordings, it is possible to visualize the entry and exit of the porcine
tissue clearly. It is also possible to see how the audio indicator’s main
dynamics can follow the dynamics obtained from the force indicator.
Puncture of important tissues (mainly fascia) resulting in a high peak
in the force generates significant audio excitations that are enhanced
and delineated thanks to the homomorphic envelope indicator. All
these results suggest that the higher is the curvature in the force
signal, the higher is the resulting audio excitation in terms of
cumulative events enveloped by the audio indicator.Conclusion
In this work, we explored the audio dynamics generated from the tip/
tissue interaction during needle insertion into soft tissue using audio
and force sensors. Different needle insertion velocities were tested to
analyze the signal dynamical responses in both sensors.
The results confirm what has been presented in previous works.
Audio contains valuable information for monitoring needle tip/tissue
interaction dynamics. Significant dynamics that can be obtained from
a well-known sensor as force can also be extracted from audio. The
results also show that the audio guidance approach is robust to
insertion velocities in terms of puncture acoustic excitations.
References
[1] Illanes A, Boese A, Maldonado I, Pashazadeh A, Schaufler A,
Navab N, Friebe M (2018) Novel clinical device tracking and
tissue event characterization using proximally placed audio
signal acquisition and processing. Scientific reports, 8(1),
pp. 1–11
[2] Illanes A, Boese A, Friebe M, Hansen C (2020) Feasibility
Check: Can Audio Be a Simple Alternative to Force-Based
Feedback for Needle Guidance? In International Conference on
Medical Image Computing and Computer-Assisted Intervention
(pp. 24–33). Springer, Cham.
Comparison of different spectral cameras for image-
guided surgery
E. Wisotzky1,2, B. Kossack1, R. Muhle3, W. Markgraf3, A.
Hilsmann1, P. Eisert1,2
1Fraunhofer Heinrich-Hertz-Institute, Vision and Imaging
Technologies, Berlin, Germany 2Humboldt-Universitat zu Berlin,
Table 1 Average and standard deviation of the Pearson coefficients
for each tested velocity
3 mm/s 6 mm/s 10 mm/s 14 mm/s
0.72 ± 0.10 0.63 ± 0.09 0.61 ± 0.15 0.71 ± 0.14
Fig. 1 Cumulative histograms of the Pearson coefficients obtained
between the audio and force indicators for the four tested insertion
velocities
Fig. 2 Examples of force and audio indicators where high correla-
tions were obtained
S58 Int J CARS (2021) 16 (Suppl 1):S1–S119
123

Institut fur Informatik, Berlin, Germany 3TU Dresden, Dresden,
Germany
Keywords Image-guided surgery, Hyperspectral imaging, Mul-
tispectral image processing, Kidney analysis
Purpose
One of the major problems for the transplantation medicine is the lack
of donor grafts as the need for organs far exceeds the number of
available donor organs. This high demand for donor organs shows in
particular the need to increase the number of successfully transplanted
organs ensuring an optimal use of the few donor organs is urgently
required. A contactless optical evaluation tool to monitor organ
quality before transplantation would therefore be of great interest.
Multispectral and hyperspectral imaging (MHSI) in medical appli-
cations can provide information about the physiology, morphology
and composition of tissues and organs. The use of these technologies
enables the evaluation of biological objects and can be potentially
applied as an objective assessment tool for medical professionals. For
example, in organ preservation prior to transplantation, HMSI could
be used to continuously monitor functional parameters of the organ
non-invasively. Based on the evaluation of organ quality, surgeons
could substantiate their decision-making process in general as well as,
in particular, it could help to ensure the appropriate use of donor
organs and increase the number of successful transplantations.Methods
In this study, four MHSI systems (one hyperspectral pushbroom
camera and three multispectral snapshot cameras) were examined for
their applicability of detecting specific tissue properties to ease the
decision-making process during surgery especially during organ
transplantations. The four cameras were used in three different setups:
First, the pushbroom camera setup captured the complete spectral data
set of the first spatial dimension by recording a slit in one shot. The
second spatial component was created by moving the slit. Second,
two snapshot cameras (4 9 4-VIS and 5 9 5-NIR) were combined to
a multispectral 41-bands setup. Both cameras followed the same
capturing principle but covered different spectral intervals (4 9 4-
VIS: 463 nm to 638 nm and 5 9 5-NIR: 693 nm to 966 nm). The
third snapshot camera (3 9 3-VIS) covered the same spectral interval
as the 4 9 4-VIS camera but having fewer bands. This allowed an
analysis of the minimum required number of spectral bands (16 bands
of 4 9 4-VIS vs. 8 bands of 3 9 3-VIS) needed for robust organ
surveillance. All setups with illumination setting are described in
detail in [1] (Table 1).
A spectrometer was used as a reference system, beforehand cali-
brated with a standardized color chart. The spectral accuracy of the
cameras reproducing chemical properties of different biological
objects (porcine blood, four different physiological and pathological
porcine tissues—kidney, lung, heart and brain) was analyzed using
the Pearson correlation coefficient. To underline the applicability of
MHSI driven analysis of tissue characteristics during kidney
transplantation, the 41-bands snapshot setup has been used to acquire
spectral data of in vivo human kidney and ureter.
To obtain the reflectance spectrum from the measured raw data,
each image was corrected according to
Ireflectance ¼ Iraw � Idarkð Þ= Iwhite � Idarkð Þ
where Ireflectance is the resulting reflectance spectrum, Iraw is the
measured raw data, Idark contains the dark reference data and Iwhite is
the white reference intensity spectrum. The entire calibration process
is described in detail in [2].Results
All four examined MHSI cameras are able to provide the character-
istic spectral properties of the porcine blood and tissue samples. The
pushbroom camera setup and the multispectral 41-bands setup
achieves Pearson coefficients of at least 0.97 compared to the ground
truth spectrometer data, indicating a very high positive correlation.
Only the 3 9 3-VIS snapshot camera setup performs moderate to
high positive correlation (0.59 to 0.85). The correlation coefficients of
the three setups to the spectrometer ground truth data of the four
porcine tissue samples are presented in Tab. 1.
All three setups allow exact reproduction of the physiological
conditions of the analyzed anatomical porcine structures, see Fig. 1.
The precision of these representations is dependent of each setup,
meaning the choice of the optimal setup would be dependent on the
specific clinical aim. Different tissue characteristics like oxygen sat-
uration (k = 400–575 nm), water (k = 970 nm) or hemoglobin
(k = 760 nm) concentration can be derived using all setups, whereas
a higher number of spectral bands is preferable for a snapshot setup
(4 9 4-VIS vs. 3 9 3-VIS camera). Thus, both basic acquisition
principles (pushbroom and snapshot) can be feasible for clinical tissue
analysis and differentiation or organ surveillance. Physiological
conditions can be analyzed, helping the surgeon to evaluate organ
quality as well as to detect dangerous incidents, like bad organ per-
fusion, during re-perfusion of the organ.
First measurements with the 41-bands snapshot setup during kid-
ney transplantation underline the achieved porcine analyses. The
analyzed kidney and ureter samples differ clearly between each other
as well as from the porcine kidney, see Fig. 1.Conclusion
We have analyzed the possible use of three different spectral acqui-
sition setups for intraoperative organ surveillance. All camera setups
are able to reconstruct the spectral behavior of the analyzed organs in
their available wavelength range. For accurate and robust analysis of
clinically relevant biological materials, fine scanning of the analyzed
spectral range is essential. The knowledge of the suitability of MHSI
camera for accurate measurement of chemical properties of biological
objects offers a good opportunity for the selection of the optimal
evaluation tool for specific medical applications like organ
transplantation.
Table 1 Pearson coefficient between the averaged spectral curves of
the different acquisition methods and the acquired spectrometer
ground truth data
Camera Setup Kidney Lung Heart Brain k-area (nm)
1. Pushbroom 0.9938 0.9978 0.9957 0.9982 500–995
2. 41-bands 0.9707 0.9822 0.9817 0.982 460–970
3. 3 9 3-VIS 0.8369 0.8397 0.5894 0.8533 400–700
The curves of the pushbroom, the 41-bands and the 3 9 3-VIS
camera setup are linearly fitted between the single bands in the given
wavelengths area
Fig. 1 Different kidney measurements of healthy porcine kidney
tissue using all four setups (spectrometer ground truth, pushbroom,
41-bands and 3 9 3-VIS) as well as in vivo human kidney and ureter
tissue during transplantation using the 41-bands setup
Int J CARS (2021) 16 (Suppl 1):S1–S119 S59
123

References
[1] Muhle R, Markgraf W, Hilsmann A, Eisert P, Wisotzky EL
(2021) Comparison of Different Spectral Cameras for Image-
Guided Surgery, submitted to Biomedical Optics Express
[2] Wisotzky EL, Kossack B, Uecker FC, Arens P, Hilsmann A,
Eisert P (2020) Validation of two techniques for intraoperative
hyperspectral human tissue determination, J. Med. Imaging
7(6):065001 https://doi.org/10.1117/1.jmi.7.6.065001
S60 Int J CARS (2021) 16 (Suppl 1):S1–S119
123

23rd International Workshop on Computer-Aided Diagnosis and Artificial Intelligence
Chair: Hiroyuki Yoshida, PhD (US)
Int J CARS (2021) 16 (Suppl 1):S1–S119 S61
123

Feasibility study of MRI and multimodality CT/MRI
radiomics for lung nodule classification
A. Jatoba1, P. Azevedo-Marques2, M. Koenigkam-Santos2,
D. Wada 2, M. Oliveira1
1Universidade Federal de Alagoas—UFAL, Programa de Pos-
Graduacao em Informatica, Maceio, AL, Brazil 2Ribeirao Preto
Medical School—University of Sao Paulo, Medical Imaging,
Hematology and Oncology, Ribeirao Preto, Brazil
Keywords multimodal medical imaging, radiomics, CT/MRI, lung
nodule classification
Purpose
Lung cancer is the leading cause of cancer incidence and mortality
worldwide, and Computed Tomography (CT) screening programs can
contribute to its early detection. However, CT still has shortcomings:
as this exam requires a considerable radiation dose, performing
periodic examinations can become undesirable because of the risks of
radiation-induced cancers.
In recent years, technical advancements made Magnetic Reso-
nance Imaging (MRI) a viable modality for chest disease
management. Besides not exposing the patient to radiation, MRI
presents certain advantages over CT, such as superior soft-tissue
contrast, allowing a better characterization of nodules. However,
thoracic MRI still requires further clinical trials and protocol devel-
opment to determine its actual capacities [1].
Multimodality medical imaging has been progressively applied in
research and clinical practice. The intuition behind multimodality
imaging is that different modalities can provide complementary
information and better support for decision making and treatment [2].
This work’s main goal was to assess whether MRI radiomics
features are well-suited for lung nodules characterization and whether
the combination of CT/MRI features can overcome its single
modalities.Methods
We acquired CT and MRI imaging from a cohort of 33 lung cancer
patients. The sequences were obtained with patients in the supine
position and with the aid of the deep inspiration breath-hold tech-
nique. The clinical chest MRI protocol included the post-contrast
T1PC sequence. Our full image database comprises 33 nodules equal
or greater than 10 mm, of which 21 were diagnosed as malignant and
12 as benign. A senior radiologist pinpointed the nodules’ location on
the CT and T1PC sequences, and each lesion was segmented in both
modalities using the semi-automatic segmentation algorithm
FastGrowCut.
Next, We extracted a series of radiomics features from each
nodule using the open-source library pyradiomics. At the time of this
work, pyradiomics supported the following feature classes: First
Order Statistics; Shape-based; gray level co-occurrence matrix
(GLCM); gray level run length matrix (GLRLM); gray level size zone
matrix (GLSZM); neighboring gray-tone difference matrix
(NGTDM); and gray level dependence matrix (GLDM).
Since MRI has arbitrary intensity units, i.e., the grey level present
in the images has no physiological meaning, image quantification
with histogram-based features is impractical. Therefore, we discarded
the first-order statistics features, leading to 89 metrics for each
modality, divided into 14 shape-based, 24 GLCM, 16 GLRLM, 16
GLSZM, 5 NGTDM, and 14 GLDM features. For our multimodality
CT/MRI approach, we combined the single modalities features into a
new set containing 178 radiomic features. We scaled each feature
using Min–Max scaling.
Due to the inherent high dimensionality of radiomics, it is
essential to perform feature selection. We used a filter method by
ranking the best features according to the ANOVA F-value statistic.
For the decision tree and random forest classifier, we considered all
features. For the remaining algorithms, we evaluated sets of 5, 10, 20,
and 30 features. Because our dataset presents unbalanced classes, we
balanced our cases using the synthetic minority over-sampling tech-
nique (SMOTE), evaluating k values of 3 and 5 for each classifier.
We selected a set of machine learning algorithms: logistic
regression (LR); k-nearest neighbors (KNN); support vector machine
(SVM); decision tree (DT); random forest (RF); naive Bayes (NB);
and multi-layer perceptron (MLP). We performed hyperparameter
optimization using grid-search with the AUC as the scoring metric.
Moreover, we also measured each model’s sensitivity and specificity.
We performed validation using fivefold nested cross-validation to
ensure that no data leakage is happening within our optimization,
repeating the experiment 30 times to obtain the average and deviation
in performance for each metric.Results
Figure 1 presents each classifier’s average AUC performance for CT,
T1PC, and CT ? T1PC.
Our results contain an intriguing finding, as the models trained
with T1PC radiomics presented superior performance compared to
those trained with CT features. To assess the statistical significance of
the classifiers’ performance difference across the two datasets, we
performed a Wilcoxon signed-rank test. We verified the significance
of this difference and rejected the null hypothesis with a confidence
level of 5% for Logistic Regression (p = 2.85e - 4); SVM
(p = 1.11e - 4); RF (p = 5.57e - 4); and Naive Bayes
(p = 2.36e - 6). A conceivable explanation is that MRI’s superior
soft-tissue contrast allowed for a better characterization of the tumors
in terms of radiomics features and led to a higher quality
segmentation.
We can also observe that the combination of CT and T1PC fea-
tures has not resulted in better classification performance, as T1PC
surpassed the combined models in every case, except for the MLP
classifier. This classifier, however, could not outperform the best
classifiers in the T1PC set. This result may indicate that our feature
selection approach was not suitable for combining multimodality
radiomics features.
In general, our models have exhibited higher sensitivity than
specificity. As our dataset contains more positive instances, the
models could better learn the patterns for positive classification.Conclusion
This study aimed to evaluate MRI and CT/MRI radiomics features’
applicability to characterize lung nodules. Our results showed that
MRI radiomics features could characterize lung nodules and support
predictive models’ development, with AUC values up to 17% higher
than their CT counterparts. This advantage over CT is exciting, as
MRI can enable a more in-depth investigation of a lung nodule’s
physiology. Moreover, MRI can mitigate radiation exposure and
adverse reactions to contrast materials commonly used in CT.
On the other hand, our multimodality method has not proven
advantageous, with lower performance than the single modalities
models. Acknowledging that CT is the gold-standard modality for
lung cancer diagnostic, we believe that a more sound investigation
into multimodality medical imaging fusion techniques is needed.
Fig. 1 Average AUC for each classifier, by imaging modality
S62 Int J CARS (2021) 16 (Suppl 1):S1–S119
123

Acknowledgements
This study was financed in part by the Coordenaccao de Aper-
feicoamento de Pessoal de Nıvel Superior (CAPES)—Finance Code
001 and by The Sao Paulo Research Foundation (FAPESP) —Grants
#16/17078-0 and 14/50889-7.
References
[1] Ohno Y, Kauczor HU, Hatabu H, Seo JB, van Beek EJ (2018)
International Workshop for Pulmonary Functional Imaging
(IWPFI). MRI for solitary pulmonary nodule and mass assess-
ment: current state of the art. Journal of Magnetic Resonance
Imaging, 47(6), 1437–1458.
[2] Wei L, Osman S, Hatt M, El Naqa I (2019). Machine learning
for radiomics-based multimodality and multiparametric model-
ing. QJ Nucl Med Mol Imaging, 63(4), 323–338.
Deep convolution neural network for laryngeal cancer
classification on contact endoscopy—narrow band
imaging via transfer learning
E. Sharaf1, E. J. Gomes Ataide2, N. Esmaeili3,4, N. Davaris5,
C. Arens5, M. Friebe3,6
1Otto-von-Guericke University, Faculty of Electrical Engineering
and Information Technology, Institute of Medical Technology (IMT),
Magdeburg, Germany 2Otto-von-Guericke University, Clinic
for Radiology and Nuclear Medicine, Department of Nuclear
Medicine, Magdeburg, Germany 3Otto-von-Guericke University,
Medical Faculty, INKA—Innovation Laboratory for Image Guided
Therapy, Magdeburg, Germany 4Technical University Munich, Chair
for Computer Aided Medical Procedures and Augmented Reality,
Munich, Germany 5Magdeburg University Hospital, Department
of Otorhinolaryngology, Head and Neck Surgery, Magdeburg,
Germany 6IDTM GmbH, Recklinghausen, Germany
Keywords Deep Learning, Larynx, Contact Endoscopy,
Classification
Purpose
A number of different imaging tools have been used in the past as a
base for histopathological assessment of tumors in the larynx. White
light endoscopy, Narrow Band Imaging (NBI), and Contact Endo-
scopy (CE) are widely accepted to visualize the region of the larynx.
In spite of the technological advancements, differentiation between
malignant and benign lesions in the larynx is difficult in reality,
irrespective of the clinicians’’ level of experience. In addition, the
subjectivity in laryngeal cancer diagnosis has been recorded, which
reduces the confidence in the evaluation process by meter means of
visual tools [1]. A higher accuracy requires a long and expensive
training period.
This works investigated using Deep Convolutional Neural Net-
works (DCNN) for classifying 2-dimensional CE-NBI images into
benign and malignant classes. The proposed approach aimed at
introducing a fully automatic method with the objective orientation to
classify the input images.Methods
The work used a dataset of 8181 CE-NBI images as a base for the
classification into benign or malignant classes. Images were resized to
284 9 224 pixels and normalized in the range (0–1).
Instead of training a deep convolutional network from scratch, the
method utilized a pre-trained network for classifying the images
efficiently. ResNet50 [2] model was picked for being a well-vetted
structure with an expected high success based on our literature
research. The ResNet design overcomes the degradation problem
shown in different convolutional networks’’ performance, which
achieved a lower error rate with deeper layers. The method included
transfer learning for accelerating the fine-tuning process of the net-
work’’s weights at the training phase. Transfer learning leads to a
better generalization on validation images as the pre-trained model
was trained on a larger number of images previously.
The implementation also included assessing the performance of
portions of ResNet50, after cutting out deep layers, rather than taking
the whole network ([ 23 million weights), which has more learning
capacity than needed for this application. This helped in reducing
weights (parameters) count, to reduce the odds of model overfitting
that happens in the case of neural networks, leading to a better gen-
eralization. For that, a ‘‘cut-off’’ layer was added to the conventional
set of hyperparameters (optimizer, learning rate, loss function). Many
models at different cut-offs were run and examined based on accu-
racy, sensitivity, and specificity metrics. Training and validation
curves were inspected visually to examine the quality of convergence.
A fivefold cross-validation technique was selected for assessing the
performance at each trial (6545 images). Additionally, a testing phase
was executed on 1636 unseen images for examining the generaliz-
ability of the model.Results
The outcomes of the work showed that taking just a portion of the
ResNet50 model achieved very good results with a 97.95% validation
accuracy, against 96.75% for the complete provided ResNet50 model,
with the same set of hyperparameters. On testing images, the smaller-
sized network (after discard deeper layers) achieved 99.12%, 98.92%,
99.28%, for accuracy, sensitivity, and specificity, respectively. Small
structures were faster in the convergence than the complete pre-
trained model. Figure 1 shows the performance of a portion of
ResNet50 (around 230 K weights) on the training and validation
phases. As seen, the convergence was started at a high point,
smoothly over the short course of epochs. The training and validation
curves were moving forward to the optimal point in correspondence
with no sign of overfitting.
Fig. 1 Example of the model’s performance (4th fold) after discard-
ing deep layers of ReNet50. Training curve (orange line) and
validation curve (blue line)
Int J CARS (2021) 16 (Suppl 1):S1–S119 S63
123

Conclusion
We conclude that the presented approach can be helpful in classifying
CE-NBI images into benign and malignant classes objectively,
especially with the current state of human-based diagnosis of laryn-
geal cancer being rather subjective. The high recognition rates
indicate the robust performance by the suggested method, and the
potential to have an objective diagnosis for helping the submission
process in clinical practice, especially in difficult cases. Fine-tuning a
portion of ResNet50 helps in decreasing the chance of overfitting, and
requires less memory, with retaining high-performance metrics.
References
[1] Davaris N, Lux A, Esmaeili N, Illanes A, Boese A, Friebe M,
Arens C (2020) Evaluation of Vascular Patterns using Contact
Endoscopy and Narrow-Band Imaging (CE-NBI) for the Diag-
nosis of Vocal Fold Malignancy. Cancers 12(1): 248
[2] He K, Zhang X, Ren S, Sun J (2016). Deep Residual Learning for
Image Recognition. In Proceedings of the IEEE Conference on
Computer Vision and Pattern Recognition: 770–778.
Deep convolutional neural networks (CNN) for COVID-
19 classification in chest X-ray images with explainable
artificial intelligence (XAI)
X. Lessage1, S. Mahmoudi1, S. A. Mahmoudi1, S. Laraba1, O.
Debauche1, M. A. Belarbi1
1UMons, Faculty of Engineering, Computer Science, Mons, Belgium
Keywords X-ray analysis, classification, convolutional neural net-
works, covid-19
Purpose
The latest advances in machine learning and in particular with con-
volutional neurons (CNN) have proven more than once their great
accuracy in the detection of diseases [1, 2].
In this paper, we present a new approach for COVID-19 detection
from chest X-ray images using Deep Learning algorithms. An effi-
cient process consisting of techniques of transfer learning and a fine-
tuning from pre-trained CNN models (InceptionV3, VGG16, Mobi-
leNet, EfficientNet, etc.) is proposed. A comparison of different
architectures shows that VGG16 and MobileNet provide the highest
scores: 97.5% and 99.3% of accuracy.
Experimentations have been conducted using an anonymized
database from an Italian hospital thanks to a retrospective study. It is
composed of three classes (normal, COVID-19, other pathologies)
with a total number of 2905 images.
Methods
The goal of the proposed method consists of the separation of X-ray
images into two or three categories by selecting and adapting the best
CNN architecture. The classifier should be able to identify two
(normal, COVID-19) or three classes (normal, COVID-19, other
pathologies).
The dataset used was randomly splitted into three parts (70% for
training, 20% for validation, and 10% for test). We used data aug-
mentation techniques to artificially increase the dataset and so
significantly improve results accuracy.
We implemented a pre-trained architecture on ImageNet with
several modifications such as: reduction of the number of classes in
the last layer from 1000 to 3, integration of 5 dense layers to fine-tune
the weights in a progressive way. During the training process, we used
the training and validation datasets. Afterwards, we achieved our
model test on an independant test dataset whose images were not seen
by the neural network.
We evaluated six architectures (VGG16, MobileNet, Xception,
InceptionV3, EfficientNetB0, DenseNet169) with the best parameters
possible and we constated that the VGG16 and MobileNet architec-
tures were more efficient.
In order to be able to explain the decision taken by the CNN, we
used a technique to visualise the pixels responsible for the classifi-
cation. We opted for the GradCAM method which is frequently used
in the domain of Explainable Artificial Intelligence (XAI) but there
are many others.
Experiments were executed on a Linux cluster node with 32 CPU
cores using a single NVIDIA GeForce GTX 980 with 4 GB memory.
Keras 2 with Tensorflow 1.8 backend was used as a deep learning
framework.Results
The analysis of Table 1 shows that MobileNet and VGG16 are the
best models in terms of accuracy with the highest scores: 99.3% and
98.7% of accuracy respectively, 98.7% and 96.3% of sensitivity
respectively, and 98.7% of specificity for both models.
For other architectures, the scores are acceptable but it is impor-
tant to note that the number of false negatives is much higher.
In Figure 1, shown pixels responsible for the classification thanks
to this temperature curve on the X-ray image and in particular in this
case of COVID-19 suspicion.Conclusion
Our approach based on in-depth learning is very promising for
detecting pathologies, based on chest X-ray images. We recommend
VGG16 and MobileNet that have achieved the best results in terms of
precision, sensitivity and specificity.
Further investigations will be done using other datasets (and more
specifically with CT images) in combination with various visualiza-
tion methods.
Table 1 Comparison of models
Models #
Classes
#
Epochs
# Images
training
# Images
validation
# Images
test
Accuracy
test (%)
Sensibility (%) Specificity (%) # TP # FP # FN # TN
VGG16 3 48 2039 588 284 97.5 98.7 96.3 147 5 2 130
MobileNet 3 48 2039 588 284 99.3 99.3 99.2 152 1 1 130
Xception 3 48 2039 588 284 91.2 91.3 91.1 136 12 13 123
InceptionV3 3 48 2039 588 284 95.7 95.9 95.6 139 6 6 129
EfficientNetB0 3 48 2039 588 284 85.5 96.6 73.3 143 36 5 99
DenseNet169 3 48 2039 588 284 90.1 85.9 94.8 128 7 21 128
S64 Int J CARS (2021) 16 (Suppl 1):S1–S119
123

References
[1] Hemdan EED, Shouman MA, Karar ME (2020) Covidx-net: A
framework of deep learning classifiers to diagnose covid-19 in
X-ray images (2020) Available via ArXiv. https://arxiv.
org/abs/2003.11055. Cited 12 Aug 2020
[2] Apostolopoulos ID, Mpesiana TA (2020) Covid-19: automatic
detection from X-ray images utilizing transfer learning with
convolutional neural networks. Physical and Engineering
Sciences in Medicine 43 635—640 (2020), https://doi.org/
10.1007/s13246-020-00865-4
Weakly unsupervised contrastive unpaired learning
for virtual bowel cleansing in computer-assisted
diagnosis for laxative-free CT colonography
J. Nappi1,2, H. Yoshida1,2
1Massachusetts General Hospital, Radiology, Boston, United States2Harvard Medical School, Radiology, Boston, United States
Keywords Unsupervised learning, CT colonography, Electronic
cleansing, Unpaired training
Purpose
Cathartic bowel preparation remains as a major barrier to colorectal
screening. Laxative-free CT colonography bypasses the cathartic
preparation in colorectal screening by combining the use of a low-
fiber diet and an orally ingested fecal-tagging contrast agent with a
computer-assisted diagnosis (CADx) method called electronic
cleansing (EC) to perform virtual cleansing of the colon after the CT
image acquisition. However, current EC methods generate 3D image
artifacts that complicate the interpretation of the virtually cleansed
images. In this pilot study, we investigated the feasibility of per-
forming the EC in laxative-free CT colonography by use of
contrastive unpaired learning.Methods
Addressing the virtual cleansing problem can be formulated as
learning an image-to-image translation, where the input image is a
laxative-free CT colonography image volume and the output image is
the corresponding virtually cleansed CT image volume. However,
such an approach has two basic problems. First, clinical laxative-free
CT colonography cases do not have precisely matching natural vir-
tually cleansed versions that could be used as paired training samples.
Second, the relationship between the input and output images is a
surjection, because the virtually cleansed output image has an infinite
variety of corresponding fecal-tagged input images. Although the first
problem can be addressed by use of the unpaired training method
provided by cycle-consistent generative adversarial networks (Cy-
cleGANs) [1], the cycle-consistency condition assumes that the
relationship between the input and output images is a bijection,
thereby failing to address the second problem.
Therefore, in this study, we made use of weakly unsupervised 3D
contrastive unpaired training (3D CUT), which is based on maxi-
mizing the mutual information between unpaired input and output
images sampled from two domains [2]. The method is implemented in
terms of a 3D GAN, where the generator that is trained to generate the
EC images is composed of sequentially applied encoder and decoder
networks. The encoder is trained to pay attention to common elements
between the input and output image domains while being invariant to
their differences, whereas the decoder is trained to synthesize the
domain-specific features. The discriminator of the 3D GAN is trained
to differentiate between real and synthetically generated EC images.
For a preliminary evaluation, we collected unpaired samples of 147
fecal-tagged laxative-free CT colonography cases and 147 catharti-
cally cleansed untagged CT colonography cases. The laxative-free CT
colonography preparation involved oral ingestion of a low-osmolar,
non-ionic iodinated agent for fecal tagging in combination with a low-
fiber diet, and the CT colonography scans were acquired by use of
multidetector CT scanners in supine and prone position with 120 kVp
and 50 mAs effective at a maximum 2.5-mm z-axis length with 1.25-
mm overlap interval. The cathartic untagged CT colonography
examinations were prepared with a standard pre-colonoscopy cleans-
ing without using fecal tagging, and the CT colonography scans were
acquired by use of helical CT scanners in supine and prone position
with 120 kVp and 60–100 mA at 2.5–5.0 mm collimation and
reconstruction intervals of 1.5–2.5 mm. A training dataset was
established by extraction of 128 9 128 9 128-voxel training volumes
of interest (VOIs) at an isotropic 0.625-mm voxel resolution from both
types of CT colonography cases. An independent external test dataset
was established by the sampling of additional laxative-free CT
colonography examinations that were not part of the 147 laxative-free
training cases. After the training, the 3D CUT was tested with the
independent test dataset to evaluate if it had been able to learn to
perform EC based on the unpaired training. As a reference method, we
also trained and tested a 3D CycleGAN in a similar manner.Results
The 3D CUT and the reference 3D CycleGAN were trained with 9735
laxative-free VOIs and 10,152 untagged cathartic VOIs. However, the
3D CycleGAN did not produce meaningful test output.
Figure 1a shows an example of the result of the testing of the 3D
CUT on a laxative-free test case. As can be seen from the images, the
Fig. 1 VGG16 explanation with GradCAM method
Fig. 1 a An example of an axial CT image before (top) and after
(bottom) performing EC by the 3D CUT. b Plot of a line profile of the
bowel surface before (black dotted line) and after (blue line)
performing the EC by the 3D CUT
Int J CARS (2021) 16 (Suppl 1):S1–S119 S65
123

3D CUT was able to subtract semi-solid residual tagged feces real-
istically from the laxative-free CT colonography images.
Figure 1b shows a line profile of the bowel surface before and
after the EC. The plot demonstrates that the 3D CUT was able to
subtract the tagged feces adhering to the bowel wall and also able to
reconstruct the mucosal thickening layer of the bowel wall. The
surrounding soft-tissue and lumen regions retained realistic radio-
density values.
We also noticed some problems. In regions that contained large
pools of fecal-tagged fluid, the 3D CUT could convert the tagged fluid
into untagged fluid rather than subtract the fluid. This happened
because the cathartically cleansed untagged CT colonography training
cases contained large quantities of untagged fluid. Thus, while the 3D
CUT did learn to perform EC of semi-solid tagged feces, it also
learned to convert tagged fluid into untagged fluid based on the
examples of the training cases. Resolving such issues provides topics
for follow-up studies.Conclusion
We performed a pilot study to investigate the feasibility of performing
contrastive unpaired learning for EC in laxative-free CT colonogra-
phy. The 3D CUT model was trained with unpaired samples of
laxative-free CT colonography and untagged cathartic CT colonog-
raphy cases. Our preliminary results indicate that the resulting model
can be used to perform EC in laxative-free CT colonography. How-
ever, our study also revealed some issues to be addressed in follow-up
studies.Acknowledgements
This study was supported by the National Institute of Biomedical
Imaging and Bioengineering and National Cancer Institute of the
National Institutes of Health under Award Number R21EB024025,
R01EB023942, and R01CA212382.
References
[1] Nappi JJ, Yoshida H (2019) Cycle-consistent 3D-generative
adversarial network for virtual bowel cleansing in CT
colonography. Proc SPIE 10949, Medical Imaging 2019: Image
Processing, 1094922Z
[2] Park T, Efros AA, Zhang R, Zhu J-Y (2020) Contrastive
learning for unpaired image-to-image translation. 16th European
Conference on Computer Vision (ECCV)
Computer assisted pneumonia quantification in
COVID-19: data from the CovILD study
A. Luger1, C. Schwabl1, T. Sonnweber1, S. Sahanic1, A. Pizzini1, A.
Bohm1, J. Loffler-Ragg1, I. Tancevski1, G. Feuchtner1, M.
Johannidis1, R. Kirchmair1, E. Woll1, G. Weiss1, E. Gizewski1, G.
Widmann1
1Medical University of Innsbruck, Innsbruck, Austria
Keywords COVID-19, quantification, computed tomography,
pneumonia
Purpose
Computed tomography (CT) is the imaging method of choice in
patients with severe acute respiratory syndrome coronavirus 2
(SARS-CoV-2) disease 2019 (COVID-19), worsening of symptoms
and detection of persistent lung abnormalities after recovery. Sub-
jective scores currently classify CT findings based on severity of
pulmonary involvement (from mild ground glass opacities (GGO) to
marked consolidations) or estimate the amount of these findings.
Estimation of the percentage of involved lung parenchyma is time
consuming and prone to inter-reader variability. Computer assisted
pneumonia quantification software may provide an objective alter-
native. The prospective, multicentre, observational CovILD study
(development of interstitial lung disease (ILD) in patients with severe
SARS-CoV-2 infection) systematically evaluated the persisting car-
dio-pulmonary damage of COVID-19 patients 60 and 100 days after
COVID-19 onset. CT scans from this study were used to evaluate a
prototype software for pneumonia quantification.Methods
The trial protocol was approved by the institutional review board at
Innsbruck Medical University (EK Nr: 1103/2020) and was registered
at ClinicalTrials.gov (registration number: NCT04416100). Informed
consent was obtained from each patient. CT scans in low-dose setting
(100 kVp tube potential) were acquired without ECG gating on a 128
slice multidetector CT hardware with a 128 9 0.6 mm collimation
and spiral pitch factor of 1.1. Overall, pulmonary findings were gra-
ded for every lobe using a modified CT severity score by consensus
reading of two pulmonary radiologists: 0-none, 1-minimal (subtle
GGO), 2-mild (several GGO, subtle reticulation), 3-moderate (mul-
tiple GGO, reticulation, small consolidation), 4-severe (extensive
GGO, consolidation, reticulation with distortion), and 5-massive
(massive findings, parenchymal destructions). The maximum score
was 25 (i.e. maximum score 5 per lobe). Syngo.via CT PneumoniaAnalysis (Siemens Healthineers, Erlangen, Germany) research pro-
totype for the detection and quantification of abnormalities consistent
with pneumonia was used to calculate the percentage of opacity
(indicating GGO), and percentage of high opacity (indicating con-
solidation). Correlations between CT severity score and software-
based pneumonia quantification were assessed with Spearman rank
test.Results
In 145 COVID-19 patients, CT lung abnormalities typical for
COVID-19 were found in 77% of patients at visit 1 and in 63% of
individuals at visit 2. The CT severity score unveiled a moderate
structural involvement in most patients at 60-day follow-up and a
mean score of 8 points (IQR 2–15). Software based pneumonia
quantification revealed a mean percentage of opacity of 0.32% (IQR
0.01–3.91), and mean percentage of high opacity of 0.23% (IQR
0.00–0.12) at 60-day follow-up, and the software-based quantification
and the CT severity scoring by two radiologists demonstrated a high
correlation (correlation coefficient = 0.8, p\ 0.001). The majority of
participants (81%) demonstrated an improvement in both the CT
severity score and the software-based pneumonia quantification
100 days after COVID-19 onset.Conclusion
Software-based pneumonia quantification may show a high correla-
tion to a subjective CT severity score. It is uninfluenced by observer
and objectives quantification of ground glass opacification and
consolidation.
Parametric identification of prostate shape using
the superellipses and its correlation with pathology
Y. Onodera1, N. Koizumi1, Y. Shigenari1, R. Igarashi1, Y.
Nishiyama2, S. Shoji3
1The University of Electro-Communications, Department
of Mechanical and Intelligent Systems Engineering, Chofu, Japan2The University of Electro-Communications, Department
of Computer and Network Engineering, Chofu, Japan 3Tokai
University, Department of Urology, Isehara, Japan
Keywords superellipse, benign prostatic hyperplasia, SVM, CAD
S66 Int J CARS (2021) 16 (Suppl 1):S1–S119
123

Purpose
In recent years, due to the increase in the number of patients asso-
ciated with the aging population, emphasis has been placed on
prevention and early detection of diseases as a way of medical care.
One disease that has a high incidence among elderly men is benign
prostatic hyperplasia (BPH). BPH is a disease specific to elderly men
in which the enlargement of the internal glands surrounding the
urethra causes pressure on the urethra, leading to dysuria and a
decrease in QOL [1].
In this study, we focused on imaging diagnosis, which is relatively
common, and aimed at diagnosing benign prostatic hyperplasia from
the morphological characteristics of the prostate gland, which is
incidentally visualized by MRI and abdominal CT, in order to realize
a simple screening test. In this paper, we propose a diagnostic pre-
diction system for prostate MRI and evaluate its diagnostic
performance.Methods
The proposed system is constructed in two major stages. The outline
of the proposed system is summarized in Fig. 1. In the first stage, we
extract features for classification from input images. The method of
feature extraction is described below. First, the prostate contour
depicted on the prostate MRI under the guidance of a doctor is treated
as the correct contour. We scan the pixels on the prostate MRI to
obtain the coordinates of the correct contour. Twenty-four points are
obtained at equal angles from the center of the image, and 100 spline
interpolation points are used to obtain smooth and continuous coor-
dinates. Based on the acquired coordinates, a mathematical model
called superellipses is used for fitting. In the prostate shape extraction,
we use a hyperelliptic model with eight deformable parameters
P = {lx, ly, r, sy, sq, xy, t, b} by Gong et al. [2]. Among the eight
hyperelliptic parameters P = {lx, ly, r, sy, sq, xy, t, b}, the position
parameter Pp = {lx, ly, r, sy} is calculated numerically and the shape
parameter Ps = {sq, xy, t, b} is identified using grid search.
In the second stage, a classifier is trained using the feature data set
obtained in the first stage, and the trained classifier is used to diagnose
whether or not the test data has benign prostatic hyperplasia. The
standardized feature data set obtained in the first stage is used as the
explanatory variable and the prostate pathology as the objective
function (normal = 0, BPH = 1), which is input to the SVM model to
build the learned model. The parameters are tuned using the grid
search method and k-cross partitioning validation to prevent over-
training and improve the generalization performance of the model.
Initially, we classify the pathological conditions using 4-dimen-
sional features with only the shape parameter Ps. Based on the results,
we then experimented with a six-dimensional feature set that includes
the shape parameter Ps plus ‘‘sy’’ and the area encompassed by the
prostate contour (number of pixels) ‘‘S’’. We use prostate MRI as the
training and diagnostic data for the system evaluation experiments.
Four consecutive prostate MRI images were used per patient, focus-
ing on the area with the largest endoglandular area in the 3-mm slice
T2-weighted images. Only images that show typical morphological
features and that are equivalent to the diagnostic results and the
physician’s imaging results will be used in this experiment.Results
The results of this experiment using 6-dimensional features are shown
in the Table 1; the results using 4-dimensional features show that the
correct answer rate, fit rate, recall rate, F value, and AUC are 0.771,
0.749, 0.826, 0.781, and 0.789, respectively. Then, for the diagnostic
system using 6-dimensional features, the correct answer rate, fit rate,
recall rate, F value, and AUC were 0.961, 0.971, 0.951, 0.960, and
0.960, respectively, as shown in the table. In this experiment, the
morphological features using the hyperelliptic model are considered
to be effective features for the diagnosis of benign prostatic hyper-
plasia with ideal morphology, since we have shown that features with
relatively low dimensionality in this experiment produce a correct
answer rate of nearly 80%. Since low dimensionality was thought to
be the cause of the misidentification, experiments were conducted
with additional features, and the accuracy was improved.Conclusion
In this study, we evaluated a method for predicting the diagnosis of
benign prostatic hyperplasia (BPH) using morphological features
based on superellipses and machine learning to realize a diagnostic
system from imaging in screening tests for BPH. We conducted
experiments using the shape deformation parameter of the superel-
lipses, and confirmed the effectiveness of the method by proposing
new features, since problems in diagnosis were confirmed. In the
future, we would like to improve the discriminative performance of
the model by extracting more features, and introduce algorithms to
reduce the number of missed pathologies, such as the introduction of
multi-step diagnosis using the confidence level. In addition, there are
some problems to be solved, such as the variation of the fitting per-
formance depending on the setting of the reference axis of the
superellipses, and the large computation time required for the grid
search method, so we would like to automate and speed up the
superellipses fitting.
References
[1] AUA Practice Guidelines Committee (2003) AUA Guideline on
Management of Benign Prostatic Hyperplasia (2003). The
journal of Urology 170(2):530–547
[2] Gong L, Pathak SD, Haynor DR, Cho PS, Kim Y (2004)Para-
metric Shape Modeling Using Deformable Superellipsess for
Prostate Segmentation. IEEE Transactions on Medical Imaging
23(3):340–349
Fig. 1 Proposed algorithm outline
Table 1 Result of experiment
Mean Standard
Accuracy 0.961 0.035
Precision 0.971 0.038
Recall 0.951 0.056
F-score 0.96 0.036
AUC 0.96 0.176
Int J CARS (2021) 16 (Suppl 1):S1–S119 S67
123

Predicting interstitial and Covid-19 diseases on chest
X-ray using a convolutional neural network
with transfer learning
L. L. Lima1,2, J. C. Nather Jr1, M. Koenigkam-Santos1,2, L. Peron 1,
K. L. Fontes Lopes 1, C. Machado1, F. Sarmento-Neto1, D. Wada 1,
M. Koenigkam-Santos 1, P. Azevedo-Marques1,2
1Ribeirao Preto Medical School—University of Sao Paulo, Medical
Imaging, Hematology and Oncology, Ribeirao Preto, Brazil2University of Sao Paulo, Interunit Graduate Program
in Bioengineering, Sao Carlos, Brazil
Keywords Lung Interstitial Disease, Covid-19, Convolutional Neural
Network, Transfer Learning
Purpose
Lung interstitial diseases (LID) includes a group of more than 200
chronic lung disarrangements, which can reduce the ability of the air
sacs to capture and carry oxygen into the bloodstream and conse-
quently lead to permanent loss of the ability to breathe [1].
Autoimmune diseases, genetic abnormalities, and long-term expo-
sures to hazardous materials can cause these diseases [1]. Another
disease is the Coronavirus disease 2019 (Covid-19), highly contagious
has spread rapidly throughout the world since January of 2020 [2].
According to the World Health Organization (WHO), the mortality
rate reaches 2–3% of people affected by Covid-19 [2].
Chest X-ray is often the initial exam in the face of clinical sus-
picion of lung diseases, in addition to being the simplest, cheapest,
and most available imaging exam. To help specialists improve the
diagnostic accuracy of LID and Covid-19 diseases presented on chest
X-ray images by acting as a second opinion through a computer-
supplied suggestion, computer-aided diagnosis (CAD) systems has
been developed.
One machine learning technique that has emerged to improve
CAD systems is the convolutional neural network (CNN) that is based
on deep learning [1, 2]. CNN extracts the image’’s features, selects the
most important features, and classifies the input images. Nevertheless,
modeling the best CNN architecture for any specific problem by hand
can be an exhausting, time-consuming, and expensive task. However,
an alternative is the use of the Transfer Learning technique, which
uses a network pre-trained on a large dataset applied on a new dataset.
In this work, we performed a CNN analysis with a transfer-learning
algorithm to predict LID and Covid-19 diseases on chest X-ray
images.Methods
This was a retrospective study approved by our institutional review
board with a waiver of patients’ informed consent. Frontal chest
X-ray images of patients diagnosed in three groups have been used:
healthy (380 images), with LID (310 images), and with Covid-19 (199
images). All images were previously analyzed by a thoracic radiol-
ogist and covid-19 diagnosis was confirmed by RT-PCR. Figure 1
shows an example from the Covid-19 set. Original DICOM images
were converted to PNG with 3 channels (RGB), to augment the
database and improve CNN’’s performance in the experiments. Next,
pixel values were normalized between 0 and 1.
A balanced subset of images was also randomly organized with
199 cases from each group, that was splitted in 80% for training (159
samples from each group) and 20% for testing (40 samples from each
group). An unbalanced testing was also performed using 222 images
from healthy, 151 images from LID groups, and 40 images from
Covid-19 set.
The experiments were performed using a graphics-processing unit
(GPU) NVidia Titan X with 12 Gigabytes of RAM, 3584 cores, speed
of 1.5 GHz, and Pascal Architecture. For training, the samples were
shuffled for tenfold cross-validation using CNN through the
framework Tensorflow (v.2.1.0.). Through the technique of transfer
learning, the pre-trained network used was the VGG19, so the reso-
lution of the images was fixed in 224 9 224. From the VGG19, all
layers until the block4_pool layer were frozen preventing their
weights from being updated during the training, and the layers until
block5_pool were retrained. Next, some layers were added: Glob-
alAveragePooling2D, BatchNormalization, a dense layer with 128
units with the activation function ReLU, a dropout layer with the rate
of 0.6, and the final dense layer with 3 units for the classification of
the three classes with Softmax activation function. The values of
batch size and epoch were 36 and 100, respectively. The optimizer
function used was Adam to minimize the categorical cross-entropy.
The processing time for training was 50 min.
To evaluate the performance of testing cases the statistical metrics
used were the area under the receiver operating characteristic curve
(AUC), sensitivity, specificity, and accuracy. We evaluated the met-
rics sensitivity, specificity, and accuracy considering each class as a
positive at a time. The confidence interval (CI) used was 95%.Results
In the evaluation using the balanced testing set, results considering
the healthy class as positive were sensitivity of 85% (CI: 0.69–0.93),
specificity of 92.50% (CI: 0.83–0.96), and accuracy of 90% (CI:
0.82–0.94). Results for the LID class as positive were sensitivity of
80% (CI: 0.63–0.90), specificity of 96.25% (CI: 0.88–0.99), and
accuracy of 90.83% (CI: 0.83–0.95); and for the Covid-19 class as
positive results were sensitivity of 92.50% (CI: 0.78–0.98), specificity
of 90% (CI: 0.80–0.95), and accuracy of 90.83% (CI: 0.83–0.95). The
AUC values were 0.96, 0.97, and 0.97 for classes healthy, LID, and
Covid-19, respectively.
In the evaluation using the unbalanced testing set, the results
considering the healthy class as positive were sensitivity of 84.23%
(CI: 0.78–0.88), specificity of 91.62% (CI: 0.87–0.95), and accuracy
of 87.65% (CI: 0.83–0.90). Results for the LID class as positive were
sensitivity of 84.77% (CI: 0.77–0.89), specificity of 93.13% (CI:
0.89–0.95), and accuracy of 90.07% (CI: 0.86–0.92); and for the
Covid-19 class as positive results were sensitivity of 92.50% (CI:
0.78–0.98), specificity of 92.76% (CI: 0.78–0.98), and accuracy of
92.74% (CI: 0.89–0.94). The AUC values were 0.95, 0.94, and 0.97
for classes healthy, LID, and Covid-19, respectively.
Fig. 1 Frontal CXR of a patient with COVID-19 pneumonia showing
most typical interstitial, hazy opacities, predominantly involving
basal and peripheral areas of the lungs (arrows). As all patients
included in this study, diagnosis was confirmed by RT-PCR and
images were previously analyzed by a thoracic radiologist
S68 Int J CARS (2021) 16 (Suppl 1):S1–S119
123

Conclusion
This study performed a CNN modeling integrated with a transfer
learning architecture for the prediction of chest X-ray images in
healthy, LID, or Covid-19. The small number of cases is a clear
limitation of this study. Even so, the proposed approach presented
potential to be used as a tool for classifying chest X-ray images.
Moreover, our method does not require image segmentation, use of
handcrafted features extractors, or clinical features as prerequisites.Acknowledgements
This study was financed in part by the Coordenaccao de Aper-
feicoamento de Pessoal de Nıvel Superior (CAPES)—Finance Code
001 and by The Sao Paulo Research Foundation (FAPESP) —Grants
#2020/07200-9, #16/17078-0 and 14/50889-7. We thank the Tecgraf/
PUC-Rio Institute for the computational resources made available,
being of vital importance for the conclusion of this work.
References
[1] Anthimopoulos M, Christodoulidis S, Ebner L, Christe A,
Mougiakakou S (2016) Lung Pattern Classification for Intersti-
tial Lung Diseases Using a Deep Convolutional Neural Network.
IEEE Trans Med Imaging 35(5):1207–1216. https://doi.org/
10.1109/tmi.2016.2535865. Epub 2016 Feb 29.
[2] Kamil MY. A deep learning framework to detect Covid-19
disease via chest X-ray and CT scan images. International
Journal of Electrical and Computer Engineering. 11. 2021;11(1)-
844–850. https://doi.org/10.11591/ijece.v11i1. pp. 844–850.
Breast cancer detection in digital mammography
with convolutional neural network: retrospective
study in Belgium
S. Mahmoudi1, X. Lessage1, F. Giudice1, S. Murgo2, S.
A. Mahmoudi1
1University of Mons—Faculty of Engineering, Computer Sciences
Department, Mons, Belgium 2CHR de Mons, Radiology, Mons,
Belgium
Keywords Breast cancer, Mammography, Classification, convolu-
tional neural networks
Purpose
Nowadays, cancer is one of the leading causes of human death in the
world. In 2020, breast carcinoma represented 11.7% of cancers
reported in the female world population. Medical imaging is crucial
for breast cancer screening and occupies a large place in diagnosis.
Early screening with digital mammography is the key factor of suc-
cessful detection of breast cancer. Also, automatic tumor detection
could help radiologists in their work and them to achieve fast and
accurate diagnosis. We propose in this work, a deep learning-based
classification method to assist radiologists in the context of breast
cancer screening and diagnosis. This system is able to classify digital
mammograms into two categories: negative or benign and malignant.
The main objective of this automatic imaging based detection method
is to avoid human second reading and at the same time reduce radi-
ologists workload. Several deep convolutional neural networks
architectures were assessed in this work, and a three stage training
process was proposed. Our experiments were conducted by using a
real database collected from the CHR Mons-Hainaut in Belgium
composed of 2410 images including 378 malignant cases.Methods
Recently, a lot of research projects were conducted to assess early
detection of breast cancer, either with masses or microcalcification
detection. However a large majority of the research projects in this
field [1, 2] were based on publicly available databases like CBIS-
DDSM, INbreast or MIAS. These databases could be used to assess
automatic tumor detection approaches but could not fit to local or
regional populations and their specificities. The main objective of our
work is to propose an efficient mammography image classifier using a
real database collected from CHR Mons-Hainaut hospital in Belgium
and an adapted pre-trained convolutional neural network. The pro-
posed method consists of developing a binary classifier using deep
neural networks applied to mammography images. The classifier is
able to identify two classes: malignant and benign in order to assist
the radiologist in his diagnosis. The dataset used was randomly
splitted into three parts (70% for training, 20% for validation, and
10% for test). We used data augmentation techniques to artificially
increase the dataset and so significantly improve results accuracy.
During the development of our model the training strategy was
defined by implementing transfer learning from pre-trained architec-
tures with ImageNet database and fine-tuning techniques. We tested
the following CNN pre-trained architectures: ResNet50, ResNet152,
InceptionV3, ResNet101, AlexNet, VGG19, VGG16. We can note
that pretrained networks allow faster training and improve the gen-
eralization capacity of the network compared to random initialization.
Also, it is worth mentioning that pretrained networks present in their
bottom layers the main primitive features that tend to be universal and
common to the majority of the datasets. On the other side, top layers
represent high level descriptive features related to final labels. Hence,
finetuning could be achieved in depth for the top layers. So, applying
a higher learning rate for top layers could take into account this fact.
That is why; we propose in our work a three stage training framework
similar to the computational framework proposed by Shen li et al. in
[1]. So, our learning strategy freezes in the first stage all parameter
layers except the last one. This step allows to finetune the model by
using only the last layer. We use in this stage a learning rate of 0.001
for 3 epochs. In a second stage we unfreeze top layers and apply a
learning rate of 0.0001 for 10 epochs. Finally, we train the whole
network with a learning rate of 0.00001 for 50 epochs combined to an
early stopping condition. Also, in order to overcome overfitting we
added a dropout layer with a probability set to 0.5. On the other hand,
Stochastic gradient descent (SGD) and Adam algorithms were both
used in our tests to optimize the networks.
The proposed method was tested with a real database composed of
2410 images from CHR Mons-Hainaut taken in 2016 and containing
negative or benign and malignant cases with verified pathological
information. This dataset includes 378 mammograms with cancer
(malignant cases). The proportion between benign and malignant
cases was chosen to maintain the frequency of occurrence of breast
cancer in real life. During the training process, we used the training
and validation datasets. Afterwards, we achieved our model test on an
independent test dataset whose images were not seen by the neural
network.Results
We present in Table 1 the results obtained with our binary classifier
for the different CNN architectures tested with the Adam optimizer, a
batch size equal to 16 and a Dense layer size of 512. The ES column
is EarlyStopping parameter and AUC is the area under the ROC
curve. The third column from the left corresponds to the number of
top layers trained in the second training phase. These results show that
the three best results were obtained with AlexNet, VGG19 and
VGG16. For VGG16 architecture, training and validation accuracy
was respectively 99.47% and 98.96%, while test accuracy reached
97.10%, and AUC 93.1%.
In a second experimentation we kept the VGG16 model which has
shown the best results and we have applied a final configuration with
EarlyStopping and a Dense layer size of 128. In this final experi-
mentation, we increased the batch size to 32 and applied SGD
optimizer. Figure 1 shows the accuracy convergence at the end of the
Int J CARS (2021) 16 (Suppl 1):S1–S119 S69
123

third training phase. After a total of 30 epochs, the training accuracy
reached 98.34% and the validation was slightly higher with a value of
99.17%.
For our test dataset the achieved accuracy was of 98.34% and the
AUC of 96.1%. The confusion matrix obtained with the VGG16
classifier generates a very few number of false negatives (FN = 4,
FP = 0, TP = 47, TN = 190). Indeed, out of a total of 51 cancer cases
in the test dataset, the model missed only four ones. In addition, all
benign class images were properly classified.Conclusion
In this paper, we addressed the problem of breast cancer detection by
using digital mammography and deep convolutional neural networks.
Several pre-trained CNN architectures were used such as: ResNet50,
ResNet152, InceptionV3, ResNet101, AlexNet, VGG19, VGG16. The
major contribution of this paper is the use of a real database, and the
use of an adapted pre-trained model based on a three stage training
process. The adapted VGG16 model achieved the best accuracy score
of 98.34% for the test dataset. This result overcomes the latest results
that use CBIS-DDSM database and present encouraging steps to
automate breast cancer detection in hospitals. Further investigations
will be done using a bigger dataset in order to improve screening
results.
References
[1] Shen L, Margolies L, Rothstein J, Fluder E, McBride R, Sieh W
(2019) Deep learning to improve breast cancer detection on
screening mammography. Scientific Reports, 9:1–12. doi:
https://doi.org/10.1038/s41598-019-48995-4.
[2] Tsochatzidis L, Costaridou L, Pratikakis I (2019) Deep learning
for breastcancer diagnosis from mammograms—a comparative
study. Journal of Imaging, 5:37. https://pubmed.ncbi.nlm.
nih.gov/31467326.
A deep learning scheme for predicting the cognitive
status of patients with small vessel disease and mild
cognitive impairment
S. Atnafu1, C. Marzi1, E. Salvadori2, A. Poggesi2, A. Giorgio3, N. De
Stefano3, M. Mascalchi4, L. Pantoni5, S. Diciotti1,6
1University of Bologna, Department of Electrical, Electronic,
and Information Engineering ‘‘Guglielmo Marconi’’, Bologna, Italy2University of Florence, NEUROFARBA Department, Neuroscience
Section, Florence, Italy 3University of Siena, Department
of Medicine, Surgery, and Neuroscience, Siena, Italy 4University
of Florence, ‘‘Mario Serio’’ Department of Experimental and Clinical
Biomedical Sciences, Florence, Italy 5University of Milan, ‘‘L.
Sacco’’ Department of Biomedical and Clinical Sciences, Milan, Italy6University of bologna, Alma Mater Research Institute for Human-
centered Artificial Intelligence, Bologna, Italy
Keywords deep learning, magnetic resonance imaging, mild cogni-
tive impairment, small vessel disease
Purpose
Mild cognitive impairment (MCI) is one of the consequences of
small vessel disease (SVD) and the prediction of the cognitive
status of patients with SVD and MCI from neuroimaging data is
crucial to identify possible markers of the cognitive deficit. In
recent years, deep learning schemes have been applied for the
prediction of the cognitive status from brain imaging. Indeed, the
ability to extract patterns and latent features from complex data,
such as magnetic resonance imaging (MRI) data, makes deep
learning schemes and, in particular, convolutional neural networks
(CNN), a powerful tool in neuroimaging applications. The objective
of this study is to develop and test a 2D-CNN model to predict the
cognitive status of patients with SVD and MCI in terms of the Trial
Making Test part A (TMT-A) score—a popular neuropsychological
test sensitive to psychomotor speed and executive functioning—
from multi-input data, i.e., MRI-derived features and demographic
data.Methods
In our study, we considered 58 patients with SVD and MCI from one
center of the VMCI-Tuscany study (27 women and 31 men, aged
74.18 ± 6.98 years, mean ± standard deviation) [1]. For each
patient, MRI data were collected using different techniques. In
Table 1 Accuracy results for the different proposed architectures
Modele ES Top Layers Train_acc (%) Val_acc (%) Test_acc (%) AUC (%)
InceptionResNetV2 6 48 99.94 84.23 79.67 52.00
ResNet50 11 46 100.00 84.23 79.67 52.00
ResNet152 8 46 100.00 84.44 79.67 52.00
InceptionV3 6 48 99.88 85.68 81.33 55.90
ResNet101 12 46 100.00 92.32 86.31 67.60
AlexNet 10 11 98.52 95.23 93.36 84.30
VGG19 8 13 99.47 98.96 96.68 92.20
VGG16 8 11 99.47 98.96 97.10 93.10
Fig. 1 training and validation accuration evolution at the third
training stage
S70 Int J CARS (2021) 16 (Suppl 1):S1–S119
123

particular, T1-weighted, T2-weighted fluid attenuated inversion
recovery (FLAIR), white matter hyperintensity lesion maps (LM),
mean diffusivity (MD) and fractional anisotropy (FA) features
derived from diffusion tensor imaging (DTI), resulting in five sets of
voxel-wise MRI-derived feature maps, were available [1–2]. These
maps were used, separately, as input to a 2D-CNN after a linear and
non-linear image registration onto the MNI152 standard template
(Figure 1). Since our CNN has a 2D architecture, we sliced each
volume into 2D images in the axial plane and, for each patient, we
selected the 16 most informative slices according to the entropy
maximization principle, i.e., the 16 slices that maximized the entropy
value. Then, a voxel-wise standard feature scaling has been applied to
achieve faster convergence.
Since the size of the training set was relatively small, we
employed a transfer learning technique by adapting a pre-trained
VGG16 model, trained on a large dataset of labeled natural images
(ImageNet dataset). Then, we modified the VGG16 architecture to be
able to feed multiple inputs (MRI-derived feature maps and demo-
graphic data, i.e., sex, age and education level of participants)
(Figure 1). Specifically, while VGG16 is a single input CNN that
accepts only a 2D image as input, our proposed model consisted of
two input branches: a CNN and a fully connected (FC) branch. The
CNN branch is formed by the convolutional layers of the VGG16
model and by a newly added global average pooling (GAP) layer that
replaces the FC layers of the VGG16 network. This branch takes the
MRI-derived feature map as input. On the other hand, the FC branch
is constituted of a FC layer followed by a dropout layer and accepts
demographic data as input. The outputs from the two branches are
concatenated and further processed by the last FC layers.
For training and validation of the proposed model, we used a
tenfold nested CV loop, where the inner fold was used for grid-search
hyperparameter tuning of the model and the outer fold for evaluating
the generalization ability of the optimized model on unseen test
samples. The nested CV was based on a subject-level to assure that no
data leakage was created during the data split. The adaptive Adam
optimizer was chosen for training all models for 40 epochs with a
mini-batch gradient descent algorithm and batch size of 128.
To assess the model’s performance, the average value of the
Pearson’s correlation coefficient between the actual and predicted
values of the TMT-A score on the outer folds was computed.Results
Table 1 illustrates an overview of the results. The model’s develop-
ment, training, validation and testing were implemented using Python
code and Keras library (using a Tensorflow backend). A workstation
equipped with Ubuntu 16.04, a high performance 12 GB G5X frame
buffer NVIDIA TITAN X (Pascal) GPU with 3584 CUDA cores and a
64-bit 16 M RAM hardware was used. For each model, the compu-
tational time needed to run a nested CV loop was about 75 h.
Conclusion
In this study, the cognitive status of patients with SVD and MCI,
measured by the TMT-A score, was predicted using CNN models
trained on multiple MRI features. Although all the models employing
different MRI-derived features produced good predictions, the TMT-
A score was best predicted using features derived from DTI data (MD
and FA maps), yielding a correlation coefficient of 0.513 and 0.504,
respectively. These values were greater than that obtained in the same
population using a least absolute shrinkage and selection operator
(LASSO) regression trained on 13 demographic and neuroimaging
features (coefficient of correlation = 0.354) [1]. However, in the
previous study, DTI-derived indices were not available and the model
predicted demographically adjusted TMT-A scores, rather than raw
scores. Our results are in accordance with the fact that cognitive
deficits associated with information processing speed are mainly the
effect of white matter damage which may be reflected by changes of
DTI-derived indices [2]. In conclusion, our results showed that a deep
learning approach could be a valuable tool in predicting the cognitive
status of patients with SVD and MCI.
References
[1] Pantoni L, Marzi C, Poggesi A, Giorgio A, De Stefano N,
Mascalchi M, Inzitari D, Salvadori E, Diciotti S (2019) Fractal
dimension of cerebral white matter: A consistent feature for
prediction of the cognitive performance in patients with small
vessel disease and mild cognitive impairment. NeuroImage:
Clinical, 24, p.101990
[2] Ciulli S, Citi L, Salvadori E, Valenti R, Poggesi A, Inzitari D,
Mascalchi M, Toschi, N., Pantoni, L. and Diciotti, S., 2016.
Prediction of impaired performance in trail making test in MCI
patients with small vessel disease using DTI data. IEEE journal
of biomedical and health informatics, 20(4), pp. 1026–1033.
Machine learning for lung CT texture analysis
in connective tissue disease: capability for disease
severity and therapeutic effect evaluations
Y. Ohno1,2,3, K. Aoyagi4, D. Takenaka5, T. Yoshikawa5,6, Y.
Fujisawa4, N. Sugihara4, H. Hattori1, K. Murayama1, H. Toyama1
1Fujita Health University School of Medicine, Radiology, Toyoake,
Japan 2Fujita Health University School of Medicine, Joint Research
Laboratory of Advanced Medical Imaging, Toyoake, Japan 3Kobe
University Graduate School of Medicine, Division of Functional
and Diagnostic Imaging Research, Department of Radiology, Kobe,
Japan 4Canon Medical Systems Corporation, Otawara, Japan 5Hyogo
Cancer Center, Diagnostic Radiology, Akashi, Japan 6Kobe
University Graduate School of Mediciine, Division of Functional
and Diagnostic Imaging Research, Department of Radiology, Kobe,
Japan
Fig. 1 Overview of the architecture of the proposed CNN for
prediction of the TMT-A score
Table 1 Average Pearson’s correlation coefficient between the actual
and predicted values of the TMT-A score on the test sets of the outer
folds (the bold value highlights the best performance)
Int J CARS (2021) 16 (Suppl 1):S1–S119 S71
123

Keywords Computer-aided volumetry, Machine Learning, CT, Tex-
ture Analysis
Purpose
In response to a need for quantitative assessment of interstitial lung
involvement, machine learning (ML)-based CT texture analysis was
developed for patients with various pulmonary diseases. Recently, we
developed and proposed ML-based CT texture analysis software and
demonstrated its’’ capability to play as second reader similar to chest
radiologists with more than 20 years experiences. In this situation, we
hypothesized that our newly developed ML-based algorithm has a
better potential than qualitatively assessed disease severity for disease
severity assessment and treatment response evaluation for patients
with connective tissue diseases. The purpose of this study was to
evaluate the capability of ML-based CT texture analysis software for
disease severity and treatment response assessments in comparison
with qualitatively assessed thin-section CT for patients with con-
nective tissue disease (CTD).Methods
Between January 2016 and December 2017, 149 patients with CTD
related ILD (CTD-ILD) who underwent initial and follow-up CTs, as
well as pulmonary function and serum KL-6 level tests, were initially
included as test cases with no overlaps between training, validation
and test cases. 149 consecutive patients with CTD-ILD were included,
consisting of 56 males (60 ± 11 years, age range: 39–83 years) and
93 females (58 ± 9 years, age range: 30–85 years) comprising 54
cases of progressive scleroderma (PSS), 34 of dermatomyositis (DM),
29 of rheumatoid arthritis (RA), 14 of polymyositis (PM), 7 of mixed
connective tissue disease (MCTD), 7 of anti-neutrophil cytoplasmic
antibody (ANCA)-associated vasculitis, and 4 of Sjogren’s syndrome.
Changes in disease severity between two serial CT examinations of
each of these cases were assessed into three groups: Stable, n = 188;
Worse, n = 98; and Improved, n = 78. Next, quantitative index
changes were determined by using software as well as qualitative
disease severity scores. To determine the relationship among all
radiological findings, each pulmonary function parameter or serum
KL-6 level, step-wise regression analysis were performed. To eval-
uate differences in each quantitative index as well as in disease
severity score between two serial CT examinations, Tukey’’s honestly
significant difference (HSD) test was performed to determine differ-
ences among the three statuses. Stepwise regression analyses were
performed to determine changes in each pulmonary functional
parameter and all quantitative indexes between two serial CTs.Results
Results of stepwise regression analysis of differences between all
quantitative radiological indexes and each pulmonary functional
parameter as well as serum KL-6 level revealed that FEV1/FVC %
was significantly affected by % normal lung and % reticulation
(r2 = 0.27, p = 0.04), %VC was significantly affected by % normal
lung, % reticulation and % GGO (r2 = 0.36, p = 0.01), while %
DLCO/VA was significantly affected by % normal lung, % reticu-
lation and % GGO (r2 = 0.27, p = 0.04). In addition, serum KL-6
level was significantly affected by % normal lung and % reticulation
(r2 = 0.27, p = 0.04). D % normal lung, D % consolidation, D %
GGO, D % reticulation and Ddisease severity score showed signifi-
cant difference among the three statuses (p\ 0.05). D % honeycomb
showed a significant difference between the ‘‘Stable’’ and ‘‘Worse’’
groups and between the ‘‘Worse’’ and ‘‘Improved’’ groups (p\ 0.01).
All differences in pulmonary functional parameters as well as in
serum KL-6 levels were significantly affected by D % normal lung,
D % reticulation and D % honeycomb (0.16 B r2 B 0.42, p\ 0.05).Conclusion
Newly developed ML-base CT texture analysis has better potential
than qualitatively assessed thin-section CT for disease severity
assessment and treatment response evaluation for patients with con-
nective tissue diseases.
Computer-aided prediction of COVID-19 progression
using unsupervised deep learning of chest CT images
T. Uemura1,2, J. Nappi1, C. Watari1, T. Hironaka1, T. Kamiya2, H.
Yoshida1
1Massachusetts General Hospital/Harvard Medical School, Imaging,
Boston, United States 2Kyushu Institute of Technology, Kitakyushu,
Japan
Keywords computer-aided prediction, deep learning, survival anal-
ysis, COVID-19
Purpose
The severity of the cases with COVID-19 together with its rapid
progression has placed great pressures on healthcare services around
the world. Therefore, fast and accurate prediction of the disease
progression of patients with COVID-19 is needed for logistical
planning of the healthcare resources. The purpose of this study was to
develop a prediction model, called pix2surv, for predicting the
COVID-19 progression from patients’’ chest CT images.Methods
Subjects and chest CTPatients who had been diagnosed as COVID-19 positive based on a
positive result for SARS-COV-2 by the reverse transcriptase-poly-
merase chain reaction (RT-PCR) test were included retrospectively in
this study. As a result, we identified, from the medical records of our
institution, high-resolution chest CT images of 105 patients with
confirmed COVID-19. For these patients, the CT scans were per-
formed with a single-phase, low-dose acquisition protocol by use of
multi-channel CT scanners with slice thickness of 0.625–1.5 mm,
pitch of 0.3–1.6, tube voltage of 80–140 kVp, and automatic tube
current modulation.
pix2surv modelThe pix2surv is based on an adversarial time-to-event model [1],
which was adapted to predict a patient’’s disease progression. Here,
we define the survival time of a patient as the number of days from
the patient’’s chest CT scan to either ICU admission or death.
Figure 1 shows our generative-adversarial-network-based architecture
of the pix2surv model, in which the time generator G is used to
generate or estimate a ‘‘survival-time image’’ from the input CT
images of a patient. The survival-time image is an image that has a
single survival time value at each pixel. The discriminator D attempts
to differentiate the ‘‘estimated pair’’ of an input CT image and a
generated survival-time image, from the ‘‘observed pair’’ of an input
CT image and the observed true survival-time image of the patient.
The training of pix2surv involves the optimization of G and
Fig. 1 Schematic architecture of the proposed pix2surv model for the
prediction of the COVID-19 progression
S72 Int J CARS (2021) 16 (Suppl 1):S1–S119
123

D through a modified min–max objective function, so that G learns to
generate a survival time (predicted disease progression) that is close
or equal to the observed survival time (observed disease progression).
Total severity score for crazy paving and consolidation (CPC)We evaluated the performance of pix2surv in the prediction of
COVID-19 progression in comparison with an existing COVID-19
progression predictor of the ‘‘total severity score for crazy paving and
consolidation’’ (CPC) [2]. The CPC for a patient was assessed by a
pulmonologist with over 20-year experience as the sum extent of
crazy paving and consolidation in the chest CT images of the patient
based on the ‘‘total severity score’’ criteria, where the sum involve-
ment of the five lung lobes is taken as the total lung score (value
range: 0–20).
EvaluationAs metrics of the prediction performance, we used the concordance
index (C-index), as well as the relative absolute error (RAE) that is
defined by Ri |tiest - ti|/ti, where ti
est is the predicted survival time and
ti is the observed survival time for patient i. A patient-based bootstrap
method with 100 replications was used to obtain an unbiased estimate
of the C-index and RAE, and they were compared with those of the
CPC using a two-sided unpaired t test.
We also evaluated the stratification of the patients into low- and
high-risk groups by generating Kaplan–Meier survival curves based
on the predicted survival times. The log-rank test was used to evaluate
the difference between the survival curves of the risk groups.Results
Our experimental results show that the C-index values (larger is
better) obtained from the CPC and pix2surv were 62.1% [95% con-
fidence interval (CI): 61.3, 63.0] and 82.5% [95% CI: 81.5, 83.5],
respectively. The RAE values (smaller is better) obtained from the
CPC and pix2surv were 49.9% [95% CI: 49.3, 50.5] and 26.3% [95%
CI: 25.5, 27.0], respectively. These results indicate that the prediction
performance of pix2surv is significantly higher than that of the CPC
(p\ 0.0001), and that its prediction error is significantly lower than
that of the CPC (p\ 0.0001).
Figure 2 shows the Kaplan–Meier survival curves of the COVID-
19 patients stratified into low- and high-risk patient groups based on
the survival times predicted by (a) the CPC and (b) pix2surv. Both
visual assessment and the P-values from the log-rank test indicate that
the separation between the two curves is larger with pix2surv than
with CPC, indicating that pix2surv is more effective than CPC in the
stratification of the progression risk of COVID-19 patients.Conclusion
We developed a novel survival prediction model, pix2surv, which
directly predicts disease progression from patient’’s chest CT images.
We demonstrated that pix2surv outperforms the CPC in predicting the
disease progression in patients with COVID-19, indicating that
pix2surv can be an effective predictor of the COVID-19 progression.
References
[1] Chapfuwa P, Tao C, Li C, Page C, Goldstein B, Carin L, Henao
R (2018) Adversarial time-to-event modeling. Proceedings of
the 35th International Conference on Machine Learning 2018,
734–743.
[2] Lyu P, Liu X, Zhang R, Shi L, Gao J (2020) The performance of
chest CT in evaluating the clinical severity of COVID-19
pneumonia: identifying critical cases based on CT characteris-
tics. Investigative Radiology 55:412–421.
Leukoplakia lesion classification in Larynx contact
endoscopy—narrow band imaging: preliminary results
of a manual versus an automatic approach
N. Esmaeili1,2, A. Illanes1, A. Boese1, N. Davaris3, C. Arens3, N.
Navab2, M. Friebe1,4
1Otto-von-Guericke University, Medical Faculty, INKA—Innovation
Laboratory for Image Guided Therapy, Magdeburg, Germany2Technical University Munich, Chair for Computer Aided Medical
Procedures and Augmented Reality, Munich, Germany 3Magdeburg
University Hospital, Department of Otorhinolaryngology, Head
and Neck Surgery, Magdeburg, Germany 4IDTM GmbH,
Recklinghausen, Germany
Keywords Leukoplakia, Contact Endoscopy, Narrow Band Imaging,
Classification
Purpose
Laryngeal leukoplakia is a clinical term, describing the presence of a
white plaque of the vocal fold. Laryngeal lesions with benign
leukoplakia can remain stable for months or years; however, some of
these lesions will eventually undergo malignant transformation.
Contact Endoscopy (CE) in combination with Narrow-Band Imaging
(NBI)—as a minimally invasive optical diagnostic imaging proce-
dure—can improve the evaluation of these types of lesions by
visualizing the microvascular changes in the area surrounding the
leukoplakia [1]. In clinical practice, diagnosis of benign and malig-
nant leukoplakia lesions based on the vascular patterns and other
endoscopic features is a subjective process resulting in invasive sur-
gical biopsy and subsequent histological examination. The main
objective of this work is to evaluate the potential of an automatic
machine learning-based approach for the classification of CE-NBI
images of vascular patterns around leukoplakia into benign and
malignant; and then, to compare the results with the multi-observer
manual classification.Methods
Video scenes of 40 patients with histologically examined leukoplakia
lesions were acquired. An Evis Exera III Video System with a xenon
light source plus integrated NBI-filter (Olympus Medical Systems,
Hamburg, Germany) and a rigid 30-degree contact endoscope (Karl
Storz, Tuttlingen, Germany) was used. 1998 high-resolution CE-NBI
images with unique vascular patterns were manually extracted from
these videos. The images were labeled into benign and malignant
groups based on histological diagnosis according to the World Health
Organization (WHO) classification.
Two image subsets were created from the CE-NBI dataset. The
Subset I included a series of four to five randomly selected CE-NBI
images of each patient with a total of 199 images. Subset II included
1799 images and was used as the training set in the automatic
approach. The Subset I was evaluated by the otolaryngologists in the
manual approach and then used as the testing set for the automatic
approach.
Fig. 2 Kaplan-Meier survival curves of the COVID-19 patients
stratified into a low-risk patient group (gray color) and a high-risk
patient group (black color) based on a the CPC and b pix2surv. The
shaded areas represent the 95% confidence intervals of the survival
curves
Int J CARS (2021) 16 (Suppl 1):S1–S119 S73
123

In the manual approach, two experienced otolaryngologists visu-
ally evaluated the CE-NBI images of Subset I. They were blinded to
the histologic diagnosis and independently classified the lesions into
benign and malignant based on the vascular patterns. Malignant
labeled lesions with malignant histopathology were considered true
positives for the calculation of sensitivity and specificity.
The method presented in [2] was used to perform the automatic
classification. The algorithm has been tested on several CE-NBI
datasets for the classification of laryngeal lesions and histopatholo-
gies. It consists of a pre-processing step involving vessel
enhancement and segmentation. A feature extraction step was then
applied to extract 24 geometrical features based on the consistency of
gradient direction and the curvature level. The supervised classifica-
tion step was conducted using the Polynomial Support Vector
Machine (SVM) and k-Nearest Neighbor (kNN). Subset II was used
for the hyperparameter tuning process with a grid search method and
fivefold cross-validation. In the automatic approach, Subset I and
Subset II were used as the testing and training sets, respectively. Each
classifier was trained using the images’’ labels and feature vectors of
the CE-NBI images of the training set. For the testing, the feature
vectors computed from the CE-NBI images of the testing set were fed
into the predictive model of each classifier, and then the expected
labels were collected. This training and testing set strategy was used
to be able to compare the results of manual and automatic classifi-
cations. The sensitivity and specificity were calculated from a
confusion matrix for each classification.Results
Table 1 presents the results of the automatic and manual classification
in CE-NBI images of leukoplakia lesions. The mean specificity of
0.875 in manual classification can be explained by the difficulty to
visually distinguish benign leukoplakia lesions from malignant ones
based on the vascular pattern around the lesion. This issue happens
due to the presence of similar microvascular structures in some
benign and malignant leukoplakia lesions. Figure 1 illustrates the
qualitative performance of the automatic approach. Two presented
indicators (Histogram of Gradient Direction and Curvature) show
different behaviors on CE-NBI images of benign and malignant
leukoplakia lesions. Furthermore, the automatic classification showed
a better performance than manual classification with a sensitivity of 1
by both classifiers. The sensitivity value of 1 means that all the CE-
NBI images of malignant leukoplakia lesions were correctly classified
by the predictive model of two classifiers. These results emphasize the
potential of the automatic approach to solving the problem of mis-
classification of laryngeal leukoplakia lesions based on the evaluation
of vascular patterns around the lesion.Conclusion
The results showed that the visual differentiation of vascular patterns
that indicate benign leukoplakia lesions from malignant ones can be
challenging for otolaryngologists in clinical practice. The automatic
algorithm demonstrated its ability in the classification of CE-NBI
images of leukoplakia lesions. We believe that the combination of the
geometrical features with machine learning classifiers has the
potential to provide a confident way for clinicians to make the final
decision about the dignity of the laryngeal leukoplakia and prevent
unnecessary surgical biopsies.
References
[1] Ni X.G, Zhu J.Q, Zhang Q.Q, Zhang B.G, Wang G.Q (2019).
Diagnosis of Vocal Cord Leukoplakia: The Role of a Novel
Narrow Band Imaging Endoscopic Classification. The Laryn-
goscope 129(2): 429–434.
[2] Esmaeili N, Illanes A, Boese A, Davaris N, Arens C, Friebe M
(2019). Novel Automated Vessel Pattern Characterization of
Larynx Contact Endoscopic Video Images. International Journal
of Computer Assisted Radiology and Surgery 14(10):
1751–1761.
Experimental evaluation of loss functions in YOLO-v3
training for the perforation detection and localization
in colonoscopic videos
K. Jiang1, H. Itoh1, M. Oda2, T. Okumura3, Y. Mori3, M. Misawa3, T.
Hayashi3, S. E. Kudo3, K. Mori1,4,5
1Nagoya University, Graduate School of Informatics, Nagoya, Japan2Nagoya University, Information Strategy Office, Information
and Communications, Nagoya, Japan 3Showa University Northern
Yokohama Hospital, Digestive Disease Center, Yokohama, Japan4Nagoya University, Information Technology Center, Nagoya, Japan5National Institute of Informatics, Research Center for Medical
Bigdata, Tokyo, Japan
Keywords Deep learning, YOLO-v3, Colonoscopic video, Colon-
perform detection
Purpose
Endoscopic Submucosal Dissection (ESD) surgery [1] is a minimally
invasive treatment for early gastric cancer. In ESD, physicians
directly remove the mucosa around the lesion under internal endo-
scopy by using flush knives. However, the flush knife may
accidentally pierce the colonic wall and generate a perforation on it. If
there is a perforation, a patient needs emergency open surgery, since
perforation can easily cause peritonitis. Our research purpose is to
construct a Computer-Aided Diagnosis (CAD) system to support ESD
surgery [1]. To support physicians in ESD surgery, the final goal is the
prevention of perforations in ESD. At the current stage, image-based
perforation detection is very challenging. Thus, we tackle with
detection and localization of perforations in colonoscopic videos. We
believe the automatic perforation-detection function is useful for the
analysis of ESD videos for the development of a CAD system.
Table 1 Classification results of manual versus automatic approach
for CE-NBI images
Manual classification Automatic classification
SVM kNN
Sensitivity 0.958 1 1
Specificity 0.875 0.872 0.897
Fig. 1 Behavior of two indicators for CE-NBI images of vascular
patterns around benign and malignant leukoplakia lesions
S74 Int J CARS (2021) 16 (Suppl 1):S1–S119
123

In our previous research, we have used You Only Look Once
(YOLO-v3) to detect and localize perforations [2]. Our experimental
results indicated a trained YOLO-v3 can perform high perforation
detection and localization accuracy. However, the sensitivity of
detection results always stays at a low level. The low sensitivity
problem illustrates that overlooking of perforation happed by a
trained YOLO-v3. Purpose of this work is development of new loss
functions for the training of YOLO-v3 for perforations detection and
localization with high detection sensitivity.Methods
In our previous work, we have constructed a perforation detection and
localization model by training an original YOLO-v3 with our dataset
[2]. For each training image, YOLO-v3 predicts a probability and a
region for every detected perforation, as detection and localization
tasks, respectively. YOLO-v3 predicts Intersection over Union (IoU)
between a predicted region and a ground truth region. By multiplicate
an estimated probability and IoU, YOLO-v3 outputs a score for each
box. For the training of YOLO-v3, the original loss function of YOLO-
v3 consists of object and box losses. These two losses evaluate mean
square error (MSE) between true class labels and scores, and error of
location of bounding boxes between prediction and true boxes.
To improve detection sensitivity, we introduce two object losses.
One is the cross-entropy (CE) loss, which evaluates the cross-entropy
error between scores and true class labels. The other is the softmax
loss, which evaluates the cross-entropy error between the true class
labels and normalized scores, where we input scores to a softmax
function. By combining one of the CE and the softmax losses with the
original box loss, we have two loss functions for YOLO-v3 training.
To compare with the previous method, we use the original object and
box losses as loss function to train a YOLO-v3, too. We experi-
mentally evaluate the detection and localization performances of the
proposed methods with several evaluation terms.Results
We used 1814 and 385 images for model training and validation,
respectively. For evaluation of the detection and localization perfor-
mance, we collected 22,598 and 150 images, respectively. All detail
settings of the constructed model are the same as the original YOLO-
v3. For the training process, we set the mini-batch size to be 64 to
train all models for 300 epochs on NVIDIA Tesla V100 PCIe 32 GB
with CUDA 10.0 and used Adam as an optimizer function.
For detection performance evaluation, we introduced the accuracy,
recall, and Receiver Operating Characteristic (ROC) curve. Figure 1
shows the ROC curve of three trained models, respectively. For
localization performance evaluation, we introduced the mean Average
Precision (mAP) score. We set the localization thresholds to be 0.6.
We defined a true positive box when the IoU of the box is larger than
0.6. Table 1 shows accuracy, recall, Area Under Curve (AUC) score,
and mAP score of three trained models. Table 1 illustrates the pro-
posed method did not provide a higher mAP score than the original
YOLO-v3. This phenomenon is due to the loss function is the com-
bination of box and object losses, change of object loss also affects
the backpropagation of the localization part.Conclusion
This work experimentally evaluated two loss functions in YOLO-v3
for the training of perforation detection and localization in colono-
scopic videos. The constructed model trained by the box loss plus CE
loss achieved 0.881 accuracy, 0.631 recall, 0.863 AUC, and 0.732
mAP in detection and localization for the limited-size samples.
Compare with the MSE and softmax losses, the CE loss has larger
output when misclassification happened, which is better for opti-
mization of the detection part in YOLO-v3. To acquire higher
localization accuracy, we will try to modify weights of two losses in
the loss function and looking forward to implying new loss functions
for YOLO-v3 in the future. Parts of this research were supported by
MEXT/JSPS KAKENHI (26108006, 17H00867, 17K20099), the
JSPS Bilateral International Collaboration Grants, the AMED
(19hs0110006h0003), and the Hori Sciences & Arts Foundation.
References
[1] Saito Y, Uraoka T, Yamaguchi Y, Hotta k, Sakamoto N, Ike-
matsu H, Fukuzawa M, Kobayashi N, Nasu J, Michida T,
Yoshida S, Ikehara H, Otake Y, Nakajima T, Matsuda T, Saito D
(2010) A prospective, multicenter study of 1111 colorectal
endoscopic submucosal dissections (with video), Gastrointesti-
nal Endoscopy 2010, 72(6):1217–1225
[2] Kai J, Itoh H, Oda M, Okumura Y, Mori Y, Misawa M, Hayashi
T, Kudo S, Mori K (2020) Preliminary Study of Perforation
Detection and Localization for Colonoscopy Video. Proceedings
of JAMIT Annual Meeting 2020, 2020:142–147
New computer-aided detection schemes to detect breast
cancer in two-dimensional synthesized mammograms
and full-field digital mammograms
M. Tan1,2, M. Al-Shabi1, W. Y. Chan3, L. Thomas3, K. H. Ng3
1Monash University Malaysia, Electrical and Computer Systems
Engineering Discipline, School of Engineering, Subang Jaya,
Selangor, Malaysia 2University of Oklahoma, School of Electrical
and Computer Engineering, Norman, United States 3University
of Malaya, Department of Biomedical Imaging and University
of Malaya Research Imaging Centre, Faculty of Medicine, Kuala
Lumpur, Malaysia
Keywords Mammography, Synthesized mammography, Structural
similarity, Breast density
Fig. 1 ROC curve of three trained models
Table 1 Qualitative evaluation of detection and localization
performances
Loss functions Accuracy Recall AUC mAP
Box loss ? MSE 0.835 0.458 0.834 0.746
Box loss ? softmax loss 0.866 0.555 0.853 0.698
Box loss ? CE 0.881 0.631 0.863 0.732
Int J CARS (2021) 16 (Suppl 1):S1–S119 S75
123

Purpose
Breast cancer screening with two-dimensional (2D) full-field digital
mammography (FFDM) is the imaging modality that is the gold
standard currently used in many countries to reduce cancer mortality
in women. In 2011, digital breast tomosynthesis (DBT) was approved
by the FDA to be used with FFDM to screen women for breast cancer.
However, this leads to double radiation exposure in women.
Thus, Hologic Inc. obtained FDA approval to produce 2D syn-
thesized mammograms (2DSMs) from DBT data, called ‘‘C-view’’
images. If 2DSM images can be used in place of FFDM in standard
screening procedure, this eliminates the need for exposing women to
double radiation exposure.
However, the question remains whether 2DSMs are equivalent in
diagnostic quality to replace FFDMs. Thus, many studies were con-
ducted to examine the use of 2DSM in conjunction with DBT over
conventional FFDM images, but almost all of them were subjective
observer studies [1].
This study compares the diagnostic quality of 2DSMs with
FFDMs using a different objective based approach by computing
structural similarity measures and feature correlations between the
two modalities. We also develop and compare two new computer-
aided detection (CAD) schemes based on global features computed on
2DSM and FFDM, which to the best of our knowledge is the first
study of its kind.Methods
We studied 407 women subjected to 2D FFDM and DBT examination
for screening or diagnostic purposes at our institution from September
2014 to February 2016. Thus, 3216 craniocaudal (CC) and medio-
lateral oblique (MLO) mammograms were analyzed altogether.
We calculated 152 structural similarity, texture and mammo-
graphic density based features previously used to predict breast
cancer risk [2] on all mammograms. We included/computed boxplots
to analyze the interquartile ranges/variations of the structural simi-
larity features from their median values.
To compare the performance of 2DSM and FFDM for developing
two cancer detection schemes based on global features computed on
the whole breast region, we computed 112 texture and mammo-
graphic density features, and trained and examined different
classifiers on them.
We compared the performances of the linear discriminant analysis
(LDA), logistic regression, and bagged decision trees classifiers. To
prevent ‘‘overfitting’’ of the classifiers on the high-dimensionality
features, we applied stepwise regression feature selection to select the
‘‘relevant’’ features in a leave-one-case-out (LOCO) cross-validation
scheme.
To compare the performances of the two global detection models,
we computed the area under a receiver operating characteristic (ROC)
curve (AUC). Using all classifier-generated detection scores, we
computed AUC and 95% confidence intervals (CIs) using a maximum
likelihood data analysis based ROC curve fitting program (ROCKIT
http://www.radiology.uchicago.edu/krl/). We also evaluated statisti-
cally significant differences at the 5% significance level using
DeLong’’s test to compare the classifier performances between 2DSM
and FFDM.Results
Figure 1 displays the boxplots of the highest structural similarity
features computed in our study. It can be observed that the structural
similarity feature of the CC image had the highest median, namely
CB-CW-SSIM of the Weber Local Descriptor (WLD) differential
excitation feature computed at scale s = 24. The CC image had the
highest median, namely 0.92 for CC1; MLO1 without the pectoral
muscle had a very low median, namely 0.797. MLOpect1 with the
pectoral muscle, had a higher median, namely 0.90, but it was still
less than CC1. The results show that CC images were the most similar
between 2DSM and FFDM modalities and coarse structures computed
at a coarse scale (i.e., s = 24) are similar between both modalities.
Table 1 tabulates the AUC values and 95% CIs of all 3 classifiers
that we analyzed in the LOCO cross-validation scheme. We observe
that all 3 classifiers trained on 2DSM outperformed the corresponding
classifiers trained on FFDM. The best-performing classifier was
bagged decision trees. The AUC values of all corresponding classi-
fiers achieved for FFDM and 2DSM were not significantly different
using DeLong’’s test at the 5% significance level.Conclusion
This study presents a comprehensive objective evaluation of simi-
larity between 2DSM and FFDM images, with results indicating that
coarse structures are similar between the two images. The perfor-
mance of global mammographic image feature-based cancer detection
schemes trained on 2DSM images outperformed corresponding
schemes trained on FFDM images. Further investigation is required to
examine whether DBT can replace FFDM as a standalone technique,
negating the need for women to undergo mammography twice,
especially for the development of automated objective-based
methods.
Table 1 Computed AUC values and corresponding 95% CIs when
applying the classifiers to FFDM and 2DSM image sets using a
LOCO cross-validation method
Image
type
Classifier AUC (SE) 95% CI P-value computed
from DeLong’’s
test
2DSM Bagged
decision trees
0.878 (0.034) [0.799–0.933] 0.103
FFDM Bagged
decision trees
0.756 (0.052) [0.643–0.846]
2DSM LDA 0.737 (0.059) [0.611–0.838] 0.382
FFDM LDA 0.710 (0.058) [0.587–0.813]
2DSM Logistic
regression
0.789 (0.045) [0.689–0.866] 0.265
FFDM Logistic
regression
0.721 (0.057) [0.600–0.821]
Fig. 1 Boxplots of the highest structural similarity feature values
computed in our study. CC1, MLO1 and MLOpect1 correspond to
CB-CW-SSIM WLD differential excitation (s = 24) computed on the
CC, MLO without pectoral muscle, and MLO with pectoral muscle
view images, respectively
S76 Int J CARS (2021) 16 (Suppl 1):S1–S119
123

References
[1] Hofvind S, Hovda T, Holen AS, Lee CI, Albertsen J, Bjorndal
H, Brandal SHB, Gullien R, Lomo J, Park D, Romundstad L,
Suhrke P, Vigeland E, Skaane P (2018) Digital Breast
Tomosynthesis and Synthetic 2D Mammography versus Digital
Mammography: Evaluation in a Population-based Screening
Program. Radiology 287 (3):787–794. https://doi.org/10.1148/
radiol.2018171361
[2] Tan M, Zheng B, Leader JK, Gur D (2016) Association between
Changes in Mammographic Image Features and Risk for Near-
term Breast Cancer Development. IEEE Trans Med Imaging 35
(7):1719–1728
Malignant tumor detection on screening breast MRI
with deep learning
Z. L. Tse1, D. R. Chen2, H. K. Wu3, Y. L. Huang1
1Tunghai University, Department of Computer Science, Taichung,
Taiwan 2Changhua Christian Hospital, Comprehensive Breast Cancer
Center, Changhua, Taiwan 3Changhua Christian Hospital,
Department of Medical Imaging, Changhua, Taiwan
Keywords Breast cancer, Deep learning, Breast magnetic resonance
image, Malignant tumor detection
Purpose
Breast magnetic resonance imaging (MRI) has many advantages such
as non-invasive, no radiation damage and multi-view section. Breast
MRI is often used in women who already have been diagnosed with
breast cancer, to help measure the size of the cancer and look for other
tumors in the breast. MRI uses radio waves and strong magnets to
make detailed three-dimensional (3D) images of the breast tissue after
contrast agent injection. Breast MRI offers valuable information
about many breast conditions which are unable to identify by other
imaging modalities [1]. Hence, MRI performs to monitor the response
of the neo-adjuvant chemotherapy which is the administration of
therapeutic agents prior to surgery. The shape and contour of the
malignant tumor would be used as a significant information to eval-
uate the effect of the neo-adjuvant chemotherapy or breast-conserving
surgery. The aim of this study is to develop an accurate tumor
detection/screening scheme on 3D breast MRI by using deep learning
techniques. The detection procedure identified the malignant tumor
region using region-based convolutional neural networks (R-CNN)
and image processing techniques.Methods
– Data acquisitionThis study utilized the breast MRI image database from 30
patients. MRI was performed with the patient in the prone posi-
tion. Examinations were performed with a 3.0-T commercially
available system (Verio�; Siemens AG, Erlangen, Germany) and
use of a dedicated16 Channel breast coil. Imaging sequences
included a localizing sequence, an axial tse_T1 weighted (3 mm),
tse_T2_tirm, pre, during, and post-Gd 3D-FSPGR (1 mm) with fat
saturation images, before and five times after rapid bolus injection
of 0.1 mmol/L gadobenate dimeglumine (Multihence�; Bracco,
s.p.a., Milano, Italy) per kilogram of body weight at a rate of
2 ml/s; followed by a saline flush, acquired at 60 s intervals were
obtained. All obtained images were stored on the hard disk and
transferred to a personal computer using a DICOM (Digital
Imaging and Communications in Medicine) connection for image
analysis.
– Malignant tumor detection with deep-learningMask R-CNN is a two-stage framework [2]: the first stage scans
the image output feature map and output through region proposal
network (RPN) generates proposals; the second stage classifies
proposals and generates bounding boxes and masks. In this study,
the mask R-CNN model utilized the ResNet (deep residual
network) and FPN (feature pyramid networks) backbone with
standard convolution and fully connected heads for mask and box
prediction, respectively. This model would obtain the best speed/
accuracy trade-off. Generally speaking, we believe that shallower
features mainly provide detailed information, while deeper infor-
mation provides semantic information. The deep-learning
techniques have the opportunity as a robust automatic
scheme for identifying malignant tumors on breast MRI without
human intervention.
In the proposed method, the mask R-CNN model identified the region
of malignant tumors from transverse, coronal and sagittal planes. The
3D regions generated from the transverse, coronal and sagittal planes
denoted RT, RC and RS, respectively. Then, this study developed the
intersection version of the 3D regions from the three views. RAND
denoted the contour of region that occurred simultaneously (such as
AND operation) from RT, RC and RS. RAND was performed as the
final result of malignant tumor regions.Results
This study totally used 30 breast MRI with malignant tumors
(pathology-proven cases) to test the accuracy of the proposed method.
The k-fold cross-validation method was used to estimate the perfor-
mance. The k is selected as 3 in the simulations and each group has 10
breast MRI. The sensitivity of the proposed detection method for
malignant tumors is 100.0% and the positive predictive value (PPV) is
71.0%. Figures 1 illustrates the identified results of RT, RC and RS
from a sample case. The 3D view of the final result RAND is shown
in Fig. 2. Moreover, the proposed method identified tumors from the
three 2D planes which could save much of the time required to detect/
screen malignant tumor on 3D breast MRI.Conclusion
This study presented an efficient method for automatically detecting
malignant tumors in breast MRI. The proposed method applied the
deep-learning model to automatic produce the region of malignant
tumors from transverse, coronal and sagittal planes. The experimental
results revealed that the proposed method can practically identify
malignant tumor from breast MRI images. Results of this study could
be utilized to 3D contouring procedure for malignant tumor and then
expected to be helpful for surgeon in evaluating the effect of neo-
adjuvant chemotherapy or breast-conserving surgery.Acknowledgements
This work was supported by the Ministry of Science and Technology,
Taiwan, Republic of China, under Grant MOST 109-2221-E-029-024.
Fig. 1 The 3D regions obtained from a the transverse, b the sagittal
and c the coronal planes
Int J CARS (2021) 16 (Suppl 1):S1–S119 S77
123

References
[1] Cho N, Im SA, Park IA, Lee KH, Li M, Han W, Noh DY, Moon
WK (2014) Breast cancer: early prediction of response to
neoadjuvant chemotherapy using parametric response maps for
MR imaging. Radiology, vol. 272, no. 2, pp. 385–3966.
[2] He K, Gkioxari G, Dollar P, Girshick R (2020) Mask R-CNN.
IEEE Trans Pattern Anal Mach Intell, vol. 42, no. 2,
pp. 386–397.
Bayesian approach for hotspot extraction from a bone
scintigram
M. Hara1, A. Saito1, J. Kawabe2, S. Higashiyama2, H. Daisaki3, A.
Shimizu1
1Tokyo University of Agriculture and Technology, Institute
of Engineering, Koganei, Tokyo, Japan 2Osaka City University,
Nuclear Medicine, Osaka, Japan 3Gunma prefectural college of health
sciences, Nuclear Medicine, Maebashi, Japan
Keywords Bone scintigram, Deep learning, Hotspots, Probabilistic
atlas
Purpose
Bone scintigraphy is useful for the diagnosis of bone metastases in
prostate or breast cancers. The bone scan index (BSI) is a popular
index for quantitatively estimating the stage of bone metastasis that
requires bone segmentation and hotspot extraction. Accurate extrac-
tion of hotspots caused by bone metastatic lesions is a difficult task
because of the high similarity between hotspots of bone metastasis
and hotspots of non-malignant lesions, such as physiological
accumulation.
Computer-aided diagnosis systems [1, 2] have been developed to
compute the BSI. These systems, however, often under-extract a part
of the bone metastatic lesion or over-extract a part of non-malignant
lesions, which are often observed at specific locations over multiple
cases. Prior knowledge of frequent sites for hotspots would be useful
for increasing the processing accuracy.
This paper presents a Bayesian approach for deep-network-based
hotspot extraction reported in [2] to exploit the occurrence probability
of hotspots caused by bone metastasis. We propose to combine the
output of the deep network with a conditional probabilistic atlas of
hotspots given a skeleton, because frequent sites of hotspots caused
by bone metastasis depend on the type of skeleton. We show the
results of applying the proposed method to 246 cases and demonstrate
its effecntiveness.Methods
The anterior and posterior bone scintigrams constitute the input. They
are normalized in terms of spatial coordinates and gray values, and are
forwarded to two BtrflyNets to perform skeleton and hotspot
segmentation. The conditional probability P(Bl|Ak) of hotspot Bl of
class l given skeleton segmentation Ak of the kth bone is calculated as
follows:
P(Bl|Ak)=
PNn = 0(Ank \ Bnl)/PN
n=0(Ank)
(PN
n=0(Ank) C 30) (1)
0 (otherwise)
where n is the case index, and N is the total number of training cases.
The probability is set to 0 when the number of extracted labels is less
than 30, which implies statistical unreliability.
Subsequently, the conditional probability is combined with the
output of BtrflyNet for hotspot extraction through the following
expression:
x’H = xH ? wxH P(Bl|Ak) (2)
where xH is the output matrix of BtrflyNet, w is a coefficient, and the
operator denotes a Hadamard product of two matrices.
During the training process, pre-training of two BtrflyNets is
carried out by independently minimizing the dice loss of skeletons
and that of hotspots. Then, fine tuning of the entire network is per-
formed by minimizing the loss functions as follows:where is the
output matrix of BtrflyNet, is a coefficient, and the operator denotes a
Hadamard product of two matrices.
Loss = Lskeleton (xS) ? L0hotspot (G(x0
H,xS)) (3)
where Lskeleton is the dice loss of the skeleton, L’hotspot is the L1 loss
with weight k for the integrated malignant hotspot and the dice loss
for the non-malignant hotspot, and G is a function to evaluate the
inconsistency between bone segmentation and hotspot extraction.Results
Anterior and posterior bone scintigrams of 246 patients were used to
assess the proposed method. The original image size was
1024 9 512, and it was cropped to 576 9 256 after preprocessing.
The number of skeleton labels was 12 for the anterior images and 11
for the posterior images. Three-fold cross-validation was used in
which 164 cases were employed for training, 41 cases were employed
for validation, and 41 cases were employed for testing. The maximum
number of training iterations was 4500, and the mini-batch size was 6.
The Adam parameters were set as a = 0.0005, b1 = 0.9, and
b2 = 0.999, and the learning rate was reduced to 1/10 every 100
epochs. The weights of the loss function, k and w, were set to 0.01
and 1, respectively.
This pilot study focused on hotspots in the pelvic area of posterior
images to prove the aforementioned concept. The average dice score
(DS) without the proposed conditional probabilistic atlas was 0.633,
whereas that with the conditional probabilistic atlas was 0.644. The
statistical difference between the two distributions of DSs was found
to be significant (p\ 0.005).
Figure 1 presents an example of cases in which false negatives of
hotspots caused by bone metastasis on the pelvis were reduced when
using the proposed atlas. The DS of malignant hotspots was increased
by 0.643 compared to that without prior knowledge. The rightmost
figure shows the conditional probabilistic atlas with the prediction of
Fig. 2 3D view of a original breast MRI and b the final identified
result
S78 Int J CARS (2021) 16 (Suppl 1):S1–S119
123

the malignant hotspot. Note that the hotspot was enhanced by the
proposed atlas, resulting in a reduction of false negatives and higher
DS.Conclusion
We propose a Bayesian approach for deep-network-based hotspot
extraction. A conditional probabilistic atlas of hotspots caused by
bone metastasis given skeleton segmentation was introduced prior to
the occurrence of hotspots. The effectiveness of the proposed method
was demonstrated using 246 cases in terms of the DS of hotspot
segmentation in the anterior pelvic area.Acknowledgements
This work was partly supported by MEXT/JSPS KAKENHI Grant
Number JP18H03255.
References
[1] Koizumi M, Miyaji N, Murata T, Motegi K, Miwa K, Koyama
M, Terauchi T, Wagatsuma K, Kawakami K, Richter J (2015)
Evaluation of a Revised Version of Computer-Assisted Diag-
nosis System, BONENAVI Version 2.1.7, for Bone Scintigraphy
in Cancer Patients, Ann Nucl Med 29:659–66
[2] Hara M, Saito A, Daisaki H, Higashiyama S, Kawabe J, Shimizu
A (2020) Simultaneous process of skeleton segmentation and
hot-spot extraction in a bone scintigram, International Journal of
Computer Assisted Radiology and Surgery, 15 (1):23–24
Self-supervised 3D-ResNet-GAN for electronic
cleansing in dual-energy CT colonography
R. Tachibana1,2, J. Nappi2, T. Hironaka2, H. Yoshida2
1National Institute of Technology, Oshima College, Suo-Oshima,
Japan 2Massachusetts General Hospital/Harvard Medical School,
Imaging, Boston, United States
Keywords dual-energy CT colonography, electronic cleansing, gen-
erative adversarial network, residual block
Purpose
Early detection and removal of polyps can prevent the development of
colon cancer. CT colonography (CTC) provides a safe and accurate
method for examining the complete region of the colon, and it is
recommended by the American Cancer Society and the United States
Preventive Services Task Force as an option for colon cancer
screening. Electronic cleansing (EC) performs virtual subtraction of
residual materials from CTC images to enable radiologists and
computer-aided detection (CADe) systems to detect polyps that could
be submerged in the residual materials.
Previously, we developed a self-supervised 3D-ResNet-GAN EC
scheme that used residual blocks (ResBlocks) to enhance the per-
formance of EC based on partially self-generated training samples in
single-energy CTC (SE-CTC) [1]. The 3D-ResNet-GAN EC was
trained to transform an uncleansed CTC volume with tagged fecal
materials into a corresponding virtually cleansed image volume. It
was shown that the 3D-ResNet-GAN EC could be used with SE-CTC
images to generate higher quality EC images than those obtained by
our previous 3D-GAN EC scheme.
In this study, we extended the 3D-ResNet-GAN EC scheme to
dual-energy CTC (DE-CTC). We also evaluated the cleansing per-
formance of the scheme on an anthropomorphic phantom and on
clinical CTC cases in comparison with those of the previous 3D-GAN
EC scheme in DE-CTC [2].Methods
An anthropomorphic phantom (Phantom Laboratory, Salem, NY) that
had been designed to imitate a human colon in CT scans was filled
with 300 cc of simulated tagged fecal material, which was a mixture
of aqueous fiber (30 g of psyllium), ground foodstuff (10 g of cereal),
and non-ionic iodinated contrast agent (300 cc of Omnipaque iohexol,
GE Healthcare). The native (empty) and partially filled versions of the
phantom were scanned by use of a CT scanner (SOMATOM Defi-
nition Flash, Siemens Healthcare) with 0.6-mm slice thickness and
0.6-mm reconstruction interval at 140 kVp and 80 kVp energies for
acquiring the DE-CTC volumes. To simulate different concentrations
of fecal tagging, the phantom was partially filled by simulated fecal
materials with three contrast concentrations (20, 40, and 60 mg/ml).
Figure 1 shows the architecture of the generator network of our
3D-ResNet-GAN EC scheme. The 3D-ResNet-GAN model consists
of a generator network with ResBlocks and a discriminator network.
Given an uncleansed DE-CTC image pair, the generator network
learns to generate the corresponding EC image volume. The archi-
tecture of the generator network is based on a 3D-U-Net architecture
that has several matching down-/up-sampling convolution layers. The
generator has a ResBlock on each convolutional layer in the down-
sampling path and between the downsampling and upsampling paths.
We trained the 3D-ResNet-GAN EC scheme iteratively with a
self-supervised method that performs an initial training with a
supervised-training dataset followed by an adaptive iterative self-
training with a self-training dataset that is constructed from each new
input dataset [1]. Each dataset contained paired uncleansed and
cleansed 1283 voxels volumes of interest (VOIs) extracted from the
CT images. For the supervised-training dataset, we used 200 paired
VOIs from precisely matching lumen locations of the CTC scans of
the colon phantom acquired without and with 20 mg/ml and 60 mg/
ml contrast concentrations. For the self-training dataset, we used 100
paired VOIs from a new unseen input CTC volume, where the output
VOIs matching the input VOIs were obtained by the application of the
current 3D-ResNet-GAN EC.
Thus, the EC method works as follows. In the initial training, the
3D-ResNet-GAN is pre-trained with a supervised-training dataset.
After this initial pre-training, we test the pre-trained 3D-ResNet-GAN
model on VOIs extracted from the new unseen input case. This will
generate a self-training dataset with paired VOIs from the new input
Fig. 1 Schematic architecture of the generator network of the 3D-
ResNet-GAN EC with ResBlocks
Fig. 1 Examples of hotspot extraction with or without the proposed
conditional probabilistic atlas
Int J CARS (2021) 16 (Suppl 1):S1–S119 S79
123

case. After the second training, the self-training dataset is updated by
replacing the target EC VOIs with the 100 new output VOIs from the
3D-ResNet-GAN EC for the next step of the training.
For quantitative evaluation, we used the peak signal-to-noise ratio
(PSNR) to assess the quality between EC VOIs and the corresponding
VOIs of the native phantom. The 100 paired VOIs that were acquired
with 40 mg/ml contrast agent concentration were used as the test data.
To evaluate the effect of the ResBlocks and different numbers of
convolution layers, we compared the performance of the proposed
3D-ResNet-GAN EC scheme with that of our previous non-ResNet
3D-GAN-EC scheme based on DE-CTC datasets. The statistical
significance of the differences of PSNRs between the EC schemes
was compared by use of the paired t test with Bonferroni correction.Results
The image quality assessment was performed for the initial training
step and for the first three self-supervised training steps (Figure 1a).
The quality of the EC images progressively improved as the number
of training steps increased. The proposed self-supervised 3D-ResNet-
GAN EC scheme yielded a higher PSNR value than that of the self-
supervised non-ResNet 3D-GAN EC scheme, except for a version of
the EC scheme that was implemented with six down/up-sampling
layers. The performance differences were statistically significant
between the 3D-ResNet-GAN and the 3D-GAN EC schemes
(p\ 10-6), except for those with six down/up-sampling layers where
the performance differences were not significant in any training step.
Visual assessment of the results of clinical cases indicated that the
proposed self-supervised 3D-ResNet-GAN EC scheme with six
down-/up-sampling layers improves the image quality in comparison
with those obtained by using our previous self-supervised 3D-GAN
EC scheme (Figure 2b).Conclusion
We developed a self-supervised 3D-ResNet-GAN scheme that uses
ResBlocks to enhance the performance of EC based on partially self-
generated training samples and DE-CTC features. Our preliminary
results indicate that the scheme can generate EC images of higher
quality than those obtained by the 3D-GAN EC scheme without
ResBlocks. Thus, the proposed self-supervised 3D-ResNet-GAN
scheme is expected to provide a high quality of EC in DE-CTC.Acknowledgements
This was study was supported partly by the NIH/NIBIB/NCI grants of
R21EB024025, R01EB023942, and R01CA212382.
References
[1] Tachibana R, Nappi JJ, Hironaka T, Yoshida H (2020) 3D-
ResNet-GAN for improved electronic cleansing in CT
colonography. International Journal of Computer Assisted
Radiology and Surgery 15(Suppl 1):S213–S214
[2] Tachibana R, Nappi JJ, Hironaka T, Yoshida H (2020) Self-
supervised generative adversarial network for electronic cleans-
ing in dual-energy CT colonography. Proc. SPIE Medical
Imaging 11318:113181E.
Artificial intelligence coronary calcium scoring in low
dose chest CT—Ready to go?
A. Luger1, C. Schwabl1, L. Gruber1, G. Feuchtner1, T. Sonnweber2, S.
Sahanic2, A. Pizzini2, A. Boehm2, J. Loffler-Ragg2, I. Tancevski2, M.
Joannidis2, R. Kirchmair2, E. Woll3, G. Weiss2, E. Gizewski1, G.
Widmann1
1Innsbruck Medical University, Radiology Department, Innsbruck,
Austria 2Innsbruck Medical University, Internal Medicine, Innsbruck,
Austria 3Zams Hospital, Internal Medicine, Zams, Austria
Keywords Coronary artery calcium score, Artificial intelligence,
computer-aided diagnosis, low dose chest CT
Purpose
Low dose chest computed tomography (CT) is routinely performed
for various indications such as lung cancer screening, pneumonia
quantification and diagnosis of interstitial lung disease. It has been
shown that coronary artery calcium score (CACS) can be derived
from low dose, non-gated chest CTs as additional information about
patient cardiovascular risk. Software tools detect calcium deposits,
defined by a density above a threshold of 130 HU, while the radiol-
ogist manually assigns these calcium deposits to the coronary arteries,
sparing calcifications of other sources like bones, aortic calcified
plaques or valve calcifications. We tested an artificial intelligence
(AI) prototype software for detection and quantification of coronary
artery calcium volume and compared it to standard manual calcium
scoring.Methods
50 consecutive CT scans derived from the CovILD study (develop-
ment of interstitial lung disease (ILD) in patients with severe SARS-
CoV-2 infection) were used to perform CACS assisted by the soft-
ware package Syngo.via CT CaScoring (Siemens Healthineers,
Erlangen, Germany) as well as by a prototype artificial intelligence
network AI Rad Companion (Siemens Healthineers, Erlangen,
Germany).
CT scans in low-dose setting (100 kVp tube potential) were
acquired without ECG gating on a 128 slice multidetector CT hard-
ware with a 128 9 0.6 mm collimation, spiral pitch factor of 1.1 and
image reconstruction 3 mm slice width. Calcium scoring was per-
formed by two experienced radiologist and at the same time the data
set was send to the cloud based AI software. Correction of threshold
to 147 HU was applied due to the low dose CT with 100 kVp tube
potential. Calcium volume values were divided into four categories
(0–9, 10–99, 100–499,[ 500). Correlation and comparison of group
means were assessed with Kendall’’s tau and Wilcoxon sign rank test.
Reliability between AI and standard CACS categories was determined
by weighted kappa. A two-tailed p\ 0.05 was considered statistically
significant.Results
Standard calcium volume was significantly related to AI calcium
volume values, s = 0.909, 95% BA CI (0.828–0.965), p\ 0.001.
Mean averages values of calcium volume was significantly higher
Fig. 2 a Improvement of the image quality of EC by use of the
proposed self-supervised 3D-ResNet-GAN EC scheme in comparison
with the previous self-supervised 3D-GAN EC scheme, where N
indicates the number of down-/up- sampling layers. b Examples of the
application of EC to a clinical CTC case with a polyp submerged in
fluid. The white arrows on the 3D-GAN EC image indicate EC
artifacts
S80 Int J CARS (2021) 16 (Suppl 1):S1–S119
123

detected by AI (M = 144.9, SD = 334.5) than by standard scoring
(M = 129.2, SD = 316.3), T = 389.5, p\ 0.001.
Weighted kappa showed a very good reliability for the AI cate-
gories (j = 0.90), however, AI lead to a shift of five patients into
higher strata compared to standard CACS (10%).
Of all patients with no detectable calcium volume AI classified all
but one correctly as zero (95.2%). In this patient small valve calci-
fication adjacent to the coronary artery was misclassified. AI did not
detect calcium deposits in four patients (8%), which had a very low
calcium volume (M = 1.2, SD = 1.1).Conclusion
AI CACS can be routinely obtained from low dose non-gated chest
CTs and add value for patient risk stratification.
A computer-aided diagnosis system based on 3-D
attention-CNN architecture for tumor diagnosis
on automated breast ultrasound
R. F. Chang1,2, J. Zhang2, Y. S. Huang1
1National Taiwan University, Department of Computer Science
and Information Engineering, Taipei, Taiwan 2National Taiwan
University, Graduate Institute of Biomedical Electronics
and Bioinformatics, Taipei, Taiwan
Keywords Automated Breast Ultrasound, Computer-aided Diagnosis,
Convolution Neural Network, Attention Mechanism
Purpose
Automated breast ultrasound (ABUS) is a widely used screening
modality in detecting and diagnosing breast cancer. It could scan the
whole breast and provide the complete breast three-dimensional (3-D)
volume. It is a time-consuming task for a radiologist to diagnose
tumors by reviewing an ABUS image. Moreover, misjudgment exists
if the radiologist interprets cancer only with the information offered
by ABUS. Therefore, the computer-aided diagnosis (CADx) systems
developed with texture or morphology features are proposed to assist
the radiologist. Recently, convolutional neural networks (CNN),
which extract features automatically, have been widely used in
medical images, and the CNN-based CADx could achieve outstand-
ing performance. Hence, in the study, a CADx system developed
with3-D CNN architecture is proposed for ABUS tumor classification.Methods
The proposed CADx system for tumor diagnosis consists of the VOI
extraction, a 3-D tumor segmentation model, and a 3-D tumor clas-
sification model. The volumes of interest (VOIs) are defined by an
experienced radiologist and resized to fixed-size first in the VOI
extraction. Second, in the tumor segmentation, a 3-D U-Net ?? is
applied to the resized VOI to create the tumor mask. Finally, the VOI,
the enhanced VOI using the histogram equalization, and the corre-
sponding tumor mask are fed into the tumor classification model. Our
tumor classification model is constructed with different Inception
blocks. However, there are many redundant features also regarded as
useful features in the subsequent classification process. Hence, the
attention mechanism, the squeeze-and-excitation (SE) model, is
embedded in our classification model to select critical elements for
classifying the tumor as benign or malignant.Results
This study collected the used dataset from collected by InveniaTM
automated breast ultrasound system (Invenia ABUS, GE Healthcare).
An automatic linear broadband transducer obtains all ABUS volumes
with a covering area of 15.4�17�5 cm. Each ABUS volume is made of
330 serial 2-D images, and each 2-D image consists of
831 9 422pixels, and the distance between each slice is 0.5 mm. 396
patients (age 49.2 ± 10.3 years) with 444 pathology-proven tumors,
including 226 malignant and 218 benign lesions, are utilized in our
experiments. To estimate the system performance, three indices,
including accuracy, sensitivity, and specificity, are used to validate
our CADx system. Moreover, to ensure the robustness and reliability
of CADx, fivefold cross validation is performed in our system training
and testing. In our experiments, the proposed system could achieve
85.6% of accuracy, 85.0% of sensitivity, and 86.2% of specificity. In
conclusion, the results imply that our system can classify tumors as
malignant or benign.Conclusion
A CADx system composed of the VOI extraction, a 3-D tumor seg-
mentation, and a 3-D SE-Inception classification model is proposed
for tumor classification on ABUS volumes. First, in VOI extraction,
the VOIs are cropped by an experienced radiologist and resized into
fixed-size. Second, the tumor masks are outlined by a 3-D
U-net ?? model. Finally, VOIs and masks are fed into the 3-D SE-
Inception model to extract useful features for diagnosing tumors. The
proposed CADx system takes advantage of texture and morphology
for medical images, and the overall performance shows the proposed
CADx has a capability for tumor classification on ABUS volumes.
Developing a computer-aided diagnosis system by 3-D
SE-ResNeXt for lung nodule classification on low-dose
computed tomography
Y. S. Huang1, S. Z. Huang2, T. C. Lin1, R. F. Chang3,4
1National Taiwan University, Computer Science & Information
Engineering, Taipei, Taiwan 2National Taiwan University, Graduate
Institute of Networking and Multimedia, Taipei, Taiwan 3National
Taiwan University, Department of Computer Science and Information
Engineering, Taipei, Taiwan 4National Taiwan University, Graduate
Institute of Biomedical Electronics and Bioinformatics, Taipei,
Taiwan
Keywords Low-dose Computed Tomography, Computer-aided
Diagnosis, Convolution Neural Network, Squeeze-and-Excitation
Purpose
Lung cancer was with the highest mortality rate in the world. Low-
dose Computed Tomography (LDCT) is an essential tool for lung
cancer detection and diagnosis. It can provide a complete three-di-
mensional (3-D) chest image. Although the LDCT was a useful lung
examination modality, the different nodule decision rules and radi-
ologist’s experience would result in different diagnosis results.
Therefore, the computer-aided diagnosis (CADx) system was devel-
oped for assisting radiologist. In recent, designing a CADx system
based on the convolution neural network (CNN) in the medical image
has become a tendency toward cancer diagnosis due to the powerful
capability of automatic feature extraction and classification. Many
studies have proven that a CADx system with CNN could help
radiologists to make a preliminary diagnosis. Therefore, in this
research, a CADx system that used an advanced residual network,
ResNeXt block, as the backbone was proposed for lung nodule
diagnosis. Moreover, to prevent the ResNeXt block from generating
redundant features, a lightweight and attention mechanism module,
squeeze-and excitation (SE), was embedded in the ResNeXt block to
help focus on important features.Methods
In this research, the proposed CADx system for lung nodule diagnosis
consists of the VOI extraction and a 3-D attention ResNext nodule
classification model, which integrates ResNeXt block with attention
machine module. The volumes of interest (VOIs) are defined and
normalized into the range from - 1 to 1 first in the VOI extraction. In
the nodule classification model, the ResNeXt block inspired by the
ResNet block and the split-transform-merge strategy of InceptionNet
Int J CARS (2021) 16 (Suppl 1):S1–S119 S81
123

is built, and the SE module is embedded into the block for developing
the 3-D SE-ResNeXt classification model. The defined VOIs are then
delivered to the 3-D SE-ResNeXt model to determine nodule as
malignant or benign.Results
In this research, the materials were collected from the National Lung
Screening Trial (NLST). All participants have received three screen-
ings, including GE Healthcare, Philips Healthcare, Siemens
Healthcare, and Toshiba machine brands. The number slice of LDCT
volume was between 100 and 300, and the range of pixel spacing was
between 0.5 and 1, and the range of slice thickness was between 1 and 3.
The used dataset consists of 880 nodules, including 440 malignant and
440 benign. In malignant, there are 171 lesions smaller than 1 cm and
269 lesions larger than 1 cm, whereas there are 398 nodules smaller
than 1 cm and 42 nodules larger than 1 cm in benign. For system val-
idation, three performance indices, including accuracy, sensitivity,
specificity, and fivefold cross validation, are used to validate our CADx
system. In experiments, the proposed system’s accuracy, sensitivity,
and specificity are 84.7%, 83.6%, 85.7%. In conclusion, the results
indicate that the proposed system has the capability for discriminating
malignant nodules from benign ones.Conclusion
In this study, a CADx system made of the VOI extraction and the 3-D
CNN-based classification model is proposed for lung nodule classi-
fication in LDCT images. First, the VOIs are defined, and then the
VOIs are fed into the 3-D Att-ResNeXt for determining nodule types.
The proposed CADx system takes advantage of CNN for medical
images, and the overall performance of this study may be further
improved by using other CNN models.
Computer-aided diagnosis of X-ray thorax diseases
using deep convolutional neural network with graph
attention mechanism
Y. W. Lee1, S. K. Huang2, R. F. Chang1,2,3
1National Taiwan University, Department of Computer Science
and Information Engineering, Taipei City, Taiwan 2National Taiwan
University, Department or Graduate Institute of Networking
and Multimedia, Taipei City, Taiwan 3National Taiwan University,
Graduate Institute of Biomedical Electronics and Bioinformatics,
Taipei City, Taiwan
Keywords Chest X-ray, Thorax diseases, Computer-aided diagnosis,
Graph attention mechanism
Purpose
According to global statistical results for leading causes of life loss in
2017, chronic obstructive pulmonary disease (COPD) (including
emphysema) and lung cancer were the seventh and twelfth of the
leading causes, respectively. Clinical researches [1] indicate that early
detection and treatment could mitigate the mortality rate of COPD.
Hence, early detection and treatment are important for patients with
thorax disease. In the chest radiograph, the radiologic features are
useful to diagnose thorax diseases, and each thorax disease has dif-
ferent radiologic features. Some clinical researches indicate that with
the help of the computer-aided diagnosis (CAD) system, the diag-
nostic performance of junior radiologists could be improved. The
diagnosis performance of radiologists with the CAD system for
malignant lung nodules has better sensitivity and false-positive rate
[2]. Besides, the CAD system might detect some missed finding by
humans and reduce the reader-dependent problem between radiolo-
gists. Therefore, detecting thorax diseases with the CAD system is
useful for clinical. Taking the benefits of deep learning techniques,
the CAD system’s diagnosis performance could be almost similar to
radiologists and the related methods have been extended to employed
in different topics. In this study, we proposed a CAD system to
diagnose thorax diseases using chest X-ray images through the CNN
model and the graph neural network (GNN) model with the graph
attention mechanism.Methods
In this study, we proposed a CAP system for diagnosing thorax dis-
eases using chest X-ray images, which contains a feature extractor
and GNN with the graph attention mechanism, called CGAM (CNN
Model with graph attention mechanism). First, we employed the CNN
backbone (EfficientNet) model to extract the detailed image repre-
sentation information. Second, the GNN with the graph attention
mechanism was used to enhance the correlation between thorax dis-
eases. Finally, the CAD system predicts the diagnostic results and the
visualization results (gradient-weighted class activation mapping,
Grad-CAM). Figure 1 shows the overall flow chart of our proposed
X-ray thorax CAD system.Results
In this study, the open dataset (NIH Chest X-ray dataset) was
employed to diagnose thorax diseases in X-ray images, which con-
tained 112,120 frontal-view chest X-ray images, labels with 14
common thorax diseases. The data ratio for the training set, validation
set, and test set were 7:1:2, respectively. In this study, we used the
AUC (area under the receiver operating characteristic (ROC) curve)
score for evaluating model performance. In our model (CGAM-Ef-
ficientNet-B4) the AUC scores of atelectasis, cardiomegaly, effusion,
infiltration, mass, nodule, pneumonia, pneumothorax, consolidation,
edema, emphysema, fibrosis, pleural thickening, hernia, and average
were 0.7817, 0.8834, 0.8337, 0.7049, 0.8330, 0.7840, 0.7371, 0.8689,
0.7525, 0.8515, 0.9424, 0.8365, 0.7957, 0.9420, 0.8248, respectively.Conclusion
The chest X-ray is one of the most common imaging examinations in
clinical diagnosis, and chest X-ray images are useful to diagnose
different thorax diseases. In this study, we proposed a CNN model
combined with GNN and the graph attention mechanism to diagnose
thorax diseases using chest X-ray images. The experiment results show
convolution neural network models can effectively predict different
thorax diseases. In this study, we proposed a CAD system to diagnose
thorax diseases using chest X-ray images with clinical values.
References
[1] Csikesz NG, Gartman EJ (2014) New developments in the
assessment of COPD: early diagnosis is key. International
journal of chronic obstructive pulmonary disease, vol. 9,
pp. 277–286.
[2] Hwang EJ, Nam JG, Lim WH, Park SJ, Jeong YS, Kang JH,
Hong EK, Kim TM, Goo JM, Park S, Kim KH, Park CM (2019)
Deep Learning for Chest Radiograph Diagnosis in the Emer-
gency Department. Radiology, vol. 0, pp. 191225.
Fig. 1 The overall flow chart of our proposed X-ray thorax CAD
system
S82 Int J CARS (2021) 16 (Suppl 1):S1–S119
123

Poster Session
Int J CARS (2021) 16 (Suppl 1):S1–S119 S83
123

Can radiological technologists create training data for
automatically segmenting the mammary gland region in
non-dense breasts?
M. Yamamuro1, Y. Asai1, N. Hashimoto1, N. Yasuda1, Y. Ozaki2, S.
Nin3, K. Ishii3, T. Yamada4, M. Nemoto5, Y. Kimura6, H. Handa7, H.
Yoshida6, K. Abe7, M. Tada7, H. Habe7, T. Nagaoka6, Y. Lee8
1Kindai University Hospital, Radiology Center, Osaka-sayama, Japan2Kyoto Prefectural Police Headquarters, Research Institute
of Scientific Investigation, Kyoto, Japan 3Kindai University Faculty
of Medicine, Department of Radiology, Osaka-sayama, Japan 4Kindai
University, Division of Positron Emission Tomography, Osaka-
sayama, Japan 5Kindai University, Department of Biomedical
Engineering, Kinokawa, Japan 6Kindai University, Department
of Computational Systems Biology, Kinokawa, Japan 7Kindai
University, Department of Informatics, Higashi-osaka, Japan 8Niigata
University, Graduate School of Health Sciences, Niigata, Japan
Keywords Mammography, Breast density, Mammary Gland Region,
Segmentation
Purpose
Although a quantified breast density is an effective index for indi-
vidualized screening mammography, the technique has not yet been
realized because of the differences in the perceptions for mammary
gland region among practitioners. Recently, a deep learning technique
has been applied to segment a mammary gland region in two-di-
mensional mammograms to achieve a reliable individualized breast
cancer screening based on an accurate breast density measurement,
instead of relying on human vision. In contrast, a large amount of
ground truth (prepared by mammary experts) is required for highly
accurate deep-learning practice; however, this work is time- and
labor-intensive. If multiple radiological technologists can share the
process for producing training images in deep learning practice
independent of their certified level, we can more easily prepare a large
number of training images to construct a segmentation model. In a
previous study, we investigated the differences in the acquired
mammary gland regions among three radiological technologists
(hereafter referred to as practitioners) having different experiences
and reading levels to streamline the ground truth in deep learning,
who shared the segmentation criteria based on the Breast Imaging
Reporting and Data System (BI-RADS). As a result, a good agree-
ment was found among the segmented mammary gland regions;
however, only dense breasts were used in that study because of easy
visual recognition of the mammary gland tissue. In this study, we
tried an identical experiment from the previous study for non-dense
breasts in which visually recognizing the mammary gland region was
difficult.Methods
A total of 150 mediolateral oblique-view mammograms of Japanese
women, who underwent digital mammography from 2017 to 2018
with normal breasts, were used in this study. All mammograms were
assessed as scattered mammary gland or fatty breasts, that is, non-
dense breasts, based on a BI-RADS criterion. All images were
radiographed with the Canon Pe-ru–ru mammographic system,
equipped with a target/filter of molybdenum/molybdenum (for 20-mm
breast thickness).
We investigated the degree of agreement among mammary gland
regions segmented by three radiological technologists as A, B, and C
with 20, 10, and 1 year of certified experience in mammography,
respectively. This investigation was performed in the following four
steps: (1) Three certified radiological technologists were stringently
lectured regarding the segmentation criteria of the mammary gland
region by a certified radiologist, with[ 20 years of experience, using
20 non-dense breast images. For example, the mammary gland region
converges on the nipple conically, and the existence and character-
istics of the retromammary space. The lecture was followed by a
discussion on the criteria among the three practitioners. (2) They
attempted to independently segment the mammary gland region in
150 non-dense breast images, including the aforementioned 20 lecture
images (this was called the 1st time experiment). (3) Six months after
the 1st time experiment, a lecture by the same radiologist was held
again using the same images, and an identical experiment with the 1st
time experiment was performed again (this was called the 2nd time
experiment). (4) The degree of agreement in the segmented mammary
gland region among the three practitioners in the 1st and 2nd time
experiments was assessed according to the following six factors:
breast density, mean glandular dose, region size, mean pixel value,
and central coordinate (X- and Y-directions). The breast density and
mean glandular dose were calculated using our original method [1]
and the Dance formula [2], respectively. The other assessment factors
were obtained using ImageJ software. The presence of significant
differences was judged via Bland–Altman analysis (for breast density)
and Student’s t-test with Bonferroni correction (for all assessment
factors).Results
In the 1st time experiment, the breast densities obtained from the
mammary gland regions segmented by practitioners ‘‘A’’ and ‘‘B’’
were in good agreement, and all assessment factors, except for the
central coordinate for the Y direction, showed no significant differ-
ences. Bland–Altman plot also revealed no fixed or proportional bias
in the breast densities derived from ‘‘A’’ and ‘‘B.’’ In contrast, the
breast density derived from the most inexperienced practitioner ‘‘C’’
was significantly lower than that from the other two practitioners
because of the large region.
In the 2nd time experiment, the degree of agreement between the
segmented regions by ‘‘A’’ and ‘‘B’’ was even higher, and all
assessment factors showed no significant differences. The results of
the t-test are listed in Table 1. Figure 1 shows the Bland–Altman plot
for breast density between ‘‘A’’ and ‘‘B.’’ There was no fixed bias or
Table 1 Results of six assessment factors on segmented mammary
gland regions
Practitioner Breast
density
(%)
M G D
(mGy)
Area
(mm2)
Mean
pixel
value
Central
coordinates
(mm)
X Y
1st time experiment
A 12 1.24 7192 652 85.8 115.0
B 10 1.19 7004 661 86.1 118.6
C 6 0.95 8923 690 85.2 113.0
|A - B| 2 0.05 188 9 0.3 3.6*
|A - C| 6* 0.29* 1731* 38* 0.6 2.0
|B - C| 4* 0.24* 1919* 29* 0.9 5.6*
2nd time experiment
A 12 1.30 6529 649 85.2 115.6
B 10 1.30 6898 658 85.9 116.8
C 12 1.32 7375 652 85.0 113.9
|A - B| 2 0.00 369 9 0.7 1.2
|A - C| 0 0.02 846* 3 0.2 1.7
|B - C| 2 0.02 477 6 0.9 2.9*
*p\ 0.05
S84 Int J CARS (2021) 16 (Suppl 1):S1–S119
123

proportional bias, and the 95% confidence interval narrowed from
11.14 in the 1st time experiment to 9.18. The breast densities derived
from practitioner ‘‘A’’ and ‘‘B’’ can be deemed as identical. In
addition, the result of practitioner ‘‘C’’ was also significantly
improved by performing two lectures with a long interval. After
receiving the second lecture, the significant difference between ‘‘B’’
and ‘‘C’’ disappeared. Thus, the two-step lecture is an avenue for
criteria sharing for segmenting the mammary gland region, especially
for inexperienced practitioners.Conclusion
We concluded that certified radiological technologists can create the
training data for deep learning that satisfies a certain criteria by
receiving one- or two-time lecture regarding mammary gland region
segmentation from a certified radiologist. This leads to an increase in
training images for highly accurate deep-learning practice.Acknowledgements
This work was supported by JSPS Grants-in-Aid Scientific Research,
Grant Number JP18K07736.
References
[1] Yamamuro M, Asai Y, Yamada K, Ozaki Y, Matsumoto M,
Murakami T (2019) Prediction of glandularity and breast radi-
ation dose from mammography results in Japanese women.
Medical & Biological Engineering & Computing 57(1):289–98
[2] Dance DR., Skinner CL., Young KC., Beckett JR., Kotre CJ
(2000) Additional factors for the estimation of mean glandular
breast dose using the UK mammography dosimetry protocol.
Physics in Medicine and Biology 45:3225–40
Deep learning for automatic quantification of AVN
of the femoral head on 3D MRI in patients eligible
for joint preserving surgery: a pilot study
A. Ruckli1, F. Schmaranzer 2, T. Lerch2, A. Boschung2,
S. Steppacher 3, J. Burger1, M. Tannast 4, K. Siebenrock 3,
N. Gerber 1, K. Gerber1
1University of Bern, sitem Center for Translational Medicine
and Biomedical Entrepreneurship, Personalised Medicine research
group, Bern, Switzerland 2Inselspital, University of Bern, Department
of Diagnostic-, Interventional- and Pediatric Radiology, Bern,
Switzerland 3Inselspital, University of Bern, Department
of Orthopaedic Surgery and Traumatology, Bern, Switzerland4Kantonsspital Fribourg, University of Fribourg, Department
of Orthopaedic Surgery and Traumatology, Fribourg, Switzerland
Keywords necrosis, hip, segmentation, deep learning
Purpose
Size of necrosis is an important prognostic factor in the management
of femoral head necrosis (AVN), usually estimated on radiographs
and MRI which is subjective and requires experienced physicians.
Ideally, a fast-volumetric assessment of necrosis size would be
desirable for a more objective standardized evaluation. Thus, we
evaluated a deep-learning method to automatically quantify the
necrotic bone in AVN.Methods
IRB-approved retrospective study of 34 patients (mean age 30 years,
14 women) with AVN according to the commonly recommended
2019 ARCO grading: I (negative X-rays): 3 hips; II (no fracture): 5
hips; IIIA (head collapse 2 mm): 12 hips. Patients underwent pre-
operative 3T hip MRI including 0.8 mm3 3D T1VIBE on which
manual ground truth segmentation of necrosis and the vital bone from
the femoral head was performed by an expert reader and then used to
train a set of convolutional neural networks (nnU-Net [1]). The raw
data had a median image shape and spacing of
104 9 384 9 384 voxels and 1 9 0.44 9 0.44 mm, respectively.
The highest in-plane resolution was oriented axial-oblique parallel to
the femoral neck. As a preprocessing step, the images were resampled
to the medial spacing and volume cropped around the femoral head
center to the shape of 80 9 160 9 160 voxels. Volume cropping
reduced the background complexity and accelerated the network
training time. A fivefold cross-validation was performed between
manual and automatic volumetric analysis of absolute/relative
necrosis volume. The mean difference between manual and automatic
segmentation was compared with paired t-tests and correlation was
assessed with Pearson correlation coefficients. We compared the
absolute and relative size of the necrosis between early and advanced
stages of AVN (ARCO I/II versus IIIA/B) using Mann–Whitney U
tests. A p-value\ 0.05 determined statistical significance.Results
The best performing configuration was the ensemble of the 2D and
3D U-net. The mean Dice coefficient for the vital femoral head bone
and necrosis was 89 ± 9% and 69 ± 25%, respectively. The indi-
vidual 2D (89 ± 9%, 67 ± 23%) and 3D (89 ± 10%, 69 ± 26%)
networks were performing very similarly on both vital and necrotic
bone (p[ 0.05). Mean absolute and relative AVN volume was
comparable between manual (8.2 ± 7.4 cm3, 17 ± 15%) and auto-
matic (7.3 ± 6.7 cm3, 15 ± 14%) segmentation (both p[ 0.05) and
showed a strong correlation (rp = 0.90 and rp = 0.92, both
p\ 0.001), respectively. Manual and automated segmentation
detected a difference (both p\ 0.05) in relative necrosis volume
between early and advanced AVN: 8 ± 8% vs. 20 ± 16% and
7 ± 8% vs. 18 ± 14%, respectively.
Fig. 1 Bland–Altman plot of practitioner A versus B for breast
density in the 2nd time experiment. The mean of difference between
A and B is - 1.82 (black solid line), the upper and lower limits of the
95% confidence interval are 2.77 and - 6.41, respectively (blue solid
lines), and the slope of the regression line is - 0.0344 (red broken
line)
Int J CARS (2021) 16 (Suppl 1):S1–S119 S85
123

Conclusion
Due to the large number of parameters, it is known that 3D convo-
lution networks have a less good generalization performance
compared to the 2D counterparts. Even if the 3D context is essential
this often makes both networks perform very similar. So far, it seems
that the deep learning approach cannot benefit from the 3D MRI
sequence. Future additional tests and 2D MRI sequences are required
to reject or confirm this hypothesis. However, applying a deep
learning method for volumetric assessment of AVN is feasible and
showed very strong agreement and enabled to distinguish early versus
advanced disease stages which paves way for evaluation in larger
datasets, with the goal to determine its prognostic value.References
[1] Isensee F, Jaeger PF, Kohl SAA, Petersen J, Maier-Hein K H
(2020) nnU-Net: A Self-Configuring Method for Deep Learning-
Based Biomedical Image Segmentation. Nature Methods: 1–9
AI-assisted RoI extraction software tool for radio-
therapy simulation
A. Kimura1, M. T. Nadege2
1Ashikaga University, Faculty of Engineering, Ashikaga, Tochigi,
Japan 2Ashikaga University, Graduate School of Engineering,
Ashikaga, Tochigi, Japan
Keywords RoI, AI, radiotherapy simulation, Geant4
Purpose
Monte Carlo radiation simulations have been used in areas of han-
dling radiations accurately, such as high energy physics, nuclear
physics, accelerator physics, medical science, and space science. It
takes charge of the important role in high energy physics in order to
verify a theory, explore an unknown particle, and so on. In radio-
therapy, it has been used it in order to precisely evaluate dose
distributions in an irradiated human body constructed from medical
data or optimize devices of a beam delivery system [1].
Geant4 toolkit has been used for a Monte Carlo simulation of the
passage of particles through matter [2]. It has been done physics
validations and developed as a C ?? class library for developing
user software applications. Therefore, it comes to be used for medical
physics simulations.
We had developed and released gMocren since 2006. It has
reached over 2400 downloads since the release. It is volume visual-
ization software for Geant4-based radiotherapy simulations. It had
been designed according to the requirements of medical users for the
visualization system of Geant4. gMocren can visualize fused images
of patient data, a dose distribution, particle trajectories and treatment
apparatus with 3D view and 3 cross-sectional sliced images. It can
only visualize RoIs, and it has no capability to edit RoIs and create a
DVH.
In this research, an RoI editing software tool using NVIDIA Clara
has been developing. It supports extracting region of tumors using an
artificial intelligence from medical image data such as DICOM
dataset and editing RoIs for radiotherapy simulation. It is useful to
create RoIs and a DVH for Geant4-based radiotherapy simulation.Methods
NVIDIA Clara is a healthcare application framework for AI-powered
imaging and genomics. It uses NIVIDA GPU to accelerate extracting
tumor or organ regions from medical images. NVIDIA provides pre-
trained models due to tumor or organ extractions.
In user requirements of radiotherapy simulations, functions of
importing RoI data and creating DVH are required in order to analyze
outcomes of a radiotherapy simulation. Geant4 toolkit has not
provided those functions as an analysis tool. Therefore, medical users
create RoI and DVH by using such a treatment planning system in a
hospital. The RoI editing tool will be freely available, so it is useful
and available not only for students or beginners but also researchers
using Geant4-based radiotherapy simulation.
The RoI editing tool has function to export RoI data to DICOM-
RT Structure or DICOM-RT Dose files. gMocren can visualizes
extracted organ regions with DICOM-RT Structure Set file, such as
outlines of a human body, organs, tumors, and so on. The RoIs are
drawn on a medical image used in the tissue extraction. The RoI
editing tool is implemented by using Python and HTML5.
NVIDIA Clara is used to extract initial RoIs in the RoI editing
tool. It is possible to edit RoI shapes from the initial RoIs. The tumor
region of edited RoI will be able to return to and update the trained AI
model of NVIDIA Clara.Results
NVIDIA Clara is provided as a docker container for a Linux PC with
a NVIDIA GPU [5]. It can work on a Linux PC as a standalone AI
server and provides an HTML interface to communicate with the
other software. A Linux PC shown in Table 1 is used for NVIDIA
Clara server.
Table 1 A Linux server specification for NVIDIA Clara
CPU AMD Ryzen 7 2700
GPU NVIDIA GeForce RTX 2080
Main memory 16 GB
Linux OS Ubuntu 18.04.3 LTS
CUDA Toolkit 10.2.89
Docker NIVIDA Docker 2.0.3
Fig. 1 Process of creating DVH from DICOM image dataset with
Geant4-based radiotherapy simulation
S86 Int J CARS (2021) 16 (Suppl 1):S1–S119
123

A spleen region in DICOM images can be extracted adequately by
using NVIDIA Clara and MITK (Medical Image Interaction Toolkit).
A spleen region is extracted from chest region of a patient dataset
within 10 s. The size of the patient dataset is 512 9 512 9 34 voxels.
The process to create DVH from DICOM image dataset with
radiotherapy simulation is shown in Fig. 1. NVIDIA Clara extracts
tumor or organ regions in DICOM Image. The extracted regions are
used as initial RoIs data. User analyzes and edits the extracted RoIs
with the RoI editing tool. And Geant4-based radiotherapy simulation
calculates dose distributions with the DICOM image dataset. Finally,
a DVH is calculated with the edited RoIs and the calculated dose
distributions and visualized by using gMocren or an analysis tool.Conclusion
The RoI Editing tool using AI has been developing. NVIDIA Clara is
used as an AI server to extract tumor or organ regions in medical
image dataset such as a DICOM dataset. The extracted region is used
to create RoIs, and then the RoIs can be edited by user. The RoI
editing tool will be available as standalone software. Therefore, it is
useful and available not only for students or beginners but also
researchers using Geant4-based radiotherapy simulation.
References
[1] Archambault L, Beaulieu L, Carrier JF, Castrovillari F, Chauvie
S, Foppiano F, Ghiso G, Guatelli S, Incerti S, Lamanna E,
Larsson S, Lopes MC, Peralta L, Pia MG, Rodrigues P, Trem-
blay VH, Trindade A (2003) Overview of Geant4 Applications
in Medical Physics. Nuclear Science Symposium Conference
Record, 2003 IEEE, Vol.3, 19–25, pp. 1743–1745
[2] GEANT4 Collaboration (S. Agostinelli et al.) (2003) ‘GEANT4:
A Simulation Toolkit,’’ Nucl. Instrum. Meth. A 506:
pp. 250–303.
Remote interventional support for emergency care
application mobile ultrasound
M. Kranzfelder1, M. Gharba2, T. Vogel1, H. Feussner1, D. Wilhelm1,
H. Friess3, J. Eichinger2, D. Ostler4
1Klinikum rechts der Isar, TU Munchen, Department of Surgery,
Munchen, Germany 2Huawei Technologies Duesseldorf GmbH,
Munich Office, European Research Center, Munchen, Germany3Klinikum rechts der Isar, TU Munich, Department of Surgery,
Munchen, Germany 4Klinikum rechts der Isar, TU Munich,
Researchgroup MITI, Munchen, Germany
Keywords 5G, Telemedicine, Ultrasound, Emergency care
Purpose
Preclinical patient treatment in an acute emergency situation (e.g. car
accident) benefits greatly from support by a medical expert. Espe-
cially in rural areas, with a lack of trained medical staff and long
travel distances to the hospital, a fast and reliable preclinical diag-
nosis, e.g. by mobile ultrasound, significantly increases patient safety.
This support with virtual presence of a medical expert can be
achieved by tele-medical applications, enabling bi-directional data
communication between the first responder and the hospital.Methods
Tele-medical applications require reliable, fast and secure wireless
data transmission. 5th. generation mobile communication (5G)
facilitates an up to 100 9 higher data rate (up to10.000 MBit/s), up to
200x higher data capacity and a (very) low latency (Ping\ 1 ms)
compared to 4G/LTE. Previous research has shown, that 5G data
transmission volume, rate, and latency met the requirements for real-
time track and trace and telemedicine applications [1].
In the herein presented preclinical study, a 5G based data trans-
mission of ultrasound, video and audio source between a moving
point of care (ambulance car = first responder) and hospital (sta-
tionary unit = medical expert) is evaluated.
The 5G network uses a carrier frequency (C-Band) of 3.41 GHz
and bandwidth of 40 MHz. Both the base transceiver station (BTS)
and the unified user equipment (UE) modem consist of 8 antennas.
Subcarrier spacing is 30 kHz.
Ultrasound examination was performed by Clarius C3 HD
(2–6 MHz) multipurpose scanner (Clarius Mobile Health Corp.,
Vancouver, Canada). For video and audio transmission, an IP-based
pan tilt zoom (PTZ) camera was used (Hikvision DS-2DE2A404IW-
DE3/W, Hangzhou, China).Results
The ultrasound system was successfully connected to the 5G modem
and processing system which was installed in a regular vehicle
(moving point of care). The remote hospital PC (stationary unit) used
to receive and read the ultrasound image data was integrated to the
base transceiver station. Through the 5G network, the ultrasound
system has been used to transmit image data to the remote hospital PC
(figure 1).
Throughput of total transmitted data through the 5G network
between the ultrasound scanner at UE side and the remote hospital PC
at BTS side revealed a peak of 6 Mbps (average 4 Mbps).
The transmission control protocol (TCP), representing the control
signalling, showed a peak throughput of 650 Kbps and was trans-
mitted with interruptions. The user datagram protocol (UDP)
transmitted data without interruptions, representing the image/data
stream from the ultrasound system to the remote hospital PC. Peak
UDP throughput was 450 Kbps (average 240 Kbps). Similar is
expected for video and audio data transmission, however, final results
are pending.Conclusion
Preliminary testing of the 5G based data transmission has been per-
formed successfully. Data throughput requirements for e-health use
cases were achieved. The ultrasound image/data has been streamed to
the remote hospital PC at BTS side through the 5G network. Logfiles
were saved for further analysis.
References
[1] Jell A, Vogel T, Ostler D, Marahrens N, Wilhelm D, Samm N,
Eichinger J, Weigel W, Feussner H, Friess H, Kranzfelder M
(2019) 5th-Generation Mobile Communication: Data Highway
for Surgery 4.0. Surg Technol Int. 10(35):36–42.
Fig. 1 Bi-directional ultrasound, video and audio data transfer
between stationary unit (hospital) and moving point of care
(ambulance)
Int J CARS (2021) 16 (Suppl 1):S1–S119 S87
123

Automatic facial nerve segmentation from CT using
deep learning
B. S. Jeoun1, S. J. Lee2, M. H. Choi2, J. Y. Yoo2, T. H. Yong2,
S. E. Choi2, S. Y. Chun1, S. Yang2, J. Kim1, W. J. Yi3,2
1Seoul National University, Interdisciplinary Program
for Bioengineering, Graduate School of Engineering, Seoul, South
Korea 2Seoul National University, Department of Biomedical
Radiation Sciences, Graduate School of Convergence Science
and Technology, Seoul, South Korea 3Seoul National University,
Department of Oral and Maxillofacial Radiology, School of Dentistry
and Dental Research Institute, Seoul, South Korea
Keywords Facial Nerve, Segmentation, CT, ENT
Purpose
Accurate facial nerve segmentation is considered to be important to
avoid any physical damages or paralysis from a patient’s face during
mastoidectomy for cochlear implantation surgery [1]. Several meth-
ods based on conventional approaches have been proposed to perform
this segmentation task. Yet, there hasn’t been any attempts to utilize
deep learning which is the popular approach in many study fields
recently. In this work, we studied automatic facial nerve segmentation
using various deep learning networks.Methods2D U-net, 2D SegNet, 2D Dense U-net, and 3D U-net were utilized as
deep learning networks which are commonly used deep learning
neural networks for anatomical structure segmentation in the medical
imaging fields, such as mammography, MRI, CBCT/CT, etc. The CT
data were acquired from 114 subjects and the dataset was split into 91
for train, 23 for test respectively. To obtain label images, a manual
segmentation task has done by otolaryngology experts. The resolution
of data was 512 9 512 9 90 with 0.6 mm of voxel spacing. For 2D
networks, each slice of CT data was vertically flipped and randomly
rotated in the range of 10 degrees with width-height shifting. For 3D
U-net, the data were cropped into 256 9 256 due to the memory issue
and computational cost. Then zero-padding was implemented to train
the network with constant input volume size 256 9 256 9 48 to
cover the whole length of the facial nerve which varies from 20 to 45.
We trained networks by using Adam optimizer, learning rate of
0.00025 by reducing on plateau every 25 epoch in 300 epochs with
dice coefficient loss. The dice coefficient score was calculated to
evaluate each network’’s prediction result.Results
Table 1 shows the quantitative evaluation result of each network’s
performance. Even if, 3D U-net has the limitations of high compu-
tational cost and memory efficiency, it achieved the best dice
coefficient score compared to other 2D networks. Especially, 3D
U-net outperformed preserving the continuous feature of facial
nerve’s canal-like anatomical structure in the perspective of learning
spatial information. While, Dense U-net, the modified U-net with
dense connections, showed a nearly similar dice coefficient score to
3D U-net, it still had some false positives like 2D U-net and 2D
SegNet.Conclusion
This work showed the possibility and limitations of automatic facial
nerve segmentation using deep learning. In the perspective of its
possibility, it is optimistic that the facial nerve segmentation can be
done by deep learning which can less labor-intensive and time-con-
suming annotation task. On the other hand, it is still challenging to
achieve accurate facial nerve segmentation result without any dis-
connections or false positives that can be utilized in clinical
application. In future work, we will study advanced and efficient deep
learning neural networks that can be applied in real clinical practice.Acknowledgements
This work was supported by the Korea Medical Device Development
Fund grant funded by the Korea government (the Ministry of Science
and ICT, the Ministry of Trade, Industry and Energy, the Ministry of
Health & Welfare, the Ministry of Food and Drug Safety) (Project
Number: 202012E09).
References
[1] Lu P, Barazzetti L, Chandran V, Gavaghan K, Weber S, Gerber
N, Reyes M. (2018) Highly Accurate Facial Nerve Segmentation
Refinement From CBCT/CT Imaging Using a Super-Resolution
Classification Approach. IEEE Trans Biomed Eng. 2018
Jan;65(1):178–188.
Entropy guided refinement strategy for knee cartilage
segmentation: data from the osteoarthritis initiative
Z. Li1, G. Zheng1
1Shanghai Jiaotong University, School of Biomedical Engineering,
Institute of Medical Robotics, Shanghai, China
Keywords Medical image segmentation, Knee cartilage, Deep
learning, Fully supervised segmentation
Purpose
Knee osteoarthritis (OA) is one of the leading causes of muscu-
loskeletal functional disability and its real burden has been
underestimated. Magnetic resonance imaging (MRI), serving as a
three-dimensional, noninvasive assessment of cartilage structure, is
widely used in OA diagnosis. And many clinical applications, such as
quantitative analysis of knee cartilage, requiring efficient segmenta-
tion of knee cartilage. To get objective, reproducible clinical analysis,
an accurate and high-quality cartilage segmentation from MRI is
crucial. Knee cartilages usually have low contrast with surrounding
tissues in magnetic resonance imaging. Manual segmentation of the
knee joint is tedious, subjective, and labor-intensive. In recent years,
with the development of deep learning, knee cartilage segmentation
has made great progress. Previous deep learning-based method either
integrate Statistical Shape Model (SSM) which need extra prior
knowledge or limit in performance. Thus, the objective of this study is
to develop a refined knee cartilage segmentation strategy to get high-
quality knee cartilage segmentation.Methods
As shown in Fig. 1, we propose a two-stage knee cartilage segmen-
tation method. It consists of a coarse segmentation stage and an
entropy guided refinement stage. Both stages use 3D-Unet with deep
supervision as the segmentation network. In the first stage, the net-
work takes original MRI data as input and output probability maps
and labels of femur, tibia, femoral cartilage and tibial cartilage. Then,
in the second stage, the bone distance map is calculated based on
labels of femur and tibia generated in stage one. Bone and cartilage
entropy maps are calculated based on probability maps of femur,
tibia, femoral cartilage and tibial cartilage generated in the second
stage. Entropy maps encode uncertainty information which could
guide the network to pay more attention to the boundary of knee
Table 1 The quantitative evaluation result of each network (Dice
Coefficient Score; DSC)
Network 2D U-net 2D SegNet 2D Dense U-net 3D U-net
DSC 0.61 ± 0.37 0.6 ± 0.36 0.68 ± 0.21 0.71 ± 0.18
S88 Int J CARS (2021) 16 (Suppl 1):S1–S119
123

cartilages. Finally, entropy maps, distance map and original MRI data
are concatenated and feed as the input to the network at stage two, and
output refined cartilages segmentation labels. Our method was eval-
uated on the publicly available dataset, namely OAI-ZIB dataset [1]
with femur, tibia, femoral cartilage and tibial cartilage manually
segmented, and it contains 507 objects.Results
Two-fold cross-validation studies are performed for the dataset of
OAI-ZIB, and the quantitative results are presented in Table 1. Our
method also outperforms the state-of-the-art knee cartilage segmen-
tation method [1] with an improvement of DSC of 0.4%, ASSD of
0.02 mm and HD of 0.89 mm. In femoral cartilage segmentation, our
method achieves DSC of 89.8%, ASSD of 0.16 mm, HD of 5.22 m.
And in tibial cartilage segmentation, our method achieves DSC of
86.4%, ASSD of 0.20 mm, HD of 4.70 mm.Conclusion
In summary, we propose a two-stage entropy guided knee cartilage
segmentation method. Our method consists of coarse segmentation
and refinement segmentation stages and without the need for addi-
tional prior knowledge. In the refinement segmentation stage, the
distance map, entropy maps and original MRI data are concatenated
to the input. The entropy maps encode the uncertainty information to
force the network to pay more attention to the uncertainty area. The
distance map encodes more spatial information into the next stage.
Our result has shown that the present method achieves good refine-
ment of uncertainty area and get better results than the state-of-the-art
method on the OAI-ZIB dataset.
References
(1) Ambellan F, Tack A, Ehlke M, Zachow S (2019) Automated
segmentation of knee bone and cartilage combining statistical
shape knowledge and convolutional neural networks: Data from
the osteoarthritis initiative. Medical image analysis 52, 109–118
Intestine segmentation combining watershed transfor-
mation and machine learning-based distance map
estimation
H. Oda1, Y. Hayashi2, T. Kitasaka3, Y. Tamada4, A. Takimoto1, A.
Hinoki1, H. Uchida1, K. Suzuki1, H. Itoh2, M. Oda5, K. Mori2,6,7
1Nagoya University, Graduate School of Medicine, Nagoya, Japan2Nagoya University, Graduate School of Informatics, Nagoya, Japan3Aichi Institute of Technology, School of Information Science,
Toyota, Japan 4Nagoya University, School of Medicine, Nagoya,
Japan 5Nagoya University, Information and Communications,
Nagoya, Japan 6Nagoya University, Information Technology Center,
Nagoya, Japan 7National Institute of Informatics, Research Center
for Medical Bigdata, Tokyo, Japan
Keywords small bowel, graphical representation, intestine recon-
struction, weak annotation
Purpose
Intestine (including small intestines) segmentation is desired for
diagnosis assistance of the ileus and the intestinal obstruction. There
are very few work [1, 2] for intestine segmentation methods whose
segmentation target is the small intestine. Oda, et al. [1] estimated
distance maps on the intestine regions, which represent distances from
outside the intestines. Regions in the intestine generated by Water-
shed transformations on the distance maps are connected and
represented as graphs. Those graphical representations allow us to
find the longest paths for each intestine’s part which is enlarged by
contents. This scheme prevents the generation of incorrect contacts
between the intestine’s different parts, by choosing a high threshold
for the Watershed transformation on the distance maps. However,
segmentation results become thinner, which cover only around the
intestine’s centerlines. The intestinal sections tend to be divided at the
intestines’ sharp curves, even if two sections are apparently contin-
uing for human eyes. Since the small intestines are complicatedly
winding, it may not be proper to connect multiple intestinal sections
only by examining the minimum distance between their endpoints.
We introduce a dual-threshold scheme for the Watershed transfor-
mation, which allows us to (1) obtain segmentation results that
sufficiently cover intestine regions and (2) check whether two
neighboring sections are continuing or not.Methods
OverviewOur proposed method performs the segmentation of the intestines
from CT volumes. Input is a CT volume. The distance map is esti-
mated on the CT volume, which has high on the centerlines, and low
on the intestines’ peripheral parts. Using two thresholds for the
Watershed transformation, the distance map is converted to two
graphs. The higher threshold generates the graphs following major
parts of the intestines, in which incorrect contacts are prevented. The
low threshold allows us to obtain regions including peripheral parts,
and those regions tend to be connected along sharp curves. The output
intestine segmentation results are generated by merging the graphs
from the higher and the lower thresholds.
Estimation of distance maps
Distance maps are estimated by using the method proposed by
Oda, et al. [1]. We introduce a weak-annotation scheme, which
requires the intestine labels only on several axial slices for each CT
volume in the training dataset. The intestine labels are converted to
the distance maps. The distance maps have high values (1.0) in the
centerlines, and low values (0.0) in intestine walls or outside the
intestines. The 3D U-Net is trained by utilizing pairs of the input CT
volumes and the distance maps generated as above. For the testing
dataset, distance maps are estimated by the trained 3D U-Net.
Generation of ‘‘intestinal segments’’
Fig. 1 A schematic illustration of the two-stage deep learning-based
method for knee cartilage segmentation is shown
Table 1 Quantitative results of two-fold cross-validation studies for
the dataset of OAI-ZIB
Method Parts DSC (%) ASSD
(mm)
HD (mm)
Ambellan et al.
[1]
Femoral
cartilage
89.9 – 3.60 0.16 ± 0.07 5.35 ± 2.50
Tibial cartilage 85.6 ± 4.54 0.23 ± 0.12 6.35 ± 4.36
Ours Femoral
cartilage
89.8 ± 2.49 0.16 – 0.05 5.22 – 2.47
Tibial cartilage 86.4 – 4.12 0.20 – 0.09 4.70 – 2.12
Int J CARS (2021) 16 (Suppl 1):S1–S119 S89
123

We introduce two threshold values s and t (0\ s\ t\ 1). The
Watershed transformation is utilized for each threshold on the dis-
tance maps. Local maxima of the distance maps are used as seeds.
Generated regions by the Watershed transformation are called ‘‘low/
high-threshold intestinal segments.’’ The high-threshold intestinal
segments are thinner than actual intestine regions, and they do not
include incorrect contacts between the intestine’s different parts.
Although the low-threshold intestinal segments sufficiently cover the
intestine regions, they often contain incorrect contacts running
through the intestine walls.
Representation of intestinal segments’ connections as graphs
Connections between the high-threshold intestinal segments are
represented as graphs. The graphical analysis allows us to obtain the
intestine segments’ sequences (called ‘‘intestinal paths’’). Since the
high-threshold intestinal segments are used here, the intestine paths
are covering only the intestines’ thick parts.
Those intestinal paths are often incorrectly divided at curves of the
intestines. Two neighboring intestinal paths are merged into one
graph when two intestinal paths are apparent to be connected by the
following rule: When intestinal segments of two endpoints of
intestinal paths are adjacent (the intestinal segments’ shortest distance
is less than d [mm]), their corresponding low-threshold intestinal
segments are checked. If those low-threshold intestinal segments are
touching, two intestinal paths are connected.
Segmentation of intestines
The low-threshold intestinal segments whose corresponding nodes
are connected as the intestinal paths are regarded as intestine seg-
mentation results. Other low-threshold intestinal segments are
regarded as false positive regions.Results
Four-fold cross-validation across 19 patients was conducted. A
trained medical student manually traced the intestine regions on 7–10
axial slices for each CT volume as the ground-truth. Parameters were
set as: s = 0.01, t = 0.2, and d = 50 mm.
The performances are compared to Oda, et al. [1] which utilizes
only one threshold t. The Dice score was improved from 0.491 to
0.672. Furthermore, our dual-threshold scheme joined many discon-
nections. The average number of intestinal paths per CT volume was
decreased from 7.9 to 6.2 by joining 1.7 disconnections per CT vol-
ume on average. Note that clinicians have not manually confirmed
that all of those joinings are correct. Figure 1 shows an example of
segmentation results covering entire intestinal regions with connect-
ing incorrectly-divided intestinal paths.Conclusion
An intestine segmentation method was proposed. The dual-threshold
scheme allowed us to (1) obtain segmentation results that are suffi-
ciently covering intestine regions and (2) check whether two
neighbouring sections are continuing or not. Future work includes the
improvement of network architectures for more accurate
segmentation.Acknowledgements
Parts of this work were supported by the Hori Sciences and Arts
Foundation, MEXT/JSPS KAKENHI (17H00867, 17K20099,
26108006, and 26560255), JSPS Bilateral Joint Research Project, and
AMED (JP19lk1010036, JP20lk1010036).
References
[1] Oda H, Hayashi Y, Kitasaka T, Tamada Y, Takimoto A, Hinoki
A, Uchida H, Suzuki K, Itoh H, Oda M, Mori K (2021) Intestinal
region reconstruction of ileus cases from 3D CT images based
on graphical representation and its visualization. SPIE Medical
Imaging 2021, Computer-Aided Diagnosis: 11597–56
[2] Shin S, Lee S, Elton D, Gulley J, Summers R (2020) Deep Small
Bowel Segmentation with Cylindrical Topological Constraints.
International Conference on Medical Image Computing and
Computer-Assisted Intervention (MICCAI) 2020: LNCS 12264:
207–215
Automatic shoulder bone segmentation from CT
arthrograms based on deep learning
H. Hess1, M. A. Zumstein2,3, L. Dommer2,3, M. Schar2, A. Hayoz2,3,
G. Zeng1, A. Ruckli1, J. Burger1, N. Gerber1, K. Gerber1
1University of Bern, SITEM, Bern, Switzerland 2University of Bern,
Department of Orthopaedic Surgery and Traumatology, Bern,
Switzerland 3Orthopaedics Sonnenhof, Shoulder, Elbow &
Orthopaedic Sports Medicine, Bern, Switzerland
Keywords Convolutional neural network, Segmentation, CT
Arthrogram, Shoulder
Purpose
The shoulder has the largest range of motion of the major joints in the
human musculoskeletal system. This high range of motion and
mechanical stability is provided by an arrangement of bony and soft-
tissue structures. Differences in the morphology of the scapula result
in different biomechanical strains which may predispose a patient to
develop certain pathologies or result in worse outcomes of different
surgeries. Therefore, morphology analysis has become a crucial tool
for clinicians. Novel morphology analysis requires a patient-specific
3D model which is generated from the semantic segmentation of a
medical image data of the patient. However, manual segmentation is
time-consuming which hinders the technology to be even more
widely integrated into the clinical process. Several techniques are
investigated for automatic segmentation of various body-tissues in
magnetic resonance images (MRI) or computer tomography (CT)
images. Due to the different Hounsfield units of bones and muscles,
basic threshold algorithms can be used to segment bones in CT
images. However, the different bones can not be distinguished, and
contrast agent and image inhomogeneity can reduce the segmentation
accuracy. More advanced segmentation techniques, such as atlas-
based or statistical shape model-based segmentation techniques,
reduce these problems. However, recently the highest segmentation
accuracies are achieved with convolutional neural networks (CNN).
Segmenting the scapular and humeral bones in shoulder CT arthro-
grams exhibits multiple additional challenges. The thin structure of
the scapular bone shows high variance in shape which aggravates an
accurate segmentation. Taghizadeh et al. present in [1] a statistical
shape modeling-based algorithm for bone segmentation in non-con-
trast shoulder CT images. However, in CT arthrograms, which are
Fig. 1 Segmentation results. Compared to Oda, et al. [1], intestine
regions were sufficiently segmented. False division was corrected
S90 Int J CARS (2021) 16 (Suppl 1):S1–S119
123

acquired for the diagnosis of different shoulder pathologies, the
contrast agent surrounds the shoulder joint and makes accurate seg-
mentation with a threshold algorithm impossible. The purpose of this
study was to develop a CNN-algorithm for accurate bone segmenta-
tion of the shoulder in CT arthrograms and evaluate its performance.Methods
Image Acquisition
Shoulder CT arthrograms from 64 patients were acquired during
the clinical routine with different CT scanners (Siemens, Toshiba) at
the University Hospital of Bern and were used for this study with the
approval of the Ethics Committee. Manual Segmentation was per-
formed by clinical experts and used for training the algorithm and as
ground truth. All CT images were acquired in the lateral direction
with a consistent in-plane resolution of 0.4 9 0.4 mm and 512 9 512
pixels. The images were created with different Kernels and showed a
high variety of quality. The slice thicknesses were between 0.4 and
0.6 mm and the volumes consisted of various numbers of planes
reaching from 160 to 550 (Fig. 1).
Algorithm implementation details
For segmentation, a standard U-Net [2] was applied. The network
was trained to segment the scapular and humeral bone separately. An
average of the cross-entropy loss and the dice loss was used as loss
function during training. Prior to the U-Net, several preprocessing
steps were applied. The pixel values were normalized to be around
zero with a standard deviation of one and the volumes were inter-
polated to isotropic volumes with a pixel size of 0.4 mm in each
direction and cropped or extended to volumes with the size 512 in
each direction. Data augmentation methods including random zoom
and shear were applied during the training process to prevent the
network from overfitting. The U-Net was separately trained along all
three planes of around 20 epochs. Random initialization was used for
the axial plane. For the coronal and sagittal plane, the weights from
the axial plane were used for refinement.
Algorithm training and evaluation
Training and predictions were done on a PC (Core i9-9900 K
CPU, 64 GB) with two GPUs (GeForce RTX 2080 Ti). Predictions
were done on unseen samples in a fivefold cross-validation process.
The predictions of all three planes were averaged for final segmen-
tation. The final segmentation was created by isolation of the largest
connected component of each label (in 3D) and cropping of all
outliers.Results
In a fivefold cross-validation process, all CT-Volumes of the 64
patients were segmented by the presented algorithm. The automatic
segmentations are compared to the manual segmentations. The seg-
mentations of the humerus show an average Dice coefficient (DC) of
0.988 an average surface distance of 0.21 mm and a Hausdorff-Dis-
tance (HD) of 3.18 mm while the segmentations of the scapula show
an average Dice coefficient of 0.976 an average surface distance of
0.18 mm and a Hausdorff-Distance of 5.41 mm.Conclusion
The CNN-algorithm presented in this study segment the scapular and
the humeral bones in shoulder CT arthrograms with high accuracy.
The algorithm is capable to segment very thin structures of the sca-
pula despite this bone region shows a high variety in shape.
Furthermore, in the majority of the CT arthrograms, the algorithm
accurately distinguished between contrast agent and bone and
achieved high segmentation accuracies even in the region at the joint,
where the contrast agent is close to the bones and shows similar voxel
intensities. Therefore, the study results show that automatic seg-
mentation of the shoulder bones with high accuracy is feasible even in
CT arthrograms from different CT scanners. This automated process
may allow the use of 3D patient data to be more widely integrated
into the clinical process for shoulder diagnosis and surgical planning
in the future.
References
[1] Taghizadeh E, Terrier A, Becce F, Farron A, Buchler P (2019)
Automated CT bone segmentation using statistical shape mod-
elling and local template matching. Computer methods in
biomechanics and biomedical engineering, vol. 22, no. 16,
pp. 1303–1310, 2019, https://doi.org/10.1080/10255842.
2019.1661391.
[2] Ronneberger O, Fischer P, Brox T (2015) U-Net: Convolutional
Networks for Biomedical Image Segmentation. In: Navab N.,
Hornegger J., Wells W., Frangi A. (eds) Medical Image
Computing and Computer-Assisted Intervention—MICCAI
2015. Lecture Notes in Computer Science, vol 9351. Springer,
Cham. https://doi.org/10.1007/978-3-319-24574-4_28
Finite element model validation for the presurgical
treatment planning of mandibular angle fractures
M. Maintz1,2, S. Herrmann3, N. Sharma2,4, F. M. Thieringer2,4
1University of Applied Sciences and Arts Northwestern Switzerland,
Institute for Medical Engineering and Medical Informatics, Muttenz,
Switzerland 2University of Basel, Medical Additive Manufacturing
Research Group, Department of Biomedical Engineering, Allschwil,
Switzerland 3CADFEM Medical GmbH, Grafing bei Munchen,
Germany 4University Hospital Basel, Oral- and Maxillo-Facial
Surgery & 3D Print Lab, Basel, Switzerland
Keywords Computer-assisted surgery, Additive Manufacturing,
Biomechanical Testing, In silico Validation
Purpose
Among mandible fractures, the mandibular angle is a frequently
fractured region. When stabilization is required, open reduction
internal fixation (ORIF) is usually performed using miniplate
osteosynthesis. Angular fractures are among the most complex
mandible fractures to treat due to the common occurrence of com-
plications related to unsuitable fixation, such as infection, injury of
Fig. 1 Example of the automatic scapula and humerus segmentation
in a CT Angiogram with an average segmentation accuracy
Int J CARS (2021) 16 (Suppl 1):S1–S119 S91
123

the teeth’ nerve and roots, loosening of the screws, and damage of the
implant. The patient-specific mandible geometry, fracture character-
istics, bone composition, and biomechanical forces strongly affect the
treatment outcome and should be considered when choosing the
plating technique [1, 2].
Computer-assisted virtual planning tools such as finite element
(FE) simulation provide patient-specific solutions in the surgical
decision-making process. The use of FE analysis in medical devices,
for example, for the in silico validation of implant designs, is
becoming increasingly popular. For the successful treatment of
defects and fractures of the mandible and to prevent treatment errors,
extensive knowledge of the complex biomechanics and time-con-
suming and expensive quality examinations are required. Due to the
increasing availability of patient-specific implant designs and the
ability to model the bone geometry with the aid of computed
tomography (CT) data of the patient, the FE method can display the
biomechanical bone-implant interaction. An accurate biomechanical
model can provide valuable information on the implant’s suitability if
in vitro and in vivo validation is not possible.
In literature, most of the FE models of the human mandible are not
validated. Besides, there is no standard method available to create and
validate FE analyses of mandible models. This study aims to develop
an accurate bone-implant modelling approach by investigating the
fixation of a mandibular angle fracture. The FE model’s credibility
was assessed in a biomechanical test to establish the suitability of the
use of FE methods in pre-surgical planning of mandibular fracture
treatment.Methods
A digital model of the mandible was created by segmenting the
mandibular cortical bone of a female patient’s CT scan. Two expe-
rienced craniomaxillofacial surgeons were involved in selecting and
placing the osteosynthesis plate (Medartis AG, Basel, Switzerland) to
fixate an unfavourable angle fracture with a high susceptibility for
deformation. The implant was designed explicitly for ORIF of
mandible angle fractures. From the patient data, Polyamide 12 (PA12)
mandibles (n = 11) were additive manufactured using Selective Laser
Sintering (SLS) technology. For the transfer of the virtual fracture
planning to the biomechanical/experimental setup, patient-specific
cutting and drilling guides were additive manufactured using PolyJet
printing technology with a photosensitive polymer DM_8505_Grey20
and OBJET 260 Connex (STRATASYS, Rechovot, Israel) to accu-
rately reproduce the placement of the fracture and the implant on the
n = 8 PA12 mandible models. The remaining mandibles (n = 3) were
used to determine suitable material properties for the FE model.
Tensile tests on PA12 samples were performed based on the ISO
527:2019 guidelines to determine the elastic and non-linear plastic
deformation of the material, which was incorporated in the engi-
neering data of the simulation. The FE model was set up according to
the biomechanical bench test. The intact mandible model was ana-
lyzed under loading, and suitable material and friction properties were
determined to validate the final, fractured model. In the biomechan-
ical tests, a servo-hydraulic testing machine (Walter and Bai AG,
Lohningen, Switzerland) applied a linear, uniaxial load to the
mandible angle area to allow the creation of a fracture gap at the
anterior border of the ramus. The load was applied in discrete 1 mm
steps, and the reaction force was recorded until 5 mm axial dis-
placement was reached. The stress-induced surface deformation of the
mandible and implant was recorded with an optical scanning device
(Atos 3 Triple Scan ARAMIS Professional, GOM GmbH, Braun-
schweig, Germany). The surface deformation and the fracture gap
were compared qualitatively and statistically with the FE simulation
results in MATLAB R2019b.Results
The comparison between the intact experimental and simulated
models resulted in a model with the E-Modulus of 1600 MPa, a non-
linear plastic deformation for the PA12 mandible according to the
tensile tests, as well as a friction coefficient of 0.2 for the mandible-
steel interface. The additive manufactured cutting and drilling guides
effectively reproduced the fracture location and implant positioning.
The qualitative analysis of the surface deformation showed a maxi-
mum deviation of 0.249 mm at the inferior border of the proximal
segment, as shown in Figure 1. The comparison of the FE analysis
and the biomechanical surface deformation of the fixed mandible
showed a high degree of agreement in the linear regression (1.045
slope, 0.06 mm offset, and an R2 of 99.7% (p\ 0.05)). The FE
model’s mean deformation was approximately - 0.11 mm with a
95% confidence level of [0.097 0.320] mm. At the maximum axial
deformation of 5 mm, the approximate deviation of 0.09 kN and
0.22 mm was recorded for the reaction force and fracture gap,
respectively (Table 1).Conclusion
In this study, a biomechanical test setup of a mandible angle fracture
model was reproduced in a computational model. The patient
mandible model was generated using additive manufacturing of
segmented CT data for the biomechanical examination. The FE data
regarding surface deformation showed a high level of agreement with
the experimental records. This confirms the validity of
using FE analysis for the representation of the biomechanical testing
outcome. However, to accurately predict the clinical outcome, the
model boundary conditions and material properties will have to be
adapted to more closely represent the in vivo conditions with the
objective of validating the FE results for the human mandible.
References
[1] Brucoli M, Boffano P, Pezzana A, Benech A, Corre P, Bertin H,
Pechalova P, Pavlov N, Petrov P, Tamme T, Kopchak A,
Romanova A, Shuminsky E, Dediol E, Tarle M, Konstantinovic
VS, Jelovac D, Karagozoglu KH, Forouzanfar T (2019) The
Table 1 The resulting reaction force (kN), and fracture gap (mm) in
the biomechanical experiment (n = 8) compared to the FE analysis
Axial deformation
(mm)
Reaction Force (kN) Fracture gap (mm)
Experiment FEA Experiment FEA
0 - 0.01 ± 0.00 - 0.01 0.01 ± 0.00 0
1 - 0.30 ± 0.07 - 0.25 0.23 ± 0.01 0.4
2 - 0.70 ± 0.06 - 0.74 0.64 ± 0.22 0.89
3 - 1.02 ± 0.04 - 1.10 1.18 ± 0.06 1.42
4 - 1.27 ± 0.04 - 1.35 1.79 ± 0.11 2.02
5 - 1.42 ± 0.04 - 1.51 2.42 ± 0.16 2.64
Fig. 1 Mandible and implant surface deviation of experimental 3D
scanned surface points and FE model geometry for the axial
deformation of 0 mm and 5 mm
S92 Int J CARS (2021) 16 (Suppl 1):S1–S119
123

‘‘European Mandibular Angle’’ research project: the analysis of
complications after unilateral angle fractures. Oral Surgery, Oral
Medicine, Oral Pathology and Oral Radiology 128(1), 14–17
[2] Merema BBJ, Kraeima J, Glas HH, Spijkervet FK, Witjes MJ
(2021) Patient-specific finite element models of the human
mandible: Lack of consensus on current set-ups. Oral Diseases
27(1), 42–51
Automatic segmentation and measurement of femoral
head necrosis in CT images
F. Cao1, J. Shen1, P. Chen2, J. Guo1, H. Ge3, S. Cai1, X. Xiong1
1Guangdong University of Technology, School of Automation,
Guangzhou, China 21st Affiliated Hospital Guangzhou University
of Chinese Medicine, Guangzhou, China 3Guangzhou Hospital
of Chinese and Western Medicine, Guangzhou, China
Keywords Automatic CT segmentation, Femoral head necrosis,
Necrotic bone segmentation, Necrotic bone measurement
Purpose
Femoral head-preserving surgery is often performed on a patient with
an early stage of osteonecrosis. During surgery, the femoral head is
evacuated through a window made at the femoral head–neck junction
and replaced by some specific bone materials. The volume of the
cavity in a femoral head, where necrotic bone is removed, should be
accurately measured. Recent studies propose automatic segmentation
methods for segmenting necrotic femoral head based on k-means [1]
or deep learning [2]. Overall accuracy of 81.5% in [1] and 38.9% in
[2] are reported. We propose an automatic CT image segmentation
method based on a confidence connected image filter and modified
geodesic active contour method. The evaluation of our method shows
that a mean of dice coefficients is 82.8% and a mean segmentation
error is 0.9 cm3.Methods
In this work, input data is a 3D CT image of a hip joint; output data
include the segmentation and the volume size of the necrotic area in a
femoral head. Our automatic segmentation method is based on (1) a
confidence connected image filter for rough segmentation and (2) the
well-known geodesic active contour method for segmentation
refinement. The segmentation result of step (1) is used as an initial
mask for the step (2) to improve the final segmentation result. The
volume size of a necrotic area is calculated by multiplying the voxel
size of the 3D CT image by the total number of voxels of the final
segmentation result.
1. Confidence connected image filter
Confidence connected image filter extracts a connected set of
pixels with pixel intensities close to a seed point. Histogram of the
CT image is computed and a range of pixel intensities of necrotic
bone is defined for automatic selection of a seed point. Then, the
mean and standard deviation across a neighborhood of the selected
seed point are calculated. They are used with a multiplier factor to
define a confidence interval. Pixels with intensity values within the
confidence interval are grouped. Finally, in the iteration step, the
mean and standard deviation of all the pixels in the previous seg-
mentation are re-calculated to grow the segmented area.
However, segmentation results of confidence connected image
filter contain some imperfections and holes. To solve this problem,
we use morphological method to fill the holes and obtain a rough
segmentation of necrotic bone.
2. Geodesic active contour with a shape-influenced term (GACS)
In a CT image, the boundary of necrotic area in femoral head is
not distinct, so we choose the well-known GACS segmentation
method which adds the shape and position information of an object to
aid the segmentation process. We propose to use the segmentation
result of step (1) as an initial contour for GACS method, thereby
avoiding manual initialization of level set. Moreover, it provides the
surface information of a femoral head to the GACS segmentation
process, that adds robustness at the step of the contour evolution. It is
because GACS method is based on a prior shape information of a
target object to evolve the initial contour globally towards to the
shape of the object. Locally, contour evolution is based on image
gradients and curvature. Output is a binary mask of the necrosis area
of a femoral head.Results
The proposed method was evaluated with 6 patients’’ 3D CT images
(size: 512 9 512 9 100, voxel size: 0.782 mm 9 0.782 mm 9 0.3
mm) with osteonecrosis. Algorithm was implemented in C ?? lan-
guage and Insight Toolkit (ITK). A CT slice of case 1 and the
automatic segmentation result are shown in Figure 1. We evaluated
the accuracy of our method with a ground truth (i.e. manual seg-
mentation of an orthopedic surgeon). For each case, we computed
dice coefficients using each slice of automatic segmentation and the
corresponding slice of the ground truth; then, we calculated a root
mean square (RMS) and a standard deviation (STD) using these dice
coefficients, as shown in table 1. The mean of dice coefficients of 6
cases were 82.8%. In addition, a volume size of necrotic bone in
femoral head was computed for each case (table 1). We found a mean
difference of necrotic bone volumes between our segmentation and
the ground truth was 00.9 cm3 (boxplot in Figure 1).Conclusion
The main contribution of this work is to propose an automatic CT
image segmentation method for osteonecrosis. It is based on confi-
dence connected image filter and geodesic active contour method.
The evaluation results show that the proposed method is able to
segment femoral head necrosis in a reasonable accuracy which is
Fig. 1 A slice of CT image of case 1 (left), automatic segmentation
of the CT slice (middle) and a boxplot of the volume difference from
table 1 (right)
Table 1 Evaluation of the proposed method with the ground truth
Cases RMS dice
(%)
STD
dice (%)
Volume of necrotic
bone/cm3Volume diff./
cm3
Automatic Ground
truth
1 83.6 4.45 6.87 5.96 0.91
2 81.7 4.58 5.03 6.11 1.08
3 83.2 3.76 5.28 4.35 0.93
4 80.3 5.61 4.06 4.93 0.87
5 82.9 4.37 5.62 4.78 0.84
6 85.2 4.12 8.31 7.52 0.79
Mean 82.8 4.48 5.86 5.61 0.9
Int J CARS (2021) 16 (Suppl 1):S1–S119 S93
123

higher than the accuracy in other studies [1] [2]. The segmentation
results can be used for our augmented reality application for femoral
head-preserving surgery. Future work will combine CT and MRI
image in order to improve the segmentation accuracy and extract
more anatomical information in osteonecrosis area.
References
[1] Zoroofi RA, Sato Y, Nishii T, Sugano N, Yoshikawa H, Tamura
S (2004) Automated segmentation of necrotic femoral head from
3D MR data. Comput Med Imaging Graph 28(5): 267–78
[2] Pham DD, Dovletov G, Serong S, Landgraeber S, Jager M, Pauli
J (2020) Multitask-learning for the extraction of avascular
necrosis of the femoral head in MRI. Bildverarbeitung fur die
Medizin: 150–155
Gated convolution network for spine CT inpaintingR. Wang1, G. Zheng1, Y. Zhao1
1Shanghai Jiao Tong University, Shanghai, China
Keywords Partial Convolution, Gated Convolution, Spine CT, Image
Inpainting
Purpose
Numerous factors could lead to partial occlusion of medical images
which may affect the accuracy of further image analysis tasks such as
semantic segmentation, registration, etc. For example, metallic
implants may cause part of the images to deteriorate. The objective of
this study is to develop an efficient deep-learning based method to
inpaint missing information and to evaluate its performance when
applied to spinal CT images with metallic implants.Methods
Prior to the partial convolution concept introduced in [1], the
inpainting algorithm based on standard convolution usually initialize
the holes with some constant placeholder value, and the pixels inside
and outside the holes are both regarded as valid pixels. As a result,
these methods often produce artifacts so that expensive post-pro-
cessing needs to be introduced to reduce the impacts of artifacts. To
deal with this limitation, the partial convolution applies a masked
convolution operation that is normalized to be conditioned only on
valid pixels. Then a rule-based mask update strategy that updates the
valid locations layer by layer is followed. Partial convolution
improves the quality of inpainting on the irregular mask, but it still
has remaining issues, such as the mask update mechanism ignoring
the receptive field, a varying amount of valid feature points (or pixels)
leading to consistent update results, etc. To address the above limi-
tations, the gated convolution is proposed in [2]. Different from the
rule-based hard-gating mask updating mechanism in partial convo-
lution, the gated convolution is able to learn the gating mechanism to
dynamically control the feature expression of each spatial position of
each channel, such as inside or outside masks. Inspired by [2], we
propose a gated convolution network (GCN) for spine CT inpainting.
The GCN adopts the framework of the generative adversarial network
(GAN), which is composed of a generator and discriminator.
Specifically, the generator consists of coarse and refinement networks,
and both of them use a simple encoder-decoder structure similar to
Unet. While the differences are mainly in the following two points.
First, all conventional convolutions are replaced by the gated con-
volution. Secondly, in image inpainting tasks, it is important that the
size of the receptive field is large enough. Therefore, we removed the
two downsampling layers in Unet and introduced dilated convolution
to expand the model receptive filed without increasing any parame-
ters. Then the combination of dilated convolution and gated
convolution, dilated gated convolution, is applied to the GCN. In
addition, rich and global contextual information is an important part
of discriminant representation for pixel-level visual tasks. However,
the convolution operations lead to a local receptive field and thus are
not effective for borrowing features from distant spatial locations. To
overcome the limitation, we integrate a contextual attention module to
capture long-range dependencies. For the discriminator, motivated by
global and local GANs, MarkovianGANs, perceptual loss, and
spectral-normalized GANs, a spectral-normalized Markovian dis-
criminator is presented to distinguish the inpainting results from the
ground truth, thereby prompting the generator to produce more real-
istic results.Results
We evaluate the proposed GCN on the spine CT data from 50 dif-
ferent patients, 10 of which contain real pedicle screw implants. Due
to the lack of registered reference image before pedicle screw
implantation, the 10 data could not be quantitatively evaluated at the
pixel level. Therefore, we adopt subjective experiments to qualita-
tively evaluate the inpainting image quality of this part of the data.
For the other 40 data without implants, we randomly select 20 of them
to use the free-form mask generation method to synthesize corre-
sponding masks for training and validation (16 data for training and 4
data for validation). To quantitatively and realistically evaluate the
performance of the two inpainting algorithms, for the remaining 20
data, we developed a method to generate simulated pedicle screw
implant masks. We respectively adopted subjective and objective
methods to evaluate the performance of our method on real data and
simulated data. The subjective evaluation metric refers to Mean
Opinion Score (MOS), and the objective evaluation metrics include
commonly used Mean Absolute Error (MAE), Peak Signal to Noise
Ratio (PSNR), and Structural Similarity Index Measure (SSIM). The
Table 1 The quantitative evaluation results of PCN and GCN on the
simulated data
Case
number
MAE PSNR SSIM
GCN PCN GCN PCN GCN PCN
1 3.3167 3.5547 45.1766 44.9548 0.9971 0.9969
2 2.0114 2.4877 48.1416 46.6749 0.9982 0.9976
3 1.7505 3.6995 50.5821 45.1820 0.9982 0.9932
4 1.8512 3.4265 49.6895 44.9026 0.9970 0.9917
5 2.3212 3.2296 47.9500 45.2147 0.9960 0.9917
6 2.7930 3.1543 45.7366 44.9263 0.9974 0.9968
7 3.8326 4.8446 43.2729 41.5865 0.9945 0.9923
8 1.8237 3.4827 50.1937 45.2708 0.9973 0.9903
9 6.6554 7.3014 39.4796 38.8284 0.9880 0.9858
10 2.8412 3.4628 46.7240 45.1855 0.9957 0.9939
11 1.7596 2.7496 49.3223 45.9686 0.9881 0.9726
12 3.2994 4.9775 45.0228 42.6120 0.9610 0.9421
13 2.5129 4.4035 46.8528 42.9081 0.9906 0.9746
14 2.3651 2.6504 46.8711 45.6282 0.9830 0.9777
15 1.7867 3.9835 50.3818 44.5360 0.9973 0.9886
16 3.4360 5.3470 44.5197 41.1009 0.9934 0.9866
17 2.4982 3.0073 46.4653 44.5323 0.9984 0.9974
18 2.0163 3.1258 47.8110 43.7487 0.9989 0.9977
19 3.6754 4.0220 44.0539 42.8442 0.9973 0.9972
20 1.4526 3.7497 51.0639 44.5460 0.9975 0.9885
Mean 2.7000 3.8330 46.9655 44.0576 0.9932 0.9877
S94 Int J CARS (2021) 16 (Suppl 1):S1–S119
123

evaluation of the inpainting effect consists of two parts: quantitative
evaluation of simulated data with reference images and qualitative
evaluation of real data without reference images. The quantitative
evaluation results of PCN and GCN on the simulated data are shown
in Table 1. From a one-to-one quantitative comparison, the MAE of
GCN on each data is lower than PCN, while PSNR and SSIM are
higher than PCN, which indicates that the superiority of GCN over
PCN in quantitative evaluation metrics is universal. For real implant
data, we conducted subjective experiments and used MOS to evaluate
the performance of the two models. Finally, the average MOS of
GCN and PCN is 8.18 and 7.12, respectively, which indicates that the
subjects generally believe that the inpainting results of GCN are more
realistic. Figure 1 shows visual examples of image inpainting results
based on two algorithms. It can be observed that there are faint traces
of implants in the inpainting result of PCN, while the traces are
almost imperceptible in the inpainting result of GCN.Conclusion
In this study, we propose a gated convolution network for spine CT
inpainting. The GCN is based on the generative adversarial network
for more realistic prediction, and the gated convolution is used to
learn a dynamic feature selection mechanism for each channel and
each spatial location. To evaluate the performance of GCN, we
respectively carry out a quantitative evaluation on simulated data with
reference, and qualitative evaluation on real data without reference.
The experimental comparison results with the state-of-the-art method
PCN show that the qualitative and quantitative evaluation of GCN has
universal advantages. From the final visualization results, we believe
that GCN has the potential to be applied to clinical practice.
References
[1] Liu G, Reda FA, Shih KJ, Wang TC, Tao A, Catanzaro B (2018)
Image inpainting for irregular holes using partial convolutions.
In Proceedings of the European Conference on Computer Vision
(ECCV) (pp. 85–100).
[2] Yu J, Lin Z, Yang J, Shen X, Lu X, Huang TS (2019). Free-form
image inpainting with gated convolution. In Proceedings of the
IEEE International Conference on Computer Vision (pp.
4471–4480).
3D modeling in hand surgery—a comparison of data
quality from multi sliced CT (MSCT) and cone beam
CT (CBCT) using different software
P. Honigmann1,2,3,4, N. Sharma3,4,5, P. Brantner4,6, F. Thieringer3,4,5,
M. Haefeli2,7
1Kantonsspital Baselland, Hand Surgery, Liestal, Switzerland2Amsterdam UMC, University of Amsterdam, Department
of Biomedical Engineering and Physics, Amsterdam Movement
Sciences, Amsterdam, Netherlands 3Medical Additive Manufacturing,
Department of Biomedical Engineering, University Basel, Basel,
Switzerland 43D Print Lab, University Hospital Basel, Basel,
Switzerland 5University Hospital Basel, Department of Oral
and Cranio-Maxillofacial Surgery, Basel, Switzerland 6University
Hospital Basel, Radiology Department, Basel, Switzerland7Kantonsspital Graubunden, Hand Surgery, Chur, Switzerland
Keywords Cone Beam CT, Multi sliced CT, Segmentation, 3D
modeling
Purpose
A high level of data quality is mandatory for 3D-modelling in Hand
Surgery. Used data are Digital Communication in Medicine
(DICOM)-images obtained by computed tomography (CT) scans.
The digital three-dimensional (3D) preparation of acquired data is
usually in the hands of the radiologist who is a mandatory member of
the team offering a 3D-printing service in-hospital.
Usually a multi-detector CT (MDCT)-scanner is available in lar-
ger hospitals and sometimes a Magnetic Resonance Imaging (MRI)
machine. During the last decade the use of cone-beam computed
tomography (CBCT) extended from the main application field of
dental imaging to hand- and foot imaging. Recent developments aim
for full body cone-beam computed tomography.Methods
We compared the quality of the data obtained by MSCT and CBCT
using different segmentation software (Mimics, DDS Pro, Horos,
DISIOR) to create 3D models for hand surgical purposes. The data
were compared using standard registration procedures in GOM
Inspect and Mimics.Results
There are differences in terms of quality of segmentation between the
types of software. DIfferences were below 1 mm. We found that -
DICOM-data from cone beam CT showed less noise and artifacts
compared to multislice CT data. This led to better segmentation
results which facilitated 3D modeling, see figures 1 and 2.
Fig. 1 Example cases of qualitative comparison on real data, where
a, b, c represent input with implants, inpainting result of PCN and
inpainting result of GCN
Fig. 1 Palmar-dorsal view of a segmented wrist model comparing of
segmentation results of Mimics and DDS of CBCT DICOM-data
Int J CARS (2021) 16 (Suppl 1):S1–S119 S95
123

Conclusion
DICOM data obtained by CBCT meet the quality requirement of
almost all purposes for 3D modeling in Hand Surgery. There need to
be an awareness that differences in segmentation procedures throuout
the available software on the markers may lead to clinically relevant
changes in 3D-modeling for a precision needed for hand surgical
purposes.
Computer-aided planning of personalized biopsy
of brain tumor based on multi-modality fusion
Y. Zhao1, G. Zheng1
1Shanghai Jiao Tong University, School of Biomedical Engineering,
Institute of Medical Robotics, Shanghai, China
Keywords Biopsy planning system, Multi-modality image fusion,
Semi-automatic segmentation, MITK
Purpose
The biopsy of brain tumor plays a vital role in the minimally invasive
interventional treatment of tumor. The accuracy of the biopsy of the
tumor directly determines the therapeutic effect of the subsequent
surgery. At present, the clinical biopsy of tumors is generally per-
formed by free-hand under image-guidance. There are still many
drawbacks to free-hand biopsy, which limit the clinical use of biopsy
technology. The primary research goal of this paper is to study several
key technical problems in the process of biopsy surgery, and a
computer-aided personalized biopsy planning system of brain tumor
is developed to provide the surgeon with more spatial information
about the tumor while reducing the fatigue of the surgeon, and assist
the surgeon in completing the biopsy operation more conveniently
and accurately.Methods
A personalized biopsy planning system of brain tumor is developed
based on the Medical Imaging Interaction Toolkit (MITK), which
consists of four parts: multi-modality image registration and fusion
module, semi-automatic segmentation module, 3D reconstruction
module and plan design of biopsy path module.
For the multi-modality image registration and fusion module, a
multi-modality image 3D rigid registration method based on mutual
information is designed to register the MR image into the physical
space of the CT image. The registered MR image and the CT image
are fused with an average weighting method, so that the fused image
contains both the tumor and soft tissue information in the MR image
and the bone and skin information in the CT image. The multi-
modality image registration algorithm is implemented by the Insight
Toolkit (ITK). The multi-modality image registration and fusion
module is integrated into the biopsy planning system as the ‘‘Regis-
tration plugin’’.
For the semi-automatic segmentation module, the graph cut
algorithm[1] is used to semi-automatically segment brain tumor in the
registered MR image. With the graph cut algorithm, users need to
interactively delineate the tumor area and the normal tissue area on
the registered MR image, and the algorithm will automatically
complete the segmentation calculation of the entire tumor area. The
graph cut algorithm is implemented by the Insight Toolkit (ITK). The
semi-automatic segmentation module is integrated into the biopsy
planning system as the ‘‘GraphCut3D plugin’’.
For the 3D reconstruction module, a reconstruction pipeline based
on the marching cubes algorithm[2] is designed. Before the marching
cubes algorithm, the image pre-processing operations, such as median
filtering and Gaussian filtering, are used to reduce noise in the image.
Then the marching cubes algorithm is used to reconstruct the 3D
mesh model of the surface skin and tumor. After the surface model is
obtained, post-processing operations are used to improve the quality
of the model, such as mesh smoothing, normal vector calculation, and
connected region analysis. Based on the CT image and the segmented
tumor binary image, 3D mesh models of the surface skin and tumor
are reconstructed respectively. The reconstruction pipeline is imple-
mented by the Visualization Toolkit (VTK). The 3D reconstruction
module is integrated into the biopsy planning system as the ‘‘Mesher
plugin’’.
For the plan design of biopsy path module, users can interactively
select biopsy target point and needle entry point on the tumor and skin
surface to generate the biopsy path, and interactively cut out the skin
surface to generate a biopsy guide plate STL model through 3D
printing. The biopsy guide can be obtained to assist the surgeon to
realize a more accurate and personalized biopsy plan design of brain
tumor. The plan design of biopsy path module is integrated into the
biopsy planning system as the ‘‘Plan Design plugin’’.Results
The multi-modality image registration algorithm is evaluated on the
‘‘ACRIN-FMISO-Brain’’ dataset from ‘‘The Cancer Imaging Archive
(TCIA)’’. The Euclidean distance between the anatomical landmarks
after registration is calculated to represent the registration error. The
graph cut algorithm is evaluated on the ‘‘MICCAI BraTS2017’’
dataset. The dice similarity coefficient (DSC), positive predictive
value (PPV) and sensitivity are calculated to represent segmentation
accuracy. The mean registration error is 1.3321 ± 0.3070 mm. The
mean DSC is 0.9130 ± 0.0188, the PPV is 0.9387 ± 0.0297, and the
sensitivity is 0.8910 ± 0.0452.The results of registration error and
segmentation accuracy are shown in Table 1. With the aid of the
biopsy planning system, the surgeon can perform a personalized
biopsy plan design for the patient, and the biopsy guide will be
generated to assist the surgeon in performing the biopsy operation.
Fig. 2 Dorso-palmar view of a segmented wrist model comparing of
segmentation results of Mimics and DDS of CBCT DICOM-data
Table 1 The results of registration error and segmentation accuracy
Segmentation accuracy Registration error
(mm)DSC PPV Sensitivity
Mean 0.913 0.9387 0.891 1.3321
Median 0.921 0.9552 0.9077 1.1896
Maximum 0.9404 0.9825 0.9536 2.3478
Minimum 0.8803 0.8838 0.8 0.5291
Standard deviation 0.0188 0.0297 0.0452 0.307
S96 Int J CARS (2021) 16 (Suppl 1):S1–S119
123

The interface of the biopsy planning system is shown in figure 1.
The data management module is located on the left side of the system
interface, which is used to manage, display and modify data. The core
plugins are located on the right side of the system interface, which
realize the functions of registration and fusion, semi-automatic seg-
mentation, 3D reconstruction and planning design respectively. The
four windows in the middle of the system interface display two-
dimensional images of different views and three-dimensional space
respectively. Figure 1 shows the result of the biopsy planning. The
red tumor model reconstructed from the 3D reconstruction module is
segmented from the registered MR image, which is in the same space
as the CT skin model. The path pointed by the white guide plate hole
is the biopsy path designed by the user. This guide model can be used
to assist in biopsy surgery after being printed by 3D printing
technology.Conclusion
A computer-aided personalized biopsy planning system of brain
tumor is developed to help the surgeon design an ideal biopsy path of
brain tumor before surgery, thereby reducing the complexity of
biopsy surgery, increasing the success rate of subsequent surgery, and
reducing the amount of extra trauma and radiation for patients. With
the aid of this system, the surgeon can complete the biopsy operation
more conveniently and accurately.
References
[1] Boykov YY, Jolly MP (2001) Interactive graph cuts for optimal
boundary & region segmentation of objects in ND images.
In Proceedings eighth IEEE international conference on com-
puter vision. ICCV 2001 (Vol. 1, pp. 105–112). IEEE.
[2] Lorensen WE, Cline HE (1987) Marching cubes: A high
resolution 3D surface construction algorithm. ACM siggraph
computer graphics, 21(4), 163–169
Semantic segmentation for tooth type using DeepLab v3
with adversarial training
D. Hayashi1, R. Nakayama1, A. Hizukuri1, K. Murata2
1Ritsumeikan, Electronic and Computer Engineering, Noji-higashi,
Kusatsu, Shiga, Japan 2TAKARA TELESYSTEMS Corp.,
Oosakashichuoku, Osaka, Japan
Keywords Semantic Segmentation for Toot, Adversarial Training,
Panoramic Dental X-ray Imaging, Computer Aided Diagnosis
Purpose
Although panoramic dental X-ray imaging is usually used for diag-
nosis of dental lesion, the spatial resolution of those images is
relatively low. Thus, small and obscure lesions are often overlooked.
Therefore, it is desirable to develop a computer-aided diagnosis
(CAD) scheme for panoramic dental X-ray images. In the CAD
scheme for dental images, it is often necessary to segment tooth for
each tooth type.
Semantic segmentation (SS) is one of the labeling methods that
associate each pixel of an image with a class label. The SS models
have been developed with deep learning approaches such as convo-
lutional neural networks (CNNs). Those SS models are usually
trained to minimize the error in an entire image. When applying those
SS models to the segmentation of small region such as each tooth, the
segmentation accuracy might be low. It is necessary in the segmen-
tation of each tooth to train the SS model with more focus on image
features for each tooth type.
There is an adversarial training as a learning method to train
Generative Adversarial Network (GAN). In this study, we propose a
computerized method for the segmentation of tooth focusing on each
tooth type by applying the adversarial training to the learning of a SS
model. A novel network was constructed by adding a CNN to the SS
model. The added CNN classified ROIs (region of interest) sur-
rounding a tooth extracted from a SS result image and the teacher
label image. The SS model and the CNN in the proposed network
were learned with the adversarial training.Methods
Our database consisted of 161 panoramic dental X-ray images
obtained from 161 patients. Label images for each of 32 tooth types
were generated by manually annotating each tooth region in the
panoramic dental X-ray images. Those images were randomly divided
into three datasets. The training, validation, and test datasets included
81, 20, and 60 images, respectively.
In this study, a novel network was constructed by adding a CNN to
a SS model for the segmentation of tooth for each tooth type. Figure 1
shows the proposed network. To determine the SS model to use in the
proposed network, three different SS models (FCN, U-Net, and
DeepLab v3) were employed to segment tooth for tooth type. The
model with the highest segmentation accuracy for the validation
dataset was then determined as the optimal SS model. Based on the
label image, ROIs (region of interest) surrounding each tooth were
extracted from the original image, the label image, and the SS result
image, respectively. The pair of the original ROI and the label ROI or
the SS ROI was inputted to the added CNN. The CNN outputted two
classification results. The CNN discriminated the SS ROI pair from
the label ROI pair, and also identified the tooth type of the inputted
ROI pair. The added CNN was constructed from five layer-blocks
consisting of a convolutional layer, a Leaky ReLU, and a batch
normalization layer. The SS model was trained with more focus on
Fig. 1 Interface of the biopsy planning system
Fig. 1 Schematic of the proposed network
Int J CARS (2021) 16 (Suppl 1):S1–S119 S97
123

image features for each tooth type by applying the adversarial training
to the SS model and the added CNN. In this study, IoU (Intersection
over Union) was used as the evaluation index for the segmentation
accuracy of tooth for each tooth type.Results
The mean IoU with DeepLab v3 for the validation dataset was 0.562,
which was significantly improved compared to FCN (0.554,
P = 0.023) and U-Net (0.488, p\ 0.001). Therefore, DeepLab v3
was determined as the optimal SS model in the proposed network.
The mean IoU with the proposed network for the test dataset was
0.687, which was greater than that with DeepLab v3 (0.611,
p\ 0.001). Tooth roots with a low contrast to the alveolar bone were
more accurately segmented using the proposed network than DeepLab
v3.Conclusion
To train the SS model with more focus on image features for each
tooth type, a novel network was constructed by adding a CNN to
DeepLab v3. The proposed network with the adversarial training
exhibited higher segmentation accuracy of tooth in panoramic dental
X-ray images compared to DeepLab v3.
Computer-aided diagnosis method for radiographic
bone loss and periodontitis stage based on deep
learning: a multi-device study
S. J. Lee1, H. J. Chang2, S. Yang1, T. H. Yong1, J. Kim3, W. J. Yi1,2,3
1Seoul National University, Department of Biomedical Radiation
Sciences, Seoul, South Korea 2Seoul National University, Department
of Oral and Maxillofacial Radiology, Seoul, South Korea 3Seoul
National University, Department of Bioengineering, Seoul, South
Korea
Keywords Deep learning, Computer-aided diagnosis (CAD), Peri-
odontitis, Radiographic bone loss
Purpose
Periodontal diseases, including gingivitis and periodontitis, are some
of the most common diseases that humankind suffers from. In 2017,
the American Academy of Periodontology and the European Feder-
ation of Periodontology proposed a new definition and classification
criteria for periodontitis based on a staging system [1].
In our previous study, a deep learning hybrid framework was
developed to automatically stage periodontitis on dental panoramic
radiographs according to the criteria that was proposed at the 2017
World Workshop [2]. In this study, the previously developed frame-
work was improved in order to classify periodontitis into four stages
by detecting the number of missing teeth/implants using an additional
CNN. A multi-device study was performed to verify the generality of
the method.Methods
OverviewFigure 1 shows the overall process for a deep learning-based CAD
method for measuring the radiographic bone loss (RBL) and deter-
mining the periodontitis stage.
Data preparationThe panoramic radiographs of each patient were acquired with three
dental panoramic X-ray machines from three devices. A total of 410
panoramic radiographs of the patients were acquired by using device
1, an orthopantomograph OP 100 (Instumentarium corporation,
Tuusula, Finland). A total of 60 panoramic radiographs of the patients
for devices 2 and 3 were acquired using PaX-i3D Smart (Vatech,
Seoul, Korea) and Point3D Combi (PointNix, Seoul, Korea),
respectively. With regard to the panoramic image dataset, 500, 500,
and 300 images were used to detect the anatomical structures, such as
the periodontal bone level (PBL), cementoenamel junction level
(CEJL), and teeth/implants, respectively.
To detect the location of the missing teeth and to quantify their
number, the image of the patient with the missing teeth was selected
and classified into two types according to the number of missing teeth.
The loss of one non-contiguous tooth was classified as type 1, and loss
of two consecutive teeth was classified as type 2. As a result of the
selection, 147 and 62 images were used for detecting and quantifying
the missing teeth for type 1 and type 2, respectively.
Detection of anatomical structures using CNNBy using a similar procedure in a previous study [2], the PBL was
annotated as one simple structure for the whole jaw on the panoramic
radiograph; the CEJL of the teeth (the fixture top level of implants)
was annotated as one structure that included the crowns of the teeth
and implants at the maxilla and the mandible, respectively.
Mask R-CNN was trained for detecting the PBL, CEJL, and teeth/
implants by using the multi-device image dataset. After training the
CNN, the segmentation accuracy of each CNN was calculated using
the images in the test set. The CNN was implemented by using Python
with the Keras and TensorFlow libraries. The CNN was trained by
applying the transfer learning method based on the weights that were
calculated in the previous study.
After training, the CNNs produced a segmentation mask of the
anatomical structures for the input panoramic image. The periodontal
bone levels were then detected by extracting the edge of the seg-
mented image (Figure 2a–c). The same process was applied for the
detection of the CEJL (Figure 2d–f), teeth, and implants from their
segmentation mask (Figure 2g–i).
Detection of the missing teeth using the CNNsEach image was manually labeled by drawing rectangular bounding
boxes around the location of the missing teeth with a labeling soft-
ware for the bounding box detection task named the YOLO mark.
Two modified CNNs from the YOLOv4 networks named CNNv4,
and CNNv4-tiny were used for detecting and quantifying the missing
Fig. 1 Overall process for a developed computer-aided diagnosis
method for radiographic bone loss and periodontitis stage based on
deep learning on dental panoramic radiographs
S98 Int J CARS (2021) 16 (Suppl 1):S1–S119
123

teeth on the panoramic radiographs. The network was trained on a
total of 2000 epochs with a 64-batch size and one- or two-stride sizes.
Staging periodontitis by the conventional CAD methodThe method of automatically diagnosing the stage of periodontitis
was the same as the method that was used in our previously published
paper [2]. The RBL of the tooth was automatically classified to
identify the stage of periodontitis according to the criteria that was
proposed at the 2017 World Workshop [1].Results
Detection performance for the anatomical structures and themissing teeth.The DSC values for Mask R-CNN were 0.96, 0.92, and 0.94, for the
detection of the PBL, CEJL, and teeth/implants, respectively.
For the detection of the missing teeth, the precision values for
CNNv4-tiny, and CNNv4 were 0.88, and 0.85, respectively. The
recall values for CNNv4-tiny, and CNNv4 were 0.85, and 0.85,
respectively. The F1-score values for CNNv4-tiny, and CNNv4 were
0.87, and 0.85, respectively. The mean of the AP values for CNNv4-
tiny, and CNNv4 were 0.86, and 0.82, respectively.
Classification performance for the periodontitis stages.Figure 2 shows the completely classified stages of the periodontitis
for the teeth/implants using the multi-device images.
To evaluate the classification performance of the periodontal bone
loss, the mean absolute differences (MAD) between the stages that
were classified by the automatic method and the radiologists’’ diag-
noses were compared. These MAD values were 0.26, 0.31, and 0.35
for the radiologists with ten-years, five-years, and three-years of
experience, respectively, for the teeth of the whole jaw. The overall
MAD between the stages with the automatic method and the radiol-
ogists while using all the images was 0.31. For the images from
multiple devices, the MAD values were 0.25, 0.34, and 0.35 for
device 1, device 2, and device 3, respectively, for the teeth/implants
for the whole jaw.Conclusion
The developed method used the percentage rate of the periodontal
bone loss to automatically and classify the periodontitis into four
stages of the whole jaw according to the renewed criteria that was
proposed at the 2017 World Workshop [1]. The developed method
can help dental professionals to diagnose and monitor periodontitis
systematically and precisely on panoramic radiographs. In future
investigations, the method must be improved to diagnose the stage of
periodontitis while considering both the severity and complexity
factors.
References
[1] Tonetti MS, Greenwell H, Kornman KS (2018) Staging and
grading of periodontitis: Framework and proposal of a new
classification and case definition. Journal of Clinical Periodon-
tology, 2018. 45 Suppl 20: p. S149-S161
[2] Chang H-J, Lee S-J, Yong T-H, Shin N-Y, Jang B-G, Huh K-H,
Lee SS, Heo M-S, Choi S-C, Kim T-I, Yi W-J (2020) Deep
Learning Hybrid Method to Automatically Diagnose Periodontal
Bone Loss and Stage Periodontitis. Scientific Reports,
2020. 10(1): 7531
Acknowledgements
This work was supported by the Korea Medical Device Development
Fund grant funded by the Korea government (the Ministry of Science
and ICT, the Ministry of Trade, Industry and Energy, the Ministry of
Health & Welfare, the Ministry of Food and Drug Safety) (Project
Number: 202011B05).
Intraoperative feedback for laparoscopic access
with surgical audio guidance
M. Spiller1, T. Suehn1, N. Esmaeili1,2, A. Boese1, M. Friebe1, A.
Illanes1
1Otto-von-Guericke University, Medical Faculty, INKA—Innovation
Laboratory for Image Guided Therapy, Magdeburg, Germany2Technical University Munich, Chair for Computer Aided Medical
Procedures and Augmented Reality, Munich, Germany
Keywords Laparoscopic Access, Needle Guidance, Audio Sensing,
Real-time Feedback
Purpose
For the laparoscopic access, the artificial creation of a pneumoperi-
toneum, carbon dioxide must be introduced into the abdominal cavity
to create the field of vision and work for the laparoscopic procedure.
For the safe generation of the pneumoperitoneum at the beginning of
a laparoscopic procedure, the Veress needle is widely used. Currently,
there is no imaging modality or other means of providing navigation
information for this procedure. The surgeons rely on their sense of
touch to guide the Veress needle. Due to this subjective and error-
prone technique, the procedure is associated with considerable risks.
About 50% of all laparoscopy complications, like injuries to blood
vessels or intra-abdominal organs, are caused when surgical access is
created [1]. In addition to the patient’s risk and an extended recovery
time, this results in considerable additional procedure time and cost.
Alternative sensor-based tools have been proposed for improving
the precision and safety of laparoscopic access. Usually, those solu-
tions comprise of a sensor embedded at the tip of the tools leading to
direct tissue contact and sterilization issues. Additionally, those tools
are mostly complex and expensive and have not been commercially
successful.
Proximal audio sensing has demonstrated to be able to differen-
tiate between Veress needle events and detect tissue-layer crossings
[2]. This concept uses an audio sensor mounted to the proximal end of
a tool to capture information about tool-tissue interactions. Based on
this concept, we are developing Surgical Audio Guidance (SURAG).
This intraoperative feedback system processes the acquired audio
signal and extracts useful guiding information to provide safety-rel-
evant feedback. We proposed and tested an auditory and a visual
feedback method. The results show that the information provided is in
Fig. 2 The stages of the periodontitis for each tooth and implant on
the dental panoramic radiographs acquired from multiple devices. The
automatic diagnosis results by the developed method on the
images. The first, second, and third rows are the images from the
device 1, device 2, and device 3, respectively
Int J CARS (2021) 16 (Suppl 1):S1–S119 S99
123

line with the events detected by proximal audio sensing and can
enhance the surgeons’ perception.Methods
The visual feedback is based on the time-domain audio signal and its
Continuous Wavelet Transformation (CWT) and is presented in real-
time to the surgeon. To evaluate this variant, 40 needle insertions
were performed using two types of Veress needles, one for single-use
and one for multiple-use. As shown in Figure 1, the insertions were
performed by a testing machine (Zwicki, Zwick GmbH & Co. KG,
Ulm) that recorded the axial needle insertion force at 100 Hz, while
the needle was inserted into an ex vivo porcine tissue phantom at an
insertion velocity of 8 mm/s. An audio signal was acquired during the
insertion at a sampling frequency of 16.000 Hz using a MEMS
microphone sensor placed at the needle’s proximal end. The acqui-
sition of force and audio was synchronized using a trigger event
visible in both the force and the audio signals. The visual feedback
was evaluated by comparing the events observed in the audio and
CWT spectrum with the reference force signal.
The auditory feedback was implemented into a small add-on
mounted to the proximal end of a Veress Needle. The add-on com-
prises of a piezoelectric MEMS microphone (PMM-3738-VM1000-R,
Vesper, Boston), an nRF52832 microcontroller (Nordic Semicon-
ductor, Trondheim) for digital processing, and a speaker for playing
the feedback. Due to the speaker’s low mass and damping measures in
the add-on housing, it is ensured that potential vibrations caused by
the speaker do not interfere with the audio acquisition. To evaluate if
the auditory feedback enhances the surgeons’ perception of tissue-
layer crossings, compared to the existing approach, the add-on has
been tested by three domain experts who repeatedly inserted different
Veress needles into an ex vivo porcine tissue phantom.Results
Figure 2 shows an exemplary comparison of an audio and a force
signal and the time-domain visual feedback. Each significant response
in the audio and CWT spectrum corresponds to an event triggered by
the Veress needle’s entry into a major anatomical structure, identifi-
able by a significant peak in the force signal. For each of these events,
a response in the spectrum can be observed. Equal observations have
been made for more than 95% of the insertions independent of the
needle’s type and the insertion velocity. This indicates that the visual
feedback can accurately display tissue-layer crossings during
laparoscopic access.
For the auditory feedback, the domain experts invited to test the
add-on consistently stated that the feedback was in line with their
tactile feedback and enhances their perception of tissue-layer cross-
ings. Furthermore, they indicated that additional feedback might be
constructive for young surgeons with limited experience in per-
forming laparoscopic access and obese patients, where the detection
of tissue-layer crossings is challenging.Conclusion
In this work, we explored the suitability of a visual and an auditory
feedback variant for enhancing the surgeons’ perception of tissue-
layer crossings during laparoscopic access using the Veress needle.
Different needle types were tested at various insertion velocities to
evaluate if visual feedback based on Continuous Wavelet Transfor-
mation can accurately display tissue-layer crossings. Additionally, an
add-on for auditory feedback has been implemented and tested by
domain experts.
The results confirm that both feedback variants are accurate and
enhance the surgeons’ perception of tissue-layer crossings while
being independent of the Veress needle’s type and insertion veloci-
ties. The findings indicate that Surgical Audio Guidance could be an
efficient means to improve precision and safety during laparoscopic
access and motivate further research and development on the feed-
back variants presented in this paper.
References
[1] Alkatout I (2017) Complications of Laparoscopy in Connection
with Entry Techniques. Journal of Gynecologic Surgery 33, 3
(2017), 81–91. https://doi.org/10.1089/gyn.2016.0111
[2] Schaufler A, Suhn T, Esmaeili N, Boese A, Wex C, Croner R,
Friebe M, Illanes A. (2019) Automatic differentiation between
Veress needle events in laparoscopic access using proximally
attached audio signal characterization. Current Directions in
Biomedical Engineering 5, 1 (2019), 369–371.
https://doi.org/10.1515/cdbme-2019-0093
Fig. 1 The visual feedback has been tested using a Zwick testing
machine that inserts a Veress needle into an ex vivo porcine tissue
phantom. The audio sensor is mounted to the proximal end of the
needle
Fig. 2 The comparison of the audio (top) and the force (bottom)
signal with the CWT-based feedback shows that events triggered by
tissue-layer crossings can be clearly observed in the visual feedback
S100 Int J CARS (2021) 16 (Suppl 1):S1–S119
123

Non-rigid cutaneous tissue deformation estimation
with iterative RANSAC and TPS from digital images
over semi-ambiguous artificial markings
C. Shi1, D. P. DeMeo2,3, E. L. Larson2, J. M. Galeotti1,
B. T. Carroll2,4
1Carnegie Mellon University, Robotics Institute, Pittsburgh, United
States 2University Hospitals, Department of Dermatology, Cleveland,
United States 3Case Western Reserve, School of Medicine,
Cleveland, United States 4Case Western Reserve, Department
of Dermatology, Cleveland, United States
Keywords dermatology, non-rigid deformation, RANSAC, thin plate
spline
Purpose
Mohs micrographic surgery (MMS) is a dermatologic procedure that
involves the removal of skin cancer while sparing as much healthy
tissue as possible. MMS delivers decreasing cure rates with increasing
sizes of cutaneous carcinoma. Postoperative complications increase
with the increasing size of the reconstruction. Clinical errors may be
introduced by biomechanical forces that deform tissue during routine
manipulation during both MMS histologic processing and surgical
flap reconstruction.
This interdisciplinary work seeks to ultimately reduce cancer
recurrence and surgical complications by improving intra-operative
surgical techniques that are used to remove and intra-operatively
pathologically examine skin cancer. To that end, we seek to develop
more accurate models of 3D tissue deformation during current clinical
practice. To gather data on non-rigid tissue deformation, strain, and
forces in real-world intra-operative surgery, we need new tools to
study the 3D deformation of excised skin-cancer tissue, from its
original in situ 3D shape to the final 3D shape when pressed against a
surgical slide for intra-operative pathology. This current work is
laying a foundation for those studies.
We have developed novel micro-painted fiducial landmarks that
adhere to the fatty skin tissue. The focus of this paper is our custom
computer-vision methodology for detecting, localizing, and matching
those fiducial dots in tissue samples before-versus-after flattening on a
microscope slide. The appearance of these landmarks makes it chal-
lenging to precisely define a center point for each dot, and the
complex nonrigid tissue deformation, when pressed against a slide,
makes it challenging to automatically match landmarks and compute
the tissue-motion field.Methods
Multichromatic acrylic microdots were painted onto porcine skin and
tracked before and after hypodermal tissue bending (10 sample
images) and epidermal flap reconstruction simulations (6 sample
images). The painting process results in irregularly shaped dots of
adhered acrylic. Two-dimensional microdot ‘‘center’’ coordinates
were estimated by the blob detection algorithm from digital images
and compared to a consensus of two expert-raters using two-tailed
Welch’’s t-tests. Color tagging, mutual information and Euclidean
distance regulation were then used to measure the similarity between
microdot pairs. For each microdot in either the before-surgery image
or after-surgery image, we picked the microdot with the highest
similarity with it in the other image as the best corresponded
matching. When the bidirectional matching is mutually verified, then
together with RANSAC, we established the correspondences between
microdots from before and after images. The matching microdot pairs
with high correlation values were used as key-point inputs to a thin
plate spline method, warping the before image to register with the
after image. Iteration over RANSAC matching and thin plate spline
led to the final correspondence map for tissue deformation.
Results
The blob detection algorithm detected 83% of microdots overall.
Detection of microdots on epidermal flaps was higher before recon-
struction than after, though not significantly (91% vs. 84%, p = 0.16),
figure 1. There was no difference in detection of microdots on
hypodermal tissue before and after bending (80% vs. 80%, p = 0.87).
Detection of microdots was higher on the epidermis than hypodermis
(88% vs. 80%, p = 0.01). The correlation algorithm detected micro-
dot coordinates within an average error of 11 pixels overall
(corresponding to 201 lm, smaller is better). There was no difference
in accuracy on epidermal flaps after reconstruction (5 vs. 7 px,
p = 0.25, corresponding to 170 vs. 209 lm), nor on hypodermal tis-
sue after bending (13 vs. 16 px, p = 0.12, corresponding to 189 vs.
231 lm). Accuracy was better on the epidermis than on the hypo-
dermis (6 vs. 15 px, p.Conclusion
Our custom microdots detection and matching algorithm based on
iterative RANSAC and thin plate spline warping is an important step
towards practically measuring biomechanical forces in the clinic
using only digital images of irregular microdot fiducials. This largely
decreases the labor work of manual annotations. It has been optimized
for specificity over sensitivity, compared to expert-raters’’ annotation,
and the algorithm shows sufficient pixel and micron accuracy to
estimate deformation in exchange for a modest loss of resolution.
Improving these techniques and introducing additional data such as
three-dimensional point clouds, which will expand the applications of
optical mapping in clinical research.
References
[1] Hruza GJ (1994) Mohs micrographic surgery local recurrences.
J Dermatol Surg Oncol 20:573–577
Ergonomic design and validation of an intraoperative
system to measure plantar pressure distribution
in supine position
J. Grossman1, K. Hara2, S. H. Chang3, T. Matsumoto3, I. Sakuma1,2,4,
E. Kobayashi4
1University of Tokyo, Bioengineering, Bunkyo City, Japan2University of Tokyo, Medical Device Development and Regulation
Research Center, Tokyo, Japan 3University of Tokyo, Orthopaedic
Surgery, Tokyo, Japan 4University of Tokyo, Precision Engineering,
Tokyo, Japan
Keywords Intraoperative, Plantar pressure distribution, Hallux val-
gus, Transfer metatarsalgia
Purpose
Foot deformities such as hallux valgus are common foot deformities
that may require surgery. However, during these surgeries many
Fig. 1 Visualization of microdots matching between iteratively-
warped before image and after image with location annotations
(epidermis)
Int J CARS (2021) 16 (Suppl 1):S1–S119 S101
123

operative decisions are made based on inexact parameters. Conse-
quently, surgical complications such as transfer metatarsalgia often
arise [1]. Obtaining a proper plantar pressure distribution (PPD) is an
important factor in the surgical success. However, it is difficult to
measure intraoperatively since it is normally obtained in standing
posture, while the surgery is performed in the supine position. A
device which can measure this parameter in supine could improve the
clinical result of surgical treatment by guiding surgeons to reliably
restore a healthy standing plantar pressure distribution to the patient.
In previous research, an intraoperative plantar pressure measure-
ment (IPPM) device was proposed, which can reproduce the PPD of
standing posture intraoperatively [2]. It was found that in standing
posture, the ground reaction force vector originates at the foot center
of pressure and passes through the femoral head center. The IPPM
device uses a force plate to align these two parameters, and a pressure
sensor to measure PPD. The IPPM device demonstrated high repro-
ducibility in experiments with healthy subjects, and now its
usefulness must be clinically validated [2].
However, the IPPM device has two remaining issues that prevent
it from being validated through clinical testing. One problem is its
heavy hardware—it weighs 2.5 kg. The other is that there is no
convenient way for the user to hold and maneuver the device. These
issues result in the device being difficult to operate, rendering it
impractical for a clinical setting. Our research aims to redesign the
IPPM device to be more ergonomic by solving the above two prob-
lems while maintaining its position measurement accuracy.Methods
A. Reducing Hardware Weight
The original IPPM device’’s force plate weighed 1.4 kg. This
force plate contained four force sensors, however, the parameters
measured by the device can be measured by a single 6-axis force
sensor. Hence, a new force plate was designed with only one
sensor in the center of the plate, reducing the total weight by
allowing the size of the force plate to be reduced. The new force
sensor was chosen by its specifications for this application
(FFS080YA501U6 Leptrino Co. Ltd.). The maximum force and
moment limits of this sensor were determined from experiments
conducted with the original device, where the maximum applied
force during operation was around 100 N.
The original force plate was made from aluminum which is a
lightweight, strong, and inexpensive material. However, when
optimizing strength and weight, composite materials are superior
options. Carbon fiber was chosen due to its properties of being
lightweight and high strength.
B. Improving Operability
To use the original device, the operator is forced to put their
hands in a particular orientation to avoid contacting a measure-
ment component and introducing error. As a result, operating the
device can be strenuous. To improve maneuverability, a carbon
fiber ring-shaped handle was attached to the back of the force
plate.
C. Position Measurement Accuracy
To evaluate the position measurement accuracy of the new
device, an optical tracking sensor (Polaris Spectra, NDI Co. Ltd.)
was used. A tracking marker was pressed onto the device at
different points, and the position of the marker measured by the
sensor was compared to the position measured by the device
(N = 5). The required system accuracy for this test is less than
5 mm of position error.
Results
A comparison of the original and new device weight is shown in
Table 1. The original device weighs 2500 g, and the new device
weighs 1750 g.
The new device design was qualitatively evaluated by two sur-
geons that had experience operating the original device. Both noted
that the decreased weight along with the added handle provided a
significantly more comfortable experience. Each surgeon concluded
that the ergonomic design is appropriate for future clinical testing.
The results of the position measurement accuracy test are shown in
Figure 1. The measured position error between the optical tracking
sensor and the device mean was 0.61 mm (SD 0.31 mm), which is
below the system accuracy threshold of 5 mm of position error. There
was no noticeable difference in measurement error for different
positions on the device.Conclusion
In this research, the IPPM device was redesigned to decrease its
weight and improve its usability. Despite the inclusion of a 400 g
Table 1 Comparison of the original and new device weight
Component weight (g) Old device New device
Pressure sensor 700 500
Top plate 1400 400
Force sensor 200
Bottom plate 250
Interfacing plate 400 N/A
Ring handle N/A 200
Handle supports N/A 200
Total 2500 1750
Fig. 1 Device Position Error Using Optical Tracking Sensor
S102 Int J CARS (2021) 16 (Suppl 1):S1–S119
123

ergonomic handle, the device weight was decreased by 30% without
compromising its position measurement accuracy. Two surgeons
confirmed the increase in usability from the new design and stated
that the device design is suitable for clinical validation studies. In the
future, clinical testing will be done to determine the system’’s ability
to reproduce plantar pressure distribution in a clinical environment.
References
[1] Coughlin MJ, Shurnas PS (2003) Hallux rigidus: demographics,
etiology, and radiographic assessment. Foot Ankle Int
24(10):731–743
[2] Hosoi I, Kobayashi E, Chang S, Matsumoto T, An Q, Anzai E,
Ohta Y, Sakuma I (2018) ‘‘Development of intraoperative
plantar pressure measuring system considering weight bearing
axis’’, International Journal of Computer Assisted Radiology
and Surgery, vol. 14, no. 2, pp. 385–395.
Smartphone-based augmented reality system for needle
insertion guidance in sacral nerve stimulation
R. Moreta-Martinez1,2, M. Garcıa-Sevilla1,2, D. Garcıa-Mato1,2, A.
Pose-Dıez-de-la-Lastra1,2, I. Rubio-Perez3, J. Pascau1,2
1Universidad Carlos III de Madrid, Departamento de Bioingenierıa e
Ingenierıa Aeroespacial, Madrid, Spain 2Instituto de Investigacion
Sanitaria Gregorio Maranon, Madrid, Spain 3Hospital Universitario
La Paz, Servicio de Cirugıa General, Madrid, Spain
Keywords Sacral nerve stimulation, Augmented reality, Needle
guidance, Smartphone
Purpose
Sacral nerve stimulation (SNS) is a procedure where an electrode is
implanted through the sacral foramina to stimulate the nerve modu-
lating colonic and urinary functions. This practice has been
implemented efficiently to treat several pathologies such as fecal
incontinence, urinary retention, and constipation.
Currently, X-ray fluoroscopy is used during electrode placement to
estimate the location of the needle with respect to the sacral foramina
(usually S3 or S4). However, this needle insertion is very challenging
to surgeons, and several X-ray projections are required to interpret the
needle’’s position correctly. Furthermore, the need for multiple
punctures causes an increase in surgical time and patients’’ pain.
Navigation systems based on optical tracking combined with intra-
operative CT have been previously used to guide needle insertion in
SNS surgeries, reducing procedural time and improving surgical
outcomes. Nevertheless, these systems require an intraoperative CT
and imply additional radiation exposure during the intervention to
both patients and professionals, restricting their clinical practice
integration. Additionally, the navigation information is displayed on
external screens, requiring the surgeon to divert his attention from the
patient. In this context, augmented reality (AR) technology could
overcome these limitations, providing the surgeon with real-time
navigation information directly overlaid in the surgical field and
avoiding external radiation during surgery [1].
In this work, we propose a smartphone-based AR application to
guide electrode placement in SNS surgeries. This navigation system
uses a 3D-printed reference marker placed on the patient to display
virtual guidance elements directly on the affected area, facilitating
needle insertion with a predefined trajectory. The proposed system
has been evaluated on an anthropomorphic phantom.Methods
A patient-based phantom was manufactured to simulate the affected
area for an SNS treatment. The phantom included the sacrum bone,
3D-printed in polylactic acid, covered with silicon (Dragon Skin 10
Slow), imitating the patient’s soft tissue. The location of the sacrum
foramen was obtained by segmenting both materials from a CT of the
phantom using 3D Slicer software.
We developed a smartphone AR application on Unity platform.
This app uses Vuforia development kit to detect and track the position
of a 3D-printed cubic reference marker (30 9 30 9 30 mm) with
unique black-and-white patterns on each face. Once the marker is
detected in the smartphone camera field of view, the virtual models
are displayed overlaid on the real-world image. These virtual models
will indicate the insertion point on the surface of the phantom and the
optimal trajectory to reach the target sacral foramen (Figure 1).
The marker was fixed on top of the phantom in the superior area of
the gluteus. We obtained the position of the marker with respect to the
phantom by a two-step procedure. Firstly, we acquired a 3D pho-
tograph (including geometric and textural information) of the
phantom’’s surface with the cubic reference marker already in place.
With this information, we applied a surface-to-surface registration
algorithm to align the acquired 3D textured with the phantom model
obtained from the CT scan. Secondly, we identified seven landmarks
from the marker patterns on the 3D textured images. These landmarks
were used to compute the position of the marker with respect to the
phantom after a fiducial-based registration. Finally, the virtual mod-
els’’ position was calculated and uploaded to the AR application.
We evaluated our solution during needle insertion on several
simulated SNS interventions on the manufactured phantom. After
detecting the AR marker with the smartphone’’s camera, the user held
the smartphone with one hand and inserted the needle with the other
one. The trajectory and the target were displayed as virtual elements
on the AR-display. Once the needle was oriented as indicated in the
AR system, the user inserted the needle. A total of three inexperi-
enced users performed this procedure ten times on two sacrum
foramina of different sizes (S3 and S4). We measured the insertion
time and the number of punctures required to place the needle in the
target foramen for each repetition.Results
Table 1 shows the insertion time and the number of punctures for
each user and foramen. The average insertion time was 30.5 ± 13.9 s,
slightly lower than the figures reported with alternative SNS guidance
methods (35.4 ± 14.6 s) [2]. The results obtained with the proposed
system showed that users performed a maximum of two punctures to
reach the target for both foramina with an average of 1.13 ± 0.34,
Fig. 1 User during needle insertion simulation on the manufactured
phantom using the smartphone-based augmented reality application
for needle guidance
Int J CARS (2021) 16 (Suppl 1):S1–S119 S103
123

significantly reducing the average number of insertions reported with
traditional methods (9.6 ± 7.7) [2].Conclusion
This work proposes a novel smartphone-based AR navigation system
to improve electrode placement in sacral neuromodulation proce-
dures. The results obtained on the patient-based phantom show that
our system could reduce the number of punctures and the insertion
time compared with the traditional methods. The smartphone appli-
cation is intuitive, facilitating needle insertion without requiring tool
tracking. Further studies should be performed to ensure feasibility
during surgical interventions. To our knowledge, this is the first work
proposing an AR solution to guide needle insertion in SNS
procedures.Acknowledgements
Supported by projects PI18/01625 (Ministerio de Ciencia, Innovacion
y Universidades, Instituto de Salud Carlos III and European Regional
Development Fund Una manera de hacer Europa) and IND2018/TIC-
9753 (Comunidad de Madrid).
References
[1] Garcıa-Mato D, Moreta-Martinez R, Garcıa-Sevilla M, Ochan-
diano S, Garcıa-Leal R, Perez-Mananes R, Calvo-Haro JA,
Salmeron JI, Pascau J (2020) Augmented reality visualization
for craniosynostosis surgery. Comput Methods Biomech
Biomed Eng Imaging Vis 1–8. https://doi.org/10.1080/
21681163.2020.1834876
[2] Zhang J, Zhang P, Wu L, Su J, Shen J, Fan H, Zhang X (2018)
Application of an individualized and reassemblable 3D printing
navigation template for accurate puncture during sacral neuro-
modulation. Neurourol Urodyn 37:2776–2781. https://doi.org/
10.1002/nau.23769
Three-dimensional surgical plan printing for assisting
liver surgery
Y. Hayashi1, T. Igami2, Y. Nakamura3, K. Mori1
1Nagoya University, Graduate School of Informatics, Nagoya, Japan2Nagoya University, Graduate School of Medicine, Nagoya, Japan3National Institute of Technology, Tomakomai College, Department
of Engineering for Innovation, Tomakomai, Japan
Keywords 3D print, Liver, Surgical plan, Image-guided surgery
Purpose
Computer assisted surgery (CAS) system, which includes surgical
planning system and surgical navigation system, has been developed
to assist understanding of patient specific anatomical structures in the
liver. These systems enable surgeon to perform preoperative surgical
planning and intraoperative surgical navigation of the liver resections
while observing the 3D reconstructed patient specific anatomical
structures from CT volumes. In resent year, since three dimensional
(3D) print technologies have been rapidly developed, a 3D printed
organ model is widely spread in medical field. The 3D printed organ
model makes easy to recognize 3D positional relationships among
anatomical structures. Therefore, in addition to CAS system, a 3D
printed liver model is also used for assisting liver surgery [1, 2]. In the
3D printed liver model, patient specific anatomical structures in the
liver, such as the portal vein and the hepatic vein, are usually fabri-
cated. Surgeon can comprehend positional relationships among these
anatomical structures and tumors in the liver by observing the 3D
printed liver model preoperatively and intraoperatively. Surgeon can
also plan liver resections by considering these positional relation-
ships. If the surgical plan such as liver partition line reproduced in the
3D printed liver model in addition to the anatomical structures, the 3D
printed model will be more useful for assisting liver resection surgery.
In this paper, we describe the three-dimensional surgical plan printing
for assisting liver resection surgery.Methods
The proposed method fabricates two 3D printed liver models sepa-
rated by liver partition line planned preoperatively as surgical plan
printing. The proposed method consists of image processing part and
fabrication part. In the image processing part, the anatomical struc-
tures are extracted from CT volume and the liver partition line is
planned. In the fabrication part, the 3D liver model is fabricated based
on the result of the image processing part using a 3D printer. We
extract anatomical structures semi-automatically from portal venous
phase contrast-enhanced CT volumes. The liver, the portal vein, the
hepatic vein, and the tumor regions are extracted using region
growing method and morphological operations such as opening and
closing. Surgeon performs surgical planning by considering the
locations of the tumor and its surrounding anatomical structures on
CT volumes. Voronoi tessellation is performed to obtain liver parti-
tion line based on the portal vein information. Surgeon checks and
corrects the segmentation results and liver partition line manually if
necessary. The Blood vessel regions are dilated by morphological
operation to reproduce the thin blood vessels. The blood vessel and
tumor regions are subtracted from the liver region. The liver partition
line also subtracted from the liver regions to divide the liver model.
We convert the obtained binary images to polygon data using
marching cubes algorithm. The two 3D printed liver models is fab-
ricated the polygonal model using a 3D printer (Agilista 3100,
Table 1 Number of punctures and insertion time for each foramen and user during simulation with the proposed augmented reality system
Foramen S3 Foramen S4
User 1 User 2 User 3 Avg. users User 1 User 2 User 3 Avg. users
Puncture time (s)
Mean 27.1 34.3 29.8 30.4 25 36.3 30.7 30.6
Std 10.1 16.6 16 14.4 5.9 18.7 11.9 13.6
Min 18 18 15 17 20 17 23 20
Max 45 71 70 62 40 69 62 57
Number of punctures
Mean 1 1.2 1.1 1.1 1.2 1.2 1.1 1.2
Std 0 0.4 0.3 0.3 0.4 0.4 0.3 0.4
S104 Int J CARS (2021) 16 (Suppl 1):S1–S119
123

Keyence, Osaka, Japan). After fabrication, support material covered
with the 3D printed liver models is removed. The surface of the 3D
liver models is polished by abrasive sponge and coated by urethane
resin to smooth the surface. The portal vein and tumor is colored
white by filling support material. The hepatic vein regions are colored
by blue dye after removing the support material.Results
We created the 3D liver models using the proposed method. Figure 1
shows an example of the fabricated 3D printed liver model. This 3D
liver model is divided into two models by the planned liver partition
line. Since the liver regions are fabricated translucent acrylic resin,
the anatomical structures in the liver can be observed. The portal vein
and the tumor are showed white color, and the hepatic vein is showed
blue color in the model. The positional relationships between the
portal vein, the hepatic vein, and the tumor inside the liver are con-
firmed using the fabricated 3D liver model. Furthermore, the
anatomical structures around the planned liver partition line are also
confirmed by using the divided 3D liver model. This will be helpful to
surgeon for understanding the complex anatomical structures around
partition line during the liver resection. Therefore, the 3D printed
liver model with surgical plan is useful for assisting liver surgery.Conclusion
In this paper, we described a three dimensional surgical plan printing
for assisting liver resection surgery. The proposed method created two
3D printed liver models divided by the preoperative liver partition
plan. The experimental results showed that the anatomical structures
along the planned partition line are confirmed using the fabricated 3D
printed liver models. Future works includes application to additional
cases and development of an automated segmentation method of
anatomical structures from CT volumes.
References
[1] Igami T, Nakamura Y, Hirose T, Ebata T, Yokoyama Y,
Sugawara G, Mizuno T, Mori K, Nagino M (2014) Application
of a three-dimensional print of a liver in hepatectomy for small
tumors invisible by intraoperative ultrasonography: preliminary
experience. World J Surg 38(12): 3163–3166
[2] Igami T, Nakamura Y, Oda M, Tanaka H, Nojiri M, Ebata T,
Yokoyama Y, Sugawara G, Mizuno T, Yamaguchi J, Mori K,
Nagino M (2018) Application of three-dimensional print in
minor hepatectomy following liver partition between anterior
and posterior sectors. ANZ J Surg 88(9): 882–885
Surgical procedure simulation dataset for surgical
robot development: an example of canine spay surgery
P. Suteecharuwat1, N. Kubuki1,2, Y. Ran2, K. Nagase1, Y. Hayakawa3
1Kitami Institute of Technology, Master‘s Course of Computer
Science, Graduate School, Kitami, Hokkaido, Japan 2Kitami Institute
of Technology, Dept. of Computer Science, Kitami, Hokkaido, Japan3Kitami Institute of Technology, Dept. of Engineering on Intelligent
Machines & Biomechanics, Kitami, Hokkaido, Japan
Keywords Surgical simulation dataset, simulation dataset, image
recognition, annotation
Purpose
Development of autonomous surgical robotic machines for standard
surgical procedures is under requisition rather than master–slave
machines. Surgery with standardized procedures is technically in high
demand as an autonomous surgical robot in local cities where the
number of surgeons is decreasing. However, it is necessary to obtain
the patient consent when collecting simulation data, and there are
crucial hurdles in such data collection. Therefore, we created a dataset
that using a simulation model of contraceptive surgery, which is a
routine surgery for small animals, dogs. Ovariohysterectomy is the
common sterilization procedure for small animals, namely cats and
dogs, etc. In the study, we tried the simulation of the canine (dog)
spay surgery, ovariohysterectomy, and made the data set of the
surgery.Methods
The automatic image recognition of tools (surgical instruments) and
surgical operation (work-flow) phases were carried out using image
recognition technology. Using a simulation model of the canine spay
surgery, 42 video movies (1080 9 720 pixels, 24 fps), in the range of
15 min to 25 min in length, were recorded during every surgical
procedure (Fig. 1). The annotation of surgical tools was carried out in
the first 15 video movies (down-sampling to 1 fps) by means of the
bounding-box annotation.Results
The annotation of surgical tools was carried out in the first 15 video
movies (down-sampling to 1 fps) by means of the bounding-box
annotation. Two or more tools are annotated on more than 80 percent
in 16,327 frames in total. This method is fitting for the precise object
detection having the individual locational data. Since surgical tools
are often held by hand and it is not easy to annotate the entire tool,
only a part of the tool was annotated. The scissors, needle holder, and
forceps are very similar when viewed from the side, and there is a
problem that they cannot be discriminated by the human eye.
Therefore, when annotating the needle holder that sandwiches the
Fig. 1 Example of fabricated 3D printed liver model. 3D printed
liver model is divided two models by planned liver partition line
Fig. 1 Forty-second videos was taken for surgical practice and has a
resolution of 1920 9 1080.Intraoperative lighting setting: bright
Int J CARS (2021) 16 (Suppl 1):S1–S119 S105
123

suture needle, we improved it so that the needle holder can be dis-
tinguished by attaching a bounding box together with the suture
needle. By annotating in this way, it is considered that the recognition
accuracy when the image of the needle holder is blurred can be
improved (Fig. 2). Suture needles were also used, but, for these three
reasons, that the size of the suture needle is small, it is rarely seen
depending on the angle, and it is often pinched by a needle holder, we
didn’t annotate the bounding-box individually. The annotation of
surgical operation (work-flow) phases was carried out in all 42 video
movies. Six consecutive phases in the canine spay surgery were
recognized. Since selected tools are used in specific phases, correla-
tions between tools and phases are helpful for the automatic phase
recognition.Conclusion
We made the data set for tool recognition and phase recognition while
the canine spay surgery is carried out using a simulation model. The
annotation data-set of surgical instruments (tools) and surgical oper-
ation (work-flow) phases were obtained using the simulation of the
canine spay surgery, ovariohysterectomy. The next step is the
designing of a neural network to recognize these tools and surgical
phases. We had an opportunity to collaborate with veterinary sur-
geons in a veterinary medicine school. We also plan the similar
simulation in oral and maxillofacial surgical procedures.References
[1] Jin A., Yeung S, Jopling J, Krause J, Azagury D, Milstein A,
Fei–Fei L (2018) Tool detection and operative skill assessment
in surgical videos using region-based convolutional neural net-
works. 2018 IEEE Winter Conference on Applications of
Computer Vision (WACV). IEEE
Real-time bone fragment navigation for open cranial
vault remodeling
D. Garcıa-Mato1,2, M. Garcıa-Sevilla1,2, S. Ochandiano2,3,
J. Pascau1,2
1Universidad Carlos III de Madrid, Departamento de Bioingenierıa e
Ingenierıa Aeroespacial, Madrid, Spain 2Instituto de Investigacion
Sanitaria Gregorio Maranon, Madrid, Spain 3Hospital General
Universitario Gregorio Maranon, Servicio de Cirugıa Oral y
Maxilofacial, Madrid, Spain
Keywords computer-assisted surgery, craniosynostosis, 3D printing,
craniofacial surgery
Purpose
Craniosynostosis is a congenital defect characterized by the prema-
ture fusion of one or more cranial sutures. This medical condition
usually leads to dysmorphic cranial vault and may cause functional
problems. Surgical correction is the preferred treatment to excise the
fused sutures and to normalize the cranial shape of the patient.
Open cranial vault remodeling is the standard surgical technique
for the correction of craniosynostosis. This approach consists of three
steps: osteotomy and removal of the affected bone tissue, reshaping
the bone fragments into the most appropriate configuration, and
placement and fixation of the reshaped bone fragments to achieve the
desired cranial shape [1]. Nowadays, surgical management of cran-
iosynostosis is still highly dependent on the subjective judgment of
the surgeons and, therefore, there is high variability in the surgical
outcomes. Inaccuracies in osteotomy and remodeling can compromise
symmetry, harmony, and balance between the face and the cranial
vault and, therefore, the aesthetic outcome.
In a previous work [2], we presented a novel workflow for intra-
operative navigation during craniosynostosis surgery. This system
requires a tracked pointer tool to estimate the positions of bone
fragments by recording points along their surface. Although this
methodology presents a high accuracy, it is time-consuming and does
not enable real-time tracking of the bone fragments. Continued
monitoring of individual fragments� position would facilitate intra-
operative guidance and improve matching with the virtual surgical
plan.
In this study, we present and evaluate a novel workflow for real-
time tracking of bone fragments during open cranial vault remodeling
combining patient-specific 3D printed templates with optical tracking.
The proposed methodology was evaluated through surgical simula-
tions in a 3D printed phantom.Methods
A 3D printed phantom was designed and manufactured to replicate a
realistic scenario for surgical simulation and performance evaluation.
This phantom is based on data from a patient with metopic cran-
iosynostosis previously treated in our center. Bone and soft tissue
were simulated with polylactic acid and silicone materials,
respectively.
Experienced craniofacial surgeons performed a virtual surgical
plan to define the location of osteotomies to remove the affected bone
tissue, the best approach to reshape the bone fragments, and the
optimal position of the fragments in the patient to achieve the desired
cranial shape. Two different interventional plans were defined to
create two distinct scenarios for surgical simulation: a simple plan,
with symmetric overcorrection and adjacent to anatomical landmarks;
and a complex plan, with asymmetric overcorrection and distant to
characteristic anatomical References.
We developed a surgical navigation system based on optical
tracking and desktop 3D printing to guide surgeons during the
intervention (see figure 1). First, a patient-specific template was
designed and 3D printed according to the virtual surgical plan. This
template enables the surgeons to reshape the bone fragments of the
supraorbital region as defined during planning. In addition, this
template incorporates spherical optical markers for position tracking.
Then, the reshaped bone fragments can be attached to the template
and their position can be computed in real-time by the optical tracking
system. To our knowledge, this is the first approach to track the
position of bone fragments using patient-specific 3D printed
templates.
A software application was specifically developed to display the
3D position of the bone fragments during surgery with respect to the
patient’s anatomy, providing visual and acoustic feedback to the
surgical team to ensure optimal placement and fixation according to
the preoperative virtual plan. A 3D printed reference frame is attached
to the patient to compensate for possible movements during surgical
Fig. 2 An example of tool annotation. Needle holder, holding the
suture needle
S106 Int J CARS (2021) 16 (Suppl 1):S1–S119
123

intervention, and a stylus tool is used to record landmarks for patient-
to-image registration.
The accuracy of this navigation system was evaluated by simu-
lating the surgical intervention using a 3D printed phantom. A total of
20 surgical simulations were performed in two scenarios with dif-
ferent complexity (i.e. simple and complex virtual plans). An
experienced user performed 10 simulations using the navigation
system, and 10 simulations using the standard freehand approach
(without navigation). The final position of the supraorbital bone
fragment was computed by recording the position of 5 pinholes using
the optical tracker. This position was compared with the virtual plan,
and translation and rotation errors were computed for each simulation.Results
Average translation and rotation errors show increased performance
when using the navigation system (see table 1). The navigated sim-
ulations showed a similar positioning accuracy in both simple and
complex scenarios, presenting an average error below 1 mm in
translation and 1 degree in rotation. However, the standard freehand
approach showed a lower accuracy in the complex surgical scenarios,
with maximum errors of 7.91 mm in translation and 5.21 degrees in
rotation.Conclusion
The proposed navigation workflow enables an accurate reshaping and
positioning of the remodeled bone fragments to match the preopera-
tive virtual plan. In contrast with previous approaches, this technique
provides surgeons with real-time 3D visualization and metrics to
accurately control the bone fragment position during cranial remod-
eling. Our framework outperforms the standard freehand approach for
remodeling in both simple and complex surgical scenarios, showing a
higher accuracy and potential to improve surgical outcomes.
Our novel methodology based on intraoperative navigation and 3D
printing can be integrated into the current surgical workflow to ensure
an accurate translation of the preoperative surgical plan into the
operating room. This solution could improve the reproducibility of
surgical interventions and reduce inter-surgeon variability.Acknowledgements
Supported by projects PI18/01625 (Ministerio de Ciencia, Innovacion
y Universidades, Instituto de Salud Carlos III and European Regional
Development Fund ‘‘Una manera de hacer Europa’’) and IND2018/
TIC-9753 (Comunidad de Madrid).
References
[1] Cohen SR, Frank RC, Meltzer HS, Levy ML (2014) Cran-
iosynostosis. Handb Craniomaxillofacial Surg 343–368.
https://doi.org/10.1142/9789814295109_0013
[2] Garcıa-Mato D, Ochandiano S, Garcıa-Sevilla M, Navarro-
Cuellar C, Darriba-Alles JV, Garcıa-Leal R, Calvo-Haro JA,
Perez-Mananes R, Salmeron JI, Pascau J (2019) Craniosynos-
tosis surgery: workflow based on virtual surgical planning,
intraoperative navigation and 3D printed patient-specific guides
and templates. Sci Rep 9:17691. https://doi.org/10.1038/
s41598-019-54148-4
Towards machine learning-based tissue differentiation
using an ultrasonic aspirator
N. Bockelmann1, D. Kesslau2, M. M. Bonsanto3, S. Buschschluter2, F.
Ernst1
1Institute for Robotics and Cognitve Systems, University of Lubeck,
Lubeck, Germany 2Soring GmbH, Quickborn, Germany 3Department
of Neurosurgery, University Hospital Schleswig–Holstein, Lubeck,
Germany
Keywords Tissue differentiation, Tactile sensor, Ultrasonic aspirator,
Machine learning
Purpose
In addition to visual assessment for tumor differentiation, palpation of
tissue by the surgeon during surgery is of great importance, for
example during resection of intracranial lesions. This intraoperative
differentiation of soft tissue can be a challenging task that usually
requires years of expertise and intuition. For this reason, research is
currently being conducted on tactile sensors as an assistive device for
better tumor delineation. However, these sensors are typically inten-
ded for robotic applications which are not usable in every surgical
Fig. 1 Intraoperative navigation system for open cranial vault
remodeling
Table 1 Average translation and rotation errors in the positioning of
the remodeled supraorbital fragment for two different scenarios:
simple and complex
Scenario Mode Translation error (mm) Rotation error (�)
Mean Std. Max. Mean Std. Max.
Simple Freehand 1.5 0.61 2.47 2.37 1.11 4.45
Navigated 0.52 0.33 1.16 0.68 0.52 1.74
Complex Freehand 2.85 2.36 7.91 2.04 1.48 5.21
Navigated 0.56 0.29 1.09 0.65 0.65 1.77
Int J CARS (2021) 16 (Suppl 1):S1–S119 S107
123

case and are required to measure the force applied to the tissue. This
leads to the development of new devices that must be integrated into
the surgical workflow. On the other hand, ultrasonic aspirators are
commonly used as hand-held instruments during tumor resec-
tion. Since ultrasonic aspirators and piezoelectric tactile sensors
operate in a similar manner, the idea of using a commercially avail-
able ultrasonic aspirator as an intelligent intraoperative probe for
tissue differentiation is motivated. This eliminates the need to change
instruments during surgery and improves the workflow of the sur-
geons. The final aim is to predict the tissue properties by only using
the electrical features of the ultrasonic aspirator, and by that com-
pensating for the missing contact force which is not available in this
surgical instrument. In the following, it is investigated as a first step in
a simplified laboratory setting, whether machine learning methods can
learn a relationship between the electrical features of an ultrasonic
aspirator and the mechanical properties of different tissues.Methods
Data is acquired using four synthetically created tissue models. Each
tissue model represents a different tissue consistency and is charac-
terized with a stiffness value that is derived from its chemical
contents. This means that the higher the stiffness value, the higher the
tissue model consistency. Data acquisition is done with a CNC
machine that holds the ultrasonic aspirator directly over the tissue
model, brings it into contact and moves up again while exerting as
little force on the tissue model as possible. Furthermore, the settings
of the instrument are set to a non-resection mode so that the tissue
model remains intact. For each tissue model, seven or eight record-
ings are made, each having a length of 12–24 s at a recording
frequency of 21 Hz. This results in a total of 30 recordings with more
than 11,000 data points, each of which containing the corresponding
stiffness value and several electrical features of the ultrasonic
aspirator.
Since tissue properties can take different continuous values,
regression is performed on the different stiffness values using the
electrical features as input. In order to perform a regression on this
data, three empirically determined nonlinear methods are used. The
first two methods are deep learning-based regression models: a Fully
Connected Network (FCN) that takes the features as input to regress
to the respected stiffness value and a 1D Residual Network (ResNet)
which uses a sliding windows approach with a window size of four
seconds to regress to the center point of the window. While the first
method is only taking information of the current data into account for
the regression, the latter method tries to leverage temporal informa-
tion of the adjacent data to increase performance. The last method
uses a Gaussian Process (GP) with an exponential kernel to determine
the stiffness value. An advantage of using GPs for a regression is the
incorporation of uncertainty into the predictions, which can be ben-
eficial in later applications.Results
A five-fold cross-validation is conducted over the 30 recordings with
a total of more than 11,000 data points. The same splits are used
across the different methods and normalized to have zero mean and
unit variance. Data points without any contact to the tissue models are
assumed to have a stiffness value of zero. To evaluate the perfor-
mance of the methods, the metrics root-mean-square error (RMSE),
mean absolute error (MAE) and R2 are obtained and averaged over
the five folds. The summarized results of the regression can be found
in Table 1. For all methods, a high R2 value of more than 0.9 can be
obtained. Since the two deep learning-based methods show similar
results it can be deduced that there is limited impact of temporal
information to the predictions. The GP regressor model yields supe-
rior performance compared to the deep learning-methods. A
qualitative result of the GP can be found in Fig. 1. Particularly
noteworthy are the large uncertainties in the area of the jump dis-
continuities of the signal and the samples around. Those jump
discontinuities are caused by bringing the instrument into contact with
the tissue model and removing it again, and pose a challenge in the
methods investigated. However, the communication of the uncertainty
of the model’s prediction to the user allows to reject the prediction in
a later clinical application, which can be particularly relevant in this
safety–critical environment.Conclusion
This work shows the possibility to learn a relationship between the
electrical features of an ultrasonic aspirator and the mechanical
properties of tissue models with a R2 metric of more than 0.9. This
indicates the feasibility to distinguish between different tissue types
using the surgical instrument. Future work needs to investigate the
performance on a larger variety of mechanical properties and the
influence of contact force. Furthermore, a more in-depth analysis of
the temporal influence to the regression is necessary, especially dur-
ing initial and final contact with the tissue model. In addition,
performance on data involving resection of tissue needs to be
investigated to pave the way for later clinical application.
This work was funded by the German Federal Ministry for Eco-
nomic Affairs and Energy (BMWi, project KI-Sigs, grant number:
01MK20012).
Multi-modality phantom for accuracy verification
of image-based navigation tools
D. Bertsche1, A. Reinelt1, T. Speidel1, P. Metze1, K. Stumpf1,
V. Rasche1, I. Vernikouskaya1
1Ulm University Medical Center, Clinic of Internal Medicine II, Ulm,
Germany
Keywords 3D print, silicon phantom, MRI phantom, XR-guidance
accuracy validation
Table 1 Results of different methods on five-fold cross-validation in
mean ± standard deviation
Methods RMSE MAE R2
FCN 0.894 ± 0.619 0.473 ± 0.409 0.906 ± 0.106
ResNet 0.823 ± 0.870 0.454 ± 0.621 0.903 ± 0.188
GP 0.561 ± 0.539 0.286 ± 0.365 0.940 ± 0.092
Fig. 1 Example of regression with GP on 400 test data points. In
areas with large deviation of ground truth, high uncertainty occurs
S108 Int J CARS (2021) 16 (Suppl 1):S1–S119
123

Purpose
The accuracy of image-based navigation tools is essential for their
benefit during an intervention. Validation of such systems requires
phantoms with similar properties of the human target structure
including the visibility under certain imaging devices. An already
introduced patient-specific cardiac phantom focuses on clinical
training [1], though not on validation of image-guided techniques. We
introduce here the method of creating a patient-specific phantom to
validate XR-based navigation tools, allowing identification of unique
target points. The phantom was created by 3D-printing of a left atrium
(LA) cast model, segmented from a patient-specific CT volume,
which was filled with a silicon compound. Predetermined anatomical
landmarks could be validated under MRI and XR.Methods
Phantom Creation
Patient-specific 3D model of the LA was segmented from CT-dataset
(Fig. 1a). The segmented model was modified to obtain an offset
between two LA hulls of 4 mm with the outer layer corresponding to
the original segmentation in scale 1:1. A flange was placed at the
location of the mitral valve to hold the hulls in place. Besides, 3-mm-
diameter connectors were placed annularly around the pulmonary
vein pairs to provide ‘‘negative’’ anatomical landmarks. The resulting
cast model (Fig. 1b) was printed and subsequently filled with
DragonSkinTM 10 MEDIUM mixed with Silicon ThinnerTM
(SmoothOn, Macungie, Pennsylvania, USA) in a ratio of 3:2
(Fig. 1c). After removing the printout from the dried silicon, sepa-
rately printed cylinders of height 6 mm and diameter 3.5 mm were
inserted into negative anatomical landmarks of the silicon model
(Fig 1d).
Validation
3D MRI volume of the silicon model was generated at a resolution of
0.34 mm/0.34 mm/1.0 mm with a T2-weighted TSE sequence on a
3.0T Philips Achieva, R5.6 (Philips Medical Systems B.V, Best, The
Netherlands). 12 of the predetermined landmarks were approached
under XR (AlluraXper FD20/10, Philips Medical Systems B.V,
Eindhoven, The Netherlands) with various C-arm angulations using a
TherapieTM Cool PathTM Duo ablation catheter (St. Jude Medical,
St. Paul, Minnesota, USA). During landmark approach, the phantom
was fixed with tape on the interventional table. To evaluate the fea-
sibility of the phantom for accuracy validation of XR-navigation
tools, the 3D landmark positions approached under XR were com-
pared to the target landmark positions determined in the cast model
using the average Euclidean distance (aed) and the standard deviation
(±). Therefore, 3D reconstruction of the catheter tip approaching the
landmarks from two differently angulated 2D XR fluoroscopies was
done using the 3D-XGuide [2] after manual registration of the 3D
MR-Phantom segmentation to XR fluoroscopies. To determine whe-
ther deviations already occurred during phantom creation,
segmentation and landmark positions in the MRI were additionally
compared to the target structures.Results
The silicon phantom achieved a measurable MRI signal (Fig. 1a),
resulting in an accurate segmentation including the marker positions
as non-signal. The thinner amplifies the MR signal and also ensures a
lower viscosity and thus a better distribution of the silicon in the
casting model. Point cloud comparison of MRI-segmentation and
target-segmentation resulted in aed of 0.6 mm (± 0.4 mm) and a
maximum deviation of 2.6 mm (Fig. 2b). The silicon phantom is
visible in XR. In contrast to the inserted printed markers (Fig. 2c),
negative markers appear in visible contrast to the silicon model in XR
(Fig. 2d), depending on C-arm angulation. Further, evaluation of the
accuracy of the phantom based on comparison of the 3D marker
positions, resulted in an aed of 1.5 mm (± 0.6 mm) between XR-
reconstruction and target-segmentation, 0.9 mm (± 0.2 mm) between
MR-landmarks and target landmarks, and 1.7 mm (± 0.7 mm)
between MR segmentation and XR reconstruction (Fig. 2e). The
cutout in the mitral valve provides a good opportunity for marker
placement and visibility inside the phantom without distorting the
anatomy (Fig. 2f).Conclusion
The silicon phantom is clearly visible under MRI and XR, which
allows accurate anatomic mimicking of the patient’s specific atrium
including the identification of anatomical landmarks. The elasticity of
the silicon phantom represents a rough approximation of tissue
Fig. 2 Results: slice of MR-volume (a), MR-cast model comparison
(b), XR of catheter and silicon phantom including printed markers
(c) and negative markers (white arrows) (d), comparison of marker
positions reconstructed from XR (blue), MR marker positions
(yellow), and cast model (red) annularly arranged around left superior
and inferior vein (LSPV, LIPV) (e), view during landmark approach
(f)
Fig. 1 Phantom creation: segmentation of patient CT (a), cast model
(b), printed cast model with removed flange and dried silicon mixture
(c), silicon phantom with markers (d)
Int J CARS (2021) 16 (Suppl 1):S1–S119 S109
123

elasticity and is a property of the silicon compound that allows vis-
ibility under MRI. However, the maximal deviation of the MRI-cast
model comparison could be attributed to the sinking of the silicon
model as a result of the elasticity. Similarly, the deviations in the XR
measurements might be related to the elasticity, but also to the manual
registration of the phantom model in XR configuration. To reduce the
elasticity, a lower proportion of thinner in the silicon compound could
be tested. The silicon phantom allowed identification of unique target
points with XR and MRI, thus enabling accuracy validation of static
XR-based navigation. Additionally, the patient-specific phantom has
high accuracy, might enable usage for pre-procedural planning and
clinical training.Acknowledgements
The project on which this report is based was funded by the Federal
Ministry of Education and Research under the funding code
13GW0372C. Responsibility for the content of this publication lies
with the author.
References
[1] Laing J, Moore JT, Vassallo R, Bainbridge D, Drangova M,
Peters TM (2018) Patient-specific cardiac phantom for clinical
training and preprocedure surgical planning. Journal of Medical
Imaging, 5(2):021222
[2] Vernikouskaya I, Bertsche D, Rottbauer W, Rasche V (2020)
3d-xguide: open-source X-ray navigation guidance system. Int J
CARS 16, 53–63 (2021)
Detection of bone metastases on FDG-PET/CT images
by using two-step anomaly detection
H. Yamaguchi1, M. Nemoto2, H. Kaida3,4, Y. Kimura1, T. Nagaoka1,
T. Yamada3, K. Hanaoka3, K. Kitajima5, T. Tsuchitani5, K. Ishii3,4
1Kindai University, Graduate school of bio-oriented science
and technology, Kinokawa, Wakayama, Japan 2Kindai University,
Faculty of bio-oriented science and technology, Kinokawa,
Wakayama, Japan 3Kindai University, Institute of Advanced Clinical
Medicine, Osakasayama, Osaka, Japan 4Kindai University Faculty
of Medicine, Department of Radiology, Osakasayama, Osaka, Japan5Hyogo College of Medicine, Department of Radiological
Technology, Nishinomiya, Hyogo, Japan
Keywords bone metastases, FDG-PET/CT, anomaly detection, one-
class SVM
Purpose
We have been tackling to develop computer-aided detection of cancer
metastases on FDG-PET/CT data based on AI anomaly detection [1].
FDG-PET is an effective modality to find metastases of cancer, but
such accumulations of FDG to hypermetabolic regions suffer radi-
ologists to read the image. Our previous studies showed that the
simple voxel anomaly detections with simple features, such as raw
voxel intensities, caused many false positive (FP) voxels due to
physiological FDG accumulations. This study proposes a two-step
anomaly detection process with Mahalanobis distance-based anomaly
detection and anomaly detection using a one-class support vector
machine (OCSVM). The proposed method uses not only the raw
voxel intensities but also intensity curvature features [2]. We exper-
imented with using the clinical images to investigate the effectiveness
of the proposed method.Methods
Figure 1 shows the flowchart of the proposed method. The proposed
method includes a two-step anomaly voxel classification. It consists
of (1) a coarse anomaly detection by a Mahalanobis distance to
extract suspicious areas (SAs) and (2) a detailed anomaly detection by
using OCSVM to detect lesion voxel candidates from the SAs.
First, CT and FDG-PET images are resampled to 2.4 mm isotropic
resolution. Second, bone areas are extracted from the iso-scaled CT
data. The bone area extraction consists of thresholding the HU value,
a connected component analysis, and morphological processes. Third,
the Mahalanobis distance from normal bone voxel data is measured at
each voxel in the extracted bone area. The two features for measuring
the Manalanobis distance are voxel intensities of CT image (HU
value) and FDG-PET image (SUV). Thresholding the Mahalanobis
distance provides the SAs, which are bone voxel clusters with
abnormal intensities. Fourth, the detailed voxel analysis using the
OCSVM with seven voxel features and an RBF kernel is performed to
the voxels in the SAs to detect the metastasis voxel candidates. The
seven voxel features are HU value, SUV, two curvature parameters
(mean curvature and gaussian curvature) of the HU value surface and
the SUV surface, and the Mahalanobis distance measured at the last
step. The metastasis voxel candidates are detected by the thresholding
for the degree of voxel anomaly calculated using the OCSVM.
Normal distribution parameters for measuring the Mahalanobis
distance and the OCSVM are learned in an unsupervised fashion with
29 normal FDG-PET/CT data cases. The hyperparameters of the
OCSVM and the thresholds of the two anomaly detections are
adjusted experimentally.
In the experiments for evaluating the proposed method, ten clin-
ical FDG-PET/CT data cases, including 19 bone metastases, were
used. These data were scanned at Kindai University Hospital and
Hyogo College of Medicine Hospital.Results
The experimental result shows that the proposed method brought
100% bone metastasis sensitivity with 131.7 voxels/case FPs. As
shown in Table 1, the number of the FPs was smaller than when one
of the components of proposed two-step anomaly detection, which
was by the Mahalanobis distance or by using the OCSVM, was used.
Table 1 Comparison of detection performances
Sensitivity (%) FP voxels/case
Proposed method 100 131.7
Only Mahalanobis distance 100 473
Only OCSVM 100 1100.9
Fig. 1 The flowchart of the proposed method
S110 Int J CARS (2021) 16 (Suppl 1):S1–S119
123

Conclusion
We proposed the detection method of bone metastases on FDG-PET/
CT data using two-step anomaly detection with the Mahalanobis
distance calculation and the OCSVM. The evaluation experiments
show that the proposed method has an adequate detection accuracy of
bone metastasis. Future works include developing the lesion area
estimation process based on the detected lesion voxel candidates and
developing an accurate lesion area identification using features
quantifying the local image pattern characteristics.This work was
supported by JSPS KAKENHI Grant Number 20K11944.
References
[1] Tanaka A, Nemoto M, Kaida H, Kimura Y, Nagaoka T, Yamada
T, Hanaoka K, Kitajima K, Tsuchitani T, Ishii K (2020) Auto-
matic detection of cervical and thoracic lesions on FDG-PET/
CT by organ specific one-class SVMs. Int J Computer Assisted
Radiology and Surgery 15(Suppl 1): S208-S209
[2] Monga A, S Benayoun (1995) Using Partial Derivatives of 3D
Images to Extract Typical Surface Features. Computer Vision
and Image Understanding 61(2): 171–189
Benign and malignant non-cystic breast lesion
differentiation on the ultrasound image
D. Pasynkov1, I. Egoshin2, A. Kolchev3, I. Kliouchkin4,
O. Pasynkova5, A. Shefer3
1Mari State University, Radiology and Oncology, Yoshkar-Ola,
Russian Federation 2Mari State University, Applied mathematics
and informatics, Yoshkar-Ola, Russian Federation 3Kazan Federal
University, Yoshkar-Ola, Russian Federation 4Kazan State Medical
University, General Surgery, Kazan, Russian Federation 5Mari State
University, Fundamental Medicine, Yoshkar-Ola, Russian Federation
Keywords breast lesion, benign, malignant, ultrasound
Purpose
Breast cancer (BC) remains an important problem for the worldwide
healthcare system. Each year more than one million BC cases is
diagnosed, and BC itself represents almost a quarter of all malig-
nancies in women. The highest morbidity values are typical for
developed countries and they correspond to more than 360,000 new
cases per year in the Europe and more than 200,000 new cases per
year in the USA. Moreover in women BC is the most frequently seen
malignancy (24.2% of all malignancies) that responsible for the
highest proportion of the cancer-related deaths (15.0%).
The most relevant strategy to decrease BC-related mortality
nowadays corresponds to the wide introduction of mammographic
screening. However, along with the improving of ultrasound (US)
equipment, they performed large studies, according to which the
incremental cancer detection rate for the combination of mammog-
raphy and US is 2.2–14.2 (median: 5.2) per 1000. The majority of the
BCs detected by US were less than 1 cm, noninvasive and had no
nodal metastases. Such approach can be easily introduced into the
population screening programs for women with low or intermediate
BC risk and dense breast parenchyma. However the limitations
include the relatively high rate of false positive results that require
future assessment and biopsy (BIRADS 3–5 lesions were found in
approximately 25% of women).
During the US examination in case any lesion is found, the first
question is to decide if this lesion cystic or solid. On the second step it
is important to characterize the solid lesions as benign or malignant,
that was the aim of our study.
Methods
We used the digital 8-bit ultrasound images of 107 histologically
proven (53 malignant and 54 benign, without regard to their histo-
logical subtype) breast lesions obtained with the help of the following
systems: Siemens-Acuson X150, Esaote MyLab C, Mindray DC-8EX
(see Fig. 1a, d).
To characterize the detected lesions as malignant or benign it is
proposed to analyze the areas of the image that surround the lesion.
At the first step, the segmenting of the outer contour of the lesion is
performed (see Fig. 1b, e) both in semi-automatic and manual (or
correction of an automatically selected contour) modes. The features of
the gradient difference in the brightness of the image pixels were taken
into account to implement the semi-automatic selection of the lesion
external area. From the center of lesion, rays were conducted with a
given degree of inclination relative to the horizontal axis along the
entire circumference. The brightness of the pixels located on the ray
was used to calculate the difference of the gradients using one-di-
mensional filter window of a given size. And the smallest and largest
extrema corresponded to the approximate boundaries of the required
segmented area.
The border of the selected area was subjected to subsequent cor-
rection by filtering the points of the border [1]. If the Euclidean
distance between the points of the area border and the nearest points
of their regression line is greater than the threshold, then this point
was replaced with an interpolated one. Here the threshold was cal-
culated using the Niblack method. This approach allowed to get rid of
abrupt changes in the boundaries of the object, which give a false
result when selecting the area.
At the second step, the selected area was assigned to one of the lesion
groups on the basis of its statistical characteristics of the brightness
distribution, textural features (Haralick, Tamura, etc.) [2], as well as
geometric features (broadening) of the selected surrounding area of the
object. When obtaining textural features, not only the original images
were used, but also their transformations with the help of various
operators, and the difference between the textural features obtained
with different parameters of the algorithms was taken into account.
The support vector machine with different kernels of the trained
model was used as a classifier (see Fig. 1c, f).
Finally we compared the rate of differentiation mistakes made by
trained radiologist and our software before the biopsy.
Results
Our approach was able to correctly characterize 49 of 54 (90.7%)
benign and 51 of 53 (96.2%) malignant lesions. On the contrary, with
the bare eye it was possible to identify correctly 46 of 54 (85.2%)
Fig. 1 a, d—Input US images of the malignant and benign breast
lesions, respectively; b, e—Segmented lesions and their surrounding
belts; c, f—Software output for a, d images, respectively
Int J CARS (2021) 16 (Suppl 1):S1–S119 S111
123

benign and 49 of 53 (92.5%) malignant lesions. The corresponding
overall specificity values were 90.7% and 86.0%, respectively.Conclusion
Automated approach may surpass the visual assessment performed by
trained radiologist that can be clinically relevant.
References
[1] Williams DJ, Shah M (1992) A fast algorithm for active con-
tours and curvature estimation. CVGIP: Image understanding,
55 (1): 14–26
[2] Humeau-Heurtier A (2019) Texture feature extraction methods:
A survey. In IEEE Access, 7: 8975–9000
Improvement of dementia classification accuracy
for brain SPECT volumes using the attention
mechanism
N. Matsumoto1, A. Saito1, M. Fukasawa2, T. Iizuka2, A. Shimizu1
1Tokyo University of Agriculture and Technology, Institute
of Engineering, Koganei, Tokyo, Japan 2Fukujuji Hospital, Center
for Dementia, Kiyose, Tokyo, Japan
Keywords SPECT, dementia, deep learning, attention
Purpose
The number of patients with dementia is increasing rapidly due to the
recent super-aging society. Early diagnosis of dementia can help to
reduce the incidence of the disease and to determine the optimal
treatment for the patient.
A single-photon emission computed tomography (SPECT) scan
visualizes the distribution of blood flow in the brain. Typical
dementia, such as Alzheimer’’s disease (AD), dementia with Lewy
bodies (DLB), or frontotemporal dementia (FTD), shows reduced
blood flow in different parts of the brain. We proposed a convolu-
tional neural network (CNN) [1] for the classification of patients with
AD, DLB, and FTD, and healthy controls (HCs).
This paper presents the improvement of the dementia classification
accuracy by combining the CNN with an attention mechanism [2],
which can lead the attention of the CNN to a specific part of brain.Methods
The input SPECT volume was standardized by a three-dimensional
stereotactic surface projection in terms of spatial coordinates and gray
values, that is, a WSFM image with normalized density values from 0
to 1. In addition, Z-score volumes were generated by referring to four
sites: whole brain, cerebellum, thalamus, and pons. The input of the
CNN is a set of five volumes of a subject, or WSFM and four Z-score
volumes.
The proposed network is shown in Figure 1, where the CNN [1] of
the perception branch is combined with the attention branch network
(ABN) trained using an attention map [2].
First, the whole network was trained by minimizing the following
loss function
Labn ¼ Lper þ Latt ð1Þ
where Lper and Latt are cross entropy losses for the perception and
attention branches, respectively, computed using classification labels.
The trained network generates an attention map M(xi) of a case xi to
emphasize feature maps and visualizes the region of attention.
Next, the ABN was fine-tuned using the loss function below
L ¼ Labn þ cLmap ð2Þ
where c is a constant value and Lmap evaluates the difference between
the attention map and a map manually designed by a user. It is dif-
ficult for our study to manually design the teacher map because of the
large variety of locations of reduced blood flow that depends on the
dementia class. This study proposed a loss Lmap that encourages the
values of the top N % voxels of the attention map to be 1. Note that
Lmap is calculated in different brain parts depending on the dementia
class, and the brain part P(xi) was manually specified for each
dementia class by the authors in advance. Specifically, the parietal
lobe, temporal lobe, and posterior cingulate gyrus are the parts for the
AD class; parietal and occipital lobes for the DLB class; frontal and
parietal lobes for the FTD class; and none for the HC class.Results
The materials were 421 SPECT volumes of 60 9 77 9 59 voxels
comprising 119 AD, 109 DLB, 93 FTD, and 100 HC cases. We
conducted a three-fold cross validation in which the training, vali-
dation, and testing volume ratios were 4:1:1. The flip of an input
volume was performed as an augmentation with a probability of 0.5.
The Adam optimizer was used in which the initial learning rate for the
training of the whole network was 0.001 and it was multiplied by 0.1
at every 100 epochs. In the fine-tuning of ABN for attention induc-
tion, the learning rate was fixed at 0.0001. N was set as 50%.
Table 1 shows the classification results of the proposed network,
and the differences from the conventional network [1] are presented
in parentheses. Consequently, the classification accuracy was
increased by 2.8 points by the proposed network with attention
induction.Conclusion
This study presented a method that can induce the attention of the
network to the specific brain part. We applied the network trained by
the proposed method to the classification of dementia (AD, DLB, and
FTD) and HC. The experimental results of the three-fold cross
Fig. 1 Proposed network for dementia classification using attention
induction
Table 1 Classification results of the proposed network
True Prediction
HC AD DLB FTD Sensitivity
(%)
Accuracy
(%)
HC 79 (- 6) 8 (3) 6 (2) 7 (1) 79 (- 6) 80 (2.8)
AD 6 (- 3) 94 (9) 9 (- 2) 10 (- 4) 78 (7)
DLB 9 (- 1) 2 (- 5) 97 (6) 1 (0) 88 (5)
FTD 10 (- 4) 11 (1) 5 (0) 67 (3) 72 (3)
S112 Int J CARS (2021) 16 (Suppl 1):S1–S119
123

validation demonstrated the effectiveness of the proposed method.
Optimization of N and suppression of attention remain as future
works. We will improve the classification accuracy of cases with
atypical attention patterns in the future.
References
[1] Yambe M, Saito A, Fukasawa M, Iizuka T, Shimizu A (2019)
3D deep convolutional neural network using SPECT images for
classification of dementia type. CARS 2019—Computer Assis-
ted Radiology and Surgery Proceedings of the 33rd International
Congress and Exhibition, 73–74
[2] Mitsuhara M, Fukui H, Sakashita Y, Ogata T, Hirakawa T,
Yamashita T, Fujiyoshi H (2019) Embedding Human Knowl-
edge into Deep Neural Network via Attention Map. arXiv
preprint arXiv:1905.03540
Investigation of a high-resolution method for detecting
large-intestine regions from plain abdominal CT images
K. Abe1, H. Takeo1, S. Nawano2, Y. Nagai3
1Kanagawa Institute of Technology, Atsugi, Kanagawa, Japan2International University of Health and Welfare, Mita Hospital,
Minato-ku, Tokyo, Japan 3National Cancer Center Hospital East,
Kashiwa, Chiba, Japan
Keywords CAD, Large-intestine, Segmentation, Plain abdominal CT
image
Purpose
At present, the research & development of computer-aided diagnosis
(CAD) is being conducted in various medical fields. Because of the
difficulty in separating the large intestine from peripheral organs,
little development has been carried out in the area of CAD that
employs CT. Recently, due to improved endoscopic precision and the
widespread use of CT colonography, research has been underway into
such areas as applying CAD to discover colorectal cancer. However,
endoscopy and CT colonography require advance preparation. CT
colonography in particular is difficult to conduct in some cases
because of stress placed on the colon when the colon is inflated by
injecting carbon dioxide gas.
In this study, research & development was conducted into a
method for detecting, at high resolution, the large-intestine region
from plain abdominal CT images captured during an abdominal
examination. This method makes it possible to acquire images for use
in CAD development without necessitating colon-stressing CT
colonography. The concordance rate of 71% between the detection
results of this method and manual detection demonstrate this meth-
od’s detection performance.Methods
1. Procedural Flow for the Extraction of the Large-intestine Region
Figure 1 shows the procedural flow of the proposed incremental
learning method
2. Preprocessing
As preprocessing, first-gradation conversion processing was per-
formed to enhance the large intestine. In this study, gradation
conversion was performed with the window level set to 50 HU—the
ordinary value for the abdomen—and, in consideration of subsequent
gas detection, the window width was set to 400 HU.
Next, bone-region detection and the detection of gas regions inside
the intestine were conducted.
During subsequent multi-stage extraction using a threshold value,
because of a tendency for incorrect extraction around the spine and
some rib areas, bone-region extraction is conducted in advance for use
as a feature.
3. Method of Extracting the Large-intestine Region Using Multi-
stage Region Extraction[1, 2].
The multi-step extraction method used for large-intestine extrac-
tion is a method for detecting the optimal shape based on the set
features by binarization while gradually changing the threshold from
a high value to a low value. Digitization is conducted by gradually
changing the threshold value from high to low. Detection of the
optimal shape is carried out based on the features that have been set.
Images for which gradation conversion was performed at widths in
the range of –350 HU to 450 HU using the above gradation process
were processed by setting the initial threshold value to 90 HU and
then by subtracting in 10 HU increments until 0 HU was reached.
Individual seed points are set for each extraction region to reduce the
shifting of extraction regions caused by threshold fluctuations. For
each of these regions, an optimal threshold value is determined using
extraction results for gas regions inside the intestine, bone-region
information, circularity and shape features, and features such as
centroids. Because there are also cases of the large intestine existing
in multiple areas on a slice, individual optimal threshold values are set
for each extraction area. This enables the precise extraction of the
large-intestine region.Results
The detection results of the colonic region by this method are shown
in Fig. 1 (Left) and the manual extraction results are shown in Fig. 2
(Right) for comparison. The concordance rates of the detection results
are 71%, demonstrating high detection performance.
Some of the incorrect detection results can be attributed to
looseness in setting the threshold for regions where body surface fat
Fig. 1 Large-intestine region extraction procedural flow
Fig. 2 Detection results of the present. (Left: present method, Right:
manual extraction)
Int J CARS (2021) 16 (Suppl 1):S1–S119 S113
123

regions, the small intestine, and the large intestine adjoin with other
organs.Conclusion
In this paper, a method for extracting the large-intestine region using
plain abdominal CT images was proposed. A multi-stage extraction
method enabled the precise extraction of the large intestine, which
tends to have faint contrast with peripheral organs. A comparison of
the detection results of the present method with manual detection
results indicates a concordance rate of 71%, verifying the extraction
performance of the present method.
While the present method is capable of extracting the large
intestine from plain abdominal CT images, there were no colorectal
cancer cases in the samples used in this study. However, the high-
level extraction results obtained with the present method suggest that
it can be expected in the future to be applied to colorectal cancer
detection methods that use plain abdominal CT images.
References
[1] Dounomae Y, Takeo H (2013) Image processing method,
apparatus and program. Japan patent JP2013–105245A
[2] Abe K, Takeo H, Dounomae Y, Kuroki Y, Nagai Y (2012)
Automation of CT-based measurement of 3-dimensional car-
diothoracic volumetric ratio, Suppl. 1, CARS2012, pp.S314-
S315
The relative importance of fine needle aspirate
diagnostic attributes in machine learning classification
of breast cancer
S. Raju1
1UIC College of Medicine at Rockford, Rockford, IL, United States
Keywords breast cancer, cytopathology, machine learning, data
mining
Purpose
The purpose of this study was to use machine learning experiments
and information gain ranking to determine the relative importance of
several breast mass fine-needle aspirate (FNA) diagnostic features in
correctly differentiating malignant from benign breast disease, with
the goal of understanding what features may be most important in
predicting malignancy.Methods
A dataset from the University of Wisconsin consisting of 699 cases
was used to train a machine learning algorithm, BayesNet, to cor-
rectly classify breast FNA results as benign or malignant on the basis
of nine cytopathological attributes: bare nuclei, bland chromatin, cell
clump thickness, marginal adhesion, mitoses, normal nucleoli, single
epithelial cell size, uniformity of cell shape, and uniformity of cell
size [1]. All data analysis was performed using the Weka machine
learning platform [2]. Information gain ranking of the attributes was
calculated to identify the relative importance of each of the nine
cytopathologic attributes in correctly distinguishing malignant from
benign lesions. First, the classifier was applied to the dataset with all
nine cytopathologic attributes included. Next, the classifier algorithm
was applied with attributes successively removed, starting with
removal of the attribute with the lowest information gain ranking and
continuing through to removal of all but the attribute with the highest
information gain ranking. After each successive removal of an attri-
bute from the dataset, the classifier was re-applied, and changes in
classifier performance with each attribute reduction were recorded.
Three additional experiments were performed: (1) the classifier was
applied using only data from lowest-information gain attribute (2) the
classifier was applied using only data from the highest-information
gain attribute and (3) the classifier was applied using only data from
the two highest-information gain attributes. Classifier performance
was measured using Area Under the Receiver Operator Curve (AUC),
Kappa statistic and percent accuracy of classification. ZeroR, a
classifying algorithm that selects the most common classification and
applies it to all cases, was used as a control classifier. Stratified ten-
fold cross validation allowed for the use of one dataset for both
classifier training and testing (Fig. 1).Results
Information gain ranking revealed degree of mitoses as the least
valuable attribute for correctly predicting malignancy, while cell size
uniformity and cell shape uniformity were determined to be the most
important attributes. In order of most to least information gain, the
attributes were: cell size uniformity, cell shape uniformity, bare
nuclei, bland chromatin, single epithelial cell size, normal nucleoli,
clump thickness, marginal adhesion, and mitoses. With all nine
attributes included, the AUC was 0.992, with percent correct classi-
fication of 97.1% and Kappa of 0.937. Removing mitoses from the
dataset improved the performance of the classifier by percent correct
classification and Kappa statistic, but AUC showed no significant
change: upon removal of this attribute, correct classification of
malignancy increased to 97.4%, Kappa increased to 0.944, and AUC
decreased slightly to 0.991. Using mitoses as the only attribute in the
dataset, the AUC was 0.683, the percent correct classification was
78.9%, and Kappa was 0.472. This performance was only marginally
better than the performance of ZeroR, the control algorithm, with
AUC of 0.496, percent correct classification of 65.5%, and Kappa of
0. The greatest decreases in performance by AUC were seen after
removal of the 7th attribute, cell shape uniformity, and after the
8th attribute, cell size uniformity. Removal of cell shape uniformity
decreased AUC from 0.987 to 0.971, decreased percent correct
classification from 95.4% to 94.3%, and decreased Kappa from 0.899
to 0.874. Further removal of cell size uniformity as an attribute
decreased AUC to 0.959, decreased percent correct classification to
92.4%, and decreased Kappa to 0.874. Removing these same two
high-information gain attributes from the data first, but maintaining
all seven other lower-information gain attributes in the dataset, yiel-
ded an AUC of 0.992, a percent correct classification of 97%, and a
Kappa of 00.934 (Table 1).Conclusion
In this data set the degree of mitoses does not appears to significantly
improve classifier performance when the remaining 8 attributes are
available. Using only one or two of the highest information gain
ranked attributes results in relatively robust performance of the
classifier although there are small improvements in performance
when additional attributes are included, with the exception of mitoses.
Fig. 1 Comparison of information gain of cytopathologic attributes.
Mitoses provided the least useful information, while cell size and cell
shape uniformity provided the most useful information for correctly
identifying malignancy in breast FNA
S114 Int J CARS (2021) 16 (Suppl 1):S1–S119
123

Inclusion of mitoses appeared to decrease the performance of the
classifier using the kappa statistic and correct classification rate.
References
[1] Mangasarian OL, Wolberg WH (1990) Cancer diagnosis via
linear programming, SIAM News, Vol 23, No 5, Sept 1990, pp 1
& 18
[2] Eibe F, Hall MA, Witten IH (2016) The WEKA Workbench.
Online Appendix for Data Mining: Practical Machine Learning
Tools and Techniques, Morgan Kaufmann, Fourth Edition
Spine MRI texture analysis and prediction of
osteoporotic vertebral fracture
J. da Silva Ramos1, J. Gomes Maciel2, A. Juci Traina1, P. Azevedo-
Marques2, M. Nogueira-Barbosa2
1Institute of Mathematics and Computer Science (ICMC), USP, Sao
Carlos, Brazil 2Ribeirao Preto Medical School, USP, Medical
Imaging, Hematology and Oncology, Ribeirao Preto, Brazil
Keywords Magnetic Resonance Imaging, Textural Attribute, Osteo-
porosis, Spine
Purpose
Bone mineral density (BMD) evaluated by bone densitometry
(DEXA) is the international reference standard for diagnosing
osteoporosis, but DEXA is far from ideal when used to predict sec-
ondary fragility fractures [1]. These fractures are strongly related to
morbidity and mortality. New techniques are necessary to achieve
better prediction of patients at risk to develop fractures. Previous
literature showed that spine MRI texture features correlate well with
DEXA measurements [2]. Our aim is to evaluate vertebral bone
texture analysis searching for potential biomarkers to predict bone
fragility fractures secondary to osteoporosis.Methods
The study group comprises 63 patients submitted to DEXA and spine
MRI: 16 healthy volunteers without osteoporosis and without verte-
bral fractures, 12 osteopenic patients without fractures and 12
osteopenic with fragility fracture, 12 osteoporotic patients without
fractures and 11 osteoporotic with fragility fracture.
T1-weighted (T1w) and T2-weighted (T2w) MRI were segmented
for feature extraction (figure 1).
In total, 1316 features were extracted from each vertebral body
(L1-L5), including shape and textures features. A few variations were
added using log and wavelets. All features were extracted using
pyradiomics.
We performed a binary classification, in which we aimed at pre-
dicting if there could be a fracture or not. In total, 97 volumetric
vertebral body were previously classified as osteopenia/osteoporosis
but had no posterior fracture and 97 volumetric vertebral body were
previously classified as osteopenia/osteoporosis and presented a
future fracture.
K-nearest neighbor (k-nn), Support Vector Machine (SVM),
Trees, Naive Bayes and Discriminant Analysis were tested separately
for classification, using tenfolds cross validation. We compared the
classifications with and without feature selection. We employed Chi
square tests and Principal Component Analysis (PCA) for the selec-
tion of features. The hyperparameters of every classifier considered in
the experiments were trained so that to achieve the best result. For
comparison, we use well-known measures, such as Accuracy, Preci-
sion, Sensitivity, F-Measure, and Area Under de Curve (AUC).Results
Classification results using the features extracted from T1w and T2w
MRI, with binary classification predicting fracture or not are depicted
on Table 1. Note that, in general, SVM performed better with selected
features, achieving up to 95% AUC and 89% Accuracy.Conclusion
Texture analysis from spine MRI achieved high diagnostic perfor-
mance for differentiation of patients with and without vertebral body
fragility fracture. The best results were obtained with feature selection
and combining texture features extracted both from T1w and T2w
images. Our results are promising and encourage prospective and
longitudinal studies to search for the best MRI features with potential
to become biomarkers.Acknowledgements
This study was financed in part by the Coordenacao de Aperfeicoa-
mento de Pessoal de Nıvel Superior (CAPES)—Finance Code 001
and by The Sao Paulo State Research Foundation (FAPESP) Grants #
2018/04266-9, 2017/23780-2 and 2016/17078-0.
Table 1 BayesNet classifer performance with sequential removal of
cytopathologic attributes
Percent
correctly
classified as
malignant or
benign (%)
Kappa
statistic
Area
under
the curve
Successive
attribute
removed
All 9 Attributes 97.10 0.937 0.992 None
8 Attributes 97.40 0.9437 0.991 Mitoses
7 Attributes 97.30 0.9406 0.991 Marginal
Adhesion
6 Attributes 97.30 0.9405 0.989 Clump
Thickness
5 Attributes 96.40 0.9214 0.988 Normal
Nucleoli
4 Attributes 96.30 0.918 0.989 Single
Epithelial
Cell Size
3 Attributes 95.40 0.8993 0.987 Bland
Chromatin
2 Attributes 94.30 0.8741 0.971 Bare Nuclei
1 Attribute 92.40 0.8368 0.959 Cell Shape
Uniformity
The attributes were removed in order of least information gain to most
information gain, and the classifier was re-applied after each removal
Fig. 1 Example of MRI segmentations for patient 10. a Sagittal T1
weighted MRI. b 3D Segmentation of T1 weighted MRI. c Sagittal T2
weighted MRI. d 3D Segmentation of T2 weighted MRI
Int J CARS (2021) 16 (Suppl 1):S1–S119 S115
123

References
[1] Bauer JS, Link TM (2009) Advances in osteoporosis imaging.
Eur J Radiol;71(3):440–9. https://doi.org/10.1016/j.ejrad.
2008.04.064
[2] Maciel JG, Araujo IM, Trazzi LC, Azevedo-Marques PM,
Salmon CEG, Paula FJA, Nogueira-Barbosa MH (2020) Asso-
ciation of bone mineral density with bone texture attributes
extracted using routine magnetic resonance imaging. Clinics
(Sao Paulo); 75:e1766. Epub 2020 Aug 26. https://doi.org/
10.6061/clinics/2020/e1766
Computerized prediction method for low-grade gliomas
with 1p/19q codeletion in brain MRI images using
3-dimensional attention branch networks
D. Tanaka1, A. Hizukuri1, R. Nakayama1
1Ritsumeikan University, Graduate School of Science
and Engineering, Kusatsu Shiga, Japan
Keywords 3D-attention branch network, low-grade gliomas (LGG),
1p/19q codeletion, MRI images
Purpose
Low-grade gliomas (LGG) with co-deficiency of the short arm of
chromosome 1 and the long arm of chromosome 19 (1p/19q
codeletion) are longer survival and positive response to chemother-
apy. Therefore, it is important to diagnose whether the LGG has 1p/
19q codeletion or not in planning effective treatment for individual
patient. However, the gene analysis for 1p/19q codeletion requires a
lot of time and expense. In previous studies, computerized prediction
methods for 1p/19q codeletion from brain MRI (Magnetic Resonance
Imaging) images have been developed using a convolutional neural
network (CNN). Those CNNs trained the relationship between ROIs
(Region of Interest) including an entire tumor and teacher signals (1p/
19q codeletion or not). Those ROIs included not only the tumor but
also background tissue. Therefore, the CNNs might not be trained
focusing on the tumor. The purpose of this study was to develop a
computerized prediction method for LGG with 1p/19q codeletion
using a 3-dimensional attention branch network (3D-ABN) with an
attention mechanism that can extract features focusing on a tumor in
brain MRI images.Methods
Our database consisted of brain T2-weighted MRI images obtained in
159 patients from The Cancer Imaging Archive (TCIA). Those ima-
ges included 102 LGGs with 1p/19q codeletion and 57 LGGs without
it. The image size was 256 9 256, whereas the number of slices was
from 20 to 60. T2-weighted MRI images first were interpolated to
isotropic voxel sizes by a linear interpolation method. A ROI
including an entire tumor was manually extracted from T2-weighted
MRI images.
Figure 1 shows a proposed 3D-ABN architecture. The 3D-ABN
was constructed from a feature extractor, an attention branch, and a
recognition branch. The ROIs with a tumor first was resized to
160 9 160 9 48 voxels and then inputted to the input layer of 3D-
ABN. The feature extractor had four convolutional blocks and
extracted feature maps from the input ROI. Each convolutional block
composed of the 3D convolutional layer, the batch normalization
layer, the rectified linear unit (ReLU) function, and the global average
pooling (GAP) layer. The feature extractor generated feature maps for
different resolutions from the second, third, and fourth convolutional
blocks. The 3D-ABN had three attention branches that generated
attention maps for weighting the tumor region. The attention maps
first were generated by using the feature maps from each attention
branch. The attention maps were then applied to the feature maps in
the attention mechanisms, as shown in Fig. 1. A tumor segmentation
mask was used for modifying the attention map in attention branch 1.
The recognition branch evaluated the likelihood of LGG with 1p/19q
codeletion using the feature maps from the feature extractor. The
recognition branch was constructed from three sub-networks con-
sisting of a GAP layer, two fully connected (FC) layers, two dropout
layers, and two ReLU functions. The features generated from the
three sub-networks were connected in the final FC layer. Finally, the
output layer with the softmax function outputted the likelihood of
LGG with 1p/19q codeletion.
A loss function for training the 3D-ABN was defined by a sum of
losses for the attention branches and for the recognition branch. The
losses for the attention branches and for the recognition were given by
mean squared error and a class-balanced cross-entropy with a weight
factor b, respectively. A three-fold cross-validation method was
employed to evaluate the classification performance of the proposed
3D-ABN. In training the proposed 3D-ABN, the learning rate, the
Table 1 Classification results for the extraction of features in T1 and
T2. Binary classification predicting fracture or not
Classifier Measure (%)
Accuracy Precision Sensitivity F-
Measure
AUC
Without feature selection
k-nn 84 82 87 84 84
SVM 86 82 91 86 95
Tree 81 80 84 82 90
Naıve Bayes 66 61 93 73 67
Discriminant
Analysis
71 69 75 72 71
With feature selection
k-nn 88 89 88 88 88
SVM 89 88 91 89 95
Tree 77 75 80 78 82
Naıve Bayes 73 71 77 74 82
Discriminant
analysis
82 84 78 81 87
Bold values represent the highest percentages while underlined values
represent the second-best result. For the feature-selected results, in
total, 69 out of 1316 features were considered
Fig. 1 Overview of the proposed 3D-ABN
S116 Int J CARS (2021) 16 (Suppl 1):S1–S119
123

mini-batch size, the number of epochs, the weight factorb, and the
weight decay were set to 0.0001, 3, 50, 0.99, and 0.01, respectively.
The classification performance of the proposed 3D-ABN was com-
pared with that of a 3D-CNN constructed from four convolutional
layers, four batch-normalization layers, four max-pooling layers, and
three fully connected layers. The learning parameters for the 3D-CNN
were the same as those for the 3D-ABN. The classification accuracy,
the sensitivity, the specificity, the positive predictive value (PPV), the
negative predictive value (NPV), and the area under the receiver
operating characteristic curve (AUC) were used as the evaluation
indices of the classification performance.Results
The classification accuracy, the sensitivity, the specificity, the PPV,
the NPV, and the AUC with the proposed 3D-ABN were 78.0% (124/
159), 79.4% (81/102), 75.4% (43/57), 85.3% (81/95), 67.2% (43/64),
and 0.804, respectively. All evaluation indices for the proposed 3D-
ABN were greater than those for the 3D-CNN (68.6%, 75.5%, 56.1%,
75.5%, 56.1%, and 0.736). The AUC for the 3D-CNN was improved
significantly by the proposed 3D-ABN (p\ 0.014). These results
implied that the proposed 3D-ABN was effective in predicting LGG
with 1p19q codeletion when compared as the 3D-CNN.Conclusion
In this study, we developed a computerized prediction method for
LGG with 1p/19q codeletion in brain MRI images using the 3D-ABN.
The proposed method was shown to have a high classification per-
formance for 1p/19q codeletion and would be useful in planning
effective treatment for LGG.
Deep learning-based prediction of clinical outcomes
in diffuse large B-cell lymphoma (DLBCL)
from a baseline 18F-FDG PET scan
P. Liu1, X. Gao1, G. Zheng1
1Institute of Medical Robotics, School of Biomedical Engineering,
Shanghai Jiao Tong University, ShangHai, China
Keywords Diffuse Large B-cell Lymphoma, Prognosis, Radiomics,
Deep learning
Purpose
Early identification of Diffuse Large B-cell Lymphoma (DLBCL)
patients with a poor prognosis from baseline 18F-FDG PET/CT scans
allows for the tailing of their curative remediation plan for an
improved chance of cure. However, this task often challenge since it
suffers from the problem of insufficient labeled data and severe class
imbalance. Deep learning-based algorithms have recently gained
momentum for a number of computer-aided diagnosis and prognosis
applications. In this work, we propose a novel multi-task deep
learning (DL)-based method for joint segmentation and predictive of
2-year progression-free survival (2y-PFS) of DLBCL, enabling out-
come prognostication directly from baseline 18F-FDG PET/CT scans.
Furthermore, in order to tackle the problem of data insufficient and
class imbalance, we introduce Batch Nuclear-norm Maximization loss
to the prediction matrix.Methods
In this paper, we propose a multi task learning method for PET
images. The proposed method do the segmentation and classification
task in a end-to-end deep learning model, this deep learning model
takes PET volumes as inputs and produces two outputs, including a
volume-level prediction probability and a segmentation map. The
proposed network is shown in Fig. 1. We adopt U-Net as the back-
bone network as it achieves excellent performance in 3D medical
image analysis. There are three modules in U-Net architecture: (i) an
encoding module, (ii) a decoding module, and (iii) skip connections
between encoding module and decoding module. As shown in
Fig. 1q, there are four down-sampling operations in the encoding
module to extract high-level semantic features. Symmetrically, there
are four up-sampling operations in the decoding module to interpret
the extracted features from the encoding module to predict the 3D
segmentation map. Skip connections connect feature maps of same
level from the encoding module to the decoding module to propagate
spatial information and refine segmentation convolution layer. We
set all convolution kernel sizes to 3 9 3 9 3, every convolution
operation followed with batch normalization (BN) and rectified linear
unit (ReLU). We use Max-pooling to down-sample feature maps.
In our Multi-task U-Net architecture, we share the encoding
module for classification and segmentation task to extract common
features for those two tasks. As illustrated in Fig. 1, a classification
branch is added to the bottom of the U-Net, Firstly, feature maps from
bottom of the U-Net are fed into the classification network which has
a convolution layer and a fully connected (FC) layers, and followed
with one softmax layer to predict the input volume as 2-year pro-
gression-free survival (2y-PFS) of DLBCL. Since our task is label
insufficient and suffer from class imbalance problem. In order to
tackle this issue, we reinvestigate the structure of classification output
matrix of a randomly selected data batch.
As [1] find by theoretical analysis that the prediction accuracy
could be improved by maximizing the nuclear-norm of the batch
output matrix. Accordingly, to improve the classification perfor-
mance, we introduce Batch Nuclear-norm Maximization (BNM) on
the output matrix. BNM could boost the performance under label
insufficient learning scenarios.
A cohort study containing clinical data including baseline 18F-
FDG PET/CT scans of 124 patients was used for the evaluation of the
proposed method under a five-fold cross validation scheme.Results
We use Accuracy, area under the receiver operating characteristic
(ROC) curve (area under the curve [AUC]), sensitivity and specificity
for quantitative evaluation of classification performance. For seg-
mentation, we use Dice similarity coefficient (DSC) to evaluate the
performance. We compare our method with two method: the alter-
native radiomic model and the model without BNM. As shown in
Table 1, our multi-task learning method achieves consistent
improvements on all metrics over radiomics model, this showing that
our multi-task deep learning model could learn better representation
of the PET images for classification and segmentation. Furthermore,
the multi-task learning framework could do the segmentation in the
same time. By introduce the BNM for our multi-task deep learning
model, we improve the AUC, Specificity and Dice, especially with
significant improves on Specificity and Dice, showing that the BNM
is indeed helpful for more effective tackle of this label insufficient
situation.
Fig. 1 Overall architecture of our method
Int J CARS (2021) 16 (Suppl 1):S1–S119 S117
123

Conclusion
The proposed multi-task deep learning prognostic model achieved
much better results than the alternative radiomic model. Our experi-
mental results demonstrated that the proposed model has the potential
to be used as a tool for tumor segmentation of PET images and risk
stratification for patients with DLBCL.
References
[1] Cui S, Wang S, Zhuo J, Li L, Huang Q, Tian Q (2020) Towards
discriminability and diversity: Batch nuclear-norm maximiza-
tion under label insufficient situations. In: Proceedings of the
IEEE/CVF Conference on Computer Vision and Pattern
Recognition. pp. 3941–3950
A Novel 2D Augmented Reality Ultrasound Framework
using an RGB-D Camera and a 3D-printed Marker
Y. Zhou1, G. Lelu1, B. Labbe1, G. Pasquier1, P. Le Gargasson1, A.
Murienne1, L. Launay1
1Institut de recherche technologique b-com (IRT b-com), Immersive
& Medical Technologies Lab, Cesson-Sevigne, France
Keywords Ultrasound, Augmented reality, Probe calibration, RGB-D
camera
Purpose
2D ultrasound (US) is widely used in many clinical practices such as
needle biopsy and surgery guidance since it is real-time, safe and
cheap. Images are acquired using a handheld probe, resulting in a
series of 2D slices, which must be further related to the underlying 3D
anatomy of the patient for effective navigation. This could be
accomplished by simultaneously acquiring 2D images and tracking
the probe using an optical or electromagnetic (EM) tracking system.
Moreover, an US Probe Calibration (UPC) procedure should be
performed beforehand in order to get the spatial relationship between
the image plane and the probe.
An important component of the Augmented Reality (AR) US
frameworks is the underlying tracking system. Many commercial
solutions exist, for instance the NDI Polaris/Aurora. A complex UPC
procedure is generally necessary, during which multiple sensors are
attached to the calibration phantom, the probe, as well as the styluswhich is an auxiliary tool used to localize the phantom. The cali-
bration matrix can be estimated using the open-source software PLUS
toolkit. Such classical AR US frameworks usually ensure a high
precision level. However, a costly, complex, and somewhat cum-
bersome system is required, which might hamper their utilization in
clinical routine.
Recently, in [1], the authors introduced a simpler and cheaper AR
US system based on a standard RGB-D camera. The camera is fixed
upon the probe, and its pose is estimated from contextual image
information. The cost is much reduced. However, textured scenes are
required and multiple fiducial markers should be installed in the
Operating Room (OR). This could have a non-negligible impact on
the routine clinical environment.
In this paper, we propose a simple and low cost RGB-D camera-
based AR US framework. A specifically-designed 3D-printed marker
and a fast model-based 3D point cloud registration algorithm FaVoR
[2] are seamlessly merged. Unlike in [1], the tracking is merely based
on depth information. This is aimed at obtaining a stable solution
despite the constraints related to the OR, such as the strong OR light
which can sometimes saturate the RGB sensors. In addition, the UPC
procedure is much simplified, additional sensors or tools, such as the
stylus, are no longer needed.
Methods
In AR US, a first step is to perform US probe calibration. Figure 1
illustrates our calibration system using the N-wire phantom fCal-2.1.
Nine metal wires of 1 mm diameter were installed so as to form the
‘‘N’’ shape at three different depth levels. The patent-pending marker
actually results from a sophisticated combination of small cubes of
size 1 cm, forming an object of roughly 4 cm span. Both the RGB-D
camera and the US image stream are connected to the mobile
workstation via USB 3.0 cables, and are managed by the fCalapplication of PLUS.
The calibration consists of three key steps: phantom localization,
probe tracking and PLUS calibration. Unlike most calibration pro-
cedures where additional markers need to be attached to the phantom
for its localization, we make full use of the generic nature of FaVoR
and directly register the virtual model of the phantom with the 3D
point cloud (depth map). Then, FaVoR is reparametrized with the
probe marker’s virtual model for the tracking. The probe is placed
over the phantom to image the installed fiducial wires, producing US
images with nine visible white spots. Those points are segmented by
PLUS, and the middle-wire points are matched to the groundtruth
positions in the phantom. Since both the phantom and the probe
marker are localized by the same camera, spatial positions in the
phantom space are easily mapped to 3D coordinates in the marker’s
space. This generates correspondences between the image and marker
spaces, from which is further computed the calibration matrix via
least-square fitting. Once calibrated, our system is deployed to aug-
ment a real-world scenario with US image information. A
visualization software based on OpenGL has been developed for
rendering an US image within a standard RGB image.
Results
The distance between the RGB-D camera and the top of the phantom
is a key variable that could impact the accuracy. As a result, we
performed the calibration at five different distances. The magnitudes
of the calibration errors on N-wire phantom generated by PLUS are
listed in Table 1.
We observe that the Occipital Structure Core achieved its best
accuracy at 50 cm, corresponding to an average calibration error of
2.6 mm. Figure 2 shows the deployment of the calibrated probe for
augmenting a real-world video on a BluePrint phantom. A needle
insertion procedure was simulated. The US images are rendered using
a proper color map which highlights pixels with higher intensities in
bright yellow. A spatial continuity is observed between the needle
Table 1 Performance of three models when evaluated with fivefold
cross validation
Methods AUC Accuracy Sensitivity Specificity DICE
Radiomics model 0.735 0.718 0.856 0.353 –
Multi-task U-net 0.792 0.814 0.875 0.622 0.964
Multi-task U-net
with BNM
0.818 0.814 0.846 0.725 0.992
S118 Int J CARS (2021) 16 (Suppl 1):S1–S119
123

part which is outside the phantom (highlighted for better visualiza-
tion) and the inside part revealed by US.
Conclusion
A simple and low cost AR US framework including an RGB-D
Camera, a 3D-printed marker, and a fast point-cloud registration
algorithm FaVoR was developed and evaluated on an Ultrasonix US
system. Preliminary results showed a mean calibration error of
2.6 mm. The calibrated probe was then used to augment a real-world
video in a simulated needle insertion scenario. Visually-coherent
results were observed. Future work should include a more rigorous
and thorough validation of the proposed method, through quantitative
evaluations in both simulated and real world medical scenarios.
References
[1] Busam B, Ruhkamp P, Virga S (2018) Markerless inside-out
tracking for interventional applications. http://arxiv.org/
abs/1804.01708
[2] Murienne A, Labbe B, Launay L (2020) Model-based 3D
Tracking for Augmented Orthopedic Surgery. EPiC Series in
Health Sciences 4:197–200
Publisher’s Note Springer Nature remains neutral with regard to
jurisdictional claims in published maps and institutional affiliations.
Fig. 1 The ultrasound probe calibration setting of the proposed AR US framework. An Ultrasonix US machine, an Occipital Structure Core
RGB-D camera, a 3D-printed marker, a water tank containing the N-wire phantom and a mobile workstation are combined for the calibration
Fig. 2 Augmented reality ultrasound simulating needle insertion in
real-world video. The tracked marker is rendered in blue and the
calibrated US image is displayed on the RGB image
Table 1 Evolution of the calibration error over the camera-phantom
distance
Distance
(cm)
40 50 60 70 80
Calib. Err.
(mm)
30.1 ± 20.0 2.6 ± 0.4 3.4 ± 0.5 3.3 ± 0.7 4.0 ± 0.6
Int J CARS (2021) 16 (Suppl 1):S1–S119 S119
123