Clarifying the Diffuse Gliomas An Update on the Morphologic ...
Upload
independentCategory
view
2download
0
Transportation Research Part A 45 (2011) 81–90
Contents lists available at ScienceDirect
Transportation Research Part A
journal homepage: www.elsevier .com/locate / t ra
Carpooling and carpool clubs: Clarifying concepts and assessing valueenhancement possibilities through a Stated Preference web surveyin Lisbon, Portugal
Gonçalo Correia a,⇑, José Manuel Viegas b,1
a Department of Civil Engineering, University of Coimbra, Rua Luís Reis Santos, 3030-788 Coimbra, Portugalb Department of Civil Engineering, Instituto Superior Técnico, Universidade Técnica de Lisboa, Av. Rovisco Pais, 1049-001 Lisboa, Portugal
a r t i c l e i n f o a b s t r a c t
Article history:Received 4 November 2010Accepted 4 November 2010
Keywords:CarpoolingCommuter tripsDiscrete Choice ModelingStated Preference surveysTransport Demand ManagementUrban transport
0965-8564/$ - see front matter � 2010 Elsevier Ltddoi:10.1016/j.tra.2010.11.001
⇑ Corresponding author. Tel.: +351 239 797105.E-mail addresses: [email protected] (G. Correia)
1 Tel.: +351 21 8418413.
The increase of urban traffic congestion calls for studying alternative measures for mobilitymanagement, and one of these measures is carpooling. In theory, these systems could leadto great reductions in the use of private vehicles; however, in practice they have obtainedlimited success for two main reasons: the psychological barriers associated with ridingwith strangers and poor schedule flexibility. To overcome some of the limitations of thetraditional schemes, we proposed studying a carpooling club model with two main newfeatures: establishing a base trust level for carpoolers to find compatible matches for tra-ditional groups and at the same time allowing to search for a ride in an alternative groupwhen the pool member has a trip schedule different from the usual one. A web-based sur-vey was developed for the Lisbon Metropolitan Region (Portugal), including a Stated Pref-erence experiment, to test the concept and confirm previous knowledge on these systems’determinants. It was found through a binary logit Discrete Choice Model calibration thatcarpooling is still attached with lower income strata and that saving money is still animportant reason for participating in it. The club itself does not show promise introducingmore flexibility in these systems; however, it should provide a way for persons to interactand trust each other at least to the level of working colleagues.
� 2010 Elsevier Ltd. All rights reserved.
1. Introduction
The continuous rising of car use deriving from urban sprawl and car ownership growth is still making traffic congestionmore frequent in urban areas (Bukold et al., 1996; Schrank and Lomax, 2005). The majority of trips are single occupant vehi-cle trips (SOV) resulting in more cars for the same number of persons. In 1990, approximately 90% of the work trips and 58%of the other trips in United States were done in SOV (Shaheen et al., 1999). Numbers of 1997 show that the average occu-pancy rate of the automobiles in commuting trips for the 15 countries of the European Union was, at that time, in the intervalbetween 1.1 and 1.2 persons per vehicle (IEA, 1997). Hence the problem is not so much car ownership increase but mainlythe way the automobile is used, and when it is used, ‘‘A good deal of the demand for transport is concentrated on a few hoursof the day, in particular in urban areas where most of the congestion takes place during specific peak periods’’ (Ortúzar andWillumsen, 2001), generally the morning and evening commuting periods.
. All rights reserved.
, [email protected] (J.M. Viegas).

82 G. Correia, J.M. Viegas / Transportation Research Part A 45 (2011) 81–90
Carpooling is considered an interesting Transport Demand Management (TDM) tool that has produced some diminish-ment in the number of SOV trips in the past, mainly when applied to employment centers where persons have their com-panies in common (Wartick, 1980; Willson and Shoup, 1990; Bianco, 2000). The other alternative is household carpooling,yet this has proven to be very inefficient in decreasing work related auto trips (Bard, 1997; Morency, 2007). An increase inscale of participation, from companies to large-scale systems, has always been the objective of public policy making. Still,early research has shown that this is difficult to achieve due to the high probability of sharing the vehicle with a non-acquaintance (Duecker et al., 1977).
On the other hand, the classical carpooling systems have low flexibility, particularly in handling schedule variations anddestinations that persons sooner or later will have, which is aggravated by the dependence on other persons that carpoolingentails (Stephen and Duecker, 1974; Margolin et al., 1978; Concas and Winters, 2007). This has resulted in only a small per-centage of the persons who make a positive change in commute-mode to carpooling to stay with this new mode until theyare not traveling to their workplace anymore (Smith and Beroldo, 2002).
The question that arises out of the previous research is if there is any way to improve carpooling attractiveness and resil-ience by considering a different form of organizing and promoting this transport alternative. Most of the research projects onthis subject were published in the seventies and eighties; thus, there is the need for further exploration of the sources for itslack of success in reaching ways to improve carpooling usage.
We were moved by the will for proposing a new model for a carpooling systems’ organization which could overcome thelimited results from past applications. We took advantage of the relative inexperience with carpooling systems in the LisbonMetropolitan Area (LMA) in Portugal with three million inhabitants (the largest in the country) to evaluate the main moti-vations and deterrents to carpooling. In this, we tried to assess which demographic characteristics and commuter situationswould be more favorable to the acceptance of carpooling.
We started by reviewing the state-of-the-art and state-of-the-practice of carpooling systems in order to derive the attri-butes of a carpooling club which could, in theory, overcome previous limitations of this transport alternative. To test thisstructure, a web-survey was set up on the internet comprised of two sections: the first, for collecting socio-demographicand usual commuter trip data and the second, with a Stated Preference (SP) experiment presenting four binary choicesfor each respondent comparing his current driving situation and an alternative with external (non-household) carpooling.
The paper is organized in the following way: in the next section, the carpooling structure in the form of clubs is derivedfrom past experience and research. Then, a review of the main factors found to influence carpooling in the past is presentedin order to support the survey design. This is followed by the construction of the SP web survey that was made available onthe web for the Lisbon region. Next, the Discrete Choice Model (DCM) estimated with the SP data is presented. The articlecontinues with a detailed analysis of the main results and finishes with a discussion and conclusion on its main findings.
2. Deriving a carpooling structure in the form of clubs
After reviewing the previous studies, two main problems came out to be the most limiting factors for carpooling: the psy-chological barrier of riding with strangers, which is necessary for expanding the scale of the systems; and poor schedule flex-ibility, where near term schedule changes are very difficult to be managed by traditional systems.
In order to cope with these two main problems, we researched a structure for managing carpooling in the form of clubs,which aims working upon schedule flexibility and psychological issues in different perspectives with the purpose of bringingmore participants to this transport option.
For managing schedule variations, the club can be set to manage both traditional stable groups and a dynamic ridematch-ing service in the same structure taking advantage of their compatibility. Traditional stable pool groups would be the core ofthe system, and when space is available in a group, it can be allocated dynamically to an occasional demand from a personwho normally belongs to another pool in the club (Correia and Viegas, 2009).
Dynamic ridematching services or instant ridesharing have been tested before, mainly in the United States, but they haveproved to be very ineffective when applied independently (Giuliano et al., 1995; Haselkorn et al., 1995; Dailey et al., 1999).From the physical dimension perspective, the technology that is needed to implement these systems exists and is ready to bedeployed (Hartwig, 2007). Its success, however, strongly depends on the willingness to share a ride with a possible stranger,and this has proven critical for the development of the concept.
The club structure that is proposed and was tested is based on users who can act both as passengers and drivers. This isactually placing a constraint, which has been recognized to influence carpooling propensity, but our goal was to design a clubaiming at higher occupancy rates, improving commuter trip sustainability. So, the main target was to reduce the number ofSOVs by bringing those solo drivers into the club, and it was assumed that all these club members could act both as driversand as passengers.
From a psychological standpoint, the club structure aims to provide a common minimum level of trust between its mem-bers by filtering and accompanying all the groups. We want to test if this can provide sufficient confidence in order to make iteasier to accept persons who are not acquaintances.
Previous research has focused on these issues and their impact on carpooling performance. Early on, Kurth and Hood(1977), found that appeals to self-interest made through work organizations were more effective than other means ofencouraging carpooling not only because the poolers have similar work schedules, but also because the work organization
G. Correia, J.M. Viegas / Transportation Research Part A 45 (2011) 81–90 83
establishes a base trust level between participants. More recent studies also led to the same conclusion: persons are likely totrust others who share their organizational affiliations and are more likely to engage in interactions, exploiting group iden-tity to form personal bonds (Prentice et al., 1994; Mcknight et al., 1998).
This suggests the importance of a common basis for establishing a relationship of the kind needed to form carpoolinggroups. ‘‘Creating a group whose members have similar interests will tend to make the group more attractive, and empha-sizing to group members their unique skills or knowledge will tend to make them believe their efforts matter’’(Terveenand McDonald, 2005). The amount of exposure persons have to each other strongly influences the likelihood of interper-sonal interaction. Persons who are physically close are likely to meet and interact frequently allowing friendships todevelop.
3. Factors that affect carpooling propensity and resilience
There are many factors which have been found to influence carpooling acceptance and these should be included for eval-uating the club’s attractiveness. In general one may divide these factors into four main classes: Transport System character-istics, Carpooling Group characteristics, Individual/Household characteristics, and Conditions at the Workplace (Hunt andMcMillan, 1997).
Transport system characteristics, especially those connected to cost and time attributes, are the primary instrument fac-tors behind mode choice and have usually been disaggregated in several parts in order to study their impact on carpooling.For travel time, researchers have been differentiating in-vehicle time and extra in-vehicle time due to carpool arrangements(Bruggeman et al., 1977; Kostyniuk, 1982; Giuliano et al., 1990; Brownstone and Golob, 1992; Hunt and McMillan, 1997) thisdistinction was introduced for measuring the inconvenience of picking up carpool partners and is needed to assess the addedvalue of policies directed at decreasing travel time for carpoolers through HOV or HOT lanes (Dahlgren, 2002; Menendez andDaganzo, 2007; Kwon and Varaiya, 2008). Walking is also particularly important in carpooling, since it is often part of anitinerary when persons have to meet others in intermediate locations for participating in pool groups (Gensch, 1981; Huntand McMillan, 1997).
Travel costs have been separated in-vehicle operation costs (Bruggeman et al., 1977; Teal, 1987); those mostly connectedwith fuel costs; toll costs; and workplace parking costs (Bruggeman et al., 1977; Hunt and McMillan, 1997). This separationhas allowed for the analysis of the impact which different incentives can have on carpooling propensity, namely parking-price reduction or toll-cost reduction for carpoolers.
Although these items are important to differentiate all modes of transportation, carpooling has attributes which areinherent just to this option. The availability of potential carpooling partners and their relationships has proved to be of par-amount importance (Kurth and Hood, 1977; Kostyniuk, 1982; Levin, 1982). Groups can be organized in different ways; thiscould also help determine the system attractiveness, such as the number of days to carpool (Glazer et al., 1986), denotingmore or less constrained arrangements and the driving decision (who drives) (Kostyniuk, 1982; Levin, 1982; Hunt andMcMillan, 1997).
Another stream of research explored the influence of socio-demographic characteristics of both the potential carpoolerand his household. Household-size and composition together with car-availability and total income were explored andfound to influence carpooling choice (Kurth and Hood, 1977; Teal, 1987; Brownstone and Golob, 1992). Individual charac-teristics, such as age and gender, have also been looked at and found relevant (Gensch, 1981; Teal, 1987; Brownstone andGolob, 1992). Also, at an individual level, the currently used mode and constraints on schedule and mobility that carpoolingusually entails also prove to be very important (Bruggeman et al., 1977; Gensch, 1981; Kostyniuk, 1982; Giuliano et al.,1995).
Conditions at workplace may also play an important role. Factors such needing the car for work, parking availability andthe availability of a company guaranteed-ride-home were also researched and have proved to influence carpooling choice.Parking supply stands out as one of the most researched aspects which has lead, generally, to the conclusion that when park-ing is easy, carpooling decreases its attractiveness. (Ben-Akiva and Atherton, 1977; Kostyniuk, 1982; Brownstone and Golob,1992).
4. Web survey for the Lisbon Metropolitan Area
4.1. Setting up the web survey
In order to evaluate the potential of the club structure for managing carpooling groups in a metropolitan area, a web sur-vey was advertised and made available during four months, from February to May 2008, in the Lisbon Metropolitan Area(LMA) in Portugal.
Several kinds of surveys have been applied in the past focusing on different aspects of these systems. Their complexityvaried from focus groups (Stephen and Duecker, 1974) to Stated Preference (SP) surveys with the objective of estimatingDCMs (Hunt and McMillan, 1997). The goals have been varying from knowing the preferences of carpooling systems orga-nization to forecasting the mode share that these schemes could achieve through their instrumental attributes, as well as thecharacteristics of the decision-makers and their mobility situation.

84 G. Correia, J.M. Viegas / Transportation Research Part A 45 (2011) 81–90
As we have seen through the publication dates of the papers cited in the previous section, the majority was developed inthe seventies and eighties after the oil crisis of 1973. So, in addition to assessing the added value of the club scheme towardsattractiveness of carpooling, the changes in the framework conditions were enough to justify revisiting the topic. Previousresults should be compared on the strength of each aspect affecting carpooling potential for the current time period and forthe specific case of the LMA.
The survey was organized in two main parts:
� Socio-demographic and usual commuter trip information – This part of the survey was mainly intended to collect informa-tion on the household and individual socio-demographics, current mobility patterns and workplace parking supply.� Stated Preference – In this part of the survey, an SP experiment was presented to commuter drivers in the LMA comparing
external carpooling (non-household participants) and the driving alone or with family alternative. Four choices were gen-erated to adapt as much as possible to the respondents’ stated mobility situation. The two first choices compared thealternative ‘‘Alone/With family’’ and ‘‘Carpooling’’ and the other two comparing the ‘‘Alone/With family’’ option withthe ‘‘Carpooling Club’’ option. By answering diverse SP choices, the respondent supplied information for calibrating a bin-ary logit DCM.
The classical approach to build SP experiments establishes attribute levels for the explanatory variables and then takesthese levels to build a design which is presented to the respondents. The full-factorial design, which would result fromall possible combinations of these levels, normally results in too many choices. The alternative is to use a fractional-factorialdesign with the attribute levels, searching for a combination of the parameters that result in null correlations among theattributes. This procedure is currently available in several statistical packages.
Independence among the attributes allows evaluating the main effects of one variable on choice independent of the ef-fects that the other variables may have. However, by generating these choice sets, some alternatives which are generatedmay not be plausible and may affect the respondent trust in the survey, and at the same time, be conducive to a problemof identification of the interviewee with the situations that are described. The option is creating designs that are built pivotedaround the experiences of sampled respondents (Hensher, 2004) ‘‘The use of a respondent’s experience, embodied in a ref-erence alternative to derive the attribute levels of the experiment, has come about in recognition of a number of supportingtheories in behavioral and cognitive psychology and economics, such as prospect theory, case-based decision theory andminimum-regret theory’’ (Rose et al., 2008).
Nevertheless, the use of reference alternatives does not fit the methods of efficient generation of SP choice sets. ‘‘Whenthe attribute levels are pivoted as percentages around some base reference alternative consisting of the attribute levels re-ported by the individual respondents during the survey task, the precise (absolute) attribute levels will not be known to theanalyst prior to conducting the survey’’ (Rose et al., 2008). Thus, it is impossible for the researcher to know the efficiencylevel of the design prior from going to the field, introducing a great uncertainty on the correlations outcome.
In the survey reported here, we wanted to create situations for the ‘‘Alone/With family’’ alternative, which resembledas much as possible, the current behavior of the respondent and at the same time, creating a carpooling option withseamless attributes given the usual impact that this mode can have on a commuter trip, particularly on time and costvariables.
These relations between current driving costs and time, and the new variables for carpooling, suggested using some sortof rules for generating the new values. This method, however, despite being expected to elicit more realistic behavior, it mayresult in correlations within the data structure, which can make the estimation of the model parameters more problematic,so a balance between degree of dependency and data structure had to be established. This is a problem to which we gavespecific attention, by subsequently evaluating the correlations that resulted among the attributes.
Two attributes were used for generating the carpool external occupants: their number and type. However, given that theobjective was to adapt as much as possible to the current transport arrangements of the respondent, we had to checkwhether the respondent was already transporting a household passenger to work before external passengers could be gen-erated (information extracted from the first part of the survey). A household passenger (PAX_HOUSEHOLD) was only consid-ered when the respondent stated that he departed with other persons from home and stopped to drop someone off at aworkplace. In those situations, the transport of one household person was considered both in the situation with and withoutcarpooling, assuming that this person would also be part of the group, alternating just like the others.
Another important type of household member was also considered. Transport of children to school is usually a constraintto participate in carpooling schemes; thus, when the respondent stated he had to do it some days of the week, this was intro-duced both in the option without carpooling and with carpooling, assuming that the carpooling group would have a detourto make this drop-off (CHILDREN_STOP).
Having generated the existence of household passengers to work or school, we were able to randomly generate the num-ber of other occupants considering a maximum vehicle occupation of four persons. These other-occupants type varied in thecategories of ‘‘friend,’’ ‘‘colleague,’’ and ‘‘carpooling club member,’’ this latter option only appearing in one of the two choiceswith a carpooling club. We opted not to include other characterizing elements, such as gender or age, given that it would notbe possible to include all these characteristics in a SP experiment.
The number of days to carpool was randomly generated between two and five days in a working week (N_DAYS_WEEK).This number of days was presented as an attribute of the carpooling system and was intended to measure the difference in

G. Correia, J.M. Viegas / Transportation Research Part A 45 (2011) 81–90 85
convenience that a carpooling scheme can have depending on the number of days that its participants have to compromiseto a shared schedule.
The experiment was focused on the morning commute when referring to travel time. In the system we tested, carpoolmembers are supposed to alternate between being the driver and being a passenger. When the carpooling alternativewas presented, the driving time (home to work) for the situation where the respondent is acting as driver was shown, aswas the walking time from his home to a meeting point when he is a passenger and walking time from a parking placeto his workplace when he is a passenger (Fig. 1).
The driving time was randomly generated in a range close to the difference between the arrival at the workplace and thedeparture from home stated by the respondent in the first part of the survey (DRIVING_TIME). Then a random period of timewas added for each partner he had to pick-up according to a number of extra-passengers (DRIVING_TIME_CARPOOL). Thesum of these periods is the extra in-vehicle time he has to spend to pick-up the remaining partners in relation to whathe usually spends. This approach made it easier for the respondent to evaluate how much more time he is spending in-vehi-cle when it is his turn to drive (EXTRA_DRIVING).
The time to walk to a meeting point in the morning when the person is a passenger was randomly generated in theinterval between 0 and 15 min (MEETING_POINT_TIME). The null value represents the situation where the passenger ispicked-up at home. The walking time from the parking lot to the workplace in the city center was randomly generatedin the interval stated by the respondent in the first part of the survey (PARKING_WALK_TIME); the null value representsthe situation where the passenger is dropped-off at his workplace. In the situation with carpooling, a random period inminutes was added to that time to consider the fact that when the respondent is acting as a passenger, he may have towalk from a parking place near the workplace of the driver to his own workplace, taking longer than usual (PARK-ING_WALK_TIME_CARPOOL). The survey did not address the return trip, implicitly assuming it would be symmetrical tothe morning commute.
Expenses were presented in different scales, trying to give numbers to the respondent with which he could easily identify.Current travel costs have been presented separating fuel costs (weekly expense), parking and toll costs (daily expenses) andwere based on the responses given in the first part of the survey, taking those intervals and generating a random value inthem (PARKING_EXPENSES, TOLL_EXPENSES and FUEL_EXPENSES). When the respondent stated having no expenses withtolls or parking this situation was replicated in the SP experiment. The costs in the carpooling situation were computed usingan equation that considered the savings that the respondent benefits from carpooling with x persons (only external to thehousehold and including the driver) in y days in a proportional way:
%Expenses reduction ¼ 1� yx� 5
þ 5� y5
� �:
Two other variables have been used to introduce variations in the savings resulting from participating in carpoolingschemes: a special parking price for carpoolers and a reduced price in tolls for carpoolers. Variations on these issues of park-ing and tolls were discussed but not retained for reasons of duration of the survey (avoidance of respondent fatigue) and ofparameter calibration. A special parking price does not require investment in allocating specific parking places in the citycenter and a HOT pricing system (lower price for higher occupancy) does not demand the creation of a HOV/HOT lane. More-over, the HOT pricing measure has been pointed as a strategy for the future in Lisbon (Diário da República, 2008), particularlyin the heavy traffic bridges that give access to the city center.
Finally, another two variables were added respecting to the carpooling clubs option: the availability of a guaranteed-ride-home program organized by the club (RIDE_HOME) and the possibility of riding in other groups of the club when having adifferent destination or the same destination with another schedule (FLEXIBILITY).
4.2. Presenting the alternatives
The introductory text for the carpooling club choices was the following: ‘‘Now we introduce the broader concept of acarpooling club, which encompasses the management of several groups with the objective of benefiting from its scale.
Fig. 1. Scheme for the pick-up and drop-off of passengers.
86 G. Correia, J.M. Viegas / Transportation Research Part A 45 (2011) 81–90
Due to the involvement of persons who do not know each other, participating in this club demands the achievement of anumber of rules which allow assessing the suitability of persons to participate in this system, namely a valid driver’s license,updated auto insurance, and possibly other examples of proof of safe driving.
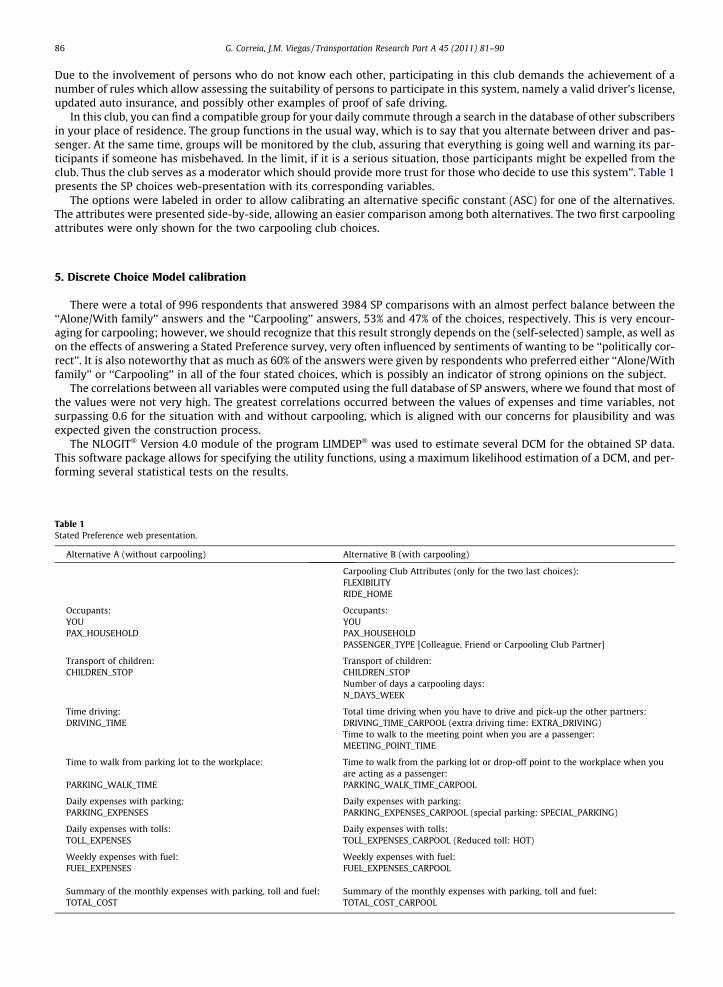
In this club, you can find a compatible group for your daily commute through a search in the database of other subscribersin your place of residence. The group functions in the usual way, which is to say that you alternate between driver and pas-senger. At the same time, groups will be monitored by the club, assuring that everything is going well and warning its par-ticipants if someone has misbehaved. In the limit, if it is a serious situation, those participants might be expelled from theclub. Thus the club serves as a moderator which should provide more trust for those who decide to use this system’’. Table 1presents the SP choices web-presentation with its corresponding variables.
The options were labeled in order to allow calibrating an alternative specific constant (ASC) for one of the alternatives.The attributes were presented side-by-side, allowing an easier comparison among both alternatives. The two first carpoolingattributes were only shown for the two carpooling club choices.
5. Discrete Choice Model calibration
There were a total of 996 respondents that answered 3984 SP comparisons with an almost perfect balance between the‘‘Alone/With family’’ answers and the ‘‘Carpooling’’ answers, 53% and 47% of the choices, respectively. This is very encour-aging for carpooling; however, we should recognize that this result strongly depends on the (self-selected) sample, as well ason the effects of answering a Stated Preference survey, very often influenced by sentiments of wanting to be ‘‘politically cor-rect’’. It is also noteworthy that as much as 60% of the answers were given by respondents who preferred either ‘‘Alone/Withfamily’’ or ‘‘Carpooling’’ in all of the four stated choices, which is possibly an indicator of strong opinions on the subject.
The correlations between all variables were computed using the full database of SP answers, where we found that most ofthe values were not very high. The greatest correlations occurred between the values of expenses and time variables, notsurpassing 0.6 for the situation with and without carpooling, which is aligned with our concerns for plausibility and wasexpected given the construction process.
The NLOGIT� Version 4.0 module of the program LIMDEP� was used to estimate several DCM for the obtained SP data.This software package allows for specifying the utility functions, using a maximum likelihood estimation of a DCM, and per-forming several statistical tests on the results.
Table 1Stated Preference web presentation.
Alternative A (without carpooling) Alternative B (with carpooling)
Carpooling Club Attributes (only for the two last choices):FLEXIBILITYRIDE_HOME
Occupants: Occupants:YOU YOUPAX_HOUSEHOLD PAX_HOUSEHOLD
PASSENGER_TYPE [Colleague, Friend or Carpooling Club Partner]
Transport of children: Transport of children:CHILDREN_STOP CHILDREN_STOP
Number of days a carpooling days:N_DAYS_WEEK
Time driving: Total time driving when you have to drive and pick-up the other partners:DRIVING_TIME DRIVING_TIME_CARPOOL (extra driving time: EXTRA_DRIVING)
Time to walk to the meeting point when you are a passenger:MEETING_POINT_TIME
Time to walk from parking lot to the workplace: Time to walk from the parking lot or drop-off point to the workplace when youare acting as a passenger:
PARKING_WALK_TIME PARKING_WALK_TIME_CARPOOL
Daily expenses with parking: Daily expenses with parking:PARKING_EXPENSES PARKING_EXPENSES_CARPOOL (special parking: SPECIAL_PARKING)
Daily expenses with tolls: Daily expenses with tolls:TOLL_EXPENSES TOLL_EXPENSES_CARPOOL (Reduced toll: HOT)
Weekly expenses with fuel: Weekly expenses with fuel:FUEL_EXPENSES FUEL_EXPENSES_CARPOOL
Summary of the monthly expenses with parking, toll and fuel: Summary of the monthly expenses with parking, toll and fuel:TOTAL_COST TOTAL_COST_CARPOOL

G. Correia, J.M. Viegas / Transportation Research Part A 45 (2011) 81–90 87
In this article, the end results of applying several specifications of a binary logit DCM to the data are presented, whileavoiding going through all the steps and iterations which were needed to reach a final exploratory specification. It startedto be specified only with the attributes of the alternatives, and then, all possible information from socio-demographic andcommuter trip characteristics were gradually added, taking advantage of the survey’s first stage for direct choice explanationpurposes.
Cost and time attributes were included in both utility functions’ specification since these vary between alternatives. Allthe other variables were specified in the carpooling utility function, thus turning the ‘‘Alone/With family’’ option as the ref-erence alternative for the model. An ASC was also included in the carpooling utility specification for capturing the averageeffect on utility of all factors which are not included in the model. Table 2 presents the final specification of variables in termsof their best significance, overall goodness of fit, and importance for carpooling understanding.
For better understanding of the model specification, we should add the following notes: Differentiating the coefficients oftravel time components proved to increase model goodness-of-fit, whereas for costs, there was no statistical significant var-iation among its components. The logarithm was used both for the DRIVING_TIME and TOTAL_COST variables because it im-proved model explanatory power, meaning, for instance, that the same difference in total cost has a different impact onutility depending on the absolute value of the attribute. Another interesting model result was that it proved better to specifya coefficient for each carpooling club participant (ADCL1, ADCL2 and ADCL3), thus allowing better identification of the im-pact of this type of occupant in carpooling choice.
The final model calibration statistics were: Number of observations = 3984, Number of parameters for estimation = 37,L(C) = �2753.2678, L(�) = �2392.073, �2[L(C) � L(�)] = 722.38922, q2 = 0.13119 and �q2 ¼ 0:12304. The values of q2 and �q2
Table 2Best combination of explanatory variables in the DCM.
Variable Description Coefficient SE
Attributes of the alternativesCHILDREN_STOP 1 if respondent drops-off a child, 0 otherwise �0.5886*** 0.1297LN(DRIVING_TIME) Logarithm of the driving time �1.1820*** 0.2652MEETING_POINT_TIME Time to reach a meeting point, walking �0.0158** 0.0084PARKING_WALK_TIME Time to walk from the parking lot toward work �0.0731*** 0.0141LN(TOTAL_COST) Logarithm of the Total Transport cost (Gas, Tolls and parking) �2.3181*** 0.2900NFRIENDS Number of friends in the group �0.0937 0.0910NCOLLEAGUES Number of colleagues in the group �0.4046*** 0.0956ADCL1 1 if there is an additional colleague in the group, 0 otherwise �0.4283*** 0.1494ADCL2 1 if there are 2 additional colleagues in the group, 0 otherwise �1.1552*** 0.2178ADCL3 1 if there are 3 additional colleagues in the group; 0 otherwise �1.2127*** 0.4098NHOUSEHOLD 1 if there is a carpool member belonging to the respondent’ household; 0 otherwise �0.8220*** 0.1236DAYS2 1 if carpooling is arranged for 2 days a week; 0 otherwise 0.0977 0.0996DAYS5 1 if carpooling is arranged for 5 days a week; 0 otherwise �0.2932*** 0.1158RIDE_HOME 1 if there is a guaranteed ride home; 0 otherwise 0.2423*** 0.1128FLEXIBILITY 1 if there is the option of riding in another vehicle when there is a near term trip; 0 otherwise �0.2937*** 0.1383HOT_PRICE 1 if there is a reduction on tolls based in the vehicle occupation; 0 otherwise 0.2025*** 0.1027
Socio-demographic profileAGE The age of the respondent �0.0141*** 0.003MARITAL 1 if the respondent is married or in a marital union; 0 otherwise 0.1670** 0.0879STUDENT 1 if the respondent is a student; 0 otherwise 0.2126* 0.1425WHITE_COLAR 1 if the respondent has a white collar job; 0 otherwise �0.1975*** 0.0774CHILDREN16 1 if there are children under 16 years old in the household; 0 otherwise 0.1801** 0.0998EMPLOYED Number of employed persons in the household; 0 otherwise �0.1458*** 0.0513VEHICLE_LUXURY If the respondent usually drives a luxury vehicle; 0 otherwise �0.3389*** 0.1574LICENSE_VEHICLES Number of licenses per vehicle in the household 0.2041*** 0.0920COSTDIF_INCOME Difference between both the costs of driving alone and the cost of carpooling, dividing by the
average income2.8105*** 0.9055
Commuter trip characteristicsDIFI_PARK 1 if respondent stated having difficulty parking his vehicle; 0 otherwise 0.4445*** 0.1461HOME_7–8 1 if respondent leaves home between 7 and 8 o’clock; 0 otherwise 0.2278*** 0.0853HOME_9–10 1 if respondent leaves home between 9 and 10 o’clock; 0 otherwise �0.1745** 0.0953WORK_19–20 1 if respondent leaves his work place between 19 and 20 o’clock; 0 otherwise 0.1816*** 0.0817PROFILE1 Binary variables denoting different levels of constrain in the car use. From less constrained (Needs
the car at work less than 3 days a week and one morning activity less than 3 days a week and oneafternoon activity less than 3 days a week) to highly constrained (needs the car for work every day
and has an extra activity in the morning and afternoon every day)
�1.0432*** 0.2323PROFILE2 �0.8958*** 0.2814PROFILE3 �0.9445*** 0.2511PROFILE4 �1.1831*** 0.2271PROFILE5 �1.2102*** 0.2897PROFILE6 �1.2728*** 0.6425A_CARPOOL ASC of the carpooling alternative 1.8515*** 0.3352
* Significant at 10%.** Significant at 5%.*** Significant at 1%.

88 G. Correia, J.M. Viegas / Transportation Research Part A 45 (2011) 81–90
compare the likelihood of the model (L(�)) with the likelihood of a model constituted only by alternative-specific constants(L(C)).
The resulting corrected pseudo-R2 (�q2) is not very high (0.12304). Nevertheless, one should not ignore the significance ofthe explanatory variables and their importance in helping to understate carpooling and the impact that the club structuremay have. In that perspective, interesting results were reached.
6. Results
One very important clue for the lack of explanation of the model is the coefficient of the ASC variable (A_CARPOOL), whichis positive and very significant, pointing to the fact that the variables mainly explained why the ‘‘carpooling’’ option is notchosen, not being able to capture more of the reasons of participating in such schemes (which appear embedded in the po-sitive constant).
In general, the most promising carpoolers according to the survey will be young persons (AGE variable with a negativeand significant coefficient) who are studying, or, if they are working, do not have a liberal profession or manager position(WHITE_COLAR variable coefficient is negative and significant), with a salary level that does not allow them to ignore thedifference that carpooling can have on their monthly budget (COSTDIF_INCOME variable with a positive and significant coef-ficient in carpooling utility). This result confirms previous research which pointed to younger persons as one of the groupsmost willing to carpool (Tischer and Dobson, 1979; Longo et al., 2008) associated to a lower income (Gensch, 1981; Teal,1987).
Persons from households where the number of licensed drivers was greater than the number of available vehicles showedhigher tendency for carpooling (LICENSE_VEHICLES variable). The same was concluded in previous research on the demo-graphics of carpooling: car availability significantly influences the willingness to carpool (Ferguson, 1995; Longo et al.,2008). Results also show that persons who chose carpooling tend to drive a city car lowering the probability of driving a lux-ury one (VEHICLE_LUXURY has a negative coefficient).
Results also point out that if these persons are married, this is an incentive for carpooling (MARRITAL variable with a po-sitive coefficient), but only when they are not already transporting their spouses to the workplace (NHOUSEHOLD with anegative coefficient) which was also concluded before (McCoomb and Steuart, 1981). However, unlike other studies(McCoomb and Steuart, 1981; Ferguson, 1995), gender does not seem to be a good explanatory variable for distinguishingthose who are willing to carpool from those who would not. This discrepancy may come from a greater significance of otherfactors that may be associated more with one gender, namely poor schedule flexibility or not having the priority in using thehousehold vehicle. However, we should note the fact that the randomly generated partners of the group were not specified intheir gender in the SP experiment, which could be important to classify the groups in terms of their attractiveness both tomale and female respondents.
Variable CHILDREN_STOP presents a very significant negative coefficient in the carpooling utility. This was expected sincesome of the opinions respondents left in the database were against this option, stating they ‘‘would not like and did not thinkit would be feasible to transport their children to school in the carpooling group.’’
The survey also shows that the persons with greater willingness to carpool tend to have a full working or studying dayfrom 8 to 19 (HOME_7–8 and WORK_19–20 are variables with a positive significant coefficient) and have difficulty parkingthe car at the work or study place (DIFI_PARK is positive and significant). This parking incentive confirms extensive previousresearch on the subject which reached the same conclusion (Ben-Akiva and Atherton, 1977; Willson and Shoup, 1990;Shoup, 1997; Bianco, 2000).
In terms of the PROFILE variables, we see that all of them have negative and significant coefficients, meaning that the needto use the car for work or other kinds of activity during the day, associated with participating in extra activities early in themorning or at the end of the afternoon, is a deterrent to carpooling.
When participating in this carpooling scheme the most promising commuters should prefer to carpool fewer days a weekrather than the five working days, as this will make their full week commuter schedule too rigid (comparison between vari-ables DAYS2 and DAYS5), a result which confirms preceding research (Glazer et al., 1986). When paying for tolls, resultsshow a tendency for respondents benefiting from a HOT pricing system that would discriminate positively those who trans-port more passengers.
For participating in carpooling groups, persons have to spend time either picking-up and/or dropping-off their partners.Nevertheless, this is always limited and can have different weights depending on the stage of the tour. The time to go from aparking facility to the workplace seems to penalize the carpooling utility more than the time to reach a meeting point nearthe home place (comparison between the coefficients of the MEETING_POINT_TIME and PARKING_WALK_TIME variables).
Having available a guaranteed-ride-home program is a benefit that brings added value (RIDE_HOME variable is positiveand significant), confirming the same result reached by Hunt and McMillan (1997). In what concerns the possibility of trans-porting others in a dynamic ridesharing program we see that the corresponding variable in the DCM (FLEXIBILITY) has a neg-ative significant coefficient; thus, we may conclude that even by using a common base trust level, as the club is meant to be,persons do not view this possibility as an advantage but still face it as something suspicious, which does not bring addedvalue to carpooling (similar to what happens in other dynamic systems).

G. Correia, J.M. Viegas / Transportation Research Part A 45 (2011) 81–90 89
The carpooling club member is a type of participant who is not trusted (ADCL1, ADCL2 and ADCL3 have significant neg-ative coefficients), confirming the psychological effect that transporting persons who are not familiar can have in potentialcarpoolers (Duecker et al., 1977). However, we also observe that the additional number of colleagues has a negative impacton the carpooling utility; in fact, the impact of one colleague in the pool group is equivalent to one carpooling partner (NCOL-LEAGUES variable comparing with ADCL1).
7. Discussion and conclusions
This paper presented the results of applying a web-based survey in the Lisbon Metropolitan Area (Portugal) for studyingcarpooling systems. An innovative structure in the form of clubs was proposed and postulated to improve carpooling attrac-tiveness. The survey allowed assessing the enhancement possibilities of this scheme compared with the traditional ones, andat the same time, going back to the beginning of the research on these systems to update what was known to be the keyfactors for their attractiveness.
The fact that the population of the Lisbon region has not experienced organized carpooling has two concurrent implica-tions for the study: on one hand, by not having participated in such groups, persons cannot grasp how carpooling can reallychange their mobility routines both in a positive or negative way. On the other hand, this leads them not to be affected bypast failed experiences, being very open minded for new ways of travel.
A strong symptom that these respondents may not have had the full notion of what carpooling usually entails, is the factthat the DCM has pointed towards a very significant unexplained preference for carpooling. This is showing a special interest(curiosity?) for this alternative, which is probably fostered by its innovative aspects and by sentiments of social responsibil-ity toward environment sustainability.
Nevertheless, results show great coherence when compared with the average behavior identified in the literature. Carpo-oling is still viewed as a more realistic alternative for lower socio-economic classes or for those who, due to their age, do nothave their own private vehicle or do not have the resources to use it during the week. The difficulty in parking the vehicleplays an important role in determining carpooling attractiveness, which, given the situation in the Lisbon city center, mayturn the option of being a passenger some days of the week an attractive one.
On the negative side, carpooling appears to be a service with very low flexibility. This is evident in the significant negativeeffect on carpooling preference of variables denoting routines with extra activities in the morning and/or afternoon. The pref-erence for less carpooling days in a week also reinforces this perspective, showing that this alternative cannot be used every day.
The process of increasing flexibility through carpooling with non-familiar persons requires a system that provides astrong trust basis amongst carpoolers, and this has lead to the proposal of a carpooling club structure. It is grounded in psy-chology and social behavior research which points to these interaction platforms as being capable of fostering friendship andtrust relations that are key aspects for allowing more resilient groups to be formed. This perspective was tested in the web-based survey stressing out the difference between carpooling among friends or colleagues and carpooling organized throughthe club. In that view, the type of occupant is paramount, and surprisingly all types of partners external to the householdhave scored a negative impact. Nonetheless, using as a comparative term the coefficients in the DCM, the carpooling clubmember has no more negative impact than work colleagues will have on carpooling preference, confirming the club as aninteresting structure to form groups of persons with a certain trust basis.
Despite these promising results, when respondents were placed in the position of accepting transporting club membersfor a near term trip, response was not favorable, and this appears to be connected with partner instability. It seems that mea-sures aimed at improving carpooling flexibility are faced with the worsening of other important aspects of the system, suchas trust issues. Evidence from this aspect is the respondents’ reactions to transporting their children in carpooling groups.Safety and security are increasingly important in urban societies where the multiplicity of perils often lead to distrust. Thisis a reality, and it seems not to be compatible with exposing children to non-familiar persons.
In summary, carpooling, despite being a simple concept which could at a first look be a very effective measure fordecreasing urban congestion, has not been able to produce significant results in other cities, and the outlook in the Lisbonregion does not seem more promising. The carpooling club scheme was not perceived as providing more benefits of flexibil-ity than the inconvenience of travelling with people outside the household. Nevertheless, it continues to appeal to certainsocial groups due to economics or their more open attitudes and for these, the club may represent an interesting platformfor meeting other carpoolers.
Acknowledgements
This work was funded by the Portuguese Science and Technology Foundation through a PhD Grant (Ref. SFRH/BD/18811/2004). The authors would like to thank the MIT-Portugal Program for supporting a visiting student opportunity in the MIT inthe Spring Semester of 2008.
References
Bard, E.A., 1997. Transit and carpool commuting and household vehicle trip making – panel data analysis. Transportation Research Record 1598, 25–31.Ben-Akiva, M., Atherton, T.J., 1977. Choice-model predictions of car-pool demand: methods and results. Transportation Research Record 637, 13–17.

90 G. Correia, J.M. Viegas / Transportation Research Part A 45 (2011) 81–90
Bianco, M.J., 2000. Effective transportation demand management combining parking pricing, transit incentives, and transportation management in aCommercial District of Portland, Oregon. Transportation Research Record 1711, 48–54.
Brownstone, D., Golob, T.F., 1992. The effectiveness of ridesharing incentives: discrete-choice models of commuting in Southern California. Regional Scienceand Urban Economics 22 (1), 5–24.
Bruggeman, J.M., Rubin, R.B., Griffiths, F., 1977. Findings of a study to estimate the effectiveness of proposed car-pool incentive policies. TransportationResearch Record 650, 36–43.
Bukold, S., Hager, W., Olsen, H., van Bodegom, W., 1996. The State of European Infrastructure 1996. European Centre for Infrastructure Studies, Rotterdam,Netherlands.
Concas, S., Winters, P.L., 2007. The impact of carpooling on trip chaining behavior and emission reductions. In: Proceedings of the Transportation ResearchBoard 86th Annual Meeting, Washington, DC.
Correia, G., Viegas, J.M., 2009. A conceptual model for carpooling systems simulation. Journal of Simulation 3, 61–68.Dahlgren, J., 2002. High-occupancy/toll lanes: where should they be implemented? Transportation Research Part A: Policy and Practice 36 (3), 239–255.Dailey, D.J., Lose, D., Meyers, D., 1999. Seattle smart traveler: dynamic ridematching on the World Wide Web. Transportation Research Part C: Emerging
Technologies 7 (1), 17–32.Diário da República, 2008. Portaria No. 715/2008 – Synthesis Report on The Plan for Air Quality Improvement in the Region of Lisbon, 2ª série (in
Portuguese).Duecker, K.J., Bair, B.O., Levin, I.P., 1977. Ride sharing: psychological factors. Transportation Engineering Journal of ASCE 103 (6), 685–692.Ferguson, E., 1995. The demographics of carpooling. Transportation Research Record 1496, 142–150.Gensch, D.H., 1981. A practical segmentation strategy to increase ride sharing. Transportation Research Part A 15 (4), 331–337.Giuliano, G., Levine, D.W., Teal, R.F., 1990. Impact of high occupancy vehicle lanes on carpooling behavior. Transportation 17 (2), 159–177.Giuliano, G., Hall, R., Golob, J., 1995. Los Angeles Smart Traveler Field Operational Test Evaluation. California Partners for Advanced Transit and Highways
(PATH). Institute of Transportation Studies – University of California, Berkeley.Glazer, J., Koval, A., Gerard, C., 1986. Part-time carpooling: a new marketing concept for ridesharing. Transportation Research Record 1082, 6–15.Hartwig, S., 2007. Empty Seats Traveling – Next Generation Ridesharing and Its Potential to Mitigate Traffic and Emission Problems in the 21st Century.
NOKIA – Research Center.Haselkorn, M., Spryidakis, J., Blumenthal, C., Michalak, S., Goble, B., Garner, M., 1995. Bellevue Smart Traveler: Design, Demonstration, and Assessment.
Washington State Department of Transportation.Hensher, D.A., 2004. Identifying the influence of stated choice design dimensionality on willingness to pay for travel time savings. Journal of Transport
Economics and Policy 38, 425–446.Hunt, J.D., McMillan, J.D.P., 1997. Stated-preference examination of attitudes toward carpooling to work in Calgary. Transportation Research Record 1598,
9–17.International Energy Agency, 1997. Indicators of Energy Use and Efficiency – Understanding the Link between Energy Use and Human Activity.Kostyniuk, L.P., 1982. Demand analysis for ridesharing: state-of-the-art review. Transportation Research Record 876, 17–26.Kurth, S.B., Hood, T.C., 1977. Car-pooling programs: solution to a problem? Transportation Research Record 650, 48–53.Kwon, J., Varaiya, P., 2008. Effectiveness of California’s high occupancy vehicle (HOV) system. Transportation Research Part C 16 (1), 98–115.Levin, I.P., 1982. Measuring tradeoffs in carpool driving arrangement preferences. Journal of Transportation, 71–85.Longo, G., Giulio, B., Lorenzo, T., Alessia, V., 2008. Sociodemographic groups and mode choice in middle-sized European City. In: Proceedings of the
Transportation Research Board 87th Annual Meeting, Washington, DC.Margolin, J., Misch, M.R., Stahr, M., 1978. Incentives and disincentives of ridesharing. Transportation Research Record 673, 7–15.McCoomb, L.A.A., Steuart, G.N., 1981. The automobile passenger - A forgotten mode. Transportation Research Part A: General 15 (1), 257–263.Mcknight, D.H., Cummings, L.L., Chervany, N.L., 1998. Trust formation in new organizational relationships. Academy Managerial Review 23 (3), 473–490.Menendez, M., Daganzo, C.F., 2007. Effects of HOV lanes on freeway bottlenecks. Transportation Research Part B: Methodological 41 (8), 809–822.Morency, C., 2007. The ambivalence of ridesharing. Transportation 34 (2), 239–253.Ortúzar, J.d.D., Willumsen, L.G., 2001. Modelling Transport. John Wiley & Sons, Ltd., Chichester, England.Prentice, D.A., Miller, D.T., Lightdale, J.R., 1994. Asymmetrics in attachments to groups and to their members: distinguishing between common-identity and
common-bound groups. Personality Social Psychology Bulletin 20 (5), 484–493.Rose, J.M., Bliemer, M.C.J., Hensher, D.A., Collins, A.T., 2008. Designing efficient stated choice experiments in the presence of reference alternatives.
Transportation Research Part B: Methodological 42 (4), 395–406.Schrank, D., Lomax, T., 2005. The 2005 Urban Mobility Report. Texas Transport Institute, Houston.Shaheen, S.A., Sperling, D., Wagner, C., 1999. Carsharing and partnership management: an international perspective. Transportation Research Record 1666,
118–124.Shoup, D.C., 1997. Evaluating the effects of cashing out employer-paid parking: eight case studies. Transport Policy 4 (4), 201–216.Smith, V., Beroldo, S., 2002. Tracking the duration of new commute modes following service from a ridesharing agency. Transportation Research Record
1781, 26–31.Stephen, A., Duecker, K., 1974. Attitudes toward and Evaluation of Carpooling. Institute of Urban and Regional Research, University of Iowa.Teal, R.F., 1987. Carpooling: who, how and why. Transportation Research Part A 21 (3), 203–214.Terveen, L., McDonald, D.W., 2005. Social matching: a framework and research agenda. ACM Transactions on Computer–Human Interaction 12 (3), 401–434.Tischer, M.L., Dobson, R., 1979. An empirical analysis of behavioral intentions of single-occupant auto drivers to shift to high occupancy vehicles.
Transportation Research Part A 13 (1), 143–158.Wartick, S.L., 1980. Employer-organized vanpooling – a program for the 1980s. Business Horizons 23 (6), 48–56.Willson, R.W., Shoup, D.C., 1990. Parking subsidies and travel choices: assessing the evidence. Transportation 17, 141–157.
Copyright © 2022 FDOKUMEN