A portfolio choice model of the demand for recreational trips
Upload
independentCategory
view
3download
0
Available online at www.sciencedirect.com
Transportation Research Part A 42 (2008) 15–27
www.elsevier.com/locate/tra
The use of stated preference techniques to model modalchoices on interurban trips in Ireland
Aoife A. Ahern *, Nigel Tapley
School of Architecture, Landscape and Civil Engineering, College of Engineering, Mathematical and Physical Sciences,
University College Dublin, Earlsfort Terrace, Dublin 2, Ireland
Received 23 November 2005; received in revised form 14 December 2006; accepted 17 June 2007
Abstract
The study examines the perceptions and preferences of passengers on interurban rail and bus and compares the pref-erences of passengers on both these modes. This is carried out to identify where passengers feel changes are needed to bothmodes to improve services, and to contrast the services offered by bus and train in Ireland. The preferences and perceptionsof passengers are collected using both stated preference and revealed preference techniques. The impacts that differenttypes of stated preference questionnaire have on the responses of individuals can, therefore, be examined. The study alsocompares stated preference models with revealed preference models and looks at if these can be pooled to take advantageof the benefits offered by both stated preference and revealed preference models.� 2007 Elsevier Ltd. All rights reserved.
Keywords: Bus; Train; Interurban; Stated preference; Revealed preference; Modal choice
1. Introduction
This paper describes a study carried out to examine the perceptions and preferences of passengers on inter-urban routes in Ireland. Passengers on both bus and rail routes are examined. Many factors influence thedemand for interurban travel. Wardman (2006) describes some of these as car travel time, car ownership, tra-vel costs, fuel costs, population and GDP. Several of these factors are external to the rail and bus industry andso it is difficult for the industry to control them.
After decades of under-investment, there has been a fundamental change in the Irish Government’s trans-port policy, driven primarily by safety considerations, committing significant new funding to the renewal anddevelopment of the rail system (MPE, 2001). The purpose of most of the Irish Government’s investment inrenewal and expansion of the rail services is to improve passenger transport and consequently increase themodal share of rail. Even though there is huge investment in railways, the question is ‘will investment alonelead to increased demand for rail passenger transport?’ especially when rail tickets prices are higher than the
0965-8564/$ - see front matter � 2007 Elsevier Ltd. All rights reserved.
doi:10.1016/j.tra.2007.06.005
* Corresponding author. Tel.: +353 1 716 7319.E-mail address: [email protected] (A.A. Ahern).

16 A.A. Ahern, N. Tapley / Transportation Research Part A 42 (2008) 15–27
competing intercity bus services and the relatively low cost of motoring and airline services in Ireland (Ahernand Anandarajah, 2006).
Ireland is a small, modern, trade-dependent economy experiencing high economic growth in the last decadewith an annual average growth rate of 7.6% in the period from 1991 to 2001. Public transport has an impor-tant role to play in supporting economic growth and social progress. Rail and bus are important modes ofpublic transport for people mainly on intercity routes.
In this study, the preferences of passengers on interurban rail and bus journeys have been examined. Theobjective is to establish the differences between the passengers on both modes and the differences in the trans-port services that are available. In the conclusion, the consequences of these differences for transport policy inIreland are discussed.
To gather data on the preferences and perceptions of passengers on both modes, a series of stated prefer-ence and revealed preference studies have been carried out on-board interurban trains and buses. Stated pref-erence studies have been used in the past to look at the relative importance of different modal attributes.Hensher (2003) used stated preference studies to determine the value of time, for example. In the mid-1980s the Department of Transport in the UK conducted a major study into the value of travel time, usingstated preference methods primarily (MVA et al., 1987) and this provided to be a turning point for the accep-tance of stated preference methods in the UK, as this study seemed to demonstrate that stated preference stud-ies could give the same results as revealed preference studies but could do so more cheaply. Apart from theStrategic Rail Review (Department of Transport, 2003) there have been very few studies of the value of timein the Irish context. Even in the Strategic Rail Review, it is unclear whether the value of time in this examplewas derived from Irish studies or whether it was adapted from international studies. Also the study assumesthat individuals on different routes have the same values of travel time.
The paper is divided into several sections: the context of the study. Section 2 describes the studies that tookplace and includes discussions of the relative merits of revealed preference and stated preference studies, andthe differences between the two methods. Section 3 describes the results of the study – both in terms of thedifferences between the stated preference and revealed preference studies and the usefulness of poolingRevealed Preference and Stated Preference studies and also the perceptions and preferences of rail and buspassengers, examining what these perceptions and preferences mean for transport policy.
2. The study context
Ireland’s rail network follows a radial pattern, extending out from Dublin. The lines are controlled andoperated by Irish Rail, a subsidiary company of CIE and there are nine interurban rail routes: Dublin–Cork,Dublin–Galway, Dublin–Limerick/Ennis, Dublin–Sligo, Dublin–Wexford/Rosslare, Dublin–Belfast, Dublin–Tralee, Dublin–Waterford and Dublin–Westport/Ballina. In terms of passenger numbers, the Dublin–Corkroute is the busiest with 3.9 million passengers in 2002, while the Dublin–Westport is the least busy with403,000 passengers in the same year. Altogether, the interurban rail network is estimated to have carriedapproximately 9.3 million passengers in 2002 (Department of Transport, 2003).
There are several studies examining the use of rail and bus on interurban trips and on the factors that influ-ence modal choice on these trips. Coto-millan et al. (1997) presented a theoretical model of intercity passengertransport demands (road, rail and air transport) in Spain using co integration and error-correction techniques.Owen and Phillips (1987) and Wardman (1997) analysed intercity rail passenger demand in Great Britain. Theformer used the tools of econometrics while the latter used direct demand models. Ponnuswamy (2004) findsout to what extent the fare structure and service level affect the patronage of urban rail transit in India. Otherresearchers such as Bel (1997) have looked at the impacts of non-monetary characteristics, such as travel time,on rail demand on interurban trips. Bel (1997) points out that journey time by rail represents a negative rela-tionship with rail demand. Bel (1997) stresses the importance of road travel times on interurban rail. Accord-ing to Bel’s research (1997) journey time by road coach represents a positive relationship with rail demand.
In this study it was essential that participants had a choice between bus and rail for their journeys. This wasbecause in this study the participants’ SP responses would be compared to their real-world choices. Therefore,only routes where bus and rail were available could be included. In addition, only routes where bus and railservices were of a similar standard were considered. In this way it was hoped that individuals travelling on the
A.A. Ahern, N. Tapley / Transportation Research Part A 42 (2008) 15–27 17
train could be expected to see the bus as a viable alternative and those travelling on the bus would see the trainas an alternative. This lead to the Dublin–Galway and the Dublin–Sligo routes being selected for the purposeof the study.
3. Survey design and distribution
In order to obtain information on the preferences and perceptions of passenger on bus and rail on inter-urban trips in Ireland, a study was carried out where questionnaires were issued on-board buses and trainson the Dublin–Sligo and Dublin–Galway routes. It was decided to use both a revealed preference studyand a stated preference study and to explore the potential of pooling information from both studies. There-fore, the questionnaire was divided into two parts and each respondent was required to complete both parts ofthe survey. The first part contained a revealed preference study, collecting information on the individual’sactual choices and the second section was a stated preference section where respondents were presented witha series of travel scenarios, which they were asked to choose between. Two types of state preference question-naire were used:
(1) Ranking(2) Stated Choice
This was with the intention of examining how using different stated preference questionnaires impact uponpeople’s replies. Hensher (1994) states that there are three types of questionnaire that can be used in statedpreference studies. These are: ranking, choice or rating. In a choice questionnaire, the task is simpler forthe respondent. The respondent simply chooses the hypothetical combination of attributes that is most favour-able to him or her and the researcher has an actual prediction of the respondent’s choice in a hypotheticalsituation. In a ranking questionnaire, respondents must order the hypothetical situations in order of prefer-ence. In a rating questionnaire, the task becomes more complicated as respondents must be able to order theirresponses in order of preference but they must also be able to indicate how much they prefer one alternativeover others. A rating questionnaire was not used in this study as it was considered to be too demanding forrespondents. There is some evidence (Hensher, 1994) that in ranking questionnaires, there is limited relevantinformation provided below the 4th ranking of the respondent as at that stage it is too difficult for respondentsto distinguish between choices.
Revealed preference and stated preference studies each have their advantages and disadvantages. Accord-ing to Swait et al. (1994) the main advantage of using a revealed preference study is that it can represent cur-rent market situations better than stated preference studies. In revealed preference studies, the choices that aremade by respondents are known outcomes, although they are dependent on the respondent’s perceptions ofattribute levels, which may or may not be accurate (Hensher, 1994).
Stated preference studies are less constrained than revealed preference studies and allow us to look atpotential changes (Swait et al., 1994). Stated preference studies allow us to examine how decision-making var-ies as different types of attribute profiles and levels are considered (Hensher, 1994). Stated preference tech-niques were originally popularised by the work of Louviere and Hensher (1983) and Davidson (1973) inthe 1970s and 1980s who demonstrated how researchers could examine trip-makers answers to hypotheticalcombinations of attribute levels for travel modes. In stated preference studies, outcomes are potential out-comes (Hensher, 1994).
According to Wang et al. (2000), stated choice and stated preference methods have limits, however. Theyare limited by a respondent’s ability to understand the hypothetical situations with which they are presentedand to provide reliable answers. Wang et al. (2000) argue that if hypothetical situations are far removed fromthe respondent’s daily experience, the stated preference study will result in poor models and inaccurate results.Therefore, stated preference studies should have some relation to the real world. Wang et al. (2000) also makerecommendations regarding strengthening stated preference models by some type of fusion with revealed pref-erence models.
The complimentary strengths of revealed and stated preference studies should be emphasised. In this study,in addition to examining the transport choice and preferences of users, it is also an objective to look at how

18 A.A. Ahern, N. Tapley / Transportation Research Part A 42 (2008) 15–27
revealed preference and stated preference studies might be used together to improve our understanding of tra-vel behaviour and modal choice. Revealed preference studies allow researchers to examine actual choices madeby travellers and to characterise how people really travel, while stated preference studies allow us to examinehow people choices might change if there are changes in the alternatives available. Cherchi and Ortuzar (2006)argue that combining revealed and stated preference studies permits the advantages of both to be maximisedwhile overcoming some of the limitations of each method. Hensher (1994) also states that using stated andrevealed preference studies together can improve the explanatory power of revealed preference studies.
In the study described in this paper, each respondent completed a questionnaire that looked at their statedpreferences and their revealed preferences. In the design of the questionnaire, a pilot study was conducted toexamine the variables chosen. This questionnaire was distributed to public transport users in University Col-lege Dublin who had used interurban public transport in the past. The pilot questionnaires could not be dis-tributed on the Dublin–Sligo or Dublin–Galway routes as permission was given to issue the surveys on eachroute on one day only by the relevant authorities. These authorities were worried about their customer beinginconvenienced or annoyed by having to complete questionnaires.
The pilot questionnaires consisted of both a stated choice and ranking exercise. The variables used for thepilot study were cost, journey length, reliability, and presence of on-board toilet facilities and presence of cater-ing facilities. This was to allow the researchers to examine particular factors that might make train travel morepopular than bus travel on interurban routes – namely the inclusion of toilet and catering facilities. In Ireland,interurban rail has a very low modal share and the reason often given for this is that bus travel is relativelycheap, quick and comfortable, while there is a small rail network, ageing rail stock, low journey speeds and poortrain frequencies. The data shows that in 2000, rail only accounted for 3.6% of modal share in inland transport,while bus accounted for 14.9% of modal share (Eurostat, 2006; Ahern and Anandarajah, 2006).
The first three variables were varied over four levels while people could answer yes or no only to the last 2variables. The values used for cost and journey length were based on the actual cost and travel time for a jour-ney to Sligo. These values were then varied by ±10% and ±20% to obtain four levels for each. The levels usedfor reliability were ‘‘on time’’, ‘‘10 minutes late’’, ‘‘20 minutes late’’ and ‘‘30 minutes late’’. A main effectsdesign was used, from which profiles were randomly sampled to create the choice and ranking exercises. Hen-sher (1994) states that there should be enough attributes included in a stated preference study to allow respon-dents to answer meaningfully, in the context of the policies under study.
A sample of 20 individuals was obtained for the pilot study, 10 of whom also examined the revealed pref-erence questionnaire. While this is a relatively small sample size, each individual was asked to complete sevenchoice replications (giving 6 · 20 = 120 responses) and a six level ranking exercise (effectively 5 · 20 = 100choice responses).
The results of the pilot stated choice study gave the expected signs for each of the variables included,although the level of significance of the catering and toilet variables were below the critical value of 1.64 (t-values of 0.47 and 0.78 respectively). While the relatively small sample size used meant that the significanceof the variables would be relatively low, it was decided that the catering variable would be excluded fromthe main study. Instead, it was replaced with a frequency of service variable.
The ranking model yielded similar results, again giving a relatively low level of significance to both the toiletand catering variables (t-values of 0.65 and 0.24 respectively). Similarly to the choice questionnaire, it wasdecided to replace the catering variable with a frequency attribute.
In the main survey, people were asked to indicate the purpose of their trips and people on business-relatedtrips were excluded from analysis as Balcombe (2004) have found that people on business-trips tend to assigndifferent levels of importance to their attributes of choice.
As in the pilot study, there were two types of stated preference questionnaire used: ranking and statedchoice. There were three forms of stated choice questionnaire used: 5-choice set, 10-choice set and wide-attri-bute questionnaire. The 5-choice set questionnaire was distributed on the Sligo train, the Sligo bus and theGalway train. The 10-choice set questionnaire was only issued on the Sligo train as was the wide-attributequestionnaire.
The choice attributes used were cost, journey length, frequency, reliability and presence of toilet facilities.The first four variables were varied over four levels while the last variable was varied over two levels. A maineffects fractional factorial design was used to create the profiles used in the experiment.
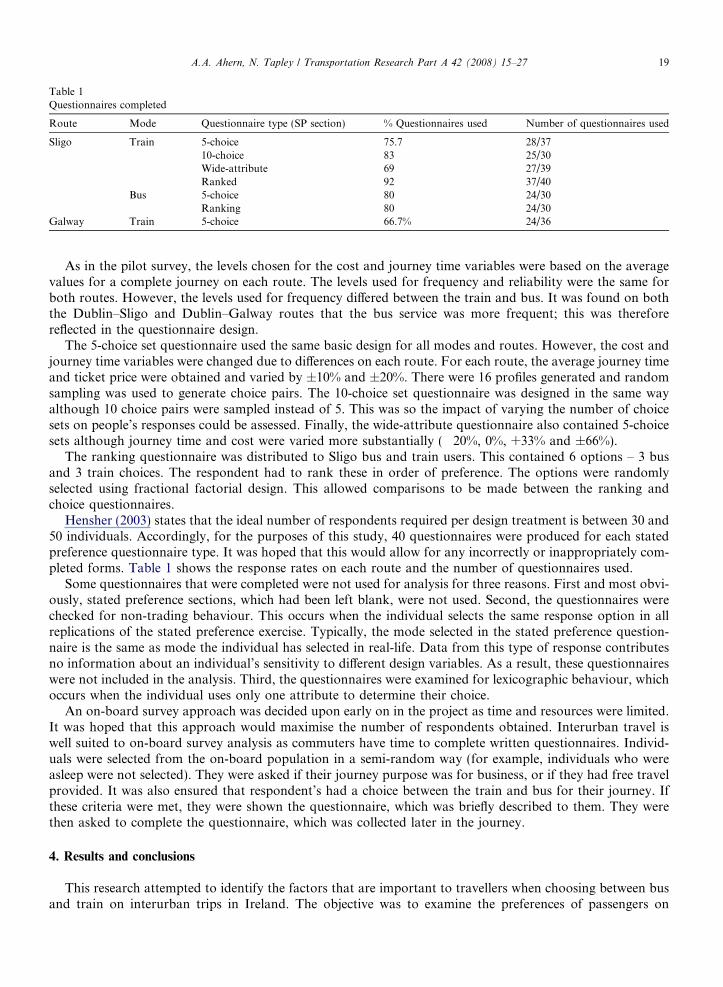
Table 1Questionnaires completed
Route Mode Questionnaire type (SP section) % Questionnaires used Number of questionnaires used
Sligo Train 5-choice 75.7 28/3710-choice 83 25/30Wide-attribute 69 27/39Ranked 92 37/40
Bus 5-choice 80 24/30Ranking 80 24/30
Galway Train 5-choice 66.7% 24/36
A.A. Ahern, N. Tapley / Transportation Research Part A 42 (2008) 15–27 19
As in the pilot survey, the levels chosen for the cost and journey time variables were based on the averagevalues for a complete journey on each route. The levels used for frequency and reliability were the same forboth routes. However, the levels used for frequency differed between the train and bus. It was found on boththe Dublin–Sligo and Dublin–Galway routes that the bus service was more frequent; this was thereforereflected in the questionnaire design.
The 5-choice set questionnaire used the same basic design for all modes and routes. However, the cost andjourney time variables were changed due to differences on each route. For each route, the average journey timeand ticket price were obtained and varied by ±10% and ±20%. There were 16 profiles generated and randomsampling was used to generate choice pairs. The 10-choice set questionnaire was designed in the same wayalthough 10 choice pairs were sampled instead of 5. This was so the impact of varying the number of choicesets on people’s responses could be assessed. Finally, the wide-attribute questionnaire also contained 5-choicesets although journey time and cost were varied more substantially (�20%, 0%, +33% and ±66%).
The ranking questionnaire was distributed to Sligo bus and train users. This contained 6 options – 3 busand 3 train choices. The respondent had to rank these in order of preference. The options were randomlyselected using fractional factorial design. This allowed comparisons to be made between the ranking andchoice questionnaires.
Hensher (2003) states that the ideal number of respondents required per design treatment is between 30 and50 individuals. Accordingly, for the purposes of this study, 40 questionnaires were produced for each statedpreference questionnaire type. It was hoped that this would allow for any incorrectly or inappropriately com-pleted forms. Table 1 shows the response rates on each route and the number of questionnaires used.
Some questionnaires that were completed were not used for analysis for three reasons. First and most obvi-ously, stated preference sections, which had been left blank, were not used. Second, the questionnaires werechecked for non-trading behaviour. This occurs when the individual selects the same response option in allreplications of the stated preference exercise. Typically, the mode selected in the stated preference question-naire is the same as mode the individual has selected in real-life. Data from this type of response contributesno information about an individual’s sensitivity to different design variables. As a result, these questionnaireswere not included in the analysis. Third, the questionnaires were examined for lexicographic behaviour, whichoccurs when the individual uses only one attribute to determine their choice.
An on-board survey approach was decided upon early on in the project as time and resources were limited.It was hoped that this approach would maximise the number of respondents obtained. Interurban travel iswell suited to on-board survey analysis as commuters have time to complete written questionnaires. Individ-uals were selected from the on-board population in a semi-random way (for example, individuals who wereasleep were not selected). They were asked if their journey purpose was for business, or if they had free travelprovided. It was also ensured that respondent’s had a choice between the train and bus for their journey. Ifthese criteria were met, they were shown the questionnaire, which was briefly described to them. They werethen asked to complete the questionnaire, which was collected later in the journey.
4. Results and conclusions
This research attempted to identify the factors that are important to travellers when choosing between busand train on interurban trips in Ireland. The objective was to examine the preferences of passengers on

20 A.A. Ahern, N. Tapley / Transportation Research Part A 42 (2008) 15–27
particular interurban routes on both bus and train. In addition, the research looked at the impact of differentstated preference and revealed preference designs on the responses of travellers.
The results were analysed using Stata v 8.0. The choice data was analysed using the conditional logit algo-rithm, while the ranking data was analysed with the Rank-ordered logistic regression algorithm. Along withthe coefficient estimates and their corresponding levels of significance, STATA also provides all of the basicpost-estimation statistics, including include the goodness-of-fit indicator, R2.
Tables 2–9 show the results.In all cases, it was found that travel time and cost are the most important factors in people’s choices of
mode. While the relative importance of these attributes differed in the different stated preference designs, itwas always the case that people chose modes based on cost of use and length of journey. On the other hand,while frequency and reliability had the expected signs, they seem to have relatively low levels of significance forpeople’s modal choices.
Why is this? It may be because in the stated preference studies, people found it easier to measure the impor-tance of time and cost to their decisions whereas frequency and reliability are more nebulous concepts to forrespondents to grasp. Both the train and bus services on the routes are quite frequent and reliable. Therefore,people may undervalue these attributes. The concepts of expensive fares and long trips are more tangible to
Table 2Sligo train SC 5-choice set
Location Mode Surveytype
Statistic Result Variable Coefficient t-Value Standarderror
Sligo Train 5-choice set Observations 280 Cost (€) �.1746062 �3.92 .0445236Log likelihood �72.205928 Journey length (min) �.41502 �5.47 .0075926LR chi2 (6df) 49.67 Reliability (mins late) �.0058429 �.38 .0154552Pseudo R2 0.2559 Toilet (1, yes; 0, no) �.0535529 �.14 .028341Correctly classified 78.6% Mode (1 train; 0 bus) �.1856897 �.48 .3880756Value of travel timesavings
€14.26/h
Table 3Sligo train SC 10-choice set
Location Mode Survey type Statistic Result Variable Coefficient t-Value Standarderror
Sligo Train 10-choice set Observations 500 Cost (€) �.2208404 �6.36 .0347343Log likelihood �125.55598 Journey length (min) �.0392599 �6.79 .005781LR chi2 (6df) 95.46 Reliability (mins late) �.0165527 �1.44 .0114648Pseudo R2 0.2754 Toilet (1, yes; 0, no) �.1544009 �.52 .29280Correctly classified 76.3% Mode (1 train; 0 bus) .3652432 1.28 .2864597Value of travel timesavings
€10.67/h
Table 4Sligo train SC 5-choice set, wide attribute
Location Mode Survey type Statistic Result Variable Coefficient t-Value Standarderror
Sligo Train 5-choice set,wide attribute
Observations 270 Cost (€) �.1946261 �4.97 .0391962
Log likelihood �46.95371 Journey length (min) �.0357553 �5.59 .0063973LR chi2 (6df) 93.24 Reliability (mins late) .0095496 0.46 .0207964Pseudo R2 0.4982 Toilet (1, yes; 0, no) �.7020393 �1.3 .5410269Correctly classified 87% Mode (1 train; 0 bus) .2971777 �0.75 �.3974854Value of traveltime savings
€11.02/h
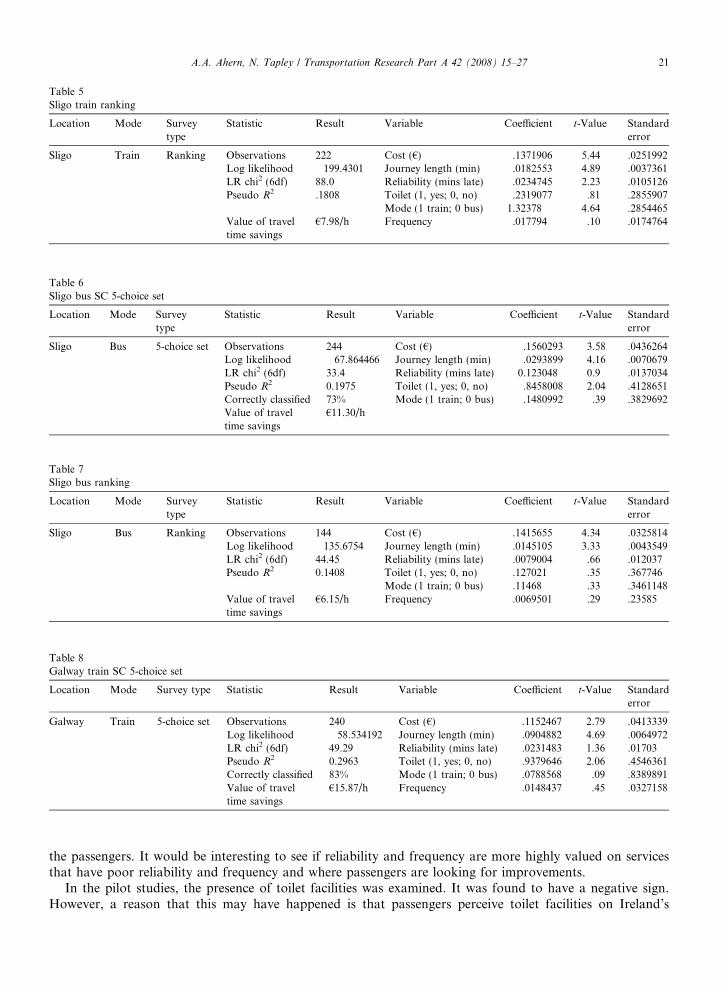
Table 5Sligo train ranking
Location Mode Surveytype
Statistic Result Variable Coefficient t-Value Standarderror
Sligo Train Ranking Observations 222 Cost (€) �.1371906 �5.44 .0251992Log likelihood �199.4301 Journey length (min) �.0182553 �4.89 .0037361LR chi2 (6df) 88.0 Reliability (mins late) �.0234745 �2.23 .0105126Pseudo R2 .1808 Toilet (1, yes; 0, no) �.2319077 �.81 .2855907
Mode (1 train; 0 bus) 1.32378 4.64 .2854465Value of traveltime savings
€7.98/h Frequency �.017794 �.10 .0174764
Table 6Sligo bus SC 5-choice set
Location Mode Surveytype
Statistic Result Variable Coefficient t-Value Standarderror
Sligo Bus 5-choice set Observations 244 Cost (€) �.1560293 �3.58 .0436264Log likelihood �67.864466 Journey length (min) �.0293899 �4.16 .0070679LR chi2 (6df) 33.4 Reliability (mins late) �0.123048 �0.9 .0137034Pseudo R2 0.1975 Toilet (1, yes; 0, no) �.8458008 �2.04 .4128651Correctly classified 73% Mode (1 train; 0 bus) �.1480992 �.39 .3829692Value of traveltime savings
€11.30/h
Table 7Sligo bus ranking
Location Mode Surveytype
Statistic Result Variable Coefficient t-Value Standarderror
Sligo Bus Ranking Observations 144 Cost (€) �.1415655 �4.34 .0325814Log likelihood �135.6754 Journey length (min) �.0145105 �3.33 .0043549LR chi2 (6df) 44.45 Reliability (mins late) �.0079004 �.66 .012037Pseudo R2 0.1408 Toilet (1, yes; 0, no) .127021 .35 .367746
Mode (1 train; 0 bus) �.11468 �.33 .3461148Value of traveltime savings
€6.15/h Frequency .0069501 .29 .23585
Table 8Galway train SC 5-choice set
Location Mode Survey type Statistic Result Variable Coefficient t-Value Standarderror
Galway Train 5-choice set Observations 240 Cost (€) �.1152467 �2.79 .0413339Log likelihood �58.534192 Journey length (min) �.0904882 �4.69 .0064972LR chi2 (6df) 49.29 Reliability (mins late) �.0231483 �1.36 .01703Pseudo R2 0.2963 Toilet (1, yes; 0, no) �.9379646 �2.06 .4546361Correctly classified 83% Mode (1 train; 0 bus) .0788568 .09 .8389891Value of traveltime savings
€15.87/h Frequency .0148437 .45 .0327158
A.A. Ahern, N. Tapley / Transportation Research Part A 42 (2008) 15–27 21
the passengers. It would be interesting to see if reliability and frequency are more highly valued on servicesthat have poor reliability and frequency and where passengers are looking for improvements.
In the pilot studies, the presence of toilet facilities was examined. It was found to have a negative sign.However, a reason that this may have happened is that passengers perceive toilet facilities on Ireland’s

Table 9Revealed preference model
Location Mode Survey type Statistic Result Variable Coefficient t-Value Standarderror
Revealedpreference
Observations 264 Cost (€) �.0214167 �.46 .0468484
Log likelihood �66.087774 Journey length (min) �.0266892 �2.31 .0115543LR chi2 (6df) 50.82 Reliability (mins late) �.0693963 �2.61 .0265787Pseudo R2 0.2777 Out of vehicle time (mins) �.031674 �1.60 .0197749Correctly classified 79.4% Excess cost (€) �.2326152 �1.98 .1174041
Mode (1 train; 0 bus) �.2784013 �.66 .423582
22 A.A. Ahern, N. Tapley / Transportation Research Part A 42 (2008) 15–27
interurban rail network to be very poor and of low quality (CIE, 2002). It may be that passengers feel that theabsence of a toilet facility is better than the presence of a substandard, poor quality toilet facility. This under-lines the fact that it is not adequate to simply provide services on-board trains or buses without ensuring thatthese services are of a sufficient quality.
The mode attribute had a negative sign for 4 models and a positive sign for 4 models. However, it was sig-nificant only once – in the Sligo train-ranking model. In this ranking exercise it seems that respondents sim-plified the task by ranking the train modes more highly than the bus modes. In effect, they are using therelatively simple distinction between bus and train to be the main choice determinant.
In all other cases, the mode attribute was not significant. This implies that all things being equal, in mostcases these travellers did not have a preference for either the train or the bus. This was contrary to what wasexpected. Conventional wisdom holds that people prefer the train to the bus as the train appears to have abetter image than the bus. However, other studies have also identified that there is an overestimation ofthe inherent attractiveness of rail travel (Ben-Akiva and Morikawa, 2002). As Ben-Akiva and Morikawa(2002) state rail is usually seen as having some ‘‘image benefits’’ over bus travel. This would appear not tobe the case in this study.
On the routes chosen, the bus services were very similar to the train services in terms of frequency and reli-ability. Therefore, it may be that the traditional image benefits associated with train travel were not present. InIreland, coach travel is relatively inexpensive and vehicles are comfortable. Rolling stock for trains, on theother hand, is quite old. At present, almost half the fleet is virtually life expired.On average: the locomotivesare over 28 years old, the locomotive hauled carriages are over 24 years old, and the rolling stocks are over 25years old. The fleet age profile and the replacement of life expired rolling stock has been a significant issue indiscussion on rolling stock with Irish Rail (Department of Transport, 2003).
Wardman (2006) showed that in London interurban rail travel is seen as a luxury good. However, in Ire-land intercity rail services are not seen as particularly more luxurious than intercity coach services. In Ireland,it would appear that rail travel is not seen as a luxury good but as an inferior good. This may be due to oldrolling stock and poor rail services. Some routes still have Mark II rolling stock from the 1970s in operation,although these were due to be phased out in 2007. This rolling stock is currently being upgraded and Mark IVscame into operation on the Dublin–Cork route in summer 2006 and on other routes at a later date, althoughindustrial action in early May 2006 delayed this introduction of the new rolling stock. This new rolling stockmay lead to changes, as rail travel may be perceived as more of a luxury good and the inherent attractivenessof train travel may become more apparent.
If rail services are to offer a realistic alternative to bus services and road travel on interurban trips, theyneed to be greatly improved. Kottenhof and Lindh (1996) demonstrated that high standard train servicesbetween cities will be more highly valued than bus services. At present, the train service in Ireland is not ofa high service while the bus service that is offered is highly competitive. There are many private companiesoperating bus services on interurban routes, causing bus services to be of a high quality and vehicles tendto be quite young.
The value of time for train users in the stated preference studies ranged from €10.67/h to €15.87/h, and wasconsistently higher than the value of time used in the Strategic Rail Review, which put the value of time at€6.63/h. This would suggest that the value of time in the Strategic Rail Review has been underestimated.
A.A. Ahern, N. Tapley / Transportation Research Part A 42 (2008) 15–27 23
The value of bus users time was €11.30/h. Train users value of time tended to be higher than that of bus usersand this is consistent with other studies (Balcombe, 2004).
Balcombe (2004) also suggests that interurban bus users have a lower value of time than train users (€10.50/h vs. €12/h respectively). On the Galway route, there is intense competition between Bus Eireann and privateoperators (Citilink and Nestor). As a result of this, bus fares are relatively low on the Galway bus servicescompared to the train, which is not faced with direct competition. The price of an adult monthly return toGalway for Bus Eireann passengers is €16. This is approximately 44% of the price of an adult monthly returnon the train service (€36.50). On the Sligo route, there is less competition between bus services, meaning thatbus and train ticket prices are more similar. The price of a monthly return to Sligo for bus users is €23.50 whilethe cost for train users is €30. Therefore, Galway train users have a relatively high value of time compared toSligo train users as they are paying a relatively high-ticket price for a similar saving in journey time.
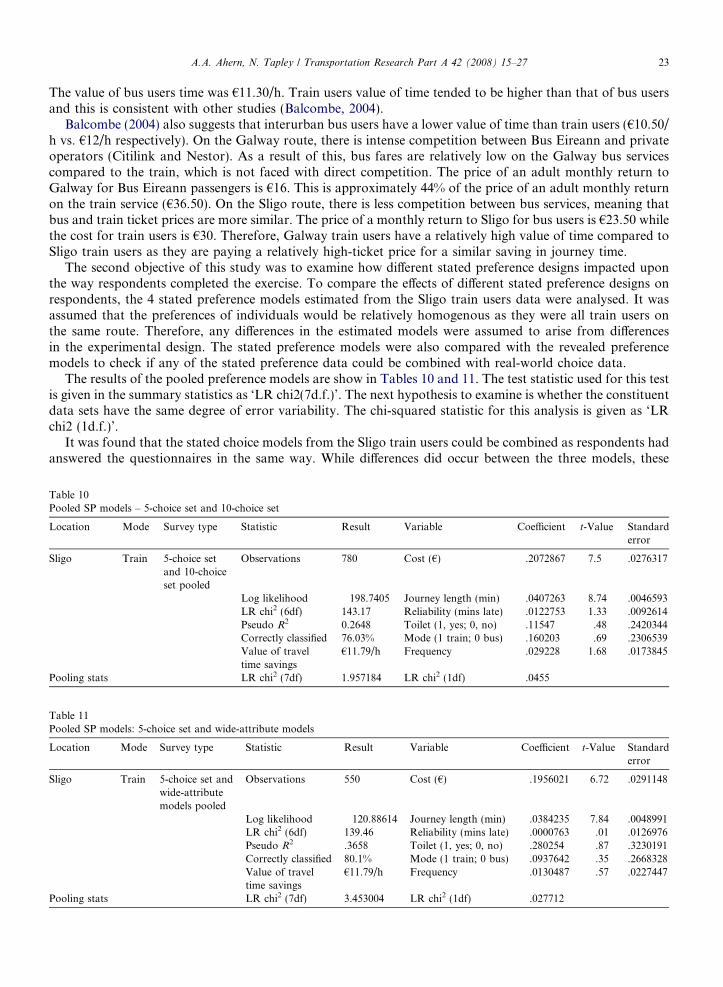
The second objective of this study was to examine how different stated preference designs impacted uponthe way respondents completed the exercise. To compare the effects of different stated preference designs onrespondents, the 4 stated preference models estimated from the Sligo train users data were analysed. It wasassumed that the preferences of individuals would be relatively homogenous as they were all train users onthe same route. Therefore, any differences in the estimated models were assumed to arise from differencesin the experimental design. The stated preference models were also compared with the revealed preferencemodels to check if any of the stated preference data could be combined with real-world choice data.
The results of the pooled preference models are show in Tables 10 and 11. The test statistic used for this testis given in the summary statistics as ‘LR chi2(7d.f.)’. The next hypothesis to examine is whether the constituentdata sets have the same degree of error variability. The chi-squared statistic for this analysis is given as ‘LRchi2 (1d.f.)’.
It was found that the stated choice models from the Sligo train users could be combined as respondents hadanswered the questionnaires in the same way. While differences did occur between the three models, these
Table 10Pooled SP models – 5-choice set and 10-choice set
Location Mode Survey type Statistic Result Variable Coefficient t-Value Standarderror
Sligo Train 5-choice setand 10-choiceset pooled
Observations 780 Cost (€) .2072867 �7.5 .0276317
Log likelihood �198.7405 Journey length (min) �.0407263 �8.74 .0046593LR chi2 (6df) 143.17 Reliability (mins late) �.0122753 �1.33 .0092614Pseudo R2 0.2648 Toilet (1, yes; 0, no) �.11547 �.48 .2420344Correctly classified 76.03% Mode (1 train; 0 bus) .160203 .69 .2306539Value of traveltime savings
€11.79/h Frequency .029228 1.68 .0173845
Pooling stats LR chi2 (7df) 1.957184 LR chi2 (1df) .0455
Table 11Pooled SP models: 5-choice set and wide-attribute models
Location Mode Survey type Statistic Result Variable Coefficient t-Value Standarderror
Sligo Train 5-choice set andwide-attributemodels pooled
Observations 550 Cost (€) �.1956021 �6.72 .0291148
Log likelihood �120.88614 Journey length (min) �.0384235 �7.84 .0048991LR chi2 (6df) 139.46 Reliability (mins late) �.0000763 �.01 .0126976Pseudo R2 .3658 Toilet (1, yes; 0, no) .280254 �.87 .3230191Correctly classified 80.1% Mode (1 train; 0 bus) �.0937642 �.35 .2668328Value of traveltime savings
€11.79/h Frequency .0130487 .57 .0227447
Pooling stats LR chi2 (7df) 3.453004 LR chi2 (1df) .027712
24 A.A. Ahern, N. Tapley / Transportation Research Part A 42 (2008) 15–27
differences were not sufficient to reject the hypothesis of parameter equality. The pooling analysis also showsthat the error variability in each of the stated choice models was equal, suggesting that the different designs donot affect the variability or randomness of individuals’ responses. The wide attribution model gave the best fitand predictions. Respondents were presented with a lot of choices situated outside the normal expectations.The novelty of these scenarios may have caused respondents to consider their answers more carefully than themore typical choices presented in the 5 and 10-choice set questionnaires.
In comparison with Hensher (2003), this study also found that increasing the number of choice sets offeredto respondents decreased the value of time in the resulting model. In this analysis, it appears that respondentsgave a relatively equal weight to ‘journey length’ and ‘cost’ in the 10-choice set model (both t-values are sim-ilar), compared with the 5-choice set model. It is difficult to explain this behaviour as, before the analysis wasconducted, it was assumed that the 10-choice set questionnaire would elicit a less considered response due tofatigue effects. However, the opposite may be true as both ‘cost’ and ‘journey length’ were given similar con-sideration while ‘frequency’ and ‘reliability’ were also close to an acceptable significance level. Thus, respon-dents may have given the lengthier task a more considered response.
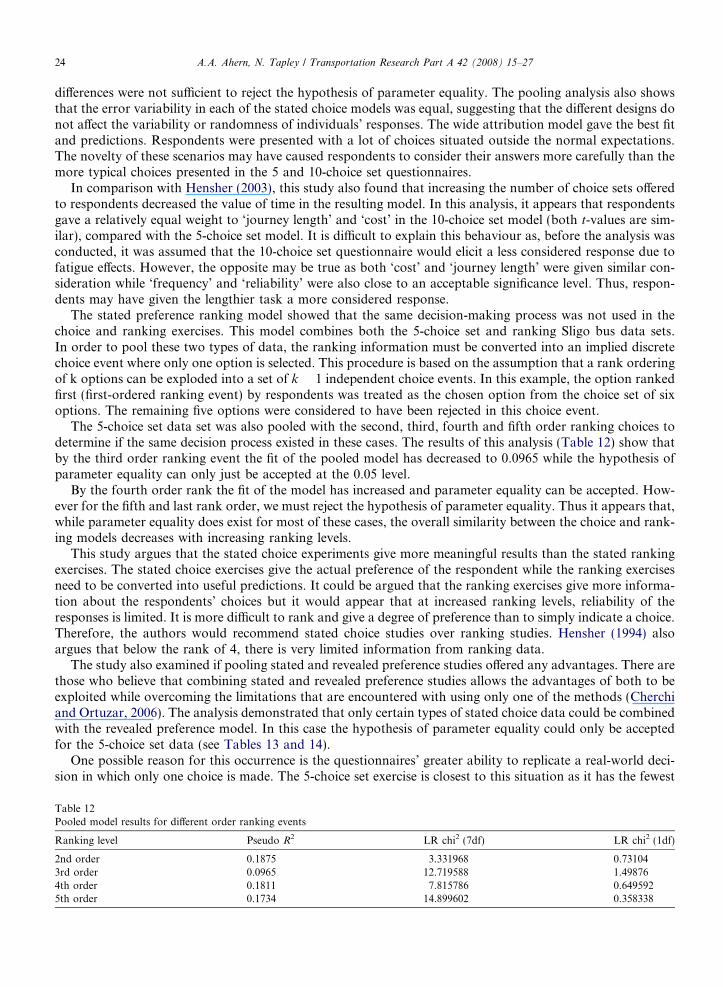
The stated preference ranking model showed that the same decision-making process was not used in thechoice and ranking exercises. This model combines both the 5-choice set and ranking Sligo bus data sets.In order to pool these two types of data, the ranking information must be converted into an implied discretechoice event where only one option is selected. This procedure is based on the assumption that a rank orderingof k options can be exploded into a set of k � 1 independent choice events. In this example, the option rankedfirst (first-ordered ranking event) by respondents was treated as the chosen option from the choice set of sixoptions. The remaining five options were considered to have been rejected in this choice event.
The 5-choice set data set was also pooled with the second, third, fourth and fifth order ranking choices todetermine if the same decision process existed in these cases. The results of this analysis (Table 12) show thatby the third order ranking event the fit of the pooled model has decreased to 0.0965 while the hypothesis ofparameter equality can only just be accepted at the 0.05 level.
By the fourth order rank the fit of the model has increased and parameter equality can be accepted. How-ever for the fifth and last rank order, we must reject the hypothesis of parameter equality. Thus it appears that,while parameter equality does exist for most of these cases, the overall similarity between the choice and rank-ing models decreases with increasing ranking levels.
This study argues that the stated choice experiments give more meaningful results than the stated rankingexercises. The stated choice exercises give the actual preference of the respondent while the ranking exercisesneed to be converted into useful predictions. It could be argued that the ranking exercises give more informa-tion about the respondents’ choices but it would appear that at increased ranking levels, reliability of theresponses is limited. It is more difficult to rank and give a degree of preference than to simply indicate a choice.Therefore, the authors would recommend stated choice studies over ranking studies. Hensher (1994) alsoargues that below the rank of 4, there is very limited information from ranking data.
The study also examined if pooling stated and revealed preference studies offered any advantages. There arethose who believe that combining stated and revealed preference studies allows the advantages of both to beexploited while overcoming the limitations that are encountered with using only one of the methods (Cherchiand Ortuzar, 2006). The analysis demonstrated that only certain types of stated choice data could be combinedwith the revealed preference model. In this case the hypothesis of parameter equality could only be acceptedfor the 5-choice set data (see Tables 13 and 14).
One possible reason for this occurrence is the questionnaires’ greater ability to replicate a real-world deci-sion in which only one choice is made. The 5-choice set exercise is closest to this situation as it has the fewest
Table 12Pooled model results for different order ranking events
Ranking level Pseudo R2 LR chi2 (7df) LR chi2 (1df)
2nd order 0.1875 3.331968 0.731043rd order 0.0965 12.719588 1.498764th order 0.1811 7.815786 0.6495925th order 0.1734 14.899602 0.358338
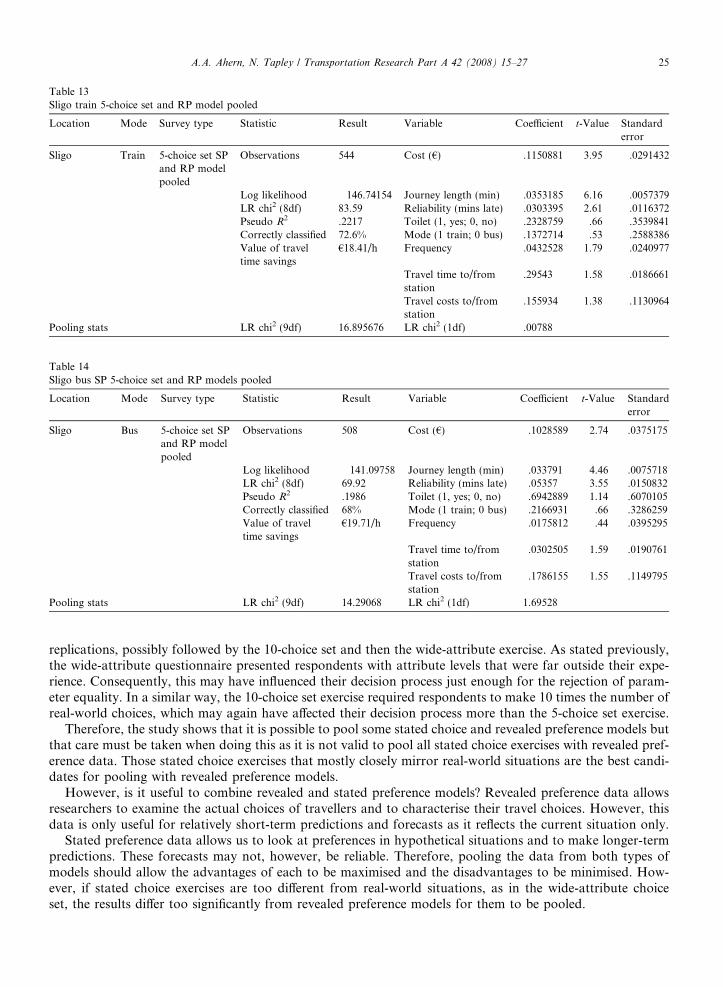
Table 13Sligo train 5-choice set and RP model pooled
Location Mode Survey type Statistic Result Variable Coefficient t-Value Standarderror
Sligo Train 5-choice set SPand RP modelpooled
Observations 544 Cost (€) �.1150881 �3.95 .0291432
Log likelihood �146.74154 Journey length (min) �.0353185 �6.16 .0057379LR chi2 (8df) 83.59 Reliability (mins late) �.0303395 �2.61 .0116372Pseudo R2 .2217 Toilet (1, yes; 0, no) .2328759 .66 .3539841Correctly classified 72.6% Mode (1 train; 0 bus) �.1372714 �.53 .2588386Value of traveltime savings
€18.41/h Frequency .0432528 1.79 .0240977
Travel time to/fromstation
�.29543 �1.58 .0186661
Travel costs to/fromstation
�.155934 �1.38 �.1130964
Pooling stats LR chi2 (9df) 16.895676 LR chi2 (1df) .00788
Table 14Sligo bus SP 5-choice set and RP models pooled
Location Mode Survey type Statistic Result Variable Coefficient t-Value Standarderror
Sligo Bus 5-choice set SPand RP modelpooled
Observations 508 Cost (€) �.1028589 �2.74 .0375175
Log likelihood �141.09758 Journey length (min) �.033791 �4.46 .0075718LR chi2 (8df) 69.92 Reliability (mins late) �.05357 �3.55 .0150832Pseudo R2 .1986 Toilet (1, yes; 0, no) �.6942889 �1.14 .6070105Correctly classified 68% Mode (1 train; 0 bus) �.2166931 �.66 .3286259Value of traveltime savings
€19.71/h Frequency .0175812 .44 .0395295
Travel time to/fromstation
�.0302505 �1.59 .0190761
Travel costs to/fromstation
�.1786155 �1.55 .1149795
Pooling stats LR chi2 (9df) 14.29068 LR chi2 (1df) 1.69528
A.A. Ahern, N. Tapley / Transportation Research Part A 42 (2008) 15–27 25
replications, possibly followed by the 10-choice set and then the wide-attribute exercise. As stated previously,the wide-attribute questionnaire presented respondents with attribute levels that were far outside their expe-rience. Consequently, this may have influenced their decision process just enough for the rejection of param-eter equality. In a similar way, the 10-choice set exercise required respondents to make 10 times the number ofreal-world choices, which may again have affected their decision process more than the 5-choice set exercise.
Therefore, the study shows that it is possible to pool some stated choice and revealed preference models butthat care must be taken when doing this as it is not valid to pool all stated choice exercises with revealed pref-erence data. Those stated choice exercises that mostly closely mirror real-world situations are the best candi-dates for pooling with revealed preference models.
However, is it useful to combine revealed and stated preference models? Revealed preference data allowsresearchers to examine the actual choices of travellers and to characterise their travel choices. However, thisdata is only useful for relatively short-term predictions and forecasts as it reflects the current situation only.
Stated preference data allows us to look at preferences in hypothetical situations and to make longer-termpredictions. These forecasts may not, however, be reliable. Therefore, pooling the data from both types ofmodels should allow the advantages of each to be maximised and the disadvantages to be minimised. How-ever, if stated choice exercises are too different from real-world situations, as in the wide-attribute choiceset, the results differ too significantly from revealed preference models for them to be pooled.

26 A.A. Ahern, N. Tapley / Transportation Research Part A 42 (2008) 15–27
Pooling stated preference data with revealed preference data to estimate the benefits of attributes anchorsstated preference data in the real world and to real decisions. However pooling stated preference and revealedpreference data must be done with great care as not all stated preference studies can be pooled with revealedpreference studies.
The authors would argue that there is some benefit from pooling stated and revealed preference data. Col-lecting revealed preference data is more accurate than stated preference data as we must treat what passengerssay they are going to do with some cynicism. However, collecting only revealed preference data does not allowresearchers to examine potential changes in the future or hypothetical situations.
In conclusion, the passengers in this study chose their modes based predominantly on the times and costsassociated with travelling. Frequency and reliability appeared to be less important to travellers. Of particularinterest was the fact that there did not seem to be an inherent preference for the train over the bus onthese interurban trips. It is postulated that this might be because the traditional advantages that trains offerover buses – more comfortable vehicles, faster journeys – were not actually present in these situations.The passengers’ experiences of train services in Ireland are that rolling stock is old and trains are relativelyslow and therefore they did not demonstrate any preference for rail over bus in the stated preference stud-ies. It may be that as train services are upgraded and as the Irish government continues to invest heavily inimproving rail services that the inherent attractiveness of rail over bus will become more apparent to passen-gers. In conclusion, the lack of investment in rail services in Ireland have led to a service that is slow androlling stock that is old. Therefore, while conventional wisdom holds that passengers value rail over buson interurban trips, this was not the case in this study. Irish passengers have not experienced high-qualityrail services that offer any great advantages over a competitive and reasonably priced rail service. Railservices need to be significantly improved if the inherent attractiveness of rail is to become apparent topassengers.
References
Ahern, A., Anandarajah, G., 2006. Influence of price and income on rail travel in Ireland. Transport 159 (4), 177–183.Balcombe, R. (Ed.), 2004. The demand for public transport: a practical guide. TRL Report 593.Bel, G., 1997. Changes in travel time across modes and its influence on inter-urban rail travel. Transportation Research E: Logistics and
Transportation Review 33 (1), 43–52.Ben-Akiva, M., Morikawa, T., 2002. Comparing ridership attraction of rail and bus. Transport Policy 9, 107–116.Cherchi, E., Ortuzar, J., 2006. On fitting mode specific constants in the presence of new options in revealed preference/stated preference
models. Transportation Research A: Policy and Practice 40, 1–18.CIE, 2002. Quality Customer Service Committee Annual Report 2002. Dublin Stationary Office.Coto-millan, P., Pino, Banos J., Inglada, V., 1997. Marshallian demands of intercity passenger transport in Spain: 1980–1992. An
economic analysis. Transportation Research Part E: Logistic and Transportation 33 (2), 79–96.Davidson, D., 1973. Forecasting traffic on STOL. Operation Research Quarterly 24, 561–569.Department of Transport, 2003. Strategic Rail Review.Eurostat, 2006. Statistical offices of the European Commission. See <http://epp.eurostat.cec.eu> (last accessed 1 August 2006).Hensher, D.A., 1994. Stated preference analysis of travel choices: the state of practice. Transportation 21, 107–133.Hensher, D.A., 2003. Revealing differences in willingness to pay due to the dimensionality of stated choice designs: an initial assessment.
Design of Designs Report #1, Institute of Transport Studies, The University of Sydney.Kottenhof, K., Lindh, C., 1996. The value and effect of introducing high standard train and bus concepts in Blekinge. Sweden, Transport
Policy 2 (4), 235–241.Louviere, J.J., Hensher, D.A., 1983. Using discrete choice models with exogenous design data to forecast consumer demand for unique
cultural events. Journal of Consumer Research 10 (3), 348–381.Minister for Public Enterprise, 2001. Iarnrod Eireann: The Way Forward. Report to the Minister for Public Enterprise, by the review
group established by the Minister for Public Enterprise.MVA, Institute of Transport Studies, University of Leeds, Transport Studies Unit University of Oxford, 1987. The value of travel time
savings, Policy Journals, Newbury, Berkshire.Owen, A.D., Phillips, G.D.A., 1987. The characteristics of railway passenger demand: an econometric investigation. Journal of Transport
Economics and Policy 21 (3), 231–253.Ponnuswamy, S., 2004. Patronage impacts of change in fares and services on urban rail transit in India. In: Proceedings of the
International Conference on Transportation System Planning and Operations, February 18–20, 2004, IITM, Chennai, India, pp 297–306.
Swait, J., Louviere, J.J., Williams, M., 1994. A sequential approach to exploiting the combined approach of stated preference and revealedpreference data: applications to freight shipper choice. Transportation 21, 135–152.

A.A. Ahern, N. Tapley / Transportation Research Part A 42 (2008) 15–27 27
Wang, D., Borgers, A., Oppewal, H., Timmermans, H., 2000. A stated choice approach to developing multi-faceted models of activitybehaviour. Transportation Research Part A: Policy and Practice 34, 625–643.
Wardman, M., 1997. Inter-urban rail demand, elasticities and competition in Great Britain: evidence from direct demand models.Transportation Research Part E: Logistics and Transportation 33 (1), 15–28.
Wardman, M., 2006. Demand for rail travel and the effects of external factors. Transportation Research Part E: Logistics andTransportation 42 (3), 129–148.
Copyright © 2022 FDOKUMEN