Carbon Disclosure Project 2009 Global 500 Report - Allianz
26
Carbon Disclosure Project 2009 Global 500 Report Report written for Carbon Disclosure Project by: Carbon Disclosure Project [email protected] +44 (0) 20 7970 5660 www.cdproject.net Paul Dickinson Chief Executive Officer [email protected] Paul Simpson Chief Operating Officer [email protected] Nigel Topping Chief Development Officer [email protected] Daniel Turner Head of Disclosure [email protected] Zoe Riddell Head of Investor CDP [email protected] Kate Levick Head of Government Partnerships [email protected] Frances Way Head of CDP Supply Chain [email protected] Joanna Lee Director, Communications & Corporate Partnerships [email protected] Tom Carnac Head of CDP Cities and Public Procurement [email protected] Pedro Faria Technical Director [email protected] Sue Howells Head of Global Partnerships [email protected] Carbon Disclosure Project 40 Bowling Green Lane London, EC1R 0NE United Kingdom Tel: +44 (0) 20 7970 5660/5667 Fax: +44 (0) 20 7691 7316 www.cdproject.net [email protected] US Fiscal Agent and Sponsor Liason Rockefeller Philanthropy Advisors 6 West 48th Street, 10th Floor New York NY 10036 USA Tel: + 1 (212) 378 2086 Fax: + 1 (212) 812 4335 Chair: Robert Napier The Met Office Alan Brown Schroders Jeremy Smith Berkeley Energy Christoph Schroeder TVM Capital Takejiro Sueyoshi James Cameron Climate Change Capital Tessa Tennant The Ice Organisation CDP Contacts CDP Board of Trustees Important Notice The contents of this report may be used by anyone providing acknowledgement is given to Carbon Disclosure Project. This does not represent a license to repackage or resell any of the data reported to CDP and presented in this report. If you intend to do this, you need to obtain express permission from CDP before doing so. PwC and CDP prepared the data and analysis in this report based on responses to the CDP 2009 information request. PwC and CDP do not guarantee the accuracy or completeness of this information. PwC and CDP make no representation or warranty, express or implied, and accept no liability concerning the fairness, accuracy, or completeness of the information and opinions contained herein. All opinions expressed herein by CDP and/or PwC are based on their judgment at the time of this report and are subject to change without notice due to economic, political, industry and firm-specific factors. Guest commentaries where included in this report reflect the views of their respective authors. PwC and CDP and their affiliated member firms or companies, or their respective shareholders, members, partners, principals, directors, officers and/or employees, may have a position in the securities discussed herein. The securities mentioned in this document may not be eligible for sale in some states or countries, nor suitable for all types of investors; their value and the income they produce may fluctuate and/or be adversely affected by exchange rates. ‘PricewaterhouseCoopers’ and ‘PwC’ refer to PricewaterhouseCoopers LLP (a limited liability partnership in the United Kingdom) or, as the context requires, other member firms of PricewaterhouseCoopers International Limited, each of which is a separate and independent legal entity. ‘Carbon Disclosure Project’ and ‘CDP’ refers to Carbon Disclosure Project, a United Kingdom company limited by guarantee, registered as a United Kingdom charity number 1122330. © 2009 Carbon Disclosure Project. On behalf of 475 investors with assets of US $55 trillion PricewaterhouseCoopers 1, Embankment Place London, WC2N 6RH United Kingdom Tel: +44 (0) 20 7583 5000 Fax: + 44 (0) 20 7822 4652 Alan McGill Partner Richard Gledhill Partner Malcolm Preston Partner Ian Milborrow Director PricewaterhouseCoopers 300 Madison Avenue 24th Floor New York, NY 10017 USA Tel +1 (646) 471 4000 Fax +1 (813) 286 6000 Liz Logan Partner Helle Bank Jorgensen Partner Contact details can be found at the following web address: http://pwc.com/climateready Report Writer Contacts
-
Upload
khangminh22 -
Category
Documents
-
view
0 -
download
0
Transcript of Carbon Disclosure Project 2009 Global 500 Report - Allianz
Carbon Disclosure Project 2009Global 500 Report
Report written for Carbon Disclosure Project by:
Carbon Disclosure [email protected]+44 (0) 20 7970 5660www.cdproject.net
Paul DickinsonChief Executive [email protected]
Paul SimpsonChief Operating [email protected]
Nigel Topping Chief Development [email protected]
Daniel TurnerHead of [email protected]
Zoe RiddellHead of Investor [email protected]
Kate LevickHead of [email protected]
Frances WayHead of CDP Supply [email protected]
Joanna LeeDirector, Communications &Corporate [email protected]
Tom CarnacHead of CDP Cities and Public [email protected]
Pedro FariaTechnical [email protected]
Sue HowellsHead of Global [email protected]
Carbon Disclosure Project40 Bowling Green LaneLondon, EC1R 0NEUnited KingdomTel: +44 (0) 20 7970 5660/5667Fax: +44 (0) 20 7691 7316www.cdproject.net [email protected]
US Fiscal Agent and Sponsor LiasonRockefeller Philanthropy Advisors6 West 48th Street, 10th FloorNew YorkNY 10036USATel: + 1 (212) 378 2086Fax: + 1 (212) 812 4335
Chair: Robert NapierThe Met Office
Alan BrownSchroders
Jeremy SmithBerkeley Energy
Christoph SchroederTVM Capital
Takejiro Sueyoshi
James CameronClimate Change Capital
Tessa TennantThe Ice Organisation
CDP Contacts
CDP Board of Trustees
Important Notice
The contents of this report may be used by anyone providing acknowledgement is given to Carbon Disclosure Project. This does not represent a license to repackage orresell any of the data reported to CDP and presented in this report. If you intend to do this, you need to obtain express permission from CDP before doing so.
PwC and CDP prepared the data and analysis in this report based on responses to the CDP 2009 information request. PwC and CDP do not guarantee the accuracy orcompleteness of this information. PwC and CDP make no representation or warranty, express or implied, and accept no liability concerning the fairness, accuracy, orcompleteness of the information and opinions contained herein. All opinions expressed herein by CDP and/or PwC are based on their judgment at the time of this reportand are subject to change without notice due to economic, political, industry and firm-specific factors. Guest commentaries where included in this report reflect the viewsof their respective authors.
PwC and CDP and their affiliated member firms or companies, or their respective shareholders, members, partners, principals, directors, officers and/or employees, mayhave a position in the securities discussed herein. The securities mentioned in this document may not be eligible for sale in some states or countries, nor suitable for alltypes of investors; their value and the income they produce may fluctuate and/or be adversely affected by exchange rates.
‘PricewaterhouseCoopers’ and ‘PwC’ refer to PricewaterhouseCoopers LLP (a limited liability partnership in the United Kingdom) or, as the context requires, othermember firms of PricewaterhouseCoopers International Limited, each of which is a separate and independent legal entity.
‘Carbon Disclosure Project’ and ‘CDP’ refers to Carbon Disclosure Project, a United Kingdom company limited by guarantee, registered as a United Kingdom charity number 1122330.
© 2009 Carbon Disclosure Project.
On behalf of 475 investors with assets of US $55 trillion
PricewaterhouseCoopers1, Embankment PlaceLondon, WC2N 6RHUnited KingdomTel: +44 (0) 20 7583 5000Fax: + 44 (0) 20 7822 4652
Alan McGillPartner
Richard GledhillPartner
Malcolm PrestonPartner
Ian MilborrowDirector
PricewaterhouseCoopers300 Madison Avenue24th FloorNew York, NY 10017USATel +1 (646) 471 4000Fax +1 (813) 286 6000
Liz LoganPartner
Helle Bank JorgensenPartner
Contact details can be found atthe following web address:
http://pwc.com/climateready
Report Writer Contacts
3
CDP Signatories 2009
2
Carbon Disclosure Project 2009
CDP Signatories 2009
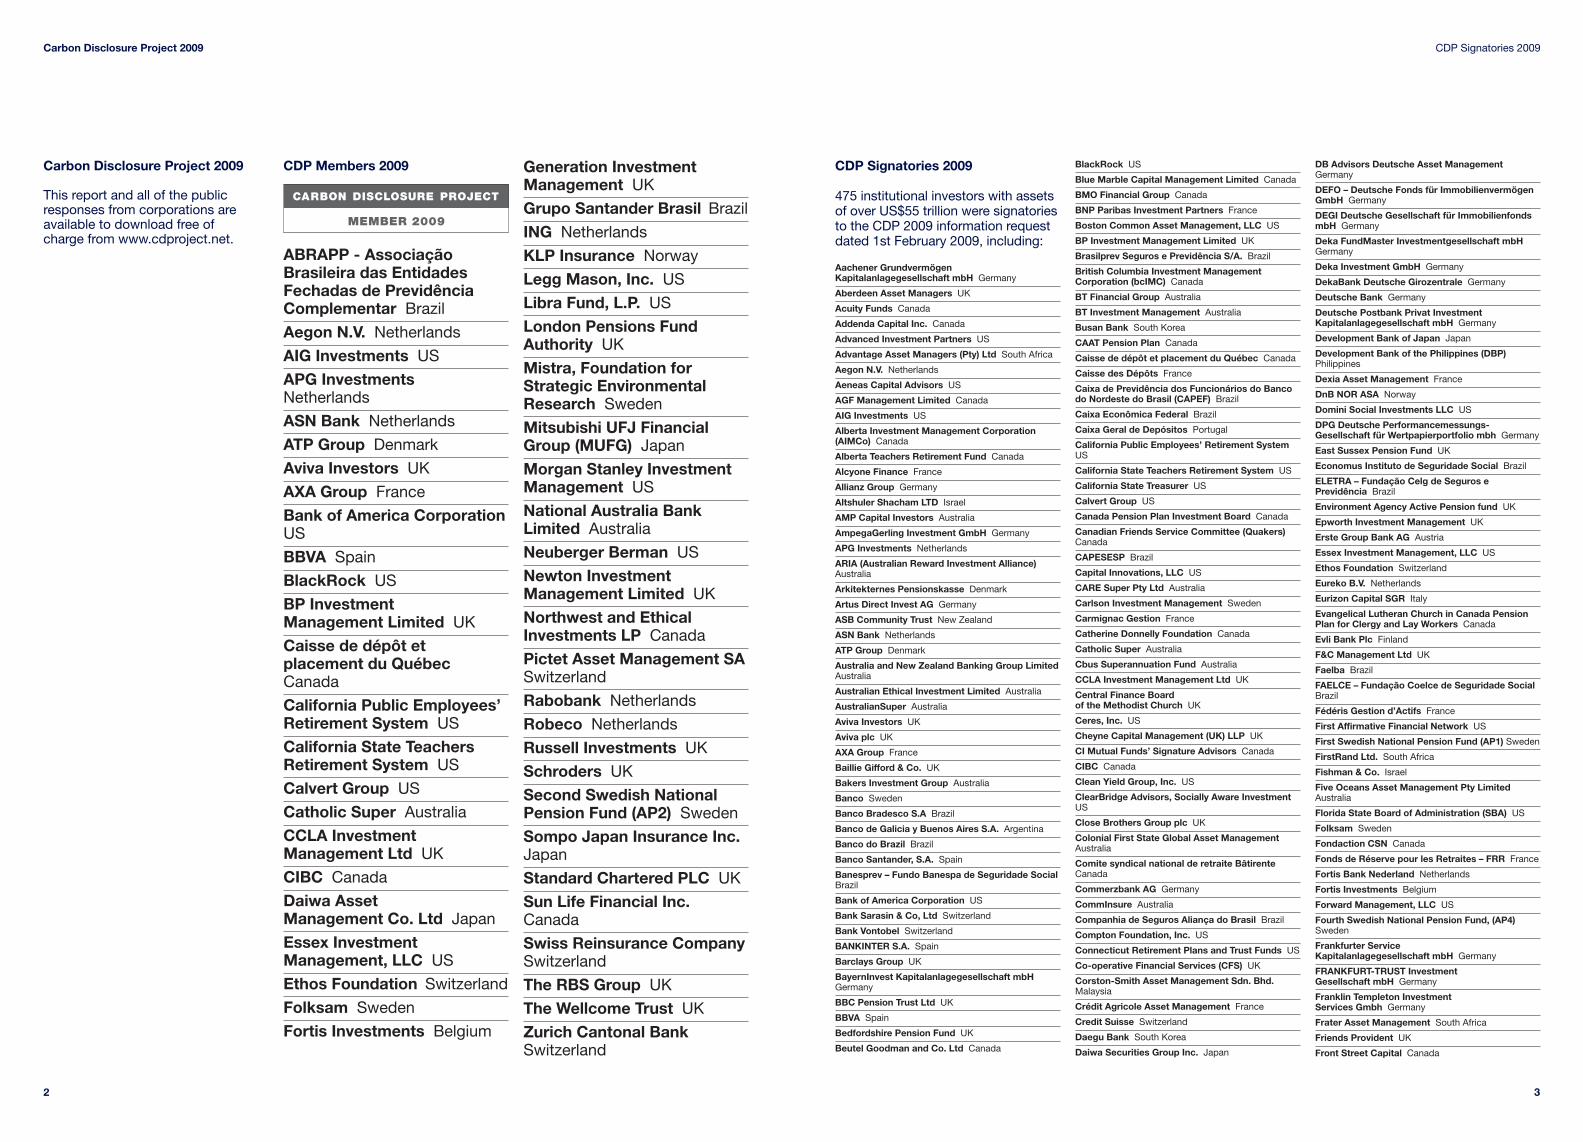
475 institutional investors with assetsof over US$55 trillion were signatoriesto the CDP 2009 information requestdated 1st February 2009, including:
Aachener GrundvermögenKapitalanlagegesellschaft mbH Germany
Aberdeen Asset Managers UK
Acuity Funds Canada
Addenda Capital Inc. Canada
Advanced Investment Partners US
Advantage Asset Managers (Pty) Ltd South Africa
Aegon N.V. Netherlands
Aeneas Capital Advisors US
AGF Management Limited Canada
AIG Investments US
Alberta Investment Management Corporation(AIMCo) Canada
Alberta Teachers Retirement Fund Canada
Alcyone Finance France
Allianz Group Germany
Altshuler Shacham LTD Israel
AMP Capital Investors Australia
AmpegaGerling Investment GmbH Germany
APG Investments Netherlands
ARIA (Australian Reward Investment Alliance)Australia
Arkitekternes Pensionskasse Denmark
Artus Direct Invest AG Germany
ASB Community Trust New Zealand
ASN Bank Netherlands
ATP Group Denmark
Australia and New Zealand Banking Group LimitedAustralia
Australian Ethical Investment Limited Australia
AustralianSuper Australia
Aviva Investors UK
Aviva plc UK
AXA Group France
Baillie Gifford & Co. UK
Bakers Investment Group Australia
Banco Sweden
Banco Bradesco S.A Brazil
Banco de Galicia y Buenos Aires S.A. Argentina
Banco do Brazil Brazil
Banco Santander, S.A. Spain
Banesprev – Fundo Banespa de Seguridade SocialBrazil
Bank of America Corporation US
Bank Sarasin & Co, Ltd Switzerland
Bank Vontobel Switzerland
BANKINTER S.A. Spain
Barclays Group UK
BayernInvest Kapitalanlagegesellschaft mbHGermany
BBC Pension Trust Ltd UK
BBVA Spain
Bedfordshire Pension Fund UK
Beutel Goodman and Co. Ltd Canada
BlackRock US
Blue Marble Capital Management Limited Canada
BMO Financial Group Canada
BNP Paribas Investment Partners France
Boston Common Asset Management, LLC US
BP Investment Management Limited UK
Brasilprev Seguros e Previdência S/A. Brazil
British Columbia Investment ManagementCorporation (bcIMC) Canada
BT Financial Group Australia
BT Investment Management Australia
Busan Bank South Korea
CAAT Pension Plan Canada
Caisse de dépôt et placement du Québec Canada
Caisse des Dépôts France
Caixa de Previdência dos Funcionários do Bancodo Nordeste do Brasil (CAPEF) Brazil
Caixa Econômica Federal Brazil
Caixa Geral de Depósitos Portugal
California Public Employees’ Retirement SystemUS
California State Teachers Retirement System US
California State Treasurer US
Calvert Group US
Canada Pension Plan Investment Board Canada
Canadian Friends Service Committee (Quakers)Canada
CAPESESP Brazil
Capital Innovations, LLC US
CARE Super Pty Ltd Australia
Carlson Investment Management Sweden
Carmignac Gestion France
Catherine Donnelly Foundation Canada
Catholic Super Australia
Cbus Superannuation Fund Australia
CCLA Investment Management Ltd UK
Central Finance Board of the Methodist Church UK
Ceres, Inc. US
Cheyne Capital Management (UK) LLP UK
CI Mutual Funds’ Signature Advisors Canada
CIBC Canada
Clean Yield Group, Inc. US
ClearBridge Advisors, Socially Aware InvestmentUS
Close Brothers Group plc UK
Colonial First State Global Asset ManagementAustralia
Comite syndical national de retraite BâtirenteCanada
Commerzbank AG Germany
CommInsure Australia
Companhia de Seguros Aliança do Brasil Brazil
Compton Foundation, Inc. US
Connecticut Retirement Plans and Trust Funds US
Co-operative Financial Services (CFS) UK
Corston-Smith Asset Management Sdn. Bhd.Malaysia
Crédit Agricole Asset Management France
Credit Suisse Switzerland
Daegu Bank South Korea
Daiwa Securities Group Inc. Japan
DB Advisors Deutsche Asset ManagementGermany
DEFO – Deutsche Fonds für ImmobilienvermögenGmbH Germany
DEGI Deutsche Gesellschaft für ImmobilienfondsmbH Germany
Deka FundMaster Investmentgesellschaft mbHGermany
Deka Investment GmbH Germany
DekaBank Deutsche Girozentrale Germany
Deutsche Bank Germany
Deutsche Postbank Privat InvestmentKapitalanlagegesellschaft mbH Germany
Development Bank of Japan Japan
Development Bank of the Philippines (DBP)Philippines
Dexia Asset Management France
DnB NOR ASA Norway
Domini Social Investments LLC US
DPG Deutsche Performancemessungs-Gesellschaft für Wertpapierportfolio mbh Germany
East Sussex Pension Fund UK
Economus Instituto de Seguridade Social Brazil
ELETRA – Fundação Celg de Seguros ePrevidência Brazil
Environment Agency Active Pension fund UK
Epworth Investment Management UK
Erste Group Bank AG Austria
Essex Investment Management, LLC US
Ethos Foundation Switzerland
Eureko B.V. Netherlands
Eurizon Capital SGR Italy
Evangelical Lutheran Church in Canada PensionPlan for Clergy and Lay Workers Canada
Evli Bank Plc Finland
F&C Management Ltd UK
Faelba Brazil
FAELCE – Fundação Coelce de Seguridade SocialBrazil
Fédéris Gestion d’Actifs France
First Affirmative Financial Network US
First Swedish National Pension Fund (AP1) Sweden
FirstRand Ltd. South Africa
Fishman & Co. Israel
Five Oceans Asset Management Pty LimitedAustralia
Florida State Board of Administration (SBA) US
Folksam Sweden
Fondaction CSN Canada
Fonds de Réserve pour les Retraites – FRR France
Fortis Bank Nederland Netherlands
Fortis Investments Belgium
Forward Management, LLC US
Fourth Swedish National Pension Fund, (AP4)Sweden
Frankfurter Service Kapitalanlagegesellschaft mbH Germany
FRANKFURT-TRUST Investment Gesellschaft mbH Germany
Franklin Templeton Investment Services Gmbh Germany
Frater Asset Management South Africa
Friends Provident UK
Front Street Capital Canada
Carbon Disclosure Project 2009
This report and all of the publicresponses from corporations areavailable to download free of charge from www.cdproject.net.
CDP Members 2009
ABRAPP - AssociaçãoBrasileira das EntidadesFechadas de PrevidênciaComplementar Brazil
Aegon N.V. Netherlands
AIG Investments US
APG InvestmentsNetherlands
ASN Bank Netherlands
ATP Group Denmark
Aviva Investors UK
AXA Group France
Bank of America CorporationUS
BBVA Spain
BlackRock US
BP Investment Management Limited UK
Caisse de dépôt etplacement du QuébecCanada
California Public Employees’Retirement System US
California State TeachersRetirement System US
Calvert Group US
Catholic Super Australia
CCLA InvestmentManagement Ltd UK
CIBC Canada
Daiwa Asset Management Co. Ltd Japan
Essex InvestmentManagement, LLC US
Ethos Foundation Switzerland
Folksam Sweden
Fortis Investments Belgium
Generation InvestmentManagement UK
Grupo Santander Brasil Brazil
ING Netherlands
KLP Insurance Norway
Legg Mason, Inc. US
Libra Fund, L.P. US
London Pensions FundAuthority UK
Mistra, Foundation forStrategic EnvironmentalResearch Sweden
Mitsubishi UFJ FinancialGroup (MUFG) Japan
Morgan Stanley InvestmentManagement US
National Australia BankLimited Australia
Neuberger Berman US
Newton InvestmentManagement Limited UK
Northwest and EthicalInvestments LP Canada
Pictet Asset Management SASwitzerland
Rabobank Netherlands
Robeco Netherlands
Russell Investments UK
Schroders UK
Second Swedish NationalPension Fund (AP2) Sweden
Sompo Japan Insurance Inc.Japan
Standard Chartered PLC UK
Sun Life Financial Inc.Canada
Swiss Reinsurance CompanySwitzerland
The RBS Group UK
The Wellcome Trust UK
Zurich Cantonal BankSwitzerland
MEMBER 2009
5
CDP Signatories 2009
4
Commentary for the Carbon Disclosure Project
Northern Trust US
Northwest and Ethical Investments LP Canada
Oddo & Cie France
Old Mutual plc UK
OMERS Administration Corporation Canada
Ontario Teachers Pension Plan Canada
Opplysningsvesenets fond (The Norwegian Church Endowment) Norway
Oregon State Treasurer US
Orion Asset Management LLC US
Pax World Funds US
PBU – Pension Fund of Early Childhood TeachersDenmark
Pension Fund for Danish Lawyers and EconomistsDenmark
Pension Protection Fund UK
Pensionskassen for Jordbrugsakademikere og Dyrlæger Denmark
PETROS – The Fundação Petrobras de Seguridade Social Brazil
PFA Pension Denmark
PGGM Netherlands
Phillips, Hager & North Investment Management Ltd. Canada
PhiTrust Active Investors France
Pictet Asset Management SA Switzerland
Pioneer Alapkezelö Zrt. Hungary
Pioneer Investments Kapitalanlagegesellschaft mbH Germany
PKA Denmark
Portfolio 21 Investments US
Portfolio Partners Australia
Porto Seguro S.A. Brazil
PPM Premiepensionsmyndigheten Sweden
PRECE Previdência Complementar Brazil
PREVI Caixa de Previdência dos Funcionários do Banco do Brasil Brazil
Principle Capital Partners Limited UK
PSP Investments Canada
QBE Insurance Group Limited Australia
Q Capital Partners South Korea
Railpen Investments UK
Rathbones/Rathbone Greenbank Investments UK
Real Grandeza Fundação de Previdência eAssistência Social Brazil
Rei Super Australia
Rhode Island General Treasurer US
RLAM UK
Robeco Netherlands
Rose Foundation for Communities and the Environment US
Royal Bank of Canada Canada
RREEF Investment GmbH Germany
Russell Investments UK
SAM Group Switzerland
Sanlam Investment Management South Africa
Santa Fé Portfolios Ltda Brazil
Sauren Finanzdienstleistungen Germany
Savings & Loans Credit Union (S.A.) Limited.Australia
Schroders UK
Scotiabank Canada
Scottish Widows Investment Partnership UK
SEB Sweden
SEB Asset Management AG Germany
Second Swedish National Pension Fund (AP2)Sweden
Seligson & Co Fund Management Plc Finland
Sentinel Funds US
SERPROS Fundo Multipatrocinado Brazil
Service Employees International Union Benefit Funds US
Seventh Swedish National Pension Fund (AP7)Sweden
Shinhan Bank South Korea
Shinhan BNP Paribas Investment TrustManagement Co., Ltd South Korea
Shinkin Asset Management Co., Ltd Japan
Shinsei Bank Limited Japan
Siemens Kapitalanlagegesellschaft mbH Germany
Signet Capital Management Ltd Switzerland
Skandia Nordic Division Sweden
SMBC Friend Securities Co., LTD Japan
Smith Pierce, LLC US
SNS Asset Management Netherlands
Social(k) US
Société Générale France
Sompo Japan Insurance Inc. Japan
Souls Funds Management Limited Australia
SPF Beheer bv Netherlands
Sprucegrove Investment Management Ltd Canada
Standard Chartered PLC UK
Standard Life Investments UK
State Street Corporation US
Statewide Superannuation Trust Australia
Storebrand ASA Norway
Strathclyde Pension Fund UK
Stratus Group Brazil
Sumitomo Mitsui Banking Corporation Japan
Sumitomo Mitsui Card Company, Limited Japan
Sumitomo Mitsui Finance & Leasing Co., LtdJapan
Sumitomo Mitsui Financial Group Japan
Sumitomo Trust & Banking Japan
Sun Life Financial Inc. Canada
Superfund Asset Management GmbH Germany
Svenska Kyrkan, Church of Sweden Sweden
Swedbank Sweden
Swiss Reinsurance Company Switzerland
Swisscanto Holding AG Switzerland
Syntrus Achmea Asset Management Netherlands
TD Asset Management Inc. and TDAM USA Inc.Canada
Teachers Insurance and Annuity Association –College Retirement Equities Fund (TIAA-CREF) US
Tempis Capital Management South Korea
Terra Forvaltning AS Norway
TfL Pension Fund UK
The Bullitt Foundation US
The Central Church Fund of Finland Finland
The Collins Foundation US
The Co-operators Group Ltd Canada
The Daly Foundation Canada
The Dreyfus Corporation US
The Japan Research Institute, Limited Japan
The Joseph Rowntree Charitable Trust UK
The Local Government Pensions Insitution(LGPI)(keva) Finland
The Presbyterian Church in Canada Canada
The RBS Group UK
The Russell Family Foundation US
The Shiga Bank, Ltd. Japan
The Standard Bank of South Africa Limited South Africa
The Sustainability Group at the Loring, Wolcott & Coolidge Office US
The Travelers Companies, Inc. US
The United Church of Canada – General CouncilCanada
The University of Edinburgh Endowment Fund UK
The Wellcome Trust UK
Third Swedish National Pension Fund (AP3)Sweden
Threadneedle Asset Management UK
Tokio Marine & Nichido Fire Insurance Co., Ltd.Japan
Toronto Atmospheric Fund Canada
Trillium Asset Management Corporation US
Triodos Bank Netherlands
TrygVesta Denmark
UBS AG Switzerland
Unibanco Asset Management Brazil
UniCredit Group Italy
Union Asset Management Holding AG Germany
Union Investment Institutional GmbH Germany
Union Investment Privatfonds GmbH Germany
Union Investment Service Bank AG Germany
Union PanAgora Asset Management GmbHGermany
UniSuper Australia
Unitarian Universalist Association US
United Methodist Church General Board ofPension and Health Benefits US
United Nations Foundation US
Universal Investment Gesellschaft mbH Germany
Universities Superannuation Scheme (USS) UK
Vancity Group of Companies Canada
VERITAS SG INVESTMENT TRUST GmbH Germany
Vermont State Treasurer US
VicSuper Pty Ltd Australia
Victorian Funds Management CorporationAustralia
Visão Prev Sociedade de PrevidenciaComplementar Brazil
Waikato Community Trust Inc New Zealand
Walden Asset Management, a division of BostonTrust and Investment Management Company US
Warburg-Henderson Kapitalanlagegesellschaft für Immobilien mbH Germany
West Yorkshire Pension Fund UK
WestLB Mellon Asset Management (WMAM)Germany
Westpac Investment Management Australia
Winslow Management Company US
WOORI BANK South Korea
YES BANK Limited India
York University Pension Fund Canada
Youville Provident Fund Inc. Canada
Zurich Cantonal Bank Switzerland
Fukoku Capital Management Inc Japan
Fundação AMPLA de Seguridade Social –Brasiletros Brazil
Fundação Atlântico de Seguridade Social Brazil
Fundação Banrisul de Seguridade Social Brazil
Fundação CEEE de Seguridade Social –ELETROCEEE Brazil
Fundação Codesc de Seguridade Social – FUSESCBrazil
Fundação de Assistência e Previdência Social doBNDES – FAPES Brazil
Fundação Forluminas de Seguridade Social –FORLUZ Brazil
Fundação Promon de Previdência Social Brazil
Fundação São Francisco de Seguridade SocialBrazil
Fundação Vale do Rio Doce de Seguridade Social – VALIA Brazil
FUNDIÁGUA - Fundação de Previdência daCompanhia de Saneamento e Ambiental doDistrito Federal Brazil
Gartmore Investment Management Ltd UK
Generation Investment Management UK
Genus Capital Management Canada
Gjensidige Forsikring Norway
GLG Partners LP UK
Goldman Sachs & Co. US
Governance for Owners UK
Government Employees Pension Fund (“GEPF”),Republic of South Africa South Africa
Green Cay Asset Management Bahamas
Green Century Funds US
Groupe Investissement Responsable Inc. Canada
GROUPE OFI AM France
GrowthWorks Capital Ltd. Canada
Grupo Banco Popular Spain
Grupo Santander Brasil Brazil
Gruppo Monte Paschi Italy
Guardian Ethical Management Inc Canada
Guardians of New Zealand Superannuation New Zealand
Hang Seng Bank Hong Kong
HANSAINVEST Hanseatische Investment GmbHGermany
Harrington Investments US
Hastings Funds Management Limited Australia
Hazel Capital LLP UK
Health Super Fund Australia
Helaba Invest Kapitalanlagegesellschaft mbHGermany
Henderson Global Investors UK
Hermes Fund Managers UK
HESTA Super Australia
Hospitals of Ontario Pension Plan (HOOPP)Canada
HSBC Holdings plc UK
Hyundai Marine & Fire Insurance Co, Ltd South Korea
IDBI Bank Limited India
Ilmarinen Mutual Pension Insurance CompanyFinland
Impax Group plc UK
Industrial Bank China
Industry Funds Management Australia
Infrastructure Development Finance Company Ltd. (IDFC) India
ING Netherlands
Inhance Investment Management Inc Canada
Insight Investment Management (Global) Ltd UK
Instituto de Seguridade Social dos Correios eTelégrafos- Postalis Brazil
Instituto Infraero de Seguridade Social –INFRAPREV Brazil
Insurance Australia Group Australia
Internationale Kapitalanlagegesellschaft mbHGermany
Investec Asset Management UK
Itaú Unibanco Banco Múltiplo S.A. Brazil
J.P. Morgan Asset Management US
Janus Capital Group Inc. US
Jarislowsky Fraser Limited Canada
Jubitz Family Foundation US
Jupiter Asset Management UK
K&H Investment Fund Management/K&HBefektetési Alapkezelö Zrt Hungary
KB Kookmin Bank South Korea
KBC Asset Management NV Belgium
KCPS and Company Israel
KDB Asset Management Co., Ltd. South Korea
Kennedy Associates Real Estate Counsel, LP US
KfW Bankengruppe Germany
Kibo Technology Fund South Korea
KLP Insurance Norway
Korea Investment Trust Management Co., Ltd.South Korea
KPA Pension Sweden
Kyobo Investment Trust Management Co., Ltd.South Korea
La Banque Postale Asset Management France
La Financiere Responsable France
LBBW – Landesbank Baden-WürttembergGermany
LBBW Asset Management GmbH Germany
LD Lønmodtagernes Dyrtidsfond Denmark
Legal & General Group plc UK
Legg Mason, Inc. US
Lend Lease Investment Management Australia
Libra Fund, L.P. US
Light Green Advisors, LLC US
Living Planet Fund Management Company S.A.Switzerland
Local Authority Pension Fund Forum UK
Local Government Superannuation SchemeAustralia
Local Super SA-NT Australia
Lombard Odier Darier Hentsch & Cie Switzerland
London Pensions Fund Authority UK
Lothian Pension Fund UK
Macif Gestion France
Macquarie Group Limited Australia
Magnolia Charitable Trust US
Maine State Treasurer US
Man Group plc UK
Maple-Brown Abbott Limited Australia
Marc J. Lane Investment Management, Inc. US
Maryland State Treasurer US
McLean Budden Canada
MEAG Munich Ergo Asset
Management GmbH Germany
MEAG Munich Ergo Kapitalanlagegesellschaft mbH Germany
Meeschaert Gestion Privée France
Meiji Yasuda Life Insurance Company Japan
Merck Family Fund US
Mergence Africa Investments (Pty) Limited South Africa
Meritas Mutual Funds Canada
Metzler Investment Gmbh Germany
Midas International Asset Management South Korea
Miller/Howard Investments US
Mirae Investment Asset Management South Korea
Mistra, Foundation for Strategic Environmental Research Sweden
Mitsubishi UFJ Financial Group (MUFG) Japan
Mitsui Sumitomo Insurance Co.,Ltd. Japan
Mizuho Financial Group, Inc. Japan
Mn Services Netherlands
Monega Kapitalanlagegesellschaft mbH Germany
Morgan Stanley Investment Management US
Motor Trades Association of AustraliaSuperannuation Fund Pty Ltd Australia
MP Pension – Pensionskassen for Magistre og Psykologer Denmark
Munich Re Group Germany
Mutual Insurance Company Pension-FenniaFinland
Natcan Investment Management Canada
Nathan Cummings Foundation, The US
National Australia Bank Limited Australia
National Bank of Canada Canada
National Bank of Kuwait Kuwait
National Grid Electricity Group of the ElectricitySupply Pension Scheme UK
National Grid UK Pension Scheme UK
National Pensions Reserve Fund of Ireland Ireland
Natixis France
Needmor Fund US
Nest Sammelstiftung Switzerland
Neuberger Berman US
New Alternatives Fund Inc. US
New Jersey Division of Investment US
New Mexico State Treasurer US
New York City Employees Retirement System US
New York City Teachers Retirement System US
New York State Common Retirement Fund(NYSCRF) US
Newton Investment Management Limited UK
NFU Mutual Insurance Society UK
NH-CA Asset Management South Korea
Nikko Asset Management Co., Ltd. Japan
Nissay Asset Management Corporation Japan
Nordea Investment Management Sweden
Norfolk Pension Fund UK
Norges Bank Investment Management (NBIM)Norway
Norinchukin Zenkyouren Asset Management Co., Ltd Japan
North Carolina State Treasurer US
Northern Ireland Local Government Officers’Superannuation Committee (NILGOSC) UK
7
Commentary for the Carbon Disclosure Project
6
With a deal in Copenhagen, however, coupled with appropriate market incentives anddomestic policy signals, I am confident we can enter a new era of green growth, one inwhich lower-carbon energy sources form the foundation of sustained economicdevelopment and prosperity.
Companies and investors that are able to assess risks and seize new opportunities will beahead of the curve in terms of global competitiveness. Conversely, those businesses that failto have a strategy in place to deal with climate change will be on the losing side of history.
In a nutshell, this is why the work of the Carbon Disclosure Project is crucial to the successof global green business in the 21st century. As the recognized standard for detailedcorporate reporting on emissions data and other climate-related disclosure information, theCarbon Disclosure Project is harnessing the power of information and investor activism toencourage a more effective corporate response to climate change.
The Carbon Disclosure Project participants include some 475 institutional investors withcombined assets of US$55 trillion, ranging from pension funds and SRI asset mangers tomainstream blue chip companies.
The Carbon Disclosure Project’s detailed reporting is helping persuade companiesthroughout the world to measure, manage, disclose and ultimately reduce their greenhousegas emissions. No other organization is gathering this type of corporate climate change dataand providing it to the marketplace.
Of course, the value of this kind of detailed climate-related corporate information will continue to grow as countries scale up their efforts to build a greener global economywhile tackling the challenge of emissions reductions.
On that note, I am pleased to highlight the cooperation between the United Nations GlobalCompact, in particular, through its Caring for Climate Initiative, and the Carbon DisclosureProject. Through shared principles and activities, the Global Compact and the CarbonDisclosure Project are expanding the network of corporate leaders committed to takingeffective, urgent action to address what I have called the defining challenge of our age:climate change.
This December in Copenhagen could mark a watershed moment in history. It is the moment where we must transform crisis into opportunity, and set the world on a safer, more prosperous path to green growth.
We must work together to encourage governments to seal a deal in Copenhagen andcatalyze the green economy of the future. The science demands it, the world economyneeds it, and the livelihoods of hundreds of millions of people depend on it.
I am pleased to provide this introduction to the Global 500 report of the Carbon DisclosureProject, an important ally in the effort to combat climate change and strengthen responsiblebusiness practices.
The business and investment community has a critical role to play in this “year of climatechange.” No issue better demonstrates the need for global solidarity than climate change,the defining challenge of our generation. No issue is more essential to our future survival as a species. And no issue is more fundamental to long-term security and sustained globalprosperity. Now more than ever, we need to come together as a global community andexpand our horizons to embrace common solutions to common problems.
As Secretary-General, I believe that with each challenge that arises, new opportunities open if we but have the vision and courage to seize them. Nowhere is this truer than withclimate change.
In December, the world’s governments will meet in Copenhagen to seal the deal on a newclimate framework for the post-2012 period that is equitable, ambitious, and effective inreducing greenhouse gases and providing for the adaptation needs of the most vulnerablepopulations. Sealing a deal in Copenhagen is vital for setting the global economy on agreener, cleaner path to sustained economic prosperity.
Over the next few months, the business and investor communities will play a pivotal role inmobilizing the political will needed to encourage governments to cross over the finish line in Copenhagen. I would encourage the Carbon Disclosure Project, along with other civic and business organizations, to make it clear to governments that doing the right thing forthe climate is also the smart thing for global competitiveness and long-term prosperity.
Indeed, organizations like the Carbon Disclosure Project can make an important difference.Participants in the Carbon Disclosure Project know that the safest way of reducing climaterisks is to reduce emissions. They know that taking early action makes good businesssense. And they know the cost of inaction on climate change will dwarf any price tag foracting today.
We have not a moment to waste. Climate change is now accelerating at a pace and scalethat requires urgent action from the highest levels of government as well as from the privatesector. Now more than ever, we need leadership from savvy CEOs and investors whounderstand that in a climate constrained world, “business as usual” is no longer possible;indeed, is a recipe for financial as well as planetary disaster.
What is needed is a new model of business profitability; one that takes into account the full costs of doing business and incorporates a company’s long-term impact on theenvironment as well as on local communities. We must eschew the tyranny of short-termthinking and ask ourselves if the profits we are reaping today are adding to – or depleting –the planet’s potential to sustain future generations.
Commentary for the Carbon Disclosure ProjectBy UN Secretary-General Ban Ki-moon30 June 2009
Carbon Disclosure Project 2009
9
Executive Summary
8
Introduction
It is often said that a business can onlymanage what it measures. Since 2000,the Carbon Disclosure Project (CDP)has, on behalf of institutional investors,challenged the world’s largestcompanies to measure and report their carbon emissions; integrating thelong-term value and cost of climatechange into their assessment of thefinancial health and future prospects of their business.
In 2009, the Carbon Disclosure Project(CDP) received the highest responserate to date, the highest level ofdisclosed emissions and greater detailthan ever before on the activities beingundertaken by the largest corporationsaround climate change mitigation andadaptation. This is testament to therealization of the need to respond to an increasingly pressing issue.
Since the first CDP report in 2003, the quantity and quality of datadisclosed has advanced significantly: a credit to those investors andcompanies participating in the initiative.In parallel, CDP data is increasinglybeing applied as a catalyst forchanging business behaviour and is becoming more integrated intomainstream financial analysis. Again,this is a notable achievement.
This year, CDP (backed by 475institutional investors representingmore than US$55 trillion of funds undermanagement) sent questionnaires tomore than 3,700 of the world’s largestcorporations requesting information ongreenhouse gas emissions, thepotential risks and opportunities relatedto climate change and strategies formanaging those risks andopportunities. The corporations’responses and reports assessing theresults of these will be published inmore than 20 countries around theworld and are freely available atwww.cdproject.net.
CDP continues to be the global leaderin data that records the businessresponse to climate change; whether it be risks and opportunities, absoluteemissions levels, performance overtime or governance. This report,prepared by CDP’s global adviser,PricewaterhouseCoopers LLP (PwC),analyzes responses from the 500largest corporations in the FTSE GlobalEquity Index Series – the “Global 500”.As of June 2009, the marketcapitalization of these companies was US$15.5 trillion.
CDP 2009 highlights
Response rate up, notwithstandingeconomic downturn in many of theworld’s largest economies
• Following the increase in thenumber of CDP signatories, thestandard of disclosure over the pastseven years since the inception ofCDP has increased dramatically;
• The overall Global 500 responserate for CDP 2009 is 82% (409), up from 77% (383) last year. Thissuggests that, notwithstandingshort term concerns and pressureon senior management time,climate change remains high on the agenda and the value of theCDP exercise endures;
• Responses reveal that a globalagreement in Copenhagen wouldprovide increased certainty for theGlobal 500 looking to set mediumand long term emissions reductiontargets;
• Five countries (France, Germany,Japan, UK and US) out of the 30 countries represented in CDP 2009, account for both 70% ofrespondents and 70% of the totalemissions disclosed (Scopes1 1 and 2);
In 2009, the CarbonDisclosure Project(CDP) received thehighest response rate to date, the highestlevel of disclosedemissions and greaterdetail than ever beforeon the activities beingundertaken by thelargest corporationsaround climate changemitigation andadaptation.
The overall Global 500response rate for CDP2009 is 82% (409), upfrom 77% (383) last year.
The response rate fromthe BRIC countries hasdoubled since 2008 to44% (16 out of 36),including a 100%response rate fromBrazil.
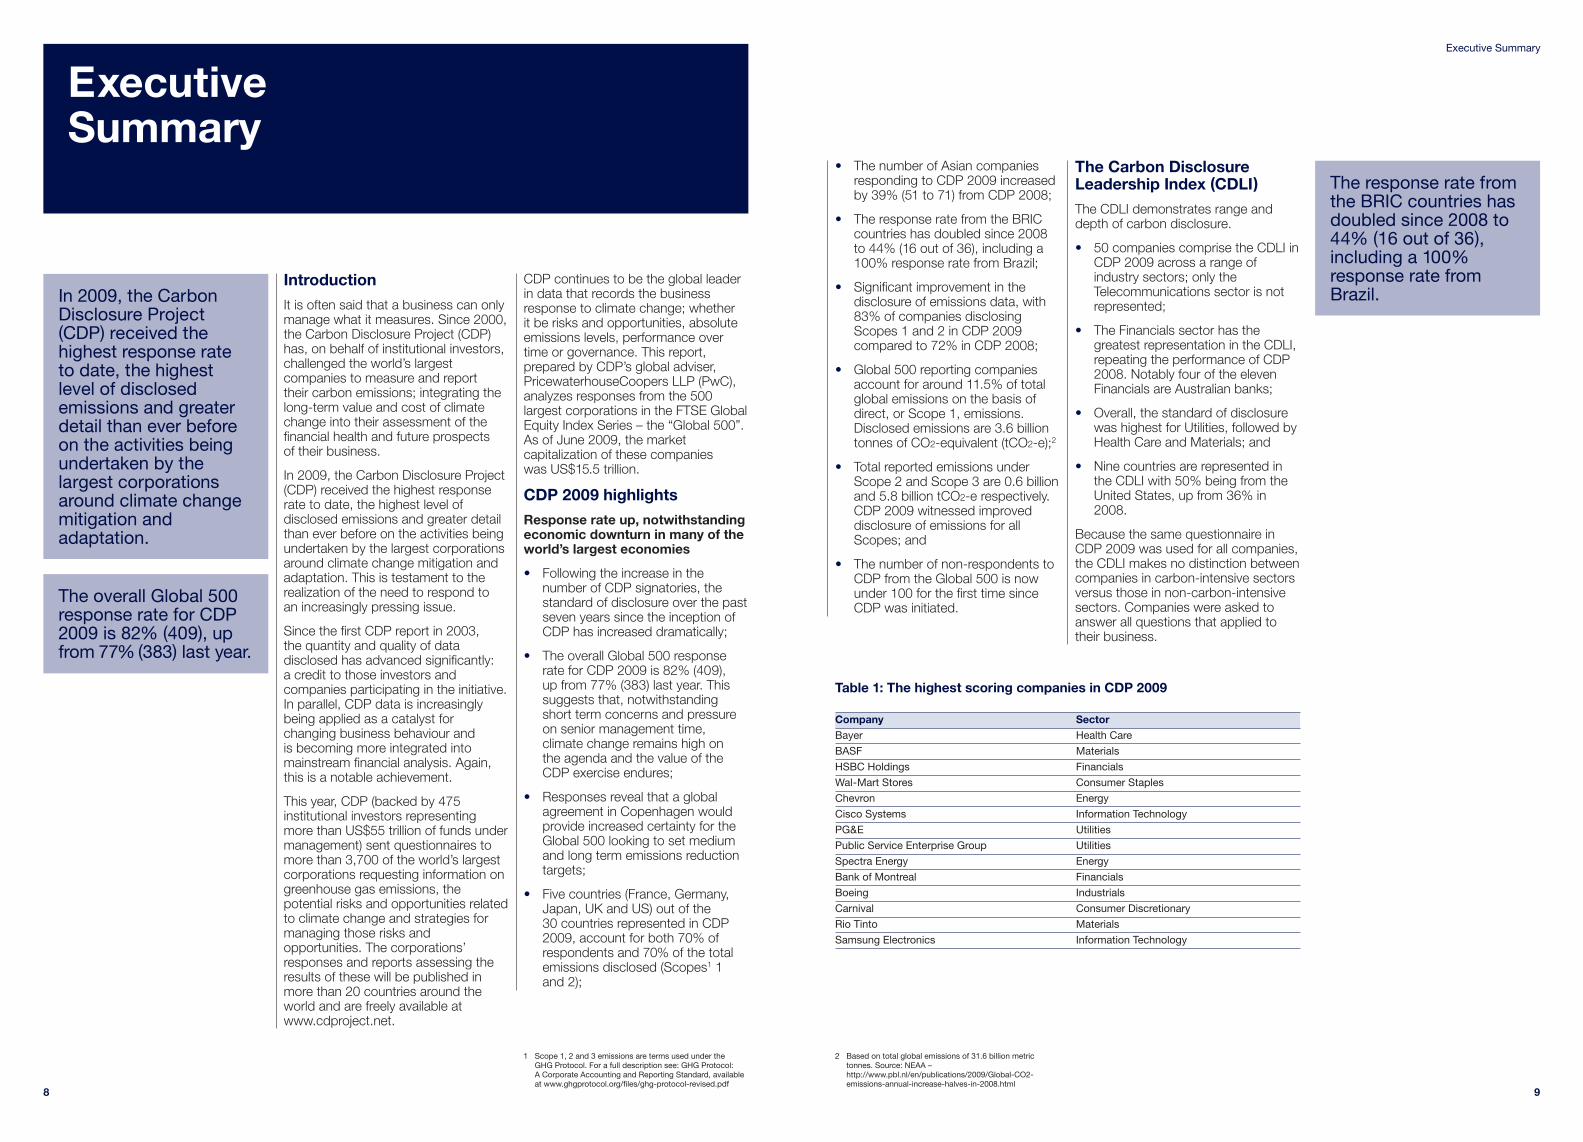
Table 1: The highest scoring companies in CDP 2009
Company SectorBayer Health Care
BASF Materials
HSBC Holdings Financials
Wal-Mart Stores Consumer Staples
Chevron Energy
Cisco Systems Information Technology
PG&E Utilities
Public Service Enterprise Group Utilities
Spectra Energy Energy
Bank of Montreal Financials
Boeing Industrials
Carnival Consumer Discretionary
Rio Tinto Materials
Samsung Electronics Information Technology
ExecutiveSummary
• The number of Asian companiesresponding to CDP 2009 increasedby 39% (51 to 71) from CDP 2008;
• The response rate from the BRICcountries has doubled since 2008to 44% (16 out of 36), including a100% response rate from Brazil;
• Significant improvement in thedisclosure of emissions data, with83% of companies disclosingScopes 1 and 2 in CDP 2009compared to 72% in CDP 2008;
• Global 500 reporting companiesaccount for around 11.5% of totalglobal emissions on the basis ofdirect, or Scope 1, emissions.Disclosed emissions are 3.6 billiontonnes of CO2-equivalent (tCO2-e);2
• Total reported emissions underScope 2 and Scope 3 are 0.6 billionand 5.8 billion tCO2-e respectively.CDP 2009 witnessed improveddisclosure of emissions for allScopes; and
• The number of non-respondents toCDP from the Global 500 is nowunder 100 for the first time sinceCDP was initiated.
The Carbon DisclosureLeadership Index (CDLI)
The CDLI demonstrates range anddepth of carbon disclosure.
• 50 companies comprise the CDLI inCDP 2009 across a range ofindustry sectors; only theTelecommunications sector is notrepresented;
• The Financials sector has thegreatest representation in the CDLI,repeating the performance of CDP2008. Notably four of the elevenFinancials are Australian banks;
• Overall, the standard of disclosurewas highest for Utilities, followed byHealth Care and Materials; and
• Nine countries are represented inthe CDLI with 50% being from theUnited States, up from 36% in2008.
Because the same questionnaire inCDP 2009 was used for all companies,the CDLI makes no distinction betweencompanies in carbon-intensive sectorsversus those in non-carbon-intensivesectors. Companies were asked toanswer all questions that applied totheir business.
1 Scope 1, 2 and 3 emissions are terms used under the GHG Protocol. For a full description see: GHG Protocol: A Corporate Accounting and Reporting Standard, availableat www.ghgprotocol.org/files/ghg-protocol-revised.pdf
2 Based on total global emissions of 31.6 billion metrictonnes. Source: NEAA –http://www.pbl.nl/en/publications/2009/Global-CO2-emissions-annual-increase-halves-in-2008.html
11
Executive Summary
10
Carbon Disclosure Project
Disclosure trends across the Global 500
• The quantity of key datadisclosed shows continuedimprovement in CDP 2009.The key areas of disclosure:emissions; reduction targets;forecasts; verifying emissions andannual reporting are all up from2008. Disclosure of emission figuresshowed the greatest year-on-yearimprovement;
• Identifying risks andopportunities around climatechange is now happening to somedegree in most companies acrossall industries, but Utilities and Energy companies scored highestoverall in this area. Interestingly, theFinancials sector performed on apar with the generally higher scoringmore carbon-intensive sectors andabove the average score for allGlobal 500 respondents. Thissuggests that, although not having a large direct exposure to carbon,the indirect exposure of theFinancials sector to climate changethrough trading, investment andlending operations is significant.Furthermore, respondents from theConsumer Staples, Industrials andInformation Technology sectorsperceived more opportunities fromclimate change than risks – primarily due to the prospects for new products and services;
• Emissions disclosure is also adomain where the more carbon-intensive sectors performedstrongly. Reporting of Scope 1 andScope 2 emissions was generallygood, but disclosure of Scope 3emissions remains consistentlyweak across all sectors. Thissuggests that further guidance onorganizational boundaries andcalculation methods would bevaluable; and
• Governance of climate change at board-level has remained at asimilar level to 2008. Utilities and Materials have the highestproportion of companies withdesignated board-level responsibilityfor climate change. These are alsothe two sectors with the highestdisclosure scores, demonstrating a clear link between high levelengagement and the provision of good quality information.
Insights from theperformance scores pilot
The CDP 2009 scoring methodologyincluded, for the first time, separatescores for performance. Thisperformance score is a pilot initiative to assess the impact of climate changeactions. Performance scores assessactions taken by companies tomanage their response to, and reducetheir contribution to, climate change.The performance score system isintegrated throughout the CDP 2009questionnaire. The exercise reflects the desire of investors to move to asystem that gives greater weight toperformance (cf. simple disclosure)over time. Initial findings for this year include:
• Generally, performance scoresreflect disclosure scoresalthough causality is difficult to establish. Overall the datasuggested a company scoring highfor disclosure is likely to also score high for performance. However, it is noteworthy that only two thirdsof the companies achieving thehighest performance scores alsofeature in the CDLI;
• The Information Technologysector achieved the highestaverage performance scoreoverall, followed by Materials;
• Seven of the top twelvecompanies for performancepoints are European, and fiveNorth American. Europe has thehighest average disclosure andperformance scores of all thegeographical regions within theGlobal 500. In addition, companiescovered by the EU ETS tended toachieve higher scores on bothdisclosure and performance than
others (20% and 25% higherrespectively). This may reflect theorganizational rigour that isimposed by mandatory legislation;and
• Materials and Utilities sectorsare strong performers inengaging positively withpolicymakers in regular dialogueat a global and national level. This reflects a willingness in thesecarbon-intensive sectors to devoteresource to an area where there isconsiderable value at risk.
Incorporating performance assessmentinto CDP 2009 has been a positivestep; it has provided distinctionbetween observing and rewardinggood reporting versus positive actionto mitigate climate change. It is likelythat a performance score componentwill be integrated into the CDLI leaguetable in the near future.
Conclusion
The depth and standard of responsesfrom the world’s largest companies to the latest CDP questionnaire is ameasure of shareholder and corporateengagement on the issue of climatechange. The responses demonstratethe many positive steps that have beentaken by Global 500 companies overthe past year. Climate change isbecoming an increasingly importantissue for the majority of largebusinesses and companies are keen to share information on their carbonperformance and climate risks andopportunities with investors and other stakeholders.
Over the coming months, policymakersand negotiators from around the worldwill be working hard, trying to agree anew global deal on climate change. It is essential that the voice of businessand investors is heard clearly in thesenegotiations. The corporate sector hasa crucial role to play in addressingclimate change through investmentand innovation. CDP 2009 hasdemonstrated clearly that the Global500 are ready for this challenge.
CDP2003 CDP2004 CDP2005 CDP2006 CDP2007 CDP2008 CDP2009
Num
ber
of r
esp
onse
s
CO
2 em
issi
ons
(bill
ion
met
ric t
onne
s)
CDP Report Name
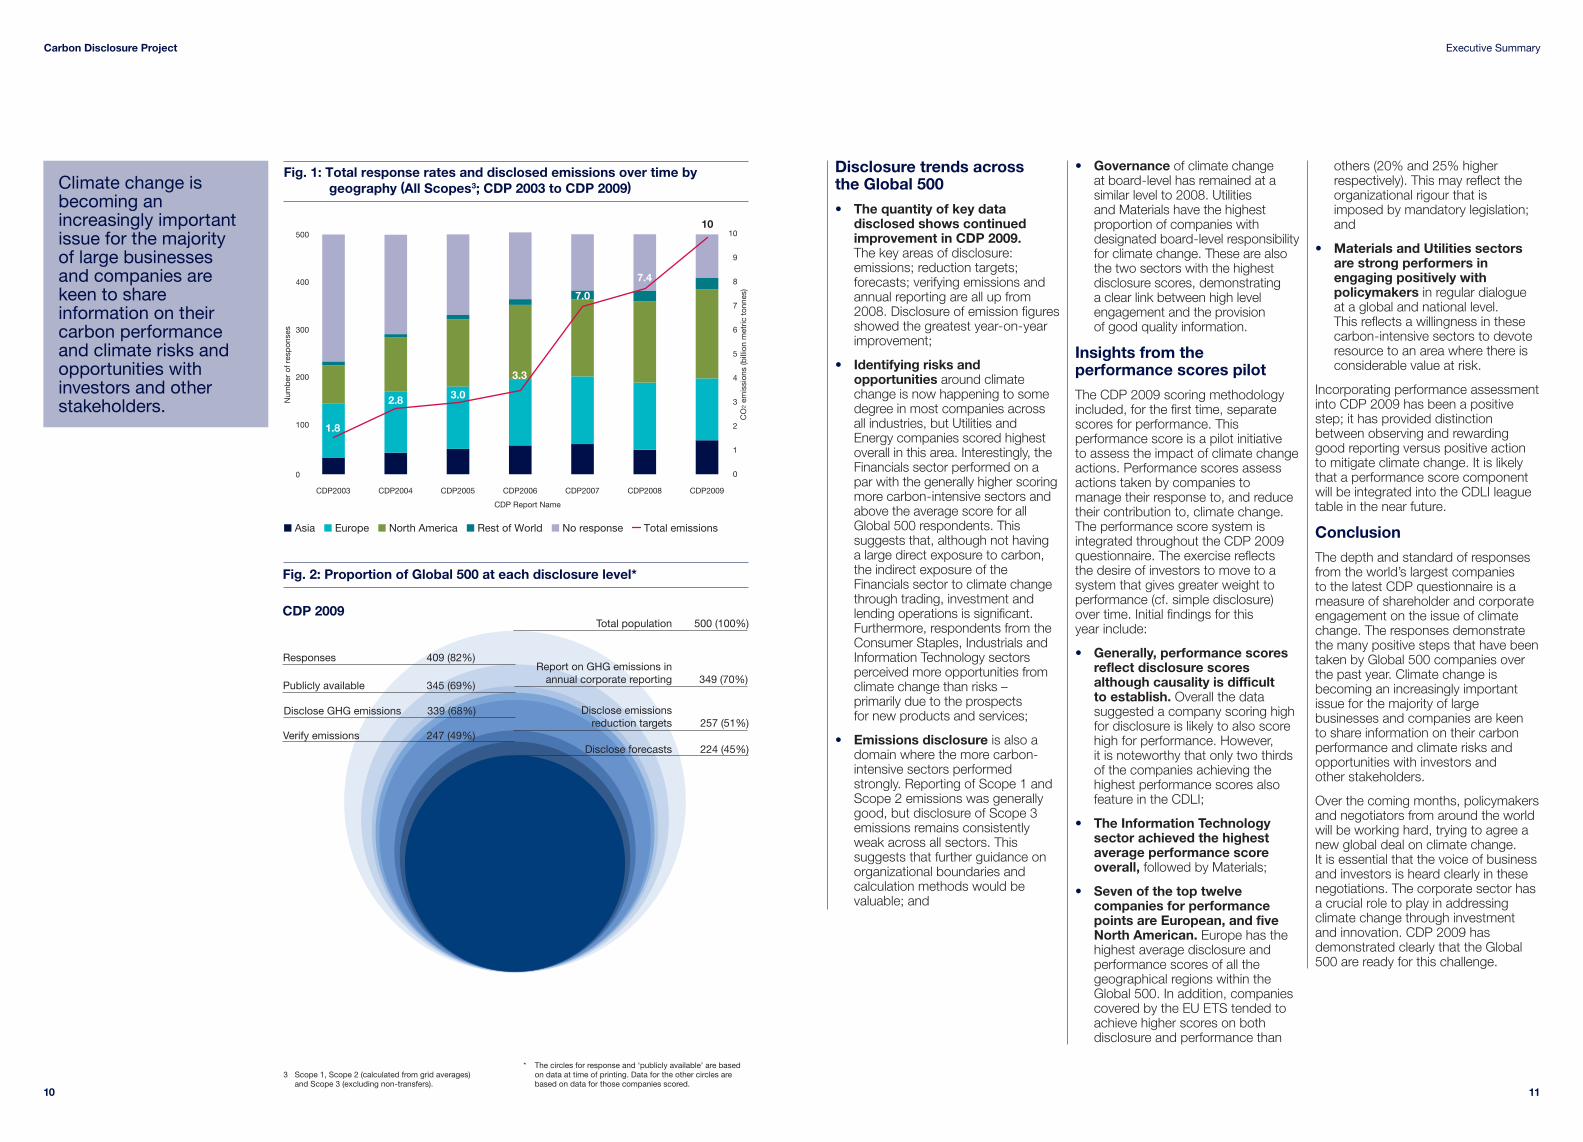
Fig. 1: Total response rates and disclosed emissions over time by geography (All Scopes3; CDP 2003 to CDP 2009)
■ Asia ■ Europe ■ North America ■ Rest of World ■ No response Total emissions
0
100
200
300
400
500 10
9
8
7
6
5
4
3
2
1
0
1.8
2.8 3.0
3.3
7.0
7.4
10
Fig. 2: Proportion of Global 500 at each disclosure level*
500 (100%)
257 (51%)
349 (70%)
224 (45%)
Responses 409 (82%)
Verify emissions 247 (49%)
Publicly available 345 (69%)
Disclose GHG emissions 339 (68%)
CDP 2009
Report on GHG emissions inannual corporate reporting
Total population
Disclose emissionsreduction targets
Disclose forecasts
3 Scope 1, Scope 2 (calculated from grid averages) and Scope 3 (excluding non-transfers).
* The circles for response and ‘publicly available’ are basedon data at time of printing. Data for the other circles arebased on data for those companies scored.
Climate change isbecoming anincreasingly importantissue for the majority of large businesses and companies arekeen to shareinformation on theircarbon performanceand climate risks andopportunities withinvestors and otherstakeholders.
1312
The turmoil in the financial markets and the global economy over the lastyear has highlighted the importance of effective disclosure and high-qualityrisk management. The financial crisis of2008 suggests we need to betterunderstand systemic risks that cancause significant de-stabilizing impactsin the global economy. Climate changehas the potential to cause disruption inthe form of unforeseen, high-impactevents (such as extreme weather) aswell as a longer term re-assignment of value across countries, industriesand corporations.
The Intergovernmental Panel onClimate Change (IPCC) predicts that‘future climate impacts show that theconsequences could vary fromdisruptive to catastrophic’4. So it is vitalthat policy makers, companies andinvestors have a full understanding ofthe associated risks and opportunities.According to HSBC research5,governments around the world haveallocated US$430 billion in fiscalstimulus to key climate change themes.Those providing the low carbonsolutions are very well positioned tobenefit, while those who ignore therisks gamble on being left behind.
By convening the collective power ofthe investment community, representedin 2009 by more than 475 investors,with US$55 trillion in assets undermanagement, CDP motivates morethan 1800 companies globally to reporttheir climate change strategies andgreenhouse gas emissions. This globalsystem provides the market, investors,policy makers and procurementdirectors with a clear understanding ofhow companies are positioned as wemove towards a low carbon economyand ensures corporations provide fulltransparency on climate change.
This year has seen considerablegrowth in responses from emergingeconomies such as China, South Africaand Korea, and CDP expanded inRussia in 2009 where major companiessuch as Gazprom and Novatekreported. CDP’s reach continues togrow with the launch of the first CDPEurope report, covering the largest 300European listed companies, as well asexpansion into countries within Centraland Eastern Europe. We have alsoopened new offices in Germany andBrazil, both key economies in the fightagainst climate change.
While the quantity and quality of dataavailable has increased significantly, so has the use of the data, which isacting as a catalyst for changingbusiness behavior. CDP data isincreasingly being integrated intomainstream financial analysis, isavailable through BloombergProfessional Services, and used toprovide sector based analysis to CDPsignatory members. A recent reportproduced by Mercer supports this view.
Some CDP signatories, such asCalSTRS are going a step further, using shareholder resolutions toencourage companies to reportthrough CDP and implement climatechange management strategies. Weare also working with the Principles of Responsible Investment (PRI) todrive awareness and improve climatechange reporting. CDP has recentlyentered a new partnership withfinancial information services companyMarkit to build a suite of indices basedon the Carbon Disclosure LeadershipIndex, which will be licensed toexchange-traded fund (ETF) andstructured product providers.
CDP now works with more than 55organizations including Dell, Unilever,Wal-Mart Stores and the BritishGovernment to measure and assessclimate change risk and opportunitythrough the supply chain. More than800 companies report their climatechange strategies through the CDPsystem to their customers and as aresult we have seen a significantincrease in the use of CDP data inprocurement operations. Nowprocurement professionals canunderstand how their supply chainsmay be impacted and as a result beginto future-proof their procurementsystems against climate change.
The process of measuring emissions iscentral to emissions management andreduction. As regulatory frameworksdevelop to mandate emissionreductions, CDP’s role will expand. Wewill continue to work with corporations,policy makers and information users toproduce practical and robust resultsthat complement the development ofmandatory reporting rules.
In order to continue to provide theglobal hub for carbon reporting, CDP is currently undergoing a significantsystems upgrade, designed to improve data comparability, facilitatebenchmarking services and ultimatelydeliver data that is appropriate forinvestment analysis and regulatorysubmissions. In countries like the USand UK, where mandatory carbonreporting is on the horizon, CDP’ssystems will help companies prepare forsuch requirements and will eventuallyintegrate with existing national registriesto enable corporations to disclose moredetailed and standardized data. Climatechange is a global problem, whichrequires a global solution and bybridging the gaps between nationalgovernments and internationalbusinesses across the globe, CDP will help to connect the national andinternational climate change ecosystem.
1 Overview of CDP
4 http://unfccc.int/essential_background/feeling_the_heat/items/2905.php
5 HSBC Global Research: A Climate for Recovery The colourof stimulus goes green.
CDP Signatories 2009 2
Commentary for the Carbon 5Disclosure ProjectUN Secretary-General Ban Ki-moon
Executive Summary 8
1 Overview of CDP 13
2 The Global 500 Carbon 17Disclosure Leadership Index 2009
3 An overview of 20the Global 500
What does your reporting say 24about your organization Alan McGill, PwC Partner,Sustainability and Climate Change
4 Geographic overview 25
5 CDP performance 27scores – pilot exercise 2009
6 Industry overview 31
7 Appendix 1 35
Summary table of companyresponse status, scores andemissions
8 Appendix 2 49
Glossary of terms
Contents

15
1 Overview of CDP
14
Carbon Disclosure Project
Highlights in carbonregulation and outlook for Copenhagen
2009 has witnessed significantprogress in the global approach toclimate change. The Obamaadministration has introduced a newera in climate change policy in the USand, as a result, a global deal inCopenhagen this December appearsmore tangible. China, so integral to thesuccess of Copenhagen, is set to meetambitious renewable energy andenergy efficiency targets and hostssome of the world’s largest renewableenergy companies. Brazil entered thenew year with a new National Plan onClimate Change and nationalgovernments in industrialized countriesincluding Japan and Australia areintroducing new legislation to reduceemissions.
Whilst the July G8 meeting agreed toprevent global temperatures risingbeyond 2º Celsius (3º-4º Fahrenheit)against pre-industrial levels, andagreed on aims to cut greenhouse gasemissions by between 50 and 80% bymid-century they disappointed manyby ducking the issue of medium termtargets. Although the multilateralarchitecture still needs work, there ismuch to report on at a regional level.
In Europe, the Energy and ClimateChange package was approved inDecember 2008 which sets out thepolicy framework and accompanyingmeasures to reduce emissions throughthe continuation (and expansion) of theEU Emissions Trading Scheme (EU-ETS); targets for non-ETS sectors andnew targets for the promotion ofrenewable energy.
In the US, the Obama administrationmoved early to set out its ambitionsaround climate change mitigation: “We will harness the sun and the winds and the soil to fuel our cars and run our factories.”10
The Waxman-Markey bill was finally putbefore the House of Representatives inJune and passed by a narrow margin.The proposed legislation would committhe US to reduce greenhouse gasemissions by 17% below 2005 levelsby 2020 through a cap-and-trade
system beginning in 2012. The bill willpass through various SenateCommittees where amendments willbe debated, before being put to a vote;most likely in October.
In Australia, further work hasprogressed on the detail of the CarbonPollution Reduction Scheme (CPRS)despite political challenges overpossible competitive impacts in theface of the economic downturn. TheScheme, which would cover around75% of total Australian emissions, isdue to face a key vote later this year.
Given the multinational nature of manycompanies, the evolution of thesepolicies is likely to have significantimplications on strategic direction andoperations and many of the world'slargest companies want to seize earlymover advantage.
Of course, the role of government iscrucial in providing the regulatoryframeworks. But investors andbusinesses will also play an essentialrole by driving capital flows towards thetechnologies which will allow economiesto flourish and innovation to thrive as wetransition to a low carbon economy.
Already these same investors andbusinesses are being directly affectedby climate change. Many companiesreport to CDP the material impacts ofclimate change on their operations,through increased flooding, watershortage, spread of disease andchanging local weather patterns.Within the public sector, cities reportingthrough CDP also explain how they areplanning to adapt to changes inweather patterns such as extreme heatand extreme precipitation.
Investors, policy makers, procurementdirectors and other stakeholders needto build up the necessary comparabledatasets in order to monitor andanalyze changes; both in terms of theresponse to mitigation measures (suchas carbon regulation) and adaptationpolicies and programmes. Integral tothe success of the deal in Copenhagenwill be the availability of this accuratereported data: if businesses don’tmeasure current emissions now, it willbe impossible for them to manage andreduce them in the future. This is whereCDP’s role is crucial.
Progress on reportingstandards
While CDP has set the tone on mattersof disclosure over the years and, for thefirst time this year, is now widening itsapproach to encompass performance,there are other valuable andcomplementary initiatives underway to address the clear requirement for the creation of a global carbonmeasurement and reporting system.
While the financial accounting systemhas taken several hundred years todevelop, carbon accounting is in itsinfancy. In order to achieve a coherentglobal system CDP is leading the workof the Climate Disclosure StandardsBoard (CDSB), working with Deloitte,Ernst & Young, KPMG andPricewaterhouseCoopers todevelop robust accounting standardsto enable carbon reporting throughannual financial reports. CDP andCDSB will also work with the WorldEconomic Forum to advise the G20group of nations on climate changeaccounting in 2010.
The CDP process demonstrates thatcorporations can lead the way in takingaction that can be Measured, Reported& Verified (MRV). It also shows howinternational companies can reducetheir emissions across the entirety oftheir operations on a global basis, evenwhen subject to a range of differentregulatory requirements. As more andmore countries introduce climatechange regulation, the CDP systemsupports companies by bridging thegap between international businessand national reporting requirementsand helps reduce the reporting burdenon companies.
The CDP Global launch marks theopening event of NY Climate Week,when business leaders, heads of stateand the world’s major investorscongregate in New York to prepare fornegotiations at COP15. An agreementthere will be a vital step towardssuccess, but it is just as important tolook beyond Copenhagen and to buildthe global systems required to combatdangerous climate change. CDPremains focused on and dedicated to this work and thanks all of theorganizations that work with us to help realize this goal.
10 Obama inauguration speech, January 21st, 2009.
Asia-ex JICK 1009 31 [35] 76 55 76 66 55 66 69 31 17 59 62
Australia 200 52 48 80 79 81 82 56 81 83 46 50 67 73
Brazil 80 76 [83] 49 61 73 73 53 61 55 22 25 61 49
Canada 200 49 55 70 57 68 56 46 81 76 27 34 49 61
Central & Eastern Europe 100 8 - 75 50 50 75 25 75 25 75 50 100 50
China 100 10 5 56 67 78 67 44 22 22 22 11 67 44
Europe 300 82 - 85 80 90 75 63 91 85 77 58 89 79
France 120 58 63 77 69 84 66 61 79 77 63 47 81 66
Germany 200 51 55 65 58 70 44 47 63 57 45 33 63 55
Global 500 81 77 80 78 84 78 63 85 80 63 54 80 74
Global Electric Utility 250 49 52 71 79 84 75 62 81 50 61 57 60 77
Global Transport 100 67 58 84 81 84 79 50 79 68 50 43 72 74
India 200 18 19 52 14 66 62 48 48 48 17 17 55 38
Ireland 45 33 - 71 71 71 64 43 71 50 50 43 57 43
Italy 60 35 [46] 52 67 86 67 48 81 62 71 33 67 57
Japan 500 37 [72] 85 87 83 80 64 77 72 33 90 49 49
Korea 100 50 [32] 61 67 76 69 57 55 55 33 35 63 55
Latin America 50 50 [52] 58 79 79 58 47 79 68 37 26 47 58
Netherlands 50 62 52 97 74 90 65 61 90 90 58 42 81 71
New Zealand 50 52 50 65 69 77 69 65 58 54 35 27 58 54
Nordic 200 65 [58] 77 76 81 63 54 83 77 46 33 78 59
Portugal 20 38 - 75 88 75 88 63 100 88 88 25 63 75
Russia 50 13 - 33 0 33 33 33 33 33 0 33 33 33
South Africa 100 68 58 86 73 86 89 68 83 86 38 33 68 65
Spain 85 41 [71] 80 66 77 63 54 91 83 86 34 80 74
Switzerland 100 56 57 74 44 72 48 48 72 67 35 19 65 43
UK FTSE 100 95 90 83 89 91 83 66 98 95 73 77 88 79
UK FTSE 250 57 58 79 78 76 72 53 81 80 36 43 61 49
US S&P 500 66 64 68 70 77 70 52 77 74 41 31 65 61
Table 2: Key trends snapshot6
This table outlines some of the key findings from CDP 2009 by geography and industry data-set.7
6 The numbers in this table are based on the totalrespondents at 10th July 2009. They may therefore varyfrom numbers in the rest of the report which are based on the number of companies who responded on time (e.g. 30th June for Global 500).
7 In some cases, the number of responses analyzed is slightlyless than the number answering CDP 2009 due totakeovers, mergers and acquisitions.
8 Percentages in square brackets reflect a different sizedsample in 2008, e.g.: in 2008 we wrote to 75 companies inBrazil, not 80; and in Japan we wrote to 150 companies in2008, not 500.
9 Asia excluding Japan, India, China and Korea.
% o
f sa
mp
le a
nsw
erin
g C
DP
6 (2
008)
8
% o
f sa
mp
le a
nsw
erin
g C
DP
200
9
% o
f re
spo
nder
s w
ith
Bo
ard
leve
lre
spo
nsib
ility
fo
r cl
imat
e ch
ang
e
% o
f re
spo
nder
s se
eing
re
gul
ato
ry r
isks
% o
f re
spo
nder
s se
eing
reg
ulat
ory
op
po
rtun
itie
s
% o
f re
spo
nder
s se
eing
phy
sica
l ris
k
% o
f re
spo
nder
s se
eing
phy
sica
lo
pp
ort
unit
ies
% o
f re
spo
nder
s d
iscl
osi
ng
Sco
pe
1 em
issi
ons
% o
f re
spo
nder
s d
iscl
osi
ng
Sco
pe
2 em
issi
ons
% o
f re
spo
nder
s ex
tern
ally
ver
ifyin
gem
issi
ons
dis
clo
sure
s
% o
f re
spo
nder
s en
gag
ed/c
ons
ider
ing
par
tici
pat
ion
in e
mis
sio
ns t
rad
ing
% o
f re
spo
nder
s w
ith
an e
mis
sio
nsre
duc
tio
n/en
erg
y re
duc
tio
n p
lan
% o
f re
spo
nder
s en
gag
ing
wit
h p
olic
ym
aker
s o
n cl
imat
e ch
ang
e
Sample: geography/number of companies
Layout of the printed report & online PDF documents
For 2009 the layout of this CDP reporthas been revised to deliver moredirectly and concisely, the mostrelevant information to the rightaudience. The printed report has beenreduced in length to provide anaccessible summary of the results ofthe 2009 questionnaire, as well as toreduce paper consumption.
To give greater consistency andtransparency to the industry sectorgroupings for 2009 the reports followthe Global Industry ClassificationStandard (GICS) and its 10 top-levelindustry sectors. For each of the 10sectors a focussed industry report has been produced and these areavailable online in PDF format atwww.cdproject.net. These industryreports covering the Global 500 dataalso include commentary and analysisof the S&P 500 and FTSE 350populations. This is to provide thereader with a greater level of detail andinsight. The location of each area ofanalysis is listed below:
Global 500 printed report
• The CDLI
• Overview of the Global 500
• A geographical overview
• Analysis of the performance scorespilot exercise
• An industry overview
• Table of companies, scores anddisclosed emissions – arrangedalphabetically
Additional sections in online PDF version (www.cdproject.net)
Industry reports covering the Global500, S&P 500 and FTSE 350populations.
• Consumer Discretionary – includingautomotive and retail
• Consumer Staples – including foodand beverage
• Energy – including oil and gas(upstream)
• Financials – including banks,insurers and real estate
• Health Care – includingpharmaceuticals and health careproviders
• Industrials – including aerospaceand defence, manufacturing andconstruction
• Information Technology
• Materials – including mining, metals,forestry and chemicals
• Telecommunications
• Utilities – including electricity, waterand gas (downstream)
CDP 2009 Questionnaire
CDP 2009 International Partner Information
1716
2 The Global 500Carbon DisclosureLeadership Index 2009
All companies in the Global 500 thatresponded on time to CDP in 2009have been scored on the quality oftheir disclosure using a standardized,transparent methodology; seewww.cdproject.net. The CarbonDisclosure Leadership Index (CDLI)includes the companies with thehighest scores and provides a valuableperspective on the range and standardof responses to CDP’s questionnaire.In contrast to CDP 2008, this year’sCDLI makes no distinction betweencompanies in carbon-intensive or non-carbon-intensive sectors.
This year’s CDLI includes the topscoring 10% of the Global 500: 50companies in total. In order to aidcomparison between companies, theCDLI table also includes information onthe three emission Scopes and carbonintensity (relative to $m revenue) toprovide a fuller picture of the emissionsprofile of each of the leaders.
The relevance and meaning of theCDLI can be summarized as follows:
• It is based entirely on the disclosureinformation provided in thecompany’s CDP response;
• It suggests good internal datamanagement and understanding ofthe issues climate change presentsto the company’s business;
• It does not consider other effortsundertaken by companies toprovide carbon or widersustainability disclosure such ascorporate responsibility reporting,environmental statements in annualreports, or through meetings andengagement with stakeholders andpolicymakers; and
• It is not a complete metric of acompany’s performance in relationto climate change management, as it does not currently make anyjudgement over absolute levels ofemissions, emission reductionachievements, or carbon intensity.
An introduction to this year’s CDLI
Combined CDLI table for 2009 –what this means and why it has changed
The CDLI continues to be based ondisclosure and companies are rankedby their disclosure score alone.Although a section on performancescores11 was included in this year’sCDLI methodology, it was not takeninto account in compiling the CDLI forthis year. However, performance scoresare likely to become integrated intoCDLI scoring in the near future.
Eligibility for inclusion in the CDLI in2009 depended on the followingconditions being satisfied:
• The company must score in thehighest 10% of companies overall(across all industries);
• The response must be publiclyavailable; and
• The response must have beensubmitted using CDP’s OnlineResponse System.
The single table, combining thoseindustries previously split and definedas carbon-intensive and non-carbon-intensive12, follows CDP’s transition toa ‘parity of sectors’ approach for 2009.The rationale behind the transition isthat, as the wide-ranging implicationsof climate change become clearer forcompanies and all sectors develop aresponse, there is a less cleardistinction between disclosureexpectations of companies in differentsectors. Hence, during CDP 2009,questions were scored on the samebasis for all companies and all sectors.
Furthermore, this year’s scoringmethodology took into account thatsome questions apply to allcompanies, whereas the applicability of other questions depends on theresponding company’s individualbusiness circumstances. The CDLIscoring methodology should notpenalize companies who are unable to respond to a question if it is notrelevant to their business.
The transition to parity of sectors inCDP 2009 means that somecompanies in non-carbon-intensivesectors may have received a loweroverall score (in absolute terms) thanthey did in CDP 2008, notwithstandingthat the standard of their response mayhave improved or remained the same.This is because the total availablescore against which the companies innon-carbon-intensive sectors havebeen assessed in CDP 2009 is greaterthan the total available score that wasavailable for ‘comprehensive’ questionsin CDP 2008.
However, it is important to note thatalthough absolute scores may differ,the transition should have little effecton companies’ relative performancewithin their respective sectors. ThoseCDLI companies classified as non-carbon-intensive in 2008, which alsofeature in this year’s CDLI, have seenan average score decrease of 13%.For the responding Global 500population overall, the sectors classedas non-carbon-intensive in 200813 andthose equivalent sectors in 200914 haveseen an average fall in scores of 17%.
11 The performance score is a CDP pilot initiative to assessactions taken by companies to manage their response to,and reduce their contribution to, climate change. Thisperformance score is separate and distinct from thedisclosure score and has no current impact on the CDLI.See the Performance chapter for a complete discussion of this pilot.
12 CDP 2008 distinguished between disclosure expectationsof companies in different sectors, in particular betweenthose classified as carbon-intensive and non-carbon-intensive.
13 Non-carbon-intensive sectors in CDP 2008: FinancialServices; Hospitality, Leisure and Business Services; Retail & Consumer; and Technology, Media andTelecommunications.
14 Equivalent non-carbon-intensive sectors in CDP 2009:Consumer Staples, Consumer Discretionary, FinancialServices, Information Technology and Telecommunications.
All public responsesfrom companies to CDP are available todownload fromwww.cdproject.net
Carbon Disclosure Project
Summary observations on theconstituents of the CDLI
• Nine of the ten industry sectors arerepresented in the CDLI with onlyTelecommunications being absentthis year. This shows that there areclear and, in some cases,consistent leaders across mostareas of business;
• The Financials sector has the mostcompanies (11) in the CDLI.Notably, there are four Australianbanks and just two US companies(in real estate and insurance)represented – perhaps reflecting theimpact of the recent downturn onthe carbon reporting in US banks;
• Nine countries are represented inthe CDLI, with four (Australia,Germany, UK and the US)represented by at least fivecompanies – possibly reflecting theincreasing driver of carbon reportingregulation in these countries;
• Companies from the US make up 50% of the CDLI; a marked rise in the standard of carbon disclosure over the last year. Thisdemonstrates that US corporationsare taking climate change seriouslyand may also reflect the increasedregulatory activity at both a stateand federal level as well as movesby the Securities and ExchangeCommission (SEC) to considerwhether corporations shoulddisclose climate risks; and
• One Asian company, SamsungElectronics, is in the CDLI –showing that companies can leadon the agenda even if domesticregulation may still be underdevelopment.
The analysis of responses and CDLIscores in 2009 suggest that the mainreasons for significant changes to theCDLI constituents compared to lastyear can be attributed to:
• The CDLI having a smaller totalnumber of companies in 2009 (50 compared to 6715 in 2008);
• A few responses indicate that some companies have reducedresourcing and funding of carbonreporting teams as a result of theeconomic downturn;
• Non-carbon-intensive companyscores having reduced as a result of the expectation that they shouldanswer all questions rather than justthe ‘minimum standard’ questionsas in 2008;
• The CDP 2009 questionnaire askingfor greater detail in a number ofareas;
• The CDP 2009 methodology beingmore tailored and flexible to thecircumstances of differentbusinesses and companiesreceiving recognition on this basis;and
• The CDP 2009 methodologyrewarding companies more forproviding specific information thatanswers the question and informsinvestors, rather than for a high levelof general detail.
A high score in the CDLI reflects acompany’s ability to manage andreport on carbon and climate change inrelation to their business. This ability isdriven by the company’s own voluntaryefforts but also the regulatory, physicaland commercial environment in whichit operates. It is worth highlighting,therefore, the highest scoringcompanies in countries not covered by the regulatory driver of the KyotoProtocol. The five highest scoringcompanies based in non-Annex 1countries are: Samsung Electronics(South Korea), Vale (Brazil), Anglo Platinum (South Africa), TaiwanSemiconductor Manufacturing(Taiwan) and Sasol (South Africa).
Regulatory, physical and commercialdrivers are key factors in responselevels, CDLI scores and high‘performance’ scores in CDP. Howthese factors are reflected in responsesand how they influence scores will beinvestigated in the following chapters.
1918
Carbon Disclosure Project
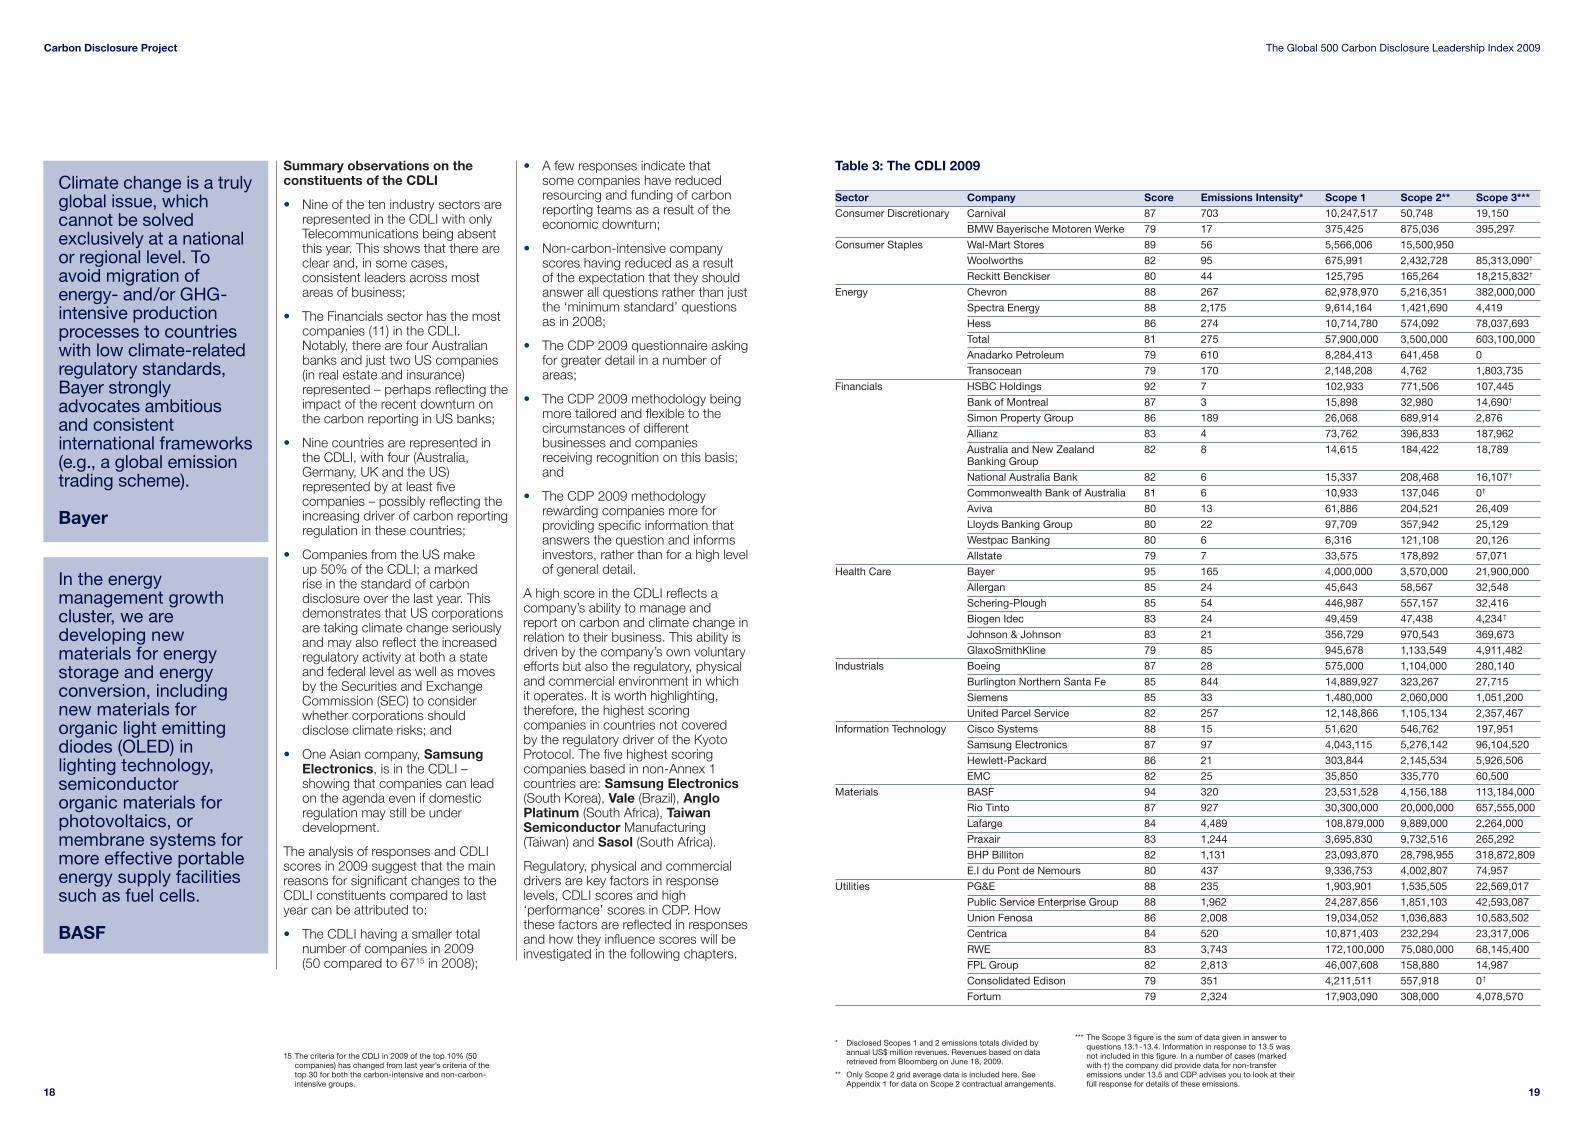
Table 3: The CDLI 2009
Sector Company Score Emissions Intensity* Scope 1 Scope 2** Scope 3***Consumer Discretionary Carnival 87 703 10,247,517 50,748 19,150
BMW Bayerische Motoren Werke 79 17 375,425 875,036 395,297
Consumer Staples Wal-Mart Stores 89 56 5,566,006 15,500,950
Woolworths 82 95 675,991 2,432,728 85,313,090†
Reckitt Benckiser 80 44 125,795 165,264 18,215,832†
Energy Chevron 88 267 62,978,970 5,216,351 382,000,000
Spectra Energy 88 2,175 9,614,164 1,421,690 4,419
Hess 86 274 10,714,780 574,092 78,037,693
Total 81 275 57,900,000 3,500,000 603,100,000
Anadarko Petroleum 79 610 8,284,413 641,458 0
Transocean 79 170 2,148,208 4,762 1,803,735
Financials HSBC Holdings 92 7 102,933 771,506 107,445
Bank of Montreal 87 3 15,898 32,980 14,690†
Simon Property Group 86 189 26,068 689,914 2,876
Allianz 83 4 73,762 396,833 187,962
Australia and New Zealand 82 8 14,615 184,422 18,789Banking Group
National Australia Bank 82 6 15,337 208,468 16,107†
Commonwealth Bank of Australia 81 6 10,933 137,046 0†
Aviva 80 13 61,886 204,521 26,409
Lloyds Banking Group 80 22 97,709 357,942 25,129
Westpac Banking 80 6 6,316 121,108 20,126
Allstate 79 7 33,575 178,892 57,071
Health Care Bayer 95 165 4,000,000 3,570,000 21,900,000
Allergan 85 24 45,643 58,567 32,548
Schering-Plough 85 54 446,987 557,157 32,416
Biogen Idec 83 24 49,459 47,438 4,234†
Johnson & Johnson 83 21 356,729 970,543 369,673
GlaxoSmithKline 79 85 945,678 1,133,549 4,911,482
Industrials Boeing 87 28 575,000 1,104,000 280,140
Burlington Northern Santa Fe 85 844 14,889,927 323,267 27,715
Siemens 85 33 1,480,000 2,060,000 1,051,200
United Parcel Service 82 257 12,148,866 1,105,134 2,357,467
Information Technology Cisco Systems 88 15 51,620 546,762 197,951
Samsung Electronics 87 97 4,043,115 5,276,142 96,104,520
Hewlett-Packard 86 21 303,844 2,145,534 5,926,506
EMC 82 25 35,850 335,770 60,500
Materials BASF 94 320 23,531,528 4,156,188 113,184,000
Rio Tinto 87 927 30,300,000 20,000,000 657,555,000
Lafarge 84 4,489 108,879,000 9,889,000 2,264,000
Praxair 83 1,244 3,695,830 9,732,516 265,292
BHP Billiton 82 1,131 23,093,870 28,798,955 318,872,809
E.I du Pont de Nemours 80 437 9,336,753 4,002,807 74,957
Utilities PG&E 88 235 1,903,901 1,535,505 22,569,017
Public Service Enterprise Group 88 1,962 24,287,856 1,851,103 42,593,087
Union Fenosa 86 2,008 19,034,052 1,036,883 10,583,502
Centrica 84 520 10,871,403 232,294 23,317,006
RWE 83 3,743 172,100,000 75,080,000 68,145,400
FPL Group 82 2,813 46,007,608 158,880 14,987
Consolidated Edison 79 351 4,211,511 557,918 0†
Fortum 79 2,324 17,903,090 308,000 4,078,570
The Global 500 Carbon Disclosure Leadership Index 2009
Climate change is a trulyglobal issue, whichcannot be solvedexclusively at a nationalor regional level. Toavoid migration ofenergy- and/or GHG-intensive productionprocesses to countrieswith low climate-relatedregulatory standards,Bayer stronglyadvocates ambitiousand consistentinternational frameworks(e.g., a global emissiontrading scheme).
Bayer
In the energymanagement growthcluster, we aredeveloping newmaterials for energystorage and energyconversion, includingnew materials fororganic light emittingdiodes (OLED) inlighting technology,semiconductor organic materials forphotovoltaics, ormembrane systems formore effective portableenergy supply facilitiessuch as fuel cells.
BASF
15 The criteria for the CDLI in 2009 of the top 10% (50companies) has changed from last year’s criteria of the top 30 for both the carbon-intensive and non-carbon-intensive groups.
* Disclosed Scopes 1 and 2 emissions totals divided byannual US$ million revenues. Revenues based on dataretrieved from Bloomberg on June 18, 2009.
** Only Scope 2 grid average data is included here. SeeAppendix 1 for data on Scope 2 contractual arrangements.
*** The Scope 3 figure is the sum of data given in answer toquestions 13.1-13.4. Information in response to 13.5 wasnot included in this figure. In a number of cases (markedwith †) the company did provide data for non-transferemissions under 13.5 and CDP advises you to look at theirfull response for details of these emissions.
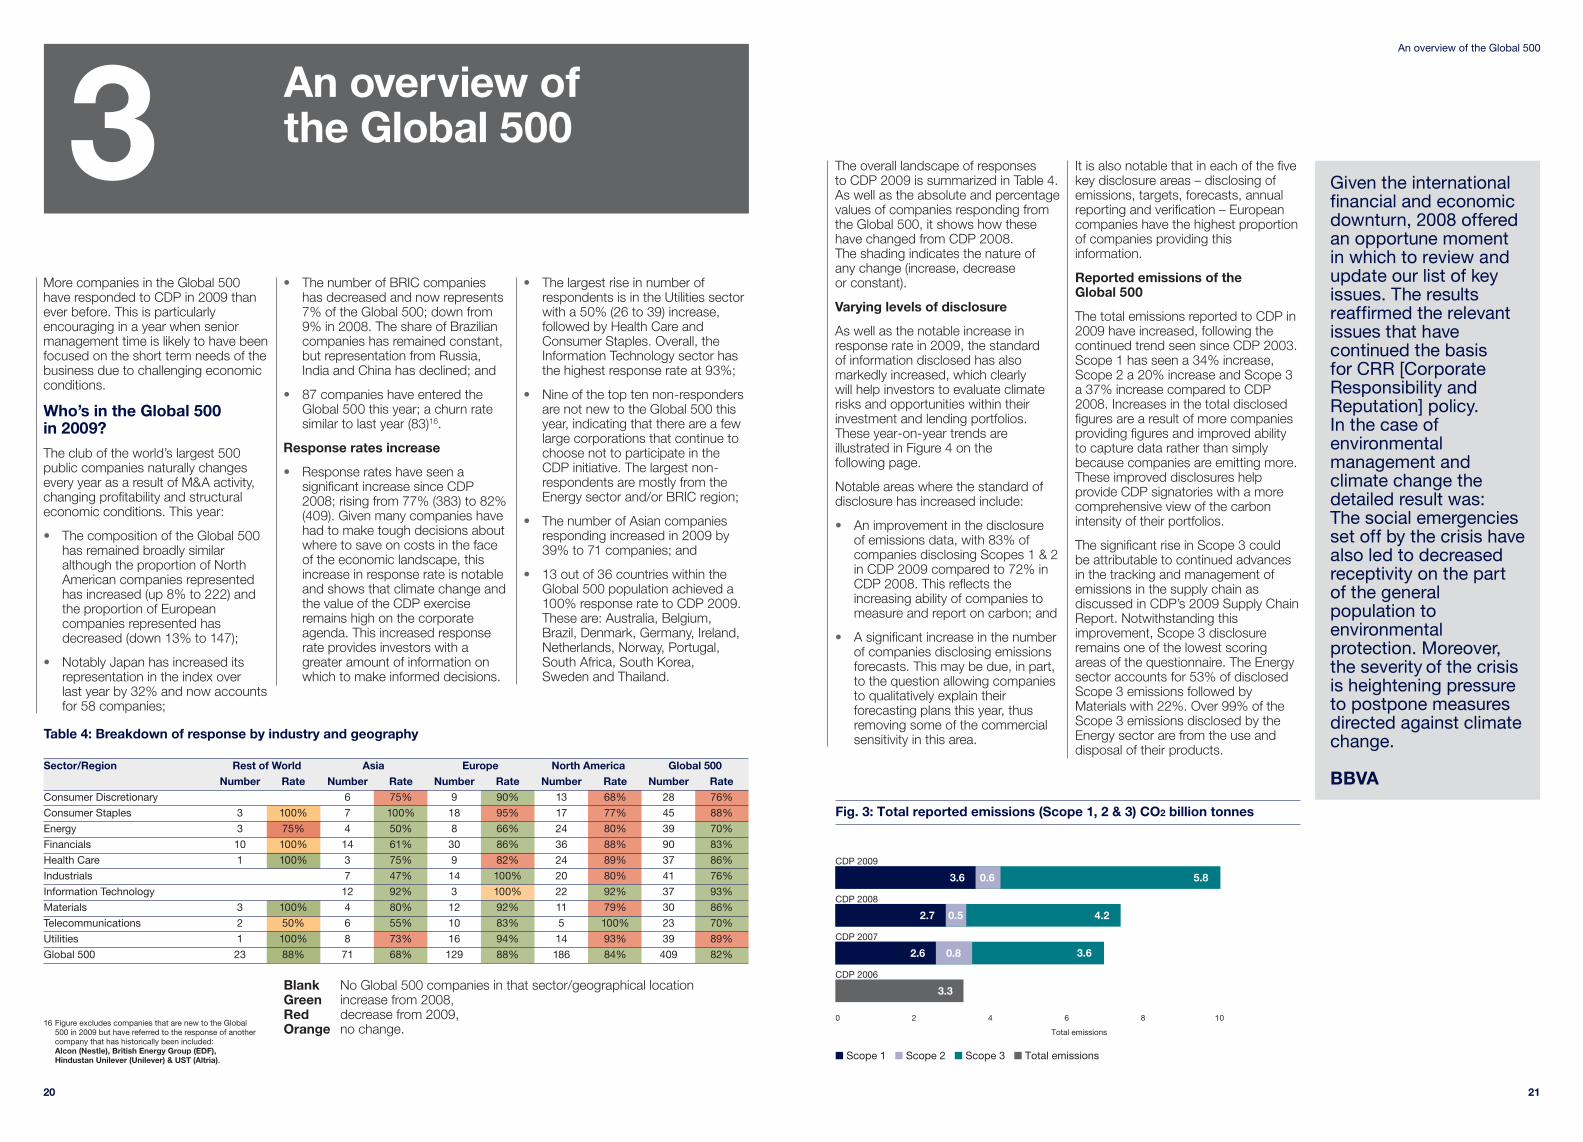
21
An overview of the Global 500
20
The overall landscape of responses to CDP 2009 is summarized in Table 4.As well as the absolute and percentagevalues of companies responding fromthe Global 500, it shows how thesehave changed from CDP 2008. The shading indicates the nature of any change (increase, decrease or constant).
Varying levels of disclosure
As well as the notable increase inresponse rate in 2009, the standard of information disclosed has alsomarkedly increased, which clearly will help investors to evaluate climaterisks and opportunities within theirinvestment and lending portfolios.These year-on-year trends areillustrated in Figure 4 on the following page.
Notable areas where the standard ofdisclosure has increased include:
• An improvement in the disclosure of emissions data, with 83% ofcompanies disclosing Scopes 1 & 2in CDP 2009 compared to 72% inCDP 2008. This reflects theincreasing ability of companies tomeasure and report on carbon; and
• A significant increase in the numberof companies disclosing emissionsforecasts. This may be due, in part,to the question allowing companiesto qualitatively explain theirforecasting plans this year, thusremoving some of the commercialsensitivity in this area.
It is also notable that in each of the fivekey disclosure areas – disclosing ofemissions, targets, forecasts, annualreporting and verification – Europeancompanies have the highest proportionof companies providing thisinformation.
Reported emissions of the Global 500
The total emissions reported to CDP in2009 have increased, following thecontinued trend seen since CDP 2003.Scope 1 has seen a 34% increase,Scope 2 a 20% increase and Scope 3a 37% increase compared to CDP2008. Increases in the total disclosedfigures are a result of more companiesproviding figures and improved abilityto capture data rather than simplybecause companies are emitting more.These improved disclosures helpprovide CDP signatories with a morecomprehensive view of the carbonintensity of their portfolios.
The significant rise in Scope 3 could be attributable to continued advancesin the tracking and management ofemissions in the supply chain asdiscussed in CDP’s 2009 Supply ChainReport. Notwithstanding thisimprovement, Scope 3 disclosureremains one of the lowest scoringareas of the questionnaire. The Energysector accounts for 53% of disclosedScope 3 emissions followed byMaterials with 22%. Over 99% of theScope 3 emissions disclosed by theEnergy sector are from the use anddisposal of their products.
0.5
0.8
4.2
3.6
Fig. 3: Total reported emissions (Scope 1, 2 & 3) CO2 billion tonnes
3.6 5.80.6
2.7
2.6
CDP 2009
CDP 2007
Total emissions
20 4 6 8 10
3.3
CDP 2006
CDP 2008
■ Scope 1 ■ Scope 2 ■ Scope 3 ■ Total emissions
Given the internationalfinancial and economicdownturn, 2008 offeredan opportune momentin which to review andupdate our list of keyissues. The resultsreaffirmed the relevantissues that havecontinued the basis for CRR [CorporateResponsibility andReputation] policy. In the case ofenvironmentalmanagement andclimate change thedetailed result was: The social emergenciesset off by the crisis havealso led to decreasedreceptivity on the partof the generalpopulation toenvironmentalprotection. Moreover,the severity of the crisisis heightening pressureto postpone measuresdirected against climatechange.
BBVA
3 An overview of the Global 500
16 Figure excludes companies that are new to the Global 500 in 2009 but have referred to the response of anothercompany that has historically been included: Alcon (Nestle), British Energy Group (EDF), Hindustan Unilever (Unilever) & UST (Altria).
Table 4: Breakdown of response by industry and geography
Sector/Region Rest of World Asia Europe North America Global 500Number Rate Number Rate Number Rate Number Rate Number Rate
Consumer Discretionary 6 75% 9 90% 13 68% 28 76%
Consumer Staples 3 100% 7 100% 18 95% 17 77% 45 88%
Energy 3 75% 4 50% 8 66% 24 80% 39 70%
Financials 10 100% 14 61% 30 86% 36 88% 90 83%
Health Care 1 100% 3 75% 9 82% 24 89% 37 86%
Industrials 7 47% 14 100% 20 80% 41 76%
Information Technology 12 92% 3 100% 22 92% 37 93%
Materials 3 100% 4 80% 12 92% 11 79% 30 86%
Telecommunications 2 50% 6 55% 10 83% 5 100% 23 70%
Utilities 1 100% 8 73% 16 94% 14 93% 39 89%
Global 500 23 88% 71 68% 129 88% 186 84% 409 82%
Blank No Global 500 companies in that sector/geographical locationGreen increase from 2008,Red decrease from 2009,Orange no change.
More companies in the Global 500have responded to CDP in 2009 thanever before. This is particularlyencouraging in a year when seniormanagement time is likely to have beenfocused on the short term needs of thebusiness due to challenging economicconditions.
Who’s in the Global 500 in 2009?
The club of the world’s largest 500public companies naturally changesevery year as a result of M&A activity,changing profitability and structuraleconomic conditions. This year:
• The composition of the Global 500has remained broadly similaralthough the proportion of NorthAmerican companies representedhas increased (up 8% to 222) andthe proportion of Europeancompanies represented hasdecreased (down 13% to 147);
• Notably Japan has increased itsrepresentation in the index over last year by 32% and now accountsfor 58 companies;
• The number of BRIC companieshas decreased and now represents7% of the Global 500; down from9% in 2008. The share of Braziliancompanies has remained constant,but representation from Russia,India and China has declined; and
• 87 companies have entered theGlobal 500 this year; a churn ratesimilar to last year (83)16.
Response rates increase
• Response rates have seen asignificant increase since CDP2008; rising from 77% (383) to 82%(409). Given many companies havehad to make tough decisions aboutwhere to save on costs in the faceof the economic landscape, thisincrease in response rate is notableand shows that climate change andthe value of the CDP exerciseremains high on the corporateagenda. This increased responserate provides investors with agreater amount of information onwhich to make informed decisions.
• The largest rise in number ofrespondents is in the Utilities sectorwith a 50% (26 to 39) increase,followed by Health Care andConsumer Staples. Overall, theInformation Technology sector hasthe highest response rate at 93%;
• Nine of the top ten non-respondersare not new to the Global 500 thisyear, indicating that there are a fewlarge corporations that continue tochoose not to participate in theCDP initiative. The largest non-respondents are mostly from theEnergy sector and/or BRIC region;
• The number of Asian companiesresponding increased in 2009 by39% to 71 companies; and
• 13 out of 36 countries within theGlobal 500 population achieved a100% response rate to CDP 2009.These are: Australia, Belgium,Brazil, Denmark, Germany, Ireland,Netherlands, Norway, Portugal,South Africa, South Korea, Sweden and Thailand.

23
An overview of the Global 500
22
Carbon Disclosure Project
Responses to the new questions of 2009
The carbon reporting agendacontinues to advance at a remarkablepace. Recognition is due, in part, tothose leading CDP responders whohelp to drive the standard forward byraising the bar on disclosure each year.The CDP questionnaire is evaluatedannually following feedback from theCDP signatories and respondingcompanies. Key new question areasadded during CDP 2009 included:
• Goods and services which avoidemissions for third parties (Question14) – This question received 226responses, many describinginnovative action; and
• Involvement in project-basedcarbon credits (Question 22) – 113 companies stated that theypurchased credits and 98 havebeen involved in their origination. 58 companies stated they areinvolved in trading credits as abusiness activity.
Largest non-responders in 2009
The number of non-respondents toCDP from the Global 500 is now under100 for the first time since CDP wasinitiated. Non-responding companieshave therefore become increasinglyvisible. The table below lists the tenlargest non-responders for 2009 bymarket capitalization.
Table 5: Largest non-responders in 2009
Sector CompanyTelecommunications América Móvil
Energy PetroChina
Telecommunications China Mobile
Energy China Petroleum & Chemical
Financials Bank of China
Financials Berkshire Hathaway
Consumer Staples Philip Morris International
Energy Reliance Industries
Energy Rosneft
Health Care Teva Pharmaceuticals Industries
In October 2008,Endesa launched a new company, EndesaCarbono, whose mainobjectives are toprovide Endesa with theCERs/ERUs necessaryto achieve its goalsbetween 2008 and2020, as well as toexport new businessopportunities to theemerging global carbonmarkets. The list ofCDM projects in 14countries includes wind,geothermal, and hydroelectricity, co-generation, watertreatment, natural gas,and methane capture in coal mines.
ENEL.
[Volkswagen] offers fueleconomy trainings…These fuel economytrainings yield anaverage fuelconsumption of 13% for all participants andup to 25% in the bestcases. Estimationsshow that a nationwidedriver training schemewould yield a savingspotential of 12 milliontonnes of CO2emissions annually in Germany.
Volkswagen
Fig. 4: Proportion of Global 500 at each disclosure level – year-on-year*
500 (100%)
257 (51%)
349 (70%)
224 (45%)
Responses 409 (82%)
Verify emissions 247 (49%)
Publicly available 345 (69%)
Disclose GHG emissions 339 (68%)
CDP 2009
500 (100%)
Publicly available 311 (62%)
206 (41%)
308 (62%)
Verify emissions 214 (43%)
Disclose forecasts 52 (10%)
383 (77%)
CDP 2008
Report on GHG emissions inannual corporate reporting
Report on GHG emissions inannual corporate reporting
Total population
Total population
Disclose emissionsreduction targets
Disclose emissionsreduction targets
Disclose forecasts
Responses
Disclose GHG emissions 275 (55%)
* The circles for response and ‘publicly available’ are basedon data at time of printing. Data for the other circles arebased on data for those companies scored.

2524
4 Geographic overview
It was noted in last year’s report that2009 would be a defining year in theclimate change calendar and thatmuch rests on the outcome of theCopenhagen Climate Conference inDecember. The outcome of thisconference is likely to shape the globalpolicy response for the next decadeand, potentially, the speed and severityof climate change impacts for manydecades to come.
Though the Global 500 continues to be largely biased towards certaingeographies – most notably the US –the international nature of theresponses reflects the full range ofregulatory, physical and commercialdrivers. The world’s largest companieshold significant influence over globalemissions and their potential to bereduced, and can play a major role inhelping to shape an internationalagreement. Three key facts from theresponses are notable in relation to this role:
• An agreement would provideincreased certainty for theGlobal 500; out of 257 companiesstating the periods of theiremissions reduction targets, only36% of these disclosed targets thatstretched beyond 2012. ConsumerStaples and Utilities were the onlysectors where more than half ofcompanies disclosed targetsbeyond 2012;
• Regulatory drivers can be anopportunity instead of a burden; 46 companies saw the introductionof the UK’s Carbon ReductionCommitment (CRC) as a risk, but16 of these also saw it as anopportunity. Interestingly, a further14 companies viewed it as only anopportunity; and
• Asian companies are quicklybecoming engaged. Asia hasincreased its proportion of theGlobal 500 respondents from CDP2008, to 17% (71), this is partly dueto an 18% increase in responserate: the largest of all thegeographic regions.
Mapping key metrics by country
To add context to the role the Global500 can play in shaping an internationalclimate change agreement, thefollowing page shows a snapshot ofkey indicators of a country’s climatechange landscape in relation to theGlobal 500 responses. It covers:
• Total publicly-disclosed Scope 1and 2 emissions of the companiesoriginating from that country, and its proportion of total Global 500disclosed emissions. This can beviewed as a proxy for the level ofinfluence over current emissions;
• Change in the response rate of thecountry compared to CDP 2008 –an indicator of the change in thelevel of engagement of the country’scompanies in climate changeinitiatives;
• The average CDLI score of thecountry – an indicator of thestandard of climate changemanagement and awareness of the country’s companies; and
• The average performance score ofthe country – an indicator of thelevel of action taken by a country’scompanies to manage theirresponse to, and reduce theircontribution to, climate change.
Key findings include:
The companies of just fivecountries account for 70% of totalemissions disclosed. Of these fivecountries, only the UK, which is 3rdlargest by emissions, also ranked in the top five companies for disclosurescore, positioning UK companies asleaders. This also suggests a gap inthe rest of the top five, (US, Germany,France and Japan), where relative toother countries, the size of emissionsbeing reported are not matched by thestandard of disclosure.
Europe is the region whichaccounts for the largest proportionof disclosed emissions. Europe alsohas the highest average companydisclosure and performance scoreswith eight and nine of the top tenscoring countries for disclosure andperformance respectively.
Geographic breakdown
Total Scope 1 emissions reported bythe Global 500 to CDP now equate to11.5% of global emissions19. Thissignificant figure shows just how muchinfluence the Global 500 companieshave on global emissions reduction –and this should be held in mind in therun up to Copenhagen. The map onthe following page highlights keystatistics for each country representedby more than one company in theGlobal 500, and includes: emissions,scores and response rates.
Carbon Disclosure Project
The ability to collate, analyze andreport a single, joined-up andconstantly-evolving information set should be a top priority for allbusinesses. This article highlights why we believe this matters now more than ever before, and introducesa methodology for achievingstrategically informed decisionmaking through integrated reporting.
The speed and severity of thefinancial crisis threw this issue intosharp relief. Without question, amajor contributory factor to the rapidescalation of the crisis was anunderestimation of risks and theirsystemic impact. Put bluntly, whenthey needed it most, managementteams in many organizations − notleast banks − lacked vital, connectedinsight into their businesses.
As a result, CEOs, non-executivedirectors, investors and regulatorsworldwide have now becomesceptical about the quality ofinformation they receive − and thevalue that this information actuallydelivers. Is it possible that they aremissing some critical insight? And if they are, how much damagecould result?
Understanding how climate change will affect the economicperformance and the prospects of a company is now a criticalbusiness issue. The building blocksof stakeholder engagement, effectivegovernance and oversight and thequality of management will becomeintegral to managing this key risk andopportunity that each company now
faces. A critical factor in this ismanagement’s ability to have at itsfingertips one integrated informationset to enable effective strategicdecision-making − and to provide astructure within which externalreporting can be tailored and targetedat key stakeholder audiences.
Until now, sustainability reporting hasbeen separated from the mainstreamfinancial model for a number ofreasons. First, it has been largely avoluntary process and its focus has in large part been directed at meetingthe information needs and agendasof external stakeholders. Andsecond, most of the focus ofcompanies’ sustainability efforts hasoperated in a silo largely separatefrom day-to-day business operationsand strategic decision-making.
This situation is beginning to changeas companies become aware of thestrategic implications that issuessuch as climate change, populationgrowth and resource usage have fortheir future business success. Whatemerges from this is a challenge forcompanies to embed sustainabilitythinking into the business and toreport on the more material issues in an integrated way. This does not mean including elements of thesustainability report in the annualreport. The process demands a much more fundamental rethink.
Indeed, the recently released US EPA, UK DEFRA and ClimateDisclosure Standards Board (CDSB)guidelines all look at the idea ofmoving this information decisively
from the fringes of corporatereporting into the strategicmainstream, so that measuring,managing and reporting on climatechange becomes a prerequisite17.
This shift may include new regulationsthat move the fiduciary duties ofdirectors in this direction. For thisreason, the role of directors willbecome the focus of intense scrutiny.As part of this recalibrated licence,greater attention will be paid to howthe business uses and consumesresources, including the overallperformance footprint of the business.
To this effect, PwC has created theworld’s first illustrative reportingexample for business on climatechange and greenhouse gasreporting – Typico plc17. Thisillustrates how a company – “Typicoplc” – might address the issue ofclimate change and the sort ofinformation (such as strategy, targets,performance and benchmarking) that should become incorporated into mainstream annual reporting by companies.
Typico plc seeks to take forward thedebate about how the reportingmodel should be influenced by issueslike climate change. Given thesignificant challenge facing societyaround climate change, it isbecoming increasingly urgent that the reporting model effectivelycommunicates company’s actionsand performance. Without thisinformation, and the ability to makeinformed decisions, how much valueare you risking at your company?
What does your reporting say about your organization Alan McGill, PwC Partner, Sustainability and Climate Change
17 CDP provides the Secretariat for CDSB, see www.cdsb-global.org
18 Typico Plc – An illustration for business climate change and greenhouse gas emissions reporting, is available at:www.pwc.com/climateready
19 Based on total global emissions of 31.6 billion metric tonnes. Source: NEAA -http://www.pbl.nl/en/publications/2009/Global-CO2-emissions-annual-increase-halves-in-2008.html
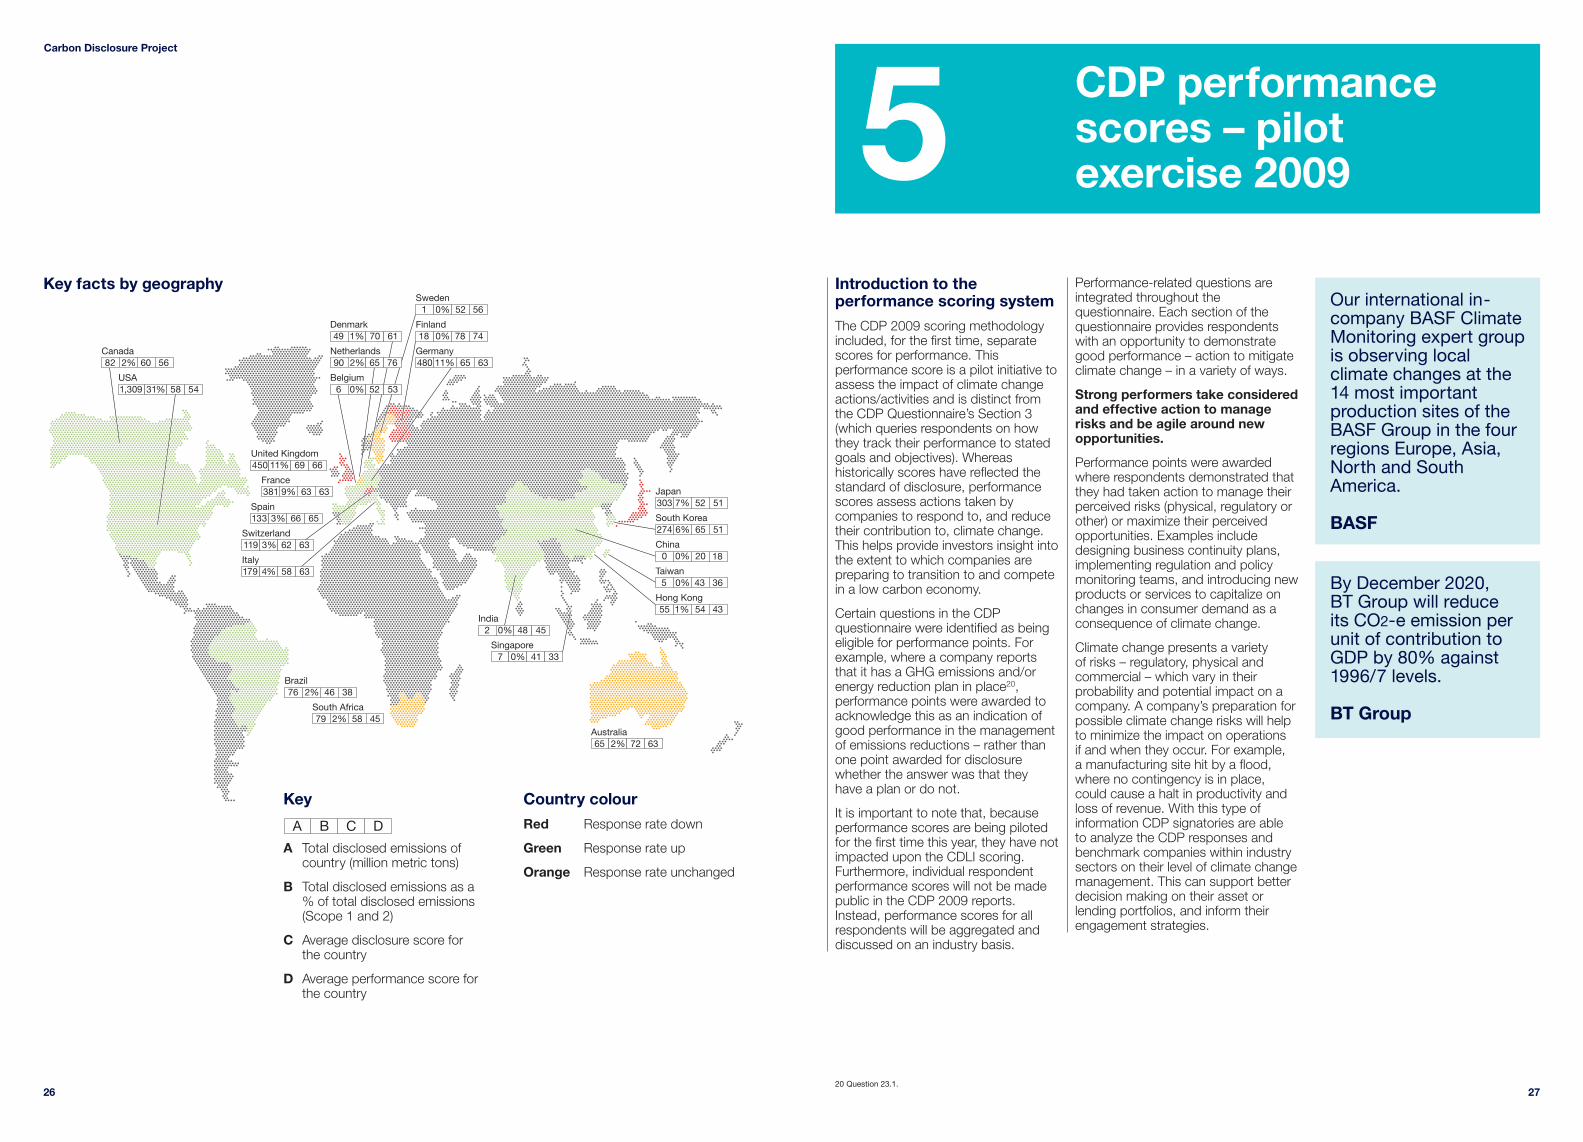
2726
5 CDP performancescores – pilot exercise 2009
Introduction to theperformance scoring system
The CDP 2009 scoring methodologyincluded, for the first time, separatescores for performance. Thisperformance score is a pilot initiative toassess the impact of climate changeactions/activities and is distinct fromthe CDP Questionnaire’s Section 3(which queries respondents on howthey track their performance to statedgoals and objectives). Whereashistorically scores have reflected thestandard of disclosure, performancescores assess actions taken bycompanies to respond to, and reducetheir contribution to, climate change.This helps provide investors insight intothe extent to which companies arepreparing to transition to and competein a low carbon economy.
Certain questions in the CDPquestionnaire were identified as beingeligible for performance points. Forexample, where a company reportsthat it has a GHG emissions and/orenergy reduction plan in place20,performance points were awarded toacknowledge this as an indication ofgood performance in the managementof emissions reductions – rather thanone point awarded for disclosurewhether the answer was that they have a plan or do not.
It is important to note that, becauseperformance scores are being pilotedfor the first time this year, they have notimpacted upon the CDLI scoring.Furthermore, individual respondentperformance scores will not be madepublic in the CDP 2009 reports.Instead, performance scores for allrespondents will be aggregated anddiscussed on an industry basis.
Performance-related questions areintegrated throughout thequestionnaire. Each section of thequestionnaire provides respondentswith an opportunity to demonstrategood performance – action to mitigateclimate change – in a variety of ways.
Strong performers take consideredand effective action to managerisks and be agile around newopportunities.
Performance points were awardedwhere respondents demonstrated thatthey had taken action to manage theirperceived risks (physical, regulatory orother) or maximize their perceivedopportunities. Examples includedesigning business continuity plans,implementing regulation and policymonitoring teams, and introducing newproducts or services to capitalize onchanges in consumer demand as aconsequence of climate change.
Climate change presents a variety of risks – regulatory, physical andcommercial – which vary in theirprobability and potential impact on acompany. A company’s preparation forpossible climate change risks will helpto minimize the impact on operations if and when they occur. For example, a manufacturing site hit by a flood,where no contingency is in place,could cause a halt in productivity andloss of revenue. With this type ofinformation CDP signatories are able to analyze the CDP responses andbenchmark companies within industrysectors on their level of climate changemanagement. This can support betterdecision making on their asset orlending portfolios, and inform theirengagement strategies.
Our international in-company BASF ClimateMonitoring expert groupis observing localclimate changes at the14 most importantproduction sites of theBASF Group in the fourregions Europe, Asia,North and SouthAmerica.
BASF
By December 2020, BT Group will reduce its CO2-e emission perunit of contribution toGDP by 80% against1996/7 levels.
BT Group
Taiwan
Sweden1 0% 52 56
Finland18 0% 78 74
Germany480 11% 65 63
Netherlands90 2% 65 76
Belgium6 0% 52 53
Denmark49 1% 70 61
Hong Kong
South Korea6% 65 51
China
Japan303 7% 52 51
France381 9% 63 63
United Kingdom450 11% 69 66
USA
Canada
Spain133 3% 66 65
Switzerland119 3% 62 63
Italy179 4% 58 63
India
Singapore
Brazil76 2% 46 38
South Africa79 2% 58 45
Australia65 2% 72 63
55 1% 54 43
0 0% 20 18
2 0% 48 45
7 0% 41 33
274
5 0% 43 36
82 2% 60 56
1,309 31% 58 54
Key
A Total disclosed emissions ofcountry (million metric tons)
B Total disclosed emissions as a % of total disclosed emissions (Scope 1 and 2)
C Average disclosure score for the country
D Average performance score for the country
Country colour
Red Response rate down
Green Response rate up
Orange Response rate unchanged
A B C D
20 Question 23.1.
Carbon Disclosure Project
Key facts by geography

29
CDP performance scores – pilot exercise 2009
28
Carbon Disclosure Project
The degree to which performancescoring is integrated into the CDLIscore and the timeline for this is yet tobe determined and stakeholders will beconsulted on developments in this area.
Who achieved high performancescores in CDP 2009?
Companies achieving highperformance scores in this year’s pilotexercise share a number of commontraits. Generally, they:
• Effectively manage carbon data andare transparent on the information -by publicly disclosing their climatechange activities and performancein an annual report;
• Effectively monitor and manage theevolving climate change agenda –by engaging positively with policymakers on the climate changeagenda;
• Implement innovative ideas tocapitalize on climate changeopportunities and apply welldesigned solutions to manageclimate change risks;
• Are forward-thinking and proactivein addressing climate change – by having established emissionsreductions plans, targets andpublishing forecasts; and
• Drive their business towards climate change mitigation – byoffering incentives, often financial,to employees for individualmanagement of climate change issues.
Observations on the leaders group:
• Over half are from Europe –supporting the high average overallscore for European companiesdescribed earlier;
• Despite it being a smaller groupthan the CDLI there are the samenumber of Information Technologycompanies in this group as theCDLI – possibly reflecting the driverof consumer behaviour becomingincreasingly climate conscious; and
• Eight (67%) of these companies –Allianz, BASF, Boeing, CiscoSystems, Consolidated Edison,EMC, Reckitt Benckiser,Siemens – are also in the CDLI,though they are all generally highscorers – showing there is a link(though not complete) betweendisclosure and performance.
Table 6: Companies achieving the highest performance scores in CDP 2009 – in alphabetical order
Company Sector RegionAccenture Information Technology North America
Allianz Financials Europe
BASF Materials Europe
Boeing Industrials North America
Cisco Systems Information Technology North America
Consolidated Edison Utilities North America
EMC Information Technology North America
Nokia Group Information Technology Europe
Reckitt Benckiser Consumer Staples Europe
Royal Dutch Shell Energy Europe
Siemens Industrials Europe
Swiss Re Financials Europe
EDP’s strategic plan,issued on the investorday in 2008, stated that CO2 emissionfactor (EF) will bereduced in 56% by2012 in comparisonwith 2005 emissions. EF will drop from 600tCO2/MWh in 2005 to270 tCO2/MWh in 2012.
EDP
We participateinternationally indeveloping effectiveenvironmental andeconomic policies and mechanisms, and we also contributeto research anddevelopment. Thisengagement informsand supports ourclimate changestrategy. Among a wide range of externalorganisations, weparticipate actively in the World BusinessCouncil for SustainableDevelopment (WBCSD)and the WBCSDCement SustainabilityInitiative (CSI) at aglobal level, as well asin CSI initiatives in Indiaand China.
Holcim
Regulation promotes forwardthinking and planning
Performance points were awardedwhere companies had reportedemissions reductions targets. Thesepoints were awarded irrespective of the appropriateness or ambition of the target.
Responding companies generallyscored well on having emissionreduction targets – with 78% gainingthe performance points. Only 54% of BRIC countries scored theperformance point on emissionsreduction targets relative to 79% fornon-BRIC. This may reflect the factthat the regulatory agenda on climatechange in the BRIC countries is lessadvanced.
Stronger performers engage inregular dialogue with policymakers to try and get the best dealfrom climate change regulation
Performance scores were awardedwhere companies were clearly able todemonstrate their engagement withpolicymakers to influence the design of policy measures around climatechange mitigation and adaptation.Examples would include the provisionof research and data, consultationresponses and advice directly toGovernments or via industry bodies.
The Materials and Utilities sectors arestrong in this regard. These sectors areamong the most carbon-intensive andhave considerable value at risk.Consequently, they are prepared todevote considerable resources toadvocacy efforts around the design of policy and often maintain goodinternal capacity to undertake theirown policy analysis.
From a geographical perspective, only49% of Asian companies are positivelyengaging policy makers compared with77% from Europe and 65% from NorthAmerica. This may reflect their relativelyrecent involvement in the global climatechange agenda. However, thesenewcomers appear to be committed toeffective engagement, with a majoritycommenting that their activities areencouraging climate change mitigationwithin their organizations.
Carbon abatement activities aredelivering results
Of the responding companies 65%confirmed that they had achievedpositive results in emissions reductionand energy-saving measures fromprograms undertaken.
Information Technology is the strongestperforming sector in this area with 74% of companies stating that theyhave achieved reductions or savings.Encouragingly, they are also able toclearly describe what these are oneither an absolute or relative basis. The Financials sector was the lowestperforming, with only 55% ofcompanies reporting progress.
Only 10% of the BRIC respondentsnoted that they have achievedemission reductions, significantly lowerthan the 72% of the non-BRICrespondents. Although the explanatoryfactors behind this are not discussed, it is likely that limited or non-existentemissions regulation, inadequateaccess to capital and cleantechnologies and a current focus onincreasing overall production are likelyto be contributory factors.
The reason for the introduction ofperformance scores – use forinvestors & policymakers
Introduction of performance scores in 2009 is an important step towardsrecognizing respondents’ progress in addressing climate change throughaction, as well as scoring therespondents on their disclosurestandard. The performance score aimsto be a useful benchmarking tool forCDP signatories to evaluate howprepared their portfolio companies are to remain profitable in a low carbon economy.
Following the increase in the number of CDP signatories, many of whomengage with companies to improveclimate reporting, the standard ofdisclosure over the past seven yearshas increased dramatically. This is acredit to those companies who haveparticipated in the CDP initiative. Theincrease also reflects greater activity by companies in mitigating climatechange and it is the level of this effort
that CDP now endeavours to measureand give recognition for. Performancescores serve to present a fuller pictureto investors and policy makers ofcorporate commitment to mitigatingthe effects of climate change.
Current limitations
All companies who responded to CDP 2009, irrespective of theirindustry, geography and level ofemissions, were scored against theperformance questions using onecommon scoring methodology. It isimportant, however, to make a numberof caveats in this regard.
The methodology for performancescores does not currently ‘flex’ toaccount for a company’s area ofbusiness and situation in the same way as the methodology for disclosure.In addition, performance scores areonly able to be awarded when theunderlying disclosure is provided by the respondent. There is no additionalresearch, or analysis undertakenindependent of the companyresponses. There is, therefore, aninherent link between performancescores and disclosure scores.However, this link is consistent acrosscompanies and so the focus of interestis how sectors perform relative to oneanother. Also, it is sensible to suggestthat the more companies monitor andmanage their impact, the more they arelikely to understand where they cantake action and the best way in whichto do it – and hence ‘perform’ to ahigher standard.
Evolution of performance scoring
Incorporating performance into CDP2009 has been a positive step; it hasprovided distinction between observingand rewarding good reporting versuspositive action to mitigate climatechange. The exercise has highlightedthat a performance score may be avaluable additional component ofreport analysis and the CDLI leaguetable in the future. It would provideguidance and incentives torespondents to take positive actionand also highlight to the CDPsignatories where this is being done –i.e. risks are being managed andopportunities maximized.

3130
6 Industry overview
As noted in the introduction, CDP has responded to feedback from itssignatories and other stakeholders for more industry-specific analysis bychoosing to present Global 500findings in individual industry reportsavailable online: www.cdproject.net.These cover the 10 industry groups as defined in the Global IndustryStandard Classification (GICS). Anoverview of these findings is presentedhere with comment on the progressthat has been made on overall levels of disclosure and any significantvariance observed on a sectoral orgeographic basis.
Key themes for each of the 10 sectors are summarized across.
Levels of disclosure across industries
The table on the following pageprovides a breakdown of theproportion of respondents that haveachieved each level of disclosure inCDP 2009. The data is presented byindustry sector and illustrates year-on-year trends (compared to CDP 2008).Although overall disclosure hasincreased, as noted previously,performance at the sector level varies significantly.
Investors, who are likely to have anobjective of diversifying risk acrosssectors and/or countries willincreasingly value data that allowsindustry peer group comparison andyear-on-year performance to beassessed.
Table 7: Key themes from the CDP 2009 company responses by industry sector
SectorDevising an effective response to changing consumer habits
Mixed views on the benefits of greater carbon labelling
Concern around the cash costs and reputational aspects of theforthcoming Carbon Reduction Commitment (UK only)
Information Technology How to capture the value from lower emissions through the use of advanced products and services
New business opportunities around climate change adaptation
Telecommunications Devising new products to help consumers reduce emissions
New business opportunities around consulting services to helpclients reduce their own emissions
Implication of stricter energy efficiency targets for new products
Health Care Impact of depleted biodiversity stocks on new drug development
How to effectively engage with employees on climate change
Financials Strategies for maximising carbon value in lending and investment
How to quantify physical risks to assets
Risks of litigation around carbon-intensive investments
Energy/Utilities Direct compliance costs to meet obligations under cap-and-trade programs
Diversification into new markets with R&D and investmentprograms to bring new energy technologies to market
New business units/products helping consumers reduce energy
Materials Impact of proposed regulation (Australia, mining sector)
New business opportunities around climate change (chemicals sector)
Physical risk to availability of natural resources, particularly water (forestry sector)
Industrials Opportunities to provide greener infrastructure and housingprojects designed with a focus on high energy efficiency andresilience to extreme weather events (construction sector)
How will changing regulation and consumer demands shapeindustry composition (transportation sector)
Consumer Staples/ Consumer Discretionary
Carbon Disclosure Project
Per
form
ance
sco
re
Disclosure score
Fig. 5: Analysis of performance scores versus disclosure scores – by industry sector
■ Consumer Discretionary ■ Consumer Staples ■ Energy ■ Financials ■ Health care
■ Industrials ■ Information technology ■ Materials ■ Telecommunications ■ Utilities
Sizes of bubbles are based on number of respondents.
45
45
50
55
60
65
70
75
80
50 55 60 65 70 75 80 85
Per
form
ance
sco
re
Disclosure score
Fig. 6: Analysis of performance scores versus disclosure scores – by geographic and leader groups
■ Average EU-ETS ■ Average non EU-ETS ■ Average BRIC ■ Average CDLI ■ China
■ India ■ Brazil ■ US ■ Europe
0
0
10
20
30
40
50
80
70
60
10 20 30 40 50 60 70 9080
HP is consolidating its 85 legacy datacenters into six datacenters in three cities,each equipped with the latest energy-efficientequipment andDynamic Smart Coolingtechnology. This issaving enoughelectricity to power allthe homes in the city of Palo Alto, Calif. formore than a year. Whenthe initiative is completeand fully optimized, weanticipate yearly energysavings from datacenter consolidation upto 380 million kWh, andannual cost savings ofup to US$30 million.
Hewlett-Packard
Since 2001, Intel hasinvested more than $23million and recoveredmore than $50 millionfrom resourceconservation andefficiency initiatives,saving in excess of 500million kilowatt-hours(kWh), enough energyto power more than50,000 US homes.
Intel
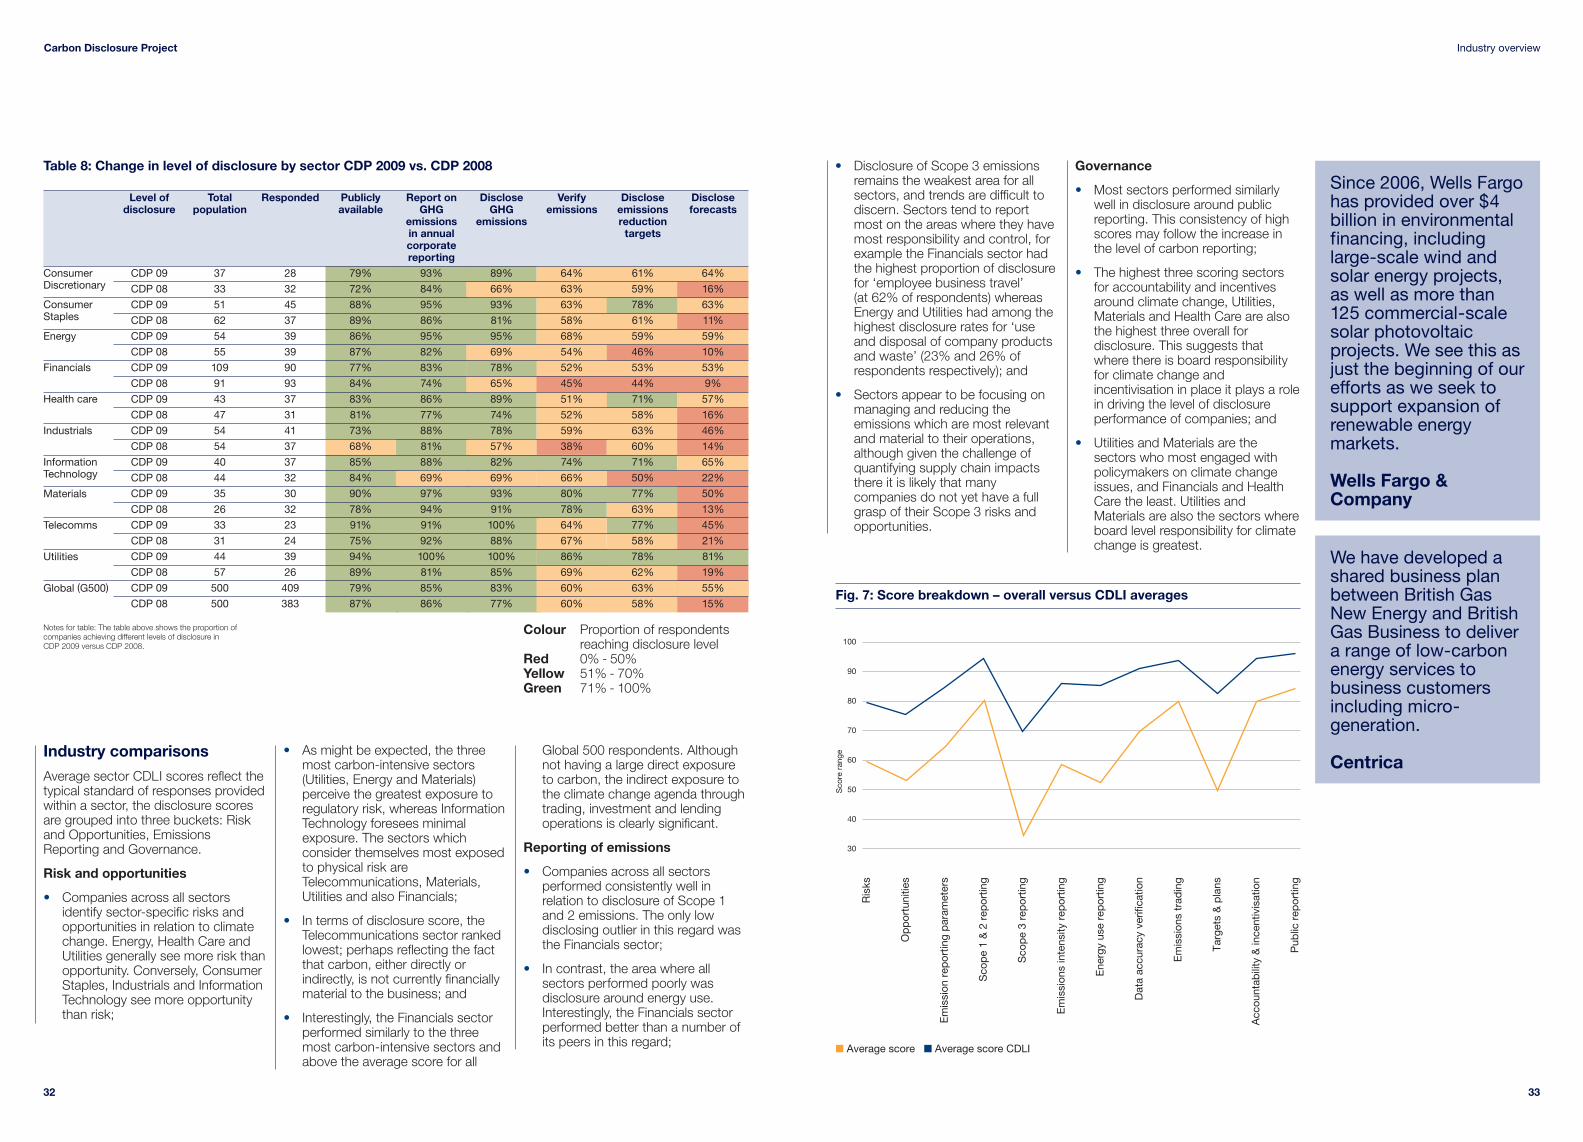
33
Industry overview
32
Carbon Disclosure Project
• Disclosure of Scope 3 emissionsremains the weakest area for allsectors, and trends are difficult todiscern. Sectors tend to reportmost on the areas where they havemost responsibility and control, forexample the Financials sector hadthe highest proportion of disclosurefor ‘employee business travel’ (at 62% of respondents) whereasEnergy and Utilities had among thehighest disclosure rates for ‘useand disposal of company productsand waste’ (23% and 26% ofrespondents respectively); and
• Sectors appear to be focusing onmanaging and reducing theemissions which are most relevantand material to their operations,although given the challenge ofquantifying supply chain impactsthere it is likely that manycompanies do not yet have a fullgrasp of their Scope 3 risks andopportunities.
Governance
• Most sectors performed similarlywell in disclosure around publicreporting. This consistency of highscores may follow the increase inthe level of carbon reporting;
• The highest three scoring sectorsfor accountability and incentivesaround climate change, Utilities,Materials and Health Care are alsothe highest three overall fordisclosure. This suggests thatwhere there is board responsibilityfor climate change andincentivisation in place it plays a rolein driving the level of disclosureperformance of companies; and
• Utilities and Materials are thesectors who most engaged withpolicymakers on climate changeissues, and Financials and HealthCare the least. Utilities andMaterials are also the sectors whereboard level responsibility for climatechange is greatest.
Since 2006, Wells Fargohas provided over $4billion in environmentalfinancing, includinglarge-scale wind andsolar energy projects,as well as more than125 commercial-scalesolar photovoltaicprojects. We see this asjust the beginning of ourefforts as we seek tosupport expansion ofrenewable energymarkets.
Wells Fargo &Company
We have developed ashared business planbetween British GasNew Energy and BritishGas Business to delivera range of low-carbonenergy services tobusiness customersincluding micro-generation.
Centrica
Sco
re r
ange
Fig. 7: Score breakdown – overall versus CDLI averages
■ Average score ■ Average score CDLI
30
40
50
60
70
90
80
100
Ris
ks
Op
por
tuni
ties
Em
issi
on r
epor
ting
par
amet
ers
Sco
pe
1 &
2 r
epor
ting
Sco
pe
3 re
por
ting
Em
issi
ons
inte
nsity
rep
ortin
g
Dat
a ac
cura
cy v
erifi
catio
n
Em
issi
ons
trad
ing
Targ
ets
& p
lans
Acc
ount
abili
ty &
ince
ntiv
isat
ion
Pub
lic r
epor
ting
Ene
rgy
use
rep
ortin
g
Industry comparisons
Average sector CDLI scores reflect thetypical standard of responses providedwithin a sector, the disclosure scoresare grouped into three buckets: Riskand Opportunities, EmissionsReporting and Governance.
Risk and opportunities
• Companies across all sectorsidentify sector-specific risks andopportunities in relation to climatechange. Energy, Health Care andUtilities generally see more risk thanopportunity. Conversely, ConsumerStaples, Industrials and InformationTechnology see more opportunitythan risk;
• As might be expected, the threemost carbon-intensive sectors(Utilities, Energy and Materials)perceive the greatest exposure toregulatory risk, whereas InformationTechnology foresees minimalexposure. The sectors whichconsider themselves most exposedto physical risk areTelecommunications, Materials,Utilities and also Financials;
• In terms of disclosure score, theTelecommunications sector rankedlowest; perhaps reflecting the factthat carbon, either directly orindirectly, is not currently financiallymaterial to the business; and
• Interestingly, the Financials sectorperformed similarly to the threemost carbon-intensive sectors andabove the average score for all
Global 500 respondents. Althoughnot having a large direct exposureto carbon, the indirect exposure tothe climate change agenda throughtrading, investment and lendingoperations is clearly significant.
Reporting of emissions
• Companies across all sectorsperformed consistently well inrelation to disclosure of Scope 1and 2 emissions. The only lowdisclosing outlier in this regard wasthe Financials sector;
• In contrast, the area where allsectors performed poorly wasdisclosure around energy use.Interestingly, the Financials sectorperformed better than a number ofits peers in this regard;
ConsumerDiscretionary
ConsumerStaples
Energy
Financials
Health care
Industrials
InformationTechnology
Materials
Telecomms
Utilities
Global (G500)
Level of Total Responded Publicly Report on Disclose Verify Disclose Disclosedisclosure population available GHG GHG emissions emissions forecasts
emissions emissions reductionin annual targetscorporatereporting
CDP 09 37 28 79% 93% 89% 64% 61% 64%
CDP 08 33 32 72% 84% 66% 63% 59% 16%
CDP 09 51 45 88% 95% 93% 63% 78% 63%
CDP 08 62 37 89% 86% 81% 58% 61% 11%
CDP 09 54 39 86% 95% 95% 68% 59% 59%
CDP 08 55 39 87% 82% 69% 54% 46% 10%
CDP 09 109 90 77% 83% 78% 52% 53% 53%
CDP 08 91 93 84% 74% 65% 45% 44% 9%
CDP 09 43 37 83% 86% 89% 51% 71% 57%
CDP 08 47 31 81% 77% 74% 52% 58% 16%
CDP 09 54 41 73% 88% 78% 59% 63% 46%
CDP 08 54 37 68% 81% 57% 38% 60% 14%
CDP 09 40 37 85% 88% 82% 74% 71% 65%
CDP 08 44 32 84% 69% 69% 66% 50% 22%
CDP 09 35 30 90% 97% 93% 80% 77% 50%
CDP 08 26 32 78% 94% 91% 78% 63% 13%
CDP 09 33 23 91% 91% 100% 64% 77% 45%
CDP 08 31 24 75% 92% 88% 67% 58% 21%
CDP 09 44 39 94% 100% 100% 86% 78% 81%
CDP 08 57 26 89% 81% 85% 69% 62% 19%
CDP 09 500 409 79% 85% 83% 60% 63% 55%
CDP 08 500 383 87% 86% 77% 60% 58% 15%
Table 8: Change in level of disclosure by sector CDP 2009 vs. CDP 2008
Colour Proportion of respondentsreaching disclosure level
Red 0% - 50% Yellow 51% - 70%Green 71% - 100%
Notes for table: The table above shows the proportion ofcompanies achieving different levels of disclosure in CDP 2009 versus CDP 2008.

3534
Industrials 3M AQ AQ 60 269 6,790,000 5,130,000 1,660,000
Industrials A.P. Moller – Maersk AQ DP 67 840 48,921,315 48,198,000 723,315 201,375 x
Industrials ABB AQ AQ 57 1,121 1,572,400 817,000 755,400
Healthcare Abbott Laboratories AQ AQ 65 55 1,619,500 842,103 777,397 64,312 x
Industrials Abertis AQ AQ(L) 52 38 189,983 30,826 159,157 ✱
Infraestructuras
Information Accenture AQ AQ 76 6 153,580 8,262 145,318 ✱ 413,042 xTechnology
Financials Ace Ltd AQ – 53 3 45,231 12,540 32,691 8,085 x
Industrials ACS Actividades de AQ IN 59 NPConstruccion y Servicios
Information Activision Blizzard NR –Technology
Information Adobe Systems AQ AQ 60 5 19,567 3,241 16,326 17,221 xTechnology
Healthcare Aetna AQ AQ 60 3 81,691 18,706 62,985
Financials Aflac AQ AQ 62 2 32,656 6,225 26,431
Materials Air Liquide AQ AQ 60 931 16,966,000 9,014,000 7,952,000 ✱ 496,000 x x
Materials Air Products AQ AQ 74 2,036 21,200,000 12,300,000 8,900,000 ✱
& Chemicals
Healthcare Alcon (see Nestle) AQ AQ
Healthcare Allergan AQ AQ 85 24 104,210 45,643 58,567 32,548 x
Financials Allianz AQ AQ 83 4 470,595 73,762 396,833 ✱ 187,962 x x x
Financials Allstate AQ AQ 79 7 212,467 33,575 178,892 57,071 x x
Industrials Alstom AQ AQ 63 19 496,000 216,000 280,000
Consumer Staples Altria Group AQ AQ 55 45 713,474 398,232 315,242 34,675 x
Consumer Amazon.com NR DPDiscretionary
Consumer Staples Ambev - Cia. Bebidas AQ AQ 51 65 586,239 497,348 88,891 ✱
das Americas
Telecommunications América Móvil NR NR
Utilities American Electric AQ AQ 52 10,347 149,415,000 149,415,000Power
Financials American Express AQ AQ 57 7 238,413 26,887 211,526 64,324 x
Telecommunications American Tower AQ – 70 122 193,896 431 193,465 8,335 x
Healthcare Amgen AQ AQ 63 NP
Energy Anadarko Petroleum AQ AQ 79 610 8,925,871 8,284,413 641,458
Table 10: Summary table in alphabetical order*
2008
2009
Co
mp
nay
CD
LI S
core
Inte
nsit
y20
No
n-p
ublic
Tota
l Em
issi
ons
21
Sco
pe
1
Sco
pe2
Gri
d A
vera
ge
Sco
pe
2 C
ont
ract
Arr
ang
emen
ts22
Sco
pe
323
Sup
ply
cha
inU
se &
Dis
po
sal o
f P
rod
ucts
& S
ervi
ces
Log
isti
cs a
nd D
istr
ibut
ion
Bus
ines
s Tr
avel
Oth
er
Sector
7 Appendix 1Carbon Disclosure Project
Sector Outlook 1 Outlook 2ConsumerStaples
“In FY2010, our goal is to accelerate andincrease water and energy conservation in the years to come through implementation of our Global Utility Optimization Process Whendrought reduces the availability of water, Heinzis at risk despite our focus on sustainableagricultural practices. Heinz faces drought andwater supply risks in many countries.” H.J. Heinz
“Physical changes resulting from climatechange don’t present any opportunities forDanone, as a food industry uses products from nature.” Danone
Materials “We have developed a financial risk model thatcalculates the costs of CO2 emissions for all ofour operations globally and our project pipelinefor 20 years into the future. Estimated emissionscosts become part of our Life of Mine plans forour existing operations. For our project pipeline,carbon costs are one factor of many thatcontribute to the overall cost of the project. Only projects with favourable costs, includingany GHG emission costs, move forward.” Newmont Mining
“At this stage Anglo Platinum does not explicitlyfactor the cost of future emissions into capitalcosts/investments. However, as growingawareness of issues surrounding emissionsexpands, this is likely to become a factor infuture decisions.”Anglo Platinum
Energy “The size of our exposure and the changing riskto both our future operational integrity and ourcurrent facilities is not yet well understood. In adapting to a world in which extreme weathermight be more common there is also a risk ofover-engineering solutions and consequentlyincreasing our construction and abandonmentcosts. In addressing these issues we arecarrying out research, jointly with ImperialCollege London, to understand better thepotential impacts on BP’s operations posed by a changing climate.” BP
“We believe that any rise in sea levels during theproductive life of existing offshore structures willbe minimal and well within design limits. In theextreme, future increases in sea level, measuredin meters, alone, or in combination with severeweather events could affect offshore productioninstallations designed to today’s standards. In the event that the classification societies,insurers, national regulatory authorities andother involved parties make changes to theapplicable design standards at some futuredate, we would apply that revised guidance.” Nexen
Health Care “Potential reductions in biodiversity caused byclimate change may have long-term impacts onNovartis operations. 60% of all (global) new anti-cancer and anti-infective agents discoveredin the period 1984 to 1995 were derived fromnatural products or their derivatives…As aresult; the Novartis pipeline could suffer from a reduction in biodiversity.”Novartis
“We do not consider our company to beexposed to physical risks. Novo Nordisk’s viewshave not changed in the past twelve months.”Novo Nordisk
Financials “We publish information about Aviva’s responseto climate change in our Annual Report &Accounts, our CR Report. We use theAccounting for Sustainability framework topresent our key data to link it to our financialreporting. We also include it in benchmarkingand investor surveys, the CDP survey of course.We also include it in our response to theClimateWise Principles and in ourCommunication of Progress for the UN Global Compact.”Aviva
“We currently do not publish information aboutthe risks and opportunities presented to ourcompany by climate change.”Progressive Corporation
Table 9: Contrasting outlooks within sectors
* Some of the figures in this table have been updated sincethe initial response analysis and may therefore differ fromdata in the main report contents.
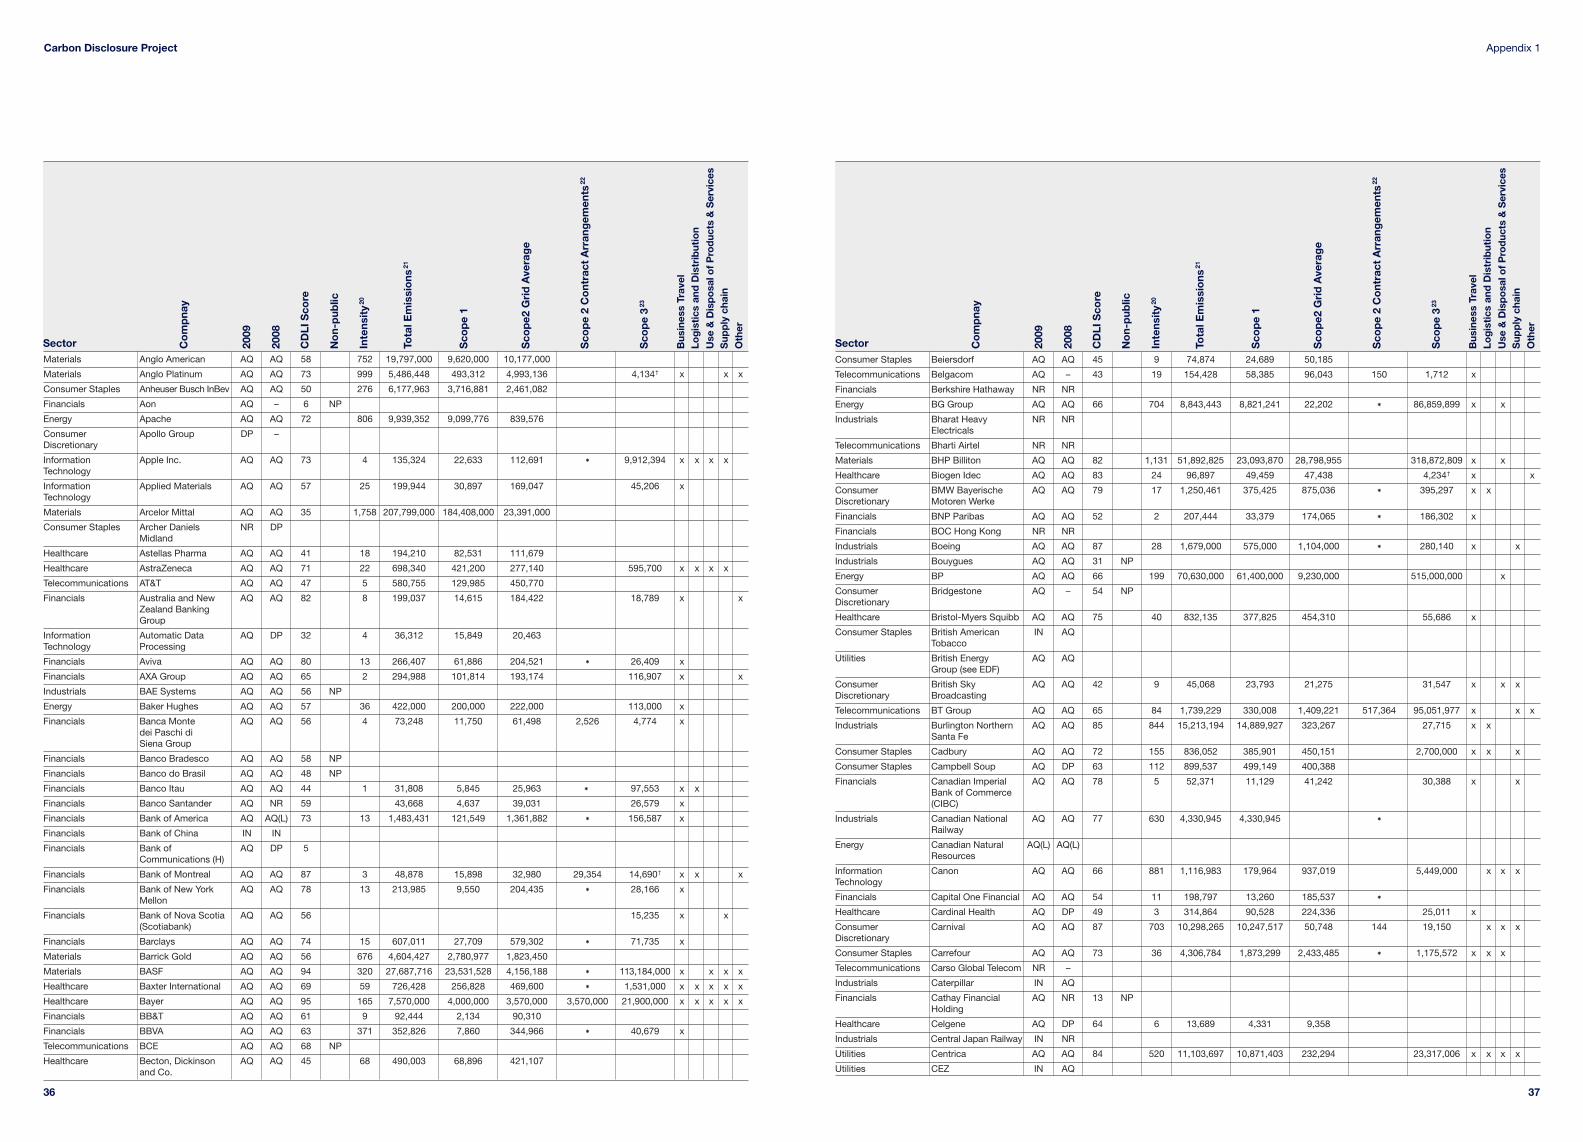
37
Appendix 1
36
Carbon Disclosure Project
Consumer Staples Beiersdorf AQ AQ 45 9 74,874 24,689 50,185
Telecommunications Belgacom AQ – 43 19 154,428 58,385 96,043 150 1,712 x
Financials Berkshire Hathaway NR NR
Energy BG Group AQ AQ 66 704 8,843,443 8,821,241 22,202 ✱ 86,859,899 x x
Industrials Bharat Heavy NR NRElectricals
Telecommunications Bharti Airtel NR NR
Materials BHP Billiton AQ AQ 82 1,131 51,892,825 23,093,870 28,798,955 318,872,809 x x
Healthcare Biogen Idec AQ AQ 83 24 96,897 49,459 47,438 4,234† x x
Consumer BMW Bayerische AQ AQ 79 17 1,250,461 375,425 875,036 ✱ 395,297 x xDiscretionary Motoren Werke
Financials BNP Paribas AQ AQ 52 2 207,444 33,379 174,065 ✱ 186,302 x
Financials BOC Hong Kong NR NR
Industrials Boeing AQ AQ 87 28 1,679,000 575,000 1,104,000 ✱ 280,140 x x
Industrials Bouygues AQ AQ 31 NP
Energy BP AQ AQ 66 199 70,630,000 61,400,000 9,230,000 515,000,000 x
Consumer Bridgestone AQ – 54 NPDiscretionary
Healthcare Bristol-Myers Squibb AQ AQ 75 40 832,135 377,825 454,310 55,686 x
Consumer Staples British American IN AQTobacco
Utilities British Energy AQ AQGroup (see EDF)
Consumer British Sky AQ AQ 42 9 45,068 23,793 21,275 31,547 x x xDiscretionary Broadcasting
Telecommunications BT Group AQ AQ 65 84 1,739,229 330,008 1,409,221 517,364 95,051,977 x x x
Industrials Burlington Northern AQ AQ 85 844 15,213,194 14,889,927 323,267 27,715 x xSanta Fe
Consumer Staples Cadbury AQ AQ 72 155 836,052 385,901 450,151 2,700,000 x x x
Consumer Staples Campbell Soup AQ DP 63 112 899,537 499,149 400,388
Financials Canadian Imperial AQ AQ 78 5 52,371 11,129 41,242 30,388 x xBank of Commerce (CIBC)
Industrials Canadian National AQ AQ 77 630 4,330,945 4,330,945 ✱
Railway
Energy Canadian Natural AQ(L) AQ(L)Resources
Information Canon AQ AQ 66 881 1,116,983 179,964 937,019 5,449,000 x x xTechnology
Financials Capital One Financial AQ AQ 54 11 198,797 13,260 185,537 ✱
Healthcare Cardinal Health AQ DP 49 3 314,864 90,528 224,336 25,011 x
Consumer Carnival AQ AQ 87 703 10,298,265 10,247,517 50,748 144 19,150 x x xDiscretionary
Consumer Staples Carrefour AQ AQ 73 36 4,306,784 1,873,299 2,433,485 ✱ 1,175,572 x x x
Telecommunications Carso Global Telecom NR –
Industrials Caterpillar IN AQ
Financials Cathay Financial AQ NR 13 NPHolding
Healthcare Celgene AQ DP 64 6 13,689 4,331 9,358
Industrials Central Japan Railway IN NR
Utilities Centrica AQ AQ 84 520 11,103,697 10,871,403 232,294 23,317,006 x x x x
Utilities CEZ IN AQ20
08
2009
Co
mp
nay
CD
LI S
core
Inte
nsit
y20
Tota
l Em
issi
ons
21
Sco
pe
1
Sco
pe2
Gri
d A
vera
ge
Sco
pe
2 C
ont
ract
Arr
ang
emen
ts22
Sco
pe
323
Sup
ply
cha
inU
se &
Dis
po
sal o
f P
rod
ucts
& S
ervi
ces
Log
isti
cs a
nd D
istr
ibut
ion
Bus
ines
s Tr
avel
Oth
er
Sector2008
2009
Co
mp
nay
CD
LI S
core
Inte
nsit
y20
Tota
l Em
issi
ons
21
Sco
pe
1
Sco
pe2
Gri
d A
vera
ge
Sco
pe
2 C
ont
ract
Arr
ang
emen
ts22
Sco
pe
323
Sup
ply
cha
inU
se &
Dis
po
sal o
f P
rod
ucts
& S
ervi
ces
Log
isti
cs a
nd D
istr
ibut
ion
Bus
ines
s Tr
avel
Oth
er
SectorMaterials Anglo American AQ AQ 58 752 19,797,000 9,620,000 10,177,000
Materials Anglo Platinum AQ AQ 73 999 5,486,448 493,312 4,993,136 4,134† x x x
Consumer Staples Anheuser Busch InBev AQ AQ 50 276 6,177,963 3,716,881 2,461,082
Financials Aon AQ – 6 NP
Energy Apache AQ AQ 72 806 9,939,352 9,099,776 839,576
Consumer Apollo Group DP –Discretionary
Information Apple Inc. AQ AQ 73 4 135,324 22,633 112,691 ✱ 9,912,394 x x x xTechnology
Information Applied Materials AQ AQ 57 25 199,944 30,897 169,047 45,206 xTechnology
Materials Arcelor Mittal AQ AQ 35 1,758 207,799,000 184,408,000 23,391,000
Consumer Staples Archer Daniels NR DPMidland
Healthcare Astellas Pharma AQ AQ 41 18 194,210 82,531 111,679
Healthcare AstraZeneca AQ AQ 71 22 698,340 421,200 277,140 595,700 x x x x
Telecommunications AT&T AQ AQ 47 5 580,755 129,985 450,770
Financials Australia and New AQ AQ 82 8 199,037 14,615 184,422 18,789 x xZealand Banking Group
Information Automatic Data AQ DP 32 4 36,312 15,849 20,463Technology Processing
Financials Aviva AQ AQ 80 13 266,407 61,886 204,521 ✱ 26,409 x
Financials AXA Group AQ AQ 65 2 294,988 101,814 193,174 116,907 x x
Industrials BAE Systems AQ AQ 56 NP
Energy Baker Hughes AQ AQ 57 36 422,000 200,000 222,000 113,000 x
Financials Banca Monte AQ AQ 56 4 73,248 11,750 61,498 2,526 4,774 xdei Paschi di Siena Group
Financials Banco Bradesco AQ AQ 58 NP
Financials Banco do Brasil AQ AQ 48 NP
Financials Banco Itau AQ AQ 44 1 31,808 5,845 25,963 ✱ 97,553 x x
Financials Banco Santander AQ NR 59 43,668 4,637 39,031 26,579 x
Financials Bank of America AQ AQ(L) 73 13 1,483,431 121,549 1,361,882 ✱ 156,587 x
Financials Bank of China IN IN
Financials Bank of AQ DP 5Communications (H)
Financials Bank of Montreal AQ AQ 87 3 48,878 15,898 32,980 29,354 14,690† x x x
Financials Bank of New York AQ AQ 78 13 213,985 9,550 204,435 ✱ 28,166 xMellon
Financials Bank of Nova Scotia AQ AQ 56 15,235 x x(Scotiabank)
Financials Barclays AQ AQ 74 15 607,011 27,709 579,302 ✱ 71,735 x
Materials Barrick Gold AQ AQ 56 676 4,604,427 2,780,977 1,823,450
Materials BASF AQ AQ 94 320 27,687,716 23,531,528 4,156,188 ✱ 113,184,000 x x x x
Healthcare Baxter International AQ AQ 69 59 726,428 256,828 469,600 ✱ 1,531,000 x x x x x
Healthcare Bayer AQ AQ 95 165 7,570,000 4,000,000 3,570,000 3,570,000 21,900,000 x x x x x
Financials BB&T AQ AQ 61 9 92,444 2,134 90,310
Financials BBVA AQ AQ 63 371 352,826 7,860 344,966 ✱ 40,679 x
Telecommunications BCE AQ AQ 68 NP
Healthcare Becton, Dickinson AQ AQ 45 68 490,003 68,896 421,107and Co.
No
n-p
ublic
No
n-p
ublic

39
Appendix 1
38
Carbon Disclosure Project
Consumer Staples Danone AQ AQ 42 36 758,996 387,155 371,841
Industrials Deere AQ AQ 66 56 1,578,558 511,976 1,066,582
Information Dell AQ AQ 66 7 406,252 30,780 375,472 313,837 93,382 xTechnology
Consumer Denso NR AQDiscretionary
Financials Deutsche Bank AQ AQ 66 3 230,414 27,815 202,599 ✱ 87,441 x
Financials Deutsche Boerse AQ AQ 31 NP
Industrials Deutsche Post AQ AQ 63 88 6,700,000 6,700,000 ✱ 25,600,000 x x
Telecommunication Deutsche Telekom AQ AQ 66 33 2,816,751 375,427 2,441,324 24,381 xServices
Energy Devon Energy AQ AQ 47 271 4,170,000 3,680,000 490,000
Consumer Staples Diageo AQ AQ 66 90 729,000 625,000 104,000 ✱ 384,300 x x x
Energy Diamond Offshore NR –Drilling
Consumer DIRECTV Group NR DPDiscretionary
Utilities Dominion Resources AQ AQ 67 3,303 53,798,568 53,798,568 ✱
Materials Dow Chemical AQ AQ 63 614 35,299,000 27,773,000 7,526,000 5,020,000 x x
Utilities Duke Energy AQ AQ 64 7,482 98,811,000 98,811,000
Materials E.I du Pont AQ AQ 80 437 13,339,560 9,336,753 4,002,807 ✱ 78,457 x xde Nemours
Utilities E.ON AG AQ AQ 74 1,317 158,837,794 155,329,015 3,508,779 797,717 x x
Industrials EADS AQ AQ 69 NP
Industrials East Japan Railway AQ AQ 38 NP
Information eBay AQ AQ 59 14 116,618 6,210 110,408 10,198 xTechnology
Utilities Edison International AQ – 39 NP
Utilities EDP - Energias AQ AQ 75 1,107 21,384,671 19,813,643 1,571,028 4,902 x x xde Portugal
Healthcare Eisai NR X
Utilities Electricite de AQ(L) AQ 91,982,800 91,790,000 192,800France (EDF)
Utilities ELETROBRAS AQ AQ 49 23 300,514 300,514
Healthcare Eli Lilly AQ AQ 53 98 1,991,946 599,536 1,392,410 95,202† x x x
Information EMC AQ AQ 82 25 371,620 35,850 335,770 60,500 xTechnology
Industrials Emerson Electric AQ AQ 21 24 603,723 603,723
Energy Enbridge AQ AQ 68 390 5,096,400 2,559,800 2,536,600 23,405,000 x x
Energy Encana AQ AQ 70 422 10,917,978 9,644,166 1,273,812 ✱ 3,451 x x
Utilities ENEL AQ AQ 55 1,327 109,862,979 109,862,979
Energy ENI AQ AQ 63 442 66,200,812 62,428,000 3,772,812 ✱ 318,000,000 x
Utilities Entergy AQ AQ 78 3,734 48,891,292 33,186,984 15,704,308 ✱
Energy EOG Resources AQ AQ 41 25 159,119 159,119
Information Ericsson AQ AQ 63 8 224,000 28,000 196,000 ✱ 4,815,000 x x x xTechnology
Utilities Exelon AQ AQ 71 512 9,664,883 9,431,588 233,295 10,234 x x
Healthcare Express Scripts NR DP
Energy Exxon Mobil AQ AQ 62 341 145,000,000 131,000,000 14,000,000 ✱
2008
2009
Co
mp
nay
CD
LI S
core
Inte
nsit
y20
Tota
l Em
issi
ons
21
Sco
pe
1
Sco
pe2
Gri
d A
vera
ge
Sco
pe
2 C
ont
ract
Arr
ang
emen
ts22
Sco
pe
323
Sup
ply
cha
inU
se &
Dis
po
sal o
f P
rod
ucts
& S
ervi
ces
Log
isti
cs a
nd D
istr
ibut
ion
Bus
ines
s Tr
avel
Oth
er
Sector2008
2009
Co
mp
nay
CD
LI S
core
Inte
nsit
y20
Tota
l Em
issi
ons
21
Sco
pe
1
Sco
pe2
Gri
d A
vera
ge
Sco
pe
2 C
ont
ract
Arr
ang
emen
ts22
Sco
pe
323
Sup
ply
cha
inU
se &
Dis
po
sal o
f P
rod
ucts
& S
ervi
ces
Log
isti
cs a
nd D
istr
ibut
ion
Bus
ines
s Tr
avel
Oth
er
SectorFinancials Charles Schwab AQ AQ 3 NP
Energy Chesapeake Energy IN –
Financials Cheung Kong NR NR
Energy Chevron AQ AQ 88 267 68,195,321 62,978,970 5,216,351 ✱ 382,000,000 x x
Industrials China Communications IN DPConstruction (H)
Financials China Construction IN NRBank (H)
Financials China Life IN NRInsurance (H)
Telecommunications China Mobile IN NR
Financials China Overseas Land NR –& Investment
Energy China Petroleum NR NR& Chemical
Telecommunications China Telecom IN IN
Telecommunications China Unicom NR NR
Financials Chubb AQ AQ 30
Utilities Chubu Electric Power AQ AQ 50 2,338 64,730,000 64,730,000 30,000 x x x
Telecommunications Chunghwa Telecom AQ NR 45 151 930,439 27,175 903,264
Energy Cia Espanola NR NRDe Petroleos
Information Cisco Systems AQ AQ 88 15 598,382 51,620 546,762 307,143 197,951 xTechnology
Financials Citigroup AQ AQ 70 13 1,371,954 40,990 1,330,964 146,019 x x
Utilities CLP Holdings AQ AQ 68 6,342 44,430,017 44,422,000 8,017
Financials CME Group AQ NR 14 NP
Energy CNOOC (Red Chip) AQ AQ 33 NP
Consumer Staples Coca-Cola AQ AQ 70 162 5,160,436 1,951,041 3,209,395 59,000† x x
Consumer Staples Colgate-Palmolive AQ AQ 77 46 701,591 271,599 429,992 ✱ 87,572 x x
Consumer Comcast IN INDiscretionary
Financials Commonwealth AQ AQ 81 6 147,979 10,933 137,046 † xBank of Australia
Energy ConocoPhillips AQ AQ 52 NP
Utilities Consolidated Edison AQ AQ 79 351 4,769,429 4,211,511 557,918 ✱ † x
Information Corning AQ AQ 57 212 1,262,281 329,629 932,652 ✱
Technology
Consumer Staples Costco Wholesale AQ AQ 17 NP
Healthcare Covidien NR DP
Financials Credit Agricole AQ AQ 51 1 64,576 32,288 32,288 ✱ 54,742 x
Financials Credit Suisse AQ AQ 68 4 190,646 17,108 173,538 ✱ 83,888 x x
Materials CRH AQ AQ 54 500 14,503,000 13,049,000 1,454,000 1,000,000 x
Financials Criteria Caixa NR –
Healthcare CSL AQ AQ 65 60 148,334 52,861 95,473
Industrials CSX AQ AQ 68 570 6,419,342 6,046,277 373,065 ✱
Consumer Staples CVS Caremark NR NR
Healthcare Daiichi Sankyo AQ AQ 40 NP
Consumer Daimler AQ AQ 65 NPDiscretionary
Industrials Danaher AQ AQ 24 NP
No
n-p
ublic
No
n-p
ublic
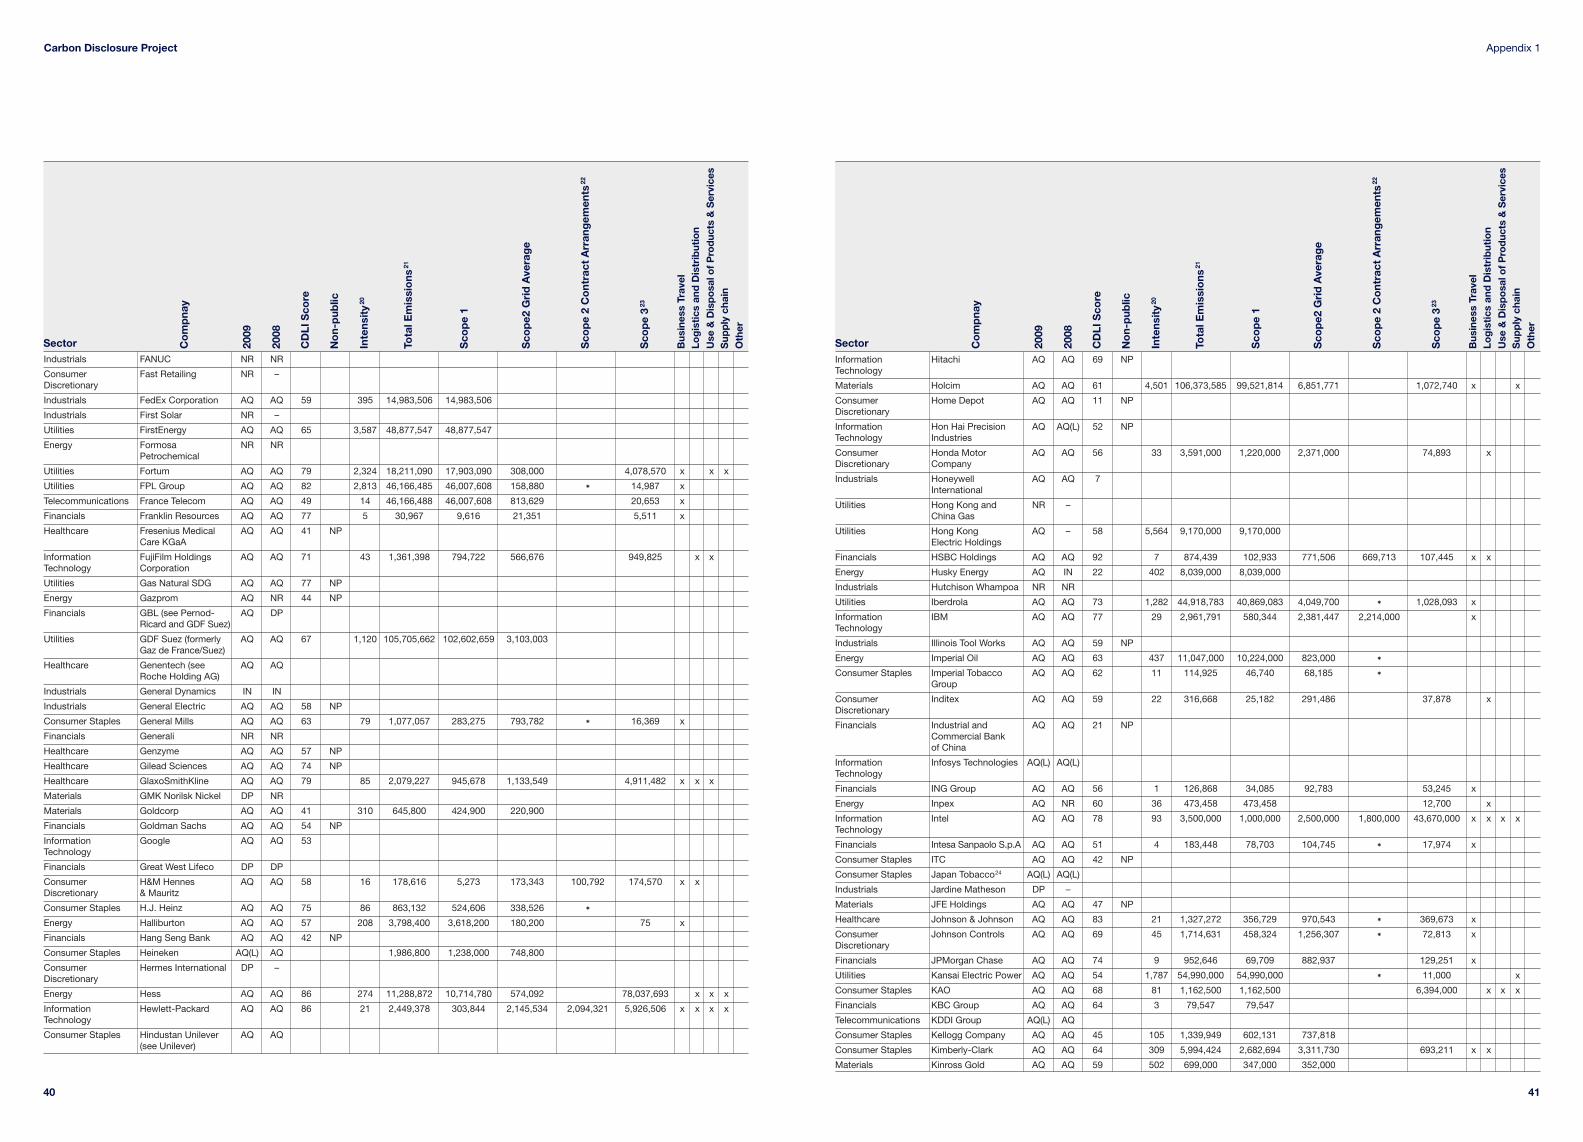
41
Appendix 1
40
Carbon Disclosure Project
Information Hitachi AQ AQ 69 NPTechnology
Materials Holcim AQ AQ 61 4,501 106,373,585 99,521,814 6,851,771 1,072,740 x x
Consumer Home Depot AQ AQ 11 NPDiscretionary
Information Hon Hai Precision AQ AQ(L) 52 NPTechnology Industries
Consumer Honda Motor AQ AQ 56 33 3,591,000 1,220,000 2,371,000 74,893 xDiscretionary Company
Industrials Honeywell AQ AQ 7International
Utilities Hong Kong and NR –China Gas
Utilities Hong Kong AQ – 58 5,564 9,170,000 9,170,000Electric Holdings
Financials HSBC Holdings AQ AQ 92 7 874,439 102,933 771,506 669,713 107,445 x x
Energy Husky Energy AQ IN 22 402 8,039,000 8,039,000
Industrials Hutchison Whampoa NR NR
Utilities Iberdrola AQ AQ 73 1,282 44,918,783 40,869,083 4,049,700 ✱ 1,028,093 x
Information IBM AQ AQ 77 29 2,961,791 580,344 2,381,447 2,214,000 xTechnology
Industrials Illinois Tool Works AQ AQ 59 NP
Energy Imperial Oil AQ AQ 63 437 11,047,000 10,224,000 823,000 ✱
Consumer Staples Imperial Tobacco AQ AQ 62 11 114,925 46,740 68,185 ✱
Group
Consumer Inditex AQ AQ 59 22 316,668 25,182 291,486 37,878 xDiscretionary
Financials Industrial and AQ AQ 21 NPCommercial Bank of China
Information Infosys Technologies AQ(L) AQ(L)Technology
Financials ING Group AQ AQ 56 1 126,868 34,085 92,783 53,245 x
Energy Inpex AQ NR 60 36 473,458 473,458 12,700 x
Information Intel AQ AQ 78 93 3,500,000 1,000,000 2,500,000 1,800,000 43,670,000 x x x xTechnology
Financials Intesa Sanpaolo S.p.A AQ AQ 51 4 183,448 78,703 104,745 ✱ 17,974 x
Consumer Staples ITC AQ AQ 42 NP
Consumer Staples Japan Tobacco24 AQ(L) AQ(L)
Industrials Jardine Matheson DP –
Materials JFE Holdings AQ AQ 47 NP
Healthcare Johnson & Johnson AQ AQ 83 21 1,327,272 356,729 970,543 ✱ 369,673 x
Consumer Johnson Controls AQ AQ 69 45 1,714,631 458,324 1,256,307 ✱ 72,813 xDiscretionary
Financials JPMorgan Chase AQ AQ 74 9 952,646 69,709 882,937 129,251 x
Utilities Kansai Electric Power AQ AQ 54 1,787 54,990,000 54,990,000 ✱ 11,000 x
Consumer Staples KAO AQ AQ 68 81 1,162,500 1,162,500 6,394,000 x x x
Financials KBC Group AQ AQ 64 3 79,547 79,547
Telecommunications KDDI Group AQ(L) AQ
Consumer Staples Kellogg Company AQ AQ 45 105 1,339,949 602,131 737,818
Consumer Staples Kimberly-Clark AQ AQ 64 309 5,994,424 2,682,694 3,311,730 693,211 x x
Materials Kinross Gold AQ AQ 59 502 699,000 347,000 352,00020
08
2009
Co
mp
nay
CD
LI S
core
Inte
nsit
y20
Tota
l Em
issi
ons
21
Sco
pe
1
Sco
pe2
Gri
d A
vera
ge
Sco
pe
2 C
ont
ract
Arr
ang
emen
ts22
Sco
pe
323
Sup
ply
cha
inU
se &
Dis
po
sal o
f P
rod
ucts
& S
ervi
ces
Log
isti
cs a
nd D
istr
ibut
ion
Bus
ines
s Tr
avel
Oth
er
Sector2008
2009
Co
mp
nay
CD
LI S
core
Inte
nsit
y20
Tota
l Em
issi
ons
21
Sco
pe
1
Sco
pe2
Gri
d A
vera
ge
Sco
pe
2 C
ont
ract
Arr
ang
emen
ts22
Sco
pe
323
Sup
ply
cha
inU
se &
Dis
po
sal o
f P
rod
ucts
& S
ervi
ces
Log
isti
cs a
nd D
istr
ibut
ion
Bus
ines
s Tr
avel
Oth
er
SectorIndustrials FANUC NR NR
Consumer Fast Retailing NR –Discretionary
Industrials FedEx Corporation AQ AQ 59 395 14,983,506 14,983,506
Industrials First Solar NR –
Utilities FirstEnergy AQ AQ 65 3,587 48,877,547 48,877,547
Energy Formosa NR NRPetrochemical
Utilities Fortum AQ AQ 79 2,324 18,211,090 17,903,090 308,000 4,078,570 x x x
Utilities FPL Group AQ AQ 82 2,813 46,166,485 46,007,608 158,880 ✱ 14,987 x
Telecommunications France Telecom AQ AQ 49 14 46,166,488 46,007,608 813,629 20,653 x
Financials Franklin Resources AQ AQ 77 5 30,967 9,616 21,351 5,511 x
Healthcare Fresenius Medical AQ AQ 41 NPCare KGaA
Information FujiFilm Holdings AQ AQ 71 43 1,361,398 794,722 566,676 949,825 x xTechnology Corporation
Utilities Gas Natural SDG AQ AQ 77 NP
Energy Gazprom AQ NR 44 NP
Financials GBL (see Pernod- AQ DPRicard and GDF Suez)
Utilities GDF Suez (formerly AQ AQ 67 1,120 105,705,662 102,602,659 3,103,003Gaz de France/Suez)
Healthcare Genentech (see AQ AQRoche Holding AG)
Industrials General Dynamics IN IN
Industrials General Electric AQ AQ 58 NP
Consumer Staples General Mills AQ AQ 63 79 1,077,057 283,275 793,782 ✱ 16,369 x
Financials Generali NR NR
Healthcare Genzyme AQ AQ 57 NP
Healthcare Gilead Sciences AQ AQ 74 NP
Healthcare GlaxoSmithKline AQ AQ 79 85 2,079,227 945,678 1,133,549 4,911,482 x x x
Materials GMK Norilsk Nickel DP NR
Materials Goldcorp AQ AQ 41 310 645,800 424,900 220,900
Financials Goldman Sachs AQ AQ 54 NP
Information Google AQ AQ 53Technology
Financials Great West Lifeco DP DP
Consumer H&M Hennes AQ AQ 58 16 178,616 5,273 173,343 100,792 174,570 x xDiscretionary & Mauritz
Consumer Staples H.J. Heinz AQ AQ 75 86 863,132 524,606 338,526 ✱
Energy Halliburton AQ AQ 57 208 3,798,400 3,618,200 180,200 75 x
Financials Hang Seng Bank AQ AQ 42 NP
Consumer Staples Heineken AQ(L) AQ 1,986,800 1,238,000 748,800
Consumer Hermes International DP –Discretionary
Energy Hess AQ AQ 86 274 11,288,872 10,714,780 574,092 78,037,693 x x x
Information Hewlett-Packard AQ AQ 86 21 2,449,378 303,844 2,145,534 2,094,321 5,926,506 x x x xTechnology
Consumer Staples Hindustan Unilever AQ AQ(see Unilever)
No
n-p
ublic
No
n-p
ublic

43
Appendix 1
42
Carbon Disclosure Project
Financials Mitsui Fudosan NR NR
Financials Mitsui Sumitomo AQ AQInsurance24
Financials Mizuho Financial AQ AQ 42 5 236,966 12,995 223,971 93 xGroup
Materials Monsanto AQ AQ 49 183 2,081,000 1,287,000 794,000
Financials Morgan Stanley AQ AQ 54 6 350,024 7,609 342,415 71,711 x
Consumer Staples Morrison AQ AQ 43 95 1,233,351 632,857 600,494 39,675 xSupermarkets
Materials Mosaic Company NR NR
Telecommunications MTN Group AQ AQ 39 22 248,927 8,100 240,827
Industrials MTR Corporation AQ AQ 48 478 1,087,954 21,775 1,066,179 1,129† x x
Financials Munich Re AQ AQ 72 2 156,648 8,891 147,757 28,744 67,395 x
Financials National Australia Bank AQ AQ 82 6 223,805 15,337 208,468 176,244 16,107† x x
Utilities National Grid AQ AQ 69 1,066 12,182,000 11,939,000 243,000 5,263,000 x x
Utilities National Thermal NR NRPower (NTPC)
Energy National-Oilwell Varco NR NR
Consumer Staples Nestle AQ AQ 60 71 7,374,453 4,217,927 3,156,526 ✱ 2,150,000 x
Materials Newmont Mining AQ AQ 70 859 5,325,543 4,138,189 1,187,354 268,947
Consumer News Corporation AQ AQ 75 19 637,274 108,931 528,343 177,650 x x xDiscretionary
Energy Nexen AQ AQ 68 599 3,830,000 3,610,000 220,000
Consumer NIKE AQ AQ 41 6 109,284 109,284 1,526,404 x x xDiscretionary
Information Nintendo AQ AQ 15 NPTechnology
Materials Nippon Steel AQ(L) AQ
Telecommunications Nippon Telegraph AQ AQ 42 31 3,599,000 222,000 3,377,000& Telephone (NTT)
Consumer Nissan Motor AQ AQ 69 29 2,440,000 909,000 1,531,000 ✱ 170,862,000 x x xDiscretionary
Information Nokia Group AQ AQ 78 4 279,300 14,700 264,600 ✱ 5,252,500 x x x xTechnology
Financials Nomura Holdings AQ AQ 45 6 49,261 49,261
Financials Nordea Bank AQ AQ 58 NP
Industrials Norfolk Southern AQ AQ 11
Financials Northern Trust AQ AQ 50 14 74,936 7,759 67,177 10,483 x
Industrials Northrop Grumman AQ AQ 42
Healthcare Novartis AQ AQ 70 36 1,501,730 575,589 926,141 182,200 x
Healthcare Novo Nordisk AQ AQ 73 25 214,727 43,196 171,531 120,000 x x
Information NTT Data24 AQ AQTechnology
Telecommunications NTT DoCoMo AQ AQ 45 21 1,090,169 7,613 1,082,556 x
Materials Nucor DP NR
Energy Occidental Petroleum AQ AQ 41 665 16,100,000 10,100,000 6,000,000
Energy Oil & Natural Gas AQ AQ 34
Telecommunications Optus (SingTel) AQ DP 65 48 501,534 7,134 494,400 x
Information Oracle AQ AQ 35Technology
2008
2009
Co
mp
nay
CD
LI S
core
Inte
nsit
y20
Tota
l Em
issi
ons
21
Sco
pe
1
Sco
pe2
Gri
d A
vera
ge
Sco
pe
2 C
ont
ract
Arr
ang
emen
ts22
Sco
pe
323
Sup
ply
cha
inU
se &
Dis
po
sal o
f P
rod
ucts
& S
ervi
ces
Log
isti
cs a
nd D
istr
ibut
ion
Bus
ines
s Tr
avel
Oth
er
Sector2008
2009
Co
mp
nay
CD
LI S
core
Inte
nsit
y20
Tota
l Em
issi
ons
21
Sco
pe
1
Sco
pe2
Gri
d A
vera
ge
Sco
pe
2 C
ont
ract
Arr
ang
emen
ts22
Sco
pe
323
Sup
ply
cha
inU
se &
Dis
po
sal o
f P
rod
ucts
& S
ervi
ces
Log
isti
cs a
nd D
istr
ibut
ion
Bus
ines
s Tr
avel
Oth
er
SectorConsumer Staples Kirin Holdings24 AQ AQ
Consumer Kohl’s AQ AQ 68 50 816,144 27,156 788,988 ✱ 182,154 xDiscretionary
Industrials Komatsu AQ AQ 63 20 449,000 152,000 297,000 2,665,900 x x x x
Utilities Korea Electric AQ AQ 49 7,658 191,884,046 180,952,435 10,931,611Power (Kepco)
Consumer Staples Kraft Foods AQ AQ 68 61 2,581,279 1,339,442 1,241,837 1,032,809 x x
Consumer Staples Kroger AQ AQ 18 NP
Information Kyocera Corporation AQ AQ 56 NPTechnology
Utilities Kyushu Electric Power NR AQ
Consumer Staples L’Oreal AQ AQ 63 8 203,799 80,823 122,976 2,214,936 x x x x
Materials Lafarge AQ AQ 84 4,489 118,768,000 108,879,000 9,889,000 2,264,000 x x x
Materials Linde AQ AQ 60 807 14,200,000 4,500,000 9,700,000 760,000 x
Financials Lloyds Banking Group AQ AQ 80 22 455,651 97,709 357,942 ✱ 25,129 x
Industrials Lockheed Martin IN DP
Consumer Loews NR DPDiscretionary
Consumer Staples Lorillard NR –
Consumer Lowe’s AQ NR 57 NPDiscretionary
Energy Lukoil NR NR
Consumer LVMH AQ AQ 72 10 238,498 46,358 192,140 370,348 x x xDiscretionary
Financials Manulife Financial AQ AQ 58 1 37,059 4,415 32,644
Energy Marathon Oil AQ AQ 59 259 18,640,000 14,010,000 4,630,000 ✱ 8,000 x
Telecommunications Maroc Telecom NR –
Financials Marsh & McLennan AQ AQ 32 NP
Information MasterCard AQ – 51 NPTechnology
Consumer McDonald’s AQ AQ 38 NPDiscretionary
Healthcare Medco Health AQ AQ 67 1 69,914 3,230 66,684Solutions
Healthcare Medtronic AQ AQ 58 18 249,335 25,229 224,106
Healthcare Merck & Co. AQ AQ 71 50 1,187,582 663,506 524,076 ✱ 60,595 x
Financials Merrill Lynch (see AQ AQBank of America Corporation)
Financials MetLife AQ NR 57 NP
Consumer Staples Metro AQ AQ 50
Information Microsoft AQ AQ 70 14 845,925 46,066 799,859 ✱ 347,738† x x xTechnology
Industrials Mitsubishi AQ AQ 46 0 4,238 4,238 95,100 x
Industrials Mitsubishi Electric NR AQ
Financials Mitsubishi Estate AQ AQ 25 NP
Industrials Mitsubishi Heavy AQ AQ 44 245,000 xIndustries
Financials Mitsubishi UFJ AQ AQ 58 5 286,343 22,223 264,120 22,538 x xFinancial Group
Industrials Mitsui & Co AQ AQ 46 NP
No
n-p
ublic
No
n-p
ublic

45
Appendix 1
44
Carbon Disclosure Project
Materials Rohm and Haas AQ AQ 39 NP
Energy Rosneft DP NR
Consumer Staples Royal Ahold AQ IN 45 69 2,474,427 1,150,964 1,323,463
Financials Royal Bank of Canada AQ AQ 74 4 137,390 27,619 109,771 ✱ 23,219 x
Financials Royal Bank of AQ AQ 77 13 690,222 118,270 571,952 ✱ 59,550 xScotland Group
Energy Royal Dutch Shell AQ AQ 75 185 85,000,000 75,000,000 10,000,000 691,401,000 x x x
Telecommunications Royal KPN AQ AQ 73 27 534,829 87,829 447,000 ✱ † x
Utilities RWE AQ AQ 83 3,743 247,180,000 172,100,000 75,080,000 ✱ 68,145,400 x x x
Consumer Staples SABMiller AQ AQ 54 109 2,343,184 1,513,037 830,147 404,533 x
Industrials Saint-Gobain AQ AQ 67 304 18,500,571 14,029,930 4,470,641
Financials Sampo DP DP
Information Samsung Electronics AQ AQ 87 97 9,319,257 4,043,115 5,276,142 ✱ 96,104,520 x x x xTechnology
Healthcare Sanofi-Aventis AQ AQ 76 NP
Information SAP AQ AQ 54 14 224,000 110,000 114,000 185,000† x xTechnology
Energy Sasol AQ AQ 71 5,171 72,680,000 62,966,000 9,714,000 570,992 x
Financials Sberbank NR IN
Healthcare Schering-Plough AQ AQ 85 54 1,004,144 446,987 557,157 32,416 x
Energy Schlumberger AQ AQ 64 70 1,890,000 1,500,000 390,000 ✱ 1,332,000 x x x
Industrials Schneider Electric AQ AQ 60 22 558,200 240,200 318,000 7,200,000† x x x x
Utilities Scottish & AQ AQ 78 1,270 19,372,778 19,286,697 86,081 65,567 47,109 x xSouthern Energy
Industrials Secom NR NR
Utilities Sempra Energy AQ AQ 41 971 10,441,679 9,906,141 535,538
Consumer Staples Seven & I Holding AQ AQ(L) 45 NP
Materials Shin Etsu Chemical AQ AQ 35
Industrials Siemens AQ AQ 85 33 3,540,000 1,480,000 2,060,000 1,051,200 x x
Financials Simon Property Group AQ AQ 86 189 715,982 26,068 689,914 ✱ 2,876 x x
Telecommunications SK Telecom AQ AQ 54 35 389,427 10,045 379,382
Utilities Snam Rete Gas AQ AQ 65 559 1,478,335 1,450,000 28,335
Financials Societe Generale AQ AQ 68 3 216,011 37,571 178,440 78,360 x x
Telecommunications SoftBank IN NR
Consumer Sony Corporation AQ AQ 66 22 1,884,460 434,116 1,450,344 1,350,000 24,338,000 x x xDiscretionary
Utilities Southern AQ AQ 48 8,241 141,137,000 141,137,000
Materials Southern Copper NR NRCorporation
Energy Southwestern Energy NR –
Energy Spectra Energy AQ AQ 88 2,175 11,035,854 9,614,164 1,421,690 4,419 x
Financials Standard Bank Group AQ AQ 51 10 165,332 6,107 159,225 3,492 x
Financials Standard Chartered AQ AQ 66 12 269,902 14,913 254,989 50,262 x
Consumer Staples AQ AQ 60 20 396,600 62,400 334,200 ✱
Discretionary
Financials State Bank of India AQ(L) AQ
Financials State Street AQ AQ 63 9 120,000 5,000 115,000 90,000 13,500 x
Energy StatoilHydro AQ AQ 40 164 15,300,000 15,100,000 200,000 46,000 x
Healthcare Stryker IN NR
Industrials Sumitomo Corporation AQ AQ 43 NP20
08
2009
Co
mp
nay
CD
LI S
core
Inte
nsit
y20
Tota
l Em
issi
ons
21
Sco
pe
1
Sco
pe2
Gri
d A
vera
ge
Sco
pe
2 C
ont
ract
Arr
ang
emen
ts22
Sco
pe
323
Sup
ply
cha
inU
se &
Dis
po
sal o
f P
rod
ucts
& S
ervi
ces
Log
isti
cs a
nd D
istr
ibut
ion
Bus
ines
s Tr
avel
Oth
er
Sector2008
2009
Co
mp
nay
CD
LI S
core
Inte
nsit
y20
Tota
l Em
issi
ons
21
Sco
pe
1
Sco
pe2
Gri
d A
vera
ge
Sco
pe
2 C
ont
ract
Arr
ang
emen
ts22
Sco
pe
323
Sup
ply
cha
inU
se &
Dis
po
sal o
f P
rod
ucts
& S
ervi
ces
Log
isti
cs a
nd D
istr
ibut
ion
Bus
ines
s Tr
avel
Oth
er
SectorFinancials Overseas Chinese AQ AQ 11 NP
Banking
Industrials PACCAR DP DP
Consumer Panasonic AQ AQ 67 43 3,673,095 904,898 2,768,197 76,880,000 x xDiscretionary
Information Paychex NR NRTechnology
Consumer Staples PepsiCo AQ AQ 63 98 4,252,973 2,878,433 1,374,540 263,300 x x
Consumer Staples Pernod-Ricard AQ AQ 59 46 420,965 311,461 109,504 105,728 621,548 x
Energy Petro Canada IN AQ
Energy PETROBRAS AQ AQ 44 NP
Energy PetroChina IN IN
Healthcare Pfizer AQ AQ 75 42 2,018,769 1,017,810 1,000,959 120,820 x
Utilities PG&E AQ AQ 88 235 3,439,406 1,903,901 1,535,505 22,569,017 x
Consumer Staples Philip Morris NR –International
Industrials Philips Electronics AQ AQ 73 35 1,288,665 483,584 805,081 720,509 308,443,296 x x x x
Financials PKO Bank Polski NR NR
Financials PNC Financial DP AQ(L)Services
Materials POSCO AQ AQ 68 2,197 72,800,000 70,600,000 2,200,000 7,421 x
Materials Potash Corporation AQ AQ 59 1,185 9,639,000 7,996,000 1,643,000of Saskatchewan
Financials Power Financial IN DP
Utilities PPL NR AQ
Materials Praxair AQ AQ 83 1,244 13,428,346 3,695,830 9,732,516 ✱ 265,292 x x
Consumer Staples Procter & Gamble AQ AQ 55 76 6,384,000 2,782,000 3,602,000
Utilities Progress Energy AQ AQ 67 5,445 49,918,840 49,918,840
Financials Progressive AQ AQ 56 19 237,688 146,873 90,815
Financials Prudential AQ AQ 57 -7 74,139 19,337 54,802 19,271 x x
Energy PTT AQ AQ 53 NP
Utilities Public Service AQ AQ 88 1,962 26,138,959 24,287,856 1,851,103 ✱ 42,593,087 x x xEnterprise Group
Financials Public Storage DP DP
Financials QBE Insurance Group AQ AQ 47 4 37,709 567 37,142 10,398 x
Information Qualcomm AQ AQ 48 8 90,616 43,922 46,694Technology
Industrials Raytheon AQ AQ 48 27 617,445 117,112 500,333
Consumer Staples Reckitt Benckiser AQ AQ 80 44 291,059 125,795 165,264 182,158,32† x x x x x
Consumer Reed Elsevier AQ AQ 76 16 126,212 18,559 107,653 93,512 131,703 x x xDiscretionary
Energy Reliance Industries NR NR
Energy Repsol YPF AQ AQ 75 356 28,570,000 26,550,000 2,020,000 173,427,031 x x x x
Information Research In Motion AQ DP 44 4 36,933 9,313 27,620 20,746 xTechnology
Financials Resona Holdings24 AQ DP NP
Consumer Staples Reynolds American AQ AQ 59 39 349,377 144,979 204,398 ✱
Materials Rio Tinto AQ AQ 87 927 50,300,000 30,300,000 20,000,000 ✱ 657,555,000 x x x x x
Healthcare Roche Holding AQ AQ 45 21 917,133 439,509 477,624 136,343 x x
Telecommunications Rogers AQ AQ 44 15 141,758 39,205 102,553 48,445 xCommunications
No
n-p
ublic
No
n-p
ublic
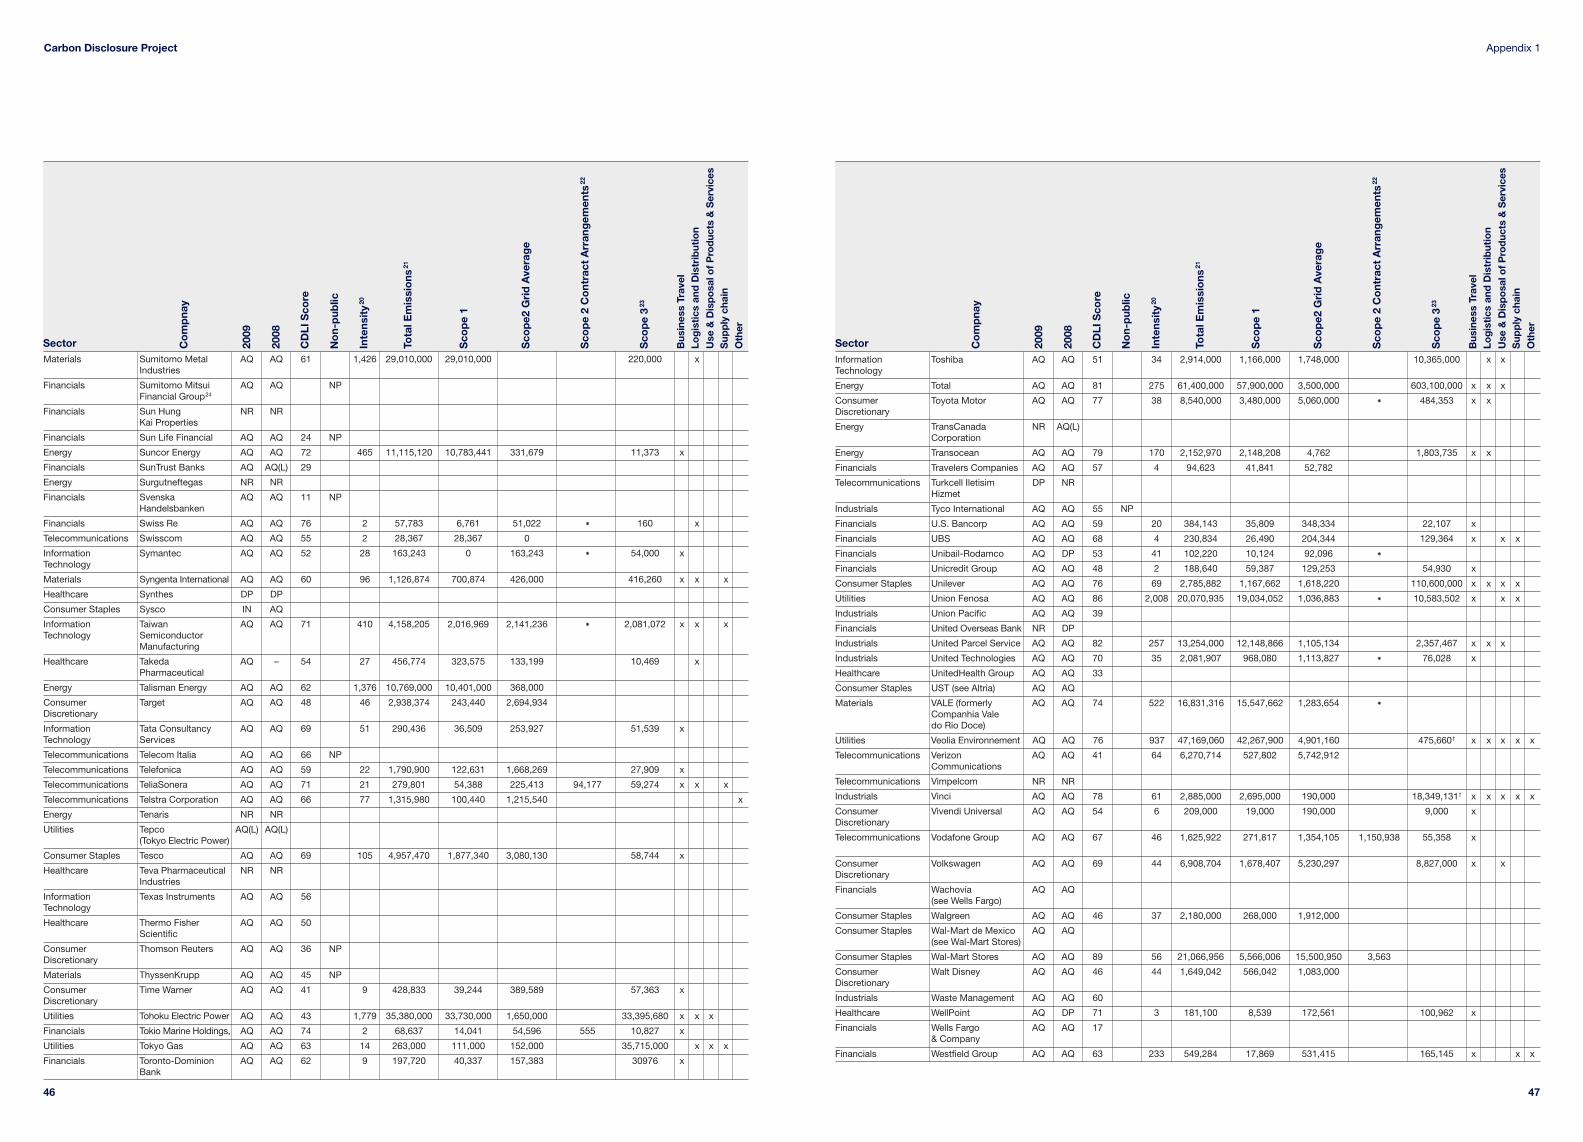
47
Appendix 1
46
Carbon Disclosure Project
Information Toshiba AQ AQ 51 34 2,914,000 1,166,000 1,748,000 10,365,000 x xTechnology
Energy Total AQ AQ 81 275 61,400,000 57,900,000 3,500,000 603,100,000 x x x
Consumer Toyota Motor AQ AQ 77 38 8,540,000 3,480,000 5,060,000 ✱ 484,353 x xDiscretionary
Energy TransCanada NR AQ(L)Corporation
Energy Transocean AQ AQ 79 170 2,152,970 2,148,208 4,762 1,803,735 x x
Financials Travelers Companies AQ AQ 57 4 94,623 41,841 52,782
Telecommunications Turkcell Iletisim DP NRHizmet
Industrials Tyco International AQ AQ 55 NP
Financials U.S. Bancorp AQ AQ 59 20 384,143 35,809 348,334 22,107 x
Financials UBS AQ AQ 68 4 230,834 26,490 204,344 129,364 x x x
Financials Unibail-Rodamco AQ DP 53 41 102,220 10,124 92,096 ✱
Financials Unicredit Group AQ AQ 48 2 188,640 59,387 129,253 54,930 x
Consumer Staples Unilever AQ AQ 76 69 2,785,882 1,167,662 1,618,220 110,600,000 x x x x
Utilities Union Fenosa AQ AQ 86 2,008 20,070,935 19,034,052 1,036,883 ✱ 10,583,502 x x x
Industrials Union Pacific AQ AQ 39
Financials United Overseas Bank NR DP
Industrials United Parcel Service AQ AQ 82 257 13,254,000 12,148,866 1,105,134 2,357,467 x x x
Industrials United Technologies AQ AQ 70 35 2,081,907 968,080 1,113,827 ✱ 76,028 x
Healthcare UnitedHealth Group AQ AQ 33
Consumer Staples UST (see Altria) AQ AQ
Materials VALE (formerly AQ AQ 74 522 16,831,316 15,547,662 1,283,654 ✱
Companhia Vale do Rio Doce)
Utilities Veolia Environnement AQ AQ 76 937 47,169,060 42,267,900 4,901,160 475,660† x x x x x
Telecommunications Verizon AQ AQ 41 64 6,270,714 527,802 5,742,912Communications
Telecommunications Vimpelcom NR NR
Industrials Vinci AQ AQ 78 61 2,885,000 2,695,000 190,000 18,349,131† x x x x x
Consumer Vivendi Universal AQ AQ 54 6 209,000 19,000 190,000 9,000 xDiscretionary
Telecommunications Vodafone Group AQ AQ 67 46 1,625,922 271,817 1,354,105 1,150,938 55,358 x
Consumer Volkswagen AQ AQ 69 44 6,908,704 1,678,407 5,230,297 8,827,000 x xDiscretionary
Financials Wachovia AQ AQ(see Wells Fargo)
Consumer Staples Walgreen AQ AQ 46 37 2,180,000 268,000 1,912,000
Consumer Staples Wal-Mart de Mexico AQ AQ(see Wal-Mart Stores)
Consumer Staples Wal-Mart Stores AQ AQ 89 56 21,066,956 5,566,006 15,500,950 3,563
Consumer Walt Disney AQ AQ 46 44 1,649,042 566,042 1,083,000Discretionary
Industrials Waste Management AQ AQ 60
Healthcare WellPoint AQ DP 71 3 181,100 8,539 172,561 100,962 x
Financials Wells Fargo AQ AQ 17& Company
Financials Westfield Group AQ AQ 63 233 549,284 17,869 531,415 165,145 x x x20
08
2009
Co
mp
nay
CD
LI S
core
Inte
nsit
y20
Tota
l Em
issi
ons
21
Sco
pe
1
Sco
pe2
Gri
d A
vera
ge
Sco
pe
2 C
ont
ract
Arr
ang
emen
ts22
Sco
pe
323
Sup
ply
cha
inU
se &
Dis
po
sal o
f P
rod
ucts
& S
ervi
ces
Log
isti
cs a
nd D
istr
ibut
ion
Bus
ines
s Tr
avel
Oth
er
Sector2008
2009
Co
mp
nay
CD
LI S
core
Inte
nsit
y20
Tota
l Em
issi
ons
21
Sco
pe
1
Sco
pe2
Gri
d A
vera
ge
Sco
pe
2 C
ont
ract
Arr
ang
emen
ts22
Sco
pe
323
Sup
ply
cha
inU
se &
Dis
po
sal o
f P
rod
ucts
& S
ervi
ces
Log
isti
cs a
nd D
istr
ibut
ion
Bus
ines
s Tr
avel
Oth
er
SectorMaterials Sumitomo Metal AQ AQ 61 1,426 29,010,000 29,010,000 220,000 x
Industries
Financials Sumitomo Mitsui AQ AQ NPFinancial Group24
Financials Sun Hung NR NRKai Properties
Financials Sun Life Financial AQ AQ 24 NP
Energy Suncor Energy AQ AQ 72 465 11,115,120 10,783,441 331,679 11,373 x
Financials SunTrust Banks AQ AQ(L) 29
Energy Surgutneftegas NR NR
Financials Svenska AQ AQ 11 NPHandelsbanken
Financials Swiss Re AQ AQ 76 2 57,783 6,761 51,022 ✱ 160 x
Telecommunications Swisscom AQ AQ 55 2 28,367 28,367 0
Information Symantec AQ AQ 52 28 163,243 0 163,243 ✱ 54,000 xTechnology
Materials Syngenta International AQ AQ 60 96 1,126,874 700,874 426,000 416,260 x x x
Healthcare Synthes DP DP
Consumer Staples Sysco IN AQ
Information Taiwan AQ AQ 71 410 4,158,205 2,016,969 2,141,236 ✱ 2,081,072 x x xTechnology Semiconductor
Manufacturing
Healthcare Takeda AQ – 54 27 456,774 323,575 133,199 10,469 xPharmaceutical
Energy Talisman Energy AQ AQ 62 1,376 10,769,000 10,401,000 368,000
Consumer Target AQ AQ 48 46 2,938,374 243,440 2,694,934Discretionary
Information Tata Consultancy AQ AQ 69 51 290,436 36,509 253,927 51,539 xTechnology Services
Telecommunications Telecom Italia AQ AQ 66 NP
Telecommunications Telefonica AQ AQ 59 22 1,790,900 122,631 1,668,269 27,909 x
Telecommunications TeliaSonera AQ AQ 71 21 279,801 54,388 225,413 94,177 59,274 x x x
Telecommunications Telstra Corporation AQ AQ 66 77 1,315,980 100,440 1,215,540 x
Energy Tenaris NR NR
Utilities Tepco AQ(L) AQ(L)(Tokyo Electric Power)
Consumer Staples Tesco AQ AQ 69 105 4,957,470 1,877,340 3,080,130 58,744 x
Healthcare Teva Pharmaceutical NR NRIndustries
Information Texas Instruments AQ AQ 56Technology
Healthcare Thermo Fisher AQ AQ 50Scientific
Consumer Thomson Reuters AQ AQ 36 NPDiscretionary
Materials ThyssenKrupp AQ AQ 45 NP
Consumer Time Warner AQ AQ 41 9 428,833 39,244 389,589 57,363 xDiscretionary
Utilities Tohoku Electric Power AQ AQ 43 1,779 35,380,000 33,730,000 1,650,000 33,395,680 x x x
Financials Tokio Marine Holdings, AQ AQ 74 2 68,637 14,041 54,596 555 10,827 x
Utilities Tokyo Gas AQ AQ 63 14 263,000 111,000 152,000 35,715,000 x x x
Financials Toronto-Dominion AQ AQ 62 9 197,720 40,337 157,383 30976 xBank
No
n-p
ublic
No
n-p
ublic

Glossary of terms
BRIC Brazil, Russia, India and China
CDLI Carbon DisclosureLeadership Index
CDM Clean DevelopmentMechanism – Kyoto Protocolcarbon reduction facility
CDP Carbon Disclosure Project
CSR Corporate SocialResponsibility
EU ETS European Union EmissionsTrading Scheme
FTSE Financial Times & StockExchange
GHG Greenhouse Gases
IPCC Intergovernmental Panel onClimate Change
M&A Mergers and Acquisitions
R&D Research & Development
SRI Socially ResponsibleInvesting
tCO2-e metric tons of carbon dioxideequivalent
Key
AQ Answered questionnaire
AQ(L) Answered questionnaire late
DP Declined to participate
IN Provided some information(but did not answer the CDPquestions)
NP Non public response
NR No response
– Company was not in the G 500, S&P 500 or FTSE 350
4948
8 Appendix 2Carbon Disclosure Project
2008
2009
Co
mp
nay
CD
LI S
core
Inte
nsit
y20
Tota
l Em
issi
ons
21
Sco
pe
1
Sco
pe2
Gri
d A
vera
ge
Sco
pe
2 C
ont
ract
Arr
ang
emen
ts22
Sco
pe
323
Sup
ply
cha
inU
se &
Dis
po
sal o
f P
rod
ucts
& S
ervi
ces
Log
isti
cs a
nd D
istr
ibut
ion
Bus
ines
s Tr
avel
Oth
er
SectorFinancials Westpac Banking AQ AQ 80 6 127,424 6,316 121,108 116,658 20,126 x x
Consumer Staples Wilmar International AQ – 47 NP
Energy Woodside Petroleum AQ AQ 64 NP
Consumer Staples Woolworths AQ AQ 82 95 3,108,719 675,991 2,432,728 85,313,090† x x x x
Healthcare Wyeth AQ AQ 57 50 1,144,236 567,580 576,656
Materials Xstrata AQ AQ 68 891 24,913,251 15,605,091 9,308,160 ✱ 215,157,719 x x x
Energy XTO Energy AQ AQ 35 725 5,575,267 4,922,450 652,817
Information Yahoo Japan24 AQ AQTechnology
Information Yahoo! AQ AQ 22 NPTechnology
Consumer Yum! Brands IN NRDiscretionary
Financials Zurich Financial AQ AQ 63 NPServices
No
n-p
ublic
20 Disclosed Scopes 1 and 2 emissions totals divided byannual US$ million revenues. Revenues based on dataretrieved from Bloomberg on June 18, 2009.
21 Scope 1 and Scope 2 grid average reported emissions.
22 Where there is a * in this column, the company did providedetail in relation to its contractual Scope 2 emissions.Please refer to the company response.
23 The Scope 3 figure is the sum of data given in answer toquestions 13.1-13.4. Information in response to 13.5 wasnot included in this figure. In a number of cases (markedwith †) the company did provide data for non-transferemissions under 13.5 and CDP advises you to look at theirfull response for details of these emissions.
24 This company answered CDP 2009 in Japanese and wastherefore not scored.

50
Printed on revive Pure White Uncoateda recycled grade containing 100% postconsumer waste and manufactured at a millaccredited with ISO 14001 environmentalmanagement standard.
The pulp used in this product is bleached usingan Elemental Chlorine Free process (ECF).
In addition, CDP has been made possible through the generous funding of:
Global Sponsor
Advisor and Report Writer
Advisors:Amory Lovins, Andrew Dlugolecki, Bill Thomas,Bob Monks, Colin Maltby, Hidemi Tomita,Hisakazu Okamura, Jane Ambachtscheer,Jeremy Oppenheim, Jon Johnson, Kathryn Murdoch, Kim Carstensen, Marc Fox,Martin Whittaker, Martin Wise, Masao Seki,Masaru Arai, Masayuki Itou, Ryuji Matsuhashi, Tim Weller, Tsuyoshi Mizuguchi
Organizations:Accounting for Sustainability, Allen & Overy,Association of British Insurers, BrooklynBridge, Ceres, Clinton Global Initiative,Confederation of British Industry, DevelopmentBank of Japan, Environmental ResearchGroup of the UK Faculty and Institute ofActuaries, EPA Energy Star, EPA ClimateLeaders, Forest Footprint Disclosure Project,GHG Protocol, Global Reporting Initiative,Institutional Investors Group on ClimateChange, Investor Group on Climate Change,Principles for Responsible Investing, SkaddenArps, The Climate Group, UK Foreign &Commonwealth Office, United NationsEnvironment Programme Finance Initiative,United Nations Global Compact, WorldBusiness Council for SustainableDevelopment, World Economic Forum, World Resources Institute, WWF.
Design implementation and production
Lavish is a leading Creative Services agency based in London. We specialize in the creation and management of brandassets and communication materials for clientsin the corporate and not-for-profit sectors.
For more information on Lavish visit www.lavishconnect.co.uk.
Our sincere thanks are extended to the following:
Notes