
carbon-capture-storage-lacq-pilot.pdf - Global CCS Institute
276
-
Upload
khangminh22 -
Category
Documents
-
view
4 -
download
0
Transcript of carbon-capture-storage-lacq-pilot.pdf - Global CCS Institute


CARBON CAPTURE AND STORAGE The Lacq pilot - Project and injection period 2006 - 2013

FORE-WORD
“We wish you an interesting read and hope at the end key concerns regarding CCS industry will be more comprehensive for all. We hope this book provides valuable insights for those involved in developing CCS in the future.”
Olivier CLERET de LANGAVANTSenior Vice President Strategy, Business Development and Research & DevelopmentTotal Exploration & Production

5
The group’s priorities in term of greenhouse gas control are to improve the energy efficiency of its industrial facilities, to deliver innovative solutions in terms of energy efficiency to its consumers, to reduce and then eliminate the flaring of associated gas, to invest in the development of complementary energy sources (biomass, solar) and to partici-pate in operational and R&D programs on CO2 capture, transport and geological storage. Total is also consolidating its efforts to address climate change by:
¬ Supporting the United Nations Global Compact’s call for companies to factor an internal carbon price into their investment decisions.
¬ Joining the World Bank's planned Zero Routine Flaring by 2030 Initiative. ¬ Joining the Climate and Clean Air Coalition, which works to more
effectively measure, manage and mitigate emissions of methane, a gas whose global warming potential is much higher than carbon dioxide’s.
It has been involved in CO2 injection and geological storage for over 15 years, in Canada for EOR (Weyburn oil field) and in Norway for aquifer storage (Sleipner, Snohvit). In 2006, the company decided to invest 60 million euros to launch the first end-to-end industrial chain Carbon Capture and Storage (CCS) project comprising the capture, transport and injection of CO2 into the depleted gas reservoir of Rousse in the southwest of France. Operated by Total Exploration Production France, the project gives a boost to the development of this promising technology. This CCS pilot was located in the Lacq basin approximately 800 kilometers from Paris.
The experimental plant was unique in several respects; by its size in capturing carbon through a 30 MWth
oxy-combustion gas boiler (unpre- cedented worldwide), by the choice of a depleted deep gas reservoir (unprecedented in Europe) located onshore five kilometers south of the agglomeration of Pau (around 140,000 inhabitants) and by its scope, operating a fully integrated industrial chain project (comprising extraction, treatment, combustion of natural gas, high-pressure steam production, CO2 capture, transport and injection) on the SEVESO-classified Lacq industrial complex.
This project entailed the conversion of an existing air-gas combustion boiler into an oxygen-gas combustion boiler, using oxygen delivered by an air separation unit (ASU) to obtain a more CO2 concentrated (and easier to capture) flue gas stream. The 30 MWth oxy-boiler was able to deliver up to 38 t/h of steam to the HP steam network of the Lacq sour gas pro-duction and treatment plant. After quenching of the flue gas stream, the rich CO2 stream was compressed (to 27 barg), dried and transported as a gas phase via existing pipelines to a depleted gas field, 29 kilometers away, where it was injected in the deep Rousse reservoir.
After internal project approval at the end of 2006, basic and detailed engi-neering was performed in 2007 and 2008. Construction works started in early 2008 and were finalized by mid-2009.
TOTAL IS COMMITTED TO REDUCING THE IMPACT OF ITS ACTIVITIES ON THE ENVIRONMENT, ESPECIALLY ITS GREENHOUSE GAS EMISSIONS.

6
At the same time, official authorizations were sought with the project providing complete reports on surface and subsurface aspects (2008). During the summer of 2008, the project went through two months of official public hearings. In May 2009, the capture, transport and storage project was officially permitted for Total Exploration Production France to operate the pilot.
The oxy boiler was started in mid-2009. The whole CCS pilot, including CO2 injection, was started on the January 8th 2010. The last injection of CO2 took place on the March 15th 2013. More than 51,000 tonnes of CO2 were injected during those 39 months.
Public and stakeholders information meetings had been held since the start of the project in early 2007 and before construction work commenced. A long public consultation and dialogue phase was organized, starting before any construction works. The Total approach was to set up an “open” and “transparent” dialogue with all the stakeholders upstream of the permitting process. Access was given to detailed information by the way of a dedicated website, brochures, a consultation dossier, a movie and a quarterly information letter which is still mailed to the neighborhood of the Rousse injection site.
Total’s main objectives in this experiment were:
¬ To demonstrate the technical feasibility and reliability of an integrated chain comprising CO2 capture, transportation and injection into a depleted gas reservoir and steam production;
¬ To acquire operating experience and data to upscale the oxy-combustion technology from pilot (30 MWth) to industrial scale (200 MWth) while downscaling the “oxy-combustion” capture cost compared to classical post capture technologies;
¬ To develop and apply geological storage qualification methodologies, monitoring methodologies and technologies on site to serve in future onshore storage monitoring programs that will be larger in scale, longer in term and economically and technically viable (microseismic monitoring, environmental monitoring);
¬ To promote CCS knowledge sharing among the public, companies, associations and the academic community through the communication of scientific results, project achievements and lessons learnt.
A “scientific academic advisory committee” was put in place early in the project in 2007 to assist Total in the scientific development of the CCS project in Rousse, to maximize information flow to the academic world to optimize CCS related R&D programs and to anticipate any potential issues for society at large with respect to a CCS project.
The above-mentioned objectives will be discussed through the different chapters of this book, which has been written to give the reader an overview of this industrial adventure in accor- dance with the scientific “informa-tion sharing”, and open and transpar-ent “dialogue” policies promoted by Total during the whole life of this pilot project. It describes the period from the decision being taken to proceed with the project to the end of CO2 injection. The development of CCS technology by 2020 -2030 can benefit from the input that this type of project offers.

7
We invested over €60 million to build this demonstrator unit. In addition, Total has contributed to furthering university research on CO2 capture-transport-storage technologies by allocating €3 million to fund several French R&D programs since 2010.”TOTAL, Alain Goulois, Vice President Research & Development, Exploration & Production
“

CONTENTS
CAPTURE AND TRANSPORT
The oxy-combustion boiler
CO2 Compression, Drying & Transportation
Hazard and risk assessment
pages 18-37
INTRODUCTION
Presentation
pages 12-17
01 02
13
20
25
33

GEOLOGICAL CHARACTER-IZATION AND MODELLING
Geological context
Geological modelling
Geological integrity
WELL INTEGRITY
The life of a cement sheath
Cement-sheath mechanical integrity
Cement-sheath chemical integrity
Application to Rousse well
Notations
pages 38-67
pages 68-123
IMPACT AND RISK ASSESSMENT MONITORING PLAN
Environmental impact assessment
Hazard and risk analysis
Monitoring plan
0304 05
pages 124-159
4185 126
72
70
50 103 130
54 120 146

CO2 STORAGE PERFORMANCE
Well injectivity
Microseismicity monitoring
Modelling the long term fate of CO2 in the Rousse reservoir
ENVIRONMENTAL MONITORING AND MODELLING (SURVEILLANCE)
Soil and surface gases
Fauna and flora
Surface water
Groundwater
Atmosphere
pages 160-179
pages 180-215
06 07
173 208
197
193
187
182
165
162

11
COMMUNITY OUTREACH
Local context
Local actors
The concertation process
Survey of the Jurançon population area around the injection site (2008)
pages 216-241
EXECUTIVESUMMARYThis pilot project entailed the conver-sion of an existing air-gas combustion boiler into an oxygen-gas combustion boiler, using oxygen delivered by an Air Separation Unit (ASU) for combustion to obtain a more concentrated flue gas/CO2 stream.
pages 242-256
WATCH VIDEO ON THE LACQ PILOT on http://www.total.com
REFERENCES
KEYWORDS INDEX
page 274
pages 257-271
pages 272-273
The social impact, as read from the press (2005-2012)
Discussion, lessons learnt and conclusions
08
230
223
233
238
220
218
CARBON CAPTURE AND STORAGE THE LACQ PILOT RESULTS & OUTLOOK JAN. 2014 (6:54)

12
chapter 1
INTRO-DUCTION
authors
J. Monne (Total)N. Aimard (Total) S. Crepin (Total)

13
Carbon capture and storage . The Lacq pilot Chapter 1: Introduction
This pilot was designed, built and operated by Total for more than three years.
The CCS pilot project entailed the conversion of an existing air-gas combustion boiler into an oxygen-gas combustion boiler, using oxygen delivered by an air separation unit (ASU) to obtain a more CO2 concentrated (and easier to capture) flue gas stream. The 30 MWth oxy-boiler was able to deliver up to 38 t/h of steam to the high pressure (HP) steam network of the Lacq sour gas production and treatment plant. After quenching of the flue gas stream, the CO2 stream was compressed (to 27 barg), dried and transported in a gaseous phase via existing pipelines to the Rousse depleted gas field, 29 kilometers away, where it was injected. Over the injection period of 39 months, 51,340 metric tonnes of CO2 were injected.
Total’s main objectives in this experiment were:
¬ To demonstrate the technical feasibility and reliability of an integrated chain comprising CO2 capture, transportation and injection into a depleted gas reservoir;
¬ To acquire operating experience and data to upscale the oxy-combustion technology from pilot (30 MWth) to industrial scale (200 MWth) while downscaling the “oxy-combustion” capture cost compared to classical post capture technologies;
¬ To develop and apply geological storage qualification methodologies, monitoring methodologies and technologies on site to serve in future onshore storage monitoring programs that will be larger in scale, longer in time and economically and technically viable;
¬ To promote CCS knowledge sharing among a range of stake-holders, from governments, public institutions, industry, academia, non-governmental organizations, to the local communities and the broader public, through an outreach and communication program of activities including face-to-face meetings, workshops and technical meetings, site visits, informative videos, open days with site tours and press releases. This book shares the project’s scientific results as well as the major achievements and lessons learnt. 01
THIS BOOK PRESENTS THE RESULTS OF A PILOT PROJECT IMPLEMENTING FOR THE FIRST TIME THE COMPLETE CARBON DIOXIDE (CO2) CAPTURE, TRANSPORT AND STORAGE (CCS) CHAIN IN AN INDUSTRIAL ENVIRONMENT.
01: Industrial scale

14
PROJECT PHASING
After internal approval was received at the end of 2006 to incur a capital expenditure of 60 million Euros to establish the integrated CCS pilot, basic and detailed engineering were performed in 2007. In 2008, the construction works started and were finalized by mid-2009. The capture facilities began operation in 2009 and CO2 injection at site started in 2010. CO2 injection ceased in 2013 but post- injection monitoring will continue until 2016.
Details of the project planning can be found here below: Table 01
TECHNICAL ASPECTS OF THE PROJECT
In this book, chapters 2 (page 18) to 7 (page 180) detail the technical aspects of the project, with emphasis on the methodologies that were followed to conduct and optimize the operations of capture, transport and storage while controlling their impacts and the associated risks.
More specifically, chapter 2 describes the retrofitting of the existing air-com-bustion boiler into an oxy-combustion boiler, which required the construc-tion and operation of an Air Separation Unit to deliver the oxygen. Exhaust gas processing is also discussed, which comprised a direct cooling contactor and a first three-stage CO2 compressor including a drying system. The transportation pipeline is described, as well as the surface facilities located at the injection site, such as the additional one-stage compressor.
Chapter 3 (page 38) is focused on the characterization of the site geology, with an emphasis on the evaluation of the geologic integrity (cap rock and bounding faults). For that purpose, extensive modelling studies were conducted to assess geomecha- nical and geochemical effects induced by CO2 injection.
Chapter 4 (page 68) presents the studies on the Rousse-1 well integrity. This well being the only one intersecting the reservoir, meant the evaluation of the quality of zonal isolation through a comprehensive characterization of the state of the completion was paramount. CO2-induced mechanical and chemical effects on
the cement sheaths are first discussed, before a very detailed analysis of the Rousse-1 well completion is carried out.
After such characterization studies are completed – and in this case confirmed the good sealing characte- ristics of the main barriers – a detailed impact and risk assessment can be performed, of which the results are discussed in chapter 5 (page 124). The only retained major risk in the case of this project is the accidental scenario of a free well blowout. The scenario is analyzed in depth, espe-cially the levels of exposure (CO2, pressure, heat) and the associated effects. This chapter concludes with a presentation of the monitoring plan, the objectives of which are to control both the operations and the risks.
Table 01: Project planning

15
Carbon capture and storage . The Lacq pilot Chapter 1: Introduction
REGULATORY ASPECTS
In 2006, the main piece of regulation for CCS in Europe had not been issued yet, with the EU CCS Directive on Geological Storage of Carbon Dioxide (Directive 2009/31/EC) coming into force on June 25th 2009.
The French authorities decided to implement this project under the “mining code” regulation regarding the subsurface aspects and the “Environmental” code regarding the surface installation aspects. The authorities also took into account all recommendations and constraints which were described in the draft of the 2009 European Directive.
During the summer of 2008 the project went through two months of official public hearings.
Chapter 6 (page 160) is focused on opera-tional aspects and discusses key aspects of the storage performance, mainly injectivity and containment. Pressure data analysis showed that injectivity was as expected, and compatible with productivity analyses performed during production. Microseismicity monitoring is also presented in detail, in particular its application to injection control and to verification of barriers integrity.
Finally, environmental monitoring is discussed in chapter 7. It includes monitoring of potential CO2 leaks and associated impacts in various compartments: ground and surface waters, soils, biosphere and atmosphere.
Results of the data and analyses acquired over the lifetime of the Lacq CCS project demonstrate the efficient and safe storage of the CO2.
In May 2009, Total Exploration Production France was permitted to operate the capture, transport and storage pilot, for a maximum injection of 120,000 metric tonnes of CO2 over two years and three years of post injection monitoring.
During 2011, Total Exploration Production France requested an 18 month extension of the initial injection period, to allow for finali-zation of the R&D program attached to this project. The French authori-ties answered positively and a com-plementary permit was issued in November 2011. The injection period was extended up to the 8th of July 2013 and the amount of CO2 that could be injected was now limited to 90,000 metric tonnes of CO2. In fact, it was not an authorization for injecting a large quantity of CO2 but an authori-zation to extend injection operations in order to finalize the subsurface R&D program. This is the reasons that injection was terminated in March rather than July 2013, complying with regulatory requirements.
Periodic reporting to the regulatory authorities is done every six months.
PUBLIC DIALOGUE AND INFORMATION
The project’s public outreach program is extensively discussed in chapter 8 (page 216), with a full description of the public dialogue process by an independent organization.
Stakeholders and public informa-tion meetings have been held from the start of the project, as early as 2007, well before any construction works started. Total engaged in an open and transparent dialogue with
all the stakeholders upstream of the permitting process. Access was given to detailed information by way of a dedicated website, brochures, a consultation file, a movie and quarterly newsletters that are still being mailed to the communities close to the Rousse injection site.
More specifically, a public consul-tation and dialogue meeting was organized in November 2007. It led to the creation of a permanent official local information and surveillance commission (CLIS) in April 2008, which has been meeting on a regular basis every six months and is attended by representatives of the French admi- nistration and stakeholders (mayors, NGO’s – including the NGO’s not in favor of the project).
The main objectives of these meetings were to:
¬ Provide technical informa-tion about the Lacq pilot and explanations to enable a better understanding of the CCS tech-nology, the context and issues;
¬ Explain why it is an opportu- nity to have such a project in the area (including possible contribution to the local socio- economic development);
¬ Answer all questions and concerns raised, providing answers along the project development stages;
¬ Provide information on short and longer term scientific follow up (a dedicated scientific committee was appointed with external experts) and monitoring;
¬ And demonstrate openness, and the willingness to engage in dialogue and give access to relevant information.

16
KEY PROJECT OUTCOMES
Total has successfully demonstrated the feasibility of safely storing CO2 in a depleted underground reservoir by injecting over 51,000 metric tonnes of CO2. The operability of a fully integrated carbon capture and storage scheme based on the oxy-combustion CO2 capture process has been proved.
The data needed to upscale the oxy-combustion technology from 30 MWth to 200 MWth was acquired during the operating tests performed at the end of 2011. These data are currently being processed and the design of this industrial oxy-boiler should be completed in 2014. Geological storage qualification methodologies have been developed and completed.
For CO2 emitted by the oil & gas sector and the power generation sector, the current cost evaluations for an indus-trial size capture unit are still high, even for oxy-combustion. More R&D pilot projects and demonstrations are needed before the upscaling and streamlining capture installations.
Regarding CO2 monitoring, one of the project’s R&D challenges that remains to be addressed in the coming years consists of selecting the right parameters, methods and equipment for a safe, economically and technically viable, long-term efficient onshore storage monitoring program. In the case of the Lacq pilot project, this long-term program will have to be validated by the French authorities.
The Lacq pilot is part of the larger Total CCS technological roadmap. CCS is a valuable contributor to green-house gas (GHG) emissions reduction and the Lacq pilot demonstration project contributes to the deployment of CCS technology by 2030.

17
This industrial pilot has proven Total’s capacity to develop innovative projects, from both a methodological and technological point of view. The experiment would not have been as successful without the strong cooperation between the scientific partners and the R&D and operational teams of Total’s Exploration & Production branch.”TOTAL, Jacques Monne, Manager of the Residual Gas Management R&D Project, Exploration & Production
“

18
authors
P. Terrien (Air Liquide)S. Lethier (Total)J. Monne (Total)O. Prato (LMF)J-P. Quet (Total)
chapter 2
CAPTURE AND TRANS-PORT
authors
P. Terrien (Air Liquide)S. Lethier (Total)J. Monne (Total)O. Prato (LMF)J-P. Quet (Total)N. Aimard (Total)M. Deveaux (Total)C. Prebende (Total)J-G. Gantet (Total)T. Schuhler (Total)

19
Carbon capture and storage . The Lacq pilot Chapter 2: Capture and transport
THE LACQ PILOT PLANT IS A 30 MWth OXY-COMBUSTION BOILER THAT PRODUCES A FLUE GAS WITH A HIGH CO2 CONTENT, WHICH IS PURIFIED, COMPRESSED AND TRANSPORTED TO THE ROUSSE STORAGE SITE.
In figure 1 a full scheme of the oxy-combustion CO2 capture pilot is represented. 01
The existing boiler has been retro-fitted by replacing the four air-fired burners with new oxy-combustion burners and a new cryogenic Air Separation Unit (ASU) for oxygen pro-duction, both designed and installed by Air Liquide. The boiler has been further adapted to oxy-combustion by improving sealing against air leakages. Moreover a flue-gas recycling system has been implemented to dilute the flames and keep the temperature of the combustion chamber at an accep- table level in the new oxy-combustion flame regime. The modifications of the existing boiler have been imple-mented by Alstom and are further described in section 2.
At the outlet of the boiler the flue gas composition is about 33% vol. CO2 and 66% vol. water with second order concentrations of nitrogen, argon and oxygen. The flue gas is washed with water to capture un-burnt particles (to protect the compressor) and cooled to reduce the 90% water content. Two 3-stage parallel compressors bring the CO2 rich gas stream from a near atmospheric pressure to a pressure of 27.5 bars. An additional Temperature
01: Surface facilities in the Rousse CCS pilot project
Swing Adsorption drying process designed by Air Liquide is used to meet the water content specification required for transport. The dry CO2 is transported to the Rousse injection site, located 30 km from the pilot facility. At the well head the CO2 is further compressed up to the injection pressure of around 50 bars in a 1-stage compressor. Section 3 describes the compression system in more details.
Transport of the CO2 between the Lacq plant and the Rousse site (Lacq, Pont d’As, Saint Faust, Rousse) is done using an existing pipeline. Pipeline specifications, as well as the surface facilities located near the injection well are presented in Section 4.
Section 5 documents the hazard and risk analysis that has been performed for the surface facilities, including transport.

20
THE OXY-COMBUSTION BOILER
2.1
AIR LIQUIDE AIR SEPARATION UNIT
The Air Separation Unit (ASU) supplied for the Lacq project was selected from the Air Liquide standard plant catalogue. This reduced the cost of the ASU, as demonstration and optimization of performance was not necessary.
The ASU selected is a “sigma” plant producing 210-220 t/d O2 at the pressure of 1.8 as required for the oxy-burner. The ASU has been designed to produce oxygen at different purity levels, (i.e 99.5%, 98%, 95%), which allowed testing of the sen-sitivity of the overall plant efficiency at different oxygen purity levels.
The energy requirement for oxygen separation is close to 300 kWh per ton of O2 produced excluding the power required for its compression. The ASU unit also produces nitrogen as a byproduct of the cryogenic separation process.
The ASU design has not been optimized with respect to energy consumption, however, Air Liquide identified possible improvements to efficiency that could contribute to the competitiveness of the oxy-combus-tion technology in the carbon capture market.
In 2008, Air Liquide started a develop-ment program of several years aiming to improve ASU efficiency through
process and technology improve-ments, and also through heat integra-tion with the power plant steam cycle.
The main result has been a reduction of oxygen separation energy by 20% for the new XLE (eXtra Low Energy) ASU compared to the most efficient Low Pressure ASU delivering oxygen to IGCC power plants available on the market. The gain can be increased by an additional 10% if heat integra-tion between the ASU and the steam cycle is implemented although this gain must be evaluated on a case by case basis; a joint study between Air Liquide and Babcok & Wilcox showed that the benefit of heat integration could improve ASU power consump-tion by up to around 16%.
Figure 2 shows the efficiency improve-ment achieved by Air Liquide and the target energy requirement set for 2017. 02
The efficiency gain obtained with the OXY XLE process is the result of im-provements to different technical ASU components such as the compressor, the air purifier and the cryogenic process. Those improvements can be implemented at any larger scale without further validation. The minimum size for practical imple-mentation of the OXY XLE ASU unit is in the order of magnitude of 2000 t/d of oxygen.

21
Carbon capture and storage . The Lacq pilot Chapter 2: Capture and transport
AIR LIQUIDE OXY-BURNERS
Air Liquide has significant experience in the design and manufacture of oxy- combustion burner, used in application such as glass manufacturing and aluminum melting. The Lacq pilot project was an opportunity to demonstrate the performance of a new oxy-burner in an air fired boiler retrofit. This section describes the design of the burners and the results obtained on the Lacq pilot.
Burner design: methodology and technical approach
The oxy-burner concept developed by Air Liquide for this project addresses particular issues related to the retrofitting of an air fired boiler, such as flame shape and heat distribution profile in the new combustion setting. The integration with the ASU with regard to pressure drops and oxygen purity was also been carefully considered. Additional aspects such as the safety of the operations and procedures for oxygen handling were also taken into account.
Based on requirements for boiler retrofitting and other general project speci-fications, a 1 MWth prototype burner was designed and tested in the combus-tion facilities at Air Liquide’s French Research Center. The dimensions of the combustion chamber and the burner of the prototype were in the same ratio as the boiler in the Lacq facility. This allowed the formation of a flame shape that could be conveniently scaled up to the 7.5 MW burners of the Lacq boiler.
What makes the Air Liquide burner unique is the possibility to use pure oxygen with flue gas recirculation, without blending or mixing these gases before they enter the burner. This also provides advantages from a safety point of view,
02: ASU separation energy
as there is a dedicated circuit for pure oxygen as part of the distribution system. The recycled flue gas is injected in two outer sections of the burner, each one having a different swirl. This can be adjusted within a wide range and provides several benefits:
¬ High flexibility for burner operation;
¬ Although the burner was not designed as a low NOx burner, in a retrofit case with high air leakage into the Flue Gas Recycle (FGR) system the nitrogen inlet will be in the low temperature part of the flame, limiting NOx emissions;
¬ The burners do not have movable parts, which minimizes maintenance.
At each step of the burner design and the evaluation process, modelling and simulation tools were used to develop a numerical model of the burner. This was validated and was found to be reliable enough for scale up and evaluation of potential impact on boiler performance. Once the burner design was optimized at 1 MWth scale, the prototype was scaled up to 7.5 MWth, the actual pilot project.

22
03: Burner installation sequence
04: Flame photos in air and oxy-combustion modes
Air mode at 20% boiler load Oxy mode at 55% boiler load and FGR = 2,5
Burner and boiler performance
The air fired boiler was converted from air-combustion to oxy-combus-tion with the following modifications:
¬ Four Air Liquide Oxy-burners were installed in a 2 by 2 configu-ration on the furnace front wall.
¬ Flue gas recycling ducts and fans were installed;
¬ The air preheater was replaced by an economizer to cool flue gases down to 220°C;
¬ A new super-heater and attem-perators were added.
The valve train that controls oxygen and fuel supply to each burner was of a standard type and no windbox was required. All four burners were installed with the swirl in the same direction, in order to have the same fluid-dynamics profile as the original boiler when operating with air. 03
The closed-loop flue gas recirculation was required to compensate for the reduced flue gas flow rate through the boiler; the recycler is a wet type and includes temperature control to avoid water condensation. As the burner starts up in air-combustion mode (up to 30% of boiler capacity) the com-bination of fan and booster installed is designed to send the flue gases to the stack; in oxy-combustion mode a portion of the flue gas is recirculated to the burner while the another is sent to the cleaning and conditioning system. These two different types of operation correspond to different pressure conditions in the combus-tion chamber, which impact flame stability and shape. The burners were designed to cope with this particu-lar type of operation, with an ability to run in a safe and reliable way not only during stable conditions in each mode but also during the transitions.
Several tests campaigns were carried out during the life of the project. The criteria used for burner evaluation included flame stability, security of operations, stability of the boiler capacity and steam quality, prevention of hot spots or flames impingement on the tubes and high CO2 concentration flue gases.

23
Carbon capture and storage . The Lacq pilot Chapter 2: Capture and transport
First campaign
The main objective of this campaign was to evaluate burner performance during start up, introduce oxygen, estimate the turn down ratio of the burners and then shut down the burners. Flame stability and burner interaction were used as criteria to assess burner performance using an endoscopic technique. The instrument was installed through the boiler’s lateral view ports, with particular care taken due to the pressure conditions in the combustion chamber.
The flame shape changes with flue gas recirculation and with the primary/secondary oxygen ratio. The flames showed high swirl, without hitting the lateral tubes and remained well attached to the burner in all conditions evaluated; no significant disturbances were observed during the transition between different conditions. 04
Second campaign
Optimization of the boiler operational conditions including the flue gas recirculation and oxygen stage was carried out during this campaign. Test ports and thermocouple grids were installed to collect data on heat fluxes in the boiler and furnace exit gas temperatures at various locations in the convection pass. The table below shows the results obtained in air and oxy-combustion modes, at 88% of boiler capacity. The Flue Gas Recycle (FGR) ratio 1 that provided the same heat transfer profile as in the air case is 2.78, corresponding to an increase in boiler efficiency of around 5% -points. Table 01
The information obtained during these tests was used to understand flame dynamics, burner interaction, the heat transfer profile and impact on boiler efficiency and to validate the models.
A simulation was undertaken, focused mainly on the combustion chamber where chemical reactions, heat transfer and fluid dynamics play a significant role. The modelcarefully accounted for the high turbulence created by the swirl, together with the different radiation properties of hot gases in oxy-combustion mode (high concentration of CO2 and H2O species). The simulation was able to capture the non-symmetrical feature of the flow (figure 5), showing higher tem-peratures on the west side of the boiler, created by having the burner’s swirl in the same direction. This trend was confirmed by the heat flux measurements results, which are shown in the bars chart in figure 5. 05
Table 01: Second test campaign results
1. the ratio of flue gas recycled over the flue gas sent to the compressor
05: Non symmetrical simulation of Lacq boiler and heat flux measurements chart
Excess Oxygen (% v/v-wet basis) Flue gas recycle ratio FEGT (°C/°F) Flue gas temperature out Economizer (°C/°F)
HEAT TRANSFER PROFILEFurnace absorption (%)Super Heater absorption (%) Economizer absorption (%) Furnace screen + boiler bank absorption (%)Boiler Efficiency (HHV basis, %)
AIR2.6-
1132/2070194/382
47.9016.065.30
30.7482.62
OXY2.6
2.781053/1927
204/399
47.3116.165.90
30.6387.37

24
Third campaign
The final tests included the evalua-tion of the impact of oxygen purity on plant efficiency, such as the ASU energy consumption and its conse-quences on the burner-boiler perfor-mance.
The results obtained showed that a reduction in the oxygen purity from 99.5% to 95% has no significant impact on the boiler efficiency. However, NOx emissions are increased, due to the higher nitrogen input into the boiler.
Conclusions and next steps
The continuous operation of the 30 MWth retrofitted boiler has been a success. After 12,000 hours of operation, no issues related to burner or boiler operation was been encoun-tered. Boiler load changes matched fuel, oxygen and FGR supply in a reliable way without negative impact on the flame stability. This demon-strated that the oxy-burners are flexible enough to meet the minimum and maximum heat load. They also provide the proper aerodynamics and mixing, contributing to creating an adequate heat transfer profile for the desired steam production and quality, as well as for the boiler operation reliability. In terms of heat flux, results indicate that the criteria used for retrofitting the boiler were met. The CO2 concentration measured in the flue gas was in the range of 90–93%, with oxygen between 5 to 7%.
The Lacq pilot project operations allowed Air Liquide to demonstrate the high efficiency of oxy-burners for natural gas combustion at a represent-ative scale for industrial applications. The ability to operate oxy-gas burners safely and reliably in the case of a retrofit with associated constraints, was also demonstrated.
Together with this demonstration of the technology, tests results have shown a 5% -points increase in boiler efficiency. This could lead to a signi- ficant efficiency improvement across the CCS chain. The economics of this improvement need to be further evaluated in a study of larger size plants. This new system should take into account global energy integra-tion in order to provide commercially attractive CO2 emission reduction solutions.
It is within this context that a new project at larger scale is under discussion. Building on the expe-rience acquired at Lacq, this new demonstration project would deploy a 200 MWth boiler, equipped with 36 MWth burners. The burners would be capable of working in both air and oxy-combustion modes and would be designed for low NOx emission. Air Liquide will base the design of these burners on the methodology proved by the Lacq project, combining experimental and simulation tools.

25
Carbon capture and storage . The Lacq pilot Chapter 2: Capture and transport
THE LACQ 3-STAGE COMPRESSOR
The compression system used in the Lacq pilot project consists of two separate compressors, delivered by the Austrian company LMF. The CO2 rich gas generated by the oxy-combustion boiler is compressed in the two 3-stage compressors, from a near atmospher-ic pressure up to 27.5 bara. These compressors provide the pressure necessary to transport the CO2 from Lacq to Rousse injection site.
Design of the Compressors
The gas is composed mainly of CO2 with minor quantities of oxygen, nitrogen, argon and some traces of carbon monoxide and nitric oxide. The compressor design is based on the international standard API 618 dedicated to process gas com-pressors for the Oil & Gas industry. This standard is commonly used in fa-cilities like the Lacq gas plant and in refineries.
Considering the requested capacity of 5,600 Nm³/h of gas to be delivered by the compressor in Lacq, the detailed design of the compressor led to the following characteristics:
CO2 COMPRESSION, DRYING & TRANSPORTATION
¬ A large boxer type compressor with 4 cylinders in an opposed horizontal configuration, with 220 mm of piston stoke;
¬ A piston with a diameter equivalent to the 2 first cylinders from the 1st stage, which reaches about 800 mm. All cylinders are non-lubricated in order to avoid oil contamination of the compressed gas;
¬ The compressor package includes the compressor and all equipment required to ensure smooth operation: anti-gas-pulsa-tion dampeners before and after each stage 2, and inter-stage gas coolers and scrubbers in order to eliminate the liquid phase;
¬ The lube oil skid with double oil pump, filters, valves, oil heater and cooler and associated piping which lubricates all moving parts of the crank gear, namely the crankshaft and its main bearings, the crossheads and the connecting rods.
This section describes the various compo-nents between the CO2 source at the pilot plant (the oxy-combustion boiler) and the injection facility at the Rousse site. These components are:
¬ flue-gas quencher; ¬ 3-stage compressor; ¬ gas drying system; ¬ CO2 pipeline; ¬ surface facilities at the Rousse site,
including a 1-stage compressor.
2.2
2. gas pulsations created by the piston reciproca-tion motion can generate high vibrations of the gas piping that can damage it

26
Difficulties and technical challenges
Piston rings
The piston rings are highly sensitive to the type of gas as well as operating condi-tions. Therefore, appropriate material has to be selected for the rings to ensure a maximum life. The selection is more a question of gained experience than of complex theoretical studies, which can only give indications. This pilot project has been in this respect very interesting and challenging.
07: The Compressor installed in the Lacq facility
06: Lacq Compressor: 4-Cylinder Boxer Compressor during testing at LMF workshop
¬ Gas compression generates heat, which has to be removed to avoid high temperatures that could damage high sensitive parts. Therefore the gas itself has to be cooled after each stage. Lubricating oil and some components, such as cylinders and main packings, are also cooled. Heat is removed by the water cooling skid, which includes a water tank, a pump, a heater and a cooler, valves, and associated piping and instruments for control and monitoring;
¬ The compressor is equipped with a 1,000 kW induction motor and rotates at 420 rpm;
¬ A complete set of instruments and valves allow the proper operation, control and moni-toring of the compressor. The measured values can be read locally on indicators and gauges, mounted on a local control panel, and are also transmit-ted to the compressor control system using a Programmable Logic C ontroller (PLC) and control panel;
¬ All parts are mounted on a steel base frame and form the com-pressor package;
¬ The complete unit is more than 10 m in length and width and about 6 m in height; its weight is about 110 t. 06, 07

27
Carbon capture and storage . The Lacq pilot Chapter 2: Capture and transport
Several combinations of different materials were tested on the Lacq compres-sor including graphite, PEEK (Polyether-Ether-Ketone), PTFE (Poly-Tetra-Fluor-Ethylene) with different additives. Finally, the best combination was selected, with different materials used in each stage.
Corrosion issues on the third stage of the Lacq compressor
All major parts of the compressor are made of corrosion resistant material excluding the compressor cylinders, which are made of molded cast iron. Because of their large sizes, the manufacturing of such cylinders in stainless steel would have been prohibitive regarding their fabrication constraints and cost.
The suction chamber of the 3rd stage cylinder was rapidly and severely attacked by acid corrosion. The CO2 rich stream is predominantly composed of CO2, with second order concentrations of Ar, O2 and N2 (when ASU is delivering O2 at a purity level of 95 or 98.5%) and parts per million of CO and NOx. Last but not least, the CO2 it is saturated with water (50°C) at the outlet of the cooling tower. Therefore, to protect each compression stage from liquid condensation, inter stage scrubbers collect the condensed water. These scrubbers, however, could not prevent micro droplets carry over. Moreover, because of the small pressure drop and the convective heat losses (in cold climate conditions) between the outlets of the scrubbers and the compressor suction chambers, some condensa-tion can occur. Liquid samples taken in the inter stage scrubbers were extremely acidic. The analysis clearly indicated the presence of nitric acid formed by the dissolution of NO2 in the condensed water, which caused the severe corrosion in the compressor. 08
In this respect, the corrosion that occurred in the compression because of CO2 enriched flue gases from oxy combustion proved very severe. Although no nitrogen is present in the oxygen delivered by the ASU when it is operating at very high purity (99.5% vol.), small amounts of nitrogen still enter the boiler:
08: Modification of the inter stage scrubbers
the natural gas contains around 0.5% vol. of nitrogen and even though the retrofitted boiler operates slightly over atmospheric pressure, it is very difficult to completely avoid air ingress. Therefore, NOx formation in the furnace is unavoidable and whenever condensation occurs the liquids become extremely acid. The only way to avoid corrosion is to ensure that no condensation occurs in the compressor package, including the scrubbers.
Technical and operational solutions to overcome liquid carry-over and further condensation have been studied. Pros and cons were assessed, and decisions were made to implement the most relevant solutions to avoid this destructive corrosion:
¬ A lower cooling temperature: changed from 50 to 30°C for condensing more water and decreasing the dew point of the CO2 stream before compression;
¬ Slight increase of the com-pression suction temperature, minimizing condensation in the compressor;
¬ Recycling of dry CO2 to the compressor inlet (downstream TSA dryers);
¬ Modifying the inter stage scrubbers by adding a second mist eliminator and installing an Hyper Vane Diffuser.
After implementing these modifica-tions, the steady operation of the pilot plant achieved during the remaining test period has demonstrated their effectiveness.

28
CO2 DRYING
Air Liquide also designed and supplied two CO2 dryers. Drying is performed under pressure after a first compression step. Drying is necessary to reach the product specification reduce corrosion in the compressor; the dried gas is partly recycled to the inlet of the compressor in order to de-saturate the CO2 and therefore avoid corrosion. 09
Design of the CO2 dryers
The drying unit consists of two adsorption beds operating in a Temperature Swing Adsorption process (TSA). The design was based on Air Liquide’s expe-rience in air separation; and is the same process as that used today in ASU’s. However, drying a CO2 rich flue gas from an oxy-combustion plant has additional challenges and the Lacq pilot provided an opportunity to demonstrate the tech-nology on a real flue gas, as well as to validate simulation tools in such condi-tions. Design was performed considering carefully chosen margins (on operating parameters, mainly on adsorbent quantities) to account for the inaccuracy of the simulation for the new type of gas to be dried (i.e. CO2 rich flue gas). Material selection was also a key aspect since corrosive conditions were expected in the presence of a wet gas containing CO2 and NOx. Figure 9 shows the two adsorption vessels installed.
Test results and data analysis
Air Liquide carried out several test campaigns to validate the perfor-mances of the flue gas drying system designed to dry around 5,000 Nm3/h of flue gas at high pressure. The achieved dew point at the outlet of the dryers was found to be in accordance with the water content specification for cryogenic purification (to avoid water freezing), therefore allowing the technology to be used in front of a CO2 cryogenic purification unit (part of the Cryocap™ Oxy technology).
In order to provide data for the design of future units and to validate simula-tion tools the drying unit was highly instrumented as illustrated below.
Different running conditions were tested including various operating pressures and regeneration gas composition (nitrogen from the ASU or dry CO2 rich flue gas) to validate the Air Liquide dryer design tool for Cryocap™ technology.
The curve in figure 11 shows the thermal profiles during the regenera-tion of dryers, as measured in the Lacq facility, and the corresponding simu-lation results obtained with a model that was updated to account for these results. 10, 11
The regeneration of the dryer with CO2 product proved to be as efficient as the regeneration with nitrogen. This is an important result for the technology development as regener-ation with nitrogen would impose additional constraints and associ-ated costs. The curve in figure 12 illustrates the efficiency of the dryers independently of the regeneration conditions chosen. 12 (page 30)
09: Dryers installed in Lacq facility

29
Carbon capture and storage . The Lacq pilot Chapter 2: Capture and transport
Inside the dryers, complex reactions occur with the impurities, in particu-lar with NOX, including formation of acid condensates. For instance NO is converted into NO2 according to the following equation, kinetically limited: 2NO + O2 = 2NO2. This reaction happens continuously before, during and after the drying step. NO and NO2 have different behaviors on the adsorbents and can each potentially be partially adsorbed during the drying step.
¬ Tests showed that approximately one third of NOX is adsorbed by the adsorbents.
¬ Through the hydrothermal profiles of the regeneration step, formation of nitric acid due to adsorbed NOX was observed, as expected.
Therefore, in these severe conditions, the choice of adsorbents and materials are key. To compare different materials, several corrosion coupons were placed inside the dryers and were removed for analysis once operations were complete. Analysis of the coupons aided in the selection of materials for dryers of other oxy-combustion projects.
10: Lacq pilot dryer - Instrumentation and sample collection scheme
11: Lacq Compressor: 4-Cylinder Boxer Compressor during testing at LMF workshop

30
12: Dryer efficiency
CO2 TRANSPORTATION PIPELINE
The transfer pipeline between Lacq and Rousse starts at block valve station MA8 on the periphery of the Lacq site and ends at the manual valve on the Rousse site, upstream of the inlet Emergency Shutdown Valve. The pipeline is 29 km long and comprises three sections separated by two intermediate operating sites:
¬ The Pont d’As (PTS) site in which the operations control room is located; ¬ The Saint Faust (SFT) site where various pipelines coming from neighboring
producing wells (raw gas and liquids) arrive.
The first section is a 12 inch steel pipe that runs from the Lacq plant to the Pont d’As station, in a zone that already includes two other pipelines currently in operation (14” Gas and 10” Liquid). This section comprises:
¬ An automatic block valve at each end; ¬ An overhead section over the Gave de Pau river; ¬ Five intermediate manifolds, running overhead for a few meters, each
located in a fenced-off area and fitted with: ¬ An automatic block valve; ¬ A pressure gauge with a low-pressure alarm.
The second section comprises an 8-inch steel pipeline that runs between the Pont d’As (PTS) site and the Saint Faust (SFT) site in a zone that contains three other operating pipelines (8” Gas, 8” Liquid and 12” Gas). This section includes:
¬ An automatic block valve at each end; ¬ Two sections running overhead for a few meters (to cross a river in one place)
that are located in fenced-off areas.
The drying unit has run satisfacto-rily for more than 10,000 hours and demonstrated drying of CO2 gas to the targeted dew point for a various range composition, and even with NOX in the feed gas.
Use of pilot test results for the Cryocap™ Oxy Roadmap
This experience has been essential in developing the Cryocap™ Oxy Roadmap, allowing Air Liquide to develop and validate simulation tools to design dryers for CO2 with NOx. Current industrial size projects are under development and the design of the drying unit for those is based on the tools validated with the Total Lacq pilot plant.

31
Carbon capture and storage . The Lacq pilot Chapter 2: Capture and transport
The third section is an 8-inch steel pipeline that runs between the Saint Faust (SFT) and Rousse sites (injection well RSE-1). This section comprises:
¬ An automatic block valve at each end;
¬ A section running overhead for a few meters (MC00) in a fenced-off area, with a manual shut-off device;
¬ A check valve on the MC00 site.
The pipelines have aerial sections that run for a few dozen meters in fully enclosed areas on the operating sites of Rousse, Pont d’As and Lacq. The trans-portation pipeline is supplied with CO2 from the Lacq plant. Therefore the gas flows in the opposite direction to the natural gas. Its maximum working pressure is 30 bars. A protec-tion valve is fitted on the compressor’s discharge pipes in the Lacq plant.
The following operations were carried out to adapt the pipeline to the trans-portation of CO2 :
¬ Installation of specific internal links at the Pont d’As station, at the St Faust station and on the MC00 site, to ensure the complete independence of the pipeline dedicated to CO2 trans-portation;
¬ Verification of the pipeline’s condition through smart pigging (check for internal and external corrosion). Damaged areas were identified and repaired;
¬ Installation of CO2 detectors near to the aerial manifolds and the open double-wall jackets that protect the pipeline.
FACILITIES AT THE ROUSSE SITE
The site comprises a plot of approxi-mately 12,100 m² to the east of the road, on which the wellhead is located, and a plot of 6,000 m² to the west for flaring. Both parts of the land are rela-tively flat, but are at different altitudes (the plot with the flare system is about 7 m lower).
The installations on the Rousse site include:
¬ A 270 kW reciprocating com-pressor (single-stage compres-sion) in an enclosed building. It is fed with CO2 from the pipeline and provides the additional increase in pressure required to inject the CO2 into the underground reservoir;
¬ An electrical room; ¬ An instrumentation room; ¬ Surface pipes; ¬ The wellhead and the well; ¬ The flare system, used exception-
ally to secure well operations, or as a vent to decompress surface facilities and the pipeline in preparation for safety works;
¬ A pipeline used to transport residual water to Lacq. This pipeline has been kept as it carries water to other production sites.
THE ROUSSE COMPRESSOR
As mentioned above CO2 is com-pressed again in a 1-stage compressor up to the injection pressure which varies depending on the existing pressure in the injection well, from 26 bara to a maximum pressure of 51 bara. A much smaller system than the first compressor was sufficient to compress the same quantity of gas. The compression is shown in figure 13, and consists of: 13 (page 32)
¬ A boxer-type compressor with 2 cylinders in opposed horizon-tal configuration, with 150 mm of piston stoke;
¬ 2 non-lubricated cylinders with piston diameters of 170 mm;
¬ The compressor package includes anti-gas-pulsation dampeners before and after each stage and gas coolers but no scrubbers are necessary;
¬ Similarly to the main compres-sor in Lacq, a lube oil skid and a cooling water skid with the same functions;
¬ A 270 kW induction motor rotating at 590 rpm;
¬ A complete set of instruments and valves, a local control panel and a control system with PLC and control panel;
¬ Two skids: the main compres-sor skid and a separate cooling water skid.
The total weight of the compressor package including all equipment is about 21 tons with following dimensions: 5.5 m in length and 4.6 m in width and 3 m in height.

32
OPERATING CONDITIONS
The main operating conditions are:
¬ Compression of the dry CO2 to the pressure required for injection into the reservoir (the pressure increased throughout the injection period);
¬ CO2 injection into the Rousse-1 well.
The composition of the gas injected into the Rousse reservoir is also controlled. CO2 content depends essentially on the purity of the oxygen used for combustion.
The pressure of the gas arriving at Rousse location varies between 16 and 22 barg (depending on the operating period) at a temperature also varying between 6°C (winter) and 25°C (summer).
Conditions for injection were: ¬ Gas temperature at the wellhead: approximately 40°C; ¬ Injection pressure at the wellhead: increasing from 25 to 50 bars, as the
quantity injected increased; ¬ Nominal injection rate of approximately 70,000 to 90,000 Nm3/day.
All information useful to the control and safety of the facilities passed on to the Pont d’As control room, from which the pipeline and the Rousse in-stallations are constantly monitored. A daily inspection is carried out to run all the checks required to ensure that the facilities are operating correctly. A contingency plan was prepared from the results of the hazard study.
The interfaces with operations at Lacq were the subject of specific procedures in the following cases:
¬ Start of gas transfer to Rousse (normal operation);
¬ End of gas transfer to Rousse (normal shutdown);
¬ Emergency shutdown of gas transfer to Rousse;
¬ Specific works on the pipeline.
13: The 1-stage compressor installed on the Rousse site

33
Carbon capture and storage . The Lacq pilot Chapter 2: Capture and transport
HAZARD AND RISK ASSESSMENT
This section presents the results of the analysis of hazards and risks for the surface facilities.
DESCRIPTION OF SURFACE FACILITIES AND THEIR ENVIRONMENT
Facilities located on site are:
¬ The compressor
The installation of a compression system, by itself, does not involve hazardous processes and is not likely to be the cause of an accident that could harm the environment. However, CO2, which is the com-pressed fluid, may impact people’s health if leakages were to occur.
¬ The CO2 pipelines
CO2 transport pipelines may impact people’s health in case of leakage.
¬ The oil tank
The oil is stored in an air tank of 25 m3 (maximum volume available). The hazards associated with this storage tank mainly consist of spills, which can ignite or contaminate the soil.
The study will focus on risks related to CO2.
HAZARDS RELATED TO PRODUCT (CO2)
Carbon dioxide is a gas under normal temperature and pressure conditions. It is present in ambient air to a pro-portion of 0.03 to 0.06%:
¬ Formula: CO2
¬ Atomic mass: 44 g/mole ¬ Boiling point at 1 Atm: - 78.49°C ¬ Density (SPT): 1.977 kg/m3 ¬ Specific gravity relative to air
at 15°C: 1.53.
It is a colorless, odorless, non-flam-mable gas that is not very reactive in chemical terms.
CO2 is not classified as toxic in French regulations, but it is an asphyxiant gas and the intensity of its effect depends on its concentration in the air and on physiological (specific to the organism affected) and climatic (temperature, oxygen content) factors.
The first symptoms, an increase in respiratory amplitude, appear when air containing more than 2% CO2 is inhaled. At a concentration of 4%, the breathing rate increases and can become labored. At a concentration of 4%, the breathing rate increases and can become labored. At a concentra-tion of 5%, the victim begins to suffer from headaches, dizziness and the first cardiovascular and vasomotor symptoms appear (increase in heart rate and arterial pressure, peripheral vasodilation).
2.3

34
HAZARDS ASSOCIATED TO CO2 TRANSPORTATION
CO2 transportation pipeline
A specific safety study was carried out on the pipeline. As stated above, the main hazard is due to the nature of the substance transported.
The methodology used was set out in the ministerial decree dated August 4th 2006 and of the GESIP (Safety Studies Group for the Chemical and Oil Industries) guide in its working version dated March 5th 2008. The GESIP methodology requires that each risk scenario is evaluated along two dimensions: its probability of occurrence (x-axis) and its severity (y-axis). The scenarios are then classified into three categories:
¬ Acceptable risk ¬ Intermediate risk ¬ High risk
All risk scenarios representing accidents in which a hazard may appear are classified, according to this method, in the “acceptable risk” category.
Additional factors that were not considered in the classification system above also contribute to further reducing risk:
¬ The pipeline is thicker than what is required, with a safety factor of 0.4 required for the 30 bars MSP. This extra thickness provides a notable safety guarantee.
¬ The pipeline walls are more than 12 mm thick. The minimum thickness above which the pipeline’s mechanical resistance is high enough to drastically reduce the probability of a crack created by site or agricultural machines (by a factor of 100).
Table 02: Gas concentration as a % volume in the air
¬ The pipeline is constantly under cathodic protection and monitored by the TEPF inspection service. This “quality control” also contributes to considerably reducing failure frequency (100 times less).
These additional conditions all con-tribute to reducing the probability of occurrence of risk scenarios associated to the use of the CO2 transportation pipeline, and confirm the classifica-tion of these risks as “acceptable”.
Plant pipelines connecting the CO2 transportation pipeline at each end
Hazards are again related to the presence of CO2 and risks are associated with an external CO2 leak. The results of the pipeline safety study can be directly applied to the Rousse surface installations.
The dried flue gas that is discharged from the dehydration unit is trans-ported to the Rousse site via a new pipeline on the Lacq site to join MA8, then via an existing pipeline until it reaches the Rousse site. The new pipeline on the Lacq site is fitted with a blowdown line, in turn fitted with a BDV actuated by an operator.
At the entrance to the Rousse site is a blowdown line from the Lacq-Rousse pipeline. The pipelines upstream and downstream of compressor K1350 can be bled to the Rousse flare. All bleed operations are carried out by locally actuating the manual decompression valves.
At a concentration of 10%, blurred vision, trembling, excessive sweating and arterial hypertension occur. If exposure lasts for several minutes, the victim may lose consciousness.
Cases of sudden, accidental death have been recorded. They were linked to the inhalation of high concentrations of CO2 accumulated in confined spaces (silos, cellars) or due to environmental disasters. At very high concentrations in the air, owing to a decrease in the concentration of oxygen, CO2 can cause anoxia.
In the table below, the thresholds given are those set by the “MEDAD memoran-dum (French Administration) dated November 16th 2007 concerning the concen-tration to be considered for O2, N2 and inert gases” i.e.:
Chemical / risk
CO2
Measurement
CO2 content
Significant lethal effects20%
First lethal effects10%
Irreversible effects5%

35
Carbon capture and storage . The Lacq pilot Chapter 2: Capture and transport
The pressure in the Lacq-Rousse pipeline depends on the difference between:
¬ The feed rate of the gas that passes through valve PV3612 at the outlet of the dehydration unit.
¬ The rate at which the vapors are withdrawn by the Rousse K 1350 compressor.
The Lacq compressor and discharge valve PCV3612 provide the supply to the pipeline. 14, 15
The Rousse compressor supplies the well with CO2 from the pipeline.
The pressure profile in the pipeline is monitored:
¬ On the Lacq site, in the CO2 pilot control room;
¬ At MA8, in the Lacq and Pont d’As site coordination room;
¬ On the different block valve assemblies, MA13bis up to Rousse via the Pont d’As site;
¬ On the Rousse site, by the Pont d’As site.
Pressure profile in the CO2 transportation pipelines
The different set points for the alarms and safety valves on the suction and discharge pipes for the Rousse compressor are shown in the diagrams below.
15: Thresholds for the alarms and safety valve for the compressor K1350 (suction)
14: Thresholds for the alarms and safety valve for the compressor K1350 (discharge)

36
The Lacq pilot offered a chance to qualify a new oxycombustion concept. We developed new-generation oxygen/natural gas burners that were successfully installed on a retrofitted boiler.
This scientific and commercial partnership with Total also enabled us to validate our mathematical models based on an output of 8 MWth per burner. From a scientific viewpoint, we have
“

37
Carbon capture and storage . The Lacq pilot Chapter 2: Capture and transport
reached a new milestone as regards flue gas dehydration. Air Liquide was able to model totally new adsorption scenarios involving high CO2 concentrations and extremely complex reactions of water and CO2 with impurities. The pilot dehydration unit designed by Air Liquide to bring water concentration down to 30 ppm actually achieved values of around 10 ppm.”AIR LIQUIDE, Claude Heller, R&D Director, Energy & Industry

38
chapter 3
GEO-LOGICAL CHARAC-TERIZATION AND MODE-LLING
authors
C.Gapillou (Total) D. Pourtoy (Total)S. Thibeau (Total)J-P. Girard (Total)
E. Gaucher (Total)M. Lescanne (Total)G. Mouronval (Total)J. Hy-Billiot (Total)

39
Carbon capture and storage . The Lacq pilot Chapter 3: Geological characterization and modelling
“The suitability of a geological formation for use as a storage site shall be determined through a characteri-zation and assessment of the potential storage complex and surrounding area…”1, and “A geological formation shall only be selected as storage site if under the proposed conditions of use there is no significant risk of leakage, and if no significant environmental or health risk exist.”2
The methodology to achieve these goals is well established and docu-mented in various guidelines as well as in the guidance documents for implementing the directive. It usually consists in a number of steps: (1) collecting data and information about the subsurface structure and properties, (2) building a geological model of the storage formation and its surroundings (also called static model), (3) building a dynamic model of the reservoir, which is used to simulate CO2 injection and CO2 evolution in the reservoir. These dynamic simulations are used to evaluate and optimize key performance indi-cators related to reservoir capacity,
injectivity and containment charac-teristics (4), also discussed in chapter 4 (Well integrity) and chapter 6 (CO2 storage performance). The evolution of these parameters is carefully checked during the operation phase, after the dynamic model has been properly calibrated in a process called history matching.
The following chapter presents the detailed geological characterization of the Rousse storage site. The Rousse reservoir is a former gas reservoir, located in the vicinity of the Lacq giant gas field. Local geology is derived both from a basin synthesis and data acquired at RSE-1 well.
Step 1 is detailed in section 2. It aims at characterizing the geological context in which the Rousse reservoir is located: the pre-Pyrenean rifting. This is followed by the characterization of the Rousse reservoir itself: a deep isolated and faulted Jurassic horst, overlain by a 4,500 m thick overbur-den composed of a series of turbidites (flysch). The objective is to identify the geometry of the structure (layering,
1. Article 4(3) 2. Article 4(4)
AS STATED IN THE EUROPEAN DIRECTIVE ON GEOLOGICAL STORAGE OF CARBON DIOXIDE (DIRECTIVE 2009/31/EC, OR SO-CALLED “CCS DIRECTIVE”):
bounding and crossing faults), the properties of the reservoir and of the sealing formations (petrophysical, mechanical and flow properties, mi- neralogy, fracture networks) through various types of measurement surveys (surface geophysics, well coring and logging).
Step 2 and 3 are documented in section 3. A geological model of the Rousse reservoir formation and the cap rock is first built, which integrates geological information, seismic data and well data in a common framework. A dynamic model of the reservoir is derived from this geological model, using the same grid. These two types of models are used in conjunction to predict the key performance factors of the CO2 storage: capacity, injectivity and containment characteristics. In the case of the Rousse reservoir, the flow model was calibrated using historical pressure data recorded during gas production.

40
Section 4 is focused on the evaluation of the containment characteristics of the Rousse reservoir, also called geo-logical integrity. It provides a detailed study of the sealing performance of the cap rock and the bounding faults.
The geomechanical integrity of the Rousse reservoir depends on the me-chanical properties of the formations (deformation and resistance properties of the cap rock and the faults) and the state of stress. Geomechanical modelling studies require positioning the reservoir structure in a much wider geological context, for which mechanical properties and stress con-ditions are identified, building a 3D geomechanical model. Unfortunately, the lack of information often requires assuming a worst-case scenario (regarding cap rock failure or faults reactivation conditions for instance). The study concludes that the pressure regimes and associated changes in the stress conditions during depletion did not alter the cap rock mechanical integrity, as deformations are elastic. Furthermore, the limited increase of the reservoir pressure due to the low CO2 volume injected will not affect the sealing competency of the cap rock, ensuring a high-quality con-tainment from a geomechanical point of view.
The evaluation of the geochemi-cal integrity is completed through reactive transport modelling studies, based on a comprehensive characteri-zation of the cap rock mineral compo-sition, and accounting for CO2-induced chemical reactions. The objective is to evaluate the effect of dissolution and precipitation of minerals that could lead to significant changes in cap rock porosity. Uncertainties on properties and reaction parameters require per-forming sensitivity studies to evaluate the uncertainties in the model predic-tions. This study applied to the Rousse case shows that CO2 diffusion into the cap rock tends globally to decrease the porosity through the precipitation of carbonates.

41
Carbon capture and storage . The Lacq pilot Chapter 3: Geological characterization and modelling
REGIONAL GEOLOGICAL CONTEXT
The Rousse geological structure is a deep, isolated, faulted Jurassic horst, overlain by a 4,500 m thick overbur-den, composed of a series of turbiditic flysch deposits of Upper Cretaceous (Cenomanian) to Tertiary (Eocene) age, and localized within the Pyrenean foredeep basin (figure 1, figure 2 and figure 3) (Aimard, et al. 2008) (Gapillou, et al. 2009) (Biteau, et al. 2006). 01, 02, 03 (page 42)
The Rousse structure was delineated by the three Rousse wells (RSE-1 (CO2
injection well), RSE-2 and RSE-3) drilled respectively in 1967, 1968 and 1983. Only wells RSE-1 and RSE-3 have encountered the Jurassic series and only well RSE-1 cross both dolomite reservoirs of this study, the Jurassic Mano and Meillon formations. Well RSE-3 was drilled on top of the horst structure, intersecting the sole Meillon formation, whereas the Mano formation is not present due to erosion. Well RSE-2 is outside the horst structure and crosses the Cretaceous series directly overlying the Permo-Triassic deposits. Cores were collected from the Mano dolomite reservoir formation and from the overburden.
GEOLOGICAL CONTEXT
3.1
The Rousse horst, which originated from the pre-Pyrenean rifting is limited by ESE-WNW and NNW-SSE normal faults. It is composed of the Jurassic Dogger and Malm series dipping 15 to 25° NE. The two regional hydro-carbon reservoir levels, the Meillon dolomite and the Mano dolomite formations, are separated by the Lons formation, a hydrocarbon source rock. The horst is wrapped in Cretaceous rock that act as an efficient top and lateral caprock: Lower Cretaceous (Albian) clays act as a lateral seal to the North and Upper Cretaceous flysch deposits act as a top seal.
At Rousse, the Upper Jurassic levels have been truncated by erosion. The Base Upper Cretaceous Unconformity (BCS) is directly overlain by the Upper Cretaceous (Cenomanian to Campanian) deposits that have been progressively onlaping along the BCS unconformity onto the paleo-high of Rousse. At well RSE-1, the Upper Cretaceous deposits have a total thickness of 2,500 m from the top reservoir to the first overlying aquifer (Danian) at the base of Tertiary deposits. These deposits consist mainly of thick marly flysch series deposited in the Pyrenean orogeny context, with few interbedded thin decametric levels of carbonated breccias interpreted as debris-flows.

42
03: Regional lithostratigraphic column
02: Rousse wells location on structural map at Base Cretaceous
01: Cross sections through Rousse field: synthetic geological scheme and position of RSE-1 CO2 injection well
EWNS

43
Carbon capture and storage . The Lacq pilot Chapter 3: Geological characterization and modelling
04: Well RSE-1, reservoir section quality
ROUSSE RESERVOIRS CHARACTERIZATION
The Rousse field reservoirs are located in the Mano and Meillon formations of Upper Jurassic age. They are composed of fractured dolomites and dolomite breccias [figure 3, (Biteau, et al. 2006)]. The two reservoirs are separated by argilla-ceous limestones of the Lons and Cagnotte formations, which is both the seal for the Meillon reservoir and the main hydrocarbon source rock. Only the Mano reservoir is used for CO2 storage.
Sedimentology
From a sedimentological point of view, dolomites of the Mano formation consist of three main groups of facies, respectively:
¬ Tidal flat, peritidal facies, corresponding to alternations of mud-stones-wackestones and of packestones-grainstones, representing the majority of deposits;
¬ Oolithic barrier facies, represented by grainstones-packestones facies with ooids ghosts, 05 (page 44);
¬ And breccia facies, either monogenic of hydrothermal or collapse origin, or polygenic corresponding to alluvial facies. 06 (page 44)
The diagenetic model is differential, linked to the original type of facies:
¬ Original mudstones are affected by an early phase of diagenesis, resulting in crypto-crystalline, replacement dolomitization;
¬ A later phase of microcrystal-line dolomitization affects the original packestones-grainstones facies by re-crystallization.
An ultimate phase of diagenesis concerns the filling of fractures, with macrocrystalline dolosparite, calcite and silica cementation. Cementation is more or less complete and some porosity is preserved despite partial dolomitic mineralization ‘bridges’.
Petrography and mineralogy
A mineralogical assessment has been conducted on Rousse Mano matrix, based on nine samples covering a 60 m depth interval, to define quan-titative bulk mineralogy of the rock (Girard, et al. 2012).
Examination of thin sections by optical microscopy and chemical mapping by SEM-Quantax permitted to characterize the textural features of the different minerals present in the reservoir. Main features are illustrated in figure 7. 07 (page 45)
The geometrical and stratigraphic relationships between the Rousse reservoirs and the different Upper Cretaceous units sealing the reservoir are relatively complex and cannot be mapped in detail by 3D seismic surveys. These Upper Cretaceous deposits are the result of the gradual filling of a W-E drepression corresponding to the opening of the Gulf of Biscay, with associated turbidi-tic episodes initially of diachronous ages, filling the syntectonic flysch trough following an overall retrogradational trend.

44
The dolomite mainly occurs as a dolomicrosparitic or dolosparite continuous matrix constituting the bulk of the rock. Dolomite also occurs as sparitic saddle dolomite, slightly Fe-rich, in fractures and fissures crosscutting the reservoir. Dolomite-filled fractures are a common feature of the Rousse reservoir.
The calcite is exclusively found as filling thin microfractures and fissures, post-dating saddle dolomite. This late generation of fractures is very heterogene-ous in the reservoir, and often absent.
06: Mano formation - examples of dolomite breccia facies
¬ Quartz occurs as silt-size detrital grains disseminated in the dolomite matrix. Apatite was not distinctly observed but certainly occurs as silt grains as well.
¬ Pyrite occurs as framboidal aggregates or neoformed cubic crystals within the dolomite matrix, or as micro fissures.
¬ Illitic clays [illite and illite/smectite (I/S)] are found as mi-crocrystals disseminated in the dolomite matrix, mainly along joints between crystals or as local small-sized clay aggregates. Illitic clays are not observed in fractures.
¬ Chlorite is essentially found along fracture walls at the interface between the saddle dolomite cement and the dolosparitic matrix. It forms an irregular discontinuous lining of chlorite crystals of authigenic origin, and post-dating the dolomite fill. It is also sporadi-cally found as small aggregates in the dolomite matrix.
05: Mano formation - ww barrier dolomite facies
RSE-1 ̶ Mano Fm ̶ 4,595.5 m: oolithic barrier, dolomite grainstone/wackestone, dissolved oolithes
RSE-1 ̶ Mano Fm ̶ 4,595.5 m:dolomite breccia whit angulous components
RSE-1 ̶ Mano Fm ̶ 4,590.5 m:dolomite breccia whit rounded components

45
Carbon capture and storage . The Lacq pilot Chapter 3: Geological characterization and modelling
07: Petrographic features and mineral distribution in the Rousse dolomite reservoir
(a) Typical dolomudstone crosscut by dolomite-filled fractures (plane light, optical microscope)(b) Detail of dolomite microsparitic matrix (plane light, optical microscope)(c) Detail of dolomite fracture-fill and late calcite (SEM-Quantax mineral map)(d) Calcite fracture developed within a preexisting dolomite fracture (SEM-Quantax mineral map)(e) and (f) Neoformed chlorite along fracture wall [(e) Optical microscope microphotographs, (f) SEM chemical map]

46
As some preliminary modelling of the chemical impact of CO2 underlined the role of the chlorite fractions as a potential cation donor (Thibeau, et al. 2009) some efforts were conducted in order to identify the chlorite and quantify its chemical composition.
The refined X-ray diffraction (XRD) analysis of the < 1µm clay size fraction of Rousse reservoir samples suggested that chlorite occurring in the reservoir was mainly of a magnesian type. However, precise determination of its chemical composition was achieved by use of two different techniques:
1. Scanning Electron Microscope (SEM)-Quantax spot analyses (10 analyses)2. Electron MicroProbe Analysis (EMPA) (24 analyses)
Both techniques were applied to the chlorite occurring as fracture lining in one sample of the Rousse reservoir. They yielded consistent chemical composi-tions, indicating the chlorite is exclusively of magnesian composition, with the following average chemical formulae, close to a Sudoite-type chlorite:[Si3.8 Al0.2 ] (Al3.2 Mg1.3) O10 (OH)8
Review of initial thermodynamical equilibrium led to the definition of the following average chemical composition of the Mano formation (Girard, et al. 2012):
Table 01: Average chemical composition of the Mano formation
Mineral formulae % mass M (g/mol) % mol % mass mol/kg water mol/m3 rock
Dolomite-ord
Calcite
Quartz
Pyrite
Apatite
Sudoite
Muscovite
Montmorillonite-Na
CaMg(co3)2
CaCO3
SiO2
FeS2
Ca5F(PO4)3
(AI 3Mg2)(Si 3AI)O10(OH)2
(KAI 2)(Si 3AI)O10(OH)2
(AI1.67Na0.33Mg0.33)Si4O10(OH)2
93.6
0.5
2.5
0.4
0.2
0.3
0.8
1.7
184.40
100.09
60.08
119.98
504.30
536.84
398.31
367.02
89.77
0.95
7.42
0.53
0.08
0.05
0.35
0.83
93.69
0.54
2.52
0.36
0.23
0.14
0.80
1.71
1567.67
16.59
129.55
9.28
1.40
0.83
6.19
14.41
14109.94
149.31
1165.95
83.51
12.60
7.47
55.75
129.71

47
Carbon capture and storage . The Lacq pilot Chapter 3: Geological characterization and modelling
08: Petrophysical measurements at Mano formation (well RSE-1). Semi-logarithmic plot of porosity versus permeability (referred to as PHI/K cross-plot)
09: Mano formation – example of small-scale fracturation
Petrophysics
The matrix of the Mano formation shows degraded petrophysical properties, with an average porosity value of 3%, and very low average permeabilities (< 1 mD). 08
Fracturation
Fracturation plays an important role for dynamics. The Mano reservoir frac-turation is heterogeneous and occurs at various scales:
¬ At fine scale, with a higher density and without apparent filling in packestones/grain-stones facies; 09
¬ At intermediate scale, localized in metric to decametric fracture corridors;
¬ And in kilometric-scale zones, centered on normal faults that were active during the neocimerian tectonic phase at Barremian times.
A review of well tests performed in the Mano formation and in nearby analogue gas fields (Meillon Saint-Faust), led to choosing an effective permeability of 5 mD for the reservoir modelling to account for fractures in the reservoir.

48
SEAL UNITS
Main seal units and associated lithologies
The basal Upper Cretaceous interval onlaping the Rousse horst constitutes the reservoir seal. Three main Upper Cretaceous seal units and associated lithologi-cal types have been identified, respectively (1) the Rousse Breccias, (2) calcareous turbidites (‘Calcaire de Soumoulou’ formation), and (3) marly to silicoclastic tur-biditic flysch series. The seal was cored at wells RSE-1 and RSE-2. 10
¬ The Rousse breccia debris flows deposits represent the lowermost, most proximal and most immature member of the filling process. They are cali-brated by wells RSE-1 and RSE-2, above the BCS, but are absent in well RSE-3. Two distinct types were encountered, respectively:
a. Carbonaceous matrix of Cenomanian-Coniacian age embedding dolomite clasts reworked from the Upper Jurassic Mano dolomite (encountered and cored at RSE-2 only, 110 m thick);
b. Carbonaceous matrix of Campanian age embedding carbonates clasts of Aptian age (encountered and cored at RSE-1 only, 25 m thick).
¬ At Rousse, these deposits are sourced from the North, but are neither directly mappable, nor visible on the seismic sections. The breccias debris flow deposits have a limited lateral extension and are laterally and vertical-ly relayed by the Upper Cretaceous marly-calcareous turbidites. The flysch deposits represent a further expression of the sequential organization of the Upper Cretaceous marine, marly-calcareous turbidites, in a more distal and/or lateral position. These deposits are more mature and organized in fining-up sequences dominated by carbonates, with an increasing shaly
content towards the top of the series. They also constitute the matrix for the Rousse breccia. Two sub-facies are distinguished, respectively:
c. Alternations of blackish marls and calcareous shale with fine levels of silts series, constituting the majority of the deposits. These facies are cored in RSE-1;
d. The cherty limestones (‘Calcaire à silex de Soumoulou’ formation), rep-resenting a distinct basalmost member of these deposits, and found only at well RSE-2 (130 m thick). These facies are cored in RSE-2.
Seal mineralogy
The samples analyzed show three distinct mineralogical signatures, globally evolving from:
¬ At the base of the cap rock, car-bonates are encountered (calcite and dolomite) originating from Mano dolomite clasts, (sample 4 in Rousse breccia at RSE-2);
¬ Above the carbonate clasts, still dominant calcite minerals are en-countered but with a noticeable higher concentration in quartz and clays in shallower samples from overlying Campanian marly-calcareous flysch series (samples 1-3 at RSE-2);
¬ Even shallower, clay and quartz mineral fractions are increas-ing, representing 50% of total composition in the shallowest sample (sample 5 at RSE-1) in shalier flysch levels.
10: Correlation of wells RSE-1, RSE-2 and RSE-3 in basal part of the Rousse seal deposits

49
Carbon capture and storage . The Lacq pilot Chapter 3: Geological characterization and modelling
The overall evolution of the miner-alogical composition is consistent with a vertical evolution of deposits from debris flow at the base, to a more mature turbiditic to siliciclastic sequence of deposition.
Seal petrophysics
All identified main seal lithological types were analyzed. Various tech-niques adapted for such very low porosity and permeability measure-ments were tested.
The porosities are best evaluated through Helium injection technique (pycnometer). Measured porosity values are comprised between 1 and 3.5%.
Permeability was measured through a gas injection technique at a con-finement pressure of 100 bars. Four distinct petrophysical groups are iden-tified (Pourtoy, et al. 2012) (Tonnet, et al. 2011) (Tonnet, et al. 2010):
¬ Upper Jurassic dolomitic clasts embedded in breccia, with a permeability close to that of Mano Dolomite reservoir (up to 150 µD), encountered at RSE-2 well;
¬ The carbonaceous clasts and matrix components of the breccia (both of cretaceous age), with very low permeabilities (lower than 1 nD);
¬ Very low permeability carbona-ceous turbidites (0.1 nD);
¬ Low permeability marls to calcareous marls (1-10 nD).
The Jurassic dolomite clasts embedded in lowest units of the breccia might locally present reservoir qualities due to deformation or fracturing, as observed on RSE-2 where hydro-carbon indices are observed in this interval (but not on RSE-1). However, the overlying calcareous matrix and calcareous clasts breccia unit of creta-ceous age proves to have efficient seal properties.
As underlined in (Tonnet, et al. 2011) and (Tonnet, et al. 2010), permeabil-ity values are very sensitive to con-finement pressure. Non-preservation of the cap rock sample could also be an issue.
Measurements of the capillary entry pressure of cap rock samples were also performed, using either CO2 or N2. Values depend on the porous structure of the seal lithologies (size of biggest pores and or of mi-cro-fractures), on the value of water/CO2 interfacial tension, but also on water wettability in presence of CO2. Measurements are challenging in such low permeabilities lithologies and require long experimental proce-dures (weeks to months). Samples are dried, and saturated under pressure in vacuum conditions, and dead volumes are saturated in gas. Average effective in-situ stress is applied by a confinement pressure on the plug. Unfortunately, capillary entry pressure for supercritical CO2 could not be measured precisely in the very low permeabilities seal lithologies of the Rousse reservoir. Measurements by steps applied on 5 samples from wells RSE-1 and RSE-2 did not see any gas displacement in the samples and concluded that the entry pressure to CO2 is higher than 75 bars (Tonnet, et al. 2011).
Faulting
Structurally, the Rousse reservoir belongs to a compartmentalized horst structure and is limited by normal faults, more likely associated to Albo-Aptian rifting phase (Gapillou, et al. 2009). The Base Upper Cretaceous unconformity (BCS) erodes the top and part of the flanks of the structure, and plays a major disconnecting role. Fault at reservoir are mainly sealed by the BCS. Only marginally do some of them show limited expression in post-BCS series but are sealed at the base of the Campanian flysch deposits anyway. Faults at Upper Cretaceous seal are posterior and clearly discon-nected from those at reservoir, since they originate above the BCS, and show a distinct orientation.
The stability of these faults is assessed in the geomechanics studies.

50
RESERVOIR
The static geomodel of Rousse reservoir formations and their cap rocks was built from:
¬ The regional structural and sedimentological features presented in the previous section;
¬ A regional well and seismic database (Pourtoy, et al. 2012). 11
From regional seismic horizons, which were revisited locally around the Rousse Jurassic structure, and well data, it was possible to define the Top and Base of the Mano reservoir, the Top and Base of the Meillon reservoir, the Base Cretaceous map and other seal intermediate horizons, as illustrated on figure 12 (Gapillou, et al. 2009). 12
11: Screen capture of a 3D Window of the regional database, showing wells and a near Top Cretaceous map
GEOLOGICAL MODELLING
3.2

51
Carbon capture and storage . The Lacq pilot Chapter 3: Geological characterization and modelling
12: Schematic of the layering of the reservoir model
13: Rousse Mano reservoir static model faults affecting the Jurassic structures and the two wells RSE-1 (penetrating Mano and Meillon formations) and RSE-3 (penetrating Meillon formation only)
The internal layering of the Rousse reservoir was defined to capture the petrophysical units seen at RSE-1 well. Four geological units above Rousse Mano reservoir were also modelled.
As seen on the previous figure, a specific effort was made to pick all faults crossing or limiting the reser-voirs. The set of faults present in the modelled structure is displayed on figure 13. These faults were modelled for the following purpose: 13
¬ Better define the geological structure;
¬ Provide an input to the pressure history match of the production period;
¬ Study the risk of their geome-chanical destabilization during either the gas production period or the CO2 injection period.

52
ROUSSE DYNAMIC FLOW MODEL
A first flow model was built from the reservoir static model (Thibeau, et al. 2012). It incorporates initial pressure and temperature conditions and initial water saturation. 14
A dedicated EOS-based representation of fluid thermodynamic properties was used to model both the properties of the initial gas and of any mixture of the initial gas with injected CO2.
It includes the 16 components that were initially identified within the Rousse gas:
¬ N2, CO2 and H2S, consisting of respectively 1.37%, 4.94% and 0.83% of the initial gas;
¬ 13 hydrocarbon components or pseudo-components (components with more than ten carbon atoms are lumped into a C11+ pseudo component).
However, at this preliminary stage, the reservoir flow models do not account for CO2 dissolution in formation water, nor water vaporization in the dry CO2, nor chemical reactions. Also, O2 and Argon were added at a later stage, as they were co-injected with CO2. The main uncertainty in this dynamic model is the connec-tivity of the various faults separating the reservoir fault blocks together with the pore volume within each block.
14: 3D view of the flow model grid, showing the main fault blocks of the Mano reservoir

53
Carbon capture and storage . The Lacq pilot Chapter 3: Geological characterization and modelling
Two reservoir scenarios (i.e. two sets of fault connectivities) were generated, matching the historical pressure and gas production of the well. In scenario 1, most of the gas accumulation is close to the producer fault block, and the faults are largely open. In scenario 2, more gas is distant from the producer, compensated with a lower connectivity of the faults. Figure 15 illustrates the result obtained. A very good pressure match is obtained in the low-pressure regime, after 1985. It can be noted on the figure that a lesser quality pressure match is obtained before 1985. This is due to the fact that at that period, RSE-1 produces gas from the two different reservoirs Mano and Meillon. As a consequence, the gas production from Mano reservoir only (used to perform the model history match) is somewhat uncertain. Figure 16 displays the pressure measurements during the injection period, and the comparison with the two scenarios. A slight pressure shift is noted at the end of the injection period. 15, 16
15: Historical Mano gas production, historical pressure recordings in RSE-1 and pressure calculation from the flow models
16: Pressure evolution during the CO2 injection

54
GEOMECHANICAL INTEGRITY
Seal integrity to CO2 injection
All the studies were performed knowing that reservoir pressure will remain substantially below initial (pre-production) reservoir pressure of 480 bars. Indeed the volume of gas produced is much larger than the volume of CO2 injected and the reservoir is not connected to any regional aquifer that would maintain pressure.
Geomechanical integrity
One challenge concerning the evalua-tion of the geomechanical integrity of Rousse seal is that it may have been damaged during the gas pro-duction period, when gas pressure dropped from 480 to 30 bars. It is well known that reducing the pressure in a reservoir results in compaction in the producing interval and stretching/ shearing in the overburden, which might damage the seal, reducing its ability to retain pressures as high as the ones that prevailed before depletion. For those reasons, calcu-lations of the mechanical stability of the cap rock after CO2 injection must consider the whole cycle of depletion and injection.
GEOLOGICAL INTEGRITY
3.3
To evaluate the safe pressure envelop for the Rousse seal (including the faults), a comprehensive geomechan-ical study was performed, which included:
¬ The set up of a 1D Mechanical Earth Model (1D-MEM) for the reservoir and the overburden, which establishes along the RSE-1 trajectory, the profile of in-situ stresses and formation mechanical properties. Their values will be used to build the 3D model.
¬ The set up of 3D Mechanical Earth Model (3D-MEM). The finite element grid of such model is obtained by embedding the reservoir grid with over-burden, under-burden and side-burdens. Pore pressure is read at various time steps, and the consequence in term of reservoir compaction and stress changes in the seal are quantified.
¬ Seal failure criteria are reviewed for the faults and cap rock and input in the 3D-MEM.

55
Carbon capture and storage . The Lacq pilot Chapter 3: Geological characterization and modelling
Set up of the 1D Mechanical Earth Model (1D-MEM) at RSE-1 well
Data from RSE-1 well was used to build a 1D-MEM. Depth profiles of poro-elas-tic properties that are Young’s Modulus, Poisson’s Ratio and Biot Coefficient are shown in figure 17.
Stress profiles along the well are calibrated using breakouts from calipers, few leak-off test results, and results of tri-axial tests on core samples taken in the reservoir and its overlying seal. Due to insufficient data necessary to constrain the stress model, four stress profiles were proposed. The most conservative among them turned out to be the scenario with the lowest minimum stress in the immediate cap rock above the Mano reservoir (figure 18), that scenario was used to assess the stability of the seal. According to this model, the stress regime is normal from ground level down to top reservoirs with a maximum horizontal stress oriented N-S. At greater depths, the stress regime changes from normal to strike-slip in hard intervals and the direction of the maximum horizontal stress rotates by 90° toward E-W. This model is consistent with regional tectonic settings and account for stiffness changes between hard carbonate reservoirs and softer shale or marl intervals as can be seen in figure 17. 17, 18
17: Depth profiles of poro-elastic properties on well RSE-1
18: Conservative depth Profiles of stresses and pressure on well RSE-1
Set up of the 3D Mechanical Earth Model (3D MEM)
The reservoir grid is structured and has 96 x 151 x 13 grid blocks, yielding a total of 188,448 grid blocks. Figure 19 shows the active and inactive cells of the reservoir grid. Five seismic horizons were imported from the geological model and the space between them was subdivided into a total of 50 layers in order to model the overburden up to the ground level. The final model has 116 x 161 x 69 or 1,368,684 grid blocks. To complete the geometry, 18 fault planes were imported into the geomechanical model. Figure 20 illustrates the final 3D model and its various compo-nents obtained after reservoir grid embedment and definition of fault elements. 19, 20 (page 56)
Young's Modulus (MPa)
Dep
th (m
TVD
RT)
Poisson's ratio and Biot Coefficient

56
19: Grid of the reservoir model used as a base to construct the 3D MEM. Left: active grid blocks. Right: all grid blocks.
20: Full 3D geochemical model (on the left) and its various components (on the right)
21: Elastic properties over a cross-section cutting along the 81 J line
22: Mohr-Coulomb shear failure criterion properties over a cross-section cutting along the 81 J line
The 3D model was populated with mechanical properties on a lay-er-by-layer basis according to vertical depth profiles from the RSE-1 well 1D-MEM. Elastic and strength proper-ties over a cross section passing by the 81 J line are portrayed in figure 21 and figure 22. 21, 22
Analysis of reservoir deformation using the 3D Mechanical Earth Model (3D MEM)
Reservoir elasto-plastic deformation occurs as a consequence of pressure changes in the reservoir. In the case of Rousse, a large pressure drop has occurred during the gas production phase. In high porosity carbonates (as chalk fields in the North sea), deformations of several meters occur and are transmitted to the sea floor (Goulder and Plischke 2010). One con-sequence of such deformations is an induced deformation of the cap rock, leading to stress changes and possible alteration of the cap rock sealing effi-ciency.
Due to the stiffness of the dolomitic formation (largely due to its very low porosity), the maximum displace-ment at the top of the reservoir occurs at the end of the production period (before CO2 injection) and has a value of 2.7 cm. This minor deformation leads to no significant stress changes in the cap rock. This displacement occurs in elastic mode only, meaning that it is probably reversible.

57
Carbon capture and storage . The Lacq pilot Chapter 3: Geological characterization and modelling
Analysis of potential seal failure using the 3D Mechanical Earth Model (3D MEM)
Various criteria of geomechanical stability have been reviewed (Pourtoy, et al. 2012):
¬ Induced fracture propagation in the cap rock;
¬ Propagation of pre-existing but initially closed fractures and faults in the cap rock;
¬ Propagation of pre-existing and initially fluid conducting fractures and faults, for which the initiation or the reopening phases are unnecessary.
The review of the modelled pressure regimes (in the reservoir) and of the stress changes (in the cap rock) led to the following conclusions:
¬ The depletion phase did not induce any mechanical damage to the cap rock of the Rousse reservoir;
¬ From the geomechanical point of view, it is safe, if needed, to bring back the pressure at least to its initial value while injecting CO2.
As the injection of 50,000 tons of CO2 will not lead to exceeding the initial pre-production pressure, it can be concluded that Rousse geomechanical sealing integrity will not be affected by CO2 injection.
CAPILLARY INTEGRITY OF THE CAP ROCK
The measurements performed on CO2 capillary entry pressures range between 15 and 76 bars.
Initial pressure regimes indicate that:
¬ Gas pressure at the apex of the structure (4,200 m below average sea level) was initially close to 480 bars;
¬ Water pressure in the cap rock above was around 432 bars, using a regional pressure data base.
As such, as the reservoir pressure is to decrease significantly below 432 bars, there is no possibility that CO2 enters the cap rock based on capillary effects.
CAP ROCK MINERALOGY AND GEOCHEMICAL INTEGRITY
Introduction
The chemical stability of the minerals constituting the caprock in contact with the CO2 plume must also be studied, to investigate on possible changes in the cap rock sealing com-petencies using reactive transport modelling (Gaus, et al. 2008), (Gherardi, et al. 2012).
Studies on the reactivity of the caprock to verify its integrity over long periods of time (10,000 years) complement the studies on the reactivity of the miner-alogy in the reservoir (Chiquet, et al. 2013), (S. Renard, 2010), (Thibeau, et al. 2009). In the case of the cap rock, our approach follows the KISS principle (Keep It Short and Simple). The general idea is to maximize some parame-ters or processes in order to build a
worst-case scenario. If the long-term chemical stability of the caprock can be demonstrated in such a case, the confidence in the caprock sealing competency will be reinforced.
The study thus consisted in a numerical modelling of the diffusion of CO2 coming from the Mano reservoir into the caprock (Campanian Flysh), and on the evaluation of the consequenc-es of this diffusion on mineralogy and porosity.
The effects on the mineralogy have been evaluated in a particularly unfa-vorable case. Indeed, it was considered that the CO2 remains in contact with the caprock at its maximum pressure. This corresponds to the most adverse conditions since part of the CO2 will flow downwards due to gravity effects, leading to lower reaction rate near the caprock than in the conditions that were assumed. Moreover, effects of dissolution kinetics were not con-sidered, which are effects that tend to slow the degrading effects of minerals. Calculations are carried out at ther-modynamic equilibrium. Reactions of dissolution and precipitation are assumed to be immediate which maximizes the effects of degradation of minerals. Finally, the buffering effect in the reservoir identified by Chiquet (Chiquet, et al. 2013) is not considered. The dissolution of clay minerals (sudoite, illite, interstratified illite/smectite) will partially mineral-ize the CO2 and will decrease its con-centration at the caprock interface.

58
Caprock characterization
Upper Cretaceous series constitute the seal above the Mano reservoir, with a thickness of 2,500 m (figure 1). The base of these Upper Cretaceous series is a key surface that truncates the Upper Jurassic series and disconnects the faults from the reservoir to the Upper Cretaceous. Immediately above the Mano reservoir, the Rousse Breccia is composed by angular pieces of Mano dolomite cemented by calcite. The chemical and mineralogical composition of this breccia is not very different from the Mano reservoir and is not considered in the modelling. More interesting in a sealing point of view is the Campanian Flysh, which contains high proportion of clay minerals. Modelling is thus focused on this rock. A detailed mineralogy has been made from one of the rare cores preserved since 1967. This core shows two types of rocks: Calcareous bank and Silt-marly interbank. The mineralogical composition is given in table 2. The clay fraction is composed of illite, interstratified illite/smectite, kaolinite and chlorite. The chlorite of the Campanian Flysh differs from the Mano reservoir. In the first case, the ratio Mg/Fe is close to a ripidolite and in the second case the absence of iron deter-mines a sudoite with a high concentration of Si and a low concentration of Mg. Table 02
It is also interesting that the porosities of the Upper Cretaceous series are very low: between 0.6 and 4%.
Given the mineralogical variability of the Campanian Flysh, three cases will be studied: clayey interbank, carbonate bank and an average value of mineral pro-portions (mean).
Table 02: Mineralogical composition of the Campanian Flysh (%mass)
Numerical model
Different tools, parameters and assumptions are used to build the reactive model:
¬ PHREEQC code (Packhurst and Appelo, 1999) associated with the database THERMODDEM. This database is used because of its completeness (especially for clays) and internal consistency (Blanc, et al. 2012);
¬ The temperature considered is 145°C;
¬ The model is purely diffusive, which means that there is no convective flow in the caprock. This assumption is coherent with the very low porosity and low permeability of this rock (< 10 μD);
¬ The transport model is a 1D model. The meshing considers single mesh of 10 cm and a thickness of 10 m of flysh;
¬ The caprock is water saturated. By consequence, the diffusion of CO2 is considered only as dissolved species (aqueous-phase system). This option maximizes the degradation as the dissolu-tion of the minerals acts in the aqueous phase only and not in the supercritical or gaseous phases. The effective diffusion coefficient of ions in solution is 10-10m2/s. The value corresponds to the diffusion of aqueous species of CO2 in water which is 10-9m2/s at 30°C (Chiquet, “Captage et stockage géologique du dioxyde de carbone ions -- Diffusion Mouillabilité Tension

59
Carbon capture and storage . The Lacq pilot Chapter 3: Geological characterization and modelling
superficielle”. PhD Thesis in French 2006), divided by the tortuosity of the rock (a factor 10 is typically used for this type of rock) 3. For sensibility cal-culations, a value of effective diffusion of 10-9m2/s has also been tested;
¬ The initial porosity consid-ered in the model is 1-3.5% by volume. This is the maximal value measured;
¬ Pressure changes in the caprock (effect on equilibrium constants, risks degassing) are not taken into account;
¬ The initial CO2 fugacity in the caprock is constrained by the mineral assemblages. The fugacity of CO2 in the reservoir is maintained at 100 bars. (This is a boundary condition during the calculation). A gas tracer (Ar(g) 1 bars) is added in order to have a non-reactive tracer allowing a good visualization of the gas transport;
¬ The redox system (Fe and S) is considered in the model. However, traces of O2(g) are not considered in this study;
¬ Finally the geochemical events that had occurred during the production phase of the reservoir are not known and are not considered. It is assumed that they are probably insignifi-cant. The extraction of methane from the reservoir is not a reactive process.
3. The temperature could increase by a factor of 10 or more the diffusion coefficient but ex-perimental data at 145°C is absent. The salinity can decrease this ratio by a factor of 2 between the dilute media and those saturated with halite
Initial water/rock equilibrium in the caprock
The chemical equilibrium of this system must be defined before modelling the diffusion of CO2 into the caprock.
Minerals included in the model are listed in table 1, and are pure phases:
¬ Dolomite; ¬ Calcite; ¬ Siderite; ¬ Quartz; ¬ Albite; ¬ Pyrite; ¬ Kaolinite; ¬ The illite + interstratified illite/
smectite was introduced into the model as the illite IMT2;
¬ The chlorite in the caprock contains less magnesium than the chlorite in the reservoir (Sudoïte), with values of Mg > Fe. This chlorite is represented with the chlorite CCa-2 that presents a ratio Mg / Fe of 1.58. This is the closest composition available in the data base THERMODDEM.
The pore water content of Cl and SO4 is not well known. Indeed, it is not possible to leach the very old core sample obtained in 1967. The chloride content can only be known consider-ing that the in-situ value matches the concentration of the last generation of fluid inclusions. Values of 2 mol/kgw of NaCl obtained by Renard (S. Renard, 2010) have been considered. For SO4, given the absence of Anhydrite in the vicinity of the caprock, a value lower than the solubility of Anhydrite has been selected: 0.025 mol/kgw.

60
Table 3 presents the result of the equilibration of pore water with minerals. The column “Delta” shows the quantity of minerals that were dissolved to furnish elements to the solution and to reach water/rock equilibrium. This equi-librium is easily obtained, and is the proof of the co-existence of all minerals at a global thermodynamic equilibrium. However, to reach this result, Albite was only allowed to dissolve and not to precipitate. If Albite is allowed to precipi-tate, the mineralogical assemblage is unbalanced, with a strong dissolution of illite, modifying globally the proportion of minerals and increasing improperly the concentration of K (0.95 mol/kgw) in the pore water. Table 03
The co-existence of Albite with clay minerals and the significance of this paradox have been discussed quite extensively in (Gaucher, et al. 2009), (Pearson, et al. 2011). It was concluded that the solubility of feldspar in similar clayey system is too low for dissolution but that the kinetics of precipitation of those phases is also too low for precipitation. Feldspar (Albite, Microcline, etc.) is globally inert in such systems.
Table 04: Composition of the pore water at equilibrium with the caprock
Table 03: Mineralogical composition of the caprock in Mol/kgw during the batch equilibration with the pore water
In the pore water, elemental con-centrations correspond to what is expected for this type of solution. The pH is slightly alkaline (6.42), which also seems normal (the neu-trality of pure water at 145°C is close to 5.6). It can be noticed that the CO2 partial pressure pCO2 is naturally es-tablished by the balance between the minerals and the solution and that pCO2 is already of 2.88 bars. Table 04

61
Carbon capture and storage . The Lacq pilot Chapter 3: Geological characterization and modelling
23: Non-reactive (Ar(g)) and reactive (CO2(g)) diffusion in different types of rocks: calcareous banks, clayey interbanks and mean banks. Calculation is done for 10,000 years of interaction.
24: Evolution of pH in the different types of rocks: calcareous banks, clayey interbanks and mean banks. Calculation is done for 10,000 years of interaction.
Results of reactive transport modelling
In the following, the state of the system at 10,000 years is only discussed. Intermediate states, calculated every 1,000 years, do not provide significant information about the evolution of the system.
The propagation of gases from the reservoir into the caprock is visible in figure 23. In all three simulations, the diffusion of Ar(g) is identical, con-firming the reproducibility of the transport calculation. 23
CO2(g) is strongly buffered by the mineral assemblage. The progress of the gas diffusion is stopped at 80 cm in the Calcareous Banks (or mean banks). The buffering effect is even stronger in clayey interbanks where gas diffusion is stopped at 50 cm.
In perfect anti-correlation with the partial pressure of CO2, the pH curves show the acidification of the medium by CO2. The buffering effect on the pH is much stronger when the banks are clayey. However, the three curves have very close forms. 24

62
Figures 25, 26 and 27 show the evolution of the mineral volume fractions in the caprock. The figures also show the evolution of porosity. These volumes are shown for 100% of the volume of a mesh of 10 cm (thickness) after 10,000 years of in-teraction. The evolution of the pore volume is calculated considering 1 liter of initial solution and the change induced by the precipita-tion or dissolution of minerals with higher or smaller molar volumes. Figure 25 shows the results for the Mean Banks, figure 26 for Silt-Marl in-terbanks, figure 27, for the Calcareous Banks. For the three scenarios, two major phenomena occur: dolomiti-zation and kaolinitization of 60, 50 and 80 cm of the caprock, respectively. These results are in agreement with the reaction paths that were consid-ered in the reservoir rock, (Chiquet and Thibeau, 2013). The clay content of the rock is clearly a barrier to the penetration of CO2 in the caprock. 25, 26, 27
25: Evolution of mineral volumes and of porosity in the caprock. Calculation is done for 10,000 years. Mean Banks. (Focus on the first 1.6 m of the caprock)
26: Evolution of mineral volumes and of porosity in the caprock. Calculation is done for 10,000 years. Silt-Marl interbanks. (Focus on the first 1.6 m of the caprock)

63
Carbon capture and storage . The Lacq pilot Chapter 3: Geological characterization and modelling
In the following, the description starts from the state where caprock is intact and progresses in the direction of the reservoir. The case of the Silt-Marl interbanks is described in detail, where phenomena are maximized (figure 26). The other two cases will be put into perspective in relation to this first case.
Three minerals appear not to be very reactive in the system: quartz, albite (by definition for precipitation), and pyrite. Dissolution of albite is not observed. Its precipitation has no meaning at considered temperatures. The process of Quartz dissolution / precipitation is fairly marginal in the 0-90 cm interval. Pyrite concentration decreases by half in the 0-50 cm interval.
The first major phenomenon that is observed is a rearrangement of the pro-portions between the clays. This is clearly visible in the interval 60-80 cm of figure 26. The primary kaolinite disappears temporarily in favor of illite while the proportion of chlorite decreases. Magnesium released by chlorite is taken by a first precipitation of dolomite. In the next interval from 50 to 60 cm, a secondary kaolinite precipitation is observed mainly at the expenses of chlorite but also illite. Magnesium released by these two clays promotes the precipita-tion of dolomite. In this case the calcium comes from the partial dissolution of calcite probably destabilized by the more acidic conditions. The release of Fe by the dissolution of illite promotes the precipitation of siderite. CO2 mineraliza-tion in the caprock is quite significant in the interval 10-50 cm as the volume proportion of carbonate minerals (calcite, dolomite, siderite) increases by 80% compared to the initial volume. In the interval of 10 to 50 cm, the disappearance of the initial porosity is observed as dolomite precipitated with a larger molar
volume than the minerals that are dissolved. In the calculation, retro-active effects on the transport para- meters are not introduced. The cal-culation of the diffusion is not stopped when the porosity drops to 0. However, the calculation identifies a clogging effect that will have an additional positive effect on the integrity of the caprock. However, in the first mesh in contact with the reservoir, calcite has undergone a most drastic effect due to the acidic en-vironment prevailing in the reservoir: calcite is totally dissolved. Secondary dolomite is also greatly reduced. Disappearance of these carbonate minerals open secondary porosity which leads to porosity values greater than 3.4 times the initial porosity in this first mesh from 0 to 10 cm.
All the phenomena described above are also present in the case of the Mean Banks (figure 25), except for the disap-pearance of calcite in the first mesh. The effect of total clogging is found in the interval 10-30 cm. The reduction of porosity is still very strong in the interval 30-60 cm.
For Calcareous Banks, the propaga-tion of the disturbance is recorded up to 90 cm (figure 27). Clays are much less present, therefore, the buffering effect resulting from their presence is lower than in the clayey banks. In this latter case, there is no evidence of clogging of the porosity even if the loss of pore volume is very significant in the interval 10-70 cm.
27: Evolution of mineral volumes and of porosity in the caprock. Calculation is done for 10,000 years. Calcareous Banks. (Focus on the first 1.6 m of the caprock)

64
28: Evolution of pH in the mean banks case. Calculation for 10,000 years of interaction with two diffusion coefficients: 10-9 m2/s and 10-10 m2/s.
Sensibility calculation for diffusion coefficients
The effective diffusion coefficient of the previous calculation has been multi-plied by 10 to take into account an effect of temperature on this parameter. With a value of 10-9 m2/s, the propagation of the chemical perturbation, for example showed by pH (figure 28 for the Mean Banks) reaches 2.8 m after 10,000 years instead of 0.9 m. 28
The mineralogical evolution shows the same trend with dolomitization and kaolinitization. The dissolution of minerals in the two first meshes is more drastic, with a porosity reaching more than 50%. This effect is obviously linked to the boundary conditions. Tests made considering an addition of 1 m of reservoir
rocks do not show such evolution, the CO2 perturbation being buffered by the minerals of the reservoir. Considering the opposite evolution in next meshes (20-90 cm), the clogging of the porosity is observed in the dolo-mitization/kaolinitization zone, for a thickness of 70 cm. 29

65
Carbon capture and storage . The Lacq pilot Chapter 3: Geological characterization and modelling
29: Evolution of mineral volumes and of porosity in the caprock. Calculation for 10,000 years of interaction and an effective diffusion coefficient of 10-9 m2/s. Mean Banks. (Focus on the first 3 m of the caprock)
Conclusion
The reactive transport modelling study that was performed shows a mineralogi-cal evolution in line with what had previously happened in the reservoir. Despite the choice of very disadvantageous conditions, geochemical trends show no mineralogical degradation leading to the creation of porosity with the exception of the first 10 cm mesh in contact with the reservoir, after 10,000 years (20 cm with an effective diffusion of 10-9 m2/s). The caprock shows a very marked buffer effect driven by the processes of dolomitization and kaolinitization. These major events are accompanied by precipitation of siderite and quartz. The higher the proportion of clays (chlorite, illite), the higher is the buffer effect. In the cases of Clayey Interbanks and of Mean Banks the porosity can be completely sealed on significant thicknesses due to the precipitation of minerals of large molar volumes. Even considering a very pessimistic case with a higher effective diffusion coefficient, 3 m of rock were only modified. This value has to be compared to the thickness of the Campanian Flysh of 2,500 m.
Finally, the low penetration distance of CO2, the very strong buffer effect and the clogging of the porosity, lead to the conclusion that the geochemical degrada-tion of the caprock by the presence of CO2 stored in the reservoir cannot lead to a leakage of gas into the overlying aquifers by a geochemical process.

66

67
Carbon capture and storage . The Lacq pilot Chapter 3: Geological characterization and modelling
By analyzing the data collected, Total’s Geoscience teams (geomodelling, geomechanics and geochemistry) were able to qualify the Rousse site as an ideal location for storing the CO2 captured from Lacq’s industrial installations.”TOTAL, Sylvain Thibeau, Expert in the geological storage of CO2
“

68
chapter 4
WELL IN-TEGRITY
authors
A. Garnier (Total)J. Saint-Marc (Formely Total)J-B. Laudet (Total)F. Rodot (Total) C. Urbanczyk (Total) A-P. Bois (Curistec)

69
Carbon capture and storage . The Lacq pilot Chapter 4: Well integrity
In particular, as cement sheaths are among the key barriers that should ensure containment integrity it is necessary to evaluate the risk of potential leakages occur along cement sheaths from debonding at one of the cement-sheaths’ boundaries or when cement becomes damaged.
Isolation defects that can affect wellbore integrity may arise from improper cement placement. They may be the result of cement slurry contaminated by fluid from the surrounding formations while the cement sets. They may also be the result of inappropriate set- cement properties. Laboratory tests, numerical modelling and field experi-ence show that there exist two types of mechanisms that could lead to ce-ment-sheath loss of integrity (Zhang and Bachu, 2011, Bois, et al. 2013): mechanical degradation when cement is subjected to excessive compres-sive or tensile loadings or chemical degradation when cement contacts carbon dioxide enriched-water. The worst case is when both degradation mechanisms occur at the same time or in succession. For example, a mechanically damaged
THE IMPLEMENTATION OF CO2 STORAGE IN GEOLOGICAL MEDIA REQUIRES A PROPER ASSESSMENT OF THE RISK OF UNCONTROLLED LEAKAGE FROM THE STORAGE SITES.
cement-sheath may allow penetration of the acidi fluid, which will further accelerate degradation through chemical processes.
Hence, it is of paramount importance to understand the mechanisms that could lead to cement-sheath loss of integrity all along well’s life and Total has launched various R&D projects to elaborate guidelines in order to eliminate such risk.
These guidelines require that cement-sheath integrity be looked at as a workflow that starts from the design stage, and ends up after the well is plugged and abandoned. Cement-sheath integrity analysis cannot be performed at a given period of the life of the well without also having been performed at the earlier stages.
Four sections form the bulk of this chapter: the first presents a short overview of the different periods of life of a cement sheath; the second is devoted to cement-sheath mechan-ical integrity; the third is dedicated to cement-sheath chemical integrity; and the fourth presents the applica-tion of Total’s methodology to Rousse well (RSE-1), and concludes with the analysis of risks related to a loss of hydraulic isolation that could possibly lead to leakage.

70
The life of a cement sheath can be divided into five periods that should be looked at, taking into account constraints of geological (temperature, fracture gradient, types of formations and fluids), wellbore (diameters, over-gauge sections, location of reservoirs and barriers), operational (onshore/offshore, service companies, procure-ment, equipment, storage on site), and regulative (company rules, norms, laws) origins. 01
First period is the production of mixable and pumpable cement slurry. The main variables that can be adjusted to obtain the most appro-priate cement properties slurry are related to the cement-system compo-sition. Quality check is performed in the laboratory through measuring rheology, stability (free water and settling tests), thickening time, fluid loss and compressive strength, and on-site through quality assurance/quality control (QA/QC).
Second period is the placement during which all drilling fluids have been displaced by the cement slurry in the annulus between the tubular (casing or liner) and the hole. After the slurry has been pumped. Gains and losses must be are controlled and must be limited to very low volumes, and defects such as mud channels in cement and formation damage (fracturation, destabilization), which could put well integrity at risk, have to be prevented. The main variables that can be adjusted to optimize cement placement are the number of fluids
(mud, chemical wash, spacers and slurries), their volume, their density and their rheological properties. Other important variables include avoiding compatibility issues among fluid compositions, the pumping sequence, hydraulics, and tubular movements during or after cement placement (rotation, reciprocation). Numerical simulations allow computing single and multi-phasic flows with fluid interfaces to specify the fluid characte- ristics that ensure an efficient cement placement. Cement placement can partially be checked through data analysis performed during mixing, pumping and displacement or later by cased-hole log analysis.
The third period involves hydration of cement that is characterized by: 1) temperature variations due to the exothermic nature of the chemical reactions; 2) volume variations due to water consumption, hydration of anhydrous grains, chemical shrinkage, and post-expansion; 3) fluid exchange between cement and formation (losses, gains); and 4) cement-properties changes. These processes impact the values of stresses and pore pressures within the cement, and can have very important consequences on the short (gas migration in cement pores, micro-annulus formation, formation destabilization) and middle to long term (stresses at end of hydration too low or too high for cement to remain undamaged during its further life). The main variables optimize that can be adjusted to improve cement hydration are the composition and
THE LIFE OF A CEMENT SHEATH
4.1

71
Carbon capture and storage . The Lacq pilot Chapter 4: Well integrity
pressure regime at the end of placement to control the evolution of cement slurry properties (volume variation, mechanical properties). Numerical simula-tions allow computing the changes of stresses during hydration and the state of cement before it is subjected to loadings that will occur during its life. The result of cement hydration can partially be checked through the analysis of cased-hole logs.
The fourth period is the setting of cement during the short term. Indeed, after cement has hardened, the cement sheath is submitted to various thermo- mechanical loading/unloading events, such as when performing a casing test, resuming drilling operations or when heating the well during testing. If these loadings are too large compared to cement strength, there is a risk of damaging the cement and compromising the well’s integrity. The main variables that can be adjusted to improve cement short-term behavior are related to the cement design as it controls the state of stress in the set cement and its mechanical properties (strength and elastic properties). Numerical simulations allow computing the evolution of the state of stress within the cement as a function of time and loadings and checking whether the cement may be damaged. The behavior of set cement in the short term can partially be checked through the analysis of cased-hole logs and annulus pressure monitoring.
The fifth period is the setting of cement during the middle to long term when the cement sheath is not only submitted to thermo-mechanical loading/unloading events but also to creep, thermo-mechanical fatigue and, possibly, chemical degradation if the cement contacts an acid fluid. Such loadings
01: Periods of the life of a cement sheath
and alterations can compromise long-term cement-sheath integrity. As with the short term, the design of cement has a very important role in controlling these effects, because it impacts not only its state of stress and its mechanical properties after it has set, but also its ability to resist to any future degradation. Numerical simu-lations and quality control (logging, annulus pressure monitoring) are also needed in this period.
Total has been leading several R&D programs to address the issue of cement-sheath integrity, hence covering the entire life of a cement sheath. Total has developed a well integrity strategy based on the inte-gration of different tools to analyze potential risks from different scenarios and elaborate on optimum strategies to minimize risks: 1) per-forming tests in the laboratory (with adequate testing procedures); 2) applying QA/QC techniques on site; 3) monitoring Wellhead Pressure (WHP) and surface casing vent opera-tions; 4) logging wells before running tubular in hole and after cementing; and 5) modelling cement-sheath behavior during the life of the well. The modelling is at the heart of designing a good cement solution and of interpreting observations made during testing, logging or monitoring. As a consequence, it is of paramount importance to have a toolbox with high quality models, and this requires being able to evaluate and compare the models. A discussion of models used to simulated cement-sheath mechanical integrity is presented in the next section.

72
INTRODUCTION
The key point to cement-sheath mechanical modelling is to select constitutive-laws that efficiently predict cement behavior. For that purpose, it is necessary to understand the main features of cement mecha- nical behavior (Bois, et al. 2011, 2012, 2013):
¬ At a degree of hydration lower than a given value, termed percolation threshold, cement behaves following laws of fluid-mechanics;
¬ At a degree of hydration higher than the percolation threshold, cement behaves following laws of poromechanics;
¬ Cement hydration leads to an increase in grain volume and to a decrease in the mass of fluid in the cement pores;
¬ Cement hydration leads to a change in cement physical and mechanical properties;
¬ Cement volume variation during hydration occurs while cement properties evolve;
¬ Cement can exhibit creep, damage and pore-collapse phenomena depending on its composition and the state of stress.
Conventional mechanical models (see following paragraphs) are generally not sufficient to describe
the behavior of Oil and Gas cement in downhole conditions, because most of them do not explicitly simulate cement hydration, and are based on continuous, one-phase, linear elasticity theory up to a threshold that depends on the cement’s unconfined compres-sive strength and tensile strength:
¬ Linear elasticity is defined by means of two static constants (E, ν) that are different from the dynamic constants that are evaluated based on compression and shear wave velocities. The static constants are measured by loading set- cement specimens in either compression or tension within the range of elastic behavior;
¬ The Uniaxial Compressive Strength (UCS) is used in shear damage criteria such as Mohr-Coulomb criterion to determine when cement becomes damaged in compression. Such criteria generally require an additio- nal parameter to evaluate how much strength is gained when the mean effective stress (p’) is increased. In the case of the Mohr-Coulomb criterion, this parameter is the friction angle (φ). Damage criteria are evaluated by performing triaxial tests, in which the axial stress (σa) is increased while a confining pressure (pc) is kept constant on samples;
CEMENT-SHEATH MECHANICAL INTEGRITY
4.2

73
Carbon capture and storage . The Lacq pilot Chapter 4: Well integrity
CEMENT BEHAVIOR
Poromechanics
Ghabezloo, et al. (2008, 2009a, 2009b) performed an extensive experimental testing program on a class G cement-system prepared with a water-to-cement (w/c) ratio of 0.44 under pressure and temperature. Samples were prepared and cured in lime-saturated water, at 90°C during at least 3 months.
This experimental program comprised drained/undrained isotropic tests, un-jacketed compression tests, drained/undrained heating tests, and perme-ability evaluation tests. Pore pressure (pp) remained constant during drained tests while undrained tests were run with no fluid exchange between the cement and the surrounding environment. Unjacketed tests were performed such that pore pressure and confining pressure remained equal (pp=pc) during the entire tests.
Results from this experimental program confirmed that the behavior of set cement could be described within Biot’s theory of poromechanics (Coussy, 2004, 2010). Moreover, they permitted evaluating the numerical values of the different thermopo- roelastic parameters. 02
These results were later extended to other cement systems with different w/c ratios and chemical composi-tions by means of micromechanical modelling and homogenization methods (Ghabezloo, 2009, 2010, 2011a, 2011b).
The actual analytical (Thiercelin, 1998b, 2007; Di Lullo, 2000) and numerical (Ravi, et al. 2002a; Fleckenstein, et al. 2001; Philippacopoulos, et al. 2002; Pattillo, et al 2002; Gray, et al. 2007) models do not take into account in the poro mechanical behavior of cement because these models are based on continuous, single-phase modelling. The exception is SealWellTM modelling (Saint-Marc, et al. 2008, Garnier, et al. 2010b, Bois, et al. 2011, 2012) that does involve poromechanical considerations.
02: Values of poroelastic constants for oil and gas cement (Ghabezloo, 2008, 2009, Ghabezloo, et al. 2008, 2009b)
¬ The Tensile Strength (TS) is used to compute when tensile cracks are induced in cement, eventually leading to its failure. It is evaluated from direct tensile tests, such as the dog bone test, or indirect tests, such as the Brazilian test, where a cylinder of cement is diametrically loaded in compression.
The need for more sophisticated constitutive laws based on thermo-chemo- poromechanics led Total in 2003 to initiate R&D programs to develop such constitutive laws. These efforts carried out both internally and externally (Fourmaintraux, et al. 2004, Garnier, et al. 2007, Saint-Marc, et al. 2008, Garnier, et al. 2010b, Bois, et al. 2011, 2012, 2013), included two PhD theses (Ghabezloo, 2008, Vu, 2012), the development and of a new cement-sheath mechanical modelling software, SealWellTM, and the installation of a new cell designed to measure cement properties under downhole conditions, STCA (Slurry-to-Cement Analyzer). Some of the main achievements of Total R&D programs are described hereunder.

74
Looking at cement as a porous material allows determining under which con-ditions cement hardens when located in front of a formation barreer, and what its pore pressure is when it has hardened. Numerical simulations of fluid diffusion from formation to cement-sheath were performed by Bois, et al. (2012) to evaluate what exchanges occurred between the formation and the cement-sheath. Considering that formations with 10-nD permeability value are fair barriers, those with 1-nD permeability values are good barriers, and those with permeability values lower than 0.01 nD are very good barriers, the authors showed that the poromechanical behavior of cement during hydration and after having set is not trivial. Hence, cement hydration never occurs under drained conditions when located in front of a barrier unless the barrier is of fair quality and the pore pressures are very high. In all other conditions cement hydration occurs under undrained conditions. It can occur in either drained or undrained conditions when the cement sheath is located in front of an oil-bearing formation, or when it is located in the annulus made by two tubulars. As a consequence, the pore pressure in a cement sheath located in front of a geological barrier, during cement hydration, only depends on the cement formulation, the cement-sheath geometry, and the formation stiffness, but not on the formation pore pressure.
Bois, et al. (2012) also showed that it might take days to weeks for a cement sheath located in front of a fair formation barrier to have its pore pressure equal to the formation pressure if cement pore-pressure had been lowered to vaporization pressure during the hydration phase. It may take weeks to months for a cement sheath in front of a good formation barrier and years in the case of a very good barrier. However, if the initial quantity of water in the slurry is so large that vaporization has not occurred (such as in water extended slurries) then cement pore pressure can reach formation pore pressure in a few days. 03
03: Variation of pore pressure in cement sheath and formation – Initial values of pore pressure in cement sheath and formation are 0 MPa and 10 MPa – Formation permeability is 0.01 nD (Bois, et al. 2012)
Pore collapse
The eventuality that cement plastically compacts when loaded in compres-sion is of paramount importance to understand the formation of micro- annuli (Bois, et al. 2011, 2012). This can occur during the entire life of a cement-sheath.
Bois, et al. (2013) investigated the short-term behavior of cement using the STCA cell. They presented the results of a series of uniaxial strain tests performed at ambient tempe- rature with, first, axial stress cycles between 5 and 15 MPa, then, other cycles up to 45 MPa when cement was older than 25 hours. Cycles performed up to 45 MPa led to the following observations: 04

75
Carbon capture and storage . The Lacq pilot Chapter 4: Well integrity
04: Uniaxial strain tests on cement under isothermal conditions (Bois, et al. 2013)
05: Drained isotropic loading tests under isothermal conditions (Ghabezloo, et al. 2008)
06: Drained deviatoric loading tests under isothermal conditions (Ghabezloo, 2008)
¬ The occurrence of a yield stress confirms the elastoplastic com-pacting behavior of the material. This yield stress depends on the hydration degree and the applied stress during hydration;
¬ The compressibility of young cement in plastic phase can be 4 to 7 times the one in elastic phase;
¬ The compressibility of young cement decreases with applied stress during the plastic phase.
For set cement, the compacting behavior was observed in the form of large permanent strains during the isotropic loading tests performed by Ghabezloo (2008) and Ghabezloo, et al. (2008). As the permanent strains increased when the isotropic confining pressure exceeded 43 MPa, the pore collapse threshold was estimated to this value by Vu, et al. 2012a,b. Pore collapse was also observed during the triaxial loading tests performed by Ghabezloo (2008) and Ghabezloo, et al. (2008), for deviatoric stresses (σa-pc) larger than about 20 MPa. In these tests, pore collapse phenomena were dominant over viscous effects. 05,06

76
Bois, et al. (2011) showed that pore collapse is required to explain the results of some of the experiments performed by Goodwin and Crook (1992) and Jackson and Murphey (1993). For example, Jackson and Murphey’s first experiment consisted of the following steps: 07
1. Have class G cement slurry mixed to 1.89 sg set into the annulus made by a 5”-inner tubular and a 7”-outer tubular;
2. Increase inner-tubular pressure to 13.8 MPa, measure cement-sheath permeability to gas;
3. Decrease inner-tubular pressure to 6.9 MPa, measure cement-sheath permeability to gas;
4. Repeat steps 3 and 4 in 13.8 MPa increments up to a maximum of 68.9 MPa inner-tubular pressure.
07: Jackson and Murphey first experiment (Jackson and Murphey, 2013)
This experiment led to the following observations:
¬ Increase of permeability was observed only when the inner- tubular pressure was decreased;
¬ No flow was detected through-out the 13.8 MPa, 27.6 MPa, and 41.3 MPa cycles;
¬ Gas started to flow as the inner- tubular pressure was bled down from 55.1 MPa to 6.9 MPa and continued until the inner tubular was re-pressurized to 13.1 MPa, at which pressure no further flow was detected;
¬ Gas flow began again as the inner- tubular pressure was bled down from 68.9 MPa to 6.9 MPa and continued until the inner tubular was re-pressurized to 19.3 MPa, at which pressure no further flow was detected.

77
Carbon capture and storage . The Lacq pilot Chapter 4: Well integrity
08: Snapshots of the simulation of Jackson and Murphey first experiment (Bois, et al. 2011)
Bois, et al. (2011, 2012) simulated this experiment assuming that steel behaves elastically, whereas cement behaves according to the modified Cam clay model (Charlez, 1991). Figure 8 presents snapshots of the simulation results taken during a 68.9 MPa loading cycle, which confirms that the main observations made by Jackson and Murphey can be reproduced by using a contracting law for cement. The first snapshot is taken at the beginning of the experiment, the second is taken at the maximum inner-tubular loading (68.9 MPa), the third is taken at the onset of debonding during unloading (25.5 MPa) and the fourth snapshot is taken after unloading has been performed down to 6.9 MPa where the micro-annulus width reaches 29 µm. 08
Other tests performed in the laboratory have shown that the importance of pore collapse in cement-sheath modelling mainly depends on the cement-system formulation, and more specifically on the cement porosity. High porosity favors pore-collapse mechanisms while low-porosity cements tend to dilate upon failure and not to contract as in the case of high-porosity cement-systems.
Pinner=0 psi Pinner=10,000 psi Pinner=3,700 psi Pinner=1,000 psi
SIMULATION
Analytical vs. numerical models
The main advantage of analyti-cal models is that they run in such a short time that they can easily be used to perform stochastic modelling. However, their main limitation is generally in the use of simplified laws (e.g. elasticity) and simple geometry (e.g. centered tubular).
The main advantages of numerical models are exactly the opposite to those of analytical models: They can use complex constitutive laws and account for complex geometries. However, they can take quite a long time to run and, as a consequence, are not fit for stochastic modelling.
Several papers have been published on Oil and Gas cement modelling. They are reviewed in the three following parts, which focus on:
¬ Analytical models that do not simulate cement hydration;
¬ Numerical models that do not simulate cement hydration;
¬ Analytical and numerical models that simulate cement hydration.
The following short review suggests that none of these models is able to correctly simulate cement behavior.

78
Analytical models that do not simulate cement hydration
One of the first approach to simulate long-term behavior of cement sheaths is SAM/CemSTRESSTM analytical model developed by Schlumberger (Thiercelin, et al. 1998b), which assumes that rock, cement, and steel behave as homogeneous, isotropic, and linearly thermo-elastic media up to a threshold where failure occurs. Three criteria are used for failure, one in traction, one in shear (Mohr-Coulomb criterion) and one for debonding (Thiercelin, 2007). The initial state of stress, after cement has set, is zero (DeBruijn, et al. 2008).
This approach allowed demonstrat-ing the importance of the cement’s Young’s modulus on cement-sheath integrity. However, this simplified approach, which took into account neither the porous nature of cement, nor its hydration, suffered from many drawbacks such as:
¬ Assuming the initial state of stresses is zero after cement has set. This is generally a very pessimistic hypothesis that increases the risk of concluding that cement will be damaged by further operations, and tends toward using more expensive flexible cement systems. Moreover, if this hypothesis is true and the formation stable, this would mean that it would be possible to drill the well with a mud density less than the formation pore pressure, even with a null mud density!
¬ Cement pore pressure is not taken into account, everything being as if loading is always performed under drained conditions. This is an optimistic hypothesis, which decreases the risk of concluding that cement will be damaged by further operations, and is unacceptable, for example, when a water- saturated cement sheath is located between two tubulars;
¬ Cement pore collapse is not taken into account leading to a possibly optimistic hypothesis when simulating the effect of Leak Off Tests (LOT), Formation Integrity Tests (FIT) or casing tests.
As a consequence the use of the CemSTRESSTM simulation application can lead to erroneous conclusions. For example, El Hassan, et al. (2005) described the case of a cement sheath that showed a good cement bond log (CBL) before increasing WHP up to 24.1 MPa and a bad one after decreasing it back to atmospheric pressure. Simulations performed with CemSTRESSTM concluded that the pressure test induced cement failure by radial cracking while the consequence of such a failure cannot be seen on a CBL. It is much more probable that the deterioration of the CBL was due to a micro- annulus at inner interface of cement sheath, which was created according to the process described by Bois, et al. (2011, 2012) based on the experiments of Goodwin and Crook (1992) and of Jackson and Murphey (1993).
The CemSTRESSTM model was later extended by BJ services (di Lullo and Rae, 2000, Myers et al. 2005) by using a bilinear elastic law for cement (Young’s modulus in compression is different from Young’s modulus in tension) and introducing empirical equations for the development of mechanical properties of cement as a function of cement hydration. This led to development of IsoVisionTM software. However, the IsoVisionTM
analytical model suffers from the same drawbacks as CemSTRESSTM model (pore pressure and pore collapse are not taken into account), and adds new issues (cement Young’s modulus is equal to formation Young’s modulus during thermal loading phases).
CemSTRESSTM and IsoVisionTM are not the only analytical models that have been developed; five other models are described in the literature:
1. Charara and Nguyen-Minh (1992) present an approach that assumes that cement is an in-compressible, linear viscoelastic body and that cement failure criterion is an intrinsic curve with zero tensile strength. Cement hydration, porous behavior and pore collapse are not taken into account;
2. Atkinson and Eftaxiopoulos (1996) present a model that assumes that cement is a linear isotropic elastic body and simulates loading of a cased-hole by an anisotropic stress variation of any orientation. Cement hydration, porous behavior, and pore collapse are not taken into account;

79
Carbon capture and storage . The Lacq pilot Chapter 4: Well integrity
3. Jo (Jo, 2008, Jo and Gray, 2010) presents a model that assumes that cement is a linear isotropic thermo-poroelastic body and attempts to extend CemSTRESSTM and Atkinson and Eftaxiopou los models by taking the porous nature of cement into account and by simulating the effects of tectonic stresses. Unfortunately, cement behavior is only simulated under undrained conditions, meaning that cement porous behavior is not correctly taken into account. Moreover, the generalized plane strain theory of Wu and Li (1990) was used, even if Pariseau (1992) showed it to be erroneous, hence leading to equations that do not match AbaqusTM simulations;
4. Teodoriu, et al. (2010) developed a model where the tubular is simulated as a thin shell and not a thick one. It is a simplification of CemSTRESSTM model;
5. Li, et al. (2010) developed a model that is a combination of CemSTRESSTM and Atkinson and Eftaxiopoulos models.
Numerical models that do not simulate cement hydration
Bosma, et al. (1999) have developed a finite-element-analysis (FEA) model, based on DianaTM code, which simulates the behavior of cement sheaths. It allows using more efficient constitutive laws for rock and cement than analytical models do, including elastoplastic laws, but suffers from at least three drawbacks:
¬ It does not explicitly take the porous nature of cement and rock into account;
¬ Mohr-Coulomb plastic law is used for cement even if it cannot be used to simulate pore collapse;
¬ Cement hydration is not simulated and the initial state of stress after cement has set is computed depending on cement shrinkage and hole stability. Hence, depending on the hy-pothesis, the initial state of stress is set to zero or to an isotropic (hydrostatic) stress field.
The two major improvements of this work are the use of a FEA code to simulate cement loading history phase by phase and the attempt to take into account cement/formation interaction for computing the initial state of stress in the cement sheath after cement has set.
The model was further improved by providing the following additional features:
¬ Simulation of the cement shrinkage/expansion through a cement volume variation after cement has set (Ravi, et al. 2002a, 2002b). However, this computa-tion does not take into account the increase in cement grain volume and the decrease in fluid volume in the cement pores while cement properties evolve. Hence, cement hydration is, in fact, not simulated;
¬ Definition of a remaining capacity factor (Griffith, et al. 2004) to show how much useful capacity remains in the material to resist failure. For example, let the tensile strength of a material be 2 MPa. If a pull of 1 MPa is applied on the material then the remaining capacity in the material to resist tensile failure is 50%. The failure modes consi- dered in the analysis are cracking, de-bonding and shear failure.
Other FEA models have been presented in the literature:
¬ Fleckenstein, et al. (2001) and Rodriguez, et al. (2003) using AnsysTM code to compare burst and collapse pressure of cemented and non-cemented tubulars. Loading is started at zero initial stress in cement and tubular. All bodies are simulated according to an elas-toplastic behavior with von Mises criterion. Neither the porous nature of cement, nor the potential for pore collapse are simulated;
¬ Pattillo and Kristiansen (2002) focus on horizontal tubular integrity in a compacting environment. The initial state of stress in the cement sheath after cement has set is hydrostatic. Cement is simulated as an elasto-plastic body with Drucker-Prager criterion;
¬ Philippacopoulos and Berndt (2002) concentrates on ther-mo-elastic effects but introduce no additional methods in terms of cement modelling;
¬ Shahri (Shahri, 2005, Shahri, et al. 2005) uses AnsysTM code and focuses on thermal effects. The initial state of stress in the cement sheath after cement has set is hydrostatic and cement is simulated as an elastic body;
¬ Gray, et al. (2009) use AbaqusTM code and assume that, at the end of hardening, the cement is in a state of hydrostatic stress equal to that of the slurry, before shrinkage occurs: Cement hydration is simulated like in Halliburton model (Ravi, et al, 2002a). Alike this model, the porous nature of cement and pore collapse is not taken into account;

80
09: Cement damage indexes in the SealWellTM model – Tubular, cement sheath and formation are colored in black, grey, and green – Failure is shown in red
¬ Nabipour, et al. (2010), Nygaard, et al. (2011), Le Guen, et al. (2012), and Giasuddin, et al. (2012, 2013) published other models based on FEA modelling. But none of introduces new modelling apsects in terms of cement-sheaths modelling.
SealWellTM, a model that simulates cement hydration
Most of the works on the poromecha- nical modelling of cement hydration are based on the theoretical work of Coussy on poromechanics (Ulm and Coussy, 1995, Coussy, 2004, 2010). Ulm and Coussy (1995) performed a thermodynamic-based investigation on the reactive porous nature of cement during hydration in the case of water exchange with the external environment and took autogenous shrinkage and the effect of tempera-ture and stress on cement hydration into account. Later, Coussy (2004) formulated a constitutive model for linear unsaturated poroelastic media with phase changes. However, cement shrinkage of oil and gas oilfield cement is not efficiently simulated because the model was developed for cement hydrated at surface, and not under pressure as encountered downhole, and because the evolution of cement properties with hydration was not included. This model cannot be used as-it-is in the case of Oil and Gas oilfield cement.
Charlez (1991) and Thiercelin, et al. (1998a) proposed to look at cement bulk shrinkage as a compaction mechanism that occurs when the sample is submitted to an increase in mean effective stress. Cement is simulated as a weakly bonded porous solid according to the modified Cam-Clay model but the evolution of the parameters with cement hydration is not accounted for. This approach did not lead to the development of efficient models.
Total developed a simple thermo-chemo-elastic model (Fourmaintraux, et al. 2004) where cement hydration is simulated by linearly changing cement properties with time. The resolution of the equations is done using the SRC (System Response Curve) method, which makes possible to replace complex well simulations (fully coupled thermo-chemo-poromechanical models able to simulate debonding) by simpler wellbore component simulations. This model was later extended to thermo-chemo-poroelasticity (Saint-Marc, et al. 2008, Bois, et al. 2011) and then to pore collapse (Bois, et al. 2011, 2012) in the SealWellTM model. Cement damage is described by various indexes, which are computed based on Mohr-Coulomb and tensile criteria. These indexes are: 09, 10

81
Carbon capture and storage . The Lacq pilot Chapter 4: Well integrity
10: Cement damage indexes and damage criteria in the SealWellTM model
¬ Bondex inner/outer indicates the risk of debonding at cement sheath inner/outer interfaces;
¬ Damex S indicates the risk of damage to the cement sheath by shear processes;
¬ Damex R indicates the risk of damage to the cement sheath by radial cracks;
¬ Slidex indicates the risk of damage to the cement sheath by axial sliding or disking.
The method used for their computation is given in figure 11. 11
11: Conventions to read the cement-sheath damage graphs

82
The main features of SealWellTM are the following:
¬ For a degree of hydration lower than the percolation threshold, cement behaves according to fluid mechanics, while it behaves according to poro-mechanics when it is larger than the percolation threshold;
¬ Cement hydration produces an increase in grain volume, a decrease in fluid mass in the cement pores, and a change in cement physical and me-chanical properties;
¬ Cement volume variation during hydration occurs while cement proper-ties evolve;
¬ Under the condition of no water exchange, cement pore pressure decreases with hydration and may reach a pressure where fluid vaporizes;
¬ Post expansion leads to an increase in grain volume.
The thermo-chemo-poromechanical model is developed based on an analogy between thermo-mechanics and chemo-mechanics. This led to the following equations when water vaporization is not reached in the cement pores:
However, when water vaporization is reached, pore pressure is only a function of temperature:
The irreversibility of cement hydration is obtained by considering that the degree of cement hydration (ξ) can only increase. Both coefficients of hydration sd (drained) and su (undrained) are positive parameters that evolve with cement hydration.
Simulation all along well history
Having a geomechanical model to simulate Oil and Gas oilfield cement behavior allows simulating cement sheaths during their entire life. Indeed it accounts for the initial state of stress after cement has set, and then for the various loadings that occur during the life of the well.
One of the reasons why the initial state of stress in the cement sheath is so important for long-term cement- sheath modelling is that it governs how far the cement sheath is from the yield surface and, as a consequence, how much loading it can be submitted to before being damaged.
Let us give an example taken from Bois, et al. (2011). A material is charac-terized by a UCS value of 30 MPa and a TS value of 3 MPa. This means that the 1D undamaged domain is limited to the interval [-3 30] in MPa. Let us consider a stress variation path where stress is first increased by 10 MPa (because of a LOT for example), and then lowered by 15 MPa (a drilling mud swap for example). If the initial state of stress is 0 MPa, loading will not damage the material. Unloading, on the other hand, will damage it in tension because the final stress is -5 MPa, which is below than the TS value. Conversely, if the initial state of stress is 10 MPa, loading and unloading will not damage the material because the stress will remain in the interval [-3 30] in MPa. Finally, if the initial state of stress is 25 MPa, loading will damage the material because the final stress is 35 MPa, which is higher than the UCS value. Hence, incorrect assumptions about the initial state

83
Carbon capture and storage . The Lacq pilot Chapter 4: Well integrity
12: Effect of the initial state of stress on damage prediction (Bois, et al. 2011)
13: Evolution of the difference between the temperature in the hole and the temperature at the formation/cement interface at various depths vs. time in a steam injection well (Garnier, et al. 2010a)
of stress can lead the designer to misconceptions: designing against compre- ssive damage whereas no such damage should occur; designing against tensile damage when no such damage should occur; designing against a given damage type whereas it is another type that should occur; being sure that damage will not occur when in fact it should. 12
Simulating a well life means simula- ting the most critical events that occur such as:
¬ Variation in mud pressure due to drilling mud to stimulation, casing tests or to hydro-fractu ring;
¬ Variation in temperature due to drilling operations, stimulation or production/injection phases;
¬ Variations in formation stress/strain due to depletion;
¬ Variations in cement pore pressure due to fluid transfer from formation to cement;
¬ Variations stresses due to an earthquake that occurred close to the well.
Among these loadings, the most difficult ones to simulate are the thermal and the dynamic loadings. For the thermal loadings, this comes from the fact that temperatures should be evaluated in tubulars, cement sheaths and formation at any time and to the fact that the tempe- rature is generally not directly known at the tubular but instead in the mud (case of temperature variations during drilling), or at a production tubing.
For example, figure 13 taken from Garnier, et al. (2010b) presents the evolution of the difference between the temperature in the hole and the temperature at the formation/cement interface as a function of time for various depths along a steam injection well. It shows that tempe rature variations are not monotonous with time, meaning that more than one time-step should be analyzed to ensure that cement-sheath integrity is preserved. Generally, the most critical times in terms of cement-sheath integrity are when temperature gradient or when temperature in the cement sheath is the largest. 13

84
Due to the fact that the temperature is not known at the tubular, it is generally necessary to take into account heat transfer mechanisms such as advection, natural convection, conduction, and even radiation when at very high temperature like when injecting steam. Forgetting one of the heat-transfer mechanisms can lead to very important errors when predicting temperature gradients in cement sheaths as shown in the example of figure 14. The initial temperature in the cement-sheath, before production start-up, was computed based on the geothermal gradient and the steady-state temperature in the production tubing was obtained from heat transfer simulations of hydrocarbon production. Temperature variations in the tubulars/cement-sheaths/formation were evaluated by simulating heat transfer from production tubing to the formation whereby heat is transferred by conduction in tubular, cement and formation. Two hypotheses were considered for heat transfer in the completion annulus fluid. The first hypothesis assumed that heat transfer was only due to conduction, while the second hypothesis also included natural convection. The results of both simulation cases show that the maximum temperature gradient in the cement sheath is four times larger when natural convection is taken into account than when it is not. They also show that long-term temperatures are not impacted very much by the heat-transfer hypothesis made in the annulus fluid. As a consequence, simulating heat transfer in the annulus fluid only by conduction may lead to very optimistic values in terms of temperature gradients, and then in terms of cement sheath integrity. 14
In terms of dynamic loading such as resulting from earthquakes, specific models that allow computing stress variations in tubulars, cements, and formations based on the earthquake seismograms have to be developed. Generally, only shear waves are considered because the amplitude of compression waves generated by an earthquake is much smaller (<10%) than the amplitude of shear waves.
Shear waves induce a maximum shear stress variation in the formation equal to:
Where ρ is the specific mass, vs is the shear-wave velocity, and vM is the maximum particulate velocity as measured on seismograms.
They also induce a stress variation in the tubulars, cement sheaths, and production/injection tubing given by:
Where µij are non-dimensional coeffi-cients that depend on the geometry, the material properties, and the wave characteristics (Kurose, 2000).
Total has worked on all these types of loading and is thus able to account for all of them when performing cement-sheath integrity analysis.
14: Evolution of the temperature gradient at various depths in the cement sheath vs. time since beginning of production depending on if natural convection in the annulus between production tubing and tubular is taken into account or not

85
Carbon capture and storage . The Lacq pilot Chapter 4: Well integrity
CEMENT-SHEATH CHEMICAL INTEGRITY
4.3
INTRODUCTION
By 2003, very few papers had been published on Portland cement degradation under the conditions encountered in oil and gas wells, most published papers being related to atmospheric pressure and tempe- rature lower than 60°C. At this time papers published in SPE conferences (Society of Petroleum Engineers) were partly conflicting.
Hence, Onan (1984) performed a series of experiments where cement samples of various compositions (Class B, C, H, calcium aluminate, mixed with pozzolan, foamed…) were exposed to supercritical carbon dioxide or carbonic acid. Several conditions in pressure (6.5-19.3 MPa) and tem-perature (41-82°C) were investiga ted as well as several curing sequences. Degradation of the cubic samples was analyzed using permeability and crush tests. The main findings of these tests were that the depth of car-bonation depends on environmental conditions: 1) carbonation increases with pressure and temperature; 2) it is close to zero at low temperature; 3) there exists a superficial zone made of totally degraded calcium carbonate and silica gel; and 4) this zone does not significantly impact the uniaxial compressive strength and permea-bility of cement if the samples were contacted by carbon dioxide after having cured during at least four days.
As a response to the work of Onan, Bruckdorfer (1985, 1986) performed tests on class A, C and H, cement samples, cured during three days under 20.7 MPa and 51 or 79.4°C. These samples were exposed to carbonic acid under the same condi-tions as in Onan (1984), the reactors being re-charged with carbon dioxide every two or three days. No decrease in compressive strength was observed after thirty-one days of exposition for the larger samples (5.08-cm cubes and 2.54 cm diameter by 5.05 cm length cylinders) while the smaller samples (cylinders with a diameter of 0.7 cm and 1.27 cm in length) showed a resistance drop of 80% at 79.4°C and 47% (class H) at 51°C. It should be noted that Onan did not use samples of such small dimensions.
Because of this uncertainty about the impact of carbonic acid and su-percritical carbon dioxide (and other acid gas) on cement degradation, Total decided to launch in 2003 a R&D project to gain new experimental data, develop geochemical and geomecha- nical models, and define guidelines for cementing wellbores in the presence of acid gas. The following sections present the results of this project that are related to the impact of carbon dioxide (Garnier, et al. 2010a, Laudet, et al. 2011, Rafaï, and Garnier, 2013).

86
EXPERIMENTAL PROCEDURES
Two cement systems were prepared according to API RP10B-2 specifications with a class G cement from CCB and various additives from Schlumberger: a cement system (denoted G) for experiments made at less than 90°C, and a system with 35% silica flour (denoted G+S) to prevent strength retrogression during tests performed at 140°C. Table 01
Cement samples were cured during more than 28 days in cylindrical molds, 20 mm in diameter and 240 mm in length, using lime-saturated water under environmental conditions that depended on the cement system: the G cement at 90°C and at atmospheric pressure; the G+S cement at 140°C and at 20.7 MPa for the first 10 days, then at 90°C and at atmospheric pressure for the following days.
A precise QA/QC program was applied to ensure that cement samples were homogeneous (Garnier, et al. 2010a, Laudet, et al. 2011):
¬ Before being molded: no free water, no sedimentation, plastic viscosity in the range 5-15 cP, yield value close to 40 lbf/100ft2, and density in the range 1.87-1.91 sg;
¬ After cement has hardened: no visible heterogeneity (cracks, bubbles) is observed on X-ray tomography so that all samples are homogeneous and identical. 15
G cement samples had a porosity of about 30% and contained about 67% of C-S-H, 17% of portlandite, and 8% of katoite. G+S cement samples had a porosity of 28% and contained about 67% of C-S-H, 10% of quartz, and 7% of katoite.
Table 01: Cement-system composition
15: RX density images of two G+S cement samples after curing – Color is based on Hounsfield scale: darker means less dense (Garnier, et al. 2010a)
Three types of experiment were performed (Garnier, et al. 2010a, Laudet, et al. 2011):
1. Short-term uncoupled exper-iments, which consisted in placing cement plugs in steel reactors filled with water in contact with carbon dioxide, and in removing them at various times to measure the evolution of cement alteration through a full set of measure-ments: weight of plug, porosity, density, permeability, phenol-phthalein impregnation, X-ray tomography (maps are colored according to Hounsfield scale where darker means less dense), Scanning Electron Microscope (SEM) equipped with a Back Scattered Electron (BSE) image detector, Energy Dispersive Spectroscopy (EDS), X-ray dif-fraction analysis (XRD), Thermo gravimetric analysis (TGA), Differential Thermal Analysis (DTA), chemical sampling and micro-indentation;

87
Carbon capture and storage . The Lacq pilot Chapter 4: Well integrity
16: Reactor and sample-holder used for the uncoupled experiments (Garnier, et al. 2010a, Laudet, et al. 2011)
2. Long-term uncoupled expe- riments, which consisted in placing cement plugs in steel reactors filled with water in contact with carbon dioxide for a very long time, and in characterizing their petrophys-ical (porosity and permeability) and mechanical (uniaxial and triaxial compressive tests, mi-cro-indentation) behavior, once fully degraded;
3. Coupledtests, which consisted in loading a cement plugs in a triaxial frame by axial and radial stresses, and pore pressure, and then in injecting supercritical carbon dioxide or carbonic acid while measuring the cement properties during degradation under mechanical load.
The experimental setup was the same for the two uncoupled experiments: 16
¬ Set-cement samples were cut to obtain cylindrical plugs 20 mm in diameter and 40 mm in length;
¬ Plugs were placed 4 by 4 on a 3-tier sample-holder (12 plugs in each cell);
¬ The sample-holder was moved in a glass beaker filled with about 350 ml distilled water at 90°C and the glass beaker was set in reactors preheated at 90°C;
¬ Reactors were closed and gaseous carbon-dioxide, pre-heated at 90 or 140°C, was injected in it;
¬ Carbon-dioxide pressure was increased from atmospheric pressure to 8 MPa at a rate of 0.2 MPa per minute to avoid induced thermo-mechanical stresses;
¬ Carbon-dioxide pressure was regularly adjusted during tests to keep it constant as dissolution of carbon dioxide in water and chemical reactions with the plugs tended to reduce pressure;
¬ Temperature was raised from 90 to 140°C for experiments performed on G+S cement at a rate of 2°C per minute;
¬ The plugs remained fully immersed in a water bath in contact with carbon dioxide at 8 MPa (for most cases);
¬ Pressure and temperature were decreased and then increased at very low rates when the plugs were removed from the reactor to perform measure-ments. The plugs were exposed for only a few seconds to air before being placed in a storage flask for characterization;
¬ The fluid in the glass beaker was collected for chemical analyses, and replaced by fresh distilled water at 90°C at the end of each carbonation period, to ensure that the aggressiveness of the solutions was kept high throughout the duration of the tests;
¬ In some cases, the cylindrical surfaces of the plugs were protected by a sleeve made of poly-etheretherketone (PEEK) to force a 1-D progression of the reaction front during the carbonation tests.

88
The experimental setup for the coupled tests used a conventional triaxial cell: 17
¬ Set-cement samples were cut to obtain cylindrical plugs of 20 mm in diameter and 40 mm in length;
¬ Plugs were saturated with water by first extracting water under low pressure and then flushing them again with water;
¬ Plugs were installed in the triaxial cell and temperature was increased (up to 90°C for example);
¬ Plugs were loaded under an hydrostatic pressure (3 MPa, for example); ¬ Lime-saturated water was injected at one end of the plug under a pressure
of 2.5 MPa while the other end was at atmospheric pressure, and permea-bility of the plug to water was measured when the flow regime had become quasi-steady;
¬ The axial stress was increased (up to 6 MPa, for example) while the value of radial pressure was kept constant;
¬ Lime-saturated water was injected at one end of the plug under a pressure of 2.5 MPa while the other end was at atmospheric pressure;
¬ Carbonic acid or (dry or humid) supercritical carbon dioxide was injected at one end of the plug under a pressure of 2.5 MPa while the other end was at atmospheric pressure;
¬ Injection pressure, injected and exit volumes, axial and radial stresses, and axial and radial strains were measured all long the test, which lasted from one to two weeks.
17: Schematic of the cell used for the coupled tests (Garnier, et al. 2010a, Laudet, et al. 2011)
18: Short-term uncoupled experiments performed on G cement at 90°C and 1.5 MPa – Analysis by phenolphthalein impregnation of plug’s fresh surfaces – 1 = Plug surface showing nearly no carbonation, 2 = Fresh surface, 3 = Carbonated fringe, 4 = Non carbonated zone
DEGRADATION KINETICS
The kinetics of cement degradation was measured using X-ray tomography and geochemical analyzes (Garnier, et al. 2010a, Laudet, et al. 2011).
Experiments performed at 90°C on G cement system
The short-term uncoupled tests that were performed on G cement plugs showed the formation of a carbonate fringe, which limited the progress of the chemical attack, when performed under 1.5 MPa carbon dioxide pressure and 90°C. They also showed that increasing the pressure up to 8 MPa increased the kinetics of carbonation. In this last case, the thickness of the carbonated fringe increased almost linearly as a function of the square root of exposure time, x = 9.5 mm/√year, meaning that the carbonation was controlled by diffusion. 18, 19, 20, 21

89
Carbon capture and storage . The Lacq pilot Chapter 4: Well integrity
19: Short-term uncoupled experiments performed on G cement at 90°C and 1.5 MPa – Analysis by RX tomography showing carbonation at plug corners – Color is based on Hounsfield scale: darker means less dense
20: Short-term uncoupled experiments performed on G cement at 90°C and 8 MPa – Analysis by RX tomography showing carbonation propagation – Color is based on Hounsfield scale: darker means less dense (Garnier, et al. 2010a, Laudet, et al. 2011)
21: Short-term uncoupled experiments performed on G cement at 90°C and 8 MPa – Changes in carbonation depth vs. time (Garnier, et al. 2010a, Laudet, et al. 2011)
G - 90°C 8 MPa

90
Because of the existence of a carbonated fringe, it would have taken a very long time to obtain completely carbonated plugs. Therefore, it was decided to run experiments using the AFREM protocol (which is based on the recommenda-tions of the Agence Française pour la Construction) to avoid carbonate precipita-tion, hence increasing the kinetics (Takla, 2010, Takla, et al. 2010). According to this protocol, degradation was carried out with gaseous carbon dioxide with a relative humidity of 65%. These environmental conditions are different from those encountered in oil and gas wells.
22: Short-term uncoupled experiments according to AFREM protocol – Analysis by phenolphthalein impregnation of plug’s fresh surfaces (Takla, 2010, Takla, et al. 2010)
23: Short-term uncoupled experiments performed according to AFREM protocol – Changes in carbonation depth vs. time (Takla, 2010, Takla, et al. 2010)
Figure 22 shows the evolution of the carbonation depth as a function of exposure time for tests performed according to the AFREM protocol with no PEEK sleeve. The carbonated thickness increased almost linearly as a function of exposure time, x = 0.33 mm/day, meaning that carbonation was controlled by the reaction kinetics. 22, 23
Experiments performed at 140°C on G+S cement system
The short-term uncoupled experi-ments performed on G+S cement system at 8 MPa of carbon-dioxide pressure and at 140°C, showed the formation of a carbonated fringe that increased almost linearly as a function of the square root of exposure time, x = 40 mm/√year, a faster kinetics than what is observed at 90°C on G cement plugs. After three months of testing, the carbonation front reached the heart of the cement plugs. In addition, a leached fringe of less than 500 µ in thickness appeared closed to the surface of these plugs, with a higher porosity than the rest of the plug. Such a leaching followed the carbonation of cement. 24, 25, 26, 27
These experiments show that the measured kinetics of degradation depend not only on cement compo-sition, temperature, and pressure, but also on the environmental condi-tions under which carbonation occurs among which the composition of the degrading fluid. As a consequence, the measured values of kinetics of degradation cannot be considered as intrinsic values that can be used to simulate cement-sheath degradation.
G - AFREM protocol

91
Carbon capture and storage . The Lacq pilot Chapter 4: Well integrity
24: Short-term uncoupled experiments performed at 140°C and 8 MPa – Analysis by RX tomography showing that carbonation occurred at plug faces – Color is based on Hounsfield scale: darker means less dense (Garnier, et al. 2010a, Laudet, et al. 2011)
26: Short-term uncoupled experiments performed at 140°C and 8 MPa – Analysis by SEM showing the existence of a carbonation front and of a zone of higher porosity (Garnier, et al. 2010a)
25: Short-term uncoupled exper-iments performed at 140°C and 8 MPa – Changes in carbona-tion depth vs. time (Garnier, et al. 2010a, Laudet, et al. 2011)
27: Short-term uncoupled experiments performed at 140°C and 8 MPa during 3 months – Analysis by SEM showing a fully-carbonated plug with a zone of higher porosity
The most rigorous alternative consists in using geochemical modelling to predict the carbonation kinetics and the composition of the degraded cement. As a consequence, a series of geochemical analyses were also performed to better characterize cement carbonation (Rafaï and Garnier, 2013). It is presented in the following part.

92
GEOCHEMICAL ANALYSIS
The unaltered cement was characterized at the beginning of the project showing, due to the high temperature, the absence of ettringite and the existence of katoite (Rafaï, et al. 2013). Table 02
Each plug taken from the reactor was characterized by chemical, mineralogical and microstructural analyses on slices of 2 mm thickness that were taken from the exposed surface of the plugs to a depth of 10 mm inside the plugs. 28
The total porosity accessible to water was measured on plugs of G cement before and after carbonation during 4 to 90 days under 1.5 or 8 MPa. This showed a dispersed decreasing trend. 29
The total porosity accessible to water was also measured on plugs of G+S cement before and after carbon-ation during 4 to 88 days under an 8 MPa pressure, showing a decrease in porosity for plugs that were carbona- ted during more than 31 days, with a superficial layer where this decrease is less important. This superficial layer should come from the dissolution of some of the calcium carbonate that had precipitated at the beginning of the exposure to carbon dioxide. After 88 days, the average porosity had decreased by about 25.5%. 30
Measured values of calcium oxide content were in agreement with measured values of porosity. After 3 months of degradation, these values remained fairly close to that of the unaltered plug, because the majority of calcium oxide reacted with carbonate ion to precipitate as calcium carbonate. 31, 32
28: Slices for chemical and mineralogical analyses (Rafaï, et al. 2013)
Table 02: Physical and mineralogical properties of the cement systems (Rafaï, et al. 2013)

93
Carbon capture and storage . The Lacq pilot Chapter 4: Well integrity
29: Short-term uncoupled experiments performed on G cement under 90°C – Total porosity vs. depth after 3 months of carbonation (Rafaï, et al. 2013)
31: Short-term uncoupled experiments performed on G cement under 90°C – CaO content vs. depth after 3 months of carbonation (Rafaï, et al. 2013)
30: Short-term uncoupled experiments performed on G+S cement under 8 MPa and 140°C – Total porosity vs. depth after 3 months of carbonation (Rafaï, et al. 2013)
32: Short-term uncoupled experiments performed on G+S cement under 8 MPa and 140°C – CaO content vs. depth after 3 months of carbonation (Rafaï, et al. 2013)

94
Quantitative mineralogical analyses showed that after three months of carbo- nation: 33
¬ G cement under 90°C and 1.5 MPa was partially carbonated in the two first millimeters, slightly modified mineralogy between 2 and 4 mm depth (portlandite and katoite are still visible), and an intact mineralogy more than 4 mm deep;
¬ G cement under 90°C and 8 MPa was carbonated to 6 mm depth and partially carbonated between 6 and 10 mm deep;
¬ G+S cement under 140°C and 8 MPa had a completely changed composi-tion up to 10 mm depth, where katoite had completely disappeared and calcium carbonates were predominant and in similar amounts over the entire thickness of the specimen.
In all three cases, calcium carbonates were mostly in the form of aragonite, the most stable high-temperature phase.
Microscopic analyses (figure 34 to figure 40) showed that the minera- logical and microstructural transfor-mations of the cements were quite similar for the three compositions after 3 months. However, the degraded thickness and the degree of alteration changed from one case to another.
33: Short-term uncoupled experiments performed on G cement under 90°C – Mineralogical content vs. depth after 3 months of carbonation – The dotted line represents the initial concentration (Rafaï, et al. 2013)

95
Carbon capture and storage . The Lacq pilot Chapter 4: Well integrity
The degraded fringes appeared thicker than those estimated by X-ray tomogra-phy. The surface had a high micro-porosity fringe, often containing iron sulfide inclusions. This layer was usually covered with a crust of calcium carbonate. Beyond the fringe, the microstructure was compact, with abundant calcium carbonate, the proportion of which decreased toward the heart of the specimen. At this depth, the Calcium Silicate Hydrates (C-S-H) were visible, usually grainy, and sometimes with a few crystals of calcium sulfate. 34, 35, 36, 37, 38, 39, 40
35: Short-term uncoupled experiments performed on G cement under 90°C – SEM-BSE visualization up to 12 mm depth together with Ca, Si, and S contents from EDS (Rafaï, et al. 2013)
34: Short-term uncoupled experiments performed on G+S cement under 8 MPa and 140°C – Mineralogical content vs. depth after 3 months of carbonation – The dotted line represents the initial concentration (Rafaï, et al. 2013)

96
39: Short-term uncoupled experiments performed on G cement under 8 MPa and 90°C – SEM visualization – 1 = Carbonated fringe; 2 = Unaltered zone
36: Short-term uncoupled experiments performed on G+S cement under 8 MPa and 140°C – SEM-BSE visualization up to 12 mm depth together with Ca, Si, and S contents from EDS (Rafaï, et al. 2013)
37: Short-term uncoupled experiments performed on G+S cement under 8 MPa and 140°C – SEM-BSE visualization with EDS after 55 days of testing (Rafaï, et al. 2013)
38: Short-term uncoupled experiments performed on G cement under 1.5 MPa and 90°C – SEM visualization – 1 = Car-bonated fringe; 2 = Micro-porous fringe; 3 = Unaltered zone
40: Short-term uncoupled experiments performed on G+S cement under 8 MPa and 140°C – SEM visualization – 1 = Lixiv-iated superficial zone; 2 = Carbonated zone; 3 = Unaltered zone

97
Carbon capture and storage . The Lacq pilot Chapter 4: Well integrity
41: Short-term uncoupled experiments performed on G cement under AFREM protocol – Permeability vs. confining pressure for three levels of carbonation (Takla, 2010, Takla, et al. 2010)
PERMEABILITY
Measurement of permeability is a very good mean to decipher if cement degradation leads to loss of cement-sheath integrity through cement matrix. As a consequence, two series of tests were performed on plugs of G cement: 1) after carbonation according to AFREM protocol (Takla, et al. 2010); and 2) during coupled tests before and after injection of carbon dioxide.
Results of permeability tests run on plugs of cement that were partially or completely carbonated according to AFREM protocol showed that: 41
¬ Permeability of non-degraded plugs (approximately 5 µD) was very close to that of carbonated samples over 3 mm. This means that the carbonation was not sufficiently advanced to obtain a significant change in permeabi- lity: either the volume of carbonated cement was too small compared to the volume of the sample, or the modification of the larger pores was not significant to change permeability;
¬ Permeability decreased with increase in confining pressure, possibly due to a reduction in pore space (compaction) and connectivity (crack closure if present);
¬ Permeability decreased as carbonation depth increased. This means that carbonation induces a modification of the pore size through calcium carbonate precipitation, making pores thinner and less connected than initial pores, eventually leading to clogging of the network;
¬ Permeability declined by nearly two orders of magnitude when the depth of carbonation increased from 3 to 10 mm;
¬ Confining pressure had hardly any effect on permeability of completely car-bonated samples (over a depth of 6 or 10 mm) for pressure above 10 MPa. This was due to the much lower compliance of the material whose pores are filled with calcium carbonate.
The permeability measured during coupled tests before and after injection of carbon dioxide (figure 45, figure 46, figure 48 on page 100) showed initial permeability values of the order of 1 µD and systematic pore clogging after the injection of carbon dioxide.
Based on these two series of measure-ments, calcium-carbonate precipita-tion in pores during cement carbo- nation prevents any increase of cement permeability, and as a consequence, any loss of cement-sheath integrity through cement matrix.
MICRO-INDENTATION PROPERTIES
Loss of cement-sheath integrity can occur through cement matrix but also be due to cement defects such as cracks or micro-annuli. The creation of such defects is function of cement mechanical properties. Therefore, it is necessary to measure the mechanical properties of carbonated cement in order to be able to evaluate the risk of loss of cement-sheath integrity after cement carbonation. This was done through three types of tests: micro- indentation, uniaxial and triaxial tests.
The micro-indentation technique is a fast and cheap technology compared to conventional mechanical tests. It consists in measuring the penetra-tion of an indenter of well-defined shape and dimensions in a material, while the force applied to the indenter is increased at constant rate. The loa- ding-displacement curve is recorded via computer and analyzed to evaluate material mechanical properties.
G AFREM protocol

98
In the case of the measurements performed on carbonated cement, the micro- indenter had a flat shape with a 1 mm diameter. The relation between the increment of indenter penetration (dh) and the increment of indenter load (dP) is based on Boussinesq theory and writes:
Where E is material Young’s modulus, ν is material Poisson’s ratio, and D is indenter diameter. Poisson’s ratio was assumed to be equal to 0.29 and equation (5) was used to compute cement Young’s modulus.
Two series of tests were performed on plugs of G cement: 1) after carbonation according to AFREM protocol (Takla, 2010, Takla, et al. 2010); and 2) after carbonation under a pressure of 1.5 or 8 MPa pressure and 90°C. Moreover, a series of tests were performed on plugs of G+S cement carbonated under 8 MPa pressure and 140°C.
Micro-indentation tests run on plugs of cement partially or completely carbonated according to AFREM protocol showed a strengthening of the cement matrix due to carbonation: Young’s modulus increased from 14.5 GPa, in non degraded material, to 19-20 GPa, in carbonated areas. However, the tests carried out on plugs after carbonation under 1.5 or 8 MPa pressure and 90 or 140°C did not show a clear trend over time, which may be due to the localization of carbona-tion at the surface of the plugs. 42, 43
42: Short-term uncoupled experiments performed on G cement under AFREM protocol – Young’s modulus (from micro-indentation testing) vs. depth for various levels of carbonation (Takla, 2010)
43: Short-term uncoupled experiments performed on G cement under 1.5 MPa and 90°C – Young’s modulus (from micro-indentation testing) vs. depth for various levels of carbonation
UNIAXIAL AND TRIAXIAL TESTS
Uniaxial compressive strength (UCS) and triaxial compressive strengths (TCS) were measured on plugs of G cement carbonated according to AFREM protocol up to a depth of 3, 6, and 10 mm (Takla, 2010, Takla, et al. 2010). Three confining pressures were used (3, 10, and 20 MPa) while pore pressure was kept at 2.5 MPa. These tests showed that cement becomes more ductile as confining pressure increases, and more brittle as carbonation progresses: 44
¬ UCS increases with an increase of carbonation depth, from 26 MPa for intact cement to 32, 41 and 67 MPa for carbonation depths of 3, 6, and 10 mm;

99
Carbon capture and storage . The Lacq pilot Chapter 4: Well integrity
44: Short-term uncoupled experiments performed on G cement under AFREM protocol – Stress-strain curves of uniaxial and triaxial tests for various levels of carbonation (Takla, 2010, Takla, et al. 2010)
COUPLED TESTS
Coupled tests were the most original tests performed in the testing campaign because they tend to reproduce what could occur downhole (carbonation under stress).
Five such tests were conducted on plugs made from G cement with carbon dioxide that all showed an immediate clogging of the pores at the beginning of the injection of carbon dioxide and carbonation only on plug surfaces (Garnier, et al. 2010a, Laudet, et al. 2011).
¬ TCS under 3 MPa confining pressure increases with an increase of carbo- nation depth, from 32 MPa for intact cement to 35, 47 and 70 MPa for carbonation depths of 3, 6, and 10 mm;
¬ TCS under 10 MPa confining pressure increases with an increase of carbonation depth, from 44 MPa for intact cement to 66, 82 and 110 MPa for carbonation depths of 3, 6, and 10 mm;
¬ TCS under 20 MPa confining pressure increases with an increase of carbona-tion depth, from 77 MPa for a carbonation depth of 3 mm to 96 and 144 MPa for carbonation depths of 6, and 10 mm. Triaxial compressive strength had not been reached after 7% axial strain for intact cement due to its ductile behavior;
¬ The increase in compressive strength from 0 to 20 MPa confining pressure decreased from 140% for a plug degraded to 3 mm depth down to 134% and 115% for plugs degraded to 6 and 10 mm.

100
The first coupled test, performed by injecting supercritical carbon dioxide in a dry sample, previously saturated with tap water, under deviatoric stress (q = 15 MPa, p = 25 MPa, pp > 10 MPa) and at 35°C, showed no significant difference in terms of mechanical behaviour before and after injecting carbon dioxide.
The second coupled test, performed by injecting wet supercritical carbon dioxide in a plug previously saturated with tap water under isotropic stress (p = 3.5-12 MPa, pp = 8-10 MPa) and 35°C showed that a few cubic centimeters of neutral interstitial fluid was expelled in the early hours of contact with carbon dioxide. This represented only a fraction of the pore volume. After one day, the flow of carbon dioxide was non-measurable. Gas was not able to go through the sample. 45
Three other coupled tests were carried out by injecting an aqueous solution saturated with carbon dioxide (gaseous atmosphere under 1 MPa) in samples previously saturated lime water (neutral fluid) showing carbona-tion only on plug surface and clogging of the pores. 46, 47, 48
45: Second coupled test performed by injecting wet supercritical carbon dioxide in a G cement plug
46: Third coupled test performed by injecting carbonic acid in a G cement plug (Garnier, et al. 2010b, Laudet, et al. 2011)
47: Third coupled test performed by injecting carbonic acid – Phenolphthalein impregnation showing no carbonation at the end of the test
CONCLUSION
Total research work led to two main results.
On one hand, it clearly showed that the degradation of cement by carbon dioxide tends to create a surface layer where carbonates precipitate, resulting in a decrease in porosity, an almost cancelled permeability and an increase in strength and stiffness and brittleness. The properties of the carbonated layer seem to be enhanced (lower permeability) when cement gets in contact with carbon dioxide under stress, which is what is expected downhole, compared to when it gets into contact under no effective stress. 49

101
Carbon capture and storage . The Lacq pilot Chapter 4: Well integrity
48: Fifth coupled test performed by injecting carbonic acid in a cement plug
49: Schematics of the carbonation of G cement
50: Schematics of the carbonation of G+S cement
Hence, this carbonated layer protects the interior of the plugs from chemical degradation, resulting in extremely slow degradation kinetics. The protective layer, however, be leached under some environmental conditions resulting, in the absence of mechanical loading, in a porous material (as seen on experiments performed on cement G+S), but the related kinetics are slow. 50
These results are in agreement with the experiments published after 2003 (Duguid, 2006, Barlet-Gouédard, et al. 2006, 2007, Kutchko, et al. 2007, 2008, 2009, Rimmelé, et al. 2008, Fabbri, et al. 2009, Brandvoll, et al. 2009, Liteanu, et al. 2009, Bachu, and Bennion, 2009, Santra, et al. 2009, Sweatman, et al. 2009, Duguid and Scherer, 2010, Huet, et al. 2011, Brandl, et al. 2011, Carroll, et al. 2011, Matteo and Scherer, 2011, 2012), which confirm that the conse-quences of carbon dioxide induced degradation depend on the environ-mental conditions: cement compo-sition, temperature, pressure, fluid composition, static or dynamic condi-tions…
However, none of these works has addressed carbonation under stress as Total did when performing coupled tests; degrading cement under effective stress can be very different than when no effective stress is applied: permeability is very quickly cancelled.
Based on these results, under downhole conditions, the kinetics of degradation are so slow that it would take about a hundred millions years to degrade a 100 meter-length cement sheath. These data are confirmed by measurements made on real wells in which carbon dioxide had been injected or produced (Carey, et al. 2007, Crow, et al. 2010): even if carbonation occurred, probably due

102
to some defects within the cement sheath, this did not compromise the integrity and durability of the cement. Hence, conventional Portland cement systems can effectively be used to create suitable barriers to carbon dioxide migration in long-term carbon dioxide storage conditions.
This conclusion was later confirmed through geochemical simulations (Carey and Lichtner, 2009, Huet, et al. 2010, Matteo and Scherer, 2012), which reproduced the observations made in the laboratory or in the field, confirmed the possible existence of carbonated cement, but never concluded to a loss of integrity of the cement sheath if the integrity existed before the cement became into contact with carbon dioxide.
Hence, the first deliverable of this R&D project, which is confirmed by the various experiments performed these last ten years around the world, is that a no-defect cement sheath does not risk to lose its integrity when put in contact with carbon dioxide, even on the long term. The critical case is the case of a cement sheath that initially contains defects.
On the other hand, it is important to distinguish between the wells to be drilled from those already drilled. Indeed, in the case of new wells, it is possible to design a sheath that will not present any defect during its life (using SealWellTM software to simulate the integrity of cement sheaths). On the opposite, in the case of existing wells, one must initially assess the quality of cement sheaths and, in a second step, assess whether the acid gas injection could lead to loss of integrity (presence or absence of defects). This requires having the knowledge,
methodologies and tools to measure the integrity of a cement sheath, such as logging, monitoring, back-analy-sis, and remedial techniques. It also requires having simulation tools to assess the effects of acid gas injection on existing wells, together with a methodology to evaluate the inputs to these simulation tools. 51
The second deliverable of this R&D project is to be found in the frame of these simulation tools. Indeed, the R&D project has allowed the perfor-mance of a full series of well-docu-mented tests on cement degradation, not only by carbon dioxide, but also by hydrogen sulphide and mixtures of these two gases. These tests have been back analyzed in order to elaborate/complete the geochemical databases required to perform coupled geochemical-geomechanical simulation of cement sheaths, where necessary.
51: Cement-sheath integrity vs. the type of wellbore

103
Carbon capture and storage . The Lacq pilot Chapter 4: Well integrity
APPLICATION TO ROUSSE WELL
4.4
INITIAL ARCHITECTURE AND COMPLETION
Rousse RSE-1 well has a maximum deviation of 12°. The more than 2,000 m thick caprock was drilled in two openhole sections: a 12¼” section down to 3,470 m MD, and a 8⅜” section down to 4,544 m MD. 52
The 12¼” section was completed using 9⅝” casing with a casing weight varying between 47 to 53.5 lb/ft 3 and was cemented with a top of cement (TOC) at around 2,270 m MD.
52: RSE-1 well sketch with stratigraphy along the well

104
The 8⅜” openhole section was completed with a 7” casing string (casing weights varying between 32 and 38 lb/ft 3). Six centralizers were placed along the 9⅝” and 7” casing strings. Diamantite cement with a weight of 1.96 sg Diamantite cement was used to cement this section and TOC was found to be at 3,569 m MD using a Cement Bond Log (CBL). Diamantite is an old trademark of Lafarge, which is similar to the old API Class F cement. The density of the mud behind the 7” casing is about 1.13 sg. There is no mention of lead slurry being used.
The reservoir section was drilled with 5¾” and 41/5” bits, reaching a total Depth (TD) of 5215 m MD. A 5” liner was set across the reservoir at a depth of 4,737 m MD (top of liner: 4,441 m MD) and cemented. The remaining openhole interval was cemented up to 4,790 m MD and the 5” liner later perforated for gas production.
Cement evaluation data was acquired on the RSE-1 well in 1967 during the well drilling and well completion, and again in 2006 and 2009 during the work over to replace faulty downhole seismic sensors and to add two more P&T sensors:
¬ The 1967 data set contains openhole data: Gamma Ray, one-arm caliper and compres-sional sonic data, covering at least the reservoir and the caprock. Right after comple-tion of the 7” casing string, a CBL was acquired across the 7” casing up to the 9⅝” casing shoe (4,482 to 3,200 m MD) finding a TOC at around 3,569 m MD;
¬ In 2006, a slim cement mapping tool and a multi-finger caliper tool were run across the 5” liner from 4,727 to 4,443 m MD, to evaluate the cement hydraulic isolation and casing condition across the reservoir section, which was concluded to be good;
¬ In 2009, an Isolation ScannerTM coupled with a Sonic ScannerTM was run over the bottom 905 meters of the 2,000 m thick caprock (4,405 to 3,500 m MD) across the 7” casing to evaluate the quality of cement hydraulic isolation.
Using the data newly acquired in 2009, it was possible to fully characterize the material behind the casing, to evaluate any possible defects present within the cement sheath and to compare these results with the CBL acquired in 1967. The logging tools that were used are briefly described in the next section and data analysis is discussed in the section after, based on Miersemann, et al. (2010) and Loizzo, et al. (2013).
OVERVIEW OF CEMENT EVALUATION LOGGING TOOLS
The quality of the cement bond is generally based on the measurement of the direct attenuation of low- frequency (sonic) acoustic waves pro- pagating through the borehole fluid and the casing wall using one trans-mitter and one receiver, and operating at frequencies of about 20 kHz. Attenuation mainly depends on the loss of energy to the materials on either side of the casing. Energy loss from the acoustic mode used by the CBL happens mostly through shear wave radiation. Thus the amplitude of the first arrival at the receiver is indicative of the presence of solid cement with good shear coupling (shear bonding) around the pipe.
Quantitative CBL interpretation relies on the fact that the apparent attenua-tion (αapp) of the first waveform peak is proportional to the fraction of the cir-cumference that is bonded to a solid – called the Bond Index (BI) – and, to a lesser extent, to the strength of the solid itself. This dependency is formalized in equation 6, where α is either the measured or apparent attenuation (in dB/m), A is the amplitude, measured at 0.9 meter from the transmitter, and s the wave path length in the casing.

105
Carbon capture and storage . The Lacq pilot Chapter 4: Well integrity
Three parameters are needed to properly calculate the Bond Index: 1) the free-pipe amplitude (AFP), i.e. the amplitude of the first waveform peak when the casing is surrounded by fluid on both sides, which should be measured directly in the well or, at worst, calibrated in the lab; 2) the free-pipe attenuation (αFP), which can be obtained from correlations; and 3) the fully-bonded attenuation (αFB), i.e. the attenuation of an extensional wave when the cement is fully bonded to the casing. This latter parameter can be obtained through a mixture of models and correlations or measured directly in the well, if a suitable reference section is available.
Extensional attenuation therefore provides a simple and robust measure of the fraction of cement bonding to the casing, which is very useful to properly detect and characterize micro-annuli, as well as very large mud channels. On the other hand, the CBL amplitude’s dependency on cement mechanical properties is very limited, making the use of CBL alone problematic for a proper analysis of cement and its defects.
In addition to the Bond Index, a CBL routinely records the full wave-train at 1.5 meters, which is displayed as a Variable Density Log (VDL). On this map, arrivals of compressional and shear head waves that propagate in the formation can be qualitatively followed, and their energy provides some information about the quality of cement-formation bonding, since it affects acoustic coupling. Unfortunately many other variables also contribute to the formation arrival strength, such as mechanical properties’ contrast and cement-casing bonding, making clear-cut identifica-tion very difficult.
The Sonic ScannerTM run in casing provides both an evaluation of the cementation quality and of the me-chanical properties of the formation. Cement evaluation is based on the direct attenuation measurement to provide an estimation of the quality of the casing-cement bond azimuthally averaged. In order to obtain a correct log, a few quality control measures need to be ensured, which include: 1) tool centralization within the casing; 2) correct detection of the first peak of the waveform train (E; and 3) identification of fast formations like carbonates, which are faster than the casing arrival and cause higher and erratic amplitudes. The fast formation effect cannot be eliminated, but can be identified by comparing it with open-hole sonic data.
The Isolation ScannerTM delivers three independent measures (van Kuijk, et al. 2005):
1. An ultrasonic pulse-echo meas-urement: a rotating sub with an ultrasonic transducer ope- rating at around 300 kHz achieves a full coverage of the casing with a high vertical and azimuthal resolution. It emits a short pulse of acoustic energy around the casing resonance frequency at normal incidence, which reflects at each interface (i.e. casing inner diameter, casing-cement and even possibly cement-formation) providing a contrast in acoustic impedance. The presence of cement behind the casing is detected as a quick dampening of the resonance, while the lack of cement gives a long resonance-decay. The analysis of the echo waveforms result in four independent measurements: 1) the acoustic impedance (equal to density times compressional velocity
and referred to as Z with units of MRayl in the International System) of the material located behind the casing; 2) the casing thickness; 3) the casing internal radius; and 4) the condition of the casing inner surface;
2. A flexural wave measurement: the flexural wave is excited by a transmitter located at the bottom of the sub and is detected by 2 receivers further up (near and far, separated by a spacing δ in centimeters). The flexural attenuation (α, in dB/cm) is measured from the arrival amplitude at the two receivers:
3. The flexural waves irradiate both compressional and shear waves in the annulus causing echoes to be reflected or scattered back as a later casing flexural wave. This echo is called the Third Interface Echo (TIE). The transit time difference between the casing arrival and the TIE is to the first order a function of the annulus thickness and the velocity of the material in the annulus. This is used to determine casing centralization and annulus thick-ness. The near and far receiver amplitudes are both compared to the casing echo amplitudes and their ratio computed. They can be used to assess the reflectivity of the cement- formation interface, giving an indication of the cement-forma-tion bond.

106
Traditional ultrasonic methods use thresholds on acoustic impedance to discriminate between solid, liquid and gas. When using the Isolation ScannerTM and its two main independent measures (acoustic impedance and flexural atte- nuation), a Solid-Liquid-Gas (SLG) map is created to define the state of the material located in the annulus, which is more robust than a threshold-based evalua-tion. The effect of the logging fluid (the fluid in the casing) is also determined in real-time using these two measurements, which eliminates the need for an extra down-pass. Fast formations have no effect on either acoustic impedance or flexural attenuation measurements.
CBL ANALYSIS
The CBL recorded in 1967 displays amplitude and transit time. Low amplitude suggests overall good casing-cement bond from 4,484 m up to about 3,569 m MD. The displayed amplitude was computed from measured attenuation.
The data newly acquired from the Array Sonic ImagerTM and the 3D ultrasonic cement imager resulted in computed amplitudes that were constantly higher than those from the older CBL, suggesting no cement degradation over time. Bond Index values above 1 are artefacts caused by low signal amplitudes, either because of higher-than-expected cement mechanical properties, or because of destructive interference from the formation signal. 53
CBL ANALYSIS
In order to characterize the material located behind the 7” casing, the two independent measures, acoustic impedance and flexural attenuation, were used. Taking a first look at the available data already suggests two slightly different cement systems across the logged interval by plotting the cross-distribution of the two measurements, distinct mud and cement poles can be identified. Since the identification of these poles and their properties are needed to ac-curately characterize the material behind the casing, they were first quality checked, as discussed below. 54, 55
Computing the density of the mud requires the knowledge of the acoustic impedance and of the fluid velocity. Fluid velocity can in principle be determined using the TIE transit time differences and the annulus thickness or open-hole diameter.
53: BI computed from Isolation ScannerTM by averaging the solid portion of the SLG map at each depth compared with the corresponding indices for the original CBL and the Sonic ScannerTM (Loizzo, et al. 2013)
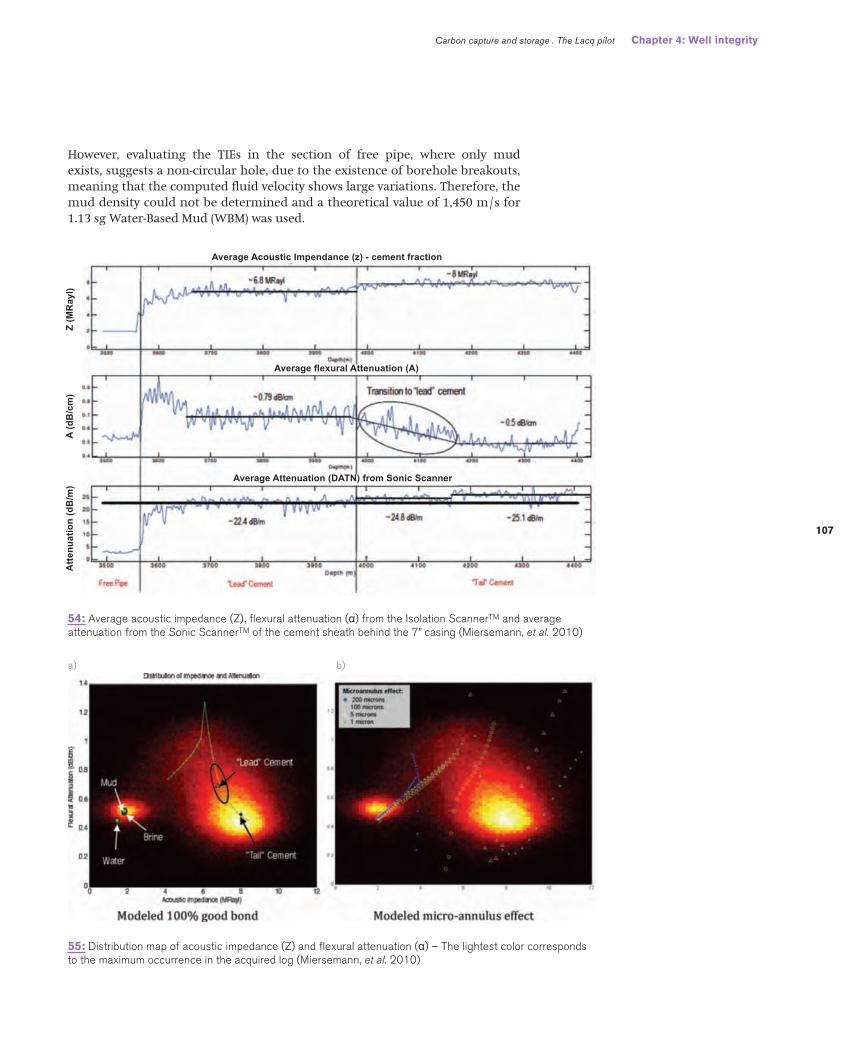
107
Carbon capture and storage . The Lacq pilot Chapter 4: Well integrity
55: Distribution map of acoustic impedance (Z) and flexural attenuation (α) – The lightest color corresponds to the maximum occurrence in the acquired log (Miersemann, et al. 2010)
54: Average acoustic impedance (Z), flexural attenuation (α) from the Isolation ScannerTM and average attenuation from the Sonic ScannerTM of the cement sheath behind the 7” casing (Miersemann, et al. 2010)
However, evaluating the TIEs in the section of free pipe, where only mud exists, suggests a non-circular hole, due to the existence of borehole breakouts, meaning that the computed fluid velocity shows large variations. Therefore, the mud density could not be determined and a theoretical value of 1,450 m/s for 1.13 sg Water-Based Mud (WBM) was used.
Atte
nuat
ion
(dB
/m)
A (d
B/c
m)
Z (M
Ray
l)
Average Acoustic Impendance (z) - cement fraction
Average flexural Attenuation (A)
Average Attenuation (DATN) from Sonic Scanner
a) b)

108
A micro-structural model was applied to characterize the cement poles, considering parameters like degree of hydration and solid volume fraction, to compute a 100% well bonded curve, which follows very well the cement distri-bution from the log response (figure 55a). Given the fact that the cement is well bonded, acoustic impedance and flexural attenuation measurements can be easily used to invert cement properties like density and compressional and shear velocities per depth. Table 3 gives an overview of the average computed values. Table 03
Although the reason for the difference in cement properties between the “lower” (4,405-3,980 m MD) and the “upper” (3,980-3,569 m MD) sections of the cemented interval is unknown, one hypothesis could be the use of different cement batches, which is supported by the transition zone at around 3,980 m MD (figure 54) and the presence of localized cement-in-cement channels across the upper section. Using the computed cement properties, the effect on Z and α of a micro-annulus of increasing width (1, 5, 100 and 200 microns) can be simulated. As can be seen in figure 55b, none of the modelled curves overlays with the measured Z-α distri-bution suggesting good casing-cement bond without any micro-annulus.
After determining the properties of set cement and mud, synthetic sonic attenu-ations can be computed from the properties of annular materials (using the SLG map or the average measured acoustic impedance to determine solid and liquid annular coverage). Comparing synthetic attenuation with measured values from the array sonic imager, a good match can be observed almost everywhere, except for sections where fast formation renders measured attenuation unreliable. This confirms that cement, outside of mud pockets (disconnected channels), is well bonded to the casing and that the computed values of sonic attenuation for well-bonded cement and mud are correct. 56
In general, the attenuation computed using (constant) cement properties and cement coverage from the SLG map results in lower values than the measured attenuation (and the one computed from average acoustic impedance): this is likely due to local variation in cement proper-ties resulting in zones with higher acoustic impedance. Using the previ-ously computed attenuations, a Bond Index can be computed. It is common practice to consider all sections with Bond Index above a certain threshold as well cemented, and therefore consider the sections with Bond Index below the same threshold as being badly cemented. In this well, by assuming a threshold of 100% bond index (a very optimistic value), the measured attenuation would be consistent with a channel covering 16% of the cemented interval.
Table 03: Computed properties of the cement and the mud (Miersemann, et al. 2010)

109
Carbon capture and storage . The Lacq pilot Chapter 4: Well integrity
The industry routinely takes a more realistic value of 80% as the Bond Index threshold, this lower value accounting for variations in cement proper-ties and degree of hydration. The trade-off is of course that, if cement is fully set and fully bonded, and if the cement attenuation is as predicted, a channel spanning 20% of the casing (about 72°) could be undetected. Using this more realistic threshold of 80%, 3.4% of the cemented interval would be flagged as affected by channels. A rough inversion of the omni-directional attenuation could therefore miss possible defects. The azimuthal resolution of the 3D ultrasonic cement imager allows accounting for the fluid/mud presence within the cement and results in this case in only 3.1% of the cemented interval being affected by channels.
56 : Comparison between the attenuation from the Sonic ScannerTM (blue curve, labeled SS), attenuation computed from acoustic impedance (green curve) and from the solid part of the SLG map (red) (Miersemann, et al. 2010)
DEFECT CHARACTERIZATION
The Isolation ScannerTM also contains a Relative Bearing (RB) accelerometer sensor, which allows differentiating between the low (RB = 180°) and the high side of the hole and can help identify the cause of certain defects. A first look at the SLG map of the isolation scanner indicates an intermittent blue (liquid) band suggesting the presence of mud pockets along the low side of the annulus. This band becomes slightly misaligned with respect to the low side of the hole (center of the map) in the upper section. It is characterized by a low acoustic impedance and a high flexural attenuation, which corre-lates with the free-pipe section above 3,568 m MD, suggesting the fluid to be mud. Very few cement-in-cement (solid) channels are identified, mainly in the upper section, and associated with the high side of the annulus. Such channels show higher acoustic impedance and lower flexural attenu-ation and are imbedded cement with medium acoustic impedance and flexural attenuation, suggesting that the higher-impedance fluid is thinner than the lower impedance one and could bypass it during placement.
Atte
nuat
ion
(DAT
N) (DATN) Comparition between Sonic and Isolation Scanner
Solid-liquid-Gas map
3600
3600
40
30
20
10
3620
3620
3640
3640
3660
3660
3680
3680
3700
3700
3720
3720
100
200
300

110
A quick look at the SLG map itself reveals localized white spots, sometimes related to acoustic impedance features called galaxy patterns. White spots in these areas are the result of casing misspeaks on the far receiver, resulting in the (wrong) flexural attenuation not being consistent with neither solid, liquid or gas. Galaxy patterns on the acoustic impedance map (flexural attenuation is not affected by galaxy patterns) are caused by third interface (e.g. formation) reflections, which arrive within the time processing window of the tool, and are characterized by local sudden impedance changes on the SLG map. In an in-gauge borehole, galaxy patterns depend on the annulus thickness, in turn determined by the average gap (open-hole caliper reading minus casing size) and the casing standoff. Since most of the identified mud pockets are located on the low side of the annulus, galaxy patterns can be further used to help characterize the vertical connectivity of these mud pockets, especially across sections with white spots on the SLG map. 57
In galaxy patterns, the apparent acoustic impedance oscillates between a minimum and a maximum value. The theoretical minimum acoustic impedance (Zmin=Zcmt
2/Zform) for cement and water was computed and superimposed to the measured Zmin. As can be seen on figure 57a, the measured Zmin in between mud pockets lies above the theoretical Zmin of cement and approaches Zmin of fluid in areas of mud pockets. This suggests that the existing mud pockets are inter-mittent and the material in between is indeed solid or slightly contaminated cement.
Zonal isolation between these intermittent mud pockets can now be assessed (figure 57b). Using the industry rule of thumb, zonal isolation with 7” casing is reached when at least 3 m of continuous good bond (BI above 80%) exists.
The lower cement section indicates that good cement is present across 83% of the entire 415 m cemented interval, whereas good cement bridges cover 69% of the upper 411 m interval in the upper cement section.
Given the relatively small number of centralizers used, and the fact that mud pockets are found across the narrow section of the annulus, it is important to assess the thickness of the good cement bridges. The minimum annulus thickness at the low side of the borehole, found using TIE transit times, suggests that the lower cement section has slightly thicker cement sheaths between the intermittent channels: 21% of the good cement bridges are above 10 mm thick, compared to 10% in the upper cement section (figure 57b). Even though the cement sheaths at the low side of the annulus are relatively thin, they are undoubtedly solid and well bonded to the casing and provide hydraulic zonal isolation along the > 800 m logged caprock section.
57: a) Theoretical minimum acoustic impedance of cement (green) and fluid (red) computed and superim-posed on the measured minimum acoustic impedance; b) Computed zonal isolation in form of land bridge lengths and minimum annulus thickness at the low side of the annulus (Miersemann, et al. 2010)
Zmin (MRayl)
Solid-liquid-Gas map
Minimum annulus thickness (mm)
Minimum annulus thickness
Land Bridge length over cemented internal
Length (m)
Zonal Isolationin 7" casing
Per
cent
age
(%)
Per
cent
age
(%)
Solid-liquid-Gas map
Minimum Accoustic Impedance vs Theorical
Zmin Water (red) and cement (green) to rock
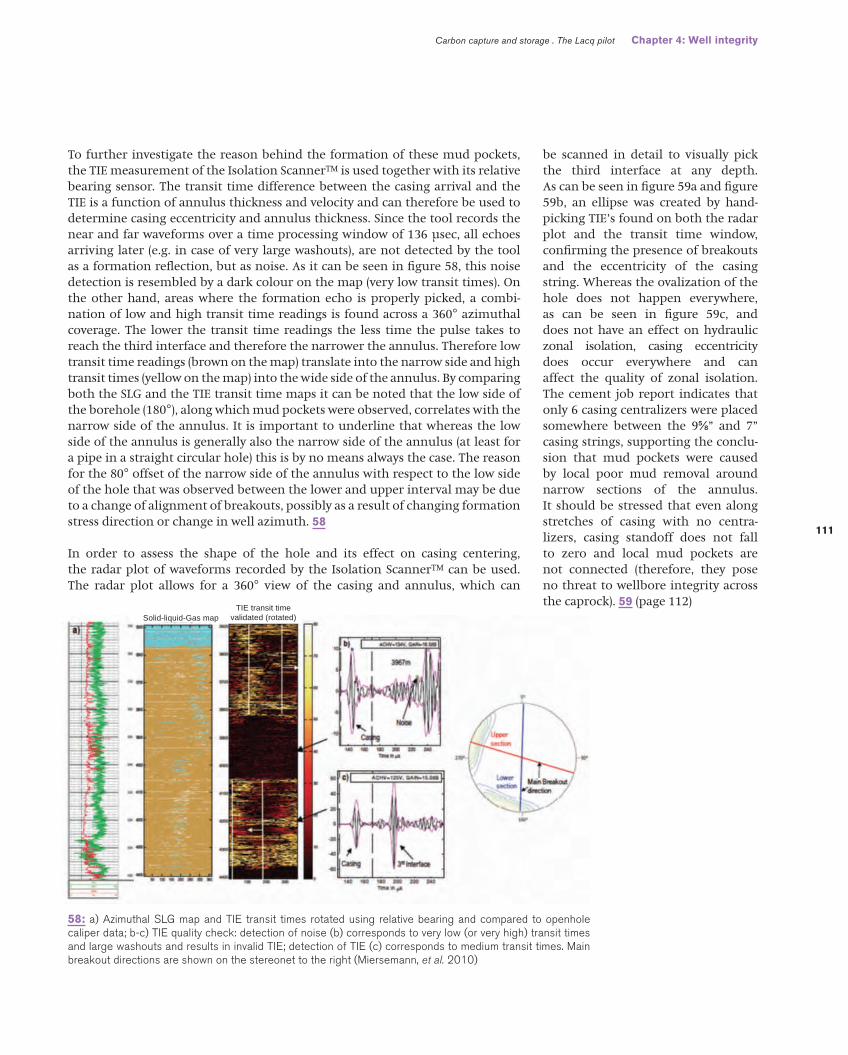
111
Carbon capture and storage . The Lacq pilot Chapter 4: Well integrity
To further investigate the reason behind the formation of these mud pockets, the TIE measurement of the Isolation ScannerTM is used together with its relative bearing sensor. The transit time difference between the casing arrival and the TIE is a function of annulus thickness and velocity and can therefore be used to determine casing eccentricity and annulus thickness. Since the tool records the near and far waveforms over a time processing window of 136 µsec, all echoes arriving later (e.g. in case of very large washouts), are not detected by the tool as a formation reflection, but as noise. As it can be seen in figure 58, this noise detection is resembled by a dark colour on the map (very low transit times). On the other hand, areas where the formation echo is properly picked, a combi-nation of low and high transit time readings is found across a 360° azimuthal coverage. The lower the transit time readings the less time the pulse takes to reach the third interface and therefore the narrower the annulus. Therefore low transit time readings (brown on the map) translate into the narrow side and high transit times (yellow on the map) into the wide side of the annulus. By comparing both the SLG and the TIE transit time maps it can be noted that the low side of the borehole (180°), along which mud pockets were observed, correlates with the narrow side of the annulus. It is important to underline that whereas the low side of the annulus is generally also the narrow side of the annulus (at least for a pipe in a straight circular hole) this is by no means always the case. The reason for the 80° offset of the narrow side of the annulus with respect to the low side of the hole that was observed between the lower and upper interval may be due to a change of alignment of breakouts, possibly as a result of changing formation stress direction or change in well azimuth. 58
In order to assess the shape of the hole and its effect on casing centering, the radar plot of waveforms recorded by the Isolation ScannerTM can be used. The radar plot allows for a 360° view of the casing and annulus, which can
be scanned in detail to visually pick the third interface at any depth. As can be seen in figure 59a and figure 59b, an ellipse was created by hand-picking TIE’s found on both the radar plot and the transit time window, confirming the presence of breakouts and the eccentricity of the casing string. Whereas the ovalization of the hole does not happen everywhere, as can be seen in figure 59c, and does not have an effect on hydraulic zonal isolation, casing eccentricity does occur everywhere and can affect the quality of zonal isolation. The cement job report indicates that only 6 casing centralizers were placed somewhere between the 9⅝” and 7” casing strings, supporting the conclu-sion that mud pockets were caused by local poor mud removal around narrow sections of the annulus. It should be stressed that even along stretches of casing with no centra- lizers, casing standoff does not fall to zero and local mud pockets are not connected (therefore, they pose no threat to wellbore integrity across the caprock). 59 (page 112)
58: a) Azimuthal SLG map and TIE transit times rotated using relative bearing and compared to openhole caliper data; b-c) TIE quality check: detection of noise (b) corresponds to very low (or very high) transit times and large washouts and results in invalid TIE; detection of TIE (c) corresponds to medium transit times. Main breakout directions are shown on the stereonet to the right (Miersemann, et al. 2010)
Solid-liquid-Gas mapTIE transit time
validated (rotated)

112
Since cement characteristics are known, cement velocity can be used to transform the automatically picked TIE transit times into compute an equivalent 36-arm caliper. Assuming that the 1-arm openhole caliper from 1967 measured the maximum diameter in an elliptical hole, a close agreement between the two caliper measurements can be observed in areas where the TIE transit times are valid. 60
The near and far receiver amplitudes of the TIE, each divided by the casing echo amplitudes, can be utilized to compute a reflection coefficient of the cement-formation interface, which gives an indication of the cement-formation bond in places where TIE is available and correctly picked (figure 60). A lack of acoustic contrast between the cement and the formation affects the TIE amplitude and reduces the reflection coeffi-cient below 1. Possible reasons are the presence of micro-annulus or not correctly picked TIE’s. First, reflection coefficients for formation (carbonate) and gas are predicted taking into account TIE amplitudes, velocities and densities of the cement and formation as well as casing and cement thick-nesses for the narrow and wide side of the annulus.
60: Comparison between the measured openhole diameter and the diameter computed from the TIE transit times (Miersemann, et al. 2010)
59: Radar plot images – Blue dotted circle = Casing, Green solid circle = 3rd interface detected by the tool, Black ellipse = true 3rd interface detected by hand picking (Miersemann, et al. 2010)
Openhole diameter computed from TIE vs. openhole caliper
Openhole diameter computed from TIE vs. openhole caliper
Depth (m)
Depth (m)
TIE time validated (rotated)
Ope
nhol
e di
amet
er (m
m)
Ope
nhol
e di
amet
er (m
m)
a) b) c)

113
Carbon capture and storage . The Lacq pilot Chapter 4: Well integrity
These results are then compared to the actual measured TIE-casing ratio to assess the cement-formation bond. Figure 61 a indicates that the computed reflection coefficients for gas and formation are equal for both the narrow and wide side of the annulus across the lower cement. The measured TIE casing ratio is slightly higher than the computed reflection coefficient possibly due to fast formation effects or mispicked TIE’s. Across the upper cement, a few areas are found, where the computed reflection coefficient of the gas is higher than that of the formation and does not correspond with channels on the SLG map. The measured TIE casing ratio is equal to the computed reflection coefficient of gas, suggesting possible micro-annulus in a few zones. However, radar plots indicate that the TIE’s are mispicked over these few intervals due to the elliptical nature of the borehole. Overall, the computed reflection coefficients for gas and formation are equal and below the measured TIE casing ratio suggesting good cement-formation bond. 61
61: Cement-Formation Bond Indicator – Computed reflection coefficient for gas (dashed green curve) and formation (solid green curve) are equal and lower than the measured TIE casing ratio (solid blue curve) (Miersemann, et al. 2010)
CASING EVALUATION
The 3D ultrasonic cement imager also measures the internal and external radii of the casing. The 7” casing string with a nominal ID of 6.004” shows overall no casing corrosion damage across the logged interval.

114
NUMERICAL SIMULATION OF THE INTEGRITYOF THE CEMENT SHEATH
The analysis of the seismicity recorded in the southwest France shows that no seismicity was induced during production of the Rousse field and, even if Rousse is located in a low-to-medium seismic area, no major earthquake has been recorded in the area. According to the database SisFrance in its 2007 release, most of the true earthquakes in the Lacq basin are near the Lacq field. Seismicity in the Rousse area is much smaller with a single earthquake recorded near the site of Rousse, the event of October 22th 1851 whose epicentral intensity is V (corresponding to strong tremor, awake of sleepers, falling of objects, and sometimes hairline cracks in plaster). 62
Hence, the risk of an earthquake in the vicinity of Rousse storage is not neg-ligible and evaluating well integrity of RSE-1 well requires analyzing three types of events: 1) well drilling and completion; 2) injection of carbon dioxide; and 3) effect of an earthquake occurring in the vicinity of the well.
Because it is extremely difficult to measure cement properties during seismic activity, a sensitivity analysis was performed by simulating two extreme cases characterized by a cement Young’s modulus of 10 and 20 GPa. Only the results obtained in the 20-GPa cement hypothesis are presented hereunder, as they are in agreement with the results of the simulations performed with the 10 GPa cement hypothesis. Table 04
Injection of carbon dioxide is simulated assuming a completion a annulus fluid density of 1.00 sg above the packer located at 4,390 m MD, a pressure of 3 MPa below the packer and a temperature decrease of 30°C below 3,600 m MD depth.
SealWellTM simulations showed that Bondex, Damex, and Slidex indices (see definition in figure 10 and figure 11 on page 81) of the cement sheath of the 12¼”, 8½” and 5¾” phases remain green during the drilling, cementing, LOT/FIT, and carbon dioxide injection phases. The results of these simula-tions are thus in agreement with the observations from cased-hole logging. 63
The methodology used to evaluate the overloads from an earthquake starts from the evaluation of the spectrum of potential earthquakes. Then surface movements are generated from the spectrum and stress variations in the wellbore components are computed for each of them based on the Kurose model (Kurose, 2000). Finally a cor-rection is performed to the stress variation based on Betbeder-Matibet method (Betbeder-Matibet, 1999), to correct the data from the effect of surface amplifications. 64, 65
62: Seismicity zoning of southwest France
Table 04: Mechanical properties of solid materials

115
Carbon capture and storage . The Lacq pilot Chapter 4: Well integrity
63: Cement-sheath damage for the 20 GPa cement hypothesis
65: Three seismograms in terms of acceleration and velocity for Lacq area
64: Seismic spectrum for Lacq area

116
Seismic overloads are computed at four depths: 2,300, 3,200, 3,350, and 4,200 m MD. The properties of the rocks in these four zones are given in table 5 together with Betbeder-Matibet correction coefficients (BMCC). 66, Table 05
Table 6 shows the minimum and maximum particulate velocity for the three seismograms in the formation, resulting in absolute maximum value (vM) of 0.380 m/s. Table 06
The maximum magnitude of shear stress variation in the formation for each zone (based on equation 3), taking into account (or not) the correction coefficient Betbeder-Matibet, is shown in table 7. Table 07
66: Four sections at which seismic overloads are computed
Table 05: Rock properties at the four sections

117
Carbon capture and storage . The Lacq pilot Chapter 4: Well integrity
Table 07: Maximum magnitude of shear stress variation for the four sections
Table 06: Minimum and maximum particulate velocity for the three seismograms
Based on values in table 7 and the Kurose model, it is possible to compute seismic overloads in the cement sheaths and tubulars, showing that the dynamic stress variations without Betbeder-Matibet correction are always less than 5.5 MPa, in the case where the cement Young’s modulus is equal to 10 GPa, and no more than 4.0 MPa, in the case where it is equal to 20 GPa. Similarly, the dynamic stress variations in casings and tubing always remain below 50 MPa. Applying the Betbeder-Matibet correction, the maximum magnitudes are equal to 0.6 and 4.0 MPa respectively in the cement sheaths and in the tubulars. These magni-tudes with or without correction are significantly lower than the safety margins computed with SealWellTM, assuming no earthquake. Therefore, the risk of damaging RSE-1 well during a seismic event is assumed to be negligible.
CONCLUSION
The 43 year old RSE-1 well of the Rousse field is the only well penetrating Rousse reservoir into which carbon dioxide has been injected. Although informa-tion on the cement job design and execution is not available, the acqui-sition of new cement evaluation logs using a combination of isolation and sonic scanners allowed the full charac-terization of the material behind the 7” casing string, in order to identify possible defects as well as casing eccentricity.
The correlation between the CBL acquired in 1967 and the one using the array sonic imager in 2009 indicates overall good casing-cement bond (of the 7” casing) with no bond or cement degradation over time. Also, computed attenuation from both tools suggests that no micro-annulus exists between the casing and cement. The characterization of the material in the annulus revealed a slight diffe- rence in cement densities between the lower (4,405-3,980 m MD) and upper (3,980-3,569 m MD) cemented interval.

118
Although mud pockets were identified within the entire interval, they are dispersed and disconnected. Both the SLG map and TIE transit time evaluation showed a general trend along the narrow side of the hole suggesting poor mud removal being the reason for their development. Bridges of good cement between the mud pockets along the narrow side of the hole are solid and their length and thickness suggests good hydraulic isolation across the 836 m cemented caprock interval.
These observations are in agreement with the results of the simulations of the cement-sheath integrity performed with SealWellTM software application, which show that no thermo-mechanical defect should have been induced during the life of the well prior to injecting carbon dioxide. The simulations also proved that the stress variations induced by injecting carbon dioxide due to thermo- mechanical effects, or resulting from an earthquake in the vicinity of the well, remain much lower than the available safety margin. As a consequence the risk of mechanically degrading cement-sheath is negligible and, based on the results of the R&D project on cement degradation by carbon dioxide, the risk of chemically degrading cement-sheath is also negligible: the 7” casing cement sheath is classified as good on the long term. The risk of carbon dioxide leakage out of Rousse reservoir is negligible overhundreds of years.
Such a leakage risk could have been evaluated by risk assessment analysis, a more and more popular mean to classify risk scenarios according to their level of criticality: as a minimum, a threshold is defined between unacceptable risk, above which the activity described in the scenario should be stopped or not started, and acceptable risk. Very often one or more intermediate classes of risk are also added, for which the activity can proceed provided risk is continuously minimized to a level as low as reasonably practical (ALARP).
Table 08: Definition of criticality classes (L: Low, LM: Lower Medium, UM: Upper Medium, H: High)
Risk is normally classified using a short descriptor (e.g. Low, High) and a color code ranging from blue/green for acceptable risk to red/black for unacceptable. Risk is measured and classified using its criticality, which is calculated from the probability of occurrence and the severity of consequences for each scenario.
There are many ways to define classes for probability and severity, as well as on how to compute criticality. A criticality matrix that links possible negative outcomes of an activity to severity classes is also necessary to define risk, and is different from company to company. For example, criticality can be defined as the product of probability and severity classes, and divides it into 4 levels: Low (light blue ), Lower Medium (yellow ), Upper Medium (orange ) and High (red ). Both Medium risk levels require the imple-mentation of risk control to continue with the activity. Table 08
In the case of RSE-1 well, the probability of leakage is so low that it can be classified into category A. Hence the criticality would only be Low or Low medium, hence justifying that a full risk assessment is not necessary in the case of RSE-1: risk assessment should always be customized according to the project specificities.

119
Carbon capture and storage . The Lacq pilot Chapter 4: Well integrity
ACKNOWLEDGEMENTS
Total would like to acknowledge the work performed by Ecole des Ponts ParisTech (Jean SULEM, Siavash GHABEZLOO), Polytech’Lille (Jianfu SHAO, Nicolas BURLION), LERM (Noureddine RAFAÏ), CURISTEC (Manh HUYEN VU, Gregory GALDIOLO), OXAND (N. NEUVILLE, O. POUPARD, Y. LE GUEN), DFi Ingénierie (D. FOURMAINTRAUX), Total (B. FRABOULET), University of Liège (Christian SCHROEDER, Pierre ILLING)IFSTTAR (Institut Français des Sciences et Technologies des Transports, de l'Aménagement et des Réseaux) (François Martineau, Sylvine GUEDON).

120
Δτm Maximum shear stress variation due to an earthquakeα AttenuationαFB Fully-bonded attenuationαFP Free-pipe attenuationαM Measured attenuationαapp Apparent attenuationαd Coefficient of thermal expansion under drained conditionsαu Coefficient of thermal expansion under undrained conditionsδ Distance between near and far receiversµij Non dimensional coefficient used to compute stresses in wellbore components due to seismic waveν Poisson’s ratioξ Degree of cement hydrationρ Specific massρf Specific mass of waterσa Axial stress applied during a triaxial testφ Friction angleA CBL amplitude, measured at 0.9 meter from the transmitterAFP Free-pipe amplitude, measured at 0.9 meter from the transmitterAFar Arrival amplitude measured at the far receiverANear Arrival amplitude measured at the near receiverAFREM Association Française de Recherche et d’Essais sur les MatériauxALARP As low as reasonably practical API American Petroleum InstituteB Skempton’s coefficientBI Bond indexBMCC Betbeder-Matibet correction coefficientBSE Back scattered electronCBL Cement bond logCCB Compagnie des Ciments BelgesC-S-H Calcium silicate hydratesD Indenter diameterDATN Discriminated attenuationDTA Differential thermal analysisE Young’s modulusE1 First peak of the waveform trainEdyn Dynamic Young’s modulusEstat Static Young’s modulusEDS Energy dispersive spectroscopyFEA Finite element analysisG Shear modulus Unit tensor
NOTATIONS
4.5

121
Carbon capture and storage . The Lacq pilot Chapter 4: Well integrity
Kd Bulk modulus under drained conditionsKu Bulk modulus under undrained conditionsMD Measured depthPEEK Polyetheretherketone QA/QC Quality assurance/quality controlR&D Research and developmentRB Relative bearingRSE-1 Rousse-1 wellSEM Scanning electron microscopeSLG Solid-liquid-gasSRC System response curveSTCA Slurry-to- cement analyzerT TemperatureTCS Triaxial compressive strengthTD Total depthTGA Thermo gravimetric analysisTIE Third interface echoTOC Top of cementTS Tensile strengthUCS Uniaxial compressive strengthVDL Variable density logWBM Water-based mudWHP Well head pressureXRD X-ray diffractionZ Acoustic impedanceZcmt Acoustic impedance of cementZform Acoustic impedance of formationZmin theoretical minimum acoustic impedanceb Biot’s coefficient Tensor of strain incrementdξ Increment of degree of hydration Tensor of total stress incrementdP Increment of indenter loaddT Increment of temperaturedh Increment of indenter penetrationdmf Increment of mass of waterdpp Increment of pore pressuremf Mass of waterp Mean total stressp’ Mean effective stresspc Confining pressure applied during a triaxial testpp Pore pressureq Deviatoric stresss Wave path length in the tubularsd Coefficient of hydration under drained conditionssg Specific gravitysu Coefficient of hydration under undrained conditionsvM Maximum particulate velocity as measured on seismogramsvp Compressional wave velocityvs Shear wave velocityw/c Water-to-cement ratio

122
Taking part in a pilot project is always a terrific opportunity for an academic team.
On the Lacq-Rousse site, our researchers were able to conduct programs solidly grounded in reality, far from laboratory idealism, based on realistic databases with samples taken from the actual reservoir and caprock, and not just from outcrops.
“

123
Carbon capture and storage . The Lacq pilot Chapter 4: Well integrity
In addition, they learnt to come to terms with the real constraints of an industrial site (e.g. safety, restricted access, local residents).”UNIVERSITY OF LORRAINE, Jacques Pironon, Director of mixed research unit (UMR) no. 7359, GeoResources

124
chapter 5
IMPACT AND RISK ASSESS-MENTMONITOR-ING PLAN
authors
X. Payre (Total)C. Maisons (Magnitude)C. Prinet (Total)J. Monne (Total)J. Hy-Billiot (Total)M. Lescanne (Total)G. Mouronval (Total)J-P. Quet (Total)

125
Carbon capture and storage . The Lacq pilot Chapter 5: Impact and risk assessment Monitoring plan
Risks can be defined as unwanted scenarios, in which a specific occur-rence will lead to loss in performance (for instance damage causing a loss in sealing capacity). Risks are often asso-ciated to a probability and a severity, the product of the two being referred as the criticality. Risks must be carefully controlled through preven-tion measures or corrective actions, before or during operations. The installation of a monitoring program is also an essential component of the risk management system, which helps in controlling the key dynamic parameters of the system (e.g. reservoir pressure, losses of integrity, CO2 leaks).
Section 2 presents a summary of the assessment of environmental impacts for the Lacq and Rousse installations, distinguishing the impact associated with works, operations, as well as different targets such as the envi-ronment (flora, fauna, soils, water resources, air quality, landscape), or humans (nuisances such as noise or traffic, safety).
Section 3 details the assessment of hazards and risks that has been performed for the storage operation, focusing on the storage geological conditions and the well. The two reference documents were the CCS directive and the French regula-tions. For instance, the CCS directive (Step 3.3) requires that the project developer should conduct a risk assessment comprising 1) the iden-
tification of hazards, 2) the exposure assessment, 3) the effects assessments, and 4) the risk characterization.
The identification of hazards aims at describing the environment, identifying potential hazards due to the nature of the products and of the operations, and evaluating the possibility to limit these hazards at the source.
The characterization of risks consists in estimating a level of risk for each of the hazardous phenomena that have been identified, through the identification of their cause, probabi- lity and magnitude of effects. Eleven risk scenarios are identified and discussed in detail for their likelihood and severity. The scenario with the highest criticality is the well blowout, for which exposure and effects are evaluated in detail, and for which mitigation measures are presented.
Finally, the last section introduces the monitoring activities that have been done on site. The monitoring plan has the objectives of both verifying the performance of injection opera-tions and controlling environmental impacts and risks. More specifically, monitoring activities are specified in Article 13, section 1 of the CCS directive: “Member States shall ensure that the operator carries out mon-itoring of the injection facilities, the storage complex (including where possible the CO2 plume), and where appropriate the surrounding environ-ments for the purpose of:
ONCE THE STORAGE CONDITIONS HAVE BEEN FULLY CHARACTERIZED, BOTH IN TERMS OF GEOLOGY (CHAPTER 3) AND WELL INTEGRITY (CHAPTER 4), A THOROUGH ASSESSMENT OF IMPACTS AND RISKS CAN BE PERFORMED, WHICH CONCLUDES THE CHARACTERIZATION PHASE.
a. Comparison between the actual and modelled behavior of CO2 and formation water in the storage site;
b. Detecting significant irregularities; c. Detecting migration of CO2; d. Detecting leakage of CO2; e. Detecting adverse effects for
the surrounding environment, including in particular on drinking water, for human population, or for users of the surrounding biosphere;
f. Assessing the effectiveness of any corrective measures taken pursuant to Article 16;
g. Updating the assessment of the safety and integrity of the storage complex in the short and long term, including the assess-ment of whether the stored CO2 will be completely and perma-nently contained.”
Given the characteristics of the Rousse CO2 storage project, the monitoring program consists in 3 main activities:
¬ The monitoring of reservoir pressure to address (a), (b), (c), (d) and (g);
¬ The monitoring of seismicity to address (b) and (e);
¬ Environmental (or surveillance) monitoring to address (d), (e) and (g).
Comprehensive results of these moni-toring activities are presented in detail in Chapters 6 and 7.

126
INTRODUCTION
An Environmental Impact Assessment analyzes the direct and indirect, temporary and permanent effects of the project installations and operations on the environment. The Environmental Impact Assessment:
¬ Is structured according to identi-fied or predictable environmental impacts;
¬ Presents and takes into account the baseline status of a site and its environment;
¬ Assesses the consequences that installations are expected to have on their environment;
¬ Describes and analyzes the measures implemented to avoid or mitigate potential undesira-ble effects on the environment.
This study also presents the conditions for site restitution after operations.
The content of the Environmental Impact Assessment depends on the size of the installations and their possible impacts on the environment.
SUMMARY OF THE IMPACT ASSESSMENTS FOR THE CO2 PILOT
When the file requesting authorization to operate was being drafted in 2008, a first assessment of the impacts of the CO2 Pilot was carried out. It included impacts occurring during the con-struction and operation phases.
A second Environmental Impact Assessment was performed in May 2013 as part of an intermediate review of operations. It comprised the conclusions of the operating phase, the surveillance phase and the phase of fieldwork associated with the deve- lopment or the dismantling of part of the installations.
The main conclusions of these assess-ments are presented below.
Impacts of the installations, works and operations at the Lacq site
Impacts during the work phase
Temporary impacts during the work phase, whether direct or indirect and of any nature, were minor: waste was managed according to the pro-cedures currently in force on the Lacq platform and transported to the appropriate disposal facilities. Road traffic due to the construction of new
ENVIRONMENTAL IMPACT ASSESSMENT
5.1

127
Carbon capture and storage . The Lacq pilot Chapter 5: Impact and risk assessment Monitoring plan
installations was limited and did not have any additional harmful effects on the environment.
The impacts associated with works in the development and dismantling phases were estimated to be similar.
Impacts of operations
Impacts on the landscapeThe Lacq industrial complex is located in the French Béarn region, in the western part of the Pyrénées Atlantiques department. It covers 220 hectares and overlaps the towns of Lacq - Audejos (48%), Arance (48%) and Abidos (4%). The Lacq complex can be accessed from the main road linking Pau to Orthez.
The new installations are built on the site of the boiler room, reusing as much as possible the existing infra-structures. They are not visible from outside the platform and are therefore not an eyesore for the neighborhood.
Impacts on the fauna and floraBecause they are built inside the platform and do not have any significant impact outside the site in terms of emissions and aqueous discharges, the new installations have no impact on the surrounding fauna and flora.
Impacts on the soil and subsoilThe installations do not require either extensive groundwork or the use of chemicals liable to cause soil conta- mination.
Impacts on water consumption and liquid releasesWater consumption is limited to the supply of the steam and cooling water circuits. Its quantity is negligi-ble compared to the platform’s water consumption.
Additional wastewater releases are composed only of condensates from flue gas treatment and from the com-pressor. This water can be sometimes acidic (pH between 6.4 and 7) due to the presence of dissolved CO2 (the equivalent of carbonated water). It is collected in the rainwater network, treated in the existing containment basin when necessary (to balance its acidity) and restored to the natural environment (released into the Gave). This unpolluted water does not have an impact on the quality of the water in the sector.
Impacts of atmospheric emissionsThe new installations considerably reduce the impact on the atmosphere, as the boiler has been modified to collect all the flue gas. During normal operation, no flue gas was discharged into the atmosphere. Flue gas was only emitted during the transitory phases (installation start-up), with the same composition as the gas emitted previously by the CH2 boiler.
Steam was also released during the re-generation of the dehydration unit’s molecular sieves.
The new installations helped prevent more than 50,000 tons of CO2 from being emitted into the atmosphere.
Moreover, the oxycombustion tech-nology in use limits the formation of nitrogen oxide.
The project thus represents a clear improvement in terms of limiting greenhouse gas emissions, and therefore contributed to enhance the environmental performance of operations on the Lacq site, meeting the objective of reducing the impact on climate change.
Impacts on road trafficProject activities did not have a significant effect on road traffic.
Impacts in terms of waste, odors, vibrations, noiseThe only additional waste generated by the installations is dust resulting from the flue gas treatment in the venturi scrubber. However, this only represents very small quantities (a few kilos per year approximately).
Waste from the CH4 boiler operation (common waste, maintenance waste) was produced in similar quantities as before.
The project therefore had a minimal impact on the production of waste.
Acoustic impactThe compressor was the only source of significant additional noise. Because the installations are located far from the site’s fences and from regulated point source zones, and thanks to the measures taken by Total to limit the acoustic impact of the compressor, regulatory requirements were met and harmful effects on the neighbor-hood were avoided.
Noise measurements were taken after the start of the operations, which confirmed the absence of acoustic impact of installations on the envi-ronment.
Sanitary impactNo significant risk for public health was noticed during the project. On the contrary, the installations limited the platform operations’ impact on the health of neighboring populations by reducing atmospheric emissions of nitrogen oxide (NOx) and carbon dioxide (CO2).

128
Impacts of the installations, works and operations at the Rousse site
Impacts during the work phase
Impacts on the landscapeThe site is hidden behind a natural hedge; so only the drilling mast and the construction of a new compressor building may have caused a temporary nuisance.
Impacts on the fauna and floraDuring the work phases, impacts are limited to the immediate surroundings of the site, as wild animals are scarcer, due to levels of noise and activity higher than what they are used to.
Impacts on the soil and subsoilThe impact is minimal, all precau-tions to avoid accidental spills have been taken. Moreover, none of the operations should involve contact with ground water.
Impacts on water consumptionWater consumption is limited to a few dozen square meters, drawn from the public network.
Impacts of atmospheric emissionsThe impact is low and limited to a few emissions of dust produced by groundwork.
Impacts on road trafficA temporary increase in road traffic occurred when transporting equipment.
Impacts associated with wasteWaste generated by the construction works was managed according to the usual procedures: sorting and removal by accredited companies.
Acoustic impactNoise was generated by the construc-tion works and particularly by well workover operations. The worksite’s activities mostly took place during the day, except for well workover operations, certain phases of which had to be continuous for safety reasons.
The most disturbing noise was caused by heavy metallic parts coming in contact with one another during the works. However, this noise was dampened by the distance and only occurred irregularly during well workover operations (lasting approxi-mately 15 days). During the day, it was covered up by the surrounding noise; at night time, however, it may have been disturbing.
Sanitary impactNo significant risk for public health was noticed during the project.
The second impact assessment conducted during the intermediate review did not reveal any significant new impacts associated with develop-ment and dismantling works.
Impacts of operations
Impacts on the landscapeThe new installations do not have a significant visual impact.
Fauna and floraNo additional impact on the fauna and flora was noticed.
Impacts on the soil and subsoilNo new fluid has been used.
Impacts on water consumptionInstallations did not use any water.
Impacts of atmospheric emissionsNo atmospheric emissions occurred in normal operation.
Impacts on road trafficCompared to the previous situation, road traffic did not increase.
Impacts associated with wasteInstallations did not produce additional waste.
Acoustic impactThe only source of noise (the compre- ssor at the Rousse site) was installed in a soundproof building.
Sanitary impactNo significant risk for public health was induced by the project.
Impacts of CO2 injection into the Rousse reservoir
Impacts on the production of gas resourcesThe reservoir is depleted, and remaining gas quantities are very small. Therefore the impact on the gas resources is low.
Impacts at the surface due to the rise in pressure of the reservoir The pressure increase is limited and the pressure remains much lower than the reservoir’s initial pressure. Therefore, it will not create any mechanical disturbance at the surface.
Piezometric impacts of the pressure rise on ground waterThe Rousse reservoir is hydraulically isolated from the overlying aquifers; no piezometric impact is therefore expected on the exploited water tables.
Impacts from CO2 leaks on the aquifers or the surfaceThere is no natural communication between the CO2 injected in the reservoir and the outside of the structure.

129
Carbon capture and storage . The Lacq pilot Chapter 5: Impact and risk assessment Monitoring plan
The case of a leak due to loss of integrity along the well is examined in the hazard analysis, documented in the next section.
Chemical impacts from the injection of CO2 in the reservoirGeochemical simulations have esta- blished that a potential loss of porosity associated with CO2 injection in the reservoir is negligible.
Sanitary impactNo significant risk for public health was noticed during the project.
The second Environmental Impact Assessment, which was published in May 2013, did not reveal any signifi-cant change in the impacts, except for a reduced water and energy consump-tion due to the shutdown of installa-tions.
Investments for environmental protection
The project as a whole reduced the environmental impacts of the Lacq platform (by limiting the atmospheric emissions).
The share of investments directly allocated to the safety and protection of the environment on the Lacq site (housekeeping and capture pads, gas, CO2 and fire detection instruments, etc.) amounts to €3 million. €4 million are also being directly invested into the protection of the local environ-ment, the integration of the Rousse installations into the landscape and the safety of workers and populations (gas and CO2 detection instruments, etc.).
A total of €7 million is therefore being directly spent on the protection of people and the environment.
Conditions regarding site restitu-tion after operations
In compliance with book V of the regu-latory section of the Environmental Code, the decision to shut down the installations was notified by a letter sent to the Prefect, together with a memorandum explaining the measures taken or planned to ensure the protection of interests covered by the legislative section of the environ-ment code, and particularly title 1 of Book V pertaining to Installations Classified for the Protection of the Environment (I.C.P.E.). This memo-randum includes the second impact assessment carried out in May 2013, mentioned above.
The following measures are taken to ensure environmental protection and safety:
¬ Installations are isolated; ¬ Water, electricity, oxygen and gas
are disconnected; ¬ Installations are washed. ¬ Installations are cleaned up
before steel reinforcement or recycling;
¬ Parts of the installations are dismantled;
¬ Waste is evacuated and elimi-nated by authorized and suitable companies;
¬ Production equipment and tools are evacuated or eliminated;
¬ The network currently in place to monitor the water table is maintained;
¬ The ground at Lacq is deconta- minated depending on its future use, and a verification report is issued.

130
METHODOLOGY
The hazard and risk analysis consists of two main steps:
1 - The identification of hazards:
¬ The description of the environ-ment and the neighborhood of the facilities, including interests that should be protected and potential sources of hazards;
¬ The identification and the characterization of hazards: inventory, product or work con-ditions related;
¬ The analysis of possible accidents on the concerned installations, using feedbacks from previous project experience to ensure the adequacy of the protection provided against the types of reported accidents;
¬ The evaluation of the possibility of reducing potential hazards at the source.
2 - The evaluation of risks:
¬ The identification of the various hazards that may occur (acciden-tally) on facilities;
¬ The determination of possible causes and effects;
¬ The estimation of the level of risk for each studied event.
This evaluation is done for the hazards that are identified, and accounts for the characteristics of the installations and the conditions of operation.
DESCRIPTION OF THE INSTALLATIONS
The well
The function of the well being to ensure communication between the reservoir and the surface, it intersects all geological formations that ensure the sealing of the reservoir. It is therefore:
¬ A potential weak point because the sealing capacity of the well (hydraulic isolation) can be accidentally altered, with a risk of blowout;
¬ A singular point that can be the source of a gas leak into the overlying aquifers or at surface.
The reservoir
The existence of a natural gas field is proof of the sealing performance of the cap rock of the geological formation that has been selected
HAZARD AND RISK ANALYSIS
5.2
This chapter presents the analysis of hazards and risks for the storage operations, covering the injection well, the reservoir and the cap rock.
However, due to the lack of feedback on CO2 storage operations (and more particularly on the probabilities of occurrence of identified hazards) and because of the specificities of facilities (more specifically the characteristics of the reservoir), only a deterministic approach can be followed.

131
Carbon capture and storage . The Lacq pilot Chapter 5: Impact and risk assessment Monitoring plan
THE IDENTIFICATION OF HAZARDS
Hazards related to products
The hazards related to CO2 are well known:
¬ The main danger comes from the effects of carbon dioxide on human beings and more generally on the environment. Adverse effects can occur for any loss of containment, if the CO2 cloud is large enough and if human exposure to the cloud happens during a sufficient time;
¬ The acidic properties of carbon dioxide can be considered as a danger when being the cause of a chemical event that leads to a degradation of the environment.
for CO2 storage. However, a CO2 leak, if it occurred, could result in the contamination of overlying aquifers or in a gas emission on surface.
CO2 injection into the reservoir layer can cause mechanical disturbance in the subsurface, with consequences such as movements of underground formation layers, surface elevation, which could possibly lead to leakage.The risks of damaging the integrity of the storage unit during underground engineering operations do exist, but are not increased by the project specific operations.
Hazards related to installations and to operations
The table below presents the results of the hazard identification step. A syste-matic method was applied to determine the hazards associated with the project, during all its phases. The origin of hazards can be either products or processes/operations. In this type of study, the environment (natural and human) must be considered as risk receptors, but also as a source of danger. Table 01
Table 01: Results of the hazard identification step
132
The result is an exhaustive list of hazards (emission of a cloud of CO2, deformation of underground formation layers or even surface elevation due to pressure) that may occur when some accidental events happen. These accidental phenomena are identified and listed in the second column, as undesirable events. Possible causes of each of these dangerous events were investigated very thoroughly.
The result is a series of scenarios, some of which may have multiple conse-quences, which cover all accidental phenomena that would generate a hazard. The risk assessment is conducted through the study of these scenarios. The last column of the table thus provides a list of scenarios that are all discussed in the remaining part of the section. Risks are all assessed together with their occurrence.
After this step eleven scenarios were studied:
1. Leakage through a defect in the sealing of the cap rock;
2. Leakage through existing faults;3. Lateral gas leak;4. Leakage through the well into
underlying aquifers;5. Leakage through the well to
surface;6. Mechanical damage in the
reservoir due to chemical effects occurring in the reservoir;
7. Mechanical damage on land because of CO2 injection;
8. Mechanical damage on land due to an earthquake;
9. Effect of an earthquake on the well;
10. Subsequent drilling of an inter-secting well;
11. Well blowout.
Note that the first two rows of the table correspond to the effects of the scenarios studied (hazards related to the product).
EVALUATION OF THE RISKS RELATED TO THE WELL AND THE RESERVOIR
Risk of leakage because of a loss of the cap rock integrity
The continuity, the thickness and the shape of the cap rock, together with the effectiveness of closure by the bounding faults, were evaluated through:
¬ Seismic studies, allowing charac-terization of the thickness and the shape of the cap rock (a 3D seismic survey was conducted in 1989-90, re-processed and inter-preted in 2006);
¬ The geological and structural model built from data recorded in the three boreholes that were drilled in the Rousse reservoir and from seismic maps;
¬ Analyses performed on cores recovered during drilling opera-tions in the reservoir and in the cap rock, well logging data and formation test data recorded in wells;
¬ The knowledge of the Arzacq basin and its context that was accumulated during more than 40 years of study (characteri-zation and exploitation of an hydrocarbon reservoir in the Southwest of France).
The structural integrity of the reservoir and its isolation from neighboring reservoirs or underlying aquifers was established based on the following considerations:
¬ The existence of the reservoir is a guarantee of the existence of a gastight structure, since gas is left trapped for millions of years at a pressure greater than the hydrostatic pressure;
¬ The fact that the faults affecting the reservoir are old, do not cross the cap rock and are sealed by the Base Upper Cretaceous unconformity;
¬ The difference in gas-in-place composition between the Rousse reservoir and the Meillon St. Faust field, located further North (sulfur and CO2 content), confirms the isolation of these structures compared to the nearest structures;
¬ The analysis of pressure data (depletion of the reservoir) during production shows that it is sealed and isolated, with no connection to the aquifer and no connection to the Meillon reservoir of the Rousse field, which is located 250 m below and is submitted to an aquifer activity;
¬ The pressure increase during the CO2 injection phase is limited and the final pressure will be kept much lower than the initial reservoir pressure and also well below the capillary entry pressure and the fracturing pressure of the cap rock, even taking into account thermal effects.

133
Carbon capture and storage . The Lacq pilot Chapter 5: Impact and risk assessment Monitoring plan
Risks of leakage due to the reacti-vation of existing faults because of the pressure increase
As mentioned in the previous paragraph, faults located in the reservoir are old, do not cross the cap rock and are sealed by the Upper-Cretaceous unconformity. A computer simulation was conducted to assess the impact of the depletion on the bounding faults. The analysis of the reservoir geometry and the position of the faults led to study more speci- fically two oriented structural sections (North-South and East-West), which are perpendicular to bounding faults.
Geomechanical modelling based on the assumption of hydrostat-ic pressure conditions in the faults and in their relaxed state shows that any slippage is a priori excluded. Even in the worst-case scenario – in terms of earth stresses and mechanical pro- perties – the friction angle of the fault, at fault initialization, prevents slippage. Especially, the strong depletion of the reservoir due to the produc-tion of gas did not a priori lead to fault activation. Several factors are involved, including the strong field of local stresses, associated with the high stiffness of the reservoir formation.
Because the overloading stress induced by the depletion of the reservoir did not result in slippage, no movement is expected during the injection phase as long as the reservoir pressure remains below the initial pressure. To support this result, a review of the seismicity recorded in the region shows no seismicity induced by the production of the Rousse field (Mano or Meillon) formations.
Risks related to CO2 lateral displacement
The risk of CO2 movement out of the reservoir can be excluded, given the thickness of the overlying cover (flysch Campanian), the reservoir structure and its hydraulic isolation.
The Rousse reservoir consists of two Jurassic reservoirs (Mano formation and Meillon dolomites formations) that are not in communication, and that contain gas condensate with low sulfur content (< 1%) and a high CO2 content (> 4.5%). This proves the independence of this satellite from the Meillon St -Faust field.
The extreme depletion of the Mano reservoir is a good indicator of the tightness of the reservoir and therefore, of a low risk of a lateral migration of the gas:
¬ When drilling the Rousse-1 well, the initial pressure in the Mano dolomite reservoir was 480 bars. It is now only 30 bars in the immediate vicinity of the well;
¬ The prediction of the reservoir pressure in the near wellbore region, at the end of CO2 injection, is approximately 70 bars;
¬ The pressure of the aquifer imme-diately overlying the producing reservoir is about 200 bars in the well RSE-1 (limestone Lasseube located at the vertical of Rousse, between 2,000 and 2,150 m);
¬ The pressure in the Meillon reservoir of the Rousse field, located 250 m below and currently in production through the Rousse-3 well, is currently close to 150 bars proving the hydraulic isolation of the two reservoirs.
As there is a strong pressure gradient between the well and the limits of the reservoir, some kind of pressure closure is added to the lateral reservoir geological confinement, since the CO2 injection zone is at a lower pressure than the distant reservoir area.
The risk of damaging reservoir integrity due to future under-ground drilling operations
This risk corresponds to an acciden-tal penetration into the reservoir during drilling operations performed by third parties (for instance, drilling a well to exploit an aquifer or to explore for hydrocarbons).
This risk is very unlikely because drilling at depths deeper than 4,000 m requires very heavy drilling equipment (drilling rig), much heavier than those typically used for common purposes such as water production for consumption. Such works would be visible even before they start.
On the other hand, for this type of drilling depth in petroleum sedimen-tary basin, the drilling operations are conducted with well-control techniques that are used to safely drill through gas layers that are much more dangerous and at elevated pressures.
Risks related to the chemical reactivity of the reservoir when exposed to CO2
The Mano dolomite reservoir rock essentially consists of dolomite (mass fraction of 93.5%) and, to a much smaller percentage, of silica SiO2, mica, muscovite, calcite, and clays such as chlorite and montmorillonite.
The injection of CO2 into the reservoir will change the composition of the gas in place by increasing the relative

134
proportion of CO2. This will change the equilibrium between phases in the reservoir pore network, namely between the gas phase (present gas mixture and injected CO2), the water phase (called irreducible water, adsorbed on the mineral surfaces) and the solid phase constituted by the minerals of the rock. The increase of the CO2 content in the gas phase will modify the water-gas equilibrium and some CO2 will go into solution in the aqueous phase, causing a slight acidification of the water: the average pH will change from 5.9 to 5.3.
The acidification of the aqueous phase and the modification of its CO2 content will alter the equilibrium between the liquid and the solid phase, that is to say, the equilibrium between water and minerals, causing partial dissolution of certain minerals and precipitation of others.
Geochemical modelling studies were used to simulate:
¬ Mineralogical changes and their consequences in terms of changes in the petrophysical properties (e.g. evolution of porosity);
¬ The fate of the injected CO2 in the reservoir, in the short, medium and long term:a. How much CO2 will remain
in the gas phase, will be dissolved in water, or will be mineralized in by precipitation of new minerals;
b. The extension of the CO2 plume in the reservoir: the presence of high pressure at the periphery of the reservoir will limit the extension of the plume to about 500 m from the injection well at the end of the injection phase.
The average reservoir characteristics are as follows:
¬ 3% porosity; ¬ Permeability less than or equal
to 1 mD; ¬ 40% water saturation.
Modelling studies coupling flow, thermodynamics and chemical reactions were performed using a mesh representation of the Mano dolomite reservoir, considering the fractured area and the matrix near and far from the well. Modelling consisted in simulating the first period of the life of the Rousse reservoir – the gas production phase – to obtain the state of the gas, water and mineral phases at the start of CO2 injection, that is to say at the end of the pressure drop and the withdrawal of gas. Reactive transport models were then used to simulate CO2 injection, with the evolution of the reservoir system, in the short, medium and long term (i.e. after stopping the injection and over thousands of years).
The Mano dolomite reservoir will only be slightly affected in the short, medium and long term by CO2 injection. The mineral compo-sition will vary very little, all three main minerals – dolomite (93.5%), silica- quartz (2.5%) and mica (0.8%) – undergoing a slight dissolution, as calcite and montmorillonite precipitate in small proportions, and as new minerals such as siderite (iron carbonate, FeCO3) and kaolinite clay (Al2Si2O5(OH)4) appear. Dissolution and precipitation will be low enough that the porous network is not affected by CO2 injection, the porosity decrea- sing only slightly from 3% to 2.99%. Given this very small variation on an already somewhat porous rock, the
risk of changes of the rock mechanical properties because of a change in its mineral skeleton is insignificant.
The injected CO2 will gradually dissolve in the aqueous phase and will mineralize into siderite (iron carbonate). Sensitivity studies on chemical kinetics showed that about 50% of the injected CO2 would miner-alize in the 2050-2150 time horizon.
Land mechanical damage induced by fracturation and / or surface elevation due to pressure effect
The injection of carbon dioxide during two years will lead to a rise in reservoir pressure. However, the final pressure will remain well below the initial reservoir pressure (485 bars).
Cap rock materials (clay and marl) have a ductile mechanical behavior and the deformations driven by the reduction in pressure during the production phase have most likely remained in reversible limits, because no movement was recorded during reservoir depletion.
Considering the risk of fracturing the cap rock, as mentioned in scenario 1 (leakage risk due to loss of integrity of the reservoir cap rock), because the pressure increase at the end of the injection period remains much lower than the initial reservoir pressure, the fracture pressure of the cap rock will never be reached, even taking into account thermal effects.

135
Carbon capture and storage . The Lacq pilot Chapter 5: Impact and risk assessment Monitoring plan
Land mechanical damage due to earthquakes
The Rousse region is located in a seismic zone referred to as “Low”. Most of the earthquakes that are listed are located close to Lacq (earthquakes induced by the Lacq field production operations). The analysis of the seismicity in the Pau / Rousse area shows that no seismicity was induced by the production of the Rousse field. The only seismic event that was recorded near the site is dated October 22nd 1851 (epicentral intensity V). 01
In general, earthquakes affect very little deep underground formations, when moving away from the epicenter. At depth, the wave propagation results in variations in stresses and elastic expansion with a too short period to allow sig-nificant movement of the rock, the gas or the water. It is the reflection of the waves on the surface that, because of large amplitudes, causes the damage that experienced with earthquakes. This is illustrated for instance, by the absence of any damage in coal mines during the earthquake of May 22nd 1960 in Chile, one of the highest intensity earthquake recorded in the world (magnitude 9.5 with approximately 3,000 deaths), where miners noted unusual noises without feeling the tremors.
In Japan, on October 23th 2004, an on-going CO2 injection operation (Iwanohara CO2 storage site located about 1,000 m deep) was exposed to an earthquake of magnitude 6.8, with an epicenter located 20 km from the injection site. The injection was immediately stopped, then resumed after extensive verifica-tions have shown a total lack of damage on both surface facilities and on the injection well (verified by measurement of temperature and pressure integrity through CBL and imaging measurements, as well as through tomography between wells), although deformations and cracks appeared on the access road of the site.
The existence for tens of millions of years of several natural gas reservoirs in the Lacq region, containing high pressure CO2 and H2S, demonstrates the robustness of underground for-mations to regional seismic activity.
Well leakage into overlying aquifers
A hydrogeological analysis of aquifers present in the environment of the injection site was conducted by the BRGM (direction of groundwater flow, location and use of samples, water quality).
This work has helped to clarify the state of knowledge on water bodies that were potentially concerned, and the constraints that they might be compelled. Within a sedimentary sequence more than 4,000 m thick, the hydrogeological analysis identi-fied three types of aquifers:
1. Aquifers that are already characte-rized and exploited for drinking water, which are located in discontin-uous sandstones and sandy reservoirs, and not found over the vertical projec-tion of the site:
¬ The alluvial aquifer of the river Gave;
¬ The aquifer located in the infra-molassic sands and the nummulitic sands.
01: Earthquake of October 22nd 1851

136
2. Potential aquifers that are not characterized nor operated in the sector, but that are suitable for thermal and geothermal usage because of the absence or very limited traces of hydrocarbons:
¬ The aquifers of the lower Eocene to Paleocene discontinuous reservoirs located between 700 and 2,000 m located over the vertical projection of the site (with limited potential);
¬ The limestone aquifer of the lower Paleocene (Lasseube formation) located around 2,100 m at the site.
3. Untapped potential reservoirs located in the sector, and unusable because of observed traces of hydrocarbons during oil exploration, that are not exactly located over the vertical projection of the site, but are present North and on the structure of Meillon:
¬ The limestone reservoir Turonian – Coniacian (Higher Mazères formation);
¬ The limestone reservoir of the Aptian (Lower Clèdes formation).
Overall, all the captive aquifers in the study area (except that of the infra-molassic sands and the nummulitic sands) contains brackish to saline waters. These high salinities likely indicate very slow turnover of water, in particular for the potential reservoirs of the Cretaceous and the sandstone formations located in the Tertiary marl.
For tertiary aquifers, the flow direction is regionally oriented along a North-South axis or South-East/North-West. But for the Cretaceous reservoirs, given the conditions of pressure, salinity, temperature and water-gas mixtures, the flow direction has not been characterized.
Aquifers from the lower Eocene to the upper Paleocene are located between 700 and 2,000 m and appear very discontinuous. This absence of large-scale hydraulic continuity necessarily limits the recharge and therefore the use of these formation waters that are classified as brackish to saline waters.The limestone aquifer of the lower Paleocene (Lasseube formation) located around 2,100 m over the vertical projection of the site has a high local and regional continuity. The water is brackish to salty (salinity ranges from 2 g/l to 40 g/l). The presence of salt and traces of oil and/or gas makes these local waters unfit for any use. It should be noted that the water quality of this aquifer improves signi- ficantly further north: water is used for irrigation as well as a thermo-min-eral resource about 40 km north of Pau where the formation outcrops.
Only two shallower aquifers (the alluvium of the Gave river, the infra-molassic sands and the nummu-litic sands) are currently exploited, in particular for the supply of drinking water to the population, about 10 kilometers to the East and North of the site.
These aquifers are not intersected by the well. Direct contamination by loss of well integrity is therefore impossible.
Potential aquifers that are not operated in the sector are penetrated by the top section of the well at depth levels ranging between 700 m and 2,000 m. CO2 leakage in these aquifers would require a subsequent loss of integrity of the tubing or the packer, then of the 7’’production casing, then of the 13-3/8’’ casing, and finally of the 13-3/8’’ casing cement sheath, at the level of these underground for-mations. However, the loss of integrity
of these components would immedi-ately translate in a pressure increase that would be detected at surface by monitoring of annular pressures.
The limestone aquifer of the lower Paleocene (Lasseube formation) located at around 2,100 m at the site contains salty to brackish waters and is unfit for any use. At the depth of this formation (2,043 m to 2,146 m), the well completion consists of two well casings (7’’ and 9’’5/8) with an annular gap (cement from 2,275 m). It is important to note that, at this depth, the aquifer pressure is greater than the pressure within the well (about 200 bars into the aquifer compared to a reservoir pressure below 70 bars at the end of injection), which makes unlikely gas flow into the aquifer.
Risk of leakage along the well up to surface
Preventive measures to reduce or eliminate the risk of damage to the integrity of the well are based on in-depth audits that are commonly performed on producing gas facilities. Their results did justify the choice of the Rousse well as an injector, the choice of the intervention program (well workover) and of the well equipment (completion). 02
In November 2006, the production was stopped to allow Schlumberger, on behalf of Total, to achieve a control operation of all well components that were exposed to the fluid produced for nearly 40 years. Logging tools were lowered into the well to control the state of corrosion of the 7’’ production casing and the 5’’ liner, together with the quality of the associated cementa-tion in the 4,443-4,727 m interval, the portion of the well located below the packer.

137
Carbon capture and storage . The Lacq pilot Chapter 5: Impact and risk assessment Monitoring plan
02: Existing well completion scheme
Control of the 5’’ casing cementation Because the depth of the gas-liquid interface was around 4,573 m, the state of the cement could not been checked above this depth (acoustic wave does not propagate in gas).
The SCMT log (Slim Cement Mapping Tool) that was used for this operation – although more difficult to run than a conventional CBL-VDL tool – shows good coupling between the casing and the formation (cement bond), and therefore a good hydraulic isolation in the interval considered.
Above 4,650m, the CBL logs acquired in 1967 indicated a possible presence of a micro-annulus between the casing and cement. The logs recorded in November 2006 do not show this feature and the cementation can be described as very good on the measured interval. The explanation lies in the fact that such a micro-annulus has a tendency to disappear over time because of creep and because of the pressure applied on the cement.
On the other hand, measurements performed on water samples that were collected downhole in March 2006 revealed that the water, below the per-forations, is not salty and acidic:
¬ Sample no. 56015 collected at 4784 m/TR pH = 4.55 Salinity = 0.78 g/l;
¬ Sample no. 56016 collected at 4572 m/TR pH = 5.1 Salinity = 0.53 g/l;
¬ Sample no. 56017 collected at 4577 m/TR pH = 5.3 Salinity = 0.51 g/l.
So there is no water upwelling from the Meillon reservoir, whose salinity is around 40 g/l, despite a difference of pressure of 120 bars between the Meillon and the Mano reservoirs. This supports the theory that the cement plug placed downhole since May 1985 has retained its sealing capacity and has not been damaged by the contact with acidic water.

138
The absence of cement deterioration at the depth of the Mano reservoir, in the section between the Mano and the Meillon reservoirs, and at the bottom of the well, indicates that during the production phase of the Mano and Meillon reservoirs, the combined presence of water and supercritical CO2 did not have a negative impact on the quality of the cementation.
The reaction of cement with CO2 is a topic of research, especially the long-term behavior of the cement in presence of water and CO2 at high- pressure and temperature. However, as noted above, the history of the well has showed a very good resistance of the cement to such an acidic environ-ment.
In the case of Rousse-1, the means for detecting pressure in the annuli, the possibility of carrying logs and the ability to intervene, allows for control of any risk that a defect in the well completion could propagate and lead to a loss of integrity of the well.
Control of the casing 7’’ cementation
The control of the 7’’ casing cemen-tation was made in 1967 during the drilling of the well. The log shows very good cementing between 4,485 m (dimension of the lowest logging measurement) and 4,000 m. The cementation is less good between 4,000 m and 3,650 m, but still decent. Above 3,650 m, the cementation appears degraded.
A control log to assess changes in the cementation should be performed during the next workover of the well.
Control liner 5 “ and the 7” casing corrosion
Concerning the liner 5’’, Schlumberger recorded a mechanical caliper PMIT log (Platform Multifinger Imaging Tool), which allows for inves-tigation of corrosion inside the liner. No internal corrosion was identified that may compromise the integrity of the casing: the measured average radius is 2.14”, in agreement with the expected inner radius of 2.138”. The outer wall of the casing has not been investigated by the PMITs.
However, the tool has identified some deposits on the inner wall of the liner, mainly around 4,683 m, that is to say, more than 200 m below the perfora-tions in the Mano reservoir. Below 4,720 m, a reduction of the liner diameter is observed, probably caused by the presence of sand.
The 7” casing located under the packers should have been similarly investigated but could not be controlled during operations in November 2006. Corrosion and cementation logging will be carried out for the 7’’ casing when resuming the well.
In conclusion, the various controls that were carried out in 2006 on the quality of the cementation and the inner corrosion of the 5’’ liner, and their comparison with the measure-ments carried out in 1967, show that these two components have not been damaged although exposed directly for nearly 40 years, and over their entire height, to the production of a mixture of acid gas and water containing CO2 and H2S.
As the 7” production casing is made of the same steel as the 5’’ liner, it is reasonable to expect that the 7’’ casing is in good condition too. The internal state of the 5” liner, of the 7” casing and the bonding with the surrounding formations through the cement sheath are considered of excellent quality, and as acceptable above and below the reservoir, for future injection of a gas containing 92% of CO2 that has been dried beforehand.
Compared to the current conditions, the injection of dry CO2 will lead to a high CO2 saturation in the area near the bottom of the well, but also to a drying of this zone, due to evaporation of the formation water into the CO2 phase, in a volume that will increase as the injection of CO2 is pursued. The risk of corrosion by carbonic acid should therefore be reduced.
Effect of an earthquake on the well
The effect of an earthquake on well integrity has been studied according to two scenarios, 1) a possible shearing of the well following the displacement of a fault crossing the well, 2) damage to the well comple-tion i.e. cement sheaths and casings.
For the first scenario, the loading required to activate a fault has been evaluated, depending on the friction angle. In the second case, it is the loading required to cause damage to the well completion that has been characterized.

139
Carbon capture and storage . The Lacq pilot Chapter 5: Impact and risk assessment Monitoring plan
To do this, the load on the fault and on the well completion components is evaluated before any earthquake. Then, the overloading required to activate the fault or damage to the component – to reach the failure criterion – is estimated. Finally, the overloading induced by the earth-quake is evaluated and compared to the overloading required to reach the failure criterion. In order to avoid de-teriorating the integrity of the well, the overloading of the earthquake must be less than or equal to the loading leading to failure.
No fault intersecting the well above the reservoir was detected during drilling in 1967. In addition, the interpretation of the 3D seismic survey conducted in 1990 did not reveal any faults possibly crossing the well. It was therefore assumed a fictitious fault in the plane of maximum stress, with zero cohesion and variable friction angle, and the state of load associated to various likely friction angles (around 20°) was evaluated all along the well. The overloading necessary to move the fault was then evaluated, all along the well.
For the second scenario, the load on well components was assessed throughout the well via the SealWell software developed by Total. The overloading required to damage the component was then calculated throughout the entire well.
The overloading induced by an earth-quake was estimated from a seismic event of Pyrenean origin. The seismic
spectrum used for the study was 2 times higher than the upper bound seismic spectrum used to determine the seismic risk of the Lacq platform, to account for the recent BRGM standard to calculate the seismic risk. Four areas were studied, all located above the packer. The first is at 2,300 m MD, the second at 3,200 m MD, the third at 3,350 m MD and the fourth at 4,200 m MD. These areas take into account the 7’’ and 9-5/8’’ casings, and the associated cements sheaths. These areas were chosen because their damage would significantly alter the integrity of the well.
Overloads induced by such an earth-quake were compared to the overloads necessary to activate a fault or break the well components. According to the findings of the study, the overload induced by an earthquake cannot cause the slippage of a fault with a friction angle of about 20, not damage a component of the well, be it a casing or cement sheath.
Risks related to a total loss of control of the well
The wellhead is the main equipment that provides isolation between the well and the surface facilities. Its design, its protection by a metal structure and the associated operating procedures are based on the experience of years of operation, for thousands of wells, by the Total group.
However, the hypothesis of an accidental degradation (even more a destruction) of the wellhead cannot
be totally eliminated. This scenario could occur, for example, because of the pull out of the wellhead caused by an air crash, even if the probability of such an event is very low. In this case, an ultimate security still exists, since the well is equipped with an isolation valve located in the well itself (and therefore inaccessible to external events), which will close in the scenario envisaged and ensure a total isolation of the well.
In the case where the wellhead is accidentally destroyed and the safety isolation valve does not work well, the gas present in the well will be emitted into the atmosphere. The local conse-quences of this scenario are discussed in detail in the next chapter.

140
CONCLUSION ON RESERVOIR- AND WELL-RELATED RISKS
SynthesisThe following table synthetizes the results of the risk analysis: Table 02
Table 02: Synthesis of reservoir- and well-related risks

141
Carbon capture and storage . The Lacq pilot Chapter 5: Impact and risk assessment Monitoring plan
Table 03: Free blowout of the well
It is clear from this table that:
¬ The structure of the reservoir and its location (sealing structure, location in an area of low seismicity, single well, pressure confinement);
¬ The injection conditions (the pressure at the end of the injection period is much lower than the initial reservoir pressure);
¬ The equipment used for con-tinuous monitoring of the reservoir behavior and to control the injection (monitoring pressure, temperature and micro-seismic monitoring);
¬ The monitoring devices used for controlling the well (pressure monitoring in the annuli, micro-seismic well recording, CO2 sensors on surface);
Are a set of conditions that make highly unlikely a dangerous event.
Moreover, if an event of this kind occurred, the injection conditions and the monitoring system would allow the Operator to detect, limit or even remove any adverse effects.
Finally, although the analysis of scenarios does not put out the need, it should be noted that the CO2 injection operation is reversible. It would consist of producing back the gas mixture in the reservoir, with the injection well transformed into a production well, and sending it back to the Lacq plant for treatment before release into the atmosphere.
However, because of the time that would be necessary to achieve such an operation, it is not a suitable option for an emergency response to a problem. However, it could be effective in controlling a dangerous event with slow kinetics.
These measures are supplemented by design options and operational procedures to prevent risks, as well as by organization security procedures in case of accidents.
Well blowout scenario
The blowout scenario corresponds to an accidental rupture of the wellhead, with the simultaneous non-closing of the sub-surface safety valve. In this case there would be a direct emission of the gas contained in the well into the atmosphere. This event will be extremely unlikely because it requires a simultaneous pull out of the wellhead and a failure of the safety valve.
The study of the consequences of this scenario was performed using the following assumptions:
1. The flow of gases depends on:
¬ The pressure and temperature in the tank; ¬ The nature of gases; ¬ The size of the tubing.
2. The nature of gases that could be emitted depends on the amount of CO2
injected, but also on the shape of the reservoir.
At Rousse, because of the characteristics of the reservoir:
¬ If the blowout occurs during the injection phase, the gas emitted will first be made of almost pure CO2, with the concentration in native gas increasing as the downhole pressure decreases. At the end of the blowout, gases may be pure original gas;
¬ If the blowout occurs long after the end of the injection phase (a calculation was performed for a blowout that would occur in 2017) the gas mixture would contain about 90% of CO2 and 10% of original gas. The concentration in original gas will further increase during the blowout.
Thus, the conditions chosen to analyze the consequences of a free well blowout are: Table 03

142
The “10% of Rousse original gas + 90% of injected CO2” scenario corresponds to a blowout that would occur at the end of the injection period or a few years after the end of the injection phase (reservoir pressure = 90 bars).
The “100% Rousse original gas” scenario corresponds to a late blowout or a blowout before injection. (Reservoir pressure is the actual pressure = 30 bars).
Both cases correspond to upper bounds events.
For this study the following conditions have been taken into account:
WeatherFour conditions were selected:
¬ B3: Stable air - wind speed = 3 m/s;
¬ F3: Very stable air - wind speed = 3 m/s;
¬ D5: Neutral air - wind speed = 5 m/s;
¬ D30: Neutral air - wind speed = 30 m/s.
Product toxicityTo estimate the effects of the toxicity of the emitted products, the following thresholds were used:
¬ H2S: ¬ 182 ppm corresponding to
the lethal effect threshold for an estimated exposure of 8 hours;
¬ 39 ppm corresponding to the irreversible effects threshold for an estimated exposure of 8 hours;
¬ 10 ppm, corresponding to the threshold to trigger the emergency response plan.
¬ CO2: ¬ 20% taken as the significant
lethal effect threshold for an exposure of 30 minutes;
¬ 10% taken as the significant lethal effect threshold for an exposure of 30 minutes;
¬ 5% taken as the irreversible effects threshold for an exposure of 30 minutes;
¬ 2%; ¬ 0.5%; ¬ 0.065%.
These values were chosen to allow estimating the evolution of the CO2 concentration as a function of distance from the emission point.
The concentration of 0.5% corresponds to the TLV-TWA 1 (USA) – the concen-tration normally accepted in these countries, in the workplace, for a daily 8 hour exposure. This value can be compared to the threshold corresponding to the threshold for activating the emergency response plan.
The threshold value that is used to prevent chronic effects, which are usually considered by labor regula-tions, is an upper bound, compared to the threshold to be chosen for a single and outstanding exposure (threshold level to trigger the emergency response plan).
Estimation of toxic effects in the two scenarios
Scenario 1: 100% original Rousse gas. 03
The raw gas contains H2S. Three areas can be distinguished:
¬ A zone of about 10 m corres- ponding to the concentration of 182 ppm (SEL);
¬ A zone of about 40 m corres- ponding to the concentration of 39 ppm (SEI);
¬ A zone of up to 120 m correspon- ding to the concentration of 10 ppm (disaster recovery).
The effects of CO2 remain in the 10m zone, therefore inside the fence of the Rousse site.
Scenario 2: 10% original Rousse gas + 90% injected CO2. 04
In this case, the three zones would have respective radius of 4 m, 6 m and 17 m. These areas are much smaller than in the previous case because the emitted gas contains only 10% of the original Rousse gas.
For CO2: ¬ The areas corresponding to
concentrations of 20% and 10% (threshold of significant lethal effects and first lethal effects for an exposure of 30 min) have a radius of a few meters. They are very close to the gas emission location and are contained in the fenced area of the Rousse site.
¬ The area corresponding to a concentration of 5% (irrever- sible effects for an exposure of 30 min) has a radius of 10 m. It is contained within the fenced area of the site Rousse.
1. TLV-TWA : Threshold Limit Value – Time Weighted Average

143
Carbon capture and storage . The Lacq pilot Chapter 5: Impact and risk assessment Monitoring plan
03: Toxic effects - 10% original gas, 90% CO2
04: Toxic effects - 10% original gas, 90% CO2
¬ The area corresponding to a concentration of 0.5% (limit for an occupational exposure of 8 hours) has a radius of about 15 m.
It appears that in both cases, the toxic effects of H2S and CO2 are spatially limited (located inside the fenced Rousse area).
Moreover, if such an event occurs, the emergency assistance would establish safety zones within much less than 8 hours. Therefore, these risks and the way they are treated are deemed acceptable.

144
05: Risk of toxicity: 100% original gas
06: Risk of toxicity: 10% original gas, 90% CO2
07: Risk UVCE (Unconfined Vapor Cloud Explosion)
Thermal effects
The heat flux threshold taken as a reference is 3 kW/m2 and corresponds to irreversible effects. For the two scenarios, the heat flux can be greater than 3 kW/m2 only for locations within 22 m from the point of emission. Adverse effects are thus limited to the fenced area of the Rousse site. 08
Overpressure effects
The threshold on pressure is set at 20 m bars, and corresponds to broken windows. For the two scenarios, pressure can be greater than 20 m bars at locations within 8 m from the point of emission (the explosion is located in the center of the flammable cloud). Such effects will always be located in the fenced area of the Rousse site. 07
Conclusion on the well blowout scenario study
In the blowout scenario, two simulta-neous events should happen:
¬ An accidental destruction of the wellhead;
¬ The non-functioning of the safety valve.
This is a very unlikely event.
In addition, the study of correspon- ding emission scenarios shows that the effects (toxicity, heat flux and pressure) will be limited to the fenced area of the Rousse site. This risk is therefore deemed acceptable.

145
Carbon capture and storage . The Lacq pilot Chapter 5: Impact and risk assessment Monitoring plan
08: Risk of burning jet
Conclusion on the assessment of risks
CO2 injection will be carried out in a depleted gas field, whose seal quality has been proven by the existence of a reservoir for millions of years.
The knowledge acquired during many years of operation in the Rousse field, completed by the recent additional characterization work (3D seismic, reservoir modelling including evaluation of geochemical and geomechanical effects) allows for qualifying the site for CO2 injection. Furthermore, injection opera-tions are performed with a very high safety margin to prevent any possibility of injection-induced mechanical damage or leakage.
The injection conditions (timing, flow rate, type of gas) help ensure that the gas plume will remain confined in the reservoir, at a pressure well below the initial pressure, with no risk of migration into the reservoir caprock. Procedures for well control and possibilities of intervention allow mitigating through correc-tive actions the risk of propagation of any defect in the completion, which could lead to a significant loss in well integrity and create a leakage pathway.
The main risk is that of a free well blowout.

146
OBJECTIVES OF THE MONITORING
The monitoring plan was designed according to the specific configura-tion of the storage site, on the basis of the Total qualification studies and the preliminary risk analysis. The moni-toring program is comprehensive and takes into account the requirements of the French Administration. Even though the risk of CO2 leakage out of the reservoir is very low due to the ge-ological configuration of the storage: 1) very deep reservoir, 2) presence of a thick and proven caprock, 3) maximal final pressure far below the initial reservoir pressure, 4) small amount of CO2 injected compared to the reservoir storage capacity, and 5) only one well intersecting the reservoir. The main objectives of the monitoring plan are to provide key information on:
¬ Site integrity: to confirm that the gas remains confined within the reservoir, that there is not leak upward out of the reservoir either through the well, the caprock, the faults;
¬ Well injectivity: to measure flow rate, injected gas composition and follow the well performance;
¬ Storage performance: to check that the observed CO2 behavior corresponds to the reservoir simulation predictions, taking into account uncertainties, and to provide further knowledge on
MONITORED PARAMETERS
Several monitoring requirements are laid down in the official au-thorizations issued by the French Administration in May 2009 and November 2011 (granting extension of the injection period by 18 months).
The following parameters are monitored:
1. CO2 stream composition, con-centration and flow (conti- nuously);
2. CO2 atmospheric concentrations at the injection well pad (conti- nuously);
3. Well annulus pressure (contin-uously);
4. Pressure and temperature along the injection well (continuously);
5. Bottom-hole reservoir pressure and temperature (continuously);
6. Reservoir and cap rock integrity (microseismic monitoring: continuously);
7. Soil gas concentration and fluxes (by campaigns organized periodi-cally);
MONITORING PLAN
5.3
the reservoir behavior, to allow for refinement of the predictive models;
¬ Environmental impacts: to check that there is no impact of the storage operations on the environment.

147
Carbon capture and storage . The Lacq pilot Chapter 5: Impact and risk assessment Monitoring plan
8. Groundwater quality (by campaigns organized periodically);9. Surface water quality (by campaigns organized periodically);
10. Biodiversity of the ecosystems (fauna and flora: annual inventory).
Two types of monitoring campaigns can be distinguished, the “official” ones required by the administration in relation with the official authorizations (see the Environment and Site rows in table 4) and those for the purpose of Research & Development, which were defined by Total and French universities (see Additional R&D row in table 4). Table 04
Year 2009 was dedicated to installing the monitoring devices and acquiring the baseline data before injection:
¬ The environmental baseline (soil gas, aquifers and ecosystems) was recorded from autumn 2008 to autumn 2009, the surveys spanning four seasons;
¬ The microseismic baseline was recorded between October 2008 and June 2009. It started just after the installation of the first microseismic array in the first of the seven shallow wells drilled.
Table 04: Yearly monitoring
09: General scheme of the injection well monitoring system

148
Years 2010, 2011, 2012 and 2013 have been devoted to performing the environmental campaign, recording all data logged by the monitoring systems and analyzing the results. The three microseismic sensors installed at the bottom of the well completion were only available from March 2011 when a workover was performed on the well to change the initial micro-seismic sensors that were damaged during the injection completion installation in 2009. Unfortunately, no baseline survey was available for this system.
The required monitoring program (including Environment and Site monitoring in table 4) will continue for three years after the end of the injection period, till March 2016.
After that, as a new permitting procedure is necessary to obtain authorization for permanent storage of the injected CO2, a long-term monitoring program will be designed if necessary, based on the technical and economic lessons learnt from the previous 75 months of monitoring.
PRESSURE AND TEMPERATURE
Well annulus pressure
The annulus pressure monitoring at the Rousse wellhead is performed with a system commonly used for production or injection well control. The pressure of the casing fluid is permanently recorded in the different annuli. Any pressure change could correspond to a leakage through the tubing or one of the casings.
Downhole pressure and temperature
The injection well was initially equipped with a fiber optic cable with two pressure and temperature sensors (3,300 and 4,400 m GL 2). At the end of 2010, two more pressure and temperature sensors were added, during the workover carried out to replace the seismic sensors that were out of order. The injector was finally equipped with four pressure and temperature downhole sensors, which were located around 1,100, 2,200, 3,300 and 4,400 m GL, i.e. 150 m above the top of the reservoir for the deepest one. 10
10: Well RSE1: notional architecture and completion
2. GL means that depth is referenced to Ground Level

149
Carbon capture and storage . The Lacq pilot Chapter 5: Impact and risk assessment Monitoring plan
MICROSEISMICITY
Introduction
Among the monitoring methods available to identify the effects of CO2 injection on the reservoir and the caprock, “microseismic surveillance” appears as an essential component of an early warning system. Indeed, injection or production of a fluid induces changes in pressure and therefore alters the effective stress within a reservoir and its surroundings, which may induce ruptures or reactivate existing faults.
The “microseismic surveillance” has appeared essential to answer a few main objectives of the monitoring program: identify effects of the stress changes induced by injection within the reservoir and on the integrity of the caprock. 12
11: Downhole pressure measurements and injection rate data, recorded from May to September 2012 12: Seismo-tectonic context (historical seismicity)
Continuous pressure and temperature monitoring is consequently performed at four locations in the wellbore. The undisturbed formation temperature profile of 2.8°C/100 m when CO2 injection does not occur has been precisely established. During injection, temperature and pressure profiles along the well, from the surface to the top reservoir, can be calculated. These data are used for the pressure transient analyses, reservoir model history matching, and for calibrating the pressure losses model. Pressure data set recorded from May to September 2012 is displayed on figure 11 as an illustration. 11
As stated earlier, the microseismic monitoring began in 2008 with the baseline survey. It was anticipated that CO2 injection in the Rousse field could alter the pore pressure and stress fields enough to potentially reactivate fractures and faults. Although the magnitudes of such events are usually small, they can be detected by a proper sensor network deployed at, or close to, the surface. When the seismic energy released by microseismic events is detected by the sensors, event location algorithms are used to indicate the location in the rock volume that has undergone brittle failure.
Seismic energy can also be generated by natural seismicity, known to be occurring in the area, where faults of the regional North Pyrenean front, between the Iberic and Eurasian plates, are still seismically active.

150
Microseismic monitoring is viewed as an early warning system, where large events in unexpected locations are used to indicate a risk of leakage. The sensitivity of the monitoring network should be high enough to detect events considered as minor, not harmful. Ideally, such monitoring should record little or no seismicity, suggesting that the CO2 plume induces no significant rock failure within the reservoir and the overburden.
In 2009, a permanent microseismic network consisting of seven sub- surface tool-strings of four levels each had been installed in shallow wells about 200 m deep. Six of the shallow wells are located on a 2 km radius circle around the injector, and the seventh one is located at the RSE-1 well pad. An additional seismometer located on the surface, close to one of the shallow wells, is used to detect and record larger magnitude natural earthquakes.
For research purposes, an array of three optical sensors has been installed along an optical fiber cable in the injection well RSE-1 slightly above the top of the Mano reservoir.
By tracking minor events and analyzing their behavior through space and time, Total hoped to identify the regions of weak failures, and thereby stress changes, and assess whether CO2 injection presents a risk to the security of storage and of near by installations.
Information is continuously available, online and in real time.
The following sections describe how the near-surface monitoring network has been designed. The analysis of the microseismic events that were recorded is discussed in chapter 6 (page 160).
EXPECTATIONS FROM MICROSEISMIC MONITORING
At Rousse, general expectations in the design of the microseismic network were defined at two levels:
1. Primary objective: mitigation of the unexpected CO2 leakage. Identification of any mechani-cal effects that could affect the integrity of the storage during and after the injection period, with two aspects:
¬ Detection of seal failure and CO2 migration to shallower formations (through small faults), i.e. detection of mi-cro-ruptures that could result from a pressure increase within the reservoir;
¬ Alarm: record natural seis-micity.
Micro-fractures could be located within the reservoir, the seal, and along faults bounding the reservoir. Due to the limited pressure increase, it is expected that induced microseis-micity, if any, would be of negative magnitude.
2. Secondary objective (research)More sensitive monitoring of the injection to access detailed in-formation on reservoir behavior (reservoir characterization):
¬ Detection of microseismic events around the CO2 injection wells;
¬ Estimation of pressure perturbation and fluid front migration.
When establishing a microseismic monitoring system, the first, and highly important, step is to establish proper surveillance criteria, and translate them into required sensor sensitivity and area of interest for
each objective (detection – alarm – reservoir characterization). An issue is whether such criteria should be based on energy at source (magnitude) and/or at sensor (felt effects, intensity).
The second step is to define anomalous behavior using threshold criteria, based upon knowledge gained from monitoring reservoir stimulation projects, and on the expected accuracy of the magnitude estimates.
The next step is to design the proper network to allow the characterization of the system behavior.
The fourth and last step is to deploy the network in the field.
STIMULATION INDUCED MICROSEISMICITY - INDUCED AND TRIGGERED MICROSEISMICITY
The Stimulation Induced Micro-seismicity (SIM) basically concerns small events associated with low event magnitude (less than 2).
The SIM can be defined based on the following criteria:
Microseismicity & Microseismic events
¬ Brittle deformation – Discrete event – Rupture (or fracture) phenomena;
¬ Anthropogenic induced phenomenon (triggered by man-made operations);
¬ Local scale studies (1 to 100 km²).

151
Carbon capture and storage . The Lacq pilot Chapter 5: Impact and risk assessment Monitoring plan
Microseismic Monitoring
¬ Passive method (continuous recording); ¬ Downhole or surface seismic recording (Geophone, Accelerometer,
Fiber Optics).
Microseismic Study
¬ Phenomenological study (from fact to meaning); ¬ Spatio-temporal distribution of discrete “failure events” along with
operations data, geological and geomechanical models.
The “rupture phenomena”, including earthquakes, are observed from micro-scopic to macroscopic scale and can be described using Earthquake Seismology scaling laws. The Microseismic Domain, as understood by the industry, can be introduced using a basic unified scaling law covering all sizes of ruptures from laboratory scale (10-3 m) to great earthquakes (> 105 m). The following table provides some general overview of the magnitudes (equivalent to Richter scale) associated with the “Microseismic Domain” as understood by the industry. The magnitudes are provided along with a range of rupture size and associated shear displacement estimates. 13
13: Classification of seismic events (modfied after Bohnhoff, 2010)A seismic “energy” release associated to a rupture phenomenon is named an Earthquake, a Microseismic Event or an Acoustic Emission (AE), depending on domain and rupture scale
When addressing SIM monitoring, two types of stimulation-induced mi-croseismic events must be considered, each with a specific energy level:
1. A by-product of a stimulation/injection process (fracture char-acterization domain)
Induced microseismic events can result from the fracturing process created by injection of a fluid. These events are small (typically with negative magnitudes) and require very sensitive monitoring equipment to be detected. These events are used to guide the fracturing process and a microseismic survey is considered a means to understand fracture growth.
2. An unintended result on mappable faults at close distances (reservoir surveil-lance & geohazard domains)
Triggered microseismic or seismic events may result from injected fluids reaching existing geological faults. These types of events can arise in any process involving the injection of pressurized liquids underground. These lead to more significant magnitudes, potentially felt by humans at the ground surface. These unintended events can be mitigated through site selection, injection design and permanent monitoring.
The regulatory authorities consider surveillance criteria for induced seismicity based upon theory and case studies. Some examples of induced seismicity, for both “by-prod-uct events” and “events triggered on mappable faults”, are presented in the following table along with earthquakes associated to the tectonic context.

152
Table 05: Level of potential induced seismicity associated to project operations, evaluated from case studies
* Since 1993, seven generally accepted criteria must be met before fault reactivation is considered to have an anthropogenic origin (Davis and Frohlich, 1993). These are:1. Are these events the first known earthquakes of this character in the region?2. Is there a clear correlation between injection and seismicity?3. Are epicenters near wells (within 5 km)?4. Do some earthquakes occur at or near injection depths?5. If not, are there known geologic structures that may channel flow to sites of earthquakes?6. Are changes in fluid pressures at well bottoms sufficient to encourage seismicity?7. Are changes in fluid pressures at hypocentral distances sufficient to encourage seismicity?
Table 06: Example of traffic-light system discussed in the literature following the Blackpool event (Hydraulic Fracturing). Thresholds are applicable for seismicity occurring within stimula-tion perimeter.
As one of the potential concerns associated with CO2 Storage (CCS) is inducing seismicity, the seismic risk must be assessed and the induced seismicity needs to be monitored. Seismicity can basically be addressed at three levels:
1. Seismic Risk Assessment (Preliminary studies)Seismic Risk Assessment (RA) accounts for regional stresses and for natural seismicity. It is based on:
¬ The identification of critically stressed faults; ¬ The avoidance of fluid injection into active faults and faults in brittle
rock.
2. Mitigation and Monitoring Measures (Traffic light moni-toring system when relevant) Table 06Surveillance relies on a traffic light monitoring system:
¬ Green. No risk: Injection can proceed as planned;
¬ Amber. Alertness: Be prepared to alter plans. Injection should proceed with caution, possibly at reduced rates. Monitoring is intensified;
¬ Red. Warning: Injection must be immediately suspended.
3. Injection characterization and control (CO2 storage perfor-mance) Surveillance through microseis-micity monitoring also aims at characterizing CO2 storage performance through:
¬ The mapping of the CO2 distri-bution through the detection of stress/pressure perturbation;
¬ The integration of seismi- city in the history-matching process for a periodical review of the CO2 injection dynamic models.
As for the Lacq CCS pilot project, the injection would be stopped if an internal event with a magnitude above 3 is detected. To fulfill this objective, all internal events with a magnitude larger than 1 should be detected and located with an accuracy of +/- 250 m.

153
Carbon capture and storage . The Lacq pilot Chapter 5: Impact and risk assessment Monitoring plan
MONITORING PLAN
Microseismic monitoring design – Traffic-light criteria
The Lacq pilot project aims at demonstrating the technical feasibility and relia-bility of an integrated onshore CCS project, with a limited volume of CO2 being injected. According to geomechanical models, the fracturing risks are insignificant. Nevertheless, as the Rousse well is located in the vicinity of a seismically active region, induced seismicity has to be evaluated and factored into the overall risk-benefit calculations. Due to the specific context, a state-of-the-art approach to Microseismic Feasibility and Monitoring Design needed to be followed:
1. Screening & Evaluation. Review of the process, context and objectives: ¬ Identify the most probable location and type of seismicity; ¬ Characterize both “by-product” and unintended seismicity; ¬ Define preliminary threshold / surveillance criteria.
2. Modelling and design phase: ¬ Waveform complexity, sensitivity & location accuracy; ¬ Preliminary network ”Basic Design”; ¬ Advanced modelling including focal mechanism (not available at the time
of this study).
3. Front End Engineering Design (FEED) & Monitoring protocol: ¬ Noise survey, and scouting survey; ¬ Network design; ¬ Monitoring protocol & Traffic light system (if applicable).
During the Screening and Evaluation phase, the main objectives were:
Objective 1 – Risk management (High Priority)Monitor unexpected triggered seismicity linked with possible fluid migration and readjustment of known (mappable) faults è Consider the main features associated to depleted/faulted fields è Near-surface network local scale (range: 1.5 km - sensitivity: M < 0.0).
Objective 2 – Societal awareness (Seismotectonic context) Monitor natural regional seismicity è Address possible interaction between CO2 injection and local tectonics and incidence on natural regional seismicity. Address Earthquake location, possible mis-interpretation and emotional reaction: the network needs to provide better sensitivity and location accuracy than Seismological National Networks è At least one seismometer (range: 30 km- sensitivity: M < 1.5).
Objective 3 – R&DMonitor expected induced micro-seismicity linked with microscale ruptures in the vicinity of injection è inform on reservoir behavior with improved microseismic characteriza-tion è Deploy downhole array in the injection well (range: 500 m - sensitiv-ity: M -2.0). Observations will serve to:
¬ Analyze reservoir behavior for research purposes on injectivity;
¬ Improve on-site monitoring methods;
¬ Prepare future larger scale long term storage projects;
¬ Confirm surface network performs as expected (validation from learning phase);
¬ Validate “Fiber Optic” monitor-ing technologies.

154
Based on the objectives listed above, the first two being mandatory, three scales/ranges have been considered to define a three-component monitoring system. The quantitative targets, for a microseismic network designed to fulfill these objectives are set more severely than those requested by regulations. The alarm system is based on static instantaneous measurements (magnitude and location) as well as on dynamic criteria (temporal evolution, b-value 3). The three identified target zones and event types are sorted in the following table, from smallest to largest coverage requirement: Table 07
3. The b-value of the Gutenberg-Richter mag-nitude-frequency relationship determines the relative number of earthquakes of different magnitudes
If a microseismic event, or an earth-quake, with magnitude greater than 3 (MW = 5 is the regional threshold required by regulatory framework) occurs within the legal seismo-tectonic “Rousse perimeter”, the injection will be stopped. This corresponds to the regional earthquake threshold accepted for the project.
Table 07: Monitoring objectives, target zones and event types

155
Carbon capture and storage . The Lacq pilot Chapter 5: Impact and risk assessment Monitoring plan
Feasibility & Design study - Network specifications
An extensive Feasibility and Design study was performed to provide the specifica-tions for the field deployment of a microseismic monitoring network capable of fulfilling the surveillance criteria defined in terms of coverage, detection sensi-tivity and location uncertainty, as described in the previous section. The optimal network characteristics have been submitted to two independent experts (from BRGM and Mines-ParisTech) to oversee the scientific aspects, to verify that moni-toring needs are addressed, and to review the monitoring protocols. The protocol and design study were finally submitted to the Regional Environment and Planning Department (DREAL) for approval.
During the study, the performance of various sensor deployments (geometry, location, number of sensors) have been analyzed – with the help of full waveform modelling – in terms of:
1. Detection and location sensitivities (assuming a specific processing scheme);2. Effective coverage (no shadow zones where detection is not possible);3. Waveform complexity (capability to detect seismic phases unambiguously);4. Location accuracy and uncertainty.
In addition, the final design considered an additional criterion of “Reliability”, implying some redun-dancy, which is a requirement for a monitoring along the project lifetime.
The full seismic waveform modelling that was carried out showed simple waveforms for near-surface sensors, as well as for the sensors to be deployed in the injector well.
The study indicated that a good coverage and a location within specifications could be provided by a subsurface network alone, after velocity calibration: such a network fully complies for requirements of hazard monitoring and risk man-agement. Because of the proximity of Pau and its intense traffic activity, it was decided to bury the sensors to get away from a high ambient noise level and thus achieve a better sensi-tivity.
Given the theoretical detection sensitivity, microseismic events located in the caprock and the overburden with a magnitude greater to -1.6 can be detected by the subsurface network (figure 14a). Downhole array enables the characterization of “fracturing type” microseismic events, with mag-nitudes between -2 and -3 (figure 14b). The value of the complementa-ry downhole array, located within injection well RSE-1 and installed for research objectives, has been assessed in combination with the master network (i.e. hybrid array). 14
Estimations of sensitivities and accu-racies are based upon hypotheses, especially on noise levels. In the data analysis, actual noise levels were accounted for to assess the network performance.14: Detection magnitude sensitivity
cross-section (West-East) (a) Master network sensitivity; (b) Hybrid network sensitivity.
(a)
(b)

156
Three objectives, three scales: a three-component monitoring system
Description of the monitoring system
The results from the Feasibility & Design study unambiguously established that a microseismic monitoring approach is relevant: sensitivity and coverage can be managed, phase identification is not an issue, and location with a calibrated velocity model can be accurate enough. As a result of having defined three ob-jectives as described above, the proposed network is hybrid, with three distinct components. The deployment geometry is chosen for optimal coverage.
The master network aims at achieving risk management and societal awareness objectives. It consists in seven microseismic triaxial-sensor Shallow-Buried Arrays (SBA’s) and one surface seismometer, to record natural seismicity. The master network allows for safe unbiased surveillance. The additional research network consists of three optical sensors installed downhole slightly above the top of the Mano reservoir.
The basic network comprises six subsurface tool strings in dedicated shallow wells located at 200 m depth in an irregular hexagonal geometry (radius of about 2 km around the injection well RSE-1), and one close to RSE-1 wellhead, roughly at its center (figure 15 and 16). Each string is composed of four EMCI triaxis SM4-10Hz velocimeters (Bandwidth: 10-1,000 Hz – Sensitivity: 28 V/m/s), located between 130 m and 200 m depth. Such a string deployment allows for consistent infor-mation, redundancy and offers the opportunity for advanced array processing. The strings have been set up at a sufficient depth to get away from some surface noises.
From measurements in a nearby borehole, it has been established that the deepest receiver should be sitting close to the base of the superficial geological layer (“molasse”).
Each tool string is connected to an acquisition station on the wellhead, which allows real-time data transfer via ADSL to an Intelligent System in the contractor’s office. This system allows the control of each station, with a real-time Internet warning message in case of dysfunction, and the transfer of seismograms extracted among continuous data recording when specific criteria are fulfilled.
Being in a seismo-tectonic context, a broadband surface seismome-ter (Noemax 20 s Velocimeter from Agecodagis based on 4.5 Hz geophones – Bandwidth: 0.05-50 Hz – Sensitivity: 78.9 V/m/s) comes in addition to the basic network to form the master network. It is located next to one of the shallow wells.
15: 7 subsurface arrays with 4 3-C sensors in shallow wells: 6 wells on a 2 km radius circle around the injection well, and 1 well at the injection well pad
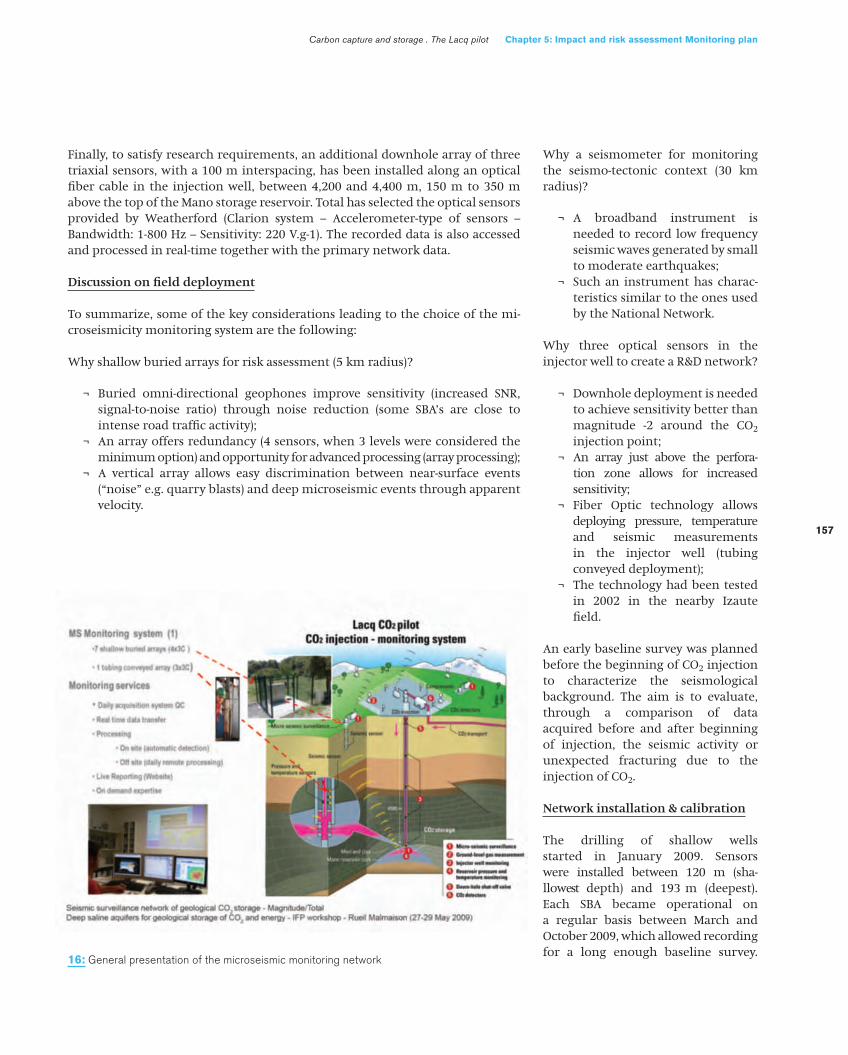
157
Carbon capture and storage . The Lacq pilot Chapter 5: Impact and risk assessment Monitoring plan
16: General presentation of the microseismic monitoring network
Finally, to satisfy research requirements, an additional downhole array of three triaxial sensors, with a 100 m interspacing, has been installed along an optical fiber cable in the injection well, between 4,200 and 4,400 m, 150 m to 350 m above the top of the Mano storage reservoir. Total has selected the optical sensors provided by Weatherford (Clarion system – Accelerometer-type of sensors – Bandwidth: 1-800 Hz – Sensitivity: 220 V.g-1). The recorded data is also accessed and processed in real-time together with the primary network data.
Discussion on field deployment
To summarize, some of the key considerations leading to the choice of the mi-croseismicity monitoring system are the following:
Why shallow buried arrays for risk assessment (5 km radius)?
¬ Buried omni-directional geophones improve sensitivity (increased SNR, signal-to-noise ratio) through noise reduction (some SBA’s are close to intense road traffic activity);
¬ An array offers redundancy (4 sensors, when 3 levels were considered the minimum option) and opportunity for advanced processing (array processing);
¬ A vertical array allows easy discrimination between near-surface events (“noise” e.g. quarry blasts) and deep microseismic events through apparent velocity.
Why a seismometer for monitoring the seismo-tectonic context (30 km radius)?
¬ A broadband instrument is needed to record low frequency seismic waves generated by small to moderate earthquakes;
¬ Such an instrument has charac-teristics similar to the ones used by the National Network.
Why three optical sensors in the injector well to create a R&D network?
¬ Downhole deployment is needed to achieve sensitivity better than magnitude -2 around the CO2 injection point;
¬ An array just above the perfora-tion zone allows for increased sensitivity;
¬ Fiber Optic technology allows deploying pressure, temperature and seismic measurements in the injector well (tubing conveyed deployment);
¬ The technology had been tested in 2002 in the nearby Izaute field.
An early baseline survey was planned before the beginning of CO2 injection to characterize the seismological background. The aim is to evaluate, through a comparison of data acquired before and after beginning of injection, the seismic activity or unexpected fracturing due to the injection of CO2.
Network installation & calibration
The drilling of shallow wells started in January 2009. Sensors were installed between 120 m (sha- llowest depth) and 193 m (deepest). Each SBA became operational on a regular basis between March and October 2009, which allowed recording for a long enough baseline survey.
158
The surface seismometer was installed and started recording with the first SBA. It has been moved to a quieter location since.
Surface shots were fired in December 2009 and June 2011. This calibration survey has been realized around each antenna in order to orientate the triaxial sensors. It confirmed that the geophones were installed with one component vertical, and allowed to calculate true orientations of both horizontal components were calculated.
The Clarion antenna was installed a first time in June 2009. However, it could not transmit any signal. The loss of signal from the seismic array was deemed non-recoverable. So another antenna had to be rein-stalled and became operational in March 2011 allowing detection of microseismic events with magnitudes smaller than -2.1. The orientation (of optical sensors) and the calibration survey (of the 3D P-wave velocity model) using vibrators was performed in June 2011, with sweeps at different positions around each antenna and the injection well RSE-1.
Apart from some very short periods where some components of the system failed due to various reasons (e.g. storms, hard disk, the recording has been continuous starting from March 2009.
Data processing
Transferred data are automatically sorted out using cross-correlation clustering. Selected events are auto-matically located with a migration technique. A real-time Internet mes-sage is transmitted half an hour after detection of events reaching alarm criteria.
With calibrated velocity models, the estimated uncertainties on the location of events detected and located by the near-surface array are lower than 150 m horizontally and 400 m vertically.
Results and their analysis of results are further discussed in chapter 6.
ENVIRONMENTAL MONITORING
In addition to the operational mon-itoring program, environmental monitoring programs have been launched for site surveillance (CO2 leakage and impact monitoring). A few of these programs are part of the SENTINELLE research project, which is supported by the French Research Agency, ANR.
Soil gas concentration and fluxes
The soil gas monitoring consists in measuring the CO2 and CH4 concen-trations one meter below the ground surface, and CO2 and CH4 fluxes at the soil-atmosphere interface, at 35 different locations around the injection site. The gas fluxes are monitored by the accumulation chamber method, using external recirculation, which is intermediate between static and dynamic principles.
Fauna / Flora
The biodiversity of the ecosystems around the Rousse injection site is checked every year. An annual inventory is drawn up at 33 places around the injection location for the flora of representative ecosystems and at 50 places around the injection location for several amphibian and
insect species. So far, no change has been recorded, showing there is no leakage of CO2 from the reservoir.
Surface water
The surface water monitoring consists of checking every six months (in spring and in autumn) two standardized bio-indicators (French Standardized Diatom Index – IBD, and French Standardized Benthic Invertebrate Index – IBGN) plus the water chemistry and mineral content parameters (pH, water conductivity, carbonates and bicarbonates con-centrations) at three locations of the Arribeu brook that drains the Rousse area. Two other locations on two other brooks are used as distant references.
Groundwater
Four perched aquifers above the deep storage reservoir are monitored. Four parameters (pH, water conductivity, carbonates and bicarbonates concen-trations) are analyzed half-yearly at four natural springs in the vicinity of the injection site. The resulting indicators are compared to the baseline reference data from the four surveys performed in 2009 (spring, summer, autumn and winter) before the injection period.
Atmosphere
Permanent catalytic CO2, CH4 and H2S sensors are placed around the injection wellhead on the Rousse injection pad to detect any abnormal concentration of these gases that might indicate a leakage. CO2 sensors were installed specifically for moni-toring such an injection site.

159
Carbon capture and storage . The Lacq pilot Chapter 5: Impact and risk assessment Monitoring plan
Surveillance of the CO2’s evolution after injection is crucial. The aim of this passive phase is to gather all the data necessary to demonstrate that the injected CO2 will remain permanently and safely confined within the deep geological layers.”FRENCH MINISTRY FOR ECOLOGY, SUSTAINABLE DEVELOPMENT AND ENERGY, Lionel Perrette, Advisor for CO2 capture and storage technologies
“

160
chapter 6
CO2 STORAGE PERFOR-MANCE
authors
C. Maisons (Magnitude)X. Payre (Total)C. Prinet (Total)S. Thibeau (Total)P. Bachaud (IFPEN)N. Maurand (IFPEN)J. Hy-Billiot (Total)M. Lescanne (Total)G. Mouronval (Total)

161
Carbon capture and storage . The Lacq pilot Chapter 6: CO2 Storage Performance
1. Fracturing the reservoir rock during CO2 injection is forbidden in the US regulation (EPA)
Injectivity is mainly controlled through downhole pressure measure-ments. Pressure data analysis is the scope of the first section, in which the reservoir model, history matching process and the injectivity index are also briefly discussed. Four fall-off sequences of pressure data were analyzed (through derivative analysis) that confirm the skin and the perme-ability-thickness values derived from the original production data.
Microseismicity monitoring can serve various purposes: it provides infor-mation to help control the injection pressure so as not to fracture the formation during CO2 injection 1. Also, monitoring of microseismicity in the storage complex permits an ongoing assessment of the integrity of the seals, such as cap rock and any bounding faults that may be present. The results of microseismicity monitoring in the context of the Rousse project are extensively presented in section 2. A near-surface network and a downhole geophone array were installed in 2011 to monitor microseismicity, respectively, as part of the risk management plan and with a proof-of-concept research objective. The networks have been continuously detecting microseis-micity, and events have been located using automated location algorithms.
THIS CHAPTER DISCUSSES ASPECTS OF RESERVOIR PERFORMANCE IN RELATION TO INJECTIVITY AND CONTAINMENT CHARACTERISTICS.
A few hundred microseismic events have been located with the downhole array and a dozen with the subsurface array over 5 years of monitoring. Most events appear to be located in the reservoir; there is no clear indication for events occurring in the overbur-den, which can be interpreted that little or no stress is transfered into the overburden, or of no fluid migration occurring from the reservoir to the overburden as inferred from geomechanical and reactive transport modelling.
Finally, the efficiency of trapping mechanisms over the long term is discussed in section 3. These processes are evaluated through long-term reactive transport modelling, ac-counting for CO2 displacement, dissolution, trapping in residual phase and mineralization. In the case of the Rousse reservoir, CO2 tends to flow deeper into the reservoir as it is heavier than the initial gas in place. It is forecasted that pressure will stabilize around 120 bars after 100 years of relaxation, a value much lower than the original reservoir pressure (481 bars at a 4,232 m depth).
Geochemical effects are limited; simulations showing that the decrease of pH due to dissolution of CO2 in water (creation of carbonic acid) will almost compensate the increase of brine pH that was the consequence of gas production. Mineralization will also be limited and will mainly be dolomite precipitation.

162
01: Final notional reservoir model for pressure and pressure derivative data history-match
PRODUCTIVITY INDEX
The objective of this study is to build a notional reservoir model that fits both the pressure derivatives monitored throughout the production period – for K*Hu (permeability thickness product) and skin evaluation and near wellbore area major geological events – and pressure decrease during the 36 years of depletion in order to estimate the residual gas in place.
Figure 1 displays a horizontal view of the notional model. It consists of three zones (different colors on the figure), an assigned porosity and permeability value per zone, and a transmissivity reduction between neighboring zones (representing potential faults). 01
Derivatives clearly show that there is only a small volume of gas at the vicinity of the RSE-1 well (zone 1). It is assumed that the gas comes to the well from zone 2 separated from the first one by a permeability barrier (figure 1). The extension and the permeability of this barrier are history-matching parameters. Parameters of zone 1 are derived primarily from the depletion of the initial production period (from 1972 to 1986). Zone 2 (yellow panel) is a transition area. It allows explaining pressure lower decrease and stabilization from 1997.
WELL INJECTIVITY
6.1

163
Carbon capture and storage . The Lacq pilot Chapter 6: CO2 Storage Performance
03: Pressure evolution during the injection period02: Well completion during the injection period
INJECTIVITY INDEX
This study analyses pressure data recorded during the CO2 injection period. The objectives are to:
¬ Review the fall-off pressure data acquisitions in RSE-1 recorded during 2011 and 2012;
¬ Conduct a fall-off derivative interpretation; ¬ And compare the near wellbore reservoir characteristics estimated from
either production or injection data.
The configuration of the reservoir model is the same as used for production data interpretation. CO2 PVT data have been used to model the injection.
During the injection period four pressure and temperature sensors are available located at different depths in the well, in addition to the wellhead pressure. A comparison has been done between all sensors, and the one located the closest to the perforations (from 4,540 m to 4,566 m) is taken as the reference (NGS8142C sensor, located at 4,395 m) (Lescanne, et al. s.d.) (Prinet, et al. 2011). 02
The four fall-off sequences selected because their duration was long enough to perform a derivative analysis are from November 2011, January 2012, March 2012 and June 2012. 03
A third zone (red panel) is also defined in order to match the last depletion period: 1997-2008. Reservoir pressure in 2008 is clearly linked to the perme-ability of zone 3.
SaphirTM software is used for this study. The history-matching of the derivatives is good and confirm the drainage areas encountered around the well. Volumes for the three areas are:
¬ Zone 1 (well area) Initial gas in place of 0.10 GSm3;
¬ Zone 2 Initial gas in place of 0.281 GSm3;
¬ Zone 3 Initial gas in place of 0.78 GSm3.
The total gas volume is 1.16 GSm3. Volume has a direct impact on the average pressure calculated at the historical end of production, here 84 bars. The model used offers lower permeabilities for zones 2 and 3 than for zone 1. These lower permeabili-ties better reproduces the increase in pressure that was recorded.
Some of the parameters used in the model are: K*Hu is equal to 825 mD.m; Skin is -4; and reservoir height is 120 m. The first panel permeability is estimated to be 6.9 mD, the second panel permeability 6.87/22 is 0.3 mD, and the permeability of the distant panel is 6.87/505 is 0.01 mD.

164
04: Fall-off data in RSE-1 : gas potential as a function of time
The derivative plots of all the fall-off sequences are difficult to interpret without the use of a data smoothing method, although the degree of smoothing must be optimized to avoid a distortion of the fall-off curve.
The diagnostic in terms of skin and permeability thickness is performed with PIETM software using a PVT formulation for pure CO2. Results are consistent with the reference interpretation performed on production data,and indicate a skin value of -4.2 and a k.h level of 825 mD.m, although uncertainties do remain due to the shape of the derivative and the PVT formulation. Fall-off data can be supe- rimposed which suggest that there is no degradation of the reservoir characteristics during the injection period (figure 4). 04
CONCLUSION
Although uncertainties remain, the interpretation of the four fall-off sequences during the CO2 injection period shows that:
¬ The skin and the permeability thickness at the CO2 injection well can be estimated and are consistent with the reference interpretation conducted when the well was a natural gas producer;
¬ There is no change in near wellbore reservoir characteristics or skin throughout the entire CO2 injection period.
These results are in line with the context of the Rousse gas field where: ¬ Gas is injected into gas; ¬ There is no active aquifer; ¬ The near wellbore area has been dried during the production period
(Thibeau, et al. 2012).
This means that no decrease of the injectivity index due to salt precipita-tion (salting out) is expected during the injection period.
As an added note, geochemistry simulations also performed around this scenario indicate that no porosity change in the reservoir should result from the CO2 injection (Chiquet, et al. 2013). Thus, geochemical simula-tions support the conclusion reached from the pressure simulations that no observable change in wellbore reservoir characteristics occurred during CO2 injection.

165
Carbon capture and storage . The Lacq pilot Chapter 6: CO2 Storage Performance
MICROSEISMICITY MONITORING
6.2
INTRODUCTION
CO2 injection started in early 2010, once all official authorizations had been received. At this time, the master microseismic network, based on seven microseismic sensor arrays buried in shallow wells and one surface seis-mometer, was wholly operational and tested. The first data were recorded in March 2009 and the deployment was fully completed in October 2009. This allowed for an observation period (baseline survey) of about nine months. The downhole optical array was unfortunately out of order at that time (refer to chapter 5) but was later replaced after a workover. From March 2011, the downhole array collected information on microseis-mic events within the reservoir in the vicinity of the injection point.
Magnitude, a Baker-Hughes – CGG Veritas company based in France, has been acting as the main contractor for data acquisition, microseismic network maintenance, and data pro-cessing. The interpretation of the data was performed by Total. The signal acquisition and processing procedures allowed online access to continuous collection of seismic information. Thus any microseismic event induced by injection and identified as a safety risk to the injection operation can be detected very rapidly, and should any anomalous behavior within the reservoir or caprock of the storage site be detected, an appropriate miti-gation action can be rapidly launched.
NETWORK PERFORMANCE
The network sensor and array design (described more fully in chapter 5, section 3) is performing mainly to specification as predicted during the feasibility study. The effective Shallow Buried Array (SBA) network “location sensitivity”, as of mid-2013 in a 2.5 km radius and down to 6 km depth, is about magnitude -1.1, whereas the predicted detection sensitivity was to be better than -1.6 (refer to Chapter 5 section 4.4). This is in line with a ratio of about 4 between Signal- to-Noise Ratio (SNR) detection threshold and SNR required for location. The downhole array effective location sensitivity, within a radius of 500 m around the antenna, is better than magnitude -2.4, with a predicted detection sensitivity of better than -2.8 (refer to chapter 5, section 4.4). The noise induced by injection did not compromise the performances of the downhole array.
The system is performing quite well: in the volume of interest (5 km x 5 km x 5 km) any event with a magnitude greater than -0.7 (corresponding roughly to a 0.2 mm displacement along a 5 m length fracture) is detected and located by the surface network with less than 250 m uncertainty.
The combination of the seismometer and the SBA master network allowed detecting and locating smaller earthquakes than the National Network (sensitivity better than 1.5 within a 30 km radius volume).
The following section presents the passive seismic network and discusses some of the microseismic monitoring results. The design and installation of the network have been presented in chapter 5.

166
05: Microseismicity vs. Monitoring network deployment and CO2 injection phases
The downhole array allows detecting microseismic events with magnitude higher than -2 within 500 m from the wellbore.
For analysis the monitoring period has been divided into four sub-periods as illustrated in figure 5: 05
0. Baseline (before injection start)1. First Injection Phases (2010)2. Main Injection Phases (2011-2013)3. Post CO2 Injection
Baseline survey (2009 before injection)
The so-called baseline period spans from March 2009 to January 2010. The monitoring network used during this period is the master network based on the Shallow Buried Arrays (SBA’s) and the surface seismometer. These nine months of seismic monitoring confirmed the predicted external detection sen-sitivity of the network, with more than 200 natural earthquakes detected within a 30 km radius around the injected well. All events detected by the National Seismological Networks have been recorded, with 25% additional events having magnitude greater than 1 for the Rousse network. The computed magnitudes are compared and confirmed by the seismometer.
Two local seismic events, with magni-tudes between -0.6 and 0.0, have also been detected and located at a depth around 6,000 m. This seismicity could be located on deep natural structures potentially related to deeper gas field exploitation a few kilometers north of Rousse.
First injection phase (2010)
The first injection phase covers a one-year period with about 110 days of injection followed by 4 months of stand-by for work-over and downhole network installation. During this period, the master network kept recording natural seismicity and some events located in a deep natural structure:
¬ 3 local seismic events, with magnitude between -0.7 and -0.3, have been located in deep struc-tures and are thus considered unrelated to injection at Rousse;
¬ 3 “induced” events, with magni-tudes ranging from -1.1 to -0.3, were also detected just after the end of this first injection phase. The induced events are located at around 4,900 m depth and 200 m south of the injection well and can be associated to the Mano reservoir.
During this period the subsurface antenna noise level was quite stable and the sensitivity of all sensors and channels of SBA’s was relatively constant.

167
Carbon capture and storage . The Lacq pilot Chapter 6: CO2 Storage Performance
2. An induced event is an anthropogenic micro-seismic event: it does not result from natural seismicity but seems to be linked with the CO2 injection within the reservoir.
Main injection phase (March 2011 – March 2013)
The main injection phase covers a two-year period with about 360 days of CO2 injection at an average rate of 90 t/day, and 110 days at an average rate of 65 t/day.
The master monitoring network kept recording natural seismicity and events located in a deep natural structure providing a relatively cons- tant “event location” sensitivity of magnitude -1.1:
¬ 27 local seismic events, with magnitude ranging from -1.0 to 1.8, have been located on the deep structures within the perimeter of interest;
¬ 11 “induced” events 2 having magnitudes ranging from -1.1 to -0.4 were also detected.
The downhole recording started a month before this main injection phase and detected and located small magnitude events. Despite some changes in detection sensitivity we can consider a constant “event location” sensitivity of about -2.0 over the whole period:
¬ about 1,700 events have been detected by the downhole network among which 445 were located;
¬ the 390 events with a magnitude greater than -2.0 were consi- dered for the event distribution analysis and correlation with injection parameters.
Post injection phase (March 2013 – June 2013)
Both the master network and the downhole network were recording during this post injection phase. The sensitivity remained the same as for the injection phase.
The events recorded by the master network were:
¬ 3 local seismic events, with magnitude ranging -0.7 to -0.3, located on the deep structures within the perimeter of interest;
¬ no “induced” events detected by the master network during this period.
The events recorded by the downhole network were:
¬ 475 events; 89 with a magnitude higher than -2. 0 were located. During this period the micro-seismicity rate remained similar to the one observed during the last months of injection phase.
First conclusion (as per end of June 2013)
As expected, the seismicity detected by the subsurface network corresponds mainly to natural seismic activity linked to north Pyrenees faults. In addition, the experiment clearly estab-lished the proof-of-concept of seismic risk management using a near-surface monitoring network, in a suburban environment, for gas injection in a reservoir about 5 km deep. The ad-ditional downhole array indicated without any ambiguity, that in the specific context of the Lacq CCS pilot project, injection had no impact on caprock integrity, in full agreement with the geomechanical studies.
RISK ASSESSMENT & SITE INTEGRITY (LOCAL EVENTS DETECTED BY MASTER NETWORK)
Risk Assessment is performed by the master network comprising seven SBA’s (4 x 3C @ 10 Hz) having an aperture of 2 km radius around the injection well (refer to Chapter 5 section 4.4 for more details). The alertness threshold that was considered a priori is magnitude 1.0.
The monitoring design produced the ability to identify microseismic activity (i.e. very low magnitude events), with local events being considered those within a 5 km radius zone centered on the RSE-1 injection well.

168
Observations
¬ Activity on mappable faults 3 surrounding the injection perimeter: 06 ¬ 35 events were detected and associated to fault type seismicity located
on mappable faults surrounding the injection. Seismicity was detected before, during and after injection;
¬ The b-value (fractal dimension) of this type of seismicity cannot be estimated due to the limited number of events.
¬ Activity a priori related to CO2 injection: ¬ Only 2 events with magnitude higher than -0.5 have been located in
the vicinity of the injection well by the surface equipment; ¬ 14 events with magnitude higher than -1.0 have been detected
with the master network.
The characteristics of the events recorded within a 5 km radius zone (“local events”), as seen on records from shallow buried arrays, are the following:
¬ The waves are upgoing (i.e. the wavefront is propagating upwards at the recording location), which is easily distinguishable on vertical arrays;
¬ The direct P-wave and S-wave are respectively detected on the vertical axis and the horizontal axis;
¬ Signal is broadband with frequencies below 100 Hz.
3. A mappable fault is a fault that has been identified through surface seismic.
06: Local seismicity detected by the master network (events colored by depth)
These local events detected by the master network display different features on the seismograms recorded with the downhole array:
¬ Waves are more or less trave- lling horizontally, as most of them are generally located at a depth similar to the downhole array depth and far distance (few kilometers): they exhibit very high apparent velocity;
¬ They have rather similar amplitudes for their vertical component and for at least one of their horizontal components;
¬ Signal frequency is high, much higher than 200 Hz, sometimes exceeding the recording bandwidth.

169
Carbon capture and storage . The Lacq pilot Chapter 6: CO2 Storage Performance
07: Stacked seismograms of event magnitude -1.1 recorded on 18/09/2010 16 :24 :48 and focal mechanism
08: Regional earthquakes detected by the master network
The source focal mechanism of the largest internal microseismic event was computed using the method of nonlinear inversion of “P-SV-SH” amplitude (Godano 2009). Because of the low energy, the signal of the four sensors on each antenna had to be stacked. The resulting focal mechanism seems to indicate a reversed fault origin for the microseismic source; the caprock of Mano’s reservoir is known to be associated with a major reversed fault. 07
REGIONAL SEISMICITY
As expected the combination of a surface seismometer and shallow buried arrays allowed detecting and locating smaller earthquakes than possible with the National Network (sensitivity better than 1.5 in 30 km radius). The natural seismicity detected by subsurface network is likely associated with North Pyrenean tectonic activity. 08

170
MICROSEISMICITY IN THE VICINITY OF INJECTION POINT (R&D)
Downhole sensors (Optical Accelerometers)
The downhole array allows detecting most microseismic events with magnitude higher than -2.0 that occur in the reservoir and a couple of hundred meters above, within a distance of 500 m from the wellbore. Approximately 2,200 microseismic events originating from, or near, the reservoir were detected by the downhole array, and about a quarter of them could be located. This activity occurred over more than 3 years and is indicative of a quite low intensity of induced microseismic activity. 09
Key observations are:
¬ The majority of events are close to the injection point within the reservoir, with trends following mappable fault directions. Events located in the caprock, if any, are not likely an indication of fluid migration or pore pressure change, but rather stress transfer through the rock matrix;
¬ The majority of events have magnitude lower than -1.0; ¬ The highest magnitude (relatively large uncertainty) is -0.3; ¬ The magnitude frequency distribution has a b-value close to -2 and
a magnitude of completeness of about -1.6. 10
09: Events located by both the master network (blue, purple and green dots) and the downhole network (red dots). Dash amber circles correspond to 750 m and 1,500 m radius from injection well
10: b-value of events located by the downhole network at the vicinity of injection well
The maximum extension of the seismic cloud with events larger than -2.0 is about 500 m (figure 9).
Microseismic results - Multidisciplinary analysis
For analysis purposes the monitoring period has been further subdivided into the following sub-periods: 11
0 - Baseline (before injection start)1 - Injection Phase 1:
1.1 - Injection tests1.2 - Injection at 77 t/day on average1.3 - Stand by (work-over and re-installation of downhole array)
2 - Injection Phase 2:2.1 - Injection at 90 t/day on average2.2 - Injection at 65 t/day on average
3 - Post CO2 injection

171
Carbon capture and storage . The Lacq pilot Chapter 6: CO2 Storage Performance
11: Time distribution of seismicity (cumulative number and cumulative seismic moment) versus CO2 injection (PCO2 and cumulative volume of CO2)
12: Cumulative injected volume of CO2 vs. Cumulative seismic moment
In order to properly analyze the time distribution of any seismicity possibly induced by CO2 injection, only the located events with a magnitude greater than -2 have been considered. Both the cumulative number of events and the cumulative seismic moment seem to correlate with the injection trends described by the downhole pressure and the cumulative volume of CO2. The rate of seismicity clearly follows the average rate of injection. However during injection Phase 2, the relation between the cumulativevolume injected and the cumulativeenergy released (cumulative moment)does not look as simple as describedby the linear relationship of the McGarr model. It should be noted that seismicity does not stop after injection and that continued moni-toring should better characterize the post injection phase. 12

172
CONCLUSION AND LESSONS LEARNT
The multifocal approach is perfectly suited to achieve the technical objectives defined for the micro- seismic component of the CO2 injection monitoring. The three-scale moni-toring network complies with the requested objectives, and allows recording natural seismicity, seismicity related to context (depleted gas fields) and microseismic events characterizing mechanical disturbances induced by CO2 injection.
The expected sensitivity provided by the master network inside the Rousse Field is validated through location of some microseismic events with magnitude higher than -1.0 (at 5 km depth). No events corresponding to any of the a priori considered “Alertness threshold” have been detected. Injection of CO2 in the Rousse Field had no impact on the caprock integrity, in full agreement with the geomechanical studies.
The R&D network (single array deployed in the injection well) also provided the required sensitivity.
Passive microseismic monitoring offers an efficient way for hazard monitoring. The master network based on SBA’s provides enough infor-mation to address public concerns.
A key question is: “Should CCS operations always/sometimes/never employ microseismic monitoring, and how should this decision be made?” Ideally, in a well chosen and operated storage site, such monitoring would record little seismicity, sug-gesting that the CO2 plume effectively moves “aseismically” through the reservoir. This seems to be the case at Rousse. Whereas the sensitivity of the monitoring system at Rousse was sufficient to detect and locate very low magnitude microseisimic events associated with injection, any such events produced no detectable impact to containment and little risk to safe operation of the project. Most seismicity detected by the subsur-face network corresponds to natural seismic activity linked to faults in the North Pyrenees – X kilometers to the south. In this context, a minimum of 3 seismometers are recommended for an independent network aimed at providing a better estimate of large event magnitudes.

173
Carbon capture and storage . The Lacq pilot Chapter 6: CO2 Storage Performance
MODELLING THE LONG TERM FATE OF CO2 IN THE ROUSSE RESERVOIR
6.3
OBJECTIVES AND WORK-FLOW OF THE STUDY
The objectives of this study are to model the chemical impacts of the injected CO2 in the Rousse Field, specifically on long term behavior, i.e. up to 1,000 years after the termina-tion of the CO2 injection.
The first step consists of mineralogical characterization of the Rousse reservoir rock based on core samples. These analyses identify the main mineral phases present in the reservoir and allow a realistic mineral assemblage to be represented in the reactive transport model.
The second step consists in performing 0D numerical simulations in order to identify the geochemical reactions resulting from CO2 injection.
The final step consists in coupling the geochemical reactions within a reservoir flow model using the IFPEN CooresTM software.
REVISITING ROUSSE MINERALOGY
The mineralogical and petrophysical study performed by Total have been presented in chapter 3. Additional laboratory analyses were performed at IFPEN to characterize Rousse mineralogy.
Mineralogical and compositional analyses were performed using an X-ray microprobe and a Scanning Electron Microscope coupled with Energy Dispersive Spectroscopy (SEM-EDS). Mineral characterization was performed on reservoir rock samples before their alteration by CO2. Elemental maps of Si, Al, Mg, Ca, Fe, Na, K, and S were acquired using an X-ray microprobe. A statistical method based on pixel composition and addi-tional SEM-EDS analyses allowed the identification of the main minerals and their composition. The principal mineral in the Rousse reservoir is dolomite of which two types were identified: one forms the rock matrix, the other one seals reservoir fractures. The fracture sealing dolomite also contains a trace fraction of calcite that was impossible to isolate on the microprobe maps due to its very small grain size. In smaller proportions, the Rousse reservoir also contains quartz and two types of clays, paragonite and sudoite.

174
Traces of pyrite were also found, but in too small quantities to be considered in the numerical model. The resulting mineral assemblage for the simulations thus contains dolomite, quartz, calcite, paragonite and sudoite. During the simula-tion kaolinite was allowed to precipitate as a secondary mineral. 13
This analysis, while consistent with the main results presented in chapter 3, also highlights that different interpretations are possible when it comes to phases present in very small amounts. Muscovite and Montmorillonite minerals are not considered in the overall mineral assemblage for this particular study whereas Paragonite and Sudoite (chlorite) are included.
13: Map of the main minerals as constructed from microprobe elementary analysis. The phase mixing is an experimental artifact due to beam size.
BATCH CHEMICAL SIMULATION
The first step of the chemical evaluation consists in computing the composition of the reservoir brine before CO2 injection. An equilibrium calculation is thus performed considering the following components in the system:
¬ The brine (1.2 molal NaCl); ¬ The mineral assemblage: dolomite (94.8%), quartz (2.7%), calcite (0.5%),
paragonite (1.9%) and sudoite (0.1%); ¬ The initial temperature of the reservoir: 150°C; ¬ A partial pressure of CO2 of 1.1 bars, corresponding to a gas pressure
of 50 bars and a CO2 fraction of 5%.
The geochemical software used for these simulations was Arxim, a multi-purpose database explorer and geochemical reactor module developed by the Ecole des Mines de Saint-Etienne and IFPEN.
Once the system is equilibrated, a dynamic calculation is performed by buffering the system with increased CO2 fugacity at injection pressure, and allowing the precipitation of kaolinite. CO2 fugacity values in the depleted state of the field and during the injection phase increase with pressure increase from 1.1 to 34.3 bars. 14
The simulation indicates that injection of CO2 leads to a rapid decrease of the pH value from 5.1 to 4.3. This reduction in pH is accompa-nied by a slight dissolution of sudoite and calcite, and a slight precipitation of paragonite and dolomite. The com-bination of these phenomena leads to a small net increase in porosity. After about 300 years, sudoite is completely dissolved, and calcite is partially dissolved. The elements Mg, Si, Al, Ca and C are released by these dissolutions, and then are involved in precipitating kaolinite and in lesser proportions, dolomite. A steep increase in pH accompanies these precipitation processes. As a result porosity decreases slightly; thus, simulation indicates CO2 injection has an overall negligible effect on porosity in the Rousse Field. A mass balance on the quantity of dissolved and precipitated minerals containing carbon was carried out and shows that part of the CO2 injected is trapped in mineral form as dolomite within this geochemical system.

175
Carbon capture and storage . The Lacq pilot Chapter 6: CO2 Storage Performance
14: Evolution of pH, porosity and minerals volume fraction during and after CO2 injection. pH and dolomite volume fraction are on the right axis
15: Detailed reservoir model after conversion into CooresTM software – Initial porosity by layers (%)
3D COUPLED FLUID FLOW AND COUPLED RESERVOIR SIMULATIONS
The second step consists of modelling these reactive pathways directly into the pressure-saturation flow model of the Rousse reservoir. The input reservoir flow model was provided by Total and is described in chapter 3.
In order to couple the reservoir flow model and the geochemical impact of the CO2 injection, the Total model was converted into CooresTM software, a simulator developed by IFPEN. As described previously, the thermody-namic description of 18 components was used, and only CO2 was con-sidered soluble in the water phase. The fluid injected during the injection period is CO2 (92%) with impurities (0.3% N2 - 3.7% Ar - 4% O2). It should be noticed that the current version of the simulator does not allow the vapori-zation of water, and thus the drying potential around the well could not be simulated. 15
Even though approximately 50,000 t of CO2 were finally injected in the Rousse reservoir, the modelling study has investigated the impact of injecting 100,000 t of CO2 (with the composition mentioned above).
The reservoir model is considered to be closed (the boundary conditions are zero flow on all sides), and the fluid production causes a reservoir depressurization. Given the low transmissibility of the faults we can observe at the end of the production period a strong pressure difference between areas closely connected to the wells (west zones, where the mean pressure is about 50 bars) and remote areas (east zones, where the mean pressure is about 160 bars).
This first step allows identifying the major reactive pathways (mineral reactions expected to occur as a consequence of CO2 injection). These reactive pathways are studied further in a full 3D reservoir model, which accounts not only for CO2 injection but also for the impact of the gas reduction and rapid pressure decrease prior to the CO2 injection.

176
The injection of CO2 causes a pressure increase in near-well regions of up to 100 bars, whereas distant areas are not affected. Post-injection, pressure continues to increase in near-well regions, and decreases in remote areas until a stabilized pressure of 120 bars is reached everywhere after 100 years.
Graphs in figure 16 illustrate the spatial and time evolution of pH, supercritical CO2 saturation, as well as variations of sudoite and kaolinite volume fraction. As noted in the 0D description of this model, the pressure drop of the reservoir due to the gas production increased the pH from 5.5 to 6.5. The physical model of CO2 dissolution takes as hypothesis an instantaneous dissolution of CO2 in water. During the injection phase, the injected CO2 flows mainly in the west zones inducing a pH drop in these zones. A minimum value of 4.5 is observed and leads to partial dissolution of sudoite and calcite (figure 16f ). On the very long term (more than 5,000 years), CO2 reaches the north and east areas.
Due to the slow kinetics of kaolinite precipitation, this mineral appears only after 200 years and mainly in the lower parts of the reservoir. Indeed, as CO2 is a relatively heavy component compared to other hydrocarbon components, post-injection it flows down by gravity effect. Precipitation of kaolinite decreases the concentra-tion of elements Al and Si in these areas that causes, locally, a complete dissolution of sudoite. These pheno- mena lead only to a very slight change of porosity. 16
16: Spatial evolution of supercritical CO2 saturation (Y-CO2), pH, volume fraction of sudoite and kaolinite before production (a), at the end of production (b), at the end of CO2 injection (c), after 1,000 years (d) and after 10,000 years (e). Figure (f) shows varia-tions of pH, porosity and minerals volume fraction in the injection cell. pH and dolomite volume fraction are read on the right axis.

177
Carbon capture and storage . The Lacq pilot Chapter 6: CO2 Storage Performance
Figure 16f illustrates the time evolution of the different minerals in the injection cell, where a very similar behavior to the one of the 0D geochemical model Arxim described previously is observed. The main difference comes from the inversion of the behavior of sudoite and kaolinite after 5,000 years: kaolinite starts to dissolve as sudoite precipi-tates. Indeed, as CO2 diffuses in the reservoir, brine pH tends to return to its equilibrium value before injection. With increasing pH, kaolinite becomes under-saturated and therefore dissolves in favor of sudoite.
CONCLUSIONS OF THE MODELLING OF THE LONG TERM FATE OF CO2
The impact of injecting 100,000 t over three years was modelled correspon-ding to twice the CO2 volume finally injected in Rousse.
The numerical study has indicated that the injected CO2 will tend to move deeper into the reservoir as it is denser than initial gas in place.
Pressure in the highly depleted field after production was about 50 bars and the near-well pressure increased to about 100 bars at the end of injection and then stabilized around 120 bars after 100 years of relaxation. The pressure increase due to CO2 injection remains below the initial reservoir pressure (481 bars at a 4,232 m depth).
The simulations indicated that geochemically induced changes in porosity are limited. They also showed that the change in pH from CO2 injection almost balances the increase of brine pH due to the gas produc-tion. Finally, precipitation of dolomite sequesters some of the injected CO2 through mineral trapping.
These results are consistent with other studies on the same topic (Chiquet, et al. 2013), (Girard, et al. 2012).

178
CO2 Capture and Storage is a highly topical issue, the more so in the current context of energy transition. For the decades to come, there is in effect no industrial alternative for keeping atmospheric CO2 concentrations within the limits mentioned in international agreements. ADEME supports the idea of a European research platform in order to anticipate and consider Capture-Storage
“

179
Carbon capture and storage . The Lacq pilot Chapter 6: CO2 Storage Performance
as an asset for territorial development. In the future, sites that can offer CO2 storage will have a good head start.”FRENCH ENVIRONMENT AND ENERGY MANAGEMENT AGENCY (ADEME), Daniel Clément, Deputy Director for Research

180
ENVIRON-MENTAL MONITOR-ING AND MODE-LLING
chapter 7
authors
N Labat (Total)M. Lescanne (Total) J. Hy-Billiot (Total)P. de Donato (UL)M. Cosson (Biotope) T. Luzzato (Biotope) P. Legay (Biotope)F. Mora (Biotope)C. Pichon (Biotope) J. Cordier (Biotope)M. Dellong (Artelia)F. Mathieu (Artelia)

181
Carbon capture and storage . The Lacq pilot Chapter 7: Environmental monitoring and modelling (surveillance)
In the reservoir where the gas is being injected, in the overlying geological layers (particularly aquifers) right up to the surface, and in the biosphere and atmosphere, our living environ-ments. It also includes monitoring flora and fauna species for impact of any potential leaks. As a preamble, we are attempting to address the question “How can the safety of the CCS industry be guaranteed?”, which was answered at the common ADEME-IFP-BRGM press conference, held in Paris on October 2, 2007: “The management of the safety risks related to geological storage is a priority issue. The aim is to ensure the safety of CCS operations over long periods of time, and the monitoring of storage sites is one of the key solutions for doing so.”
Based on national and international feedback from CCS projects (Weyburn, Canada – Frio, Texas, USA – In Salah, Algeria – Sleipner, Norway – Otway, Australia) and from projects related to natural analogs (Latera, Italy – Montmiral, France – Ste Marguerite, France – McElmo Dome, Colorado US – Milhàlyi, Hungary – Florina, Greece), it is necessary to obtain a spatial andtemporal view – on an injection or storage site – of the gas transfer phenomena taking place in the geosphere, biosphere and atmosphere compartments.
Against this backdrop, the main objec-tives of geochemical environmental monitoring are:
¬ Develop, test, optimize and validate the different types of technology or technology com-binations specifically designed
ENVIRONMENTAL MONITORING FIRST AND FOREMOST MEANS FOLLOWING THE TREND IN CO2 CONCENTRATION/FLUXES OVER TIME:
to monitorthe safety of the CCS operations and manage poten-tialimpacts on the surrounding ecosystems. These metrological challenges increase with depth and are particularly significant in reservoirs below 2,500 m.
¬ In the reservoir: check that CO2 concentration levels evolve in line with modelled predictions, and calibrate such models over time so that predictive tools are as reliable as possible (combined with acquisition of hydrodynam-ic parameters, P and T, K).
¬ In the layers above the reservoir: monitor the natural geoche- mical background to detect any abnormal variation that might be the consequence of a leak, so as to limit and manage any environmental impacts.
¬ At the surface: set up a sur-veillance network with alert thresholds defined in relation to natural CO2 fluxes-concentration levels and their variability.
All these environmental monitor-ing actions are defined in European Directive 2011/92/EU which deter-mines the Environmental Impact Assessment (EIA) procedures for all CCS (Carbon Capture and Storage) projects. In this environmental mon-itoring approach, geochemical meas-urement grids need to be appropri-ate to site-specific geological context, based on characterization of the reservoir, storage complex, overlying strata and regional setting. Note the following points in relation to this site-specific approach:
¬ In the reservoir, geochemical monitoring should be carried out at a point likely to be reached by the CO2 plume (accounting for the distance from the injection point, reservoir geometry and estimated hydrodynamic char-acteristics). At this location, evolution of CO2 concentration levels may be used to calibrate and update the reservoir model.
¬ Above the reservoir, geochem-ical monitoring points should be located to account for struc-tural features as characterized by previous geophysical inves-tigations. Due to the sensitivity of monitoring instruments, in-stallation in aquifers – porous water-filled formations in which the CO2 would spread in the event of a leak toward the surface – is an efficient means of rapidly detecting a possible leak.
This chapter concentrates on environ-mental monitoring of groundwater, surface water, soil, surface and atmos-pheric gases. It also includes moni-toring of fauna and flora species for CO2 leak impact detection, but does not deal with reservoir monitoring, which is described in the previous chapter. For soil and surface (atmos-pheric) monitoring, results presented in this chapter are largely taken from the SENTINELLE project (ANR-07-PCO2-007-08) and from analytical actions undertaken by Total.

182
02: Monitoring system in the mini-well : A) Completion, B) Gas circulation module, C) Infrared and Raman sensor part (UL)
01: Geochemical monitoring system in place in the SENTINELLE well (UL)
METEOROLOGICAL APPROACH
The SENTINELLE well was drilled to a depth of 85 m, around 20 m away from the Rousse injection well. It is a tubed well with a screened portion enabling gaseous exchange with the geological formation and has been used to investi-gate a shallow aquifer situated in the Puddingstone (molasse) formed during the Miocene. 01
The piezometric level of the Puddingstone water table initially stabilized at 46.8 m below surface and subsequently fluctuated by around 2 m due to seasonal effects. The following monitoring systems were deployed and optimized in order to obtain reliable measurements over the long term.
In the liquid phase:
¬ A permanent piezometric sensor measures fluctuations in the groundwater level;
¬ An Idronaut sensor measures physico-chemical parameters: pH, Eh, conductivity, temperature, dissolved oxygen;
¬ A Raman liquid probe is connected by optical fibre to a Raman spectro- meter installed at surface. This probe serves to measure both ionic phases (CO 32-, SO 42-…) and dissolved gases (CO2, N2, O2…).
SOIL AND SURFACE GASES
7.1
Throughout Total’s Lacq pilot injection project, environmental monitoring of soil and surface gases (soil-atmosphere interface) was conducted in two specific wells close to the Rousse injection well (SENTINELLE well, -85 m, and Mini well, -3.9m) and was based on a matrix of 35 measurement points (surface and soil) distributed according to soil pedology over an area of 35 km2 around the Rousse injection site (CO2 pilot, Lacq/Rousse, France).

183
Carbon capture and storage . The Lacq pilot Chapter 7: Environmental monitoring and modelling (surveillance)
03: Complementary module for measuring gas from the SENTINELLE well (INERIS). The gas samples were taken at 40 m depth
04: Map showing the location of monitoring points (BRGM-INERIS)
Table 01: Systems for measuring soil gas
Type Depth (m) Parameter Gas
Flux chamber (INERIS) 0 Flux CO2 and CH4
Barasol’s probe (BRGM) -1 Concentration 222Rn
GCMS (IFPEN) -1 Concentration CO2, N2, O2, CH4, H2, and isotopie H2S, 13CO2, C18O2, 13CH4
Specific sensors -1 Concentration CO2, O2, CH4, 4He, 222Rn(Infrared, mass spectrometer, scintillationcounter) (BRGM)
Mass spectrometer -1 Isotopie 13CO2(BRGM)
In the gas phase:
¬ A continuous gas sampling system is connected to a station for measuring CO2, CH4 and O2 by means of specific sensors;
¬ A Raman gas probe is connected by optical fibre to a Raman spec-trometer installed at surface. This probe serves to measure gases present (CO2, N2, O2…);
¬ In the mini well (3.9 m), casing was unnecessary due to the relatively shallow depth (3.4 m) and structure of the soil (70-80% quartz, 10-20% illite, 1% kaolinite, 1% goethite and hematite, 1% anatase, no organic matter). Results were compiled on a geochemical platform of continuous in-situ measurements for the following 7 parameters:
¬ CO2 concentration in the well; ¬ CO2 concentration in the;
atmosphere; ¬ Well temperature; ¬ Atmospheric temperature; ¬ Pressure in the well; ¬ Atmospheric pressure; ¬ Gas flow-rate;
¬ Gas measurements were taken by specific infrared and Raman sensors. The platform’s global
architecture is presented in figure 2. Mathematical algorithms specifically developed in the laboratory (Cailteau, et al. 2011) (Cailteau, et al. 2011) were used to transform the infrared signal (IIR) into quantitative concentration data (CCO2). The compatibility between the infrared and Raman sensors was also optimized in the laboratory (Taquet, et al. 2013). 02
A complementary module was also added to the platform. The module is directly connected to the SENTINELLE well so that gas can be sampled at depth and brought to the surface to analyze certain gas concentrations (O2, CO2, CH4) and radon volumetric activity. 03 Finally, figure 4 presents the measurement grid put in place on the Rousse site, and table 1 compiles the different types of monitoring deployed. 04, Table 01

184
05: Circulation chamber flux measurement device (INERIS)
06: Comparative trend in the gas phase of the SENTINELLE well between the CO2 log (top) and the gas 13C isotopic signature (bottom). (INERIS)
A specific method called CARE (Accu-mulation and External Recirculation Chamber), developed and patented by INERIS, was used to measure the soil gas fluxes of CO2 and CH4. Gas fluxes from the soil to the atmosphere over a surface area of 0.25 m2 (Savanne, et al. 1997), (Pokryszka, et al. 2010) can be measured directly and with great accuracy. 05
RESULTS
Based on the monitoring results, a large geochemical database was built comprising gas measurements for an injection site taken over several seasonal cycles and covering injection and post-injection periods. This database provides information on the gas flux (CO2, CH4) and concentration levels (CO2, H2O, N2, 222Rn, CH4, H2S, O2, 4He).
Figure 6 represents the data log of CO2 concentration levels and the evolution of the gas isotopic signature in the SENTINELLE well. 06
The dynamics in the variation of CO2 concentration levels in the SENTINELLE well alternate due to degassing of the water table and atmospheric recharge:
¬ In summer: the concentration of gaseous CO2 increased on contact with the water table, whereas the isotopic signature of the gas decreased in the direction of the pole of signatures expected for a gaseous phase in equilib-rium with the water table (between -23‰ and -28‰). The gaseous phase in contact with the water table appears to gain in dissolved CO2.
¬ In winter: the CO2 concentration levels of the well gas column were almost at equilibrium with those in the atmosphere. The same was true for the carbon isotope signature of CO2 in the gas present in the well, which tended toward a characteristic value of atmospheric CO2.
Variations in the volumetric activity of radon were also observed but could not be considered significant, inasmuch as they were below the sensitivity threshold generally admitted for the type of sensor used (~100 Bq.m-3). These variations represented an intrinsic response of the sensor to changes in atmospheric temper-ature. Figure 7 conceptualizes these results in the shape of a phenomenologi-cal model of the variations in CO2 concentration in the subsurface (SENTINELLE well) in relation to the isotopic signature of the gas and radon activity. 07

185
Carbon capture and storage . The Lacq pilot Chapter 7: Environmental monitoring and modelling (surveillance)
08: Continuous evolution of CO2 concentrations in the soil (Mini well: -3.4 m) over more than one seasonal cycle (April 2010 to Dec. 2011). Measurements were taken on the Rousse pad, 15 m away from the CO2 injection well (Total CCS pilot, Lacq/Rousse, France) (UL)
Figure 8 and figure 9 show a considerable natural variability, at both a local and large scale. In the soil (figure 8), the variability curve of the CO2 concentra-tions is complex and alternates between zones where concentrations are high (max. 50,000 ppm) and zones where they are much lower (min. 10,000 ppm). Matching these variations against the seasonal cycle does not reveal any obvious logical trend. In terms of CO2 flux at the soil-atmosphere interface over an area of 35 km2 around the injection well, variations of more than four times the standard deviation can be observed. 08, 09 (page 186)
Unlike CO2 concentrations in the soil, a clear trend can be seen following the climate of each season of the year. Emissions are effectively much higher in the summer than in the winter, with an average ratio of 1:3 to 1:5 respectively,
which varies mainly according to the biological context of the sites studied. Compared with the influence of other parameters that characterize the monitored sites (geology, pedology, biological context, etc.), seasonal variations are largely dominant. In addition, no significant methane fluxes were observed on any of the sites, as the values were always below 0.05 cm3 m-2 min-1.
The environmental monitoring showed that more than a seasonal cycle was necessary to establish a soil gas benchmark (Status 0) instead of one year, as had been initially recom-mended. The natural and anthropic variability affecting the gas transfer phenomena in the different compart-ments considered could thus be ap-prehended more accurately. However, despite the variations, the metrologi-cal and technical possibilities of iden-tifying, qualifying and quantifying regularities in the gaseous exchanges at the surface of an injection site of several km2 were demonstrated in practice, and benchmark values were defined.
Finally, it appeared that the biologi-cal signature of the soil CO2 (δ13CCO2 close to -24‰) was affected by the dynamics of the exchange with the atmosphere in the vicinity of the soil-atmosphere interface, reflected in CO2 concentrations of less than 0.2% with a significant increase in δ13CCO2 values by around -12‰. Whatever the time period considered, only surface phenomena (soil or atmosphere) affected soil dynamics. This obser-vation was corroborated by helium measurements, which gave no indica-tion of any deeper-originating gases, as most measurements come within a restricted range of 5.24 ± 0.1 ppm.
07: Phenomenological model of the variations of CO2 concentrations in the subsurface (SENTINELLE well, -80 m) (INERIS, BRGM, IFPEN)

186
09: Evolution in CO2 fluxes before and after the CO2 injection phases. Data come from the SENTINELLE measurement campaigns and from other specific ones requested separately by Total (INERIS)
10: Simulation of the envelope showing the evolution of CO2 concentration in the soil (Mini well, -3.4 m, Total CCS pilot, Rousse site, France). Toward a predictive tool (UL). Blue: experimental curve, Gray: predictive model
With N: piezometric level of the SENTINELLE well
PREDICTIVE MODELLING OF CO2 CONCENTRATIONS IN SOIL
The most important variations (up to +/- 2,500 ppm, low frequency) in CO2 concentrations in the soil at -3.9 m (Mini well, figure 8) were studied by means of a statistical approach known as a Principal Component Analysis (PCA).
The analysis revealed that these main variations generally anti-correlate with the variations in piezometric level measured in the Sentinelle well. This statistical approach helped define a variability envelope representing the fluctuations in soil CO2 concen-trations on the Rousse site near the injection well. The upper and lower battery limits of the envelope are defined based on the two following linear regressions: 10
¬ Upper battery limit: [CO2] drilling
=-19911xN – 871474; ¬ Lower battery limit: [CO2] drilling
=-19181xN – 849246.
The calculated mean relative error is close to 15% whereas the absolute variability of soil CO2 concentration is higher than 450%. We therefore have a model that is able to calculate, with a 15% error, the evolution of CO2 con-centration in the soil, simply based on the measurement of SENTINELLE’s piezometric level. Drawing on addi-tional elements, which factor in the hydrogeological complexity of the Jurançon plateau’s karst geological environment, the main variations in CO2 concentration (up to +/- 2,500 ppm, low frequency) can be explained by CO2 dissolution and salting out processes that depend on the geometry of the perched water table located at 6 m depth.
Gas transfer processes at the surface are specific to the site under con-sideration and cannot be readily transposed from one site to another. Finally, all the measurements showed that the CO2 and CH4 con-centrations and fluxes followed their natural evolution in the geosphere, biosphere and atmosphere through-out the injection phases. This obser-vation shows that the Total group is proficient in injection operations.

187
Carbon capture and storage . The Lacq pilot Chapter 7: Environmental monitoring and modelling (surveillance)
FAUNA AND FLORA
7.2
Operating permit no. 09/IC/122 sets out environmental monitoring requirements for the area surrounding the Rousse geological CO2 storage site, concerning groundwater, surface waters, fauna, flora and soil gases. This section describes the investigations, results and conclusions of the environmental monitoring campaigns of habitats, flora and fauna conducted over a five-year period in the Jurançon foothills.
The environmental monitoring protocol draws on a baseline survey conducted in 2008/2009 to determine:
¬ The choice and location of natural habitat and flora monitoring stations; ¬ The choice and location of fauna monitoring stations for insects: Rhopalocera
(monarch butterflies), Odonata (dragonflies) and Orthoptera, and for amphibians (frogs, toads and salamanders);
¬ The baseline status of habitats, flora and fauna (insects and amphibians). In addition, indicative data were also collected on reptiles (lizards, snakes and tortoises).
The results of the five-year monitoring campaign are presented below.
11: View across the Jurançon foothills of the Pyrenees. © T. Luzzato - Biotope

188
HABITATS AND VEGETATION
The vegetation in a given area reflects the ecological conditions in which it develops, in other words the site conditions (topography, soil humidity, physical and chemical properties of the substrate, exposure to sunlight, etc.), and the uses of the site (for grazing, cultivation, silviculture, etc.). Vegetation is therefore a good integrator of ecological dynamics and is one of the biological parame-ters used for environmental monitoring of the Rousse site. The surveys covered the full rage of natural habitats on the site, including wet and dry meadows, vineyard edges, hillside grassland and woodlands. To this end, 33 permanent monitoring plots were established. On each one, two vegetation counts were performed at the same period each year for five consecutive years. The monito- ring data shows that plant communities are stable overall, particularly in climax forest habitats. Only the vegetation in the abandoned wet meadows was found to be gradually evolving through spontaneous dynamics into wetland vegetation with tall grasses.
Some of the most outstanding types of vegetation are found in habitats of European interest. Examples are hayfields along streams or at the foot of hillsides with characteristic and diversified plant associations including species that are becoming scarce, such as biannual flax (Linum usitatissimum subsp. angustifolium) or French oat-grass (Gaudinia fragilis).
Grasses growing on neutral soils are found on extensively grazed hillsides with a carbonated molasse substrate. Among these grasses are a few characteristic orchid species, including the pyramidal orchid (Anacamptis pyramidalis), the woodcock orchid (Ophrys scolopax), the tongue orchid (Serapias lingua) and the spider orchid
Ophrys exaltata subsp. Marzuola, which is both rare and protected. These hillside habitats are fairly close to the Pyrenees and therefore also harbor montane species such as the Pyrenean germander (Teucrium pyrenaicum).
The common junipers (Juniperus communis) found on some grasslands reflect their previous use as pastures. Once grazing is abandoned, these grasslands gradually evolve into moorland habitats with heath (Erica vagans) and moor grasses (Molinia). The climax, or ultimate, stage of the vegetation dynamics originating with these grasslands is reflected in the stands of downy oak (Quercus pubescens) and pedunculate oak (Quercus robur), which are very common on the fre-quently steep hillsides of the sector’s narrowest valleys.
The acidic sandy soils of some upper hillsides are favorable to acid-loving plants such as heath and western gorse (Ulex gallii) and the acid-loving plant associations characteristic of upland beech forests, such as holly (Ilex aquifolium) and ferns (Blechnum spicatum).
The botanical study also located stations with plants of heritage value, which were monitored for five years. None of the four species monitored disappeared during the period. These were the large pink (Dianthus superbus), which is protected in France, two trefoil species (Lotus angustissimus subsp. Hispidus and Lotus angustis-smus subsp. angustissimus), which are protected in Aquitaine, and the bluestem (Bothriochloa ischanemum), a species whose presence determines the creation of Natural Zones of Special Interest for Ecology, Fauna and Flora (ZNIEFF) in the Pyrénées-Atlantiques department of France.
12: Biannual flax © F. Mora - Biotope
13: Pyramidal orchid © F. Mora - Biotope
14: Heath © F. Mora - Biotope
15: Upland beech forest © F. Mora - Biotope
16: Large pink © F. Mora - Biotope

189
Carbon capture and storage . The Lacq pilot Chapter 7: Environmental monitoring and modelling (surveillance)
AMPHIBIANS
Amphibians in the Jurançon foothills include newts, salamanders, toads and frogs. Their life cycle comprises an aquatic stage (tadpoles and larvae) and a terrestrial stage (adults). Amphibians are excellent indicators of environmental quality, and were therefore monitored in order to assess the potential effects of geological CO2 storage at the Chapelle de Rousse site. Inventories were made of amphibian habitats (pools, ponds, ruts and ditches, streams, abandoned drinking troughs, springs, etc.) and of the different species found there. 34 amphibian reproduction sites were monitored from 2009 to 2013.
Over the five-year monitoring period, nine species of amphibians were observed on all the sites, seven of which reproduce each year in the Jurançon foothills. The level of diversity is relatively low compared to the region as a whole, which has 17 species of amphibians.
The brownish-colored palmate newt (Lissotriton helveticus) is the region’s smallest amphibian, at less than 10 cm in length. It reproduces in all types of stagnant water habitats in the Jurançon foothills and, as far as possible, avoids sites where its predators are present (crayfish and fish). The palmate newt is one of the most commonly found amphibians in the Jurançon foothills and has been observed on at least 20 sites.
The marbled newt (Triturus marmoratus) is a large species sometimes measuring more than 15 cm in length. Unlike the palmate newt, it is brightly colored, with green and dark brown marbling on its back and a black belly patterned with white spots. It is more demanding than the palmate newt in terms of conditions for reproduction, seeking relatively deep water with no predators and plenty of aquatic vegetation. It was observed each year in an old concrete drinking trough. In 2010, it was observed in a pond on private property, but this was filled in by the owners the following year. The marbled newt is considered to be vulnerable in the region as its habitats are under threat from human activities, especially when ponds are destroyed, filled in or abandoned.
The fire salamander (Salamandra salamandra) can grow to 25 cm in length. Its black skin is striped and spotted with bright yellow. This land-dweller lays its eggs in streams but never ventures into water when adult. The fire salaman-der is common in the Jurançon foothills as this wooded area has an abundance
17: Marbled newt © T. Luzzato - Biotope 18: Fire salamander © T. Luzzato - Biotope
of small streams where it can reproduce. Its presence was observed in the ten streams sampled in the study area, seven of which are inhabited only by fire salamanders. It is one of the most commonly found species in the Jurançon foothills.
The midwife toad (Alytes obstetricans) is a small grey toad with a warty back that is very common in the Jurançon foothills. Although rarely seen, its soft, piping call is often heard at dusk. It usually stays hidden under stones, wood or tarps or in pipe outlets near houses, and reproduces in streams, ditches, springs or old wash houses. Its presence is mainly detected during nocturnal surveys; it has been heard at least once at 18 monitoring stations.
The common toad (Bufo bufo) is easily recognized by its uniform color, bright orange eyes and warty skin. It can be found everywhere in the Jurançon foothills as it is an extremely common species. Nevertheless, it was found to be reproducing in only 3 monito- ring stations in the study area over the five-year campaign. Unlike newts, the common toad is fairly tolerant to predators. It has been observed in 3 ponds where fish are sometimes abundant.
The agile frog (Rana dalmatina) is a small brown frog found in wet meadows and woodlands. It is rela-tively rare in the Jurançon foothills. It has been found in at least 3 stations in the Arribeu valley, in a wet meadow, a ditch and a pond.

190
The edible (or green) frog (Pelophylax kl. Esculentus) is recognizable by its green back with a yellow stripe. It is the most common frog species in France. It is fairly common in the Jurançon foothills, in stagnant water habitats.
The surveys of amphibian reproduc-tion sites in the Jurançon foothills showed variations in species richness in the 34 stations surveyed from 2009 to 2013. These variations, positive or negative, differed from year to year. They appear to be the result of external factors such as weather conditions, climate-related events (flooding), site modifications of natural or human origin and the presence of predators. Spring weather conditions have a no-ticeable influence on the phenology of amphibian reproduction (repro-duction takes place earlier after mild winters and later after cold winters) and on water levels. Destruction or degradation of some habitats was noted during the five years of moni-toring. This can rapidly affect the re-production of amphibians when the change is too great. After five years of monitoring, no correlation could be established between the injection of CO2 into the subsoil at Chapelle de Rousse and changes to amphibian re-production habitats or variations in species richness.
INSECT SURVEY – ROUSSE FOOTHILLS
As for habitats and amphibians, potential impacts of geological CO2 storage in the Jurançon foothills and at Chapelle de Rousse were monitored in insect popula-tions for a period of five years. Each year, 33 plots were surveyed for butterflies, dragonflies, crickets and grasshoppers. Counts took place twice a year in late June and early September, allowing successive insect generations to be observed since some species, especially butterflies, reproduce early while others such as crickets and grasshoppers, need more time to complete their biological cycle and reach their adult stage in late summer.
Altogether 127 insect species, of all groups, were counted during surveys over the five years. However, not all these species were counted each year. Insect populations are highly variable, depending on different factors.
One of the main factors is the great mobility of insects, especially butterflies and dragonflies. Some large butterflies, such as the silver-washed fritillary (Argynnis paphia), the great banded grayling (Brintesia circe) and the peacock butterfly (Inachis io) fly at speed and can cover large distances. Furthermore, their density is lower than that of other smaller species, which tend to stay closer to their repro-duction site. Similarly, some large dragonflies also travel long distances and may disappear from observation points at certain times. Examples are the western spectre (Boyeria irene), which travels considerable distances along waterways and can be absent a long time before returning to its point of departure.
Weather conditions are another major factor leading to variability in insect populations, both seasonal and at the time of population counts. Cold wet springs, as in 2012 and 2013, strongly influence the emergence and survival of insect species, especially among early butterflies. For example, the populations observed in late June (halfway between the spring and summer generations) were affected, with increased mortality in the spring species and late emergence of the summer species. Common and ubiquitous species like the common blue (Polyommatus icarus) were virtually absent in the June 2013 counts, but had been present in more than half of the plots surveyed in 2012. Conversely, unusual
19: Silver-washed fritillary © T. Luzzato - Biotope
20: Western spectre © T. Luzzato - Biotope

191
Carbon capture and storage . The Lacq pilot Chapter 7: Environmental monitoring and modelling (surveillance)
25: Green leek grasshopper © T. Luzzato - Biotope
23: Large blue © T. Luzzato - Biotope 24: Southern damselfly © T. Luzzato - Biotope
weather conditions seem to encourage other species, which may then be found in remarkable abundance to the detriment of others, as in June 2013 when the spotted fritillary (Melitaea didyma) was regularly observed.
Land uses in the survey plots are also of crucial importance. Many of the surveys were made in hayfields or pastures. Haymaking dates are variable and also depend on weather conditions. Therefore, results for a given field will obviously differ a great deal depending on whether the survey is conducted before or after haymaking, with much lower diversity in the latter case. Moreover, because flowers are cut during haymaking, foraging butterflies are no longer attracted to the hayfields. Similar effects arise due to the presence or absence of livestock in pastures. Other drastic effects are produced for example when a field is ploughed or when vegetation is cut back along ditches or stream banks, which can occur at any time regardless of survey dates or weather conditions.
The survey plots were varied in order to represent a wide variety of habitats and of the species that depend on them: pastures, dry grassland, wet fields, ditches, ponds, rivers, etc. The insect populations observed therefore included species characteristic of certain specific habitat types as well as more opportunistic species tolerating a wide range of different habitats.
Among these species, some are of heritage value and/or protected, and reflect the quality and richness of the environments studied. Examples among butterflies include the large blue (Maculinea arion), a protected species present in dry grasslands. Among dragonflies, the southern damselfly (Coenagrion mercuriale) was regularly found along small ditches and streams with aquatic vegetation. This small blue damselfly is protected and is recognized by a pattern shaped like a bull’s head on the second segment of the abdomen. Among Orthoptera, some species are of heritage value due to their scarcity or unfavorable conserva-tion status in France or in Europe. One example is the green leek grass-hopper (Mecostethus parapleurus), which prefers wet meadow habitats with sedges. This species seems to be thriving in the Jurançon foothills as the number of plots where it was found increased from one count to the next.
During the monitoring campaign – probably because of the increase in wet spring weather, particularly in 2012 and 2013 – we observed an overall decline in species characteristic of dry habitats, especially grasshoppers, which were probably less able to adapt to extreme humidity, unlike the green leek grasshopper mentioned above, which appeared to have benefitted from these. Whatever the reason, it is very difficult to make any hypothesis accounting for the variation in species numbers, particularly over a short period of five years.

192
CONCLUSION
Overall, after the baseline survey conducted in 2009, the counts performed each year until 2013 show relatively minor changes in fauna and flora populations, according to the indicators established.
However, these changes may well be due to different factors of natural or human origin that were not covered by this monitoring campaign, but which have a strong influence on fauna, flora and natural habitats. The human factors include land use changes in the monitoring plots, over which the survey had no control. Mechanical ditch cleaning, deliberate draining of ponds, haymaking and plowing in meadows are all factors with immediate and radical effects on most of the monitoring indica-tors. Weather conditions (during the surveys or in the previous months) also have a predominant effect on fauna and flora phenology. As an example, spring weather conditions were exceptionally dry in 2011 but very wet in 2012, which delayed the life cycles of virtually all the catego-ries monitored. In addition, for the insect category in particular, weather conditions on the day of the count can greatly influence the species diversity and number of individuals observed.
Therefore, while fluctuations were sometimes observed from year to year, they can be ascribed in most cases to natural changes (such as gradual and natural vegetation dynamics in the absence of human intervention),
to obvious human disturbance or to weather conditions that fluctuate over time. Moreover, it should be borne in mind that the natural year-on-year variability of plant and animal populations is also, to a certain extent, a natural phenomenon.
In view of these different points, it would be problematic at this juncture to establish any relationship between the injection of CO2 into the geological reservoir at Rousse and the changes observed in the plant, insect and amphibian populations. Nevertheless, care should be taken not to draw hasty conclusions from the observations made over such a short period. In the short term and under the present monitoring conditions, many of the parameters (exerting a direct and radical influence) could be masking the potential effects of CO2 storage.

193
Carbon capture and storage . The Lacq pilot Chapter 7: Environmental monitoring and modelling (surveillance)
SURFACE WATER
7.3
METROLOGY
The metrological aspects have already been mentioned above, in the paragraph “Soil and surface gases”.
RESULTS
Data from the liquid phase of the SENTINELLE well was obtained from over a seasonal cycle of monitoring. Figure 26 clearly shows that there are three distinct zones in the water column of the SENTINELLE well. These three zones directly reflect specific exchange dynamics at the depth being considered. 26
Surface water monitoring data were acquired from the superficial aquifer of the Rousse site via the SENTINELLE well.
26: Representation of the three distinct zones in the aqueous phase of the SENTINELLE well (BRGM UL)

194
The first zone (-45 to -52 m) is not stable and presents slow exchange dynamics. It is in interaction with the atmospheric CO2 of the air column. The second zone (-52 to -80 m) is stable and is at fast dynamic equilibrium. It interacts with the subsurface CO2. The third zone (-82 to -85 m) is disrupted by the drilling waste found downhole and is also at fast dynamic equilibrium. The piezometric level of the SENTINELLE well has also been monitored since November 2009. It dropped over the first year of monitoring (from -43.5 to -46 m) and rose again slightly at the end of 2011 to around -45.5 meters. The piezometric level has always been above the screened area, meaning that it has never been possible to measure gas from the unsaturated zone through the well. Gas can therefore be transferred from the subsurface to the well only if it migrates via the water table. 27
Considering the data gathered from the gaseous phase of the SENTINELLE well together with the results of the isotopic analyses, it is possible to represent the evolution ranges of the main physico-chemical parameters of the well’s water and gas columns. This evolution is shown in figure 28. 28
27: Evolution of the piezometric level in the SENTINELLE well (TOTAL INERIS)
28: Evolution of the SENTINELLE well’s main physico-chemical and isotopic parameters: air and water columns (INERIS BRGM)
MODELLING / EXPERI-MENTAL SIMULATION
Taking into account these data and to perform the physical accurancy of the statistical model presented figure 10, the hydrogeologic context of the Rousse-1 site must be considered for the most part, the Jurançon hills where the Rousse-1 site is situated are made up of a complex karst geological environment. Such an environment is characterized by its heterogeneous distribution of sources, water tables and cavities whose points of supply and connections are currently unknown (under study by the IPGP).
The operations undertaken to drill the Mini well revealed a perched water table, undoubtedly perennial, close to the -6 m mark. The characteristics of this water table were not measured. However, as previously observed, it is highly likely that this perched water table is partly connected to the SENTINELLE well, and consequently, to the deeper water table. Due to soil- water exchange processes, the perched water table depends strongly on the geochemical and isotopic characte- ristics of the soil gas. Therefore, a rea-sonable hypothesis is that its charac-teristics are similar to those measured in the upper part of the SENTINELLE well’s aqueous phase: δ13CCO2 between -13‰ and -19‰.

195
Carbon capture and storage . The Lacq pilot Chapter 7: Environmental monitoring and modelling (surveillance)
29: Phenomenological model representing the CO2 transfer phenomena close to the injection well of the Rousse-1 site.
In addition, although no direct mea- surement was taken of the soil on the Rousse PAD – except in the Mini well – it can be assumed, based on the soil gas measurements taken on the 42 km² matrix grid, that the soil gas composition is the result of three major contributions:
¬ Atmospheric, via a fixed soil- atmosphere exchange interface, highlighted by the presence of a 13C rich zone;
¬ Biological, which is the reflection of the soil’s specific characteris-tics highlighted by the presence of a zone poor in 13C;
¬ Of the perched water table at -6 m, via a mobile soil-water interface that depends on the piezometric level.
The last two contributions are likely to generate major temporal variations in the composition of CO2 in the soil.
Indeed, the biological contribution, which strictly depends on the intensity of the autotrophic (root respiration) or heterotrophic (activity of decomposer organisms) respiration processes in the soil, changes with the seasons and climatic conditions. A number of studies have shown that the intensity of the respiration processes chiefly depends on the soil’s temperature and humidity conditions (Laporte, et al. 2002), (Rastogi, et al. 2002), (Wu, et al. 2010). So, the intensity of this CO2 source of biological origin has a direct impact on the concentration of CO2 measured in the Mini well.
As we have seen previously, the contribution of the perched water table at -6 m has undoubtedly an impact on the concentration of CO2 measured in the Mini well. 29
Drawing on all these elements, a localized phenomenological model can be proposed that represents the gas transfer phenomena in the superficial geosphere and at the soil-atmosphere interface near the injection well of the Rousse-1 site. This model accounts for:
¬ The existence of a certain number of key hydrogeological elements (presence of a perched water table at -6 m, probably connected to the Sentinelle well);
¬ The existence of multiple exchange interfaces that can be both fixed (soil-atmosphere) and mobile (water tables/gaseous phase of the soil). The geometry of this type of interface, and consequently its exchange dynamics, vary according to rainfall;
¬ The relation between the different elements - isotopic composition and CO2 concentration measurements taken from the different phases.

196
The CO2 transfer processes involved in this system can therefore be summa-rized as follows:
¬ The CO2 produced is of biological origin. It is characterized by an isotopic composition between -23‰ and -29‰, and can either be spread through the adjacent horizons in the soil or/and interact with the system’s other geological and hydrological compartments.
¬ Intense gaseous exchanges take place at the fixed soil-atmos-phere interface: These gaseous exchanges are highly dependent on climatic conditions (atmos-pheric and soil temperatures, at-mospheric pressure, etc.) as well as on the soil’s permeability. As seen above, the water concentra-tion levels in the soil condition its permeability to gas.
¬ Exchanges at the soil-water table interface are steered by processes in which CO2 is dissolved in or liberated from the water in the SENTINELLE well, at times when the water table dries up (periods of low hydrometry).
¬ Exchanges of CO2 take place between the perched water table at -6 m and the water in the SENTINELLE well. The occur-rence of this type of exchange would tend to indicate a drop in δC13 CO2 in the water in the top part of the Sentinelle well. The anti-correlation between the piezometric level of the Sentinelle well and the CO2 in the soil suggests that there is a direct relation between these two aqueous levels. It is obvious too that the exchange dynamics between the two levels will be considerably affected by rainfall frequency.
¬ On top of this, the hydrody-namics of the water table were difficult to characterize at this stage in the study. It is highly likely that this water table is connected to the SENTINELLE well and the perched water table. However, the events that have an impact on the water table’s dynamics may not come within the geometric zone of the model (volume of nearly 3,000 m3 of soil: cross-section of 20 m in diameter and 10 m in height); in this case, a larger-scale analysis is required, which is not performed in the present study.

197
Carbon capture and storage . The Lacq pilot Chapter 7: Environmental monitoring and modelling (surveillance)
GROUNDWATER
7.4
WHY MONITOR GROUNDWATER?
Environmental monitoring of the CO2 injection pilot on the site of the Rousse geological reservoir includes the surveillance of ground water. First of all, why this compartment should be monitored, and what to expect as a consequence are questions to be answered.
The Rousse site was selected for its geological features thanks to which it has trapped sulfur-rich natural gas for millions of years. Between the reservoir and the surface, a series of hydrogeological formations of different quality and size lie on top of one another; some of them are used as a source of water for drinking, for irrigation and balneology purposes. Although the Rousse reservoir is par-ticularly tight and deep, surveillance is essential, first to evaluate the effects of possible irregularities on the hydro-geological environment – especially on the characteristics of the ground water – and second, to detect any con-tainment problems or irregularities during injection operations.
Could the monitoring of ground water 1 used a resource serve as a potential indicator of whether the CO2 is properly confined and whether a failure has any effects on water quality? To be a good indicator, a parameter must be specific to the phenomenon being monitored and present rapid dynamics to detect fast changes in the system behavior. But the characteristics of ground water fluctuate over time and depend on many factors, and the dynamics of the effect that can be measured in the catchment areas if CO2 comes into contact with the aquifer several kilo-meters away are very complex. Even if this is a legitimate idea, the com-partment containing ground water resource does not have enough ideal indicators of CO2 confinement. So why monitor the quality of ground water?
1. In France, many potential sites for CO2 storage are deep aquifers that contain water un-suitable for consumption (high salinity, presence of pollutants such as hydrocarbons, impossible to exploit) and are not connected to the resource aquifers, whose monitoring is addressed in this paper. The Rousse pilot site makes use of a former natural gas reservoir, not deep resource aquifers.

198
Several research programs, included in the summary drawn up by the BRGM and the ONEMA (2013) 2 on the subject, came to the conclusion that CO2 leaks affect the physico-chemical characteristics of water. In 2009, when defining the program for monito- ring water quality – whether or not it would be used to oversee confinement – two main arguments were considered:
¬ The precautionary principle Although many measures are taken (for design and surveillance), an accidental CO2 leak – massive or slow – may contaminate the aquifers and affect water quality, rendering the water in the nearest catchments unfit for consumption in the worst case scenario. The surveillance program uses a wide range of parameters, to ensure that the quality of the water is not affected.
¬ The purpose of a pilot site is to collect data. If other components of the surveillance system reveal a leak, invaluable data for un-derstanding certain phenomena and evaluating the impact of a known leak on the aquifers could be obtained by monitoring its physico-chemical characteristics.
2. Julie Lions and Olivier Bouc (2013). Summary of the potential impacts of CO2 geological storage on ground water resources.
3. Polycyclic Aromatic Hydrocarbon.
WHAT PARAMETERS SHOULD BE MONITORED?
According to the BRGM and the ONEMA (2013), water quality has never been measured when a CO2 leak occurs in a geological storage. Potential impacts are therefore deduced from bibliogra-phies of works studying industrial or natural analogs and from the results of laboratory and field experiments.
Ground water characteristics depend on the equilibrium between water, rock and dissolved gases. The water’s composition will therefore evolve according to the amount of CO2 involved and the initial characteristics of the water/rock complex.
If a leak occurred on the Rousse pilot site, the effect of the dissolved CO2 on the water’s pH might be the first factor of deterioration. An increase in the level of dissolved CO2 would cause a rise in the concentration of carbonic acid (H2CO3), releasing protons (H+) and reducing the water’s pH. In aquifers, the variation in pH is nevertheless limited by the presence of minerals (buffer effects). The pH decrease potentially expected if a CO2 leak occurs modifies the water/rock equilibrium and changes the solubil-ity of the chemical elements – some of which are potentially toxic – according to highly complex dynamics. Generally speaking, one can expect a decrease in pH, an increase in mineralization (release of cations), a rise in bicar-bonate ion levels and even a drop in carbonate levels in the case of alkaline water. In the same way, a change in pH may modify metal element concentra-tions and make them more complex.
A second cause of the deterioration of water quality under consideration is the fact that CO2 could act as a vector gas for various compounds initially present in the Rousse reservoir, sulfur compounds in particular. These sub-stances – H2S, SOx, NOx or hydrocar-bons – can also change the soil’s oxi-dation-reduction conditions and pH.
A five-year program for monitoring the Rousse pilot site was devised based on these potential effects and the pre-cautionary principle. It focuses on mineralization parameters and the trace elements likely to affect the water’s drinkability. The analytical program run was as follows:
¬ Physico-chemical parameters measured in situ:
¬ Temperature; ¬ pH; ¬ Conductivity.
¬ Physico-chemical parameters measured in the laboratory:
¬ Basic physico-chemical analyses:
¬ pH, conductivity; ¬ Total Organic Carbon
(TOC), Total Inorganic Carbon (TIC), Total Mineral Carbon (TMC);
¬ Nitrates, phosphates and sulfates;
¬ Bicarbonates and Carbonates.
¬ Metals: Ba, Fe, Cu, Pb, Zn, Al. ¬ PAH 3.
It is worth noting that this direct parameter was abandoned due to the difficulties of taking samples to measure CO2 without disrupting the gas equilibrium.

199
Carbon capture and storage . The Lacq pilot Chapter 7: Environmental monitoring and modelling (surveillance)
4. Hydrogeological summary of the Tertiary and Cretaceous formations in the sector of the Rousse gas field (in France’s Pyrénées-Atlantiques department), BRGM/RC-55997-FR, November 2007
WHAT MONITORING STATIONS FOR WHAT REFERENCE VALUES?
When the monitoring’s objectives and purpose and most relevant parame-ters had been identified, the moni-toring stations still had to be defined, together with the reference values that would serve as alert or vigilance levels.
Choosing the aquifers
At Total’s request, the BRGM summa-rized the existing data on ground water 4 in 2007. Three types of aquifers can be found in the sedimentary pile of over 4,000 m:
The aquifers that have been explored and are used for drinking water
They are found in discontinuous sandstone reservoirs, which are not present vertically above the Rousse reservoir:
¬ The alluvial aquifer of the Gave de Pau river;
¬ The infra-molassic sand and nummulite sandstone aquifer.
The potential aquifers in the sector that are unexplored and not produced
They can, however, be used for thermal or geothermal purposes because they contain no (or only small traces of) hy-drocarbons:
¬ Aquifers of the Early Eocene to Late Paleocene found in discon-tinuous sandstone reser-voirs at
depths of 700 to 2,000 meters above the Rousse reservoir (with limited possi-bilities);
¬ The calcareous aquifer of the Early Paleocene (Lasseube formation) found at a depth of 2,100 m directly above it.
Potential reservoirs in the sector that are not used and not usable
These cannot be used because of the hydrocarbon traces observed during drilling:
¬ The Turonian-Coniacian calcar-eous reservoir (Upper Mazères formation);
¬ The Late Aptian calcare-ous reservoir (Lower Cledes formation).
Three criteria were used to choose the aquifers: (I) benefits for the popula-tion (drinking water, irrigation, and balneology), (II) accessibility or the level of equipment used for sampling and (III) how much is known about the water’s physico-chemical char-acteristics. Ultimately, four aquifers were monitored for over four years:
¬ The infra-molassic sand and nummulite sandstone aquifer: the ground water is confined except near aquifer outcrop areas and when it is covered by a permeable overburden (alluvial deposits of the Gave de Pau for example). The ground water in this sector generally flows from South to North. It is usually of excellent quality, except in the Bordes sector where very local exchanges take place with the alluvial water table of the Gave de Pau River.
¬ The alluvial aquifer of the Gave de Pau and its affluents: this aquifer 10 to 25 meters thick is composed of detrital material, sand, pebbles, limestone and clay, and forms terraces on either side of the river. The Gave de Pau flows from South-East to North-West. Despite its vulnerability to anthropogenic pollution, the alluvial water table of the Gave de Pau is an economically attractive source of ground water because it is abundant, easy to access and inexpensive to produce.
¬ The Early Paleocene aquifer (Lasseube limestone): this aquifer outcrops at a recharge zone to the south of the injection site, then plunges under several thousand meters of marl of the Late Cretaceous at the injection point, before gradually resurfac-ing to the sorth of the Rousse site where it is sometimes exploited. In the study sector, the wa-ter in the aquifer presents a brackish to salty facies at great depth. Salinity ranges from 2 g/l to 40 g/l. Traces of hydrocarbons and gas have also been identified here and there. The quality of the aquifer’s water improves consi- derably to the North. This aquifer is mainly drawn on for irriga-tion purposes and as a thermo- mineral resource. The spa resorts of Eugénie-Les-Bains, Saint-Paul-Lès-Dax and Préchacq-Les-Bains rely on a number of Paleocene thermo-mineral sources.
¬ The perched water tables in the molasse of the Jurançon hills: perched water tables are small aquifers on the heights of the Jurançon hills that feed severa- llow-flow sources in the study zone.

200
30: Source of drinking water
L’Arribeu (small river near the injection site) is fed by this aquifer and meets up with the formations of the Gave de Pau, of which it is an affluent. This aquifer is not referenced as a significant reserve, as it has low water level that depends directly on rainfall and may be considered vulnerable due to its shallow depth. It is used by just a handful of individuals for various purposes including as a source of drinking water. 30
Choosing the monitoring stations and defining the reference values
Exploratory analysis of existing data
To provide evidence on which to base the choice of monitoring stations and reference values, data concerning a number of engineering structures in equipped aquifers that had been under surveillance for the past few years was selected and analyzed in 2009 5. Out of a regional selection of data provided by InfoTerre™ and ADES on 146 engineering structures totaling over 80,000 analyses and 229 parameters, a homogenous set of data was obtained based on 20 such structures over (I) several decades and (II) 17 parameters supplying information from 239 observations, most of which can be related to the potential effects of CO2 dissolution (pH, conductivity, dissolved O2, bicarbonates, hardness, TAC, magnesium, calcium…). This dataset was Analyzed for Principal Components (PCA) and for variance, and the results highlighted the following aspects:
¬ There is a clear difference between the aquifers and many catchment areas. Intra-catchment variance (chronological series) is much lower than inter-catchment variance, showing that the catchments each have their own geochemical signature even if they belong to the same aquifer. The PCAs therefore proved that there are two structuring factors: catch-ments and aquifers, whose statistical significance was confirmed by ANOVA.
5. ARTELIA with contributions from ASCONIT and BIOTPE (2009). CO2 injection into the Rousse geological reservoir, France, environmen-tal studies, 2009 reference status, ground and surface water
¬ The best way to differentiate catchment areas and aquifers is to use discriminatory variables, a set of positively correlated parameters related to mine- ralization (conductivity, bicar-bonates, hardness, TAC and calcium). To a lesser extent, sodium, potassium, sulfate and nitrate may also be distinguish-ing variables. pH, ammonium, KMnO4 oxidation, silicate, iron and manganese produce no significant differentiation. The catchments of the Lasseube lime-stones have a greater degree of mineralization and the highest potassium, sodium and sulfate contents. The catchments of the Gave de Pau have the lowest degree of mineralization and the lowest sodium/potassium contents; some noteworthy ex-ceptions are however encoun-tered in the infra-molassic and nummulite sandstone catchments. The infra-molassic and nummulite sandstone catchments form two separate catchment groups. The first group, of two catchments, has the higher potassium/sodium contents and a low level of mineralization. The other group has lower potassium/sodium contents and intermediate mineralization.
¬ Because analyses are spread out over the year and results vary from one catchment to another according to the period, the dataset could not be used to study the influence of seasons on the variables. The seasonality effect, where it exists, will therefore be included in the residual variance.

201
Carbon capture and storage . The Lacq pilot Chapter 7: Environmental monitoring and modelling (surveillance)
¬ The structure of the dataset, the fact that the aquifer and catchment factors are significant and the diversity of the hypotheses concerning the type of relationship possible between the “year” factor and the variables (linear or factual relationship? hidden effects of the analysis dates?, etc.) mean that the attempts (by ANOVA or regression) to show that “years” have a signifi-cant impact on variables remain complex as they have to be performed on a case-by-case basis by catchment and by variable. However, from 1988 to 2008, the results of regression analyses showed an increase in mineraliza-tion in three catchments: two in the infra-molassic sand and nummulite sandstone formations and one in the alluvial system of the Gave de Pau.
Choosing the catchments to be monitored
Three criteria were used to select the catchments to be monitored. They were evaluated based on the information presented in the previous section: (I) repre-sentativeness of the aquifers selected, (II) proximity to the site, and (III) enough data to allow reliable reference values to be determined.
Data were collected quarterly in 2009 and every six months from 2010 to 2013. Monitoring catchments and sources are given in table 2 below. Table 02
Reference values
Several kinds of reference value were established in 2009:
¬ For the catchments, the reference values for the four key carbon chemistry parameters (pH, conductivity, bicarbonate and carbonate) were defined based on historical data plus those measured in 2009, so a total of 15 years of monitoring data. One parameter was therefore determined for each catchment, drawing on a series of data up to 30 values, offering relative robustness.
Table 02: Monitored catchment areas and sources
¬ No measurements were performed on the sources before the reference status. The reference values for the four key carbon chemistry parameters are composed only of the values measured in 2009.
¬ For all the other parameters, the reference values are simply those measured during the reference status of 2009.
¬ In the case of the four key carbon chemistry parameters, an analysis of the catchment’s historical data revealed the necessity to compare the results per catchment and not compile the values per aquifer. At present, however, the reference values for sources are still grouped together.
The threshold values of the four key carbon chemistry parameters were therefore calculated for all of the sources and for each catchment based on the reference data available.

202
¬ The level-1 threshold value was equal to the mean of ± two times the standard deviation or ± 90% of the minimum value and 110% of the maximum value. The smallest interval was chosen. In this case, the deviation was qualified as standard.
¬ The level-2 threshold value was equal to the mean of ± three times the standard deviation or ± 70% of the minimum value and 140% of the maximum value. The smallest interval was chosen. In this case, the deviation was qualified as significant.
¬ The level-3 threshold value was greater than the mean of ± three times the standard deviation or ± 70% of the minimal value and 140% of the maximum value. The smallest interval was chosen. In this case, the deviation was qualified as considerable.
For the other parameters, another conventional reference document was used to characterize the ground water’s quality: Appendix III of French Decree no. 2001-1220 of December 20th 2001, concerning water for human consumption, excluding natural mineral water. This appendix sets out the qualities required of raw water to be used as drinking water.
Table 3 recaps the threshold values for the pH, conductivity, carbonate and bicarbonate parameters. Table 03
Table 03: Groundwater reference values

203
Carbon capture and storage . The Lacq pilot Chapter 7: Environmental monitoring and modelling (surveillance)

204

205
Carbon capture and storage . The Lacq pilot Chapter 7: Environmental monitoring and modelling (surveillance)
31: Location of Ground-water monitoring sites for the Lacq CCS project

206
RESULTS AND FEEDBACK
Precautionary principle
The surveillance system currently monitoring the pilot site has so far not revealed any containment problem or injection anomaly. The results obtained by environmental monito- ring retrace the data back through a history of both natural and unnatural changes, but not correlated to the activities of the CO2 sequestration site.
After three years of monitoring since the inventory status determined in 2009, the precautionary principle, on which the monitoring plan was based in part, still appears to be the most relevant. It should lead us to optimize surveillance of substances whose con-centrations are likely to attain toxic levels if the pH drops or the redox potential is modified, in order to an-ticipate any health risks. Other param-eters such as arsenic, mercury and hexavalent chromium could be added to those monitored in the present program.
Based on Appendix III (raw under-ground water) of French decree no. 2001-1220 of December 20th 2001 (concerning water for human consumption, excluding natural mineral water) and on order no. 09/IC/122, the results of the catchment and source analyses do not reveal any anomaly or pollution caused by metals, hydrocarbons or nitrates. Generally speaking, the water is of suf-ficiently good quality to be used as a resource and the results are consistent with the values obtained at the time of the reference status in 2009. The de-viations observed are not significant and are often below the detection limit for PAHs and heavy metals. It is worth noting that naphthalene (PAH) is occasionally detected in the ground water of several of the catchments but at levels lower than those set out
in Decree no. 2001-1220. No historical data on the presence of naphthalene was found in the ADES database.
The monitoring objective related to the precautionary principle has been fully met. It might be worth suggest-ing that if the surveillance system casts any doubts on the reservoir’s capacity to contain the CO2 (reservoir pressure, microseismicity, soil gas, etc.), the frequency of checks must be doubled.
Variability in comparison with the reference values and indicators
As regards three of the carbon chemistry parameters (pH, conduc-tivity and bicarbonates) for which reference values were defined, the following significant deviations were observed: out of 187 values in 2010, 2011 and 2012 (pH, conductivity and bicarbonates), 174 (93%) are consid-ered standard, 12 present a significant deviation (four values for pH, seven for conductivity and one for bicarbo-nate) and one (0.5%) presents a consi- derable deviation (bicarbonate).
The deviations in the case of conduc-tivity and bicarbonate can largely be explained by a rising tendency toward mineralization in three of the catchments, a phenomenon brought to light before the start of activities. In certain cases, for a number of reasons, the mineralization of catchments changes over time. For conductivity to be used as an indicator of failure, mineralization dynamics would have to be taken into consideration. 32
There are some abnormally low isolated pH values that call for particular attention and are a reminder that pH may vary according to a number of factors, including measuring condi-tions, aquifer drawdown, rainfall and
level of recharge. However, these indi-cators have revealed no impact of the CO2 storage activities on the different aquifers.
Generally speaking, the reference values and levels that were not compliant (standard, significant, con-siderable deviation) did not trigger any false alerts. But conversely, in the absence of any actual incident, it might be questioned whether the reference values are sensitive enough to trigger the alarm if an environmental anomaly related to CO2 storage were to occur. This query remains unanswered for the time being, and the dynamics and extent of the variations in these parameters if a massive or slow CO2 leak occurs have yet to be studied.
Other remarks
Although the monitoring of aquifers could potentially be used as a tool for making sure that CO2 is properly contained in deep geological layers based on a certain number of param-eters (pH, dissolved CO2, conductivity, cations), many obstacles have yet to be overcome and considerable research and testing efforts must be made before it can become an operational surveillance tool.
The aquifers being monitored were either selected in line with the precau-tionary principle, i.e. the aquifers used by people, usually relatively shallow and easy to access, or by looking for a means of surveillance – meaning the aquifer the most directly exposed to deep CO2 upflows, not equipped and with very little known about its characteristics and the variance of its parameters. Equipping these deep aquifers would not only be very costly but would also involve a greater risk of bringing the deep zones into contact with the surface by drilling down to the most exposed aquifers.

207
Carbon capture and storage . The Lacq pilot Chapter 7: Environmental monitoring and modelling (surveillance)
In the frame of an operating permit, the advantage of setting up a network of automatic probes on a selection of equipped catchment areas and on specific pi-ezometers (pH/ORP, temperature, conductivity, piezometric level) around pilot or high-potential sites must be evaluated and if necessary requested.
The probes would help build up our knowledge of the parameters’ dynamics and the factors that govern them in the site’s specific hydrogeo-logical context. A relevant interpre-tation of the measurements’ variance would offer improved detection of anomalies related to sequestration activities. The advantages of imple-menting a protocol based on autono-mous probes for measuring dissolved CO2 in deep and confined aquifers must also be assessed.
The last aspect to be considered is the need to rationalize and pool protocols and data.
The scientific community is expected to define a list of parameters that meet the precautionary principle and another that might be used for sur-veillance purposes. Detection limits, sampling frequencies and measuring techniques must also be determined. For example, for the purposes of the precautionary principle, analyses were chosen in line with the analysis standards designed for drinking water. These methods do not appear to be sufficiently sensitive to highlight vari-ations in trace element content; heavy metals and their different forms may effectively be relevant indicators.
Data pooling and sharing is a key aspect for acquiring the knowledge needed to harmonize protocols and set up an exchange platform. Before sequestration operations become more widespread, it is necessary to start drawing up a technical guide, compliant with regulations and dealing with the monitoring condi-tions of ground water and the sur-veillance of confinement through the observation of resource aquifers.
32: Increase in the mineralization of catchments C3, C4 and C8

208
METROLOGY
Monitoring CO2 concentrations in the lower atmosphere (typically 0 to 20 m) and CO2 fluxes at the soil-vegeta-tion-atmosphere interface reveals the CO2 exchanges between the soil and the atmosphere and its spatial vari-ability around the measuring point. Continuous monitoring of deep CO2 injection helps detect anomalies over time or locally (typical radius of several hundred meters) as against natural CO2 exchanges. To put this idea into practice mean complying with a somewhat constraining scope of work:
¬ Having sensitive and reliable CO2 sensors able to detect variations of just a few ppm;
¬ Having tried and tested methods (equipment and algorithms) able to ensure continuous monitoring of CO2 concentrations and fluxes over several months, or even several years, in order to investi-gate the temporal variability of weather conditions and detect an unexpected variation in concentration levels or fluxes;
¬ Being capable of identifying variations, attributable to deep storage, in concentrations or fluxes, as against the natural CO2 exchanges that occur in the environment. Effectively, the soil and vegetation are composed
ATMOSPHERE
7.5
One of the compartments areas that is often overlooked in the environmental monitoring approach concerns the near atmosphere, to which can be added the biosphere (composed essentially of vegetation cover). By taking into account this differentiation, the data presented in this chapter concerns the vegetation cover from 0 to 10 m and the lower part of the atmosphere (the troposphere, from 0 to 2,000 m).
of living beings, which produce large quantities of CO2 when they breathe; in the case of plant organisms some of this gas is absorbed through photosynthesis;
¬ Factor in the complexity of the environment around the measuring site, in particular the ecosystems’ topography and var-iations (vineyards, crops, forests, inhabited areas).
Tried and tested methods are now available in the field of micromete-orology to meet the first two con-ditions mentioned above. The cova riance method (Aubinet, et al. 2012) is thus used on over 100 sites in Europe – particularly as part of the European infrastructure ICOS 6 – and more than 500 worldwide, to perform con-tinuous monitoring of CO2 fluxes on a semi-hourly basis between an ecosystem and the atmosphere, in order to evaluate the biosphere’s carbon footprint at local and global scales. The system developed for the ANR SENTINELLE program is in keeping with the specifications of the major international networks that perform this type of measurement. 33
6. http://www.icos-infrastructure.eu

209
Carbon capture and storage . The Lacq pilot Chapter 7: Environmental monitoring and modelling (surveillance)
Two strategic solutions were adopted:
¬ Place the measurement system on the Rousse-1 site, at a height enabling it to “see” over a distance of 1 to 2 km, an area corresponding roughly to that of the CO2 storage reservoir; for this purpose we chose a height of 10 m;
¬ Carry out continuous monitoring over a long period of time in order to test the capacity of the system to perform in-depth monitoring and to identify any changes in operating conditions and in the CO2 emitted by the soil and vegetation. The system was up and running on the site from September 2009 to June 2010, and from February 2012 to June 2012.
In the case of the troposphere, two types of monitoring methods based on onshore remote sensing were combined. These devices respectively use laser (Lidar Dial COWI – CO2 Wind) and infrared (OPAG33/EM27, Bruker) remote sensing to measure atmospheric gas from a distance. The first is a unique prototype that was built for the ANR SENTINELLE program. The second is an off-the-shelf device based on the principle of passive infrared emission.
35: The infrared remote sensing system OPAG33/EM27 (BRUKER) (UL). Left: Instrument being calibrated in the laboratory. Center: System in the measurement phase on site. Right : Sighting device.
33: System for measuring fluxes at the surface-atmosphere interface using the covariance method (INRA)
34: Conceptual diagram of the COWI Lidar systemAOM: acousto-optic modulator; PBS: polarizing beam splitter; PZT: piezo-electric; HWP: half-wave plate; QWP: quarter-wave plate; DFB: distributed feedback laser diode; TDFA: optical amplifier; EOM: electro-optic modulator; AOFS: acousto-optic frequency shifter; D: photodiode; DD: direct detection; A/D: FPGA analog-to-digital conversion (LMD)
The Lidar is an active remote-sensing device whose measurement principle is based on the interaction of a laser pulse with the components of the propagation environment, in this case the atmosphere’s particles and molecules (figure 34). In the DIAL (Differential Absorption Lidar) and Doppler Lidar developed by COWI, the main physical processes in play along the laser beam emitted to the atmosphere are: Mie scattering by the particles, absorption by CO2 molecules and a frequential Doppler effect (and broadening) due to the particle movements. 34

210
The specificity of the COWI laser is that it sequentially emits laser pulses at two different wavelengths with a precise spectral position, “On” and “Off” of a CO2 absorption ray (reference wavelength). Part of the laser light released into the entire space at the two different wavelengths is collected by a telescope (backscat-tered wave) and optically mixed on a detector according to the heterodyne detection principle.
The system used for infrared atmos-pheric measurements is an OPAG33/EM27 developed by BRUKER. It is based on the analysis of passive remote sensing by infrared spectrometry (Harig, et al. 2006), (Harig, R. 2004). This means that there is no infrared source: the gas itself generates its own infrared spectrum according to its nature and temperature. The in-strument has a measurement range of 5,000 m and can be fitted with a telescope. The focal opening in this case is 10 mrad, i.e. at a distance of 1,000 m the analysis diameter is 10 m. The spectral range is between 3,000 and 700 cm-1. The resolution was optimized to 1 cm-1, for a mea- surement time of less than 30 seconds. The measurement can be taken over 360° with a vertical azimuth of maximum 60°.
Given the passive measurement principle, the calculated concentra-tion equals the average concentration of the gas considered in the entire measuring cone, which goes from the telescope to a background. In the case of a gas uniformly spread throughout an atmospheric volume, the position of the background defines the length of the cone, i.e. the measuring distance “d”. In the case of a gas cloud in an atmospheric volume, the thickness of the cloud defines the measuring
distance “d”. Concentrations are esta- blished in ppp.m then in ppm if the distance “d” is known.
Measurements by infrared remote sensing are taken in three steps:
¬ Calibration of the system using a specially developed gas cell in the laboratory that controls the gas’ temperature and total and partial pressures;
¬ Recognition of the gas’ different spectral signatures by comparing the gas’ emitted infrared signal in a specific spectral window against gas spectral databases (HILTRAN, etc.), or recalculated theoretical emission spectra or experimen-tal spectra of calibration gas;
¬ Transformation of the signal into quantitative data of partial pressure or concentration. These transformations are performed using phenome-nological emission models developed in the laboratory, combined with the decompo-sition of the spectrum of gas being considered. This last step is necessary to find out exactly what the intensity or the surface area of the gas’ characteristic spectrum is.
Figure 35 partially illustrates this approach, showing the calibration phase on a gas cell (left-hand view), the measurements being taken on the field using the OPA33/EM27 without a telescope (central view), and the optical sighting device (right-hand view). 35 (page 209)
RESULTS
As regards the measurements taken in the biosphere over the entire measurement period, the system provided data for 97% of that time, 90% considering the data cast aside because of rainfall and 22% considering only the nocturnal data. Applying wind speed and direction thresholds brought this percentage down to 13%.
First, the quality of the data was analyzed, then the CO2 fluxes and con-centrations observed were compared with the different weather variables in order to characterize the site in its “Status 0” configuration.
Because of the environment’s com-plexity (relief and CO2 sources and wells within a radius of a few hundred meters to several kilometers), the variables measured, particularly the CO2 concentration levels and fluxes, are likely to change according to the origin of the air mass. Consequently, it was important to characterize the site before injection so that any anomalies could be detected. To this purpose, an analysis was performed factoring in wind direction to identify any local heterogeneities.
¬ As expected, the prevailing winds blow from the West or North-West (figure 36 left), and are stronger in this same wind sector (figure 36 right). It is highly likely that, in compari-son to the synoptic wind in the region, this wind rose will be affected by the topography;
¬ Air temperatures are higher for north-easterly winds (data not shown here) that generally corre-spond to anticyclonic conditions with long hours of sunshine;

211
Carbon capture and storage . The Lacq pilot Chapter 7: Environmental monitoring and modelling (surveillance)
¬ The CO2 concentration values present significant anomalies (figure 36 left with higher levels (over 390 ppm) between the South-West and the North – and the South-East and the North to a lesser extent (around 385 ppm) – whereas concentrations are lower toward the East-North-East and the South-South-West (roughly 380 ppm). These anomalies undoubtedly stem from the variations in land use and in possible anthropic sources (urban areas, industrial activities, transport);
¬ CO2 fluxes (figure 36 right) vary considerably according to direction, a particular case being the North to East direction (between 340° and 60°), which presents major anomalies with negative fluxes that might be measure-ment artifacts caused by the installations of the Rousse-1 pad. The measure-ment’s variability and relevance are discussed further down. 36
The prototype of the COWI laser remote-sensing device for measuring atmospheric CO2 was completed after the research program was over. The results of the first tests carried out in March 2012 on the site of the École Polytechnique (Palaiseau, France) are presented in figure 37. They show the potential of the COWI lidar for performing atmospheric monitoring of CO2 surface emissions and pollution particles through (1) identification and quantification of the emissions (2) estimation of these emissions sphere of influence. This also gives an idea of all the advantages that might be gained from combining it with an infrared remote-sensing system, which on top of additional spatiotem-poral information would offer access to a wider range of gases. 37
The passive infrared remote-sensing of atmospheric gases (that was used at the Lacq projects) was developed and optimized as part of the ANR SENTINELLE program, and a major
36: Rose of the CO2 concentrations (in ppm, on the left) and CO2 fluxes (in mg/m²/s, on the right) on the Rousse site from September 2009 to June 2012 (INRA)
37: Experimental site at the École Polytechnique, Palaiseau. Spatial distribution of the atmospheric reflectiv-ity (CNR) of the radial wind (VR) and the CO2 mixing ratio. These measurements are taken along the line of sight (LOS) of the COWI laser (in yellow on the picture). The study and CO2 source area is indicated by a white rectangle. (LMD)

212
step forward has been taken as regards the recognition and 3D experimental simulation of atmospheric gaseous envelopes. Using the two-layer model presented above, it was possible to measure the CO2 concentrations above the Rousse injection site. To obtain a 3D view of the CO2 envelopes, it was necessary to perform all measurements at two distinct locations in order to cross-check all the data obtained from different shooting angles. 38
38: Principle of measurement by infrared remote-sensing at two different locations (OPAG33/EM27 BRUKER) with an eye to the spatial reconstruction of the CO2 envelopes above the Rousse injection site (Total CCS pilot Lacq/Rousse, France). (UL)
39: Impact of an increase in CO2 emissions in the case of (left) a uniform source-range: the source emits over the entire area between the measuring point and 500 m in the wind, the two curves show the variation of concentration detected at the measuring point according to the intensity of the emission (red) and the wind speed (green); (right) a local source: a 50 m wide source-line was simulated. The red curve shows the signal at 500 m as a function of the intensity of the source. The green curve shows the concentration detected based as a function of distance to the source (upstream edge relative to the wind) for an emission of 10 mg / m2/ s. (INRA)
MODELLING, EXPERIMEN-TAL SIMULATION
It has been seen that the measure-ment of atmospheric CO2 levels have a greater stability than the flux measurement, which would suggest the possibility to use it as a tracer for the monitoring of a CO2 injection site. Indeed, any increase in local emissions leaves a “trace” in the atmosphere, which can be detected if sufficiently sensitive analyzers are available. This is currently the case (com-mercial analyzers for the measurement of atmospheric CO2 by infrared absorption – or Cavity Ring – Down Spectroscopy –, have a precision lower than the ppm and are very stable over time). If one has an ad hoc atmospheric dispersion model (Flesch, et al. 2005) (Loubet, et al. 2009), then with some as-sumptions on their location, extent or intensity, it is possible to trace them back to their sources. As an illustra-tion/example, using a simple analyt-ical model (Loubet, et al. 2001), the impact on the concentration of CO2 at a measurement point 10 m from the top of a source has been calculat-ed in two cases: 39
1. The measurement is homoge-neous in space with 0.1 mgCO2 m-2s-1 over the whole extent/surface (figure 39, left);
2. The measurement is corre-sponding to a fault line causing a major leak 10 mgCO2 m-2s-1 over a width of 50 m between 0 and 500 m from the point of measurement (figure 39, right).
In both cases, the observed increase in concentration is similar and in the order of a few ppm. It is thus easily detectable by current analyzers. Moreover, it would be enough to make measurements in the order of a few seconds at a low frequency and not at 20 Hz as for the covariance method.

213
Carbon capture and storage . The Lacq pilot Chapter 7: Environmental monitoring and modelling (surveillance)
40: 3D Positioning of the CO2 envelope, right above the injection site (CCS Pilot Total Lacq/Rousse, France): Distribution curves of iso-concentration of CO2 in steps of 20 ppm (UL)
41: Spatial localization and quantification of CO2 pockets with a concentration higher than/above 500 ppm (CCS Pilot Total Lacq/Rousse, France) (UL)
However, one must also bear in mind that the standard deviation of the CO2 concentrations for different wind di-rections is fairly stable but also high, around 30 ppm. This type of method could therefore only be applied to long series of measurements, as this would be the only way to obtain suffi-cient sensitivity.
An alternative could be to use a network of CO2 sensors placed near the ground (typically 1-2 m high), which would combine the advantage of integrating the atmospheric mea- surements (one can see a source even when not located directly above it) and the probability of being close to the source. This type of sensor networks that were not yet available a few years ago could become reality in the rela-tively short term. Developments are underway, in particular in the case of projects tracking carbon sources and sinks in the biosphere (e.g. Integrated carbon observation system (ICOS) infrastructure).
For the atmospheric gases measured by infrared remote sensing (OPAG33/EM27), all quantitative data collected at the CO2 injection site by the two measurement systems (as presented in figure 38) were interpolated using GOCADTM, a 3D modelling software, in order to obtain a true quantita-tive spatial localization of the CO2 envelopes right above the injection site. The combination of infrared remote sensing and 3D modelling is an originality/specificity of the French National Research Agency (ANR) program SENTINELLE that allows for the first time to simulate experimen-tally an atmospheric volume of CO2.
The end result of this 3D representation is shown in figure 40. One can clearly distinguish the spatial distribution of the CO2 through its iso-concentration curves in steps of 20 ppm. 40
Such an approach prefigures the future diagnosis tools (localization, quantifi-cation) for the geochemical monitoring of the atmospheric environment right at the storage sites. By way of illustration and based on data from figure 40, one can easily locate and quantify the pockets of CO2 that are having a concentra-tion greater than a set value (warning threshold or alert threshold), in this case 500 ppm was set as the alert threshold value. 41

214
It is clear that this type of scientific development of remote measure-ment systems of concentrations/gas fluxes within the biosphere and troposphere, goes far beyond the framework of the geological storage of CO2 and finds its ultimate goals in the environmental monitoring of air pollutants (natural environment, anthropic or urbanized areas), and in the securing of emitting indus-trial sites, especially the ones classi-fied as SEVESO (European Directive 2012/18/EU, aimed at improving the safety of sites containing large quanti-ties of dangerous substances).
It is clear that this type of metrology will become essential in the coming years while asserting themselves as standards of environmental monitor-ing of the atmosphere.

215
Carbon capture and storage . The Lacq pilot Chapter 7: Environmental monitoring and modelling (surveillance)
Carbon Capture and Storage is particularly well suited to industrial sites that release large quantities of CO2 (over 100,000 tons) such as coal and gas-fired power plants, steelworks, refineries and petrochemical complexes.”TOTAL, Manoelle Lepoutre, Executive Vice President, Sustainable Development and Environment
“

216
chapter 8
COMMU-NITY OUT-REACH
authors
M. Ha-Duong (CIRED)M. Gaultier (APESA)B. de Guillebon (APESA)G. Mardon (CIRED)

217
Carbon capture and storage . The Lacq pilot Chapter 8: Community Outreach
This Project was one of the first integrated CCS projects in the world at this scale, and the first to be authorised in France.
The social dynamics of this project were particularly interesting at the local level. The CO2 storage site was close to a fairly densely populated area – the city of Pau and it’s neighboring cities had nearly 150,000 inhabitants in 2007. The CCS chain started at the Lacq Industrial Facility (located 29 km from the injection site). The communities around the Industrial Facility have been living for over 50 years with a high level of industrial activity near their homes, however, the communities nearest the storage area, tend to be semi-urban or rural with less familiarity of industry.
After describing the local context, this chapter presents the local actors and describes the “concertation” 1 process that was led both before and after the official permit request for the Lacq Pilot Project. The final sections of the report present the results of a survey of the Jurançon population and the analysis of the press coverage from their project.
01: During a field visit, Nicolas Aimard, Total Project Manager, presents the CCS project to the researchers working within the framework of Soceco-2 research program (2008) - PHOTO CIRED.
Approach
To obtain the most exhaustive description of our case, we followed the monographic approach, which led us to use several social science research methods. These methods included: bibliographic research, face-to-face interviews, passive observation, par-ticipative observation (one of the authors is a member of the project’s supervisory commission - CLIS), quali-tative and quantitative media analysis of the press, as well as a local popu-lation survey. Results were discussed and validated with the stakeholders at several workshops on CCS, organized by CIRED and others.
1. “Concertation” is a French word used here, it describes an institutional and legal procedure. For details, see Section 4. Etymology: concertare (Latin), to combat, to dispute, to keep up with [in French: combattre, disputer, rivaliser]. The French word “concertation” keeps a common sense of reciprocal or mutual interaction or control, among things or persons, and is “process-oriented” far more than “decision-oriented”. Synonymy: French word “concertation” is near synonymous
(metonymically) with the French “négociation”. The verb “concerter” is synonymous, in order of decreasing probabilities, with: combiner, préparer, arranger, calculer, préméditer, mûrir, organiser; that is in English, respectively: to combine, to prepare, to compound, to calculate, to premeditate, to mature, to organize. Cf. Dictionary of [French] synonyms of CRISCO (Caen University) via the CNTRL website: http://www.cnrtl.fr/synonymie
TOTAL’S CO2 CAPTURE, TRANSPORT AND STORAGE (CCS) RESEARCH PILOT PROJECT IN LACQ – INAUGURATED IN JANUARY 2010 WAS NOT ONLY A TECHNICAL EXPERI-MENT, BUT ALSO A SOCIAL AND LEGAL INNOVATION.

218
Total’s integrated CCS Pilot Project takes place in the Gave de Pau river valley, in the land of Béarn, which is a part of the Pyrénées-Atlantiques (64) administrative department of France.
The Lacq Natural Gas Field was disco- vered in 1951. It has been an important asset for France, providing up to one third of the country’s domestic natural gas requirements, and thousands of jobs. A new city (Mourenx) was built for workers coming from all over France and abroad, then Pau’s (capital of Béarn) population doubled, and a strong local corporate and union culture emerged.
In the wake of changes brought about by technology, Total’s large Science and Technology Research Center (Center Scientifique Jean Feger) developed global recognition for it’s expertise, the UPPA (Pau and Pays de l’Adour University) developed its sciences department, and the in-dustrial incubator Helioparc added a growing conglomerate of grey matter in Pau.
Gas production peaked in 1982, then the flow started to decline around 2009 and the field’s economic life was being considered by private and public actors in terms of continued progress of industrial activities.
LOCAL CONTEXT
8.1
In 2008, Total’s crucial decision to reduce gas production to 300,000 m3 per day (compared to 2.5 million m3 per day during the preceding few years) was made, in order to provide Lacq Chemical Industries with a supply of gas for around the next 30 years. In 2010, Total announced that commercial gas production in Lacq would cease in 2013, putting an end to the great Béarn gas epoch. It was therefore time to address the future of the field and the community that relied on it.
The depleted wells closure and reclamation plan was effectively implemented in 2013. The first wells impacted by the closure campaign were stopped in September and the last ones on October 15th. Of the 46 wells in the field, 11 will be maintained: 5 to feed local industries (Arkema, Sobegi, Toray…) via the Lacq chemical cluster LCC30 project, 5 placed in reserve, and 1 will be left to enable observations. Plugging of the perma- nent wells is planned in three stages:
¬ Mid 2014 for the Meillon field; ¬ End of 2015 for the Lacq field; ¬ 2016 for the Rousse site near
Jurançon after the CO2 injection pilot has been completed. This site will then be subject to a three year mandatory monitor-ing period.

219
Carbon capture and storage . The Lacq pilot Chapter 8: Community Outreach
Thus, after a 50 year natural gas bonanza, economic development plans for the valley are being rein-vented, and several specialty chemical production facilities, including a bio- ethanol plant and a carbon fiber plant have been attracted. In this context, with the economic future of the area at stake, Total’s CCS project announcement had the potential to offer real value to the community. The project fits with the firm’s broader strategy to responsibly manage the plants shutdown, not only by supporting local small and medium enterprises through its subsidiary Total Développement Régional (Total DDR), but also by directly investing in training and R&D activities on the platform.
Lacq’s natural gas is highly corrosive and dangerous, because it contains high quantities of Hydrogen Sulfide (H2S) and Carbon Dioxide (CO2). Yet the processing plant’s safety record shows no fatal accidents despite having people living very close to the plant. However, the risk is not only near the processing plant. The gas field extends dozens of kilometers beyond Lacq, including a stretch underneath the city of Pau. Consequently there is a wide network of pipelines in the area. These may have a low impact for people who are new to the area, especially since some of them are no longer in operation, like in Rousse. However, local citizens can have a memory or direct knowledge of the visual, air and noise pollutions that come from living in a valley rich in heavy industries.
A benefit of citing infrastructure projects in an area very familiar with heavy industries is that local institu-tions have experience with managing dangerous gases and pipeline risk. Since the beginning of the oil and gas production in this area various liquid streams have been re-injected into the geologic structures. Some of these liquids came from the underground fields themselves, some came from the processing plant. Injection of liquid waste from other chemical plants in the industrial park is currently au-thorized in the geologic formation known as “Cretaceous 4000”. This is an economic opportunity, as some chemical waste streams would require up to €600/t to be processed otherwise. That opportunity remains a significant asset for the region, as only 2% of the disposal capacity has been used up in 40 years.
Following a recommendation by the French National Commission on Public Debates (CNDP), in 2001-2002 a “concertation” took place on whether to renew the “Cretaceous 4000” permit (Metras 2001). Even if all this was not tied to the CCS project technically, legally or administratively, it contri- buted to the local political culture of “concertation” about industrial risk and geological injection.

220
2. This branch of the administration was renamed in January 2011 the Direction Régionale de l’Environnement et de l’Aménagement et du Logement (DREAL).
When the Project started, Total was the fifth largest publicly-traded integrat-ed international oil and gas company. It operated in more than 130 countries and had 96,950 employees. In Lacq, more than 850 persons were directly employed by Total Exploration Production France. In addition, Total’s main research center, dedicated to oil and gas exploration (Centre Scientifique et technique Jean Feger) is located in Pau, with more than 2,000 employees (Total and sub-contractors). Total is widely establi- shed in the Pyrénées-Atlantiques territory, and even beyond its own employees it supports a network of economic actors. The balance of local economic and political power is clearly tilted towards the largest French multinational.
Locally, the Direction Régionale de la Recherche de l’Industrie et de l’Environ-nement in Aquitaine (DRIRE) 2 adminis-tration represents the interests of the State. DRIRE has the responsibility to investigate the injection permit request and prepare the decision by the Prefect, taking the national public good into account, as well as the concerns of local communities and businesses. The DRIRE played a key role in organizing the public dialogue opportunities for the Lacq CCS Project.
LOCAL ACTORS
8.2
Civil Society
The Lacq CCS Project touches on 11 cities, making for a diverse set of stakeholders and local interests. People living close to project infra-structure, the local communities impacted by a project, and the elected representatives for those local com-munities and cities, are the key stake-holders considered when discussing civil society. The civil society groups with influence over the Lacq Project are diverse, but they can be largely split into one of two categories:
¬ Communities close to the capture site which benefit from industrial jobs at the Lacq Plant. Their economic wellbeing is inex-tricably linked to the operation of the natural gas field, and the impact of the closure of the field on them is a critical issue. Total’s reputation and involvement in these local communities through educational outreach and other initiatives, has earned the company a positive reputa-tion with local stakeholders. As a measure of the Corporate Social Responsibility demonstrated by Total, Arquizan (2008) writes that over the last 30 years, Total DDR lent 140 million euros to 500 starting companies in the department.

221
Carbon capture and storage . The Lacq pilot Chapter 8: Community Outreach
3. Jurançon’s royal fame goes back to 1553, when infant Henry IV’s lips were rubbed with garlic and wet with wine from the local region at his baptism... 4. Commission Locale d’Information et de Suivi, CLIS: local information and surveillance commission.
The picture is different at the other end of the pipeline, at the storage site. This area is populated by wine growers and farmers, and is less affected by the employment situation in the Lacq industrial area. They belong to a territory of about 10 km² (1,000 ha) officially recognized as producing “Vin du Jurançon”, an exportable ancient (1936) Appellation d’Origine Controlée (AOC) quality label wine 3. Patches of the Jurançon territory have also started to become residential neighborhoods for the larger Pau city.
Elected Officials
The positions of elected represent-atives in the different Project areas reflect this variety of interests. Mayors in the Lacq Basin publicly took a positive position towards the project from the start, and made this known to other players at the first CLIS 4 meeting held on June 3rd 2008. Mayors from the Jurançon hillsides did not take a position during the project’s “concertation”, which occurred during the campaign period for municipal elections. After the March 2008 elections, the new Mayor of Jurançon took a stand by questioning Total’s responsibility after its departure from the site. This remained his main nego-tiating position. The strength of the question was backed by the Mayor’s position as a Professional Judge in Toulouse’s administrative court, and the project’s management recognized its seriousness.
Environmental NGOs
Given the industrial history of the region, environmental NGOs are fairly active, watching over new project developments and implementation. At the start of the Project, the ENGO groups had no defined position on CCS, then two existing asso-ciations jointly articulated explicit opposition to the project: Santé-Environnement-Bassin de Lacq and SEPANSO Béarn.
In addition to the arguments against CCS as a technology expressed by France Nature Environnement (FNE), they argued that the project would be ineffective, expensive and, given the population density and seismic activity in the local area, presented risks for neighbours (Mauhourat & Lambert-Habib 2008). In addition, a specific association named Coteaux de Jurancon Environnement (CJE) was created by local citizens concerned about the injection project, in order to inform and mobilize the local population. CJE and SEPANSO actively participated in the official public discussions at a level where isolated citizens could not have attended directly.
The launch of the Lacq CCS Project was announced on February 8TH 2007. CO2 injection was expected to begin at the end of 2008 and last for two years. At this point, no subsequent phases of the Lacq Project had been decided, other than the necessary long-term injection site monitoring. The first “Lacq Project Information Dossier”, a key communication created with the support of a con-sulting team (C&S Conseils) and issued by Total in October 2007 5, only shows a draft project timetable covering the period through consultation, construction, permitting, the next mandatory Public Inquiry and terminating with the com-mencement of injection. 02
02: Lacq CCS pilot project, draft timetable in 2007 October (Total5)
5. “Summary Lacq Project Information Dossier, Key information on the Lacq carbon capture and storage project”, Total 2007, November. http://total.com/en/co2-total-synthese-gb
CO2 Capture and Storage: synthesis of Lacq Pilot projets concertation, Total october 2007. http://total.com/fr/lacq-synthese-dossier- concertation-2

222
03: Influence-support mapping of the stakeholders for the Lacq CCS project.
6. Jean-Michel GIRES, Senior Vice President, Sus-tainable Development and Environment – Total; in “Lacq CO2 Capture and geological storage Pilot Project, Project information Dossier”, Total 2007 October. http://total.com/en/co2-lacq-total-project-infor-mation-dossier
Stakeholder analysis was conducted around the Lacq CCS Project by an indepen- dent consulting company commissioned by Total. This analysis was based on face-to-face interviews in the field, conducted during the first quarter of 2007, participation at discussion workshops and a bibliographic survey.
Figure 3 below illustrates the situation around September 2008, at the end of the public inquiry phase. The graph plots the positions of the various stakeholders in terms of their varying levels of influence and support for the Project. 03
The key players are those with both a high degree of influence and support for the project. They are located towards the upper right of the matrix. They appear to be the industry actors, institutions and experts. They are allied for the devel-opment of CCS in France, and expect that the success of the Lacq Pilot will help reinforce their position.
The media, national environmental NGOs and most, but not all, town councils had a minor role in the discussions. A lack of understanding of a new technol-ogy could explain why these players did not have a clear position and influence on the future of the industry. Overall, the top-left corner is empty. This shows that no opposition has been influential in the early phases of implementation. The overall social context was favorable. Nevertheless, Total set up an Independent Scientific Committee to advise the project team during all phases of the pilot. The Scientific Committee included representatives of the French Authorities and independent scientific experts.
“At this stage, Total wishes to open a broader dialogue with all stakeholders: elected officials, citizens, economic players, social bodies and community groups. The aim is to foster an exchange of knowledge and information, to answer questions and allow all interested parties to air their views on the aims and methods of the project as well as the surveillance and control measures being taken. We at Total hope that this dialogue will prove useful to all stakeholders and help us with decisions that must be taken in the future.” 6

223
Carbon capture and storage . The Lacq pilot Chapter 8: Community Outreach
THE CONCERTATION PROCESS
8.3
WHAT IS A CONCERTATION?
Principles
Although the French institutional expression “concertation” implies multiple stakeholders, it does not necessarily indicate opposition. Concertation is a form of dialogue, different from others like negotiation, debate, consultation and mediation:
¬ Contrary to negotiation, con-certation does not aim to reach a decision collectively, only to prepare it 7. When the admin-istration engaged the local community in concertation, it did not bind its hands. The decision to authorize the project or not, was always the admi- nistration’s. However, there was a promise to pay real attention to the results of the concertation in the decision-making process.
¬ A concertation results in a specific decision to be made soon, as opposed to a debate which can happen at a more ideological level. There had been no national debate on CCS in France when Total announced its project.
7. Cf. (1) above. 8. Of course, parties having opposing views may not find “perfect” resolution…
¬ Concertation is more than con-sultation. It cannot be limited to asking an opinion. The con-certation had a consultation phase, as described below, but it then extended beyond that. Concertation implies an exchange of arguments and con-siderations among stakeholders, to make the different viewpoints explicit but without exaggera- ting differences. Concertation is a strengthening process for action 8, intending to preserve the common dimension of a project without leading to undue distortion, nor being in any way a co-decision procedure.
¬ Mediation is about facilitating a collective decision by using an independent third party. In contrast, a concertation process can be led by one of the stake-holders, or by a dependent third party. Here the concertation was initiated by Total, and then led by the Administration.
Applicable Regulations
Concertation has been increasingly viewed as an essential principle for public action, particularly when social acceptance of private projects is at stake and can only be addressed through dialogue with local stake-holders.

224
9. Cf. French governmental website: Toutsurlen-vironnement.fr, and Directive Inspire 2007/2/CE, 2007 March 14th (Infrastructure for Spatial Information in the European Community). 10. Ministère de l’Environnement et de l’Aménagement du Territoire (MATE). 11. This device is governed by the law of July 12, 1983. The section 236 of the law of July 12, 2010, has amended the section L123-1 of the En-vironmental Code as follows: “The purpose of the Public inquiry is to ensure public information and participation, as well as taking account of the third parties interests in the elaboration of decisions that may affect the environment” (“L’enquête publique a pour objet d’assurer l’information et la participation du public ainsi que la prise en compte des intérêts des tiers lors de l’élaboration des décisions susceptibles d’affecter l’environnement”).
12. “ La mise en œuvre de la concertation procède d’une volonté politique. Il incombe donc aux pouvoirs publics (élus, administra-tions) de veiller à sa mise en œuvre. Lorsque le maître d’ouvrage n’est pas une autorité publique, il lui faut alors tenir l’autorité compétente informée de son projet et définir avec celle-ci les modalités de la con-certation (Article 3). ” MATE 1996.
Concertation is institutionally linked to the principle of participation of the parties involved in a project, as defined by international conven-tions, and specifically by the Aarhus Convention (public access to informa-tion, public participation, public access to administrative or judicial proceedings), ratified by France in 1998 9.
According to the concertation charter of the French Ministry of Environment and Country Planning 10 in 1996,
“Concertation provides value for repre-sentative democracy with more participa-tory democracy”, and it aims to “enhance public involvement in the design of projects, including where laws and regula-tions already prescribe it”.
This is notably the case with regards to the French public inquiry procedure (a legal device enabling mandatory public information and requests for public comment for certain types of projects 11) initiated by the Prefect.
The public inquiry procedure can be implemented in the municipali-ties affected by a project, and would be conducted by an Investigating Commissioner selected by the President of the Administrative Court.
If the decision-making authority devia- tes from Investigating Commissioner’s advice – which it is not bound by – the Investigating Commissioner’s advice with arguments may be used by the Administrative Court within two months.
On March 1st 2005, the Environment Charter became a French Constitution Act. It legislates the public partici-pation principle in section 7. More recently, the legislation enacted on December 27th 2012 updated the conditions in which the public par-ticipation principle may and must be applied to the State Authorities’ decisions. As a general rule, a concer-tation may still be set up by various stakeholders even prior to the regula-tory requirements implementation.
The Lacq CCS Pilot Project took place during a period of evolving legal debates, regulatory developments following Grenelle I (August 9th 2009) and II (July 12th 2012), and in anticipa-tion of changes in European regula-tion and national transpositions.
In Practice
The added value of a concertation is provided by embedding it within the local context of a project - legally independent, but subject to the geo-graphical, social, political, economic influences or constraints on its social acceptability. The concertation is not about negotiating around a project, but negotiating around the participa-tory process itself, having to efficient-ly and fairly involve all the stakehold-ers, including: elected representatives, citizens, administrations, technical and legal experts, and various organized actors in civil society like NGOs and enterprises.
The 1996 MATE Charter establishes a general framework and guiding principles for good practice:
¬ Section 3: “The concertation implementation is driven by a political will. Thus it is the task of public authorities (elected representatives, administration) to ensure its implementation. If contracting authority is not a public authority, then it has to keep the competent authority informed of the project and to define in agreement with it the concertation modalities” 12.

225
Carbon capture and storage . The Lacq pilot Chapter 8: Community Outreach
13. “La concertation est un processus qui se poursuit jusqu’à la réalisation effective du projet et même au-delà si nécessaire. Il est souhaitable que les partenaires de la concertation se mettent d’accord sur un cheminement, marqué par des étapes ou des temps forts, chacun donnant lieu à un rapport intermédiaire (article 6).” MATE 1996. 14. “ Lorsque la présence d’un garant de la concertation se révèle opportune, sa désig-nation procède d’un consensus aussi large que possible. Le garant de la concertation est impartial et ne prend pas parti sur le fond du dossier (article 7). ” MATE 1996.
15. The law 95-101 of 02 February, 1995, “Strengthening the Environment Protection”, creates a National Commission for the Public Debate (CNDP). The CNDP is responsible for organizing public participation in the devel-opment of large-scale, publicly or privately initiated projects or facilities of national interest, since there are strong socioeconomic stakes or have significant impacts on the envi-ronment or country planning (here the country planning represents public policies undertaken for a balanced development of regions or for a spatial organization in accordance with a guiding vision). The CNDP later becomes an independent public authority (AAI, Autorité Administrative Indépendante) under the law of 27 February, 2002. This law can also define the conditions by which developers must offer some form of public participation – a Public Debate or a concertation, at the discre-tion of the National Commission.
¬ Section 6: Furthermore: “concer-tation is a process which continues to the actual completion of the project and even beyond if need be. It is advisable for partners to agree on a concertation path marked by stages and key times, each resulting in a progress report” 13 Project context, project benefits, project implementation.
¬ Section 7: “If the presence of a guarantor is proven appropri-ate, then he must be designated on a consensus basis as wide as possible. The concertation guarantor must be impartial and should not take sides regarding the case substance.” 14
¬ Finally in Section 8 it is made clear that, concertation is funded by the project owner, and the concertation assessment report has to be included in the public inquiry file if such an inquiry is prescribed.
The French public debate 15 is aimed at maturing opinions, forming per-ceptions and assessing changes or sustainability over time. Nevertheless concertation makes actors take in to consideration the stakeholders’ goals and ensure their compatibil-ity with a project implementation plan, through a dialogue that works within the practical necessities of the project and its specific purpose - struc-tured exchanges targeting a common interest.
The first step to setting up a concerta-tion, is to identify and review all stake-holders and to engage in individual interviews with potential participants (possibly represented by spokespeo-ple), and to submit them an initial assessment. The most complete and reliable information available must be provided to participants on request and as early as possible, thus ensuring the exchanges are in keeping with the goal of concertation.
ANNOUNCEMENT, SOCIAL CHARACTERIZATION AND CONCERTATION (2007)
Figure 2 shows the project’s general timeline and its main events as reported in the regional press. The project’s final investment decision was made at the end of 2006, and the first press statement was released February 8th 2007 (Total 2007b).
Total’s outreach activities, compre-hensively reported on their website (Total 2008), were voluntary and started well in advance of the formal administrative process (Cf. figure 1). C&S Conseils, a specialist communica-tion consulting company from Paris, helped to study the social context, define the project’s engagement methods, conduct the concertation and write the associated communica-tion materials. 01 (page 217)
Following the initial public announce-ment of the Project, a public infor-mation meeting was held at Jurançon in March 2007. The meeting was for people neighbouring the future injection site at Rousse. Generally, there were very few negative feelings evident at this meeting. The discus-sions centered on questions about the possible consequences, noise or visual impacts, land zoning change and financial compensations for the city.
Next a social site characterization study was performed to help organize the concertation. Between June and September 2007, C&S Conseils conducted about forty interviews with local and regional stakeholders: elected representatives including all the Mayors of the cities crossed by the pipeline, administrations, asso-ciations, businesses, and with the members of the project’s scientific follow-up committee.

226
This study led to the concertation itself that included:
¬ Commitment to a “Charte de la concertation” (Total 2007a) in which the company states the transparency guidelines according to which it will conduct the concertation. A guiding principle was that “All participants in public dialog do not take part in the final decision but all participants in the decision making take part in the public dialogue.”;
¬ Publication of a 52 page brochure (C&S Conseils 2007) and an 8 page synthesis document. The documents were organized around four topics:
¬ climate change; ¬ CCS technology; ¬ goals and characteristics
of the Pilot Project; ¬ impacts and conditions
of implementation; ¬ A section of about 10 pages
on climate change, CCS and the Project on the Total.com website, and Project exhibition displays at meeting places and at Pau Airport;
¬ Oral presentations and Ques-tions/Answers sessions at three public meetings organized in the town-halls of Jurançon, Pau and Mourenx. A total audience of about 300 partici-pants attended these meetings, which each lasted about two and a half hours. Talks by Total representatives were com-plemented and discussed by national experts from outside the Project.
Meeting summaries were published on Total’s website (Total 2008). The main local discussion topics were related to security, land value, image risks for other activities like wine growing and visual impact on the site. Discussions around the regional effects of the Project, centered on economic attractiveness, industrial development, jobs and taxes. General discussions around CCS, examined its costs, scale, additional energy needs, regulation, public subsidies, long term responsibility and risk control.
Concertation Outcome
According to Total 2008 the outcome of the concertation was first a clarifi-cation with respect to the agreements and disagreements that arose during the process.
All participants agreed that:
¬ Climate change is an urgent issue;
¬ Increasing energy conservation, efficiency and renewables is more important than CCS;
¬ A governance open to civil society is a goal to reach;
¬ The Total Project contributes to the economic renewal of the area;
¬ Risk management is an absolute priority.
There were two points of dissent around:
¬ The potential of CCS technolo-gy to mitigate climate change by reducing Greenhouse Gas emissions;
¬ Whether CCS should be regulated under the Mining Code or the Code for the Environment, a point linked with the question of the legal status of CO2 (is it a waste or not?).
There were several substantive outcomes of the concertation:
¬ An information day on climate change and mitigation options was held on October 2nd 2008 in Pau’s historical Congress Centre (Penot 2008);
¬ Agreement to continue the dialogue between parties by setting up a local commission on information and follow-up (Commission Locale d’Informa-tion et de Suivi, CLIS);
¬ Total promised they, “will help local projects related to climate change mitigation (provided they are supported by the city)”, and that discussions on taxes could be opened;
¬ After the concertation, the project’s neighbours formed an association – Coteaux de Jurançon Environnement (CJE) officially registered on January 16th 2008.
¬ The project’s technical plan was amended to decrease visual impact and noise. It was decided that the compressor at the injection site would be located inside a shelter.

227
Carbon capture and storage . The Lacq pilot Chapter 8: Community Outreach
FORMAL DIALOGUE AND AUTHORIZATION (2008-2009)
In France, large industrial projects have traditionally been justified by public interest and technical progress, with the State having the ultimate authority and responsibility for deeming what is in the national interest. However, increasingly, this centralized concept is being broken down with the relocation of a number of State competences to Territorial Administrations and local commu-nities (with decisions deferred to the State Authority only as a last resort). Therefore, regional and local authori-ties, as well as organizations from civil society, now demand to be more sys-tematically involved in decision-making.
The opening of a more inclusive public decision making process has been formalized in a stream of laws starting in the mid-seventies with the environmental impact assessment law of 1976 which was reviewed in 2002 in the context of the adoption of the Aarhus International Convention.
In April 2008, Total filed the administra-tive authorization request (Demande d’Autorisation d’Exploiter) with the Pyrénées Atlantiques (64) departmental Prefecture, in charge of examining the permit request under the DREAL regional authority.
This was the first CCS project to be processed in France, so there were no CCS specific regulations. This project would test the existing regulatory frameworks in France and help shape future CCS specific regulation in anticipation of a transposition from the European Directive. The pilot
project offered an opportunity to define a regulatory framework and set thresholds based on real meas-urements, and was to be progressed through a replicable acceptability process.
Communication and Consultation
During the spring of 2008, Total held meetings with Mayors and neighbors to the Project, adding a workshop in Jurançon Council in July, and an open site visit complemented with an information letter to neighbors in December. Total also established a dedicated phone line for inquiries, and published a quarterly newsletter.
Formal discussions on the project were conducted mostly at the CLIS ad-hoc commission (Commission Locale d’Information et de Suivi). The CLIS was officially enacted on April 30th, 2008 by the Pyrénées Atlantiques Prefect. In the absence of specific CCS regulation, the CLIS was created using the legal model of commissions es-tablished to follow-up on landfill sites and the “Cretaceous 4000” CLIS. The group included: 1 State representative; 9 locally elected officials; 2 delegates from workers’ unions; 4 from associa-tions; 5 experts and 4 Total employees.
The CLIS was established to discuss the authorization request and sit at least for the entire project’s life. It met 8 times between June 2008 and December 2009, about twice a year.
The CLIS heard formal reports on the Project from Total and experts like the BRGM (Bureau de Recherches Géologiques et Minières), the French Geological Survey. Its website (Commission Locale d’Information et de Suivi 2010), which was hosted on the Prefecture’s official
website, provides open access to the reports and a significant range of sup-porting material. The CLIS visited the installations twice. During the first visit they discussed the Project onsite with residents close to the Project site. Ultimately, the CLIS released a press release about the project, but did not conduct a formal public meeting at the storage site. The CLIS also asked for, and heard a report on, the history of accidents with natural gas in the area, reviewed the monitoring plan, security exercises and a local percep-tion survey. The CLIS also reviewed and improved the draft authorization document.
Associations opposing the project, CJE and SEPANSO Béarn (a fede- ration affiliated to France Nature Environment), participated actively in the CLIS meetings. At the outset, CJE’s moderate members were willing to engage with Total. These initial members (around 120 people) were from diverse profiles, and included both rural people who had been living in Jurançon for a long time, and newly arrived residents. At the end of Summer 2008, the association was not ready to organize big demonstra-tions, but could mobilize reliably a more radical faction in opposition to the project, for example protesting in front of the injection site during the CLIS visit.
¬ CJE’s scientific advisor sum-marized CJE’s sustained objec-tions in a column published in a leading national newspaper (Pépin 2009). Total was depicted as a big corporation that could not be trusted to develop CCS responsibly, and its concertation efforts were portrayed as mostly marketing or communication.

228
16. IFP Energies nouvelles is a public-sector research, innovation and training center active in the fields of energy, transport and the envi-ronment.
17. De Marliave, personal communication, 6/10/2010.
The risk analysis was criticized for not considering massive release scenarios (even though this was “not possible” according to IFPEN 16 who were advising Total on the project), and the security exercise was criti-cized for not directly involving neighbors;
¬ Opponents to the project ques-tioned the independence of the BRGM, and CJE argued that the project could have been reviewed by an inter-disciplinary panel including foreign experts. BRGM replied with four arguments: 1. BRGM, as the public reference
establishment for geosciences is legitimate to examine the permit request: providing technical expertise to the administration is one of the core missions it has been created for;
2. The assessment was only focused on aspects in which the BRGM is competent, and the expertise conducted by a newly created unit of 13 specialists of security and impacts of CO2 storage (BRGM 2009);
3. The unit’s personnel was not involved in site selection and characterization studies, and BRGM’s current research partnership with Total at the Rousse site are not connected to the injection permit request;
4. It would have been difficult to find CCS experts that had never been involved in a joint research project with Total.
¬ SEPANSO raised the issue that disagreements about the share of CCS in climate policies persist. They were not accepted as relevant by the CLIS, as they pertained to a national debate on energy policy choices;
¬ The opponents requested the release of more technical reports. Total argued commercial reasons to keep some documents out of the public domain, but invited the experts to consult them on their premises. The CLIS President noted that the existing legal recourse against the permit may hinder transparency.
An administrative public inquiry (carried out by the Préfecture des Pyrénées-Atlantiques) was held from July 21st to September 22nd 2008 in 4 cities. Participation was very weak in Lacq and in towns along the pipeline, 90% of the comments were received in Jurançon. CJE criticized this inquiry for being conducted during the summer holiday period, and for shaping the final advice to sound quite positive while 56 out of the 60 recorded comments were negative. However, the surveyors assessed that the replies by the project-holder to the objections raised by the citizens were satisfactory. In response to critics, it was stated that the survey was not a referendum and that 60 self-select-ed voices, that is less than 1% of the population, were not representative of the wider community.
A final technical problem had to be examined before injection: signals from the three seismic sensors at the bottom of the well were lost,
probably because of a broken optical fiber. Replacing the sensor would have delayed the start of injection by 9 months. Without the sensors at the bottom of the well, the seismic mon-itoring network would comprise of only the 7 sub-surface sensors, buried 200 meters deep. The permit specified that it was the operator’s responsibili-ty to determine the necessary number of sensors. Total’s case that the in-complete network would be enough to monitor the site integrity was reviewed positively by two independ-ent experts’ teams, so the Prefect did not cancel the authorization.
Municipal elections were held in March 2008. The project was not an issue in the campaign debates, as it was seen as a politically risky topic with little benefit for candidates in raising it. The newly elected Mayor in Jurançon initially took a stance against the Project, backed by a unanimous vote of the Municipal Council. The building permit for works needed at the injection site was not granted at first presentation, and had to be revised before being accepted.
Besides the Jurançon Mayor and Lacq’s cities community (Communauté des Communes de Lacq), other local elected leaders were mostly absent from the negotiations. From an initially tense relationship, after several meetings and site visits, the Jurançon Mayor’s position evolved and became favorable to the Project. The move dissatisfied a faction of the population. A partner-ship agreement was signed in April 2009. The agreement was described by Total 17 as follows:

229
Carbon capture and storage . The Lacq pilot Chapter 8: Community Outreach
04: Inauguration of the CO2 capture and storage facility in Lacq (France), January 11th 2010: Valérie Letard, Secretary of State for Green Technologies, and Christophe de Margerie, Chief Executive Officer of the Total Group: “Our added value lies in our ability to develop increasingly complex resources from every point of view: technical innovation, environmental impact, social acceptability, political implications, etc.” Photography, caption, and quotation from Shareholders newsletter, 32, Spring 2010, Total.
“Total has signed multiple patronage and sponsorship agreements in the Aquitaine region for decades, and Total Exploration Production France (TEPF) has a 50 year history on these oil production sites. This new storage project was hence framed in the broader context seeing the end of TEPF activities in Lacq and the satellite fields by the end of 2013, due to gas reserve depletion. This decline of a historical activity important for the region is subject to a policy of support and assistance in regional re-industrialization. It is also notable that the CO2 injection required stopping natural gas production from the well, which was modest but nevertheless represented a direct income for the town.
Within this overall framework and without any mention of specific Rousse pilot, a spon-sorship agreement for the amount of €1.5 million was signed with the municipality of Jurançon to assist in the implementation of community projects especially in the field of sustainable energy (solar panels). More recently, the press echoed a sponsorship agreement of TEPF for the Region (an amount of €5 million was mentioned). This agreement is linked to the reduced activity of TEPF due to the end of the gas exploitation, and its connection with the storage project is all the more tenuous as the project has been underway since May 2009.”
The sponsorship agreement was not all new money specific to the new storage project, but rather a consolidated reappraisal of already granted monies.
The capture, transport and storage project was finally permitted on May 13th 2009, 27 months after the initial press conference. There are no injection taxes. The first injection happened on January 8th 2010, and on January 11th 2010, Valérie Letard, State Secretary in charge of green technologies and climate negotiations and Christophe de Margerie, Total CEO, formally inaugurated the CCS Research Pilot.

230
A questionnaire survey was designed and sent to the most sensitive fraction of the population of the city of Jurançon – those living closest to the planned CO2 injection area. The area is partly rural, (mainly vineyards), and partly low density, residential housing, principally wealthy families and a significant proportion of retired people.
The survey was sent to named residents, with a stamped return envelope, and reached 1,206 mailboxes concentrat-ed in the area of the pilot project (roughly one third of the mailboxes of the more than 7,000 inhabitants of the city).
The survey was sent out in October 2008, before the authorization but after the formal public dialogue so that most inhabitants should have been aware of the project either through the 2007 concertation or through the public inquiry set up during the summer of 2008.
The response ratio was 14%, which is satisfying compared to the 8% - 10% that was expected: 167 responses were received – 153 were completed, 14 were returned clearly marked ‘will not respond’, it is assumed that these were from the most radical part of the CJE who saw a survey as potentially weakening its position.
SURVEY OF THE JURANÇON POPULATION AREA AROUND THE INJECTION SITE (2008)
8.4
Unsurprisingly retired people repre-sented a large share of the respondents (42%), while 28% were employed in private companies, 12% in a public organization, 12% were independent workers, and 3% unemployed. This response ratio is good considering the survey length of 89 questions. The survey was organized in 5 parts: general questions about the context, information about the CCS Pilot, the concertation organized by Total, the formal dialogue (public inquiry and CLIS) and social acceptance.
CONTEXT
A first set of questions about the general and local context of the CCS Pilot was meant to evaluate the respondents’ sensibility to global environmental and social issues.
To the question “Among the environ-mental issues, which do you feel to be the more worrisome? (two possible answers)”, climate change came first (48%), before water pollution (29%), air pollution (26%), forest destruction (21%), overexploitation of agricultural resources (15%), soil contamination (13%), ozone layer reduction (10%), GMO (9%), and noise (5%).

231
Carbon capture and storage . The Lacq pilot Chapter 8: Community Outreach
INFORMATION ON THE CCS PILOT
Although information has been spread through newspapers, meetings organized by Total, and the formal public dialogue, there were still 7% of the respondents who said they had no information on the project. About 40% indicated that the first time they received information on the project was in 2007 (during the concertation organized by Total), another 9% stated
THE CONCERTATION ORGANIZED BY TOTAL
40% of the respondents knew that Total had organized concertation meetings. This information came to them mainly from the press (57% of respondents). Only 13% of the respondents had attended the meetings and even less (7%) had knowledge of the proceedings or outcome of the meetings.
FORMAL PUBLIC DIALOGUE (ORGANIZED BY THE PREFECT)
70% of the respondents said that a public inquiry was important to take into account the interests of those people living closest to the project. But only 9% said they actually partici-pated in the public inquiry. 33% of the respondents declared that they had heard about the existence of the Local Commission on Information and Follow-up (Commission Locale d’Infor-mation et de Suivi, CLIS), and only 10% had been informed of the results of its first meetings.
SOCIAL ACCEPTANCE
The injected CO2 was to be stored in an old gas extraction well. People in Jurançon are used to seeing gas wells and gas pipe manifolds which have been operating for more than 40 years in their landscape. When asked if they felt that Total had a good risk manage-ment record on those wells and pipes: 40% responded yes, 18% no and 40% did not know. 31% declared having experi-enced some nuisance from these instal-lations, while 69% had no nuisance.
For the following questions, 82% completely agreed or agreed with the idea that Humankind is completely responsible for climate change, and 91% completely agreed or agreed that it is urgent to act against climate change. When asked the question of what to do, the respondents over-whelmingly selected renewable energies and reduction of energy consumption.
Among the CO2 storage techniques, the respondents choose the biological solutions (storing carbon in forests, before geological storage. At this time the result may reflect a common vision of a biological solution by which the CO2 is “destroyed”, as opposed to the vision of a geological disposal where CO2 is merely stored with a risk of leakage.
After the series of questions on global issues, the survey goes into questions on local issues. Answers differ signifi-cantly from those to global questions. When asked which of the local problems is the most worrisome, climate change ranked seventh, after poverty and exclusion, environ-mental degradation, globalization, unemployment, technological risks and safety/terrorism.
that this was at the beginning of 2008, 28% in the summer of 2008 (during the public inquiry) and 16% in the Autumn of 2008 (at the time of the survey).
When asked about how they were informed about the project, 41% of respondents cited the local press and other media. Total’s newsletter sent by mail and information meetings were the information source for 27% of the respondents. The rest got their information mainly by word of mouth (24%). Only 10% of respon- dents declared they had accessed the Total website or other sites. Yet 55% of the respondents stated that the information they had on the Pilot was not sufficient.
When asked to indicate the most interesting aspects of the Pilot (several answers permitted), the respondents most cited response the scientific interest of the Project (65 responses). Less respondents cited economic de-velopment (29 responses), employ-ment (27 responses), and industrial attractiveness (23 responses).
When asked “which information source can provide you with addition-al information on the project” (several answers permitted), Scientists came first again (60 responses) and national environmental associations second (35). The information sources selected less frequently were Total, local poli-ticians and local associations, with about 20 citations each.

232
Asked if there was still a need to negotiate on the Pilot’s implementa-tion, a majority of respondents (51%) were affirmative. A small minority (15%) felt there was no need for addi-tional negotiation, and one third had no opinion. It should be noted that these answers came after the public consultation.
Asked about who should participate in the negotiations on the Pilot’s implementation, respondents covered a wide range of stakeholders as follows: neighbours and their asso- ciations (35%), local elected represen- tatives (25%), environmental associations (22%), local services of the State (13%), and other interested industrials (5%).
Finally, the respondents were asked under which conditions they could subscribe to the Project (several answers permitted). Environmental protection guarantees came first (72 answers), along with safety gua- rantees (68 answers) and guarantees on the long term future of the injection site (51 answers). A few responses mentioned respect of cultural heritage (21 answers), jobs creation (20 answers), and financial compen-sation (15 answers). Five respondents answered that the existing conditions were enough, as opposed to 32 who indicated that they would not accept the pilot under any condition.
The survey results confirmed the wide differences in perception between local and global issues. Locally, social and local environmental issues are perceived to be much more important than climate change.
The questions about Project informa-tion demonstrated that the media and word of mouth are the primary methods for people accessing Project information, and that attitudes are weakly proactive in the search of
information. The results also suggest that people have well contrasted opinions on the quality of their information sources. The low use of the available infor-mation could be due in part to the mistrust in information provided by Total.
Having started at the beginning of 2008 before the public inquiry, the CLIS had met several times before the opinion survey; its proceedings were available on the web. Answers about the CLIS and about the public inquiry corroborate the idea that, except for radical opponents, people have low motivation for direct participation in the formal public dialogue organized by the law. This result fits with the general conclusion of (Fourniau 2011) that the French model of public debate is waiting for a rebound.
Since most people did not engage in the concertation, to them the cost of negotiation is very small. This may explain why the demand is so high. Even after the significant diligence of the industry and administration, most respondents asked for more discussions regarding environment, safety and long term follow-up. This may point to the relevance of an enduring negotiation commission, the CLIS, as opposed to the one-shot public inquiry.
18. Authors’ translation from : “ Il y aura toujours des gens qui auront des doutes sur la technologie du stockage du CO2 dans le sous-sol ” (...) “ Dans le cas de Jurançon, nous avons convaincu plus qu’une majorité de personnes. Cela ne veut pas dire qu’il faut lâcher pour autant, et arrêter d’informer ”. Sud Ouest, “ Le C02 dans le sous-sol : c’est parti ! ”, 12 janvier 2010. 19. Authors’ translation from : “ L’association paloise pour la défense du climat Coclipau et Coteaux de Jurançon Environnement appelaient au rassemblement, samedi
05: in Sud Ouest journal, 2010 January 12th and 2011 March 14th (Extracts).
Christophe de Margerie, Total CEO, addressing jour-nalists on the 2010 January 11th inauguration day : “Some people will always have doubts about CO2 storage in the subsurface“ (...) “in the case of Jurançon, we have convinced more than of the majority of people. That does not mean we can let go and stop informing”.18 In “CO2 into the subsoil: that’s gone for real!”, Sud Ouest, January 12th 2010.One year later: “Climate : putting an end to burying our heads in the sand”
“The Pau climate defense association Coclipau and Coteaux de Jurançon Environnement called for a demonstration on Saturday morning in Clémenceau Place to denounce the current pilot of CO2 storage under Chapelle de Rousse, by Total, and the hazards one may fear for the population. In the light of Japanese events showing that man cannot tame nature, demonstrators were calling for us to stop burying our heads in the sand to not see the danger. To this end, they had made an ostrich from recycling materials”.19 Photo Guillaume Bonnaud, in Sud Ouest, 2011, March 14th, Pau.
matin, place Clemenceau. Un rassemble-ment conçu pour dénoncer l’expérimen-tation en cours de stockage du CO2 sous la Chapelle de Rousse, par Total, et les risques qu’on peut craindre pour la population. À la lumière de l’actualité nippone qui montre que l’homme ne peut dompter la nature, les manifestants appelaient à cesser la politique de l’autruche, qui consiste à plonger la tête dans le sable pour ne pas voir le danger. Ils avaient, pour cela, réalisé une autruche à partir de matériaux de recyclage. ” Sud Ouest, 14 mars 2011, Pau.

233
Carbon capture and storage . The Lacq pilot Chapter 8: Community Outreach
THE SOCIAL IMPACT, AS READ FROM THE PRESS (2005-2012)
8.5
As the survey indicated that information mostly comes to citizens through the local press, the main daily newspapers were analyzed over the period 2005 - 2012 for articles referring to the Lacq CCS Pilot Project. This gives us a vision of the social impact of the Project.
At the national press level, influential general news titles Le Monde, Liberation and Le Figaro, and influential business news titles La Tribune and Les Echos mention the Lacq CCS project only sporadically, always in the context of the more general question of CCS. We conclude that this local project never became an object of public debate at a national level.
At the regional level of Aquitaine, the dominant newspaper is Sud Ouest. This daily journal, founded in 1944, was France’s second largest regional newspaper in 2010 with more than a million readers (Audipresse 2010, EPIQ survey). Over the period going from 2005 to 2012, 124 articles mentioning the Lacq CCS project can be found. The news sample includes a dozen duplicates (generally not published on the same day), since the journal shares editorial content in its 21 local paper editions and its website. In comparison with other local or regional newspapers, Sud Ouest is the only French daily newspaper to have reported steadily and speci- fically about the Lacq CCS implementation. Figure 6 shows the time distribution of these articles. 06
06: Sud Ouest quarterly number of articles relating to the Lacq CCS pilot.

234
The analysis that was conducted relied on encoding each article along two dimensions. The ‘incremental news value’ related to the formal stages of social and political decision-making process (project, stances, debates, decisions) was first assessed. These stages are not irreversible steps in a waterfall process - a deliberative processe can iterate back and forth as needed. Then articles were distinguished according to their territorial circulation, with four types of editorial localization: (1) publishing only in the local editions for Lacq, Rousse and Pau, that is in “Béarn or Béarn & Soule local editions”; (2) in “other local editions”; (3) in newspaper pages common to all editions, that is in “general editions”; or yet (4) on the newspaper “website only” (not printed). Figure 7 shows the distribution of articles over time along these two dimensions. 07
The project implementation had four crucial moments. These correspond to the local maxima in figure 6 when the project was discussed relatively more in the press, and providing information relating to “upper” news value levels. They are:
¬ The concertation organized by Total in the final quarter of 2007; ¬ The positive vote of the local Lacq’s Cities Community Council (Communauté
de Communes de Lacq) on July 3th 2008. A few days later, the city council of Jurançon voted a motion of distrust (despite being formally represented at the Lacq’s Cities Community Council);
¬ The official pilot inauguration in January 2010. Surprisingly the inaugura-tion was treated as news of local interest, as opposed to the November con-certation procedure, or the July 2008 votes, which had been reported in the
06: Sud Ouest quarterly number of articles relating to the Lacq CCS pilot.
general editions. It was not only due to a reported turbulent local context, but also to the high R&D stakes of the event being seen as local rather than regional. Valérie Letard, the State Secretary for Green Technologies and Climate negotiations attending the inau-guration, said: “before long, Lacq will be a recognized site all over the world and will undoubted-ly gain followers…” 20 A first achievement came as Lacq CCS pilot stimulated the creation of “Avenia”, a specialized geo-sciences cluster Total belongs to. Avenia, is, sited in Pau and in mid 2010 was granted a govern-mental “National competitive cluster” label (Pôle national de compétitivité). This local success was published again as a highly important local news; 06
20. “D’ici quelque temps, Lacq sera un site reconnu dans le monde entier et fera sans doute école.” Sud Ouest, January 10th 2010, “Le C02 dans le sous-sol : c’est parti !”

235
Carbon capture and storage . The Lacq pilot Chapter 8: Community Outreach
¬ Debates in 2011 about whether the injection permit, initially given for two years, should be extended remained an important local news item until the administration’s positive answer (depending on the DREAL) on November 14th 2011, again published in Sud Ouest general edition. The extension permitted injection up to July 8th 2013. It restricted the total quantity of CO2 injected to 90,000 t in agreement with norms defined by the newly published European Directive on CCS research projects, which did not threaten the project’s technical or scientific integrity.
Overall, the chart shows that the project trended as a news topic in the regional press between 2007 and 2011. A public debate existed before and after the public inquiry period, as shown at the “stances and demonstra-tions” news value level. But a progres-sive shift in the press interest should be noted: while the debate about the post-production and the industrial future of the area remains active, the debate about the local consequenc-es of the CCS project was sidelined progressively since mid 2010.
The National label “pôle de compétitivi-té” gained by Avenia in 2010, changed the nature of public debate to a focus on a new emerging economic development possibility for the Pau area, around geosciences, with both regional and national outreach.
The upper “implementations and decisions” level of the chart shows suc-cessive critical events:
¬ Avenia being granted a national label was covered in a Béarn edition in 2010;
21. http://www.pole-avenia.com/index.php/nos-services/geoscopie http://www.geoscopie.fr/ 22. Authors’ translation from French : “ Un label national vient d’être accordé au pôle de compétitivité Avenia. D’ici une quaran-taine d’années, les énergies fossiles, comme le pétrole, auront vécu. D’autres énergies devront prendre le relais. L’Aquitaine a une carte à jouer dans ce domaine. C’est dans cette perspective qu’a été créé le pôle de compétitivité Avenia. Celui-ci regroupe 130 entreprises implantées dans la région, parmi lesquels des géants comme Total, mais aussi des unités de recherches, des universités et des organismes de formation professionnelle. Des activités qui représen-tent 6 000 emplois directs et 25 000 emplois indirects. (...) ” in Sud Ouest, 2010 May 25th, “ Les chances de l’Aquitaine sont aussi sous terre ”, J.J.N.
¬ In 2012, a general edition covered Avenia launching Geoscopie 21, a platform of strategic and economic intelligence relating to Geosciences (this grew out of a partnership with the Chambers of Commerce and Industry (CCI) of Pau, and Aquitaine at a regional level).
08: in Sud Ouest journal, May 25th 2010, and La République des Pyrénées, November 19th 2010 (Extracts)
Chances of Aquitaine are below ground, too. Sud Ouest, May 25th 2010Geothermy, one of Avenia leads to work on. Photo Pascal Bats.[Extract] “A national label has just been granted to the competitive cluster Avenia.In about forty years, fossil fuels, like oil, will have had their times. Other energy sources will have to take over. Aquitaine has got a card to play in this field.It is in that perspective that the Avenia competitive cluster was created. The cluster regroups 130 regional
firms, including giants like Total, but also research units, universities and professional training or-ganizations. Activities that represent 6 000 direct jobs and 25 000 indirect jobs (…).”22
Pau University chooses the geoscienc-es card. La République des Pyrénées, November 19th 2010. Geosciences were the focus of the forum held yesterday at Pau University. ©Photo Olivier Clavé.[Extract:] “Geosciences industry is a major sector in Béarn, amounting to 2 billion Euros spin-offs per year, more than 4 000 direct jobs, and 23 000 created jobs.The will of the University is also to mark its specificity in the higher education field (…) In addition to Master students, ENSGTI and EISTI engineering schools had come and taken part in the event. “Geosciences are trans-disciplinary subjects. They gather physics, chemistry as well as mathematics”, emphasized Jacques Mercadier the ENSGTI Director (…).”23
La géothermie, l’une des pistes de travail d’Avenia. Photo Pascal BATS 23. Authors’ translation from French : “ (...) L’industrie des géosciences est un secteur majeur en Béarn, avec deux milliards de retombées économiques par an, plus de 4000 emplois directs, et 23 000 emplois induits. La volonté de l’université est aussi de marquer sa spécificité dans le milieu universitaire (...) Outre les étudiants en master, les écoles d’ingénieurs ENSGTI et EISTI étaient venus prendre part à l’événement. “ Les géosciences sont des matières transdisciplinaires. Elles réunis-sent la physique, la chimie mais également les mathématiques ”, souligne Jacques Mercadier directeur de l’ENSGTI (...) ” in La République des Pyrénées, 2010 November 19th, “ L’université de Pau joue la carte des géosciences. ” Les géosciences étaient au cœur du forum organisé hier à l’Université de Pau. © Photo Oliver Clavé.

236
From the Sud Ouest journal, there was also a change towards addressing the readership’s scientific, economi-cal, social, industrial and political interests at a widened regional level. Such an epilogue fits well with the 2008 survey results about what local respondents cited as “interesting aspects” of the Lacq CCS Pilot Project: These are not only their reactions to a nonstandard project, but their expectations relating to its imple-mentation – in other words the ex-pectation that this Pilot Project could be demonstrating a future standard climate mitigation option.
However, a comprehensive analy- tical approach must differentiate between reconstituting a thread of press contents ex post, so retro-spectively recognizing variations in press coverage during the period (Cf. figure 6, page 234), and follow-up press reporting as it appears imme- diately from the daily editorial practice, forward looking but still uncertain of the changing course of events. The value of news is associated with their new or updated information content, but what actually underpins their relevance to readers (newswor-thiness) stems from a selection from among massive and proliferating flows of news that journalists must process before their daily editorial meeting. Journalists must anticipate the readership’s concerns, and thus represent their political news value the same day, of which the reflexive 24 counterpart is the readership’s will-ingness to pay for news. We may reasonably infer such a speculative use of readership’s concerns is editorially
to take charge of the current public debate reflexivity, so that we have to restitute it discretely and sequentially (Cf. figure 6).
Insofar as the general “non free” daily press has the function of supporting this double upgrading of informa-tion (updating and current reflexivity) to address a maximum readership, such an upgrading tends to overlap the most prospective and sharable contents rising as (fairly typical in political sciences) “political general-ity” (that is not a consensus!). French regional press is historically closer to its territorial markets than the national press, and is jealously aware of its audiences special needs with a community dimension fostering a more intensive reflexivity and the rising of “political generalities”.
The journal Sud Ouest characteristical-ly reported news about the Lacq CCS pilot in a local dimension (CCS con-certation, CLIS, interviews with stake-holders, Lacq basin industrial context, social and political implications). In a regional dimension it was more clearly focused on political elements, through territorial institutions hier-archical interplays (prefectural bylaws dependent on DREAL assessments).
However, it also reported news about:
¬ Induced prospective issues (safety or environmental hazards, codes and laws);
¬ Policy challenges (Climate change and carbon price, renewable energy, sustainable employment);
¬ Stakeholders’ strategies related to retroactions between scien-
24. Reflexivity refers to the importance of eliciting relevant facts prior envisioning what is considered to be consequences.
25. The “formal participation” motivates mainly the stakeholders, and among them (or formally represented), the potential opponents of a specific project and people anxious to listen to the arguments put forward and feedbacks provided in response. All of them give support to the formal participation process itself for transparency, and in some cases wish to ensure the largest audience from media. It means a participation process may not get or provide the whole potential audience, even if publication is regulated (as for public inquiries).
tific and technological research and sustainable development or energy transition (technical or scientific expertise and meetings, ONG stances, Pau University, Total group and industrial clusters, elected representatives engagements and visions).
Thus the journal systematically placed regional strengths and advantages in a common context that is the basic community “generality”. Through an editorial policy combining local and general editions to address a maximal audience, the regional journal Sud Ouest demonstrates an ability to discover and stimulate latent reflexive relays within the general public debate and get a sense of territorial capabilities of the general public within the region.
Faced with social acceptability issues arising in local debates, regional news outlets demonstrate responsiveness opportunities partially offsetting the limited “formal” participation 25 in local debates by widening the scope and redirecting most of the missing public attention towards the less focused regional stakes reflex-ivity. Conversely local stakes lacking generality at a local level may be framed within coherent dynamics and issues at a regional level. This was especially

237
Carbon capture and storage . The Lacq pilot Chapter 8: Community Outreach
the case with regards to the CCS Pilot shifting from the Lacq Pilot accepta-bility and project operating topics, which alternated between the Béarn local edition and the general edition of Sud Ouest (Cf. figure 6, until 2010), to a derived geosciences & CCS topic first in Béarn local edition only (Avenia, 2010), then finally in a general edition (Geoscopie, 2012); but the latter topic – simultaneously as a geoscienc-es & deep geothermy topic, again involving Avenia based in Pau (Béarn) – alternated from 2010 between other than Béarn local editions and general editions (still addressing Béarn read-ership as well). In this way providing a second thread of news addressing local and general readerships with ad-ditional concerns, no more only the CCS, but geothermal power (graphical-ly not represented in figure 6).
Since 2010, the political generality, sustaining the same development paradigm, has moved from CCS to geosciences at large. It should be noted that a geosciences supply existed earlier in Aquitaine, a region with numerous winegrowing and geothermal areas, also ready to welcome new developments and active centers (Cf. figure 6).
Nevertheless such a process – media upgrading of current reflexivity accompanied by a political general-ity rising – can only be achieved if a wide audience can be attracted. If so, a question then arises: does the media coverage impair or undermine the local public participation, or, does it enhance a local public debate by raising public awareness of the debated issues and adding to context by addressing a wider audience?
The initial concertation process already gave evidence that the public debate challenge is not at first quanti-tative, but one of qualitative dialogue and of legitimacy of issues and results: it is not a voting, but a multipath information process, the goal is to optimize a project without any information distortion, or unexpected significant issues. It is not surprising therefore that after the concertation and public inquiry there remained questions related to the project acceptability and needs for informa-tion raising from even the action implementation (Cf. figure 6). More broadly, figure 6 highlights the public debate propensities at all territorial scales, and reflects a scalability having to be taken into account. In the Lacq CCS case, after the concertation and the public inquiry ending in 2008, the pilot implementation period and the three years following CO2 injection provided this evolution and the corresponding rising generality with useful time, in a particular and complex initial context (Lacq after gas and employment issues, engineering schools and Pau University declining attractivity, novelty and acceptability of an integrated CCS system pilot). Conversely, the widening public debate scope, gave the local public debate broader and more accurate perspective and context, thus stimu-lating reflexivity and enhancing local capabilities for the action acceptance.
Figure 6 alternates well contrasting territorialized sequences from 2007 until 2010 with a clear editorial policy that demonstrates the local public debate was not eclipsed by a leading regional development generality, while the official pilot inauguration
under the auspices of the French State in January 2010 was clearly a turning point (Cf. figure 6). Then the suc-cessful completion of the CCS chain experimentation until March 2013 never undermined the need for a happy epilogue of the public CCS debate, and here it is the rewarding shift to the scope of a regional geosciences development for energy transition from a local and fertile anchorage.

238
In this case, Total demonstrated a strong will to engage in a concer- tation, allocating significant resources early on: hiring a consulting firm and allocating senior engineers time to answer questions arising from the process.
The concertation covered the whole territory, from the capture site in Lacq, where acceptability was likely from the start, to the storage site in Jurançon where acceptability was less certain. Social conditions were very favorable for the project. For two generations, the operator (Total) has been the major economic (and therefore political) power in the area, and has consistently demonstrated that it can successfully control high risks. The project offered direct and indirect support for local economic development, and a future use for a gas field facing depletion and the resulting decrease in economic activity. Furthermore, research on CCS is supported nationally and internationally by scientists and Governments. This international confidence in the technology helped to ensure the Lacq Project received its permit.
Still there are lessons to be learnt. Total’s position would have been stronger if its permit request had been audited by a different team, and if it had more specific long-term plans. Because concertation meetings were held before elections, the local officials could only take a non-
DISCUSSION, LESSONS LEARNT AND CONCLUSIONS
8.6
committed stance. Using a Parisian consulting firm to moderate the discussion, and employing hostesses to hand out the information packages was not appreciated by the people of Jurançon.
Total, following the advice of the President of the national commission on public debates, did not mass-mail the community with information on the project. Consequently, citizens came to the meetings to receive information, not to defend a stance in a debate. Another reason why the public participation in the discussion was low is that smaller formats might have been more interactive.
This case exposes the difficulty of modern governance. A balance between concertation, information and representation has to be found for each issue, depending on local ethics and customs as well as science and technology. As concluded by Ha-Duong and Chaabane eds. (2010), this balance can only be found prag-matically. Technology policy is pro-gressive and interactive; it needs projects to go forward. The Lacq Project contributed to the regulation framework itself.
The CLIS worked well, but the formal public inquiry came a little late in the procedure and did not interest many citizens. Risk management studies were revised, and landscape integration in the environment was improved. Landscaping is the sensory interface with the community.

239
Carbon capture and storage . The Lacq pilot Chapter 8: Community Outreach
The process of consultation, which aims to be a process of open dialogue was strengthened and legitimized by the foundation of the residents’ association CJE. The radicalization of CJE’s position during the concer-tation process impacted the balance of the public discussions with the project holders at CLIS. Total had to adjust its position, and could not do this without an understanding of the values expressed by the public at meetings of the association.
It might have been presumed that since geological storage is a highly technical subject, there was some rationality in technocratic decision making, where executive powers are delegated to Elected Representatives and State’s Engineers. Most citizens know very little about geosciences, and might err on the side of too much caution when asked about an R&D project, since research means that there is a knowledge gap somewhere. In this case, the argument needs discussion, since some neighbours were perfectly knowledgeable about the Rousse Reservoir, having worked at Total. We observed that the citizens tied to Total, retired or still active, exercised self-restraint in the public debates.
The case also highlights the issue of independence. As for many new technologies or drug assessments, CCS experts generally have an interest in the development of CCS. Local people in the administration, in the industry and even in the university or in the environmental associations mostly belong to interrelated social networks. Local political representa-tives are often reluctant to take sides on socially dividing matters, while Prefects as State Servants are in charge of communities and institutional procedures.
It is believed that, far from being a problem, strong communication links on the human or civil side is a strong asset for governance. Beyond sharing knowledge, a key to the successful co-construction of a social innovation is the widening and deepening of the real “social networks” behind it. In this case, providing information empowered the local community to act. Having concerned citizens asking pointed questions to experts, balances power and creates its own momentum. The fact that the concertation led the neighbours to create an association of opponents to tackle their own concerns probably improved the quality and the legitimacy of the CLIS debates.
ACKNOWLEDGEMENTS
This case study was funded by the CNRS and the Agence National de la Recherche, France, under project SOCECO2 ANR-06-CO2-009. Minh Ha-Duong was principal investigator on the project. Benoit de Guillebon was co-principal investigator for APESA. Michèle Gaultier contributed specially on the survey described in section 5, Gilles Mardon contributed specifically on the press analysis report in section 6. All authors contributed to writing and revising the manuscript.
240
The Lacq pilot allowed to qualify a complete CCS industrial chain and to implement new monitoring methodologies to ensure a safe underground storage of CO2. Beyond the technological interests, it was also an opportunity for the Total project team to introduce an innovative acceptability process involving local residents, elected representatives, ONG’s, citizens’ groups.The main objective was to build a real
“

241
Carbon capture and storage . The Lacq pilot Chapter 8: Community Outreach
dialog before starting any construction work to explain all aspects of the project with as many people and groups as possible to ensure that they were informed and we were aware of their concerns. It was a positive experience. In today’s business environment, no project can truly succeed without a constructive dialog with the stakeholders, the local community and the wider general public; therefore, a genuine and interactive acceptability process is essential.”Thierry Debertrand, Vice President HSE Total E&P

242
EXECUTIVE SUMMARY
“When the Ministry of Ecology gave the go-ahead for the Lacq CO2 pilot, there was no regulatory context for oversight. European experts on the subject devised a framework directive for the whole of Europe, and BRGM then worked to transpose it into French law. Here again, the pilot was a great opportunity to define a framework and thresholds based on real measurements.”FRENCH GEOLOGICAL SURVEY (BRGM), Catherine Truffert, Research Director
author
J. Monne (Total)

Carbon capture and storage . The Lacq pilot Executive Summary
243
After quenching, the CO2 th
steam boiler is compressed (to 27 barg), dried and transported as a gas phase
injected in the deep Rousse reservoir. During 39 months of the injection period, 51,340 metric tonnes of CO2 have been injected.
Total’s main objectives of this experiment were:
¬ To demonstrate the technical feasibility and reliability of an integrated chain comprising CO2 capture, transportation and injection into a depleted gas reservoir and steam production.
¬ To acquire operating experience and data to upscale the oxy-combustion technology from pilot (30 MWth) to industrial scale (200 MWth) while downscaling the “oxy-combustion” capture cost compared to classical post capture technologies.
¬ monitoring methodologies and technologies on site to serve in future onshore storage monitoring programs that will be larger in scale, longer in term and economically and technically viable (microseismic monitoring, environmental monitoring).
¬ To promote CCS knowledge sharing among the public, companies, associ-
results, project achievements and lessons learnt.
THIS PILOT PROJECT ENTAILED THE CONVERSION OF AN EXISTING AIR-FIRED BOILER AND OXY-FIRED BOILER, USING OXYGEN DELIVERED BY AN AIR SEPARATION UNIT (ASU) FOR COMBUSTION TO OBTAIN A MORE CONCEN-TRATED FLUE GAS/CO2 STREAM.
01

244
CAPTURE AND TRANSPORT
The CCS pilot installations consist of an ASU, an oxy-combustion boiler, a direct cooling contactor, a CO2 compressor, a dryer system, transportation pipelines and an injection site (including a compressor, an injection well, a reservoir and a subsurface seismic network).
The oxy-combustion boilerp
A new dedicated ASU was installed on the Lacq gas treatment complex by the French company Air Liquide, to produce 240 t/day of low-pressure oxygen (1.8 Bara) at a purity designed to vary from 95% to 99.5% vol. Only 99.5% pure oxygen is used to feed the oxy-combustion boiler. The nitrogen rejected by the ASU is partially used for regenerating the dryer system.
--
tion boiler, with pure oxygen replacing air for the combustion of natural gas.
burners were replaced by four 8 MWth
Liquide for oxy-combustion. This tech-nology is specially designed to manage heat transfer inside the combustion chamber, without requiring special construction materials, and to adapt the combustion characteristics to a conventional heat exchanger design.
to trials at a 1 MWth oxy-combustion cold-wall test rig (Air Liquide Center),
variable rates.
adapted to oxy-combustion, mainly by improving sealing to limit air in-leak-
recycle duct and a fan, through
the inlet of the oxy-burners to dilute
temperature inside the combustion chamber at an acceptable level. After this revamping, handled by our in-dustrial partner Alstom, the boiler pressure was slightly higher than the atmospheric pressure.
This 30 MWth oxy-boiler started up in 2009 and has produced up to 38 t/h of HP steam (60 bars and 450°C) to feed the HP network of the Lacq industrial complex. 03
31-34% volume of CO2 and 62-65% volume of H2O along with other components such as nitrogen, argon and oxygen.
03: Lacq facilities ©2011-Laurent PASCAL
02: Detailed diagram of the capture and transport system

Carbon capture and storage . The Lacq pilot Executive Summary
245
CO2 treatment, compression and transportation
in a direct cooling contactor, and most of its water is removed by condensation. The dry CO2 stream goes to the Lacq CO2 compressor.
The Lacq CO2 compressor is a three-stage reciprocating compressor with 1 MW power, designed to compress the CO2 Stream from 1 barg up to 27 barg. A supple-
stages of the compressor. Two molecular sieves remove the residual water from the CO2 stream, giving a maximum concentration of 30 ppm vol. eliminating any condensation in the transportation pipelines.
The CO2 stream is sent to the Rousse injection compressor via 29 km of pipeline (12” seguing into 8” diameter) as shown in the Figure below. Ten emergency shutdown valves are installed along the pipelines to minimize the consequenc-es in the event of pipeline leakage. Depressurization devices are also available. The pipelines are made of carbon steel and were used for over 30 years to transport natural gas produced at Rousse to Lacq. They were subjected to an in-depth inspection before being reused.
-meters south of the town of Pau and its suburbs (around 140,000 inhabitants).
The Rousse compressor is a one-stage re-ciprocating compressor with 330 kW power, designed to compress the CO2 stream from 27 barg up to 51 barg for injection in the reservoir. It is housed in a shelter to minimize visual impact and noise in accordance with the population request issued during the public dialogue period.
The CO2 is injected through an existing well, Rousse-1, which was used from 1972 to 2008 to produce wet sour gas. Rousse-1 was selected after cement and corrosion logging undertaken in 2006. A workover was organized in early 2009 to convert the well into an injector. It was equipped with four pressure sensors, four tem-perature sensors and three microseis-
-pletion.
Prior to the injection phase, an extensive characterization phase was conducted to verify the characteris-tics of the CO2 storage site, namely its capacity, the injectivity and the con-tainment properties. This assessment phase included the characterization of the geological context, the geolog-ical integrity of the reservoir, and the well integrity. It also contained the analysis of impacts, hazards and risks, from which the monitoring plan was derived. 04
04: Detailed diagram of the 29 kilometers pipeline from Lacq to Rousse
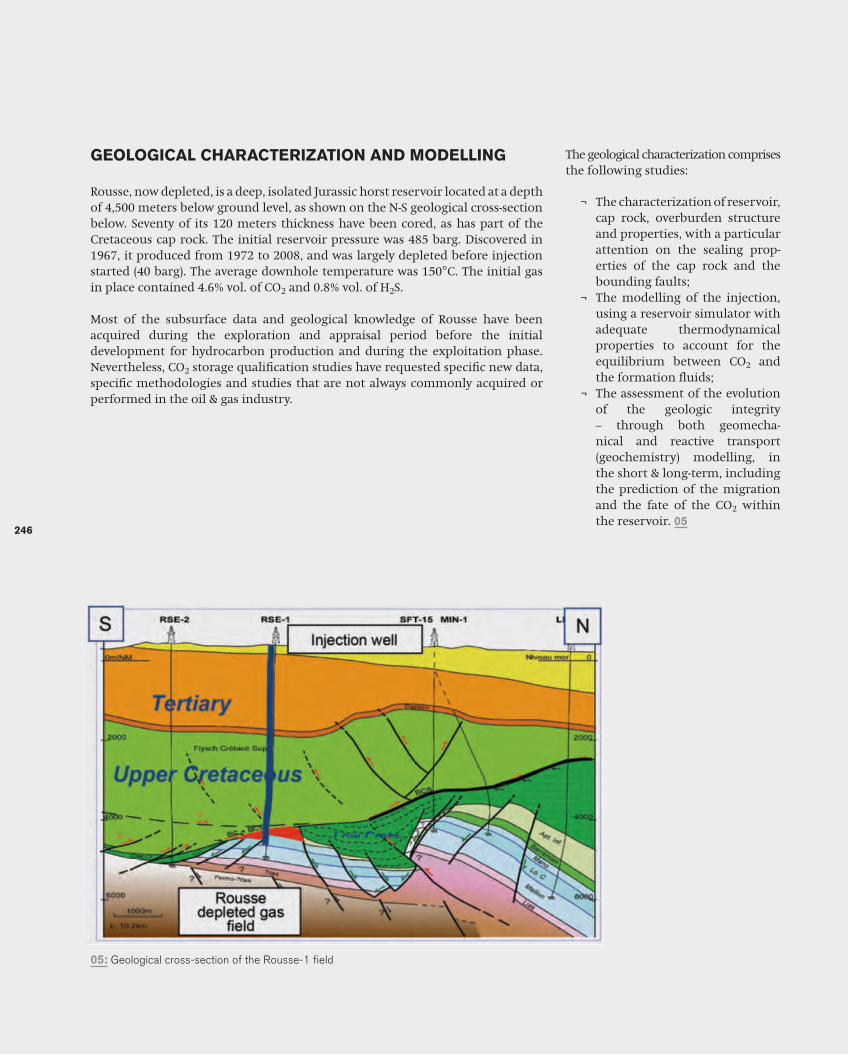
246
GEOLOGICAL CHARACTERIZATION AND MODELLING
Rousse, now depleted, is a deep, isolated Jurassic horst reservoir located at a depth of 4,500 meters below ground level, as shown on the N-S geological cross-section below. Seventy of its 120 meters thickness have been cored, as has part of the Cretaceous cap rock. The initial reservoir pressure was 485 barg. Discovered in 1967, it produced from 1972 to 2008, and was largely depleted before injection started (40 barg). The average downhole temperature was 150°C. The initial gas in place contained 4.6% vol. of CO2 and 0.8% vol. of H2S.
Most of the subsurface data and geological knowledge of Rousse have been acquired during the exploration and appraisal period before the initial development for hydrocarbon production and during the exploitation phase. Nevertheless, CO2
performed in the oil & gas industry.
The geological characterization comprises the following studies:
¬ The characterization of reservoir, cap rock, overburden structure and properties, with a particular attention on the sealing prop-erties of the cap rock and the bounding faults;
¬ The modelling of the injection, using a reservoir simulator with adequate thermodynamical properties to account for the equilibrium between CO2 and
¬ The assessment of the evolution of the geologic integrity – through both geomecha- nical and reactive transport (geochemistry) modelling, in the short & long-term, including the prediction of the migration and the fate of the CO2 within the reservoir. 05
05: Geological cross-section of the Rousse-1 field

Carbon capture and storage . The Lacq pilot Executive Summary
247
WELL INTEGRITY
A comprehensive study of the Rousse well integrity was done, based on measure-ments and modelling studies, to assess the current state of the well, but also the possibility of degradation of the completion during CO2 injection. In particu-lar, leakage may occur along cement sheaths when debonding exists at one of the boundaries or when cements become damaged. The integrity of the cement sheaths must then be carefully evaluated.
Defects in the cement sheaths may be due to improper cement placement, con-
the cement sets, or the result of inappropriate set-cement properties. Laboratory
of mechanisms that could lead to cement-sheath loss of integrity:
¬ Mechanical degradation when cement is submitted to compressive or tensile loadings that are too high;
¬ And chemical degradation when cement gets in contact with carbon dioxide-enriched water.
These two types of degradation mechanisms are discussed in detail; the worst case being when both degradation mechanisms occur at the same time or one after another.
cement job design and execution is not available. However, the acquisition of new cement evaluation logs using a combination of isolation and sonic scanners allowed the full characterization of the material behind the 7” casing string, in order to identify possible defects as well as casing eccentricity. Results shows that bridges of good cement do exist between the mud pockets along the narrow side of the hole, and that their length and thickness suggests hydraulic isolation is maintained across the 836 meters cemented caprock interval. 06
06: Rock sample from the Rousse reservoir ©2011-Laurent Pascal

248
IMPACT AND RISK ASSESSMENT – MONITORING PLAN Once the characterization studies have been performed through measurement surveys and modelling studies, following the methodology described above, a detailed impact and risk analysis can be performed, from which will be derived (1) the monitoring plan to verify the evolution of the storage system, and (2) a set of preventive and corrective actions to mitigate risks.
Impact and risk assessment
The assessment of environmental impacts details the impact associated with works and operations, distinguishing different targets such as the environment
-tifying potential hazards due to the nature of the products involved and associ-ated operations, and then evaluating the possibility to limit these hazards at the
modes of failures; the leakage scenarios and the evaluation of possible conse-quences. A comprehensive analysis of possible exposure and potential effects
as having the highest criticality: the “ blowout scenario.
Monitoring plan
The objectives of the monitoring activities are to (1) verify the performance .sksir dna stcapmi latnemnorivne lortnoc )2( dna ,snoitarepo noitcejni fo
Therefore, the monitoring program – designed in 2007 – was tailored to the
07: Measurement of gas flows in the subsoil by INERIS, ©2011-Laurent Pascal
Analysis of surface water around the Rousse site, ©2011-Laurent Pascal
on the reservoir, the injection well, the deep subsurface, but also at surface and near-surface levels.
Several monitoring aspects are laid
issued by the French Administration in May 2009 and November 2011 (the latter granting extension of the injection period by 18 months). The program plan has been followed during the 39 months of injection (until March 2013), and it is followed by three years of post-injection ob-servation (from March 2013 to March 2016). After that, as a new permitting procedure will be necessary to obtain authorization for permanent storage of the injected CO2, another monitor-
– emit siht mret-gnol – margorp gniwill be designed if necessary, based on the technical and economic lessons learnt from the previous 75 months of monitoring.

Carbon capture and storage . The Lacq pilot Executive Summary
249
08: Schematic drawing of Lacq CO2 Pilot monitoring system
¬no leak upward and out of the reservoir, through the well or the cap rock, to the groundwater resources and to the surface, and no impact on the biosphere or human health);
¬ ¬ Follow the well performance; to check that the CO2 behavior is as modelled
by the reservoir simulation; ¬ And to acquire information for calibrating the tools and updating the pre-
dictive models (especially the reservoir model and the pressure loss model).
The following parameters are monitored: 08
1. CO2 stream composition,
2. CO2 atmospheric concentrations at the injection well pad;
3. Well annulus pressure;4. Pressure and temperature along
the injection well;5. Bottom-hole reservoir pressure
and temperature;6. Reservoir and cap rock integrity
(microseismic monitoring); 7. Soil gas concentration and
8. Groundwater quality;9. Surface water quality;
10. and Biodiversity of the ecosystems.
There are two kinds of campaign, -
ministration in connection with the
by Total and French universities.

250
CO2 STORAGE PERFORMANCE
Pressure and temperature monitoring
Pressure and temperature are continuously monitored, at four locations along
used to calibrate pressure loss models and is compared to the observation points
The Bottom-Hole Pressure is continuously monitored and constantly increases due to the CO2 injection. So far, the pressure increase in the well is in line with pressure predictions from the model.
Finally, pressure fall-off derivative interpretation was performed, which led to skin and permeability thickness estimations that are in line with the original interpretation performed during gas production. In addition and as expected, no injectivity decline was observed.
Microseismic monitoring
The microseismic monitoring system comprises seven shallow wells, each equipped with four microseismic sensors. Six of the wells are located within a circle two kilometers in radius around the injection well, and the seventh on
09: Illustration of the seismic monitoring system
the Rousse well pad. In addition, there are three more microseismic sensors at the bottom of the Rousse injection well completion (between 4,200 - 4,400 meters or feet below ground level). This permanent monitoring is not only unique, but offers outstanding performance as well: it is sensitive enough to detect seismic events cor-responding to a displacement of 0.15 millimeters for a 3 meter length fault (magnitude of -1) with a locali-zation uncertainty of +/- 250 meters. During the baseline survey, mainly natural seismic events due to the deep tectonic activity of the Pyrenean mountain range were recorded. 09
Up to now, only low-magnitude (< 0) microseismic events have been recorded, incapable of producing any impact on the cap rock and reservoir integrity.

Carbon capture and storage . The Lacq pilot Executive Summary
251
ENVIRONMENTAL MONI-TORING AND MODELLING
In parallel to the operational mon-itoring program, additional R&D programs have been launched on methodologies, environmental indi-cators and thresholds.
One of them is the SENTINELLE re-search project supported by the French Research Agency, ANR. It has three ob-jectives. The first is to determine for a given site the different gas sources, with respect to geosphere, biosphere and atmosphere, and to quantify the gas exchange and flux between these different compartments. The Rousse site has been chosen to acquire data on gas contents and fluxes in the different compartments of the near subsurface, the biosphere and the at-mosphere. The second objective is to propose a methodology for 3D surveys (with 0 < x < 10 km; 0 < y < 10 km; -0.1 < z < 10 km) of a CO2 storage site. The third is to test different monitor-ing technologies easy to implement for CO2 storage.
Soil gas concentration and fluxes
The soil gas monitoring consists of measuring the CO2 and CH4 concentra-tions 1 meter below the ground surface, and CO2 and CH4 fluxes at the soil-at-mosphere interface at 35 different locations around the injection site. The gas fluxes are monitored by the accumulation chamber method, using external recirculation, which is inter-mediate between static and dynamic principles.
Before CO2 injection in the Rousse reservoir, baseline data were recorded to characterize soil gas behavior as a function of time. Quarterly field data acquisitions were made from September 2008 to December 2009. The data collected during the
baseline survey shows nigh variabil-ity between the different locations. In addition, seasonal variations were clearly observed, corresponding to the intensity of biological activity in the soil (high in summer and low in winter).
The soil gas concentrations and fluxes have been measured during the injection period every six months and are still measured during the three-year post-injection monitoring period, specifically in winter and autumn where the biological activity is low.
In addition, the d13C CO2 isotopes were measured (-15 to -25‰ d13C PDB), demonstrating that the CO2 in the soil is not of deep subsurface origin; it is a mixture of biological (-25) and atmos-pheric origin (-5). The isotope of the injected gas is -40, so any leak would be detected by isotope analysis.
Up to now, no change in soil gas compositions and fluxes has been recorded, testifying to the absence of CO2 leakage from the reservoir.
Fauna and Flora
The biodiversity of the ecosystems around the Rousse injection site is checked every year. An annual inventory is drawn up at 33 places around the injection location for the flora of representative ecosystems and at 50 places around the injection location for several amphibian and insect species. So far, no change has been recorded, showing there is no leakage of CO2 from the reservoir.
Surface water
The surface water monitoring consists of checking every six months (in spring and in autumn) two standardized bio-in-dicators (French standardized diatom index – IBD, and French Standardized
benthic invertebrate index – IBGN) plus the water chemistry and mineral content parameters (pH, water con-ductivity, carbonates and bicarbonates concentrations) at three locations of the Arribeu brook that drains the Rousse area. Two other locations on two other brooks are used as distant references.
The results of the bi-annual analyses of all the indicators are compared to the baseline reference data from the two surveys performed in spring and autumn 2009, in the pre-injection period. To date, no change in water quality has been recorded, attesting that there is no CO2 leaking from the reservoir.
Groundwater
Four perched aquifers above the deep storage reservoir are monitored. Four parameters (pH, water conductivity, carbonates and bicarbonates concen-trations) are analyzed half-yearly at four natural springs in the vicinity of the injection site. The resulting indicators are compared to the baseline reference data from the four surveys performed in 2009 (spring, summer, autumn and winter) before the injection period. Up to now, no change in water quality has been recorded, testifying to the absence of CO2 leakage from the reservoir.
Atmosphere
Permanent catalytic CO2, CH4 and H2S sensors were placed around the injection wellhead on the Rousse injection pad to detect any abnormal concentration of these gases that might indicate a leakage. CO2 sensors were installed specifically for mon-itoring such an injection site. Up to now, no abnormal detection has been recorded.

252
PUBLIC OUTREACH
Public and stakeholders informa-tion meetings were held from before the start of the project in early 2007 and prior to any construction works. A long public consultation and dialogue phase has also been organized, starting before any con-struction works. Total’s approach was to set up an “open” and “transpar-ent” dialogue with all stakeholders upstream of the permitting process. Access was given to detailed informa-tion by way of a dedicated website, brochures, a consultation dossier, a movie and a quarterly information letter still mailed to the neighbor-hood of the Rousse injection site.
A public consultation and dialogue meeting had been organized in Novem- ber 2007. That led to the creation of a permanent official local information and surveillance commission (CLIS) in April 2008, which has been regularly meeting every six months with the attendance of the Administration and stakeholders (mayors, and NGOs with an interest in the project).
The main objectives of these meetings were to:
¬ Share the opportunity of having such a project in that area and provide technical infor-mation on the Lacq pilot itself;
¬ Provide a better understan- ding of CCS technology context, issues and therefore promote the CCS technology deployment;
¬ Have all questions raised to propose answers at different steps in the project;
¬ Provide information on short and longer term scientific follow up (a dedicated scientific committee was appointed with external experts) and monitoring;
¬ Help identify possible project contributions to local socio- economic development;
¬ And Demonstrate transparency and provide access to relevant information.

Carbon capture and storage . The Lacq pilot Executive Summary
253
CONCLUSION
Having injected more than 51,000 of CO2, Total has successfully demonstrated the feasibility of safely storing CO2 in a depleted underground reservoir. The operability of a fully integrated Carbon Capture and Sequestration scheme based on the oxy-combustion CO2 capture process has been proved. The data needed to upscale the oxy-combustion technology from 30 MWth to 200 MWth was acquired during the operating tests performed at the end of 2011. They are currently being processed and the design of this industrial oxy-boiler should be
developed, as well as operational and surveillance procedures (control of the injectivity, monitoring).
For CO2 emitted by the Oil&Gas sector and the power generation sector, current cost evaluations for an industrial size capture unit are still high, even for oxy- combustion. More R&D works and demonstrations are needed before the upscaling and streamlining of CCS installations can become common place.
Regarding CO2 monitoring, one of our R&D challenges remains, for the coming years, to select the right parameters, methods and equipment to ensure a long-term onshore storage monitoring program that is econo- mically and technically viable. In the case of this pilot project, the proposed long-term program will have to be validated by the French authorities.
The Lacq pilot is part of the larger Total CCS technological roadmap. CCS is considered to have a valuable contribution to green house gases reduction. The Lacq pilot demonstra-tion project is an important foun-dation project providing substantial experience and learning that will help contribute to the deployment of this technology by 2030.
10: Illustration of Lacq facilities ©2011-Laurent Pascal
11: Example of Lacq laboratory ©2012-Laurent Pascal

254
The Lacq platform was a chance for the Group to manage the technologies and costs involved in a carbon capture and storage chain, but also to acquire in-depth knowledge of the methods for characterizing and monitoring a geological storage site, and gain experience in the realities of stakeholder relations.
“

Carbon capture and storage . The Lacq pilot Executive Summary
255
Cooperation with the scientific partners of the academic world was highly successful: giving them access to facilities and data so as to enable them to carry out experiments unlocked crucial progress.”TOTAL, Jean-François Minster, Senior Vice President, Scientific Development Division

256
With this pilot – the only one of its kind in Europe – our research program on acid gas injection has reached a major milestone. The knowledge acquired in terms of geological characterization of the host rock, reactivity to injection and surveillance is fundamental and will also benefit other future sectors such as geothermal systems, energy storage and enhanced recovery.”FRENCH GEOLOGICAL SURVEY (BRGM), Catherine Truffert, Research Director
“

257
REFER-ENCES

258
REFERENCES
Chapter 3
Aimard, N. M. Lescanne, G. Mouronval, C. Prébendé, J. Saint-Marc, and S. Thibeau. “The CO2 pilot at Lacq: an in-tegrated oxycombustion CO2 capture and geological storage project in the South West of France”. Paper presented at the GHGT-9 Conference, Washington, USA, Nov. 16th-20th 2008.
Biteau, J.J. A. Le Marrec, M. Le Vot, and J.M. Masset. “The Aquitaine Basin”. Petroleum Geoscience, no. 12 (2006).
Blanc, P. et al. “Thermodemm: a geo-chemical database focused on low tem-perature water/rock interactions and waste materials”. Applied Geochemistry, no. 27 (2012): pp. 2107-2116.
Bouc, O. et al. “determining safety criteria for CO2 geological storage”. Energy Procedia, no. 1 (2009): pp. 2439-2446.
Chiquet, P. “Captage et stockage géologique du dioxyde de carbone ions -- Diffusion Mouillabilité Tension superficielle”. PhD Thesis in French. University of Pau, France, 2006.
Chiquet, P. J.L. Daridon, D. Broseta, and S. Thibeau. “CO2/water interfacial tensions under pressure and temper-ature conditions of CO2 geological storage”. Energy Convers Manage, no. 48 (2007): pp. 736-744.
Chiquet, P. S. Thibeau, Marc Lescanne, and C. Prinet. “Geochemical assess-ment of the injection of CO2 into Rousse depleted gas reservoir. Part II geochemical impact of the CO2 injection”. Energy Procedia, 2013.
Gapillou, C. S. Thibeau, G. Mouronval, and M. Lescanne. “Building a geocellu-lar model of the sedimentary column at Rousse CO2 geological storage site (Aquitaine, France) as a tool to evaluate a theoretical maximum injection pressure”. Energy Procedia, no. 1 (2009): pp. 2937-2944.
Gaucher, E.C. et al. “A robust model for pore-water chemistry of clayrock”. Geochim. Cosmochim. Acta, no. 73 (2009): pp. 6470-6487.
Gaus, I. et al. “Geochemical and solute transport modelling for CO2 storage, what to expect from it?”. International Journal of Greenhouse Gas Control, no. 2 (2008): pp. 605-625.
Gherardi, F. P. Audigane, and E.C. Gaucher. “Predicting long-term geochemical alteration of wellbore cement in a generic geological CO2 confinement site: Tacking a difficult reactive transport modelling challenge”. Journal of Hydrology, no. 420-421 (2012): pp. 340-359.

259
Girard, J.-P. Chiquet, P. Thibeau, S. Lescanne, M. and Prinet, C. “Geochemical assessment of the injection of CO2 into Rousse depleted gas reservoir. Part I: Initial mineralogi-cal and geochemical conditions in the Mano reservoir”. Energy Procedia 37, 2013. pp. 6395-6401.
Goulder, T.G. and B. Plischke. “History Matched Full Field Geomechanics Model of the Valhall Field including Water Weakening and Re-Pressurisation.” Paper SPE 131505 presented at EUROPEC, Conference held in Barcelone, Spain June 14th-17th 2010.
Monne, J. and Prinet, C. “Lacq-Rousse industrial CCS reference project: Description and operational feedback after two and half years of operation.” Energy Procedia 37, 2013, pp. 6444-6457.
Packhurst, D.L. and C.A.J. Appelo. “User’s guide to phreeqc - a computer program for speciation, batch-reac-tion, one-dimensional transport, and inverse geochemical calculations”.In Water-resources investigations. Denver, Colorado: USGS, 1999.
Pearson, J.F. C. Tournassat, and E.C. Gaucher. “Biochemical processes in a clay formation in situ experi-ment: Part E - Equilibrium controls on chemistry of pore water from the Opalinus clay, Mont Terri Underground Research Laboratory, Switzerland”. Applied Geochemistry, no. 26 (2011): pp. 990-1008.
Pourtoy, D. Onaisi, A. Lescanne, M. Thibeau, S. and Viaud, C. 2013. “Seal integrity of the Rousse depleted gas field impacted by CO2 injection (Lacq industrial CCS reference project France)”. Energy Procedia 37, pp. 5480-5493.
Renard, S. “Rôle des gaz annexes sur l’évolution géochimique d’un site de stockage de dioxyde de carbone. Application à des réservoirs carbon-atés”. PhD Thesis in French. University of Nancy, 2010.
Renard, S.P. J.R.M. Sterpenich, J. Pironon, P. Chiquet, M. Lescanne, and A. Randi. “Geochemical study of the reactivity of a carbonate rock in a ge-ological storage of CO2: Implications of co-injected gases”. Energy Procedia, no. 4 (2011): pp. 5364-5369.
Thibeau, S. P. Chiquet, C. Prinet, and M. Lescanne. “Lacq-Rousse CO2 Capture and Storage demonstration pilot: Lessons learnt from reservoir modelling studies”. Energy Procedia 37, pp. 6306-6316.
Thibeau, S. P. Chiquet, G. Mouronval, and M. Lescanne. “Geochemical assessment of the injection of CO2 into Rousse depleted gas reservoir”. Energy Procedia 1, pp. 3383-3390.
Tonnet, N. D. Broseta, and G. Mouronval. “Evaluation of the petro-physical properties of a carbonate-rich caprock for CO2 geological storage purposes”. SPE EUROPEC/EAGE Annual Conference and Exhibition, June 14th-17th 2010, Barcelona, Spain, 2010.
Tonnet, N. G. Mouronval, P. Chiquet, and D. Broseta. “Petrophysical assess-ment of a carbonate-rich caprock for CO2 geological storage pruposes”. Energy Procedia, no. 4 (2011): pp. 5422-5429.

260
REFERENCES
Chapter 4
Atkinson, C. Eftaxiopoulos, D.A.: “A plane model for the stress field around an inclined, cased and cemented wellbore”. International Journal for Numerical and Analytical Methods in Geomechanics, 20 (1996) pp 549-569.
Bachu, S. Bennion, D.B.: “Experimental assessment of brine and/or CO2 leakage through well cements at reservoir conditions”. International Journal of Greenhouse Gas Control, 3 (2009) pp 494-501.
Barlet-Gouédard, V. Rimmelé, G. Goffé, B. Porcherie, O.: “Well Technologies for CO2 Geological Storage: CO2-Resistant Cement”. Oil & Gas Science and Technology – Revue de l’IFP, 62 (2007), pp 325-334.
Barlet-Gouédard, V. Rimmelé, G. Goffé, B. Porcherie, O.: “Mitigation strategies for the risk of CO2 migration through wellbores”. paper IADC/SPE 98924 presented at the IADC/SPE Drilling Conference held in Miami, Florida, USA (Feb. 21th-23th 2006), p 17.
Betbeder-Matibet, J.: “L’atténuation des mouvements sismiques en profon-deur”. paper presented at the 5e Colloque National de l’Association Française du Génie Parasismique (AFPS) held in Cachan, France (Oct. 19th-21th 1999), p 6.
Bois A.-P. Garnier, A. Galdiolo, G. Laudet, J.-B.: “Use of a mechanistic model to forecast cement-sheath integrity”. SPE Drilling & Completion (June 2012) pp 304-314.
Bois A.-P. Garnier, A. Rodot F. Saint-Marc J. Aimard N.: “How to prevent loss of zonal isolation through a com-prehensive analysis of microannulus formation”. SPE Drilling & Completion (March 2011) pp 13-31.
Bois A.-P. Vu M.-H. Ghabezloo S. Sulem J. Garnier, A. Laudet, J.-B.: “Cement sheath integrity for CO2 storage – An integrated perspective”. Energy Procedia, 37 (2013) 5628–5641.
Bosma, M. Ravi, K. van Diel, W. Schreppers, G.J.: “Design approach to sealant selection for the life of the well”. paper SPE 56536 presented at the SPE Annual Technical Conference and Exhibition held in Houston, Texas, USA (Oct. 3rd-6th 1999) p 14.
Brandl, A. Cutler, J. Seholm, A. Sansil, M. Braun, G.: “Cementing solutions for corrosive well environments”. SPE Drilling & Completion (June 2011) pp 208-219.
Brandvoll, Ø. Regnault, O. Munz, I.A. Iden, I.K. Johasen, H.: “Fluid – solid interactions related to subsurface storage of CO2 Experimental tests of well cement”, Energy Procedia, 1 (2009) pp 3367-3374.
Bruckdorler, R.: “Carbon dioxide corrosion in oilwell cements”, paper SPE 15176 presented at the SPE Rocky Mountain Regional meeting held in Billings, Montana, USA (19-21 May 1986) p 9.

261
Bruckdorler, R.: “Carbon dioxide corrosion resistance in cements”, paper 85-36-61 presented at the 36th annual technical meeting of the Petroleum Society of CIM held in Edmonton, Alberta, Canada (June 2nd-5th 1985) p 9.
Carey, J.W. Lichtner, P.C.: “Computational studies of two-phase cement-CO2-brine interaction in wellbore environments”, SPE Journal (Dec. 2011) pp 940-948.
Carey, J.W. Wigand, M. Chipera, S.J. WoldeGabriel, G. Pawar, R. Lichtner, P.C. Wehner, S.C. Raines, M.A. Guthrie Jr. G.D.: “Analysis and performance of oil well cement with 30 years of CO2 exposure from the Sacroc unit, West Texas, USA”, International Journal of Greenhouse Gas Control, 1 (2007) pp 75-85.
Carroll, S. McNab, W. Torres, S. Singleton, M. Zhao, P.: “Wellbore integrity in carbon sequestration en-vironments: 1. Experimental study of cement - sandstone/shale – brine – CO2”, Energy Procedia, 4 (2011) pp 5186-5194.
Charara, I. Nguyen-Minh, D.: “Mechanical effects of pressure and temperature variations on annular cement in oil wells”, paper presented at the 33rd US Rock Mechanics Symposium held in Santa Fe, New Mexico, USA (June 3rd-5th 1992) p 9.
Charlez, Ph.A.: “Rock mechanics. 1. Theoretical fundamentals”, Editions Technip (1991) p 333.
Coussy O.: “Mechanics and physics of porous solids”, John Wiley and Sons Ltd (2010) p 281.
Coussy O.: “Poromechanics”, John Wiley and Sons Ltd (2004) p 298.
Crow, W. Carey, J.W. Gasda, S. Williams, D.B. Celia, M.: “Wellbore integrity analysis of a natural CO2 producer”, International Journal of Greenhouse Gas Control, 4 (2010) pp 186-197.
DeBruijn, G. Siso, C. Reinheimer, D. Whitton, S. Redekopp, D.: “Flexible cement improves wellbore integrity for steam assisted gravity drainage (SAGD) wells”, paper SPE/PS/CHOA 117859 PS2008-345 presented at the SPE/PS/CHOA International Thermal Operations and Heavy Oil Symposium held in Calgary, Alberta, Canada (Oct. 20th-23th 2008) p 21.
di Lullo, G. Rae, P.: “Cements for long term isolation—Design opti-mization by computer modelling and prediction”, paper SPE 62745 presented at IADC/SPE Asia Pacific Drilling Technology held in Kuala Lumpur (Sept. 11th-13th 2000) p 14.
Duguid, A. Scherer, G.W.: “Degradation of oilwell cement due to exposure to carbonated brine”, International Journal of Greenhouse Gas Control, 4 (2010) pp 546–560.
Duguid, A.: “The effect of carbonic acid on well cements”, PhD disserta-tion, Princeton University, Princeton, New Jersey, USA (2006) p 311.
El Hassan, H. Sultan, M. Saeed, A.A. Johnson, C. Belmahi, A. Rishmani, L.: “Using a flexible, expandable sealant system to prevent microan-nulus formation in a gas well: A case history”. paper SPE 92361 presented at the SPE Middle East Oil & Gas Show and Conference held in Bahrain, UAE (March 12th-15th 2005) p 7.
Fabbri, A. Corvisier, J. Schubnel, A. Brunet, F. Goffé, B. Rimmele, G. Barlet-Gouédard, V.: “Effect of carbonation on the hydro-mechanical properties of Portland cements”, Cement and Concrete Research, 39 (2009) pp 1156–1163.
Fleckenstein, W.W. Eustes, A.W. III, Miller, M.G.: “Burst-induced stresses in cemented wellbores” SPE Drilling & Completion (June 2001) pp 74-82.
Fourmaintraux, D. Bois, A.-P. Franco, C. Fraboulet, B. Brossollet, P.: “Efficient wellbore cement sheath design using the SRC (System Response Curve) Method”, paper SPE 94176 presented at the 14th Europec Biennial Conference held in Madrid, Spain (June 13th- 16th 2004) p 10.
Garnier, A. Fraboulet, B. Saint-Marc, J. Bois, A.-P.: “Characterization of cement systems to ensure cement sheath integrity”, paper presented at the 2007 Offshore Technology Conference held in Houston, Texas, USA (Apr. 30th May 3th 2007) p 11.
Garnier, A. Laudet, J.-B. Neuville, N. Le Guen, Y. Fourmaintraux, D. Rafaï, N. Burlion, N. Shao, J.-F.: “CO2-induced changes in oilwell cements under downhole conditions: first experimen-tal results”, paper SPE 134473 presented at the SPE Annual Technical Conference and Exhibition held in Florence, Italy (Sept. 19th-22nd 2010a) p 15.
Garnier, A. Saint-Marc, J. Bois, A.-P. Kermanac’h, Y.: “A innovative meth-odology for designing cement sheath integrity exposed to steam stimula-tion”, SPE Drilling & Completion (March 2010b) pp 58-69.
Ghabezloo S. Sulem J. Saint-Marc J.: “Evaluation of a permeability–porosity relationship in a low-permea-bility creeping material using a single transient test”, International Journal of Rock Mechanics and Mining Sciences, 46 (2009b) 4, pp 761-768.
Ghabezloo S. Sulem J. Saint-Marc J.: “The effect of undrained heating on a fluid-saturated hardened cement paste”, Cement and Concrete Research, 39 (2009a) 1, pp 54-64.

262
Ghabezloo, S. Sulem, J. Guedon, S. Martineau, F. Saint-Marc, J.: “Poromechanical of hardened cement paste under isotropic loading”, Cement and Concrete Research, 38 (2008) 12, pp 1424-1437.
Ghabezloo, S.: “Association of macros- copic laboratory testing and micro-mechanics modelling for the evalua-tion of the poroelastic parameters of a hardened cement paste”, Cement and Concrete Research, 40 (2009) 8, pp 1197-1210.
Ghabezloo, S.: “Comportement ther-mo-poro-mécanique d’un ciment pétrolier”, PhD dissertation, école Nationale des Ponts et Chaussées, Paris, France (2008) p 194.
Ghabezloo, S.: “Effect of the variations of clinker composition on the poroe-lastic properties of hardened class G cement paste”, Cement and Concrete Research, 41 (2011b) 8, pp 920-922.
Ghabezloo, S.: “Micromechanics analysis of thermal expansion and thermal pressurization of a hardened cement paste”, Cement and Concrete Research, 41 (2011a) 5, pp 520-532.
Ghabezloo, S.: “Multiscale modelling of the poroelastic properties of various oil-well cement pastes”, Journal of Multiscale Modelling, 2 (2010) pp 199-215.
Giasuddin, H.M. Sanjayan, J. Ranjith, P.G.: “Analysis of interfacial debonding of geopolymer annular sealing in CO2 geo-sequestration wellbore”, Energy Procedia, 37 (2013) pp 5681-5691.
Giasuddin, H.M. Sanjayan, J. Ranjith, P.G.: “Modelling of a wellbore composite cylinder system for cement sheath stress analysis in geological sequestration of CO2”, paper ARMA 12-369 presented at the 46th US Rock Mechanics/Geomechanics Symposium held in Chicago, Illinois, USA (June 24th-27th 2012), p 10.
Goodwin, K.J. Crook, R.J.: “Cement sheath stress failure”, SPE Drilling Engineering (Dec. 1992), p 291-296.
Gray, K.E. Podnos, E. Becker, E.: “Finite element studies of near-wellbore region during cementing operations: Part I”, SPE Drilling & Completion (Mar. 2009), pp 127-136.
Griffith, J.E. Lende, G. Ravi, K. Saasen, A. Nodland, N.E. Jordal, O.H.: “Foam cement engineering and implemen-tation for cement sheath integrity at high temperature and high pressure”, paper IADC/SPE 87194 presented at the IADC/SPE Drilling Conference held in Dallas, Texas, USA (March 2nd-4th 2004), p 11.
Huet, B. Tasoti, V. Khalfallah, I.: “A review of Portland cement carbon-ation mechanisms in CO2 rich envi-ronment”, Energy Procedia, 4 (2011) pp 5275–5282.
Huet, B.M. Prevost, J.H. Scherer, G.W.: “Quantitative reactive transport modelling of Portland cement in CO2-saturated water”, International Journal of Greenhouse Gas Control, 4 (2010) pp 561–574.
Jackson, P.B. Murphey, C.E.: “Effect of casing pressure on gas flow through a sheath of set cement”, paper SPE/IADC 25698 presented at the Drilling Conference held in Amsterdam, The Netherlands (Feb 2rd-25th 1993) p 10.
Jo, H. Gray, K. E.: “Mechanical behavior of concentric casing, cement, and formation using analytical and numerical methods”, paper presented at the 44th US Rock Mechanics Symposium and 5th US-Canada Rock Mechanics Symposium held in Salt Lake City, Utah, USA (June 27th-30th 2010), p 13.
Jo, H.: “Mechanical behavior of con-centric and eccentric casing, cement, and formation using analytical and numerical methods” PhD dissertation, University of Texas, Austin, Texas, USA (2008), p 181.
Kurose, A.: “Effets des séismes sur les ouvrages souterrains”, PhD disserta-tion, école polytechnique, Paris, France (2000) p 248.
Kutchko, B. G. Strazisar, B.R. Huerta, N. Lowry, G.V. Dzombak, D.A. Thaulow, N.: “CO2 reaction with hydrated Class H Well cement under geologic seques-tration conditions: Effects of flyash admixtures”, Environmental Science and Technology, 43 (2009), p 3947-3952.
Kutchko, B.G. Strazisar, B.R. Dzombak, D.A. Lowry, G.V. Thaulow, N.: “Degradation of well cement by CO2 under geologic sequestration conditions”, Environmental Science & Technology, 41 (2007), pp 4787-4792.
Kutchko, B.G. Strazisar, B.R. Lowry, G.V. Dzombak, D.A. Thaulow, N.: “Rate of CO2 attack on hydrated class H well cements under geologic sequestra-tion conditions”, Environmental Science & Technology, 42 (2008), pp 6237-6242.
Laudet, J.B. Garnier, A. Neuville, N. Le Guen, Y. Fourmaintraux, D. Rafaï, N. Burlion, N. Shao, J.-F.: “The behavior of oil well cement at downhole CO2 storage conditions: static and dynamic laboratory experiments”, Energy Procedia, 4 (2011) pp 5251-5258.

263
Le Guen, Y. Asamoto, S. Houdu, E. Poupard, O.: “Well integrity: Modelling of thermo-mechanical behavior and gas migration along wells - Application to Ketzin injection well”, Energy Procedia, 23 (2012), pp 462-471.
Li, Y. Liu, S. Wang, Z. Yuan, J. Qi, F.: “Analysis of cement sheath coupling effects of temperature and pressure in non-uniform in situ stress field”, paper presented at the CPS/SPE International Oil & Gas Conference and Exhibition held in Beijing, China (June 8th-10th 2010) p 16.
Liteanu, E. Spiers, C.J. Peach, C.J.: “Failure behaviour wellbore cement in the presence of water and super-critical CO2”, Energy Procedia, 1 (2009), pp 3553-3560.
Loizzo, M. Miersemann, U. Lamy, P. Garnier, A.: “Advanced cement integrity evaluation of an old well in the Rousse field”, Energy Procedia, 37 (2013) pp 5710-5721.
Matteo, E.N. Scherer, G.W. Huet, B. Pel, L.: “Understanding boundary condition effects on the corrosion kinetics of class h well cement”, Energy Procedia, 4 (2011) pp 5370-5376.
Matteo, E.N. Scherer, G.W.: “Experimental study of the diffu-sion-controlled acid degradation of Class H Portland cement”, International Journal of Greenhouse Gas Control, 7 (2012) pp 181–191.
Miersemann, U. Loizzo, M. Lamy, P.: “Evaluating old wells for conversion to CO2 injectors: Experience from the Rousse field”, paper SPE 139506 presented at the SPE International Conference on CO2 Capture, Storage, and Utilization held in New Orleans, Louisiana, USA (Nov. 10th-12th 2010), p 14.
Myers, S. El Shaari, N. Dillenbeck, Robert L. III: “A new method to evaluate cement systems design requirements for cyclic steam wells”, paper SPE 93909 presented at the SPE Western Regional Meeting held in Irvine, California, USA (Mar. 30th-1st Apr. 2005) p 5.Nabipour, A. Joodi, B. Sarmadivaleh, M.: “Finite element of downhole stresses in deep gas wells cements”, paper SPE 132156 presented at the SPE Deep Gas Conference and Exhibition held in Manama, Bahrain (Jan. 24th-26th 2010), p 13.
Nygaard, R. Salehi, S. Lavoie, R.: “Effect of dynamic loading on wellbore leakage for the Wabamun area CO2 sequestration project”, paper CSUG/SPE 146640 presented at the Canadian Unconventional Resources Conference held in Calgary, Alberta, Canada, (Nov. 15th-17th 2011), p 19.
Onan, D.D.: “Effects of supercritical carbon dioxide on well cements”, paper SPE 12593 presented at the 1984 Permian Basin Oil & Gas Recovery Conference in Midland, Texas, USA (Mar. 8th-9th 1984), p 14.
Pariseau, W.G.: Discussion on a paper by Z. Wu and S. LI “The generalized plane strain problem and its appli-cation in three-dimensional stress measurement” International Journal of Rock Mechanics and Mining Science & Geomechanics Abstracts, 28 (1991) 4, p 343.
Pattillo, P.D. Christiansen, T.G.: ”Analysis of horizontal casing integrity in the Valhall field”, paper SPE/ISRM 78204 presented at the SPE/ISRM Rock Mechanics Conference, Irvine, California, USA (Oct. 20th-23rd 2002), p 10.
Philippacopoulos, A.J. Berndt, M.L.: “Mechanical response and charac-terization of well cements”, paper SPE 77755 presented at the SPE Annual Conference and Exhibition held in San Antonio, Texas, USA (Sept. 29th Oct. 2nd 2002), p 8.
Rafaï, N. Garnier, A.: “Stockage des gaz à effet de serre et durabilité de matériaux à base de ciment pétrolier dans des conditions de puits”, paper presented at the GC’2013, held in Cachan, France (Mar. 26th-27th 2013), p 10.Ravi, K. Bosma, M. Gastbled, O.: “Improve the economics of oil and gas wells by reducing the risk of cement failure”, paper IADC/SPE 74497 presented at the IADC/SPE Drilling Conference held in Dallas, Texas, USA (Feb. 26th-28th 2002a), p 13.
Ravi, K. Bosma, M. Gastbled, O.: “Safe and economic gas wells through cement design for life of the well”, paper SPE 75700 presented at the SPE Gas Technology Symposium held in Calgary, Alberta, Canada (Apr. 30th-2nd May 2002b), p 15.
Rimmelé, G. Barlet-Gouédard, V. Porcherie, O. Goffé, B. Brunet, F.: “Heterogeneous porosity distribu-tion in Portland cement exposed to CO2-richfluids”, Cement and Concrete Research, 38 (2008), pp 1038-1048.
Rodriguez, W.J. Fleckenstein, W.W. Eustes, A.W. III.: “Simulation of collapse loads on cemented casing using finite element analysis”, paper SPE 84566 presented at the SPE Annual Technical Conference and Exhibition held in Denver, Colorado, USA (Oct. 5th-8th 2003), p 9.

264
Saint-Marc, J. Garnier, A. Bois, A.-P.: “Initial state of stress: The key to achieving long-term cement-sheath integrity”, paper SPE 116651 presented at the SPE Annual Technical Conference and Exhibition held in Denver, Colorado, USA (Sept. 21st-24th 2008), p 14.
Santra, A. Reddy, B.R. Liang, F. Fitzerald, R.: “Reaction of CO2 with Portland cement at downhole conditions and the role of pozzolanic supplements”, paper SPE 121103 presented at the 2009 SPE International Symposium on Oilfield Chemistry held in The Woodlands, Texas, USA (Apr. 20th-22nd 2009), p 9.
Shahri, M.A. Schubert, J.J. Amani, M.: “Detecting and modelling cement failure in high-pressure/high-tempera-ture (HP/HT) wells, using finite element method (FEM)”, paper IPTC 10961 presented at the International Petroleum Technology Conference held in Doha, Qatar (Nov. 21st-23rd 2005), p 10.
Shahri, M.A.: “Detecting and modelling cement failure in high pressure/high temperature wells, using finite-ele-ment method”, M.Sc. dissertation, Texas A&M University, College Station, Texas, USA (2005), p 61.
Sweatman, R.E. Santra, A. Kulakofsky, D.S. Calvert, D.G.J.: “Effective zonal isolation for CO2 sequestration wells”, paper SPE 126226 presented at the SPE International Conference on CO2 Capture, Storage, and Utilization held in San Diego, California, USA (Nov. 2nd-4th 2009), p 15.
Takla, I. Burlion, N. Shao, J.-F. Saint-Marc, J. Garnier, A.: “Effects of Storage of CO2 on Multiaxial Mechanical and Hydraulic Behaviours of an Oilwell Cement”, Journal of Materials in Civil Engineering of ASCE, 23 (2010), 6, pp 741-746.
Takla, I.: “Comportement thermo-hy-dro-mécanique d’un ciment pétrolier sou l’effet du CO2”, PhD dissertation, Université des Sciences et Technologies de Lille, France (2010), p 246.
Teodoriu, C. Ugwu, I. Schubert, J.: “Estimation of casing-cement-forma-tion interaction using a new analy- tical model”, paper presented at the SPE Europec/Eage Annual Conference and Exhibition held in Barcelona, Spain (June 14th-17th 2010), p 13.
Thiercelin, M.J. Baumgarte, C. Guillot, D.: “A soil mechanics approach to predict cement sheath behavior”, paper SPE/ISRM 47375 presented at the Eurock’98 held in Trondheim, Norway (July 8th-10th 1998a), p 9.
Thiercelin, M.J. Dargaud, B. Baret, J.F. Rodriquez, W.J.: “Cement design based on cement mechanical response”, SPE Drilling & Completion, 13 (1998b), 4, pp 266–273.
Thiercelin, M.J.: “Mechanical prop-erties of well cements”. In Well Cementing, second edition, ed. E.B. Nelson and D. Guillot (2007), pp 269–288.
Ulm, F.-J. Coussy O.: “Modelling of thermochemomechanical couplings of concrete at early ages”, Journal of Engineering Mechanics, 121 (1995), 7, pp 785-794.
Van Kuijk, R. Zeroug, S. Froehlich, B. Allouche, M. Bose, S. Miller, D. le Calvez, J.-L. Schoepf, V. Pagnin, A.: “Noval ultrasonic cased-hole imager for enhanced cement evaluation”, paper IPTC 10546 presented at the International Petroleum Technology Conference held in Doha, Qatar (Nov. 21th-23nd 2005), p 14.
Vu, M.-H. Sulem, J. Laudet, J-B.: “Effect of the hydration temperature on the creep of a hardened cement paste”, Cement and Concrete Research, 42 (2012b) 9, pp 1233-1241.
Vu, M.-H.; Sulem, J.; Ghabezloo, S. Laudet, J.B. Garnier, A. Guedon, S.: “Time-dependent behaviour of hardened cement paste under isotropic loading”, Cement and Concrete Research, 42 (2012a) 6, pp 789-797.
Vu, M.-H.: “Effet des contraintes et de la temperature sur l’intégrité des ciments des puits pétroliers”, PhD dissertation, Université Paris-Est, Paris, France (2012), p 240.
Wu, Z. Li, S.: “The generalized plane strain problem and its application in three-dimensional stress meas-urement” International Journal of Rock Mechanics and Mining Science & Geomechanics Abstracts, 27 (1990), 1, pp 43–49.
Zhang, M. Bachu, S.: “Review of integrity of existing wells in relation to CO2 geological storage: What do we know?” International Journal of Greenhouse Gas Control, 5 (2011), 4, pp 826-840.

265
REFERENCES
Chapter 5
T. Bardainne, N. Dubos-Sallée, G. Sénéchal, P. Gaillot et H. Perroud, “Analysis of the induced seismicity of the Lacq gas field (Southwestern France) and model of deformation,” Geophysical Journal International, vol. 172, n° 13, 2008, pp. 1151-1162.
M. Bohnhoff, G. Dresen, W. Ellsworth and H. Ito, “Passive seismic monitor-ing of natural and induced earth-quakes: Case studies: Future direc-tions and socio-economic relevance”. in New Frontiers in Integrated solid Earth Sciences, International Year of Planet Earth, Springer, 2010, pp. 261-285.
BRGM/RC-56362-FR, “Rapport d’avan- cement expertise du dossier “Mines” - Pilote de stockage du CO2 de Rousse”.
S. Maxwell, R. Young, R. Bossu, A. Jupe et J. Dangerfield, “Processing of induced microseismicity recorded in the Ekofisk reservoir,” chez 68th Annual Meeting, SEG, 1998.
S. Davis et C. Frohlich, “Did (or will) Fluid Injection Cause Earthquakes? – Criteria for a Rational Assessment,” Seismological Research Letter, vol. 64, n° 13-4, 1993, pp. 207-224.
M. Lescanne, J. Hy-Billot, N. Aimard and C. Prinet, “The site monitoring of the Lacq industrial CCS reference project”.
M. Lescanne, J. Monne et W. Beydoun, “Acceptability challenges for injecting and storing CO2 in a depleted reservoir – a case study of the CCS pilot in Lacq” chez SEG, San Antonio, Texas, 2011.
J.-P. Deflandre, J. Laurent, D. Michon et E. Blondi, “Microseismic surveying and repeated VSPs for monitoring an underground gas storage reservoir using permanent geophones,” First Break, vol. 13, n° 14, 1995, pp. 129-138.
J.-P. Deflandre et F. Huguet, “Permanent Passive Seismic Monitoring at the Céré-la-Ronde Underground Gas Storage During Reservoir Fill-Up,” chez Extended Abstract 63rd EAGE Conference, 2001.
J. Kwee, “Micro-Seismicity in the Bergermeer gas storage field,” Master Thesis, University of Utrecht – TNO report 2008-U-R1071/b, Bergermeer Seismicity Study, Utrecht, 2012.
V. Oye, E. Aker, T. Daley, D. Kühn, B. Bohloli et V. Korneev, “Microseismic Monitoring and Interpretation of Injection Data from the in Salah CO2 Storage Site (Krechba), Algeria,” Energy Procedia, vol. 37, 2013, pp. 4191-4198.
T. Van Eck, F. Goutbeek, H. Haak et B. Dost, “Seismic hazard due to small-magnitude, shallow-source, induced earthquakes in The Netherlands,” Engineering Geology, vol. 87, 2006, p. 105–121.

266
R. Van Eijs, R.M.H.E, F. Mulders, M. Nepveu, C. Kenter et B. Scheffers, “Correlation between hydrocarbon reservoir properties and induced seis-micity in the Netherlands,” Engineering Geology, vol. 84, 2006, p. 99–111.
P. Renoux, E. Fortier et C. Maisons, “Microseismicity induced within Hydrocarbon Storage in Salt Caverns, Hazard review and event re-location in a 3D velocity model,” chez SMRI Fall 2013 Technical Conference, Manosque, France, 2013.
J. Verdon, “Microseismic monitor-ing and geomechanical modelling of CO2 storage in subsurface reservoirs”, Springer Thesis Series, 2012, p. 186.
C. Green, P. Styles et B. Baptie, “Preese Hall Shale Gas Fracturing Review & Recommendations For Induced Seismicity Mitigation for DECC 2012,” 2012.
C. de Pater et S. Baisc, “Geomechanical Study of Bowland Shale Seismicity,” Cuadrilla, 2011.
E. Fortier, F. Cerda et J. Hy-Billiot, “Lacq pilot project: Seismic surveillance network of geological C02 storage,” 68IFP deep saline aquifer / Seminar, Rueil-Malmaison, France, 2009.

267
REFERENCES
Chapter 6
Chiquet, P. S. Thibeau M. Lescanne, and C. Prinet. “Geochemical assess-ment of the injection of CO2 into Rousse depleted gas reservoir. Part II geochemical impact of the CO2 injection”.
Girard, J-P. P. Chiquet, S. Thibeau, M. Lescanne and J. Hy-Billiot. “Geochemical assessment of the injection of CO2 into Rousse depleted gas reservoir. Part I: Initial mineralogi-cal and geochemical conditions in the Mano reservoir”.
Godano, M. “Etude théorique sur le calcul des mécanismes au foyer dans un réservoir et application à la sismicité de la Saline de Vauvert”. PhD, 2009.
Lescanne, M. J.H. Hy-Billot, N. Aimard and C. Prinet. “The site monitoring of the Lacq industrial CCS reference project.”
OMP – Observatoire Midi-Pyrénées, Seismological database, 2009-2010.
Prinet, C. S. Thibeau, M. Lescanne and J. Monne. “Lacq-Rousse CO2 Capture and Storage demonstration pilot: lessons learnt from two and a half years of monitoring.”
Thibeau, S. P. Chiquet, C. Prinet and M. Lescanne. “Lacq-Rousse CO2 Capture and Storage demonstration pilot: Lessons learnt from reservoir modelling studies.”
Verdon, J.P. “Microseismic monitor-ing and geomechanical modelling of CO2 storage in subsurface reservoirs”. Springer Thesis Series. Springer, 2012.
Verdon, J.P. D.J. White, J.-M. Kendall, D.A. Angus, Q. Fisher, and T. Urbancic. “Passive seismic monitoring of carbon dioxide storage at Weyburn”. Leading Edge 29, n° 2 (2010), pp 200-206.

268
REFERENCES
Chapter 7
ACEMAV COLL. Duguet R. and Melki F. “Les amphibiens de France, Belgique et Luxembourg”. Mèze: Collection Parthénope, Biotope Edition. (2003).
Alard, D. Botineau, M. Boullet, V. Clément, B. Van Es, J. De Foucault, B. et al. “Cahiers d’habitats Natura 2000 - Tome 4 Vol. 1 & 2 - Habitats agro-pastoraux”. La Documentation Française. (2005).
Aubinet, M. Vesala, T. and Papale, D. “Eddy Covariance: A Practical Guide to Measurement and Data Analysis. Eddy Covariance: A Practical Guide to Measurement and Data Analysis”. Springer Atmospheric Sciences Series, Springer. (2012), pp. 438.
Bardat, J. “Podrome des végétations de France”. Publications scientifiques du Museum National d’Histoire Naturelle. (2004).
Berroneau, M. C. “Guide des amphi- biens et reptiles d’Aquitaine”. Association Cistude Nature. (2010).
“Diagnostic et plan de gestion 2013-2017 des pelouses sèches du coteau de Gan et Jurançon”. Communauté d’agglomération de Pau Pyrénées. Biotope Edition, (2013).
Blanchard, F. and Lamothe, T. “Étude typologique et fonctionnelle des coteaux marnicoles du Tursan (dépar-tement des Landes)”. Conservatoire Botanique National Aquitaine / Poitou-Charentes. (2005).
BOULLET, V. “Les pelouses calcicoles (Festuco-Brometea) du domaine atlan-tique français et ses abords au nord de la Gironde et du Lot. Essai de synthèse phytosociologique”. Thèse Doct. 3e cycle. Lille. (1986).
Cailteau, C. de Donato, P. Pironon, J. Vinsot, A. Fierz, T. Garnier, C. et al. In situ gas monitoring in clay rocks: “mathematical developments for CO2 and CH4 partial pressure determina-tion under non-controlled pressure conditions using FT-IR spectrom-etry. Analytical methods, 3, (2011), pp. 888-895.
Cailteau, C. Pironon, J. de Donato, P. Vinsot, A. Fierz, T. Garnier, C. et al. FT-IR metrology aspects for on-line monitoring of CO2 and CH4 in un-derground laboratory conditions”. Analytical Methods, 3, 877-887. (2011).
Christmann, E. “Guide des milieux for-estiers en Aquitaine. Centre régional de la propriété forestière d’Aquitaine”. (2004).
Cook, F. and Orchard, V. (2008). “Relationship between soil respiration and soil moisture”. Soil Biology and Biochemistry, 40 (5), pp 1013-1018.
CORINE. “Habitats of the European Community. Data specifications part 2”. Luxembourg. biotopes manual (1991).

269
Coste, H. “Flore descriptive et illustrée de la France, de la Corse et des contrées limi-trophes, 3 tomes”. Nouveau tirage. Librairie scientifique et technique Albert Blanchard, Paris. [I]: 416 p. [II]: 627 p. [III]: (1998). p 807.
CREN d’Aquitaine. Inventaire des milieux naturels remarquables de la Communauté d’Agglomération de Pau-Pyrénées. (2004).
Flesch, T. Wilson, J. and Harper, L. Deducing ground-air emissions from observed trace gas concentrations: a field trial with wind disturbance. Journal of Applied Meteorology, 44, (2005) pp 475-484.
Grand, D. and Boudot, J.-P. “Les Libellules de France, Belgique, Luxembourg”. Mèze : (Coll. Parthénope) Biotope Eition. (2006).
Harig, R. Passive remote sensing of pol-lutants clouds by FTIR spectrometry: Signal to noise ration as a function of spectral resolution. Applied Optics, 43 (23), (2004), pp. 4603-4610.
Harig, R. Matz, G. Gerhard, H. J.H. G. and V. S. (2006). Infrared remote sensing of harzardous vapours: Surveillance of public areas during the FIFA footbaal World Cup 2006, Sensors and Command, Communications, and Intelligence (C3I) Technologies for Homeland Security and Homeland Defense VI. Proceedings of SOIE, 6538.
Lafranchis, T. Papillons d’Europe, 2e édition. Paris: Diatheo. (2007, 2010).
Laporte, M. Duschene, L. and Wetzel, S. Effect of rainfall patterns on soil surface CO2 efflux, soil moisture, soil temperature and plant growth in a grassland ecosystem of northern Ontario, Canada: implications for climate change. BMC Ecology, 2 (10), 1-6. (2002).
Loubet, B. Asman, W. Theobald, M. Hertel, O. Tang, Y. Robin, P. et al. Ammonia deposition near hot spots: processes, models and mon-itoring methods. In M. Sutton, and al. (Eds.), “Atmospheric ammonia” Springer. (2009), pp. 205-267.
Loubet, B. Milford, C. Sutton, M. and Cellier, P. “Investigation of the interaction between sources and sinks of atmospheric ammonia in an upland landscape using a simplified dispersion-exchange model”. Journal of Geophysical Research: Atmospheres, (2001). 106 (D20), pp. 24183-24195.
Muratet, J. “Identifier les amphibiens de France métropolitaine,” Guide de terrain. Association ECODIV, France. (2007).
Pokryszka, Z. Charmoille, A. and Bentivegna, G. “Development of methods for gaseous phase geochem-ical monitoring on the surface and in the intermediate overburden strata f geological CO2 storage sites”. Oil & Gas Science and Technology, (2010). 65 (4), pp. 653-666.
Pottier G. coord. “Atlas des amphibiens et reptiles de Midi-Pyrénées”. Collection Atlas naturalistes de Midi-Pyrénées. (2008). Ed. Nature Midi-Pyrénées.
Pottier, G. “Guide des reptiles et amphibiens de Midi-Pyrénées”. Nature Midi-Pyrénées, France. (2003).
Rastoni, M. Singh, S. and Pathak, H. “Emissions of carbon dioxide from soil”. Current Science, 82 (5). (2002).
Savanne, D. Berne, P. Cellier, P. Laville, P. Pokryszka, Z. Sabroux, J. et al. “Comparison of different methods for measuring landfill methane emissions”. 6th International Landfills Symposium – Sardinia’97. Sardinia, Oct. 13rd-17th (1997).
Taquet, N. Pironon, J. de Donato, P. Lucas, H. and Barrès, O. “Efficiency of combined FTIR and Raman spectrometry for online quantifica-tion of gases: Application to the moni-toring of carbon dioxide storage sites”. International Journal of Greenhouse Gas Control, 12, 2013, pp 359-371.Wood, R. “Note on the theory of the greenhouse”. London, Edinborough and Dublin Philosophical Magazine, 17, (1909). pp. 319-320.
Wu, X. Yao, Z. Braggemann, N. Shen, Z. Wolf, B. Dannenmann, M. et al. “Effects of soil moisture and tempe- rature on CO2 and CH4 soil/atmos-phere exchange various land use/cover types in a semi-arid grassland in inner Mongolia, China”. Soil Biology and Biochemistry, (2010). 45 (5), pp 773-787.

270
REFERENCES
Chapter 8
C. Arquizan, “Évènement: 30 ans d’activité de Total Développement Régional”. Solidarité d’entreprise, vol. 4, 2008. p 1.
Bureau de Recherches Géologiques et Minières (BRGM), “Création de l’unité ‘Sécurité et impacts du stockage de CO2”. 2009. [Online]. Available: http ://www.brgm.fr/dcenewsFi le? ID=806.
Commission Locale d’Information et de Suivi, “L’Etat en Pyrénées-Atlantiques: CO2 à Lacq,” 2010. [Online]. Available: http://www.pyr-enees-atlantiques.pref.gouv.fr/sections/actions_de_l_etat/environnement_et_dev/actualites/. [Access July 1st 2010].
C&S Conseils, “Dossier de concerta-tion: Projet pilote de captage et de stockage géologique de CO2 dans le bassin de Lacq”. 2007. [Online]. Available: http://www.total.com/fr/dossiers/captage-et-stockage-geologique -de-co2/l-exemple-industriel-de-lacq/le-dossier-de-concertation-900283.html.
J.-M. Fourniau, “L’institutionnalisation controversée d’un modèle français de débat public”. Téléscope, vol. 17, n°11 (Special issue on Citizens’ Participation), 2011, pp. 70-93.
M. Ha-Duong and N. Chaabane, “Captage et stockage du CO2 : Enjeux techniques et sociaux en France”. Quae éditions, 2010.
M. Ha-Duong, M. Gaultier et B. de Guillebon, “Social aspects of Total’s Lacq CO2 capture, transport and storage pilot project,” Energy Procedia, vol. 4, pp. 6263-6272.
J. Mauhourat and M.-L. Lambert-Habib, “Position des Associations Santé-Environnement-Bassin de Lacq et SEPANSO. Enquête publique sur le projet de Capture et Séquestration du CO2 (CSC) de Total à Rousse (Jurançon)”. 2008. [Online]. Available: http://www.sepansobearn.org/risques_industriels/risques_industriels_03.html. [Access September 27th 2011].
F. Metras, “Cretaceous 4000”. La lettre de l’APESA, Supplément au n° 18, 2001. p. 2.
J.-P. Penot, “Changement climatique: enjeux scientifiques et industriels, réponses régionales”. 2008. [Online]. Available: http://www.alternatives-pa-loises.com/article.php3?id_article=1660. [Access August 30th 2010].
H. Pépin, “Première expérience de stockage souterrain de CO2 en France,” 2009. [Online]. Available: http://www.lemonde.fr/idees/article/2009/ 12/09/premiere-experience-de-stockage-souterrain-de-co2-en-france-par-henri-pepin_1278341_3232.html.

271
Total, “Engagements de Total pour la concertation. Projet pilote de captage stockage géologique de CO2 dans le bassin de Lacq”. 2007. [Online]. Available: http://www.total.com/MEDIAS/MEDIAS_INFOS/2175/FR/charte-concertation-lacq.pdf ?PHPSES-SID=5d26cd29f2a5b4bcc147fe92acb-c2ad2.
Total, “Total lance, en France, le premier projet intégré de captage et stockage géologique de CO2 dans un ancien gisement de gaz naturel”. 2007. [Online]. Available: http://www.in-fo-financiere.fr/upload/MAN/2009/10/FCMAN130308_20091023.pdf.
Total, “Bilan de la concertation. Projet pilote de captage stockage de CO2 dans le bassin de Lacq”. 2008. [Online]. Available: http://www.total.com/fr/ dossiers/captage-et-stockage-geologique-de-co2/l-exemple-industriel-de-lacq/la-concertation-900282.html.

272
KEY-WORDS INDEX

273
Absorption(23, 209, 210, 212)Adsorption(19, 28, 37)Air-fired combustion(19, 243, 244)Anthropogenic(150, 152, 167, 199)Atmosphere(15, 100, 127, 139, 251, 141, 158, 181-186, 208, 209, 212, 214) Aquifer(5, 41, 132, 133, 135, 136, 164, 182, 193, 197, 199-201, 206)Biosphere(15, 125, 181, 186, 208, 210, 213, 214, 249, 251)Boiler (5, 6, 11, 13, 14, 16, 19, 21-25, 27,127, 243, 253) Cap-rock(40, 48-50, 54-57, 130, 132, 134, 146, 161, 246, 249, 250)Capture(5-7, 13-16, 18-20, 23, 50, 51, 129, 159, 178, 181, 215, 217, 220-222, 229, 238, 243, 244, 253)Carbon Dioxide (CO2)(13, 15, 33, 39, 85-88, 90, 92, 97, 99-102, 114, 117, 118, 127, 131, 134, 219)Climate change(127, 215, 226, 230-232, 236)Community outreach(11, 216)Concertation(11, 217, 219, 221, 223-226, 230, 231, 232, 234, 236-239, 269, 270)Containment(15, 39, 40, 69, 127, 131, 161, 172, 197, 206, 245)Depleted reservoir(264)EOR(5)Environmental monitoring (6, 10, 15, 180-182, 185, 187, 188, 197, 206, 208, 214, 243, 251)European Directive(15, 39, 181, 214, 227, 235)Flue gas(5, 13, 19, 21-24, 28, 34, 37, 127, 243-245)Geological integrity(9, 40, 54, 245)Geological modelling (9, 50)GHG(16, 253)Groundwater(135, 147, 158, 181, 182, 187, 197, 202, 205, 249, 251)
IGCC(20)Impact assessment(9, 126, 128, 129, 181, 227)Impurities(29, 37, 175)Injection(5,6 13-15, 19, 25, 31, 32, 39, 42, 49, 51, 53, 54, 56, 83, 84, 88, 97, 99, 102, 114, 125, 128-136, 138, 141, 142, 145-159, 161, 163-168, 170-177, 181, 182, 184-186, 190, 192, 195, 197, 199, 200, 206, 208, 210, 212-214, 218-221, 225-230, 232, 235, 237, 243-251, 271)Leakage(21, 39, 65, 69, 118, 119, 131-136, 145, 146, 148, 150, 158, 231, 244, 245, 247, 248, 251, 259)Monitoring plan(9, 14, 124, 125, 146, 153, 206, 227, 245, 248) Mineral trap(177)Mitigation(125, 150, 152, 165, 226, 236)Oxy-combustion(5, 6, 8, 13, 14, 16, 19, 20-25, 27, 28, 243, 244, 253)Permeability(47, 49, 57, 58, 73, 74, 76, 85-88, 97, 100, 101, 134, 161-164, 196, 250)Pore space(97)Porosity(40, 43, 47, 49, 56-59, 62-65, 77, 86, 87, 90-93, 95, 100, 129, 134, 162, 164, 174-177)Reservoir(5, 6, 13, 14, 16, 31, 32, 39-41, 43-59, 61-65, 104, 117, 118, 122, 125, 128-134, 136-142, 145, 146, 148-151, 153, 157, 158, 161-167, 169, 170, 172-177, 181, 192, 197-200, 206, 209, 239, 243-251, 253)Risk assessment (9, 14, 118, 124, 132, 152, 157, 167, 248)Scrubber(127)Sequester(177)Storage(5-7, 13-16, 19, 33, 39, 43, 49, 57, 67, 69, 70, 87, 102, 114, 125, 130, 131, 135, 146, 148, 150, 152, 153, 157-161, 165, 172, 178, 179, 181, 187, 189, 190, 192, 197, 198, 206, 208, 209, 213-215, 217, 221, 222, 227-229, 231, 232, 238, 239, 243, 245, 246, 248, 250, 251, 253, 271)Storage performance (10, 15, 39, 146, 152, 160, 250) Supercritical(49, 58, 85, 87, 88, 100, 138, 176)
Transport(5, 7, 13-15, 19, 25, 31, 33, 40, 57-59, 61, 63, 65, 134, 161, 173, 211, 217, 228, 229, 244-246)Well(13-15, 19, 23, 24, 26, 28, 31, 32, 35, 39, 41-44, 47-51, 53-56, 59, 68, 69, 71, 78, 80, 82, 83, 85, 97, 102-105, 108, 110-112, 114, 117-119, 125, 128-141, 144-150, 152-158, 162-168, 170, 172, 175-177, 182-186, 191-196, 217, 220, 222, 225, 227-229, 231, 232, 235-238, 244, 245, 247-250, 253)Well injectivity(10, 146, 162) Well Integrity(14, 39, 68, 70, 71, 114, 125, 136, 138, 145, 245, 247)

274
CARBON CAPTURE AND STORAGE - THE LACQ PILOT - RESULTS & OUTLOOK JAN. 2014 (6:54)
on http://www.total.com
WATCH VIDEO ON THE LACQ PILOT