Carbon-based Nanosensors for Salicylate Determination in ...
28
1 Carbon-based nanosensors for salicylate determination in pharmaceutical preparations Fatehy M. Abdel-Haleem a ,* Azza Salah a , Mahmoud S. Rizk a , Hussein Moustafa a , Mikhael Bechelany b , Ahmed Barhoum b,c* a Chemistry Department, Faculty of Science, Cairo University, Gamaa Street, Giza 12613, Egypt. b Institut Européen des Membranes, IEM – UMR 5635, ENSCM, CNRS, Univ Montpellier, Montpellier, France. c Department of Materials and Chemistry, Vrije Universiteit Brussel, B-1050 Brussels, Belgium. *Corresponding author: [email protected], [email protected]; [email protected] Abstract Thiourea-based carbon paste electrodes (CPEs) were constructed as potentiometric sensors for the determination of salicylate anion in pharmaceutical preparations. The optimized CPE consists of 45.5% graphite, 0.5% reduced graphene oxide (rGO), 46% plasticizer, 5% thiourea ionophore, and 3% tridodecylmethyl ammonium chloride as additive. The electrode exhibited a Nernstian response of 59 mV decade -1 in the concentration range of 10 -1 -10 -5 mole L -1 and a detection limit of 1 x10 -5 mole L -1 . The prepared sensor showed high selectivity against similar anions (i.e. 4 − , benzoate, I - , SCN - ). Selectivity was confirmed by calculating formation constant (β) using sandwich membrane method, where β for thiourea-salicylate is 10 0.43 . The selectivity, the molecular recognition mechanism and the bonding interaction between the salicylate anion and the nitrogen-rich ionophore were studied and quantified by performing theoretical calculations at DFT-B3LY/6-31G** level of theory. The sensors can be successfully used for the determination of salicylate anion in different pharmaceutical formulations, Aspocid® and Aspirin®.
-
Upload
khangminh22 -
Category
Documents
-
view
0 -
download
0
Transcript of Carbon-based Nanosensors for Salicylate Determination in ...

1
Carbon-based nanosensors for salicylate determination in
pharmaceutical preparations
Fatehy M. Abdel-Haleema,* Azza Salaha, Mahmoud S. Rizka, Hussein Moustafaa, Mikhael
Bechelanyb, Ahmed Barhoumb,c*
a Chemistry Department, Faculty of Science, Cairo University, Gamaa Street, Giza 12613, Egypt.
b Institut Européen des Membranes, IEM – UMR 5635, ENSCM, CNRS, Univ Montpellier, Montpellier, France.
c Department of Materials and Chemistry, Vrije Universiteit Brussel, B-1050 Brussels, Belgium.
*Corresponding author: [email protected], [email protected];
Abstract
Thiourea-based carbon paste electrodes (CPEs) were constructed as potentiometric sensors for
the determination of salicylate anion in pharmaceutical preparations. The optimized CPE consists of
45.5% graphite, 0.5% reduced graphene oxide (rGO), 46% plasticizer, 5% thiourea ionophore, and 3%
tridodecylmethyl ammonium chloride as additive. The electrode exhibited a Nernstian response of 59
mV decade-1 in the concentration range of 10-1-10-5 mole L-1 and a detection limit of 1 x10⁻⁵ mole L-1.
The prepared sensor showed high selectivity against similar anions (i.e. 𝐶𝑙𝑂4−, benzoate, I-, SCN-).
Selectivity was confirmed by calculating formation constant (β) using sandwich membrane method,
where β for thiourea-salicylate is 100.43. The selectivity, the molecular recognition mechanism and the
bonding interaction between the salicylate anion and the nitrogen-rich ionophore were studied and
quantified by performing theoretical calculations at DFT-B3LY/6-31G** level of theory. The sensors
can be successfully used for the determination of salicylate anion in different pharmaceutical
formulations, Aspocid® and Aspirin®.
2
Keywords: Potentiometric sensors; salicylate; reduced graphene oxide; thiourea; DFT; nonlinear
optical properties.
1. Introduction
Salicylate is the salt of a salicylic acid that occurs naturally in plants or synthetically in
medications, perfumes or preservatives [1]. Salicylate works as a preservative and natural immune
hormone of the plant, thus protecting the plant against fungi, insects and different diseases [1]. In
human medications, salicylate is used as inflammatory, antimicrobial and analgesic agent and as heart
attack protective. It reduces pain and fever and may protect against colon cancer [2, 3]. However, the
high doses of salicylate lead to accidental poisoning death of children, bleeding; Reye’s syndrome and
its long use may cause kidney cancer and liver diseases [4]. So, determination of salicylate concertation
in plasma is crucial. Also, monitoring its concentration in pharmaceutical and biological samples is
important, as salicylate becomes toxic in blood when exceeds 2.2 x 10⁻³ mmole L-1 (300 mg/L) [5,6],
while the effective therapeutic dose range is from 1.1x10⁻³ to 2.2 x 10⁻³ mmole L-1, which is too close
to the toxicity level. Salicylate concentration higher than 4.3 x 10⁻³ mmole L-1 is considered as lethal
dose [7].
To date, various methods have been developed for the determination of salicylate in physiological
fluids, including fluorometry [8], UV spectrophotometry [9-10], flow-injection atomic absorption
spectrometry [11], voltammetry [12] and high-performance liquid chromatography (HPLC) [13].
However, most of these methods are expensive, tedious, lake adequate selectivity, and time-
consuming. To overcome these drawbacks, electrochemical techniques such as potentiometric sensors
were recently used for routine analysis. Potentiometric sensors are applicable for determining
salicylate (charged species) in colored and turbid solutions, e.g. physiological fluids and
pharmaceutical formulations. The potentiometric sensors and their ion-selective electrodes respond to
the analytes in the presence of various interfering ions. Other advantages characterize potentiometric

3
sensors over other analytical techniques such as applicability over wide concentration ranges, low
detection limit and fast response time which facilitate the use of potentiometric sensors in routine work
[14].
Different types of ion-selective electrodes (ISEs) such as poly(vinyl chloride) (PVCE), carbon
paste (CPE), modified carbon paste (MCPE), and screen-printed electrodes (SPE) have been used in
potentiometric sensors. CPEs and MCPEs acquire certain importance due to its simplicity over other
types, the variability in size and the possibility of miniaturization, the renewability of the sensor
surface, the ease of construction and the possibility of modification [15]. Different modifiers were used
for the improvement of the response characteristics of the constructed sensors, such as lipophilic ion-
exchanger (e.g. derivatives of tetraphenyl borates or quaternary ammonium salts), carbon nanotubes
(CNTs), graphene and reduced graphene oxide (rGO) [16,17].
Up to date, several potentiometric sensors have been reported for salicylate determination [18-22].
However, these sensors lack adequate selectivity, need long response time, are applied in a small
concentration range, and some of them use expensive ionophores [18-21]. Thiourea is commercially
available reagents [22,23] and forms very stable complexes with salicylate [24,25]. It has been used
for the optical detection of salicylate [26]. However, the optical detection of salicylate using thiourea-
based sensor suffered from small concentration range (10-1-10-4 mole L-1), high detection limit (3.9x10-
5 mole L-1), and long response time (2-3 minutes) [26].
In this study, we report straightforward a precise thiourea-based rGO-modified CPE for the
determining of salicylate in pharmaceutical formulations. Incorporation of thiourea into the ISEs for
the electrochemical detection of salicylate overcomes the early reported sensors [18-22,26], and
exhibited better selectivity over early reported thiourea-based sensor [27]. The mechanism of the
complex formation is investigated theoretically. The geometries of the studied complexes are stabilized
by the formation of H-bonds. The energies calculated for HOMO and LUMO (EHOMO and ELUMO) of

4
the studied complexes are used to find the different global properties. The prepared sensors were used
for determining the salicylate in real pharmaceutical formulations, Aspocid®, and Aspirin®. The
bonding interaction between the salicylate anion and the nitrogen-rich ionophore were studied and
quantified by performing theoretical calculations at DFT-B3LY/6-31G** level of theory. The
electronic dipole moment (µ) and first-order hyperpolarizability (β) values of the formed complexes
have been computed theoretically [28, 29].
2. Experimental
1. Materials
Graphite (G, 99.9%, < 45μM), multiwalled carbon nanotubes (NC7000™ - Nanocyl) sodium
borohydride (NaBH4, 98%), poly(vinyl chloride) with high molecular weight (Mw ̴ 43,000) (PVC),
4,5-dimethyl-1,2 –phenylendiamine (DMPD, 98%), 4-nitro-phenyl isothiocyanate (NPTC, 98%),
tetrahydrofuran (THF, 99.9%), tridodecyl-methylammonium chloride (TDMAC, 98%), graphene
oxide (GO nanosheets), different plasticizers like, dibutyl 2-nitrophenyloctyl ether (O-NPOE, 99%),
and dioctyl phthalate (DOP, 99.5%) were of analytical grade and purchased from Sigma-Aldrich
(Munich, Germany). Doubly distilled water was used through this work. Glacial acetic acid (99.5%),
sodium hydroxide, silver nitrate, chloroform, petroleum ether, hydrochloric acid (30%), acetone,
sodium salts of sulfate, nitrate, nitrite, chloride, iodide, bromide, benzoate, salicylate, thiocyanate and
perchlorate monohydrate were purchased from ADWIC (Cairo, Egypt), and used as received without
further purification. Sodium acetate solution (0.05 mole L-1) with pH (4.5) and 0.05 mole L-1 phosphate
buffers (pH 7) were used for the preparation of salicylate and different interfering anions solutions
[30].
2. Preparation of reduced graphene oxide and thiourea
5
Reduced graphene oxide (rGO) was prepared by the reduction of GO using NaBH4 [31]. Briefly,
approximately 1.0 g of GO was dispersed in 50 mL of 10 mM NaBH4, sonicated for 1 h, and
centrifuged to separate the rGO nanosheets. The coagulate was then dried at 120 °C. The thiourea
ionophore was prepared as described elsewhere [27]. Briefly, DMPD:NPTC with a mole ratio of 1:2
were dissolved in methanol and then the reaction mixture was refluxed for 4 h. Yellow powder of
thiourea was obtained after filtration, washing and drying at 100 °C.
3. Apparatus and characterization techniques
Morphology of the constructed sensors was examined by Scanning Electron Microscopy (SEM,
Zeiss EVO HD-15) coupled with an Oxford X-MaxN EDX detector. The elemental distribution
(composition) was mapped through energy dispersive X-Ray spectroscopy (EDX) by integrating the
intensity of the peaks corresponding to C, N, O, S, and Cl as a function of the beam position when
operating the SEM in scanning mode.
Bonding structures were analyzed using Fourier transform infrared spectroscopy (FTIR, Filter–
460 plus JASCO); KBr pellets were used for the measurement and spectra were taken in the range
4000–400 cm-1. Structure and purity were characterized and ensured by Thin-layer chromatography
(TLC), Gas-chromatography-Mass spectrometry (GC-MS, SHIMADZU QP-2010, Japan) at 70 eV,
FTIR and Proton-Nuclear magnetic resonance (1H-NMR, Mercury-300BB, USA) using d-DMSO as a
solvent, as reported elsewhere [27]. For potential and pH measurements, digital Jenway 3010 and 3505
pH meters (England) were used. Home-made Ag/AgCl as an internal reference electrode and saturated
calomel reference electrode (SCE) (Hanna-Italy) was used as the outer reference electrode.
4. Preparation of PVC and sandwich membrane electrodes
PVC membrane was prepared from 33% PVC, 66 % plasticizer, and different percentages of
TDMAC and thiourea (Table 1). The membrane constituents were dissolved in 3 mL THF, inside in 5
cm diameter Petri dish under continuous stirring. After drying in air for 24 h, a homogenous transparent
6
membrane was obtained [1,2]. The formed membrane was cut and glued to the end of PVC tube
electrode using PVC/THF cocktail, filled with internal soaking solutions (0.02 M NaCl + 0.02 M
sodium salicylate) and then soaked for 24 h. For the sandwich membrane, additional membrane
without any ionophore (reference membrane MR) was prepared by the same method and stuck by hand
to the other ionophore-containing membrane [3]. The sandwich membrane was glued to the end of the
PVC tube, and filled with internal soaking solutions in the same way [3].
5. Preparation of carbon paste ISEs
Unmodified CPEs were constructed by mixing thiourea, plasticizer, TDMAC, and graphite in an
agate mortar and mixed well until it was uniformly wetted. In the case of modified CPEs, one of the
different additives MWCNTs, GO or rGO) was added to the paste mixture before mixing for complete
homogeneity [32]. Electrode body filled with the mixture and polished on a very smooth surface to get
the shiny surface. Electrical contact is made through a stainless-steel rod through the center of the
holder. The electrode could be used directly for potentiometric measurements without preconditioning.
6. Electromotive force measurements and pH effect
Potentiometric measurements were carried out using digital Jenway 3010 pH-meter (England) in
which the potential difference or electromotive force (EMF) between ion selective working electrode
(WE) and the reference saturated calomel electrode (RE) under zero current flow was measured at
room temperature. The electrochemical system could be represented as (RE//Sample//WE) in which
both electrodes were immersed in different anion concentrations. The obtained EMF values plotted
against the logarithmic values of the different concentrations. According to Nernest Equation, EMF is
proportional to the logarithm of the ion activity.
The pH effect on the potential measurements of salicylate selective electrodes was tested using 10-
3 mole L-1 salicylate as a test solution. pH value was changed from 2 to 11 by the addition of NaOH or
7
HCl to the test solution, and the EMF of this solution was recorded. EMF was plotted versus the
different pH values.
7. Selectivity coefficient determination
Selectivity coefficient 𝐾𝑆𝑎𝑙,𝐽𝑝𝑜𝑡 was determined by separate solution method (SSM), in which EMF
of a cell containing two solutions separately, one containing the salicylate at the activity aSal (but no
interfering J), and the other containing the interfering ion J at the same activity aJ = aSal (but no
salicylate). The value of 𝐾𝑆𝑎𝑙,𝐽𝑝𝑜𝑡
could be calculated from equation 1:
𝐾𝑆𝑎𝑙,𝐽𝑝𝑜𝑡 =
𝐸2−𝐸1
𝑆+ (1 −
𝑍𝑆𝑎𝑙
𝑍𝐽) log 𝑎𝑆𝑎𝑙 (1)
Where E1 and E2 are the measured EMF values for 10-1 mole L-1 salicylate and interfering ion solutions,
respectively, ZSal and ZJ are the charges of salicylate and the interfering anions, respectively, and S is
the slope of the calibration curve.
8. Formation constant measurements and calculations
Strength of the binding between ionophore and different anions are estimated by determining the
complex formation constants in the membrane phase. Two membranes, one with ion-exchanger and
ionophore and another one containing only the ion-exchanger were prepared. One of the membranes
was placed on top of the other and the potential across the sandwiched membrane was measured
potentiometrically. The formation constant (𝛽𝐼𝐿𝑛) was calculated using equation 2:
𝛽𝐼𝐿𝑛= (𝐿𝑇 −
𝑛𝑅𝑇
𝑍𝐼)
−𝑛
exp (𝐸𝑀𝑍𝐼𝐹
𝑅𝑇) (2)
where T, the absolute temperature; R, the gas constant; F, the Faraday constant; LT , the total
concentration of thiourea ionophore in the membrane segment; RT, the concentration of TDMAC; ZI,
the charge of the anion I; n, the stoichiometry of the ion–ionophore complex: and EM, the membrane
8
potential. The EM value depends mainly on the host-guest interaction and it can be determined by
subtracting the cell potential of the membrane without ionophore from that of the sandwich membrane.
The values of the formation constant could be related to the selectivity coefficients values.
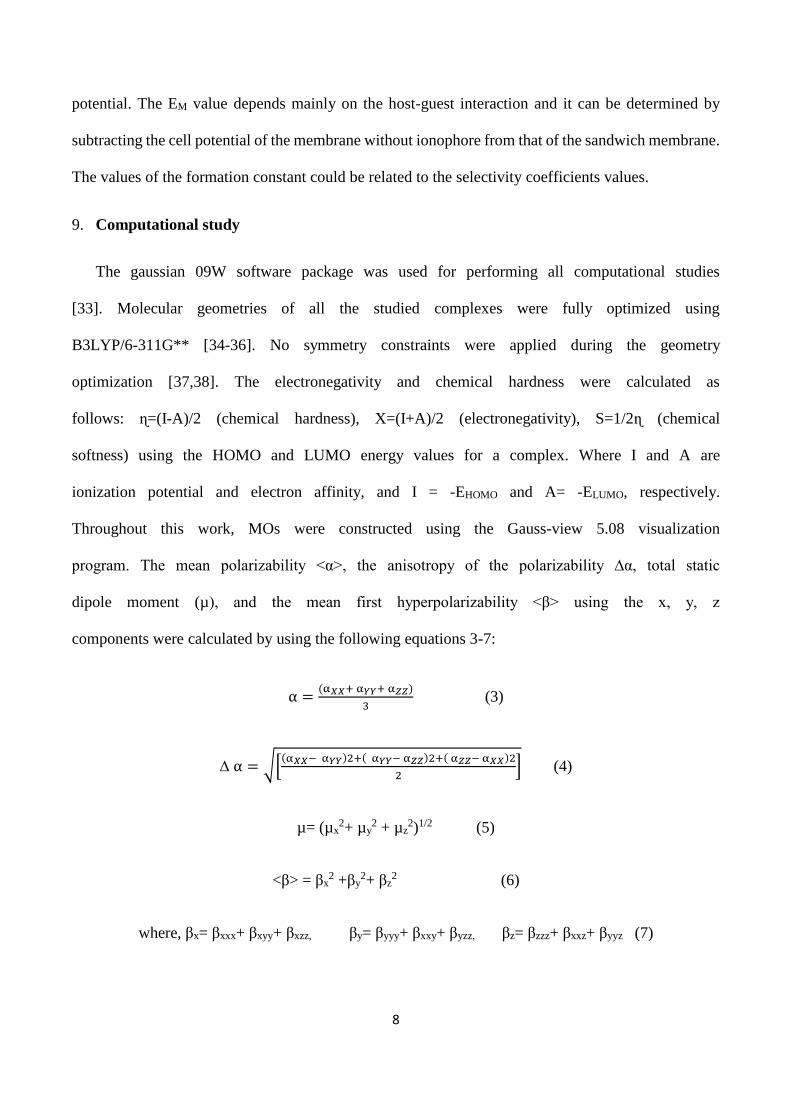
9. Computational study
The gaussian 09W software package was used for performing all computational studies
[33]. Molecular geometries of all the studied complexes were fully optimized using
B3LYP/6-311G** [34-36]. No symmetry constraints were applied during the geometry
optimization [37,38]. The electronegativity and chemical hardness were calculated as
follows: ɳ=(I-A)/2 (chemical hardness), X=(I+A)/2 (electronegativity), S=1/2ɳ (chemical
softness) using the HOMO and LUMO energy values for a complex. Where I and A are
ionization potential and electron affinity, and I = -EHOMO and A= -ELUMO, respectively.
Throughout this work, MOs were constructed using the Gauss-view 5.08 visualization
program. The mean polarizability <α>, the anisotropy of the polarizability ∆α, total static
dipole moment (µ), and the mean first hyperpolarizability <β> using the x, y, z
components were calculated by using the following equations 3-7:
α =(α𝑋𝑋+ α𝑌𝑌+ α𝑍𝑍)
3 (3)
∆ α = √[(α𝑋𝑋− α𝑌𝑌)2+( α𝑌𝑌− α𝑍𝑍)2+( α𝑍𝑍− α𝑋𝑋)2
2] (4)
µ= (µx2+ µy
2 + µz2)1/2 (5)
<β> = βx2 +βy
2+ βz2 (6)
where, βx= βxxx+ βxyy+ βxzz, βy= βyyy+ βxxy+ βyzz, βz= βzzz+ βxxz+ βyyz (7)

9
Among second-order NLO phenomena, we focused on the hyper-Rayleigh scattering (HRS) response
[39]. Assuming a non-polarized incident light in the X-direction, the harmonic light intensity scattered
at 90° in the Y direction and vertically (V) polarized (along the Z axis) is given by Bersohn’s
expression [40]:
HRS = √(𝑍𝑍𝑍2 +
𝑍𝑋𝑋2 ) (8)
The depolarization ratio, DR, which reveals the shape of the NLO-phore, reads
DR = 𝑍𝑍𝑍
2
𝑍𝑋𝑋2 (9)
are orientational averages of the β tensor, which are proportional to the scattered signal intensities for
vertically and horizontally-polarized incident signals, respectively.
10. Sample analysis
The constructed sensors were examined for the determination of salicylate anion in different
pharmaceutical formulations, i.e. Aspocid® (75 mg) and Aspirin® (320 mg). Aspirin is a derivative
of salicylic acid and is also known as acetylsalicylic acid. Aspirin® is a well-known drug for treating
inflammation, fever, and pain and avoiding strokes risk. Aspocid ® tablet is used for Risk of stroke,
Fever, Rheumatic fever, Pain, Kawasaki disease, Rheumatoid arthritis, Pericarditis, Heart attack
Aspirin® and Aspocid® were prepared from their pharmaceutical preparations by grinding five
tablets of each type to a fine powder. A known amount of tablets powder was dissolved in a buffer
solution at 40 °C for 10 minutes and then cooled and filtered. Afterward, the buffer was completed
with the buffer solution to 250 mL. Other concentrations were obtained by appropriate dilutions. These
solutions were used further for potentiometric determination of salicylate concertation using sensors
of optimized conditions, and results were compared to that obtained with the reference methods
[27,41].
10
3. Results and discussion
Primary studies were carried out using a carbon paste sensor containing thiourea as an ionophore.
The response for all anions was weaker than that for salicylate anion, which confirms the specific
interaction of thiourea with salicylate. These results were ensured by the previously reported method
that used the same ionophore [27].
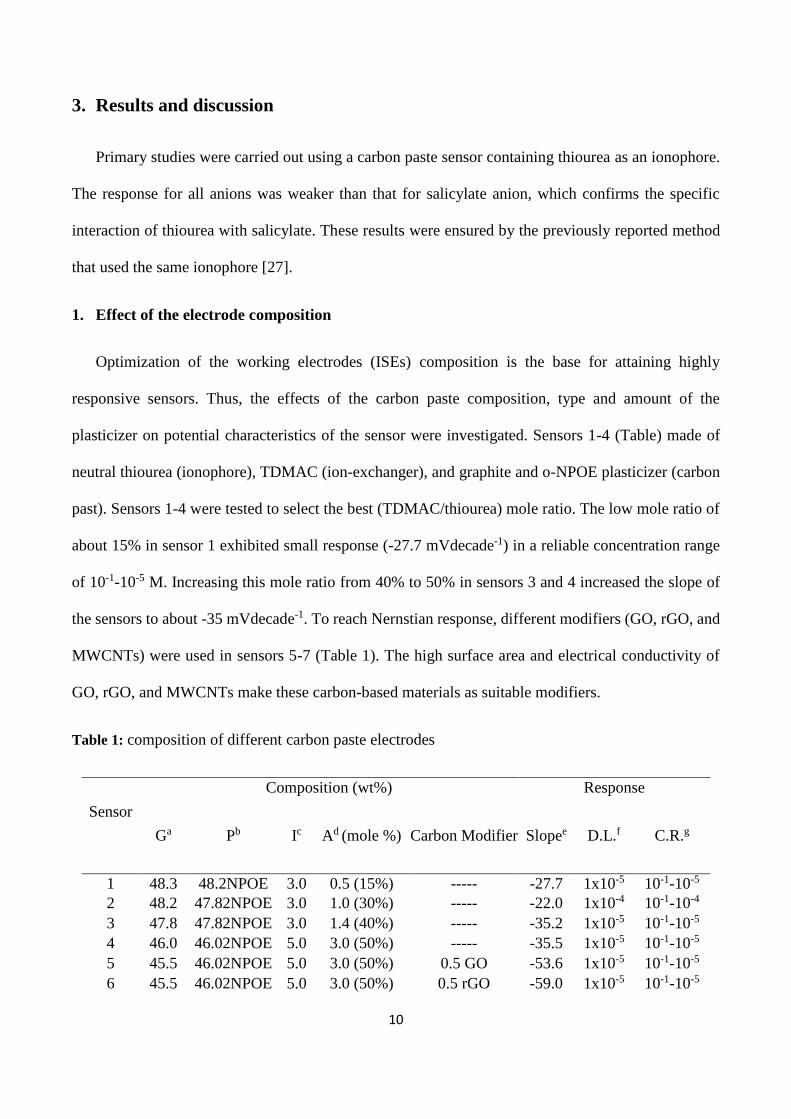
1. Effect of the electrode composition
Optimization of the working electrodes (ISEs) composition is the base for attaining highly
responsive sensors. Thus, the effects of the carbon paste composition, type and amount of the
plasticizer on potential characteristics of the sensor were investigated. Sensors 1-4 (Table) made of
neutral thiourea (ionophore), TDMAC (ion-exchanger), and graphite and o-NPOE plasticizer (carbon
past). Sensors 1-4 were tested to select the best (TDMAC/thiourea) mole ratio. The low mole ratio of
about 15% in sensor 1 exhibited small response (-27.7 mVdecade-1) in a reliable concentration range
of 10-1-10-5 M. Increasing this mole ratio from 40% to 50% in sensors 3 and 4 increased the slope of
the sensors to about -35 mVdecade-1. To reach Nernstian response, different modifiers (GO, rGO, and
MWCNTs) were used in sensors 5-7 (Table 1). The high surface area and electrical conductivity of
GO, rGO, and MWCNTs make these carbon-based materials as suitable modifiers.
Table 1: composition of different carbon paste electrodes
Sensor
Composition (wt%) Response
Ga Pb Ic Ad (mole %) Carbon Modifier Slopee D.L.f C.R.g
1 48.3 48.2NPOE 3.0 0.5 (15%) ----- -27.7 1x10⁻⁵ 10-1-10-5
2 48.2 47.82NPOE 3.0 1.0 (30%) ----- -22.0 1x10⁻⁴ 10-1-10-4
3 47.8 47.82NPOE 3.0 1.4 (40%) ----- -35.2 1x10⁻⁵ 10-1-10-5
4 46.0 46.02NPOE 5.0 3.0 (50%) ----- -35.5 1x10⁻⁵ 10-1-10-5
5 45.5 46.02NPOE 5.0 3.0 (50%) 0.5 GO -53.6 1x10⁻⁵ 10-1-10-5
6 45.5 46.02NPOE 5.0 3.0 (50%) 0.5 rGO -59.0 1x10⁻⁵ 10-1-10-5
11
7 45.5 46.02NPOE 5.0 3.0 (50%) 0.5 MWCNT -75.0 1x10⁻⁶ 10-1-10-6
8 45.5 46.0DOP 5.0 3.0 (50%) 0.5 rGO -50.0 1x10⁻⁴ 10-1-10-4
a: graphite, b: plasticizer, c: thiourea ionophore, d: TDMAC all the previous and modifier are in
weight% ratio between moles of TDMAC to moles of thiourea is between brackets in A column. e:
slope in mVdecade-1, f,g: detection limit and concentration range in mole L-1.
The improvement in the slope by the addition of GO in sensor 5 can be explained by the
existence of different hydroxyl and carboxylic function groups [31,42], that can enhance the formation
of the hydrogen bond with salicylate anion. More improvement was achieved by addition of rGO in
sensor 6, which is due to the high surface area and electrical conductivity of rGO that facilitate charge
transfer and thus ensure high electrochemical activity, the populated chemical moieties on rGO surface
which enhance the sensor performance, high tunability of the chemical and electrical properties of
rGO, and efficient charge transport by rGO [31,42,43]. The larger surface area of the MWCNTs in
sensor 7 may be the reason for the super-Nernstian response.
The nature of the plasticizer influences the dielectric constant of the past that affects the
mobility within the past, which in turn affects the ion selective electrode characteristics [44,45]. Using
plasticizer of high dielectric constant, o-NPOE, is preferred because it decreases the response time,
increases the linear concentration range of application and decreases the detection limit (Fig. 1) [45].
We prepared sensor 8 that contains the same constituents of sensor 6 after replacing with a plasticizer
of low dielectric constant, DOP. This change causes the deterioration of the sensing characters in terms
of detection limit, concentration range and response time (Table 1).

12
Fig. 1: Calibration curves of sensor 6 (blue) and sensor 8 (orange).
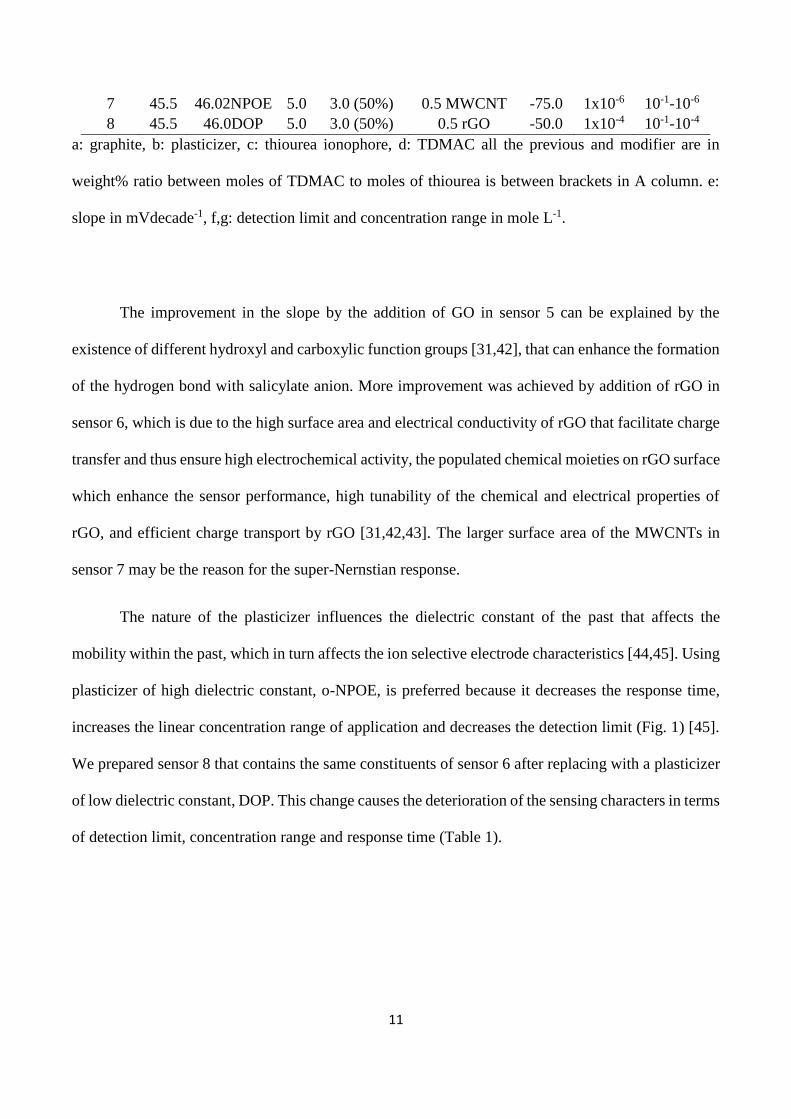
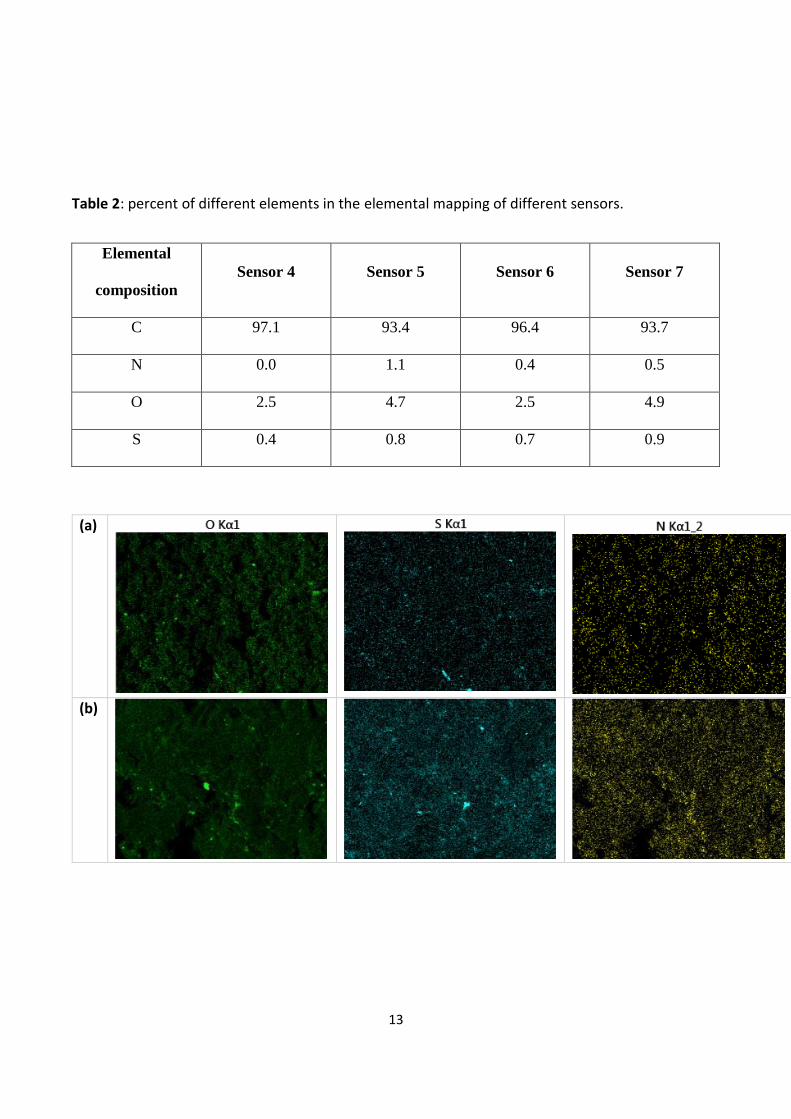
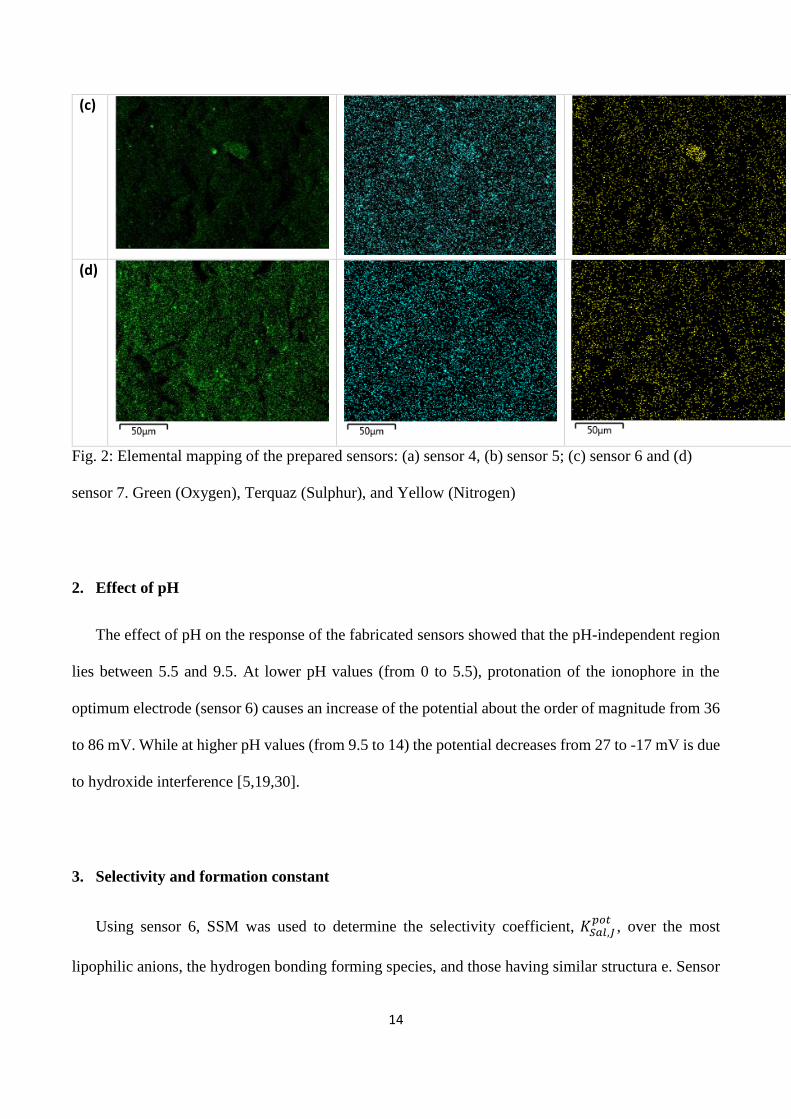
The morphology of the carbon paste electrodes (sensors 4-7) and the elemental distribution of
nitrogen, oxygen, and sulfur in the carbon paste was investigated by SEM elemental mapping (Figure
2a-d). It can be seen clearly that elemental distribution of Nitrogen and Sulphur in the carbon paste
(belong to thiourea ionophore ion-pair). The highest amount of carbon exists in sensor 4 which is
mainly made of graphite. Addition of GO, rGO, and MWCNTs to carbon past increases the
dispensability of thiourea ionophore, especially in the case of sensor 5. Addition of 0.5wt% GO to
sensor 5 (Figure 5b) significantly improved the dispersion of the thiourea ionophore ion-pair in the
carbon paste comparing with other sensors (Figure 1a). The relatively lower oxygen content in sensor
6 (Figure 2c and Table 2) comparing with sensor (5) indicates the reduction of GO into reduced GO.
Addition of 0.5wt% CNTs in the sensor 7 (Figure 5d) slightly improve the dispersion of the thiourea
ionophore ion-pair in the carbon paste comparing with sensor 4 (Figure 1a).
0
50
100
150
200
250
300
-6-4-20
E [m
V]
log [salicylate]
13
Table 2: percent of different elements in the elemental mapping of different sensors.
Sensor 7 Sensor 6 Sensor 5 Sensor 4
Elemental
composition
93.7 96.4 93.4 97.1 C
0.5 0.4 1.1 0.0 N
4.9 2.5 4.7 2.5 O
0.9 0.7 0.8 0.4 S
(a)
(b)
14
(c)
(d)
Fig. 2: Elemental mapping of the prepared sensors: (a) sensor 4, (b) sensor 5; (c) sensor 6 and (d)
sensor 7. Green (Oxygen), Terquaz (Sulphur), and Yellow (Nitrogen)
2. Effect of pH
The effect of pH on the response of the fabricated sensors showed that the pH-independent region
lies between 5.5 and 9.5. At lower pH values (from 0 to 5.5), protonation of the ionophore in the
optimum electrode (sensor 6) causes an increase of the potential about the order of magnitude from 36
to 86 mV. While at higher pH values (from 9.5 to 14) the potential decreases from 27 to -17 mV is due
to hydroxide interference [5,19,30].
3. Selectivity and formation constant
Using sensor 6, SSM was used to determine the selectivity coefficient, 𝐾𝑆𝑎𝑙,𝐽𝑝𝑜𝑡
, over the most
lipophilic anions, the hydrogen bonding forming species, and those having similar structura e. Sensor
15
6 exhibited good selectivity over all species, even that having similar structure such as benzoate. To
relate the selectivity to the binding strength, formation constants were measured by sandwich
membrane method [33]. Complete agreement is obtained between the results of formation constant
and selectivity, where the most interfering species show the highest formation constant species and
vice versa, Table 3.
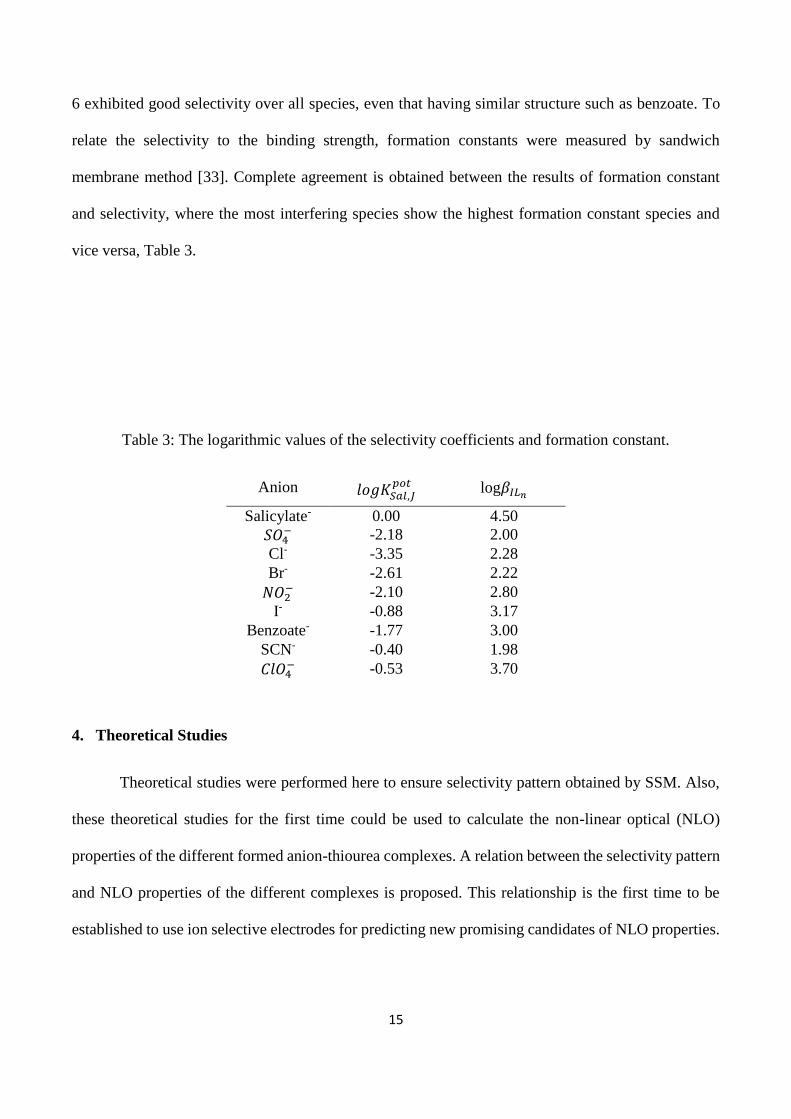
Table 3: The logarithmic values of the selectivity coefficients and formation constant.
log𝛽𝐼𝐿𝑛 𝑙𝑜𝑔𝐾𝑆𝑎𝑙,𝐽
𝑝𝑜𝑡 Anion
4.50 0.00 Salicylate-
2.00 -2.18 𝑆𝑂4−
2.28 -3.35 Cl-
2.22 -2.61 Br-
2.80 -2.10 𝑁𝑂2−
3.17 -0.88 I-
3.00 -1.77 Benzoate-
1.98 -0.40 SCN-
3.70 -0.53 𝐶𝑙𝑂4−
4. Theoretical Studies
Theoretical studies were performed here to ensure selectivity pattern obtained by SSM. Also,
these theoretical studies for the first time could be used to calculate the non-linear optical (NLO)
properties of the different formed anion-thiourea complexes. A relation between the selectivity pattern
and NLO properties of the different complexes is proposed. This relationship is the first time to be
established to use ion selective electrodes for predicting new promising candidates of NLO properties.
16
Comparison of NLO properties of formed anion-thiourea complexes and urea as a reference will be
mentioned.
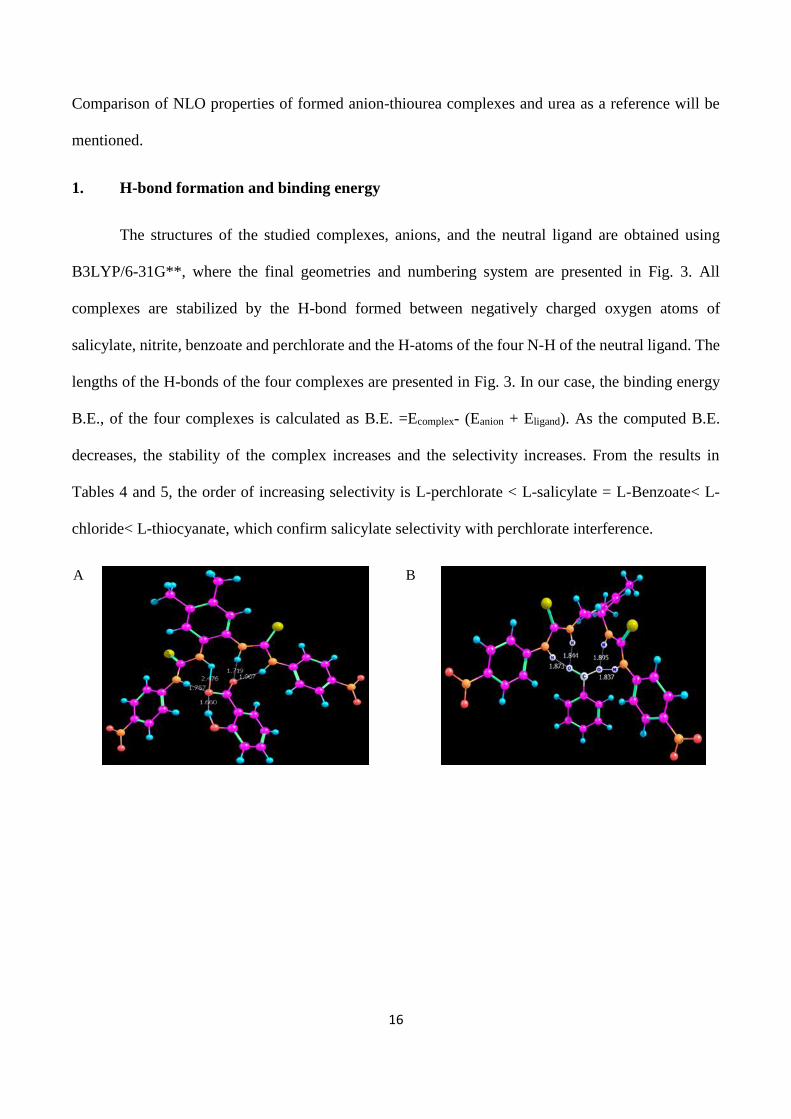
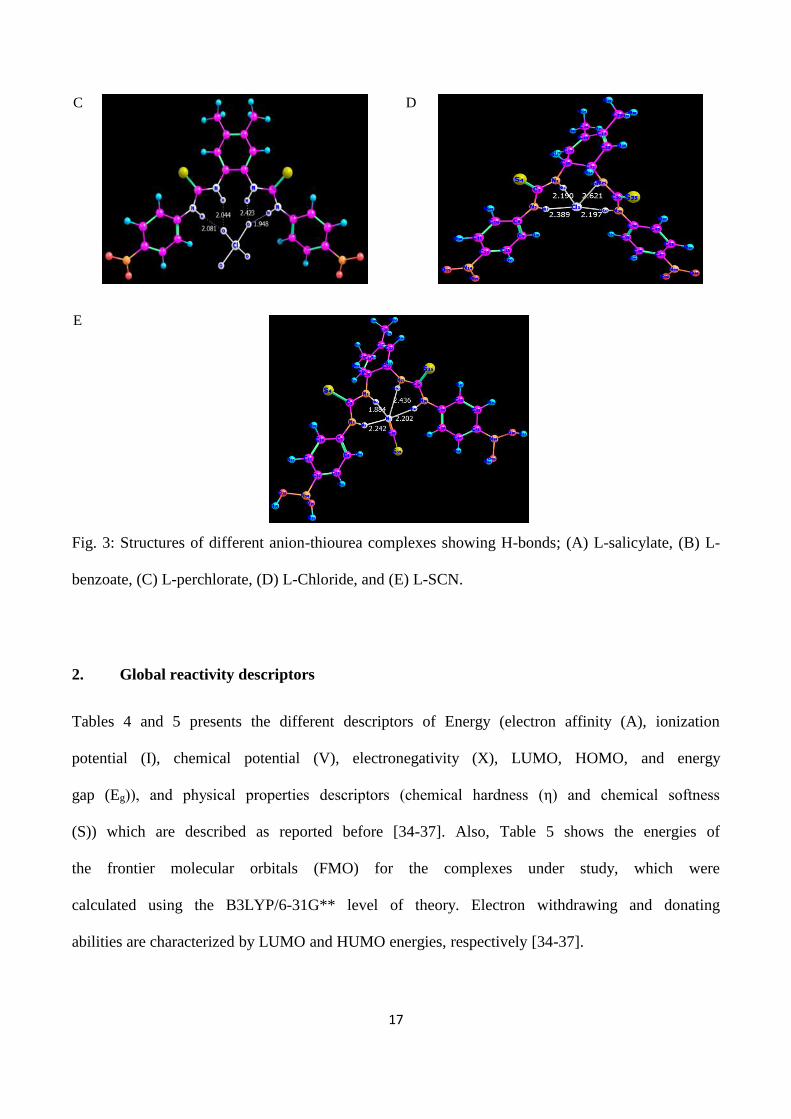
1. H-bond formation and binding energy
The structures of the studied complexes, anions, and the neutral ligand are obtained using
B3LYP/6-31G**, where the final geometries and numbering system are presented in Fig. 3. All
complexes are stabilized by the H-bond formed between negatively charged oxygen atoms of
salicylate, nitrite, benzoate and perchlorate and the H-atoms of the four N-H of the neutral ligand. The
lengths of the H-bonds of the four complexes are presented in Fig. 3. In our case, the binding energy
B.E., of the four complexes is calculated as B.E. =Ecomplex- (Eanion + Eligand). As the computed B.E.
decreases, the stability of the complex increases and the selectivity increases. From the results in
Tables 4 and 5, the order of increasing selectivity is L-perchlorate < L-salicylate = L-Benzoate< L-
chloride< L-thiocyanate, which confirm salicylate selectivity with perchlorate interference.
A
B
17
C
D
E
Fig. 3: Structures of different anion-thiourea complexes showing H-bonds; (A) L-salicylate, (B) L-
benzoate, (C) L-perchlorate, (D) L-Chloride, and (E) L-SCN.
2. Global reactivity descriptors
Tables 4 and 5 presents the different descriptors of Energy (electron affinity (A), ionization
potential (I), chemical potential (V), electronegativity (X), LUMO, HOMO, and energy
gap (Eg)), and physical properties descriptors (chemical hardness (η) and chemical softness
(S)) which are described as reported before [34-37]. Also, Table 5 shows the energies of
the frontier molecular orbitals (FMO) for the complexes under study, which were
calculated using the B3LYP/6-31G** level of theory. Electron withdrawing and donating
abilities are characterized by LUMO and HUMO energies, respectively [34-37].

18
Table 4: Global reactivity descriptors of the different thiourea- anion complexes
L-Salicylate L-Benzoate L-perchlorate L-Chloride L-thiocyanate
ET, au -2772.648 -2697.602 -3036.761 -2737.6 -2270.6
B.E., Kcal 681.5 681.5 52.1 774.3 1413.2
EHOMO, au -0.2295 -0.1231 -0.2514 -0.1272 -0.1095
ELUMO, au -0.1015 -0.0076 -0.0394 -0.0068 0.0509
I, eV 6.242 3.348 6.838 3.459 2.978
A, eV 2.761 0.207 1.072 0.185 -1.348
χ, eV 4.502 1.778 3.955 1.822 0.815
ɳ, eV 1.741 1.571 2.883 1.637 2.163
Ѕ, eV-1 0.182 0.194 0.173 0.305 0.231
ν, eV -4.502 -1.778 -3.955 -1.822 -0.815
ω, eV 2.908 3.012 2.205 27.798 0.251
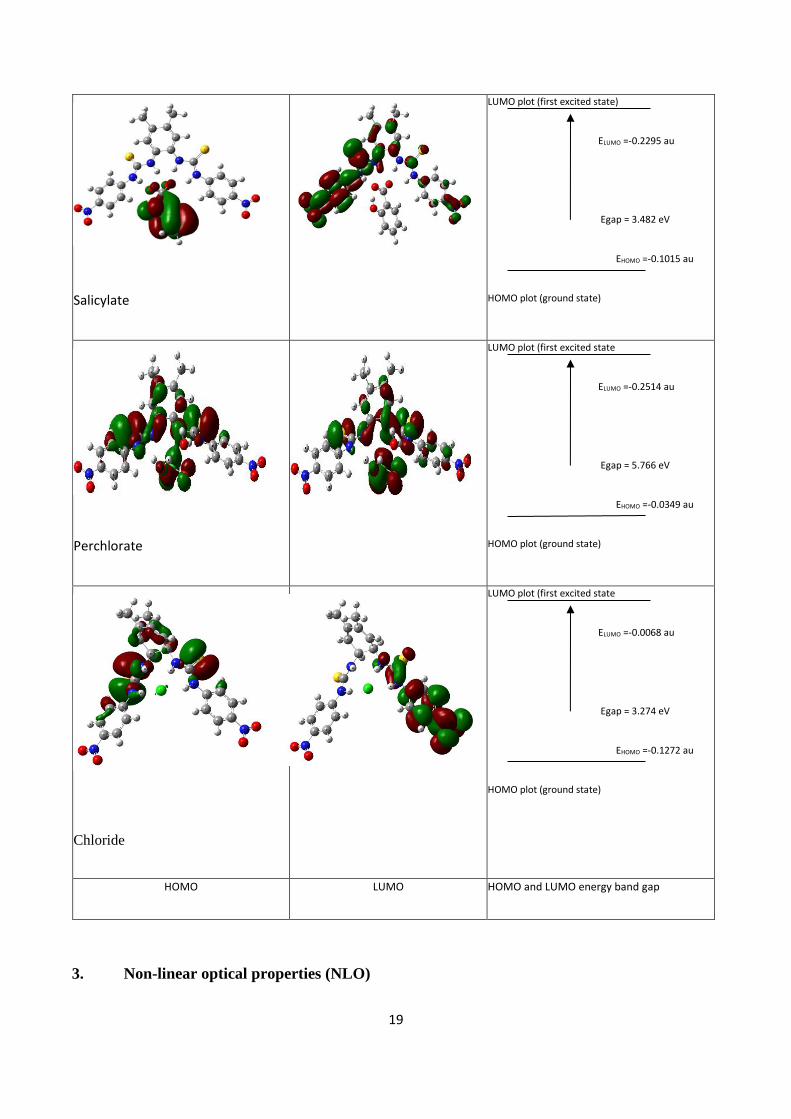
Table 5: HUMO and LUMO of different thiourea-anion complexes with a schematic representation of their
energies and energy gaps.
Benzoate
LUMO plot (first excited state)
ELUMO =-0.1231 au
Egap = 3.142 eV
EHOMO =-0.0076 au
HOMO plot (ground state)
SCN-
LUMO plot (first excited state)
ELUMO =0.0509 au
Egap = 1.593 eV
EHOMO =-0.1095 au
HOMO plot (ground state)
19
Salicylate
LUMO plot (first excited state)
ELUMO =-0.2295 au
Egap = 3.482 eV
EHOMO =-0.1015 au
HOMO plot (ground state)
Perchlorate
LUMO plot (first excited state
ELUMO =-0.2514 au
Egap = 5.766 eV
EHOMO =-0.0349 au
HOMO plot (ground state)
Chloride
LUMO plot (first excited state
ELUMO =-0.0068 au
Egap = 3.274 eV
EHOMO =-0.1272 au
HOMO plot (ground state)
HOMO LUMO HOMO and LUMO energy band gap
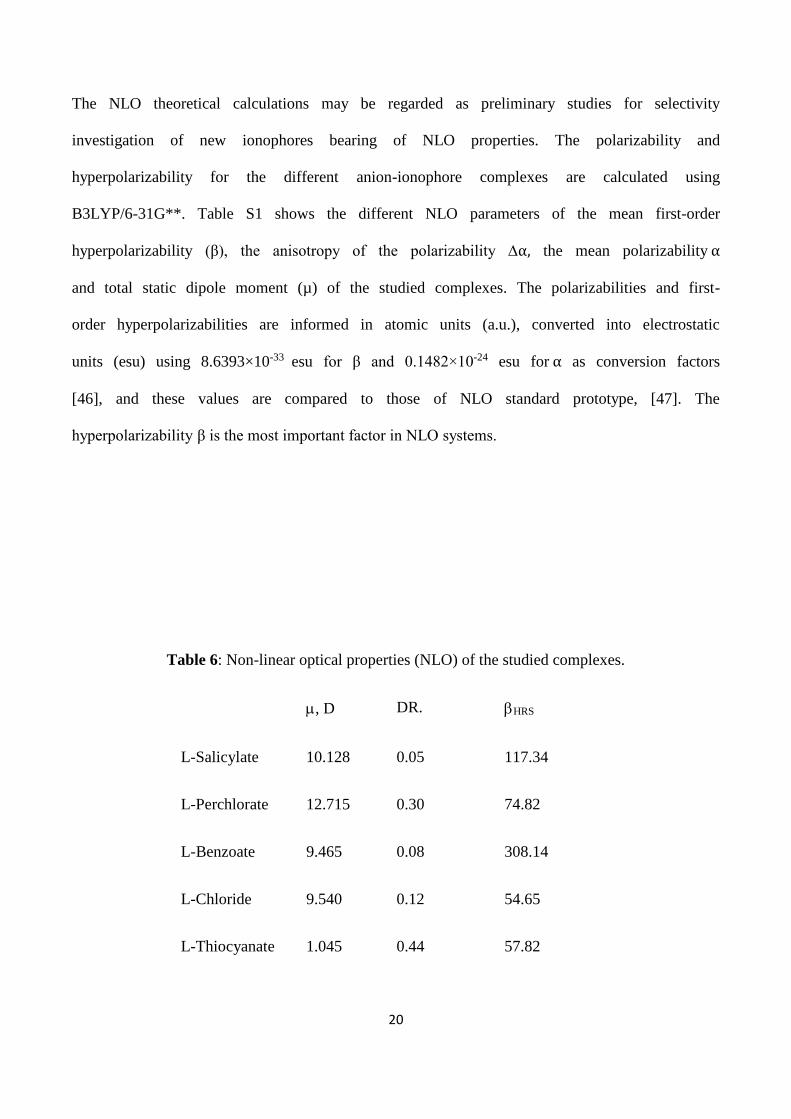
3. Non-linear optical properties (NLO)
20
The NLO theoretical calculations may be regarded as preliminary studies for selectivity
investigation of new ionophores bearing of NLO properties. The polarizability and
hyperpolarizability for the different anion-ionophore complexes are calculated using
B3LYP/6-31G**. Table S1 shows the different NLO parameters of the mean first-order
hyperpolarizability (β), the anisotropy of the polarizability ∆α, the mean polarizability α
and total static dipole moment (µ) of the studied complexes. The polarizabilities and first-
order hyperpolarizabilities are informed in atomic units (a.u.), converted into electrostatic
units (esu) using 8.6393×10⁻³³ esu for β and 0.1482×10⁻²⁴ esu for α as conversion factors
[46], and these values are compared to those of NLO standard prototype, [47]. The
hyperpolarizability β is the most important factor in NLO systems.
Table 6: Non-linear optical properties (NLO) of the studied complexes.
, D DR. HRS
L-Salicylate 10.128 0.05 117.34
L-Perchlorate 12.715 0.30 74.82
L-Benzoate 9.465 0.08 308.14
L-Chloride 9.540 0.12 54.65
L-Thiocyanate 1.045 0.44 57.82
21
Also, to relate the selectivity pattern obtained by the ion-selective electrode to NLO properties,
Hyper-Rayleigh scattering (HRS) and the depolarization ratio (DR.) is calculated. The variation of
these parameters shown in Table 6 can be rationalized by complexation and structural evidence [48].
The highest value of HRS for benzoate and salicylate confirms short bond length between these anions
and thiourea ligand which confirm their strong complexation and higher selectivity [48,49]. The lowest
value of DR. should be obtained for the more selective ion, which is shown in the Table 6 for salicylate
and perchlorate. These data confirm the salicylate selectivity with some interference by benzoate and
perchlorate.
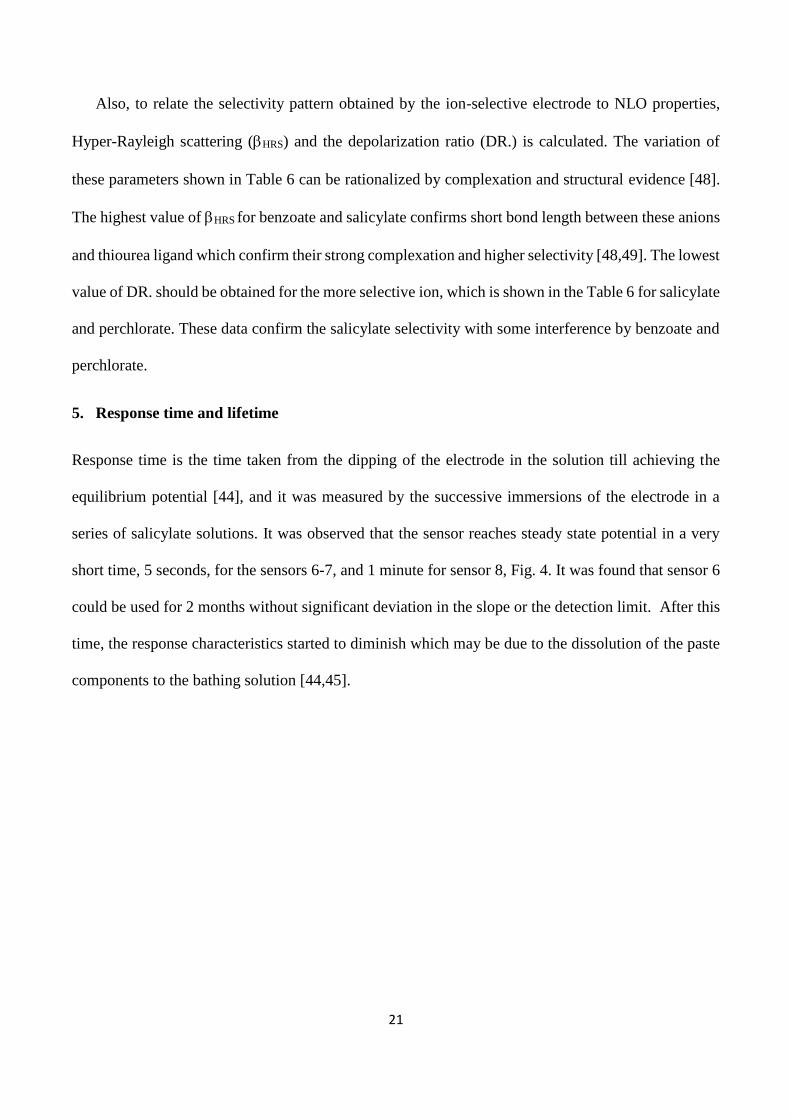
5. Response time and lifetime
Response time is the time taken from the dipping of the electrode in the solution till achieving the
equilibrium potential [44], and it was measured by the successive immersions of the electrode in a
series of salicylate solutions. It was observed that the sensor reaches steady state potential in a very
short time, 5 seconds, for the sensors 6-7, and 1 minute for sensor 8, Fig. 4. It was found that sensor 6
could be used for 2 months without significant deviation in the slope or the detection limit. After this
time, the response characteristics started to diminish which may be due to the dissolution of the paste
components to the bathing solution [44,45].
22
Time, sec.
0 100 200 300 400 500 600
E, m
V
0
50
100
150
200
Fig. 4: response time of sensor 6.
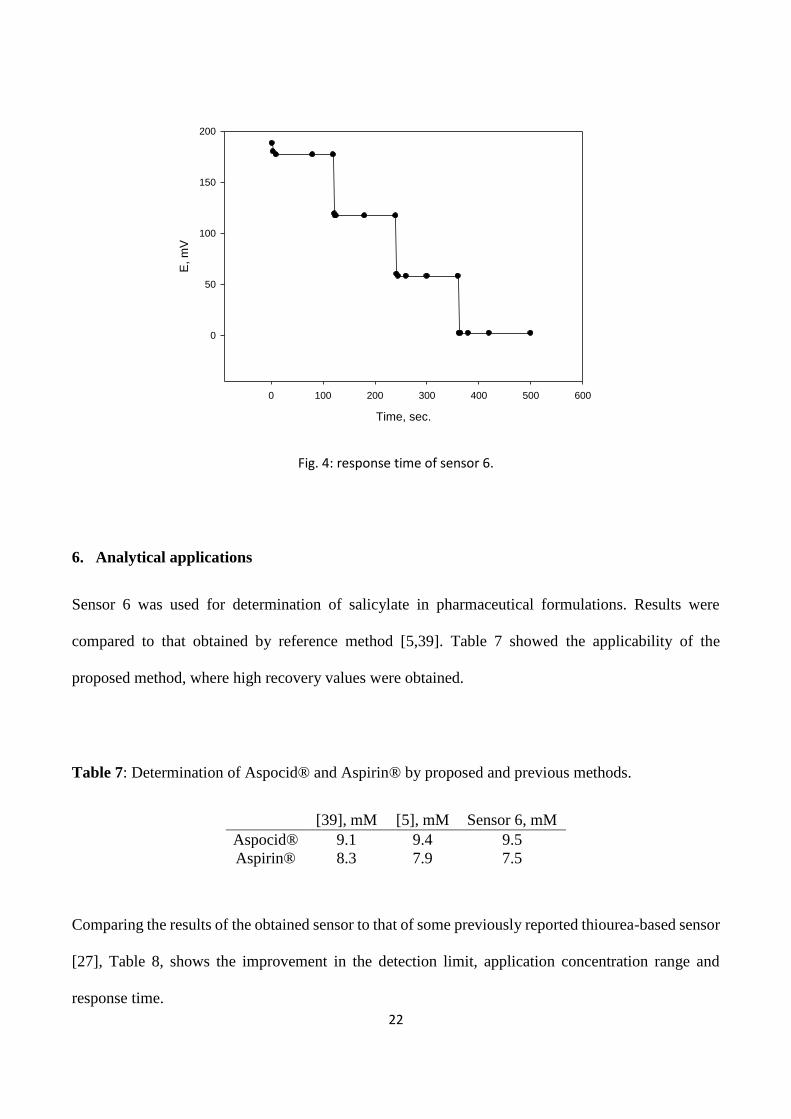
6. Analytical applications
Sensor 6 was used for determination of salicylate in pharmaceutical formulations. Results were
compared to that obtained by reference method [5,39]. Table 7 showed the applicability of the
proposed method, where high recovery values were obtained.
Table 7: Determination of Aspocid® and Aspirin® by proposed and previous methods.
[39], mM [5], mM Sensor 6, mM
Aspocid® 9.1 9.4 9.5
Aspirin® 8.3 7.9 7.5
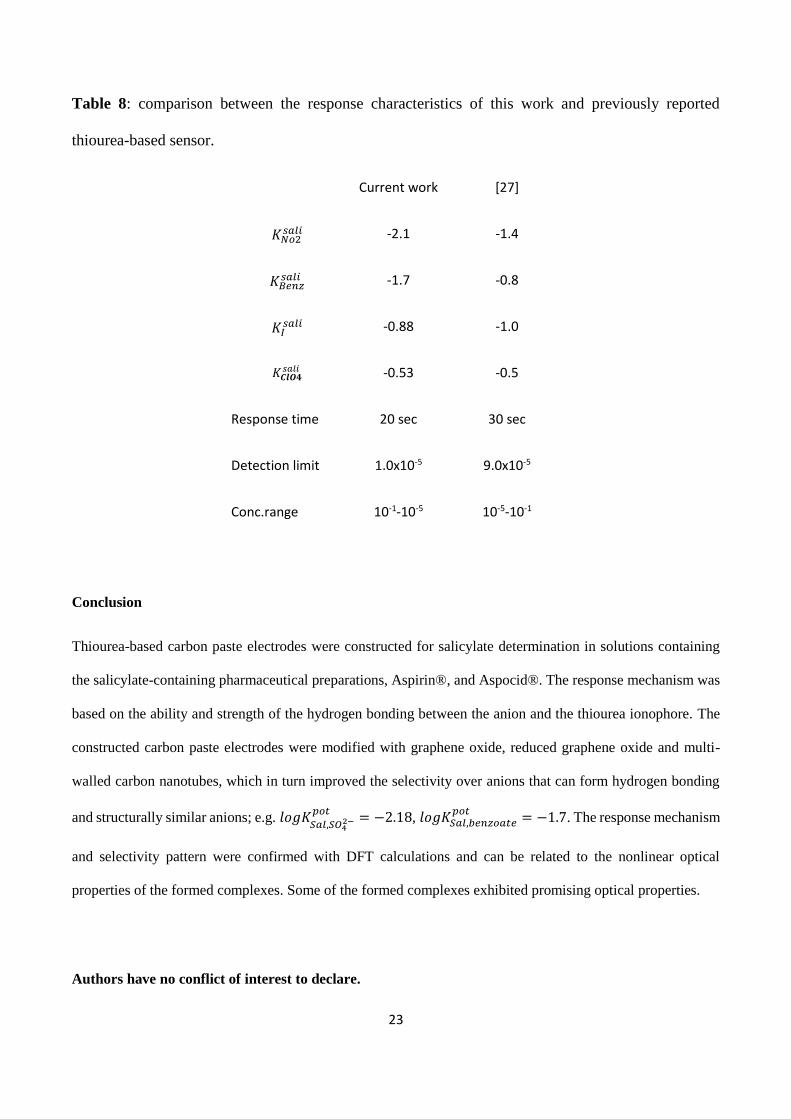
Comparing the results of the obtained sensor to that of some previously reported thiourea-based sensor
[27], Table 8, shows the improvement in the detection limit, application concentration range and
response time.
23
Table 8: comparison between the response characteristics of this work and previously reported
thiourea-based sensor.
Current work [27]
𝐾𝑁𝑜2𝑠𝑎𝑙𝑖 -2.1 -1.4
𝐾𝐵𝑒𝑛𝑧𝑠𝑎𝑙𝑖 -1.7 -0.8
𝐾𝐼𝑠𝑎𝑙𝑖 -0.88 -1.0
𝐾𝑪𝒍𝑶𝟒𝑠𝑎𝑙𝑖 -0.53 -0.5
Response time 20 sec 30 sec
Detection limit 1.0x10⁻⁵ 9.0x10⁻⁵
Conc.range 10-1-10-5 10-5-10-1
Conclusion
Thiourea-based carbon paste electrodes were constructed for salicylate determination in solutions containing
the salicylate-containing pharmaceutical preparations, Aspirin®, and Aspocid®. The response mechanism was
based on the ability and strength of the hydrogen bonding between the anion and the thiourea ionophore. The
constructed carbon paste electrodes were modified with graphene oxide, reduced graphene oxide and multi-
walled carbon nanotubes, which in turn improved the selectivity over anions that can form hydrogen bonding
and structurally similar anions; e.g. 𝑙𝑜𝑔𝐾𝑆𝑎𝑙,𝑆𝑂4
2−𝑝𝑜𝑡
= −2.18, 𝑙𝑜𝑔𝐾𝑆𝑎𝑙,𝑏𝑒𝑛𝑧𝑜𝑎𝑡𝑒𝑝𝑜𝑡
= −1.7. The response mechanism
and selectivity pattern were confirmed with DFT calculations and can be related to the nonlinear optical
properties of the formed complexes. Some of the formed complexes exhibited promising optical properties.
Authors have no conflict of interest to declare.

24
References
[1] N.S. Palikhe, S.H. Kim, H.S. Park, What do we know about the genetics of aspirin intolerance, 33(2008)
(5), 465–72
[2] S. Shahrokhian, A. Hamzehloei, M. Bagherzadeh. PVC-Based Mn(III) Porphyrin Membrane-Coated Graphite
Electrode for Determination of Histidine, 74(2002), 3312–3320
[3] A. L. Sun, Y. Q. Chai, R. Yuan, G. F. Gui, Chin. J. Highly Selective Salicylate Membrane Electrode Based
on N,N′-(Aminoethyl)ethylenediamide Bis(2-salicylideneimine) Binuclear Copper(II) Complex as Neutral
Carrier, 24(2006), 894– 898.
[4] "Acetylsalicylic Acid." UXL Encyclopedia of Science. . Encyclopedia.com. 13 Feb.
2017<http://www.encyclopedia.com>.
[5] A.L. Sun, Y.Q. Chai, R.G.F. Gui, Chin. Highly Selective Salicylate Membrane Electrode Based on N,N′-
(Aminoethyl)ethylenediamide Bis(2-salicylideneimine) Binuclear Copper(II) Complex as Neutral Carrier,
24(2006), 894.
[6] T.G. Moore, M.J. Joseph, B.W. Allen, L.A. Coury, Enzymically Amplified Voltammetric Sensor for
Microliter Sample Volumes of Salicylate, 67(1995), 1896.
[7] J.B. Mowry, D.A. Spyker, D.E. Brooks, N. McMillan, J.L. Schauben, 2014 Annual Report of the American
Association of Poison Control Centers' National Poison Data System (NPDS): 32nd Annual Report.,
53(2015)(10), 962.
[8] P. C. Damiani, M. D. Borraccetti, A. C. Olivier, Anal. Chim. Acta., 2002, 471, 87.
[9] I. M. Scott, H. Yamamoto. Phytochem., 1994, 37,335.
[10] M. S. Marcelo, G. T. Marcello, J. P. Ronei,Analysis of liposomes, 68(2006),1707-1212
[11] G. A. Rivas, J. M. Calatayud, FIA-AAS determination of salicylic acid by a solid-phase reactor of copper
carbonate incorporated in polyester resin beads, 42(1995), 1285.
25
[12] L. Lu, X. Zhu, X. Qiu, H. He, J. Xu, X. Wang, Int. J. graphene oxid/multi walled carbon nanotubes
composites as an enhanced sensing platform for voltametric determination of salcylic acid , 9(2014), 8057.
[13] S. Croubels, A. Maes, K. Baert, P. De Backer, Anal. Chim. Acta, 2005, 520, 179.
[14] E. Bakker, Electroanalysis with Membrane Electrodes and Liquid–Liquid Interfaces, 88(2016), 395.
[15] I.S. vancara, K. Vytras, K. Kalcher, A. Walcarius, J. Wang, Carbon Paste Electrodes in Facts, Numbers,
and Notes: A Review on the Occasion of the 50-Years Jubilee of Carbon Paste in Electrochemistry and
Electroanalysis, 21(2009)(1), 7.
[16] Sh. A. Zaidi, Int. J. grapheme; a comperehensive review on its utilization in carbon paste electrodes for
improved sensor performances, 8(2013), 11337.
[17] I. Švancara, K. Vytřas, J. Barek, J. Zima, Carbon Paste Electrodes in Modern Electroanalysis, 31(2001)(4),
311.
[18] M.N. Ayanoglu, H. E.K. Ertirin, A.D. Ozel, O. Sahin, M. Yılmaz, E. Kılıc, Salicylate Ion-Selective
Electrode Based on a Calix[4]arene as Ionophore, 27(2015), 1676.
[19] I.M. Isa, N. M. Sohaimi, N. Hashim, A. Kamari, A. Mohamed, M. Ahmad, S.A. Ghani, Suyanta, Int. J.
determination of salicylate ion by potentiometric membrane electrode, 8(2013), 2112.
[20] M. Mazloum-Ardakani, P. Pourhakkak, M. Salavati-Niasari, M.A. Karimid, M.H. Mashhadizadeh, J. Braz.
Efficient Dehydrogenation of Formic Acid Using an Iron Catalyst22(2011), 30.
[21] E.P. Luo, Y.Q. Chai, R. Yuan, J.Y. Dai, L. Xu, Highly salicylate-selective membrane electrode based on a
new thiomacrocyclic Schiff base complex of binuclear copper(II) as neutral carrier, 249(2009), 615.
[22] S. O. Kang, J. M. Linares, D. Powell, D. VanderVelde, K. Bowman-James, J. Am. New Polyamide
Cryptand for Anion Binding125(2003), 10152.
[23] S.I. Kondo, Y. Hiraoka, N. Kurumatani, Y. Yano, Carborane acids. New “strong yet gentle” acids for
organic and inorganic chemistry, 1720(2005)
26
[24] D.H. Lee, H.Y. Lee, K.H. Lee, J.I. Hong, Selective anion sensing based on a dual-chromophore
approach†,1188(2001)
[25] G.M. Kyne, M.E. Light, M.B. Hursthouse, J. de Mendoza, J.D. Kilburn, J. Strongly Acidic and High-
Temperature Hydrothermally Stable Mesoporous Aluminosilicates with Ordered Hexagonal
Structure,1258(2001).
[26] F.M. Abdel-Haleem, Highly selective thiourea-based bulk optode for determination of salicylate in spiked
urine samples, Aspirin® and Aspocid®,233(2016), 257.
[27] Chaegyeong Lee, Junghwan Kim, Dong Wan Kim, Shim Sung Lee, Jineun Kim, and Jae Sang KimBull.
Korean Chem. Soc. 2007, Vol. 28, No. 12, 2466-70.
[28] (a) S. Natorajan, G. Shanmugam, S.A. Martin, Cryst. Res. Technal. 2008, 43,561. (b) D.S. Chemia, J.
Zysss, Nonlinear Optical Properties of Organic Molecules and Crystals Academic Press, Orlando,FL,1987. (c)
D.S. Bradshow, D.L. Andrews, J. Nonlinear Opt. Phys. Matter, 2009, 18, 285.
[29] H. Moustafa, M.E. Elshakre, S. Elramly, Electronic structure and nonlinear optical properties (NLO) of
2,4-di-aryl-1,5-benzothiazepine derivatives using DFT approach, 1136(2017), 25.
[30] A.I. Vogel, Quantitative Inorganic Analysis, Longman, London, S. E. 1st ed. Vol. 18. 1930.
[31] H. Shin, K.K. Kim, A. Benayad, S. Yoon, H.K. Park, I. Jung, M.H. Jin, H. Jeong, J.M. Kim, J. Choi, Y.H.
Lee, Efficient Reduction of Graphite Oxide by Sodium Borohydride and Its Effect on Electrical Conductance,
19(2009), 1987.
[32] M.S. Rizk, F.M. Abdel-Haleem, M. Saad, Development of new potentiometric sensors for the
determination of proguanil hydrochloride in serum and urine, 27(2016), 857.
[33]. G.W.T.M.J. Frisch, H.B. Schlegel, G.E. Scuseria, M.A. Robb, J.R. Cheeseman, G. Scalmani, V. Barone,
B. Mennucci, G.A. Petersson, H. Nakatsuji, M. Caricato, X. Li, H.P. Hratchian, A.F. Izmaylov, J. Bloino, G.
Zheng, J.L. Sonnenberg, M. Hada, M. Ehara, K. Toyota, R. Fukuda, J. Hasegawa, M. Ishida, T. Nakajima, Y.
27
Honda, O. Kitao,H. Nakai, T. Vreven, J.A. Montgomery Jr., J.E. Peralta, F. Ogliaro, M. Bearpark, J.J. Heyd, E.
Brothers, K.N. Kudin, V.N. Staroverov, R. Kobayashi, J. Normand, K. Raghavachari, A. Rendell, J.C. Burant,
S.S. Iyengar, J. Tomasi, M. Cossi, N. Rega, J.M. Millam, M. Klene, J.E. Knox, J.B. Cross, V. Bakken, C.
Adamo, J. Jaramillo, R. Gomperts, R.E. Stratmann, O. Yazyev, A.J. Austin, R. Cammi, C. Pomelli, J.W.
Ochterski, R.L. Martin, K. Morokuma, V.G. Zakrzewski, G.A. Voth, P. Salvador, J.J. Dannenberg, S. Dapprich,
A.D. Daniels, O. Farkas, J.B. Foresman, J.V. Ortiz, J. Cioslowski, and D. J. Fox, Gaussian Inc., Wallingford,
CT (2009).
[34] T. Schaefer, T.A. Wildman, S.R. Salman, J. Am. An electrically neutral .sigma.-sulfuranyl radical from the
homolysis of a perester with neighboring sulfenyl sulfur: 9-S-3 species, 102(1980), 107.
[35] T. Schaefer, S.R. Salman, T.A. Wildman, P.D. Clark, Can. JConformational consequences of
intramolecular hydrogen bonding by OH to the directional lone-pair of sulfur in derivatives of methyl phenyl
sulfide, diphenyl sulfide, and diphenyl disulfide, 60(1982), 342.
[36] A.D. Becke, J. Density‐functional thermochemistry. III. The role of exact exchange, 98(1993), 5648.
[37] S.E. Ulic, C.O.D. Védova, A. Hermann, H.G. Mack, H. Oberhammer, J. Phys. Length-Dependent Optical
Effects in Single Walled Carbon Nanotubes†, 112(2008), 6211.
[38] A.E. Reed, F. Weinhold, J. Natural bond orbital analysis of near‐Hartree–Fock water dimer, 78(1983),
4066.
[39] T. Verbiest, K. Clays, V. Rodriguez, Second-Order Nonlinear Optical CharacterizationsTechniques: an
Introduction, CRC Press, New York, 2009.
[40] R. Bersohn, Y.H. Pao, H.L. Frisch, J. Chem. Phys. 1966, 45, 3184-3198.
[41] P. Trinder, Rapid determination of salicylate in biological fluids, 57(1954)(2), 301.
[42] V. Georgakilas, M. Otyepka, A.B. Bourlinos, V. Chandra, N. Kim, K.Ch. Kemp, P. Hobza, R. Zboril, K.S.
Kim, Functionalization of Graphene: Covalent and Non-Covalent Approaches, Derivatives and Applications
, 112(2012), 6156.
28
[43] Y. Liu, X. Dong, P. Chen, Biological and chemical sensors based on graphene materials, 41(2012), 2283.
[44] E. Bakker, P. Bühlmann, E. Pretsch, Carrier-Based Ion-Selective Electrodes and Bulk Optodes. 1. General
Characteristics, 8(1997), 3083-3132
[45] N.T. Abdel Ghani, R.M. El Nashar, F.M. Abdel-Haleem, Computational Design, Synthesis and Application
of a New Selective Molecularly Imprinted Polymer for Electrochemical Detection, 28(2006)(7), 1530.
[46] A. A. Abdel Aziz, F. M. Elantabli, H. Moustafa, S. M. El-Medani, J. Molec. Structure 1141 (2017) 563-
576
[47] A.A. Abdel Aziz, F.M. Elantabli, H. Moustafa, S.M. El-Medani, Spectroscopic, DNA binding ability,
biological activity, DFT calculations and non linear optical properties (NLO) of novel Co(II), Cu(II), Zn(II),
Cd(II) and Hg(II) complexes with ONS Schiff base 1141(2017), 563.
[48] B. Champagne, A. Plaquet, J. Pozzo, V. Rodriguez, F. Castet, Nonlinear Optical Molecular Switches as Selective
Cation Sensors, J. Am. Chem. Soc. 2012, 134, 8101−8103.
[49] A. Plaquet, B. Champagne, F. Castet, Nonlinear Optical Molecular Switches for Alkali Ion Identification, Molecules
2014, 19, 10574-10586