Can Farmers Create Efficient Information Networks ... - GOV.UK
68
Centre for the Study of African Economies Department of Economics . University of Oxford . Manor Road Building . Oxford OX1 3UQ T: +44 (0)1865 271084 . F: +44 (0)1865 281447 . E: [email protected] . W: www.csae.ox.ac.uk Can Farmers Create Efficient Information Networks? Experimental Evidence from Rural India ∗ A. Stefano Caria † Marcel Fafchamps ‡ January 2015 ∗ We are first of all indebted to Gaurav Puntambekar for his outstanding management of the project. We would like to thank Johannes Abeler, Francesco Cecchi, Megenagna Gashaw Guade, Esteban Ortiz Ospina, Simon Quinn, Bassel Tarbush, Mateusz Ujma and seminar participants at the 2014 NEUDC Conference, the 2014 Pacific Development Conference, the 2014 conference of the Centre for the Study of African Economies, the 2014 CESifo conference on social economics, and at the CSAE workshop series for useful comments and suggestions. Our gratitude also goes to the the enumerators and supervisors whose contributions made this study possible. We finally would like to thank the study participants for their goodwill and patience. All mistakes remain naturally ours. This document is an output from research funding by the UK Department for International Development (DFID) as part of the iiG, a research programme to study how to improve institutions for pro-poor growth in Africa and South-Asia. The views expressed are not necessarily those of DFID. Stefano Caria further acknowledges financial support from the Economic and Social Research Council, UK. † Centre for the Study of African Economies, Department of Economics, University of Oxford. Email ste- [email protected]. Web: https://sites.google.com/site/stefanoacaria ‡ Stanford University 1 CSAE Working Paper WPS/2015-07
-
Upload
khangminh22 -
Category
Documents
-
view
2 -
download
0
Transcript of Can Farmers Create Efficient Information Networks ... - GOV.UK

Centre for the Study of African EconomiesDepartment of Economics . University of Oxford . Manor Road Building . Oxford OX1 3UQT: +44 (0)1865 271084 . F: +44 (0)1865 281447 . E: [email protected] . W: www.csae.ox.ac.uk
Can Farmers Create Efficient Information Networks?
Experimental Evidence from Rural India∗
A. Stefano Caria† Marcel Fafchamps‡
January 2015
∗We are first of all indebted to Gaurav Puntambekar for his outstanding management of the project. We
would like to thank Johannes Abeler, Francesco Cecchi, Megenagna Gashaw Guade, Esteban Ortiz Ospina,
Simon Quinn, Bassel Tarbush, Mateusz Ujma and seminar participants at the 2014 NEUDC Conference, the
2014 Pacific Development Conference, the 2014 conference of the Centre for the Study of African Economies,
the 2014 CESifo conference on social economics, and at the CSAE workshop series for useful comments and
suggestions. Our gratitude also goes to the the enumerators and supervisors whose contributions made this
study possible. We finally would like to thank the study participants for their goodwill and patience. All
mistakes remain naturally ours. This document is an output from research funding by the UK Department
for International Development (DFID) as part of the iiG, a research programme to study how to improve
institutions for pro-poor growth in Africa and South-Asia. The views expressed are not necessarily those of
DFID. Stefano Caria further acknowledges financial support from the Economic and Social Research Council,
UK.†Centre for the Study of African Economies, Department of Economics, University of Oxford. Email ste-
[email protected]. Web: https://sites.google.com/site/stefanoacaria‡Stanford University
1
CSAE Working Paper WPS/2015-07

Abstract
We run an artefactual field experiment in rural India which tests whether farmers
can create efficient networks in a repeated link formation game, and whether group
categorization results in homophily and loss of network efficiency. We find that the
efficiency of the networks formed in the experiment is significantly lower than the
efficiency which could be achieved under selfish, rational play. Many individual de-
cisions are consistent with selfish rationality and with a concern for overall welfare,
but the tendency to link with the ‘most popular’ farmer in the network causes large
efficiency losses. When information about group membership is disclosed, social net-
works become more homophilous, but not significantly less efficient. Networks play
an important role in the diffusion of innovations in developing countries. If they are
inefficiently structured, there is scope for development policies that support diffusion.
2
1 Introduction
It is well-known that knowledge about new technologies diffuses through social net-
works. Farmers, for example, share with each other information about the profitabil-
ity and optimal use of agricultural innovations [Foster and Rosenzweig, 1995, Mun-
shi, 2004, Bandiera and Rasul, 2006, Conley and Udry, 2010, Krishnan and Patnam,
2012]. Peer-learning has also been documented for new health technologies and finan-
cial products [Kremer and Miguel, 2007, Oster and Thornton, 2012, Banerjee et al.,
2013]. The pattern of this information diffusion is influenced by the structure of net-
works. For example, when some individuals have no connections, diffusion can be
partial. When information has to travel through long chains of links, diffusion can
be slow.1 Efficient information networks maximise the total value of the information
circulated, net of the cost of diffusion [Bala and Goyal, 2000].
Evidence on the efficiency of information networks is scarce. Little is known, for ex-
ample, about the efficiency of these networks among farmers. Two recent randomised
control trials show that monetary incentives for information agents in rural commu-
nities improve the diffusion of information in a cost-effective fashion [Ben Yishay and
Mobarak, 2012, Berg et al., 2013]. This indirectly suggests that un-incentivised diffu-
sion is suboptimal. Direct evidence is largely missing.
Observational assessment of network efficiency is complicated by several factors.
First, a census of all individuals and all links is required. Such data is usually hard to
obtain. Furthermore, the costs and benefits of each link have to be quantified. These
are often not observed by the field researcher. Finally, with observational data alone,
it is difficult to attribute inefficiency to the preferences and decision-making rules of
individuals, or to the constraints individuals face. In this study, we instead rely on
an artifactual laboratory experiment that allows us to quantify the efficiency of small
experimental networks, with a great deal of control over the constraints imposed on
decision makers [Harrison and List, 2004].
We study whether farmers form efficient networks in a sequential link-formation
game. Our motivating example is the diffusion of information. A link, in this example,
represents a social interaction where new information is observed. Each farmer can
form one link to another player, without requiring the partner’s consent. Observation
occurs only in one direction. Crucially, when farmer i observes the information of
1Network structure also has important consequences for learning when information is noisy and individ-
uals have to aggregate the signals generated by multiple experimenters [Bala and Goyal, 1998].
1
farmer j, he has also access to the information which farmer j has acquired by observing
other players. The benefits of a link are thus proportional to the number of players
that can be ‘reached’ directly or indirectly thanks to this link. This set-up is that of
unilateral, one-way flow link formation with no decay discussed in Bala and Goyal
[2000].
We manipulate the basic game along two dimensions. First, we vary the direc-
tion of information exchange. In the first treatment, a player selects the partner he
would like to observe. In the second treatment, a player chooses the partner by whom
he will be observed. In both treatments, the cycle network is efficient2, a Nash equi-
librium, and generates no inequality in payoffs across agents. Selfish agents playing
best response converge to the cycle network after repeated play of the first treatment.3
Efficiency-minded, other-regarding players converge to the cycle network in the sec-
ond treatment. By ruling out tradeoffs between efficiency and equilibrium, limiting
coordination requirements, and anonymising interaction we give the ‘best shot’ to the
possibility of efficient networks emerging in the game.
Second, we vary whether farmers have knowledge about the group affiliation of
the other players. At the beginning of the experiment we randomly assign farmers to
groups that have to compete in an unrelated task. In selected experimental sessions,
we publicly disclose information about players’ group identity.4 We test whether, as a
result, the number of in-group links increases and the efficiency of networks decreases.
Social differentiation may discourage links that are desirable from an efficiency point of
view. Observational research on networks often points to the importance of homophily-
the tendency of similar individuals to interact with each other with disproportionate
frequency [McPherson et al., 2001, Currarini et al., 2009, Golub and Jackson, 2012].
Homophily can be the result of a norm related to group membership [Akerlof and
Kranton, 2000]. In our game, restricting links to in-group partners would result in
2As in Bala and Goyal [2000], we define welfare as the sum of players’ payoffs. The efficient network
maximises this sum of payoffs. The cycle is the (unique) efficient network in our game. We define a relative
measure of efficiency by comparing the sum of expected payoffs determined by a particular network to the
sum of expected payoffs which obtains in the cycle network.3Farmers play sequentially. We describe this in detail in the next section and show simulation results
indicating that convergence to the cycle network is fast when players follow selfish best response. This is not
surprising. Bala and Goyal [2000] study a sequential game with features very similar to ours. Part (a) of
their theorem 3.1 applies to a class of payoff functions that includes the one of our game. For these payoff
functions, theorem 3.1 shows that the network converges to the cycle with probability one when players play
selfish best-response.4Personal identity, on the other hand, is never disclosed.
2

large efficiency losses.
When group identity is not disclosed, we predict that individuals will play simple,
intuitive link-formation rules leading to high levels of efficiency. In the first treatment,
the selfish best response is to choose the player who reaches, directly or indirectly, the
highest number of individuals in the network. In the second treatment, other-regarding
players who want to maximise the sum of payoffs in the group will target the player
who is reached by the highest number of individuals. Players who instead want to
maximise the payoff of the least well-off peer will choose the farmer who reaches the
smallest number of individuals. We derive these predictions from standard models of
strategic network formation augmented to include other-regarding preferences [Bala
and Goyal, 2000, Charness and Rabin, 2002].
When group identity is disclosed, we predict individuals will choose in-group links
more frequently, possibly at the cost of establishing less efficient networks. Previ-
ous research has highlighted how group categorisation generates in-group favoritism
[Tajfel, 1981, Brewer, 1999, Akerlof and Kranton, 2010], affects social, risk and time
preferences [Benjamin et al., 2010, Chen and Li, 2009, Kranton et al., 2012], influ-
ences behaviour in strategic environments [Yamagishi and Kiyonari, 2000, Charness
et al., 2007], and modifies performance [Hoff and Pandey, 2006]. Akerlof and Kran-
ton [2000] posit that agents receive utility from following prescriptions associated
with their social categories. Many farmers in our experiment report that restricting
links to the in-group is prescribed. Thus, when the preferred partner belongs to the
out-group, a farmer faces a tradeoff between efficiency and conformity with the social
prescription. We expect that at least some subjects will choose to conform.
In terms of methodology, we take steps against a number of common confounders
of experimental inference: low understanding, side payments, wealth effects and ex-
perimenter demand effects. We rely on induced, randomised group membership to
rule out unobserved covariates that may be correlated with natural groups. As the
saliency of induced group membership has been found to influence behaviour in eco-
nomic experiments [Charness et al., 2007, Eckel and Grossman, 2005], we increase
saliency by means of an independent task that sets the two groups in competition.
We run our experiment in the Indian state of Maharashtra. With the many so-
cial identities based on caste, religion and class, India offers an appropriate setting to
study homophily in social networks [Beteille and Srinivas, 1964, Guha, 2008, Dunning
and Nilekani, 2013]. Recent work on information agents in rural communities indeed
3

suggests that social distance affects the probability of information diffusion and experi-
mental work has shown that priming natural identities, chiefly caste, affects individual
performance and economic outcomes [Hoff and Pandey, 2006, Anderson, 2011, Berg
et al., 2013]. In India, interest in novel agricultural extension approaches that exploit
farmers’ dense social network activity is also high.
Our findings can be summarised as follows. First, network efficiency is significantly
lower than the level of efficiency which selfish or efficiency-minded players would have
achieved playing the rules we outline above. Expected payoffs are, on average, only 65
percent of those in the cycle network. Interestingly, farmers in the second treatment
achieve levels of network efficiency similar to those of farmers in the first treatment.
Second, the link-formation rules we derive have considerable predictive power. In
the second treatment, for example, 70 percent of decisions are consistent with either of
the two rules outlined above. Regression analysis confirms the statistical significance
of this result. We also identity two additional link-formation rules which have further
predictive power on link-formation decisions: choosing the ‘most popular’ player in the
network, and choosing a player by whom one was chosen in a previous turn. About 65
percent of the decisions that are not consistent with the predicted rules target the ‘most
popular’ player in the network. Simulation analysis suggests that the largest gains in
efficiency could be achieved by reducing the proportion of decisions that follow this
rule.
Third, when information about group membership is disclosed, the resulting net-
works have more in-group links, but are not significantly less efficient. These effects
can occur simultaneously if farmers (i) always follow their chosen link-formation rule,
but (ii) whenever this rule is satisfied by both in-group and out-group partners they
prefer to link with an in-group partner. Consistently with this mechanism we observe
that in the first treatment the frequency of in-group links that satisfy the selfish link-
formation rule grows by 13.8 percentage points. The overall frequency of in-group
links increases by 11.7 percentage points in this treatment.
Our work relates most directly to the literature on network formation. This has
developed theoretically through the seminal contributions of Jackson and Wolinsky
[1996] and Bala and Goyal [2000]. Experimental work on link formation has been
motivated by these models and has explored issues of inequity aversion [Goeree et al.,
2009, Van Dolder and Buskens, 2009, Falk and Kosfeld, 2012], coordination [Berning-
haus et al., 2006], and whether chosen links are myopic best responses or far-sighted
4
strategies [Callander and Plott, 2005, Conte et al., 2009, Kirchsteiger et al., 2011].
In a related experiment, Belot and Fafchamps [2012] compare unilateral partnership
formation decisions to dictator game allocations with equivalent payoff consequences.
All of these experiments use western subjects, typically university students.
A parallel literature has used observational dyadic data from rural areas of de-
veloping countries to explore how specific networks for the sharing of risk, favours,
information and labour are formed [Fafchamps and Gubert, 2007, Krishnan and Sci-
ubba, 2009, Karlan et al., 2009, Comola, 2010, Jackson et al., 2012, Santos and Bar-
rett, 2010, Comola and Fafchamps, 2013]. Empirical studies of naturally occurring
networks typically document some degree of homophily [McPherson et al., 2001]. A
recent theoretical literature distinguishes between homophily motivated by preferences,
opportunities or strategic behaviour [Currarini et al., 2009, Currarini and Menge, 2012,
Tarbush and Teytelboym, 2014].5
Falk and Kosfeld [2012] study a game of unilateral, one-way-flow link formation
that is based on Bala and Goyal [2000] and hence is closely related to ours. The
design we propose, however, differs on a number of dimensions: links are added to
the network one at a time; players are allowed only one link, so that the only cost
of a connection is the opportunity cost of not forming another connection; the game
is played by groups of 6. The first two features limit coordination and computation
problems and make the game simpler. Falk and Kosfeld [2012] find that efficient
networks are achieved in about half of the periods of the game. However, they do not
report an average efficiency statistics for the one-way-flow treatment, which makes it
difficult to compare their results to ours.6
A second literature that we connect to is that on the diffusion of innovations. Foster
and Rosenzweig [1995], Munshi [2004], Bandiera and Rasul [2006], Conley and Udry
[2010], Krishnan and Patnam [2012] show how technologies diffuse through farmers’
networks in India, Mozambique, Ghana and Ethiopia. Duflo et al. [2011], however,
cannot find evidence of learning among maize farmer in Kenya. More recently, Centola
[2010, 2011], Banerjee et al. [2012] and Banerjee et al. [2013] use experimental
5Individuals may have a desire to match with in-group partners, they may simply be exposed to more
potential matches with in-group peers, or they may link with in-group peers because it is in their material
interest to do so, for example, in order to avoid sanctions associated with deviations from social norms.6We can however note that in the last period of our game, the cycle network is achieved in less than 10
percent of the sessions, that is, much less frequently than in any of the one-way-flow treatments studied by
Falk and Kosfeld [2012].
5
techniques to investigate how the structure of the network and the position of the first
injection point affect diffusion.
Finally, our study is related to identity economics and a rich literature in economics
and social psychology, referenced above, that studies how group categorisation gen-
erates in-group bias and modifies behaviour. A recent experiment by Currarini and
Menge [2012] shows that group categorisation produces both in-group bias in allo-
cation and homophilous matching. Interestingly, a further treatment with exogenous
matching shows that in-group bias is lower when subjects can choose their interacting
partners.
Our contribution is threefold. First, we document low levels of network efficiency
in unilateral, one-way flow link formation. This is a stark result in a simple game
with limited coordination issues and clear theoretical predictions. The literature has
recently started exploring how subjects in rural areas of developing countries achieve
lower efficiency in trading experiments than Western players [List, 2004, Bulte et al.,
2012]. Our findings suggest that networks could be a second domain of widespread
inefficiency and cross-cultural difference. Second, we document heterogeneous link
formation strategies that are consistent with a number of models of other-regarding
preferences. This can inspire further theoretical study of network formation that ex-
plicitly includes other-regarding preferences. Third, our results document an effect of
arbitrary group categorisation on networks. This expands our understanding of the set-
tings in which group categorisation modifies behaviour. It also shows how, beyond the
material payoffs of the game, the formation of networks can be influenced by features
of the social world. This could be a particularly fertile area for future experimental
research on networks.
The paper is organised as follows. Section 2 presents the design. Section 3 develops
predictions and testable hypotheses. Section 4 describes the data. Section 5 reports
the results of the analysis. Section 6 concludes.
2 Design
The link formation game is played by groups of 6 farmers. One of the farmers is
randomly drawn at the end of the experiment to receive a monetary prize.7 In our
motivating example, the prize corresponds to a piece of valuable information. Farmers
7The prize is worth 100 Indian Rupees, or about 5.2 USD at PPP, given an exchange rate at the
time of 0.0155 USD per INR and a PPP conversion factors of 10/3 from the 2011 ICP round ( http:
6
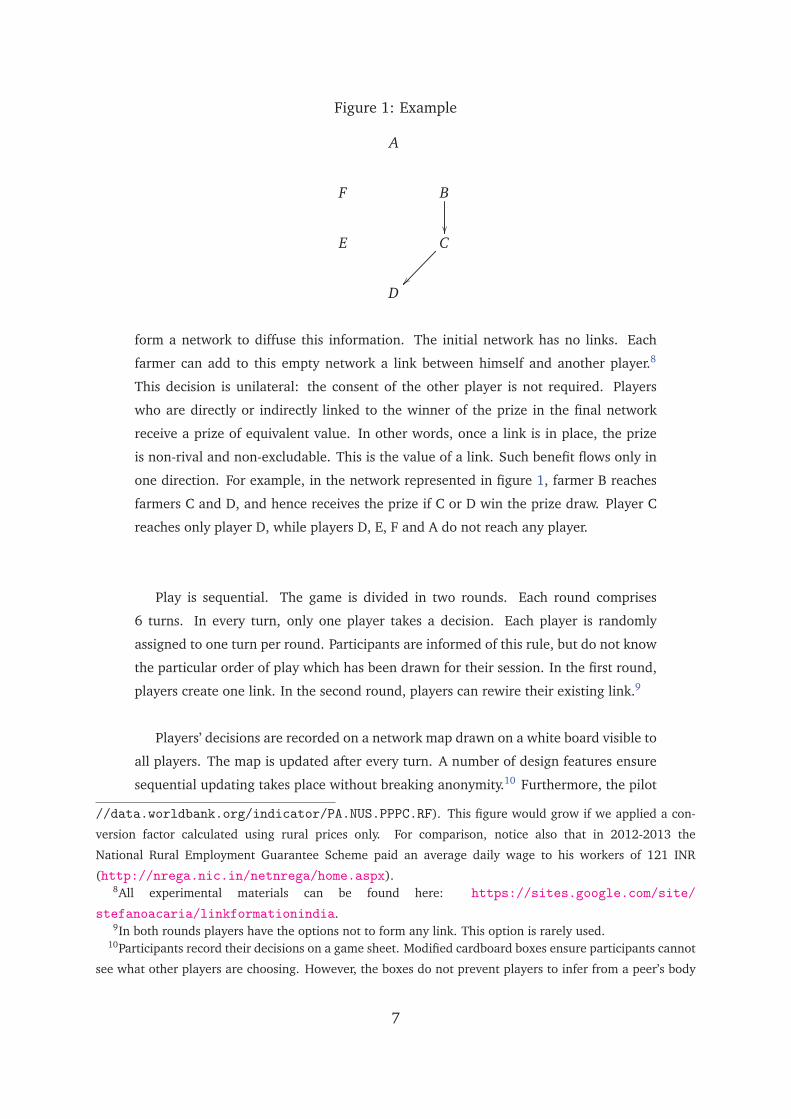
Figure 1: Example
A
F B
E C��
D��
form a network to diffuse this information. The initial network has no links. Each
farmer can add to this empty network a link between himself and another player.8
This decision is unilateral: the consent of the other player is not required. Players
who are directly or indirectly linked to the winner of the prize in the final network
receive a prize of equivalent value. In other words, once a link is in place, the prize
is non-rival and non-excludable. This is the value of a link. Such benefit flows only in
one direction. For example, in the network represented in figure 1, farmer B reaches
farmers C and D, and hence receives the prize if C or D win the prize draw. Player C
reaches only player D, while players D, E, F and A do not reach any player.
Play is sequential. The game is divided in two rounds. Each round comprises
6 turns. In every turn, only one player takes a decision. Each player is randomly
assigned to one turn per round. Participants are informed of this rule, but do not know
the particular order of play which has been drawn for their session. In the first round,
players create one link. In the second round, players can rewire their existing link.9
Players’ decisions are recorded on a network map drawn on a white board visible to
all players. The map is updated after every turn. A number of design features ensure
sequential updating takes place without breaking anonymity.10 Furthermore, the pilot
//data.worldbank.org/indicator/PA.NUS.PPPC.RF). This figure would grow if we applied a con-
version factor calculated using rural prices only. For comparison, notice also that in 2012-2013 the
National Rural Employment Guarantee Scheme paid an average daily wage to his workers of 121 INR
(http://nrega.nic.in/netnrega/home.aspx).8All experimental materials can be found here: https://sites.google.com/site/
stefanoacaria/linkformationindia.9In both rounds players have the options not to form any link. This option is rarely used.
10Participants record their decisions on a game sheet. Modified cardboard boxes ensure participants cannot
see what other players are choosing. However, the boxes do not prevent players to infer from a peer’s body
7

revealed that when the network map has more than a few links players find it difficult
to calculate the number of direct and indirect connections of each peer. We hence
remind the decision maker of the total number of (direct and indirect) connections
every other player has in the current network. The counting of connections is done by
means of a Java application running on a small laptop operated by the game assistant.
After entering a new link, the software produces a table with the number of (direct and
indirect) connections of each player in the current network. This number is written
next to the respective player ID on the white board, immediately after the network
map has been updated with a new link.
The experimental tasks are carried out in the following order:
1. Players randomly draw a card from an urn which assigns them a letter ID and an
experimental group.
2. Players answer three questions on agricultural knowledge, which are part of an
intergroup contest in agricultural knowledge. At the end of the experiment, if
all players in a group have answered all questions right, the group receives one
point and is applauded by everyone. Points are summed across sessions and
participants are informed of the overall ranking between the two groups.11
3. Players play a simple allocation task, where they have to divide a fixed sum of
money between an in-group and an out-group recipient randomly drawn from
the participants in the following session of the experiment.
4. Players play the link formation game. They are given the instructions of the
game, they answer a number of questions which test their understanding of these
instructions12, and they then play a trial of the game that lasts for seven turns. At
the end of the trial, the game assistant randomly draws a participant and shows
movements whether he is updating his game sheet or not. This threatens anonymity as it is possible to
determine which participant has the turn by simply checking who is updating his game sheet at a given point
in the game. We solve this problem in the following way. At the beginning of each turn, the game assistant
publicly calls the ID of the player who has the turn. After allowing some time to look at the updated network
map, the game assistant asks all players to make a circle on their game sheet. The player with the turn circles
the ID letter of the player to whom he would like to link, while the players without the turn draw a circle
in an empty box provided on the same page of the game sheet. As everybody writes something on their
game sheet at the same time farmers cannot infer the identity of the player with the turn by checking who is
updating his game sheet at a given point.11Notice information about the overall ranking is disclosed only at the end of the experiment, that is, after
step 5 in figure 2. So, whilst the contest creates the feeling of inter-group competition on a second, unrelated
domain, it does not affect the beliefs farmers may have about the levels of knowledge and cognitive ability
of other farmers in their group.12The game assistant checks the answers and is instructed to give further explanations of more than one
8

Figure 2: Order of activities in the experiment
1
ID and group assigned
Knowledge contest
2
3
Allocation task
Link formation game
4
5
Expectations elicited
who would receive the prize if this was the actual game. After the trial, the actual
link formation game is played.
5. Players are asked three questions about their expectations and beliefs and are
then administered a short questionnaire, which collects information on socio-
demographic variables and asks participants to explain the motivation behind
their decisions in the game. At the end of this fifth phase, participants are in-
formed of which team won the contest in agricultural knowledge and of the
number of points each team has collected across sessions.
We rely on a between-subject design. We vary the direction of the flow of benefits
associated with a link. In Treatment 1 (henceforth T1), players form links that let
them reach other individuals. This means that if player A chooses player B, then player
A will receive the monetary prize whenever B wins the prize, but not vice versa. In
Treatment 2 (henceforth T2), links let other players reach the player who proposes the
link. If A chooses a link with B, then B will receive the monetary prize whenever A
wins it, but not vice versa. Figure 3 illustrates. Following our theoretical predictions
in the next section, as the network is updated, players are reminded of the number of
individuals which each player reaches. In T2, players are also reminded of the number
of individuals who reach a particular player. For example, in panel (b) of figure 3,
player D reaches one player (player E). While two players (B and C) reach player D. In
T1, players are only reminded about the fact that D reaches one player. In T2, they are
reminded both about the fact that D reaches one player and the fact that two players
reach D.13
We also vary the information about peer group membership available to players
during the link formation game. This is cross-cut with T1 and T2. In a first set of
player makes more than one mistake. Hence these can be considered as a lower bound on the level of
understanding of players.13We give precise definitions of these concepts in the following section.
9

Figure 3: Links in the two treatments
A
F B��
E C��
D��
��
(a) T1
A
F B
��
E C��
D��
��
(b) T2
Table 1: Summary of treatments
No identity Identity
Links take prize T1no T1id
Links give prize T2no T2id
treatments, which we call T1no and T2no, individuals have no information about peers’
group affiliation. Hence their link formation decisions are by design unrelated to the
groups formed at the beginning of the experiment. In a second set of treatments,
called T1id and T2id, group identity is common knowledge, as players belonging to
different groups are identified with different symbols on the public network map on
the whiteboard.14 We hence run four treatments, as shown in table 1.
Instructions are framed in terms of a salient example from the local context. The
link formation game is presented as a game where one farmer will receive a valuable
piece of information about a new agricultural technology. The network determines
who receives help from the farmer with the valuable information. In T1 the choice of a
link is presented in terms of choosing who to approach for help to access the valuable
information. In T2 the choice is about which other player one wants to help in case one
accesses the valuable information. The groups are called the mango and the pineapple
group. In the explanation they are associated to the producer groups which farmers
typically form in the areas of our study.
In our design, group membership is randomly allocated. The original experiments
14Mango group players are identified with a circle. Pineapple group players are identified with a triangle.
10
in social psychology, on the other hand, rely on groups which are formed on the basis
of trivial preferences.15 While preference-based matching has the potential to increase
the saliency of group membership, it also has two disadvantages. First, players’ charac-
teristics may be correlated to what the researchers considers as orthogonal preferences.
Second, even if the chosen set of preferences is truly orthogonal, some players may be-
lieve that such correlation exists. For example, a player may (erroneously) think that
people with a certain preference in art or sport are smarter. In both cases, the effects of
common knowledge of social identity would be confounded by those associated with
correlated categories and beliefs.
We hence opt for a design which relies on random assignment to social groups
and increases the saliency of group identity by means of the contest in agricultural
knowledge. This task combines four desirable features: (i) it is linked to the overall
framing of the experiment, (ii) it creates a feeling of competition between the two
groups on a domain, that of agricultural knowledge, which is distinct to the domain
of monetary outcomes of the experiment, (iii) the relative position of the two groups
in this second domain is only revealed after the link formation game has been played,
(iv) every player can have a strong marginal impact on the group’s outcome: if a player
fails to answer one question correctly, the whole group fails to gain the point for that
session. The idea of using contests to increase the salience of group identity has been
successfully used before in experimental studies [Eckel and Grossman, 2005].
To ensure comparability and minimize noise during play, we follow a number of
established practices in the lab-in-the-field literature. These include extensive piloting,
simple standardized instructions that are read out to participants, double translation of
all written material, and reliance on physical randomization devices [Barr and Genicot,
2008, Viceisza, 2012].
2.1 Possible Confounders
We take a number of steps against common confounders of experimental analyses.
Low understanding. We test players’ understanding before the game starts. Sub-
jects in T1no and T1id are asked 8 understanding questions, while subjects in T2no
and T2id are asked 7 understanding questions. The questions test for understanding
of the network map and of the incentives that result from the rules of the game. After
15Notice however that in-group bias in allocation tasks is found also when group membership is determined
by the flip of a coin [Tajfel, 1981]
11
the questions are asked, enumerators briefly check the answers and give further expla-
nations on the points where players made mistakes. Hence these answers give a lower
bound to the level of understanding of players in the game.
Figure 19 in the appendix presents the cumulative distribution of mistakes. In both
T1 and T2 more than 50 percent of players made at most 1mistake, and about 80
percent of players made at most 2 mistakes.
To further increase understanding, we also run a trial round of the link formation
game before the main game is played.
Side-payments. Personal identity is not disclosed in the game and payments are
disbursed privately. This decreases the possibility of side-payments. In particular, it
decreases the possibility that network formation decisions will be targeted towards
individuals from whom side payments can be more easily extracted.
Wealth effects. Both the allocation task and the link-formation game are incen-
tivised with monetary payments. In the allocation task individuals choose how to split
a sum of money between two farmers in a future session of the experiment. The allo-
cation decision does not affect the wealth of the decision maker. It also does not affect
the wealth of the other farmers in his session. This rules out unintended influences
across the two tasks created by endogenous shocks to players’ wealth.
Experimenter demand effects. These arise when subjects, in an attempt to please
the experimenter, respond to implicit cues embedded in the experimental design [Zizzo,
2010]. For example, the fact that we disclose information about group identities may
suggest to players that we expect them to use this information somehow. To minimize
such concerns, we rely on a between-subjects design. These designs are thought to be
less vulnerable to the demand effects critique [Zizzo, 2010]. Furthermore, we refrain
to give knowledge about players’ experimental group identities in the instruction phase
and in the trial round, to avoid making unintended suggestions about how we expect
players to use the group membership information.
The visual reminder of the number of connections of each player can be a second
source of experimenter demand effects. It could be argued that this feature biases the
results in the direction of efficiency, as it increases the saliency of network statistics
related to efficiency enhancing strategies. Our aim in including this feature was to
exclude the possibility that lack of familiarity with the graphical representation of the
12

network would be driving departures from efficiency. Hence this design features is
meant to “give the best shot" to the possibility of efficient networks. In the light of
this design feature, our finding that network efficiency is significantly below potential
becomes, if anything, more compelling.
3 Predictions
Our objective is to study the efficiency of the experimental networks formed by farmers.
We hypothesise that farmers will choose their links on the basis of the structure of the
network in predictable ways. In particular, we expect that farmers in T1 will play selfish
best response, while farmers in T2 will either try to maximise the sum of the payoff
of all players in the session, or the payoff of the least well-off player. We first present
the ‘link-formation rules’ that follow from these preferences. Then, we simulate link-
formation games where individuals follow the proposed rules and study the efficiency
of the resulting networks. We show that when all farmers play selfish best response in
T1, or when they maximise the sum of all payoffs in T2, the structure of the network
converges to the cycle with high frequency within two rounds of the game.
3.1 Link-formation rules
Throughout the analysis we repeatedly use two concepts: network reach and in-reach.
We define the reach of farmer j as the number of players whom farmer j observes
directly or indirectly. The in-reach of farmer j is the number of players who directly or
indirectly observe farmer j. The expected payoff of farmer j is a linear function of his
reach in the final network. If we normalise the value of the prize to 1, the expected
payoff of farmer j is simply given by:
π j =reachj + 1
6(1)
Farmer j’s in-reach, on the other hand, determines the number of players who in-
directly observe the information that is observed by farmer j. It is a measure of how
far the information available to farmer j travels in the network. We present formal
notation and definitions of these concepts in the appendix.
Following much of the existing literature, we assume myopic behaviour: a farmer
considers the network which obtains after his link is added as the final network of the
game. This rules out dynamic strategies based on threats, rewards, or signals. Recent
13
research shows that the strategies played in experimental network formation games
are often consistent with myopic best response [Conte et al., 2009].
In T1, a new link by player i affects his reach in the network, and hence his expected
payoff. Only one link is permitted. Before this link is formed, player i has a reach of
0. A new link to player j allows player i to reach all the farmer whom player j reaches.
Picking the partner with the highest reach maximises the reach of player i and, hence,
his expected payoff.16 The link-formation rule of a selfish player in T1 will hence be:
Rule 1. Form a link with the player with the maximum reach.
For this first rule and for all the rules that follow, we assume that in case of a
tie between two or more potential partners, farmer i randomly chooses one of these.
Furthermore, when we study whether player i’s decisions conform to any of the link-
formation rules, we exclude links to player i from the computation of the reach and
in-reach of his potential partners. This is because, from player i’s perspective, these
links are redundant: they do not allow him to observe more information in T1, or to
spread his own information further in T2.
In T2, new links to do not affect the reach of the player that forms them. A purely
selfish player would be indifferent between forming and not forming a link in this
treatment. If he forms a link, he would be indifferent about its consequences on the
welfare of other players. However, a large body of evidence in experimental economics
shows that individuals care about the payoffs of the other players in systematic, het-
erogenous ways [Charness and Rabin, 2002, Andreoni and Miller, 2002].17 Following
the literature on other-regarding preferences, we assume that players have a utility
function that weights concerns for the player’s own payoff and the payoff of all other
players:
ui = πi + γ f (π−i) (2)
16In the appendix we show this formally.17Notice that player i’s strategy in T1 also has an impact on the payoffs of the individuals who have a path
towards i in g. In future work, we will extend this section to include an the analysis of how other-regarding
preferences affect behaviour in T1.
14

where we assume that there are n individuals in the set of all players N, and π−i =
{πi ,π2, ..,πi−1,πi+1, ...,πn}. To advance further we have to make some assumptions
about the shape of function f. We can explore two archetypal candidates. The first is:
ui = πi + γ∑
j∈N\iπ j (3)
Utility function 3 expresses a concern for aggregate welfare. Charness and Rabin
[2002] argue this is the model of social preferences with the highest predictive power
for dictator game allocations. When a farmer forms a new link with player j in T2, he
increases the reach of player j and of all the players who observe player j. Intuitively,
the effect on aggregate welfare of a new link is proportional to the number of individ-
uals who observe player j. This is player j’s in-reach. In T2, the link that maximises
the sum of individual payoffs should thus be a link with the player with the maximum
in-reach.18 We predict that a fraction of players in T2 have other-regarding preferences
expressed by 3 and will thus play according to the following link-formation rule:
Rule 2. Form a link with the player with the maximum in-reach.
A second possibility is that players care about the welfare of the player who is least
well-off in the network. The literature in empirical social choice has documented this
type of concern [Yaari and Bar-Hillel, 1984], which we can express using the following
max-min utility function:
ui = πi + γ minj∈N\iπ j (4)
Utility function 4 is akin to the Rawlsian social welfare function which is a staple of
social choice theory. The function is maximised by choosing the player with the lowest
reach, which is the e player with the lowest expected payoff. We predict that a fraction
of players in T2 have other-regarding preferences expressed by 4 and will thus play
according to the following link formation rule:
Rule 3. Form a link with the player with the minimum reach.
18In the appendix we show this formally and explain one qualification that applies to links that create a
small cycle.
15
Notice that, depending on the structure of the network, the sets of players who
satisfy rules 2 and 3 can be disjoint or overlapping. Figure 15 in the appendix shows
an example where the two sets are disjoint: F has the minimum reach while A,B,C, and
D all have the maximum in-reach.
A third model of social preferences is that of inequality aversion [Fehr and Schmidt,
1999]. Under inequity aversion, a player feels guilt towards players with a lower
expected payoff and envy towards players with a higher expected payoff. An inequity
averse player in the first turn of a T2 session prefers not to form any link, as this would
cause him to feel envy towards the player who benefits from the link. This prediction
is virtually always falsified in our pilot and main data. We thus do not explore the
predictions of the model of inequity aversion any further.
On the basis of the discussion above, we make the following prediction regarding
individual decisions.
Prediction 1. In T1 players will form links to partners with the maximum reach. In T2
players will form links either with partners with the maximum in-reach or with partners
with the minimum reach.
For ease of exposition we will sometimes refer to rule 1 and rule 2 as the ‘efficiency-
minded rules’, as both of these rules follow from a desire to maximise payoff (either
one’s own, or that of the rest of the group). We will also refer to rule 3 as the ‘Rawlsian
rule’, as it reflects the max-min logic of the Rawlsian social welfare function.
3.2 Network efficiency
We measure welfare as the sum of individual expected payoffs. The cycle network,
where each player wins the prize for sure, maximises this sum and is the unique effi-
cient network structure in our game. To compare the cycle network to other networks,
we define a continuous measure of efficiency by taking the ratio between the average
reach of players in a network and average reach of players in the cycle.
Efficiencyg =1n
∑ni=1 reachi
5(5)
16

The cycle network has efficiency 1 under this measure. All other possible networks
have a level of efficiency that falls in the interval [0,1). Our definition of efficiency
rises monotonically with the sum of the expected payoffs in a network.
We simulate link-formation games where players follow the link-formation rules
outlined above and we study the overall efficiency of the resulting networks. Our first
set of simulations shows that when all players follow rule 1 in T1 average efficiency
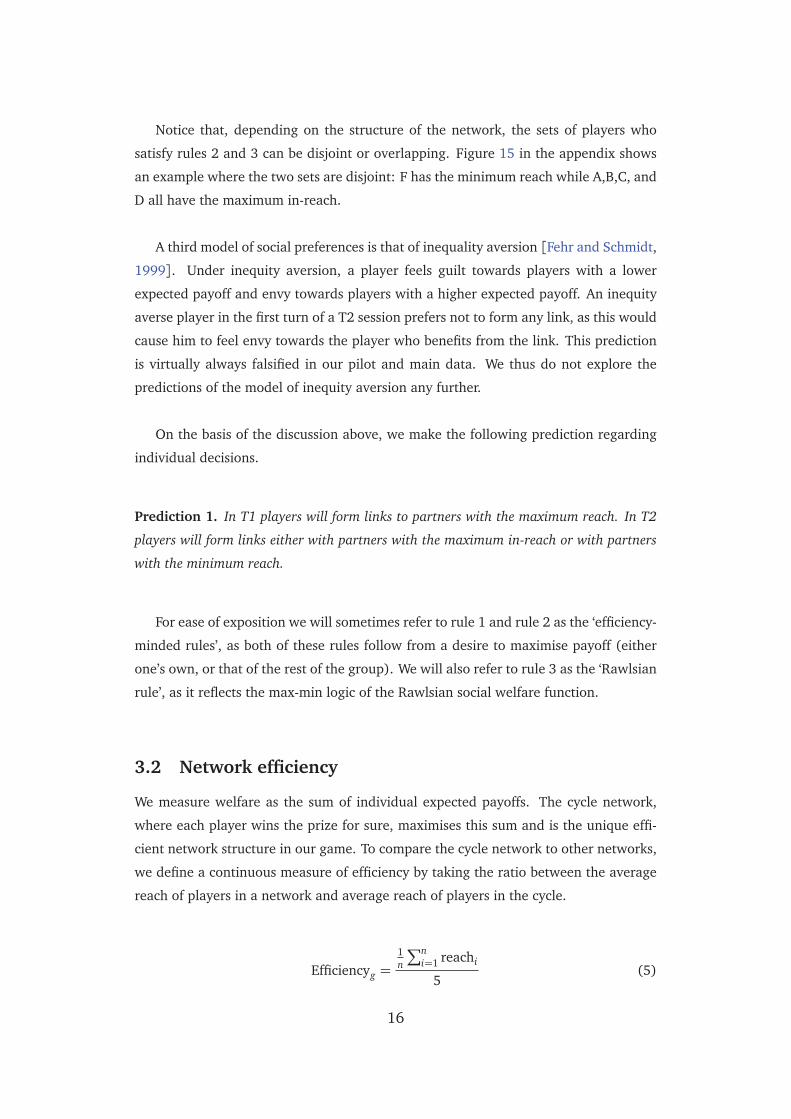
is about 96 percent. Figure 4 gives an example of how play in accordance with rule 1
achieves the cycle network within 2 rounds. Once the cycle network is reached, under
rule 1 no player wants to rewire his link.
In a very small number of cases the process does not converge to the cycle. This is
because players randomise between candidates of equal value, without consideration
to the future order of play. This sometimes results in a situation where the player who
can form the cycle network by re-wiring his link has already played his second turn.
If we allow more rounds, the likelihood of this occurring in every round becomes very
small. For example, in three rounds rule 1 achieves 99 percent efficiency.
Our second set of simulations shows that when all players play according to rule
2 in T2 average efficiency is also about 96 percent.19 When all players in T2 play ac-
cording to rule 3, on the other hand, network efficiency is 67 percent. Figure 5 reports
kernel density estimates and average efficiency for simulated sessions where play is in
accordance, respectively, with rule 2, rule 3, and with a random link formation process.
The random link formation process achieves average efficiency of about 52 percent.
We also study efficiency in sessions where a mix of rules is played. We simulate
sessions where a fraction p of decisions follow rule 3, and a fraction 1-p of decisions
follow rule 2. Results show that efficiency decreases monotonically with p in the in-
terval between 96 and 67 percent. Figure 16 shows this graphically. We can thus
formulate the following prediction on session level efficiency.
Prediction 2. Network efficiency in T1no is close to 96 percent. In T2no, it is between 96
and 67 percent.
19 This is not surprising, as rule 2 generates link formation processes that are symmetrical with the respect
to rule 1 in T1.
17
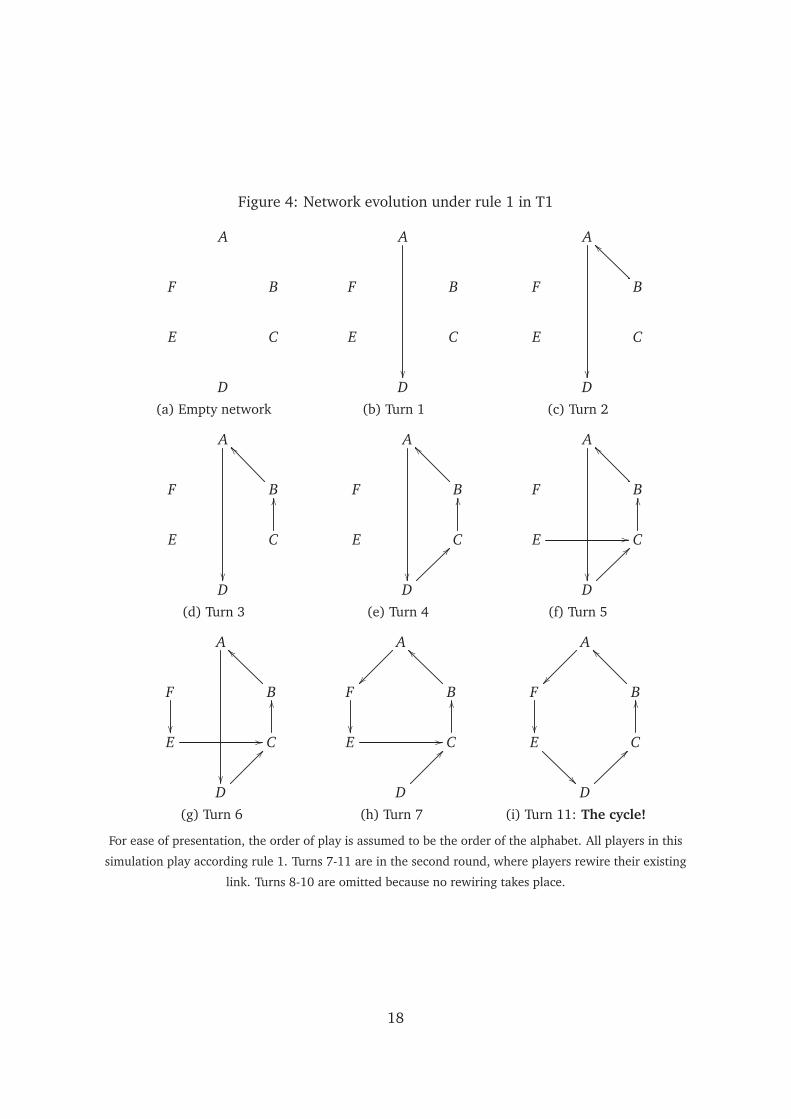
Figure 4: Network evolution under rule 1 in T1
A
F B
E C
D(a) Empty network
A
��
F B
E C
D(b) Turn 1
A
��
F B
��
E C
D(c) Turn 2
A
��
F B
��
E C
��
D(d) Turn 3
A
��
F B
��
E C
��
D
��
(e) Turn 4
A
��
F B
��
E �� C
��
D
��
(f) Turn 5
A
��
F
��
B
��
E �� C
��
D
��
(g) Turn 6
A
��F
��
B
��
E �� C
��
D
��
(h) Turn 7
A
��F
��
B
��
E
��
C
��
D
��
(i) Turn 11: The cycle!
For ease of presentation, the order of play is assumed to be the order of the alphabet. All players in this
simulation play according rule 1. Turns 7-11 are in the second round, where players rewire their existing
link. Turns 8-10 are omitted because no rewiring takes place.
18
Figure 5: Average efficiency under different link-formation rules in T2
(a) Random (b) Rule 2: Maximum in-reach
(c) Rule 3: Minimum reach
Each panel reports kernel density estimates of the distribution of the average value of reach after 12 turns of
play for 500 simulated sessions. The vertical line indicates average efficiency achieved by a given rule. The
rule used in each set of simulations is indicated below the panel.
19
Figure 17 in the appendix shows the evolution of efficiency under the different link
formation rules. In the second round, efficiency has no trend when all players play
random or rule 3. However, when players play rule 2, average efficiency monotonically
increases every turn.
3.3 The effect of group identity
In order to make predictions about behaviour when group identity is disclosed, we
follow the seminal paper of Akerlof and Kranton [2000] and introduce a positive effect
on utility which comes from following a social prescription:
ui = πi + γ f (π−i) + Pi (6)
Pi is equal to a positive constant c if player i follows the social prescription. In
our game, for example, farmers may get positive utility whenever they use their link
to connect with an in-group partner. This may describe the satisfaction arising from
following a norm which states that links should be restricted to in-group partners.
Whenever an in-group link generates an additional positive effect on utility of c we say
that the individual is subject to a norm of homophily. Self-reports from our players
are consistent with the existence of such norm. In a questionnaire administered after
the game, 51 percent of players agree with the statement: ‘In a game like this, one
should only link to a player of his own group’. Furthermore, about 70 percent of
players expect at least 3 of the other 5 individuals in the session to agree with the
statement.
What will be the effect of disclosing group identity in our game? Suppose farmer
i follows rule 2 in T2. For any positive value of c, whenever there are both in-group
and out-group players who have maximum in-reach, farmer i will form a link with one
of the in-group players. Before disclosure of group identity, he would have randomly
chosen among the players with maximum in-reach. After disclosure, he can target his
link to an in-group partner. The frequency of in-group links increases.
Now consider the case where there are no in-group players with maximum in-reach.
If c is small, the positive utility from following the social norm will not compensate the
loss in utility from failing to maximise the social objective. In this case, farmer i will
act in the same way as he would have when group identity was not disclosed: he will
form a link with an out-group player.
20

If c is high, on the other hand, the in-group player with highest reach within the set
of in-group players may be preferred to the player with the highest in-reach overall. In
this case, after disclosure of group identity, farmer i will sometimes choose links that
have a weaker effect on aggregate welfare. The efficiency of the network decreases.
The higher c, the larger the difference in in-reach a farmer is prepared to tolerate
in order to conform to the social norm. In a set of simulations reported in figure 18 in
the appendix, we show that when individuals play rule 2 and tolerate a difference in
in-reach of 2 units, average network efficiency is 53 percent. When players play rule 3
and tolerate a difference in reach of 2 units, average efficiency is about 40 percent.20
These considerations motivate a final prediction:
Prediction 3. Disclosure of group identity generates networks characterised by (i) more
in-group links and, depending on the magnitude of c, (ii) lower efficiency.
3.4 Analysis
We analyse treatment effects using non-parametric two-sided Wilcoxon rank sum tests
over session-level outcomes. We focus in particular on efficiency and the number of
ingroup links in the final network. The Wilcoxon rank sum test is a test of the null that
the outcomes of the two treatments are drawn from same distribution. The alternative
hypothesis is that either outcome is stochastically greater21 than the other.
Further, we study individual decisions with dyadic regression analysis. In particular,
we use models of the following form:
linki j,r = α+Network Position j,rβ +Di jγ+δroundr + ei j,r (7)
20As a limit case, suppose farmers in T1 would never link to an out-group peer. If the play rule 1 among
in-group partners, the network will converge to two small cycles with 3 players each. The average reach for
this network structure is 2, corresponding to 40 percent efficiency.21For two populations A and B, A is stochastically greater than B if Pr(a > b) > 1
2, where a and b are
observations from population A and B, respectively. The two-sided Wilcoxon rank sum test sets the null of
Pr(a > b) = 12
against the alternative hypothesis that Pr(a > b) �= 12. The two-sided test is more conservative
than the one-sided test.
21

The unit of observation is all i-j dyads in each session s. We observe each dyad
once for each of the two rounds r. linki j,r is a dummy which takes value 1 if player i
has chosen to establish a link with player j in round r. The matrix ‘Network Position’
contains variables which describe the network position of player j before player i’s
decision in round r. For each treatment, these include the variables specified in the
link formation rules we propose above. For T2, these include a dummy for having
the minimum reach, and a dummy for having the maximum in-reach. For T1, they
include a dummy for having the maximum reach. As a check, in T1, we also include
a dummy for having the minimum value of in-reach. For robustness, we will also run
specifications where we include the actual values of reach and in-reach.
To control for correlations between our variable of interests and the fixed positions
of the players in the network map, we introduce a dummy variable for each possible
pairing of map positions.22 The matrix Di j contains these variables. Furthermore, we
control for round specific effects.
Model (7) will be estimated using OLS, correcting standard errors for arbitrary cor-
relation at the session level. We can plausibly assume that there is no correlation be-
tween errors terms involving individuals in different sessions of the experiment. How-
ever, as explained, individuals are only allowed one link. This generates a correlation
between error terms involving similar individuals within a session. For example, since
a link to j precludes a link to k, E[ei j,r eik,r] �= 0. This inference problem is typical in
dyadic regression analysis [Fafchamps and Gubert, 2007]. We correct for intra-session
correlation in error terms using cluster-robust standard errors for inference.
Previous studies have shown that when the number of independent groups of ob-
servations is low, the cluster correction delivers downwardly biased standard errors
[Cameron et al., 2008]. Thus, when we run regressions with less than 40 clusters, we
apply the wild bootstrap correction to p-values proposed by Cameron et al. [2008].
22For example, see figure 4. From the perspective of player A, while B’s position in the network is evolving,
B remains A’s closest neighbour in the visual representation of the set of players. This may make player
A more likely to choose B than more distant players when A makes mistakes. To reach the cycle network,
Player A may also choose an immediate neighbour as part of a coordination strategy which relies on physical
proximity. A similar possibility is explored in Callander and Plott [2005]. Alternatively, some positions in
the map, for example A’s position, may be visually more salient. If the position in the map is correlated with
the network position of the player, regression analysis would suffer from omitted variable bias. We hence
include position dummies for all possible directed dyads (AB, AC, .. , BA, BC, ..) to ensure that the effect of
network position which we study in regression 7 is not confounded by correlations with the initial position
in the network map.
22
4 Data
We run our field experiment in the Indian state of Maharashtra. We randomly sample
from a census list of all villages in 4 ‘talukas’ (sub-districts) of the Pune and Satara
districts.23 Villages in these subdstricts are situated approximately 1,30 to 3h hours
away from Pune. This is a similar distance to the district capital as that of the villages
selected in the study of Banerjee et al. [2013]. To reflect the large heterogoeneity in
geographic conditions in this area of India, we choose two subdistricts which mostly
comprise mountainous areas, and two subdistricts in the agricultural plains.
We select study participants through door-to-door random sampling. Before reach-
ing the village, our team is shown a Google Earth map of the village. On alternating
days, the teams start sampling from the periphery of the village or from the center of
the village.24 We invite all male adult farmers who are encountered in the door-to-door
visit until we have enough farmers to fill in all planned sessions.
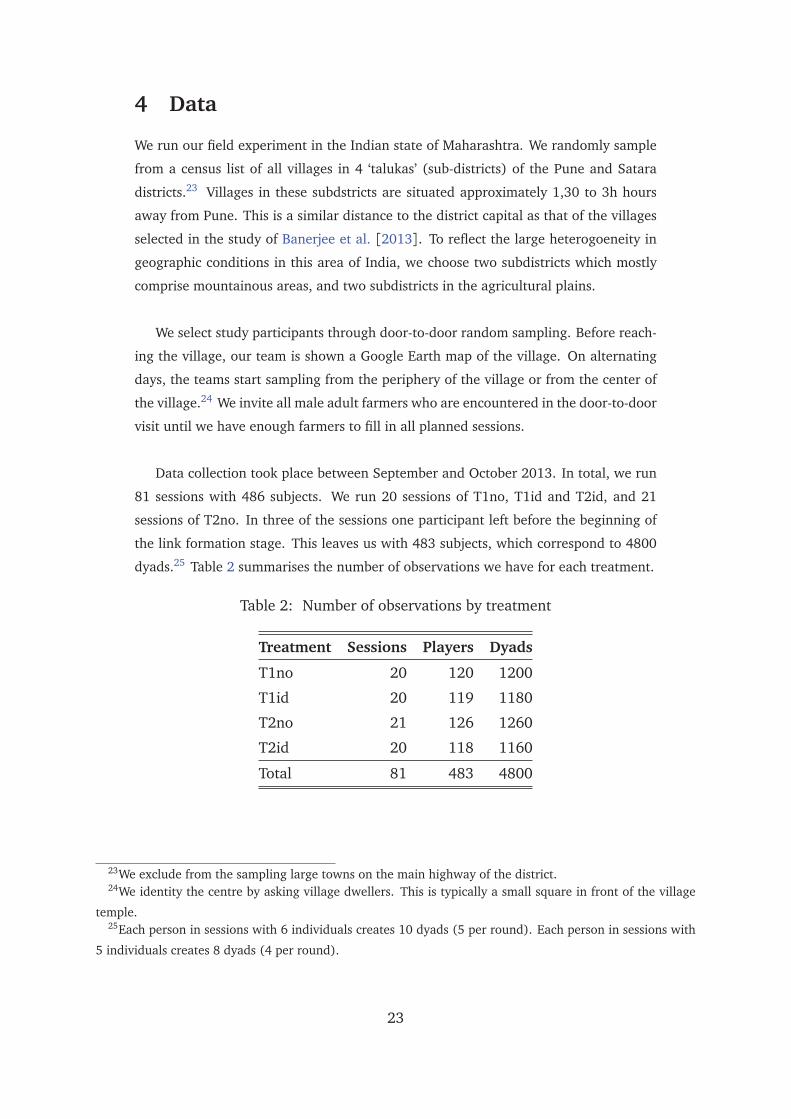
Data collection took place between September and October 2013. In total, we run
81 sessions with 486 subjects. We run 20 sessions of T1no, T1id and T2id, and 21
sessions of T2no. In three of the sessions one participant left before the beginning of
the link formation stage. This leaves us with 483 subjects, which correspond to 4800
dyads.25 Table 2 summarises the number of observations we have for each treatment.
Table 2: Number of observations by treatment
Treatment Sessions Players Dyads
T1no 20 120 1200
T1id 20 119 1180
T2no 21 126 1260
T2id 20 118 1160
Total 81 483 4800
23We exclude from the sampling large towns on the main highway of the district.24We identity the centre by asking village dwellers. This is typically a small square in front of the village
temple.25Each person in sessions with 6 individuals creates 10 dyads (5 per round). Each person in sessions with
5 individuals creates 8 dyads (4 per round).
23
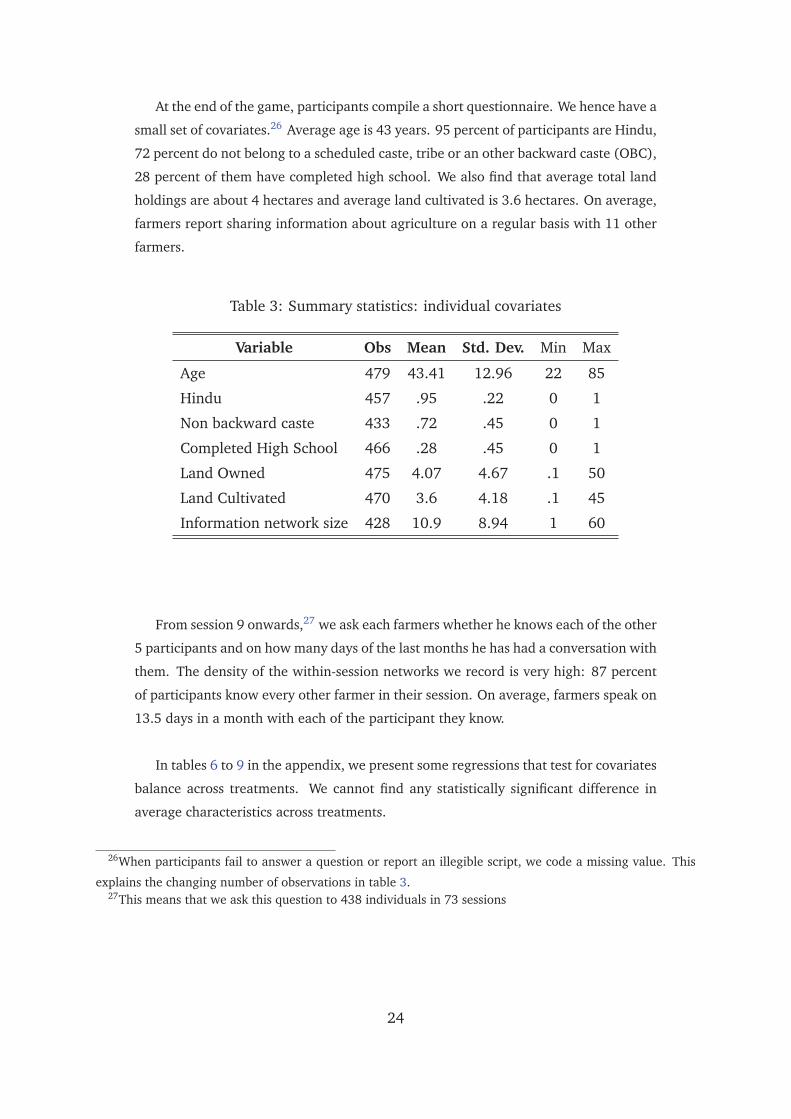
At the end of the game, participants compile a short questionnaire. We hence have a
small set of covariates.26 Average age is 43 years. 95 percent of participants are Hindu,
72 percent do not belong to a scheduled caste, tribe or an other backward caste (OBC),
28 percent of them have completed high school. We also find that average total land
holdings are about 4 hectares and average land cultivated is 3.6 hectares. On average,
farmers report sharing information about agriculture on a regular basis with 11 other
farmers.
Table 3: Summary statistics: individual covariates
Variable Obs Mean Std. Dev. Min Max
Age 479 43.41 12.96 22 85
Hindu 457 .95 .22 0 1
Non backward caste 433 .72 .45 0 1
Completed High School 466 .28 .45 0 1
Land Owned 475 4.07 4.67 .1 50
Land Cultivated 470 3.6 4.18 .1 45
Information network size 428 10.9 8.94 1 60
From session 9 onwards,27 we ask each farmers whether he knows each of the other
5 participants and on how many days of the last months he has had a conversation with
them. The density of the within-session networks we record is very high: 87 percent
of participants know every other farmer in their session. On average, farmers speak on
13.5 days in a month with each of the participant they know.
In tables 6 to 9 in the appendix, we present some regressions that test for covariates
balance across treatments. We cannot find any statistically significant difference in
average characteristics across treatments.
26When participants fail to answer a question or report an illegible script, we code a missing value. This
explains the changing number of observations in table 3.27This means that we ask this question to 438 individuals in 73 sessions
24

Table 4: Summary statistics: session networks
Variable Obs Mean Std. Dev. Min Max
Out-degree 438 4.78 .76 0 5
Average days spoken with known peers 430 13.44 9.56 0 30Degree refers to the reported number of other participants that a player knows. For each known farmer j, we ask farmer i on how many
days of the last month he has spoken to farmer j. We compute the average of this variable across all farmers j for each farmer i. In the
second row of the table, we average this variable over all farmers i. 8 farmers do not know anybody in the network, so we do not
compute this variable for them.
5 Results
We organise our discussion around four key results.
We first investigate overall efficiency. Table 10 summarises treatment-level aver-
ages of player reach and the related measure of efficiency for the final network of the
game. We pool all sessions with no knowledge of group identity together and compare
the distribution of average session efficiency to two simulated benchmarks: the distri-
bution of average session efficiency which would obtain if individuals chose their links
at random, and the distribution under ‘efficiency-minded’ link formation (rule 1 in T1,
rule 2 in T2). We obtain the following result, which is represented graphically in figure
6 below:
Result 1. Network efficiency in T1no and T2no is 65 percent. This is 31 percentage points
below average efficiency under ‘efficiency-minded’ link-formation (rule 1 in T1, rule 2 in
T2), and 13 points above average efficiency under random network formation. Both
differences are statistically significant.
The efficiency of the experimental networks is 31 percentage points below the
average level achieved by the ‘efficiency-minded’ link-formation rules. A Wilcoxon
rank-sum the tests confirms that the difference between the distribution of network
efficiency in our data and the simulated distribution is statistically significant at the
1 percent level (Z = 12.08, p <.001). On the other hand, the efficiency of the ex-
perimental networks is higher by a significant 13 percentage points than the average
efficiency which random play would have achieved (Z = 4.62, p <.001).
The direction of the flow of benefits associated with the links does not affect av-
erage efficiency. Hence the result above is not driven a by lower efficiency in the T2
25

Figure 6: Efficiency in no-identity sessions and in random networks
(a) Histogram (b) Kernel density estimate and means
treatment. Average efficiency across the T1no and T2no treatments is in fact very sim-
ilar. A Wilcoxon rank sum test cannot reject the null that the outcomes of the two
treatments are drawn from the same distribution (Z = -.11, p = .91). Figure 7 below
presents this result graphically. We predicted that efficiency in T2 would vary in the
range between 57 and 96 percent, and that efficiency in T1 would be 96 percent. The
prediction for T1 is clearly rejected.
Result 2. Efficiency in T2no sessions is not significantly different from efficiency in T1no
sessions.
It is important to note that low efficiency is not an artefact of truncation at 12 turns:
efficiency has no monotonic updward trend in either T1no or T2no, and efficiency at
turn 12 is only a few percentage points higher than it was at turn 6. Figure 8 illustrates.
Falk and Kosfeld [2012], on the other hand, document strong learning dynamics and
positive efficiency trends in their experiment.
26
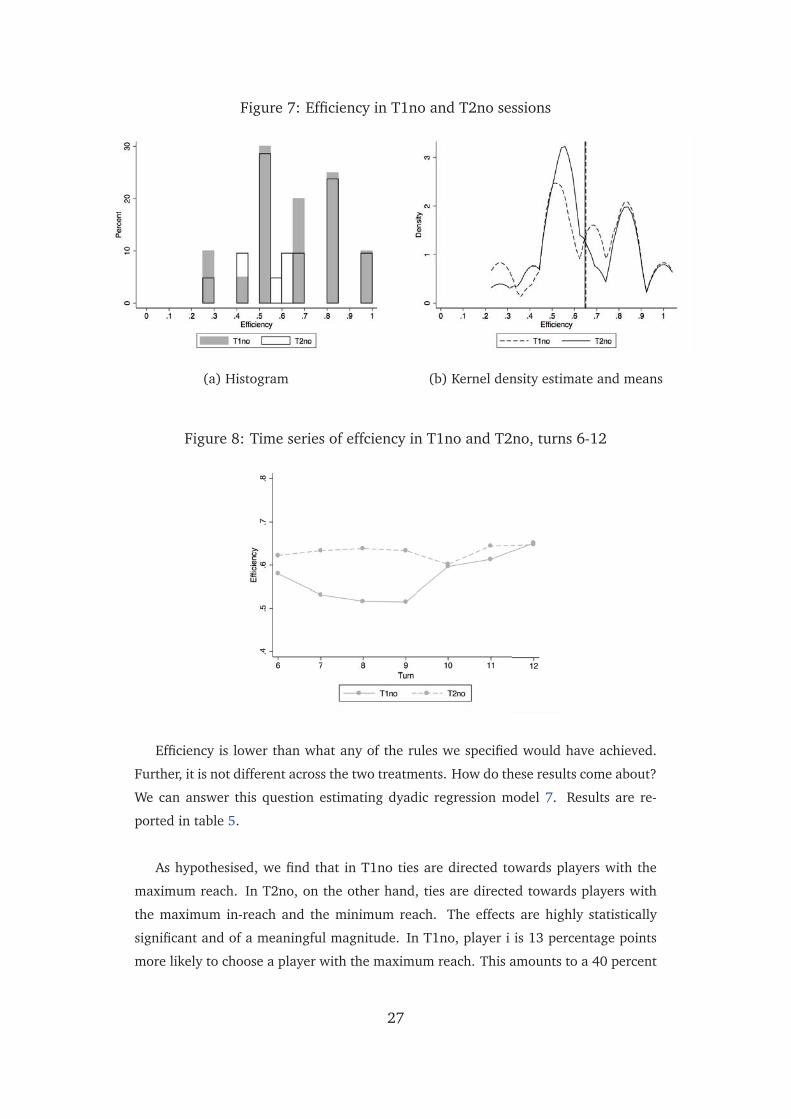
Figure 7: Efficiency in T1no and T2no sessions
(a) Histogram (b) Kernel density estimate and means
Figure 8: Time series of effciency in T1no and T2no, turns 6-12
Efficiency is lower than what any of the rules we specified would have achieved.
Further, it is not different across the two treatments. How do these results come about?
We can answer this question estimating dyadic regression model 7. Results are re-
ported in table 5.
As hypothesised, we find that in T1no ties are directed towards players with the
maximum reach. In T2no, on the other hand, ties are directed towards players with
the maximum in-reach and the minimum reach. The effects are highly statistically
significant and of a meaningful magnitude. In T1no, player i is 13 percentage points
more likely to choose a player with the maximum reach. This amounts to a 40 percent
27

increase over the probability of choosing a player who does not have the maximum
reach. In T2no, player i is 11 percentage points more likely to choose a player with
maximum in-reach and 7 percentage points more likely to pick a player with minimum
reach. A Wald test cannot reject the equality of these two coefficients.
Table 5: Dyadic linear probability model (7)
(1) (2) (3) (4)
Panel a
max reach j .132 .130(.001)∗∗∗ (.001)∗∗∗
min in-reach j .018 .016(.461) (.627)
max in-reach j .111 .120(.006)∗∗∗ (.002)∗∗∗
min reach j .073 .066(.078)∗ (.142)
Const. .323 .367 .192 .218(.002)∗∗∗ (.002)∗∗∗ (.002)∗∗∗ (.028)∗∗
Panel b
max reach j = min in-reach j 10.34 10.81(.004)∗∗∗ (.004)∗∗∗
max in-reach j = min reach j 0.57 1.12(.459) (.304)
Obs. 1200 910 1260 940
Sample T1no T1no T2no T2no
Cluster N 20 20 21 21
Controls � �
Dyadic OLS regression. Dependent variable is a dummy which takes a value of one if i chose to establish a link with j. Each regression
contains controls for the round and for each possible pairing of map positions. Confidence: ***↔ 99%, **↔ 95%, *↔ 90%.
Regressions in columns 2 and 4 include controls for age, land owned, land cultivated, number of contacts in real information networks,
number of mistakes in the initial understanding questions and dummies for having completed secondary education, for being Hindu,
and for not belonging to a backward caste. Standard errors are corrected for clustering at session level. P-values obtained with wild
bootstrap-t procedure reported in parentheses. Panel b reports the F statistics (and p value in parenthesis) for a Wald test of the
equality of coefficients.
We confirm the robustness of these results by running a specification that substi-
tutes the dummies with the values of reach and in-reach. This allows players to make
mistakes, while requiring larger mistakes to be less likely than smaller mistakes. Table
12 reports the estimates. Results are significant and of a larger magnitude. In T1no, for
example, player i is 22 percentage points more likely to choose a player with a reach
of 4 than a player with a reach of 0. Given that a player with 0 reach has a probability
of being chosen of 27.1 percent, this amounts to an increase by 81 percent.
We summarise this analysis in the following result, which supports prediction 1:
28

Result 3. In T1no, links to farmers who have the maximum reach in the network are
significantly more likely to be formed than other links. In T2no, links to farmers who
have the maximum in-reach and to farmers who have the minimum reach are significantly
more likely to be formed than other links.
Table 12 shows a further significant effect: in T1no player i is more likely to es-
tablish a link with a player with a lower in-reach. A caveat is in order, as, in the
previous specification, when we include a dummy for whether an individual has the
minimum in-reach we report a positive, but small and insignificant coefficient. This
suggests that the effect of in-reach in T1 is probably not substantial. This result is also
difficult to explain within our theoretical framework. One possibility is that links carry
social value for the person receiving the link proposal. Individuals who choose peers
with a low in-reach in T1no could thus be targeting the players who have accumulated
the minimum social value in the game so far. We cannot provide a direct test for this
interpretation.28 We have however some qualitative evidence in support of it. In the
post-play questionnaire farmers are asked the following question: "Do you think that
choosing a farmer from your own group is a way of showing respect to him?". 51 per-
cent of farmers answer yes to this question. This is consistent with the view that links
carry social value, but represents by no means a full-fledged test.
We define an additional link-formation rule to describe this behaviour:
Rule 4. Form a link with the player with the minimum in-reach.
From now on, we will refer to rule 3 and rule 4 jointly as the ‘Rawlsian’ rules
While result 3 is in line with prediction 1, not all decisions are consistent with
the archetypal rules we have proposed. This becomes apparent when we look at the
relative frequency of decisions consistent with the various rules. In T1no, 51 percent
of decisions are consistent with rule 1 and 63 percent with rule 4. In T2no, 56 percent
of decisions are consistent with rule 2 and 68 percent with rule 3.
28Furthermore, strictly speaking, this motive would lead to a rule targeting the player with the minimum
in-degree, unless indirect connections also carry social value.
29

This exercise, however, poses two problems. First, there are often multiple individu-
als who satisfy a particular rule. Hence, rules satisfied by a larger number of candidates
are selected more frequently when individuals choose randomly or make random mis-
takes. This makes it difficult to interpret frequencies and to compare different rules.
To address this, we calculate the probability of observing a decision consistent with a
particular rule when farmers choose links at random. We then calculate a confidence
interval around the frequency with which we observe decisions consistent with the
same rule in the data. Finally, we check whether the probability of choosing such rule
under random play lies below the confidence interval. If so, we are observing a rule
being chosen significantly more often than under random play.
Second, the sets of individuals satisfying different rules often overlap. In a line
network, for example, the first individual has both the maximum reach and the mini-
mum in-reach. The last individual, on the other hand, has the maximum in-reach and
minimum reach. This complicates comparison across rules. To study the extent of the
problem we investigate the frequency of overlaps. For each turn, we check whether the
sets of potential partners who satisfy the ‘efficiency-minded’ and ‘Rawlsian’ rules are
disjoint, partially overlapping, or fully overlapping.29 Results are presented in panel
(a) of figure 21 in the appendix. Overlaps are very frequent. We will hence repeat the
analysis for the sample turns where the best response sets are not fully overlapping.
Figure 9 presents the analysis for the whole sample. In T1no, both decisions con-
sistent with rule 1 and decisions consistent with rule 4 are observed significantly more
often than under random play. While decisions consistent with rule 4 are more fre-
quent, they also have a higher probability of occurring under random play. In T2no,
rules 2 and 3 are also observed significantly more often than under random play. These
results are basically unaffected if we restrict the analysis to turns where the ‘efficiency-
minded’ and ‘Rawlsian’ best response sets are not fully overlapping. As a further ro-
bustness check, we also consider the two decisions taken by each player jointly and
find that pairs of decisions consistent with a single archetypal rule occur more often
29Consider turn t when farmer i has to play. Let BR1t , BR2
t , BR3t and BR4
t be the sets of players who, from
the point of view of farmer i, satisfy link-formation rules 1,2,3 and 4, respectively. For T1, we focus on BR1t
and BR4t and define three mutually exclusive cases:
1. Fully overlapping: BR1t ∩ BR4
t = BR1t = BR4
t .
2. Disjoint: BR1t ∩ BR4
t = �.3. Partially overlapping: not disjoint and not fully overlapping.
For T2, we focus on BR2t and BR3
t and similarly define the three cases.
30
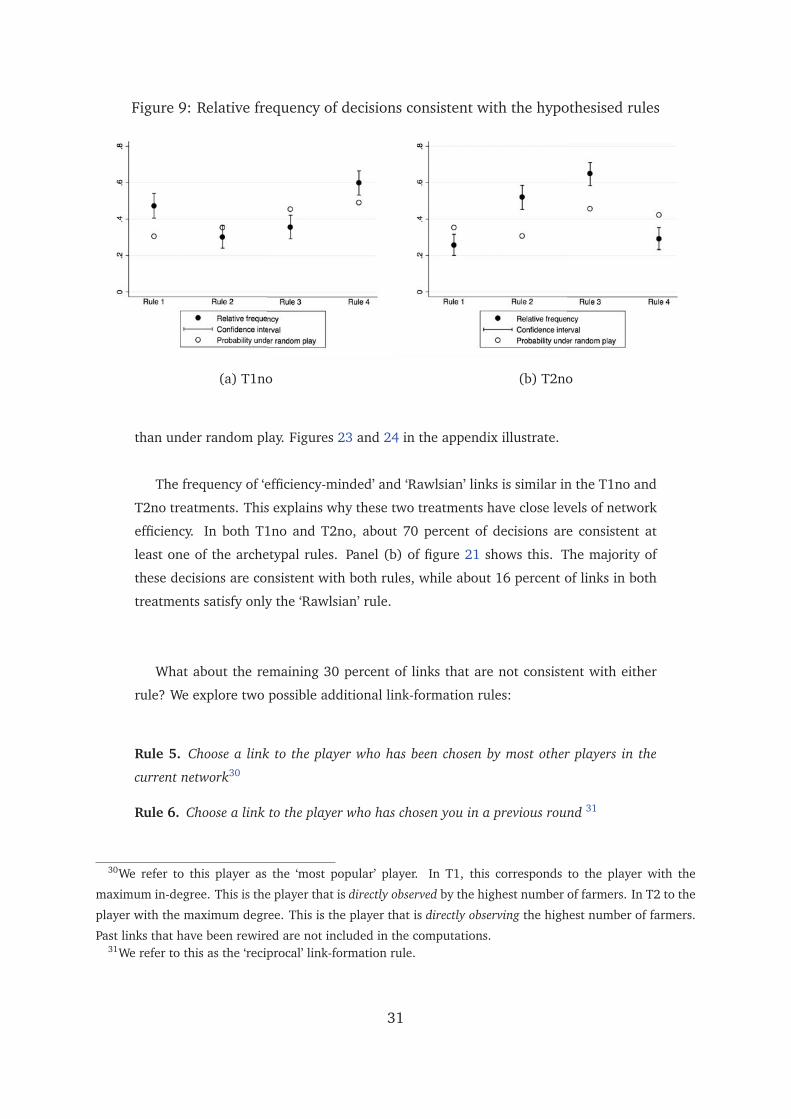
Figure 9: Relative frequency of decisions consistent with the hypothesised rules
(a) T1no (b) T2no
than under random play. Figures 23 and 24 in the appendix illustrate.
The frequency of ‘efficiency-minded’ and ‘Rawlsian’ links is similar in the T1no and
T2no treatments. This explains why these two treatments have close levels of network
efficiency. In both T1no and T2no, about 70 percent of decisions are consistent at
least one of the archetypal rules. Panel (b) of figure 21 shows this. The majority of
these decisions are consistent with both rules, while about 16 percent of links in both
treatments satisfy only the ‘Rawlsian’ rule.
What about the remaining 30 percent of links that are not consistent with either
rule? We explore two possible additional link-formation rules:
Rule 5. Choose a link to the player who has been chosen by most other players in the
current network30
Rule 6. Choose a link to the player who has chosen you in a previous round 31
30We refer to this player as the ‘most popular’ player. In T1, this corresponds to the player with the
maximum in-degree. This is the player that is directly observed by the highest number of farmers. In T2 to the
player with the maximum degree. This is the player that is directly observing the highest number of farmers.
Past links that have been rewired are not included in the computations.31We refer to this as the ‘reciprocal’ link-formation rule.
31

Regression analysis reported in table 13 in the appendix suggests that, in general,
rules 5 and 6 do not significantly predict link-formation decisions. Nevertheless, links
consistent with rule 5 are observed frequently: 66 percent of decisions that do not
follow the ‘efficiency-minded’ or the ‘Rawlsian’ rule target the ‘most popular’ player
in the network instead. Reciprocal links are not as common: they occur only in 18
percent of decisions that not consistent with the archetypal rules. Figures 22 and ??
illustrate.
Simulation analysis shows that the largest efficiency gains can be achieved by re-
ducing the proportion of links that are targeted to the ‘most popular’ player, as opposed
to reducing the proportion of ‘Rawlsian’ links. We simulate a link formation process
where 54 percent of decisions are consistent with rule 1, 16 percent with the rule 4
and the remaining 30 percent with the ‘most popular’ player rule.32 We then switch
increasing proportions of decisions assigned to follow rule 4 to rule 1, keeping the
proportion of rule 5 decisions fixed. We repeat the same exercise for rule 5: we switch
increasing proportions of decisions assigned to follow rule 5 to rule 1, keeping the pro-
portion of rule 4 decisions fixed. The results are stark: switching all rule 5 decisions
to the rule 1 delivers an efficiency gain of 25 percentage points, while an equivalent
reduction of ‘Rawlsian’ decisions results only in a 5 percentage points increase.33 Fig-
ure 10 illustrates. In figure 25 in the appendix we present the same simulation, with a
different assumption about the baseline proportion of decisions following the various
rules. Qualitatively, results are not affected.
32This reflects the decisions in our data, with two simplifying assumptions: (i) all decisions that are con-
sistent with both rule 1 and rule 4 are assumed to follow the rule 1, (ii) all decisions that are not consistent
with the archetypal rules are assumed to follow rule 5.33We also know from the simulations reported in figure 16 what would happen if switch all rule 5 decisions
to rule 3. This thought experiment corresponds to a simulation where 46 percent of decisions follow rule 3
and 54 percent follow rule 1. Figure 16 shows that network efficiency in such scenario would be above 90
percent, which corresponds to 20 percentage points gain.
32
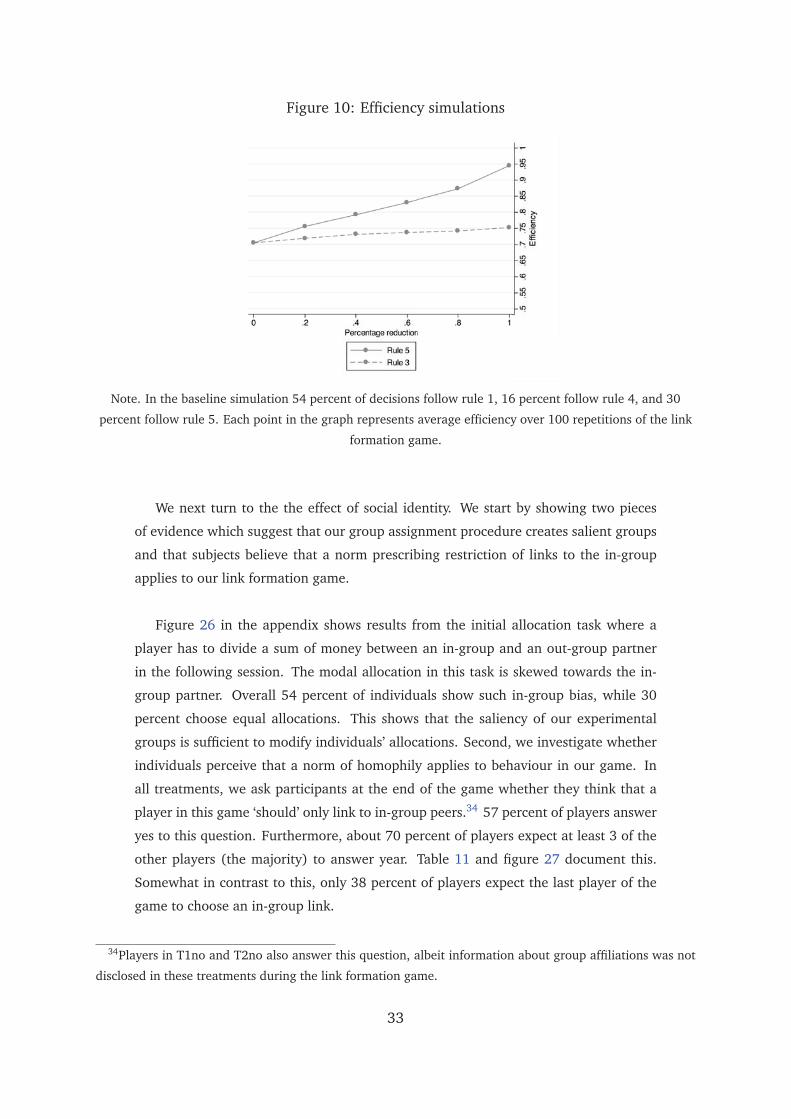
Figure 10: Efficiency simulations
Note. In the baseline simulation 54 percent of decisions follow rule 1, 16 percent follow rule 4, and 30
percent follow rule 5. Each point in the graph represents average efficiency over 100 repetitions of the link
formation game.
We next turn to the the effect of social identity. We start by showing two pieces
of evidence which suggest that our group assignment procedure creates salient groups
and that subjects believe that a norm prescribing restriction of links to the in-group
applies to our link formation game.
Figure 26 in the appendix shows results from the initial allocation task where a
player has to divide a sum of money between an in-group and an out-group partner
in the following session. The modal allocation in this task is skewed towards the in-
group partner. Overall 54 percent of individuals show such in-group bias, while 30
percent choose equal allocations. This shows that the saliency of our experimental
groups is sufficient to modify individuals’ allocations. Second, we investigate whether
individuals perceive that a norm of homophily applies to behaviour in our game. In
all treatments, we ask participants at the end of the game whether they think that a
player in this game ‘should’ only link to in-group peers.34 57 percent of players answer
yes to this question. Furthermore, about 70 percent of players expect at least 3 of the
other players (the majority) to answer year. Table 11 and figure 27 document this.
Somewhat in contrast to this, only 38 percent of players expect the last player of the
game to choose an in-group link.
34Players in T1no and T2no also answer this question, albeit information about group affiliations was not
disclosed in these treatments during the link formation game.
33
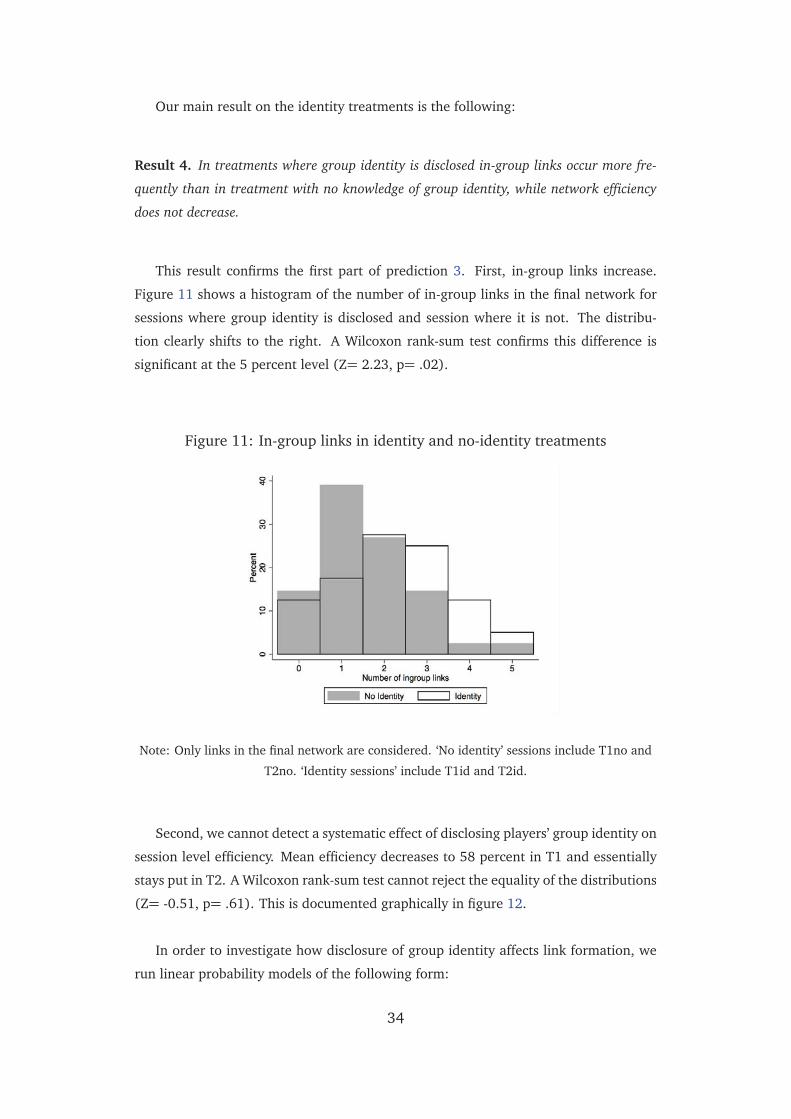
Our main result on the identity treatments is the following:
Result 4. In treatments where group identity is disclosed in-group links occur more fre-
quently than in treatment with no knowledge of group identity, while network efficiency
does not decrease.
This result confirms the first part of prediction 3. First, in-group links increase.
Figure 11 shows a histogram of the number of in-group links in the final network for
sessions where group identity is disclosed and session where it is not. The distribu-
tion clearly shifts to the right. A Wilcoxon rank-sum test confirms this difference is
significant at the 5 percent level (Z= 2.23, p= .02).
Figure 11: In-group links in identity and no-identity treatments
Note: Only links in the final network are considered. ‘No identity’ sessions include T1no and
T2no. ‘Identity sessions’ include T1id and T2id.
Second, we cannot detect a systematic effect of disclosing players’ group identity on
session level efficiency. Mean efficiency decreases to 58 percent in T1 and essentially
stays put in T2. A Wilcoxon rank-sum test cannot reject the equality of the distributions
(Z= -0.51, p= .61). This is documented graphically in figure 12.
In order to investigate how disclosure of group identity affects link formation, we
run linear probability models of the following form:
34
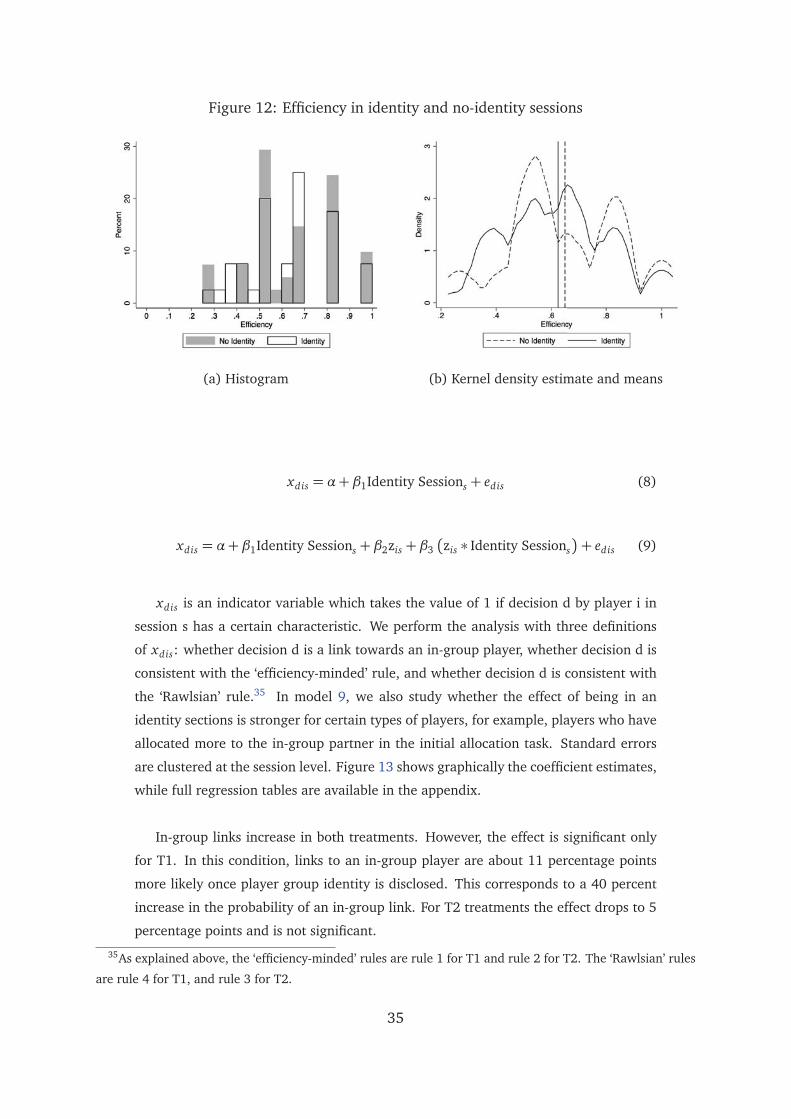
Figure 12: Efficiency in identity and no-identity sessions
(a) Histogram (b) Kernel density estimate and means
xdis = α+ β1Identity Sessions + edis (8)
xdis = α+ β1Identity Sessions + β2zis + β3�zis ∗ Identity Sessions
�+ edis (9)
xdis is an indicator variable which takes the value of 1 if decision d by player i in
session s has a certain characteristic. We perform the analysis with three definitions
of xdis: whether decision d is a link towards an in-group player, whether decision d is
consistent with the ‘efficiency-minded’ rule, and whether decision d is consistent with
the ‘Rawlsian’ rule.35 In model 9, we also study whether the effect of being in an
identity sections is stronger for certain types of players, for example, players who have
allocated more to the in-group partner in the initial allocation task. Standard errors
are clustered at the session level. Figure 13 shows graphically the coefficient estimates,
while full regression tables are available in the appendix.
In-group links increase in both treatments. However, the effect is significant only
for T1. In this condition, links to an in-group player are about 11 percentage points
more likely once player group identity is disclosed. This corresponds to a 40 percent
increase in the probability of an in-group link. For T2 treatments the effect drops to 5
percentage points and is not significant.
35As explained above, the ‘efficiency-minded’ rules are rule 1 for T1 and rule 2 for T2. The ‘Rawlsian’ rules
are rule 4 for T1, and rule 3 for T2.
35

The frequency of ‘efficiency-minded’ or ‘Rawlsian’ links is unaffected by the dis-
closure of group identity in T1. In section 3, we argued that a farmer who derives
a limited, but positive benefit from following the social norm may not be prepared
to sacrifice his objective in order to conform to the norm. However, when there are
both in-group and out-group partners who satisfy his preferred link-formation rule, he
will strictly prefer a link to an in-group partner. In this scenario, disclosure of group
identity will be associated to: (i) an increase in in-group links, (ii) no change in the
relative frequency of ‘efficiency-minded’ and ‘Rawlsian’ links, and (iii) an increase in
the proportion of, say, ‘efficiency-minded’ links that are directed towards an in-group
partner. We have already presented evidence consistent with effects (i) and (ii). We
test for effect (iii) by restricting the sample to ‘efficiency-minded’ decisions in T1 and
T2 and running again model 8, with the in-group link dummy as dependent variable.
The significant coefficient of 13.8 which we obtain for T1 can be interpreted as the
percentage point increase in the probability that an ‘efficiency-minded’ link is directed
to an in-group farmer.
Decisions consistent with the two archetypal rules are, on the other hand, observed
less frequently in T2. Links towards players with maximum in-reach drop by 9 per-
centage points (a 17 percent fall with respect to the baseline probability of such links
in T2no). The effect is however only significant at the 15 percent level. Links towards
players with minimum reach also decrease by an insignificant 4 percentage points.
These results suggest that disclosure of group identity may operate through differ-
ent mechanisms in the two treatments. We are unable to shed more light on these
mechanisms through estimation of model 9: the effect of group identity disclosure on
the likelihood of choosing an in-group link is not stronger for individuals who show
in-group bias in the allocation task, who agree with the norm of homophily, or who
expect more peers to agree with the norm of homophily.36
We have not said much about understanding so far. The last set of results we report
shows that the likelihood of choosing a link consistent with any of the rules we have
discussed is generally not correlated with the number of correct answers players give
in the initial understanding questions. We show this using the following regression
model:
36In future work, we plan to attempt estimation of a structural mixture model of link selection, which
allows for different link formation objectives in the population.
36
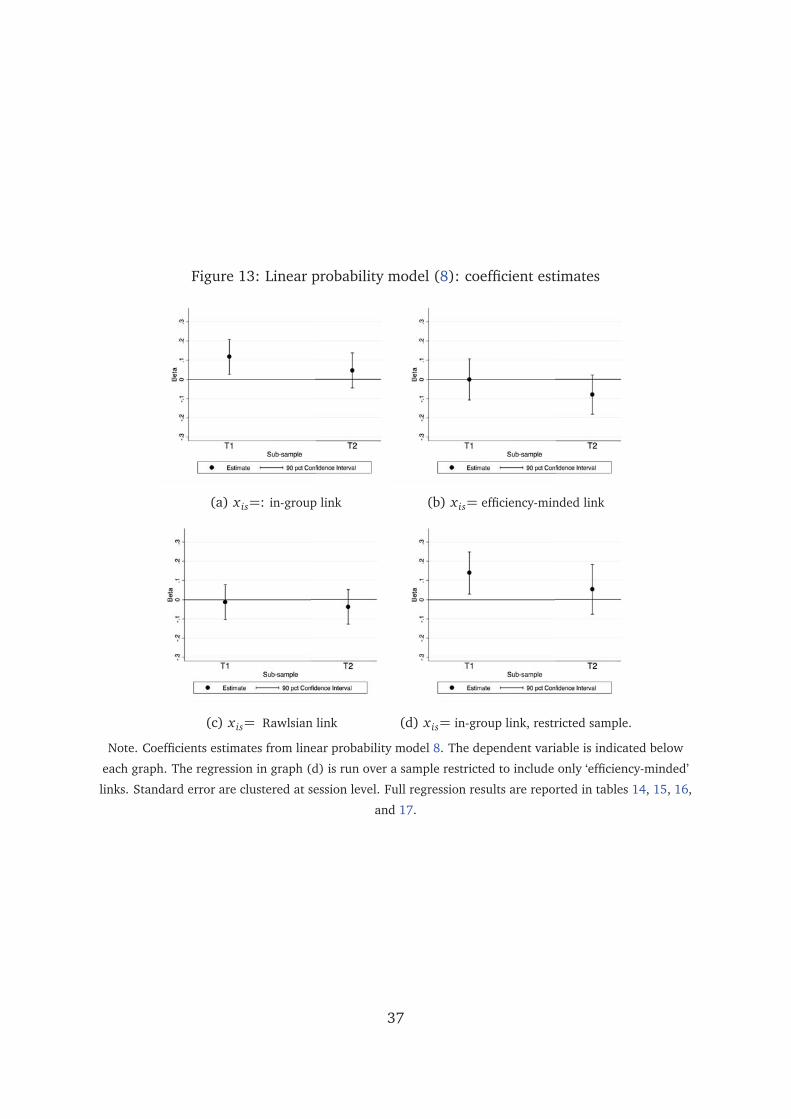
Figure 13: Linear probability model (8): coefficient estimates
(a) xis=: in-group link (b) xis= efficiency-minded link
(c) xis= Rawlsian link (d) xis= in-group link, restricted sample.
Note. Coefficients estimates from linear probability model 8. The dependent variable is indicated below
each graph. The regression in graph (d) is run over a sample restricted to include only ‘efficiency-minded’
links. Standard error are clustered at session level. Full regression results are reported in tables 14, 15, 16,
and 17.
37
xdis =α+ β1Identity Sessions
+ β2�understandingis ∗ Identity Session=0s
�
+ β3�understandingis ∗ Identity Session=1s
�+ edis (10)
understandingis is the z-score of the number of correct answers players give in the
initial understanding questions. β2 captures whether high understanding subjects are
more likely to choose links consistent with strategy x in sessions where group identity
is not disclosed. β3 measures whether high understanding subjects are more likely to
choose links consistent with strategy x in sessions where group identity is disclosed.
Tables 20 and reports results of separate estimations of model 10 for T1 and T2. The
only significant result is that in sessions where group identity is disclosed, players
with a higher understanding z-score are less likely to link to the player who has been
chosen most frequently. The coefficient is only significant at the 10 percent level and
small in magnitude: a standard deviation increase in understanding is associated with
a decrease in the likelihood of a link towards the ‘most popular’ player of 4 percentage
point, corresponding to 10 percent reduction in this probability.
38
6 Conclusion
Social networks play an important role in the diffusion of innovations such as new
agricultural technologies, health schemes or financial products. Theoretical models
show that in games of unilateral, one way flow link formation, myopic, selfish indi-
viduals can converge to efficient networks after repeated play [Bala and Goyal, 2000].
We offer the first experimental test of this prediction for a non-western population- a
sample of farming communities in rural India. This is a policy-relevant setting: interest
for new, cost-effective intervention designs that promote the diffusion of agricultural
technology is currently high in India. We make a second contribution to the literature
by exploring how a pervasive feature of the social world, group categorisation, affects
the way networks are formed.
We find that the efficiency of the networks formed in our experiment is signifi-
cantly and substantially lower than the level of efficiency which myopic selfish play
would have achieved. While many farmers choose welfare-enhancing links, large effi-
ciency losses come about because a minority group of farmers chooses to link with the
‘most popular’ farmer in the network. When information about group membership is
disclosed, more in-group links are formed, but networks do not become significantly
less efficient.
Inefficiently structured networks can limit the diffusion of information about new
technologies and hence their adoption. This creates a rationale for development poli-
cies that support the diffusion of socially beneficial innovations. Interventions can
bypass social structures altogether and rely instead on modern technologies. Recent
trials show that agronomic information transmitted via SMS, phone lines and voice
messages can be effective at increasing yields, and discouraging the use of inefficient
pesticides [Cole and Fernando, 2012, Casaburi et al., 2014]. Alternatively, interven-
tions can try to strengthen peer-to-peer transmission by incentivising farmers to share
information [Ben Yishay and Mobarak, 2012] or by fostering the creation of new links
[Vasilaky and Leonard, 2013].
Future work can use artefactual link-formation field experiments to inform the de-
velopment of diffusion policy in two ways. First, it can further explore link-formation
heuristics in specific settings. Program design should ensure compatibility with those
heuristics. For example, where individuals preferentially attach to the ‘most popular’
farmers, peer-to-peer extension programs can rely on a few, prominent injection points.
Where links are reciprocal and less centralised, different models may be required. Sec-
39

ond, experimental designs can help develop our understanding of how social features
impact network formation and potentially limit peer-to-peer diffusion. Further study
of the effects of group categorisation using natural groups is required. Within-group
status differentiation offers a second important avenue for exploration.
40
References
G.A. Akerlof and R.E. Kranton. Identity Economics: How Our Identities Shape Our Work,
Wages, and Well-Being. Princeton University Press, 2010. ISBN 9781400834181.
URL http://books.google.co.uk/books?id=1gKUpITuf00C.
George A. Akerlof and Rachel E. Kranton. Economics and identity. The Quarterly
Journal of Economics, 115(3):715–753, August 2000. URL http://ideas.repec.
org/a/tpr/qjecon/v115y2000i3p715-753.html.
Siwan Anderson. Caste as an impediment to trade. American Economic Journal: Applied
Economics, 3(1):239–63, September 2011. doi: 10.1257/app.3.1.239. URL http:
//www.aeaweb.org/articles.php?doi=10.1257/app.3.1.239.
James Andreoni and John Miller. Giving according to garp: An experimental test of
the consistency of preferences for altruism. Econometrica, 70(2):pp. 737–753, 2002.
ISSN 00129682. URL http://www.jstor.org/stable/2692289.
Venkatesh Bala and Sanjeev Goyal. Learning from Neighbours. Review of Economic
Studies, 65(3):595–621, July 1998. URL http://ideas.repec.org/a/bla/
restud/v65y1998i3p595-621.html.
Venkatesh Bala and Sanjeev Goyal. A noncooperative model of network formation.
Econometrica, 68(5):1181–1230, September 2000. URL http://ideas.repec.
org/a/ecm/emetrp/v68y2000i5p1181-1230.html.
Oriana Bandiera and Imran Rasul. Social networks and technology adoption in
northern mozambique. Economic Journal, 116(514):869–902, October 2006. URL
http://ideas.repec.org/a/ecj/econjl/v116y2006i514p869-902.html.
Abhijit Banerjee, Emily Breza, Arun Chandrasekhar, and Matthew O. Jackson. Come
Play with Me: Experimental Evidence of Information Diffusion about Rival Goods.
Working papers, 2012.
Abhijit Banerjee, Arun G. Chandrasekhar, Esther Duflo, and Matthew O. Jackson.
The diffusion of microfinance. Science, 341(6144), 2013. doi: 10.1126/science.
1236498. URL http://www.sciencemag.org/content/341/6144/1236498.
abstract.
Abigail Barr and Garance Genicot. Risk sharing, commitment, and information:
An experimental analysis. Journal of the European Economic Association, 6(6):
1151–1185, December 2008. URL http://ideas.repec.org/a/tpr/jeurec/
v6y2008i6p1151-1185.html.
41

Michele Belot and Marcel Fafchamps. Good Samaritans and the Market: Experimental
Evidence on Other-Regarding Preferences. Discussion Papers 2012001, University of
Oxford, Nuffield College, August 2012. URL http://ideas.repec.org/p/cex/
dpaper/2012001.html.
Ariel Ben Yishay and Mushfiq Mobarak. Communicating with farmers through social
networks. Working paper, 2012.
Daniel J. Benjamin, James J. Choi, and A. Joshua Strickland. Social identity and
preferences. American Economic Review, 100(4):1913–28, September 2010. URL
http://ideas.repec.org/a/aea/aecrev/v100y2010i4p1913-28.html.
Erlend Berg, Maitreesh Ghatak, R Manjula, D Rajasekhar, and Sanchari Roy. Motivat-
ing knowledge agents: Can incentive pay overcome social distance? STICERD -
Economic Organisation and Public Policy Discussion Papers Series 42, Suntory and
Toyota International Centres for Economics and Related Disciplines, LSE, March
2013. URL http://ideas.repec.org/p/cep/stieop/42.html.
SiegfriedK. Berninghaus, Karl-Martin Ehrhart, and Marion Ott. A network experiment
in continuous time: The influence of link costs. Experimental Economics, 9(3):237–
251, 2006. ISSN 1386-4157. doi: 10.1007/s10683-006-9125-1. URL http://dx.
doi.org/10.1007/s10683-006-9125-1.
Andre Beteille and Mysore Srinivas. 212. networks in indian social structure. Man,
64:pp. 165–168, 1964. ISSN 00251496. URL http://www.jstor.org/stable/
2796572.
Marilynn B Brewer. The psychology of prejudice: Ingroup love and outgroup hate?
Journal of social issues, 55(3):429–444, 1999.
Erwin Bulte, Andreas Kontoleon, John List, Ty Turley, and Marteen Voors. When eco-
nomics meets hierarchy: A field experiment on the workings of the invisible hand.
Technical report, 2012.
Steven Callander and Charles R. Plott. Principles of network development
and evolution: an experimental study. Journal of Public Economics, 89(8):
1469–1495, August 2005. URL http://ideas.repec.org/a/eee/pubeco/
v89y2005i8p1469-1495.html.
A. Colin Cameron, Jonah B. Gelbach, and Douglas L. Miller. Bootstrap-Based Improve-
ments for Inference with Clustered Errors. The Review of Economics and Statistics,
90(3):414–427, August 2008. URL http://ideas.repec.org/a/tpr/restat/
v90y2008i3p414-427.html.
42

Lorenzo Casaburi, Michael Kremer, Sendhil Mullainathan, and Ravindra Ramrattan.
Harnessing ict to increase agricultural production: Evidence from kenya. Working
paper, 2014.
Damon Centola. The spread of behavior in an online social network experiment. Sci-
ence, 329(5996):1194–1197, 2010. doi: 10.1126/science.1185231. URL http:
//www.sciencemag.org/content/329/5996/1194.abstract.
Damon Centola. An experimental study of homophily in the adoption of health be-
havior. Science, 334(6060):1269–1272, 2011. doi: 10.1126/science.1207055. URL
http://www.sciencemag.org/content/334/6060/1269.abstract.
Gary Charness and Matthew Rabin. Understanding social preferences with simple
tests. The Quarterly Journal of Economics, 117(3):817–869, August 2002. URL
http://ideas.repec.org/a/tpr/qjecon/v117y2002i3p817-869.html.
Gary Charness, Luca Rigotti, and Aldo Rustichini. Individual behavior and group
membership. American Economic Review, 97(4):1340–1352, September 2007. URL
http://ideas.repec.org/a/aea/aecrev/v97y2007i4p1340-1352.html.
Yan Chen and Sherry Xin Li. Group identity and social preferences. The American
Economic Review, pages 431–457, 2009.
Shawn A. Cole and A. Nilesh Fernando. The Value of Advice: Evidence from Mobile
Phone-Based Agricultural Extension. Harvard Business School Working Papers 13-
047, Harvard Business School, November 2012. URL http://ideas.repec.org/
p/hbs/wpaper/13-047.html.
Margherita Comola. The network structure of mutual support links: Evidence from
rural tanzania. Pse working papers, HAL, June 2010.
Margherita Comola and Marcel Fafchamps. Testing unilateral and bilateral link for-
mation. The Economic Journal, pages n/a–n/a, 2013. ISSN 1468-0297. doi:
10.1111/ecoj.12071. URL http://dx.doi.org/10.1111/ecoj.12071.
Timothy G. Conley and Christopher R. Udry. Learning about a new technology:
Pineapple in ghana. American Economic Review, 100(1):35–69, March 2010. URL
http://ideas.repec.org/a/aea/aecrev/v100y2010i1p35-69.html.
Anna Conte, Daniela Di Cagno, and Emanuela Sciubba. Strategies in social network
formation. Birkbeck Working Papers in Economics and Finance 0905, Birkbeck,
Department of Economics, Mathematics & Statistics, June 2009. URL http://
ideas.repec.org/p/bbk/bbkefp/0905.html.
43

Sergio Currarini and Friederike Menge. Identity, Homophily and In-Group Bias.
Working Papers 2012.37, Fondazione Eni Enrico Mattei, May 2012. URL http:
//ideas.repec.org/p/fem/femwpa/2012.37.html.
Sergio Currarini, Matthew O. Jackson, and Paolo Pin. An economic model of friend-
ship: Homophily, minorities, and segregation. Econometrica, 77(4):1003–1045, 07
2009.
Esther Duflo, Michael Kremer, and Jonathan Robinson. Nudging farmers to use fer-
tilizer: Theory and experimental evidence from kenya. American Economic Review,
101(6):2350–90, 2011. doi: 10.1257/aer.101.6.2350. URL http://www.aeaweb.
org/articles.php?doi=10.1257/aer.101.6.2350.
Thard Dunning and Janhavi Nilekani. Ethnic quotas and political mobilization: Caste,
parties, and distribution in indian village councils. American Political Science Review,
107:35–56, 1 2013. ISSN 1537-5943. doi: 10.1017/S0003055412000573. URL
http://journals.cambridge.org/article_S0003055412000573.
Catherine C. Eckel and Philip J. Grossman. Managing diversity by creat-
ing team identity. Journal of Economic Behavior & Organization, 58(3):
371–392, November 2005. URL http://ideas.repec.org/a/eee/jeborg/
v58y2005i3p371-392.html.
Marcel Fafchamps and Flore Gubert. The formation of risk sharing networks. Journal of
Development Economics, 83(2):326–350, July 2007. URL http://ideas.repec.
org/a/eee/deveco/v83y2007i2p326-350.html.
Falk and Kosfeld. It’s all about connections: Evidence on network formation. Review
of Network Economics, 11(3):1–36, September 2012. URL http://ideas.repec.
org/a/bpj/rneart/v11y2012i3n2.html.
Ernst Fehr and Klaus M. Schmidt. A theory of fairness, competition, and cooperation.
The Quarterly Journal of Economics, 114(3):817–868, August 1999. URL http:
//ideas.repec.org/a/tpr/qjecon/v114y1999i3p817-868.html.
Andrew D Foster and Mark R Rosenzweig. Learning by doing and learning from others:
Human capital and technical change in agriculture. Journal of Political Economy,
103(6):1176–1209, December 1995. URL http://ideas.repec.org/a/ucp/
jpolec/v103y1995i6p1176-1209.html.
Jacob K. Goeree, Arno Riedl, and Aljaz Ule. In search of stars: Network for-
mation among heterogeneous agents. Games and Economic Behavior, 67(2):
44

445–466, November 2009. URL http://ideas.repec.org/a/eee/gamebe/
v67y2009i2p445-466.html.
Benjamin Golub and Matthew O. Jackson. How homophily affects the speed
of learning and best-response dynamics. The Quarterly Journal of Economics,
127(3):1287–1338, 2012. URL http://ideas.repec.org/a/oup/qjecon/
v127y2012i3p1287-1338.html.
S. Goyal. Connections: An Introduction to the Economics of Networks. Princeton Uni-
versity Press, 2007. ISBN 9781400829163. URL http://books.google.co.uk/
books?id=h4V250eVEKgC.
R. Guha. India After Gandhi: The History of the World’s Largest Democracy. Ecco book.
HarperCollins, 2008. ISBN 9780060958589. URL http://books.google.co.
uk/books?id=2fvd-CaFdqYC.
Glenn W. Harrison and John A. List. Field Experiments. Journal of Economic Liter-
ature, 42(4):1009–1055, December 2004. URL http://ideas.repec.org/a/
aea/jeclit/v42y2004i4p1009-1055.html.
Karla Hoff and Priyanka Pandey. Discrimination, social identity, and durable in-
equalities. American Economic Review, 96(2):206–211, May 2006. URL http:
//ideas.repec.org/a/aea/aecrev/v96y2006i2p206-211.html.
Matthew O. Jackson and Asher Wolinsky. A strategic model of social and economic
networks. Journal of Economic Theory, 71(1):44–74, October 1996. URL http:
//ideas.repec.org/a/eee/jetheo/v71y1996i1p44-74.html.
Matthew O. Jackson, Tomas Rodriguez-Barraquer, and Xu Tan. Social capital and social
quilts: Network patterns of favor exchange. American Economic Review, 102(5):
1857–97, August 2012.
Dean Karlan, Markus Mobius, Tanya Rosenblat, and Adam Szeidl. Trust and social col-
lateral. The Quarterly Journal of Economics, 124(3):1307–1361, August 2009. URL
http://ideas.repec.org/a/tpr/qjecon/v124y2009i3p1307-1361.html.
Georg Kirchsteiger, Marco Mantovani, Ana Mauleon, and Vincent Vannetelbosch. My-
opic or Farsighted? An Experiment on Network Formation. CEPR Discussion Pa-
pers 8263, C.E.P.R. Discussion Papers, February 2011. URL http://ideas.repec.
org/p/cpr/ceprdp/8263.html.
Rachel Kranton, Matthew Pease, Seth Sanders, and Scott Huetter. Identity, group con-
flict, and social preferences. Working paper, 2012.
45

Michael Kremer and Edward Miguel. The illusion of sustainability. The Quarterly
journal of economics, 122(3):1007–1065, 2007.
Pramila Krishnan and Manasa Patnam. Neighbors and extension agents in ethiopia:
who matters more for technology dffusion. Working papers, International Growth
Center, 2012.
Pramila Krishnan and Emanuela Sciubba. Links and architecture in village networks.
Economic Journal, 119(537):917–949, 04 2009.
John A. List. Testing Neoclassical Competitive Theory in Multilateral Decentralized
Markets. Journal of Political Economy, 112(5):1131–1156, October 2004. URL
http://ideas.repec.org/a/ucp/jpolec/v112y2004i5p1131-1156.html.
Miller McPherson, Lynn Smith-Lovin, and James M Cook. Birds of a feather: Ho-
mophily in social networks. Annual Review of Sociology, 27(1):415–444, 2001. doi:
10.1146/annurev.soc.27.1.415. URL http://arjournals.annualreviews.
org/doi/abs/10.1146/annurev.soc.27.1.415.
Kaivan Munshi. Social learning in a heterogeneous population: technology dif-
fusion in the indian green revolution. Journal of Development Economics, 73
(1):185–213, February 2004. URL http://ideas.repec.org/a/eee/deveco/
v73y2004i1p185-213.html.
Emily Oster and Rebecca Thornton. Determinants of technology adoption: Peer effects
in menstrual cup take-up. Journal of the European Economic Association, 10(6):
1263–1293, 2012.
Paulo Santos and Christopher B. Barrett. Identity, interest and information search in a
dynamic rural economy. World Development, 38(12):1788–1796, December 2010.
Henri Tajfel. Human groups and social categories: Studies in social psychology. CUP
Archive, 1981.
Bassel Tarbush and Alexander Teytelboym. Friending. 2014.
Dennie Van Dolder and Vincent Buskens. Social motives in network formation: An
experimental study. International Conference on Game Theory for Networks. Papers
and Proceedings, (1):593–602, May 2009.
Kathryn Vasilaky and Kenneth Leonard. As good as the networks they keep?: Improv-
ing farmers’ social networks via randomized information exchange in rural uganda.
March 2013.
46

Angelino Viceisza. Treating the field as a lab: A basic guide to conducting economics
experiments for policymaking. Food security in practice technical guide series 7,
International Food Policy Research Institute (IFPRI), 2012. URL http://ideas.
repec.org/p/fpr/fsprac/7.html.
Menahem Yaari and Maya Bar-Hillel. On dividing justly. Social Choice and Welfare, (1):
1–22, 1984.
Toshio Yamagishi and Toko Kiyonari. The group as the container of generalized reci-
procity. Social Psychology Quarterly, 63(2):pp. 116–132, 2000. ISSN 01902725. URL
http://www.jstor.org/stable/2695887.
Daniel Zizzo. Experimenter demand effects in economic experiments. Experimental
Economics, 13(1):75–98, March 2010. URL http://ideas.repec.org/a/kap/
expeco/v13y2010i1p75-98.html.
47

7 Appendix
7.1 Formal derivation of the rules
7.1.1 Notation
We define some basic notation following Goyal [2007]. Let N=(1,2,..,n) be the set of
players. In T1, each player i chooses a (pure) strategy gi = (gi1, gi2, ..., gii−1, gii+1, ..., gin)37,
which is a vector of directed links gi j ∈ {0, 1}. In T2, on the other hand, every
player chooses a strategy gi = (g1i , g2i , ..., gi−1i , gi+1i , ..., gni), a vector of directed links
g ji ∈ {0, 1}. Let Γi be the set of possible values of gi .38 Γ = Γ1 × Γ2 × ...× Γn is the
set of all possible combinations of player strategies. The vector of player strategies
g = (g1, g2, ..., gn), drawn from Γ, can be represented as a directed network. g + i j is
the network obtained from adding the link gi j = 1 to network g.
In our game player i receives the prize if he is the winner of the prize lottery, or if
he is connected to the winner via a path of links. A path from player i to player j is a
set of links such that: gi y = gyw = ...= gz j = 1. A direct link is a path of length 1. The
notation i→g j indicates that in network g there is a path from i to j. If the path i→g j
exists, we say that play i reaches player j network g. In this case, player i is assigned
the prize whenever player j is assigned the prize. A path i →g j, on the other hand,
has no implication on whether player j is assigned the prize when player i is assigned
the prize.
We need to introduce two crucial concepts for our analysis. First, let Nj(g) = {k ∈N | j →g k} and μ j(g) = |Nj(g)|. μ j(g) represents the number of players whom player
j reaches in network g. Sometimes we want to exclude from the count the path from
player j to player i. Let Nji(g) = {k ∈ N \ i| j→g k} and μ ji(g) = |Nji(g)|. μ ji(g) is the
number of players whom player j reaches in network g, excluding player i. We call
μ ji(g) the reach of player j in network g.
Second, let N− j(g) = {k ∈ N |k →g j} and μ− j(g) = |N− j(g)|. μ− j(g) represents
the number of players who reach player j in network g. Again, we sometimes need
to exclude the path from player i to player j. Let N− ji(g) = {k ∈ N \ i|k →g j} and
μ− ji(g) = |N− ji(g)|. μ− ji(g) is the number of players who reach player j in network
g, excluding player i. We call μ− ji(g) the in- reach of player j in network g.
37Link from player i to player i are ruled out.38In both T1 and T2, we impose that at most one link can be equal to 1. Thus, there are n possible values
of of gi: n-1 possible links plus the strategy of establishing no links at all.
48

The notions of μ j and μ− j should not be confused with the most common notions
of out-degree and in-degree, which represent the number of direct links of a player in
the network.39
Network g determines an expected payoff π j(g) for each player. This is simply
calculated as the value of the prize, which we normalise to 1, times the probability of
winning the prize, which is equal to the fraction of players accessed by player j:
π j(g) =1+μ j(g)
n(11)
7.1.2 Rule 1
We assume that in T1 player i chooses strategy gi to maximise expected payoff. That
is, he has to pick the partner j such that:
maxjπi(g + i j) (12)
Notice that when i has the turn Ni(g) = {∅} and μi(g) = 0. In the first round of the
game gi has all of its entries equal to zero. In the second round, the decision maker
has to consider the game as if gi had only zero entries, as the link specified in the first
round is removed once he declares his second-round strategy.
Proposition 1. Player i maximises πi(g+ i j) by choosing the partner with the maximum
value of μ ji(g) in the network g.
Proof. Rewrite πi(g + i j) as: 1+μi(g+i j)n
. Notice that, as μi(g) = 0, μi(g + i j) =
1+μ ji(g). Thus πi(g + i j) =2+μ ji(g)
n, which is monotonically increasing in μ ji(g). �
7.1.3 Rule 2
Let player i in T1 have a utility function (3). The gain in utility obtained from a g ji
link can be summarised as follows:
39The formal definitions of out-degree and in-degree are as follows. Let N di (g) = { j ∈ N |gi j = 1} be the set
of players with whom player i is directly linked. μdi = |N d
i (g)| is the number of players to whom with whom
player i is directly linked. This is the out-degree of player i. N d−i(g = { j ∈ N |g ji = 1}, on the other hand, is
the set of players j such that g ji = 1. μd−i = |N d−i(g)| is the in-degree: the number of players who have a direct
link to i.
49

ui(g + ji)− ui(g) = πi(g + ji)−πi(g) + γ∑
k∈N\iπk(g + ji)−πk(g)
= γ∑
k∈N\iπk(g + ji)−πk(g)
= γ f (g + ji) (13)
where f (g + ji) =∑
k∈N\i πk(g + ji)− πk(g). In T2 a link as no effect on player
i’s reach, nor on his effected payoff. However, player i has a preference for links that
maximise the increase in the expected payoff of the other players. f (g + ji) measures
the increase in expected payoff for the other players. To study how f (g+ ji) is related
to player j’s position in the network, there are two cases we need to consider.
Case 1: j /∈ Ni(g). Here f (g + ji) can be simply expressed as:
�μi(g) + 1��μ− ji(g) + 1�
(14)
To derive (14), we first need to show the following property of networks in T2.
Lemma 1. In T2, when it is player i’s turn to play, if j /∈ Ni(g), no player in j ∪ N− j(g)
reaches a player in i ∪ Ni(g).
Proof of lemma. We refer to gi j = 1 as an ‘outgoing’ link for player i and g ji = 1
as an ‘incoming’ link. In T2, players can have have multiple ‘outgoing’ links, but can
have at most one ‘incoming’ link. When it is player i’s turn to play, player i has no
‘incoming’ links. He may have one or more ‘outgoing’ links, in which case Ni(g) is
nonempty. Every individual k in Ni(g) has exactly one ‘incoming’ link. This ‘incoming’
link is either a link with i (gik = 1), or it is a link with a third player z in Ni(g) (i→g z).
Thus, no player in the set i ∪Ni(g) has an ‘incoming’ link with a player outside the set
i ∪ Ni(g). If a player j is not in Ni(g), he cannot reach any player in i ∪ Ni(g).
Furthermore for j /∈ Ni(g), i ∪ Ni(g) ∩ N− j(g) = �. Player i does not reach player
j. Further, No player reached by player i reaches player j. If some player reached
by player i reaches player j, then player j would be part of Ni(g), which contradicts
j /∈ Ni(g). This concludes the proof. �
50

If j /∈ Ni(g), and player i sets g ji = 1, player j now reaches player i and all players
in Ni(g). Lemma 1 tells us that none of the players in Ni(g) was previously reached
by player j. In other words, each individual in Ni(g) allows player j to observe new
information. Player j’s expected payoff increases by μi(g) + 1.
When player i sets g ji = 1, all individuals in N− j(g) now reach player i and all
players in Ni(g). Lemma 1 tells us that none of the players in Ni(g) was previously
reached by any player in N− j(g). The expected payoff of each player in N− j(g) also
goes up by μi(g)+1. There are μ− j(g) players in N− j(g). So the sum of expected payoff
among players increases by�μi(g) + 1��μ− j(g) + 1�
. As j /∈ Ni(g), μ− j(g) = μ− ji(g).
We can express the increase in expected payoff also as:�μi(g) + 1��μ− ji(g) + 1�
.
Case 2: j ∈ Ni(g). Now g ji = 1 link creates a cycle. The effect on f (g + ji) is
smaller than that of a link to a player outside of Ni(g) who has the same in-reach. This
is because some of the information that player j shares with the players who reach him
is redundant. Figure 14 shows this with an example. In the example, player A has a
reaches player C through player B. If player A links to player C, player C now reaches
both A and B, and hence μC increases by 2. μB, however, increases by 1 only, as player
B already observes player C. In other words, some of the information given to player B
is redundant.40
The simple heuristic of choosing the player with the maximum in-reach approxi-
mates well the more complicated rule which would calculate f (g+ ji) for every possi-
ble partner j and pick the partner with the highest value of f (g + ji).
1. When Ni(g) = �, f (g + ji) monotonically increases in j’s in-reach. In this case,
rule 2 maximises f (g + ji).
2. When Ni(g) �= � and no player with maximum in-reach is in the Ni(g) set, rule 2
maximises f (g + ji).
40If Ni(g) is a line, when player i creates a link to a player j ∈ Ni(g), the first player in the i→g j path, call
him k, experiences an increase in μk(g) of 1, the second player an increase of 2, and so on.. until we to get
to player j, who gets an increase in μ j(g) of μ− ji(g) + 1. Thus we can express f (g + ji) as
f (g + i j) =μ− ji+1∑
n=1
n
=(μ− ji + 1)(μ− ji + 2)
2(15)
If Ni(g) is a tree, this expression would become more complicated.
51

Figure 14: Effect of a g ji link
A
��F
��
B
��E C
D(a) Example
A
��
F
��
B
��E C
D(b) Links creates no cycle
A
��F
��
B
��E C
D(c) Links creates cycle
3. When Ni(g) �= � and at least some of the players in the set of individuals with
maximum in-reach are in Ni(g), rule 2 sometimes fails to maximise f (g + ji).
The latter occurs when a link to a player outside of Ni(g) who does not have
maximum in-reach has a larger effect on f (g+ ji) than a link to a player in Ni(g)
with maximum in-reach. Rule 2 would suggest the wrong partner here.
To minimise the likelihood of the third scenario, we formulate rule 2 in terms of
μ− ji(g), as opposed to μ− ji(g). That is, we do not consider player i in the count of
player j’s in-reach. This only penalises players in Ni(g), and makes it less likely that
rule 2 selects them when players outside of Ni(g) with a higher potential impact on
f (g + ji) are available.
52
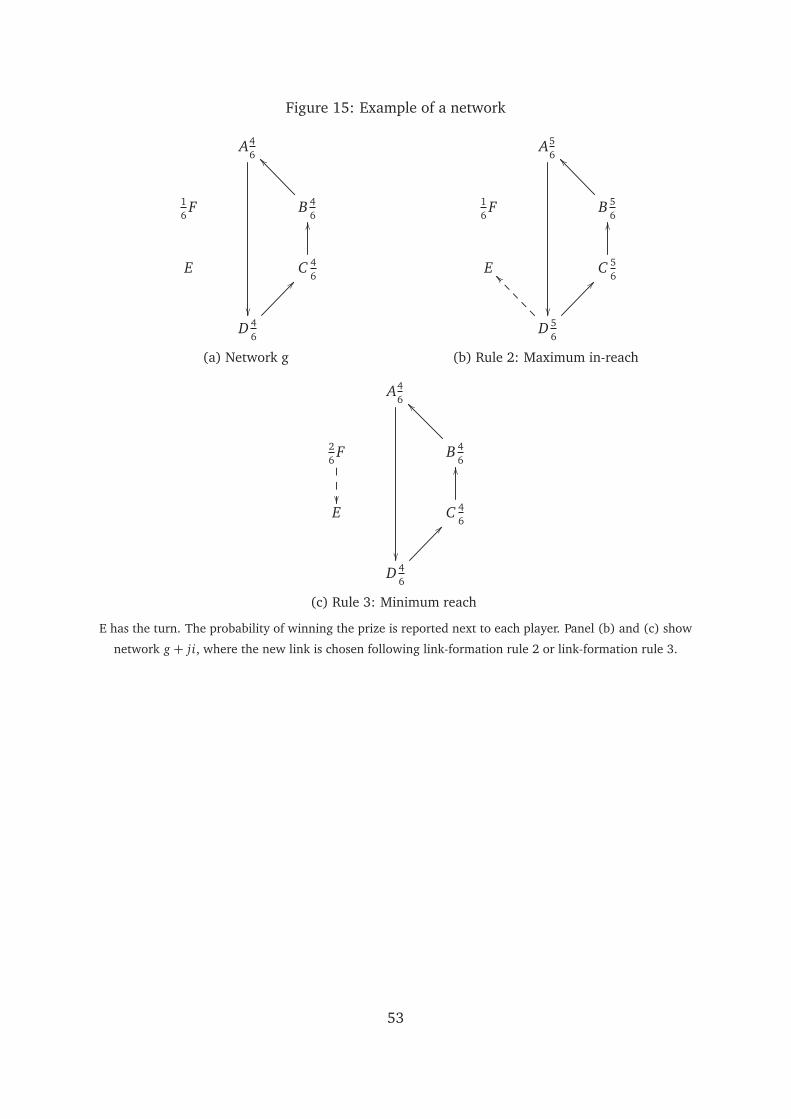
Figure 15: Example of a network
A46
��
16F B 4
6
��
E C 46
��
D 46
��
(a) Network g
A56
��
16F B 5
6
��
E �� C 56
��
D 56
��
(b) Rule 2: Maximum in-reach
A46
��
26F B 4
6
��
E��
C 46
��
D 46
��
(c) Rule 3: Minimum reach
E has the turn. The probability of winning the prize is reported next to each player. Panel (b) and (c) show
network g + ji, where the new link is chosen following link-formation rule 2 or link-formation rule 3.
53
7.2 Figures
Figure 16: Link formation process with mixed rules
Simulation where rule 3 is played with probability p and rule 2 with probability 1-p. 500 simulation for
each level of p.
Figure 17: Simulated time series of average reach
Each rule is simulated 500 times.
54
Figure 18: Simulated effect of group identity concerns on network structure
(a) Rule 2 (b) Rule 3
Weight 0 simulations show efficiency when all players play rule 2 (panel a) or rule 3 (panel b). Weight 2
simulations show efficiency when players value a link to an in-group player as much as 2 units of in-reach
(panel a) or two units of reach (panel b). We report results summarising 100 simulation for each of the 4
rules.
Figure 19: Cumulative distribution of mistakes in understanding questions
(a) T1 (b) T2
55
Figure 20: Efficiency in no-identity sessions and under rule 1
(a) Histogram (b) Kernel density estimate and means
Figure 21: Overlap in decisions and in choice sets
(a) Best response sets (b) Decisions
56
Figure 22: What explains links that are not consistent with the archetypal rules?
(a) Links to the ‘most popular’ player (b) ‘Reciprocal’ links
The category ‘most popular’ shows the relative frequency of decisions consistent with rule 5 and not
consistent with the ‘efficiency-maximising’ and ‘Rawlsian’ rules. The category ‘reciprocal’ shows relative
frequency of decisions consistent with rule 6 and not consistent with the ‘efficiency-maximising’ and
‘Rawlsian’ rules. Only data for sessions with no knowledge of group identity is shown.
Figure 23: Relative frequency of decisions consistent with the hypothesised rules. Best
Response Sets not fully overlapping
(a) T1 (b) T2
T1 sessions: rounds in which the set of individuals with maximum reach is not perfectly overlapping with
the set of individuals with minimum in-reach. T2 sessions: rounds in which the set of individuals with
maximum in-reach is not perfectly overlapping with the set of individuals with minimum reach.
57
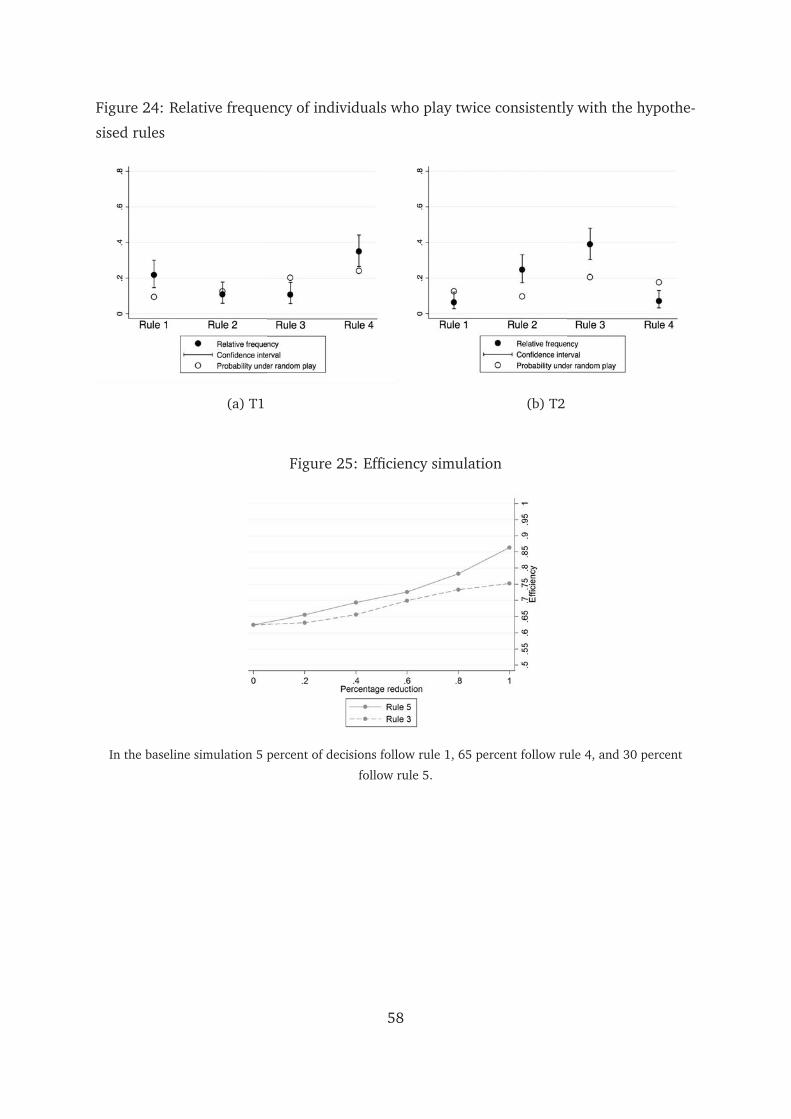
Figure 24: Relative frequency of individuals who play twice consistently with the hypothe-
sised rules
(a) T1 (b) T2
Figure 25: Efficiency simulation
In the baseline simulation 5 percent of decisions follow rule 1, 65 percent follow rule 4, and 30 percent
follow rule 5.
58
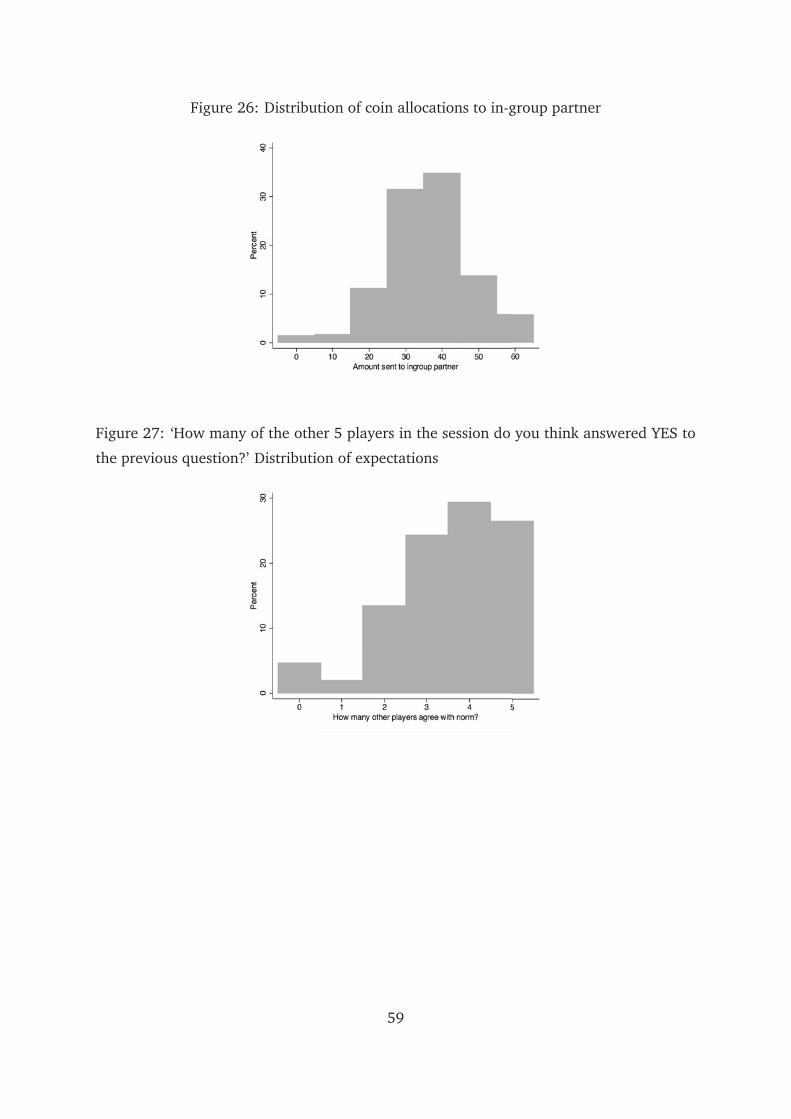
Figure 26: Distribution of coin allocations to in-group partner
Figure 27: ‘How many of the other 5 players in the session do you think answered YES to
the previous question?’ Distribution of expectations
59
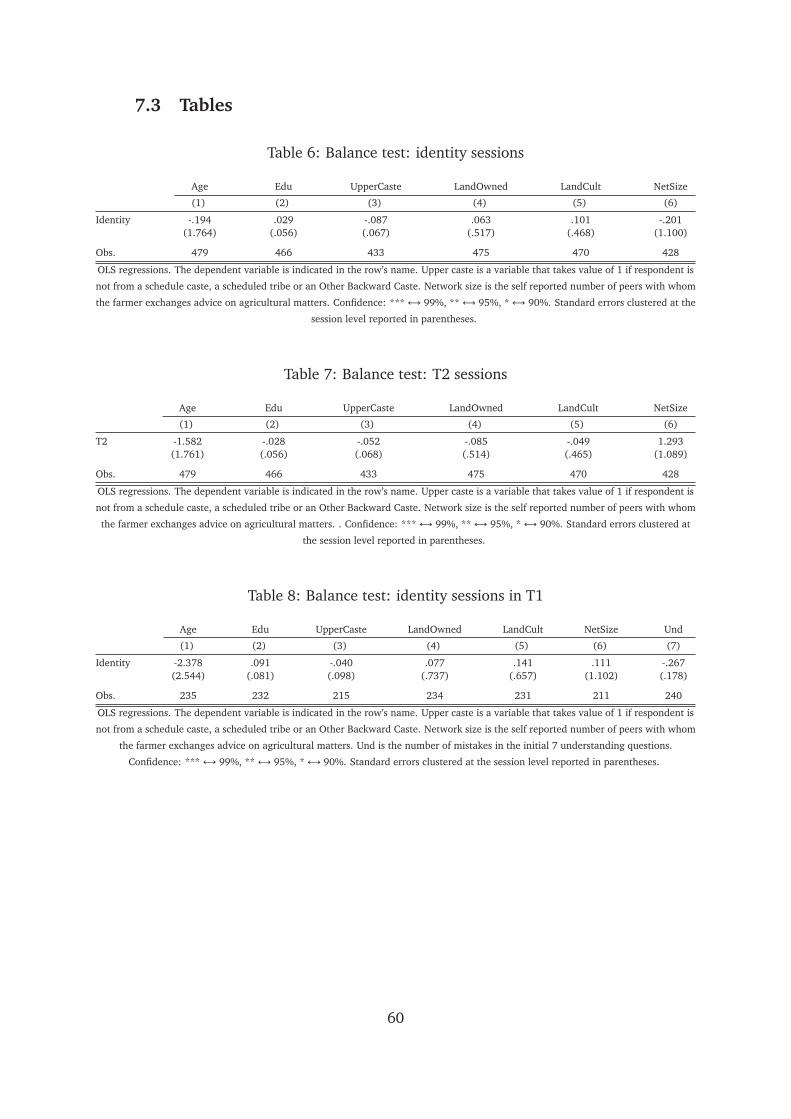
7.3 Tables
Table 6: Balance test: identity sessions
Age Edu UpperCaste LandOwned LandCult NetSize
(1) (2) (3) (4) (5) (6)
Identity -.194 .029 -.087 .063 .101 -.201(1.764) (.056) (.067) (.517) (.468) (1.100)
Obs. 479 466 433 475 470 428
OLS regressions. The dependent variable is indicated in the row’s name. Upper caste is a variable that takes value of 1 if respondent is
not from a schedule caste, a scheduled tribe or an Other Backward Caste. Network size is the self reported number of peers with whom
the farmer exchanges advice on agricultural matters. Confidence: ***↔ 99%, **↔ 95%, *↔ 90%. Standard errors clustered at the
session level reported in parentheses.
Table 7: Balance test: T2 sessions
Age Edu UpperCaste LandOwned LandCult NetSize
(1) (2) (3) (4) (5) (6)
T2 -1.582 -.028 -.052 -.085 -.049 1.293(1.761) (.056) (.068) (.514) (.465) (1.089)
Obs. 479 466 433 475 470 428
OLS regressions. The dependent variable is indicated in the row’s name. Upper caste is a variable that takes value of 1 if respondent is
not from a schedule caste, a scheduled tribe or an Other Backward Caste. Network size is the self reported number of peers with whom
the farmer exchanges advice on agricultural matters. . Confidence: ***↔ 99%, **↔ 95%, *↔ 90%. Standard errors clustered at
the session level reported in parentheses.
Table 8: Balance test: identity sessions in T1
Age Edu UpperCaste LandOwned LandCult NetSize Und
(1) (2) (3) (4) (5) (6) (7)
Identity -2.378 .091 -.040 .077 .141 .111 -.267(2.544) (.081) (.098) (.737) (.657) (1.102) (.178)
Obs. 235 232 215 234 231 211 240
OLS regressions. The dependent variable is indicated in the row’s name. Upper caste is a variable that takes value of 1 if respondent is
not from a schedule caste, a scheduled tribe or an Other Backward Caste. Network size is the self reported number of peers with whom
the farmer exchanges advice on agricultural matters. Und is the number of mistakes in the initial 7 understanding questions.
Confidence: ***↔ 99%, **↔ 95%, *↔ 90%. Standard errors clustered at the session level reported in parentheses.
60
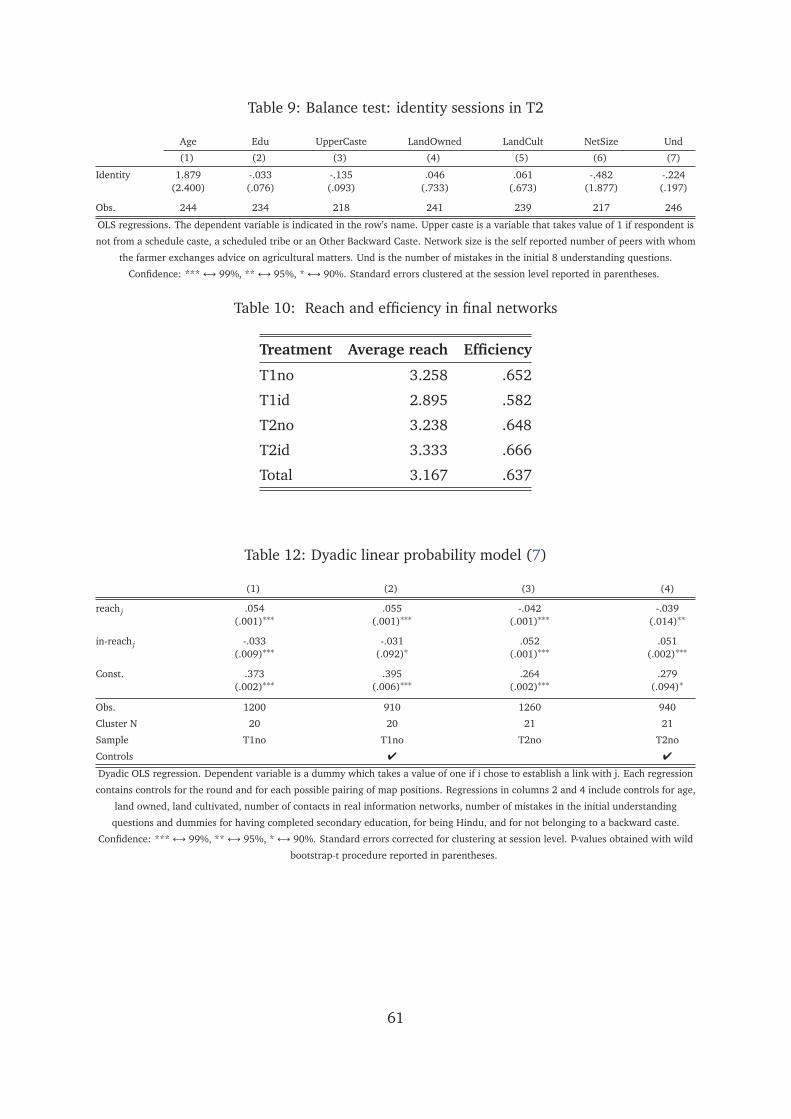
Table 9: Balance test: identity sessions in T2
Age Edu UpperCaste LandOwned LandCult NetSize Und
(1) (2) (3) (4) (5) (6) (7)
Identity 1.879 -.033 -.135 .046 .061 -.482 -.224(2.400) (.076) (.093) (.733) (.673) (1.877) (.197)
Obs. 244 234 218 241 239 217 246
OLS regressions. The dependent variable is indicated in the row’s name. Upper caste is a variable that takes value of 1 if respondent is
not from a schedule caste, a scheduled tribe or an Other Backward Caste. Network size is the self reported number of peers with whom
the farmer exchanges advice on agricultural matters. Und is the number of mistakes in the initial 8 understanding questions.
Confidence: ***↔ 99%, **↔ 95%, *↔ 90%. Standard errors clustered at the session level reported in parentheses.
Table 10: Reach and efficiency in final networks
Treatment Average reach Efficiency
T1no 3.258 .652
T1id 2.895 .582
T2no 3.238 .648
T2id 3.333 .666
Total 3.167 .637
Table 12: Dyadic linear probability model (7)
(1) (2) (3) (4)
reach j .054 .055 -.042 -.039(.001)∗∗∗ (.001)∗∗∗ (.001)∗∗∗ (.014)∗∗
in-reach j -.033 -.031 .052 .051(.009)∗∗∗ (.092)∗ (.001)∗∗∗ (.002)∗∗∗
Const. .373 .395 .264 .279(.002)∗∗∗ (.006)∗∗∗ (.002)∗∗∗ (.094)∗
Obs. 1200 910 1260 940
Cluster N 20 20 21 21
Sample T1no T1no T2no T2no
Controls � �
Dyadic OLS regression. Dependent variable is a dummy which takes a value of one if i chose to establish a link with j. Each regression
contains controls for the round and for each possible pairing of map positions. Regressions in columns 2 and 4 include controls for age,
land owned, land cultivated, number of contacts in real information networks, number of mistakes in the initial understanding
questions and dummies for having completed secondary education, for being Hindu, and for not belonging to a backward caste.
Confidence: ***↔ 99%, **↔ 95%, *↔ 90%. Standard errors corrected for clustering at session level. P-values obtained with wild
bootstrap-t procedure reported in parentheses.
61
Table 11: Summary statistics of allocation, expectations and norms
Variable Obs Mean Std. Dev. Min Max
Amount allocated to in-group partner 483 36.066 11.659 0 60
In-group bias in allocation 483 .542 .499 0 1
Agrees with norm of homophily 483 .571 .495 0 1
No. other players expected to agree with the norm 478 3.513 1.309 0 5
Expects last link to be an in-group link 402 .385 .487 0 1‘Amount allocated to in-group partner’ is the number of Rupees, out of 60, allocated to the in-group partner in the initial allocation
task. ‘In-group bias in allocation’ is a dummy equal to 1 if the player has allocated more than half of the endowment to the in-group
partner in the allocation task. ‘Agrees with norm of homophily’ is a dummy equal to 1 if the player answered yes to the question ‘In the
link formation game you have just played, do you think a player should only link to a peer of his own group?’. ‘No. other players
expected to agree with the norm’ is the answer to the question ‘How many of the other 5 players in the session do you think answered
YES to the previous question?’. There is 1 missing value. We also set to missing answers that are greater than 5. ‘Expects last link to be
an in-group link’ is a dummy equal to 1 if the respondent expects the player with the last turn choose an in-group link. This variable
excludes the 81 players who have the last turn in the session.
Table 13: Dyadic linear probability model (7)
(1) (2)
max reach j .121(.012)∗∗
min in-reach j -.0004(.931)
max in-reach j .122(.022)∗∗
min reach j .059(.202)
Reciprocali j -.093 -.010(.006)∗∗∗ (.399)
Most popular j -.031 -.011(.308) (.685)
Const. .402 .225(.001)∗∗∗ (.036)∗∗
Obs. 910 940
Sample T1no T2no
Cluster N 20 21
Controls � �
Dyadic OLS regression. Dependent variable is a dummy which takes a value of one if i chose to establish a link with j. Each regression
contains controls for the round and for each possible pairing of map positions. Confidence: ***↔ 99%, **↔ 95%, *↔ 90%.
Standard errors corrected for clustering at session level. P-values obtained with wild bootstrap-t procedure reported in parentheses.
Panel b reports the F statistics (and p value in parenthesis) for a Wald test of the equality of coefficients.
62

Table 14: Linear probability model (8): in-group links
T1 T2
Identity session .117 .046(.055)∗∗ (.056)
Const. .282 .268(.037)∗∗∗ (.033)∗∗∗
Obs. 438 447
Sample T1 T2
Cluster N 40 41
Linear Probability Model. Dependent variable takes the value of 1 if link d in session s is towards an in-group partner. First turn, first
round decisions are dropped. Confidence: ***↔ 99%, **↔ 95%, *↔ 90%. Standard errors clustered at the session level reported
in parentheses.
Table 15: Linear probability model (8): efficiency-minded links
T1 T2
Identity session -.0003 -.080(.065) (.062)
Const. .473 .519(.044)∗∗∗ (.045)∗∗∗
Obs. 438 447
Sample T1 T2
Cluster N 40 41
Linear Probability Model. Dependent variable takes the value of 1 if link d in session s is towards a partner with the maximum
out-degree (in T1) and maximum in-degree (in T2). First turn, first round decisions are dropped. Confidence: ***↔ 99%, **↔95%, *↔ 90%. Standard errors clustered at the session level reported in parentheses.
Table 16: Linear probability model (8): Rawlsian links
T1 T2
Identity session -.013 -.038(.055) (.055)
Const. .600 .649(.033)∗∗∗ (.036)∗∗∗
Obs. 438 447
Sample T1 T2
Cluster N 40 41
Linear Probability Model. Dependent variable takes the value of 1 if link d in session s is towards a partner with the minimum
in-degree (in T1) and minimum out-degree (in T2). First turn, first round decisions are dropped. Confidence: ***↔ 99%, **↔ 95%,
*↔ 90%. Standard errors clustered at the session level reported in parentheses.
63
Table 17: Linear probability model (8): in-group links
Restricted sample
T1 T2
Identity session .139 .053(.066)∗∗ (.079)
Const. .298 .242(.048)∗∗∗ (.051)∗∗∗
Obs. 207 215
Sample T1 T2
Cluster N 40 41
Linear Probability Model. Dependent variable takes the value of 1 if link d in session s is towards an in-group partner. Sample
restricted to ‘efficiency-minded’ links. First turn, first round decisions are dropped. Confidence: ***↔ 99%, **↔ 95%, *↔ 90%.
Standard errors clustered at the session level reported in parentheses.
Table 18: Linear probability model (9): in-group links T1 treatment
(1) (2) (3) (4)
Identity sessions .095 .133 -.014 .191(.073) (.077)∗ (.115) (.073)∗∗∗
Bias in allocation taski .002(.084)
Biasi* Identity sessions .044(.124)
Homophily Normi .055(.080)
Normi*Identity sessions -.027(.097)
Homophily norm expectationi -.014(.024)
Norm expectationi*Identity sessions .040(.032)
Ingroup link expectationi .074(.072)
Link expectationi*Identity sessions -.133(.107)
Obs. 438 437 435 371
Sample T1 T1 T1 T1
Cluster N 40 40 40 40
Linear Probability Model. Dependent variable takes the value of 1 if link d in session s is towards an in-group partner. “Bias in
allocation task" is a dummy equal to one if the player has allocated more than half of the dictator endowment to the in-group partner.
“Homophily norm" is a dummy equal to one if the player has agreed with the statement of the norm of homophily. “Homophily norm
expectation" captures the number of other players that the individual expects to agree with the norm of homophily. “in-group link
expectation" is a dummy equal to one if the player expects the last player to choose an in-group link. First turn, first round decisions
are dropped. Confidence: ***↔ 99%, **↔ 95%, *↔ 90%. Standard errors clustered at the session level reported in parentheses.
64
Table 19: Linear probability model (9): in-group links T2 treatment
(1) (2) (3) (4)
Identity sessions .014 .001 -.080 .024(.080) (.073) (.133) (.060)
Bias in allocation taski -.015(.074)
Biasi*Identity sessions .054(.111)
Homophily normi -.011(.082)
Normi*Identity sessions .083(.103)
Homophily norm expectationi -.032(.021)
Norm expectationi*Identity sessions .034(.040)
Ingroup link expectationi .018(.064)
Link expectationi*Identity sessions .178(.100)∗
Obs. 447 447 440 371
Sample T2 T2 T2 T2
Cluster N 41 41 41 41
Linear Probability Model. Dependent variable takes the value of 1 if link d in session s is towards an in-group partner. “Bias in
allocation task" is a dummy equal to one if the player has allocated more than half of the dictator endowment to the in-group partner.
“Homophily norm" is a dummy equal to one if the player has agreed with the statement of the norm of homophily. “Homophily norm
expectation" captures the number of other players that the individual expects to agree with the norm of homophily. “in-group link
expectation" is a dummy equal to one if the player expects the last player to choose an in-group link. First turn, first round decisions
are dropped. Confidence: ***↔ 99%, **↔ 95%, *↔ 90%. Standard errors clustered at the session level reported in parentheses.
Table 20: Linear probability model: understanding in T1
Rule 1 Rule 4 Reciprocal Most Popular Ingroup
(1) (2) (3) (4) (5)
Identity sessions -.008 -.030 -.086 .120 .105(.065) (.069) (.043)∗∗ (.052)∗∗ (.085)
Understandingi* Identity sessions=0 .016 -.003 -.035 .032 -.010(.034) (.041) (.023) (.029) (.034)
Understandingi* Identity sessions=1 .031 .017 .027 -.043 -.009(.026) (.029) (.017) (.024)∗ (.034)
Const. .491 .633 .153 .363 .304(.053)∗∗∗ (.057)∗∗∗ (.039)∗∗∗ (.037)∗∗∗ (.062)∗∗∗
Obs. 478 478 478 478 478
Sample T1 T1 T1 T1 T1
Culster N. 40 40 40 40 40
Linear Probability Model. Dependent variable takes the value of 1 if a link is consistent with the link-formation rule indicated in the
heading. Confidence: ***↔ 99%, **↔ 95%, *↔ 90%. Standard errors clustered at the session level reported in parentheses.
65
Table 21: Linear probability model: understanding in T2
Rule 2 Rule 3 Reciprocal Most Popular Ingroup
(1) (2) (3) (4) (5)
Identity sessions -.072 -.030 -.004 -.001 .053(.059) (.051) (.031) (.041) (.055)
Understandingi* Identity sessions=0 .0009 .023 .017 -.022 .008(.036) (.034) (.019) (.029) (.031)
Understandingi*Identity sessions=1 .042 .024 -.010 .007 .031(.040) (.029) (.018) (.024) (.041)
Const. .559 .675 .088 .417 .264(.044)∗∗∗ (.035)∗∗∗ (.023)∗∗∗ (.028)∗∗∗ (.032)∗∗∗
Obs. 488 488 488 488 488
Sample T2 T2 T2 T2 T2
Cluster N 41 41 41 41 41
Linear Probability Model. Dependent variable takes the value of 1 if a link is consistent with the link-formation rule indicated in the
heading. Confidence: ***↔ 99%, **↔ 95%, *↔ 90%. Standard errors clustered at the session level reported in parentheses.
66