CAMPAIGN FINANCE REGULATION IN AUSTRALIA: defender of democracy or protector of parties
139
CAMPAIGN FINANCE REGULATION IN AUSTRALIA: defender of democracy or protector of parties MATTHEW KEOGH November 2003 A thesis submitted in accordance with the requirements of the degree of Bachelor of Arts (Honours) in Politics at the University of Notre Dame Australia
Transcript of CAMPAIGN FINANCE REGULATION IN AUSTRALIA: defender of democracy or protector of parties

CAMPAIGN FINANCE REGULATION IN AUSTRALIA: defender of democracy or protector of parties
MATTHEW KEOGH
November 2003
A thesis submitted in accordance with the requirements of the degree of Bachelor of Arts (Honours) in Politics at the University of Notre Dame Australia

Declaration I, Matthew James Keogh, declare this dissertation to be the result of my own research
containing as its main content work that has not been submitted for a degree at any
other tertiary institution.
MATTHEW KEOGH
Dated:

i
For Buddy
Acknowledgements None of this research, study or thesis would have been possible without the help,
dedication, commitment and support of a large number of people. Firstly, my family
(the Keogh Klan) and close friends (Bud and the Gang) who have had to put up with
me this year and also provided me with much needed distractions.
To the Honours Group, my supervisor, Dr Bob, and the staff at the School of Arts and
Letters, thanks for your support and encouragement, the prodding along and
assistance in changing this from an idea into something more tangible and not too
unwieldy.
I must also thank the staff at the MO, the EO and AMT for supporting me on this
project and giving me the flexibility to work and complete this study. Thanks must
also go to my Housemate and Househusband for their support in the concluding
months and for putting up with living with me and my “I have to get it done” attitude.
Finally, thank you to the staff at the Australian Electoral Commission for their time
and can-do attitude in allowing me to access data for this research and to those that
helped with the proofing.
Thank you to you all!

ii
Abstract An important part of examining the vigour of the Australian version of liberal
democracy is examining the regime that regulates campaign finance in Australia. To
do this we must understand the nature of Australian liberal democracy and the
campaign finance regulatory regime. This study examines the relationship between
money and votes in recent (1993-2001) Australian federal elections as well as the use
of trust funds and litigation and their effects on liberal democracy in Australia. From
this examination an assessment is made as to the wellbeing of Australian liberal
democracy and recommendations are then made regarding how to make the
Australian campaign finance regulatory regime in Australia more democratic.

iii
Contents
ABSTRACT............................................................................................................. ii LIST OF FIGURES................................................................................................... v
CHAPTER ONE: THE AUSTRALIAN REGIME................................................ 1 INTRODUCTION ..................................................................................................... 1 THE AUSTRALIAN DEMOCRACY............................................................................ 2
Liberalism ......................................................................................................... 3 Democracy ........................................................................................................ 5 Liberal Democracy ............................................................................................ 8
THE PROBLEM .................................................................................................... 10 THE AUSTRALIAN CAMPAIGN FINANCE REGULATORY REGIME......................... 13
Registered Political Parties ............................................................................. 17 Associated Entities........................................................................................... 19 Candidates and Senate Groups ........................................................................ 20 Publishers and Broadcasters ........................................................................... 21 Third Parties ................................................................................................... 22
CHAPTER TWO: MONEY AND VOTES .......................................................... 24 INTRODUCTION ................................................................................................... 24 PROPOSITION ...................................................................................................... 26 REVIEW OF THE LITERATURE ............................................................................. 27
Outline ............................................................................................................ 27 United States .......................................................................................................... 30 United Kingdom..................................................................................................... 32 Canada ................................................................................................................... 35 New South Wales, Australia ................................................................................... 36
Analysis ........................................................................................................... 39 METHODS............................................................................................................ 40
Other Methodologies ....................................................................................... 40 United States .......................................................................................................... 41 United Kingdom..................................................................................................... 42 Canada ................................................................................................................... 51 New South Wales, Australia ................................................................................... 52
Differences ...................................................................................................... 55 Methodology for this research ......................................................................... 57 This Research .................................................................................................. 61
RESULTS ............................................................................................................. 64 CONCLUSIONS ..................................................................................................... 71
CHAPTER THREE: LITIGATION AND DEFINITIONS................................. 73 BACKGROUND ..................................................................................................... 73 THE FUND AND THE LEGAL ACTION ................................................................... 74 ISSUES ................................................................................................................. 76 CONCLUSIONS ..................................................................................................... 83
CHAPTER FOUR: CONCLUSIONS................................................................... 84 DEMOCRACY AND CAMPAIGN FINANCE .............................................................. 84 MONEY, VOTES AND DEMOCRACY ..................................................................... 85
iv
A NEW THEATRE OF BATTLE ............................................................................. 87 PROFESSIONALISATION....................................................................................... 88 RECOMMENDATIONS........................................................................................... 89
Australian Electoral Commission..................................................................... 89 Inclusion of Definitions .......................................................................................... 90 Further Control of Donations .................................................................................. 91 Anonymous Donations ........................................................................................... 92
Gerritsen ......................................................................................................... 93 Expenditure Limits ................................................................................................. 93 Mass Media Usage.................................................................................................. 94
My Recommendations...................................................................................... 95 Further Disclosure .................................................................................................. 95 Associated Entities ................................................................................................. 97 Regularity............................................................................................................... 98 Regulatory Power ................................................................................................. 101
CONCLUSIONS ....................................................................................................102 APPENDIX A: EXPENDITURE AND VOTE DATA........................................106 APPENDIX B: RECEIPT AND EXPENDITURE DATA..................................110 APPENDIX C: DECLARED DONATION AND EXPENDITURE DATA .......112 APPENDIX D: RECEIPT AND VOTE DATA...................................................114 APPENDIX E: DECLARED DONATION AND VOTE DATA ........................118 BIBLIOGRAPHY ................................................................................................120 INDEX ..................................................................................................................130

v
List of Figures FIGURE 1: EXPENDITURE V FIRST PREFERENCE VOTE - 1993 ..................................... 66 FIGURE 2: EXPENDITURE V FIRST PREFERENCE VOTE - 1996 ..................................... 66 FIGURE 3: EXPENDITURE V FIRST PREFERENCE VOTE - 1998 ..................................... 66 FIGURE 4: EXPENDITURE V FIRST PREFERENCE VOTE - 2001 ..................................... 67 FIGURE 5: EXPENDITURE V TOTAL RECEIPTS (INCOME) - 1993.................................. 67 FIGURE 6: EXPENDITURE V TOTAL RECEIPTS (INCOME) - 1996.................................. 67 FIGURE 7: EXPENDITURE V TOTAL RECEIPTS (INCOME) - 1998.................................. 68 FIGURE 8: EXPENDITURE V TOTAL RECEIPTS (INCOME) - 2001.................................. 68 FIGURE 9: TOTAL RECEIPTS (INCOME) V TWO-PARTY PREFERRED VOTES - 1993........ 69 FIGURE 10: TOTAL RECEIPTS (INCOME) V TWO-PARTY PREFERRED VOTES - 1998...... 69 FIGURE 11: TOTAL RECEIPTS (INCOME) V TWO-PARTY PREFERRED VOTES - 1998...... 70 FIGURE 12: TOTAL RECEIPTS (INCOME) V TWO-PARTY PREFERRED VOTES - 2001...... 70
1
Chapter One: the Australian regime
Introduction
It is disturbing that an attitude of ‘close enough is good enough’ is taken towards
democracy in Australia, in particular in regards to the regulation of campaign finance.
The area of political campaign finance is one that, while topical in the United States,
is not a common area of discussion in Australia. Political parties and political
candidates require donations to fund the costs of running their campaigns at election
time. This reality has an impact upon the nature of democracy. The way in which
such funds are raised, from whom they are raised, how and on what they are spent, the
effect of such expenditure and the level of transparency during each of these
processes all have different consequences for democracy.
This paper will explore campaign finance in Australia at a federal level to evaluate its
place in Australian democracy. One of the most fundamental components of a
western liberal democracy is the holding of free, fair and regular elections. This is the
case in Australia. Hand-in-hand with this is campaign finance. In Australia, as in
other western liberal democracies such as the United States, the United Kingdom and
Canada, the financing of election campaigns is regulated. Electoral campaign finance
is regulated so that the system of government remains democratic. This thesis will
examine how effective the campaign finance regulatory regime that exists at a federal
level in Australia is at maintaining the integrity of democracy in Australia.

2
In order to conduct this analysis this thesis will examine aspects of the Australian
federal democracy and campaign finance regime. Firstly, this chapter will examine
the nature of liberal democracy in Australia. In particular, what the requirements are
for a system to be considered democratic in Australia and how these can be used to
test the campaign finance regime in Australia. This chapter will also briefly outline
how the Australian campaign finance regulatory regime currently operates.
Secondly, Chapter Two of this paper will examine the existence of relationships
between money raised and spent by political parties during election campaigns and
the performance of those parties at the ballot box. Chapter Three will examine the
existence and use of funds outside of the regulatory regime in Australia and the use of
litigation as a political tool.
Finally, Chapter Four contains an assessment of the campaign finance regime in
Australia in relation to how it fares in the Australian democracy. Chapter Four also
contains recommendations on how the regulatory regime in Australia can be
improved at a federal level to make the system more democratic.
The Australian Democracy
The Australian political system is a liberal democracy.1 A liberal democracy is a
political system in which democratically based institutions of governance exist along
1 Parkin 2002, 'Liberal Democracy', in Summers, Woodland &Parkin (eds), Government, Politics, Power and Policy in Australia, 7th edn, Longman, Frenchs Forest, pp. 297-321. p 297.

3
side liberal conceptions of individual rights and economics.2 While featuring some
recognisably Australian elements, Australia’s liberal democracy is a product of the
centuries-old liberal democratic tradition which has its origins in Europe and in
Australia’s case the United Kingdom in particular.3 In order to understand liberal
democracy in Australia it is important to understand the concepts of liberalism and
democracy and place these in an Australian context.
Liberalism
Politically, liberalism denotes a family of positions centred on constitutional
democracy, the rule of law, political and intellectual freedom, toleration of religion,
morals and lifestyle, opposition to racial and sexual discrimination, and respect for the
rights of the individual.4 One of the deepest commitments of liberal political
philosophy is to individualism. Liberals see the individual as the centre of the
political, social and economic world. Liberals believe that it is vitally important that
individuals be able to direct their own lives. This concept is known as liberty, which
comes from the Roman word ‘libertas’.5 Many liberals hold that the most serious
threat to individual autonomy has always come from political authoritarianism, which
is in opposition to the concept of democracy.6 Liberalism contends that the individual
should be free to hold and express independent opinions.7
2 Parkin. p 297. 3 Parkin. p 298. 4 McCloskey 1986, 'Mill's Liberalism', in Muschamp (ed.), Political Thinkers, MacMillan, Crows Nest, pp. 177-93. p 183; Mill 1991, On Liberty, In Focus, Routledge, London. p 23-5; Waldron 1998, 'Liberalism', in Craig (ed.), Routledge Encylcopedia of Philosophy, Routledge, London. 5 Maddox 2000, Australian Democracy in Theory and Practice, 4th edn, Longman, Sydney. p 566. 6 Maddox. p 566. 7 Maddox. p 567.

4
Another important part of liberal individualism is equality.8 Equality deals with the
principle that all persons should be treated as having equal moral worth.9 This means,
in the context of a liberal democracy, the authorisation of government needs to be
through regular, free and fair elections in conditions of electoral equality. However,
the idea of equality needs to be embedded within a broader theory of politics and
society in order to be given a specific content. No political theory aims at equality
pure and simple. It aims instead at specific types of equality thought to be morally or
socially important.10 This concept gives rise to limiting rights, like that of voting to
those over eighteen years of age.11
In Australia, the major parties come from a liberal tradition. As Graham Maddox puts
it, “the Australian system falls more into Duverger’s ‘bourgeois’ classification12,
where the two party groupings line up at opposite ends of a liberal spectrum: the
Labor Party generally represents a radical-liberal point of view, while the Liberal and
National Parties might be styled conservative-liberal.”13
Anthony Parkin suggests that the liberal tradition asserts the significance of a number
of factors within a liberal democracy. Parkin lists these factors as being: the rule of
law; a strong private sector economy and a general acceptance of basic individual
liberties and rights.14
8 McCloskey. p 189; Waldron. 9 McCloskey. p 189; Wearle 1998, 'Equality', in Craig (ed.), Routledge Encyclopedia of Philosophy, Routledge, London. 10 Wearle. 11 This concept is developed below under the heading Democracy 12 cf. Duverger 1964, Political Parties, 3rd edn, Methuen, London. 13 Maddox. p 298. 14 Parkin. p 303.

5
Democracy
The word ‘democracy’ comes from the Greek words ‘demos’ meaning ‘the people’
and ‘cracy’ meaning ‘rule’.15 Literally, the word ‘democracy’ means ‘the people
rule’. This is referred to now as government by the people.16 Democracy is a system
that is viewed by many different people in many different ways. John Locke wrote
that no rational creature when free would “put himself into subjection to another for
his own harm”.17 Nearly one hundred years later again, Jean-Jacques Rousseau
referred to a legitimate democratic state as a state created by individuals volunteering
some of their rights but who continue to participate in the decision making of the
state, so that public policies continue to represent the ‘general will’.18
Democracy was most famously described, however, by Abraham Lincoln, who
described it as “government of the people, by the people, for the people”.19 This
description is very useful for coming to an understanding of democracy generally and
how it works in Australia. “Government of the people” refers to the fact that the
Government governs over ‘the people’. However, it is the other two descriptors that
illustrate how there can be many different types of democracy. The phrase
“government by the people” raises the question of how do the people govern?
15 The word ‘cracy’ is a derivative of ‘curcia’ meaning ‘power’ – McCloskey. p 34. 16 Heywood 1992, Political Ideologies: an introduction, MacMillan, London. p 269. 17 Locke 1971, 'The True End of Civil Government (Second Treatise on Civil Government)', in Barker (ed.), Social Contract, Oxford University Press, London. p 97. para. 164 18 Parkin. p 301; Rousseau (1762) 1993, The Social Contract and Discourses, Everyman, London. p 191-3. 19 Heywood. p 272; Lincoln 1863, The Gettysburg Address, Associated Press, Gettysburg, 19 November 1863, Speech.

6
Simplistically, do the people govern directly, as in ancient Greek city-states, or do
they govern indirectly, through elected representatives?20
This question then leads to another question. Who are ‘the people’? Clearly, ‘the
people’ does not mean everyone who lives in a society. The answer to this question
has varied considerably over time. During the twentieth century there has been a
broad movement from the term only including land owning males through to today
when any citizen over the age of 18, male or female can vote and participate in
society.21 This relates back to the discussion above regarding equality and how it
relates to what a society regards as morally or socially important. As recently as the
early twentieth century the right to vote was limited to those hwo owned land. This
tempering of political equality was based on the view that only those who were
affected by the actions of government should be able to decide who made up the
government. As the main actions of the state related to private property only those
who owned property needed to be able to vote. However, society’s views of political
equality and the role of government have changed and so with them the right of
people to vote has expanded but is still limited to a degree.
In dealing with the concept of ‘the people’ democratic theorists stress the importance
of political equality. It is here that there is a strong link between liberalism and
democracy. In a democracy there is the idea that all individuals possess the right of
political participation and the interests of one citizen are no more important than those
20 Heywood. p 272-3. 21 Heywood. p 273-4.

7
of another. This means that democracy requires political power to be divided equally
amongst ‘the people’.22
In resolving the question of “government by the people,” during modern times, in
western developed nations, liberal democracy has developed as government by
consent. Simply, this means the development of indirect or representative democracy.
The basic requirements of such a democracy are universal adult suffrage, i.e. that all
of ‘the people’ can vote; a secret ballot, to maintain the freedom of ‘the people’; and
party competition, i.e. that ‘the people’ are presented with a choice of whom they
choose to govern themselves.23 This concept is also known as pluralism.
In such a system, in order to achieve political equality, the following conditions must
be met:24
1. all adult citizens must be entitled to stand for election regardless of race,
colour, sex or religion;
2. all citizens must possess a vote, i.e. universal adult suffrage;
3. no one must possess more than a single vote, each should have an equal voice
at election time;
4. all votes must be of equal value, requiring as close to equal size electorates as
possible.
In the Australian context Maddox argues that democracy should rest on a
constitutional order; it should have a ‘responsible’ executive; there should be an
opposition to the executive; that all its institutions should uphold the ideals of 22 Heywood. p 275. 23 Heywood. p 277. 24 Heywood. p 265.

8
democracy – justice, liberty, equality and community – and finally, the system should
operate in a pluralistic, participatory society.25
Parkin suggests that the democratic tradition asserts the freedom of people to engage
in political activity; a state that derives its legitimacy from the authorisation of
representative political institutions and provision of basic welfare and education.26
This last section, “the provision of basic welfare and education,” can be seen as an
Australian version of the meaning of democracy.
Liberal Democracy
Liberal democracy is the form of democracy that has developed in the western world
and is a system that determines government based on electoral success. In such
systems great attention is paid to the rules that govern the electoral process, in order to
ensure that it is ‘democratic’. 27 In order to do this, elections must be regular, so that
those elected will be responsible to ‘the people’; free, enabling voters to make up their
own minds and express their views without intimidation or corruption (this is usually
done through the use of a secret ballot); and fair, being conducted so that all ‘the
people’ have equal power.28 Schumpeter calls this an “institutional arrangement for
arriving at political decisions in which individuals acquire power to decide by means
of a competitive struggle for the people’s vote”.29
25 Maddox. p 113-4. 26 Parkin. p 303. 27 Heywood. p 281. 28 Heywood. p 281-2. 29 Heywood. ; Schumpeter (1942) 1994, Capitalism, Socialism and Democracy, Routledge, London. p 269.

9
In bringing the concepts of liberalism and democracy together in the Australian
context we find competing interests. As Emy and Hughes point out, “the ‘liberal’ and
the ‘democratic’ aspects of liberal democracy do not fit neatly together: there is a
certain tension between them.”30 This is the case in many liberal democracies. These
tensions are well illustrated in this study and in the study of electoral campaign
finance in general. The regulation of campaign finance must find a middle ground
between the competing interests of the individual liberty and freedom of speech of
liberalism and the equality of power required by democracy.
Liberal democracies are not immune from inequalities of power and influence arising
from the way interests are mobilised and the institutional structures of political,
economic and social life within liberal democracies are likely to favour some interest
over others.31 It is because of this that the regimes set up to regulate campaign
finance in liberal democracies can be such contentious issues. As put by Rolf
Gerritsen, “to what extent are private interests legitimately allowed to use financial
means to advance their point of view?”32 Phrased another way, to what extent can
private interests be restrained from using their financial resources to advance their
point of view? These questions come from a liberalist grounding. The importance of
such questions is highlighted by Kim Beazley’s claim that “a serious imbalance in
campaign funding threatens the health of democracy.”33 Such contention between
30 Parkin. p 303. 31 Parkin. p 315. 32 Gerritsen 1995, Election Funding Disclosure and Australian Politics: debunking some myths, 21, Information and Research Service, Parliament House Library, Commonwealth of Australia, Canberra. p Introduction. 33 Commonwealth of Australia Debates, 2 November 1983. p 2213.

10
liberal and democratic views requires compromise, and as can be seen below in the
outline of the Australian regime, compromise can lead to problems.
The Problem
The question that arises in assessing liberal democracy in Australia is whether the
campaign finance regime that exists in Australia is democratic? Elections must be
regular, free, fair and competitive. However, how free are elections if in the lead up
to Election Day ‘the people’ are constantly bombarded with the messages of only a
few of the possible alternatives? How competitive are the elections if during the
campaign only a few of the parties and candidates competing in the election are in a
position to compete on a level paying field while the others are in no way
competitive? How fair is it if some parties and candidates exert an unequal influence
on the process by their use of money as donations, as campaign expenditure and in
legal action?
In order to determine whether the campaign finance regime in Australia is democratic
these questions must be answered in relation to the way in which the regime operates.
In order to do this the components of the regime must be assessed against what their
effect is on the following factors in their make up of the liberal democratic system in
Australia: equality; freedom; competitiveness; fairness. Essentially, do the
components promote or subvert the equality of ‘the people’, do the components create
or hinder the free operation of the democracy, do the components promote or hinder
the competitiveness of the parties and candidates involved in the system, do the

11
components make the system fairer or more unfair? In the main this will be answered
by examining how money affects the outcomes of elections, particularly, as campaign
expenditure is seen as a good guide to the intensity of a campaign.34
Intertwined with these issues is the increasing professionalisation of politics in
Australia. This follows on the heels, in fact has been learnt from, a similar process in
the United States.35 In a way professionalisation can be a bit of a ‘chicken and egg’
problem as it can be seen in one of two ways. The first is that as a result of the
increasing amounts of money becoming involved in politics there is a tendency for
this to allow for the use of ‘political professionals’ such as pollsters, consultants,
media advisers and the list goes on. Alternatively, the professionalisation of politics
can be seen from the view that in the never ending search to get ‘an edge’ on one’s
political opponents political parties and candidates have turned to ever more complex,
professional and expensive means of running campaigns. In order to do this,
campaigns need to employ professional campaigners and spend more money. In this
view, therefore, the professionalisation of politics leads to increased costs and hence
the requirement for more money in politics.
I support the latter hypothesis and this is supported by a number of researchers as
shown in Chapter Two, such as Peter Kobrack. Such professionalisation can also
create problems for democracy, as professionalisation leads to the creation of
‘political mercenaries’; professional politicians such as pollsters, policy advisors and
campaign directors who have no affinity to any ideology and will work for the highest 34 Johnston, MacAllister & Pattie 1999, 'The Funding of Constituency Party General Election Campaigns in Great Britain', Environment and Planning C: Government and Policy, vol. 17, pp. 391-409. p 403. 35 Kobrak 2002, Cozy Politics: political parties, campaign finance, and compromised governance, Lynne Rienner Publishers, Boulder. p 110-1.

12
bidder. The existence of such political mercenaries and their use help to undermine
the liberal democratic requirement of pluralism because instead of people contesting
each other with their differing views, some groups are now able to employ
professional politicians with no affiliation whatsoever to their viewpoint to contest
these arguments for them. This can then give certain ideas, that are no better than
others the appearance of being better because of the way they are portrayed by the
professionals that help sell them.
Adamany and Agree suggest four rationales that are associated with electoral
regulation to provide a framework for evaluating the effectiveness and fairness of any
democracy’s electoral system. Their four rationales are:36
1. enable a capitalist nation with an unequal social distribution of economic
resources to establish a condition of equality in financing politics (i.e.
equality);
2. create a system that will endow all significant points of view with sufficient
resources to present their case reasonably effectively to the bulk of citizens
(i.e. support pluralism);
3. ensure that each significant political interest in society is provided with
economic resources in such a way as to recognise newly emerging socio-
economic interests and not disproportionately reward decaying or declining
interests; and
4. free political parties and their representatives from undesirable or
disproportionate influence or pressure from donors in their election activities
(i.e. transparency).
36 Adamany & Agree 1975, Political Money, Johns Hopkins University Press, Baltimore. p 8-12.

13
While this method of analysis is useful to a degree it does not fit cleanly with the
analysis in this paper. In examining the campaign finance regime in Australia, this
analysis therefore, makes reference to the following three criteria:
1. the effect on the equality of political power in Australia;
2. the transparency of election financing in Australia; and
3. the effect on pluralism in Australia.
In order to make such an assessment it is first crucial that we have a basic
understanding of how the regulatory regime operates.
The Australian Campaign Finance Regulatory Regime
The current electoral funding and disclosure regulatory regime in Australia was
introduced by the Hawke Labor Government in 1984.37 The scheme that was
introduced was the product of investigations by Parliamentary committees and
independent Commissions instigated by the Fraser Liberal Government in response to
the outdated and unworkable regime that existed until 1980.38 Since its inception in
1984 the regime has remained fairly constant in structure and objective with minor
but consistent changes over the years. This section outlines the current campaign
finance regulatory regime in Australia. In the course of this research I have made use
of data from earlier elections where the regime operated slightly differently. These
differences are outlined as they occur.
37 Gerritsen. Part 2 38 Gerritsen. ; Harders 1981, Inquiry into Disclosure of Electoral Expenditure, Canberra. Part 2

14
One of the main features of the regime in Australia is that it gives formal recognition
(for the first time when it was introduced) to political parties. Some say that the
introduction of the regime even entrenched political parties as part of the electoral
system in Australia.39 This is one of the key ways in which the Australian regime is
different to those operating in other nations. While in countries like the US campaign
finance regulation is based on candidates and other organisations, in Australia the
regime is centred on parties. This is a product of the party-centric political system in
Australia, in particular the pre-eminence of the Australian Labor Party, the Liberal
Party of Australia and the Nationals (formerly the National Party of Australia). The
position of parties in Australia, some argue, has resulted in a reduction in the
autonomy of candidates and made it harder for independent candidates to succeed.40
The regime has two main aims: to increase transparency in the Australian electoral
process and to introduce a public funding system for Australian federal elections.41
Under the public funding system any candidate or senate group that receives more
than four percent (4%) of the vote in an election will receive public funding. The
public funding is paid after the election and is calculated by multiplying the number
of votes received by the public funding rate at the time of the election. The public
funding rate is calculated every six months and is increased at the rate of inflation. At
the time of the 2001 election the public funding rate was $1.79026 per vote.42
39 Commonwealth of Australia. p 2509ff. (Hall, Steele) 40 Commonwealth of Australia. p 2509ff. (Hall, Steele) 41 Gerritsen. Part 2 42 Commonwealth of Australia 2001b, Funding and Disclosure Handbook for Candidates, Australian Government Printing Service, Canberra. p 9.

15
Until 1995 public funding was only available as a reimbursement for expenditure
made by parties during the election. This meant that if a party spent less than the
amount of public funding it would be entitled to it only received public funding to
cover its declared expenses.43 From the 1996 election onwards public funding
entitlements were paid to parties based only on the vote they received, regardless of
their expenditure. The result of this was that minor parties, with very small resources,
which won a reasonable proportion of the vote in an election, would get their full
entitlement thereby allowing them to grow as a party.44 This gave more accurate
affect to the intention of public funding, which was to create a more level playing
field for elections to be fought on between the parties.
The regime is based on the appointment of agents by political parties, candidates and
Senate groups. All returns and public funding payments are made by and to these
agents. As mentioned above, public funding is paid based on the number of first
preference votes received. In the case of endorsed candidates this funding is paid to
the agent of their political party. In the case of individual candidates and non-
endorsed Senate Group funding is paid to the agent for that candidate or senate
group.45
To make the Australian electoral system more transparent a disclosure regime was
also introduced.46 This regime required that political parties, associated entities (of
political parties), candidates, publishers, broadcasters and third parties make returns to
43 Commonwealth of Australia 1997, Funding and Disclosure Report Following the Federal Election Held On 2 March 1996, Canberra. p 3. 44 Commonwealth of Australia 2000a, Funding and Disclosure Report following the Federal Election held on 3 October 1998, Australian Electoral Commission, Canberra. p 4-6. 45 Commonwealth of Australia Funding and Disclosure Handbook for Candidates. p 1,10. 46 Australia. House of Representatives Debates, 2 November 1983. p 2213; Gerritsen. Part 2

16
the Australian Electoral Commission (AEC) after each election. The AEC then
makes these returns available to the public after a period of time. For parties and
associated entities the returns must list their total expenses, income and debts and are
submitted annually. Candidate and Third Party returns are based on election cycles.
Third Parties must also lodge annual returns. Each group is also required to list
individual transactions over a certain threshold. Broadcasters and publishers must
declare any advertisements or promotions that they prepare, publish or broadcast for a
candidate or party during an election and third parties must declare any donations they
make to a party or candidate if the total of their donations is over a particular
threshold. In 1992 changes were made so that political parties and associated entities
were required to make annual returns to the AEC instead of returns just for
elections.47
These disclosure requirements are outlined in more detail below, along with a
description of each entity.
47 Commonwealth of Australia 1995, Election Funding and Financial Disclosure Report for the election for the House of Representatives and the Senate held on 13 March 1993, Canberra. ; Commonwealth of Australia 1996, Funding and Disclosure Handbook for Political Parties, Australian Government Printing Service, Canberra. ; Commonwealth of Australia 2000d, Funding and Disclosure Handbook for Associated Entities, Australian Government Printing Service, Canberra. ; Commonwealth of Australia 2000b, Funding and Disclosure Handbook for Third Parties, Australian Government Printing Service, Canberra. ; Commonwealth of Australia 2001c, Funding and Disclosure Handbook for Broadcasters and Publishers, Australian Goverment Printing Service, Canberra. ; Commonwealth of Australia Funding and Disclosure Handbook for Candidates. p 1-2.

17
Registered Political Parties48
A registered political party is one that is registered with the AEC. This does not
include parties that are registered at a State or Territory level. State and Territory
branches of parties must register with the AEC separately in order to receive public
funding. Political parties that are not registered with the AEC are regarded as third
parties.
Registered political parties are required to lodge annual (financial year) returns with
the AEC, which set out the total of all receipts, payments and debts for the party.
Registered political parties are subject to compliance investigations by the AEC and
their returns must also set out the names and address of person or organisations of
sources of receipts of $1,500 or more or who is owed $1,500 or more by the party.
The type of receipt that we are most interested in for the purposes of this research is
donations.
However, when determining if someone has donated $1,500 or more to the party, only
donations of over $1,500 need to be counted. For example where a person makes two
donations over the $1,500 threshold amount and one under the threshold amount the
donor must be declared on the political parties return to the AEC, but only for the first
two amounts (which were over $1,500). Likewise, if a person makes a number of
donations each of less than $1,500 that donor does not have to be declared, even if the
total of the donations was more than $1,500. This means that donors can make
unlimited donations of $1,499 to political parties and the parties do not need to
48 Commonwealth of Australia 2000c, Funding and Disclosure Handbook for Political Parties, Australian Government Printing Service, Canberra.

18
declare these donors on their returns to the AEC. Donors to political parties are also
required to make disclosure returns to the AEC, these are covered below under Third
Parties. Anonymous donations of $1,000 or more to a registered political party are
forfeited to the Commonwealth Government.
Another difficulty associated with the disclosure of donations is the way in which
receipts are categorised on the returns to the AEC by the political parties. Receipts
can be designated into one of three categories, however, the use of these is optional
and a party organisation may elect to designate all of their receipts as ‘unspecified
receipts’. This makes it very difficult to even determine the declared donors to a party
as not all parties separately identify donations from other receipts. The three different
categories are ‘donations or gift’, ‘public funding’ and ‘other receipts’. These
categories are defined in Table 1.49
Category Definition Donation or Gift The giving of any property from one person to
another (including money) in exchange for an amount of money or other property not of equal value to the value of the property given. For example, money or a service for which no payment or an inadequate payment is received. It includes both cash and non-cash (gift-in-kind) donations. Commercial transactions are not treated as donations.
Public Funding Funding made available to political parties and candidates from State and Commonwealth electoral bodies, under relevant legislation.
Other Receipts Amounts received by a party or associated entity that do not meet the legislative definition of 'gift'. Examples include membership fees, interest on investments, dividends on shares and rent received on properties owned.
Table 1: Categories of Receipts
49 Commonwealth of Australia AEC Funding and Disclosure - Glossary, Australian Electoral Commission, <http://search.aec.gov.au/annualreturns/arwGlossary.htm>.

19
In general the main political parties have reported their receipts under the above
categories from the 1998 election onwards, indeed a number have from the 1993
election.
Associated Entities50
An associated entity is an organisation that is either controlled by or operates wholly
or to a significant extent for the benefit of one or more political parties. Therefore, an
associated entity can be an organisation that is independent of a party but still benefits
it. Examples of associated entities are companies that hold assets for political parties,
such as John Curtin House Ltd, and trust funds and fundraising organisations, such as
the 500 Club (WA).51
Associated entities must also lodge annual (financial year) disclosure returns to the
AEC. These returns cover the same information as those for registered political
parties. Associated entities are also subject to audits by officers of the AEC.
In addition, where a payment has been made to a registered political party out of
income earned from capital or the associated entity, the details of all persons or
organisations who deposited capital in trust with the associated entity from 16 June
1995 onwards must be disclosed. Donors to associated entities may also be deemed
under the Act to have made their donations direct to a registered party and therefore 50 Commonwealth of Australia Funding and Disclosure Handbook for Associated Entities. 51 About the 500 Club, 500 Club, viewed 12 October 2003 <http://www.500club.com.au/info/about/about500.htm>. ; Crabb 2003, 'Ethanol Company Doubled Donation before Fuel Ruling', The Age, 4 February 2003, p. 4.

20
also to have disclosure obligations. Anonymous donations of $1,000 or more are also
forfeited to the Commonwealth Government.
Candidates and Senate Groups52
A candidate is a candidate for election in a Division of the House of Representatives
or for the Senate. Individual candidates and Senate Groups are required to lodge
election returns to the AEC. These returns cover the period starting from the 31st day
after the previous election for current Senators and Members of Parliament, from the
day of endorsement for candidates endorsed by a political party and from the day of
declaration of intent to be a candidate for unendorsed candidates. The period of
disclosure ends on the 30th day after the election being contested.
Candidate and Senate Group returns must set out the total of all receipts and certain
categories of campaign expenditure. The categories of campaign expenditure include
broadcasting advertisements, publishing advertisements, displaying advertisements at
a theatre or other place of entertainment, costs of campaign material, direct mailing
and research. These returns must also declare the names and address of all receipts of
$200 or more to the same candidate, or $1,000 or more to the same Senate Group. In
addition, anonymous donations of $200 or more to a candidate or $1,000 or more to a
Senate Group are forfeited to the Commonwealth Government. Unlike in the United
52 Commonwealth of Australia Funding and Disclosure Handbook for Candidates.
21
Kingdom, there are no maximum spending limits on campaign expenditure by
candidates.53
Publishers and Broadcasters54
A publisher is any person or organisation who publishes a newspaper, magazine or
other periodical, whether published for sale or distribution without charge. A
broadcaster is any holder of a license within the meaning of the Broadcasting Services
Act 1992 other than a rebroadcasting or retransmission license as well as the ABC and
SBS.
Broadcasters and publishers are required to lodge returns listing the details of
electoral advertisements during the election period. The election period is the period
from the issue of the writ to polling day. Electoral advertisements include campaign
advertisements for political parties and candidates and advertisements placed by
persons commenting on the election but are not seeking election themselves. In
addition, advertisements placed by Government agencies must also be disclosed.
Publishers, however, do not need to lodge a return if their charges for electoral
advertisements did not total more than $1,000.
53 Commonwealth of Australia Funding and Disclosure Handbook for Candidates. ; Johnston, MacAllister & Pattie. p 392. 54 Commonwealth of Australia Funding and Disclosure Handbook for Broadcasters and Publishers.

22
Third Parties55
The term third parties refers to a person or organisation other than a registered
political party, candidate, Senate Group, associated entity, broadcaster or publisher
who is under an obligation to make a disclosure return to the AEC. Such people and
organisations include those that donate $1,500 or more in total to the same political
party or associated entity during one financial year.
Annual (financial year) returns must be made setting out donations made, directly or
indirectly (through an associated entity or other third party), to a registered political
party where those donations total $1,500 or more. Returns are also required to
disclose donations received by a third party of $1,000 or more that is then used in
whole or in part to make a donation to one or more political parties.
An election return (a return covering the election period as mentioned above under
Candidates and Senate Groups) must also be lodged where donations are made by a
person or organisation totalling $200 or more to the same candidate in an election or
$1,000 or more to an organisation specified in the Gazette by the AEC. Such
organisations are generally associated entities. An election return must also be lodged
where a person or organisation incurs $200 or more of electoral expenditure or where
$1,000 or more of donations received from a person are used in whole or in part to
incur $1,000 or more on expenditure for political purposes.
55 Commonwealth of Australia Funding and Disclosure Handbook for Third Parties.

23
One of the clearest observations from the above disclosure rules is that there are many
discrepancies in what has to be reported by each type of person or organisation and
therefore, also many potential gaps. This also means that it is hard to gather
completely accurate information from any one return. The effect of this is that while
information is disclosed, it is very hard to find and cross check. This is one way in
which the disclosure regime is ineffective in protecting Australian democracy. The
specifics of this are outlined in later chapters.

24
Chapter Two: money and votes Introduction
This chapter examines the relationship between the financing of political campaigns
by political parties and the outcomes of elections. Is there only so much a
candidate/party can do in a campaign, or is it the case that the more a candidate/party
spends on an election campaign the more likely they will be to win that election?
This will be explored by examining previous research in this area of study in other
jurisdictions and using similar theories to examine the effects of money on elections
in Australia.
It is now generally assumed, particularly in the United States that funds spent on
election campaigns translate automatically into votes.56 The United States Supreme
Court supported the view that money influences elections in its ruling that the concept
of government restricting the speech of some elements to enhance the relative voice
of others by limiting candidate campaign expenditure was “foreign to the First
Amendment”.57 Frank Sorauf states that this was akin to the court elevating the
proposition that “money talks” from popular saying to a principle of constitutional
law.58
56 Dharmapala 2002, 'Campaign War Chests, Entry Deterrence, and Voter Rationality', Economics and Politics, vol. 14, no. 3, pp. 325-50. p 326. 57 Quoted in Corrado, Mann, Ortiz, Potter & Sorauf (eds) 1997, Campaign Finance Reform: a source book, The Brookings Institution, Washington, DC. p 64 58 Sorauf 1992, Inside Campaign Finance: myths and realities, Yale University Press, New Haven. p 9-11.

25
The above statement illustrates that campaign finance is playing a growing role in the
systems of Government in western liberal democracies. The concern raised is what
effect does this have on our democracies? Does money distort the Australian
democracy?
Most research in this area has been conducted in other Anglo-American jurisdictions
and is outlined below. The finding of the majority of this research is that election
spending contributes to the success of candidates and parties in legislative elections.59
The main difference between recent research to that of this analysis is that most
research in this area has concentrated on local election spending at the constituency,
divisional, riding or electorate level and not looked at spending by parties as a whole
or on a national or state level as this research does. The main reason for this is that
such local data is available in other jurisdictions. However, because the campaign
finance regulatory regime in place in Australia only required disclosure returns from
each registered political party national, state or territory organisation and not from
each campaign such data is not available for Australian federal elections.
This chapter also discusses the methodological differences of this research to that of
other previous research in this area. Finally, this chapter will outline the results of the
examination of the relationships outlined below and how this impacts upon
democracy in Australia.
59 Carty & Eagles 1999, 'Do Local Campaigns Matter? Campaign spending, the local canvass and party support in Canada', Electoral Studies, vol. 18, pp. 69-87. p 72. This point is illustrated below under “Review of the Literature”.

26
Proposition
It is clear from the coverage of the research below that in recent years a small but still
substantial amount of research has been completed examining the relationship
between party spending on campaigns and the outcomes of those elections. What is
also clear is that very little research has been done in this area in Australia. The main
reason for this is due to different reporting requirements in Australia, as compared to
the United States and the United Kingdom. In Australia expenditure figures are not
available on a division by division basis in Australia.
Recent Royal Commissions in Canada, New Zealand, Queensland, Tasmania and
Western Australia have recognised the potential for excessive electoral expenditure to
have an unfair influence on voters.60 Despite these findings, a significant gap exists in
Anglo-American electoral research on the relationship between campaign expenditure
and election outcomes as a result of the lack of any further research in Australia in
this area. The area of campaign finance is an important area for public policy
discussion and debate as it reaches to the crux of the effectiveness of the democratic
system. For this reason it is important that the gap be filled so that proper information
is available on a national level concerning such relationships. The research in this
paper will begin to fill this gap.
This paper tests the theories expressed in the research conducted in other jurisdictions,
specifically, that the more a party spends on an election campaign the more votes it
wins. This research will focus on the federal elections in 1993, 1996, 1998 and 2001 60 Western Australia 1995, Specified Matters: 20 & 21 - Disclosure of Political Donations, Disclosure of Electoral Expenditure and Other Matters of Political Finance, 7, Commission on Government, Perth. p 11.

27
and ask the question, does campaign expenditure, as well as the donations to
campaigns that make up that expenditure, affect the outcome of elections?
Review of the Literature
Outline
The literature increasingly supports the view that campaign spending by parties or
candidates impacts on votes gained.61 It is important however, to understand the
public policy framework that this research is part of before reviewing its results. The
regulation of the use of money in election campaigns has been the topic of national
commissions in the United States, Canada, Australia, Great Britain and the former
West Germany.62 The main issue of contention in the area of campaign finance is that
donors who contribute to political parties do so in the expectation that their payment
will yield some form of return.63 Green and Farrows put together many examples of
such behaviour from information gleaned from the Ralph Nader Congress Project in
the 1960s and 1970s.64 More recently, Peter Kobrack has written about what he sees
as compromised governance. For example, a person seeking a favourable
61 Cf. Forrest, Johnston & Pattie 1999, 'The effectiveness of constituency campaign spending in Australian state elections....' Environment and Planning A, vol. 31, pp. 1119-28. p 1119; Green & Krasno 1988, 'Salvation for the Spendthrift Incumbent: the Effects of Campaign Spending in House Elections', American Journal of Political Science, vol. 32, pp. 884-907. ; Johnston & Pattie 1995, 'The Impact of Spending on Party Constituency Campaigns in Recent British General Elections', Party Politics, vol. 1, no. 2, pp. 261-73. 62 Alexander (ed.) 1989, Comparative Political Finance in the 1980s, Cambridge University Press, Cambridge. p 1 63 Fisher 2002, Party Finance: is more reform still needed?, IPPR. p 2. 64 Green, Fallows & Zwick 1972, Who Runs Congress? The President, big business or you?, Ralph Nader Congress Project, Bantam Books, New York.
28
appointment as a director of the European Bank of Reconstruction and Development
wrote to the Clinton administration. He was then contacted by a fund-raiser and told
“If you want to talk to the President, make a donation of $25,000, and you’ll get
invited to the White House.”65 It is from actions such as this and many others like it
on smaller and larger scales, that contributions to campaign funds can create at the
very least potential, if not actual, conflicts of interest. Such conflicts undermine
democracy.66
The reason that candidates and parties are in an endless search for more and more
money is due to the ever increasing costs of running campaigns. Anthony King states
that in the United States this is a result of the high “vulnerability equation,” consisting
of “frequent general elections plus primaries plus lack of party cover plus the need to
raise large amounts in campaign funds [which] equals an unusually high degree of
electoral exposure”.67 For incumbents the pressure to raise funds comes partially
from the knowledge that a large, early war chest68 can discourage a serious primary or
general election challenge.69 However, Kobrack also outlines other reasons for the
high costs of running a campaign, stating that acquisition of votes by use of political
technology instead of volunteer power is a capital-intensive exercise. Fisher points
65 Kuntz 1997, 'DNC Invites for Clinton Coffees Perked Along with $25,000 Price Tag, a Businessman Recalls', Wall Street Journal, 8 October 1997, p. A24. cited in Kobrak. p 121. 66 Johnston, MacAllister & Pattie 'The Funding of Constituency Party General Election Campaigns in Great Britain'. p 391. 67 King 1997, Running Scared, Free Press, New York. p 42-3. – emphasis from original. 68 “war chest”: money saved from previous election campaigns, the salient feature being any funds raised by an incumbent prior to the entry decision of a potential challenger: Dharmapala. p 325. 69 Dharmapala. ; Kobrak. p 110.

29
out that money is important because it buys what is not or cannot be volunteered.70
This situation was clearly enunciated by the Barbeau Committee in Canada: 71
The elector cannot make a sensible choice unless he is well informed. Keeping the electorate well informed means using the great communications media: radio, television, newspapers, printed flysheets, billboards etc. If these media are to be used well, parties and candidates must spend very considerable sums of money. The sums are essential expenses in informing the public.
The professionalisation of politics has brought with it the use of consultants for
advertising, strategy and management, research aids, media experts and pollster, all of
which cost money.72 Such rising costs occur in elections all over the world. The Joint
Standing Committee on Electoral Matters of the Australian Parliament noted that in
1984 $7.1 million was spent on political advertising via broadcasters and publishers.
By the 1987 federal election this figure had risen to $14.9 million, an increase of
112%, comprising an increase of 137% in the cost of television and radio
advertising.73 Rolf Gerritsen states that “election costs … have roughly tripled over
the last decade [1985-1995].”74
Kim Beazely stated when introducing the 1984 campaign finance reforms into
Parliament, that “[t]he sky-rocketing costs of modern election campaigns have
threatened to create a situation where national government can be delivered to the
party with the best bagman”.75 Many would regard it undemocratic if a political party
were to win government because of the volume of its message rather than the content 70 Fisher 1999, 'Party Expenditure and Electoral Prospects: a national level analysis of Britain', Electoral Studies, vol. 18, no. 4, pp. 519-32. p 519. 71Barbeau Committee 1966, Report on Canadian Political Finance. – quoted in Ewing 1992, Money, Politics and Law, Clarendon Press, Oxford. p 47. 72 Kobrak. p 110-1. 73 Commonwealth of Australia 1989, Who Pays the Piper Calls the Tune - minimising the risks of funding political campaigns: inquiry into the conduct of the 1987 federal election and 1988 referendums, 4, Parliament of the Commonwealth of Australia, Canberra. p 86. 74 Gerritsen. Introduction 75 Commonwealth of Australia Debates. p 2213.

30
of its message.76 Following from the research above, a small but growing body of
research has formed in order to examine whether the application of the two basic
campaign resources – money and people (usually volunteers) – affects the outcome of
elections in a systematic way. The main jurisdictions in which such research has been
undertaken are the United States, the United Kingdom and Canada.
United States
One of the first pieces of research in this area was conducted by Gary Jacobson in the
1970s and 1980s. His research, while acknowledging that spending by candidates
challenging the current House representative was linked to their performance, had a
paradoxical result, which sparked much debate in this area in research. Jacobson
examined the change in vote for candidates in United States House of Representative
elections based on the expenditure of challengers and incumbents. Jacobson found
that the more challengers spent during their campaign the better they performed but
that the more incumbents spent in their re-election campaign, the worse they appeared
to do. He surmised that the reason for this was that incumbents tend to spend heavily
when they are vulnerable and hence more liable to be defeated.77 Jacobson’s research
was followed closely by that of Green and Krasno, who purported that they expected
the political quality of a challenger to exert a positive influence on the challenger’s
vote and bear a positive relationship to challenger expenditures as well as to
76 Ewing 1992, 'The Legal Regulation of Electoral Campaign Financing in Australia: a preliminary study', Western Australia Law Review, vol. 22, pp. 239-56. p 256; Western Australia. p 18. 77 Jacobson 1980, Money in Congressional Elections, Yale University Pres, New Haven.
31
incumbent expenditures.78 They found that once challenger quality was accounted for
in their study (something that they say Jacobson, did not do adequately) incumbent
spending exerts an influence that is “sizable, properly signed, and fairly stable across
different levels of challenger spending”.79 The primary difference between these two
studies was that while Jacobson used a dummy variable (set to either 0 or 1) for
challenger quality, based on whether they had previously held office, Green and
Krasno used a multi-facetted variable (0 to 8), producing a larger variance in
challenger quality, which they say more accurately represented the actual elections.
Green and Krasno, in their rebuttal of Jacobson’s reworking of his earlier work, based
on new election data and a new set of equations,80 compared “yields”, the number of
votes “purchased by challengers and incumbents in each district”.81 In this later
research Green and Krasno point out that incumbents’ are less susceptible to
diminishing returns than challengers. They say this is because challengers, who
typically start the campaign with little name recognition, make early gains and then
confront the more difficult task of getting their message across to the voter.
Incumbents, however, begin the campaign relatively well known, so do not enjoy the
same gains early in the race, but by the same token, do not suffer a drop off in the
productivity of their spending as rapidly.82
78 Green & Krasno 'Salvation for the Spendthrift Incumbent: the Effects of Campaign Spending in House Elections'. p 886. 79 Green & Krasno 'Salvation for the Spendthrift Incumbent: the Effects of Campaign Spending in House Elections'. p 898. 80 Jacobson 1990, 'The Effects of Campaign spending in House Elections: New Evidence for Old Arguments', American Journal of Political Science, vol. 34, pp. 334-62. 81 Green & Krasno 1990, 'Rebuttal to Jacobson's 'New Evidence for Old Arguments'', American Journal of Political Science, vol. 34, pp. 363-72. p 363. 82 Beitz 1984, 'Political Finance in the United States: a survey of research', Ethics, vol. 95, pp. 129-48. ; Green & Krasno 'Rebuttal to Jacobson's 'New Evidence for Old Arguments''. p 365.
32
More recently, Paul Starr stated that the challenger who lost the “money” election had
a slim chance of prevailing in the people’s election. Starr presents data from the
Center for Responsive Politics and Citizen Action that shows that in 1996 the
candidate who raised the most money won 92% of House races and 88% of Senate
races in the United States.83 Kobrack follows Starr’s thesis but adds Jacobson’s
qualification that money is not a guarantee, as large campaign funds can signal that a
candidate is in trouble.84
United Kingdom
Research in this area has also occurred in the United Kingdom. A great deal of the
research in this area points out that little research has looked at the impact of spending
and activity at the local constituency level, but rather at the national level.85 This is
due to the old prevailing view that constituency campaigns have “little success in
changing political attitudes”86 and that “constituency organisation counts for next to
83 Starr 1997, 'Democracy v. Dollar', The American Prospect, vol. 8, no. 31. p 1. 84 Kobrak. p 125. 85 Bogdanor 1982, 'Reflections on British Political Finance', Parliamentary Affairs, vol. 35, pp. 367-80. ; Pinto-Duschinsky 1981, British Political Finance 1830-1980, American Enterprise Institute, Washington, DC. ; United Kindgom. House of Commons. Home Affairs Committee 1993, Funding of Political Parties: minutes of evidence and memorada of evidence. Session 1992-93, Cm 726, HMSO: House of Commons, London. ; United Kindgom. House of Commons. Home Affairs Committee 1994, Funding Political Parties: second report. Session 1993-94, Cm 301, HMSO: House of Commons, London. cited in Johnston & Pattie 'The Impact of Spending on Party Constituency Campaigns in Recent British General Elections'. p 261.; Fisher 1997, Political Parties: financial costs of party organisation and activities, Department of Politics and Modern History, London Guildhall University. cited in Johnston, MacAllister & Pattie 'The Funding of Constituency Party General Election Campaigns in Great Britain'. p 398.; Butler & Kavanagh 1974, The British General Election of February 1974, Macmillan, London. p 201. cited in Carty & Eagles. p 73. and Fisher 'Party Expenditure and Electoral Prospects'. 86 Crewe & Harrop (eds) 1986, Political Communications: the general election campaign of 1983, Cambridge University Press, Cambridge. ; Crewe & Harrop (eds) 1989, Political Communications: the general election campaign of 1987, Cambridge University Press, Cambridge. ; Kavanagh 1970, Constituency Electioneering in Britain, Longman, London. p 87. in Pattie, Johnston & Fieldhouse 1995, 'Winning the Local Vote: the effectiveness of constituency campaign spending in Great Britain, 1983-1992', The American Political Science Review, vol. 89, no. 4, pp. 969-83. at paragraph 8.

33
nothing in the television age”.87 Such national studies are not in line with the research
covered in this thesis. Charles Pattie, Ronald Johnston and Edward Fieldhouse found
in their research that incumbents also perform badly in the United Kingdom but feel
that this is not just due to the “weak-incumbent” problem discussed by Jacobson but
also the fact that nearly all incumbents spend near the legal spending limits in their
campaigns and can therefore, not effectively outspend their challengers if required.
The end result of this was that the more a party spent in its own seats, the worse it did
and the better its rivals performed.88 They also found that spending by non-incumbent
parties in a seat had a significant effect on their election results, in the expected
positive direction, concluding that the more a challenger spends the more votes they
receive and the fewer votes won by their rivals. In general Pattie et al. concluded that
the more a party spends the more votes and seats it wins.89 This research was backed
up by very similar research by Pattie and Ronald Johnston.90
Denver and Hands’ analysis of the 1992 general election in the United Kingdom,
however, found that Conservative Party constituency campaigns had relatively little
effect on the vote but that same was not true of the Labour and Liberal Democrat
campaigns.91 Denver and Hands examined the change in the share of the electorate
won in comparison to the last election between parties in each constituency.92 Their
reason for this, they say, is the starting point for each party: those constituencies in
which parties did poorly at the previous election offered the greatest scope for a local 87 Ivor Crewe, quoted in Denver 1994, Elections and Voting Behaviour in Britian, 2nd edn, Prentice-Hall/Harvester Wheatsheaf, Hemel Hempstead. p 117., cited in Carty & Eagles. p 73. 88 Pattie, Johnston & Fieldhouse. p 976. 89 Pattie, Johnston & Fieldhouse. p 981. 90 Johnston & Pattie 'The Impact of Spending on Party Constituency Campaigns in Recent British General Elections'. p 264. 91 Denver & Hands 1997, 'Challengers, Incumbents and the Impact of Constituency Campaigning in Britain', Electoral Studies, vol. 16, pp. 175-93. p 187. 92 Denver & Hands 'Challengers, Incumbents and the Impact of Constituency Campaigning in Britain'. p 181.

34
campaign to make a positive difference as the opposition parties.93 They found that
Labour and the Liberal Democrats, were far more likely to be in that situation as the
Conservative Party were in government and therefore held the most seats.94
Johnston, Pattie and Ian MacAllister also conducted a similar study to Johnston and
Pattie’s earlier studies, this time focusing on the 1997 general election in Great
Britain. They found that there was a clear impact from constituency spending on the
outcome of the 1997 general election.95 They also found that parties raised and spent
the most where they were likely to campaign most intensively, i.e. in the seats they
held and in the marginal seats where they were the challengers.96 This would seem to
go a long way in explaining why they found that campaigns that spend more are more
likely to win, as it would seem quite logical that the most intense campaigns would be
the most effective. Johnston, MacAllister and Pattie concluded that the amount
parties spent was significantly related to the election outcome: the more a party spent,
the better its performance (especially if it was a challenger) and the poorer the
performance of its opponents.97
In a later study, Justin Fisher conducted a national level analysis of the relationship
between party expenditure and electoral prospects. Fisher’s thesis was that increased
spending capacity provides parties with greater opportunities to promote themselves
to voters and that the exploitation of such opportunities would result in electoral 93 Denver & Hands 'Challengers, Incumbents and the Impact of Constituency Campaigning in Britain'. p 184. 94 Carty & Eagles. p 74; Denver & Hands 'Challengers, Incumbents and the Impact of Constituency Campaigning in Britain'. p 189-91. 95 Johnston, MacAllister & Pattie 'The Funding of Constituency Party General Election Campaigns in Great Britain'. p 402. 96 Johnston, MacAllister & Pattie 'The Funding of Constituency Party General Election Campaigns in Great Britain'. p 403. 97 Johnston, MacAllister & Pattie 'The Funding of Constituency Party General Election Campaigns in Great Britain'. p 404.

35
payoffs.98 Fisher, however, raises the important point that the relationship between
money an electoral popularity may be reciprocal. Thus, there is likely to be a
relationship between how a candidate is likely to perform on election day and how
much they can raise. In turn, the amount of money a candidate can raise will affect
how much they can spend, which may affect how well they perform electorally.99
Fisher indicates that spending at a national level had little demonstrable electoral
impact but that other factors such as the media should also be taken into account.100
He concluded, however, that increased party expenditure can have a positive effect,
but that it is difficult to show on a consistent basis.101 In later work Fisher
acknowledges that it is simplistic at one level to automatically equate increased
spending with increased electoral payoffs as other factors before and during and
election will always play a part in their outcome.102 His explanation for different
findings between constituency and national level spending is that at a constituency
level the types of spending in each election are fairly routine, whereas at a national
level these may change significantly from year to year.103
Canada
The limited research that has been conducted in Canada indicates that local spending
contributes in a variable, but generally positive way to a party’s electoral fortunes.104
Carty and Eagles agree with Denver and Hands’ findings that challenger campaigns
98 Fisher 'Party Expenditure and Electoral Prospects'. p 520. 99 Fisher 'Party Expenditure and Electoral Prospects'. p 521. 100 Fisher 'Party Expenditure and Electoral Prospects'. p 529. 101 Fisher 'Party Expenditure and Electoral Prospects'. p 530. 102 Fisher Party Finance. p 6. 103 Fisher Party Finance. p 8. 104 Carty & Eagles. p 72.

36
can be more effective at improving electoral shares simply because they have more
room for improvement.105 Carty and Eagles conclude that there is a positive
correlation between local campaign spending and activity and votes won. They also
found that such campaign effects are strongest for campaigns of candidates of the
non-governing parties.106
New South Wales, Australia
Very little has been written about the effect of campaign finance on the outcome of
Australian elections. One of the main reasons for this, as mentioned above, is the lack
of appropriate data.107 All the research refers to the work of Ronald Johnston and
Charles Pattie. Essentially, in Australia, due to the operation of the public funding
system, the cyclical nature of investigating local campaign effects that exist where
there is no public funding (i.e. do parties do well locally in terms of their campaign
spending because they campaign effectively, or do they campaign effectively because
they are already strong and have ample resources) does not apply.108
In light of the difficulties in acquiring appropriate information in federal elections
Gary Forrest conducted research examining flow-of-the-vote and campaign spending
based on the 1991 New South Wales state election. This research was based on
previous work Forrest had published in 1991 and 1992 that indicated considerable
105 Carty & Eagles. p 76. 106 Carty & Eagles. p 83. 107 Johnston 2003, Re: Effects of Campaign Spending on Election Outcomes in Australia, Perth, 22 April 2003, Email. 108 Forrest, Johnston & Pattie. p 1123.

37
support for a positive relationship between money and votes.109 Forrest posited that
“the greater the effort put into local campaigning in 1991 by each major party relative
to the other, the more votes will be retained or attracted (flows to) and the fewer will
be lost (flows from).”110 Forrest used an entropy-maximising procedure to estimate
the flow-of-the-vote for each electoral division between 1988 and 1991.111 He found
that for every $1,000 the ALP spent they won them a 0.65% increase in their vote,
which was offset by a 0.23% decrease in their vote for every $1,000 spent by the
Liberal-National Party Coalition.112 In addition, Forrest found that incumbency of
individual seats made no significant impact but that the spending of the Coalition
government was less effective than the spending of the ALP opposition.113 Forrest
did acknowledge however, that local campaign effort is only one of a number of
factors influencing the flow-of-the-vote.114
In 1999 Forrest, Johnston and Pattie, published research into the effectiveness of
constituency based campaigns in New South Wales state elections. This research
followed the methods previously employed by Johnston and Pattie in their research in
the same area in Great Britain. They found that the proposition that the more a party
spends, the greater the votes it wins was generally true but that the strength of the
relationship found in the elections in the early 1980s was not found in elections in the
109 Forrest 1997, 'The Effects of Local Campaign Spending on the Geography of the Flow-of-the-Vote at the 1991 New South Wales State Election', Australian Geographer, vol. 28, no. 2, pp. 229-40. p 230. 110 Forrest 'The Effects of Local Campaign Spending on the Geography of the Flow-of-the-Vote at the 1991 New South Wales State Election'. p 234. 111 Forrest 'The Effects of Local Campaign Spending on the Geography of the Flow-of-the-Vote at the 1991 New South Wales State Election'. p 231. 112 Forrest 'The Effects of Local Campaign Spending on the Geography of the Flow-of-the-Vote at the 1991 New South Wales State Election'. p 234. 113 Forrest 'The Effects of Local Campaign Spending on the Geography of the Flow-of-the-Vote at the 1991 New South Wales State Election'. p 238. 114 Forrest 'The Effects of Local Campaign Spending on the Geography of the Flow-of-the-Vote at the 1991 New South Wales State Election'. p 235.

38
late 1980s and 1990s. They said that this is due to the earlier elections being
‘maintaining’ elections, while the later elections were of a ‘reinstating’ nature.115
Shaun Bowler, David Farrell and Ian McAllister’s research, published in 1996,
examined the effectiveness of local campaigns during the 1993 federal election in
Australia. Bowler, however, used information gathered as part of the Australian
Election study survey as a measure of local campaign effort as opposed to campaign
expenditure.116 Bowler examined five different types of local campaign activity and
found that they fitted into two basic categories of local activity. In estimating the
effect of local activity on the vote Bowler regressed the votes Members of Parliament
(MPs) received in 1993 and the swing that took place in their divisions between the
1990 and 1993 elections for each of the five types of campaign activity. Bowler
found that local constituency work by MPs had a negligible effect on the number of
votes received by MPs.117 Local party work by MPs, on the other hand, influenced
their vote to a considerable degree.118 Bowler found that local campaign effects have
limited influence on electoral outcomes in parliamentary systems because the central
issue at stake is who will form the national government.119
115 Forrest, Johnston & Pattie 'The effectiveness of constituency campaign spending in Australian state elections....' p 1127. 116 Bowler, Farrell & McAllister 1996, 'Constituency campaigning in parliamentary systems with preferential voting: is there a paradox?' Electoral Studies, vol. 15, no. 4, pp. 461-76. p 463. 117 Bowler, Farrell & McAllister. p 464. 118 Bowler, Farrell & McAllister. p 465. 119 Bowler, Farrell & McAllister. p 471.

39
Analysis
Each of the above pieces of research identifies different factors that complicate their
understanding of the operation of money in election campaigns. King refers to the
high “vulnerability equation” that exists in the United States and there are many
references to the ever increasing costs of running campaigns. Jacobson developed the
concept that expenditure has different effects for challengers and incumbents. This
was developed further by Green and Krasno, who further developed how the quality
of the challenger relates to the outcome of elections and the concept of diminishing
returns. Fisher points out that the relationship between money and electoral
performance may be reciprocal with those spending the most money performing the
best in the election but also with those with the most chance of winning raising more
money. Carty and Eagles pointed out that in Parliamentary systems, it is often the
candidates from the party that is in Government that have the qualities of incumbency,
regardless of whether or not they are actually the incumbent in that particular seat.
All of these factors result in the study of electoral campaign finance becoming more
and more complex. In developing a method of research these researchers and myself
attempt to re-simplify this study so that concrete results may be obtained. While the
methods employed by the different researchers are different they have attempted to
account for the factors mentioned above as well as others, such as socio-economic
conditions, ethnicity and support for parties at previous elections, by introducing
different dummy variables into the equations they use to analyse the relationship
between expenditure and electoral performance. These methods are outlined below.

40
Methods
Before explaining the methodology utilised in this research it is useful give a brief
treatment of the methodologies employed in some of the other research in this area
mentioned above. These methodologies can be easily broken up by the jurisdictions
that they have been applied to as the research in each jurisdiction encountered
different problems based on their differing political structures. Following this I will
discuss the key differences between these jurisdictions and Australia on a federal
level. From this discussion I will outline the methodology employed in this research
to examine the relationship between donations, expenditure and votes and the
outcomes of elections.
Other Methodologies
There are four main jurisdictions that have been covered by the research: the United
States, the United Kingdom, Canada and the Australian state of New South Wales.
To a large degree the methodologies employed in each of these jurisdictions has been
largely the same and based on the research done by Jacobson in the 1970s with most
differences based on differing political structures or refinements to Jacobson’s
original formulae.

41
United States
In his original study Jacobson considered there to be four factors that determined the
proportion of the vote a challenger (a candidate running for a US House of
Representatives seat who was not already a member of the House) would receive
(CV). The four factors were the strength of the challenger’s party (CPS), measured
by the proportion of the vote that the candidate of the challenger’s party received in
the district at the previous election; the challenger’s expenditure (CE), in thousands of
dollars; the incumbent’s expenditure (IE), in thousands of dollars and the challenger’s
party (P). In his study, party was represented by a dummy variable of zero for
Republicans and one for Democrats.120 From this Jacobson calculated ordinary least
squares regressions equations in the form (with e as an error term)121:
CV = a + b1CE + b2IE + b3P + b4CPS + e
Green and Krasno found fault in Jacobson’s method, in particular because Jacobson
did not account for challenger quality as a factor that affected the proportion of votes
won by the challenger. Green and Krasno added this to Jacobson’s equation with
challenger quality being a variable with a value of 0 to 8 based on previous roles and
experience.122 Green and Krasno also believed that Jacobson’s methodology was too
rigid as it was linear and therefore was not able to account for the diminishing
marginal returns of a candidate’s expenditure.123
120 Green & Krasno 'Salvation for the Spendthrift Incumbent: the Effects of Campaign Spending in House Elections'. p 885-6. 121 Denver & Hands 'Challengers, Incumbents and the Impact of Constituency Campaigning in Britain'. p 176-7. 122 Green & Krasno 'Salvation for the Spendthrift Incumbent: the Effects of Campaign Spending in House Elections'. p 886. 123 Green & Krasno 'Salvation for the Spendthrift Incumbent: the Effects of Campaign Spending in House Elections'. p 886.
42
United Kingdom
While there has been to some extent a hostile debate between Jacobson and his
supporters and Green and Krasno and their followers, in the UK the methodology for
the study of this area has essentially been set by Charles Pattie and Ronald Johnston.
In their 1995 study of the 1992 general election in the United Kingdom Pattie,
Johnston and Fieldhouse used a series of regression models, with party vote share as
the dependent variable and spending levels as the independent variables. In order to
take into account changes in constituency population sizes and voter participation
rates Pattie et al calculated vote share as a percentage of the local electorate. Also,
due to the existence of spending limits for constituency based campaigns in the UK,
campaign expenditure was also expressed as a percentage of the maximum legal
expenditure limit.124 Pattie et al used an equation for their comparisons consisting of
percentage of the vote (VOTEPC), Conservative Party spending in a constituency at
the election as a percentage of the legal limit (CSnPC); Labor Party spending at the
election as a percentage of the legal limit (LSnPC) and Alliance spending at the
election as a percentage of the legal limit (ASnPC).125
However, Pattie et al did acknowledge that this was just one factor affecting the
percentage of vote won by a party and so took other factors into account also by using
124 Pattie, Johnston & Fieldhouse. p 972-3. 125 Pattie, Johnston & Fieldhouse. p 973.

43
a number of control variables. These variables were based on the data from the last
national census and were as follows for each constituency:126
The proportion of the population in semi and unskilled manual jobs
(SEMI/UNSKILLED)
The proportion of the population employed in the energy industry (MINE)
The proportion of households in properties rented from local government
(COUNCIL); and
The proportion of the population living in households headed by someone
from the New Commonwealth or Pakistan (NCWP)
The use of these variables, claimed Pattie et al, controlled for both the general
geography of voting and for the overall geography in party support between regions.
They then entered all of the above variables into the regression models.127 In their
analysis Pattie et al differed from Jacobson and Green and Krasno by using parties
and the basis of incumbency instead of candidates, this was because in the UK the
majority of voters vote for parties, which are well recognised, not for individual
candidates, who are not easily recognised. On the whole, however, there is a large
amount of overlap between incumbent candidates and incumbent parties.128 The
model that Pattie et al used was as follows:129
SPENDPCt = c + b1Vt-1 + b2Mt-1 + b3SECONDt-1 + b4SPENDR1PCt + b5SPENDR2PCt
126 Pattie, Johnston & Fieldhouse. p 973. 127 Pattie, Johnston & Fieldhouse. p 973-4. 128 Denver & Hands 'Challengers, Incumbents and the Impact of Constituency Campaigning in Britain'. p 177. 129 Pattie, Johnston & Fieldhouse. p 977.

44
where SPENDPCt is the percentage of the legal maximum spent by a party at election
t; Vt-1 is the vote for the party in the seat at the previous election (t-1) as a percentage
of the constituency electorate; Mt-1 is the percentage point difference between the
electorate shares of the party and the winner in the seat (or, where the party won,
between it and the second-place party) at the previous election (t-1) (this value is
always positive); SECONDt-1 is a dummy for the party in second place at the previous
election; SPENDR1PCt is the percentage of the legal limit spent by one rival party at
election t; SPENDR2PCt is the percentage of the legal limit spent by the other rival
party at election t and b1-5 are slope coefficients. SPENDPC was then substituted for
PSP values in the equation below:130
VOTEPC = c + b1PCSP + b2PLSP + b3PASP + b4SEMI/UNSKILLED + b5MINE + b6COUNCIL + b7NCWP + biREGIONi
where PCSP is the predicted percentage of the legal maximum spent by the
Conservative party, after controlling for the strategic position in each seat after the
previous election; PLSP is the same as PCSP but for the Labor Party; PASP is the
same as PCSP but for the Alliance and REGIONi represents the dummy variables for
the regions used in an earlier analyses.131
Denver and Hand’s took a different direction for the UK by following Jacobson’s
model more closely using vote share as a dependent variable with the vote share at the
previous election as a control but by using the change in the share of the electorate
won as compared with the previous election as a measure of electoral change and
reporting regressions with this measure as the dependent variable. However, they
130 Pattie, Johnston & Fieldhouse. p 977. 131 Pattie, Johnston & Fieldhouse. p 977.

45
split the sample into two analysing challengers and incumbents separately. They used
challenger’s performance as a dependent variable and included the challenger’s party
as a control variable to take account of national-level changes. For the same reason
they included the incumbent’s party when the incumbent’s performance was the
dependent variable. Denver and Hands came up with the following series of
regression models:132
C1V92 = a + b1C1V87 + b2C1P + b3Icamp + b4C1camp + b5C2camp + e C1Che = a + b1C1P + b2Icamp + b3C1camp + b4C2camp + e IV92 = a + b1IB87 + b2IP + b3Icamp + b4C1camp + b5C2Ccamp + e IChe = a + b1IP + b2Icamp + b2C1camp + b3C2camp + e
where C1V92 is the first challenger’s share of the vote in 1992; C1V87 is the first
challenger’s share of the vote in 1987; IV92 is the incumbent’s share of the vote in
1992; IV87 is the incumbent’s share of the vote in 1987; C1Che is the first
challenger’s change in share of votes won between 1987 and 1992; IChe is the change
in the incumbent’s share of votes won between 1987 and 1992; Icamp is the
incumbent’s campaign strength; C1camp is the first challenger’s campaign strength;
C2camp is the second challenger’s campaign strength; IP is the incumbent’s party and
C1P is the first challenger’s party.133
Denver and Hands then used the following two models to show that the effects of
campaigning were different for the different parties:134
132 Denver & Hands 'Challengers, Incumbents and the Impact of Constituency Campaigning in Britain'. p 181. 133 Denver & Hands 'Challengers, Incumbents and the Impact of Constituency Campaigning in Britain'. p 181-2. 134 Denver & Hands 'Challengers, Incumbents and the Impact of Constituency Campaigning in Britain'. p 182-3.

46
Con92 = a + b1Con87 + b2Coninc + b3Concamp + 4Labcamp +
b5Ldemcamp + e
Conche = a + b1Coninc + b2Concamp + b3Labcamp + b4Ldemcamp + e where Con92 is the share of the vote won by the Conservatives in 1992; Con87 is the
share of the vote won by the Conservatives in 1987; Conche is the change in the
Conservative vote between 1987 and 1992; Coninc is a dummy binary variable
indicating Conservative incumbency; and Concamp, Labcamp and Ldemcamp are the
campaign strength scores for the Conservative, Labor and Liberal-Democrat parties
respectively.135
In order to test whether it is previous vote effect and not challenger effect that is
important in such studies Denver and Hands divided the campaigns of the parties in
each constituency into three groups based on their share of the vote in 1987 (low,
medium and high). They then tested each group against the following models:136
Vote92 = a + b1vote87 + b2owncamp + b3othercamp + e
Che = a + b1owncamp + b2othercamp + e
where Vote92 is the vote share of the relevant party in 1992; vote87 is the share of the
vote of the relevant party in 1987; Che is the change in the share of the vote gained by
the relevant party between 1987 and 1992; owncamp is the strength of the relevant
135 Denver & Hands 'Challengers, Incumbents and the Impact of Constituency Campaigning in Britain'. p 183. 136 Denver & Hands 'Challengers, Incumbents and the Impact of Constituency Campaigning in Britain'. p 184-5.

47
party’s campaign; and othercamp is the sum of the campaign strengths of the two
opposing parties.137
Denver and Hands then suggested an alternative set of equations, which incorporated
an interaction term (the product of vote share in the 1987 election and campaign
strength in 1992). They stated that this had the advantage of “utilising all the data
simultaneously”138 and avoided dividing cases into categories. The models developed
from this were:139
Vote92 = a + b1vote87 + b2owncamp + b3othercamp +
b4(owncamp x vote87) + e
Che = a + b1owncamp + b2othercamp + b3(owncamp x vote87) + e Denver and Hands found that there were a number of different effects that resulted
from the above statistical method that were not easy to sort out and therefore, chose to
examine holding constant one or other of the relevant variables.140 They did this in a
number of ways, firstly, they held the party constant to examine whether the previous
vote effect would still exist. Secondly, they examined the effects for each party’s
campaign separately and included terms for the interaction between votes received in
1987 and campaign strength in 1992. This produced two new formulae:
Con92 = a + b1Con87 + b2Concamp + b3Labcamp + b4Ldemcamp + b5(Con87 x Concamp) + e
137 Denver & Hands 'Challengers, Incumbents and the Impact of Constituency Campaigning in Britain'. p 185. 138 Denver & Hands 'Challengers, Incumbents and the Impact of Constituency Campaigning in Britain'. p 186. 139 Denver & Hands 'Challengers, Incumbents and the Impact of Constituency Campaigning in Britain'. p 185-6. 140 Denver & Hands 'Challengers, Incumbents and the Impact of Constituency Campaigning in Britain'. p 186.

48
Conche = a + b1concamp + b2Labcamp + b3Ldemcamp + b4(Con87 x Concamp) + e
The last relationship that Denver and Hands examined was whether party effect
remained if previous vote was held as a constant. Again, they saw two ways of
achieving this. Firstly, by using data defined on the basis of share of the vote in 1987
they included terms for the interaction between party and campaign strength:141
Vote92 = a + b1vote87 + b2owncamp + b3othercamp + b4(Con x Concamp) + b5(Ldem x Ldemcamp) + e
Che = a + b1owncamp + b2othercamp + b3(Con x Concamp) + b4(Ldem x Ldemcamp) + e
Secondly, Denver and Hands examined the same relationship but by using all data
simultaneously. They achieved this by introducing Vote87 as a control variable,
producing the following model:
Che = a + b1vote87 + b2owncamp + b3othercamp + b4(Con x owncamp) + b5(Libdem x owncamp) + e
Denver and Hands used a number of models for deriving their conclusions. These
models were based around the vote received by parties in the 1992 election and the
change in vote received by parties between the 1987 election and the election in 1992
and the strength of the campaigns of each party as well as the vote received by the
parties in 1987.
141 Denver & Hands 'Challengers, Incumbents and the Impact of Constituency Campaigning in Britain'. p 187-8.
49
In their research published in 1995 Johnston and Pattie used a model first tested by
Johnston in 1986142 base on the proposition that the more a party spends the better its
electoral performance should be. Johnston and Pattie used the ratio of two parties’
performance (as percentages of the votes cast) at each pair of elections between 1979
and 1992 to measure inter-electoral change.143 After regressing inter-electoral change
between the parties for these elections Johnston and Pattie used regression models that
used seven variables to represent constituency characteristics and 22 dummy variables
to represent regions.144 These figures were then regressed against spending by the
various parties each constituency as a percentage of the maximum allowable in that
constituency.145
Fisher’s national level research published in 1999 examined the influence of a party’s
annual expenditure on popularity in opinion polls.146 Fisher’s hypothesis was that
electoral popularity is a function of party spending, the spending of the party’s
principle opponent and the existing strength of the party. This hypothesis was
represented by the following formula:
POLL = a + b1PS + b2PE – b3OPE + e
142 Johnston 1986, 'Information Provision and Individual Behaviour: a case study of voting at an English general election', Geographical Analysis, vol. 18, pp. 129-41. cited in Johnston & Pattie 'The Impact of Spending on Party Constituency Campaigns in Recent British General Elections'. p 264. 143 Johnston & Pattie 'The Impact of Spending on Party Constituency Campaigns in Recent British General Elections'. p 264. 144 Johnston & Pattie 'The Impact of Spending on Party Constituency Campaigns in Recent British General Elections'. p 266. 145 Johnston & Pattie 'The Impact of Spending on Party Constituency Campaigns in Recent British General Elections'. p 266-7. 146 Fisher 'Party Expenditure and Electoral Prospects'. p 524.

50
where a is a constant, POLL is the share of the poll for the party concerned, PS is the
electoral strength of the party, PE is expenditure by the party, OPE is the expenditure
by the parties main rival, e is the error term and b1-3 are regression coefficients.147
Fisher, struck methodological difficulties due to the lack of a pre-defined campaign
period and not being able to account for non-partisan political campaigning. Fisher
dealt with the first problem by using annual data and the second by the fact that non-
partisan activity is likely to be concentrated around the time of general elections, and
that his analysis was based on annual data in non-general election years.148 Fisher
then also looked at the relationship between expenditure by challengers and
incumbents and the electoral strength of the challenger on challenger’s share of the
poll and vice versa so as to test the theories of Jacobson and Green and Krasno.149
Johnston, MacAllister and Pattie, in their study published in 1999 worked on the
following assumptions: that parties would spend the most in the seats that they
already held and wished to retain and in addition, in other seats where the margin of
loss at the last election was small. Johnston, MacAllister and Pattie also assumed that
candidates would spend more in seats where the margin between the parties was the
least. 150 To test these theories, they plotted a series of graphs that showed the
relationship between expenditure by political parties and the margin of votes in each
seat for the 1997 general election. They plotted separate graphs for each party:
147 Fisher 'Party Expenditure and Electoral Prospects'. p 524-5. 148 Fisher 'Party Expenditure and Electoral Prospects'. p 525. 149 Fisher 'Party Expenditure and Electoral Prospects'. p 525-6. 150 Johnston, MacAllister & Pattie 'The Funding of Constituency Party General Election Campaigns in Great Britain'. p 394.

51
Labour, Conservative and Liberal Democrat.151 Johnston, MacAllister and Pattie also
examined the relationship between party expenditure and seats each party held in
1992 and whether that seat was marginal, close or safe.152
Canada
The research design employed by Carty and Eagles in their Canadian research
differed to most of the above research due to it being centred on parties as opposed to
incumbents and challengers. The main reason for this was the way in which Carty
and Eagles conceptualised incumbency. Instead of treating the actual incumbent
representative of the seat as the incumbent Carty and Eagles treated candidates from
the party in government as incumbents and those from opposition parties as
challengers. This is because of the strict party discipline that characterises the
parliamentary system in Canada. Carty and Eagles argue that incumbency in the
minds of most voters is based on the governing party’s record and that therefore, it is
more accurate to use their model rather than a straight incumbency versus challenger
model.153
In order to conduct their research Carty and Eagles took the proportion of the total
constituency (called a ‘riding’ in Canada) vote for each of the three major national
parties in the 1999 Canadian federal election as the dependent variable in their
analysis. The independent variables they used were volunteer use and expenditure, as 151 Johnston, MacAllister & Pattie 'The Funding of Constituency Party General Election Campaigns in Great Britain'. p 394-5. 152 Johnston, MacAllister & Pattie 'The Funding of Constituency Party General Election Campaigns in Great Britain'. p 396. 153 Carty & Eagles. p 75.

52
these related to the nature and intensity of the campaigns by the parties.154 Carty and
Eagles represented campaign expenditure as the amount spent in each constituency by
each campaign per elector. Volunteer strength was determined as the number of
volunteers during the election for each of the three parties.155 Carty and Eagles also
included a variable measuring the party’s level of support at the previous election.
This was because, they argue, parties do not start from scratch but rather “inherit”156
the legacies of previous election campaigns.157 In addition, they utilised three
constituency-level indicators. The first was an index of socio-economic status, the
second, a measure of urbanisation within the constituency and the third, measured the
ethno-social homogeneity of the constituency. Carty and Eagles then used ordinary
least squares regressions to estimate the parameters for the model.158
New South Wales, Australia
In his analysis of the elections in New South Wales (NSW), Forrest examines the
flow-of-the-vote by using an entropy-maximising procedure utilising data from the
NSW Election Survey in 1995. Forrest used the number of votes cast for each party
in each electoral division at the 1991 and 1988 NSW elections. Forrest also used the
flow-of-the-vote sum at a State wide level, which he arrived at by inflating division
flow-of-the-vote results. The results for flows to and from the major parties were
154 Carty & Eagles. p 76. 155 Carty & Eagles. p 76-7. 156 Carty & Eagles. p 77. 157 Carty & Eagles. p 77. 158 Carty & Eagles. p 77-8.

53
used as dependent variables in later analysis.159 Forrest then regressed the flow-of-
the-vote against campaign spending for each of the parties. This was to test his
hypothesis that “the greater the effort put into local campaigning in 1991 by each
major party relative to the other, the more votes will be retained or attracted (flows to)
and the fewer will be lost (flows from).”160 Forrest then expanded his model to
“control for underlying influences”161 by incorporating a number of political-
contextual and socio-structural variables. These variables (number over a dozen)
were based on the two major divisions in NSW of class, as determined by socio-
economic status, and urbanisation (rural-urban).162 Forrest also included further
variables to account for whether or not a particular seat was marginal and to account
for incumbency.163
In their study of NSW elections, Forrest, Johnston and Pattie hypothesised that party
spending would be increasingly linked to election outcomes.164 In order to test this,
they analysed the results of the NSW elections from 1988 to 1995 in two stages. The
first stage was to examine the effect of class, urbanisation and ethnicity of electoral
divisions on the way in which they voted. The equation used for this stage of the
analysis was:165
159 Forrest 'The Effects of Local Campaign Spending on the Geography of the Flow-of-the-Vote at the 1991 New South Wales State Election'. p 231-2. 160 Forrest 'The Effects of Local Campaign Spending on the Geography of the Flow-of-the-Vote at the 1991 New South Wales State Election'. p 234. 161 Forrest 'The Effects of Local Campaign Spending on the Geography of the Flow-of-the-Vote at the 1991 New South Wales State Election'. p 235. 162 Forrest 'The Effects of Local Campaign Spending on the Geography of the Flow-of-the-Vote at the 1991 New South Wales State Election'. p 235-6. 163 Forrest 'The Effects of Local Campaign Spending on the Geography of the Flow-of-the-Vote at the 1991 New South Wales State Election'. p 236. 164 Forrest, Johnston & Pattie 'The effectiveness of constituency campaign spending in Australian state elections....' p 1123. 165 Forrest, Johnston & Pattie 'The effectiveness of constituency campaign spending in Australian state elections....' p 1124.

54
ALP2PPi,t = ∫ (ALP2PPi,t-1), GOVHSG, NESB, SKILL, AGRIC where ALP2PPi,t is the difference between the Labor two-party preferred vote and that
for the coalition in constituency i at the current election, t; ALP2PPi,t-1 is the same
difference as above but for the previous election; GOVHSG is the percentage of
households in the constituency that are rented from the state (i.e. government/public
housing); NESB is the percentage of the constituency that come from a non-English
speaking background; SKILL is the percentage of the constituency that work in semi-
skilled and unskilled occupations and AGRIC is the percentage of constituency
populations employed in agriculture.166
In the second stage the impact of major-party spending was assessed independently of
the state 1 effects. The equation for stage 2 was:167
ALP2PPi,t = ∫ (ALP2PPi,t-1, GOVHSG, NESB, SKILL, AGRIC, ALP$i,t, LNP$i,t)
where ALP$i,t and LNP$i,t are the absolute campaign-spending totals by the ALP and
the Liberal Party/National Party Coalition.168 This gave a flow of the vote to or from
the ALP based on the ALP’s vote at the previous election and controlled against
different regional factors in each constituency and the spending by both the ALP and
the Liberal Party/Nationals Coalition.
Shaun Bowler, David Farrell and Ian McAllister’s study of the 1993 federal election
in Australia was based on the 1993 Australian Election Study survey. This survey
166 Forrest, Johnston & Pattie 'The effectiveness of constituency campaign spending in Australian state elections....' p 1124. 167 Forrest, Johnston & Pattie 'The effectiveness of constituency campaign spending in Australian state elections....' p 1124-6. 168 Forrest, Johnston & Pattie 'The effectiveness of constituency campaign spending in Australian state elections....' p 1126.

55
asked successful Members of Parliament and unsuccessful incumbents how much
time they spent working on different activities within their divisions. The types of
activities were divided into two types: “constituency service” and “local party
work.”169 Bowler et al then regressed the mean hours per month spent on each
activity against the number of votes that the Members received in the 1993 election
and against the swing for or against the Member between the 1990 and 1993
elections.170 While this study was interesting for its results, its methodology is not
related to the research reported in this thesis.
Differences
In general the models used analyse a change in the share of the vote obtained by one
party as a function of the previous strength of the party (usually based on its
performance at the previous election), the party’s expenditure and the expenditure of
other parties. Many of the analyses also include in their models variables to counter
any effects based on geography, socio-economic and other regional differences of
each constituency or district.
However, it is pertinent at this point to examine some of the key differences between
electoral campaigns in the jurisdictions discussed thus far and Australia at a federal
level. The first and main difference is that voting in Australia is compulsory. The
effect of this is that one of the main tasks of local campaigns in the United States, the
169 Bowler, Farrell & McAllister. p 463. 170 Bowler, Farrell & McAllister. p 463-4.

56
United Kingdom and Canada, that of ‘getting out the vote,’ is not required.171 The
second major difference is the voting method employed in Australia: preferential
voting or single transferable vote. While in the above mentioned jurisdictions it is
possible to improve one’s vote without reducing vote of one’s opponent by ‘getting
out more of the vote’, this is not possible in Australia. This means that greater
emphasis is placed on convincing voters who do not have any party affiliation or
allegiance (otherwise known as swinging voters) to vote for a particular party over
another, thereby not only increasing one party’s vote but directly reducing the votes
obtained by the other parties.
Two other significant differences also exist, which stem from Australia being a
parliamentary system. Firstly, congressional election campaigns in the United States
are more parochial and candidate-centred than those in parliamentary systems such as
Australia, Canada and the United Kingdom.172 Another important difference is the
way incumbency is conceptualised. Due to the strict party discipline evolving from
parliamentary systems, especially in Australia and Canada173, in the minds of most
voters incumbency is defined in terms of the incumbent governing party, as opposed
to the affiliation of the actual Member of Parliament in a particular seat. By
definition, this means that more incumbents will be members of the governing party
than the opposition parties.174
171 Pattie, Johnston & Fieldhouse. 172 Carty & Eagles. p 72. 173 Carty & Eagles. p 75. 174 Carty & Eagles. p 75.

57
Methodology for this research
In order to answer the question proposed at the beginning of the chapter the
methodologies employed in the above studies were broadly followed. However, the
methods employed had to be modified to suit the information that is available in the
Australian context for federal elections. This means that whereas many of the above
studies concentrated only on local campaign expenditure this study will examine
expenditure at state and national levels.
The information used to conduct this research was gathered primarily from the
Australian Electoral Commission (AEC), to which all parties are required to submit
disclosure returns as described in Chapter One. Information relating to the number of
votes obtained by each party was also gathered from the AEC.175
In forming a methodology a number of difficulties were encountered in relation to
data availability and the form in which the data was presented. In addition a few
points must be made about the Australian political structure and its operation and how
this affects the formulation of an accurate methodology. Some of these are basic but
necessary points to be considered. In order to examine how campaign expenditure
affects the outcomes of elections, purely discussing the number or percentage of first
preference votes received by a party is not entirely useful. The examination must deal
with the realities of the formation of government in Australia. At the federal level, as
in the United Kingdom, the party that becomes the governing party is the one that
wins the most seats in the House of Representatives. For this reason this research 175 Australia. Australian Electoral Commission 1999, Election Statistics 1993, 1996, 1998, Australian Electoral Commission. ; Australia. Australian Electoral Commission 2002, Election Statistics 2001, Australian Electoral Commission.

58
focuses on votes won in divisions of the House of Representatives only and not votes
won by parties in Senate elections.
As mentioned above, Australia uses a preferential or single transferable vote (STV)
voting system for House of Representatives elections. This means that voters can
nominate an order of preference for candidates in an election and that in order to win
an election a candidate must receive over 50% of the vote in that division. For this
reason it is important to look not only at first preference votes won by each party but
also the vote received by the two major parties on a two-party preferred basis as it is
this vote that nearly always determines who wins the division. The two-party
preferred outcome was also analysed in this study as it is this result that determines
the winning candidate in each division. However, as financing data is not available
on a division by division basis two-party preferred results will be based on State and
national totals. The number of actual seats won was also examined. This is important
due to the closed-system nature of the Australian system created by a compulsory and
preferential voting system mentioned above.
While it would have been preferable to utilise spending data on a division by division
basis to conduct this research this was not possible. As mentioned earlier, Australian
electoral law only requires parties and candidates to lodge expenditure returns through
their State or Territory party bodies for each election on a State or Territory wide
basis. This means that campaign expenditure information on a division by division
basis is not available to the public. In an effort to conduct research at a division level
I contacted each of the State, Territory and national organisations of each of the
parties examined in this research. I requested from each party a break down of their

59
expenditures during the 1996 election on a division by division basis. Despite a
guarantee of confidentiality, the parties regarded the information as being sensitive
and were not prepared to provide the information to me.176 For this reason the
campaign expenditure figures used are only broken down by State and Territory as
provided to the Australian Electoral Commission (AEC).
An additional difficulty is that the reported campaign expenditures from the parties do
not differentiate between expenditure for Senate and House of Representative
elections. This means that in comparing expenditure to votes the expenditure figures
used are for both the Senate and the House of Representatives whereas the votes are
only for the House of Representatives. However, at least in the case of the Australian
Labor Party, the Liberal Party and the National Party campaign expenditure on Senate
elections makes up a minor part of the total expenditure by the parties during the
campaign. Additionally, while the Australian Democrats and Greens fare better in the
Senate than in the House of Representatives they still field candidates in nearly every
House of Representatives election. This would seem to indicate that their expenditure
would still mainly be aimed at House of Representatives elections with such
expenditure having positive spin offs for the Australian Democrats and Greens in the
Senate in the same way it does for the other major parties. Therefore, this problem
can be effectively ignored.
Another problem is that the national organisations of the parties also spend money on
the election campaigns separately to the state and territory organisations. It is not
possible in every case to discover in which state or territory particular funds were
176 It should be noted that the GreensWA did provide me with the information that I requested, however, on its own it was of no use to the research. My thanks to Rowena.

60
spent. To eliminate this problem in the research I have compared the total
expenditure of each party, including all national, state and territory organisations of
each party, with the total vote received by the party over the whole country during the
election. The use of these figures makes sure that all expenditure is included in the
research.
Reference must also be made to the fact that the research conducted in this area in
other jurisdictions made use of dummy variables to different degrees to counter
specific socio-economic, geographical and other factors present in each division or
constituency. In this research I do not feel that such variables are necessary. As the
analysis in this thesis is essentially from a state and territory level, regional variations
will essentially cancel themselves out within each state and territory and across the
country.
It should also be noted that the use of financial year returns means that party activities
between elections are more accountable as parties must report their finances more
regularly and completely than with election returns, which are once every three years
in effect, however, it also means that in the study of each election the data is not as
accurate as election based returns. A number of factors come into play when looking
at data over a financial year; however, as they equally affect each party these factors
can be ignored. The main factors to take note of are: firstly, donations reported could
have been in relation to a state election held during that financial year; secondly, if an
election is held at the beginning of a financial year a great deal of donations and some
expenditures relating to the election may have been reported in the previous financial
year’s return to the AEC.

61
This Research
In answering the question does campaign financing affect the outcome of an election
we need to determine whether the more a party spends on its election campaign
equates to or has a positive relationship with that party acquiring more votes in that
election. In conducting this research I hypothesise that despite there being many
factors that affect the outcome of an election, ranging from long to short term as well
as local and national political factors, the more a party spends on its election
campaign the higher its vote will be and therefore, the lower the vote of the other
parties contesting the election will be. This analysis examined the number of first
preference votes for each of the five major parties: the Australian Labor Party (ALP),
the Liberal Party (LPA), the Nationals (NP), the Australian Democrats (Dem) and the
Greens (Grn). Also examined, were the number of two-party preferred votes for the
ALP, the Liberal Party and the Nationals.
The following formulas were used in the examination:
FPVt = a + bPEf + e 2PPVt = a + bPEf + e
where FPV is the number of first preference votes won by a party in a State or
Territory in the House of Representative at election t; 2PPV is the number of the two-
party preferred votes won by a party in a State or Territory in the House of
Representatives at election t; PE is the total expenditure by a party in a State or

62
Territory during financial year f, covering election t; a is a constant; b is the slope
variable or regression coefficients; and e is an error term.
The other half of this research involved examining the effect of the different sources
of income of the results of the election. This is important as a strong relationship
between donations to political parties and the outcomes of elections would call into
question the unrestrained nature of the Australian campaign financing regime. That
is, donations to a party can influence the outcome of an election.
In order to examine these relationships this research went down two different paths,
the first was to assess the nature of the relationship by examining the relationships
between the total receipts of a party and the amount spent during a campaign. In
addition, the relationship between the total donations to a party and the party’s
expenditure during a campaign was examined. This relationship was examined with
the following models:
PEf = a + bPRf + e PEf = a + bPDf + e where PRf is the total receipts for a party during financial year f and PDf is the total
declared donations to a party during financial year f.
Secondly, the relationship between the total funds raised by a party and the votes it
received and the total donations a party received and the votes it received was
examined. In each of these cases the examination included both first preference votes
63
and the two-party preferred vote as above. The equations used in this analysis were
essentially identical to those above also.
In these examinations the following formulas were used:
FPVt = a + bPRf + e 2PPVt = a + bPRf + e FPVt = a + bPDf + e 2PPVt = a + bPDf + e
In making these further examinations a number of problems arose. Again, these stem
from data availability. The returns for the financial year 1992/1993 (covering the
1993 federal election) were of a different format and required information to be
presented in a different way to that of the returns used from the 1996 federal election
onwards. The forms did require the parties to specify their total receipts and total
payments. This data was used in this research. However, the way in which
information regarding donations was required to be presented differed from that used
from the 1996 federal election onwards. For this reason data relating to donations has
not been used for the 1993 federal election as to do so would result in comparisons of
unalike data.
In addition, in nearly all cases parties did not distinguish between donations and other
receipts in the 1995/1996 returns (which covered the 1996 federal election). For this
reason only total income data is used in this study in 1996. However, donations were
declared in the financial year returns from 1998 onwards. The way in which

64
donations are declared, as discussed in Chapter One, does cause a problem however,
as data on donations can be incomplete and inaccurate.
The other problem with this data is that parties are required to give a total income
amount and then only have to itemise and categorise amounts of $1500 or more. This
means that any number of donations can be unaccounted for if they are under $1500
and are only accounted for under the total receipts amount.
Despite these difficulties the information obtained from the data that was available is
still useful. The overall effect is that we have expenditure data for four consecutive
elections. On the income side we have total receipts data for the first two elections
examined and complete income data (donations and total receipts) for the latter two.
Results
This research essentially made five comparisons: first, between expenditure and
votes; second, between income and expenditure; third, between donations and
expenditure; fourth, between income and votes and finally, between donations and
votes. In each instance where there was a comparison with votes the comparison was
made both with first preference votes and secondly with the two-party preferred vote.
Each election has been considered separately. The results that were produced were
largely as expected. There was little variance between the three elections in the
results and as expected the strength of the relationships were higher in the first set of
relationships examined and lowest in the final set of relationships examined.

65
Figures 1, 2, 3 and 4 show the relationship between first preference votes won and the
expenditure of the parties for each election between 1993 and 2001 respectively. On
these graphs, the y-axis represents expenditure and the x-axis represents first
preference votes. Each dot represents a party’s performance in a particular state or on
the national level. There were also very strong relationships between expenditure and
two-party preferred votes as well as between expenditure and the number of seats won
by each party. Pearson regressions of the data gave r and r2 values in the range of
0.9370 to 0.9826 and 0.8781 to 0.9655 respectively.177 Overall, this suggests that
there is certainly a very strong relationship between the amount that a party spends on
its election campaign and its success in the election.
Figures 5, 6, 7 and 8 show the relationship between the declared receipts of parties
and their expenditure. Again, the relationship between these two areas is very strong.
The data from 1993 produced an r value of 0.9947 and an r2 value of 0.9895. For
1996 data the r value was 0.9978, with a r2 value of 0.9956; for 1998 the r value was
0.9954, with a r2 value of 0.9908. Values of 0.9473 and 0.8975 were produced for r
and r2 respectively from the 2001 data. In figures 5, 6, 7 and 8 the y-axis represents
expenditure and the x-axis represents receipts. Such high correlations tend to suggest
that parties spend all of their income in the financial year of an election on that
election.
177 Full tables of data for this study are included in Appendices A to E.

66
Figure 1: Expenditure v First Preference Vote - 1993
Figure 2: Expenditure v First Preference Vote - 1996
Figure 3: Expenditure v First Preference Vote - 1998

67
Figure 4: Expenditure v First Preference Vote - 2001
Figure 5: Expenditure v Total Receipts (Income) - 1993
Figure 6: Expenditure v Total Receipts (Income) - 1996
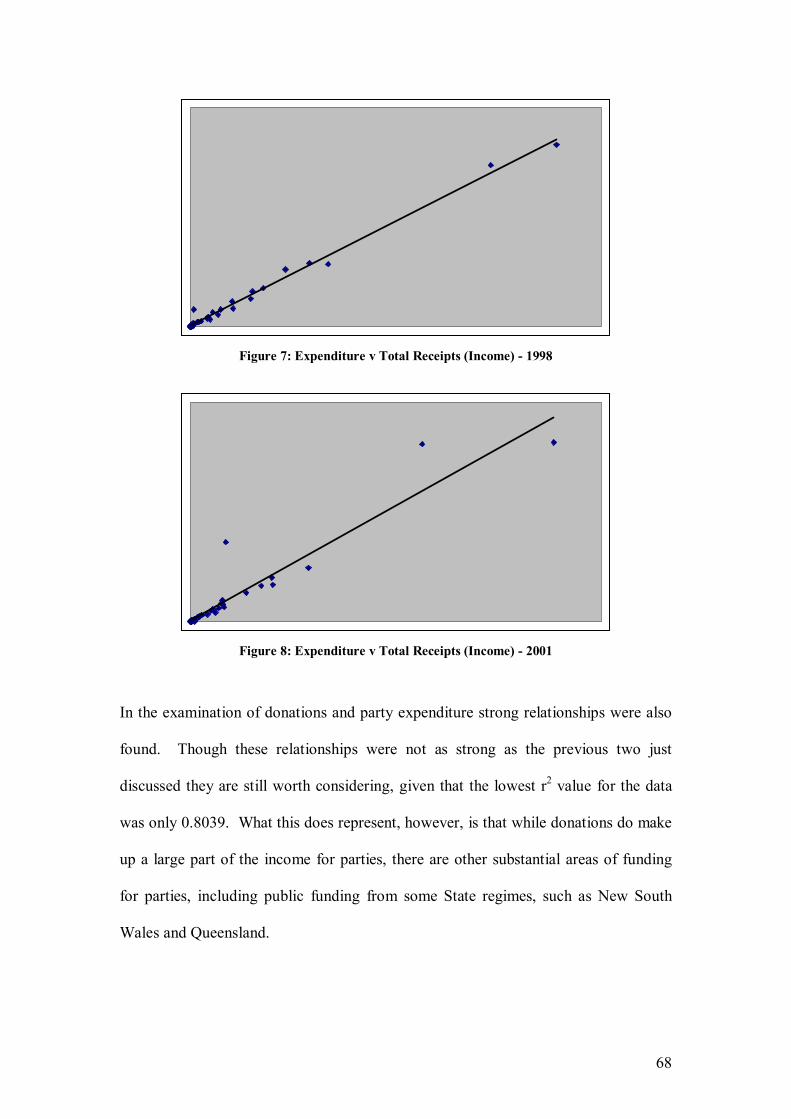
68
Figure 7: Expenditure v Total Receipts (Income) - 1998
Figure 8: Expenditure v Total Receipts (Income) - 2001
In the examination of donations and party expenditure strong relationships were also
found. Though these relationships were not as strong as the previous two just
discussed they are still worth considering, given that the lowest r2 value for the data
was only 0.8039. What this does represent, however, is that while donations do make
up a large part of the income for parties, there are other substantial areas of funding
for parties, including public funding from some State regimes, such as New South
Wales and Queensland.

69
As was expected, particularly given the very strong relationship between expenditure
and votes and expenditure and receipts, the relationship between receipts and votes
was also very strong. This is illustrated in figures 9, 10, 11 and 12, with the y-axis
representing receipts and the x-axis representing the two-party preferred votes
received by the parties.
Figure 9: Total Receipts (Income) v Two-party preferred Votes - 1993
Figure 10: Total Receipts (Income) v Two-party preferred Votes - 1998

70
Figure 11: Total Receipts (Income) v Two-party preferred Votes - 1998
Figure 12: Total Receipts (Income) v Two-party preferred Votes - 2001
Likewise, the relationship between donations and votes was strong but not as strong
as the above relationships. The regression coefficient values for this data ranged from
0.7888 up to 0.9467, with r2 values from 0.6222 to 0.8962. These values still show
that a strong, though not very strong, relationship exists between donations received
by a party and the votes that the party receives at an election. 178
178 These comparisons were only made for data for the 1998 and 2001 elections because of a lack of data for the 1996 election as discussed earlier.

71
Conclusions
A number of conclusions can be reached from the strengths of the relationships
demonstrated in the results from this research. The first is that political parties draw
their income for elections from a variety of sources and that this is related, though not
very strongly to the amount of donations a party receives. This is demonstrated by the
fact that a large amount of party receipts are in the form of loans in lieu of income the
parties will receive in public funding payments after the election and other sources.
The second conclusion is that due to the very strong relationship between parties’
receipts and expenditure, parties spend nearly all and sometimes a bit more than their
income in an election year. This demonstrates that the political parties will utilise all
resources available to them to campaign during an election. Thirdly, the very strong
relationship between party expenditure and votes received shows that there is a very
strong case to be made in Australia, as has been made in the United States, Canada
and the United Kingdom, that party campaign expenditure does influence the outcome
of elections. This appears to not only be the case in relation to first preference votes
but also at a two-party preferred level, which is important because it is this vote that
determines who wins seats, and in relation to the number of seats won, which is the
most important as this determines which party wins Government.
In the elections of 1993, 1996 and 2001 the Liberal Party spent more than the ALP
but only won more seats than the ALP in the elections of 1996 and 2001, with the
ALP winning the 1993 election. The ALP only spent more than the Liberal Party in
the election in 1998 and it won more seats than the Liberal Party in that election,
however, as the Liberal Party was in coalition with the Nationals the Liberal/National

72
Coalition won the 1998 election. Considering the Liberal Party and the Nationals
together as a Coalition when looking at seats won, the Coalition outspent the ALP in
every election from 1993 to 2001 and won more seats than the ALP in every election
from 1996 to 2001. These results clearly illustrate a strong relationship between the
electoral expenditure and electoral results.
The anomaly of the 1993 election, however, is best explained by reference to the
cyclical nature of donations to elections as mentioned earlier. The Liberal Party was a
clear favourite to win the 1993 election after 10 years of an ALP government. In line
with this the Liberal Party attracted more donations and was able to secure more
funding than the ALP in their 1993 campaign. This allowed the Liberal Party to
outspend the ALP during the 1993 election campaign. However, due to some large
tactical mistakes by the Liberal Party in relation to their proposal to introduce a goods
and services tax (GST) during the campaign the ALP managed to win the election.

73
Chapter Three: litigation and definitions Background
At the 1996 federal election Pauline Hanson, a disendorsed Liberal Party candidate,
won the seat of Oxley in Queensland. Ms Hanson then delivered one of the most
controversial maiden speeches in the history of the Commonwealth Parliament and
went on to form the One Nation Party (later known as Pauline Hanson’s One Nation).
Pauline Hanson and the party she formed became the focus of much ridicule from
other political parties and the mainstream media. However, despite being attacked
from many areas One Nation performed very well in the June 1998 Queensland State
election.
The dramatic and somewhat mysterious rise of Pauline Hanson and her party
prompted the making of a short documentary, Inside One Nation, which aired on the 4
Corners program on the ABC on the 10 August 1998.179 As part of this program a
Liberal Commonwealth Government Minister, Tony Abbott, was questioned about a
fund set up to finance legal action against Pauline Hanson and One Nation. Mr
Abbott denied the claims. In a statement issued in August 2003 Mr Abbott claims
that he did establish a fund in August 1998, but after his interview with 4 Corners. 180
179 Inside One Nation (4 Corners) 1998, Television, 10 August 1998. Distributed by Australian Broadcasting Corporation. 180 Abbott 2003, One Nation Litigation, Manly, 26 August 2003, Media Release, <http://www.tonyabbott.com.au/onenation.html>.

74
The Fund and the Legal Action
It now appears that as a result of One Nation winning 11 seats in the Queensland State
election Tony Abbott met with Terry Sharples, a disgruntled former One Nation
candidate. Sharples had evidence that he believed could show One Nation had
fraudulently registered as a political party in Queensland. Abbott met with Sharples
and Ted Briggs, a former State treasurer of One Nation on 7 July 1998. At issue as a
result of this meeting, and subsequent others, has been to what extent Abbott provided
any funds to Sharples in an effort to have him bring a case against One Nation.181 The
Sydney Morning Herald later obtained a copy of an agreement by Abbott
guaranteeing that Sharples would not be “further out-of-pocket as a result of this
action”.182
On July 31, 1998 Abbott was interviewed by the ABC for its 4 Corners episode Inside
One Nation. In this interview Abbott was asked if any Liberal Party funds or funds
from any other source had been given to Terry Sharples. Mr Abbot said “absolutely
not”.183 Mr Abbott has now said that he meant that no Liberal Party funds had been
given to Mr Sharples and that in any event the guarantee that Mr Sharples would not
be out of pocket did not equate to having funds for Mr Sharples.184
On 24 August 1998 Tony Abbott established the Australians for Honest Politics Trust
fund. The Trustees of the fund were Mr Abbott and two former Members of
Parliament: Peter Coleman (the father in-law of the Treasurer Peter Costello) and
181 Snow 2000, 'Absolute Abbott', Sydney Morning Herald, 11 March 2000, pp. 1, 4-5. 182 Snow. 183 Inside One Nation (4 Corners). 184 Abbott.

75
John Wheeldon (a Minister in the former Whitlam Government). This was reported at
the time.185 Mr Abbott says that most of the $100,000 raised by the fund was spent in
the preparation of the Hazelton case against One Nation.186 Barbara Hazelton was a
One Nation Supporter who used to work in Pauline Hanson’s office. Hazelton was
prepared to pursue legal action to de-registrater One Nation, however, after a few
months, Hazelton decided to cease the action.187 The rest of the funds were returned
to the donor to the fund.188 Mr Abbott has also said that he disclosed that he was a
Trustee of the Trust under his disclosure requirements as a Member of Parliament.189
In 1999 the Australian Electoral Commission contacted Tony Abbott as a trustee of
the Australians for Honest Politics Trust to determine whether the Trust was an
associated entity under the Commonwealth Electoral Act and as such should make a
declaration. Upon seeking advice from Mr Abbott the AEC determined that the Trust
was not an associated entity.190
In August 1999 the Queensland courts agreed with Sharples in his case against the
Queensland Electoral Commissioner that Pauline Hanson and One Nation co-founder
David Ettridge had fraudulently registered One Nation as a political party in
Queensland. It must be noted that this did not affect its registration at a federal level
with the Australian Electoral Commission (AEC). However, as a result of this and
subsequent proceedings, One Nation virtually collapsed in all States of Australia and
185 Abbott. ; Niesche 1998, 'Hanson Finally Gets Poll Funds', The Australian, 3 September 1998, p. 4; Wilkinson 1998, 'Lib MP Backs Trust to Attack Hanson', Sydney Morning Herald, 29 August 1998, p. 3. 186 Abbott. ; Coleman 2003, 'Abbott Deserves a Medal', The Australian, 28 August 2003, p. 11. 187 Coleman; Wilkinson. 188 Abbott. ; Coleman. 189 Abbott. 190 Atkins 2003, 'Review May Unveil Fighting Fund Donors', The Courier-Mail, 28 August 2003, p. 4.

76
at a federal level, culminating in a three year sentence for Hanson and Ettridge for
electoral fraud in Queensland on 20 August 2003.191
As a result of the demise of Pauline Hanson, there were calls for Mr Abbott to
disclose the donors to the Australians for Honest Politics Trust and for him to more
fully explain its actions in 1998 and 1999. In late August 2002 a spokesman for the
AEC said that the status of the trust would be reviewed again.192 In September the
Australian Electoral Commissioner, Mr Andy Becker, said that the issue of whether
an organisation is set up to benefit a registered political party was complex.193
Issues
Controversy surrounding the use of trust funds and electoral campaign finance in
Australia is not new. During the early 1990s there was much debate of the use of
trusts to hide the true identities of donors.194 It was for this reason that the
requirements of declaring donors for trusts were incorporated into the associated
191 The conviction was overturned on 6 November 2003; Kingston 2003, Hanson Sinks Abbott: is Howard in danger?, viewed 27 August 2003 <http://www.smh.com.au/articles/2003/08/22/1061529330032.html>. ; Meade, K, Shanahan, D & Staff Reporters 2003, '"The Truth Has Set Us Free"', The Australian, 7 November 2003, p. 1; Pavey & Klot 2003, Released After 78 Days in Jail, News.com.au, viewed 6 November 2003 <http://www.news.com.au/common/story_page/0,4057,7787014%255E2,00.html>. 192 Atkins; Gilchrist, Marris & Videnieks 2003, 'AEC Launches New Trust Inquiry', News.com.au, 28 August 2003. 193 Hallett 2003, Electoral Disclosure Obligations, Australian Electoral Commission, Canberra, 5 September 2003, Media Release, <http://www.aec.gov.au/_content/What/media_releases/2003/sep/elec_disc_oblig.htm>. 194 Gerritsen. 6.2 The Source of funds

77
entity declaration provisions.195 However, the above case presents a whole new set of
problems surrounding the use of trust funds.
While there are many political issues that arise from the above case, there are two
main issues that develop relating to the Australian campaign finance regime. The first
relates to whether or not the Australians for Honest Politics Trust should be deemed to
be an associated entity under the Commonwealth Electoral Act. The second relates to
what the effects are of not including such funds within Australian electoral financial
disclosure laws.196
Firstly, as discussed in Chapter One, an associated entity is defined as an entity that is
controlled by one or more registered political parties or operates wholly or to a
significant extent for the benefit of one or more registered political parties.197 The
critical phrase in relation to the Australians for Honest Politics Trust is “for the
benefit of one or more registered political parties.” The phrase “wholly or to a
significant extent” is also important here.
It has been argued by Tony Abbott, and the AEC originally followed Abbott’s
reasoning, that the Trust was not for the benefit of the Liberal Party, but was for the
benefit of the political process and therefore, was not an associated entity that must
disclose its donors.198 This appears to follow what the AEC has described as “an
195 Australia. Australian Electoral Commission 2000b, Funding and Disclosure Handbook for Associated Entities, Australian Government Printing Service, Canberra. 196 Tham 2003, When Litigation's Just Another Way to Play Politics, <http://www.smh.com.au/articles/2003/09/03/10262548901240.html>. 197 Commonwealth Electoral Act 1918 s287 198 Dodson 2003, 'Watchdog Eyes Fighting Fund', The Age, 28 August 2003, p. 3.

78
unwillingness by some to comply with disclosure; others have sought to circumvent
its intent by applying the narrowest possible interpretation of the legislation.”199
So then, how broadly, can the phrase “for the benefit of one or more registered
political parties” be construed? It would appear now that the actions of the Trust in
offering to fund cases against the registration of One Nation in Queensland was
clearly to the benefit of the Liberal Party, at least in Queensland, if not to all other
registered political parties that had to compete with One Nation, including the
National Party and the Australian Labor Party. This would seem to fit within the
generally accepted definition of one or more political parties. So then, is there a point
at which operating for the benefit of too many political parties is not a direct enough
benefit for an organisation to be considered an associated entity?
Interestingly, in its funding and disclosure report after the 1998 federal election the
AEC recommended that the definition of an associated entity be clarified by inserting
the following definitions into the Commonwealth Electoral Act 1918. The AEC
recommended that the term “benefit” be given a broad meaning so as into include the
receipt of favourable terms and other instances where a party ultimately enjoys a
benefit.200 The AEC then further recommended in 2001 that the definition be
expanded to include where a benefit is enjoyed by members of a political party based
on their membership of that party.201 This is quite broad as it includes benefit to
199 Australia. Australian Electoral Commission 2000a, Funding and Disclosure Report following the Federal Election held on 3 October 1998, Australian Electoral Commission, Canberra. p 2. See also, Chaples 1994, 'Developments in Austrlian Election Finance', in Alexander &Shiratori (eds), Comparative Political Finance Among the Democracies, Westview Press. p 29. 200 Commonwealth of Australia Funding and Disclosure Report following the Federal Election held on 3 October 1998. p 27-8. 201 Commonwealth of Australia 2001a, Attachment H - Status Reprt on Progress of FAD Recommendations from the 1993 Federal Election Onwards, 147H, Australian Electoral Commission, Canberra.

79
members as opposed to the party generally, which may not necessarily benefit
members directly.
Clearly any action by an organisation that effectively wipes out a competing political
party is to the benefit of other parties. However, the question needs to be answered in
relation to how direct does such operation need to be? The other question is when
does the operation of an organisation become a substantial operation? If a charitable
organisation, working with the poor, decided to make a donation to support a party it
may, if the donation was large enough, have to make a declaration of that donation.
What if that charity does some other act to support a political party? Such an action
would not be the charity’s core or whole operation, so could it be considered that the
charity “substantially operated” for the benefit of that political party? It would appear
that this is why there are separate categories of associated entity and third party; with
the former required to make annual returns and the latter required to make election
returns if particular thresholds are met.
The AEC also recommended that the term “substantially operated” be clarified so that
an organisation would have to expend more than 50% of its “distributed funds,
entitlements or benefits”202 on a political party (presumably this could actually be on
one or more parties) for it to pass the substantiality test. To date, none of these
recommendations have been taken up.
This brings us back to the phrase “for the benefit of one or more registered political
parties.” What operations or actions are or are not of benefit to political parties? If
202 Commonwealth of Australia Funding and Disclosure Report following the Federal Election held on 3 October 1998. p 27.
80
such a charity chose to support legal action, as the Australians for Honest Politics
Trust did, would it be substantially operating for the benefit of other parties? While a
charity in this scenario may not be deemed to be an associated entity because it would
fail the substantiality test, the Australians for Honest Politics Trust was set up for the
sole purpose of funding such actions. So assuming the Australians for Honest Politics
Trust does pass the substantiality test, is supporting litigation against political parties
something that is for the benefit of other political parties?
Questions of this nature have in some ways been tackled before but not in Australia.
In the case of Buckley v Valeo203 in the United States the Supreme Court had to decide
what sort of actions were or were not in support of a candidate’s election. While the
ruling by the Supreme Court has not always been liked by those involved in campaign
finance reform in the United States it did provide some stringent and clear guidelines
for what does and does not constitute advocating the election or defeat of a candidate.
The Supreme Court said that campaign finance limitations in the United States only
applied to “communications that in express terms advocate the election or defeat of a
clearly identified candidate for federal office”. In the footnote of the judgement the
court included what have become known as the ‘magic words’, which were phrases
that the court deemed to be express terms advocating election or defeat as referred to
in its judgement.204 The use of other phrases, while they may hint or imply support
for or rejection of a particular candidate, have now been deemed to fall outside of the
scope of campaign finance law in the United States. This is what has resulted in the
phenomenon of ‘issue ads’ in the United States.
203 Buckley v Valeo (1976) 424 US 1 204 The phrases were ‘vote for …,’ ‘elect…,’ ‘support…,’ ‘cast your ballot for…,’ ‘Smith for Congress,’ ‘vote against…,’ ‘defeat…,’ ‘reject… .’

81
This example, demonstrates the difficulty that is to be encountered in the future when
dealing with non-registered party organisations that expend funds that are not
obviously directly for the benefit of any one registered political party. Arguably
Australia is in need of its own Buckley v Valeo. I would, therefore, suggest that until
a case similar to that involving the Australians for Honest Politics Trust is taken
through the courts Australia will not have a solid understanding of exactly what does
and does not fit within the definition of benefiting a political party for the purposes of
determining if an organisation is or is not an associated entity.205
Why is this important? The reason that it is important is because associated entities,
as discussed in Chapter One, must make annual returns to the AEC listing their
donors and the donations and other campaign related expenses that they make. This is
as opposed to third parties who only have to provide election returns disclosing only
specific items. Therefore, the disclosure provisions for associated entities are much
more stringent and transparent. There are two further issues here. Even if
organisations such as the Australians for Honest Politics Trust were to be deemed
associated entities and made to make annual returns, while the public would know
who their donors were, it would be arguable whether funding actions such as those
funded by the Australians for Honest Politics Trust would be required to be
specifically disclosed. Here again, we await a determination from the courts in some
future case yet to be brought to set out the strict requirements of such disclosures or
changes to the relevant regulations to require such actions and their costs to be
disclosed.
205 There is a certain irony in this point, in that possibly the best way to determine the place of legal action in the political sphere is through further use of legal action that would no doubt be funding by an organisation similar to the Trust discussed in this chapter.

82
Secondly, this is not an issue that is going to go away, in fact, the situation with the
Australians for Honest Politics Trust may be a sign of the opening of a new theatre for
political parties, or their friends, to do battle. This poses a serious threat to our
democracy in two ways. The first, as has been mainly discussed above, is the fact that
at the moment there appears to be no accountability of these issues via public
disclosure. The second threat comes from access to funds. As was seen in the
election of George W Bush as President of the United States via the United States
Supreme Court, the introduction of litigation into the political arena has serious
ramifications. If litigation does become a new theatre for battle in Australian politics
then it is the major two parties, the Australian Labor Party and the Liberal Party of
Australia, that stand to win. As evidenced by the research in Chapter Two, these two
parties have access to much more money and resources than any other parties in
Australia, indeed more resources than the other parties in Australia combined. Who
knows what other resources the ALP and Liberal Party have at their disposal, the
Australians for Honest Politics may only be the tip of the iceberg. If this is the case
the minor parties in Australia are at a serious disadvantage, a disadvantage that it
would appear that even public funding could not rectify.
This process can be seen as a further illustration of the results of the
professionalisation of politics and its effects on pluralism. In this type of scenario the
professionals used are lawyers. While these professionals are used to being used as
‘hired guns’, their introduction into the political sphere is cause for great concern.

83
Conclusions
An equal playing field is required, allowing for pluralism to flourish as an integral
part of a liberal democratic system. However, the events and actions by Tony Abbott
and the Australians for Honest Politics Trust and their relationship to the demise
(albeit only temporarily) of Pauline Hanson and One Nation may suggest that while
public funding is attempting to level the election campaign playing field the big
players like the Liberal Party and the ALP are finding a new field to play on which
suits them better. This is of serious concern for the maintenance of liberal democracy
in Australia.

84
Chapter Four: conclusions Democracy and Campaign Finance
Liberal Democracy is a contested concept with a variety of forces competing for the
benefit of their interests resulting in conflict. Further, compromise must be reached
between the competing values of liberalism and democracy. The campaign finance
regime in Australia illustrates the compromises that can result from such conflict as
do such regimes in other western democracies. Liberalism encompasses the values of
liberty, equality and freedom of speech. Democracy is a system of government that is
of, by and for “the people.” These concepts interlink in their value of equality and
promotion of pluralism. However, while freedom of speech encourages pluralism, the
unrestrained use of money in elections can remove the equality of power that is
required in a democracy. It is for these reasons that a transparent campaign finance
system is required, one where political players must be open about where they receive
money from and how they spend it.
It is important that the campaign finance regime used in a liberal democracy enhances
and does not subvert that democracy. A regime can enhance a democracy by ensuring
equality of political power and maintaining transparency. A regime can subvert
democracy if it does not do these things adequately and so creates the illusion that
democracy is being protected when it is not. In essence, campaign finance regulatory
regimes guard democracy from liberalism but should not encroach too far on
liberalism.

85
Adamany and Agree discuss the use of four rationales for evaluating the effectiveness
and fairness of any democracy’s electoral system. Their rationales are broader,
however, than just concerning the regulation of campaign finance. As mentioned in
Chapter One, there are three criteria that a campaign finance system should be
analysed against to determine its effectiveness in maintaining democracy:
1. How does the regime affect the equality of political power within the
system?
2. Does the system produce transparency and hence, accountability?
3. Does the system enhance or detract from pluralism?
These are the criteria upon which the assessments below are made.
Money, Votes and Democracy
Chapter Two discussed the relationship between money and votes or election
outcomes by looking at a number of different relationships over a period of three
elections. In the first election there was a change of government, in the second, while
the opposition won more votes on a two-party preferred basis, it remained in
opposition, and in the third, the Government remained in power. Therefore, it appears
that while each election was conducted in differing political circumstances, such
changes did not impact the study. The relationship between the expenditure of
political parties and the votes that they received at both the first preference and two-
party preferred stage was very strong. The relationship was also very strong between
party expenditure and seats won. This seems to indicate that the more a party spends

86
on its election campaign the more votes and hence, seats, it will win, thereby resulting
in winning government.
This research also looked at the relationships between income and expenditure,
donations and expenditure, income and votes and donations and votes. The
relationship among income, donations and votes was also strong but not as strong as
that between expenditure and votes. The results of these relationships indicated that
parties tended to spend near to or slightly more than all of their income in an election
year. Obviously, this is because winning elections is important. The two major
parties were also left with large debts after an election year. The relationship between
income, donations and votes, however, while still strong on its own, was weaker than
that of the relationship between income, donations and expenditure and weaker again
than that of expenditure and votes. This was as expected as these elements are further
removed from each other in the process of the campaign if we look at them in a linear
fashion progressing from donations to income to expenditure to votes to seats won to
winning government.
The existence of such strong relationships demonstrates the need for a strong electoral
campaign finance regulatory regime. Liberalism upholds the value of freedom of
speech and the expenditure of funds is a form of freedom of speech. However, the
political equality of “the people” is eroded if the wealthy can determine the results of
elections based on who they donate funds to and therefore allow provide the means to
expend more money on an election campaign. It would appear that, given at the time
of the last election studied the campaign finance regulatory regime in Australia had
87
been in place for 17 years, the system is in need of reform in order to reduce the effect
of money and in particular donations on the outcome of elections.
A New Theatre of Battle
Two main issues were raised in Chapter Three: the meaning of “substantial” and
“benefit” and the use of litigation in politics. In relation to definitions, the current
definition of an associated entity is broad and ambiguous and this has been
acknowledged by the Australian Electoral Commission. Such ambiguity poses real
problems in the administration of the disclosure regime in Australian and therefore
effects the ability of maintaining a transparent electoral system. This issue is tackled
further under ‘Recommendations’ below.
The issue of the use of legal action to gain political advantage is one that has caused
much controversy in 2003, stemming from the gaoling of former One Nation party
leader, Pauline Hanson for fraud. It was the use of funds raised by a group to bring a
civil action against Ms Hanson that eventually led to her criminal prosecution that has
led to this controversy, with many questioning the true motives of the group that
financed the action. What is of further concern is the possible continued use of legal
action by political parties or their allies. One of the main aims of the regulatory
regime is to maintain as level a playing field as possible for the fighting of elections;
this is the rationale behind providing public funding. However, the use of litigation
opens up a new theatre of battle for political parties, where it is not possible to
provide a levelling influence such as public funding. The only possible way that a

88
regime could intervene would be to provide more transparency and this relates back to
the definitions mentioned above. Other than this, any move that results in an
increased use of litigation as a political tool will result in an unfair benefit to the
major political parties and an unfair disadvantage to other political parties.
Professionalisation
The issue of professionalisation is one that relates to all of the issues discussed above.
The professionalisation of politics appears to be one of the major causes of the
increasing costs of campaigning and running elections and therefore, is one of the
main factors in increasing the amount of money that is now involved in elections.
While there are many circular arguments about the causes of the professionalisation of
politics, one factor that is certain is that the more regulatory requirements that are
placed on political parties and candidates the more professional their campaigns have
to be in order to make sure that they are compliant with the law. This then makes it
more difficult for grassroots organisations to get involved in the political process
because of the cost of complying with the regulatory regime. This is to the detriment
of pluralism in liberal democracy.
As well as the increasing costs of campaigns that are associated with the
professionalisation of politics, there is also the detrimental affect on democracy that
results from the creation of professional politicians or political mercenaries. The use
of such mercenaries creates two problems. Firstly, it puts those groups that cannot

89
afford them at a distinct disadvantage to those that can and secondly, it means that
these people are actively disengaging from what they think may be politically right or
wrong and so support people purely based on what they are paid. While not talking of
democracy, even Machiavelli could see the problems that this can create.206
Recommendations
As a result of examining the electoral campaign finance system in Australia, the effect
of money on election outcomes and the use of litigation as a political tool one can see
that there are problems and loopholes in the current system. Pointing out such
downfalls is only part of the task. It is also critical to consider ways in which these
downfalls can be rectified, and the Australian liberal democracy with them.
Australian Electoral Commission
There is no point in starting from scratch when others have already given
consideration to some of these issues. For that reason I will first outline the
recommendations that have been made by the AEC as a result of the 1996 and 1998
federal elections and submissions made by the AEC to the Joint Standing Committee
on Electoral Matters in 2002207 in relation to electoral funding and disclosure. The
recommendations dealt with here are not exhaustive but are selected based on their
relevance to the issues covered in this paper. 206 Machiavelli (1532) 1999, The Prince, New edn, Penguin Classics, Penguin Books, London. p 39-43. 207 Commonwealth of Australia 2002, Submission to the Joint Standing Committee on Electoral Matters: the conduct of the 2001 federal election, 147, Australian Electoral Commission, Canberra.

90
Inclusion of Definitions
The AEC recommended in its post 1998 federal election funding and disclosure report
that the definition of an associated entity be clarified. The AEC suggested the
following additions: 208
“‘controlled’ to include the right of a party to appoint a majority of directors or trustees’;
‘to a significant extent’ to mean the receipt by a political party of more than 50% of the distributed funds, entitlements or benefits enjoyed and/or services provided by the associated entity in a financial year; and
‘benefit’ to include the receipt of favourable, non-commercial terms and instances where the party ultimately enjoys the benefit.”
In its submission to the Joint Select Committee on Electoral Matters in August 2001
the AEC recommended that the term ‘benefit’ referred to above be further clarified
by inserting the following interpretation:209
‘benefit’ includes “instances where the benefit is enjoyed by members
of a registered political party on the basis of that membership.
Both sets of recommendations deal with the issues that are raised in Chapter Three of
this paper. The introduction of such definitions would be of benefit in gaining a
clearer understanding of what organisations constitute an associated entity, however,
the definition suggested for ‘benefit’ is still broad and is not exclusive, therefore, even
208 Commonwealth of Australia Funding and Disclosure Report following the Federal Election held on 3 October 1998. p 13. 209 Commonwealth of Australia 2001d, Submission to the Joint Standing Committee on Electoral Matters Inquiry into Electoral Funding and Disclosure, 15, Australian Electoral Commission, Canberra. p 13.

91
if such recommendations were implemented the problems that are outlined with the
current definition of ‘benefit’ would still apply.
Further Control of Donations
The AEC, in its October 2000 submission to the Joint Select Committee on Electoral
Matters, recommended that all payments at fundraising events be regarded under the
Commonwealth Electoral Act 1918 as donations or gifts and that limits not be
imposed upon the value of donations.
The reason for the first recommendation is that often parties use inflated prices to
functions as a way of securing donations without necessarily having to reveal the
source. This is because, while in some circumstances it is obvious that such a
purchase is a donation, in others it is not. In addition, it is possible for persons
wanting to make a donation to pay for others to attend such fundraisers, thereby
appearing not to be making a donation, while in reality one person is actually making
a sizeable donation. This is one way in which people make donations but still remain
below the disclosure threshold. While such a recommendation would not be
welcomed by the political parties, unless a better way is found of regulating such
income sources, such a recommendation would be of great use in better identifying
donations to political parties.210
210 Commonwealth of Australia 2000e, Submission to Joint Standing Committee on Electoral Matters Inquiry into Electoral Funding and Disclosure, Australian Electoral Commission, Canberra.

92
The recommendations not to impose limits on donations is drawn from experience in
the United States where such limits have merely pushed donations underground,
thereby making the system even less transparent. In this case, it is better to be able to
account for more of the money, even if it is not limited than to only be able to account
for some of the money because donors find underground methods of making such
donations.
In its funding and disclosure report following the 1996 federal election the AEC also
recommended that political parties be required to identify donations separately from
other receipts. As discussed in Chapter One, currently there is no requirement for
parties to specify which receipts are donations and which are receipts of other
categories. The current arrangement has caused many problems and reduces the
transparency of the system. This recommendation should be adopted.
Anonymous Donations
The AEC has also recommended that the ban on anonymous donations that currently
exists for political parties be extended to associated entities. The ban on anonymous
donations applies, as discussed in Chapter One, on donations that are above a
particular threshold where the name and address of the donor are unknown. This
recommendation closes a loophole that allows such donors to make a donation to an
associated entity instead of a political party, which can then be passed onto a political
party by the associated entity as a way of avoiding disclosure.

93
Gerritsen
Further to these recommendations from the AEC Rolf Gerritsen, in his report Election
Funding Disclosure in Australian Politics also made a number of recommendations
for changes to the funding and disclosure regime in Australia.211 The
recommendations made by Gerritsen are quite representative of recommendations
made by others in relation to the Australian campaign finance regulatory regime.212
Gerritsen proposed the prohibition of corporate and institutional donations as well as a
prohibition on overseas donations. There are points for and against such
recommendations; however, they do not fit within the scope of this paper
specifically.213 Gerritsen also proposed that expenditure limits be introduced for
political parties, that there be restrictions placed on third party and non-official
advertising and the usage of the mass media.
Expenditure Limits
Limiting the expenditure of any group involved in elections has been cited as a way of
reducing the upwardly spiralling costs of elections and campaigns and thereby,
reducing party dependency on donors. Firstly, the results from the research conducted
211 Gerritsen. Part 8 212 cf: Democrats 2001a, Keeping Political Parties Honest: Democrats launch measures to change politics, <http://www.democrats.org.au/news/index.htm?press_id=1611&display=1>. ; Democrats 2001b, Making the B*****DS Honest: Democrats' accountability package, Canberra. ; Tham 2002, 'Legal Regulation of Political Donations in Australia: time for change', in Patmore (ed.), The Big Makeover: a new Australian Constitution, Labor Essays, pp. 72-86, 242-5,62-65. ; Tucker & Young 2002, 'Public Financing of Election Campaigns in Australia: a solution or a problem?' in Patmore (ed.), The Big Makeover: a new Australian Constitution, Labor Essays, pp. 60-71, 241-2, 61-62. 213 In fact a whole other paper could be written on just these two issues.

94
in Chapter Two shows that donations are not the only funding source that parties are
dependent on. Gerritsen also shows in his own paper how donations only make up a
minority of funding for political parties.214
Secondly, as shown in the United States the imposition of such limits purely moves
spending on campaigns from the groups that have their expenditure limited to other
groups. Thirdly, given the position taken by the Australian High Court in the case of
the Australian Capital Television v Commonwealth215 it is highly unlikely that such a
limit would be deemed constitutional. This point particularly highlights again how
efforts to maintain an equal playing field in democracy have to be weighed up against
people’s rights of freedom of expression. This reasoning would also appear to negate
the recommendation of restricting third party and non-official advertising during
elections.
Mass Media Usage
Gerritsen also recommended the reduction of campaign expenditure by requiring all
mass media to provide free advertising or in the alternate, restricting the use of paid
advertising. With regard to the latter suggestion, the evidence shows that the
introduction of such limits in the United States only resulted in the proliferation of
more groups to run advertising.216 In Australia, this would translate into the
proliferation of more and more associated entities and other such groups running
advertisements on behalf of parties in order to circumvent the limits. 214 Gerritsen. Part 9 215 Australian Capital Television Pty Ltd v Commonwealth (1992) 177 CLR 106 216 Gerritsen. Part 8.6

95
The recommendation to require all mass media outlets to provide free advertising to
political parties is one that has been fervently opposed, for obvious reasons, by the
media. In effect, the policy decision has been taken that the operations on political
parties be subsidised by the introduction of public funding in 1984 and the free or
reduced rate use of the mass media only amounts to a further subsidy of party activity.
In fact, the provision of such advertising would probably amount to the freeing up of
party resources for other endeavours and not rectify any existing imbalances between
parties.
My Recommendations
Further Disclosure
The first two recommendations I propose relate to the lack of information that was
available when conducting the research discussed in Chapter Two. Specifically, that
it is not possible to replicate studies from other jurisdictions in Australia due to a lack
of expenditure information at a divisional level. Most of the studies conducted in the
United Kingdom, the United States and Canada that examine the relationship between
money and votes examine spending at the local campaign level on a seat by seat basis.
One of the reasons for this is that this produces a larger sample size and is thus, more
accurate. In the case of the United States, research based on individual House
districts produces a sample of over 400, whereas State based research would only give

96
a sample of 50. In Australia, a division by division examination would give a sample
of 150 as opposed to the sample size of 8 from every State and Territory. Such
division by division studies are not possible at this time in Australia as the data is not
currently available. Due to the centralised structure of the parties in Australia the
Australian campaign finance regulatory system is based on each party’s State or
Territory section making financial returns to the AEC. These returns cover that
party’s finances for all of its constituent parts over the whole State or Territory as
opposed to candidates or campaigns for each seat having to make individual
disclosure returns to the AEC. This is possible as the regime allows endorsed
candidates to have their party include what they would need to disclose as part of the
party’s return. This reflects not only the centralised nature of the major parties
operations but also the fact that it is the major parties that control the operation of the
campaign finance regulatory regime in Australia.
Because of the centralised and entrenched nature of political parties in the Australian
political system any proposal that would loosen the central control of parties over
their constituent parts would surely fail. Therefore, I propose that in the returns of
registered political parties, parties must specify the value of payments made in
relation to the campaign as a whole (nationally or in that State or Territory),
campaigns for the Senate and for each electoral division. In addition, donations that
must be disclosed must be broken down in the same way as payments. These two
changes should be more acceptable to the major parties then separate party unit
returns for each campaign.

97
This would provide a closer level of accountability of candidates themselves as
opposed to just the State or Territory units of the parties. This is because the public
would be able see directly which candidates receive donations and from where and
therefore, the public could more easily identify any potential conflicts of interest or
instances of ‘quid pro quo’ with donors. Similarly, the public would be able to more
easily ascertain how much was expended by each candidate against their opponents.
Such disclosure requirements would also allow for more accurate studies of the role
of money in politics in Australia as more accurate data at a divisional level would be
available and so studies such as those conducted in other jurisdictions referred to in
Chapter Two could also be conducted in Australia.
Associated Entities
The third change that I would recommend is that the above requirements suggested
for registered political parties are also placed upon returns from associated entities so
as not to provide a loophole to avoid such detailed disclosure. In addition, the
disclosure requirements placed on third parties relating to their donations or actions
for a registered political party should also be expended to include associated entities,
so as to make sure that all donations over the threshold are accounted for, either to
political parties or associated entities.
Fourth, as discussed in Chapter Three and in the above recommendations by the
Australian Electoral Commission, tighter definitions are required for terms defining
an associated entity; specifically, the terms ‘to a significant extent’ and ‘benefit’. The

98
recommendations by the AEC in relation to the word ‘significant’ (i.e. that the
benefiting action is more than 50% of the operations of the organisation) are sufficient
as they would provide more clarity. However, in relation to the word ‘benefit’, I feel
that while the recommendations by the AEC are useful in providing a clear
understanding, the definitions recommended by the AEC are open ended so that they
could be construed in a broad or a narrow sense. Therefore, lack the clarity required,
as discussed in Chapter Three. I would recommend that a definition of the term
‘benefit one or more registered political parties’ be:
any action by an organisation that contributes to the success at an election or an increase of membership for one or more registered political parties or any action that is to the detriment of the opponents of one or more registered political parties, whether that opponent is a registered political party or not.
The above definition is broad enough to encompass most actions that are of benefit to
a political party, but would be limited in operation by the term ‘to a significant extent’
in the beginning of the definition of an associated entity. To have a definition that is
too limited would be ignoring the reality of different theatres of battle that are used in
politics in Australia today.
Regularity
Fifth, I would recommend the following changes to reporting timelines disclosure
returns. For publishers and broadcasters, their requirements would remain the same.
For entities that are required to make election returns, they must make a return for
every three months from the beginning of their reporting period, be it from the 31st
day after the previous election or after their endorsement as a candidate, with a final

99
cumulative return at the end of the period. Each return would be required within 28
days of the end of the three month period. For entities that make annual (financial
year) returns, they should be required to submit a return for every quarter, within 28
days of the end of each quarter, with a cumulative return at the end of the financial
year, due within 28 days of the end of the financial year. In addition, returns should
be made available for public inspection within 5 working days of being received by
the AEC.
The reason for recommending these changes is to give the disclosure provisions some
value. Currently, annual (financial year) returns are not made available to the public
until 1 February the following year (this is an approximate delay of 30 weeks) and
election returns are not made available to the public until 24 weeks following polling
day. In either situation the relevant data for any given election will not be made
available to the public until well after the election has been held. The result of this is
that parties and other entities can enter into financial arrangements that could very
well harm them during an election if they were known publicly at election time
because the details of such arrangements are not made publicly available until well
after the election. If political parties and other players in the political process in
Australia are going to be held to account for the way in which they use funds and
from whom they receive funds the electorate must be aware of these facts at the time
of the election. While, the intense election period itself is not as long as three
months, any conduct just prior to an election would become public during an election
and any activity conducted during the election period proper (from the announcement
by the Prime Minister until election day) would be available considerably sooner after
the election than it would currently, while the election is still in the minds of the

100
public. These changes should, therefore, add a new level of accountability to the
disclosure system in place in Australia.
One problem that applies to all of the above recommended regulations is the added
complexity and administrative burden they place on individuals and organisations that
are required to make disclosure returns. This is an issue that has serious
ramifications. The more complex and burdensome the requirements of disclosure are
the more skilled people are required to maintain the appropriate records to meet such
requirements. For small organisations and individuals this can make disclosure
requirements too difficult and therefore unworkable. In addition it means that,
smaller groups are not able to afford to employ people to make sure that they meet
these regulatory requirements, leaving only the main parties and large organisations
able to remain in the political system as the others are not able to comply with
disclosure requirements. Therefore, the added burden of disclosure to maintain
transparency for a more level playing field can in fact be one factor that makes the
political playing field more unlevel. I feel that my recommendations above do not
make the existing reporting requirements more complex, however, I recognise that
they do make them more burdensome. In relation to breaking down expenditure by
division, I am aware of a minor party that already does this, which suggests to me that
such a requirement is not overly burdensome for small parties and that such a
requirement could be absorbed by the major parties. In relation to requiring quarterly
reporting, this will place added burden on all parties, groups and individuals but in
my view the added transparency it will provide will be worth any increases in burden
on parties and other entities. Due to these concerns the above recommendations

101
could be modified so that third parties that are individuals are still only required to
make election period and annual returns as provided under the current regime.
Regulatory Power
Finally, I would recommend that the Australian Electoral Commission be given the
power to make its own regulations, just as the Federal Electoral Commission in the
United States is able to do currently. Currently, there is power for the Governor-
General to make regulations which are required for the administration of the
Commonwealth Electoral Act 1918.217 In practice, this means that such regulations
are prepared and recommended to the Governor-General for his assent by the
government of the day, which in accordance with constitutional convention is always
given. This relates to the bigger issue of the regulated also being the regulators.
Currently, as a representative democracy, the Parliament sets the laws that regulate
elections, including funding and disclosure provisions. This, to a degree, presents a
conflict of interest. As an example, since the 1993 federal election the AEC has made
95 recommendations to the Parliament (through the Joint Select Committee on
Electoral Matters) regarding the funding and disclosure provisions of the
Commonwealth Electoral Act 1918 alone. Of these, eight have been given effect, one
was recommended by the Joint Select Committee but was not condoned by the
government and three have become obsolete. While, these changes were legislative,
there is also potential for changes by regulation, which are currently, in practice, at
the discretion of the relevant Minister. It is for this reason that I believe that the AEC
217 Commonwealth Electoral Act 1918 s395

102
should be given the authority to make regulations relating at least to the funding and
disclosure provisions of the Commonwealth Electoral Act 1918, with the possibility
of expanding the current scope for regulations in these provisions within the Act.
Such regulations, as with all other regulations, would be subject to disallowance by
the Parliament. While this would seem to ultimately leave power with the politicians,
in reality, while such regulations would not have been proposed by a Minister, it
would not be politically expedient in most cases for Members of Parliament to be
seen to be removing regulations that are designed to make them more accountable.
Conclusions
The Australian electoral campaign finance regulatory regime is one that was
established to increase equality for electoral participants, provide a level of
transparency and in doing so provide for a pluralistic society in Australia. To a large
degree the system in Australia has done that. As Gerritsen says, despite its faults, “the
system still makes a worthwhile contribution to the workings of Australian
democracy”. I think this evaluation is accurate. However, this is still a case of ‘close
enough is good enough.’ In its submission to the Joint Standing Committee on
Electoral Matters Inquiry into Electoral Funding and Disclosure the AEC said:218
The legislation’s history to date can be characterised as one of only partial success. Provisions have been, and remain, such that full disclosure can be legally avoided. In short, the legislation has failed to meet its objective of full disclosure to the Australian public of the material financial transactions of political parties, candidates and others.
218 Australia. Australian Electoral Commission 2000c, Submission to Joint Standing Committee on Electoral Matters Inquiry into Electoral Funding and Disclosure, Australian Electoral Commission, Canberra. para. 2.9

103
In the course of this research I have identified a number of deficiencies in the regime,
which I have outlined and make recommendations to resolve. However, on the whole
I think it can be said that the system at least aims to provide for a healthy liberal
democracy in Australia and to a large degree has succeeded.
The issue of the relationship between money and the outcomes of elections brings into
stark contrast the potential problems and pitfalls of a campaign finance regulatory
regime. The effect that money appears to have on the outcome of elections in
Australia demonstrates that economic equality does disrupt political equality within
the Australian democracy. In the course of my research into these effects, gaps in the
disclosure regime were discovered, which show that the system is not as transparent
as one would first think or hope it to be. This research also illustrated the huge gap
that exists between the spending power and power to attract donations between the
major parties (the Australian Labor Party and the Liberal Party/Nationals Coalition)
and the minor parties (the Australian Democrats and the Greens).
The apparent turn to the use of litigation in Australian politics and the use of trusts to
hide the source of funds driving such actions is of grave concern for liberal
democracy in Australia. As discussed in Chapter Three and this chapter, such
litigation will only highlight the financial inequalities of political parties and powers
in Australia. In addition, without clarifications to definitions in the Commonwealth
Electoral Act 1918, the level of transparency required for the public to be aware of
such activity and discrepancies will not be available. Such discrepancies are a
hindrance to a healthy pluralistic society. Coupled with this is the phenomenon of

104
professional politicians and professional politics that has swept the United States and
is now also a reality in Australia. This means that the buying power of the major
parties will give them a greater ability of persuasion in campaigns compared to their
less wealthy counterparts.
Referring back to the three criteria mentioned in Chapter One: equality, transparency
and pluralism; each assessment must be made with a certain degree of pragmatism. Is
the campaign finance system in Australia, with its faults as mentioned in this paper
and the good structures and intent it has put in place, one that enhances or reduces
political equality in Australia? I think that the research shows that while there are
serious flaws in the operation of the system in particular places, overall, the system,
with the use of public funding, goes a long way to provide for a more level political
playing field than many other liberal democracies. Therefore, overall I feel the effect
of the system on political equality is positive, however, the effect of economic
inequalities on political equality needs to be addressed.
Is the system transparent? To a large degree it is if all entities make completely
accurate disclosures, however, the discrepancies in reporting requirements of different
entities creates a complex system with a number of loopholes, meaning that if entities
were so inclined they can circumvent a number of reporting requirements. Therefore,
I feel that the system has achieved a reasonably high level of transparency, especially
when compared to the loopholes that exist in the United States, but that there is a
great deal of room for improvement, as evidenced from the recommendations above.

105
The campaign finance system in Australia has had a positive effect on pluralism in
Australia. The political playing field is more equal than before its introduction and
“the people” are now able to choose between more parties than before the regimes
introduction. This is probably most clearly evidenced by the success in the last two
decades of the Australian Democrats and the Greens, at least in the Senate.
In conclusion, therefore, I feel that the Australian liberal democracy is in a healthy
state of affairs but like all bodies, requires exercise to maintain its health. As politics
in Australia takes new turns the system must also develop. The implementation of the
recommendations in this chapter will put the system on a good footing to maintain the
health of liberal democracy in Australia and so move from one that is close enough to
one that is actually good enough.

10
6
App
endi
x A
: exp
endi
ture
and
vot
e da
ta
Elec
tora
l Exp
endi
ture
s v
Vote
s
Pa
rty
Gro
upin
g by
Sta
te
1993
Exp
endi
ture
19
93 F
P Vo
te
1993
2PP
Vot
e 19
93 S
eats
Won
1996
Exp
endi
ture
19
96 F
P Vo
te
1996
2PP
Vot
e 19
96 S
eats
Won
($)
($)
AL
P
Nat
iona
l 2,
035,
348.
34
18,1
04,9
28.4
0
NSW
3,
633,
432.
00
1,71
4,51
2 1,
898,
256
33
7,
659,
787.
00
1,45
3,54
2 1,
700,
239
20
Vict
oria
1,
997,
939.
03
1,27
2,97
4 1,
381,
417
17
4,
353,
627.
28
1,19
0,40
4 1,
355,
503
16
Que
ensl
and
2,95
6,29
9.09
71
0,37
4 88
4,42
6 13
7,99
6,54
3.66
63
9,51
0 76
5,01
9 2
Wes
tern
Aus
tralia
1,
001,
018.
00
381,
143
445,
462
6
1,84
9,74
9.00
34
7,58
3 39
8,75
5 3
Sou
th A
ustra
lia
2,09
2,00
9.68
35
8,70
7 43
6,65
0 4
1,
119,
500.
00
326,
678
391,
516
2 Ta
sman
ia
130,
632.
00
143,
621
167,
780
4
629,
309.
00
137,
607
159,
853
3 AC
T 36
2,37
4.81
95
,993
11
0,05
5 2
40
6,53
3.89
91
,477
10
5,32
3 3
Nor
ther
n Te
rrito
ry
420,
493.
04
43,5
78
43,5
78
1
202,
697.
09
36,9
94
42,0
03
TO
TAL
14,6
29,5
45.9
9 4,
720,
902
5,36
7,62
4 80
42,3
22,6
75.3
2 4,
223,
795
4,91
8,21
1 49
Li
bera
l Par
ty o
f Aus
tralia
Nat
iona
l 8,
605,
402.
02
12,5
31,6
47.0
0
NSW
3,
015,
091.
89
1,12
7,29
1 1,
176,
605
8
9,04
9,78
7.71
1,
229,
423
1,38
9,05
5 19
Vi
ctor
ia
2,51
5,71
2.00
1,
102,
965
1,18
5,67
5 17
11,3
66,9
98.0
0 1,
106,
556
1,19
0,87
4 19
Q
ueen
slan
d 1,
378,
666.
00
571,
226
689,
821
7
3,10
4,46
6.00
75
7,62
1 86
5,23
8 17
W
este
rn A
ustra
lia
1,60
2,27
2.25
47
4,74
3 52
2,58
0 8
3,
838,
566.
38
440,
647
465,
403
8 S
outh
Aus
tralia
2,
622,
249.
61
421,
687
485,
892
8
3,27
4,62
8.21
46
0,24
6 52
4,44
5 10
Ta
sman
ia
212,
361.
63
129,
132
139,
239
1
1,61
4,38
9.18
13
8,08
7 15
0,05
7 2
ACT
170,
347.
49
61,5
35
69,7
96
605,
621.
44
78,1
09
84,5
92
N
orth
ern
Terr
itory
(CLP
) 85
2,32
6.00
35
,207
35
,207
66
4,04
4.83
38
,302
42
,630
1
TOTA
L 20
,974
,428
.89
3,92
3,78
6 4,
304,
815
49
46
,050
,148
.75
4,24
8,99
1 4,
712,
294
76
Nat
iona
l Par
ty o
f Aus
tralia
Nat
iona
l 1,
101,
892.
00
42,5
27.0
0
NSW
97
4,42
8.00
34
6,19
1 43
2,58
0 8
3,
975,
310.
00
443,
542
521,
349
10
Vict
oria
73
4,20
0.91
13
7,47
0 13
6,75
7 3
2,
018,
595.
42
128,
091
142,
853
2 Q
ueen
slan
d 1,
388,
177.
13
269,
152
251,
888
5
3,44
5,00
7.81
30
6,98
6 29
2,88
4 6
Wes
tern
Aus
tralia
34
,515
.00
2,34
5
472,
542.
63
13,3
33
Sou
th A
ustra
lia
68,8
55.0
0 2,
878
30
,665
.88
Ta
sman
ia
33
,914
.44
1,21
8
AC
T
Nor
ther
n Te
rrito
ry
TO
TAL
4,30
2,06
8.04
75
8,03
6 82
1,22
5 16
10,0
18,5
63.1
8 89
3,17
0 95
7,08
6 18

10
7
Elec
tora
l Exp
endi
ture
s v
Vote
s
Pa
rty
Gro
upin
g by
Sta
te
1993
Exp
endi
ture
19
93 F
P Vo
te
1993
2PP
Vot
e 19
93 S
eats
Won
1996
Exp
endi
ture
19
96 F
P Vo
te
1996
2PP
Vot
e 19
96 S
eats
Won
($)
($)
Au
stra
lian
Dem
ocra
ts
N
atio
nal
62,8
69.0
0
1,
464,
315.
00
N
SW
185,
052.
69
99,8
17
82
2,45
8.57
24
0,25
5
Vi
ctor
ia
47,2
13.0
0 10
1,18
5
520,
118.
00
203,
892
Que
ensl
and
45,3
16.0
7 74
,278
322,
006.
09
129,
244
Wes
tern
Aus
tralia
30
5.00
31
,791
169,
622.
00
55,8
62
Sou
th A
ustra
lia
271,
747.
69
71,9
81
39
8,41
6.44
93
,899
Ta
sman
ia
5,94
4.68
7,
653
80
,281
.37
12,6
96
ACT
3,72
5.07
10
,355
7,52
8.00
Nor
ther
n Te
rrito
ry
TO
TAL
622,
173.
20
397,
060
3,
784,
745.
47
735,
848
Aust
ralia
n G
reen
s
Nat
iona
l 11
,897
.84
33,1
30.0
0
NSW
42
,102
.03
38,3
67
21
3,82
6.00
92
,549
Vi
ctor
ia
14,0
18.8
8 3,
317
23
9,78
4.00
52
,810
Q
ueen
slan
d 60
,943
.89
58,5
02
14
0,40
1.38
47
,379
W
este
rn A
ustra
lia
78,4
61.0
0 55
,907
213,
981.
00
53,1
01
Sou
th A
ustra
lia
2,07
1.35
1,
496
4,
199.
62
27,1
46
Tasm
ania
10
0,14
9.00
24
,319
396,
505.
00
19,6
89
ACT
20,9
53.7
1
58
,787
.00
16,5
96
Nor
ther
n Te
rrito
ry
21
,119
.82
5,32
4
TO
TAL
330,
597.
70
181,
908
1,
321,
733.
82
314,
594
r
0.93
70
0.93
35
0.87
97
0.97
84
0.97
35
0.95
28
r2
0.
8781
0.
8714
0.
7739
0.
9574
0.
9477
0.
9078

10
8
Elec
tora
l Exp
endi
ture
s v
Vote
s
Pa
rty
Gro
upin
g by
Sta
te
1998
Exp
endi
ture
19
98 F
P Vo
te
1998
2PP
Vot
e 19
98 S
eats
Won
2001
Exp
endi
ture
20
01 F
P Vo
te
2001
2PP
Vot
e 20
01 S
eats
Won
($)
($)
AL
P
Nat
iona
l 20
,294
,641
.30
25,4
01,0
56.9
4
NSW
19
,910
,466
.00
1,48
9,02
1 1,
909,
289
22
11
,757
,092
.02
1,38
0,82
2 1,
498,
653
20
Vict
oria
5,
584,
901.
00
1,26
1,28
9 1,
521,
560
19
6,
882,
110.
00
1,23
0,76
4 1,
540,
613
20
Que
ensl
and
7,95
4,21
4.40
71
9,74
3 90
7,25
6 8
4,
668,
799.
57
730,
914
942,
748
7 W
este
rn A
ustra
lia
1,65
7,35
9.00
37
7,54
5 51
5,73
3 7
1,
949,
492.
95
402,
927
525,
355
7 S
outh
Aus
tralia
1,
323,
820.
10
319,
267
400,
587
3
3,86
7,27
1.00
31
6,36
2 39
1,97
3 3
Tasm
ania
1,
047,
890.
00
150,
384
176,
241
5
968,
078.
63
145,
305
177,
833
5 AC
T 36
8,60
2.51
98
,588
12
1,55
2 2
90
2,71
0.18
95
,215
12
3,78
6 2
Nor
ther
n Te
rrito
ry
157,
116.
07
38,4
69
45,9
86
1
491,
586.
53
39,1
11
47,8
52
1 TO
TAL
58,2
99,0
10.3
8 4,
454,
306
5,59
8,20
4 67
56,8
88,1
97.8
2 4,
341,
420
5,24
8,81
3 65
Li
bera
l Par
ty o
f Aus
tralia
Nat
iona
l 12
,255
,956
.69
17,1
13,5
20.0
0
NSW
18
,229
,003
.13
1,13
1,54
5 1,
342,
086
18
14
,013
,515
.00
1,27
2,20
8 1,
499,
576
21
Vict
oria
8,
752,
480.
00
1,05
3,99
0 1,
225,
287
16
11
,304
,471
.00
1,15
4,49
3 1,
317,
417
15
Que
ensl
and
4,51
4,10
8.26
61
5,15
3 80
9,51
5 14
2,33
4,71
2.00
76
7,95
9 90
0,63
9 15
W
este
rn A
ustra
lia
2,80
2,31
0.35
39
7,83
6 52
7,04
2 7
3,
619,
503.
84
449,
036
559,
970
8 S
outh
Aus
tralia
2,
588,
003.
61
389,
382
484,
967
9
5,79
4,53
5.62
43
0,44
1 50
7,14
9 9
Tasm
ania
1,
392,
323.
01
117,
377
131,
236
884,
878.
00
114,
283
130,
185
AC
T 44
9,36
5.71
59
,424
73
,131
86
8,53
8.38
65
,651
78
,880
Nor
ther
n Te
rrito
ry (C
LP)
866,
753.
31
36,0
14
44,9
51
1,63
1,26
0.00
36
,961
43
,309
1
TOTA
L 51
,850
,304
.07
3,80
0,72
1 4,
638,
215
64
57
,564
,933
.84
4,29
1,03
2 5,
037,
125
69
Nat
iona
l Par
ty o
f Aus
tralia
Nat
iona
l 49
4,50
6.00
95
8,03
6.00
NSW
5,
557,
030.
00
293,
126
344,
475
9
4,21
4,23
7.00
34
9,37
2 43
8,46
8 7
Vict
oria
1,
327,
631.
77
77,3
85
95,8
34
2
1,33
3,23
2.00
91
,048
96
,985
2
Que
ensl
and
3,10
7,52
5.96
19
9,18
5 24
4,83
8 5
1,
964,
801.
35
192,
454
210,
263
4 W
este
rn A
ustra
lia
731,
855.
00
13,5
96
51
5,29
0.00
11
,052
S
outh
Aus
tralia
24
,909
.58
4,79
6
44,2
44.0
0
Tasm
ania
ACT
N
orth
ern
Terri
tory
TOTA
L 11
,243
,458
.31
588,
088
685,
147
16
9,
029,
840.
35
643,
926
745,
716
13

10
9
Elec
tora
l Exp
endi
ture
s v
Vote
s
Pa
rty
Gro
upin
g by
Sta
te
1998
Exp
endi
ture
19
98 F
P Vo
te
1998
2PP
Vot
e 19
98 S
eats
Won
2001
Exp
endi
ture
20
01 F
P Vo
te
2001
2PP
Vot
e 20
01 S
eats
Won
($)
($)
Au
stra
lian
Dem
ocra
ts
N
atio
nal
2,29
5,75
9.00
3,
434,
857.
00
N
SW
554,
600.
19
154,
496
46
9,75
2.00
16
0,70
6
Vi
ctor
ia
224,
438.
00
171,
091
20
0,34
5.00
18
4,56
4
Q
ueen
slan
d 18
6,15
4.31
80
,003
229,
295.
15
90,6
79
Wes
tern
Aus
tralia
92
,147
.00
41,3
64
19
9,23
5.65
50
,581
S
outh
Aus
tralia
22
5,68
6.00
93
,905
40
,437
73
0,32
0.76
98
,849
Ta
sman
ia
63,0
96.5
8 10
,024
58,5
13.1
4 13
,785
AC
T 56
,470
.00
14,3
94
13
9,62
1.52
16
,266
N
orth
ern
Terri
tory
4,65
8
4,
795
TOTA
L 3,
698,
351.
08
569,
935
40,4
37
5,46
1,94
0.22
62
0,22
5
Au
stra
lian
Gre
ens
N
atio
nal
40,7
82.8
5
1,
413,
972.
46
N
SW
431,
333.
23
98,6
47
21,3
06
529,
329.
68
180,
079
Vict
oria
11
6,05
6.00
59
,383
17
4,39
6
Q
ueen
slan
d 91
,574
.86
47,4
40
13
2,23
9.22
73
,467
G
reen
sWA
215,
073.
00
52,6
74
36
2,14
1.59
64
,939
S
outh
Aus
tralia
12
,714
.61
4,57
6
90,2
84.0
0 34
,141
Ta
sman
ia
405,
389.
00
17,0
91
10
5,36
7.73
24
,052
AC
T 51
,595
.00
8,14
5
144,
568.
00
14,3
35
Nor
ther
n Te
rrito
ry
17,9
76.8
4 2,
753
3,66
5
TO
TAL
1,38
2,49
5.39
29
0,70
9
2,77
7,90
2.68
56
9,07
4
r 0.
9815
0.
9801
0.
9773
0.
9826
0.
9780
0.
9796
r2
0.96
33
0.96
06
0.95
52
0.96
55
0.95
65
0.95
95

11
0
App
endi
x B
: rec
eipt
and
exp
endi
ture
dat
a To
tal R
ecei
pts
v Ex
pend
iture
Pa
rty
Gro
upin
g by
Sta
te
19
93
1993
1996
19
96
19
98
1998
2001
20
01
Expe
nditu
re ($
) In
com
e ($
)
Expe
nditu
re ($
) In
com
e ($
)
Expe
nditu
re ($
) In
com
e ($
)
Expe
nditu
re ($
) In
com
e ($
) AL
P
N
atio
nal
2,
035,
348.
34
2,83
8,12
2.37
18,1
04,9
28.4
0 18
,793
,702
.21
20
,294
,641
.30
20,3
29,7
37.4
0
25,4
01,0
56.9
4 6,
120,
139.
16
NSW
3,63
3,43
2.00
3,
586,
451.
00
7,
659,
787.
00
7,60
1,05
7.00
19,9
10,4
66.0
0 23
,430
,611
.00
11
,757
,092
.02
14,0
74,7
96.5
3 Vi
ctor
ia
1,
997,
939.
03
1,98
9,15
4.40
4,35
3,62
7.28
4,
637,
304.
71
5,
584,
901.
00
7,27
1,19
0.00
6,88
2,11
0.00
5,
386,
889.
00
Que
ensl
and
2,
956,
299.
09
3,50
5,57
0.00
7,99
6,54
3.66
7,
582,
420.
32
7,
954,
214.
40
7,11
4,33
9.20
4,66
8,79
9.57
5,
801,
511.
09
Wes
tern
Aus
tralia
1,00
1,01
8.00
97
9,13
2.00
1,84
9,74
9.00
2,
010,
027.
00
1,
657,
359.
00
1,81
4,64
5.00
1,94
9,49
2.95
2,
015,
787.
98
Sou
th A
ustra
lia
2,
092,
009.
68
2,02
3,86
0.94
1,11
9,50
0.00
1,
159,
392.
00
1,
323,
820.
10
1,25
6,08
9.70
3,86
7,27
1.00
3,
738,
056.
00
Tasm
ania
130,
632.
00
169,
626.
00
62
9,30
9.00
52
5,69
0.00
1,04
7,89
0.00
51
3,40
4.00
968,
078.
63
821,
711.
18
ACT
36
2,37
4.81
49
0,01
9.70
406,
533.
89
559,
691.
91
36
8,60
2.51
45
9,16
5.03
902,
710.
18
1,04
6,97
7.81
N
orth
ern
Terri
tory
420,
493.
04
355,
143.
77
20
2,69
7.09
32
8,06
7.77
157,
116.
07
190,
009.
23
49
1,58
6.53
53
6,58
8.87
TO
TAL
14
,629
,545
.99
15,9
37,0
80.1
8
42,3
22,6
75.3
2 43
,197
,352
.92
58
,299
,010
.38
62,3
79,1
90.5
6
56,8
88,1
97.8
2 39
,542
,457
.62
Li
bera
l Par
ty o
f Aus
tralia
N
atio
nal
8,
605,
402.
02
7,74
0,97
9.70
12,5
31,6
47.0
0 15
,578
,243
.75
12
,255
,956
.69
12,4
48,5
16.4
5
17,1
13,5
20.0
0 20
,185
,380
.00
NSW
3,01
5,09
1.89
2,
535,
527.
04
9,
049,
787.
71
9,31
0,01
4.23
18,2
29,0
03.1
3 16
,188
,023
.79
14
,013
,515
.00
13,9
71,8
22.0
0 Vi
ctor
ia
2,
515,
712.
00
2,50
9,93
5.00
11,3
66,9
98.0
0 11
,468
,244
.00
8,
752,
480.
00
10,2
68,6
00.0
0
11,3
04,4
71.0
0 12
,083
,690
.00
Que
ensl
and
1,
378,
666.
00
1,17
9,71
1.00
3,10
4,46
6.00
4,
383,
423.
00
4,
514,
108.
26
3,84
7,21
4.68
2,33
4,71
2.00
2,
934,
878.
00
Wes
tern
Aus
tralia
1,60
2,27
2.25
1,
659,
912.
18
3,
838,
566.
38
4,13
8,45
0.79
2,80
2,31
0.35
3,
011,
890.
55
3,
619,
503.
84
4,02
6,64
1.76
S
outh
Aus
tralia
2,62
2,24
9.61
2,
419,
863.
28
3,
274,
628.
21
3,65
5,75
0.71
2,58
8,00
3.61
2,
894,
770.
99
5,
794,
535.
62
5,27
5,24
7.21
Ta
sman
ia
21
2,36
1.63
20
5,00
5.23
1,61
4,38
9.18
1,
669,
896.
77
1,
392,
323.
01
1,22
1,54
1.92
884,
878.
00
925,
865.
00
ACT
17
0,34
7.49
21
4,81
9.22
605,
621.
44
598,
660.
83
44
9,36
5.71
51
0,21
4.51
868,
538.
38
981,
883.
57
Nor
ther
n Te
rrito
ry (C
LP)
85
2,32
6.00
1,
044,
559.
18
66
4,04
4.83
42
5,79
5.16
866,
753.
31
782,
459.
80
1,
631,
260.
00
1,55
7,14
1.00
TO
TAL
20
,974
,428
.89
19,5
10,3
11.8
3
46,0
50,1
48.7
5 51
,228
,479
.24
51
,850
,304
.07
51,1
73,2
32.6
9
57,5
64,9
33.8
4 61
,942
,548
.54
N
atio
nal P
arty
of A
ustra
lia
Nat
iona
l
1,10
1,89
2.00
78
1,68
5.00
42,5
27.0
0 47
,500
.00
5,
557,
030.
00
569,
927.
00
95
8,03
6.00
88
7,62
6.00
N
SW
97
4,42
8.00
1,
457,
151.
00
3,
975,
310.
00
3,96
9,30
1.00
5,55
7,03
0.00
5,
139,
162.
00
4,
214,
237.
00
4,91
1,48
0.00
Vi
ctor
ia
73
4,20
0.91
1,
066,
090.
66
2,
018,
595.
42
2,03
8,51
4.31
1,32
7,63
1.77
1,
349,
608.
51
1,
333,
232.
00
1,24
7,43
4.00
Q
ueen
slan
d
1,38
8,17
7.13
1,
767,
700.
95
3,
445,
007.
81
3,97
3,45
6.99
3,10
7,52
5.96
2,
995,
493.
12
1,
964,
801.
35
2,01
9,58
9.02
W
este
rn A
ustra
lia
34
,515
.00
287,
544.
00
47
2,54
2.63
56
5,83
0.10
731,
855.
00
458,
620.
00
51
5,29
0.00
42
7,33
6.00
S
outh
Aus
tralia
68,8
55.0
0 62
,756
.00
30
,665
.88
34,1
50.6
9
24,9
09.5
8 22
,522
.95
44
,244
.00
40,7
14.0
0 Ta
sman
ia
33,9
14.4
4 24
,040
.08
ACT
Nor
ther
n Te
rrito
ry
TOTA
L
4,30
2,06
8.04
5,
422,
927.
61
10
,018
,563
.18
10,6
52,7
93.1
7
11,2
43,4
58.3
1 10
,535
,333
.58
9,
029,
840.
35
9,53
4,17
9.02

11
1
Tota
l Rec
eipt
s v
Expe
nditu
re
Part
y G
roup
ing
by S
tate
1993
19
93
19
96
1996
1998
19
98
20
01
2001
Ex
pend
iture
($)
Inco
me
($)
Ex
pend
iture
($)
Inco
me
($)
Ex
pend
iture
($)
Inco
me
($)
Ex
pend
iture
($)
Inco
me
($)
Aust
ralia
n D
emoc
rats
N
atio
nal
62
,869
.00
109,
101.
00
1,
464,
315.
00
3,13
4,50
1.00
2,29
5,75
9.00
3,
355,
333.
00
3,
434,
857.
00
3,42
7,14
8.00
N
SW
18
5,05
2.69
20
6,95
2.49
822,
458.
57
621,
418.
77
55
4,60
0.19
53
3,91
0.64
469,
752.
00
507,
116.
00
Vict
oria
47,2
13.0
0 65
,894
.00
52
0,11
8.00
36
9,32
7.00
224,
438.
00
197,
230.
00
20
0,34
5.00
23
5,10
3.00
Q
ueen
slan
d
45,3
16.0
7 58
,760
.65
32
2,00
6.09
23
2,66
5.02
186,
154.
31
208,
598.
96
22
9,29
5.15
24
6,87
3.55
W
este
rn A
ustra
lia
30
5.00
10
,763
.00
16
9,62
2.00
12
2,45
8.00
92,1
47.0
0 89
,484
.00
19
9,23
5.65
17
9,29
5.42
S
outh
Aus
tralia
271,
747.
69
246,
096.
05
39
8,41
6.44
35
6,01
1.47
225,
686.
00
243,
476.
00
73
0,32
0.76
78
5,57
3.20
Ta
sman
ia
5,
944.
68
11,8
31.3
2
80,2
81.3
7 71
,916
.00
63
,096
.58
62,8
96.0
0
58,5
13.1
4 68
,772
.96
ACT
3,
725.
07
4,69
4.14
7,52
8.00
10
,090
.00
56
,470
.00
56,8
20.0
0
139,
621.
52
148,
149.
95
Nor
ther
n Te
rrito
ry
TOTA
L
622,
173.
20
714,
092.
65
3,
784,
745.
47
4,91
8,38
7.26
3,69
8,35
1.08
4,
747,
748.
60
5,
461,
940.
22
5,59
8,03
2.08
Aust
ralia
n G
reen
s
N
atio
nal
11
,897
.84
12,9
60.2
2
33,1
30.0
0 35
,006
.00
40
,782
.85
47,4
97.9
7
1,41
3,97
2.46
1,
466,
397.
20
NSW
42,1
02.0
3 45
,597
.50
21
3,82
6.00
26
5,30
5.00
431,
333.
23
343,
799.
91
52
9,32
9.68
92
3,14
1.22
Vi
ctor
ia
14
,018
.88
21,1
16.3
5
239,
784.
00
246,
731.
00
11
6,05
6.00
11
4,14
7.00
0.00
79
8,19
2.38
Q
ueen
slan
d
60,9
43.8
9 74
,767
.99
14
0,40
1.38
16
4,26
4.87
91,5
74.8
6 11
6,83
5.44
132,
239.
22
170,
863.
12
Wes
tern
Aus
tralia
78,4
61.0
0 10
6,02
7.00
213,
981.
00
290,
382.
00
21
5,07
3.00
24
0,90
1.00
362,
141.
59
473,
339.
00
Sou
th A
ustra
lia
2,
071.
35
3,39
9.65
4,19
9.62
8,
379.
72
12
,714
.61
13,9
01.8
8
90,2
84.0
0 10
8,96
5.00
Ta
sman
ia
10
0,14
9.00
14
8,66
5.00
396,
505.
00
407,
620.
00
40
5,38
9.00
38
2,81
6.00
105,
367.
73
105,
045.
86
ACT
20
,953
.71
22,2
65.0
9
58,7
87.0
0 77
,897
.00
51
,595
.00
54,1
62.0
0
144,
568.
00
165,
550.
00
Nor
ther
n Te
rrito
ry
21,1
19.8
2 32
,206
.81
17
,976
.84
17,9
03.7
7
TOTA
L
330,
597.
70
434,
798.
80
1,
321,
733.
82
1,52
7,79
2.40
1,38
2,49
5.39
1,
331,
964.
97
2,
777,
902.
68
4,21
1,49
3.78
r
0.
9947
0.
9978
0.
9954
0.
9473
r2
0.
9895
0.
9956
0.
9908
0.
8975
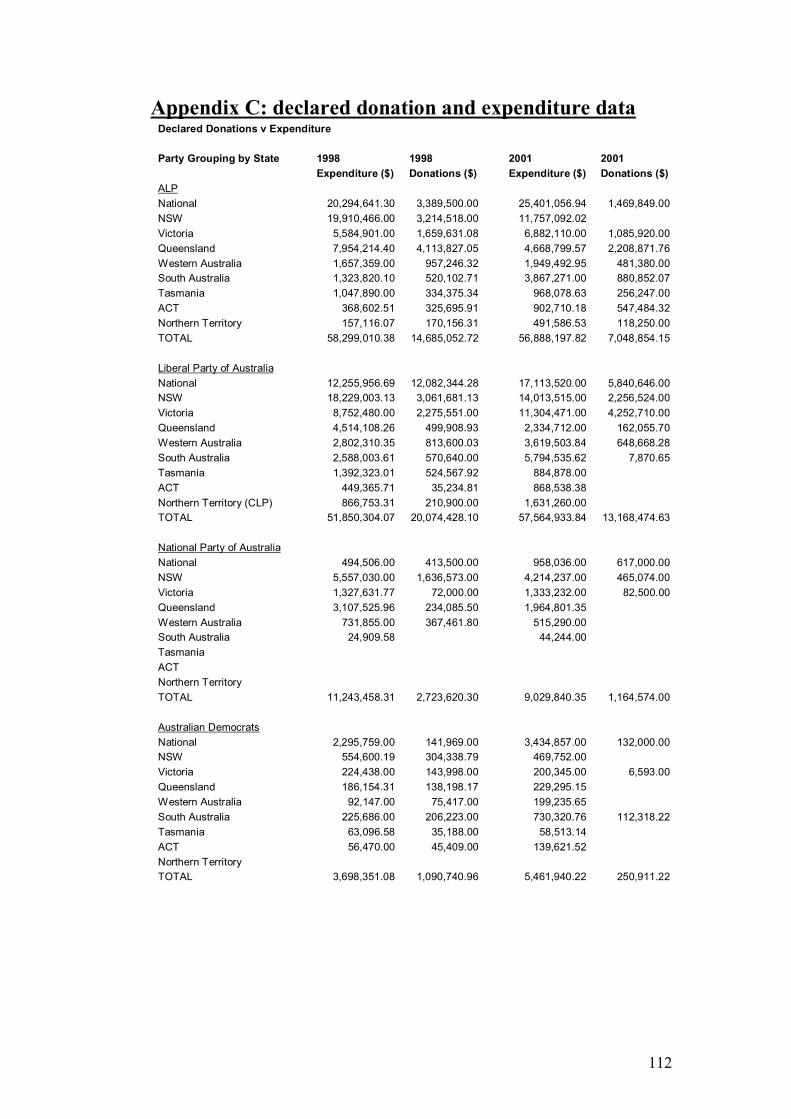
112
Appendix C: declared donation and expenditure data Declared Donations v Expenditure Party Grouping by State 1998 1998 2001 2001 Expenditure ($) Donations ($) Expenditure ($) Donations ($) ALP National 20,294,641.30 3,389,500.00 25,401,056.94 1,469,849.00 NSW 19,910,466.00 3,214,518.00 11,757,092.02 Victoria 5,584,901.00 1,659,631.08 6,882,110.00 1,085,920.00 Queensland 7,954,214.40 4,113,827.05 4,668,799.57 2,208,871.76 Western Australia 1,657,359.00 957,246.32 1,949,492.95 481,380.00 South Australia 1,323,820.10 520,102.71 3,867,271.00 880,852.07 Tasmania 1,047,890.00 334,375.34 968,078.63 256,247.00 ACT 368,602.51 325,695.91 902,710.18 547,484.32 Northern Territory 157,116.07 170,156.31 491,586.53 118,250.00 TOTAL 58,299,010.38 14,685,052.72 56,888,197.82 7,048,854.15 Liberal Party of Australia National 12,255,956.69 12,082,344.28 17,113,520.00 5,840,646.00 NSW 18,229,003.13 3,061,681.13 14,013,515.00 2,256,524.00 Victoria 8,752,480.00 2,275,551.00 11,304,471.00 4,252,710.00 Queensland 4,514,108.26 499,908.93 2,334,712.00 162,055.70 Western Australia 2,802,310.35 813,600.03 3,619,503.84 648,668.28 South Australia 2,588,003.61 570,640.00 5,794,535.62 7,870.65 Tasmania 1,392,323.01 524,567.92 884,878.00 ACT 449,365.71 35,234.81 868,538.38 Northern Territory (CLP) 866,753.31 210,900.00 1,631,260.00 TOTAL 51,850,304.07 20,074,428.10 57,564,933.84 13,168,474.63 National Party of Australia National 494,506.00 413,500.00 958,036.00 617,000.00 NSW 5,557,030.00 1,636,573.00 4,214,237.00 465,074.00 Victoria 1,327,631.77 72,000.00 1,333,232.00 82,500.00 Queensland 3,107,525.96 234,085.50 1,964,801.35 Western Australia 731,855.00 367,461.80 515,290.00 South Australia 24,909.58 44,244.00 Tasmania ACT Northern Territory TOTAL 11,243,458.31 2,723,620.30 9,029,840.35 1,164,574.00 Australian Democrats National 2,295,759.00 141,969.00 3,434,857.00 132,000.00 NSW 554,600.19 304,338.79 469,752.00 Victoria 224,438.00 143,998.00 200,345.00 6,593.00 Queensland 186,154.31 138,198.17 229,295.15 Western Australia 92,147.00 75,417.00 199,235.65 South Australia 225,686.00 206,223.00 730,320.76 112,318.22 Tasmania 63,096.58 35,188.00 58,513.14 ACT 56,470.00 45,409.00 139,621.52 Northern Territory TOTAL 3,698,351.08 1,090,740.96 5,461,940.22 250,911.22

113
Declared Donations v Expenditure Party Grouping by State 1998 1998 2001 2001 Expenditure ($) Donations ($) Expenditure ($) Donations ($) Australian Greens National 40,782.85 8,000.00 1,413,972.46 157,902.88 NSW 431,333.23 130,392.00 529,329.68 Victoria 116,056.00 8,401.00 4,500.00 Queensland 91,574.86 43,334.68 132,239.22 2,000.00 Western Australia 215,073.00 34,254.40 362,141.59 28,200.00 South Australia 12,714.61 90,284.00 Tasmania 405,389.00 23,530.00 105,367.73 ACT 51,595.00 20,729.00 144,568.00 2,000.00 Northern Territory 17,976.84 4,000.00 TOTAL 1,382,495.39 272,641.08 2,777,902.68 194,602.88 r 0.9068 0.8966 r2 0.8222 0.8039
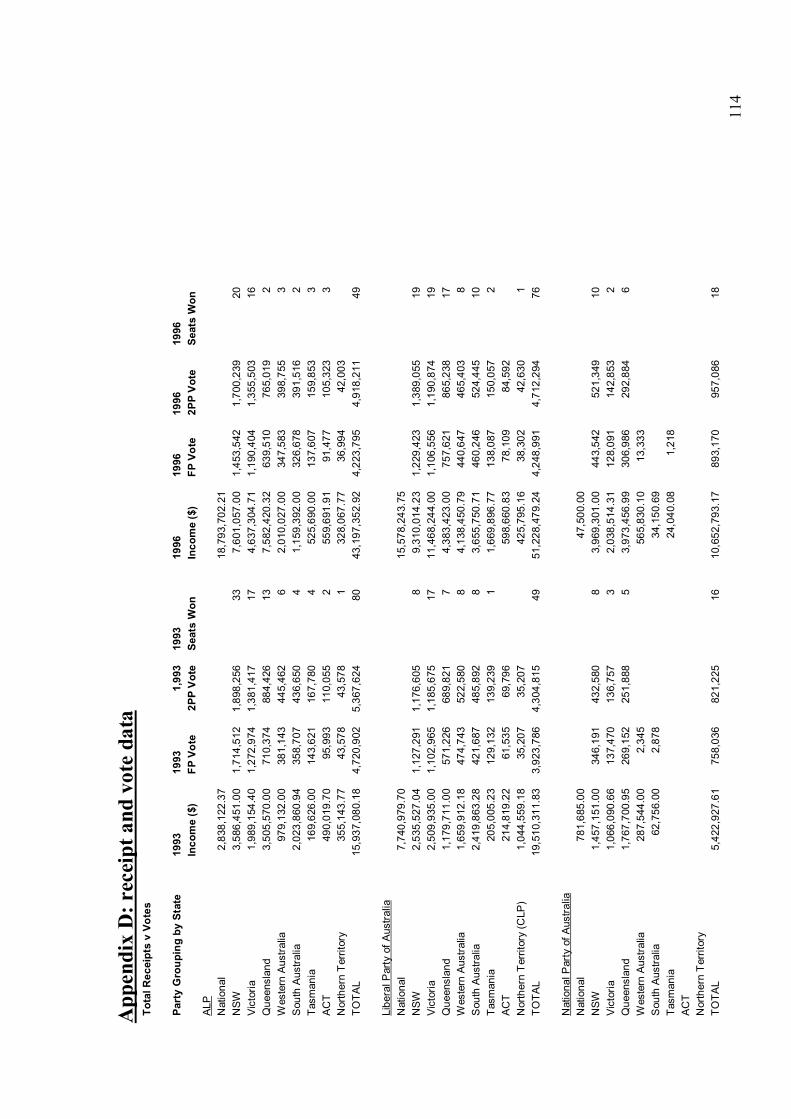
11
4
App
endi
x D
: rec
eipt
and
vot
e da
ta
Tota
l Rec
eipt
s v
Vote
s
Part
y G
roup
ing
by S
tate
1993
19
93
1,99
3 19
93
19
96
1996
19
96
1996
In
com
e ($
) FP
Vot
e 2P
P Vo
te
Seat
s W
on
In
com
e ($
) FP
Vot
e 2P
P Vo
te
Seat
s W
on
ALP
Nat
iona
l
2,83
8,12
2.37
18
,793
,702
.21
N
SW
3,
586,
451.
00
1,71
4,51
2 1,
898,
256
33
7,
601,
057.
00
1,45
3,54
2 1,
700,
239
20
Vict
oria
1,98
9,15
4.40
1,
272,
974
1,38
1,41
7 17
4,63
7,30
4.71
1,
190,
404
1,35
5,50
3 16
Q
ueen
slan
d
3,50
5,57
0.00
71
0,37
4 88
4,42
6 13
7,58
2,42
0.32
63
9,51
0 76
5,01
9 2
Wes
tern
Aus
tralia
979,
132.
00
381,
143
445,
462
6
2,01
0,02
7.00
34
7,58
3 39
8,75
5 3
Sou
th A
ustra
lia
2,
023,
860.
94
358,
707
436,
650
4
1,15
9,39
2.00
32
6,67
8 39
1,51
6 2
Tasm
ania
169,
626.
00
143,
621
167,
780
4
525,
690.
00
137,
607
159,
853
3 AC
T
490,
019.
70
95,9
93
110,
055
2
559,
691.
91
91,4
77
105,
323
3 N
orth
ern
Terri
tory
355,
143.
77
43,5
78
43,5
78
1
328,
067.
77
36,9
94
42,0
03
TO
TAL
15
,937
,080
.18
4,72
0,90
2 5,
367,
624
80
43
,197
,352
.92
4,22
3,79
5 4,
918,
211
49
Li
bera
l Par
ty o
f Aus
tralia
N
atio
nal
7,
740,
979.
70
15,5
78,2
43.7
5
NSW
2,53
5,52
7.04
1,
127,
291
1,17
6,60
5 8
9,
310,
014.
23
1,22
9,42
3 1,
389,
055
19
Vict
oria
2,50
9,93
5.00
1,
102,
965
1,18
5,67
5 17
11,4
68,2
44.0
0 1,
106,
556
1,19
0,87
4 19
Q
ueen
slan
d
1,17
9,71
1.00
57
1,22
6 68
9,82
1 7
4,
383,
423.
00
757,
621
865,
238
17
Wes
tern
Aus
tralia
1,65
9,91
2.18
47
4,74
3 52
2,58
0 8
4,
138,
450.
79
440,
647
465,
403
8 S
outh
Aus
tralia
2,41
9,86
3.28
42
1,68
7 48
5,89
2 8
3,
655,
750.
71
460,
246
524,
445
10
Tasm
ania
205,
005.
23
129,
132
139,
239
1
1,66
9,89
6.77
13
8,08
7 15
0,05
7 2
ACT
21
4,81
9.22
61
,535
69
,796
59
8,66
0.83
78
,109
84
,592
Nor
ther
n Te
rrito
ry (C
LP)
1,
044,
559.
18
35,2
07
35,2
07
425,
795.
16
38,3
02
42,6
30
1 TO
TAL
19
,510
,311
.83
3,92
3,78
6 4,
304,
815
49
51
,228
,479
.24
4,24
8,99
1 4,
712,
294
76
N
atio
nal P
arty
of A
ustra
lia
Nat
iona
l
781,
685.
00
47,5
00.0
0
NSW
1,45
7,15
1.00
34
6,19
1 43
2,58
0 8
3,
969,
301.
00
443,
542
521,
349
10
Vict
oria
1,06
6,09
0.66
13
7,47
0 13
6,75
7 3
2,
038,
514.
31
128,
091
142,
853
2 Q
ueen
slan
d
1,76
7,70
0.95
26
9,15
2 25
1,88
8 5
3,
973,
456.
99
306,
986
292,
884
6 W
este
rn A
ustra
lia
28
7,54
4.00
2,
345
56
5,83
0.10
13
,333
S
outh
Aus
tralia
62,7
56.0
0 2,
878
34
,150
.69
Ta
sman
ia
24,0
40.0
8 1,
218
ACT
Nor
ther
n Te
rrito
ry
TOTA
L
5,42
2,92
7.61
75
8,03
6 82
1,22
5 16
10,6
52,7
93.1
7 89
3,17
0 95
7,08
6 18

11
5
Tota
l Rec
eipt
s v
Vote
s
Part
y G
roup
ing
by S
tate
1993
19
93
1,99
3 19
93
19
96
1996
19
96
1996
In
com
e ($
) FP
Vot
e 2P
P Vo
te
Seat
s W
on
In
com
e ($
) FP
Vot
e 2P
P Vo
te
Seat
s W
on
Aust
ralia
n D
emoc
rats
N
atio
nal
10
9,10
1.00
3,
134,
501.
00
N
SW
20
6,95
2.49
99
,817
621,
418.
77
240,
255
Vict
oria
65,8
94.0
0 10
1,18
5
369,
327.
00
203,
892
Que
ensl
and
58
,760
.65
74,2
78
23
2,66
5.02
12
9,24
4
W
este
rn A
ustra
lia
10
,763
.00
31,7
91
12
2,45
8.00
55
,862
S
outh
Aus
tralia
246,
096.
05
71,9
81
35
6,01
1.47
93
,899
Ta
sman
ia
11
,831
.32
7,65
3
71,9
16.0
0 12
,696
AC
T
4,69
4.14
10
,355
10,0
90.0
0
Nor
ther
n Te
rrito
ry
TOTA
L
714,
092.
65
397,
060
4,
918,
387.
26
735,
848
Au
stra
lian
Gre
ens
Nat
iona
l
12,9
60.2
2
35
,006
.00
N
SW
45
,597
.50
38,3
67
62
1,41
8.77
92
,549
Vi
ctor
ia
21
,116
.35
3,31
7
369,
327.
00
52,8
10
Que
ensl
and
74
,767
.99
58,5
02
23
2,66
5.02
47
,379
W
este
rn A
ustra
lia
10
6,02
7.00
55
,907
122,
458.
00
53,1
01
Sou
th A
ustra
lia
3,
399.
65
1,49
6
356,
011.
47
27,1
46
Tasm
ania
148,
665.
00
24,3
19
71
,916
.00
19,6
89
ACT
22
,265
.09
10,0
90.0
0 16
,596
N
orth
ern
Terri
tory
32
,206
.81
5,32
4
TO
TAL
43
4,79
8.80
18
1,90
8
4,91
8,38
7.26
31
4,59
4
r 0.
9301
0.
9465
0.
9078
0.
9414
0.
9658
0.
9571
r2
0.
8650
0.
8959
0.
8241
0.
8862
0.
9328
0.
9161

11
6
Tota
l Rec
eipt
s v
Vote
s
Part
y G
roup
ing
by S
tate
1998
19
98
1998
19
98
20
01
2001
20
01
2001
In
com
e ($
) FP
Vot
e 2P
P Vo
te
Seat
s W
on
In
com
e ($
) FP
Vot
e 2P
P Vo
te
Seat
s W
on
ALP
Nat
iona
l
20,3
29,7
37.4
0
6,
120,
139.
16
N
SW
23
,430
,611
.00
1,48
9,02
1 1,
909,
289
22
14
,074
,796
.53
1,38
0,82
2 1,
498,
653
20
Vict
oria
7,27
1,19
0.00
1,
261,
289
1,52
1,56
0 19
5,38
6,88
9.00
1,
230,
764
1,54
0,61
3 20
Q
ueen
slan
d
7,11
4,33
9.20
71
9,74
3 90
7,25
6 8
5,
801,
511.
09
730,
914
942,
748
7 W
este
rn A
ustra
lia
1,
814,
645.
00
377,
545
515,
733
7
2,01
5,78
7.98
40
2,92
7 52
5,35
5 7
Sou
th A
ustra
lia
1,
256,
089.
70
319,
267
400,
587
3
3,73
8,05
6.00
31
6,36
2 39
1,97
3 3
Tasm
ania
513,
404.
00
150,
384
176,
241
5
821,
711.
18
145,
305
177,
833
5 AC
T
459,
165.
03
98,5
88
121,
552
2
1,04
6,97
7.81
95
,215
12
3,78
6 2
Nor
ther
n Te
rrito
ry
19
0,00
9.23
38
,469
45
,986
1
53
6,58
8.87
39
,111
47
,852
1
TOTA
L
62,3
79,1
90.5
6 4,
454,
306
5,59
8,20
4 67
39,5
42,4
57.6
2 4,
341,
420
5,24
8,81
3 65
Libe
ral P
arty
of A
ustra
lia
Nat
iona
l
12,4
48,5
16.4
5
20
,185
,380
.00
N
SW
16
,188
,023
.79
1,13
1,54
5 1,
342,
086
18
13
,971
,822
.00
1,27
2,20
8 1,
499,
576
21
Vict
oria
10,2
68,6
00.0
0 1,
053,
990
1,22
5,28
7 16
12,0
83,6
90.0
0 1,
154,
493
1,31
7,41
7 15
Q
ueen
slan
d
3,84
7,21
4.68
61
5,15
3 80
9,51
5 14
2,93
4,87
8.00
76
7,95
9 90
0,63
9 15
W
este
rn A
ustra
lia
3,
011,
890.
55
397,
836
527,
042
7
4,02
6,64
1.76
44
9,03
6 55
9,97
0 8
Sou
th A
ustra
lia
2,
894,
770.
99
389,
382
484,
967
9
5,27
5,24
7.21
43
0,44
1 50
7,14
9 9
Tasm
ania
1,22
1,54
1.92
11
7,37
7 13
1,23
6
92
5,86
5.00
11
4,28
3 13
0,18
5
ACT
51
0,21
4.51
59
,424
73
,131
98
1,88
3.57
65
,651
78
,880
Nor
ther
n Te
rrito
ry (C
LP)
78
2,45
9.80
36
,014
44
,951
1,
557,
141.
00
36,9
61
43,3
09
1 TO
TAL
51
,173
,232
.69
3,80
0,72
1 4,
638,
215
64
61
,942
,548
.54
4,29
1,03
2 5,
037,
125
69
N
atio
nal P
arty
of A
ustra
lia
Nat
iona
l
569,
927.
00
887,
626.
00
0 N
SW
5,
139,
162.
00
293,
126
344,
475
9
4,91
1,48
0.00
34
9,37
2 43
8,46
8 7
Vict
oria
1,34
9,60
8.51
77
,385
95
,834
2
1,
247,
434.
00
91,0
48
96,9
85
2 Q
ueen
slan
d
2,99
5,49
3.12
19
9,18
5 24
4,83
8 5
2,
019,
589.
02
192,
454
210,
263
4 W
este
rn A
ustra
lia
45
8,62
0.00
13
,596
427,
336.
00
11,0
52
Sou
th A
ustra
lia
22
,522
.95
4,79
6
40,7
14.0
0
Tasm
ania
AC
T
N
orth
ern
Terri
tory
TO
TAL
10
,535
,333
.58
588,
088
685,
147
16
9,
534,
179.
02
643,
926
745,
716
13

11
7
Tota
l Rec
eipt
s v
Vote
s
Part
y G
roup
ing
by S
tate
1998
19
98
1998
19
98
20
01
2001
20
01
2001
In
com
e ($
) FP
Vot
e 2P
P Vo
te
Seat
s W
on
In
com
e ($
) FP
Vot
e 2P
P Vo
te
Seat
s W
on
Aust
ralia
n D
emoc
rats
N
atio
nal
3,
355,
333.
00
3,42
7,14
8.00
NSW
533,
910.
64
154,
496
50
7,11
6.00
16
0,70
6
Vi
ctor
ia
19
7,23
0.00
17
1,09
1
235,
103.
00
184,
564
Que
ensl
and
20
8,59
8.96
80
,003
246,
873.
55
90,6
79
Wes
tern
Aus
tralia
89,4
84.0
0 41
,364
179,
295.
42
50,5
81
Sou
th A
ustra
lia
24
3,47
6.00
93
,905
40
,437
78
5,57
3.20
98
,849
Ta
sman
ia
62
,896
.00
10,0
24
68
,772
.96
13,7
85
ACT
56
,820
.00
14,3
94
14
8,14
9.95
16
,266
N
orth
ern
Terri
tory
0.00
4,
658
4,79
5
TO
TAL
4,
747,
748.
60
569,
935
40,4
37
5,59
8,03
2.08
62
0,22
5
Aust
ralia
n G
reen
s
N
atio
nal
47
,497
.97
1,46
6,39
7.20
NSW
343,
799.
91
98,6
47
21,3
06
923,
141.
22
180,
079
Vict
oria
114,
147.
00
59,3
83
79
8,19
2.38
17
4,39
6
Q
ueen
slan
d
116,
835.
44
47,4
40
17
0,86
3.12
73
,467
W
este
rn A
ustra
lia
24
0,90
1.00
52
,674
473,
339.
00
64,9
39
Sou
th A
ustra
lia
13
,901
.88
4,57
6
108,
965.
00
34,1
41
Tasm
ania
382,
816.
00
17,0
91
10
5,04
5.86
24
,052
AC
T
54,1
62.0
0 8,
145
16
5,55
0.00
14
,335
N
orth
ern
Terri
tory
17,9
03.7
7 2,
753
3,66
5
TO
TAL
1,
331,
964.
97
290,
709
4,
211,
493.
78
569,
074
r
0.90
25
0.98
41
0.97
60
0.93
66
0.95
04
0.95
67
r2
0.81
45
0.96
84
0.95
25
0.87
73
0.90
33
0.91
53

11
8
App
endi
x E
: dec
lare
d do
natio
n an
d vo
te d
ata
Dec
lare
d Do
natio
ns v
Vot
es
Pa
rty
Gro
upin
g by
Sta
te
19
98
1998
19
98
1998
2001
20
01
2001
20
01
Dona
tions
($)
FP
Vote
2P
P Vo
te
Seat
s W
on
Do
natio
ns ($
) FP
Vot
e 2P
P Vo
te
Seat
s W
on
ALP
Nat
iona
l
3,38
9,50
0.00
1,
469,
849.
00
N
SW
3,
214,
518.
00
1,48
9,02
1 1,
909,
289
22
0.
00
1,38
0,82
2 1,
498,
653
20
Vict
oria
1,65
9,63
1.08
1,
261,
289
1,52
1,56
0 19
1,08
5,92
0.00
1,
230,
764
1,54
0,61
3 20
Q
ueen
slan
d
4,11
3,82
7.05
71
9,74
3 90
7,25
6 8
2,
208,
871.
76
730,
914
942,
748
7 W
este
rn A
ustra
lia
95
7,24
6.32
37
7,54
5 51
5,73
3 7
48
1,38
0.00
40
2,92
7 52
5,35
5 7
Sou
th A
ustra
lia
52
0,10
2.71
31
9,26
7 40
0,58
7 3
88
0,85
2.07
31
6,36
2 39
1,97
3 3
Tasm
ania
334,
375.
34
150,
384
176,
241
5
256,
247.
00
145,
305
177,
833
5 AC
T
325,
695.
91
98,5
88
121,
552
2
547,
484.
32
95,2
15
123,
786
2 N
orth
ern
Terri
tory
170,
156.
31
38,4
69
45,9
86
1
118,
250.
00
39,1
11
47,8
52
1 TO
TAL
14
,685
,052
.72
4,45
4,30
6 5,
598,
204
67
7,
048,
854.
15
4,34
1,42
0 5,
248,
813
65
Li
bera
l Par
ty o
f Aus
tralia
N
atio
nal
12
,082
,344
.28
5,84
0,64
6.00
NSW
3,06
1,68
1.13
1,
131,
545
1,34
2,08
6 18
2,25
6,52
4.00
1,
272,
208
1,49
9,57
6 21
Vi
ctor
ia
2,
275,
551.
00
1,05
3,99
0 1,
225,
287
16
4,
252,
710.
00
1,15
4,49
3 1,
317,
417
15
Que
ensl
and
49
9,90
8.93
61
5,15
3 80
9,51
5 14
162,
055.
70
767,
959
900,
639
15
Wes
tern
Aus
tralia
813,
600.
03
397,
836
527,
042
7
648,
668.
28
449,
036
559,
970
8 S
outh
Aus
tralia
570,
640.
00
389,
382
484,
967
9
7,87
0.65
43
0,44
1 50
7,14
9 9
Tasm
ania
524,
567.
92
117,
377
131,
236
11
4,28
3 13
0,18
5
ACT
35
,234
.81
59,4
24
73,1
31
65
,651
78
,880
Nor
ther
n Te
rrito
ry (C
LP)
21
0,90
0.00
36
,014
44
,951
36,9
61
43,3
09
1 TO
TAL
20
,074
,428
.10
3,80
0,72
1 4,
638,
215
64
13
,168
,474
.63
4,29
1,03
2 5,
037,
125
69
N
atio
nal P
arty
of A
ustra
lia
Nat
iona
l
413,
500.
00
617,
000.
00
N
SW
1,
636,
573.
00
293,
126
344,
475
9
465,
074.
00
349,
372
438,
468
7 Vi
ctor
ia
72
,000
.00
77,3
85
95,8
34
2
82,5
00.0
0 91
,048
96
,985
2
Que
ensl
and
23
4,08
5.50
19
9,18
5 24
4,83
8 5
192,
454
210,
263
4 W
este
rn A
ustra
lia
36
7,46
1.80
13
,596
11
,052
S
outh
Aus
tralia
0.00
4,
796
Ta
sman
ia
ACT
Nor
ther
n Te
rrito
ry
TOTA
L
2,72
3,62
0.30
58
8,08
8 68
5,14
7 16
1,16
4,57
4.00
64
3,92
6 74
5,71
6 13

11
9
Dec
lare
d Do
natio
ns v
Vot
es
Pa
rty
Gro
upin
g by
Sta
te
19
98
1998
19
98
1998
2001
20
01
2001
20
01
Dona
tions
($)
FP
Vote
2P
P Vo
te
Seat
s W
on
Do
natio
ns ($
) FP
Vot
e 2P
P Vo
te
Seat
s W
on
Aust
ralia
n D
emoc
rats
N
atio
nal
14
1,96
9.00
13
2,00
0.00
NSW
304,
338.
79
154,
496
160,
706
Vict
oria
143,
998.
00
171,
091
6,
593.
00
184,
564
Que
ensl
and
13
8,19
8.17
80
,003
90
,679
W
este
rn A
ustra
lia
75
,417
.00
41,3
64
50,5
81
Sou
th A
ustra
lia
20
6,22
3.00
93
,905
40
,437
11
2,31
8.22
98
,849
Ta
sman
ia
35
,188
.00
10,0
24
13,7
85
ACT
45
,409
.00
14,3
94
16,2
66
Nor
ther
n Te
rrito
ry
4,65
8
4,
795
TOTA
L
1,09
0,74
0.96
56
9,93
5 40
,437
25
0,91
1.22
62
0,22
5
Aust
ralia
n G
reen
s
N
atio
nal
8,
000.
00
157,
902.
88
N
SW
13
0,39
2.00
98
,647
21
,306
180,
079
Vict
oria
8,40
1.00
59
,383
4,50
0.00
17
4,39
6
Q
ueen
slan
d
43,3
34.6
8 47
,440
2,00
0.00
73
,467
W
este
rn A
ustra
lia
34
,254
.40
52,6
74
28
,200
.00
64,9
39
Sou
th A
ustra
lia
4,57
6
34
,141
Ta
sman
ia
23
,530
.00
17,0
91
24,0
52
ACT
20
,729
.00
8,14
5
2,00
0.00
14
,335
N
orth
ern
Terri
tory
4,00
0.00
2,
753
3,66
5
TO
TAL
27
2,64
1.08
29
0,70
9
194,
602.
88
569,
074
0.89
67
0.93
91
0.94
67
0.78
88
0.90
57
0.90
42
0.
8041
0.
8818
0.
8962
0.
6222
0.
8202
0.
8176
120
Bibliography
Abbott Claims Hanson Slush Fund Intentions were Honourable, 2003, ABC News, <http://www.abc.net.au/news/justin/weekly/newsnat-27aug2003-49.htm>.
'Abbott Denies Trust-Fund Favours', 2003, News.com.au, 27 August 2003. Abbott Refuses to 'dob in' Fund Contributors, 2003, Australian Broadcasting
Corporation, <http://www.abc.net.au/news/justin/weekly/newsnat-27aug2003-29.htm>.
Abbott, T 2003, One Nation Litigation, Manly, 26 August 2003, Media Release, <http://www.tonyabbott.com.au/onenation.html>.
Abbott Understands Hanson Anger, 2003, ABC News, <http://www.abc.net.au/news/newsitems/s933344.htm>.
About the 500 Club, 500 Club, viewed 12 October 2003 2003, <http://www.500club.com.au/info/about/about500.htm>.
Ackerman, B & Ayres, I 2002, Voting With Dollars: a new paradigm for Campaign Finance, Yale University Press, New Haven.
Adamany, D & Agree, G 1975, Political Money, Johns Hopkins University Press, Baltimore.
Adamany, D W 1972, Campaign Finance in America. Alexander, H E 1972, Political Financing, Critical Issues in Political Science,
Burgess Publishing Company, Minneapolis. Alexander, H E 1976, Financing Elections: money, elections and political
reform, Congressional Quarterly Press, Inc, Washington, DC. Alexander, H E (ed.) 1989, Comparative Political Finance in the 1980s,
Cambridge University Press, Cambridge. Atkins, D 2003, 'Review May Unveil Fighting Fund Donors', The Courier-Mail,
28 August 2003, p. 4. Australia. Australian Electoral Commission AEC Funding and Disclosure -
Glossary, Australian Electoral Commission, 2003, <http://search.aec.gov.au/annualreturns/arwGlossary.htm>.
Australia. Australian Electoral Commission 1988a, Election Funding and Financial Disclosure: report on the operation of Part XX of the Commonwealth Electoral Act 1918 in relations to the elections held on 11 July 1987, Australian Electoral Commission, Canberra.
Australia. Australian Electoral Commission 1988b, Election Funding and Financial Disclosure: report on the operation of Part XX of the Commonwealth Electoral Act 1918 in relation of the elections held on 11 July 1987, Canberra.
Australia. Australian Electoral Commission 1991, Election Funding and Financial Disclosure Report for the elections for the House of Representatives and the Senate held on 24 March 1990, Australian Electoral Commission, Canberra.
Australia. Australian Electoral Commission 1995, Election Funding and Financial Disclosure Report for the election for the House of Representatives and the Senate held on 13 March 1993, Canberra.
Australia. Australian Electoral Commission 1996, Funding and Disclosure Handbook for Political Parties, Australian Government Printing Service, Canberra.

121
Australia. Australian Electoral Commission 1997, Funding and Disclosure Report Following the Federal Election Held On 2 March 1996, Canberra.
Australia. Australian Electoral Commission 1999, Election Statistics 1993, 1996, 1998, Australian Electoral Commission, 2003.
Australia. Australian Electoral Commission 2000a, Funding and Disclosure Handbook for Associated Entities, Australian Government Printing Service, Canberra.
Australia. Australian Electoral Commission 2000b, Funding and Disclosure Handbook for Political Parties, Australian Government Printing Service, Canberra.
Australia. Australian Electoral Commission 2000c, Funding and Disclosure Handbook for Third Parties, Australian Government Printing Service, Canberra.
Australia. Australian Electoral Commission 2000d, Submission to Joint Standing Committee on Electoral Matters Inquiry into Electoral Funding and Disclosure, Australian Electoral Commission, Canberra.
Australia. Australian Electoral Commission 2000e, Funding and Disclosure Report following the Federal Election held on 3 October 1998, Australian Electoral Commission, Canberra.
Australia. Australian Electoral Commission 2001a, Funding and Disclosure Handbook for Broadcasters and Publishers, Australian Government Printing Service, Canberra.
Australia. Australian Electoral Commission 2001b, Funding and Disclosure Handbook for Candidates, Australian Government Printing Service, Canberra.
Australia. Australian Electoral Commission 2001c, Attachment H - Status Report on Progress of FAD Recommendations from the 1993 Federal Election Onwards, 147H, Australian Electoral Commission, Canberra.
Australia. Australian Electoral Commission 2001d, Submission to the Joint Standing Committee on Electoral Matters Inquiry into Electoral Funding and Disclosure, 15, Australian Electoral Commission, Canberra.
Australia. Australian Electoral Commission 2002a, Election Statistics 2001, Australian Electoral Commission, 2003.
Australia. Australian Electoral Commission 2002b, Submission to the Joint Standing Committee on Electoral Matters: the conduct of the 2001 federal election, 147, Australian Electoral Commission, Canberra.
Australia. House of Representatives 'Debates', 2 November 1983. Australia. Parliament. Joint Standing Committee on Electoral Matters 1989, Who
Pays the Piper Calls the Tune - minimising the risks of funding political campaigns: inquiry into the conduct of the 1987 federal election and 1988 referendums, 4, Parliament of the Commonwealth of Australia, Canberra.
Australia. Parliament. Joint Standing Committee on Electoral Matters 1994, Financial Reporting by Political Parties: interim report from the Joint Standing Committee on Electoral Matters on the inquiry into the conduct of the 1993 election and matters related thereto, Australian Government Printing Service, Canberra.
Australia. Parliament. Joint Standing Committee on Electoral Matters 1997, The 1996 Federal Election: report of the inquiry into the conduct of the 1996 federal election and matters related thereto, Canberra.

122
Australian Capital Television Pty Ltd v Commonwealth (1992) 177 CLR 106 Bagman, B 2003, All the political donation figures, Crikey, viewed 15/02/2003
2003, <http://www.crikey.com.au/politics/2003/02/03/20030203donations.html>.
Barbeau Committee 1966, Report on Canadian Political Finance. Beetham, D 1998, 'Legitimacy', in E Craig (ed.), Routledge Encyclopedia of
Philosophy, Routledge, London. Beitz, C R 1984, 'Political Finance in the United States: a survey of research',
Ethics, vol. 95, pp. 129-48. Bennett, S 1996, Winning and Losing: Australian national elections, Melbourne
University Press, Carlton South. Bennett, S 2002, Australia's Political Parties: more regulation?, 21, Politics and
Public Administration Group, Information and Reaseach Services, Deartment of the Parliamentary Library, Commonwealth of Australia, Canberra.
Bogdanor, V 1982, 'Reflections on British Political Finance', Parliamentary Affairs, vol. 35, pp. 367-80.
Bowler, S, Farrell, D M & McAllister, I 1996, 'Constituency campaigning in parliamentary systems with preferential voting: is there a paradox?' Electoral Studies, vol. 15, no. 4, pp. 461-76.
Brass, P R 1994, 'Elite Competition and Nation-Formation', in J Hutchinson & AD Smith (eds), Nationalism, Oxford University Press, Oxford, pp. 83-9.
Buckley v Valeo (1976) 424 US 1 Burnell, P & Ware, A (eds) 1998, Funding Democratization, Manchester
University Press, Manchester. Butler, D & Kavanagh, D 1974, The British General Election of February 1974,
Macmillan, London. Cain, M 2002, Scoping Paper - Political Parties, the State and Voters, ippr. 'Calm down' about Abbott, says PM, 2003, viewed 27 August 2003 2003,
<http://www.theage.com.au/articles/2003/08/27/1061663840573.html>. Carty, R K & Eagles, M 1999, 'Do Local Campaigns Matter? Campaign
spending, the local canvass and party support in Canada', Electoral Studies, vol. 18, pp. 69-87.
Cass, D & Burrows, S 2000, 'Commonwealth Regulation of Campaign Finance: public funding, disclosure and expenditure limits', Sydney Law Review, vol. 22, no. 4, pp. 477-526.
Chaples, E 1994, 'Developments in Austrlian Election Finance', in HE Alexander & R Shiratori (eds), Comparative Political Finance Among the Democracies, Westview Press.
Coleman, P 2003, 'Abbott Deserves a Medal', The Australian, 28 August 2003, p. 11.
Commonwealth Electoral Act, 1918. Corrado, A, Mann, T E, Ortiz, D R, Potter, T & Sorauf, F J (eds) 1997,
Campaign Finance Reform: a source book, The Brookings Institution, Washington, DC.
Cox, G W & McCubins, M D 1997a, 'Toward a Theory of Legislative Rules Changes: assessing Schickler and Rich's evidence', American Journal of Political Science, vol. 41, no. 4, pp. 1376-86.

123
Cox, G W & McCubins, M D 1997b, 'Toward a Theory of Legislative Rules Changes: assessing Schikler and Rich's evidence', American Journal of Political Science, vol. 41, no. 4, pp. 1376-68.
Crabb, A 2003, 'Ethanol Company Doubled Donation before Fuel Ruling', The Age, 4 February 2003, p. 4.
Crewe, I & Harrop, M (eds) 1986, Political Communications: the general election campaign of 1983, Cambridge University Press, Cambridge.
Crewe, I & Harrop, M (eds) 1989, Political Communications: the general election campaign of 1987, Cambridge University Press, Cambridge.
Crikey Team & Shareholders, F W 2002, Money seems to be able to buy Westfield all the influence it wants, Crikey, viewed 15/02/2003 2003, <http://www.crikey.com.au/politics/2002/05/26/20020526westfieldmay.html>.
Day, S 2003, Fischer Knew of Slush Fund in 1998, viewed 27 August 2003 2003, <http://www.theage.com.au/articles/2003/08/27/1061663835437.html>.
Delegate, D 2002, Who is funding Greg Sword's re-election bid?, Crikey, viewed 15/02/2003 2003, <http://www.crikey.com.au/politics/2002/07/14/20020714delladelegate.html>.
Democrats, A 2001a, Making the B*****DS Honest: Democrats' accountability package, Canberra.
Democrats, A 2001b, Keeping Political Parties Honest: Democrats launch measures to change politics, 2003, <http://www.democrats.org.au/news/index.htm?press_id=1611&display=1>.
Denver, D 1994, Elections and Voting Behaviour in Britian, 2nd edn, Prentice-Hall/Harvester Wheatsheaf, Hemel Hempstead.
Denver, D & Hands, G 1997, 'Challengers, Incumbents and the Impact of Constituency Campaigning in Britain', Electoral Studies, vol. 16, pp. 175-93.
Dharmapala, D 2002, 'Campaign War Chests, Entry Deterrence, and Voter Rationality', Economics and Politics, vol. 14, no. 3, pp. 325-50.
Dodd, T 1994, 'Public Funding of Election Campaigns', in AEC Commonwealth of Australia, Information Section, (ed.), The People's Say, Australian Government Printing Service, Canberra, pp. 32-4.
Dodson, L 2003, 'Watchdog Eyes Fighting Fund', The Age, 28 August 2003, p. 3. Dunn, D, D. Financing Presidential Campaigns. Duverger, M 1964, Political Parties, 3rd edn, Methuen, London. Eagles, M 1993, 'Money and votes in Canada: campaign spending and
parliamentary election outcomes, 1984-1988', Candadian Public Policy, vol. 19, pp. 432-49.
Ellis, B 2002, Goodbye Babylon: further journeys in time and politics, Viking / Penguin, Camberwell.
Ewing, K 1992, 'The Legal Regulation of Electoral Campaign Financing in Australia: a preliminary study', Western Australia Law Review, vol. 22, pp. 239-56.
Ewing, K 1992, Money, Politics and Law, Clarendon Press, Oxford. Farrow, I 1995, 'Politicians Inc.' IPA Review, vol. 47, no. 4.

124
Fisher, J 1997, 'Political Parties: financial costs of party organisation and activities', paper presented to Economic and Social Research Council Research Seminar Series on Political Parties.
Fisher, J 1999, 'Party Expenditure and Electoral Prospects: a national level analysis of Britain', Electoral Studies, vol. 18, no. 4, pp. 519-32.
Fisher, J 2002, Party Finance: is more reform still needed?, IPPR. Forbes, M 1998, 'Hanson Confidante Sues Party', The Age, 29 August 1998, p. 3. Forrest, J 1997, 'The Effects of Local Campaign Spending on the Geography of
the Flow-of-the-Vote at the 1991 New South Wales State Election', Australian Geographer, vol. 28, no. 2, pp. 229-40.
Forrest, J & Marks, G N 1999, 'The mass media, election camapigning and voter response: the Australian experience', Party Politics, vol. 5, no. 1, pp. 99-114.
Forrest, J, Johnston, R J & Pattie, C J 1999, 'The effectiveness of constituency campaign spending in Australian state elections....' Environment and Planning A, vol. 31, pp. 1119-28.
Franklin, M N & Wlezien, C (eds) 2002, The Future of Election Studies, First edn, Pergamon / Elsevier Science, Oxford.
Gerritsen, R 1995, Election Funding Disclosure and Australian Politics: debunking some myths, 21, Information and Research Service, Parliament House Library, Commonwealth of Australia, Canberra.
Gilchrist, M, Marris, S & Videnieks, M 2003, 'AEC Launches New Trust Inquiry', News.com.au, 28 August 2003.
Glasgow, G 2002, 'The Efficiency of Congressional Campaign Committee Contributions in House Elections', Party Politics, vol. 8, no. 6, pp. 657-72.
Grant, J T & Rudolph, T J 2002, 'To Give or Not to Give: Modeling Individuals Contributions Decisions', Political Behavior, vol. 24, no. 1, pp. 31-54.
Gray, G 1996, 'Labor and the 1996 Federal Election (Political party funding. Address to The Sydney Institute, 18 June 1996)', The Sydney Papers, vol. 8, no. 3, pp. 48-55.
Green, A 2003, 'Perlis of Pauline: her breach of 'club' rules was technical rather than deceit', Sydney Morning Herald, 22 August 2003, p. 11.
Green, D P & Krasno, J S 1988, 'Salvation for the Spendthrift Incumbent: the Effects of Campaign Spending in House Elections', American Journal of Political Science, vol. 32, pp. 884-907.
Green, D P & Krasno, J S 1990, 'Rebuttal to Jacobson's 'New Evidence for Old Arguments'', American Journal of Political Science, vol. 34, pp. 363-72.
Green, M J, Fallows, J M & Zwick, D R 1972, Who Runs Congress? The President, big business or you?, Ralph Nader Congress Project, Bantam Books, New York.
Hallett, B 2003, Electoral Disclosure Obligations, Australian Electoral Commission, Canberra, 5 September 2003, Media Release, <http://www.aec.gov.au/_content/What/media_releases/2003/sep/elec_disc_oblig.htm>.
Harders, C 1981, Inquiry into Disclosure of Electoral Expenditure, Canberra. Harrison, R 1998, 'Democracy', in E Craig (ed.), Routledge Encyclopedia of
Philosophy, Routledge, London. Held, D 1987, Models of Democracy, Standford University Press, Standford. Heywood, A 1992, Political Ideologies: an introduction, MacMillan, London.

125
Hogberg, D 2002, 'Rethinking the Party Cartel Model: an analysis of the Bolling committee reforms', paper presented to Annual Meeting of the Northeastern Political Science Association, Providence, Rhode Island, November 2002.
Hughes, C A 1992, 'Australia and New Zealand', in D Butler & A Ranney (eds), Electioneering: a comparative study of continuity and change, Clarendon Press, Oxford, pp. 88-109.
Inside One Nation (4 Corners) 1998, Television, 10 August 1998. Distributed by Australian Broadcasting Corporation.
ippr 2003, ippr- research, ippr, viewed 05/04/2003 2003, <http://www.ippr.org.uk/research/index.php?project=92¤t=22>.
Jacobson, G 1978, 'The Effects of Campaign Spending in Congressional Elections', American Political Science Review, vol. 72, pp. 469-91.
Jacobson, G 1980, Money In Congressional Elections, Yale University Press, New Haven.
Jacobson, G 1990, 'The Effects of Campaign spending in House Elections: New Evidence for Old Arguments', American Journal of Political Science, vol. 34, pp. 334-62.
Jacobson, G C 1980, Money in Congressional Elections, Yale University Pres, New Haven.
Johnston, R J 1986, 'Information Provision and Individual Behaviour: a case study of voting at an English general election', Geographical Analysis, vol. 18, pp. 129-41.
Johnston, R J 2003, Re: Effects of Campaign Spending on Election Outcomes in Australia, Perth, 22 April 2003, Email.
Johnston, R J & Pattie, C J 1995, 'The Impact of Spending on Party Constituency Campaigns in Recent British General Elections', Party Politics, vol. 1, no. 2, pp. 261-73.
Johnston, R J, Pattie, C J & MacAllister, I 1998, 'Funding constituency campaigns at British general elections', in The Funding of Political Parties in the United Kingdom: report of the Committee on Standards in Public Life, inquiry into the funding of political parties, HMSO, London.
Johnston, R J, MacAllister, I & Pattie, C J 1999, 'The Funding of Constituency Party General Election Campaigns in Great Britain', Environment and Planning C: Government and Policy, vol. 17, pp. 391-409.
Jones, P 1998, 'Freedom of Speech', in E Craig (ed.), Routledge Encyclopedia of Philosophy, Routledge, London.
Hanson's Fall the Result of Long Campaign 2003, Television, Melbourne, 21 August 2003. Distributed by Australian Broadcasting Corporation.
Kavanagh, D 1970, Constituency Electioneering in Britain, Longman, London. King, A 1997, Running Scared, Free Press, New York. Kingston, M 2003a, Tony Abbot's Dirty Hanson Trick - and He Lied About it, of
course, viewed 27 August 2003 2003, <http://www.smh.com.au/articles/2003/08/26/1061663783129.html>.
Kingston, M 2003b, Hanson Sinks Abbott: is Howard in danger?, viewed 27 August 2003 2003, <http://www.smh.com.au/articles/2003/08/22/1061529330032.html>.
Kobrak, P 2002, Cozy Politics: political parties, campaign finance, and compromised governance, Lynne Rienner Publishers, Boulder.

126
Kuntz, P 1997, 'DNC Invites for Clinton Coffees Perked Along with $25,000 Price Tag, a Businessman Recalls', Wall Street Journal, 8 October 1997, p. A24.
La Canna, X 2003, Howard Knew of Abbott Slush Fund, viewed 27 August 2003 2003, <http://www.theage.com.au/articles/2003/08/27/1061663819143.html>.
Lewis, N A & Oppel Jr, R A 2003, US Court Issues Dicordant Ruling on Campaign Law, The New York Times, viewed 5/05/2003 2003, <http://www.nytimes.com/2003/05/03/politics/03DONA.html?ex=1053097606&ei=1&en=4307bb4e7cf1da2c>.
Lewis, S, Walker, J & Meade, K 2003, 'Nothing Secret or Illegal: Abbott', The Australian, 27 August 2003, p. 1.
Lincoln, A 1863, The Gettysburg Address, Associated Press, Gettysburg, 19 November 1863, Speech.
Linton, M 1994, Money and Votes, ippr. Lloyd, C 1990, 'The 1990 Media Campaign', in C Bean, I McAllister & J
Warhurst (eds), The Greening of Australian Politics - the 1990 federal election, Longman-Cheshire, Melbourne, pp. 92-113.
Locke, J 1971, 'The True End of Civil Government (Second Treatise on Civil Government)', in E Barker (ed.), Social Contract, Oxford University Press, London.
Lovell, D & Moore, R D 1992, Essay Writing and Style Guide for Politics and the Social Sciences, Australiasian Political Studies Association, Canberra.
Maarek, P J 1995, Political Marketing and Communication, English edn, John Libbey, London.
Machiavelli, N (1532) 1999, The Prince, New edn, Penguin Classics, Penguin Books, London.
MacPherson, C B 1977, The Life and Times of Liberal Democracy, Oxford University Press, Oxford.
Maddox, G 2000, Australian Democracy in Theory and Practice, 4th edn, Longman, Sydney.
Mayne, S 2000, Let's Fact It, Cash for Preferences is Rife in Australia, Crikey, viewed 15/02/2003 2003, <http://www.crikey.com.au/politics/2000/12/03/20001203prefdeal.html>.
Mayne, S 2002, The biggest Labor fundraiser in history, Crikey, viewed 15/2/2003 2003, <http://www.crikey.com.au/politics/2002/11/11/20021111laborfundraiser.html>.
Mayne, S 2003, Dodgey gongs 2003, Crikey, viewed 15/02/2003 2003, <http://www.crikey.com.au/politics/2003/01/22/20030122gongs.html>.
McAllister, I 1992, Political Behaviour: citizens, parties and elites in Australia, Longman-Cheshire, Melbourne.
McCarty, N, Poole, K T & Rosenthal, H 2000, The Hunt for Party Discipline in Congress, Columbia University, University of Houston & Princeton University.
McCloskey, H J 1986, 'Mill's Liberalism', in D Muschamp (ed.), Political Thinkers, MacMillan, Crows Nest, pp. 177-93.
Meade, K, Shanahan, D & Staff Reporters 2003, '"The Truth Has Set Us Free"', The Australian, 7 November 2003, p. 1.

127
Mill, J S 1991, On Liberty, In Focus, Routledge, London. Mills, S 1986, The New Machine Men: polls and persuasion in Australian
politics, Penguin, Melbourne. Moon, J & Stone, B (eds) 2002, Power and Freedom in Modern Politics,
Contemporary Issues, University of Western Australia Press, Crawley. Niesche, C 1998, 'Hanson Finally Gets Poll Funds', The Australian, 3 September
1998, p. 4. Abbott Defends Slush Fund Allegations 2003, Television, S Taylor, Sydney, 2
August 2003. Distributed by Australian Broadcasting Corporation. opensecrets.org Federal Campaign Finance Law: new contribution limits, The
Center for Responsive Politics, viewed 12/05/2003 2003, <http://www.opensecrets.org/basics/law/index.asp>.
opensecrets.org What is a PAC?, The Center for Responsive Politics, viewed 13/05/2003 2003, <http://www.opensecrets.org/pacs/pacfaq.asp>.
opensecrets.org Background on Soft Money, The Center for Responsive Politics, viewed 13/05/2003 2003, <http://www.opensecrets.org/pubs/glossary/softmoney.htm>.
opensecrets.org 2003a, Campaign Finance Reform: the issue, The Center for Responsive Politics, viewed 14/05/2003 2003, <http://www.opensecrets.org/news/campaignfinance/index.asp>.
opensecrets.org 2003b, Tracking the Payback - Campaign Finance Reform, The Center for Responsive Politics, viewed 12/05/2003 2003, <http://www.opensecrets.org/payback/issue.asp?issueid=CFR&CongNo=107>.
Parkin, A 2002, 'Liberal Democracy', in J Summers, D Woodland & A Parkin (eds), Government, Politics, Power and Policy in Australia, 7th edn, Longman, Frenchs Forest, pp. 297-321.
Pateman, C 1970, Particpation and Democratic Theory, Cambridge University Press, Cambridge.
Patterson, S, C 1994, 'Legislative Leviathan: party government in the House', American Political Science Review, vol. 88, no. 2, pp. 466-4667.
Pattie, C J, Johnston, R J & Fieldhouse, E A 1995, 'Winning the Local Vote: the effectiveness of constituency campaign spending in Great Britain, 1983-1992', The American Political Science Review, vol. 89, no. 4, pp. 969-83.
Pavey, A & Klot, S 2003, Released After 78 Days in Jail, News.com.au, viewed 6 November 2003 2003, <http://www.news.com.au/common/story_page/0,4057,7787014%255E2,00.html>.
Pinto-Duschinsky, M 1981, British Political Finance 1830-1980, American Enterprise Institute, Washington, DC.
Reid, C 2001, 'Future Matters More Than Past', Sunday Telegraph, 4 November 2001.
Riley, M 2003, 'Anti-rorting Proposals Ignored', Sydney Morning Herald, 4 September 2003.
Rosenberg, L 1996a, 'Soft Money', in A Bag of Tricks: loopholes in the campaign finance system, Center for Responsive Politics, Washington, DC.
Rosenberg, L 1996b, 'Issue Advocacy', in A Bag of Tricks: loopholes in the campaign finance system, Center for Responsive Politics, Washington, DC.

128
Rosenberg, L 1996c, 'Independent Expenditures', in A Bag of Tricks: loopholes in the campaign finance system, The Center for Responsive Politics, Washington, DC.
Rosenberg, L 1996d, 'Politicians' Non-profit Organizations', in A Bag of Tricks: loopholes in the campaign finance system, The Center for Responsive Politics, Washington, DC.
Rosenberg, L 1996e, 'Leadership PACs', in A Bag of Tricks: loopholes in the campaign finance system, The Center for Responsive Politics, Washington, DC.
Rousseau, J-J (1762) 1993, The Social Contract and Discourses, Everyman, London.
Saffell, D C 1974, Watergate: its effects on the american political system, Winthrop Publishers, Inc, Cambridge, Massachusetts.
Schickler, E & Rich, A 1997, 'Party Government in the House Reconsidered: a response to Cox and McCubbins', American Journal of Political Science, vol. 41, no. 4, pp. 1387-94.
Schumpeter, J A (1942) 1994, Capitalism, Socialism and Democracy, Routledge, London.
Seccombe, M 2001, Sydney Morning Herald, 19 September 2001. Shearman, B 2002, ALP's rivers of gold, Crikey, viewed 15/02/2003 2003,
<http://www.crikey.com.au/politics/2002/11/25/20021125ALPfunding.html>.
Snow, D 2000, 'Absolute Abbott', Sydney Morning Herald, 11 March 2000, pp. 1, 4-5.
Sorauf, F J 1992, Inside Campaign Finance: myths and realities, Yale University Press, New Haven.
Sorensen, T C 1975, Watchmen in the Night: Presidential accountability after Watergate, MIT Press, Cambridge, Massachusetts.
Starr, P 1997, 'Democracy v. Dollar', The American Prospect, vol. 8, no. 31. Stencel, M 1997, The Reforms, washingtonpost.com, viewed 10/05/2003 2003,
<http://www.washingtonpost.com/wp-srv/national/longterm/watergate/legacy.htm>.
Tham, J-C 2002, 'Legal Regulation of Political Donations in Australia: time for change', in G Patmore (ed.), The Big Makeover: a new Australian Constitution, Labor Essays, pp. 72-86, 242-5,62-65.
Tham, J-C 2003, When Litigation's Just Another Way to Play Politics, <http://www.smh.com.au/articles/2003/09/03/10262548901240.html>.
Thompson, M 1999, Labor Without Class: the gentrification of the ALP, Pluto Press Australia, Annandale.
Tucker, D & Young, S 2002, 'Public Financing of Election Campaigns in Australia: a solution or a problem?' in G Patmore (ed.), The Big Makeover: a new Australian Constitution, Labor Essays, pp. 60-71, 241-2, 61-62.
United Kindgom. House of Commons. Home Affairs Committee 1993, Funding of Political Parties: minutes of evidence and memorada of evidence. Session 1992-93, Cm 726, HMSO: House of Commons, London.
United Kindgom. House of Commons. Home Affairs Committee 1994, Funding Political Parties: second report. Session 1993-94, Cm 301, HMSO: House of Commons, London.

129
VandeHei, J 2003, 'Democrats Initiate New 'Soft Money' Campaign', Washington Post, 7/05/2003, p. A01.
Waldron, J 1998, 'Liberalism', in E Craig (ed.), Routledge Encylcopedia of Philosophy, Routledge, London.
Warhurst, J 2002, 'The Australian Federal Election of 10 November 2001', Australian Jounral of Political Science, vol. 37, no. 1, pp. 153-60.
Wearle, A 1998, 'Equality', in E Craig (ed.), Routledge Encyclopedia of Philosophy, Routledge, London.
Western Australia, C o G 1995, Specified Matters: 20 & 21 - Disclosure of Political Donations, Disclosure of Electoral Expenditure and Other Matters of Political Finance, 7, Commission on Government, Perth.
Whittington, L & Harper, T 2003, 'Taxpayer boost for parties', Toronto Star, 30/01/2003.
Wilkinson, M 1998, 'Lib MP Backs Trust to Attack Hanson', Sydney Morning Herald, 29 August 1998, p. 3.
Williams, G 1997, Truth in Political Advertising Legislation in Australia, 13, Law and Bills Digest Group, Research Papers, Department of Parliamentary Library, Commonwealth of Australia, Canberra.
Williams, P 1997, The Victory: the inside story of the takeover of Australia, Allen & Unwin, St Leonards.

130
Index A
Abbott, Hon. Tony..... 73, 74, 75, 76, 77, 83 Adamany, D ..................................... 12, 85 Agree, G........................................... 12, 85 Alexander, Herbert E. ....................... 27, 78 Associated Entities.................16, 19, 77, 97 Atkins, Dennis.................................. 75, 76 Australia
Elections 1993. 5, 16, 26, 32, 38, 54, 57, 63, 65,
66, 67, 69, 71, 72, 78, 101 199615, 16, 19, 26, 32, 38, 57, 59, 63,
65, 66, 67, 70, 71, 73, 89, 92 1998... 3, 4, 15, 19, 26, 57, 63, 65, 66,
68, 69, 70, 71, 73, 74, 75, 76, 78, 79, 89, 90
200114, 26, 57, 65, 67, 68, 70, 71, 78, 89, 90
Joint Standing Committee on Electoral Matters................. 29, 89, 90, 91, 102
New South Wales.. 36, 37, 40, 52, 53, 68 Queensland ........... 26, 68, 73, 74, 75, 78 Western Australia
Commission on Government.... 26, 30 Australian Democrats...... 34, 41, 59, 61, 93,
103, 105 Australian Electoral Commission 15, 16, 17,
18, 19, 20, 22, 57, 59, 60, 75, 76, 77, 78, 79, 81, 87, 89, 90, 91, 92, 93, 96, 97, 99, 101, 102 Submissions....................89, 90, 91, 102
Australian Greens .............. 59, 61, 103, 105 Australian Labor Party 4, 13, 14, 37, 42, 44,
46, 54, 59, 61, 71, 72, 78, 82, 83, 93, 103
B
Barbeau Committee ................................29 Beitz, Charles R......................................31 Bogdanor, Vernon ..................................32 Bowler, S ................................... 38, 54, 55 Broadcasters and Publishers........ 11, 16, 21 Butler, D.................................................32
C
Canada .1, 25, 26, 27, 29, 30, 35, 40, 51, 56, 71, 95 Barbeau Committee............................29
Carty, R. Kenneth 25, 32, 33, 34, 35, 36, 39, 51, 52, 56
Chaples, E ..............................................78 Corrado, Anthony ...................................24 Crabb, Annabel.......................................19 Crewe, Ivor....................................... 32, 33
D
Democracy ...............2, 3, 4, 5, 8, 32, 84, 85 Australia .................................. 3, 4, 7, 8
Lincoln ................................................5 Denver, D.33, 34, 35, 41, 43, 44, 45, 46, 47,
48 Dharmapala, Dhammika ................... 24, 28 Donations....................................26, 91, 93
Anonymous ....................................... 92 Duverger, Maurice....................................4
E
Eagles, M .25, 32, 33, 34, 35, 36, 39, 51, 52, 56
Eagles, Munroe.... 25, 32, 33, 34, 35, 36, 39, 51, 52, 56
Ewing, K.......................................... 29, 30
F
Farrell, D. M................................38, 54, 55 Fieldhouse, Edward A.32, 33, 42, 43, 44, 56 Fisher, Justin . 27, 28, 29, 32, 34, 35, 39, 49,
50 Forrest, James.......27, 36, 37, 38, 52, 53, 54
G
Gerritsen, Rolf. 9, 13, 14, 15, 29, 76, 93, 94, 102
Government Lincoln ................................................5
Green, Donald P .. 27, 30, 31, 39, 41, 42, 43, 50, 59
GreensWA.............................................. 59
H
Hands, G .. 33, 34, 35, 41, 43, 45, 46, 47, 48 Hanson, Pauline............... 73, 75, 76, 83, 87 Harders, Clarrie ...................................... 13 Harrop, Martin........................................ 32 Hazelton, Barbara ................................... 75 Heywood, Andrew........................ 5, 6, 7, 8 Hughes, C A.............................................9
I
Inquiries ........................ 13, 76, 90, 91, 102
J
Jacobson, Gary .... 30, 31, 32, 33, 39, 40, 41, 42, 43, 44, 50
Johnston, Ronald J.....11, 21, 27, 28, 32, 33, 34, 36, 37, 38, 42, 43, 44, 49, 50, 51, 53, 54, 56
K
Kavanagh, D........................................... 32 Kavanagh, Dennis................................... 32 Kobrak, Peter.........................11, 28, 29, 32
L
Legal Action..................................... 73, 77 Liberal Democracy ......................... 2, 8, 84

131
Democracy...........2, 3, 4, 5, 8, 32, 84, 85 Liberalism...................................... 3, 84 Parkin ...............................2, 3, 4, 5, 8, 9 Schumpeter ..........................................8
Liberal Party of Australia 14, 54, 59, 61, 71, 72, 73, 74, 77, 78, 82, 83, 103
Liberalism ...............................2, 3, 4, 8, 84 Mill......................................................3 Rousseau..............................................5
Lincoln, Abraham.....................................5 Locke, John ..............................................5
M
MacAllister, I .......11, 21, 28, 32, 34, 50, 51 Machiavelli, Niccolo...............................89 Maddox, Graham.......................... 3, 4, 7, 8 Mann, Thomas E. ...................................24 McAllister, Ian ........................... 38, 54, 55 Media ......................................... 73, 76, 94 Mill, John Stuart .......................................3
O
One Nation ................ 73, 74, 75, 78, 83, 87 Ortiz, Daniel R. ......................................24
P
Parkin, Andrew......................2, 3, 4, 5, 8, 9
Pattie, Charles J ... 11, 21, 27, 28, 32, 33, 34, 36, 37, 38, 42, 43, 44, 49, 50, 51, 53, 54, 56
Potter, Trevor ......................................... 24 Professionalisation.................................. 88
Political Mercenaries.......................... 89 Publishers and Broadcasters.........11, 16, 21
R
Rousseau, Jean-Jacques ............................5
S
Sharples, Terry ................................. 74, 75 Shumpeter, Joseph Alois...........................8 Sorauf, Frank J. ...................................... 24 Starr, Paul............................................... 32
T
The Nationals14, 37, 54, 59, 61, 71, 78, 103 Third Parties................................16, 18, 22
U
United Kingdom 1, 3, 11, 21, 26, 27, 28, 29, 30, 32, 33, 34, 37, 40, 41, 42, 43, 44, 45, 46, 47, 48, 49, 50, 51, 54, 56, 57, 71, 95
United States ... 1, 11, 14, 24, 26, 27, 28, 30, 31, 32, 39, 40, 41, 55, 56, 71, 80, 82, 92, 94, 95, 101, 104


![Centurion: Defender Of Rome - User Manual [EN, FR]](https://static.fdokumen.com/doc/165x107/63388088c5ddac3e970cf85d/centurion-defender-of-rome-user-manual-en-fr.jpg)