Experimental evidence for foraminiferal calcification under anoxia
Upload
independentCategory
view
2download
0
1 23
Coral ReefsJournal of the International Society forReef Studies ISSN 0722-4028 Coral ReefsDOI 10.1007/s00338-013-1047-8
Calcification rates of the massive coralSiderastrea siderea and crustose corallinealgae along the Florida Keys (USA) outer-reef tract
I. B. Kuffner, T. D. Hickey &J. M. Morrison

1 23
Your article is published under the Creative
Commons Attribution license which allows
users to read, copy, distribute and make
derivative works, as long as the author of
the original work is cited. You may self-
archive this article on your own website, an
institutional repository or funder’s repository
and make it publicly available immediately.

REPORT
Calcification rates of the massive coral Siderastrea sidereaand crustose coralline algae along the Florida Keys (USA)outer-reef tract
I. B. Kuffner • T. D. Hickey • J. M. Morrison
Received: 30 January 2013 / Accepted: 24 May 2013
� The Author(s) 2013. This article is published with open access at Springerlink.com
Abstract Coral reefs are degrading on a global scale, and
rates of reef-organism calcification are predicted to decline
due to ocean warming and acidification. Systematic mea-
surements of calcification over space and time are neces-
sary to detect change resulting from environmental
stressors. We established a network of calcification moni-
toring stations at four managed reefs along the outer
Florida Keys Reef Tract (FKRT) from Miami to the Dry
Tortugas. Eighty colonies (in two sequential sets of 40) of
the reef-building coral, Siderastrea siderea, were trans-
planted to fixed apparatus that allowed repetitive detach-
ment for buoyant weighing every 6 months. Algal-
recruitment tiles were also deployed during each weighing
interval to measure net calcification of the crustose coral-
line algal (CCA) community. Coral-calcification rates were
an order of magnitude greater than those of CCA. Rates of
coral calcification were seasonal (summer calcification was
53 % greater than winter), and corals in the Dry Tortugas
calcified 48 % faster than those at the other three sites.
Linear extension rates were also highest in the Dry Tor-
tugas, whereas percent area of the coral skeletons exca-
vated by bioeroding fauna was lowest. The spatial patterns
in net coral calcification revealed here correlate well with
Holocene reef thickness along the FKRT and, in part,
support the ‘‘inimical waters hypothesis’’ proposed by
Ginsburg, Hudson, and Shinn almost 50 yrs ago to explain
reef development in this region. Due to the homogeneity in
coral-calcification rates among the three main Keys sites,
we recommend refinement of this hypothesis and suggest
that water-quality variables (e.g., carbonate mineral satu-
ration state, dissolved and particulate organic matter, light
attenuation) be monitored alongside calcification in future
studies. Our results demonstrate that our calcification
monitoring network presents a feasible and worthwhile
approach to quantifying potential impacts of ocean acidi-
fication, warming, and/or deteriorating water quality on the
process of calcification.
Keywords Coral growth � CCA � Buoyant weight �Bioerosion � Ocean acidification � Climate change
Introduction
Coral reefs are the largest biomineralized structures on the
planet. They function as barriers to coastal hazards by
protecting land from hurricanes and tsunamis, provide
essential habitat for fisheries, support tourism and recrea-
tional industries, and provide sand for beaches through the
natural process of erosion; however, coral reef ecosystems
are becoming degraded on a global scale (Pandolfi et al.
2003). Declines in coral populations are largely a result of
ocean warming via coral bleaching and disease mortality
(Aronson et al. 2003; Veron et al. 2009). With respect
to trophic functioning and the ecosystem as a whole,
overfishing (Jackson et al. 2001) and anthropogenic impact
on water quality caused by land-use change (Fabricius
2005) are both significant stressors. While debate continues
as to how scientists can best inform decision makers via
Communicated by Geology Editor Prof. Bernhard Riegl
Electronic supplementary material The online version of thisarticle (doi:10.1007/s00338-013-1047-8) contains supplementarymaterial, which is available to authorized users.
I. B. Kuffner (&) � T. D. Hickey � J. M. Morrison
St. Petersburg Coastal and Marine Science Center,
U.S. Geological Survey, 600 4th Street South,
St. Petersburg, FL 33701, USA
e-mail: [email protected]
123
Coral Reefs
DOI 10.1007/s00338-013-1047-8

research and monitoring in hopes of at least slowing the
loss of coral reefs (Risk 1999; Hughes et al. 2010), under-
standing calcification, the constructive process responsible
for the creation of reefs, is of utmost importance. Predicting
future impacts of ocean warming and acidification on coral
reefs will require more in situ studies (Frieler et al. 2013),
including those that address the variables controlling cal-
cification and reef accumulation over space and time.
The rate at which corals calcify can be influenced by
multiple environmental variables including temperature
(Shinn 1966; Jokiel and Coles 1977, 1990), water motion
(Jokiel 1978; Dennison and Barnes 1988), solar irradiance
(Falkowski et al. 1990), aragonite saturation state (Gattuso
et al. 1998; Marubini et al. 2003), and inorganic nutrient
levels (Marubini and Davies 1996). On shallow-water
reefs, many of these environmental variables are dynamic
on diurnal (Ohde and Van Woesik 1999) and seasonal
(Gledhill et al. 2008) time scales. Super-annual trends in
ocean warming (Winter et al. 1998; Chollett et al. 2012)
and declining pH (ocean acidification, Bates 2007) over the
past several decades have been confirmed by observational
records around the globe. The majority of studies evalu-
ating controls on coral calcification have been aquarium or
sea-table experiments, and there are few supporting data
from the field. Calcification of corals in captivity inversely
correlates with [H?] and pCO2, and positively correlates
with aragonite saturation state, carbonate ion concentra-
tion, dissolved inorganic carbon (DIC), and pH (Marubini
and Atkinson 1999; Marubini et al. 2003; Reynaud et al.
2003; Anthony et al. 2008; Jokiel et al. 2008). Calcification
response to temperature manipulations is curvilinear,
increasing linearly until a regionally defined optimum, and
then declining even before bleaching and mortality ensue
(Coles and Jokiel 1978; Jokiel and Coles 1990).
Most field research on coral growth has involved mea-
suring linear extension rates, visualized by slicing and
X-raying cores taken from living coral colonies and then
measuring the width of density growth-band couplets,
which are assumed to reflect annual growth (Knutson et al.
1972). Calcification rate is then routinely calculated by
multiplying linear extension rate by the average bulk
skeletal density (measured by various techniques) of each
growth-band couplet. However, previous well-replicated
studies have demonstrated high unexplained variance in
linear extension within and among colonies living on the
same area of reef (Hudson 1981a; Dodge and Brass 1984;
Harriott 1999), and large assumptions are made regarding
the time domain (see Discussion in Carricart-Ganivet
2011). Using this approach of retrospectively calculating
calcification rate, the evidence connecting in situ coral
growth to environmental trends is equivocal. Correlation
has been demonstrated in some cases, showing declines in
coral calcification as the oceans have warmed and acidified
(Cooper et al. 2008; De’ath et al. 2009; Tanzil et al. 2009),
but in some studies trends were not observed (Helmle et al.
2011; Vasquez-Bedoya et al. 2012) or observed only on
certain reef types (Castillo et al. 2011) or regions, with
high-latitude reefs even showing increases in calcification
with time (Cooper et al. 2012).
The purpose of our study was to examine and quantify
spatial and temporal (seasonal) variability in calcification
rates by a reef-building coral, Siderastrea siderea, and by
crustose coralline algal (CCA) communities on the Florida
Keys Reef Tract (FKRT; Fig. 1). Like many reefs around
the world, the reefs of the Florida Keys have undergone
major degradation since the 1960s (Lidz et al. 2006; Pal-
andro et al. 2008), but debate continues with regards to why
(Voss 1973; Pandolfi et al. 2005) and what conservation
management strategies to employ (Keller and Causey
2005). Detecting change in calcification rates and ascribing
that change to ocean warming, ocean acidification, poor
water quality, or any other variable will require a solid
83°W 82°W 81°W 80°W
25°N
26°N
Gulf of Mexico
Bis
cayn
e B
ay
Atlantic Ocean
Dry Tortugas
Pulaski Shoal (PLS)
Sombrero Key(SMK)
Molasses Reef(MLR)
Fowey Rocks(FWY)
Florida Bay
Florida Everglades
Miami
Key West
Marathon
Key Largo
0 25 50
kilometers
X
X
X
XN
Florida, U.S.A.
Fig. 1 Map of the Florida
Keys, USA, showing the
locations of four calcification
monitoring sites (arrows). Site
names used are those of the
adjacent National Data Buoy
Center stations: Pulaski Shoal
(PLS), Sombrero Key (SMK),
Molasses Reef (MLR), and
Fowey Rocks (FWY)
Coral Reefs
123
understanding of the natural range and variability in calci-
fication rates that are apparent today. In order to address
this, we transplanted 80 whole colonies of S. siderea to four
outer-reef sites on the FKRT (Fig. 1) and measured coral-
calcification rates directly via the buoyant weight method
(Jokiel et al. 1978) over a 2-yr period. We simultaneously
deployed algal-recruitment tiles to measure net calcification
by the CCA community.
Materials and methods
The FKRT is a bank-reef system that runs semi-continu-
ously along the length of the Florida Keys at 24.5–25.5�N
latitude (Fig. 1). Four sites spanning 340 km of the reef
tract were selected in shallow spur-and-groove or low-
relief hard-bottom habitat at a water depth of 4 to 6 m. In
addition to habitat, site selection was based upon the
availability of meteorological data gathered by National
Data Buoy Center (NDBC) stations (http://www.ndbc.
noaa.gov/) and underwater oceanographic data gathered by
the Sustained Ecological Research Related to Management
of the Florida Keys Seascape (SEAKEYS) program. We
established our sites on the reef within 225 m of the
NDBC/SEAKEYS stations at Pulaski Shoal (PLS), Som-
brero Key (SMK), Molasses Reef (MLR), and Fowey
Rocks (FWY). The PLS site is within the boundaries of
Dry Tortugas National Park, SMK and MLR are within
Sanctuary Preservation Areas of the Florida Keys National
Marine Sanctuary (FKNMS), and FWY is within Biscayne
National Park. Global positioning system coordinates of
the sites are included in Electronic Supplementary Material
(ESM) Table S1.
We chose S. siderea because it is presently the most
abundant massive species of reef-building coral on the
FKRT (Lirman and Fong 2007), it is resistant to cold- and
warm-water stress events (Colella et al. 2012), it is com-
paratively successful at sexual reproduction as opposed to
the other FKRT reef builders (Lirman and Fong 2007), and
it is proving to be a choice species for paleoclimate
reconstruction in the Atlantic ocean (DeLong et al. 2011).
Two batches of 40 corals were collected in two consecutive
runs of the experiment, the first in spring/summer 2009 and
the second in spring 2011. Corals were collected in 3–6 m
water depth and from within 7 km of the monitoring sites
except for FWY in 2009 (24 km).
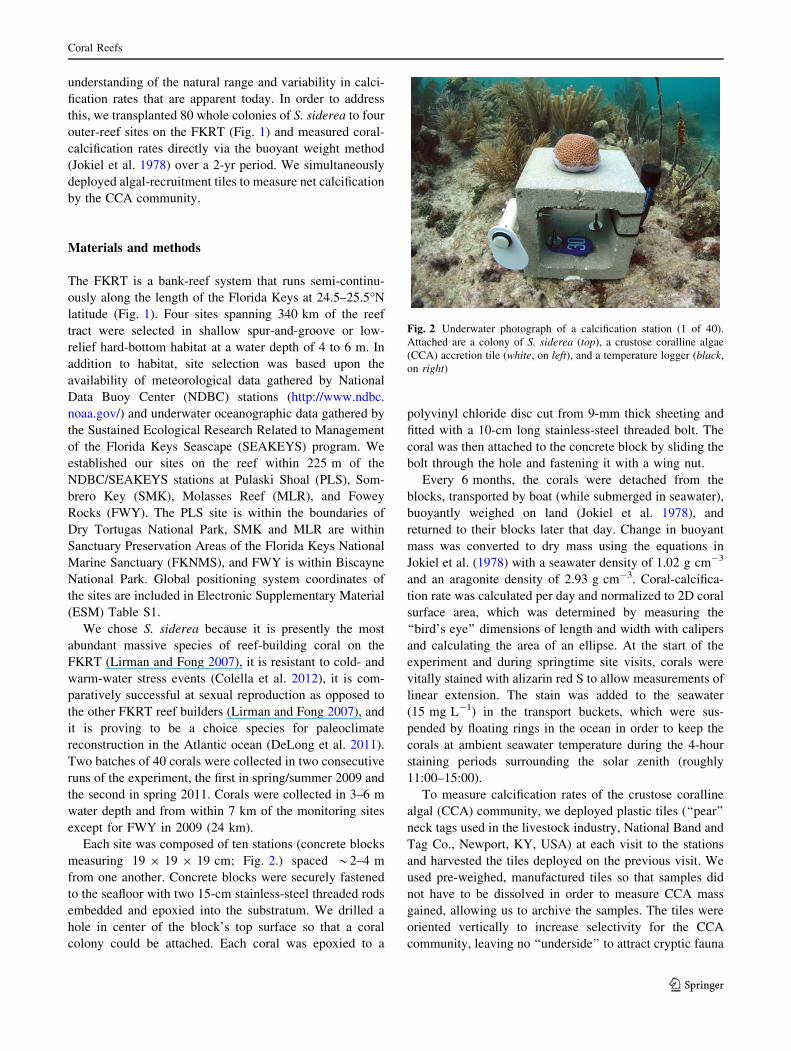
Each site was composed of ten stations (concrete blocks
measuring 19 9 19 9 19 cm; Fig. 2.) spaced *2–4 m
from one another. Concrete blocks were securely fastened
to the seafloor with two 15-cm stainless-steel threaded rods
embedded and epoxied into the substratum. We drilled a
hole in center of the block’s top surface so that a coral
colony could be attached. Each coral was epoxied to a
polyvinyl chloride disc cut from 9-mm thick sheeting and
fitted with a 10-cm long stainless-steel threaded bolt. The
coral was then attached to the concrete block by sliding the
bolt through the hole and fastening it with a wing nut.
Every 6 months, the corals were detached from the
blocks, transported by boat (while submerged in seawater),
buoyantly weighed on land (Jokiel et al. 1978), and
returned to their blocks later that day. Change in buoyant
mass was converted to dry mass using the equations in
Jokiel et al. (1978) with a seawater density of 1.02 g cm-3
and an aragonite density of 2.93 g cm-3. Coral-calcifica-
tion rate was calculated per day and normalized to 2D coral
surface area, which was determined by measuring the
‘‘bird’s eye’’ dimensions of length and width with calipers
and calculating the area of an ellipse. At the start of the
experiment and during springtime site visits, corals were
vitally stained with alizarin red S to allow measurements of
linear extension. The stain was added to the seawater
(15 mg L-1) in the transport buckets, which were sus-
pended by floating rings in the ocean in order to keep the
corals at ambient seawater temperature during the 4-hour
staining periods surrounding the solar zenith (roughly
11:00–15:00).
To measure calcification rates of the crustose coralline
algal (CCA) community, we deployed plastic tiles (‘‘pear’’
neck tags used in the livestock industry, National Band and
Tag Co., Newport, KY, USA) at each visit to the stations
and harvested the tiles deployed on the previous visit. We
used pre-weighed, manufactured tiles so that samples did
not have to be dissolved in order to measure CCA mass
gained, allowing us to archive the samples. The tiles were
oriented vertically to increase selectivity for the CCA
community, leaving no ‘‘underside’’ to attract cryptic fauna
Fig. 2 Underwater photograph of a calcification station (1 of 40).
Attached are a colony of S. siderea (top), a crustose coralline algae
(CCA) accretion tile (white, on left), and a temperature logger (black,
on right)
Coral Reefs
123

(e.g., tunicates, bryozoans, and tube-forming worms).
Harvested tiles were rinsed with tap water to remove loose
sediments, photographed on each side, dried for 48 h at
60 �C, and weighed to obtain the mass (g CaCO3) gained
per day. Grazing intensity was estimated by counting the
number of parrotfish-bite marks per tile.
Underwater temperature data were collected using
HOBO� Water Temp Pro v2 temperature loggers (Onset�,
Pocasset, MA, USA). Two loggers were deployed at each
site attached to the side of the blocks (Fig. 2). The loggers
collected temperature data every 15 min (n = 96 per day).
Site visits were typically during November and May.
Foul weather delayed Dry Tortugas visits on two occa-
sions (PLS corals were instead weighed in July in 2010
and December in 2011). Data are reported here for four
weighing intervals (Fig. 3); the first two are from the first
batch of 40 corals and the second two from the second
batch. The first batch of corals was sampled in May 2011
by taking two 4-mm-wide slices from each live coral
using a modified tile saw. The remaining halves of the
colonies were epoxied together and reattached to the
seafloor (100 % of the colonies survived). The slabs were
cleaned with a sonicator in distilled water, air dried, and
photographed under a stereomicroscope to measure the
distance from the alizarin red S stain line to the surface of
the coral along the exothecal wall (six measurements per
slab, two slabs per colony). The slabs were X-rayed to
reveal the burrows and cavities made by bioeroding
organisms. Linear extension (mm) and the area of skele-
ton excavated (mm2) were estimated using iSolution
Capture� version 3.1 image analysis software (IMT
i-Solution Inc., Vancouver, BC, Canada). Coral density
was calculated by dividing calcification rate by linear
extension rate.
All statistical analyses were performed using the soft-
ware package Statistix� 9 (Analytical Software, Talla-
hassee, FL, USA). Dependent variables (coral and CCA
calcification rates, CCA-tile grazing, temperature) were
analyzed using two-way ANOVA with site, time interval,
and the two-way interaction term in the model. Unless
otherwise stated, the two-way interactions were not sig-
nificant. For the variables measured on the coral slabs (first
set of corals only), data were analyzed using one-way
ANOVA by site. If the assumptions of ANOVA were not
met (residuals not normally distributed, unequal variance
among ANOVA cells), then the data were transformed as
noted or a nonparametric Kruskal–Wallis (K–W) ANOVA-
like test was used. Post hoc comparisons were made using
Tukey’s Honestly Significant Difference (HSD) or K–W all
pairwise comparisons by site with alpha = 0.05. To test for
seasonal effects when appropriate (i.e., no two-way inter-
action), a linear contrast of winter versus summer time
intervals was performed using a Student’s t test based upon
the a priori hypothesis that calcification would vary with
season. Since there was no significant difference between
the calcification rates of the two batches of corals at any of
the sites (two-way ANOVA, site 9 batch p = 0.31, batch
p = 0.77), the data from the two batches of corals were
pooled. Three of the 80 corals were removed from the
dataset: two because they experienced extremely bad
sponge infections wherein calcification was negative and
one because it disappeared. Simple linear regression was
used to examine the relationship between calcification rate
and linear extension for the first batch of corals.
4/2009 10/2009 4/2010 10/2010 4/2011 10/2011 4/2012
Und
erw
ater
tem
pera
ture
(°C
)
18
20
22
24
26
28
30
32
PLS
SMK
MLR
FWY
Fig. 3 Daily mean underwater
temperature (�C) at four Florida
Keys outer-reef tract sites from
April 2009 to May 2012.
Dashed line at 30 �C marks a
generalized bleaching threshold
for most corals in the region.
The vertical gray lines mark the
four weighing intervals, the first
two for the first 40 corals, and
the second two for the second
40. Site abbreviations are
Pulaski Shoal = PLS,
Sombrero Key = SMK,
Molasses Reef = MLR, and
Fowey Rocks = FWY
Coral Reefs
123

Results
The study-wide mean calcification rate of S. siderea from
2010 to 2012 was 2.7 mg cm-2 d-1 (n = 77). Both time
interval and site had significant effects on coral-calcifica-
tion rates (two-way ANOVA, time F = 25.2, p \ 0.0001,
site F = 19.1, p \ 0.0001) (Fig. 4a, ESM Table S1). Coral
calcification was 53 % faster during summer compared to
winter (linear contrast, winter vs. summer T = 8.5,
p \ 0.0001) and 48 % faster in the Dry Tortugas compared
to the three main Keys sites (Tukey’s HSD by site,
PLS [ MLR = SMK = FWY).
Mean annual linear extension was 2.6 mm yr-1 (n = 39)
and significantly varied among the sites (Kruskal–Wallis
[K–W] test, H = 16.4, p = 0.001). Linear extension was
greatest at PLS (mean ± SE = 3.1 ± 0.1 mm yr-1), but
there was statistical overlap with FWY and SMK (K–W all
pairwise comparisons by site, only PLS [ MLR). Linear
extension and calcification rate had a significant positive
relationship (least-squares linear regression, R2 = 0.50,
p \ 0.0001). Density, calculated by dividing calcification
rate by linear extension rate, was 3.7 g cm-3 overall, and
did not statistically vary among sites (K–W test, H = 4.6,
p = 0.20).
Percent of the skeleton excavated by macrobioeroders
was statically different among sites (K–W test, H = 12.9,
p = 0.005). Corals at PLS were the least excavated
(mean ± SE = 3.7 ± 1.0 %), statistically lower than
MLR (13.2 ± 3.9 %) and SMK (11.3 ± 1.7 %), with
FWY in between (6.0 ± 1.9 %) and not statistically dif-
ferent from either group (K–W all pairwise comparisons by
site).
Overall mean calcification of the CCA community was
0.13 mg cm-2 d-1, more than an order of magnitude less
than the coral-calcification rate (Fig. 4b, ESM Table S1).
Calcification by the CCA community did not show clear sea-
sonal patterns (ANOVA two-way interaction (site 9 season)
F = 6.31, p = 0.0005). Although the significant two-way
interaction makes it hard to draw conclusions about the
main effects, the site effect was large (two-way ANOVA,
site F = 69.2, p \ 0.0001), with highest CCA calcifica-
tion at SMK, followed by MLR, and the other two sites
(Tukey’s HSD by site, SMK [ MLR [ PLS = FWY). It
was evident from the many parrotfish feeding scars that
grazing could have been an important factor in the exper-
iment. Number of bite marks per tile varied among sites
and was greatest at FWY (two-way ANOVA on square-
root transformed data, site F = 69.0, p \ 0.0001, Tukey’s
HSD by site: FWY [ PLS = MLR = SMK).
Mean daily underwater temperature (�C) averaged over
the 2-yr period (Fig. 5a) was slightly cooler at PLS
(26.2 ± 3.3 SD) and slightly warmer at SMK (26.8 ± 3.0
SD) compared to the other sites (K–W test, H = 11.9,
p = 0.008, K–W all pairwise comparisons, SMK [ PLS).
Short-duration, site-specific temperature excursions were
seen throughout the dataset (Fig. 3). Diurnal variability in
temperature was strongly site specific (Fig. 5b; K–W test,
H = 346, p \ 0.0001) and was clearly lowest at PLS,
followed by MLR, and then the other two sites (K–W all
pairwise comparisons by site, PLS \ MLR \ SMK =
FWY). Diurnal variability was greatest during winter
months at the three main Keys sites, but PLS showed the
greatest variability in summer (Fig. 5b).
Discussion
Our overall estimate of mean annual calcification for
S. siderea was 0.99 g cm-2 yr-1, which is within the range
of values reported for in situ studies on other coral species
using the buoyant weight technique as well as recent
studies that calculated calcification rates using density and
linear extension measurements of annual growth bands
(a)
(b)
Fig. 4 Mean net coral-calcification rates (mg cm-2 d-1) of S.siderea colonies (a) and mean net accretion (mg cm-2 d-1) of
crustose coralline algae (CCA) communities (b) at four sites in the
Florida Keys. Error bars are ± 1 SEM. Site abbreviations are Pulaski
Shoal = PLS, Sombrero Key = SMK, Molasses Reef = MLR, and
Fowey Rocks = FWY. The data in the figure and the GPS
coordinates of the sites are presented in the electronic supplementary
material, ESM Table S1
Coral Reefs
123

(ESM Table S2). Surprisingly, the magnitude of the site
effect (greatest calcification in the remote Dry Tortugas)
was on par with the seasonal effect (greater calcification in
summer); both were roughly 50 %. Mean temperature
differences between sites cannot explain the spatial pattern
because the four sites generally stayed within 1 �C of each
other (Fig. 5a). However, there was a clear distinction
among the sites with regards to the diurnal variability in
temperature (Fig. 5b). While daily instability in tempera-
ture\1 �C is unlikely to be a main driver in and of itself, it
provides a ‘‘fingerprint’’ (most clearly seen in the winter
months; Fig. 5b) indicating the tidally driven arrival of
waters from more than one source. Movement of water
through the Keys via tidal passes, into Hawk Channel (the
shallow basin that runs parallel to and just seaward of the
entire island chain), and out to the reef is clearly observed
by satellite during cold fronts (Roberts et al. 1982). There
is a net annual outflow of water through the tidal passes
driven by higher sea level in Florida Bay relative to the
Atlantic resulting from the complex interactions of tides,
geomorphology, and prevailing winds (Lee and Smith
2002; Gibson et al. 2008).
The patterns in coral calcification we observed here are
congruent with the Holocene geologic record of the FKRT.
The accumulation of Holocene reef is *20 m thick in the
Dry Tortugas, while the main Keys reefs have not appre-
ciably accumulated more than a few vertical meters over
the last 6,000 yrs (Shinn et al. 1977; Shinn 1980). Rising
sea level started to flood the Florida peninsula around
6,000 yrs before present (BP), completely submerging the
area that is now Florida Bay by 2000 BP (Lidz and Shinn
1991). Terrestrial influence of the Florida peninsula on
water quality and basin-depth influence on annual tem-
perature range of the waters delivered from the West
Florida Shelf and Florida Bay through the Florida Keys
tidal passes constitute the most parsimonious explanation
for the pattern in reef accretion in the late Holocene; this is
known as the ‘‘inimical waters’’ hypothesis (Hudson 1983;
Lidz and Shinn 1991; Ginsburg and Shinn 1994). This
hypothesis, along with antecedent Pleistocene topography
(Lidz et al. 2006), is used to explain the modern distribu-
tion of reefs along the FKRT, which correlates with the
presence and width of tidal passes. As documented early on
by aerial photography, the most developed reefs are found
in areas where tidal exchange is minimal (Marszalek et al.
1977). The spatial pattern in present-day coral coverage
continues to reflect this, despite the degradation of coral
populations over the past half-century (Burman et al.
2012).
There are many aspects of water quality that could
contribute to the ‘‘inimical’’ status (with regards to reef
growth) of waters flowing from Florida Bay and the West
Florida Shelf. Water quality has been monitored on a
quarterly basis throughout the Florida Keys (including the
Dry Tortugas) since 1995, and has revealed geographical
variation in many variables reflecting large-scale transport
via circulation pathways and elucidating multiple nutrient
sources (Boyer and Briceno 2010). A principal components
analysis of the Boyer and Briceno (2010) data from 155
stations resulted in seven water-quality domains, with mid-
channel and offshore main Keys sites falling out together
and in a different domain than the Dry Tortugas stations.
While stations very close to the main Keys did show ele-
vated levels of nutrients (Boyer and Briceno 2010), dis-
solved inorganic nutrients have not shown convincing
onshore-offshore patterns beyond the landward portion of
Hawk Channel (Szmant and Forrester 1996). Recent
monitoring of the carbonate system variables has shown
onshore-offshore and seasonal patterns in the main Keys
(Manzello et al. 2012) and seasonal patterns in waters
offshore of the Keys (Gledhill et al. 2008), but few data
exist for the Dry Tortugas area. Two studies so far have
attempted to link water quality and coral growth on the
(b)
Month
Diu
rnal
var
iabi
lity
(SD
) in
tem
pera
ture
(°C
)
0.0
0.1
0.2
0.3
0.4
0.5
(a)M
ean
unde
rwat
er te
mpe
ratu
re (
°C)
20
22
24
26
28
30
32
PLSSMK MLRFWY
J F M A M J J A S O N D
Fig. 5 Mean (a) and standard deviation (b) of mean (n = 96
measurements per day) of daily underwater temperature (�C) for
each month over 2 yrs at four sites on the Florida Keys outer-reef
tract. Error bars are ± 1 SEM. Site abbreviations are Pulaski
Shoal = PLS, Sombrero Key = SMK, Molasses Reef = MLR, and
Fowey Rocks = FWY
Coral Reefs
123

FKRT. Lirman and Fong (2007) found that coral commu-
nity structure and linear extension rates did not correlate
well with water quality. Cook et al. (2002) found no pat-
terns in linear extension, but found a positive relationship
between calcification rate and distance from the Channel
#5 tidal pass.
The lack of differentiation in calcification rates among
the three main Keys sites indicates that the inimical waters
hypothesis may need some refinement to be applicable to
our results. In accord with the hypothesis, we expected to
see faster calcification rates at Molasses Reef (protected
from Florida Bay waters by the island of Key Largo) than
at Sombrero Key (opposite the Seven Mile Bridge tidal
pass that accounts for 50 % of the volume transport
through the Keys; Lee and Smith 2002). However, perhaps
the shallow, nearshore waters not associated with the tidal
passes (e.g., Hawk Channel itself) could also be considered
‘‘inimical’’ due to their large annual range in temperature
(Hudson 1981b; Manzello et al. 2012). Records of a recent
cold event, for example, illustrate this point. In January
2010, massive mortality of corals on nearshore patch reefs
occurred along the length of the upper Keys (where there
are few tidal passes) due to a cold front that cooled near-
shore waters to below 16 �C for multiple days (Kemp et al.
2011; Lirman et al. 2011; Colella et al. 2012).
Light attenuation is another variable that warrants con-
sideration in explaining the spatial variation in coral cal-
cification that we observed. High levels of suspended
particulate matter predicted low coral percent cover and
carbonate production on reefs in the Coral Triangle
(Edinger et al. 2000). Periodic increased turbidity due to
wind mixing of fine, carbonate sediments is regularly
observed in Hawk Channel, which turns a milky, nearly
opaque aquamarine color when the surface winds are
[15–20 knots (authors’ personal observations). Since our
calcification stations are \6 m deep, light levels may be
saturating during summer, but could be limited during
windy periods and in winter when length of day is short
and sun angles are low. The SEAKEYS program was
intended to be our source of underwater light data, but the
instruments were taken offline shortly after the inception of
our calcification monitoring network due to lack of fund-
ing. Therefore, we are presently unable to make correla-
tions between calcification rates and light extinction
coefficients at our sites.
Bioerosion has also been linked to aspects of water
quality. Most bioeroding organisms that infest, erode, and/
or dissolve reef structure and coral skeletons are filter
feeders, and exchange with nearshore waters probably
brings them a steady food supply (Hallock and Schlager
1986). Our corals at the Dry Tortugas site had the smallest
proportion of their skeletons bored, followed by those at
Fowey and then the other two sites. Highsmith (1980)
found a strong correlation between global patterns in
water-column productivity and the abundance of bioerod-
ing infauna in museum specimens of coral skeletons from
around the world, and field studies since then have shown
similar patterns (Sammarco and Risk 1990; Harriott 1999;
Chiappone and Sullivan 1997; Manzello et al. 2008).
The patterns in calcification and bioerosion revealed
here are consistent with the water-column productivity
hypothesis, but higher-frequency and more comprehensive
(e.g., monitoring the carbonate system parameters) data
will be required to determine what aspects of water quality
could be responsible. Since we only measured net calcifi-
cation (see Andersson and Mackenzie 2012), we cannot
discern the relative contributions of gross calcification
versus bioerosion rates in producing the patterns we
observed. Also, much of the bioerosion that we quantified
in our X-rays probably pre-dated the transplantation of the
corals because most of the borings were below the alizarin
stain line and the bioeroding community is very slow
growing. However, linear extension showed similar pat-
terns as calcification rate (greatest growth at Pulaski
Shoal), indicating that gross calcification rates were at least
partially responsible for the pattern observed.
Depending on species and location, patterns in calcifi-
cation rate, linear extension, and skeletal density can cor-
relate with one another positively, negatively, or not at all
(Barnes and Crossland 1980; Carricart-Ganivet 2004), and
all three vary throughout the year (Shinn 1966; Barnes and
Crossland 1980). Because linear extension was signifi-
cantly correlated with calcification rates measured in our
study, one might question the need for measuring calcifi-
cation rates. However, we found that the error within site
was proportionally much larger than the variance among
sites for linear extension compared to calcification rate, and
the linear extension rate data were not normally distributed.
In order to detect spatial or temporal differences, replica-
tion would have to be much higher using linear extension
and density to calculate calcification rate than when mea-
suring calcification rates directly. For example, the study
by De’ath et al. (2009) examined 328 colonies to draw their
conclusion that calcification rate has significantly declined
over time on the Great Barrier Reef.
Whether or not a reef will accrete is controlled by the
balance between rate of carbonate production by calcifiers
and rate of carbonate breakdown by bioeroders (Hallock
and Schlager 1986), but corals are not the only important
calcifiers. While the net calcification rate of the CCA
community was low compared to reef-building corals in
this study (CCA 0.054 g cm-2 yr-1 vs. S. siderea,
0.99 g cm-2 yr-1), the percent cover by CCA is often
much greater than that of live coral (Adey 1998). Given the
CCA community’s ubiquitous presence on the ocean floor
(Steneck 1986), its important function as a positive
Coral Reefs
123

settlement cue for coral larvae (Morse et al. 1988; Heyward
and Negri 1999), its major role in the carbonate budget and
in sediment production of most reefs (Adey and Macintyre
1973; Chisholm 2000), and its vulnerability to ocean
acidification (Anthony et al. 2008; Kuffner et al. 2008;
Albright et al. 2010), we recommend that systematic
monitoring of CCA net accretion become an integral part
of reef-monitoring programs. Presently, there are few data
that we can directly compare to ours. CCA communities
across our four FKRT sites had a mean carbonate accretion
rate of 540 g m-2 yr-1. A similar study using ceramic
plates on the north side of Jamaica reported values of 128
and 159 g m-2 yr-1 for two sites that were in habitats
comparable to ours (Mallela 2007). Short-term incubation
experiments on the GBR measuring calcification rates of four
species of CCA reported rates as high as 3.3 kg m-2 yr-1,
but rates measured in this way would not include any
loss from herbivory or other erosional factors (Chisholm
2000).
The patterns in net CCA accretion observed in our study
indicate that CCA communities were responding to dif-
ferent variables than those controlling coral calcification.
Nutrient availability and herbivory both positively affected
CCA community accretion on Hawaiian reefs (Smith et al.
2001). The significantly higher CCA accretion documented
at Sombrero Reef suggests a source of exogenous nutrients,
since the number of parrotfish-bite marks was clearly
greater at Fowey Rocks compared to the other three sites
while CCA accretion was low. Direct flow from the largest
tidal pass in the Florida Keys connecting Sombrero Reef
with the West Florida Shelf is the most likely vector for the
delivery of nutrient-enriched waters. The factors control-
ling CCA accretion at the four sites currently remain
unknown, and quantification of the grazing community
(e.g., parrotfish, territorial damselfish) will need to be
integrated into future studies. Because CCA communities
are so responsive to calcite saturation state (Kuffner et al.
2008), the carbonate system parameters need to be evalu-
ated as well. This will require deployment of continuously
monitoring instruments to be meaningful, though, since
diurnal and seasonal variability in these parameters is quite
large in nearshore waters (Yates and Halley 2006; Hof-
mann et al. 2011; Price et al. 2012).
Ocean acidification (OA) may impact reef accretion in
the future but, at least for the FKRT, will probably not do
so via direct, chronic impacts of OA on coral-calcification
rates. Coral mortality (resulting from bleaching, cold-water
stress, disease, etc.) will most likely continue to be the
important driver of coral community structure (Burman
et al. 2012) and, hence, community calcification rates on
reefs (Kleypas et al. 2011). However, OA could be influ-
ential on reef trajectory by impacting early life-history
phases that are essential to reef recovery, either by direct
effects on coral recruits (Albright et al. 2008; Cohen et al.
2009) or indirectly, through OA impacts on the crustose
coralline algal community (Kuffner et al. 2008; Albright
et al. 2010; Albright and Langdon 2011). Regardless, a
possible implication of differences in calcification rates
among reef sites is that they will respond differently to
future environmental changes. For example, reefs in the
Dry Tortugas with higher calcification rates may take
longer to show signs of chronic stress and could recover
more quickly from major stress events (e.g., Lidz and
Zawada 2013) than other reefs in the region. It is important
that other coral species be investigated to see whether the
spatial patterns in calcification are similar, especially those
that are not as temperature tolerant as S. siderea.
This study was the first to systematically measure in situ
calcification rates of whole coral colonies and the CCA
community over multiple years in a reef-crest setting and
provides a key baseline dataset to allow detection of
change in the future. As fossil-fuel burning continues to
alter the global carbon cycle by moving carbon from the
Earth’s crust to the atmosphere and the oceans (Mackenzie
and Lerman 2006), there is further commitment to Earth-
system change (Meehl et al. 2005). Long-term, systematic
measurement of calcification rates of reef-building organ-
isms will allow us to document and quantify the potential
impacts of chronic warming, altered water quality, and/or
ocean acidification on the processes of calcification and
reef construction.
Acknowledgments This study was principally funded by the US
Geological Survey (USGS) Coastal and Marine Geology program
with supplementary funds from the USGS Terrestrial, Freshwater, and
Marine Ecosystems program and grants from the USGS Global
Change Research fund and the Department of Interior Southeast
Climate Science Center. Scholarly input from Brian Keller (FKNMS),
who is greatly missed, was essential during the planning of the study.
We thank the National Park Service crew of the M/V Ft. Jefferson (C.
and J. Douglass, J. Spade) for their support in the Dry Tortugas. For
field and laboratory help, we thank A. Brame, L. Goldberger, K.
Ludwig, C. Reich, C. Reynolds, J. Sanford, and C. Williams. We
thank C. Reich for preparing Fig. 1. The study was conducted under
scientific permits FKNMS-2008-062A, FKNMS-2010-122, DRTO-
2009-SCI-0009, DRTO-2011-SCI-0004, BISC-2009-SCI-0019,
BISC-2010-SCI-0035, and BISC-2011-SCI-0025. Any use of trade
names herein was for descriptive purposes only and does not imply
endorsement by the US Government.
Open Access This article is distributed under the terms of the
Creative Commons Attribution License which permits any use, dis-
tribution, and reproduction in any medium, provided the original
author(s) and the source are credited.
References
Adey WH (1998) Coral reefs: algal structured and mediated
ecosystems in shallow, turbulent, alkaline waters. J Phycol
34:393–406
Coral Reefs
123

Adey WH, Macintyre IG (1973) Crustose coralline algae: a re-
evaluation in the geological sciences. Geol Soc Am Bull
84:883–904
Albright R, Langdon C (2011) Ocean acidification impacts multiple
early life history processes of the Caribbean coral Poritesastreoides. Global Change Biol 17:2478–2487
Albright R, Mason B, Langdon C (2008) Effect of aragonite
saturation state on settlement and post-settlement growth of
Porites astreoides larvae. Coral Reefs 27:485–490
Albright R, Mason B, Miller M, Langdon C (2010) Ocean acidifi-
cation compromises recruitment success of the threatened
Caribbean coral Acropora palmata. Proc Natl Acad Sci USA
107:20400–20404
Andersson AJ, Mackenzie FT (2012) Revisiting four scientific
debates in ocean acidification research. Biogeosciences
9:893–905
Anthony KRN, Kline DI, Diaz-Pulido G, Dove S, Hoegh-Guldberg O
(2008) Ocean acidification causes bleaching and productivity
loss in coral reef builders. Proc Natl Acad Sci USA
105:17442–17446
Aronson RB, Bruno JF, Precht WF, Glynn PW, Harvell CD, Kaufman
L, Rogers CS, Shinn EA (2003) Causes of coral reef degradation.
Science 302:1502–1504
Barnes DJ, Crossland CJ (1980) Diurnal and seasonal variations in the
growth of a staghorn coral measured by time-lapse photography.
Limnol Oceanogr 25:1113–1117
Bates NR (2007) Interannual variability of the oceanic CO2 sink in
the subtropical gyre of the North Atlantic Ocean over the last 2
decades. J Geophys Res 112:1–26
Boyer JN, Briceno HO (2010) 2010 annual report of the Water
Quality Monitoring Project for the Florida Keys National Marine
Sanctuary. Southeast Environmental Research Center, Florida
International University, Miami, p 82
Burman SG, Aronson RB, van Woesik R (2012) Biotic homogeni-
zation of coral assemblages along the Florida reef tract. Mar
Ecol Prog Ser 467:89–96
Carricart-Ganivet JP (2004) Sea surface temperature and the growth
of the West Atlantic reef-building coral Montastraea annularis.
J Exp Mar Biol Ecol 302:249–260
Carricart-Ganivet JP (2011) Coral skeletal extension rate: An
environmental signal or a subject to inaccuracies? J Exp Mar
Biol Ecol 405:73–79
Castillo KD, Ries JB, Weiss JM (2011) Declining coral skeletal
extension for forereef colonies of Siderastrea siderea on the
Mesoamerican Barrier Reef System, southern Belize. PLOS
ONE 6:1–12
Chiappone M, Sullivan KM (1997) Rapid assessment of reefs in the
Florida Keys: results from a synoptic survey. Proc 8th Int Coral
Reef Symp 2:1509–1514
Chisholm JRM (2000) Calcification by crustose coralline algae on the
northern Great Barrier Reef, Australia. Limnol Oceanogr
45:1476–1484
Chollett I, Muller-Karger FE, Heron SF, Skirving W, Mumby PJ
(2012) Seasonal and spatial heterogeneity of recent sea surface
temperature trends in the Caribbean Sea and southeast Gulf of
Mexico. Mar Pollut Bull 64:956–965
Cohen AL, McCorkle DC, de Putron S, Gaetani GA, Rose KA (2009)
Morphological and compositional changes in the skeletons of
new coral recruits reared in acidified seawater: Insights into the
biomineralization response to ocean acidification. Geochem
Geophys Geosyst 10:1–12
Colella MA, Ruzicka RR, Kidney JA, Morrison JM, Brinkhuis VB
(2012) Cold-water event of January 2010 results in catastrophic
benthic mortality on patch reefs in the Florida Keys. Coral Reefs
31:621–632
Coles SL, Jokiel PL (1978) Synergistic effects of temperature, salinity
and light on the hermatypic coral Montipora verrucosa. Mar Biol
49:187–195
Cook CB, Mueller EM, Ferrier MD, Annis E (2002) The influence of
nearshore waters on corals of the Florida reef tract. In: Porter
JW, Porter KG (eds) The Everglades, Florida Bay, and coral
reefs of the Florida Keys: an ecosystem sourcebook. CRC Press,
Boca Raton, pp 771–788
Cooper TF, De’ath G, Fabricius KE, Lough JM (2008) Declining
coral calcification in massive Porites in two nearshore regions of
the northern Great Barrier Reef. Global Change Biol 14:529–538
Cooper TF, O’Leary RA, Lough JM (2012) Growth of Western
Australian corals in the Anthropocene. Science 335:593–596
De’ath G, Lough JM, Fabricius KE (2009) Declining coral calcifi-
cation on the Great Barrier Reef. Science 323:116–119
DeLong KL, Flannery JA, Maupin CR, Poore RZ, Quinn TM (2011)
A coral Sr/Ca calibration and replication study of two massive
corals from the Gulf of Mexico. Palaeogeogr Palaeoclimatol
Palaeoecol 307:117–128
Dennison WC, Barnes DJ (1988) Effect of water motion on coral
photosynthesis and calcification. J Exp Mar Biol Ecol 115:67–77
Dodge RE, Brass GW (1984) Skeletal extension, density and
calcification of the reef coral, Montastrea annularis: St. Croix,
U.S. Virgin Islands. Bull Mar Sci 34:288–307
Edinger EN, Limmon GV, Jompa J, Widjatmoko W, Heikoop JM,
Risk MJ (2000) Normal coral growth rates on dying reefs: Are
coral growth rates good indicators of reef health? Mar Pollut
Bull 40:404–425
Fabricius KE (2005) Effects of terrestrial runoff on the ecology of
corals and coral reefs: review and synthesis. Mar Pollut Bull
50:125–146
Falkowski PG, Jokiel PL, Kinzie RA (1990) Irradiance and corals. In:
Dubinsky Z (ed) Ecosystems of the world: Coral reefs. Elsevier
Science Publishers, Amsterdam, pp 89–107
Frieler K, Meinshausen M, Golly A, Mengel M, Lebeck K, Donner SD,
Hoegh-Guldberg O (2013) Limiting global warming to 2 �C is
unlikely to save most coral reefs. Nature Clim Change 3:165–170
Gattuso JP, Frankignoulle M, Bourge I, Romaine S, Buddemeier RW
(1998) Effect of calcium carbonate saturation of seawater on
coral calcification. Global Planet Change 18:37–46
Gibson PJ, Boyer JN, Smith NP (2008) Nutrient mass flux between
Florida Bay and the Florida Keys National Marine Sanctuary.
Estuaries and Coasts 31:21–32
Ginsburg RN, Shinn EA (1994) Preferential distribution of reefs in
the Florida reef tract: the past is the key to the present. In:
Ginsburg RN (ed) Proceedings of the colloquium on global
aspects of coral reefs: Health, hazards and history. University of
Miami, Miami, pp 21–26
Gledhill DK, Wanninkhof R, Millero FJ, Eakin M (2008) Ocean
acidification of the Greater Caribbean Region 1996–2006.
J Geophys Res 113:1–11
Hallock P, Schlager W (1986) Nutrient excess and the demise of coral
reefs and carbonate platforms. Palaios 1:389–398
Harriott VJ (1999) Coral growth in subtropical eastern Australia.
Coral Reefs 18:281–291
Helmle KP, Dodge RE, Swart PK, Gledhill DK, Eakin CM (2011)
Growth rates of Florida corals from 1937 to 1996 and their
response to climate change. Nat Communications 2:215
Heyward AJ, Negri AP (1999) Natural inducers for coral larval
metamorphosis. Coral Reefs 18:273–279
Highsmith RC (1980) Geographic patterns of coral bioerosion: a
productivity hypothesis. J Exp Mar Biol Ecol 46:177–196
Hofmann GE, Smith JE, Johnson KS, Send U, Levin LA, Micheli F,
Paytan A, Price NN, Peterson B, Takeshita Y, Matson PG, DerseCrook E, Kroeker KJ, Cristina Gambi M, Rivest EB, Frieder CA,
Coral Reefs
123

Yu PC, Martz TR (2011) High-frequency dynamics of ocean pH:
A multi-ecosystem comparison. PLOS ONE 6:e28983
Hudson JH (1981a) Growth rates in Montastrea annularis: a record of
environmental change in Key Largo Coral Reef Marine Sanc-
tuary, Florida. Bull Mar Sci 31:444–459
Hudson JH (1981b) Response of Montastrea annularis to environ-
mental change in the Florida Keys. Proc 4th Int Coral Reef Symp
2:233–240
Hudson JH (1983) Growth history of Montastrea annularis at Looe
Key National Marine Sanctuary, Florida. In: Bohnsack JA (ed)
Resource survey of Looe Key National Marine Sanctuary.
NOAA Technical Memorandum NMFS-SEFSC-478, pp 91–111
Hughes TP, Graham NAJ, Jackson JBC, Mumby PJ, Steneck RS
(2010) Rising to the challenge of sustaining coral reef resilience.
Trends Ecol Evol 25:633–642
Jackson BC, Kirby MX, Berger WH, Bjorndal KA, Botsford LW,
Bourque BJ, Bradbury RH, Cooke R, Erlandson J, Estes JA,
Hughes TP, Kidwell S, Lange CB, Lenihan HS, Pandolfi JM,
Peterson CH, Steneck RS, Tegner MJ, Warner RR (2001)
Historical overfishing and the recent collapse of coastal ecosys-
tems. Science 293:629–638
Jokiel PL (1978) Effects of water motion on reef corals. J Exp Mar
Biol Ecol 35:87–97
Jokiel PL, Coles SL (1977) Effects of temperature on the mortality
and growth of Hawaiian reef corals. Mar Biol 43:201–208
Jokiel PL, Coles SL (1990) Response of Hawaiian and other Indo-
Pacific reef corals to elevated temperature. Coral Reefs
8:155–162
Jokiel PL, Maragos JE, Franzisket L (1978) Coral growth: buoyant
weight technique. In: Stoddart DR, Johannes RE (eds) Coral
reefs: research methods. UNESCO, Paris, pp 529–541
Jokiel PL, Rodgers KS, Kuffner IB, Andersson AJ, Cox EF,
Mackenzie FT (2008) Ocean acidification and calcifying reef
organisms: a mesocosm investigation. Coral Reefs 27:473–483
Keller BD, Causey BD (2005) Linkages between the Florida Keys
National Marine Sanctuary and the South Florida Ecosystem
Restoration Initiative. Ocean Coast Manage 48:869–900
Kemp DW, Oakley CA, Thornhill DJ, Newcomb LA, Schmidt GW,
Fitt WK (2011) Catastrophic mortality on inshore coral reefs of
the Florida Keys due to severe low-temperature stress. Global
Change Biol 17:3468–3477
Kleypas JA, Anthony KRN, Gattuso JP (2011) Coral reefs modify
their seawater carbon chemistry - case study from a barrier reef
(Moorea, French Polynesia). Global Change Biol 17:3667–3678
Knutson DW, Buddemeier RW, Smith SV (1972) Coral chronome-
ters: seasonal growth bands in reef corals. Science 177:270–272
Kuffner IB, Andersson AJ, Jokiel PL, Rodgers KS, Mackenzie FT
(2008) Decreased abundance of crustose coralline algae due to
ocean acidification. Nature Geosci 1:114–117
Lee TN, Smith N (2002) Volume transport variability through the
Florida Keys tidal channels. Cont Shelf Res 22:1361–1377
Lidz BH, Shinn EA (1991) Paleoshorelines, reefs, and a rising sea:
South Florida, U.S.A. J Coast Res 7:203–229
Lidz BH, Zawada DG (2013) Possible return of Acropora cervicornisat Pulaski Shoal, Dry Tortugas National Park, Florida. J Coast
Res 29:256–271
Lidz BH, Reich CD, Peterson RL, Shinn EA (2006) New maps, new
information: coral reefs of the Florida Keys. J Coast Res
22:260–282
Lirman D, Fong P (2007) Is proximity to land-based sources of coral
stressors an appropriate measure of risk to coral reefs? An
example from the Florida Reef Tract. Mar Pollut Bull
54:779–791
Lirman D, Schopmeyer S, Manzello D, Gramer LJ, Precht WF, Banks
K, Barnes B, Bartels E, Bourque A, Byrne J, Donahue S,
Duquesnel J, Fisher L, Gilliam D, Hendee J, Johnson M,
Maxwell K, McDevitt E, Monty J, Rueda D, Ruzicka R, Thanner
S (2011) Severe 2010 cold-water event caused unprecedented
mortality to corals of the Florida reef tract and reversed previous
survivorship patterns. PLOS ONE 6:e23047
Mackenzie FT, Lerman A (2006) Carbon in the geobiosphere -
Earth’s outer shell. Springer, Dordrecht, p 402
Mallela J (2007) Coral reef encruster communities and carbonate
production in cryptic and exposed coral reef habitats along a
gradient of terrestrial disturbance. Coral Reefs 26:775–785
Manzello DP, Kleypas JA, Budd DA, Eakin CM, Glynn PW, Langdon
C (2008) Poorly cemented coral reefs of the eastern tropical
Pacific: Possible insights into reef development in a high-CO2
world. Proc Natl Acad Sci USA 105:10450–10455
Manzello DP, Enochs IC, Melo N, Gledhill DK, Johns EM (2012)
Ocean acidification refugia of the Florida Reef Tract. PLoS ONE
7:e41715
Marszalek DS, Babashoff G Jr, Noel MR, Worley DR (1977) Reef
distribution in South Florida. Proc 3rd Int Coral Reef Symp
2:223–229
Marubini F, Atkinson MJ (1999) Effects of lowered pH and elevated
nitrate on coral calcification. Mar Ecol Prog Ser 188:117–121
Marubini F, Davies PS (1996) Nitrate increases zooxanthellae
population density and reduces skeletogenesis in corals. Mar
Biol 127:319–328
Marubini F, Ferrier-Pages C, Cuif JP (2003) Suppression of skeletal
growth in scleractinian corals by decreasing ambient carbonate-
ion concentration: a cross-family comparison. Proc R Soc Lond
B Biol Sci 270:179–184
Meehl GA, Washington WM, Collins WD, Arblaster JM, Hu A, Buju
LE, Strand WG, Teng H (2005) How much more global warming
and sea level rise? Science 307:1769–1772
Morse DE, Hooker N, Morse ANC, Jensen RA (1988) Control of
larval metamorphosis and recruitment in sympatric agariciid
corals. J Exp Mar Biol Ecol 116:193–217
Ohde S, Van Woesik R (1999) Carbon dioxide flux and metabolic
processes of a coral reef, Okinawa. Bull Mar Sci 65:559–576
Palandro DA, Andrefouet S, Hu C, Hallock P, Muller-Karger FE,
Dustan P, Callahan MK, Kranenburg C, Beaver CR (2008)
Quantification of two decades of shallow-water coral reef habitat
decline in the Florida Keys National Marine Sanctuary using
Landsat data (1984–2002). Remote Sens Environ 112:3388–3399
Pandolfi JM, Bradbury RH, Sala E, Hughes TP, Bjorndal KA, Cooke
RG, McArdle D, McClenachan L, Newman MJH, Peredes G,
Warner RR, Jackson JBC (2003) Global trajectories of the long-
term decline of coral reef ecosystems. Science 301:955–958
Pandolfi JM, Jackson JBC, Baron N, Bradbury RH, Guzman HM,
Hughes TP, Kappel CV, Micheli F, Ogden JC, Possingham HP,
Sala E (2005) Are U.S. coral reefs on the slippery slope to slime?
Science 307:1725–1726
Price NN, Martz TR, Brainard RE, Smith JE (2012) Diel variability in
seawater pH relates to calcification and benthic community
structure on coral reefs. PLOS ONE 7:e43843
Reynaud S, Leclercq N, Romaine-Lioud S, Ferrier-Pages C, Jaubert J,
Gattuso JP (2003) Interacting effects of CO2 partial pressure and
temperature on photosynthesis and calcification in a scleractinian
coral. Global Change Biol 9:1660–1668
Risk MJ (1999) Paradise lost: how marine science failed the world’s
coral reefs. Mar Freshw Res 50:831–837
Roberts HH, Rouse JRLJ, Walker ND, Hudson JH (1982) Cold-water
stress in Florida Bay and northern Bahamas: a product of winter
cold-air outbreaks. J Sediment Petrol 52:0145–0155
Sammarco PW, Risk MJ (1990) Large-scale patterns in internal
bioerosion of Porites: cross continental shelf trends on the Great
Barrier Reef. Mar Ecol Prog Ser 59:145–156
Shinn EA (1966) Coral growth-rate, an environmental indicator.
J Paleontol 40:233–240
Coral Reefs
123

Shinn EA (1980) Geologic history of Grecian Rocks, Key Largo
Coral Reef Marine Sanctuary. Bull Mar Sci 30:646–656
Shinn EA, Hudson JH, Halley RB, Lidz B (1977) Topographic
control and accumulation rate of some Holocene coral reefs:
South Florida and Dry Tortugas. Proc 3rd Int Coral Reef Symp
2:1–7
Smith JE, Smith CM, Hunter CL (2001) An experimental analysis of
the effects of herbivory and nutrient enrichment on benthic
community dynamics on a Hawaiian reef. Coral Reefs
19:332–342
Steneck RS (1986) The ecology of coralline algal crusts: convergent
patterns and adaptive strategies. Annu Rev Ecol Syst
17:273–303
Szmant AM, Forrester A (1996) Water column and sediment nitrogen
and phosphorus distribution patterns in the Florida Keys, USA.
Coral Reefs 15:21–41
Tanzil JTI, Brown BE, Tudhope AW, Dunne RP (2009) Decline in
skeletal growth of the coral Porites lutea from the Andaman Sea,
South Thailand between 1984 and 2005. Coral Reefs
28:519–528
Vasquez-Bedoya LF, Cohen AL, Oppo DW, Blanchon P (2012)
Corals record persistent multidecadal SST variability in the
Atlantic Warm Pool since 1775 AD. Paleoceanography
27:pa3231
Veron JEN, Hoegh-Guldberg O, Lenton TM, Lough JM, Obura DO,
Pearce-Kelly P, Sheppard CRC, Spalding M, Stafford-Smith
MG, Rogers AD (2009) The coral reef crisis: The critical
importance of \ 350 ppm CO2. Mar Pollut Bull 58:1428–1436
Voss GL (1973) Sickness and death in Florida’s coral reefs. Nat Hist
72:41–47
Winter A, Appeldoorn RS, Bruckner A, Williams EH, Goenaga C
(1998) Sea surface temperatures and coral reef bleaching off La
Parguera, Puerto Rico (northeastern Caribbean Sea). Coral Reefs
17:377–382
Yates KK, Halley RB (2006) Diurnal variation in rates of calcification
and carbonate sediment dissolution in Florida Bay. Estuaries and
Coasts 29:24–39
Coral Reefs
123
Copyright © 2022 FDOKUMEN