CaixaBI R&C 2011_EN.docx
245
ANNUAL REPORT Separate and Consolidated Operations, 2011
-
Upload
khangminh22 -
Category
Documents
-
view
1 -
download
0
Transcript of CaixaBI R&C 2011_EN.docx

ANNUAL REPORT
Separate and Consolidated Operations, 2011

Annual Report – 2011
2
Index
Board of Directors’ Report ......................................................................... 4
1 Statutory bodies...............................................................................................................5
2 Organogram ....................................................................................................................6
3 Key consolidated financial indicators ...............................................................................7
4 Overview of CaixaBI ........................................................................................................8
4.1 Prizes and rankings................................................................................................................................... 8
4.2 Main operations ...................................................................................................................................... 10
5 Macroeconomic environment.........................................................................................13
5.1 International............................................................................................................................................ 13
5.2 Domestic ................................................................................................................................................ 16
5.3 Capital markets....................................................................................................................................... 17
6 Strategy and business model.........................................................................................19
6.1 Project finance ........................................................................................................................................ 20
6.2 Structured finance................................................................................................................................... 22
6.3 Corporate finance – advisory ................................................................................................................... 24
6.4 Debt capital market ................................................................................................................................. 28
6.5 Equity capital market ............................................................................................................................... 30
6.6 Financial brokerage................................................................................................................................. 32
6.7 Research ................................................................................................................................................ 32
6.8 Financing and structuring area................................................................................................................. 33
6.9 Syndication and sales ............................................................................................................................. 35
6.10 Venture capital ........................................................................................................................................ 35
6.11 Outlook for 2012 ..................................................................................................................................... 41
7 Results ..........................................................................................................................44
8 Human resources ..........................................................................................................47
9 Qualified equity investors...............................................................................................49
10 Acknowledgments .........................................................................................................50
11 Proposal for the appropriation of net income .................................................................51
Financial statements, notes and opinions ............................................... 52
1 Consolidated and separate financial statements............................................................53
2 Notes to the consolidated financial statements ..............................................................64
3 Notes to the separate financial statements ..................................................................126

Annual Report – 2011
3
4 Reports and opinions...................................................................................................185
Report on corporate governance........................................................... 197
I Corporate governance ..................................................................... 198
1 Assessment of compliance with good governance principles.......................................199
2 Management guidelines, mission, objectives and policies ...........................................201
3 General operating principles........................................................................................204
4 Relevant transactions with related parties....................................................................205
5 Corporate model..........................................................................................................208
5.1 Statutory bodies .................................................................................................................................... 209
5.2 Specialised committees......................................................................................................................... 222
6 Remuneration of members of statutory bodies ............................................................226
7 Control system ............................................................................................................227
7.1 Internal control system .......................................................................................................................... 227
7.2 Control system on the protection of the company’s investments and its assets........................................ 230
7.3 Control system for safeguarding customers’ assets held under CaixaBI’s custodian services................... 230
8 Disclosure of relevant information................................................................................232
8.1 Market relations representative.............................................................................................................. 232
8.2 Disclosure of relevant information .......................................................................................................... 232
8.3 Diagramme of CaixaBI investments ....................................................................................................... 232
8.4 Share capital and dividends policy ......................................................................................................... 233
9 Analysis of economic, social and environmental sustainability.....................................234
9.1 Economic considerations....................................................................................................................... 237
9.2 Environmental considerations................................................................................................................ 238
9.3 Social considerations ............................................................................................................................ 238
II Compliance with legal guidelines ....................................................... 240

Annual Report – 2011
4
Board of Directors’ Report

Annual Report – 2011
5
1 Statutory bodies
Shareholders’ meeting
Chairman
José Lourenço Soares
Secretaries
Salomão Jorge Barbosa Ribeiro
António Pereira Grada Ferreira
Board of directors
Chairman of the board of directors
Jorge Humberto Correia Tomé
Chairman of executive committee
Jorge Telmo Maria Freire Cardoso
Members of executive committee
Gonçalo Vaz Gago da Câmara de Medeiros Botelho
Francisco José Pedreiro Rangel
Members of the board of directors
Rui Manuel do Vale Jordão Gonçalves Soares
José Pedro Cabral dos Santos
José Manuel Carreiras Carrilho
Fiscal board
Chairman
Miguel José Pereira Athayde Marques
Members
Pedro António Felício
Maria Rosa Tobias Sá
Deputising
João Barata da Silva
Statutory auditors
Acting
Deloitte & Associados, SROC represented by João Carlos Henriques Gomes Ferreira
Deputising
Carlos Luís Oliveira de Melo Loureiro

Annual Report – 2011
6
2 Organogram
Board of Directors
ExecutiveBoard
Compliance Office
Ália Silva
CorporateDebt FinanceDivision
Paulo Serpa Pinto
Primary Equities MarketDivision
Ana Santos Martins
Corporate Advisory Division
Paulo Oliveira Silva
Syndicationand Sales
Leonor Canedo
Project FinanceDivision
Daniel Santos
Structured FinanceDivision
Paulo Henriques
Finance and StructuringDivision
Francisco Santos
Research Office
João Miguel Lourenço
Internal Audit Office
Fernando Oliveira
Financial BrokerageDivision
Valentim Martins
Legal Affairs Office
Ana Andrade
Strategic Planning andOrganisationDivision
Rita Lourenço
Human and AdministrativeResources
António Carlos Alves
OperationsDivision
Miguel Freire
Marketing andCommunicationOffice
António Gregório
AccountsDivision
João Gonçalves
InformationSystems
Ema Campos
Business Areas
Support Areas

Annual Report – 2011
7
3 Key consolidated financial indicators
Results indicators
(EUR thousand) 2010 2011
Net interest income 33,313 29,052
Net commissions 73,712 61,793
Income from financial assets (16,688) (31,283)
Other operating income 1,609 (519)
Net operating income 91,946 59,043
Net operating income – adjusted (1)
94,247 86,729
Provisions and impairment (9,656) (31,896)
Structural costs (29,018) (24,774)
Income before tax 53,272 2,373
Tax (13,611) 6,220
Non-controlling interests 492 (40)
Net income 40,153 8,553
Performance ratios
Cost-to-income - adjusted (1)
30.5% 28.1%
(1) Adjusted for impairment on financial assets
Balance sheet indicators
(EUR thousand) 2010 2011
Credit portfolio 787,912 699,133
Securities portfolio 671,516 537,241
Derivatives portfolio (active position) 428,578 715,196
Derivatives portfolio (passive position) (418,469) (735,111)
Customer resources 104,996 114,069
Net assets 2,000,188 2,161,679
Share capital 81,250 81,250
Shareholders’ equity 275,520 213,816
Performance ratios
ROE 15.0% 3.5%
ROA 2.0% 0.4%

Annual Report – 2011
8
4 Overview of CaixaBI
4.1 Prizes and rankings
Caixa - Banco de Investimento, S.A. (CaixaBI or Bank) in performing its operations, in 2011, furthered
the internationalisation strategy it has been implementing over the last few years. The Bank’s good
performance in terms of its core business has continued to merit the recognition of its customers and
partners and has been rewarded by the distinctions afforded by international analysts and in its
leading positions in the main sector rankings.
Best investment bankin Portugal
Global Finance
Best investment bankin Portugal
EMEA Finance
Best debt housein Portugal
Euromoney Award for Excellence
Best investment bankin Portugal
Global Finance
Americas transport deal of the year
Project Finance International
Latin America transport deal of the year
Euromoney Project Finance
Best Investment Bank
In Portugal
2011
Best Investment Bank
In Portugal
2010
Best Debt House
In Portugal
2011
Nº 1 Corporate
Bond House
2011
Americas TransportDeal of the Year 2011
MANDATED LEAD ARRANGER | 2011
IDB (B LOAN): USD 330,000,000IDB (A LOAN): USD 100,000,000
Latin America Transport Deal of the Year 2011
MANDATED LEAD ARRANGER | 2011
IDB (B LOAN): USD 330,000,000IDB (A LOAN): USD 100,000,000
Annual Report – 2011
9
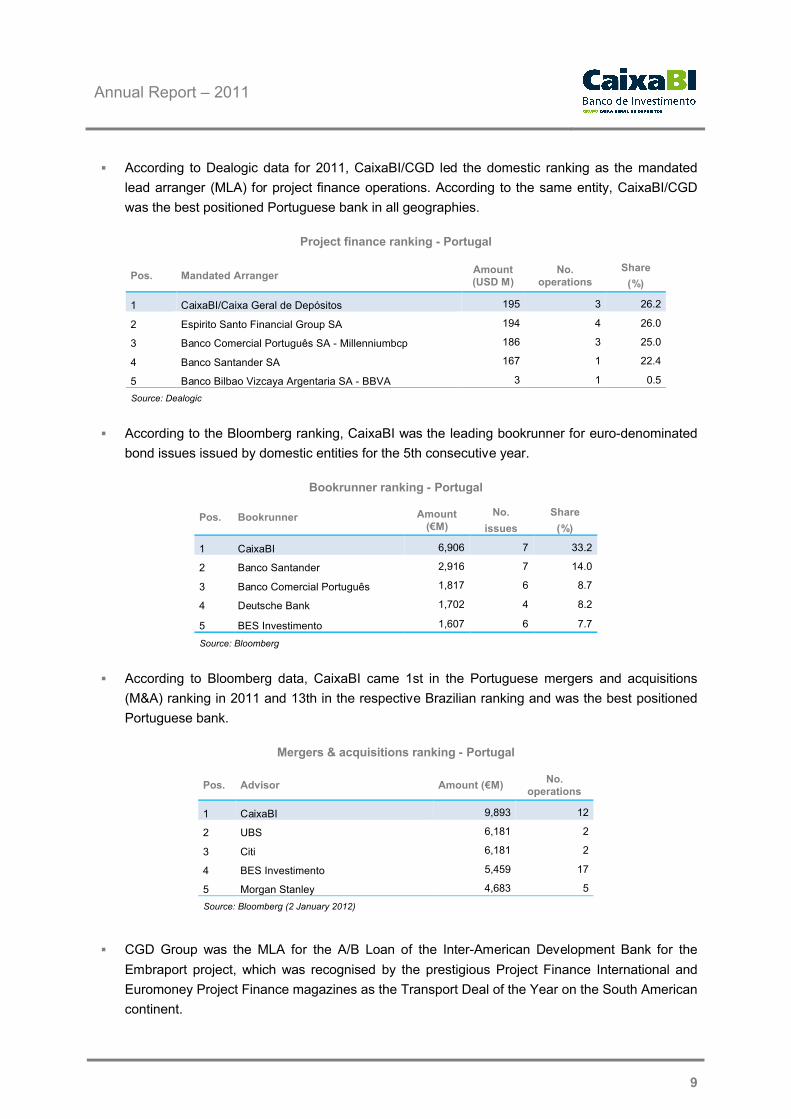
According to Dealogic data for 2011, CaixaBI/CGD led the domestic ranking as the mandated
lead arranger (MLA) for project finance operations. According to the same entity, CaixaBI/CGD
was the best positioned Portuguese bank in all geographies.
Project finance ranking - Portugal
Pos. Mandated ArrangerAmount(USD M)
No. operations
Share
(%)
1 CaixaBI/Caixa Geral de Depósitos 195 3 26.2
2 Espirito Santo Financial Group SA 194 4 26.0
3 Banco Comercial Português SA - Millenniumbcp 186 3 25.0
4 Banco Santander SA 167 1 22.4
5 Banco Bilbao Vizcaya Argentaria SA - BBVA 3 1 0.5
Source: Dealogic
According to the Bloomberg ranking, CaixaBI was the leading bookrunner for euro-denominated
bond issues issued by domestic entities for the 5th consecutive year.
Bookrunner ranking - Portugal
Pos. Bookrunner Amount(€M)
No.
issues
Share
(%)
1 CaixaBI 6,906 7 33.2
2 Banco Santander 2,916 7 14.0
3 Banco Comercial Português 1,817 6 8.7
4 Deutsche Bank 1,702 4 8.2
5 BES Investimento 1,607 6 7.7
Source: Bloomberg
According to Bloomberg data, CaixaBI came 1st in the Portuguese mergers and acquisitions
(M&A) ranking in 2011 and 13th in the respective Brazilian ranking and was the best positioned
Portuguese bank.
Mergers & acquisitions ranking - Portugal
Pos. Advisor Amount (€M)No.
operations
1 CaixaBI 9,893 12
2 UBS 6,181 2
3 Citi 6,181 2
4 BES Investimento 5,459 17
5 Morgan Stanley 4,683 5
Source: Bloomberg (2 January 2012)
CGD Group was the MLA for the A/B Loan of the Inter-American Development Bank for the
Embraport project, which was recognised by the prestigious Project Finance International and
Euromoney Project Finance magazines as the Transport Deal of the Year on the South American
continent.
Annual Report – 2011
10
4.2 Main operations
CaixaBI was involved in various emblematic business deals, strengthening its leading position as an
investment bank. Reference should be made to the following highlights in terms of its main business
areas.
Project finance
CGD Group, through CaixaBI, was involved in operations for a global amount of close to €389 million,
of which around €231 million in Portugal. CaixaBI came 1st in the Dealogic ranking for its role as an
MLA in project finance operations in Portugal and was the best positioned Portuguese bank in all
geographies.
On an international level, reference should be made to the progressive geographical expansion of the
Bank’s operations, associated with operations in Angola and Mozambique and, together with Banco
Caixa Geral – Brasil, S.A. (BCG Brasil), on structuring and/or financial advisory operations for a
diverse series of projects in Brazil. These prize-winning endeavours are exemplified by the award of
the highly ranked Project Finance International and Euromoney Project Finance magazines’ Transport
Deal of the Year prize for the Embraport operation in which CGD Group was the MLA.
Structured finance
In the sphere of structured operations on a corporate basis, CaixaBI geared its operations to
identifying mandates guaranteeing it MLA status of which special reference should be made to its
financial advisory services to Secil for funding the acquisition of an equity stake in Betecna from the
Lafarge Group.
Corporate finance – advisory
Notwithstanding the unfavourable macroeconomic environment and reduced level of M&A operations
activity on a global level, CaixaBI’s work and endeavours have been reflected in the Bloomberg
ranking in which the Bank came 1st, in Portugal, based on its involvement in 12 M&A operations for an
aggregate amount of around €10 billion.
In Brazil, according to the same ranking, CaixaBI, together with BCG Brasil and following only two full
years of activity in the country, came 13th in the investment banks’ ranking in terms of volume of
announced/completed M&A operations and is the best positioned Portuguese bank with an aggregate
amount of around R$17.8 billion.
During the course of 2011, reference should be made to the financial advisory operation for
Parpública’s disposal of a 21.35% equity investment in EDP, as part of the company’s highly
successful 8th reprivatisation stage. Reference should also be made to the financial advisory services
on Galp Energia’s disposal of a 30% equity investment in Petrogal Brasil, for around USD 4.8 billion.
Reference should, lastly, be made to the financial advisory operations for Portugal Telecom’s equity
investment in the Brazilian Oi Group, following the disposal of its equity investment in Vivo, in which

Annual Report – 2011
11
CaixaBI was also involved in a financial advisory capacity. This was one of the biggest operations
involving Portuguese companies over the last few years and represents yet another success for
CaixaBI’s Portugal – Brazil cross-border activities.
Debt capital market
CaixaBI’s leading position in the debt capital market and structured asset financing operations, in
2011, won another important international recognition with Euromoney’s Award of Excellence for the
Best Debt House in Portugal for the second time running.
Reference should also be made to the NYSE Euronext Lisbon Awards, awarded for the first time in
2011, with the main objective of promoting and recognising the activities of capital market players,
which distinguished CaixaBI with its No. 1 Corporate Bond House prize.
Notwithstanding the extraordinarily challenging environment in the debt markets, notably in the bond
sector, CaixaBI, over the course of 2011, led seven primary market bond issues. This performance,
according to the Bloomberg ranking, positioned the Bank as the number one bookrunner for euro-
denominated domestic bond issues for the fifth year running.
Activity in the commercial paper segment was strongly conditioned by the growing balance sheet
restrictions faced by domestic financial institutions, in 2011. However, despite the unfavourable
environment, CaixaBI retained a leading position in this market in Portugal, having organised and led
thirteen new commercial programmes1, totalling around €2.5 billion, last year.
Equity capital market
CaixaBI developed and successfully completed four capital market operations in 2011.
In the international sphere, it was involved as co-lead for the Bankia international public offering (IPO)
as the only Portuguese bank in the banking syndicate for one of the biggest offerings in Europe in
2011, and as co-manager for the international tranche of the Sonae Sierra Brasil IPO and secondary
public subscription for EDP Energias do Brasil, strengthening its international presence in the capital
market area.
In Portugal and notwithstanding the low level of activity in the primary share market, CaixaBI was
responsible for organising and structuring the Inapa rights issue, through the issue of non-voting
preference shares as one of the main capital market operations in 2011.
Financial brokerage
The performance of the share segment of the capital market over the course of 2011 was extremely
negative, reflecting current uncertainty over fundamental variables for the evolution of share markets.
The domestic share market was particularly penalised by this environment, owing to greater investor
risk aversion to Portuguese assets which fuelled a decline of the volumes brokered in the market.
1
Includes fully or partly renewed programmes maturing in 2011.

Annual Report – 2011
12
According to CMVM data, market turnover to the end of August was down 34% over the same period
of 2010, naturally affecting the Bank’s financial brokerage activity.
There were no primary market operations, in Portugal, in 2011. CaixaBI was, however, actively
involved in the Bankia IPO in Spain and as co-manager for the Sonae Sierra Brasil IPO and for the
EDP offer for its EDP Energias do Brasil subsidiary.
Financing and structuring area
Public debt market-making activity in the secondary market, in 2011, was characterised by extremely
difficult conditions with low liquidity levels, historically high bid-offer spreads and major volatility.
Notwithstanding such market constraints, CaixaBI came 1st out of all the primary dealers in IGCP’s
general performance ranking.
In its activity as a liquidity provider, CaixaBI is a benchmark operator and Euronext has awarded its
maximum “A” ratings on all securities and categories in which it operates.
Syndication and sales
CaixaBI was involved, in 2011, as joint lead manager, for the issue of €600 million in Portugal
Telecom bonds and a Portuguese Treasury Bond issue for the amount of €3.5 billion. It was also
responsible for 341 commercial paper issues totalling €12 billion, with €4.8 billion in placements.
Venture capital
CaixaBI’s venture capital area has five venture capital funds, enabling it to provide a transversal level
of cover for different target segments over the course of the corporate life cycle and which, in one
specific case, was geared to a sectoral focus:
Caixa Empreender+
Caixa Mezzanine
CGD Group
Energias Renováveis and
Desenvolvimento e Reorganização Empresarial, set up in 2011.
During the course of 2011, 210 investment opportunities were analysed, with 32 operations totalling
€60 million having been approved, of which 21 were completed, involving an investment of €17 million.
There were also 8 disinvestments at a realisation price of €15 million.
Of total assets under direct Caixa Capital management, the amount invested in subsidiaries totalled
€344 million, at the end of 2011, invested in 75 companies of which 40% over the last three years
period.

Annual Report – 2011
13
5 Macroeconomic environment
5.1 International
2011 was characterised by the heightening of the sovereign debt crisis, started in 2010, and
particularly affecting the eurozone’s more peripheral countries such as Greece, Ireland and Portugal,
which were provided by financial assistance programmes from the IMF, ECB and European
Commission (Troika), but which, at certain times also penalised Spain and Italy.
The main rating agencies successively downgraded their ratings on countries with the greatest fiscal
difficulties, in 2011, keeping open the possibility of new short/medium term downgrades in the event of
failure to comply with the adjustment programmes and/or worsening economic outlook. This
environment led investors to reduce their exposure to such countries’ debt securities, with a highly
negative impact on the evolution of the respective yields spreads in relation to German public debt
securities with an identical maturity, pursuant to its role as a safe currency in periods of the greatest
turmoil, leading to historically low yields on these securities.
The Troika accordingly announced support measures to European countries experiencing difficulties
in accessing the markets, complemented by their commitment to strengthening and accelerating the
fiscal consolidation process as well as carrying out structural reforms designed to improve their
competitiveness and fuel their future growth. Countries with bailouts ceased to issue debt in the longer
maturity markets, performing only short term operations (treasury bills or similar securities) with the
aim of satisfying their short term liquidity requirements. The ECB also endeavoured to dampen the
yields on sovereign debt based on market acquisition of public debt securities of member states under
the greatest pressure.
On an economic level, the austerity programmes submitted by governments to guarantee compliance
with the respective adjustment programmes ended up by fuelling pessimism over the growth of
short/medium term economic activity, not only in the countries directly involved but also on a global
level.
The indicators of other non EU countries also showed imbalances in their public finance indicators.
This had a penalising effect, at certain times, on the performance of financial markets, such as in the
US, with an impact on an increase in the intrinsic risk on their public debt securities.
Growing concerns over the significant slowdown of growth in the main economies led the central
banks in the main economic zones to opt for clearly more expansionary monetary policies. This was
the case with the ECB which, at its November and December meetings, lowered its key rates by 0.5%
to 1.0%. At the end of the year, the ECB also announced two three year liquidity injection operations
to meet the needs of the financial system which was greatly penalised by the virtual closure of credit
markets, particularly in the case of southern European institutions.

Annual Report – 2011
14
FED, ECB, BoE and BoJ intervention rates
Source: Bloomberg, CaixaBI
The start of 2012 is likely to continue to be characterised by investors’ risk aversion to the financial
assets of the eurozone’s more peripheral countries, reflected in the continuation of relatively high risk
premiums on such countries. An improvement in the global assessment of the risks associated with
these countries will essentially depend on their capacity to evidence effective improvements in their
current fiscal consolidation processes, by complying with the objectives defined in the respective
financial assistance or stability programmes, pursuant to which investors are likely to attach great
importance to the main fiscal performance indicators achieved in the first few months of 2012.
In mid January, the IMF published an update to its World Economic Outlook which reflected a high
level of uncertainty regarding world economic performance, incorporating the risks associated with the
sovereign debt crisis and banking sector problems in the eurozone. According to the data published,
the world economy is thought to have grown by an average of 3.8% over 2011 against an estimate of
4.0% in the September report and 5.2% in 2010.
The IMF has reduced its growth estimates for the world economy, in 2012, indicating GDP growth of
around 3.3%. This will be a two tier growth, with the most developed economies recording more
moderate growth in activity and with unemployment remaining high. The more peripheral eurozone
countries will be penalised by pressure on their credit spreads and fiscal consolidation measures. The
IMF has downgraded the growth prospects for the countries by an amplitude of -0.7% for 2012, with
an estimate of GDP changes of 1.2.
ECB
FED
BoE
BoJ0,0
1,0
2,0
3,0
4,0
5,0
6,0
7,0
Ma
r-0
7
Ju
n-0
7
Se
p-0
7
De
c-0
7
Ma
r-0
8
Ju
n-0
8
Se
p-0
8
De
c-0
8
Ma
r-0
9
Ju
n-0
9
Se
p-0
9
De
c-0
9
Ma
r-1
0
Ju
n-1
0
Se
p-1
0
De
c-1
0
Ma
r-1
1
Ju
n-1
1
Se
p-1
1
De
c-1
1
Evo
lutio
n o
f C
en
tra
l B
an
ks'
inte
rve
ntio
n r
ate
s (
%)

Annual Report – 2011
15
Developing economies are likely to post more significant growth rates, albeit with an increase of
inflationary pressures owing to higher commodity prices, particularly in first half 2011. China, India and
Brazil are likely to be highly dynamic notwithstanding the IMF’s downwards revisions of GDP growth.
GDP growth in the main world economies
2008 2009 2010 2011e 2012e
Eurozone 0.5% -4.2% 1.9% 1.5% 0.3%
Germany 1.0% -4.7% 3.7% 3.0% 0.6%
France 3.0% -2.4% 1.5% 1.7% 0.4%
Spain 0.9% -3.7% -0.1% 0.7% -1.0%
Portugal 0.0% -2.5% 1.4% -1.5% -3.1%
Italy -1.3% -5.0% 1.5% 0.4% -1.3%
United Kingdom -1.0% -4.9% 1.8% 0.9% 0.6%
US 0.0% -2.6% 3.0% 1.7% 1.8%
Japan -1.2% -6.3% 4.1% -0.9% 1.7%
Brazil 5.1% -0.7% 7.5% 3.0% 3.0%
World economy 2.8% -0.6% 5.0% 3.8% 3.3%
Source: IMF, EC, ESN, OECD, CaixaBI
According to the IMF, financial markets are likely to continue to be characterised by high levels of
volatility, reflecting investors’ concerns over sovereign risk, particularly in the eurozone. The
progressive stabilisation of financial markets may support a gradual acceleration of the rate of growth
of economic activity on an international level.
Other incentives for economic growth will, however, continue to be necessary and may, in the current
European context, be restricted to monetary-like instruments for which key reference rates are likely to
remain low for a relatively long period. In general, the reduction of inflationary pressures, owing to the
decline in the prices of the main commodities and contraction of consumption with economic
deleveraging and high unemployment rates will favour the maintenance of expansionary monetary
policies in the main economic blocs.
Various risk factors on the main economies, however, remain and may lead to a lower level of
economic activity. They include, inter alia:
Expectation of continued high unemployment for a relatively long period, owing to the gap
between the positive change in GDP and a shift towards job creation, which, if occurring, could
lead to less dynamic domestic demand in different countries.
Continuing credit restrictions, reflecting the banks’ needs to deleverage their balance sheets and
continue to increase their capital to comply with the new regulatory requirements.
Greater unwillingness by financial institutions to assume uncollateralised risks, having opted to
invest cash surpluses in short term investments with central banks at relatively low rates.
Danger of contagion of the sovereign debt crisis to other countries which will continue to
condition fiscal policies for a relatively long period.

Annual Report – 2011
16
5.2 Domestic
Notwithstanding the fact that the Portuguese Republic’s borrowing requirements up to 2013 are largely
guaranteed by the financial assistance programme signed in May 2011, funding restrictions on the
domestic economy and deleveraging requirements remain. This will have a negative impact on GDP
over the last few months of 2011 and predictably over a large part of 2012.
The Portuguese economy contracted by 1.5% in 2011, according to the snapshot estimates disclosed
by the INE, against growth of 1.0% in 2010. Reference should be made to negative quarter-on-quarter
changes over the last five quarters. This performance derived from the negative contribution of private
and public consumption and a huge drop in investment, notwithstanding the good performance of net
exports.
Up to third quarter 2011, net external demand made a positive contribution to GDP, with exports up
7.8%, notwithstanding the world economic slowdown. The 2.8% decline in imports particularly derived
from lower domestic demand.
The fiscal deficit reduction objective, which led to the implementation of austerity measures under the
financial assistance programme for Portugal, caused a retraction of domestic demand and investment,
with a downturn of 3.0% in private consumption, 2.5% in public consumption and 9.8% in gross fixed
capital formation in the first nine months of the year.
GDP and main components
Source: INE, CaixaBI Equity Research
The Harmonised Index of Consumer Prices (HICP) in Portugal, for December 2011 posted average
year-on-year growth of 3.6%, reflecting the changes in VAT rates and increase in the prices of the
main commodities in the international markets in the first half of the year.
The unemployment rate in fourth quarter 2011 was 14.0%, in comparison to the preceding quarter’s
12.4% and 11.1% at the end of 2010 (values not adjusted for INE’s new methodology).
-4
-3
-2
-1
0
1
2
3
-20
-15
-10
-5
0
5
10
15
1T
07
2T
07
3T
07
4T
07
1T
08
2T
08
3T
08
4T
08
1T
09
2T
09
3T
09
4T
09
1T
10
2T
10
3T
10
4T
10
1T
11
2T
11
3T
11
GD
P e
vo
lutio
n (
Yo
Y %
)
GD
P c
om
po
ne
nts
(Y
oY
%)
GDP Investment Domestic Demand Exports Imports

Annual Report – 2011
17
5.3 Capital markets
Money market
Interest rates in the eurozone money market tended to increase slightly over the course of the first half
year followed by stabilisation up to November, which witnessed the start of a downwards movement
as a reaction to the fall in the ECB’s refinancing rate.
Overnight and Euribor 3, 6 and 12 month rates
Source: Thomson Reuters, CaixaBI
Foreign exchange market
The performance of the single European currency against the dollar, in 2011, was heterogeneous,
appreciating significantly in the first quarter followed by a period of stabilisation up to September and
then depreciating, to a rate of less than 1.30 at the end of December. Performance against the yen
followed the same trend up to May after which the drop in the value of the euro was more pronounced
and lasting, ending the year close to 99.50 yen. The euro’s performance against sterling was more
stable as shown in the following chart.
EUR/USD, EUR/GBP and EUR/JPY (base100)
Source: Thomson Reuters, CaixaBI
0,0%
0,5%
1,0%
1,5%
2,0%
2,5%
Jan-11 Feb-11 Mar-11 Apr-11 May-11 Jun-11 Jul-11 Aug-11 Sep-11 Oct-11 Nov-11 Dec-11
Euribor 3M Euribor 6M Euribor 12M EONIA
90
95
100
105
110
115
Jan-11 Feb-11 Mar-11 Apr-11 May-11 Jun-11 Jul-11 Aug-11 Sep-11 Oct-11 Nov-11 Dec-11
EUR/USD EUR/GBP EUR/JPY

Annual Report – 2011
18
Share market
The euro crisis, which took the form of a broad rating downgrades movement in several eurozone
countries and external interventions in Ireland, Greece and Portugal, had economic and financial
repercussions which translated into a significant increase of risk premiums in most European share
markets.
A comparative analysis shows that US share benchmarks posted a more positive level of performance
than their European counterparties. Movements on the Bovespa were similar to those of European
indices but recorded the highest fall between January and August, as a consequence of the contagion
of the euro crisis. In 2011, the PSI20 was down 28.2%, Bovespa down 18.1%, the EuroStoxx50 down
17.5%, the Dax down 14.5%, the IBEX35 down 13.1% with the S&P500 recording a nil change and
the Dow Jones Industrial up 5.5%.
Main stock markets
Source: Thomson Reuters, CaixaBI
Bond market
Investors’ flight to such quality assets as German sovereign debt, led to a fall in long term yields in the
eurozone, although the yields on the peripheral euro countries increased significantly. As shown in the
following chart, the downwards movement in euro core yields was relatively parallel along the curve.
Yield curve at start and end 2011
Source: Thomson Reuters, CaixaBI
60
70
80
90
100
110
120
Jan-11 Feb-11 Mar-11 Apr-11 May-11 Jun-11 Jul-11 Aug-11 Sep-11 Oct-11 Nov-11 Dec-11
PSI20
DJ Ind
S&P 500
IBEX
BovespaStoxx50
0,0%
0,5%
1,0%
1,5%
2,0%
2,5%
3,0%
3,5%
4,0%
2Y 3Y 4Y 5Y 6Y 7Y 8Y 9Y 10Y 15Y 20Y 30Y
Dec-11
Jan-11

Annual Report – 2011
19
6 Strategy and business model
CaixaBI is the autonomous unit within CGD Group that concentrates all of its investment banking
activity, operating in tandem with CGD’s commercial structures to maximise the opportunity for cross-
selling with commercial banking activity.
The Bank develops products and services for customers operating in its target market segments of
large and medium sized companies, public institutes and local councils, institutional investors and
major domestic and regional project developers, as well as private individual investors in the trading
area.
CaixaBI has concentrated on markets targeted by Portuguese companies. In line with this strategy it
has carved out a highly competitive position in the Portugal – Spain – Brazil - Lusophone Africa
perimeter, without losing sight of other geographies of interest to its customers. The Bank’s
commercial organisation, with the aim of applying the referred to strategic model, is based on a
product divisions approach, involving both domestic and international aspects. CaixaBI’s high level of
specialisation is reflected in its provision of a comprehensive portfolio of premium financial services
including all relevant investment banking areas activity:
Project finance
Structured finance
Corporate finance - advisory
Debt capital market
Equity capital market
Financial brokerage
Research
Financing and structuring area
Syndication and sales
Venture capital.

Annual Report – 2011
20
6.1 Project finance
Notwithstanding the difficult economic-financial context felt over the course of 2011, CaixaBI was
responsible for structuring several operations giving it first place, in Portugal, in Dealogic’s MLA
ranking for project finance operations in 2011. The same organisation classified CaixaBI as the best
positioned Portuguese bank in all geographies.
CaixaBI was involved in various project finance operations, entailing global CGD Group investment of
approximately €389 million2, in 2011, most of which allocated to operations in Portugal.
Reference should be made to the following successfully completed operations in 2011:
Embraport: construction of a port terminal which, at a first stage
will be capable of handling 1.2 million TEU and will have the
capacity to handle bulk liquids, improving the capacity of the Port of
Santos (Brazil) to receive new generation deep keel cargo vessels.
The project’s promoters are Odebrecht Transport, Dubai Port
World and Coimex. The project was financed by an A/B Loan of the
Inter-American Development Bank (USD 430 million) and by a loan
from the Caixa Económica Federal (in Brazilian reais equivalent to
around USD 330 million).
CGD Group was the MLA for the A/B Loan of the Inter-American
Development Bank, in an operation in which only four commercial
banks participated, based on an invitation from the promoters and which was singled out by the
prestigious Project Finance International and Euromoney Project Finance magazines as the
Transport Deal of the Year on the South American continent.
ELOS Poceirão – Caia: CaixaBI was the MLA in the concession
contract for the design, construction, financing, maintenance and
supply of rail infrastructures (excluding signalling and
telecommunications systems) on the section between the Poceirão
and Caia zones as an integral part of the high speed Lisbon –
Madrid rail link. It was also MLA for the concession for the rail
infrastructures on the section of standard line east of the current
station in Évora and the border between Portugal and Spain, in the
Caia zone, which is an integral part of the standard Sines-Elvas-
Caia line, referred to as the “RAV Poceirão-Caia”.
2
Not all of the completed operations were eligible for the Dealogic ranking.
Latin America Transport Deal of the Year 2011
MANDATED LEAD ARRANGER | 2011
IDB (B LOAN): USD 330,000,000IDB (A LOAN): USD 100,000,000
ELOS – Ligações de Alta Velocidade, S.A.
Phase I – High Speed Railway
Line linking Portugal and Spain
(Poceirão-Caia)
Portugal
€1,088,384,493
MANDATED LEAD ARRANGER 2| 2011

Annual Report – 2011
21
Indáqua Santo Tirso: refinancing of the water and sewage
concession in the municipalities of Santo Tirso and Trofa, as
part of the process for restoring the concession’s economic-
financial balance. All of the original financing was taken out with
CGD.
On an international level, reference should be made to the Bank’s commitment to its geographical
expansion, focusing on Brazil, Mozambique and Angola, which endeavours continued to bear fruit in
2011, exemplified by its involvement in the referred to Embraport operation as well as financial
advisory services to EDP Energias do Brasil in the auction for a licence for the construction of a
combined 500 MW natural gas power station in Brasil.
Water and Sewage
Concession – Economic and
Financial Rebalancing
Portugal
€17,500,000
MANDATED LEAD ARRANGER 9 | 2011

Annual Report – 2011
22
6.2 Structured finance
In terms of operations financed and structured on a corporate basis, in 2011, reference should be
made to CaixaBI’s ongoing involvement in the identification of mandates giving it MLA status both in
Portugal and overseas.
In Portugal, reference should be made to the signing of the
promissory financing contract with SECIL, for an equity investment
in Betecna from the Lafarge Group, signed in July.
The Bank also played a highly active role in structuring various operations, particularly:
Ascendi: involvement in financing the Ascendi Group, reimbursed by the dividend flow received
by Ascendi Group SGPS.
José de Mello Saúde: structuring of short term finance for José de Mello Saúde for the
reimbursement of a tranche of the loan made by CGD Group to Escala Braga – Entidade
Gestora do Edifício, S.A. This financing operation was fully provided for by CaixaBI.
Also on an international level, CaixaBI endeavoured to be actively involved in advisory, structuring and
financial organisation on a typically corporate basis exemplified by the structured operation with
Rodovias do Tietê. In this operation, CGD Group, through BCG Brasil, was a member of a banking
syndicate which, in December 2010, arranged for a bridging loan with the Rodovias do Tietê
concessionaire, through the issue of promissory notes with a maturity of 6 months, latterly renewed in
June 2011, in the form of a new promissory notes issue with a maturity of 6 months.
The slow economic recovery and limited capacity of several companies to resolve their commitments,
vis-à-vis a scenario of liquidity restrictions maintained the trend noted in liabilities refinancing
operations, in which CaixaBI remained active in providing advisory services on several liabilities
refinancing operations.
Leveraged Buy -Out
Betecna(Grupo Lafarge)
€75,000,000
MANDATED LEAD ARRANGER 2 | 2011
Annual Report – 2011
23
As regards activity in the medium-sized enterprises segment, the environment of major restrictions on
access to liquidity, requirements for a reduction in leveraging imposed on the domestic economy and
significant increase in spreads were the reasons for greater concentration in accompanying
commercial paper programmes and the development and finalising of financial advisory mandates in
progress, particularly:
Eu-Steel Group: final closing stage of financial advisory services on refinancing liabilities,
involving negotiations with each of the lending banks.
Piedade Group: advisory service on refinancing the group’s liabilities, performed in collaboration
with PricewaterhouseCoopers, consisting of redefining the financing and negotiation structure
with each of the lending banks.

Annual Report – 2011
24
6.3 Corporate finance – advisory
M&A activity, in 2011, was down both worldwide and in Europe in comparison to 2010 (by 2.5% and
5.0% respectively), with very much lower amounts than in the last decade.
M&A activity
(€billion ) 2001 2002 2003 2004 2005 2006 2007 2008 2009 2010 2011
World market 1,656 1,168 1,020 1,564 1,947 2,774 3,126 1,722 1,211 1,427 1,391
Growth rate. -51.6% -29.5% -12.7% 53.5% 24.5% 42.5% 12.7% -44.9% -29.7% 17.9% -2.5%
European market 683 619 451 636 863 1.331 1.573 890 404 533 507
Growth rate -51.2% -9.4% -27.2% 41.0% 35.7% 54.2% 18.2% -43.4% -54.6% 32.0% -5.0%
Source: Bloomberg
The world financial crisis, the major fiscal crisis affecting several countries in Western Europe,
uncertainty deriving from interbank market liquidity problems and rating downgrades on the sovereign
debt of a series of European countries are highly conditioning factors on M&A activities.
Notwithstanding the unfavourable macroeconomic context and reduced level of global mergers and
acquisitions activity CaixaBI’s endeavours over the course of 2011, namely its main M&A operations
on domestic entities are reflected in its current ranking in international benchmark league tables.
According to Bloomberg, CaixaBI came first in the domestic M&A ranking, in 2011, having been
involved in 12 operations for an aggregate amount of around €10 billion.
In Brazil, according to the same ranking, CaixaBI, in conjunction with BCG Brasil and following only
two full years of activity in this country, came 13th in terms of the announced/completed volume of
M&A operations and was the best positioned Portuguese bank with an aggregate amount of around
R$17.8 billion.
Special reference should be made to the following projects in 2011:
EDP: financial advisory services for Parpública’s disposal of an equity investment of 21.35% in
EDP, as part of the company’s 8th remarkably successful reprivatisation stage at a price of €3.45
per share corresponding to a premium of 53.6% over the company’s listed price. This
reprivatisation process was extremely competitive, and allowed
the Portuguese state and EDP to maximise their objectives.
The strategic partnership between EDP and China Three
Gorges represents a high level of value added for the company,
particularly as regards growth in new geographies with the
objective of achieving worldwide leadership in renewable
energies areas and obtaining new funding sources. The
operation will also make it possible to achieve high value offset
operations for the Portuguese economy in terms of potential
direct investment by Chinese companies in the industrial area
and R&D centres as well as financial support for Portuguese
Advisory in the sale of a
21.35% stake in
regarding the 8th Phase of
the Privatisation Process
FINANCIAL ADVISOR| 2011
Advisory in the sale of a
21.35% stake in
regarding the 8th Phase of
the Privatisation Process
FINANCIAL ADVISOR| 2011

Annual Report – 2011
25
companies and financial institutions.
Galp Energia: financial advisory services for Galp Energia’s
disposal of a 30% equity investment in Petrogal Brasil, through a
capital increase of around USD 4.8 billion in Sinopec. This
operation enabled Galp Energia to meet the borrowing
requirements associated with its exploration & production
activities in Brazil, resulting in direct proceeds from the
reimbursement of 30% of partners´ loans in Petrogal Brasil
(around USD 390 million). Reference should be made to the fact
that the capital increase announced is significantly higher than
the initial objectives indicated to the market by Galp Energia.
This strategic partnership with Sinopec, which still requires the
approval of the competent authorities is geared to the joint
development of Galp Energia’s current assets in Brazil, although there is a possibility that both
parties will continue to expand in the region.
Portugal Telecom: financial advisory services for Portugal
Telecom’s equity investment in the Brazilian Oi Group,
translating into an important level of support by CaixaBI to
enable Portugal Telecom to strengthen its internationalisation
and maintain a presence in a market with good growth prospects
following the disposal of its equity investment in Vivo, in which
CaixaBI also acted as the financial advisor.
The financial advisory operation for Portugal Telecom’s equity
investment in Oi was one of the largest operations involving
Portuguese companies over the last few years and represents
another example of CaixaBI’s successful Portugal – Brazil cross-
border operations.
SAG: financial advisory services for SAG’s disposal of an
investment of around 47% in Unidas, to the investment funds
managed by Gávea, Kinea and Vinci, in the form of a capital
increase of R$ 300 million. CaixaBI played a highly important role
in identifying suitable financial partners for the operation and in its
permanent involvement, enhancing the project’s value. This
operation was one of the largest private placements in Brazil, in
2011, in the case of Brazilian private equities.
Advisory in the sale of a stake in
FINANCIAL ADVISOR | 2011
Advisory in the sale of a 30% stake in
Petrogal Brasil
FINANCIAL ADVISOR| 2011
Advisory in the acquisition ofa stake in
FINANCIAL ADVISOR | 2011

Annual Report – 2011
26
CaixaBI successfully developed and completed other projects, in 2011, particularly:
Financial advisory services to DGTF for an economic-financial assessment and disposal of the
share capital of BPN, pursuant to the bank’s reprivatisation process.
Financial advisory services to Portugal Telecom for an equity investment in Contax and latter
merger with Dedic/GPTI.
Financial advisory services to EDP Energias do Brasil for the assessment and acquisition of
exploration rights to the Santo Antônio do Jari power plant.
Financial advisory services to DGTF for an economic and financial assessment of its equity
investment in Investment Opportunities.
Financial advisory to CGD for an economic and financial assessment of IHRU.
Financial advisory services to Parcaixa for an economic and financial assessment of Águas de
Portugal.
Financial advisory services to Parpública for an economic and financial assessment of TAP,
pursuant to its respective reprivatisation process.
Financial advisory services to Parpública for an economic and financial assessment of REN, as
part of the 2nd stage of its reprivatisation process.
Financial advisory services to A. Silva & Silva for the iZi/Mestre Maco disposal process.
Financial advisory services to REN for an economic and financial assessment of EDM –
Telefibra.
Financial advisory services to Parpública for an economic and financial assessment of
Hidroeléctrica de Cahora Bassa.
Financial advisory services to Caixa Seguros e Saúde for an economic and financial assessment
of HPP Saúde.

Annual Report – 2011
27
Advisory in thesale of theshare capital of
regarding the PrivatisationProcess
FINANCIAL ADVISOR | 2011
Advisory in theacquisition of a stake in
FINANCIAL ADVISOR | 2011
Advisory in theacquisitionof the
exploitationrightsin
Usina Hidroeléctrica
Santo António do Jari
FINANCIAL ADVISOR| 2011
Economicand Financial Valuationof
InvestmentOpportunities
FINANCIAL ADVISOR | 2011
Economic and Financial Valuation of
FINANCIAL ADVISOR | 2011
Economic and Financial Valuation of
FINANCIAL ADVISOR | 2011
PARCAIXA SGPS, SA
Economicand Financial Valuation of
regarding thePrivatisation Process
| 2011FINANCIAL ADVISOR
Economicand Financial Valuation of
regarding the 2nd Phase of
the Privatisation Process
| 2011FINANCIAL ADVISOR
Advisory in the sale of theshare capital of
FINANCIAL ADVISOR | 2011
Economicand Financial Valuation of
EDM TELEFIBRA
FINANCIAL ADVISOR | 2011
Economicand Financial Valuation of
FINANCIAL ADVISOR | 2011
CAIXA SEGUROS E SAÚDE, SGPS, SA
Economic and Financial Valuation of
FINANCIAL ADVISOR | 2011

Annual Report – 2011
28
6.4 Debt capital market
CaixaBI’s leading position in the debt capital market and structured assets financing in Portugal, was
afforded yet another important international recognition, in 2011, with the Award of Excellence for the
Best Debt House in Portugal from Euromoney, for the second year running. Reference should also be
made to the No. 1 Corporate Bond House prize from the NYSE Euronext Lisbon Awards.
Bond loans
The worsening crisis situation in Europe’s debt markets, major constraints which, since first quarter
2010 have restricted Portuguese issuers’ access to the market, various rating downgrades on the
Portuguese Republic and the main domestic banks and companies, in addition to the growing balance
sheet restrictions faced by Portuguese financial institutions, are factors which, in 2011, severely
limited the development of the Bank’s activity in these aspects of its operations.
Notwithstanding this environment, CaixaBI, in 2011, continued to be the Portuguese market
benchmark operator in the debt component of the capital market, particularly in the bonds and
commercial paper segments. CaixaBI’s performance in leading seven primary bond market issues
continued to position the Bank, according to the Bloomberg ranking as the leading bookrunner for
euro-denominated bonds issued by domestic entities for the fifth year running.
Its proactive management of opportunities enabled CaixaBI to operate as the bookrunner in two of the
three bond issues organised by domestic issuers in 2011. These operations, both of which took place
in the very limited window of opportunity available to several Portuguese issuers between end January
and early February, involved the issue of new benchmarks with a maturity of 5 years by Portugal
Telecom (€600 million) and the Portuguese Republic (€3.5 billion).
CaixaBI was also dealer manager in a CGD exchange offer, involving an exchange of securities for
four subordinated issues in circulation (two Tier I and two Upper Tier II issues) for securities pertaining
to a new senior issue maturing in 2015, for the amount of €367.3 million.
5,625% Notes due 2016
€600,000,000
01| 2011
PT International Finance B.V.
JOINT LEAD MANAGER & BOOKRUNNER
6,4% Obrigações do
Tesouro Benchmarkdue
2016
€3,500,000,000
JOINT LEAD MANAGER & BOOKRUNNER 02|2011
Change
of 2 Issues Upper Tier II
and of 2 Issues Tier I
for 8% Notes due 2015
€367,310,000
09| 2011J OINT DEALER MANAGER
8% Notes due 2015
€367,310,000
09| 2011JOINT LEAD MANAGER & BOOKRUNNER

Annual Report – 2011
29
CaixaBI also led four new CGD bond issues, two of which for covered bonds and two Portuguese
state-backed issues totalling €6.1 billion.
Commercial paper
Activity in the commercial paper segment was strongly conditioned by the growing balance sheet
restrictions faced by domestic financial institutions in 2011. However, notwithstanding the
unfavourable environment, CaixaBI retained a leading position in this market in Portugal having in the
last year, organised and led thirteen new commercial paper programmes3, totalling around €2.5 billion,
particularly:
3
Includes fully or partly renewed programmes maturing in 2011.
Floating Rate Mortgage
Covered Bonds due 2021
# 12
€750,000,000
04| 2011LEAD MANAGER & BOOKRUNNER
Floating Rate Mortgage
Covered Bonds due 2021
# 13
€750,000,000
04| 2011LEAD MANAGER & BOOKRUNNER
Guaranteed Floating
Rates Notes
€1,800,000,000
07| 2011LEAD MANAGER & BOOKRUNNER
Guaranteed Floating
Rates Notes
€2,800,000,000
12| 2011LEAD MANAGER & BOOKRUNNER
Commercial Paper
Programme
€ 200,000,000
04| 2011SOLE ARRANGER
Commercial Paper
Programme
€ 620,000,000
06| 2011SOLE ARRANGER
Commercial Paper
Programme
€ 1,000,000,000
06| 2011JOINT ARRANGER
Commercial Paper
Programme
€ 70,000,000
09| 2011SOLE ARRANGER
SONAE INVESTIMENTOS, SGPS, S.A.
Commercial Paper
Programme
€ 300,000,000
10| 2011JOINT ARRANGER
Commercial Paper
Programme
€ 100,000,000
10| 2011SOLE ARRANGER
Commercial Paper
Programme
€ 50,000,000
10| 2011SOLE ARRANGER

Annual Report – 2011
30
6.5 Equity capital market
A significant slowdown of activity in primary share markets was witnessed over the course of 2011
with a decline of 30.3% in the number of offers and 42.6% in terms of funds secured in comparison to
2010. This slowdown was more sharply felt in the second half of the year, with 3rd quarter 2011
having been the least active period in terms of new issues since 2009.
In Portugal and in light of the negative macroeconomic environment, 2011 was characterised by an
absence of new issues and relevant capital increases, with only two exceptions in the financial sector.
International investors continued to display major risk aversion. The effective recovery of the capital
market is dependent upon the general evolution of the economic situation and investor sentiment.
Capital market activity in Spain was also limited on account of the poor performance of the economy in
general, except for banking sector offerings in the sphere of the reorganisation and recapitalisation
process of the Spanish cajas. These included the Bankia IPO, which was one of the biggest offers this
year in Europe.
As regards the Brazilian market, in 2011, although there is still a relevant pipeline of offers, only
several of the smaller offers proceeded, with a significant number of offers having been postponed
owing to high interest rates, downwards revisions of the economy’s growth rate estimates and the
situation of instability in the main world stock markets.
In 2011, CaixaBI successfully achieved four capital market operations: the Bankia IPO, Sonae Sierra
Brasil IPO, the secondary public subscription for EDP – Energias do Brasil and Inapa’s capital
increase.
As part of its internationalisation strategy, CaixaBI was involved as
co-lead in the Bankia IPO as the only Portuguese bank in the banking
syndicate for one of the largest offerings in Europe, in 2011. Bankia is
the entity resulting from the aggregation of a series of Spanish cajas
(Caja Madrid, Bancaja, Caja Canarias, Caja de Ávila, Caixa Laietana,
Caja Segovia and Caja Rioja).
Notwithstanding the highly unfavourable environment in Europe in
general and the banking sector in Spain, in particular, it was possible
to successfully organise a major offering of €3.09 billion, in which
CaixaBI played an important role in promoting the Bankia offer and
investment case to a broad range of institutional investors in the
European market, notably in less obvious markets such Scandinavia.
CaixaBI also continued to carve out a position in Brazil, in partnership with BCG Brasil. Reference
should be made to CaixaBI´s involvement as co-manager for the Sonae Sierra Brasil IPO and the
EDP - Energias do Brasil secondary public offering, strengthening its international presence in the
capital market area. CaixaBI, as co-manager, contributed to the geographical diversification of the
placement in promoting contacts with a large number of institutional investors in the European market.
Initial Public Offering
€ 3,092,145,949
CO-LEAD | 2011

Annual Report – 2011
31
In Portugal, notwithstanding the reduced level of primary share market activity, CaixaBI was
responsible for organising and structuring the Inapa rights issue through its issue of non-voting
preference shares, as one of the main capital market operations in Portugal, in 2011.
SecondaryPublic Offering
R$ 810.724.020
CO-MANAGER | 2011
Initial Public Offering
R$ 465,020,860
CO-MANAGER | 2011
Share Capital Increase
through the issue of non-
voting preference shares
€ 54,176,479.38
ARRANGER | 2011

Annual Report – 2011
32
6.6 Financial brokerage
The highly negative performance of the share segment of the capital market over the course of 2011
reflected uncertainty over fundamental variables for the evolution of share markets, the slowdown of
the main world economies, the Europe-wide sovereign debt crisis and the main central banks’ needs
to adjust monetary policies. This framework led to a reduction of exposure to share risk by asset
managers, with negative repercussions on stockmarket turnover. The Portuguese share market was
particularly penalised by this environment, reflecting investors’ greater aversion to Portuguese assets
which is also reflected in a drop in brokerage volumes in the market, down 34% over 2010, according
to CMVM data.
CaixaBI was actively involved in the Bankia IPO and was co-manager for the Sonae Sierra Brasil IPO
and the EDP share offering on its EDP Energias do Brasil subsidiary, in 2011.
6.7 Research
CaixaBI’s equity research area aims to independently monitor the evolution of financial markets, with
the objective of assisting investors’ decision-making processes associated with the management of
equity investments in their financial assets portfolios.
Operating on a sell-side approach, the research area monitors the companies listed on the main
NYSE Euronext Lisbon (PSI20) index as well as other Portuguese mid and small caps selected on the
basis of their interest to investors.
CaixaBI is part of the ESN (European Securities Network), which is a pan European investment banks
and/or brokerage houses network working together in the capital markets in a wide range of areas
ranging from corporate equities and debt to the brokerage business (sales and trading) and equity
research areas.
Underlying the collaboration in the research area is a pan European approach whose methodology is
based on equity analysis standards to provide investors with local expertise while simultaneously
ensuring a more focused coverage of each company’s specific circumstances.
Reference should also be made to the fact that the ESN’s equity research teams are divided up into
various sectors based on the Footsie methodology, of which around 10 include Portuguese
companies, making it possible to supply research reports on European companies to domestic
investors while simultaneously providing information about domestic companies to a large number of
foreign investors on the same network, without the need for a global structure. Membership of the
ESN therefore allows CaixaBI’s analysts to form a consequently broader European perspective of the
evolution of capital markets, which is all the more important taking the current level of financial market
globalisation into account.

Annual Report – 2011
33
6.8 Financing and structuring area
Public debt
Market-making activity on public debt in the secondary market, in 2011, was characterised by
extremely difficult conditions, poor liquidity, historically high bid-offer spreads and major volatility. The
widening of spreads to historical maximums – above 1500 basis points on maturities of 5 years and
more than 1000 basis points on 10 year maturities in comparison to German bonds – also increased
the Bank’s difficulty in managing its positions.
Notwithstanding such market constraints, CaixaBI came top out of all of the primary dealers in IGCP’s
general performance ranking. The Bank’s strategy for this distinction was based on its best effort
compliance with obligations and in achieving relatively higher performance levels than in 2010, both in
terms of compliance and market share.
Liquidity providing
CaixaBI’s liquidity providing activities for various securities listed on Euronext Lisbon, such as Cofina,
Orey Antunes, Altri, Inapa, Ibersol and SAG Gest remained dynamic in 2011. This is a business area
in which CaixaBI was a pioneer and continues to be a benchmark operator with Euronext having
awarded its maximum “A” rating on all securities and categories.
CaixaBI continued to expand its contracts base in diversifying the type of instruments for which it is a
liquidity provider, maintaining its market-making activity on the Fundiestamo property fund and several
Tier I deeply subordinated perpetual issues, such as Finibanco, Millenniumbcp, BES and BESI.
Own portfolios
Access to wholesale funding by Portuguese issuers continues to be constrained, particularly for
financial issuers and only alleviated at the end of the year with the ECB’s three year maturity auction.
Owing to such constraints, CaixaBI has concentrated its trading activity in futures or shares. The
interaction between shares and credit teams has increased, implementing various models which have
been maintained, perfected or discontinued in line with market conditions or performance.
Corporate risk management advisory services
Instability in capital markets has geared the Bank’s activity to identifying new business opportunities
and intensifying customer contacts in order to minimise interest risk and mark-to-market variability.
With the decline of lending to companies, in a scenario of rates at historical minimums and strong
limitations on the taking of new risks, the positive performance noted essentially derives from
endeavours to find and secure new opportunities, particularly:
The extracting of some value from live structures, particularly through the identification of
operations for restructuring opportunities proposed to customers, owing to the stability/increase of
interest rates at the start of 2011.

Annual Report – 2011
34
Performance of hedge operations, essentially interest rate risk.
The performance of a series of highly profitable derivatives operations, leaving credit exposure
unchanged.
Deposit-taking operations, with a higher level of expression in second half 2011.

Annual Report – 2011
35
6.9 Syndication and sales
Syndication and sales activities, in 2011, were performed in a context of an extreme drop in secondary
market activity and the virtual non-existence of primary market operations.
Notwithstanding, CaixaBI succeeded in operating as joint lead manager in the following issues:
Portugal Telecom 5 years (January 2011): placement of a Portugal Telecom bond issue, for
the amount of €600 million, at a coupon rate of 5.625% maturing on 8 February 2016.
Benchmark 5 year Treasury Bonds (February 2011): placement of a Portuguese Republic
Treasury Bond Issue for the amount of €3.5 billion, at a coupon rate of 6.40% maturing on 15
February 2016.
Caixa Geral de Depósitos Exchange Offer (September 2011): exchange offer proposing an
exchange of secondary market subordinated debt in the institutional segment for a senior debt
bond maturing on 28 September 2015 at a coupon rate of 8%. The objective of this operation
was the strategic management of CGD’s financing and own funds structure and was very
successful in achieving a highly positive impact on investors holding such assets.
CaixaBI, as a specialised treasury securities operator was involved in Portuguese public debt auctions
in 2011:
January: treasury bonds auction (3.60%) – October 2014 and treasury bonds auction (4.80%)
January 2020;
March: treasury bonds auction (5.5%) – September 2013;
April: treasury bonds auction (5%) – June 2012 – extraordinary auction.
Treasury bills have been the Portuguese Republic’s main source of market funding, insofar as it
ceased to enjoy access to the medium and long term markets since its bailout application. CaixaBI, in
collaboration with CGD and IGCP, in order to promote treasury bill auctions secured orders for the
successful execution of all of the auctions occurring during the year.
CaixaBI performed 341 commercial paper issues, totalling €12 billion, in 2011, having placed €4.8
billion in coordination with CGD, particularly in the 4th quarter, at the time of the normalisation of the
treasury bills placement rates and restrictions raised by the Bank of Portugal (BdP) on banks’ interest
rates on deposits, with commercial paper having a good credit risk as an alternative for investors.
6.10 Venture capital
CaixaBI’s venture capital area is geared to strengthening the competitive capacity of domestic
companies in wider markets, promoting the appearance and development of well structured business
projects with high appreciation potential and a return on invested capital.
Activity in 2011 was naturally highly constrained by the recessionary context and uncertain business
environment. In general and together with companies’ reluctance to assume aggressive growth
strategies, a drop in the level of economic performance and depreciation of assets was witnessed.
Annual Report – 2011
36
The strategy adopted was therefore to fuel the development of industry in Portugal, consolidating CGD
Group’s leading position in the sector and fundamentally providing companies with capital instruments
adjusted to their development stage.
CGD Group has allocated around €700 million to venture capital resources in its twofold capacity as
an investor in highly specialised funds under third party management or with a suitable aptitude and
fundamentally as a direct operator using its own vehicles managed by Caixa Capital.
During the course of the year a fresh boost was given to the network operating model, comprising a
vast range of partnerships with different types of entities for securing, examining, and assessing
business projects, which, in addition to giving Caixa Capital a central role in its “ecosystem”, made it
possible to support a vast range of communicational initiatives in conjunction with CGD.
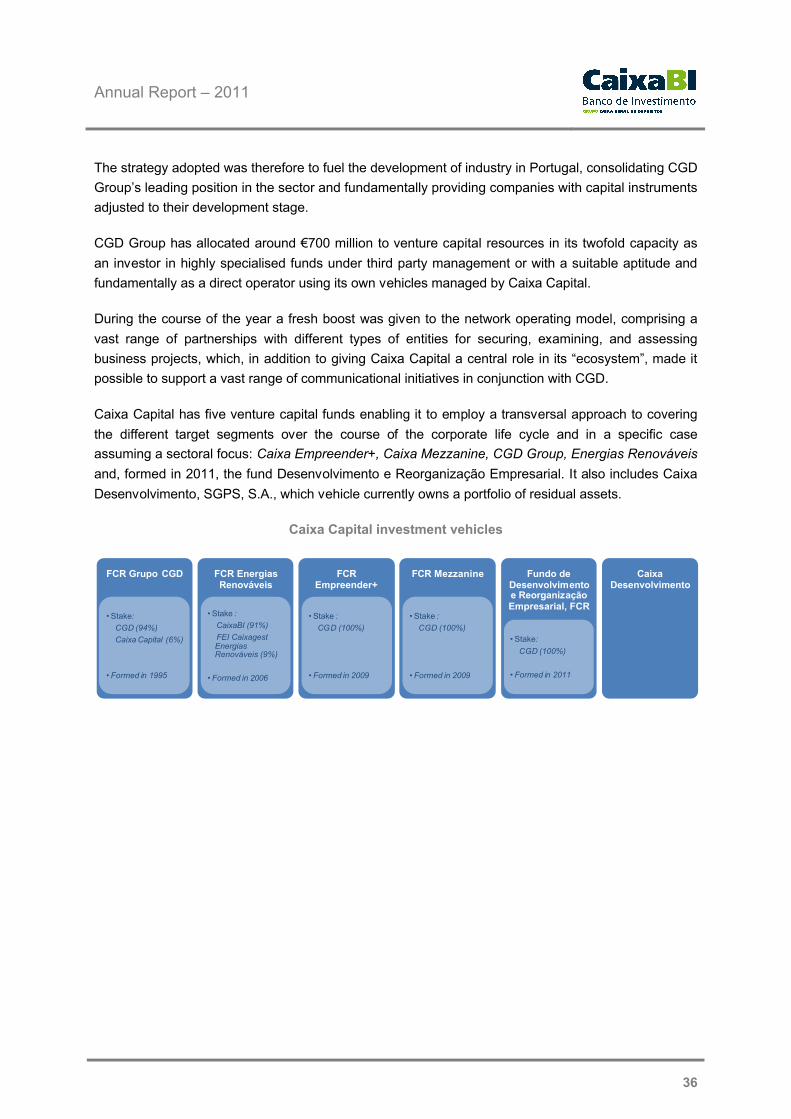
Caixa Capital has five venture capital funds enabling it to employ a transversal approach to covering
the different target segments over the course of the corporate life cycle and in a specific case
assuming a sectoral focus: Caixa Empreender+, Caixa Mezzanine, CGD Group, Energias Renováveis
and, formed in 2011, the fund Desenvolvimento e Reorganização Empresarial. It also includes Caixa
Desenvolvimento, SGPS, S.A., which vehicle currently owns a portfolio of residual assets.
Caixa Capital investment vehicles
FCR Energias Renováveis
• Stake :
CaixaBI (91%)
FEI CaixagestEnergias Renováveis (9%)
• Formed in 2006
FCR Grupo CGD
• Stake:
CGD (94%)
Caixa Capital (6%)
• Formed in 1995
FCR Empreender+
• Stake :
CGD (100%)
• Formed in 2009
FCR Mezzanine
• Stake :
CGD (100%)
• Formed in 2009
Fundo de Desenvolvimento e Reorganização Empresarial, FCR
• Stake:
CGD (100%)
• Formed in 2011
Caixa Desenvolvimento

Annual Report – 2011
37
Investments
The investment volume, in terms of total assets under direct Caixa Capital management, at the end of
2011 totalled €344 million in 75 companies. It should be noted that 40% of the portfolio comprised
investments made over the last three years.
210 investment opportunities were analysed during the course of the year, mainly in the form of seed
capital/start-ups. 32 operations totalling €60 million were approved and 21, involving investment of €17
million, completed. Industry (25%), services (23%) and information technology projects (22%)
predominated in sectoral terms.
Projects analysed in 2011
Status Type
By sector
210
21
11
130
48
Total
Implemented
Approved but not implemented
Filed
Under analysis
210
109
15
75
11
Total
Seed / Start-Up
Acquisition
Expansion
Reorganisation
Information Techonology
22%
PrivateEquity
1%
Industry25%
Services23%
Commerce10%
Agro industry4%
Tourism1%
Others3%
Energy11%

Annual Report – 2011
38
The referred to investments are split up into €3 million on 18 new investments and €14 million on
additional investment in 14 subsidiary companies, as follows:
CGD Group FCR
FCR Turismo Inovação (Tourism Innovation): 10% equity capital investment in the Turismo
Inovação – FCR, venture capital fund managed by Turismo Capital – SCR, S.A. with the
corporate objective of “contributing to the innovation, modernisation and internationalisation of
tourism SMEs and tourism projects enhancing the value of supply”. The fund has a capital of €20
million and its investors have paid up 30% of the subscribed capital, signifying a €600,000
investment for FCR CGD Group.
Mota-Engil and AICEP: partnership with Mota-Engil Indústria e Inovação, SGPS, S.A. and
AICEP Capital Global – Sociedade de Capital de Risco, S.A., with the corporate aim of promoting
joint participation in innovative, differentiated, industry based projects with high growth and value
creation potential, upon which work has still to start or is at its start-up stage, predominantly
outside domestic territory and preferably in external markets in which the companies belonging to
CGD and Mota-Engil groups and their respective subsidiaries operate.
ME3I: subscription for 19.4% of the equity capital of ME3I, SGPS, S.A., a company formed on
the basis of the above referred to agreement, as a corporate vehicle to which smaller
investments will be allocated. In 2011, this company approved a 49% equity investment in the
Solargus company’s internationalisation project for the Peruvian market, to set up a metalworking
area plant, starting 2012.
Capital increases: additional investment in portfolio companies totalled €11.32 million and
involved A. Silva & Silva – Imobiliário e Serviços, S.A., Logoplaste Latam, SGPS, S.A., Onyria
Internacional, S.A., Logoplaste Investimento, SGPS, S.A., Artlant PTA, S.A. and Eurofrozen –
Indústria e Comércio de Produtos Alimentares, S.A.
FCR Energias Renováveis (Renewable energies)
Pinewells: a €526 000 investment in Pinewells, S.A., following its October capital increase, in
which the Fund increased its investment from 20% to 22.69%.
FCR Empreender+ (entrepreneurialism)
Biosurfit: payment of the last investment tranche in Biosurfit, S.A., for the amount of €333,000,
comprising approximately 9.4% of the respective capital increase. The Biosurfit investment was
part of a global capital increase aimed at completing the SpinIT technology industrialisation
process and supporting the company’s growth and internationalisation strategy.
FCR Critical Ventures I: participation in the formation of the Critical Ventures I Venture Capital
Fund, involving the subscription for investment units comprising an investment of approximately
25%. The Critical Ventures I Venture Fund is geared to investment in seed and start-up projects
in the information technologies, communication and electronics areas.

Annual Report – 2011
39
BIPS: participation in the capital increase of Around Knowledge - Consultoria Informática, Lda.
(BIPS), to support the company’s commercial roll-out and internationalisation, in its capacity as
the global winning project in the 2010 edition of the ISCTE-IUL MIT Portugal Venture
Competition.
Waydip: participation in the capital increase of Waydip – Energia e Ambiente, Lda., on an
investment to support the company’s commercial roll-out and internationalisation, in its capacity
as project winner in the Sustainable Systems category of Energy and Transport areas of the
2010 edition of the ISCTE-IUL MIT Portugal Venture Competition.
WeAdapt: participation in the capital increase of WeAdapt – Inclusive Design and Engineering,
Lda., on an investment to support the company’s commercial roll-out and internationalisation, in
its capacity as the global winning project in the Products and Services category of the 2010
edition of the ISCTE-IUL MIT Portugal Venture Competition.
Acellera: participation in the capital increase of Acellera Therapeutics, Lda., on an investment
designed to support the completion of the validation and certification process for cellular
therapies applied in immunosuppressant therapy and liver transplants in its capacity as the global
winning project in the Life Sciences category of the 2010 edition of the ISCTE-IUL MIT Portugal
Venture Competition.
Stemmatters: participation in the capital increase of Stemmatters - Biotecnologia e Medicina
Regenerativa, S.A., designed to support the company’s commercial start-up in the cell banks and
biomedical services area and completion of development work on new cellular therapies in the
human cartilage regeneration area.
PLUX: participation in the capital increase of PLUX – Wireless Biosensors, S.A., to support the
company’s commercial roll-out and internationalisation of its BioPLUX Clinical product as a
physiotherapy recovery system using wireless biosensors and biofeedback techniques.
Digital Luxury: additional investment in Digital Luxury, S.A., as part of an additional fund
injection to support the company’s entry to the Brazilian market .
Smart Cartridge: payment of the last two investment tranches in Fotonesga, S.A. (Smart
Cartridge), to support the launch of a network of inkjet printers, refill/recycling kiosks in Portugal
and Spain.
isGReen: participation in the capital increase of isGreen II, Lda. (isGreen), in an investment to
support the company’s commercial roll-out and internationalisation, in its capacity as the project
winner in the Sustainable Systems category of Energy and Transport areas of the 2011 edition of
the ISCTE-IUL MIT Portugal Venture Competition.
AllDesk: participation in the capital increase of All Desk, Lda. (AllDesk), for the completion of the
development of the All_Desk.com platform and to support the company’s commercial roll-out in
its capacity as the project winner in the Web & IT category of the 2011 edition of the ISCTE-IUL
MIT Portugal Venture Competition.
Nonius: participation in the capital increase of Noniussoft, S.A. (Nonius), designed to support the
consolidation of its position in the domestic market and promote the internationalisation (Brazil) of
its Interactive TV, high speed internet access and VoIP services for the hotel sector.

Annual Report – 2011
40
FCR Universitas: participation in the formation of the Inovcapital Universitas Venture Capital
Fund, involving an investment of approximately 6%. The Universitas Venture Capital Fund is
geared to investment in early stage projects and mobilises around a dozen higher educational
institutions led by AUDAX (ISCTE).
FCR ISTart: participation in the formation of the ISTart Venture Capital Fund, involving an
investment of approximately 6%. The ISTart Venture Capital Fund is geared to investment in
seed projects centred on opportunities generated by Instituto Superior Técnico.
Disinvestments
Eight disinvestments with a realisation price of €15 million were made in 2011 in the following
companies:
Bem Comum, S.C.R., S.A.: transfer of the nominal investment in this venture capital company to
CGD.
Convento de Belmonte – Investimentos Turísticos S.A.: total disposal of the investment
based on the sales option contained in the shareholders’ agreement.
Critical Health, S.A.: disposal of share capital and transfer of loans (accessory capital payments
and partners’ loans), at their nominal value and pari-passu with the Critical Group, of a part of the
investment made by FCR Empreender+ in this company.
EDP Renováveis, S.A.: partial disinvestment comprising the stockmarket disposal of 1,005,000
shares.
FCR AICEP Capital Global FIEP: reduction of fund capital comprising the distribution of surplus
liquidity resulting from proceeds of €595,000 for FCR CGD Group, which now holds 1,734
investment units.
Grupo Pestana Pousadas – Investimentos Turísticos, S.A.: liquidation of another payment as
set out in the payments schedule for the share purchase/sale, transfer of accessory capital
payments and partners’ loans agreement.
Logoplaste LatAm, SGPS, S.A.: disposal of the full amount of the share capital and transfer of
partners’ loans held by FCR CGD Group to Logoplaste Group (Newpak, S.A.).
MWH – Gestão de Recursos Naturais, S.A.: disposal of full amount of the share capital and
transfer of partners’ loans held by the FCR Energias Renováveis to Fomentinvest, SGPS, S.A.

Annual Report – 2011
41
6.11 Outlook for 2012
The evolution of the Portuguese economy, in 2012, will be strongly conditioned by the fiscal
consolidation process and consequent austerity measures announced and implemented, namely as
regards the higher tax burden and reduction of public investment.
The Bank of Portugal, in its Winter Economic Bulletin revised its estimates on the performance of the
Portuguese economy for 2011 and 2012, incorporating the most recent indicators and measures
announced by the government to correct the imbalances in public finance indicators. These are now
characterised by a more significant contraction of economic activity in 2012 than in 2011, reflecting a
slowdown of the world economy, starting second half 2011. For 2011 the Bank of Portugal has,
accordingly, estimated GDP contraction of 1.6% in comparison to -1.9% in the Autumn Economic
Bulletin, indicating GDP contraction of 3.1% for 2012 in comparison to a contraction of 2.2% in the
Autumn Economic Bulletin.
This revision reflects the negative performance of all components associated with domestic demand,
penalised by the continuing fiscal consolidation process which is likely to tighten in 2012: private
consumption will be down 6.0%, public consumption down 2.9% with an estimated downturn of 12.8%
in investment. The negative performance of domestic demand will continue to be partly offset by an
improvement in net external demand, with estimates of export growth of 4.1% and a reduction of 6.3%
in imports.
Implicit in the Bank of Portugal’s forecasts is a trend towards an improvement of the current and
capital accounts as a percentage of GDP, reflecting a reduction of the Portuguese economy’s external
imbalances through the progressive reduction of the public sector deficit and private sector
deleveraging, including the financial sector which will help to reduce the economy’s borrowing
requirements.
In the document upon which the State Budget for 2012 is based, the government submitted its
estimates on the evolution of the Portuguese economy which point to a 2.8% contraction of GDP in
2012, reflecting a sharp drop in all domestic demand components, a 4.8% reduction of private
consumption, 6.2% in the case of public consumption and 9.5% for investment. This contraction is
only partially offset by the positive contribution of net external demand, with a growth of 4.8% in the
exports of goods and services and a 4.3% decline in the imports of goods and services.
The unemployment rate is likely to remain relatively high up to mid 2013, owing to the adjustment
process on the productive structures of many companies to the new circumstances, pressuring private
consumption and helping to reduce domestic economy leveraging levels.
The inflation rate is likely to be higher than in the rest of the eurozone, incorporating changes in the
VAT rate on several products, although a reduction of pressure from domestic demand may help to
dampen price growth.

Annual Report – 2011
42
Main indicators on the Portuguese economy
2008 2009 2010 2011e 2012e
GDP 0.0% -2.5% 1.4% -1.6% -3.1%
Private consumption 1.3% -1.1% 2.3% -4.0% -6.0%
Public consumption 0.4% 3.7% 1.3% -3.2% -2.9%
Investment -0.3% -11.3% -4.9% -11.2% -12.8%
Domestic demand 0.9% -2.6% 0.8% -5.3% -6.5%
Imports 2.3% -10.6% 5.1% -4.5% -6.3%
Exports -0.1% -11.6% 8.8% 7.3% 4.1%
CPI (Y-o-Y) 2.4% -1.0% 1.4% 3.6% 3.2%
Unemployment rate 7.7% 9.6% 10.8% 12.7% 13.4%
Budget deficit (% GDP) -3.6% -10.1% -9.8% -5.9% -4.5%
Public debt (% GDP) 71.6% 83.0% 93.3% 101.6% 111.0%
Source: EC, IMF, BdP, CaixaBI Equity Research
CaixaBI’s activity, in 2012, should continue to be governed by the internationalisation strategy which
has been furthered over the last few years, adapting to the highly demanding circumstances likely to
occur in the future.
One of the objectives over the course of 2012 will therefore be to deleverage balance sheets. This will
involve a reduction of the size of credit and securities portfolios without prejudicing the performance of
operations fuelling the Bank’s returns.
The outlook for acquisition finance is particularly one of a major slowdown, especially on account of
the difficulty in funding this type of operation. This will be offset by an expected increase in the number
of advisory mandates as part of the reorganisation of financial liabilities.
Notwithstanding, strong constraints are expected to continue, in 2012, on the development of the debt
capital and structured assets financing markets. CaixaBI will maintain its commitment to the
Portuguese market in which it will continue to operate as a benchmark institution in the bond and
commercial paper sectors. On a parallel level and as part of the Bank’s internationalisation strategy,
the priority in this segment of activity will also include the internationalisation of activity in these two
business areas, providing for customers’ needs in the various jurisdictions in which it already operates.
M&A activity in Portugal must necessarily be affected by the unfavourable macroeconomic
environment expected in 2012, which is likely to penalise economic agents’ investment decisions and
business projects, although this will be counterbalanced by the boost given by the Portuguese State’s
privatisations programme resulting from the commitments assumed under the financial assistance
programme.
In the case of Spain, in structural terms and following the fiscal consolidation programme submitted by
the government, the European Commission estimates economic contraction of 1.0%, which indicator,
in 2013, may be marginally positive, with good prospects for the gradual recovery of CaixaBI’s activity
in Spain.

Annual Report – 2011
43
According to IMF estimates, the Brazilian economy is likely to grow 3.0%, in 2012, sustained by the
growth of domestic demand (private consumption and private and public investment) and external
demand (commodity exports). Reference should also be made to the fact that Brazil will be organising
the World Cup in 2014 and Olympic Games, in 2016, while, at the same time, pursuing a public
investment policy designed to provide economic stimulus, namely in the oil and gas, electricity,
logistics and residential construction sectors. This macroeconomic environment is likely to translate
into growth of CaixaBI’s advisory services to this geography in 2012.
IMF estimates for Angola indicate economic growth of 10.8% in 2012. One of the major challenges
facing the Angolan economy is the development of non-oil sectors, namely sectors such as
construction and transport which are related with basic infrastructures. If successful, this market could
be increasingly important to CaixaBI.
IMF estimates for Mozambique indicate GDP growth of 7.5%, in 2012, sustained by investment in
transport and energy infrastructures which may also fuel an increase in advisory activities in this
market.
In short, the outlook for the evolution of CaixaBI’s activity, in 2012, is strongly dependent on: (i)
sustained market recoveries; (ii) the impact of the austerity and fiscal consolidation measures
announced by the Portuguese and Spanish governments on economic growth in the two Iberian
countries; (iii) fulfilment of the conditions defined by the Troika following the request for external
assistance made by Portugal and (iv) maintenance of the sustained growth of the Brazilian, Angolan
and Mozambican markets and business penetration by CaixaBI and local CGD Group banks in these
markets.

Annual Report – 2011
44
7 Results
Investment banking activity is naturally sensitive to the current economic environment and is directly
affected by the negative performance of the capital markets and investors’ risk aversion to the assets
of countries on the periphery of the eurozone, particularly Portugal and Spain.
Notwithstanding the less favourable environment, CaixaBI had a positive year in terms of activity,
coming in the leading positions in most league tables and having been involved in the largest
operations in its target markets.
CaixaBI’s internationalisation strategy for the Brazilian and Lusophone African markets, in addition to
strengthening its focus on advisory and brokerage activities which are less demanding in terms of
capital allocation and liquidity, enabled it to achieve a good level of commissions income, even in a
year with a significant slowdown in economic activity in the Iberian Peninsula.
Net commissions of €62 million, for the year were therefore generated by the following activities:
advisory services for project and structured finance operations,
advisory services for M&A operations and related services,
advisory services for primary equity market operations,
advisory services for primary debt market operations,
brokerage services for the secondary equity market,
intermediation in the secondary debt market, and
advisory services for venture capital.

Annual Report – 2011
45
Notwithstanding the good performance of its core activity, CaixaBI’s net operating income was down
by around 36% over 2010, to €59 million. This evolution largely derived from the impact of the
recognition of impairment on financial assets and non-recurring costs related with the contributions
made to the Investors’ Indemnity System (IIS). Disregarding such effects, CaixaBI’s recurring net
operating income at €90 million, was in line with 2010.
Net operating income
CaixaBI’s cost-to-income ratio was 28.1%, when adjusted for impairment of financial assets, but
remained clearly lower than that of its peers and less than the 30.5% achieved in 2010.
Notwithstanding CaixaBI’s already referred to high efficiency level, it succeeded in reducing its
structural costs by around 15%, in 2011, even in a scenario marked by its international expansion,
deriving from significant cost containment efforts.
Structural costs
The Bank’s net income of €8.6 million was highly impacted by increased impairment, both on a level of
financial assets and the credit portfolio, totalling €60 million.
29
62
(31)
(1)
59
(3)
90 92
(28)
Net interest income
Net commissions
Income from financial assets
Other operating income
Net operating income (2011)
Adjust. in financial
assets and IIS
Pro-forma net
operating Income (2011)
Net operating income (2010)
(€m
illio
n)
(2%)
1715
11
9
2010 2011
(€m
illio
n)
Amortisation
General administrative expenses
Employee costs(12%)
(20%)
(15%)29 25

Annual Report – 2011
46
In 2011, CaixaBI increased its impairment and provisions as part of a prudent balance sheet risk
hedging process in a particularly difficult scenario in terms of the Portuguese and Spanish economies,
in which markets CaixaBI’s credit and guarantees portfolio is concentrated.
Impairment, provisions and adjustments to financial assets
Reference should be made to deleveraging endeavours over the course of the year which translated
into a reduction of around 15% in the Bank’s credit and securities portfolios, with a €223 million
reduction of net assets.
Evolution of credit and securities portfolios
CaixaBI’s solvency ratio, measured on a separate basis, remains at a solid 11.2%.
28
26
42
60
12
Financial assets Credit portfolio Securities portfolio
Other provisions
Provisions and impairment
(2011)
Provisions and impairment
(2010)
(€m
illio
n)
5,1x
788 699
672
537
2010 2011
(€m
illio
n)
Securities portfolio
Credit portfolio
(11%)
(20%)
(15%)1,459 1,236

Annual Report – 2011
47
8 Human resources
CaixaBI’s human resources management aims to build a solid, motivated team capable of meeting all
of the Bank’s customers’ needs, market demands and challenges, ensuring the capacity to innovate
and pioneer to achieve its defined strategic objectives.
Talent retention and stability are resident concerns in terms of the Bank’s personnel policy, which
provides workers with opportunities to achieve professional advancement either by taking masters and
postgraduate courses in the financial area or language courses given at the Bank or based on their
participation in various seminars or one-off training events both in Portugal and abroad.
The Bank continued to develop curricular placement programmes, in 2011, providing trainees with
their first contact with working environments and, in several cases, a career opportunity in investment
banking.
CaixaBI also has a family-friendly corporate culture, having, over the course of time, implemented a
series of support measures for its workers and their families, to achieve better balance between
professional, family or personal lives, particularly:
Mortgage and personal loans, at special rates and maturities.
A healthcare insurance policy, including close family members.
Protocols with various entities providing workers and their families with special terms.
Access to CGD’s Cultural, Sports and Leisure Centre which includes socio-cultural and sporting
activities open to workers’ families, particularly the organisation of holiday camps for their
children.
The Bank, at the end of 2011, had 187 workers on a consolidated basis of whom 94 in business
areas, 43 in operational support areas, 30 in management support areas, 21 in venture capital
subsidiaries and 3 executive committee members.
Distribution by functional areas
3
3
29
45
107
2%
2%
16%
24%
57%
CaixaBI Executive Board
Caixa Capital Executive Board
Management Support
Operational Support
Product and Commercial Areas

Annual Report – 2011
48
The Bank continues to commit to its younger employees, with workers under the age of 39 already
accounting for 47% of its human capital. CaixaBI’s workers were distributed among the following age
brackets at 31 December.
Distribution by age bracket
The Bank has a highly qualified level of human capital with around 75% of its workers having higher
level academic qualifications at the end of 2011.
Distribution by academic qualifications
5
32
28
34
37
27
24
3%
17%
15%
18%
20%
14%
13%
+ 60
50-59
45-49
40-44
35-39
30-34
<29
6
40
141
3%
21%
75%
Primary
Secondary
Higher

Annual Report – 2011
49
9 Qualified equity investors
Gerbanca, SGPS, S.A.
81,016,231 shares
99.71% of voting rights
Annual Report – 2011
50
10 Acknowledgments
In light of the highly uncertain and demanding context in which CaixaBI operated, in 2011, overriding
guidelines in terms of the Bank’s management included the protection of its liquidity and solvency
indices, consolidation of its customer base and enhancement of its reputation in all operating markets.
To achieve this result in a particularly difficult year, special recognition should be afforded to the
competent and committed contribution of its workers, the constant support of its shareholders and the
trust and loyalty of its customers who, once again confirmed the Bank’s benchmark status on the
domestic banking scene.
The board is also grateful for the cooperation of the supervisory authorities – Bank of Portugal and
Securities Market Commission – members of its shareholders’ meeting, fiscal board and statutory
auditor.

Annual Report – 2011
51
11 Proposal for the appropriation of net income
The board of directors, considering the adequacy of the levels of shareholders’ equity needed to
enable CaixaBI to perform its activities, hereby submits the following proposal on the appropriation of
the total amount of €1,464,516.24 of net income for 2011 to the general meeting.
Legal reserve (10% of net income for year) €146,451.62
Other reserves €1,318,064.62
Lisbon, 20 February 2012
Jorge Humberto Correia Tomé
Jorge Telmo Maria Freire Cardoso
Gonçalo Vaz Gago da Câmara de Medeiros Botelho
Francisco José Pedreiro Rangel
Rui Manuel do Vale Jordão Gonçalves Soares
José Pedro Cabral dos Santos
José Manuel Carreiras Carrilho

Annual Report – 2011
52
Financial statements, notes and opinions

Annual Report – 2011
53
1 Consolidated and separate financial statements

Annual Report – 2011
54
Consolidated financial position
2011 2010 2011 2010
(amounts in euros) NotesAmount before impairment and
amortisation1
Impairment and amortisation
2
Net amount
3=1-2
Net amount Notes
ASSETS LIABILITIES
Cash and cash equivalents with central banks 5 2,924,679 2,924,679 8,894,162 Credit institutions’ and central banks’ resources 16 995,491,052 1,129,143,842
Cash assets with other credit institutions 6 1,443,656 1,443,656 5,440,368 Customer resources and other loans 17 114,069,415 104,996,362
Investments in credit institutions 7 33,483,543 120,600 33,362,943 7,477,072 Debt securities
Financial liabilities at fair value through profit or loss 10 733,589,348 416,869,550
Securities and derivatives portfolio: Negative revision of hedge derivatives 10 1,521,387 1,599,779
Financial assets at fair value through profit or loss 8 800,571,724 800,571,724 615,331,283 Non-current liabilities held for sale
Available for sale financial assets 9 450,406,157 450,406,157 483,512,357 Provisions for other risks 18 5,137,583 3,211,635
Positive revaluation of hedge derivatives 10 1,459,895 1,459,895 1,250,849 Current tax liabilities 14 2,150,156 257,589
Held to maturity investments Deferred tax liabilities 14 2,831,370 2,700,360
Loans and advances to customers 11 767,313,626 68,180,997 699,132,629 787,912,373 Other subordinated liabilities
Non-current assets held for sale Other liabilities 19 93,072,434 65,888,116
Investment properties Total liabilities 1,947,862,746 1,724,667,232
Other tangible assets 12 22,794,203 10,571,641 12,222,561 12,730,810 CAPITAL
Intangible assets 13 5,162,625 4,372,728 789,897 519,656 Capital 20 81,250,000 81,250,000
Investments in associated companies Share premium
Current tax assets 14 23,534,398 23,534,398 9,597,046 Other equity instruments
Deferred tax assets 14 60,383,503 60,383,503 29,036,888 Treasury shares
Other assets 15 83,979,017 8,532,316 75,446,700 38,484,823 Fair value reserves 21 (73,626,045) (18,328,780)
Other reserves and retained earnings 21 193,754,412 168,601,131
Income for period 21 8,552,996 40,153,282
Advance of dividends
Non-controlling interests 22 3,884,634 3,844,823
Total capital 213,815,997 275,520,455
Total assets 2,253,457,025 91,778,282 2,161,678,743 2,000,187,687 Total liabilities and shareholders’ equity 2,161,678,743 2,000,187,687
Certified Accountant Board of Directors
João Gonçalves Jorge Humberto Correia Tomé
Jorge Telmo Maria Freire Cardoso
Gonçalo Vaz Gago da Câmara de Medeiros Botelho
Francisco José Pedreiro Rangel
Rui Manuel do Vale Jordão Gonçalves Soares
José Pedro Cabral dos Santos
José Manuel Carreiras Carrilho

Annual Report – 2011
55
Consolidated income statements
(amounts in euros)Notes 2011 2010
Interest and similar income 23 336,268,601 273,408,934
Interest and similar costs 23 (307,216,678) (240,096,121)
Income from equity instruments 458,717 402,353
NET INTEREST INCOME INCLUDING INCOME FROM EQUITY INSTRUMENTS 29,510,640 33,715,167
Income from services and commissions 24 67,625,939 85,955,502
Costs of services and commissions 24 (5,832,923) (12,243,258)
Income from financial operations 25 (31,741,783) (17,090,524)
Other operating income 26 (518,972) 1,608,690
NET OPERATING INCOME 59,042,902 91,945,577
Employee costs 27 (15,252,830) (17,375,285)
Other administrative expenditure 28 (8,516,892) (10,624,140)
Depreciation and amortisation 12 and 13 (1,004,292) (1,018,112)
Provisions net of recoveries and cancellations 18 (1,964,235) 8,334,930
Credit impairment net of reversals and recoveries 29 (24,153,856) (7,282,901)
Impairment of other assets net of reversals and recoveries 29 (5,778,062) (10,708,264)
Income from associated companies
INCOME BEFORE TAX AND NON-CONTROLLING INTERESTS 2,372,734 53,271,806
Income tax:
Current 14 (2,444,590) (13,691,199)
Deferred 14 8,664,663 80,520
6,220,073 (13,610,679)
CONSOLIDATED INCOME PRIOR TO NON-CONTROLLING INTERESTS 8,592,807 39,661,127
Of which: Income after tax on discontinued operations
Non-controlling interests 22 (39,811) 492,155
NET INCOME FOR PERIOD 8,552,996 40,153,282
Shares in circulation 81,250,000 79,208,137
Earnings per share 0.11 0.51
Certified Accountant Board of Directors
João Gonçalves Jorge Humberto Correia Tomé
Jorge Telmo Maria Freire Cardoso
Gonçalo Vaz Gago da Câmara de Medeiros Botelho
Francisco José Pedreiro Rangel
Rui Manuel do Vale Jordão Gonçalves Soares
José Pedro Cabral dos Santos
José Manuel Carreiras Carrilho

Annual Report – 2011
56
Consolidated cash flow statements
(amounts in euros)2011 2010
Cash flows generated by operating activities
Interest and commissions received 401,471,935 359.862.374
Interest and commissions paid (318,932,982) (252.010.974)
Payments to employees and suppliers (24,393,368) (28.348.426)
Payment of income tax (14,489,374) (46.920.264)
Other income (1,111,089) 1.898.703
Operating income prior to changes in operating assets 42.545.122 34,481,414
(Increases) decreases in operating assets
Financial assets at fair value through profit or loss (220,444,281) 91.550.032
Available for sale financial assets (22,162,011) (276.975.854)
Investments in credit institutions (25,985,291) 16.871.019
Loans and advances to customers 65,441,714 82.539.055
Other assets (47,586,618) (5.951.072)
(250,736,488) (91.966.820)
Increases (decreases) in operating liabilities
Financial liabilities held for trading 316,641,406 116.493.833
Other credit institutions’ resources (141,059,787) 20.325.679
Customer resources 9,343,524 (34.631.700)
Other liabilities 28,604,755 (32.330.621)
213,529,898 69.857.191
Net cash from operating activities 5.338.532 12,371,784
Cash flows generated by investing activities
Acquisition of tangible and intangible assets (779,713) (482.930)
Disposal of tangible and intangible assets 15,409 70.650
Disposal of investments in subsidiaries, associated companies and joint enterprises - -
Dividends received 458,717 402.353
Net cash from investing activities (305.587) (9,927)
Cash flows generated by financing activities
Payment of dividends (15,000,000) (23.590.336)
Disposal of treasury shares - 23.290.000
Net cash of financing activities (15.000.000) (300,336)
Increase (decrease) net of cash and equivalents (9.967.055) 12,061,521
Cash and equivalents at start of period 14.334.530 2,273,009
Cash and equivalents at end of period 4.367.475 14,334,530
Certified Accountant Board of Directors
João Gonçalves Jorge Humberto Correia Tomé
Jorge Telmo Maria Freire Cardoso
Gonçalo Vaz Gago da Câmara de Medeiros Botelho
Francisco José Pedreiro Rangel
Rui Manuel do Vale Jordão Gonçalves Soares
José Pedro Cabral dos Santos
José Manuel Carreiras Carrilho

Relatório e Contas – 2011
57
Statement of changes to consolidated shareholders’ equity
(amounts in euros) Other reserves and retained earnings
Capital Treasury sharesFair value reserves
ReservesRetained earnings
Total Profit for periodNon-controlling
interestsTotal
Balances at 31 December 2009 81,250,000 (5,999,453) 171,472 84,691,798 48,515,598 133,207,396 45,606,639 4,336,978 258,573,031
Distribution of profit for 2009:
Distribution of dividends by the bank - - - - 1,434,664 1,434,664 (25,025,000) - (23,590,336)
Transfer to reserves and retained earnings - - - 22,216,454 (1,634,815) 20,581,639 (20,581,639) - -
Disposal of treasury shares (net of fiscal effect) - 5,999,453 - - 13,377,432 13,377,432 - - 19,376,885
Consolidated comprehensive income for 2010 - - (18,500,252) - - - 40,153,282 (492,155) 21,160,874
Balances at 31 December 2010 81,250,000 - (18,328,780) 106,908,252 61,692,879 168,601,131 40,153,282 3,844,823 275,520,455
Distribution of profit for 2010:
Distribution of dividends by the bank - - - - - - (15,000,000) - (15,000,000)
Transfer to reserves and retained earnings - - - 32,003,075 (6,849,794) 25,153,282 (25,153,282) - -
Consolidated comprehensive income for 2011 - - (55,297,265) - - - 8,552,996 39,811 (46,704,458)
Balances at 31 December 2011 81,250,000 - (73,626,045) 138,911,327 54,843,086 193,754,413 8,552,996 3,884,634 213,815,997
Certified Accountant Board of Directors
João Gonçalves Jorge Humberto Correia Tomé
Jorge Telmo Maria Freire Cardoso
Gonçalo Vaz Gago da Câmara de Medeiros Botelho
Francisco José Pedreiro Rangel
Rui Manuel do Vale Jordão Gonçalves Soares
José Pedro Cabral dos Santos
José Manuel Carreiras Carrilho

Annual Report – 2011
58
Statements of comprehensive consolidated income
((amounts in euros)
2011 2010
Attributable to bank’s
shareholders
Attributable to non-controlling
interestsTotal
Attributable to bank’s
shareholders
Attributable to non-controlling
interestsTotal
Consolidated income 8,552,996 39,811 8,592,807 40,153,282 (492,155) 39,661,127
Exchange rate differences
Revaluation reserves on available for sale financial assets:
Revaluation of available for sale financial assets (77,849,109) (54,689) (77,903,798) (33,010,507) (663,762) (33,674,269)
Fiscal impact 22,849,587 - 22,849,587 8,191,902 - 8,191,902
Transfer to income on disposal (3,846,444) (82,524) (3,928,969) (2,970,365) 106,001 (2,864,364)
Fiscal impact 873,490 - 873,490 719,488 - 719,488
Transfer to income through recognition of impairment in period 3,961,159 - 3,961,159 9,544,581 337,202 9,881,783
Fiscal impact (1,148,734) - (1,148,734) (754,792) - (754,792)
Unrecognised income in income statement (55,160,052) (137,213) (55,297,265) (18,279,693) (220,559) (18,500,252)
Consolidated comprehensive income (46,607,056) (97,402) (46,704,458) 21,873,589 (712,714) 21,160,874
Certified Accountant Board of Directors
João Gonçalves Jorge Humberto Correia Tomé
Jorge Telmo Maria Freire Cardoso
Gonçalo Vaz Gago da Câmara de Medeiros Botelho
Francisco José Pedreiro Rangel
Rui Manuel do Vale Jordão Gonçalves Soares
José Pedro Cabral dos Santos
José Manuel Carreiras Carrilho

Annual Report – 2011
59
Statement of separate financial position
2011 2010 2011 2010
(amounts in euros) Notes
Amount before provisions,
impairment and amortisation
1
Provisions, impairment and
amortisation
2
Net amount
3=1-2
Net amount Notes
ASSETS LIABILITIES
Cash and cash equivalents with central banks 4 2,923,679 2,923,679 8,893,162 Central banks’ resources 16 232,136,123 330,157,222
Cash assets with other credit institutions 5 1,103,350 1,103,350 5,420,784 Financial liabilities held for trading 7 733,589,348 416,869,550
Financial assets held for trading 6 789,285,121 789,285,121 600,020,313 Other credit institutions’ resources 17 763,354,930 798,986,619
Other financial assets at fair value through profit or loss 6 11,286,603 11,286,603 14,964,047 Customer resources and other loans 18 134,850,201 115,114,269
Available for sale financial assets 8 405,827,103 405,827,103 436,057,098 Debt securities
Investments in credit institutions 9 26,081,619 26,081,619 6,661,937 Financial liabilities associated with asset transfers
Loans and advances to customers 10 767,313,626 64,789,921 702,523,705 793,666,823 Hedge derivatives 7 1,521,387 1,599,779
Held to maturity investments Non-current liabilities held for sale
Assets with repurchase agreements Provisions 19 11,044,883 9,755,693
Hedge derivatives 7 1,459,895 1,459,895 1,250,849 Current tax liabilities 14 1,887,009 158,570
Non-current assets held for sale Deferred tax liabilities 14 1,990,720 2,166,083
Investment properties Equity capital instruments
Other tangible assets 11 22,659,435 10,482,927 12,176,508 12,673,195 Other subordinated liabilities
Intangible assets 12 4,874,780 4,316,779 558,001 388,823 Other liabilities 20 110,556,856 82,851,326Investments in subsidiary, associated companies and joint enterprises 13 62,623,869 62,623,869 62,598,445
Total liabilities 1,990,931,456 1,757,659,111
Current tax assets 14 22,984,243 22,984,243 8,987,537 CAPITAL
Deferred tax assets 14 58,383,503 58,383,503 27,146,888 Capital 21 81,250,000 81,250,000
Other assets 15 76,848,774 4,867,950 71,980,825 26,796,740 Share premiums
Other equity instruments
(Treasury shares)
Revaluation reserves 22 (78,290,723) (22,225,246)
Other reserves and retained earnings 22 173,842,775 143,239,646
Income for period 22 1,464,516 45,603,129
(Advance of dividends)
Total shareholders’ equity 178,266,568 247,867,529
Total assets 2,253,655,600 84,457,576 2,169,198,024 2,005,526,640 Total liabilities and shareholders’ equity 2,169,198,024 2,005,526,640
Certified Accountant Board of Directors
João Gonçalves Jorge Humberto Correia Tomé
Jorge Telmo Maria Freire Cardoso
Gonçalo Vaz Gago da Câmara de Medeiros Botelho
Francisco José Pedreiro Rangel
Rui Manuel do Vale Jordão Gonçalves Soares
José Pedro Cabral dos Santos
José Manuel Carreiras Carrilho

Annual Report – 2011
60
Separate income statements
(amounts in euros)Notes 2011 2010
Interest and similar income 23 336,018,051 273,127,353
Interest and similar costs 23 (307,561,621) (240,170,456)
Net interest income 28,456,430 32,956,897
Income from equity instruments 24 2,958,717 7,324,643
Income from services and commissions 25 58,499,506 80,187,402
Costs of services and commissions 25 (5,825,207) (12,233,718)
Income from assets and liabilities at fair value through profit or loss (net) 26 (34,994,794) (20,222,477)
Income from available for sale financial assets (net) 27 3,012,033 2,480,992
Income from foreign exchange revaluations (net) 28 285,392 259,434
Income from the disposal of other assets 29 (958,753) (397)
Other operating income 30 (1,081,066) 951,119
Net operating income 50,352,257 91,703,894
Employee costs 31 (13,626,803) (15,309,819)
General administrative expenditure 32 (7,875,099) (9,796,380)
Depreciation and amortisation 11 and 12 (932,296) (997,781)
Provisions net of recoveries and cancellations 19 (1,289,190) 15,961,025
Value adjustments on loans and advances to customers and amounts
receivable from other debtors (net of recoveries and cancellations) 19 (26,396,630) (14,757,923)
Impairment of other financial assets net of reversals and recoveries 19 (4,520,152) (6,913,262)
Impairment of other assets net of reversals and recoveries 19 (1,412,830) (882,528)
Income before tax (5,700,742) 59,007,227
Tax
Current 14 (1,695,777) (12,565,387)
Deferred 14 8,861,035 (838,711)
Income after tax 1,464,516 45,603,129
Of which: Income after tax on discontinued operations
Net income for period 1,464,516 45,603,129
Shares in circulation 81,250,000 79,208,137
Earnings per share 0.02 0.58
Certified Accountant Board of Directors
João Gonçalves Jorge Humberto Correia Tomé
Jorge Telmo Maria Freire Cardoso
Gonçalo Vaz Gago da Câmara de Medeiros Botelho
Francisco José Pedreiro Rangel
Rui Manuel do Vale Jordão Gonçalves Soares
José Pedro Cabral dos Santos
José Manuel Carreiras Carrilho

Annual Report – 2011
61
Separate cash flow statements
(amounts in euros)2011 2010
Cash flows generated by operating activities
Interest and commissions received 392,097,635 353.816.649
Interest and commissions paid (319,270,990) (251.994.120)
Payments to employees and suppliers (21,986,806) (25.387.840)
Payment of income tax (13,964,044) (42.536.056)
Other income (1,670,545) 1.241.577
Operating income prior to changes in operating assets 35.205.250 35,140,211
(Increases) decreases in operating assets
Financial assets at fair value through profit or loss (220,791,205) 71.105.568
Available for sale financial assets (26,723,356) (282.151.572)
Investments in credit institutions (19,408,981) 15.594.019
Loans and advances to customers 65,441,714 82.539.055
Other assets (56,102,229) (8.063.011)
(257,584,056) (120.975.941)
Increases (decreases) in operating liabilities
Financial liabilities held for trading 316,641,406 116.493.833
Other credit institutions’ resources (141,059,788) 20.325.679
Customer resources 19,967,570 (31.833.922)
Other liabilities 29,208,532 (26.796.305)
224,757,720 78.189.285
Net cash from operating activities 2.378.914 (7,646,445)
Cash flows generated by investing activities
Acquisitions of tangible and intangible assets (618,105) (347.728)
Disposals of tangible and intangible assets 15,254 44.313Acquisitions of Investments in subsidiaries, associated companies and jointly controlled entities (21,698) (22.721)Disposals of Investments in subsidiaries, associated companies and jointly controlled entities - 13.000.000
Dividends received 2,958,717 7.324.643
Net cash from investing activities 2.334.169 19,998,507
Cash flows generated by financing activities
Payment of dividends (15,000,000) (23.590.336)
Disposal of treasury shares - 23.290.000
Net cash from financing activities (15.000.000) (300,336)
Increase (decrease) net of cash and equivalents (10.286.918) 12,051,726
Cash and equivalents at start of period 14.313.946 2,262,220
Cash and equivalents at end of period 4.027.029 14,313,946
Certified Accountant Board of Directors
João Gonçalves Jorge Humberto Correia Tomé
Jorge Telmo Maria Freire Cardoso
Gonçalo Vaz Gago da Câmara de Medeiros Botelho
Francisco José Pedreiro Rangel
Rui Manuel do Vale Jordão Gonçalves Soares
José Pedro Cabral dos Santos
José Manuel Carreiras Carrilho
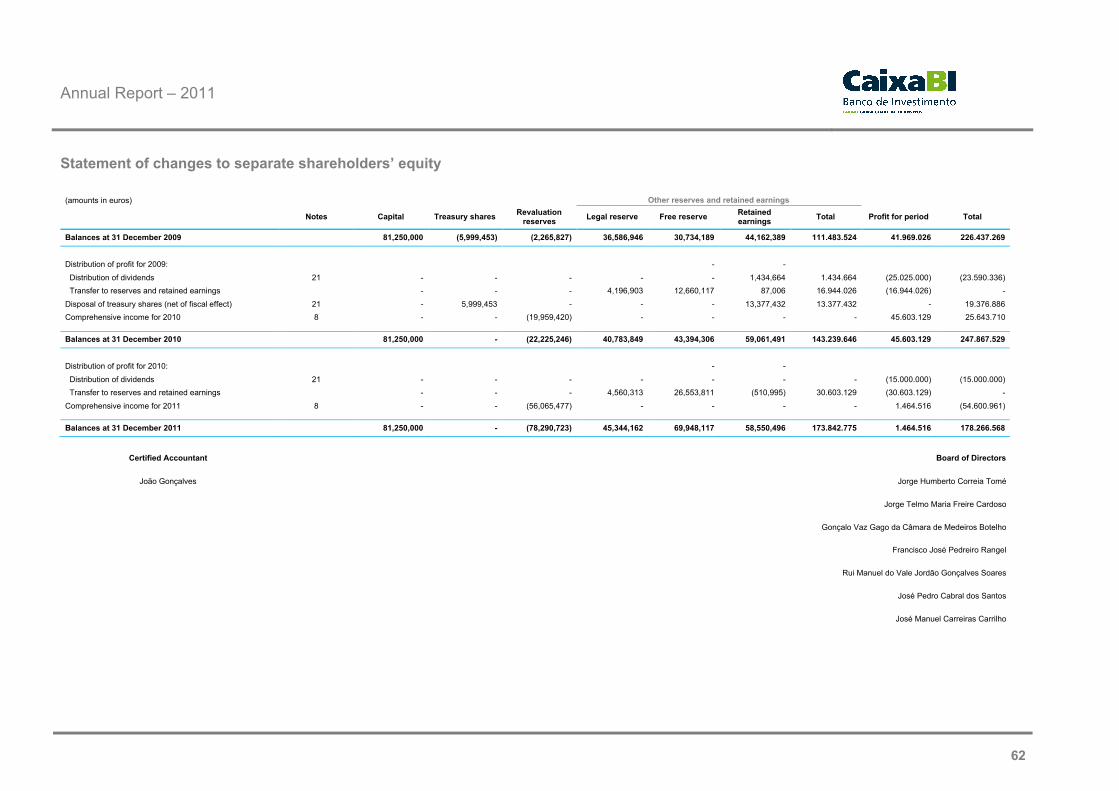
Annual Report – 2011
62
Statement of changes to separate shareholders’ equity
(amounts in euros) Other reserves and retained earnings
Notes Capital Treasury sharesRevaluation
reservesLegal reserve Free reserve
Retained earnings
Total Profit for period Total
Balances at 31 December 2009 81,250,000 (5,999,453) (2,265,827) 36,586,946 30,734,189 44,162,389 111.483.524 41.969.026 226.437.269
Distribution of profit for 2009: - -
Distribution of dividends 21 - - - - - 1,434,664 1.434.664 (25.025.000) (23.590.336)
Transfer to reserves and retained earnings - - - 4,196,903 12,660,117 87,006 16.944.026 (16.944.026) -
Disposal of treasury shares (net of fiscal effect) 21 - 5,999,453 - - - 13,377,432 13.377.432 - 19.376.886
Comprehensive income for 2010 8 - - (19,959,420) - - - - 45.603.129 25.643.710
Balances at 31 December 2010 81,250,000 - (22,225,246) 40,783,849 43,394,306 59,061,491 143.239.646 45.603.129 247.867.529
Distribution of profit for 2010: - -
Distribution of dividends 21 - - - - - - - (15.000.000) (15.000.000)
Transfer to reserves and retained earnings - - - 4,560,313 26,553,811 (510,995) 30.603.129 (30.603.129) -
Comprehensive income for 2011 8 - - (56,065,477) - - - - 1.464.516 (54.600.961)
Balances at 31 December 2011 81,250,000 - (78,290,723) 45,344,162 69,948,117 58,550,496 173.842.775 1.464.516 178.266.568
Certified Accountant Board of Directors
João Gonçalves Jorge Humberto Correia Tomé
Jorge Telmo Maria Freire Cardoso
Gonçalo Vaz Gago da Câmara de Medeiros Botelho
Francisco José Pedreiro Rangel
Rui Manuel do Vale Jordão Gonçalves Soares
José Pedro Cabral dos Santos
José Manuel Carreiras Carrilho
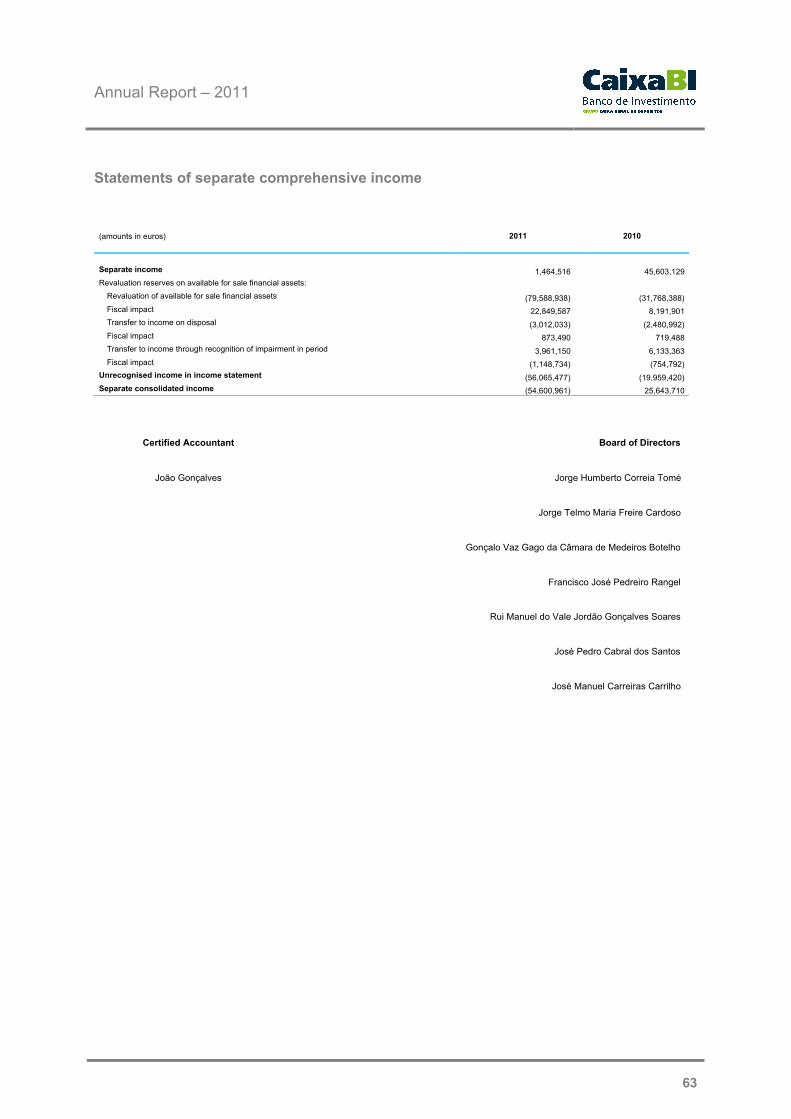
Annual Report – 2011
63
Statements of separate comprehensive income
(amounts in euros) 2011 2010
Separate income 1,464,516 45,603,129
Revaluation reserves on available for sale financial assets:
Revaluation of available for sale financial assets (79,588,938) (31,768,388)
Fiscal impact 22,849,587 8,191,901
Transfer to income on disposal (3,012,033) (2,480,992)
Fiscal impact 873,490 719,488
Transfer to income through recognition of impairment in period 3,961,150 6,133,363
Fiscal impact (1,148,734) (754,792)
Unrecognised income in income statement (56,065,477) (19,959,420)
Separate consolidated income (54,600,961) 25,643,710
Certified Accountant Board of Directors
João Gonçalves Jorge Humberto Correia Tomé
Jorge Telmo Maria Freire Cardoso
Gonçalo Vaz Gago da Câmara de Medeiros Botelho
Francisco José Pedreiro Rangel
Rui Manuel do Vale Jordão Gonçalves Soares
José Pedro Cabral dos Santos
José Manuel Carreiras Carrilho

Annual Report – 2011
64
2 Notes to the consolidated financial statements
1. INTRODUCTORY NOTE
Caixa - Banco de Investimento, S.A. (“Bank”) was formed by a public deed of 12 November 1987, having
absorbed all assets and liabilities of the Portuguese branch of Manufacturers Hanover Trust Company, in
conformity with the terms of Ministerial Order no. 865-A/87 of 6 November, jointly issued by the Presidency of the
Council of Ministers and Ministry of Finance.
The Bank is Caixa Geral de Depósitos Group’s specialised investment banking business arm, which includes
activities such as fixed and variable corporate debt finance, equity finance, financial advisory, structured finance,
project finance, brokerage, research and venture capital operations. Its operations are performed by a branch
office in Lisbon and another in Porto, an offshore branch in Madeira and a branch in Spain.
The Bank also has direct and indirect investments in the share capital of several companies in which it has
majority shareholdings. These companies comprise Group Caixa – Banco de Investimento (Group).
As referred to in Note 20, the majority of the Bank’s share capital is owned by Caixa Geral de Depósitos Group
company Gerbanca, SGPS, S.A.
The consolidated financial statements, at 31 December 2011, were approved by the board of directors on 20
February 2012.
The Bank’s and its subsidiaries’ companies’ financial statements at 31 December 2011 still require the approval of
their respective shareholders’ meetings. The board of directors considers, however, that the said financial
statements will be approved without significant changes.
2. ACCOUNTING POLICIES
2.1. Presentation bases
The consolidated financial statements at 31 December 2011 were prepared on the basis of the
International Financial Reporting Standards (IFRS) as adopted in the European Union, in line with
European Parliament and Council Regulation (EC) 1606/2002 of 19 July and the dispositions of
Decree Law 35/2005 of 17 February.
2.2. Consolidation principles
The consolidated financial statements include the accounts of the Bank and the entities directly and
indirectly controlled by the group (Note 4).
In terms of associated companies, “subsidiaries” are companies over whose current management the
Bank has effective control with the aim of obtaining economic benefit from their operations. Control
usually takes the form of more than 50% of the share capital or voting rights. In addition, as a result
of the application of the IAS 27 Standard – “Consolidated and Separate Financial Statements”, the
group has included venture capital funds managed by the group which is exposed to most of the risks
and enjoys most of the benefits associated with the respective activity.

Annual Report – 2011
65
Subsidiaries’ accounts were consolidated by the global integration method. Transactions and
significant balances between the consolidated companies have been eliminated. Consolidation
adjustments are also made, when applicable, to ensure the consistency of the application of the
Group’s accounting principles.
Third party equity investments in subsidiary companies have been recognised in "non-controlling
shareholders’ interests" in shareholders’ equity.
Consolidated income derives from the net income of the Bank and its subsidiaries, in proportion to
their respective effective equity investments, after consolidation adjustments, including the
elimination of dividends received and capital gains and losses generated between companies
included in the consolidation perimeter.
2.3. Combinations of business activities and goodwill
Acquisitions of subsidiaries are recognised according to the purchase method. The cost of the
acquisitions comprises the aggregate fair value of the assets delivered and liabilities incurred or
assumed for achieving control over the acquired entity plus the costs directly attributable to the
operation. On the acquisition date, identifiable assets, liabilities and contingent liabilities satisfying the
recognition requirements of the IFRS 3 Standard - “Combinations of business activities” are
recognised at their respective fair value.
Goodwill comprises the positive difference between a subsidiary’s cost price and the effective
percentage acquired by the group in terms of the fair value of its respective assets, liabilities and
contingent liabilities. Goodwill is recognised as an asset and is not amortised. Impairment tests are,
however, performed at least once a year.
Up to 01 January 2004, as permitted by the accounting policies defined by the Bank of Portugal,
goodwill was fully deducted from shareholders’ equity in the year of the acquisition of the
subsidiaries. As permitted by the IFRS 1 Standard, the group did not make any changes to this entry,
for which the goodwill generated on operations occurring up to 01 January 2004 continues to be
recognised in reserves.
2.4. Investments in associated companies
“Associated” companies are those over which the Bank has a significant influence but over whose
management it does not enjoy effective control. Significant influence is considered to exist whenever
the group has a direct or indirect investment of 20% - 50% in a company’s share capital or voting
rights.
Investments in associated companies are valued by the equity accounting method. According to this
method, investments are initially valued at their respective cost price and the value is subsequently
adjusted on the basis of the group’s effective percentage of changes in associated companies’
shareholders’ equity (including income).
If there are any materially relevant divergences, the shareholders’ equity used for the equity
equivalence calculation of associated companies is adjusted to reflect the use of the group’s
accounting principles.
Goodwill, comprising the positive difference between an associated company’s cost price and the
effective percentage acquired by the group in terms of the fair value of its respective assets, liabilities

Annual Report – 2011
66
and contingent liabilities continues to be recognised in the value of the investment whose total book
value is subject to annual impairment tests.
Unrealised income on transactions with associated companies is eliminated in proportion to the
group’s effective percentage investment in the said entities.
2.5. Translation of balances and transactions in foreign currency
The separate accounts of each group entity included in the consolidation are prepared in accordance
with the currency used in the economic context in which they operate (referred to as the “operating
currency”). All group companies, at 31 December 2011 and 2010, used the euro as their operating
currency, except for CaixaBI Brasil – Serviços de Assessoria Financeira, LTDA, which used the
Brazilian real.
Foreign currency transactions are recognised on the basis of the reference rates in force at the
transaction date. At each balance sheet date, monetary assets and liabilities denominated in foreign
currency are translated into euros on the basis of the foreign exchange rate in force. Non-monetary
assets, recognised at fair value, are translated on the basis of the exchange rate in force on the last
valuation date. Non-monetary assets, recognised at their historical cost, continue to be recognised at
the original exchange rate.
Exchange rate differences assessed upon exchange translation are recognised in income for the
year, except for differences originated by non-monetary financial instruments, such as shares,
classified as available for sale and recognised in a specific shareholders’ equity account heading until
disposal.
2.6. Financial instruments
a) Financial assets
Financial assets are recognised at the agreement data at their respective fair value, plus the
costs directly attributable to the transaction. Financial assets are classified at their time of initial
recognition in one of the following categories defined in IAS 39:
i) Financial assets at fair value through profit or loss
This category includes:
Financial assets held for trading, which essentially include the acquisition of securities
with the objective of realising gains on the basis of short term market price fluctuations.
This category also includes derivative financial instruments, excluding derivative financial
instruments complying with hedge accounting requirements; and,
Financial assets recognised at fair value through profit or loss.
The use of the “fair value option” implies the irrevocable recognition, in this category, of the
financial instruments at the time of initial recognition and is restricted to situations in which
the application results in the production of more relevant financial information, i.e.:
a) If their application eliminates or significantly reduces an accounting mismatch that would
otherwise occur as a result of the inconsistent measurement of assets and liabilities or
recognition of gains and losses;

Annual Report – 2011
67
b) Groups of financial assets, financial liabilities or both which are managed and when the
performance thereof is assessed on a fair value basis, in accordance with formally
documented risk and investment management strategies; and when information on the
group is distributed internally to management bodies;
c) It is also possible to classify financial instruments containing one or more embedded
derivatives in this category, unless:
The embedded derivatives do not significantly modify the cash flows which would,
otherwise, be required under the contract;
It is evident, with little or no analysis, that the implicit derivatives should not be
separated out.
The group recognises the equity instruments relating to venture capital operations in this
category whenever the instruments have associated derivatives, notably the right or
contractual obligation to dispose of the subsidiary companies under the terms of
shareholders’ agreements entered into on the date upon which the equity investments were
made and the securities classifiable in sub-paragraph b) above.
Financial assets classified in this category are recognised at fair value whose gains and
losses generated by their subsequent valuation are recognised in the income statement in
the “income from financial operations” account heading. Interest is recognised in the
appropriate “interest and similar income” account headings.
ii) Loans and accounts receivable
These are financial assets with fixed or determinable payments, not listed on an active
market and not included in any of the other previously referred to financial asset categories.
This category includes loans and advances to the group’s customers, amounts receivable
from other financial institutions and from the provision of services or disposal of assets.
These assets are initially recognised at fair value, less any commissions included in the
effective rate, plus all incremental costs directly attributable to the transaction. The assets
are subsequently recognised in the balance sheet at their amortised cost less impairment
losses.
Interest is recognised on the basis of the effective rate method which enables the amortised
cost to be calculated and the interest split over the period of the operations. The effective
rate is the rate that, being used to discount the estimated future cash flows associated with
the financial instrument, enables its present value to be matched with the value of the
financial instrument at the date of initial recognition.
iii) Available for sale financial assets
This category includes variable-income securities not classified as assets at fair value
through profit or loss, including stable financial investments and investments without
associated options in the group’s venture capital area and other financial instruments initially
recognised herein and not classifiable in the other categories of the above referred to IAS 39
Standard.
Available for sale financial assets are measured at fair value, with the exception of
shareholders’ equity instruments not listed on an active market and whose fair value cannot

Annual Report – 2011
68
be reliably measured, which continue to be recognised at cost. Revaluation gains or losses
are recognised directly in shareholders’ equity in the “fair value reserve”. At the time of sale
or if impairment is assessed, the accumulated fair value changes are transferred to income
or costs for the year.
Interest on debt instruments classified in this category is assessed on the basis of the
effective tax method and recognised in the income statement.
Dividends on equity capital instruments classified in this category are recognised as income
in the income statement when the group’s right to receive them has been established.
Reclassification of financial assets
With the entry into force of the change to the IAS 39 Standard on 13 October 2008, the Bank
was in a position to reclassify several of its financial assets classified as financial assets held for
trading or available for sale to other financial assets categories. No reclassifications to financial
assets categories at fair value through profit or loss, are, however, permitted.
Fair value
As referred to above, financial assets classified in financial assets categories recognised at fair
value through profit or loss and available for sale financial assets are recognised at their fair
value.
The fair value of a financial instrument comprises the amount at which an asset or financial
liability can be sold or liquidated between independent, informed parties, interested in realising
the transaction under normal market conditions.
The fair value of financial assets is, for most assets, assessed by a CGD Group body which is
independent from the trading function, based on the following criteria:
Closing price at the balance sheet date, for instruments traded on active markets;
The following valuation methods and techniques are, inter alia, used for debt instruments not
traded on active markets (including unlisted securities or securities with low liquidity levels):
i) Bid prices published by financial information services such as Bloomberg and Reuters,
including market prices available on recent transactions;
ii) Reference bid prices obtained from financial institutions operating as market-makers;
iii) Internal valuation models based on market data used to define a price for the financial
instrument, reflecting market interest rates and volatility, in addition to liquidity and the
credit risk associated with the instrument.
Unlisted shareholders’ equity instruments held as part of venture capital operations are
valued on the basis of the following criteria:
i) Prices charged by independent entities on materially relevant transactions during the
last six months;
ii) Multiples of comparable companies in terms of operating sector, dimension and
profitability;
iii) Discounted cash flows;

Annual Report – 2011
69
iv) Settlement price comprising the subsidiary company’s net worth;
v) Cost price (only for investments made in the twelve months preceding the valuation).
If there is a right or contractual obligation to alienate the subsidiaries under the terms of
shareholders’ agreements entered into when the investments are made, the respective
accounting valuation may not exceed the current amount of the sales price.
A discount factor reflecting the securities’ lack of liquidity and/or counterparty credit risk in
the agreements entered into is, if justified, applied to the amounts obtained from the above
referred to valuation methodologies.
Other unlisted shareholders’ equity instruments whose fair value cannot be reliably
measured (e.g. owing to the lack of recent transactions) continue to be recognised at cost,
less any impairment losses.
b) Financial liabilities
Financial liabilities are recognised at the agreement date at their respective fair value, less the
costs directly attributable to the transaction. Liabilities are classified in the following categories:
i) Financial liabilities held for trading
Financial liabilities held for trading comprise the negative revaluation of derivative financial
instruments recognised at their fair value.
ii) Other financial liabilities
This category includes other credit institutions’ and customers’ resources and liabilities
incurred on payments of services or purchases of assets.
These financial liabilities are valued at their amortised cost.
c) Derivatives and hedge accounting
The Bank performs derivative operations as part of its activity to provide for its customers’
requirements and reduce its exposure to foreign exchange, interest rate and price fluctuations.
Derivative financial instruments are recognised at their fair value at the date of the agreement.
They are also recognised in off-balance sheet accounts at their respective notional value.
Derivative financial instruments are subsequently measured at their respective fair value. Fair
value is assessed:
On the basis of prices obtained in active markets (e.g. futures trading in organised markets);
On the basis of models incorporating valuation techniques accepted in the market, including
discounted cash flows and options valuation models.

Annual Report – 2011
70
Embedded derivatives
Derivative financial instruments embedded in other financial instruments are separated from the
base agreement and processed as autonomous derivatives under the IAS 39 Standard,
whenever:
The embedded derivative’s economic characteristics and risks are not closely related with
the base agreement defined in the IAS 39 Standard; and
The full amount of the combined financial instrument is not recognised at fair value, with fair
value changes being reflected in the income statement.
Hedge derivatives
These derivatives are designed to protect the group from exposure to a specific risk attached to
its operations. Reclassification as hedge derivatives and use of the hedge accounting concept,
as described below, are subject to compliance with the rules of the IAS 39 Standard.
The group, at 31 December 2011 and 2010, only used hedges on the changes in the fair value
of financial instruments recognised in the balance sheet as “fair value hedges”.
The group prepares formal documentation, for all hedge operations, at the beginning of the
operation, to include the following aspects:
Risk and strategy management objectives associated with the realisation of the hedge
operation, in accordance with the hedge policies defined by the group;
Description of hedged risk(s);
Identification and description of hedged and hedge financial instruments;
Hedge operation effectiveness appraisal method and respective periodicity.
Hedge effectiveness tests are periodically performed and documented, using a comparison
between the change in fair value of the hedge instrument and hedged item (part attributable to
hedged risk). With the aim of enabling the use of hedge accounting under IAS 39, the ratio
should be between a range of 80% and 125%. Prospective effectiveness tests are also
performed in order to demonstrate the hedges’ expected future effectiveness.
Hedge derivatives are recognised at fair value, with the results being assessed daily and
recognised in income and costs for the year. If the hedge is seen to be effective, the Bank will
also recognise the change in fair value of the hedged item, attributable to the hedged risk, in
income for the year. The impact of such valuations is recognised in “income from financial
operations” account headings. For derivatives, such as interest rate swaps, with an associated
interest component, the periodisation of interest for the period in progress and liquidated flows
are recognised in “interest and similar income” and “interest and similar costs" in the income
statement.
Positive and negative revaluations of hedge derivatives are recognised in specific assets and
liabilities account headings.
Valuations of hedged items are recognised in the account headings in which such assets and
liabilities are recognised.

Annual Report – 2011
71
Trading derivatives
Trading derivatives are all derivative financial instruments that are not associated with effective
hedge operations in accordance with the IAS 39 Standard, including:
Derivatives taken out to hedge assets or liabilities risks recognised at fair value through
profit or loss, thus rendering hedge accounting unnecessary;
Derivatives taken out to hedge risk which does not comprise effective cover under the IAS
39 Standard;
Derivatives taken out for trading purposes.
Trading derivatives are recognised at fair value, with the results being assessed daily and
recognised in income and costs for the year. The impact of such valuations is recognised in
“income from financial operations” account headings. For derivatives, such as interest rate
swaps, with an associated interest component, the periodisation of interest for the period in
progress and liquidated flows are recognised in “interest and similar income” and “interest and
similar costs" in the income statement.
d) Impairment of financial assets
Financial assets at amortised cost
The group periodically analyses impairment on its financial assets recognised at amortised cost,
notably loans and advances to customers, Investments in credit institutions and other assets.
Signs of impairment are identified on an individual basis on financial assets with a significant
level of exposure and on a collective basis as regards like-for-like assets, whose debtor
balances are not separately relevant.
The following events may comprise signs of impairment:
Failure to comply with contractual clauses, i.e. arrears of interest or capital;
Debtor or debt issuing entities’ significant financial difficulties;
Existence of a strong probability of a declaration of bankruptcy by the debtor or debt issuing
entity;
Granting of facilities to a debtor in financial difficulties which would not be granted under
normal circumstances;
Historical records of collections suggesting that the nominal value will never be fully
recovered;
Data indicating a measurable reduction of the estimated value of the future cash flows of a
group of financial assets since original recognition, although such a reduction cannot be
identified in the group’s separate financial assets.
Whenever signs of impairment on separately analysed assets are identified, the eventual
impairment loss comprises the difference between the book value at the time of analysis and
current value of projected future cash flows expected to be received (recoverable value),
discounted on the basis of the asset’s original effective interest rate.
Assets upon which specific analyses have not been performed have been included in a
collective impairment analysis and classified for this purpose into homogenous groups with

Annual Report – 2011
72
similar risk characteristics. Separately analysed assets on which no objective signs of
impairment have been noted were also subject to collective impairment analyses, as referred to
in the preceding paragraph.
Owing to the non-existence of a relevant track record in terms of the Bank, impairment losses
calculated on the collective analysis were assessed on the basis of Caixa Geral de Depósitos
Group parameters for comparable types of credit.
The amount of impairment assessed is recognised in costs for the year and separately in the
balance sheet as a deduction from the amount of the respective credit.
The group, whenever applicable, writes off unrecoverable credit from assets through its use of
the respective accumulated impairment with the board of directors’ approval. Eventual
recoveries of credit written off from assets are recognised as a deduction from the impairment
losses balance recognised in the income statement.
Available for sale financial assets
As referred to in Note 2.6, a) available for sale financial assets are recognised at their fair value,
with changes in their fair value being reflected in “fair value reserves” in shareholders’ equity.
Whenever any objective evidence of impairment exists, accumulated capital losses recognised
in reserves, are transferred to costs for the year in the form of impairment losses and
recognised in the “impairment of other assets, net of reversals and recoveries” heading.
In addition to the signs of impairment on financial assets recognised at amortised cost, IAS 39
also provides for the following specific signs of impairment on equity instruments:
Information on significant changes having an adverse impact on the technological, market,
economic or legal environment in which the issuing entity operates, indicating that the cost
of the investment may not be recovered;
A prolonged or significant decline in market value at below cost.
The Bank, on each of its financial statement’s reference dates performs an analysis of the
existence of any impairment losses on available for sale financial assets, considering, for the
said purpose, the nature and specific, individual characteristics of the assets being valued. In
addition to the results of the analysis, the following events were considered to comprise
objective evidence of impairment on equity instruments:
Existence of potential capital losses of more than 50% of the respective cost price;
Situations in which the fair value of the equity instrument remains below its respective cost
price for a period of more than 24 months.
The existence of potential capital losses of more than 30% of the cost price, for more than 9
months, was also considered to comprise objective signs of impairment.
Impairment losses on equity instruments cannot be reversed and any potential capital gains
originated after the recognition of impairment losses are, therefore, recognised in the “fair value
reserve”. Impairment is always considered to exist if additional capital losses are assessed at a
later stage and are recognised in income for the year.
Criteria identical to debt instruments are applied for the analysis of “Tier 1” securities.

Annual Report – 2011
73
The group also periodically performs impairment analyses on financial assets recognised at
cost, notably unlisted equity instruments whose fair value cannot be accurately measured. The
recoverable value, in this case, comprises the best estimate of future flows receivable from the
asset, discounted at a rate which adequately reflects the risk associated with holding the asset.
The amount of the impairment loss is directly recognised in income for the period. Impairment
losses on such assets cannot be reversed.
2.7. Non-current assets held for sale and groups of assets and liabilities for disposal
In accordance with the IFRS 5 Standard – “non-current assets held for sale and discontinued
operations”, non-current assets, or groups of assets and liabilities for disposal are classified as being
held for sale whenever their book value is expected to be recovered from their sale and not their
continued use. For an asset (or group of assets and liabilities) to be classified in this account heading
the following requirements must be met:
There should be a strong probability of the sale’s occurrence;
The asset should be immediately available for sale in its current condition;
The sale is expected to take place up to a year from the asset's classification in the account
heading.
Assets recognised in this account heading are valued at their cost price or fair value whichever the
lower, less the costs incurred on the sale.
2.8. Other tangible assets
Except for assets acquired up to 1998, these are recognised at cost, less depreciation and
accumulated impairment losses. The costs of repair, maintenance and other expenses associated
with their use are recognised as a cost for the year, in the “other administrative expenses” account
heading.
The Bank revalued its fixed assets in 1998, under Decree Law 31/98 of 11 February. As permitted
under the IFRS 1 Standard, the book value, incorporating the effect of the referred to revaluation was
considered as a cost in the transition to the IFRS, as the proceeds, at the time in question, generally
comprised cost, or amortised cost, in accordance with the IFRS, adjusted to take changes to price
indices into account.
Depreciation is calculated and recognised as a cost for the year, on a systematic basis, during the
asset’s estimated useful life, comprising the period in which it is expected to be available for use, i.e.
Years of useful life
Property 10 - 50
Equipment:
Furniture and materials 4 - 10
Transport material 4
IT equipment 3 - 4
Interior installations 3 - 10
Security equipment 4 - 10
Plant and machinery 5 - 10
Land is not depreciated.
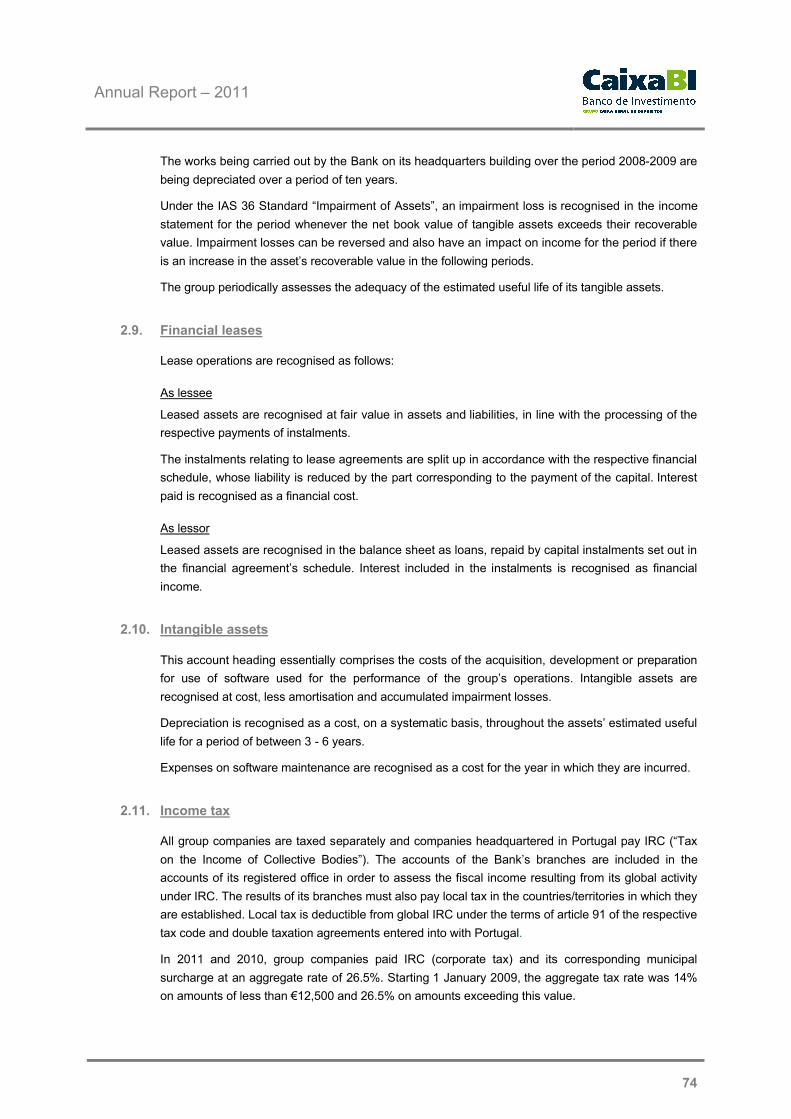
Annual Report – 2011
74
The works being carried out by the Bank on its headquarters building over the period 2008-2009 are
being depreciated over a period of ten years.
Under the IAS 36 Standard “Impairment of Assets”, an impairment loss is recognised in the income
statement for the period whenever the net book value of tangible assets exceeds their recoverable
value. Impairment losses can be reversed and also have an impact on income for the period if there
is an increase in the asset’s recoverable value in the following periods.
The group periodically assesses the adequacy of the estimated useful life of its tangible assets.
2.9. Financial leases
Lease operations are recognised as follows:
As lessee
Leased assets are recognised at fair value in assets and liabilities, in line with the processing of the
respective payments of instalments.
The instalments relating to lease agreements are split up in accordance with the respective financial
schedule, whose liability is reduced by the part corresponding to the payment of the capital. Interest
paid is recognised as a financial cost.
As lessor
Leased assets are recognised in the balance sheet as loans, repaid by capital instalments set out in
the financial agreement’s schedule. Interest included in the instalments is recognised as financial
income.
2.10. Intangible assets
This account heading essentially comprises the costs of the acquisition, development or preparation
for use of software used for the performance of the group’s operations. Intangible assets are
recognised at cost, less amortisation and accumulated impairment losses.
Depreciation is recognised as a cost, on a systematic basis, throughout the assets’ estimated useful
life for a period of between 3 - 6 years.
Expenses on software maintenance are recognised as a cost for the year in which they are incurred.
2.11. Income tax
All group companies are taxed separately and companies headquartered in Portugal pay IRC (“Tax
on the Income of Collective Bodies”). The accounts of the Bank’s branches are included in the
accounts of its registered office in order to assess the fiscal income resulting from its global activity
under IRC. The results of its branches must also pay local tax in the countries/territories in which they
are established. Local tax is deductible from global IRC under the terms of article 91 of the respective
tax code and double taxation agreements entered into with Portugal.
In 2011 and 2010, group companies paid IRC (corporate tax) and its corresponding municipal
surcharge at an aggregate rate of 26.5%. Starting 1 January 2009, the aggregate tax rate was 14%
on amounts of less than €12,500 and 26.5% on amounts exceeding this value.

Annual Report – 2011
75
With the publication of Law 12 – A/2010 of 30 June, a state tax was introduced, payable by all
taxpayers who, in 2010 and in future years have taxable income of more than €2,000,000 which is
not exempt from IRC. The state surcharge comprises 2.5% on the part of the taxable income, subject
to and not exempt from IRC, in excess of the referred to limit of €2,000,000. This disposition implies
that the tax rate used in 2010 and 2011 for the calculation of deferred tax and recognition of income
tax for the period was 29% (Note 14).
Law 64-B/2011 of 30 December (State Budget Law for 2012), temporarily increased the limits and
rates of the state tax on taxpayers in 2012 and 2013, who make taxable profit subject to and not
exempt from IRC of more than €1,500,000. It should therefore be noted that, for 2012 and 2013, the
state surcharge rate on taxable profit of between €1,500,000 and €10,000,000 will increase to 3%,
with the rate applicable on taxable profit subject to and not exempt from IRC of more than
€10,000,000 therefore being 5%. Given the temporal/transitory nature of the new calculation rules on
the state surcharge (only applicable in 2012 and 2013), the deferred tax recorded by group
companies in 2011 did not take the referred to increase in the State Budget for 2012 into account.
The Bank’s Madeira Offshore Branch, however, is exempt from IRC up until 31 December 2011
under article 33 of the Statute of Fiscal Benefits. For the purposes of the application of this
exemption, in accordance with the dispositions of article 34 of the Statute of Fiscal Benefits, at least
85% of the profit attributable to the entity’s global activity should derive from the performance of
operations outside the institutional scope of the Madeira Free Zone.
Caixa Desenvolvimento, SGPS, S.A. (Caixa Desenvolvimento) is subject to the general regime of the
elimination of distributed profit provided for in article 51 of the IRC Code, under which profits are
exempt from tax in cases in which (i) the company distributing the income is resident in Portugal or
the European Union and is subject to IRC (or similar tax), (ii) the income derives from effectively
taxed profits and (iii) the entity benefiting from the dividends has for at least one year retained an
investment of more than 10% in the company distributing the dividends.
Caixa Desenvolvimento also applied the deferred taxation regime, established in the IRC Code, on
capital gains and losses realised in 1999 and 2000 on its exchange or sale of investments or shares.
Based on the regime in force on 01 January 2002, the capital gains made in the referred to years on
investments disposed of by 31 December 2004, are being taxed over a ten year period, with the
group having recognised the respective deferred tax liability.
Under article 32 of the Statute of Fiscal Benefits, the capital gains and losses made by Caixa Capital
– Sociedade de Capital de Risco, S.A.’s (Caixa Capital) and Caixa Desenvolvimento’s sale of equity
investments, provided that such investments are held for not less than one year, and the financial
costs paid on the acquisition, are not considered as taxable material. This regime does not apply to
the capital gains made and financial costs paid when the equity investments have been acquired (i)
from entities with which a special relationship exists, as defined in no. 4 of article 63 of the IRC Code,
(ii) to entities which are domiciled, headquartered or effectively managed in a territory with a more
favourable tax regime or (iii) to entities resident in Portuguese territory, subject to a special tax
regime and when held for a period of less than three years.
Under the terms of no. 4 of article 32 of the Statute of Fiscal Benefits, Caixa Capital is also entitled to
deduct from its IRC taxable income and up to the amount thereof, as a fiscal benefit, an amount
equal to the sum of its IRC tax bills for the five years preceding the year of the respective benefit,
provided that the amount of the deduction is invested in companies with growth and appreciation
potential. Amounts not deducted under the previously referred to terms may be deducted at a later
stage, subject to the same terms, from its tax bill for the following five years.

Annual Report – 2011
76
Income made by venture capital funds is exempt from IRC under the dispositions of article 23 of the
Statute of Fiscal Benefits.
Total income tax recognised in the income statement includes current and deferred taxes.
Current tax is calculated on the basis of taxable profit for the year, which is different from accounting
income owing to adjustments to taxable profit resulting from costs or income which are not relevant
for fiscal purposes or only considered in other periods.
Deferred tax comprises the impact of temporary deductible or taxable differences between the
balance sheet value of assets and liabilities and their fiscal basis, used to assess taxable profit on tax
recoverable or payable in future periods.
Deferred tax liabilities are normally recognised for all temporary taxable differences, whereas
deferred tax assets are only recognised up to the amount by which the existence of future taxable
profit, permitting the use of the corresponding deductible tax differences or fiscal losses, is probable.
Deferred taxes are not, however, recorded in the following situations:
Temporary differences resulting from goodwill;
Temporary differences originating from the initial recognition of assets and liabilities in
transactions which do not affect accounting income or taxable profit;
Temporary differences resulting from non-distributed profit by subsidiaries and associated
companies, to the extent that the group is able to control their reversal and which is not likely to
occur in the foreseeable future.
The principal situations originating temporary differences in group terms comprise provisions and
impairment not accepted for fiscal purposes, revaluations of equity investments registered as
available for sale financial assets, deferred commissions, statutory revaluations of tangible assets,
capital gains on the disposal of investments (see above) and fiscal benefits granted to venture capital
activities.
Deferred taxes are calculated on the basis of the tax rates expected to be in force on the date of
reversal of the temporary differences, comprising the approved or substantially approved rates, at the
date of the balance sheet.
Income tax (current or deferred) is recognised in the income statement for the year, except for cases
in which the originating transactions have been recognised in other shareholders’ equity account
headings such as in the case of revaluations of available for sale financial assets. In such cases the
corresponding tax is also recognised as a charge to shareholders’ equity and does not affect income
for the year.
2.12. Provisions and contingent liabilities
A provision is set up when there is a current (legal or constructive) obligation, resulting from past
events, involving the probable future expenditure of resources and when this may be reliably
assessed. The amount of the provision comprises the best estimate of the amount to be paid to
liquidate the liability at the date of the balance sheet.
When not probable, the future expenditure of resources is considered to be a contingent liability.
Contingent liabilities require no more than a disclosure procedure, unless the possibility of their
payment is remote.

Annual Report – 2011
77
This account heading reflects the provisions required for liabilities incurred on guarantees and other
off-balance sheet liabilities and is assessed on the basis of a risk assessment on the operations and
respective customers. It also includes other provisions for fiscal, legal and other contingencies.
2.13. Employee benefits
The Bank does not have any retirement pensions liabilities to its employees, who are covered by the
national social security regime, owing to the fact that it is not a signatory to the Collective Wage
Bargaining Agreement for the Banking Sector.
However, with the objective of providing its employees with a retirement subsidy to the standard
social security regime, the Bank, at its own initiative has made contributions with the objective of
paying old age retirement and survivors’ pensions to its employees, in accordance with the terms set
out in the contract.
The Bank pays a percentage of 3.5% of each employee’s annual wages into the fund. Pension costs,
in 2011 and 2010 were €290,391 and €436,464 respectively (Note 27).
The contributions are made in the form of joint membership of the Caixa Reforma Prudente Open
Pension Fund, managed by CGD Pensões – Sociedade Gestora de Fundos de Pensões, S.A..
The Bank does not have any liabilities other than the above referred to contributions owing to the fact
that this is a defined contribution plan.
The other group companies do not have pensions liabilities.
Short term benefits, including productivity bonuses paid to employees, are recognised in “employee
costs” for the respective period, on an accrual basis.
2.14. Commissions
As referred to in Note 2.6, commissions received on credit operations and other financial instruments,
i.e. commissions charged for originating operations, are included in amortised costs and recognised
as costs or income over the period of the operation.
Commissions for services performed are usually recognised as income for the period of performance
of the service or as a lump sum if resulting from single acts.
The estimate of the commissions the Bank expects to pay to other credit institutions for the
syndicating of credit operations in which it is involved as lead and in which CGD Group’s initial
exposure is higher than the defined objective, is recognised as accrued costs as a charge to the
“costs of services and commissions” account heading for the year in which the Bank recognises the
income relating to the corresponding commission.
2.15. Securities and other items held under custody
Securities and other items held under custody, notably customers' securities, are recognised in off-
balance sheet account headings at their nominal value.

Annual Report – 2011
78
2.16. Cash and cash equivalents
For the purposes of the preparation of cash flow statements, the group considers “cash and cash
equivalents” to be the total amount of the “cash and cash equivalents with central banks” and “cash
equivalents with other credit institutions” account headings.
2.17. Critical accounting estimates and most relevant judgemental aspects in the
application of accounting policies
The main accounting policies applied by the group are described in Note 2. In the application of these
policies the Bank’s and group’s board of directors must make estimates. The estimates with the
greatest effect on the consolidated financial statements include those set out below.
ASSESSMENT OF IMPAIRMENT LOSSES ON LOANS AND ACCOUNTS RECEIVABLE
Impairment losses on loans and receivables are assessed in accordance with the methodology
defined in Note 2.6. d). Accordingly, the assessment of impairment on separately analysed assets
derives from the Bank’s specific valuation based on its specific knowledge of its customers’ status
and the guarantees associated with the operations in question.
The assessment of impairment on collectively analysed assets was based on Caixa Geral de
Depósitos Group parameters for comparable types of credit.
The Bank considers that the assessment of impairment on the basis of this methodology permits the
adequate recognition of the risk associated with its credit portfolio, based on the rules defined in IAS
39.
VALUATION OF FINANCIAL INSTRUMENTS NOT TRADED IN ACTIVE MARKETS
In accordance with the IAS 39 Standard, the group values all financial instruments at fair value,
except for those recognised at amortised cost. The valuation models and techniques described in
Note 2.6. a) are used to value financial instruments not traded on liquid markets, including equity
instruments allocated to venture capital operations. The valuations obtained comprise the best
estimate of the fair value of the referred to instruments at the date of the balance sheet. The
determining of fair value on equity instruments allocated to venture capital operations, may, however,
be subjective.
As referred to in Note 2.6. a), to guarantee an adequate separation between functions, the valuation
of most such financial instruments, except for equity instruments allocated to venture capital
operations, is assessed by a body that is independent from the trading function.
A summary of the sources used by the group to assess the fair value of financial instruments is
provided in Note 31 – Disclosures on financial instruments, in the “fair value" section.
ASSESSMENT OF IMPAIRMENT LOSSES ON AVAILABLE FOR SALE FINANCIAL ASSETS
As described in Note 2.6. d), capital losses deriving from the valuation of such assets are recognised
as a charge to the fair value reserve. Whenever objective evidence of impairment exists, the
accumulated capital losses recognised in the fair value reserve should be transferred to costs for the
year.
For equity instruments, including those allocated to venture capital, determination of the existence of
impairment losses may be subjective. The group assesses whether or not impairment exists on such
assets through a specific analysis at each balance sheet date, taking into consideration the

Annual Report – 2011
79
definitions provided in the IAS 39 Standard (see Note 2.6. d)). As a general criterion, impairment is
always assessed when it is considered, that, owing to the size of the capital loss assessed, the full
recovery of the amount invested by the group is highly improbable.
In the case of debt instruments classified in this category, including “Tier I” classified as equity
instruments, the capital losses are transferred from the fair value reserve to income, whenever there
is any indication of the possible future occurrence of failure to comply with contractually agreed cash
flows, notably on account of the issuer’s financial difficulties, defaults on other financial liabilities, or a
significant downgrade of the issuing entity’s rating.
ASSESSMENT OF TAX ON PROFIT
Tax on profits (current and deferred) is assessed by group companies on the basis of the rules
defined by the current fiscal framework. In several cases, however, fiscal legislation may not be
sufficiently clear and objective and may give rise to different interpretations. The amounts recognised
in such cases represent the best understanding of the responsible Bank bodies and subsidiaries on
the correctness of the operations although this may be queried by the fiscal authorities.
2.18. Adoption of new standards (IAS/IFRS) or revision of already issued standards
The following standards, interpretations, amendments and revisions endorsed by the European
Union and mandatory for financial years beginning on or after 1 January 2011, were adopted for the
first time, in the year ended 31 December 2011:
IFRS 8 and IAS 24 (amendment) – “Operating segments” and “Related Party Disclosures” – This
revision simplifies the definition of «related party», simultaneously eliminating certain internal
incoherencies and providing exemptions for entities associated with public administration as
regards the amount of information such entities must provide regarding transactions with related
parties.
IFRIC 14 (amendment) – “Prepayment of a minimum funding requirement” - These changes
eliminate an unintentional consequence of IFRIC 14 in cases in which an entity subject to a
minimum funding requirement makes a prepayment of contributions when, in certain
circumstances, the entity making such a prepayment would be obliged to recognise expenditure.
If a specific defined benefits plan is subject to a minimum funding requirement, the amendment to
IFRIC 14 determines that such a payment be processed as any other prepayment, as if it were an
asset.
IFRIC 19 – Extinguishing financial liabilities with equity instruments - this interpretation deals with
the following issues:
(a) Classification of own equity instruments issued to fully or partly extinguish a financial liability
are “considerations paid” according to paragraph 41 of IAS 39;
(b) how an entity should initially measure own equity instruments issued to extinguish this
financial liability;
(c) how an entity should process any difference between the amount of the financial liabilities
extinguished and the initial measured amounts of own equity instruments issued.
Improvements to the various IFRS: IFRS 1, IFRS 3 and IFRS 7, IAS 1, 32, 34, 39 and IFRIC 13 –
improvements made to the international financial reporting standards with the aim of simplifying
and clarifying the international accounting standards.

Annual Report – 2011
80
IAS 32 – “Financial Instruments ” – the presentation was changed under the terms of the annex to
Regulation (EC) No.1293/2009.
The application of these standards and interpretations did not have any materially relevant impacts
on the group’s financial statements at 31 December 2011.
New, amended or revised standards and interpretations not adopted
The following amendments, mandatory from 1 July 2011, have at the date of the approval of these
financial statements been endorsed by the European Union:
IFRS 7 (amendment) – “Financial instruments - “disclosures” – This revision increases the
disclosure requirements on transactions involving the transfer of financial assets. It aims to
guarantee greater transparency regarding exposure to risks when financial assets are transferred
and the transferring entity retains some involvement (exposure) thereto.
The standards, although having been endorsed by the European Union, were not adopted by the
group for the year ended 31 December 2011, owing to the fact that their application was still not
mandatory. No significant impacts on the financial statements deriving from their adoption have been
estimated.
3. OPERATING SEGMENTS
The board of directors receives and analyses the group’s financial information every month, split up into business
segments representing its areas of activity by type of origination, designed, as a whole, to ensure a dynamic
investment banking business platform i.e.
Corporate finance - including debt and equity financial advisory and project finance activities.
Trading and sales including trading and asset and liabilities treasury management operations.
Brokerage - brokerage operations.
Commercial banking - including domestic and international transversal business origination.
Venture capital - CGD group’s venture capital operations are performed by Caixa Capital - Capital de Risco,
S.A. (which, in addition to concentrating all operating activity also manages four venture capital funds) and
Caixa Desenvolvimento, SGPS, S.A. (principally geared to strategic operations with the highest potential
appreciation).
Other – Other activities outside the scope of the above referred to categories.

Annual Report – 2011
81
The following tables summarises the information on the group’s operating segments at 31 December 2011 and
2010:
2011
(amounts in euros)Corporate
financeTrading and
salesBrokerage
Commercial banking
Venture capital
Other Total
Interest and similar income 17,381,927 306,742,499 46,535 11,757,728 245,270 94,642 336,268,601
Interest and similar costs (10,181,137) (291,137,945) (46,033) (5,764,925) - (86,637) (307,216,678)
Income from equity instruments - 335,155 - - - 123,562 458,717Net interest income including incomefrom equity instruments I. 7,200,790 15,939,710 502 5,992,802 245,270 131,567 29,510,640
Income from services and commissions 49,970,597 991,507 5,228,495 4,679,202 6,728,036 28,102 67,625,939
Costs of services and commissions (4,471,991) (253,395) (1,090,134) (8,220) (7,715) (1,467) (5,832,923)
Income from financial operations (8,024,988) (24,208,779) (21,112) (403,841) 916,936 1 (31,741,783)
Other operating income (9,424) (30,377) (42,790) 17,362 802,656 (1,256,399) (518,972)
II. 37,464,194 (23,501,045) 4,074,460 4,284,504 8,439,912 (1,229,763) 29,532,262
Net operating income 44,664,983 (7,561,335) 4,074,961 10,277,306 8,685,182 (1,098,196) 59,042,902Provisions net of recoveries and cancellations (430,661) - - 6,017 - (1,539,591) (1,964,235)Credit impairment net of reversals and recoveries (9,084,194) - 8,577 (15,102,594) 24,355 (24,153,856)Impairment of other assets net of reversals and recoveries (1,222,389) (4,049,472) 2,769 (664,572) 154,919 683 (5,778,062)
III. (10,737,244) (4,049,472) 11,346 (15,761,149) 154,919 (1,514,553) (31,896,154)
Total 33,927,739 (11,610,807) 4,086,307 (5,483,842) 8,840,101 (2,612,749) 27,146,748
Other costs and income (18,593,752)
Consolidated net income 8,552,996
Financial assets at fair value through profit or loss - 789,567,956 8 11,003,760 - - 800,571,724
Available for sale financial assets - 352,786,431 - 41,112,525 44,579,054 11,928,147 450,406,157
Positive revaluation of hedge derivatives - 1,459,895 - - - - 1,459,895
Loans and advances to customers 465,106,098 - 2,392,989 221,393,823 - 10,239,719 699,132,629Credit institutions’ and central banks’ resources 237,249,426 583,456,729 1,220,661 139,516,804 22,739,661 11,307,772 995,491,052
Customer resources and other loans 4,876,964 - 28,660,869 80,531,582 - - 114,069,415Financial liabilities at fair value through profit or loss - 733,589,348 - - - - 733,589,348
Negative revision of hedge derivatives - 1,521,387 - - - - 1,521,387
2010
(amounts in euros)Corporate
financeTrading and
salesBrokerage
Commercial banking
Venture capital
Other Total
Interest and similar income 13,361,944 250,879,876 38,402 8,771,387 281,581 75,744 273,408,934
Interest and similar costs (4,040,140) (233,336,994) (20,276) (2,627,109) (94) (71,508) (240,096,121)
Income from equity instruments - 242,762 - - 77,710 81,881 402,353Net interest income including incomefrom equity instruments I. 9,321,804 17,785,644 18,126 6,144,278 359,197 86,117 33,715,166
Income from services and commissions 60,859,871 3,379,550 5,452,918 10,431,827 5,786,910 44,426 85,955,502
Costs of services and commissions (8,655,161) (3,538,992) - (6,563) (9,540) (33,002) (12,243,258)
Income from financial operations 75,718 (16,678,593) (162,514) (716,662) 391,528 - (17,090,523)
Other operating income 799,524 84,556 136,243 (71,989) 924,274 (263,918) 1,608,690
II. 53,079,952 (16,753,479) 5,426,647 9,636,613 7,093,172 (252,494) 58,230,411
Net operating income 62,401,756 1,032,165 5,444,773 15,780,891 7,452,369 (166,377) 91,945,577
Provisions net of recoveries and cancellations (60,869) 1,961,882 - - (199,743) 6,633,660 8,334,930Credit impairment net of reversals and recoveries (6,236,596) (31) (3,745) (1,061,841) - 19,312 (7,282,901)Impairment of other assets net of reversals and recoveries (1,132,090) (5,781,770) 1,183 (916,555) (2,912,474) 33,442 (10,708,264)
III. (7,429,555) (3,819,919) (2,562) (1,978,396) (3,112,217) 6,686,414 (9,656,235)
Total 54,972,201 (2,787,754) 5,442,211 13,802,495 4,340,152 6,520,037 82,289,342
Other costs and income (42,136,060)
Consolidated net income 40,153,282
Financial assets at fair value through profit or loss - 601,761,270 5 13,223,085 346,924 - 615,331,283
Available for sale financial assets - 382,845,740 - 42,768,213 47,455,259 10,443,146 483,512,357
Positive revaluation of hedge derivatives - 1,250,849 - - - - 1,250,849
Loans and advances to customers 513,845,379 - 2,639,001 261,560,978 - 9,867,016 787,912,373Credit institutions’ and central banks’ resources 307,311,036 589,603,434 1,578,287 189,915,727 28,588,635 12,146,722 1,129,143,842
Customer resources and other loans 4,829,715 183,755 22,428,969 77,553,922 - - 104,996,362Financial liabilities at fair value through profit or loss - 416,869,550 - - - - 416,869,550
Negative revision of hedge derivatives - 1,599,779 - - - - 1,599,779

Annual Report – 2011
82
Interest and similar costs were split up over the various business lines on the basis of the average value of the
respective asset allocations to the said operating segments.
Income distribution by principal balance sheet headings and countries in which the group performs its activities in
2010 and 2011 is set out below:
2011
(amounts in euros) Portugal Spain Total
Interest and similar income 318,451,105 17,817,495 336,268,601
Interest and similar costs (289,521,109) (17,695,569) (307,216,678)
Income from equity instruments 458,717 - 458,717
Net interest income including income from equity instruments I. 29,388,713 121,927 29,510,640
Income from services and commissions 67,542,377 83,562 67,625,939
Costs of services and commissions (5,824,893) (8,030) (5,832,923)
Income from financial operations (31,510,546) (231,236) (31,741,783)
Other operating income (519,166) 194 (518,972)
II. 29,687,772 (155,510) 29,532,262
Net operating income 59,076,485 (33,584) 59,042,902
Provisions net of recoveries and cancellations (1,964,235) - (1,964,235)
Credit impairment net of reversals and recoveries (17.976.645) (6,177,211) (24,153,856)
Impairment of other assets net of
reversals and recoveries (5,778,062) - (5,778,062)
III. (25,718,942) (6,177,211) (31,896,154)
Total 33,357,543 (6,210,795) 27,146,748
Other costs and income (18,593,752)
Consolidated net income 8,552,996
Financial assets at fair value through profit or loss 799,588,969 982,755 800,571,724
Available for sale financial assets 450,406,157 - 450,406,157
Positive revaluation of hedge derivatives 1,459,895 - 1,459,895
Loans and advances to customers 688,677,437 10,455,192 699,132,629
Credit institutions’ and central banks’ resources 976,916,483 18,574,570 995,491,052
Customer resources and other loans 114,069,415 - 114,069,415
Financial liabilities at fair value through profit or loss 733,589,348 - 733,589,348
Negative revision of hedge derivatives 1,521,387 - 1,521,387
2010
(amounts in euros) Portugal Spain Total
Interest and similar income 255,452,679 17,956,255 273,408,934
Interest and similar costs (222,912,333) (17,183,788) (240,096,121)
Income from equity instruments 402,353 - 402,353
Net interest income including income from equity instruments I. 32,942,699 772,467 33,715,166
Income from services and commissions 85,565,916 389,586 85,955,502
Costs of services and commissions (12,233,839) (9,419) (12,243,258)
Income from financial operations (16,377,545) (712,979) (17,090,524)
Other operating income 1,596,872 11,818 1,608,690
II. 58,551,404 (320,994) 58,230,410
Net operating income 91,494,103 451,473 91,945,576
Provisions net of recoveries and cancellations 8,283,307 51,622 8,334,930
Credit impairment net of reversals and recoveries (5.361.392) (1,921,509) (7,282,901)
Impairment of other assets net of
reversals and recoveries (10,708,264) - (10,708,264)
III. (7,786,349) (1,869,886) (9,656,235)
Total 83,707,754 (1,418,413) 82,289,341
Other costs and income (42,136,060)
Consolidated net income 40,153,282
Financial assets at fair value through profit or loss 614,117,292 1,213,991 615,331,283
Available for sale financial assets 483,512,357 - 483,512,357
Positive revaluation of hedge derivatives 1,250,849 - 1,250,849
Loans and advances to customers 770,494,748 17,417,626 787,912,373
Credit institutions’ and central banks’ resources 1,109,775,915 19,367,927 1,129,143,842
Customer resources and other loans 104,996,362 - 104,996,362
Financial liabilities at fair value through profit or loss 416,869,550 - 416,869,550
Negative revision of hedge derivatives 1,599,779 - 1,599,779

Annual Report – 2011
83
The information set out in the preceding tables comprises the balance sheet and income statements of all group
entities headquartered in Portugal (“Portugal” column) and the Madrid branch (“Spain” column). Each of the group
entities performs its activity mainly with customers or resident counterparties domiciled in the same countries in
which they are headquartered.
4. GROUP COMPANIES AND TRANSACTIONS IN PERIOD
The following is a summary of the financial data extracted from the provisional accounts of the entities included in
the consolidation perimeter in the last financial year, using the global integration method:
(amounts in euros) Registered office
CurrencyPercentage
equity investment
Date AssetsProfit / (Loss)
Shareholders’ equity
Entity
Caixa - Banco de Investimento, S.A. Lisbon Euros 100.00% 31-12-2011 2,169,198,024 1,464,516 178,266,568
Caixa Desenvolvimento, SGPS, S.A. Lisbon Euros 100.00% 31-12-2011 4,285,174 31,433 4,127,360
Caixa Capital - Sociedade de Capital de Risco, S.A. Lisbon Euros 100.00% 31-12-2011 39,571,414 5,148,225 38,103,120
Fundo de Capital de Risco Energias Renováveis - Caixa Capital Lisbon Euros 91.00% 31-12-2011 33,212,331 1,966,929 33,042,135
CaixaBI Brasil - Serviços de Assessoria Financeira Ltda São PauloReais
100.00% 31-12-20116,019,000 5,162,365 5,162,365
Euros 2,491,411 2,136,829 2,136,829
Caixa Desenvolvimento, SGPS, S.A. formed in 1998, has its registered office in Portugal. Its corporate object is to
operate as a holding company, as an indirect form of performing economic activities.
Caixa Capital - Sociedade de Capital de Risco, S.A. (Caixa Capital) has its registered office in Lisbon and was
formed at 31 December 1990 under Decree Law 17/86 of 5 February. The company’s corporate object is to
support and promote investment and technological innovation by making temporary equity investments in projects
or companies. It is also authorised to provide assistance to the financial, technical, administrative and commercial
management of its subsidiary companies. At 31 December 2011 it managed five venture capital funds.
Fundo de Capital de Risco para Investidores Qualificados Energias Renováveis – Caixa Capital (FCR Energias
Renováveis) was formed in January 2006, with a subscribed capital of €50,000,000 comprising 2,000 investment
units. The fund’s objective is to invest its assets in equity investments in companies with high growth and
appreciation potential, operating in the field of generating electricity from renewable energy sources. The Bank
subscribed for 1,820 investment units with a nominal value of €45,500,000, of which €18,900,000 was
outstanding at 31 December 2011 and 2010.
On 16 December 2011, the Investors’ meeting of Fundo de Capital de Risco Energias Renováveis – Caixa
Capital, decided to liquidate the fund, preferably by the end of first quarter 2012.
In November 2011, the Bank formed the company CaixaBI Brasil – Serviços de Assessoria Financeira Ltda., in
Brazil with the corporate object of providing consultancy services to companies on capital structuring issues,
business strategy and connected matters, in addition to consultancy and services for mergers and the buying and
selling of companies and Bank financing structuring from other entities. The company is 90% owned by the Bank
and 10% owned by Caixa Desenvolvimento SGPS, S.A..
5. CASH AND CASH EQUIVALENTS WITH CENTRAL BANKS
This account heading comprises the following:
(amounts in euros) 2011 2010
Cash 2,897 2,897
Sight deposits with central banks 2,921,782 8,891,265
2,924,679 8,894,162

Annual Report – 2011
84
The “sight deposits with Bank of Portugal” account heading includes the deposits providing for the demands of the
“Minimum Reserve Requirements of the System of European Central Banks” (SEBC). Interest is paid on these
deposits which comprise 2% of the deposits and debt securities with a maturity of up to two years, excluding the
deposits and public debt securities subject to SEBC minimum reserve requirements.
6. CASH ASSETS WITH OTHER CREDIT INSTITUTIONS
This account heading comprises the following
(amounts in euros) 2011 2010
Sight deposits
In Portugal 1,037,917 5,254,421
Abroad 404,879 185,947
Interest receivable 860 -
1,443,656 5,440,368
7. INVESTMENTS IN CREDIT INSTITUTIONS
This account heading comprises the following:
(amount in euros) 2011 2010
Short term loans
Abroad 20,000,000 -
Term deposits
In Portugal 10,904,581 7,410,600
Abroad 2,491,310 -
Interest receivable 87,652 66,472
33,483,543 7,477,072
Impairment (Note 29) ( 120,600 ) -
33,362,943 7,477,072
At 31 December 2011 and 2010, the “term deposits” account heading comprised operations with CGD Group
financial institutions.
At 31 December 2011 and 2010, the “loans” heading was for loans made to Caixa Geral de Depósitos, S.A. –
Sucursal de France maturing in January 2012.

Annual Report – 2011
85
8. FINANCIAL ASSETS AT FAIR VALUE THROUGH PROFIT OR LOSS
These headings comprise the following:
2011 2010
(amount in euros)
Held for tradingAt fair value
through profit or loss
Total Held for tradingAt fair value
through profit or loss
Total
Debt instruments
- Issued by public entities:
. Bonds - 2 2 11,135,157 2 11,135,159
- Issued by other entities:
. Bonds and other securities:
Issued by resident entities 72,523,243 10,021,006 82,544,250 84,170,709 12,950,363 97,121,072
Issued by non-resident entities 9,272 1,265,595 1,274,868 76,048,737 2,013,682 78,062,419
72,532,516 11,286,603 83,819,119 171,354,603 14,964,047 186,318,650
Equity instruments
Issued by resident entities 1,045,069 - 1,045,069 41,197 346,923 388,120
Issued by non-resident entities 1,970,932 - 1,970,932 1,297,184 - 1,297,184
3,016,001 - 3,016,001 1,338,381 346,923 1,685,304
Derivatives with positive fair value(Note 10) 713,736,603 - 713,736,603 427,327,329 - 427,327,329
789,285,121 11,286,603 800,571,724 600,020,313 15,310,970 615,331,283
The “debt instruments issued by other resident entities - held for trading” account heading at 31 December 2011
and 2010, included €70,890,370 and €81,124,157 in bonds convertible into EDP shares issued by Parpública –
SGPS, S.A. respectively.
At 31 December 2010, the “financial assets at fair value through profit or loss – equity instruments” account
heading included €346,923 for the equity investment in MWH - Gestão Recursos Naturais, S.A.
In December 2009, the group acquired 337,926 MWH – Gestão de Recursos Naturais, S.A. shares from FCR
Energias Renováveis, comprising 10% of the equity capital at a nominal unit price of €1. By 31 December 2010
the group had paid up 251,305 shares, with the rest outstanding. Partners’ loans for the amount of €621,804 were
also made. At 31 December 2010 the equity investment in MWH – Gestão de Recursos Naturais, S.A. was
recognised on the basis of the sales price defined in the shares purchase/sales contract and transfer of partners´
loans entered into on 4 January 2011 for the amounts of €260,303 and €644,445, respectively. In January 2011,
the group disposed of its investment in the company.
The group recognises equity instruments for venture capital in this category, whenever there are associated
derivatives (i.e. the right or contractual obligation to dispose of the subsidiary companies under shareholders’
agreements entered into when the equity investments were made).
Collateralised debt securities with a nominal value of €1,550,000 and €75,591,000 respectively (Note 18) were
recognised in this account heading at 31 December 2011 and 2010.

Annual Report – 2011
86
9. AVAILABLE FOR SALE FINANCIAL ASSETS
This account heading comprises the following:
(amount in euros) 2011 2010
Debt instruments
Issued by resident entities
Portuguese public debt 258,560,239 256,848,797
Issued by other entities 94,078,927 95,182,837
Issued by non-resident entities
Public debt 5,177,739 3,570,611
Issued by other entities 32,933,044 55,241,612
390,749,949 410,843,857
Impairment (Note 29) ( 3,961,150 ) -
386,788,799 410,843,857
Equity instruments
Shares
Gross amount
Issued by resident entities
At fair value 1,066,341 740,905
At historical cost 153,127 153,127
Issued by non-resident entities
At fair value 30,041,251 52,594,270
At historical cost 7,350,841 927,903
38,611,560 54,416,205
Impairment (Note 29) ( 3,524,528 ) ( 11,755,144 )
35,087,032 42,661,061
Investment units
Gross amount 21,573,296 22,329,670
Other equity instruments
Gross amount 6,957,030 7,677,768
63,617,357 72,668,500
450,406,157 483,512,357
Information on the value of share and investment units at 31 December 2011 and 2010, is set out below:
2011 2010
(amount in euros) %
investmentCost price Impairment
Fair value reserve
Book value%
investmentBook value
(Note 29) (Note 21)
Venture capital investments:
CGD Group Venture Capital Fund 6.46% 21,349,747 - 223,549 21,573,296 6.46% 22,329,670
SICAR NovEnergia II 4.61% 11,907,582 - 9,015,263 20,922,845 6.53% 19,093,482
Pinewells, S.A. 22.65% 1,426,341 - (360,000) 1,066,341 20.00% 740,905
EDP Renováveis, S.A. 0.025% 1,552,526 (660,276) 124,270 1,016,520 0.32% 12,230,340
La Seda Barcelona 0.00% 1,795 (1,744) - 51 0.13% 60
Other less than €100,000 1 - - 1 1
36,237,993 (662,020) 9,003,081 44,579,054 54,394,458
Other investments:
SEIF - South Europe Infrastructure Equity Finance 8.33% 4,883,721 - 1,539,217 6,422,938 8.33% 5,442,832Corporación Interamericana para el Financiamiento de Infraestructura 9.26% 3,995,672 (1,934,605) 3,444,142 5,505,209 9.26% 5,000,314
MTS Portugal, SGMR, S.A. 4.67% 153,127 - - 153,127 4.67% 153,127
Other 927,903 (927,903) - - -
9,960,423 (2,862,508) 4,983,359 12,081,274 10,596,273
46,198,416 (3,524,528) 13,986,441 56,660,328 64,990,731

Annual Report – 2011
87
Information on movements in this account, for 2011 and 2010 was as follows:
(amount in euros) Balance at31.12.2009
Purchases / sales
Change in fair value reserve
Impairment (Note 29)
Exchange differences
Balance at 31.12.2010
Purchases / sales
Change in fair value reserve
Impairment(Note 29)
Exchange differences
Balance at31.12.2011
Venture capital investments:
CGD Group Venture Capital Fund 21,761,702 - 567,968 - - 22,329,670 - (756,374) - - 21,573,296
SICAR NovEnergia II 17,712,326 - 1,381,156 - - 19,093,482 - 1,829,363 - - 20,922,845
EDP Renováveis, S.A. 14,612,268 3,373,062 3,197,155 (8,952,145) - 12,230,340 (10,810,750) (403,070) - 1,016,520
Pinewells, S.A. 1,096,941 - (356,036) - - 740,905 526,341 (200,905) - - 1,066,341
La Seda Barcelona 100 - 1,695 (1,735) - 60 - - (9) - 51
Fomentinvest, SGPS, S.A. 5,138,081 (3,576,923) (1,561,158) - - - - - - - -
Martifer, SGPS, S.A. 2,595,508 (2,595,508) - - - - - - - - -
Other less than €100,000 - 1 - - - 1 - - - - 1
62,916,926 (2,799,368) 3,230,780 (8,953,880) - 54,394,457 (10,284,409) 469,014 (9) - 44,579,054
Other investments:SEIF - South Europe InfrastructureEquity Finance 4,052,818 555,000 835,014 - - 5,442,832 640,000 340,106 - - 6,422,938Corporación Interamericana para el Financiamiento de Infrastructure 1,992,123 - 2,852,542 - 155,649 5,000,314 - 337,901 - 166,994 5,505,209
MTS Portugal, SGMR, S.A. 153,127 - - - - 153,127 - - - - 153,127
Other - 927,903 - (927,903) - - - - - - -
6,198,068 1,482,903 3,687,557 (927,903) 155,649 10,596,274 640,000 678,007 - 166,994 12,081,274
69,114,994 (1,316,465) 6,918,337 (9,881,783) 155,649 64,990,731 (9,644,409) 1,147,021 (9) 166,994 56,660,328
The “other equity instruments” account heading comprises non-voting preference shares issued by Caixa Geral
Finance Limited, giving a right to a quarterly preferential dividend, at the company’s discretion, equivalent to
annual interest at the Euribor rate plus a spread. Caixa Geral Finance may redeem the preferential shares
starting from the tenth year after their issue (June 2014 and September 2015) with a 1% increase in spread if
failing to do so.
At 31 December 2011 and 2010, the potential capital losses on “debt instruments” registered in the fair value
reserve, totalled €113,764,751 and €35,385,271 respectively of which €100,203,706 and €27,137,908,
respectively, on Portuguese public debt bonds.
The investment in Corporación Interamericana para el Financiamento de Infraestructuras was made in 2001 for
USD 4,000,000 US dollars. In August 2008, the Bank purchased €1,000,000 for the total amount of USD
1,170,000 US dollars. Exposure to foreign exchange risk is hedged by funding in US dollars with the change in
fair value in 2011 and 2010 resulting from the recognition of the foreign exchange component in results.
At 31 December 2011 and 2010 the investment in La Seda de Barcelona, S.A. (La Seda) was accepted for
trading on the Madrid stock exchange.
The following were the principal movements in equity capital instruments recognised in “available for sale financial
assets” in 2011 and 2010:
EDP Renováveis, S.A.
In 2010 and 2011 the group sold EDP Renováveis, S.A. shares on the stock exchange. These operations
generated capital gains of €2,121,661 in 2011 and €94,668 euros in 2010 (Note 25).
The group recognised impairment of €8,952,145 on its investment in EDP Renováveis in 2010.
Pinewells, S.A.
In October 2011 the group was involved in the share capital increase of Pinewells, S.A., having subscribed for
175,447 shares with a nominal value of €3 each. This operation increased the investment in the fund to 22.65%.

Annual Report – 2011
88
Fomentinvest, SGPS, S.A.
In February 2010, as part of a restructuring of the investments held by Caixa Geral de Depósitos Group’s venture
capital operations, the group disposed of its investment in Fomentiveste to the CGD Group Venture Capital Fund
– Caixa Capital (FCR CGD) at its book value at 31 December 2009 making capital losses of €1,561,158 (Note
25).
Martifer, SGPS, S.A.
In May and June 2010 the Fund disposed of the whole of its investment in Martifer, SGPS, S.A. The sale was
made on the stock market at various times for the total amount of €1,417,722, originating capital losses of
€1,177,787 (Note 25).
South Europe Infrastructure Equity Finance
The Bank was involved in the South Europe Infrastructure Equity Finance (SEIEF) capital increases in 2011 and
2010, investing amounts of €640,000 and €555,000 respectively. The Bank has undertaken to provide a total of
up to €10,000,000 in equity funding at the fund’s request, whenever a new operation is realised.
Reclassification of securities
The Bank reclassified its financial assets held for trading category securities to the available for sales financial
assets category on 1 July 2008, in conformity with the change to the IAS 39 Standard approved on 13 October
2008. Owing to the turbulence in the financial markets in 2008, the fact that the Bank does not expect to dispose
of these securities over the short term explains the reason for the transfer between categories
Information on the impact of the reclassification of these securities, in income and fair value reserves account
headings is set out below:
(amount in euros) 2011 2010
Fair value 5,652,174 7,424,229
Accrued interest 4,399 3,471
Book value 5,656,573 7,427,700
Fair value reserve (5,865,860) 4,093,805
Capital gains/losses in income for period - 329,758
Impact in income for period if the reclassification had not been made (1,772,055) (1,602,996)
The fiscal effect is not reflected in the amounts.
Collateralised debt securities with a nominal value of €404,470,000 and €351,180,000 respectively (Note 18)
were recognised in this account heading at 31 December 2011 and 2010.

Annual Report – 2011
89
10. DERIVATIVE FINANCIAL INSTRUMENTS
These operations were valued in conformity with the criteria set out in Note 2.6. c), at 31 December 2011 and
2010. Information on the respective notional and balance sheet value, at the said dates, is set out below:
2011
Notional amount Book value
Trading derivatives
Hedge derivatives
TotalAssets held for trading
Liabilitiesheld for trading
Hedge derivatives
Total
(Note 8)
Derivative financial instruments
OTC
. Swaps
Interest rate 11,162,654,957 14,917,906 11,177,572,863 634,798,840 (654,658,328) (61,492) (19,920,979)
. Caps & Floors 1,940,651,040 - 1,940,651,040 33,343,537 (33,324,740) - 18,796
. Options
On interest rate 600,000,500 - 600,000,500 45,594,226 (45,606,280) - (12,054)
13,703,306,497 14,917,906 13,718,224,403 713,736,603 (733,589,348) (61,492) (19,914,237)
Stock exchange trading
. Futures
Interest rate 30,768,886 - 30,768,886 - - - -
Market value 3,667,000 - 3,667,000 - - - -
13,737,742,383 14,917,906 13,752,660,289 713,736,603 (733,589,348) (61,492) (19,914,237)
2010
Notional amount Book value
Trading derivatives
Hedge derivatives
TotalAssets held for trading
Liabilities held for trading
Hedge derivatives
Total
(Note 8)
Derivative financial instruments
OTC
. Swaps
Interest rate 10,609,327,929 15,815,750 10,625,143,679 370,958,733 (360,533,298) (348,930) 10,076,505
. Caps & Floors 2,703,102,260 - 2,703,102,260 37,246,105 (37,205,261) - 40,844
. Options
On interest rate 600,000,500 - 600,000,500 19,068,510 (19,079,533) - (11,023)
On currency 18,205,928 - 18,205,928 53,981 (51,458) - 2,523
13,930,636,618 15,815,750 13,946,452,368 427,327,329 (416,869,550) (348,930) 10,108,849
Stock exchange trading
. Futures
Interest rate 9,870,977 - 9,870,977 - - - -
Market value 3,618,000 - 3,618,000 - - - -
13,944,125,595 15,815,750 13,959,941,345 427,327,329 (416,869,550) (348,930) 10,108,849
The book value of the assets classified as hedged items, at 31 December 2011 and 2010, totalled €11,502,767
and €12,460,591 respectively, including €1,442,632 and €1,491,606 (Note 11), respectively, in respect of value
adjustments.
The book value of the liabilities classified as hedged items, at 31 December 2011 and 2010, also totalled
€6,559,757 and €6,328,521 respectively, including €345,377 and €331,207 (Note 17), respectively, in respect of
value adjustments.

Annual Report – 2011
90
Information on the distribution of derivative financial instruments operations, at 31 December 2011 and 2010 by
periods to maturity (notional amounts) is set out below:
2011
> 3 months > 6 months > 1 year
<= 3 months <= 6 months <= 1 year <= 5 years > 5 years Total
Derivative financial instruments
OTC
. Swaps
Interest rate
Trading 684,687,165 488,815,517 295,149,777 2,711,564,625 6,982,437,872 11,162,654,957
Hedge - - - 14,917,906 - 14,917,906
684,687,165 488,815,517 295,149,777 2,726,482,531 6,982,437,872 11,177,572,863
. Caps & Floors
Trading - - - 1,596,877,847 343,773,193 1,940,651,040
. Options
On interest rate - - - - 600,000,500 600,000,500
684,687,165 488,815,517 295,149,777 4,323,360,379 7,926,211,565 13,718,224,403
Stock exchange trading
. Futures
Interest rate
Trading 30,768,886 - - - - 30,768,886
Market value 3,667,000 - - - - 3,667,000
719,123,051 488,815,517 295,149,777 4,323,360,379 7,926,211,565 13,752,660,289
2010
> 3 months > 6 months > 1 year
<= 3 months <= 6 months <= 1 year <= 5 years > 5 years Total
Derivative financial instruments
OTC
. Swaps
Interest rate
Trading 150,015,131 49,651,922 992,298,873 3,842,407,285 5,574,954,718 10,609,327,929
Hedge - - - 5,000,000 10,815,750 15,815,750
150,015,131 49,651,922 992,298,873 3,847,407,285 5,585,770,468 10,625,143,679
. Caps & Floors
Trading - 114,300,000 608,551,286 925,714,080 1,054,536,894 2,703,102,260
. Options
On interest rate - - - - 600,000,500 600,000,500
On currency 18,205,929 - - - - 18,205,929
168,221,060 163,951,922 1,600,850,159 4,773,121,365 7,240,307,862 13,946,452,368
Stock exchange trading
. Futures
Interest rate
Trading - 9,870,977 - - - 9,870,977
Market value - 3,618,000 - - - 3,618,000
168,221,060 177,440,899 1,600,850,159 4,773,121,365 7,240,307,862 13,959,941,345
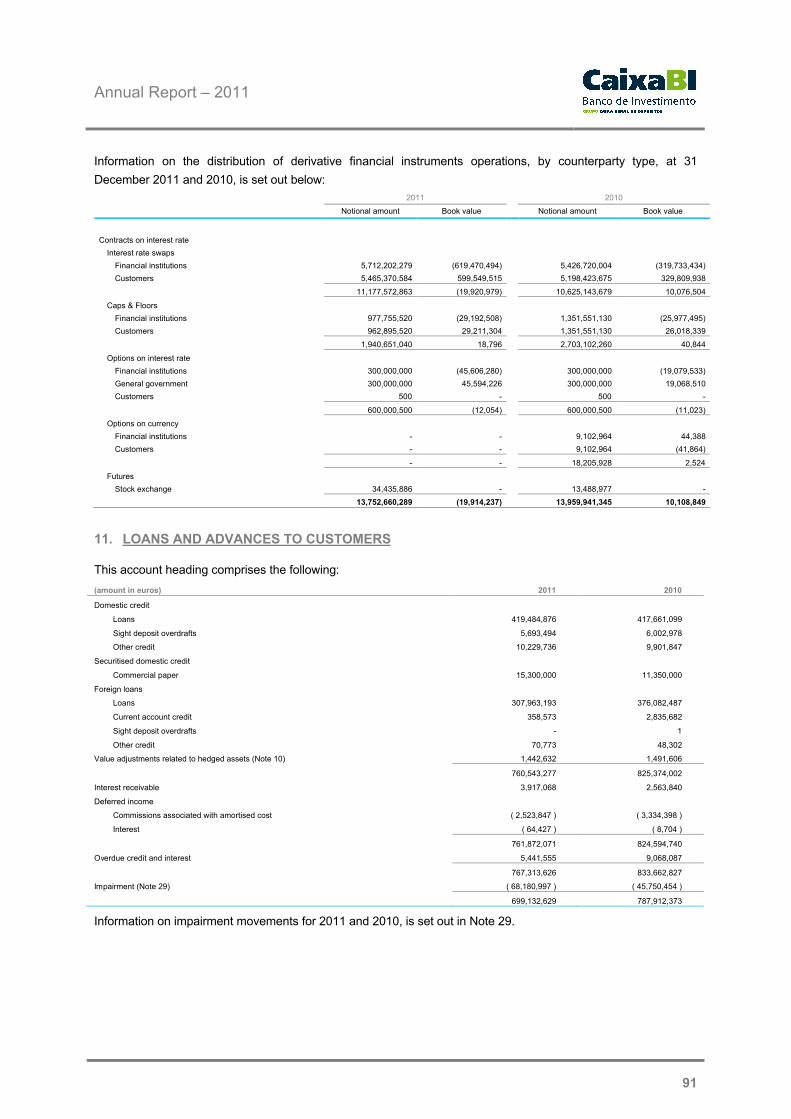
Annual Report – 2011
91
Information on the distribution of derivative financial instruments operations, by counterparty type, at 31
December 2011 and 2010, is set out below:
2011 2010
Notional amount Book value Notional amount Book value
Contracts on interest rate
Interest rate swaps
Financial institutions 5,712,202,279 (619,470,494) 5,426,720,004 (319,733,434)
Customers 5,465,370,584 599,549,515 5,198,423,675 329,809,938
11,177,572,863 (19,920,979) 10,625,143,679 10,076,504
Caps & Floors
Financial institutions 977,755,520 (29,192,508) 1,351,551,130 (25,977,495)
Customers 962,895,520 29,211,304 1,351,551,130 26,018,339
1,940,651,040 18,796 2,703,102,260 40,844
Options on interest rate
Financial institutions 300,000,000 (45,606,280) 300,000,000 (19,079,533)
General government 300,000,000 45,594,226 300,000,000 19,068,510
Customers 500 - 500 -
600,000,500 (12,054) 600,000,500 (11,023)
Options on currency
Financial institutions - - 9,102,964 44,388
Customers - - 9,102,964 (41,864)
- - 18,205,928 2,524
Futures
Stock exchange 34,435,886 - 13,488,977 -
13,752,660,289 (19,914,237) 13,959,941,345 10,108,849
11. LOANS AND ADVANCES TO CUSTOMERS
This account heading comprises the following:
(amount in euros) 2011 2010
Domestic credit
Loans 419,484,876 417,661,099
Sight deposit overdrafts 5,693,494 6,002,978
Other credit 10,229,736 9,901,847
Securitised domestic credit
Commercial paper 15,300,000 11,350,000
Foreign loans
Loans 307,963,193 376,082,487
Current account credit 358,573 2,835,682
Sight deposit overdrafts - 1
Other credit 70,773 48,302
Value adjustments related to hedged assets (Note 10) 1,442,632 1,491,606
760,543,277 825,374,002
Interest receivable 3,917,068 2,563,840
Deferred income
Commissions associated with amortised cost ( 2,523,847 ) ( 3,334,398 )
Interest ( 64,427 ) ( 8,704 )
761,872,071 824,594,740
Overdue credit and interest 5,441,555 9,068,087
767,313,626 833,662,827
Impairment (Note 29) ( 68,180,997 ) ( 45,750,454 )
699,132,629 787,912,373
Information on impairment movements for 2011 and 2010, is set out in Note 29.

Annual Report – 2011
92
This account was broken down as follows, by periods to maturity at 31 December 2011 and 2010:
(amount in euros) 2011 2010
Up to three months 26,150,000 12,198,917
Three months to one year 20,744,913 12,792,890
One to five years 214,788,278 241,250,807
More than five years 492,808,019 550,292,726
Current account overdrafts 6,052,067 8,838,662
760,543,277 825,374,002
Impairment, recognised at 31 December 2011 and 2010, was assessed as follows:
(amount in euros) 2011 2010
Separate analysis 64,789,921 39,996,004
Collective analysis 3,391,076 5,754,450
68,180,997 45,750,454
The total nominal value of credit suffering from specific impairment at 31 December 2011 and 2010 was
€148,082,791 and €113,382,404 respectively, including the amounts recognised in outstanding and overdue
credit.
The sectoral distribution of loans and advances to customers (nominal value), excluding overdue credit, at 31
December 2011 and 2010, was as follows:
(amount in euros) 2011 2010
Sector of activity Amount % Amount %
Manufacturing
Electricity, water and gas generation and distribution 120,823,388 15.9 135,765,101 16.4
Food, beverages and tobacco industries 10,427,577 1.4 11,199,835 1.4
Base metallurgical and metal industries 5,607,273 0.7 5,617,275 0.7
Textiles industry 7,729,834 1.0 7,619,182 0.9
Chemicals and synthetic or artificial fibres manufacturing 9,528,062 1.3 9,881,345 1.2
Paper pulp, card and publishing and printing thereof 552,626 0.1 631,574 0.1
Manufacture of electrical and optical equipment 740,016 0.1 791,294 0.1
Manufacturing 23,101,876 3.0 1,279,848 0.2
Manufacture of articles of rubber and plastics 238,464 0.0 343,083 0.0
Properties, rentals and corporate services
Property activities 56,542,359 7.4 59,433,875 7.2
Other 105,630,199 13.9 138,192,391 16.7
Transport, warehousing and communications 224,330,893 29.5 241,036,829 29.2
Construction 98,798,795 13.0 100,070,640 12.1
Wholesale/retail 2,750,584 0.4 20,510,887 2.5
Health and social security 16,983,095 2.2 17,627,511 2.1
Financial activities 15,857,647 2.1 15,667,970 1.9
Hotels and restaurants 3,875,118 0.5 5,036,398 0.6
Other collective, social and personal activities and services 44,327,976 5.8 42,068,562 5.1
Loans and advances to individual customers 12,697,493 1.7 12,600,402 1.5
760,543,277 100 825,374,002 100
The Bank, in 2011, disposed of global credit operations for the amount of €22,456,571, for a book value of
€23,417,261, making capital losses of €960,690 (Note 25).

Annual Report – 2011
93
12. OTHER TANGIBLE ASSETS
Information on movements in the “other tangible assets” account headings for the years 2011 and 2010 is set out
below:
2011
Balance at 31.12.10 Net
Gross amount Accumulated Depreciation Write-offs amount at
(amount in euros) depreciation Acquisitions for period (net)31 December
2011
Property:
For own use 16,200,020 (4,135,759) 135,095 (492,937) - 11,706,419
Other property 77,843 (77,843) - - - -
Equipment:
IT equipment 1,979,288 (1,818,630) 149,452 (157,679) (112) 152,318
Interior installations 1,810,123 (1,767,463) - (11,320) - 31,339
Furniture and materials 1,544,802 (1,204,499) 1,651 (75,156) - 266,798
Plant and machinery 572,867 (503,396) 1,458 (25,714) - 45,215
Transport material 148,836 (107,690) - (13,914) (13,317) 13,916
Other equipment 1,214 (412) - - - 802
Security equipment 240,087 (240,087) - - - -
Property leases:
IT equipment 17,262 (5,754) - (5,754) - 5,754
22,592,342 (9,861,532) 287,655 (782,475) (13,429) 12,222,561
2010
Balance at 31.12.09 Net
Gross amount Accumulated Depreciation Write-offs amount at
(amount in euros) depreciation Acquisitions for period (net) 31.12.10
Property:
For own use 16,200,020 (3,656,331) - (479,428) - 12,064,261
Other property 77,843 (77,843) - - - -
Equipment:
IT equipment 1,775,535 (1,623,691) 223,232 (213,721) (697) 160,658
Interior installations 1,811,695 (1,754,948) - (14,087) - 42,659
Furniture and materials 1,543,740 (1,127,623) 1,114 (76,928) - 340,304
Plant and machinery 573,069 (477,571) - (26,027) - 69,471
Transport material 148,836 (77,124) - (30,565) - 41,147
Other equipment 1,214 (412) - - - 802
Security equipment 240,087 (240,087) - - - -
Property leases:
Transport material 351,750 (281,400) - - (70,350) -
IT equipment - - 17,262 (5,754) - 11,508
22,723,790 (9,317,030) 241,608 (846,510) (71,047) 12,730,810
13. INTANGIBLE ASSETS
Information on movements in the “intangible assets” account headings for the years 2011 and 2010 is set out
below:
(amount in euros)
2011
Balance at 31.12.10Acquisitions Transfers Adjustments
Depreciation for period
Net amount at31 December
2011Gross
amountAccumulated depreciation
Automatic data processing systems 4,233,175 (4,150,911) 335,954 332,200 - (221,817) 528,602
Intangible assets in progress 437,392 - 161,556 (332,200) (5,452) - 261,296
4,670,567 (4,150,911) 497,510 - (5,452) (221,817) 789,897
(amount in euros)
2010
Balance at 31.12.09Acquisitions
Depreciation for period
Net amount at31.12.10Gross
amountAccumulated depreciation
Automatic data processing systems 4.171.052 (3.979.309) 62.123 (171.602) 82.265
Intangible assets in progress 258.193 - 179.199 - 437.392
4.429.245 (3.979.309) 241.322 (171.602) 519.656

Annual Report – 2011
94
Intangible assets in progress, at 31 December 2011 and 2010, comprised expenses incurred on the acquisition of
software not yet in use at the said dates.
14. INCOME TAX
Deferred tax assets and liabilities balances, at 31 December 2011 and 2010, were:
(amount in euros) 2011 2010
Current tax assets
Income tax to be recovered
Current year 15,134,689 9,939,146
Past years 8,399,709 657,900
23,534,398 9,597,046
Current tax liabilities
Income tax payable (2,150,156) (257,589)
21,384,242 9,339,457
Deferred tax assets 60,383,503 29,036,888
Deferred tax liabilities (2,831,370) (2,700,360)
57,552,133 26,336,528
At 31 December 2011, the “Income tax to be recovered” heading included €951,974 in respect of a claim made by
the Bank on its IRC for 1999, which was received in January 2012.
The “income tax to be recovered” account heading, at 31 December 2010, included €657,900 in respect of a
claim made by the Bank on its IRC for 2000 which was received in December 2011.
The following table provides details and information on deferred tax movements in 2011 and 2010:
2011
(amounts in euros) Balance at
31.12.10Change in income
Change in shareholders’
equity
Balance at31.12.2011
Commissions 9,095,196 (3,902,877) - 5,192,320
Valuation of available for sale financial assets 8,419,308 - 22,550,943 30,970,251
Impairment and provisions not accepted for fiscal purposes 7,096,433 12,293,889 - 19,390,321
Fiscal benefits - venture capital (Note 2.11) 1,890,001 110,000 - 2,000,001
Impairment of available for sale financial assets 271,636 8,880 - 280,516
Deferral of capital gains tax on the disposal of financial investments (Note 2.11) (247,290) 148,269 - (99,022)
Property revaluations not accepted for fiscal purposes (188,755) 6,502 - (182,253)
26,336,528 8,664,663 22,550,943 57,552,134

Annual Report – 2011
95
2010
Change Rate change
(amounts in euros) Balance at
31.12.09Income
Shareholders’ equity
IncomeShareholdes’
equityBalance at31.12.2010
Commissions 8,071,278 385,143 - 638,775 - 9,095,196
Valuation of available for sale financial assets 445,030 - 7,330,747 - 643,531 8,419,308
Impairment and provisions not accepted for fiscal purposes 9,011,701 (2,748,808) - 833,540 - 7,096,433
Fiscal benefits - Venture capital (Note 2.11) 1,081,401 808,600 - - - 1,890,001
Impairment of available for sale financial assets 230,231 18,479 - 22,926 - 271,636
Deferral of capital gains tax on the disposal of financial investments (Note 2.11) (395,559) 148,269 - - - (247,290)
Property revaluations not accepted for fiscal purposes (178,423) 6,080 - (16,412) - (188,755)
Revaluation of derivative financial instruments 150,185 (150,185) - - - -
Valuation of other assets at fair value through profit or loss (10,863) 10,863 - - - -
Value adjustments to hedged assets (123,250) 123,250 - - - -
18,281,730 (1,398,309) 7,330,747 1,478,829 643,531 26,336,528
The group does not recognise deferred tax assets whenever the existence of future taxable income allowing their
respective use is not probable. Accordingly and taking future taxable profit and the limit defined by article 92 of
the IRC Code into account, at 31 December 2011 and 2010 the deferred tax assets not registered by Caixa
Capital totalled €1,186,732 and €892,695, respectively.
Information on tax on profit recognised in the income statement and the tax burden, measured by the ratio
between the appropriation for tax on profit and net profit for the year before tax is set out below:
(amounts in euros) 2011 2010
With an impact on Income for period
Current year tax
IRC for period 2,674,129 13,659,346
Banking sector contribution 677,236 -
Adjustments for past years ( 906,775 ) 31,853
2,444,590 13,691,199
Deferred tax
Registration and reversal of temporary differences ( 8,664,663 ) ( 80,520 )
Total tax in income statement ( 6,220,073 ) 13,610,679
Income before tax and non-controlling interests 2,372,734 53,271,806
Fiscal burden ( 262,19% ) 25,55%
With an impact in reserves
Deferred tax – fair value reserve 22,550,943 7,974,278
Current year tax – Capital gains on treasury shares (Note 21) - 3,913,114
Current year tax 23,400 182,320
Total tax in reserves 22,574,343 12,069,712
Total tax in shareholders’ equity 16,354,270 25,680,391
Current tax reflected in reserves for the amount of €23,400 and €182,320 in 2011 and 2010, refers to the tax
associated with the revaluation of debt securities sold in 2011 and 2010 and classified as available for sale
financial assets in the year, for the purposes of assessing tax income for past years. The deferred tax recognised
in the same account heading refers to the revaluation during the year of equity investments and debt securities
which are also classified as available for sale financial assets, whose fiscal effects will only be produced at the
time of disposal.

Annual Report – 2011
96
The following is an analysis of the reconciliation between the nominal tax rates in 2011 and 2010:
2011 2010
(amounts in euros) Rate Amount Rate Amount
Income before tax and non-controlling interests 2.372.734 53.271.806
Tax assessment based on nominal rate 26.50% 628,775 26.50% 14,117,029
State surcharge 4.14% 98,204 2.41% 1,281,795
Total tax 726,979 15,398,824
Fiscal loss allocated by Economic Interest Grouping (10.13%) (240,330) (0.51%) (272,561)
Impact of tax regime on the activity of
Madeira Offshore Branch (Note 2.11) (3.95%) (93,834) (5.85%) (3,118,987)
Elimination of double taxation 44.25% 1,050,037 (0.33%) (177,827)
Fiscal benefits (2.75%) (65,258) (0.02%) (9,182)
Capital gains on investments - tax regime applicable to
Caixa Capital and Caixa Desenvolvimento (64.72%) (1,535,714) (2.97%) (1,582,304)
Fiscal regime of FCR Energias Renováveis (4.94%) (117,221) 2.72% 1,449,122
Change in nominal tax rate - - (2.78%) (1,478,829)
Banking sector contribution 28.54% 677,236 - -
Fiscal capital gains (15.02%) (356,498) (0.95%) (504,552)
Provisions and impairment not relevant for fiscal purposes 25.49% 604,828 7.13% 3,800,172
Separate source-based taxation 4.42% 104,990 0.20% 105,693
Recognition of deferred tax on Madeira Offshore Branch (249.71%) (5,924,937) - -
Adjustments for past years (38.22%) (906,775) 0.20% 31,853
Other (6.05%) (143,578) 0.00% (30,742)
(262.15%) (6,220,073) 25.75% 13,610,679
For the year ended 31 December 2011, the Bank recognised deferred tax on provisions temporarily not accepted
for fiscal purposes on loans made by the offshore branch given the end of the fiscal benefit for this branch starting
1 January 2012.
In conformity with current legislation, tax returns are subject to review and correction by the tax authorities for a
period of four years. The Bank’s tax returns for 2008 - 2011 are therefore still subject to review and the possibility
of correction.
The board of directors considers that any correction is unlikely to have a significant impact on the financial
statements, at 31 December 2011.
Banking sector contribution
With the publication of Law 55 - A/2010, of 31 December, the Bank was covered by the banking sector
contribution regime. The banking sector contribution is levied on:
a) The liabilities assessed and approved by the taxpayers less basis (Tier 1) and complementary (Tier 2) own
funds and the deposits covered by the Deposit Guarantee Fund. The following are deducted from liabilities:
Elements which, according to the applicable accounting standards are recognised as shareholders’ equity;
Liabilities associated with the recognition of responsibilities for defined benefits plans;
Liabilities for provisions;
Liabilities resulting from the revaluation of derivative financial instruments;
Deferred income, without considering income related to borrowing operations and;
Liabilities for non-derecognised assets in securitisation operations.

Annual Report – 2011
97
b) The notional amount of the off-balance sheet derivative financial instruments assessed by the taxpayers
except for financial hedge derivatives or whose risk positions balance each other out.
The rates applicable to the bases defined in the preceding sub-paragraphs a) and b) are 0.05% and 0.00015%,
respectively, based on the amount assessed.
The Bank has posted the banking sector contribution to the “current year tax” account heading in the income
statement.
15. OTHER ASSETS
This account heading comprises the following:(amounts in euros) 2011 2010
Debtors and other investments
Debtors - futures trading 5,786,015 2,878,717
Other debtor balances acquired as part of the liquidation of FCR PME (Note 19) 2,066,139 2,460,889
Acquisition of investments – Banif CVC 44,419 22,721
Amount receivable on the sale of Manuel Inácio & Filhos, S.A. - 11,629,371
Amount receivable on the sale of Barraqueiro:
Capital - 3,563,606
Interest receivable - 54,899
Other partners’ loans (Note 8) - 621,804
Miscellaneous debtors
Interest pending settlement 3,566,294 1,619,240
Other 14,185,244 8,250,313
25,648,111 31,101,560
Other assets 48,846 48,846
Income receivable
Other income receivable 251,184 92,845
Deferred expenses
Insurance 29,779 31,003
Operational leasing instalments 3,812 3,812
Other deferred expenses 628,454 875,569
662,045 910,384
Prepayments and accrued income
Securities operations pending settlement 51,649,724 17,129,822
Other lending operations pending settlement 524,551 1,386,505
52,174,276 18,516,327
Overdue credit and interest 5,194,556 4,980,338
83,979,017 55,650,300
Impairment (Note 29) ( 8,532,316 ) ( 17,165,477 )
75,446,700 38,484,823
The “debtors - futures trading” account heading at 31 December 2011 and 2010 comprises the futures margin
account.
In July 2010 the Bank acquired 50% of the capital of CGD – Participações em Instituições Financeiras, Ltda.
(CGD Participações), for the amount of €22,721 with the remaining 50% of the capital being held by Banco Caixa
Geral Brasil. This vehicle was set up to acquire 70% of the share capital of Banif Corretora de Valores e Câmbio,
S.A. (Banif CVC) for the amount of 123.9 million reais (€51.3 million at 31 December 2011), as provided for in the
agreement entered into on 2 June 2010. The Bank, in 2011, paid up the capital increase agreed in 2010 for the
amount of 50,000 reais (€21,698), with 65,013,200 reais (€26,910,551) of capital to be paid by CGD
Participações remaining. In February 2012 23,750,000 reais (€10,409,818) was paid up.
The definitive contract for the acquisition of Banif CVC was signed on 6 February 2012.

Annual Report – 2011
98
The shareholders’ agreement of Banif Corretora de Valores e Câmbio entered into on the same date considers
the following options:
Put option on Banif Banco de Investimento (Brasil), S.A. (Banif) to CGD Participações, at the exclusive
discretion of Banif, in the period between the 12th and 60th month from the date of the signing of the shares
sales/purchase contract of 2 June 2010. The price will vary on the basis of the net profit for the period up to
the date upon which the option is realised.
Call option on Banif by CGD Participações at the exclusive discretion of CGD Participações, starting from
the 60th month after the signing of the shares sales/purchase contract of 2 June 2010. The price will vary on
the basis of the net profit for the period up to the date upon which the option is realised.
At 31 December 2011, the “miscellaneous debtors – other” account heading refers to the amount of the
cancellation of a swap taken out with the Bank and the already processed costs incurred thereon for the amount
of €7,580,458. The risk of this operation was fully assumed by Banco Caixa Geral Brasil, S.A. (BCG Brasil) under
a “Risk Investment Agreement”. At 31 December 2011, the Bank posted a liability on behalf of BCG Brasil for the
same amount (Note 19).
The “miscellaneous debtors - other” account heading at 31 December 2011 and 2010 includes €3,337,675 and
€3,305,441 in amounts receivable from customers for the invoicing of services provided by the Bank.
The “other deferred expenses” account heading, at 31 December 2011 and 2010 includes €395,040 and
€542,104, respectively, made on account of the investment in Agrupamento Complementar de Companies TREM
II – Aluguer de Material Circulante, ACE (TREM II).
In April 2009, the group exercised its sales option on Manuel Inácio & Filhos, S.A. shares as provided for by the
shareholders’ agreement. The amount receivable, calculated using the methodology provided for in this
agreement totalled €11,629,371. As a result of this operation, the company (i) transferred potential capital losses
of €1,875,000 which had been recognised in the investment to impairment on debtors and other investments and
(ii) recognised capital gains of €7,878,971 over the cost price in the “income from assets and liabilities at fair
value through profit or loss” account heading which was fully offset by the same amount of impairment recognised
in accounts receivable. It was agreed with the promoting shareholders of Manuel Inácio & Filhos in December
2010 that an amount of €1,666,667 would be received. At the same date an addendum to the contract for the
purchase and sale of shares under which the company sold the investment to the Fundo de Recuperação was
signed. In 31 December 2010, the group adjusted the impairment on the basis of the amount receivable from the
proceeds of such operations. The amount was liquidated in February 2012.
At 31 December 2010, the amount of €3,563,606 refers to the amount receivable as part of the disposal in June
2002 of Caixa Desenvolvimento’s investment in Barraqueiro, SGPS, S.A. Based on the initial agreement and
subsequent addenda, an amount of €3,563,606 was liquidated in 2010 and 2011, with the whole amount of the
debt having been paid off at 31 December 2011.
At 31 December 2010, the “partners’ loans” account heading comprised partners’ loans to MWH – Gestão de
Recursos Naturais, S.A., with interest payable at a Euribor-indexed rate.
The “securities operations pending settlement” account heading, at 31 December 2011 and 2010, comprises the
value of the operations for the sale of securities at the end of the year and settled in the first few days of the
following year.
At 31 December 2011 and 2010, the “overdue credit and interest” account heading included overdue loans of
€3,551,441, originated in Caixa Valores and deriving from securities trading operations in 1992 by a group of
customers. Impairment for the same amount has been allocated to this credit.

Annual Report – 2011
99
Caixa Valores took legal action against the group of customers in September 1994, accusing them of
responsibility for realising the referred to operations and claiming an amount of €6,003,180 plus interest accruing
since June 1993. As the action is still in progress, the Bank has not recorded any asset related with this situation.
Information on “impairment” at 31 December 2011 and 2010, is set out below:
(amounts in euros) 2011 2010
Debtors
Caixa Valores 3,551,441 3,551,441
Overdue credit and interest 2,222,348 1,397,195
Overdue interest on Interest rate swaps 664,701 757,507
Amount receivable on the sale of Manuel Inácio & Filhos, S.A. - 8,829,371
Other 2,093,826 2,629,963
8,532,316 17,165,477
Impairment on overdue invoices and bad and doubtful debts at 31 December 2011 is recognised in the
“impairment of credit” account heading (Note 11).
16. OTHER CREDIT INSTITUTIONS’ AND CENTRAL BANKS’ RESOURCES
This account heading comprises the following:
(amounts in euros) 2011 2010
Central banks’ resources
Term deposits 232,000,000 330,000,000
Credit institutions’ resources in Portugal
Very short term resources 435,916,145 470,228,074
Term deposits 318,900,000 327,390,000
Sight deposits 282,710 136,228
Credit institutions’ resources abroad
Sight deposits 1,230 405,571
987,100,085 1,128,159,873
Interest payable 8,390,967 983,969
995,491,052 1,129,143,842
Information on the periods to maturity of other credit institutions’ resources is set out below:
(amounts in euros) 2011 2010
Sight deposits and overdrafts 283,940 541,799
Up to three months 804,516,145 1,101,818,074
Three months to three years 7,300,000 25,800,000
More than three years 175,000,000 -
987,100,085 1,128,159,873
The “central banks’ resources” account heading at 31 December 2011 comprises term deposits with the Bank of
Portugal, as collateral for European Central Bank funding. These deposits are collateralised by a pledge on
securities with a nominal value of €399,275,000 and €377,321,000 respectively at 31 December 2011 and 2010
(Note 18) with interest at the rate fixed by the European Central Bank.

Annual Report – 2011
100
17. CUSTOMER RESOURCES AND OTHER LOANS
This account heading comprises the following:
(amounts in euros) 2011 2010
Deposits
Sight 37,843,824 54,613,176
Term 73,967,420 47,868,716
111,811,244 102,481,892
Value adjustments related to hedged liabilities (Note 10) 345,377 331,207
112,156,621 102,813,099
Interest payable on deposits 1,912,794 2,183,263
114,069,415 104,996,362
The following information is provided on deposits at 31 December 2011 and 2010 in accordance with their
respective period to maturity:
(amounts in euros) 2011 2010
Repayable on demand 37,843,824 54,613,176
Up to three months 60,468,100 34,292,700
Three months to one year 3,000,000 3,000,000
One to five years 5,000,000 5,000,000
More than five years 5,499,320 5,576,016
111,811,244 102,481,892
18. PROVISIONS AND CONTINGENT LIABILITIES
Provisions
Information on “provisions for other risks” movements in 2011 and 2010 is set out below:
2011
(amounts in euros) Balance at
31.12.10
Net provisions in income
statementUse
Balance at31.12.11
For other risks and liabilities:
Guarantees and commitments 581,456 424,644 - 1,006,100
Other risks 2,630,179 1,539,591 (38,287) 4,131,483
3,211,635 1,964,235 (38,287) 5,137,583
2010
(amounts in euros) Balance at
31.12.09
Net provisions in income
statementUse
Balance at31.12.10
For other risks and liabilities:
Guarantees and commitments 520,587 60,869 - 581,456
Other risks 13,609,267 (8,395,799) (2,583,290) 2,630,179
14,129,854 (8,334,930) (2,583,290) 3,211,635
Provisions for guarantees and commitments are calculated on the basis of the estimated losses associated
with operations in progress, in accordance with a separate analysis and Caixa Geral de Depósitos group
parameters.
Provisions for other risks and liabilities comprise the group’s best estimate of eventual amounts to be
expended on settling legal, fiscal and other contingencies.

Annual Report – 2011
101
Contingent liabilities and commitments
Contingent liabilities associated with banking activity are recognised in off-balance sheet account headings
as follows:
(amounts in euros) 2011 2010
Contingent liabilities:
Guarantees and sureties 54,478,484 55,471,419
Asset-backed guarantees
Available for sale financial assets (Note 9) 404,470,000 351,180,000
Financial assets at fair value through profit or loss (Note 8) 1,550,000 75,591,000
460,498,484 482,242,419
Commitments:
Revocable lines of credit 75,066,972 94,521,902
Securities subscriptions 7,921,679 62,511,679
Potential liability to Investors’ Indemnity System 4,188,207 1,722,312
Term liabilities to Deposit Guarantee Fund 162,182 162,182
87,339,040 158,918,075
(amounts in euros) 2011 2010
Liabilities for the provision of services:
Deposit and custody of securities 6,529,834,056 7,794,428,153
Amounts under bank management 418,551,972 394,732,086
6,948,386,028 8,189,160,239
The “assets-backed guarantee” account heading, at 31 December 2011 and 2010 comprises the nominal
value of debt securities pledged, by the Bank (Notes 8 and 9), in respect of the following situations:
(amounts in euros) 2011 2010
Pledge on securities in the “ECB assets pool” (Note 16) 399,275,000 377,321,000
Investors’ Indemnity System (SII) 3,830,000 2,500,000
Caixa Geral de Depósitos, S.A. – Euronext 2,500,000 2,500,000
Large transactions processing system (SPGT) - 44,200,000
Deposit Guarantee Fund 415,000 250,000
406,020,000 426,771,000
The object of the Deposit Guarantee Fund is to guarantee customers’ deposits in conformity with the limits
defined by the General Credit Institutions Regime. This takes the form of regular annual contributions. A part
of the said contributions takes the form of an irrevocable commitment to realise the respective contributions
when requested by the Fund. These amounts are not recognised in costs. The total value of commitments
assumed since 1996 totals €162,182.
The balance on the “amounts under bank management” account heading, at 31 December 2011 and 2010
comprises the value of the following venture capital funds managed by Caixa Capital, excluding outstanding
capital:
(amounts in euros) 2011 2010
Fund Value of Fund Net income Value of Fund Net income
FCR CGD Group – Caixa Capital 333,872,457 ( 11,705,789 ) 327,115,412 9,794,290
FCR Energias Renováveis - Caixa Capital 33,042,135 1,966,929 31,075,206 ( 3,017,725 )
FCR Mezzanine 29,337,161 ( 18,463 ) 29,355,624 ( 371,187 )
FCR FDR 14,320,712 ( 679,288 ) - -
FCR Empreender + 7,979,507 ( 1,706,338 ) 7,185,844 ( 169,845 )
418,551,972 394,732,086

Annual Report – 2011
102
19. OTHER LIABILITIES
This account heading comprises the following:
(amounts in euros) 2011 2010
Creditors and other resources
General government
Deduction of tax at source 4,306,577 4,963,292
Value added tax 711,335 689,183
Social security contributions 248,602 234,618
Interest and dividends payable 215,895 203,886
Outstanding capital (Note 9) - 86,621
Miscellaneous creditors
Banco Caixa Geral Brasil, S.A. (Note 15) 7,580,458 -
Investors’ Indemnity System (Note 26) 2,850,940 -
Cost price of assets acquired on liquidation of FCR PME 596,953 728,199
Creditors - securities operations 184,538 695,417
Suppliers of leased assets 7,812 12,356
Other suppliers 385,816 594,944
Other 1,202,453 418,526
18,291,379 8,627,042
Costs payable
Other costs payable
Additional remuneration 2,694,000 2,536,227
Holiday and holiday subsidies 916,492 1,692,290
Pension fund 339,097 432,954
Other 1,641,902 1,002,984
5,591,491 5,664,454
Deferred income
Agencying commissions 870,816 1,057,182
Commissions on the provision of guarantees and other contingent liabilities 3,612 6,315
874,428 1,063,497
Other accruals and deferred income accounts
Securities operations pending settlement 49,914,220 17,084,385
Lending operations pending settlement
Commissions payable - syndicated credit operations 17,904,545 32,381,592
Other 496,371 1,067,146
68,315,136 50,533,123
93,072,434 65,888,116
The balance on the “creditors - securities operations” account heading at 31 December 2011 and 2010, refers to
the current accounts of brokerage operations customers.
The “securities operations pending settlement” account heading at 31 December 2011 and 2010, comprises the
value of securities purchase operations at the end of the year and settled in the first few days of the following
year.
The “commissions payable - syndicated loan operations” account heading at 31 December 2011 and 2010,
comprises amounts charged to customers for the structuring of syndicated loan operations in which CGD Group
supplies all or a significant part of the loan with the latter objective of placing it with other credit institutions. As
described in Note 2.14, the Bank recognises the part of the commissions received in proportion to the total
amount of credit the group intends to syndicate in this account heading.

Annual Report – 2011
103
Information is provided below on the value of the assets acquired from the winding up and liquidation of FCR
PME at 31 December 2011 and 2010:
(amounts in euros) 2011 2010
Other assets (Note 15):
Debtors 2,099,459 2,460,729
Amounts received but still not transferred 50,000 7,476
2,149,459 2,468,205
Impairment ( 1,552,506 ) ( 1,740,006 )
596,953 728,199
The amount spent on the acquisition of assets will be settled as the corresponding assets are received. According
to the contracts entered into, the differences between the amounts of the disposal of investments and the debtor
balances and those realised by the group should be paid or retuned by the fund’s investors.
20. SUBSCRIBED CAPITAL AND TREASURY SHARES
Subscribed capital comprises 81,250,000 shares with a nominal value of €1 each.
Information on the Bank’s equity structure, at 31 December 2011 and 2010, is set out below:
No. Shares %
Gerbanca, SGPS, S.A. 81,016,231 99.7
Other 233,769 0.3
81,250,000 100.0
The Bank owned 4,658,000 of its own shares at a cost price of €5,999,453, at 31 December 2009.
The Bank disposed of its treasury shares in June 2010 at €5 each, for €23,290,000 making accounting gains of
€13,377,432, net of tax of €3,913,114 (Note 14), recognised in retained earnings.
21. RESERVES, RETAINED EARNINGS AND PROFIT FOR YEAR
The composition of the reserves and retained earnings account headings at 31 December 2011 and 2010, was as
follows:
(amounts in euros) 2011 2010
Fair value reserves
Potential gains
Debt instruments ( 113,764,751 ) ( 35,385,271 )
Shares and investment units 13,986,441 12,757,830
Other equity instruments ( 6,160,983 ) ( 5,440,244 )
( 105,939,293 ) ( 28,067,685 )
Fiscal effect
Current year tax 1,342,997 1,319,597
Deferred tax 30,970,251 8,419,308
( 73,626,045 ) ( 18,328,780 )
Other reserves and retained earnings
Legal reserve 46,758,852 42,198,539
Free reserve 87,814,071 60,371,309
Legal revaluation reserve 4,338,403 4,338,403
Retained earnings 54,843,086 61,692,880
193,754,412 168,601,131
Profit for period 8,552,996 40,153,282
128,681,363 190,425,632

Annual Report – 2011
104
Legal reserve
In conformity with Decree Law 298/92 of 31 December, changed by Decree Law 201/2002 of 26 September, the
Bank is required to set up a legal reserve fund until equal to its share capital or sum of free reserves and retained
earnings, if higher, annually transferring an amount of not less than 10% of net profits to the reserve.
The reserve may only be used to cover accrued losses or for share capital increases. The above referred to
amount comprises the full amount of the legal reserve registered by the group. The value of the legal reserve
registered by the Bank at 31 December 2011 and 2010 totalled €45,344,162 and €40,783,849 respectively.
Legal revaluation reserve
The Bank revalued its fixed assets in 1998, under Decree Law 31/98 of 11 February. The increase of €4,338,403,
in the net value of the fixed assets was recognised in the “revaluation reserves” account heading in the separate
accounts.
Revaluation reserves may only be used to cover accrued losses or for share capital increases.
Fair value reserves
The fair value reserve recognises potential capital gains and losses on available for sale financial assets, net of
the corresponding fiscal effect.
Dividends
A resolution was passed at the shareholders’ meeting of 20 May 2011, to distribute €15,000,000 in dividends for
2010.
Profit for year
Information on the Bank’s consolidated net income for 2011 and 2010 is set out below:
(amounts in euros) 2011 2010
Bank’s separate net income (statutory accounts) 1,464,516 45,603,129
Subsidiaries’ contribution (statutory accounts)
Caixa Capital 5,148,225 4,862,655
Caixa Desenvolvimento 31,433 661,202
FCR Energias Renováveis – Caixa Capital 1,789,905 ( 2,746,130 )
CaixaBI Brasil – Serviços de Assessoria Financeira, Ltda. 2,136,829 -
9,106,392 2,777,727
Cancellation of dividends paid by the Bank to Caixa Desenvolvimento ( 2,500,000 ) ( 7,000,000 )
Impact of conversion of separate accounts to IFRS:
Valuation of subsidiaries by Caixa Capital 756,374 991,495
Valuation of subsidiaries by FCR Energias Renováveis - Caixa Capital ( 1,387,374 ) ( 2,230,101 )
Impairment on lending 1,113,087 11,032
Consolidated net income 8,552,996 40,153,282
According to the accounting policies applicable to the sector, Caixa Capital and FCR Energias Renováveis
recognise the valuation of all of their investments in the income statement. These valuations are recognised in the
fair value reserve in the case of “available for sale financial assets” in the group’s consolidated accounts.
22. NON-CONTROLLING INTERESTS
At 31 December 2011 and 2010, this account heading was fully made up of the non-controlling interests
comprising 9% of the investment units of FCR Energias Renováveis. In 2011 and 2010, the part of the profit/(loss)
assessed by FCR Energias Renováveis attributed to non-controlling interests totalled €39,811 and (€492,155),
respectively.

Annual Report – 2011
105
23. INTEREST AND INCOME AND INTEREST AND SIMILAR CHARGES
These headings comprise the following:
(amounts in euros) 2011 2010
Interest and similar income:
Interest on investments in credit institutions In Portugal 582,566 374,217
Interest on investments in credit institutions abroad 484,230 -
Interest on domestic loans 14,532,803 10,726,478
Interest on foreign loans 11,595,666 9,330,670
Interest on financial assets held for trading:
Securities 4,058,409 9,688,399
Derivative instruments – swaps 284,819,060 231,859,582
Interest rate guarantee contracts 554,735 21,292
Interest on other financial assets at fair value through profit or loss
Securities 419,709 631,198
Interest on available for sale financial assets 17,441,519 9,282,190
Interest on hedge derivatives 379,974 335,694
Interest on debtors and other investments
Debtors 175,005 251,755
Partners’ loans 411 22,231
Interest on liquid assets 44,861 33,234
Other Interest 179,019 30,356
335,267,967 272,587,296
Commissions received associated with amortised cost 1,000,634 821,638
336,268,601 273,408,934
Interest and similar costs:
Interest on deposits
General government 163,631 131,687
Other resident entities 2,475,582 927,879
Other non-resident entities - 166,242
2,639,213 1,225,808
Interest on central banks’ resources 2,948,338 1,233,861
Interest on credit institutions’ resources in Portugal 18,962,890 8,391,933
Interest on credit institutions’ resources abroad 3,030 251,212
Interest on financial liabilities held for trading
Swaps 281,708,242 228,230,808
Interest on hedge derivatives 713,233 745,797
Other interest and similar costs 241,732 16,702
304,577,465 238,870,313
307,216,678 240,096,121

Annual Report – 2011
106
24. INCOME AND COSTS ON SERVICES AND COMMISSIONS
These headings comprise the following:
(amounts in euros) 2011 2010
Income from services and commissions
For services provided
Structuring of operations 21,714,993 25,800,539
Venture capital funds management (Caixa Capital) 6,749,445 5,806,566
Deposit and custody of securities 892,816 976,608
Other 14,466,677 15,885,668
For operations realised on behalf of third parties 4,098,679 5,994,485
For guarantees provided 801,924 777,247
For commitments to third parties 141,102 135,927
Other 18,760,303 30,578,462
67,625,939 85,955,502
Costs of services and commissions
For banking services provided by third parties 3,505,162 10,577,365
For operations performed by third parties 1,254,360 1,600,952
Commissions for operations on financial instruments 66,452 50,549
For guarantees received 1,047 5,101
Other 1,005,902 9,291
5,832,923 12,243,258
The “income from services and commissions – other ” account heading for 2011 and 2010, essentially includes
financial advisory commissions. The “costs of services and commissions – for banking services provided by third
parties” account heading included €3,461,662 and €8,634,475, respectively, relating to commissions to be passed
on to other credit institutions in future syndications in accordance with the policy described in Note 2.14.

Annual Report – 2011
107
25. INCOME FROM FINANCIAL OPERATIONS
These headings comprise the following:
(amounts in euros) 2011 2010
Foreign exchange income
Revaluation of foreign exchange position 285,391 259,434
Income from the disposal of loans and advances to customers
Loans and advances to customers (Note 11) ( 960,690 ) -
Income from assets and liabilities held for trading
Equity instruments ( 664,224 ) 16,774,887
Debt instruments ( 4,263,012 ) ( 10,461,822 )
Derivative instruments
Equity swaps - ( 17,101,307 )
Futures ( 2,760,516 ) ( 9,152,905 )
Interest rate swaps ( 26,691,885 ) 141,252
Options ( 3,560 ) 26,898
Interest rate guarantee contracts 131,614 12,243
Other - 21,989
( 34,251,583 ) ( 19,738,765 )
Income from other financial assets at fair value through profit or loss
Debt instruments ( 755,371 ) ( 508,214 )
Equity instruments - 8,998
( 755,371 ) ( 499,216 )
Income from available for sale financial assets
Debt instruments 2,460,085 2,398,651
Equity instruments 1,468,884 465,712
3,928,969 2,864,363
Income from hedge operations
Interest rate swaps 75,306 171,965
Income from other financial operations
Value adjustments to hedged assets and liabilities ( 63,144 ) ( 147,462 )
Other ( 661 ) ( 843 )
( 63,805 ) ( 148,305 )
( 31,741,783 ) ( 17,090,524 )
Information on income from equity instruments classified as available for sale financial assets in 2011 and 2010 is
set out below (Note 9):
(amounts in euros) 2011 2010
Income from available for sale financial assets
EDP Renováveis, S.A. 2,121,661 94,668
Fomentinvest SGPS, S.A. - 1,561,158
2,121,661 1,655,826
Losses on available for sale financial assets
Banco Espírito Santo, S.A. ( 652,777 ) -
Martifer SGPS, S.A - ( 1,177,787 )
Caixa Geral Finance Limited - ( 12,327 )
( 652,777 ) ( 1,190,114 )
1,468,884 465,712

Annual Report – 2011
108
26. OTHER OPERATING INCOME
These headings comprise the following:
(amounts in euros) 2011 2010
Other operating income
Staff on loan – CGD Group 907,236 1,073,416
Provision of miscellaneous services 519,818 541,811
Reimbursement of expenses 273,713 331,446
Income from non-financial assets:
Other tangible assets 1,980 -
Other 1,859,556 415,827
3,562,303 2,362,500
Other operating costs
Tax
Indirect taxes
Rates 84,901 84,464
Stamp duty 213 1,771
Tax on road transport 614 1,072
Other 34 -
Direct taxes
Other tax 503,700 233,938
589,462 321,245
Contributions to Investors’ Indemnity System (Note 19) 2,850,940 -
Staff on loan – CGD Group 403,857 -
TREM II 147,064 166,787
Donations and subscriptions 33,036 32,496
Contributions to Deposit Guarantee Fund 27,096 17,500
Losses on tangible assets - 397
Other 29,820 215,385
3,491,813 432,565
4,081,275 753,810
Other operating income (net) ( 518,972 ) 1,608,690
The Bank, in 2011, posted €2,850,940 relative to an extraordinary contribution to the Investors’ Indemnity System.
At 31 December 2011, this amount had still not been liquidated (Note 19) and was liquidated in January 2012.
CaixaBI took special administrative proceedings against the Investors’ Indemnity System, pursuant to which it
applied for the cancellation of the resolution of the Management Committee of the Investors’ Indemnity System,
and consequent return of amounts paid plus interest starting from the time of effective payment, or subsidiarily, a
partial cancellation of the referred to resolution and consequent return of the excess amount paid plus interest
starting from the time of the respective payment.
27. EMPLOYEE COSTS
This account heading comprises the following:
(amounts in euros) 2011 2010
Remuneration paid to board of directors and inspection bodies 1,041,362 1,892,376
Remuneration paid to employees 11,000,308 12,318,320
12,041,670 14,210,696
Mandatory social costs:
Costs of remuneration 2,042,061 2,184,873
Pension costs (Note 2.13) 290,391 436,464
Other mandatory social costs 90,548 110,958
2,423,000 2,732,295
Other employee costs 788,160 432,294
15,252,830 17,375,285

Annual Report – 2011
109
The average number of staff employed by the Bank and its subsidiaries in 2011 and 2010, excluding the board of
directors and inspection bodies was 178 and 181, respectively, distributed as follows:
2011 2010
Senior management 79 81
Technical and line management 77 79
Administrative and auxiliary staff 22 21
178 181
28. OTHER ADMINISTRATIVE EXPENSES
This account heading comprises the following:
(amounts in euros) 2011 2010
Specialised services 4,109,365 6,157,395
Maintenance and repairs 1,148,440 1,085,209
Rents and leases 991,669 1,016,275
Travel and expenses 835,931 747,205
Communications 488,057 444,954
Advertising and publications 467,975 608,310
Water, power and fuel 125,402 127,852
Consumables 101,875 103,905
Publications 57,915 53,315
Staff training 52,876 75,750
Insurance 5,750 31,878
Other third party services 86,636 124,514
Other third party supplies 45,091 47,578
8,516,892 10,624,140
Information on the minimum payments of operational leases on transport and computer equipment at 31
December 2011 and 2010 is set out below:
(amounts in euros) 2011 2010
Up to 1 year 634,453 744,261
Between 1 and 5 years 787,141 897,405
29. IMPAIRMENT
Information on impairment movements in 2011 and 2010 is set out below:
2011
(amounts in euros) Balance at31.12.10
Net provisions in income statement
UseExchange differences
TransfersBalance at31.12.11
Investments in credit institutions (Note 7) - - - 120.600 120.600
Loans and advances to customers (Note 11) 45,750,454 24,153,856 (3,065,581) 50,039 1,292,229 68,180,997
Debtors and other investments (Note 15) 17,165,477 1,816,903 (9,037,235) - (1,412,829) 8,532,316
Available for sale assets (Note 9)
Debt instruments - 3,961,150 - - - 3,961,150
Equity instruments 11,755,144 9 (8,291,869) 61,244 - 3,524,528
11,755,144 3,961,159 (8,291,869) 61,244 - 7,485,678
74,671,074 29,931,918 (20,394,685) 111,283 - 84,319,590
2010
(amounts in euros) Balance at31.12.09
Net provisions in income statement
UseExchange differences
Transfers OtherBalance at31.12.10
Loans and advances to customers (Note 11) 37,938,559 7,282,901 (1,251,345) 110,925 1,669,414 - 45,750,454
Debtors and other investments (Note 15) 17,956,869 826,481 - - (1,669,414) 51,541 17,165,477
Available for sale assets (Note 9) 5,438,408 9,881,783 (3,700,809) 135,762 - - 11,755,144
61,333,835 17,991,165 (4,952,154) 246,687 - 51,541 74,671,074
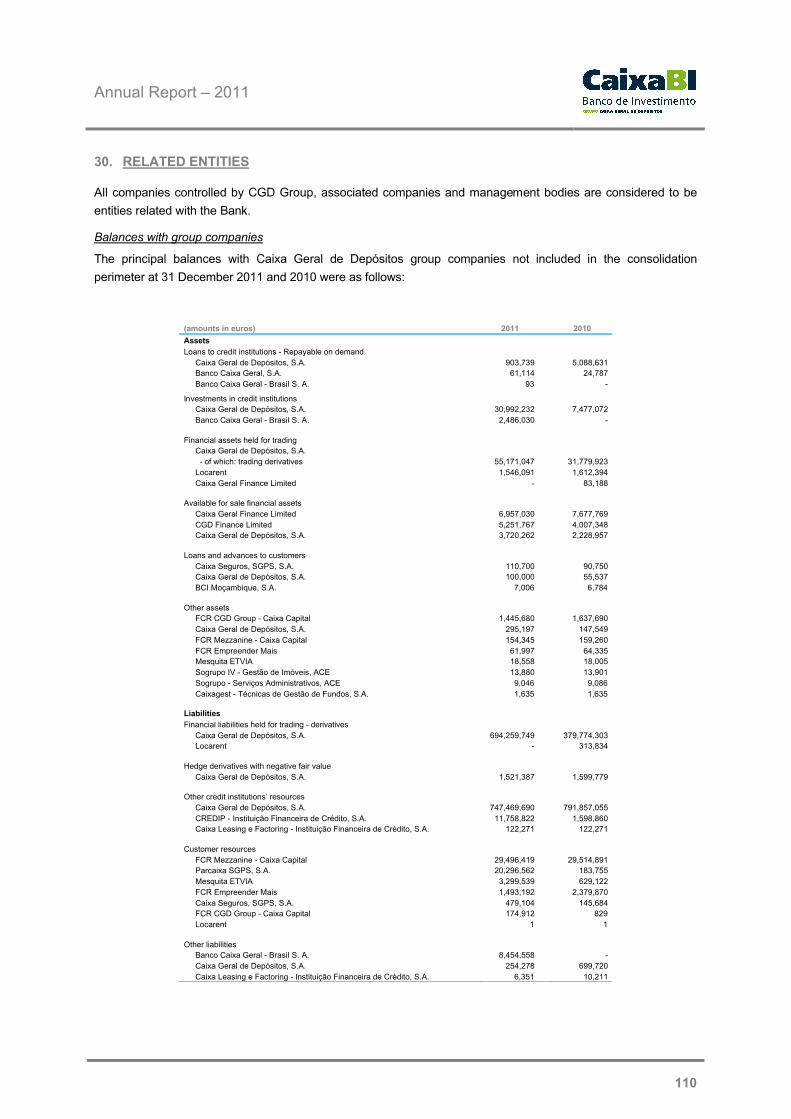
Annual Report – 2011
110
30. RELATED ENTITIES
All companies controlled by CGD Group, associated companies and management bodies are considered to be
entities related with the Bank.
Balances with group companies
The principal balances with Caixa Geral de Depósitos group companies not included in the consolidation
perimeter at 31 December 2011 and 2010 were as follows:
(amounts in euros) 2011 2010
Assets
Loans to credit institutions - Repayable on demand
Caixa Geral de Depósitos, S.A. 903,739 5,088,631
Banco Caixa Geral, S.A. 61,114 24,787
Banco Caixa Geral - Brasil S. A. 93 -
Investments in credit institutions
Caixa Geral de Depósitos, S.A. 30,992,232 7,477,072
Banco Caixa Geral - Brasil S. A. 2,486,030 -
Financial assets held for trading
Caixa Geral de Depósitos, S.A.
- of which: trading derivatives 55,171,047 31,779,923
Locarent 1,546,091 1,612,394
Caixa Geral Finance Limited - 83,188
Available for sale financial assets
Caixa Geral Finance Limited 6,957,030 7,677,769
CGD Finance Limited 5,251,767 4,007,348
Caixa Geral de Depósitos, S.A. 3,720,262 2,228,957
Loans and advances to customers
Caixa Seguros, SGPS, S.A. 110,700 90,750
Caixa Geral de Depósitos, S.A. 100,000 55,537
BCI Moçambique, S.A. 7,006 6,784
Other assets
FCR CGD Group - Caixa Capital 1,445,680 1,637,690
Caixa Geral de Depósitos, S.A. 295,197 147,549
FCR Mezzanine - Caixa Capital 154,345 159,260
FCR Empreender Mais 61,997 64,335
Mesquita ETVIA 18,558 18,005
Sogrupo IV - Gestão de Imóveis, ACE 13,880 13,901
Sogrupo - Serviços Administrativos, ACE 9,046 9,086
Caixagest - Técnicas de Gestão de Fundos, S.A. 1,635 1,635
Liabilities
Financial liabilities held for trading - derivatives
Caixa Geral de Depósitos, S.A. 694,259,749 379,774,303
Locarent - 313,834
Hedge derivatives with negative fair value
Caixa Geral de Depósitos, S.A. 1,521,387 1,599,779
Other credit institutions’ resources
Caixa Geral de Depósitos, S.A. 747,469,690 791,857,055
CREDIP - Instituição Financeira de Crédito, S.A. 11,758,822 1,598,860
Caixa Leasing e Factoring - Instituição Financeira de Crédito, S.A. 122,271 122,271
Customer resources
FCR Mezzanine - Caixa Capital 29,496,419 29,514,891
Parcaixa SGPS, S.A. 20,296,562 183,755
Mesquita ETVIA 3,299,539 629,122
FCR Empreender Mais 1,493,192 2,379,870
Caixa Seguros, SGPS, S.A. 479,104 145,684
FCR CGD Group - Caixa Capital 174,912 829
Locarent 1 1
Other liabilities
Banco Caixa Geral - Brasil S. A. 8,454,558 -
Caixa Geral de Depósitos, S.A. 254,278 699,720
Caixa Leasing e Factoring - Instituição Financeira de Crédito, S.A. 6,351 10,211

Annual Report – 2011
111
Transactions with group companies
The principal balances in Caixa Geral de Depósitos, S.A.’s income statement for group companies not included in
the consolidation perimeter, at 2011 and 2010, are set out below:
(amounts in euros) 2011 2010
Net interest income
Caixa Geral de Depósitos, S.A. (114,851,412) (107,793,303)
- of which: financial assets held for trading 88,824,055 (99,543,138)
- of which: available for sale financial assets 107,256 204,142
- of which: hedge derivatives (460,722) (555,511)
FCR CGD Group - Caixa Capital (1,468) (19,116)
CGD Finance Limited 149,724 117,349
Caixa Geral Finance Limited 26,626 -
Caixa Leasing e Factoring - Instituição Financeira de Crédito, S.A. (148) (288)
Banco Caixa Geral, S.A. (2,744) (5,455)
CREDIP - Instituição Financeira de Crédito, S.A. (113,000) (6,438)
Caixa Seguros, SGPS, S.A. -
Parcaixa SGPS, SA (86,860) (11,799)
Locarent 1,492,513 4,231,752
FCR Empreender Mais (26,110) (37,280)
FCR Mezzanine - Caixa Capital (597,404) (254,415)
Mesquita ETVIA (42,844) (2,389)
Income from equity instruments
Caixa Geral Finance Limited 335,155 242,762
Net commissions
FCR CGD Group - Caixa Capital 5,136,488 4,976,627
FCR Empreender Mais 222,679 221,869
FCR Mezzanine - Caixa Capital 604,220 607,472
Caixa Geral de Depósitos, S.A. 1,509,320 75,848
Caixa Seguros, SGPS, S.A. 178,550 80,000
CREDIP - Instituição Financeira de Crédito, S.A. 1,135,387 -
Parcaixa SGPS, SA 234,303 71,730
Banco Caixa Geral - Brasil, SA (606,594) (1,869,521)
Banco Caixa Geral, S.A. - 400,000
Mesquita ETVIA 4,305 7,881
Income from financial operations
Caixa Geral de Depósitos, S.A. (334,112,947) (76,110,432)
- of which: financial assets held for trading (334,170,443) (76,698,278)
- of which: available for sale financial assets - 501,212
- of which: hedge derivatives 57,496 86,634
Locarent 996,074 (2,301,206)
Other operating income
Caixa Geral de Depósitos, S.A. 627,005 717,727
Sogrupo IV - Gestão de Imóveis, ACE 160,429 176,603
Sogrupo - Serviços Administrativos, ACE 107,423 168,431
Caixagest - Técnicas de Gestão de Fundos, S.A. 21,931 23,266
CREDIP - Instituição Financeira de Crédito, S.A. 18,000 18,375
Mesquita ETVIA 30,064 29,825
Banco Caixa Geral Brasil 19,254 -
Other administrative expenditure
Caixa Geral de Depósitos, S.A. (463,955) (995,931)
Banco Caixa Geral, S.A. (73,816) (77,495)
Locarent (565,218) (547,310)
Banco Caixa Geral Brasil (45,000) -
Caixa Leasing e Factoring - Instituição Financeira de Crédito, S.A. - (14)
The Bank also had a guarantee of €7,127,030 provided to Caixa Geral de Depósitos at 31 December 2011
(€7,171,724 in 2010).
Transactions with related entities are generally made on the basis of market values on the respective dates.
Bank’s management bodies
The costs incurred on the remuneration of the Bank’s board of directors, in 2011, totalled €1,034,299 of which
amount €12,940 in respect of contributions to the pension fund, as described in Note 2.13 (€1,724,086 and
€14,024 respectively in 2010).

Annual Report – 2011
112
No bonuses were paid to board members in 2011 and 2010.
Two of the board members have mortgage lending agreements with the Bank for the amount of €257,041
(€189,369 in 2010). This is a standard loan for Bank employees which were taken out prior to the appointment as
board members. The Bank has no additional liability or granted any long term benefit to the board of directors,
other than those referred to above.
Information on the amounts paid to the members of boards of directors and inspection bodies, in 2011, is set out
in the management report.
Information on the fees charged by the statutory auditors, in 2011, is set out in the management report.
31. FINANCIAL INSTRUMENTS
Management policies on financial risks pertaining to the group’s activity
CGD Group adopted a centralised risk management model, in 2001. This encompasses the assessment and
control of all of the group’s credit, market and liquidity risks, based on the principle of the separation of functions
between commercial and risk areas. CaixaBI group’s risk management and control are, accordingly, centralised
by CGD’s Risk Management Division. The Bank also has risk management regulations defining the limits and
operating procedures on the management of various risks.
The following disclosures on the principal types of risks pertaining to the group’s activity are required under IFRS
7.
Foreign exchange risk
Foreign exchange risk is controlled and assessed on a daily individual basis for Caixa – Banco de Investimento,
S.A.’s operations. VaR amounts and limits are calculated on total open and currency positions.

Annual Report – 2011
113
Financial instruments were broken down into the following currencies at 31 December 2011 and 2010:
2011
Euros USD Sterling Real Other Total
Assets
Cash and cash equivalents with central banks 2,924,679 - - - - 2,924,679
Cash assets with other credit institutions 1,254,422 43,859 4,183 101 141,092 1,443,656
Investments in credit institutions 30,992,233 - - 2,491,310 - 33,483,543
Securities and derivatives portfolio:
Financial assets at fair value through profit or loss
Securities 75,548,510 8 - - - 75,548,517
Derivative financial instruments (notional) 10,704,665,762 453,187,672 - 4,801,523 - 11,162,654,957
Derivative financial instruments (book value) 634,943,238 78,254,101 - 539,264 - 713,736,603
Available for sale financial assets 437,715,022 12,691,135 - - - 450,406,157
Hedge derivatives (notional) 15,815,750 - - - - 15,815,750
Loans and advances to customers 765,720,207 1,593,419 - - - 767,313,626
Other assets 76,077,326 7,800,294 70,111 - 31,286 83,979,017
Provisions and impairment (75,132,643) (1,580,670) - - - (76,713,313)
12,670,524,504 551,989,817 74,294 7,832,199 172,378 13,230,593,192
Liabilities
Credit institutions’ and central banks’ resources (980,573,540) (14,917,512) - - - (995,491,052)
Customer resources and other loans (112,711,518) (1,357,897) - - - (114,069,415)
Financial liabilities at fair value through profit or loss
Derivative financial instruments (notional) (10,704,665,762) (453,187,672) - (4,801,523) - (11,162,654,957)
Derivative financial instruments (book value) (578,117,176) (76,001,887) - (539,264) - (654,658,328)
Hedge derivatives (notional) (15,815,750) - - - - (15,815,750)
Other liabilities (85,746,483) (7,629,347) (51,186) 354,582 - (93,072,434)
(12,477,630,229) (553,094,316) (51,186) (4,986,206) - (13,035,761,937)
Net exposure (1,104,499) 23,108 2,845,993 172,378 1,936,980
2010
Euros USD Sterling Other Total
Assets
Cash and cash equivalents with central banks 8,894,162 - - - 8,894,162
Cash assets with other credit institutions 5,310,762 15,519 31,367 82,719 5,440,368
Investments in credit institutions 7,477,072 - - - 7,477,072
Securities and derivatives portfolio:
Financial assets at fair value through profit or loss
Securities 180,613,787 7,390,167 - - 188,003,954
Derivative financial instruments (notional) 9,968,348,991 635,748,294 - 5,230,644 10,609,327,929
Derivative financial instruments (book value) 326,475,073 44,460,471 - 23,189 370,958,733
Available for sale financial assets 470,906,116 5,666,587 6,939,654 - 483,512,357
Hedge derivatives (notional) 15,815,750 - - - 15,815,750
Loans and advances to customers 786,587,377 27,195,654 19,879,795 - 833,662,827
Other assets 53,994,208 1,627,484 28,552 57 55,650,300
Provisions and impairment (61,385,300) (1,530,631) - - (62,915,931)
11,763,037,999 720,573,545 26,879,368 5,336,610 12,515,827,521
Liabilities
Credit institutions’ and central banks’ resources (1,060,506,890) (42,206,513) (26,430,439) - (1,129,143,842)
Customer resources and other loans (103,438,220) (1,558,142) - - (104,996,362)
Financial liabilities at fair value through profit or loss
Derivative financial instruments (notional) (9,968,348,991) (635,748,294) - (5,230,644) (10,609,327,929)
Derivative financial instruments (book value) (319,786,830) (40,723,279) - (23,189) (360,533,298)
Hedge derivatives (notional) (15,815,750) - - - (15,815,750)
Other liabilities (65,779,534) (107,351) (1,231) - (65,888,116)
(11,533,676,215) (720,343,579) (26,431,670) (5,253,834) (12,285,705,297)
Net exposure 229,966 447,698 82,776 760,440

Annual Report – 2011
114
The amounts relating to derivatives in the above tables, comprise the notional amount of interest rate swaps.
Liquidity risk
Liquidity risk comprises the group’s risk of difficulties in securing funds to meet its commitments. An example of
liquidity risk may be the Bank’s incapacity to dispose of a financial asset quickly at close to its fair value.
An analysis of the group’s liquidity risk is part of the consolidated liquidity analysis of CGD Group’s Asset-Liability
Committee. The Bank has an irrevocable line of credit from CGD, for liquidity requirements of up to one year.
CGD group policy, on the other hand, does not advise direct access to the capital market for securing medium
and long term funding, which is the consolidated liability of CGD group with CGD having a global management
commitment and eventual coverage of the liquidity gaps of its various subsidiaries as a whole.
Under IFRS 7 requirements, the full amount of non-discounted contractual cash flows for the various time bands,
based on the following premises, is set out below:
Customers’ sight deposits, recognised in the “customer resources and other loans” account heading are
“repayable on demand”;
Sight deposits overdrafts are recognised in the “loans and advances to customers” account headings in
“repayable on demand”;
The “other” column comprises amounts already received or paid which are being deferred;
The amount for derivative financial instruments set out in this table comprises their book value;
Shares and customers’ overdue credit have been classified for unspecified periods;
For operations whose income is not fixed such as on operations indexed to Euribor, the future cash flows
have been estimated at the reference value at 31 December 2011 and 2010.
2011
Contractual periods to maturity
(amounts in euros) Repayable
on demand
Up to 3 months
3 months - 1 year
1 - 3 years 3 - 5 yearsMore than 5
yearsUndetermined Other Total
Assets
Cash and cash equivalents with central banks 2,924,679 - - - - - - - 2,924,679
Cash assets with other credit institutions 1,443,656 - - - - - - - 1,443,656
Investments in credit institutions - 31,070,383 - 2,491,310 - - - - 33,561,693
Securities and derivatives portfolio:
Other financial assets at fair value through profit or loss
- 162,954 5,476,471 514,008 7,866,014 2 - - 14,019,449
Available for sale financial assets (gross balances)
- 95,696,127 71,242,069 108,060,904 84,645,051 263,406,759 63,617,358 - 686,668,268
Financial assets held for trading
- Securities - 1,280,943 2,769,988 90,515,045 - - 3,016,001 - 97,581,977
- Derivative financial instruments - 284,960,765 2,805,935 28,534,333 41,634,586 355,800,984 - - 713,736,603
Loans and advances to customers (positive balances)
5,693,494 54,798,082 123,383,941 191,528,508 150,034,453 383,218,243 5,441,556 (2,588,274) 911,510,003
Positive revaluation of hedge derivatives - - - 1,459,895 - - - - 1,459,895
Other assets 70,541,959 - 7,580,458 - - - 5,194,556 662,045 83,979,017
80,603,788 467,969,255 213,258,862 423,104,003 284,180,104 1,002,425,988 77,269,471 (1,926,230) 2,546,885,240
Liabilities
Credit institutions’ and central banks’ resources
283,940 813,699,370 7,491,256 - 180,512,500 - - - 1,001,987,066
Customer resources and other loans 30,062,683 68,379,777 3,122,000 7,084,877 - 8,088,032 - - 116,737,369
Financial liabilities held for trading
- Derivative financial instruments - 304,179,972 2,813,868 29,822,648 45,171,998 351,600,863 - - 733,589,348
Negative revision of hedge derivatives - - - - 1,521,387 - - - 1,521,387
Other liabilities 50,101,185 14,760,816 27,336,005 - - - - 874,428 93,072,434
80,447,808 1,201,019,934 40,763,129 36,907,525 227,205,885 359,688,895 - 874,428 1,946,907,604
Liquidity gap 155,980 (733,050,680) 172,495,732 386,196,478 56,974,219 642,737,093 77,269,471 (2,800,658) 599,977,636

Annual Report – 2011
115
2010
Contractual periods to maturity
(amounts in euros) Repayable on demand
Up to 3 months
3 months -1 year
1 - 3 years 3 - 5 yearsMore than 5
yearsUndetermined Other Total
Assets
Cash and cash equivalents with central banks 8,894,162 - - - - - - - 8,894,162
Cash assets with other credit institutions 5,440,368 - - - - - - - 5,440,368
Investments in credit institutions - 7,531,563 - - - - - - 7,531,563
Securities and derivatives portfolio:Other financial assets at fair value through profit or loss
- 78,906 2,222,627 5,606,083 2,887,912 6,130,797 346,924 - 17,273,248
Available for sale financial assets (gross balances)
- 13,200,274 44,030,890 149,868,859 106,090,420 236,112,286 72,668,500 - 621,971,229
Financial assets held for trading
- Securities - 12,197,343 10,487,574 28,521,781 108,898,767 53,269,413 1,338,381 - 214,713,260
- Derivative financial instruments - 660,845 11,276,389 42,754,557 29,559,904 343,075,634 - - 427,327,329
Loans and advances to customers (gross balances)
6,002,978 38,816,737 101,613,640 238,286,778 173,845,172 394,206,470 9,068,090 (3,343,102) 958,496,763
Positive revaluation of hedge derivatives - - - - 1,250,849 - - - 1,250,849
Other assets 40,441,012 644,034 4,852,079 - - - 8,856,795 910,384 55,704,304
60,778,520 73,129,702 174,483,200 465,038,059 422,533,024 1,032,794,599 92,278,689 (2,432,718) 2,318,603,074
Liabilities
Credit institutions’ and central banks’ resources
541,799 1,129,367,502 - - - - - - 1,129,909,302
Customer resources and other loans 33,443,693 34,430,005 24,240,671 - 7,046,860 9,839,166 - - 109,000,395
Financial liabilities held for trading
- Derivative financial instruments - 654,243 11,194,927 43,601,034 29,514,548 331,904,798 - - 416,869,550
Negative revision of hedge derivatives - - - - - 1,599,779 - - 1,599,779
Other liabilities 17,788,373 11,857,743 35,178,502 - - - - 1,063,498 65,888,116
51,773,866 1,176,309,493 70,614,100 43,601,034 36,561,408 343,343,743 - 1,063,498 1,723,267,142
Liquidity gap 9,004,654 (1,103,179,792) 103,869,100 421,437,025 385,971,615 689,450,856 92,278,689 (3,496,216) 595,335,932
As already referred to, the Bank benefits from an irrevocable line of credit from CGD, permitting the adequate
management of liquidity gaps of up to one year.

Annual Report – 2011
116
Interest rate risk
Interest rate risk comprises the fair value or cash flow risks associated with a specific financial instrument, if
changed on the basis of changes in market interest rates.
The following is a summary of the type of exposure to interest rate risk at 31 December 2011 and 2010:
2011
(amounts in euros) Not subject to interest
rateFixed rate Variable rate Total
Assets
Cash assets with other credit institutions - - 1,443,656 1,443,656
Investments in credit institutions - - 33,483,543 33,483,543
Financial assets held for trading
- Securities 3,016,001 72,281,165 251,351 75,548,517
- Derivative financial instruments - 5,579,185,621 5,583,469,336 11,162,654,957
Other financial assets at fair value through profit or loss - 2 11,286,602 11,286,603
Hedge derivatives - 5,000,000 9,917,906 14,917,906
Available for sale financial assets 63,617,358 274,834,888 111,953,912 450,406,157
Loans and advances to customers 2,853,282 11,502,767 752,957,577 767,313,626
Other assets 83,979,017 - - 83,979,017
153,465,658 5,942,804,441 6,504,763,883 12,601,033,982
Liabilities
Financial liabilities held for trading
- Derivative financial instruments - 5,607,667,852 5,554,987,105 11,162,654,957
Credit institutions’ and central banks’ resources - 283,940 995,207,112 995,491,052
Customer resources and other loans - 42,642,886 71,426,529 114,069,415
Hedge derivatives 9,917,906 5,000,000 14,917,906
Other liabilities 93,072,434 - - 93,072,434
93,072,434 5,660,512,585 6,626,620,746 12,380,205,765
Net exposure 60,393,224 282,291,857 (121,856,863) 220,828,218
2010
(amounts in euros) Not subject to interest
rateFixed rate Variable rate Total
Assets
Cash assets with other credit institutions - - 5,440,368 5,440,368
Investments in credit institutions - - 7,477,072 7,477,072
Financial assets held for trading
- Securities 1,338,381 152,590,009 18,764,594 172,692,984
- Derivative financial instruments - 5,287,170,759 5,322,157,171 10,609,327,929
Other financial assets at fair value through profit or loss 346,924 2 14,964,045 15,310,970
Hedge derivatives - 5,000,000 10,815,750 15,815,750
Available for sale financial assets 72,668,500 262,391,931 148,451,926 483,512,357
Loans and advances to customers 5,724,987 12,460,591 815,477,248 833,662,827
Other assets 51,387,760 - 4,262,540 55,650,300
131,466,552 5,719,613,292 6,347,810,714 12,198,890,558
Liabilities
Financial liabilities held for trading
- Derivative financial instruments 5,311,592,900 5,297,735,030 10,609,327,929
Credit institutions’ and central banks’ resources - 541,799 1,128,602,042 1,129,143,842
Customer resources and other loans - 46,415,568 58,580,794 104,996,362
Hedge derivatives 10,815,750 5,000,000 15,815,750
Other liabilities 65,888,116 65,888,116
65,888,116 5,369,366,017 6,489,917,866 11,925,171,999
Net exposure 65,578,436 350,247,275 (142,107,152) 273,718,559
The “financial assets held for trading - shares” account heading at 31 December 2011 and 2010, included
€70,890,370 and €81,124,157 for a portfolio bond whose interest included a fixed-rate component and an optional
component indexed to the stock market performance of a Portuguese share.

Annual Report – 2011
117
Exposure to interest rate risk, at 31 December 2011 and 2010 can be broken down into the following maturity
periods:
2011
Rate refixing / contractual periods to maturity
(amounts in euros) Repayable on
demandUp to 3 months
3 – 12 months
1 - 3 years 3 - 5 yearsMore than 5
yearsUndetermined Other Total
AssetsCash assets with other credit institutions 1,443,656 - - - - - - - 1,443,656
Investments in credit institutions - 30,992,233 - 2,491,310 - - - - 33,483,543
Financial assets held for trading
- Securities - 1,520,344 - 71,012,172 - - 3,016,001 - 75,548,517
- Derivative financial instruments - 2,045,458,968 4,007,664,882 918,004,402 696,483,618 3,495,043,088 - - 11,162,654,957Other financial assets at fair value through profit or loss - 6,097,330 5,189,272 2 - - - - 11,286,603
Hedge derivatives - - 9,917,906 5,000,000 - - - - 14,917,906
Available for sale financial assets - 161,678,925 71,449,308 31,066,087 11,452,268 111,142,211 63,617,358 - 450,406,157
Loans and advances to customers 2,396,824 456,068,938 293,296,850 1,194,966 11,502,767 - 5,441,556 (2,588,274) 767,313,626
Other assets 70,541,959 - 7,580,458 - - - 5,194,556 662,045 83,979,017
74,382,439 2,701,816,736 4,395,098,675 1,028,768,939 719,438,653 3,606,185,299 77,269,471 (1,926,230) 12,601,033,982
Liabilities
Financial liabilities held for trading
- Derivative financial instruments - 2,031,939,994 3,992,471,606 929,539,089 698,816,800 3,509,887,467 - - 11,162,654,957Credit institutions’ and central banks’ resources 283,940 812,775,937 7,382,564 - 175,048,611 - - - 995,491,052
Customer resources and other loans 30,062,683 61,836,655 9,589,874 6,559,757 - 6,020,447 - - 114,069,415
Hedge derivatives - - 5,000,000 - 9,917,906 - - - 14,917,906
Other liabilities 50,101,185 13,908,477 28,188,344 - - - - 874,428 93,072,434
80,447,808 2,920,461,063 4,042,632,389 936,098,846 883,783,317 3,515,907,913 - 874,428 12,380,205,765
Net exposure (6,065,369) (218,644,326) 352,466,285 92,670,093 (164,344,664) 90,277,385 77,269,471 (2,800,658) 220,828,218
2010
Rate refixing / contractual periods to maturity
(amounts in euros) Repayable on demand
Up to 3 months
3 - 12 months 1 - 3 years 3 - 5 yearsMore than 5
yearsUndetermined Other Total
AssetsCash assets with other credit institutions 5,440,368 - - - - - - - 5,440,368
Investments in credit institutions - 7,477,072 - - - - - - 7,477,072
Financial assets held for trading
- Securities - 18,764,594 4,749,672 11,149,370 93,008,533 43,682,434 1,338,381 - 172,692,984
- Derivative financial instruments - 1,857,206,264 3,761,202,878 1,575,642,477 599,041,529 2,816,234,781 - - 10,609,327,929Other financial assets at fair value through profit or loss - 10,137,956 4,826,089 2 - - 346,924 - 15,310,970
Hedge derivatives - - 10,815,750 - 5,000,000 - - - 15,815,750
Available for sale financial assets - 128,454,149 43,298,970 42,586,244 35,191,463 161,313,032 72,668,500 - 483,512,357
Loans and advances to customers 6,002,978 435,031,977 374,442,293 - - 12,460,591 9,068,090 (3,343,102) 833,662,827
Other assets 40,441,012 644,034 4,798,075 - - - 8,856,795 910,384 55,650,300
51,884,358 2,457,716,047 4,204,133,726 1,629,378,093 732,241,526 3,033,690,837 92,278,689 (2,432,718) 12,198,890,558
Liabilities
Financial liabilities held for trading
- Derivative financial instruments - 1,848,694,819 3,746,332,175 1,589,183,200 601,053,574 2,824,064,160 - - 10,609,327,929Credit institutions’ and central banks’ resources 541,799 1,128,602,042 - - - - - - 1,129,143,842
Customer resources and other loans 33,443,693 34,365,812 24,214,982 - 6,328,521 6,643,354 - - 104,996,362
Hedge derivatives - - 5,000,000 - - 10,815,750 - - 15,815,750
Other liabilities 17,788,373 11,857,743 35,178,502 - - - - 1,063,498 65,888,116
51,773,866 3,023,520,416 3,810,725,660 1,589,183,200 607,382,095 2,841,523,264 - 1,063,498 11,925,171,999
Net exposure 110,492 (565,804,368) 393,408,066 40,194,893 124,859,431 192,167,573 92,278,689 (3,496,216) 273,718,559
The contents of the above referred to table were based on the following premises:
the book value of fixed-rate instruments was classified in accordance with their respective period to
maturity;

Annual Report – 2011
118
the book value of variable-rate instruments (e.g. indexed to Euribor), was classified in accordance with the
respective maturity until the next refixing of the rate;
the balance sheet value of instruments not subject to interest rate risk (e.g. shares) was included in the
"undetermined" column;
the balance sheet value included in the “other” column comprises amounts which have already been
received or paid which are being deferred;
information is provided on notional purchase amounts (as assets) and sales (as liabilities) on interest rate
and equity swaps;
overdue loans to customers are not considered to be subject to interest rate risk, and;
customers’ sight deposits, when no interest is paid, are considered to be fixed-rate and are classified as
“repayable on demand”.
Credit risk
Credit risk comprises financial losses on the defaults of counterparties with which agreements on financial
instruments have been entered into.
Maximum exposure to credit risk
The following is a summary of the maximum exposure to credit risk, by financial instrument, at 31 December 2011
and 2010:
(amounts in euros) 2011 2010
Type of Financial Instrument Book value (gross)
Provisions / Impairment
Book value(net)
Book value (gross)
Provisions / Impairment
Book value (net)
Assets:
Cash assets with other credit institutions 1,443,656 - 1,443,656 5,440,368 - 5,440,368
Investments in credit institutions 33,483,543 120,600 33,362,943 7,477,072 - 7,477,072
Financial assets at fair value through profit or loss 797,555,722 - 797,555,722 613,645,979 - 613,645,979
Available for sale financial assets 386,788,799 - 386,788,799 410,843,857 - 410,843,857
Loans and advances to customers 767,313,626 68,180,997 699,132,629 833,662,827 45,750,453 787,912,373
Hedge derivatives 1,459,895 - 1,459,895 1,250,849 - 1,250,849
Other assets (excluding deferred costs) 83,316,972 8,532,316 74,784,656 54,739,916 17,165,477 37,574,439
2,071,362,214 76,833,913 1,994,528,300 1,927,060,868 62,915,931 1,864,144,937
Off-balance sheet:
Guarantees provided 54,478,484 1,006,100 53,472,383 55,471,419 581,456 54,889,963
2,125,840,697 77,840,014 2,048,000,683 1,982,532,287 63,497,387 1,919,034,900
Credit quality of financial assets
The Bank does not have an internal rating system. The principal procedures in force in terms of the approval and
monitoring of credit operations designed to ensure an adequate risk level for the Bank’s strategy, are set out
below:
The Bank has a Credit Committee, comprising members of the Executive Committee and managers of the
structural organs with any form of involvement in lending. The Bank’s Credit Committee meets once a week
with a minimum of two directors and managers of the structural organs involved in the lending process.

Annual Report – 2011
119
The production of commercial proposals for submission to the Credit Committee is the responsibility of
structural organs (business/product divisions), which require the risk opinion of CGD’s Risk Management
Division, in advance. The proposals approved by the Bank’s Credit Committee are recorded in minutes and
are signed by all present, for later submission to and the final resolution of CGD’s Credit Boards.
A part of credit operations with customers is, inter alia, guaranteed by the following types of collateral:
A pledge on securities;
Bank guarantees;
State-backed;
Mortgage loans for employees; and
Personal guarantees.
Credit quality of debt securities and derivative financial instruments
The following table provides information on the balance sheet value of portfolio debt securities net of impairment
(excluding matured securities) according to the Standard & Poor’s or equivalent rating, by type of guarantor or
issuing entity and by the guarantor’s or issuing entity’s geography, at 31 December 2011 and 2010:
2011
(amounts in euros) Portugal
Rest of European Union
North America Other Total
Financial assets held for trading
BB- up to BB+ 71,132,449 - - - 71,132,449
B+ 1,390,795 - - - 1,390,795
Not rated 9,272 - - - 9,272
72,532,516 - - - 72,532,516
Issued by:
Corporates - - - - -
Governments and other local authorities 70,890,370 - - - 70,890,370
Financial institutions 1,642,146 - - - 1,642,146
72,532,516 - - - 72,532,516Financial assets at fair value through profit or loss (Fair Value Option)
BB- up to BB+ 2 - - - 2
B+ 0 - - - -
Not rated 10,021,006 - - 1,265,595 11,286,601
10,021,008 - - 1,265,595 11,286,603
Issued by:
Corporates 10,021,005 - - - 10,021,005
Governments and other local authorities 2 - - - 2
Financial institutions 1 - - 1,265,595 1,265,597
10,021,008 - - 1,265,595 11,286,603
Available for sale financial assets (net of impairment)
BBB - 10,220,304 886,626 - 11,106,931
BB- up to BB+ 278,087,343 - - - 278,087,343
CCC- up to CCC+ 3,607,431 962,078 - - 4,569,509
D - 1.216.589 - - 1.216.589
Not rated 76.366.775 15.441.652 - - 91.808.427
358.061.549 27.840.624 886.626 - 386.788.799
Issued by:
Corporates 65,778,541 6,621,546 886,626 - 73,286,713
Governments and other local authorities 259,952,398 1,216,589 - - 261,168,987
Financial institutions 32,330,611 20,002,489 - - 52,333,100
358,061,549 27,840,624 886,626 - 386,788,799

Annual Report – 2011
120
2010
(amounts in euros) Portugal
Rest of European Union
North America Other Total
Financial assets held for trading
AAA - - - - -
AA- up to AA+ - 2,959,121 1,950,103 - 4,909,224
A- up to A+ 18,941,806 10,206,097 6,547,954 2,991,545 38,687,401
Less than A- 89,606,291 25,701,924 843,987 11,605,776 127,757,978
Not rated - - - - -
108,548,096 38,867,142 9,342,044 14,597,321 171,354,603
Issued by:
Corporates 1,438,145 25,994,492 - 7,969,055 35,401,692
Governments and other local authorities 92,259,314 - - 3,635,263 95,894,576
Financial institutions 14,850,638 12,872,649 9,342,044 2,993,003 40,058,334
108,548,096 38,867,142 9,342,044 14,597,321 171,354,603Financial assets at fair value through profit or loss (Fair Value Option)
AA- up to AA+ 3 - - - 3
Not rated 12,950,361 - - 2,013,682 14,964,044
12,950,365 - - 2,013,682 14,964,047
Issued by:
Corporates 12,950,361 - - - 12,950,361
Governments and other local authorities 2 - - - 2
Financial institutions 1 - - 2,013,682 2,013,684
12,950,365 - - 2,013,682 14,964,047
Available for sale financial assets (net of impairment)
AAA - - - - -
AA- up to AA+ - 1,990,343 865,334 - 2,855,676
A- up to A+ 277,877,471 22,370,126 8,758,272 2,079,738 311,085,607
Less than A- 15,786,884 14,619,754 - - 30,406,638
Not rated 66,495,935 - - - 66,495,935
360,160,291 38,980,222 9,623,606 2,079,738 410,843,857
Issued by:
Corporates 68,518,138 - - - 68,518,138
Governments and other local authorities 258,003,150 3,570,611 - 2,079,738 263,653,499
Financial institutions 33,639,003 35,409,612 9,623,606 - 78,672,220
360,160,291 38,980,222 9,623,606 2,079,738 410,843,857
The Bank, at 31 December 2011 recognised in “debtors - other” an amount of €2,116,198 relating to interest on
derivative financial instruments in arrears on which impairment of €664,701 was recognised. The book value
recognised in “financial assets held for trading” relating to the said operations totalled €15,555,313.
The Bank, at 31 December 2011 also recognised in “debtors - other” an amount of €1,619,240 relating to interest
on derivative financial instruments in arrears on which impairment of €757,507 was recognised. The book value
recognised in “financial assets held for trading” relating to the said operations totalled €2,736,275.
At 31 December 2011 debt securities issued by “governments and other local authorities” in the rest of the
European Union included bonds issued by the Republic of Greece for a book value of €1,216,589, net of
impairment (impairment recognised on this security was €3,961,150 – Note 29). At 31 December 2010 the book
value of these bonds was €3,570,611.
Credit quality of Investments in credit institutions
The counterparties with which the Bank had contracted “Investments in credit institutions ”at 31 December 2011,
comprised CGD Group bodies (€33,362,943), with an external rating of BB-.

Annual Report – 2011
121
Quality of loans and advances to customers
Information on non-performing credit operations and/or separate impairment at 31 December 2011 and 2010, is
set out in the following table:
2011 2010
(amounts in euros) Collectively
impaired loansSeparately
impaired loansTotal
Collectively impaired loans
Separately impaired loans
Total
Lending to companies
Collective analysis
Outstanding 606,158,901 142,641,235 748,800,136 709,617,930 104,314,318 813,932,247
Overdue - 5,441,556 5,441,556 - 9,068,090 9,068,090
Impairment (3,328,964) (64,789,921) (68,118,885) (5,667,983) (39,996,004) (45,663,987)
602,829,937 83,292,870 686,122,807 703,949,946 73,386,403 777,336,350
Mortgage loans
Outstanding 9,960,647 - 9,960,647 9,578,472 - 9,578,472
Impairment (61,685) - (61,685) (83,237) - (83,237)
9,898,962 - 9,898,962 9,495,235 - 9,495,235
Consumer loans
Outstanding 339,861 - 339,861 371,675 - 371,675
Impairment (427) - (427) (3,230) - (3,230)
339,434 - 339,861 368,445 - 368,445
Total outstanding loans 616,459,409 142,641,235 759,100,645 719,568,076 104,314,318 823,882,394
Total overdue loans - 5,441,556 5,441,556 - 9,068,090 9,068,090
Total impairment (3,391,076) (64,789,921) (68,180,997) (5,754,449) (39,996,004) (45,750,453)
Total loans 613,068,333 83,292,870 696,361,203 713,813,627 73,386,403 787,200,030
Market risk
Market risk comprises the risk of a change in fair value or the cash flows of financial instruments deriving from
changes in market prices, including foreign exchange, interest rate and price risks.
Market risk is assessed on the basis of the following methodologies:
Value-at-Risk” (VaR) on the trading portfolio. This portfolio includes the following elements: securities and
derivative financial instruments portfolio.
A sensitivity analysis on the Bank’s other assets and liabilities recognised in the Bank’s separate financial
statements. This sensitivity analysis is calculated on the bases of the premises defined in Bank of Portugal
Instruction 19/2005.
The group does not have qualitative information for the sensitivity analysis on the remaining assets and liabilities
of its subsidiaries.
Trading portfolio
VaR comprises an estimate of the maximum potential loss on a specific assets portfolio, over a specific period
with a given confidence level, assuming normal market operation.
The calculation methodology used is that of historical simulation i.e. future events are fully explained by past
events, based on the following premises:
asset held for: 10 days;
confidence level: 99%;
price sampling period: 720 calendar days;
decay factor = 1, i.e. all observations carry the same weight.

Annual Report – 2011
122
For options, the theoretical price is calculated by the use of adequate models and the use of implicit volatility. No
calculation for correlations is made, owing to the methodology applied; i.e. the correlations are empirical.
The following is a breakdown of VaR at 31 December 2011 and 2010 (thousand euros):
(EUR thousand) 2011 2010
Market VaR :
Interest rate 142 269
Exchange rate 23 76
Price 20 66
Diversification effect (50) (167)
135 244
The diversification effect is calculated implicitly. Total VaR refers to the combined effect of interest rate, price,
foreign exchange and volatility risks.
Bpvs (basis point values), changes in the market value of interest rate positions owing to the parallel movement of
1 basis point on the yield curves are calculated for the trading portfolio and treasury positions. Other sensitivity
indices commonly applicable to options portfolios are also calculated.
Impact assessment on income of extreme changes in market risk factors (stress testing) assessments are
performed monthly.
Theoretical backtesting (comparison of the VaR measure with technical results) is performed daily and real
backtesting (comparison of the VaR measure with the real result) monthly. The number of exceptions obtained i.e.
the number of times theoretical or real losses exceed VaR, enable the method’s accuracy to be assessed and any
necessary adjustments made.
Non-trading portfolio
The sensitivity analysis on the non-trading portfolio was carried out to assess the potential impact on the Bank’s
net interest income in 2012 (excluding the other companies within the consolidation perimeter), considering a fall
of 50 basis points (bps) in reference interest rates and assuming a parallel movement of the interest rate curve.
The Bank’s separate financial assets and liabilities in its financial statements were considered for this purpose,
excluding:
derivative financial instruments; and
commercial paper.
The principal premises related with the pricing of operations were:
variable-rate operations: market rate plus respective contractual spread;
new fixed-rate operations: market rate plus respective spread equivalent to the difference between the
average rate on live transactions at 31 December 2011 and respective market rate;
new variable-rate operations: market rate plus average contractual spread on live transactions at 31
December 2011.
Based on the above referred to premises, the potential positive impact of a 50 basis points fall in reference
interest rates on net interest income for 2012 totals €201,699 (€1,993,466 at 31 December 2010). In the event of
a 50 basis points increase in reference interest rates, the potential negative impact on net interest income
forecast for 2012 totals €194,941 (€2,003,045 at 31 December 2010).

Annual Report – 2011
123
Fair value
The group maintained a significant part of its assets, notably its securities and derivatives portfolio, at fair value
through profit or loss, at 31 December 2011.
Reference should be made to the following aspects as regards the principal financial assets and liabilities
recognised at cost:
Interest is paid on almost all loans in the case of investments in and resources with other credit institutions
at indexed rates and short refixing periods;
As shown above, in the section on interest rate risk, the payment of interest on almost all customer deposits
is indexed to Euribor, with short refixing periods. A long term operation at fixed interest rates has been
covered by a hedge derivative for which reason the change in the fair value attributable to the interest rate
risk has already been recognised in the deposit’s book value (see Note 17).
In light of the above, the Bank considers that the book value of its financial assets, net of provisions and its
financial liabilities comprises a reliable approximation of their respective fair value.
The form of assessing the fair value of financial instruments at 31 December 2011 and 2010, is summarised
below:
(amounts in euros) 2011
Assets valued at cost price
Financial instruments at fair value
Prices in an active market
Valuation techniques based on:
Type of financial instruments Market data Other Total
Assets
Financial assets held for trading - 4,406,796 713,987,955 70,890,370 789,285,121
Other financial assets at fair value through profit or loss - 2 - 11,286,602 11,286,603
Available for sale financial assets 153.127 317,833,191 29,029,452 103,390,387 450,406,157
Hedge derivatives - - 1,459,895 - 1,459,895
153.127 322,239,989 744,477,302 185,567,358 1,252,437,776
Liabilities
Financial liabilities held for trading - - 733,589,348 - 733,589,348
Hedge derivatives - - 1,521,387 - 1,521,387
- - 735,110,735 - 735,110,735
(amounts in euros) 2010
Assets valued at Cost price
Financial instruments at fair value
Prices in an active market
Valuation techniques based on :
Type of financial instruments Market data Other Total
Assets
Financial assets held for trading - 79,727,563 437,749,249 82,543,502 600,020,313
Other financial assets at fair value through profit or loss - 2 941,268 14,369,701 15,310,970
Available for sale financial assets 153.127 343,847,866 42,608,044 96,903,321 483,512,357
Hedge derivatives - - 1,250,849 - 1,250,849
153.127 423,575,430 482,549,409 193,816,523 1,100,094,489
Liabilities
Financial liabilities held for trading - - 416,869,550 - 416,869,550
Hedge derivatives - - 1,599,779 - 1,599,779
- - 418,469,329 - 418,469,329
The contents of the above referred to table were based on the following premises:
Prices on active markets correspond to equity instruments listed on a stock market and high liquidity bonds
(Level 1);
Prices of derivative financial instruments are calculated using valuation techniques based on market date
(Level 2);

Annual Report – 2011
124
Portfolio shares valued by indicative bids supplied by contributors external to the group were recognised in
“Valuation techniques - market date (Level 2)”;
Shares valued by internal CGD Group models are presented in “Valuation techniques – Other (Level 3)”;
This column includes:
- At 31 December 2011, €70,890,370 in bonds convertible into EDP shares issued by Parpública SGPS,
S.A., which were being valued in accordance with an internal model defined by the Bank.
- At 31 December 2011 and 2010, €80,759,654 and €82,067,907, respectively, relating to fixed or
variable-rate bonds issued by Portuguese financial and non-financial companies, in respect of which
there are no active market nor indicative prices supplied by external counterparties. These securities
were valued using a projected cash flow updating model, at market interest rates plus a spread the Bank
considers adequate to the issuing entity’s credit risk as a discount rate.
Assets valued at cost are stable financial investments held by the Bank for which no active market exists;
The following values refer to subsidiary companies held under venture capital operations:
- Cost price: in the case of acquisitions made in the twelve months preceding the valuation date;
- Prices in an active market: for stock market listed companies; and
- Other: for other subsidiaries.
The following table provides information on the movements occurring in 2011 and 2010 on securities valued by
“valuation techniques - other” (Level 3):
(amounts in euros) Balance
31.12.2010
Changes to valuation method
Acquisitions/ disposals
Gains recognised in :Exchange
rate changesBalance
31.12.2011Fair value reserve
Income for period
Potential Effective
Financial assets held for trading 82,543,502 - (4,320,144) - (7,368,457) 35,470 - 70,890,370
Other financial assets at fair value through profit or loss 14,369,701 - (2,329,969) - (753,130) - 11,286,601
Available for sale financial assets 96,903,321 3,607,431 2,106,500 595,388 - 10,752 166,995 103,390,387
193,816,523 3,607,431 (4,543,613) 595,388 (8,121,588) 46,222 166,995 185,567,359
(amounts in euros)
Balance 31.12.2009
Changes to valuation method
Acquisitions/ disposals
Income recognised in :
Exchange rate changes
Balance31.12.2010Fair value
reserve
Income for period
Potential Effective
Financial assets held for trading - 92,659,873 (3,530,712) - (6,641,192) 55,533 - 82,543,502
Other financial assets at fair value through profit or loss 49,541,938 1 (34,694,086) - (478,153) - - 14,369,701
Available for sale financial assets 95,343,234 (16,318,869) 12,622,084 5,099,423 - 1800 155,649 96,903,321
144,885,172 76,341,005 (25,602,714) 5,099,423 (7,119,345) 57,333 155,649 193,816,523
32. CAPITAL MANAGEMENT
In capital management terms, the Bank is under the Bank of Portugal supervision, both in its separated accounts
and in Group CGD’s consolidated accounts.
The solvency ratio on the Bank’s separate financial statements, at 31 December 2011 and 2010, was 11.20% and
10.26% respectively.

Annual Report – 2011
125
(amounts in euros) Separate basis Individual 2011 2010
Eligible own funds (Base+Complementary-Deductions) (1) 255,416,292 228,373,810
Basis own funds 248,872,093 218,208,798
Paid up capital 81,250,000 81,250,000
(-) Treasury shares - -
Legal, statutory and other reserves 115,292,278 84,178,154
Retained earnings from past years 58,550,496 59,061,492
(-) Intangible assets (558,001) (388,823)
(-) Adjustment - TREM II (395,040) (542,104)
(-) Deferred tax assets associated with provisions for general credit risks - (698,512)
(-) Revaluation differences on available for sale assets - negative fair value (net of tax) (6,160,983) (5,440,244)
(-) Reserves for deferred tax liabilities resulting from the revaluation of available for sale assets 893,343 788,835
Complementary own funds 6,544,199 10,165,012
Revaluation reserves for fixed assets 4,338,403 4,338,403
Revaluation differences on available for sale assets - positive fair value (45%) 2,205,796 2,035,333
Provisions for general credit risks - 3,791,275
Own funds requirements (2) 182,397,595 178,081,849
Credit and counterparty credit risk 139,034,241 126,872,463
(-) 8% Provisions for general credit risks - part not eligible for own funds (502,545) (262,499)
Position risks - debt instruments 30,293,059 36,151,196
Position risks - equity securities 301,886 510,166
Commodity risks - -
Operational risk - standard method 13,270,954 14,810,523
Solvency ratio 11,20% 10,26%
Legend:
(1) According to Official Notice 12/92
(2) According to current legislation: Official Notices 5/07, 8/07, 9/07

Annual Report – 2011
126
3 Notes to the separate financial statements
1. INTRODUCTORY NOTE
Caixa - Banco de Investimento, S.A. (“Bank”) was formed by a public deed of 12 November 1987, having
absorbed all assets and liabilities of the Portuguese branch of Manufacturers Hanover Trust Company, in
conformity with the terms of Ministerial Order no. 865-A/87 of 6 November, jointly issued by the Presidency of the
Council of Ministers and Ministry of Finance.
The Bank is Caixa Geral de Depósitos Group’s specialised investment banking business arm, which includes
activities such as fixed and variable corporate debt finance, equity finance, financial advisory, structured finance,
project finance, brokerage, research and venture capital operations. Its operations are performed by a branch
office in Lisbon and another in Porto, an offshore branch in Madeira and a branch in Spain.
As referred to in Note 21, the majority of the Bank’s share capital is owned by Caixa Geral de Depósitos Group
company Gerbanca, SGPS, S.A.
The financial statements at 31 December 2011 were approved by the board of directors on 20 February 2012.
The Bank’s financial statements, at 31 December 2011, still require the approval of its shareholders’ meeting. The
board of directors considers, however, that the said financial statements will be approved without significant
alterations.
2. ACCOUNTING POLICIES
The separate financial statements of the Bank’s registered office have been combined with those of its branches
and represent the Bank’s global activities. All balances and trading between the Bank’s headquarters and branch
offices in this process have been eliminated.
2.1. Presentation bases
The Bank’s financial statements have been prepared on the going concern principle, based on books
and accounting records, kept in conformity with the accounting principles set out in the Adjusted
Accounting Standards under the terms of Bank of Portugal Official Notice 1/2005 of 21 February and
Instructions 9/2005 and 23/2004, in accordance with the competence afforded by no. 3 of Article 115
of the General Credit and Financial Institutions Regime, approved by Decree Law 298/92 of 31
December.
The Adjusted Accounting Standards generally correspond to the International Financial Reporting
Standards (IFRS), as adopted by the European Union under European Parliament and Council
Regulation (EC) 1606/2002 of 19 July, transposed into national legislation by Decree Law 35/2005 of
17 February and Bank of Portugal Official Notice 1/2005 of 21 February. Under the terms of Official
Notice 1/2005, however, the following exceptions have an impact on the Bank’s financial statements:
i) Valuation criteria on loans and advances to customers and amounts receivable from other
debtors (credit and accounts receivable) – credit is recognised at its nominal value and may not
be reclassified in other categories and, as such, recognised at fair value;

Annual Report – 2011
127
ii) Provisioning of credit and accounts receivable - minimum provisioning levels are defined in
accordance with the dispositions of Bank of Portugal Official Notice 3/95, with the changes
made by Bank of Portugal Official Notices 8/03 of 30 June and 3/2005 of 21 February (Note 2.3.
a)). The regime also includes liabilities comprising acceptances, guarantees and other similar
instruments;
iii) Tangible assets must be maintained at cost and cannot, therefore, be recognised at fair value,
as permitted by the IAS 16 Standard – Tangible Fixed Assets. The recognition of legally
authorised revaluations is, however, permitted, as an exception, in which case the resulting
capital gains are recognised in “revaluation reserves”.
2.2. Translation of balances and transactions in foreign currency
The Bank’s accounts have been prepared in accordance with the currency used in the economic
context in which it operates (referred to as “operating currency”), i.e. the euro.
Foreign currency transactions are recognised on the basis of the reference rates in force at the
transaction date. At each balance sheet date, monetary assets and liabilities denominated in foreign
currency are translated into euros on the basis of the foreign exchange rate in force. Non-monetary
assets, recognised at fair value, are translated on the basis of the exchange rate in force on the last
valuation date. Non-monetary assets, recognised at their historical cost, continue to be recognised at
the original exchange rate.
Exchange rate differences assessed upon exchange translation are recognised in income for the
year, except for differences originated by non-monetary financial instruments, such as shares,
classified as available for sale and recognised in a specific shareholders’ equity account heading until
disposal.
2.3. Financial instruments
a) Loans and advances to customers and amounts receivable from other debtors
As described in Note 2.1, these assets are registered according to the dispositions of Bank of
Portugal Official Notice 1/2005. They are therefore registered at their nominal value and the
respective proceeds i.e. interest and commissions, are recognised over the course of the period
of the operations by the pro rata temporis method, in the case of operations with residual flows
over a period of more than one month. Whenever applicable, commissions and external costs
allocated to contracts for similar operations underlying the assets included in this category are
also periodised over the course of the loan’s period of application.
The provisioning regime is defined in Bank of Portugal Official Notice 3/95 and includes the
following:
Provision for overdue credit and interest
This provision is used to cover the risks on lending with overdue payments of principal or
interest. The provision percentages for overdue credit and interest are increased in
proportion to the period having elapsed since their respective maturity and whether they
are collateralised.

Annual Report – 2011
128
Provision for doubtful loans
This provision caters for the risks of outstanding principal on loans to customers with
unpaid principal or interest or customers with other unpaid liabilities.
Official Notice no. 3/95 provides the following classifications for doubtful loans:
- outstanding payments on a single credit operation in which at least one of the following
conditions applies to the respective unpaid principal and interest:
(i) when exceeding 25% of the unpaid principal, plus accrued interest;
(ii) when in default for more than:
• six months in the case of operations with a maturity of less than five years;
• twelve months in the case of operations with a maturity of five or more and
less than ten years;
• twenty four months in the case of operations with a maturity of ten years or
more.
These doubtful loans are provisioned in accordance with the provisioning percentage for
overdue credit.
- Outstanding credit on a single customer, if the overdue credit and interest on all of the
operations in respect of the said customer, plus the outstanding credit described in the
preceding sub-paragraph, exceed 25% of the total credit, plus overdue interest. These
doubtful debts are provisioned on the basis of 50% of the average percentage of
provisions for overdue credit.
Provisions for bad and doubtful debts at 31 December 2011 and 2010, were higher than
the minimum amounts defined by the Bank of Portugal.
Provision for general credit risks
This provision is recognised in liabilities and covers the risks of non payment of loans and
other risks, such as the provision of guarantees and securities, deriving from the Bank’s
activity. The amount of the provision is calculated on the application of the following
general percentages on the full amount of the value of unmatured credit, including
guarantees and acceptances:
- 1.5% on consumer credit and unspecified loans and advances to customers;
- 0.5% on collateralised mortgage lending or property leasing operations, in both cases
when the property is for the borrower’s residence;
- 1% for other credit.
Provisions for general credit risks at 31 December 2011 and 2010, were higher than the
minimum amounts defined by the Bank of Portugal.
Provisions increases ceased to be accepted as a tax deductible cost from 1 January 2003.
The effect in the income statement is recognised in the “provisions net of recoveries and
cancellations” account heading in the income statement.

Annual Report – 2011
129
b) Other financial assets
Other financial assets are recognised at fair value at the agreement date, plus the costs directly
attributable to the transaction. These assets are initially recognised in one of the following
categories defined in the IAS 39 Standard:
i) Financial assets at fair value through profit or loss
This category includes:
Financial assets held for trading, which essentially include the acquisition of securities
with the objective of realising gains on the basis of short term market price fluctuations.
This category also includes derivative financial instruments, excluding derivative financial
instruments complying with hedge accounting requirements; and,
Financial assets recognised at fair value through profit or loss (“fair value option”).
The use of the “fair value option” implies the irrevocable recognition, in this category, of the
financial instruments at the time of initial recognition and is restricted to situations in which
the application results in the production of more relevant financial information, i.e.
a) If its application eliminates or significantly reduces an accounting mismatch that would
otherwise occur as a result of the inconsistent measurement of assets and liabilities or
recognition of gains and losses;
b) Groups of financial assets, financial liabilities or both which are managed and when the
performance thereof is assessed on a fair value basis, in accordance with formally
documented risk and investment management strategies; and when information on the
group is distributed internally to management bodies.
c) It is also possible to classify financial instruments containing one or more embedded
derivatives in this category, unless:
- The embedded derivatives do not significantly modify the cash flows which would,
otherwise, be required under the contract;
- It is evident, with little or no analysis, that the implicit derivatives should not be
separated out.
Financial assets classified in this category are recognised at fair value whose gains and
losses generated by their subsequent valuation are recognised in the income statement in
the “income from assets and liabilities measured at fair value through profit or loss” account
headings. Interest is recognised in the appropriate “interest and similar income” account
headings.
ii) Loans and accounts receivable
These are financial assets with fixed or determinable payments, not listed on an active
market and not included in any of the other financial asset categories. This category
essentially includes amounts receivable from other financial institutions.
These assets are initially recognised at fair value, less any commissions included in the
effective rate, plus all incremental costs directly attributable to the transaction. The assets
are subsequently recognised in the balance sheet at their amortised cost less impairment
losses.

Annual Report – 2011
130
Interest recognition
Interest is recognised on the basis of the effective rate method which makes it possible to
calculate the amortised cost and split up the interest over the course of the period of the
operations. The effective rate is the rate that, being used to discount the estimated future
cash flows associated with the financial instrument, enables its present value to be matched
with the value of the financial instrument at the date of initial recognition.
iii) Available for sale financial assets
This category includes variable-income securities not classified as assets recognised at fair
value through profit or loss, including stable financial investments and other financial
instruments initially recognised herein and not classifiable in the other categories of the
above referred to IAS 39 Standard.
Available for sale financial assets are measured at fair value, with the exception of
shareholders’ equity instruments not listed on an active market and whose fair value cannot
be reliably measured, which continue to be recognised at cost. Revaluation gains or losses
are recognised directly in shareholders’ equity in the “fair value reserve”. At the time of sale
or if impairment is assessed, the accumulated fair value changes are transferred to income
or costs for the year.
Dividends on equity capital instruments classified in this category are recognised as income
in the income statement when the Bank’s right to receive them has been established.
Reclassification of financial assets
With the entry into force of the amendment to the IAS 39 Standard on 1 October 2008, the Bank
is in a position to reclassify several of its financial assets classified as financial assets held for
trading or available for sale to other financial assets categories. No reclassifications to financial
assets categories at fair value through profit or loss, are, however, permitted.
Fair value
As referred to above, financial assets classified in financial assets categories recognised at fair
value through profit or loss and available for sale financial assets are recognised at their fair
value.
The fair value of a financial instrument comprises the amount at which an asset or financial
liability can be sold or liquidated between independent, informed parties, interested in realising
the transaction under normal market conditions.
The fair value of financial assets is, for most assets, determined by a CGD group body which is
independent from the trading function, based on the following criteria:
Closing price at the balance sheet date, for instruments traded on active markets;
The following valuation methods and techniques are, inter alia, used for debt instruments not
traded on active markets (including unlisted securities or securities with low liquidity levels):
i) Bid prices published by financial information services such as Bloomberg and Reuters,
including market prices available on recent transactions;
ii) Reference bid prices obtained from financial institutions operating as market-makers;

Annual Report – 2011
131
iii) Internal valuation models based on market date used to define a price for the financial
instrument, reflecting market interest rates and volatility, in addition to liquidity and the
credit risk associated with the instrument.
c) Financial liabilities
Financial liabilities are recognised at the agreement date at their respective fair value, less the
costs directly attributable to the transaction. Liabilities are classified in the following categories:
i) Financial liabilities held for trading
Financial liabilities held for trading comprise the negative revaluation of derivative financial
instruments recognised at their fair value.
ii) Other financial liabilities
This category includes other credit institutions’ and customers’ resources and liabilities
incurred on payments of services.
These financial liabilities are valued at their amortised cost.
d) Derivatives and hedge accounting
The Bank performs derivative operations as part of its activity to provide for its customers’
requirements and reduce its exposure to foreign exchange, interest rate and price fluctuations.
Derivative financial instruments are recognised at their fair value at the date of the agreement.
They are also recognised in off-balance sheet accounts at their respective notional value
Derivative financial instruments are subsequently measured at their respective fair value. Fair
value is assessed:
On the basis of prices obtained in active markets (e.g. futures trading in organised
markets);
On the basis of models incorporating valuation techniques accepted in the market,
including discounted cash flows and options valuation models.
Embedded derivatives
Financial instruments embedded in other financial instruments are separated from the base
agreement and processed autonomously under the IAS 39 Standard, whenever:
The embedded derivative’s economic characteristics and risks are not closely related with
the base agreement defined in the IAS 39 Standard; and
The full amount of the combined financial instrument is not recognised at fair value, with
fair value changes being reflected in the income statement.
Hedge derivatives
These derivatives are designed to protect the group from exposure to a specific risk attached to
its operations. Classification as hedge derivatives and use of the hedge accounting concept, as
described below, are subject to compliance with the rules of the IAS 39 Standard.

Annual Report – 2011
132
The Bank, at 31 December 2011 and 2010, only used hedges on the changes in the fair value
of financial instruments recognised in the balance sheet as “fair value hedges”.
The Bank prepares formal documentation, for all hedge operations, at the beginning of the
operation, to include the following aspects:
Risk and strategy management objectives associated with the realisation of the hedge
operation, in accordance with the hedge policies defined by the Bank;
Description of hedged risk(s);
Identification and description of hedged and hedge financial instruments;
Hedge operation effectiveness appraisal method and respective periodicity.
Hedge effectiveness tests are periodically performed and documented, using a comparison
between the change in fair value of the hedge instrument and hedged item (part attributable to
hedged risk). To enable the use of hedge accounting under the IAS 39 Standard, this ratio
should be within a range of 80% - 125%. Prospective effectiveness tests are also performed in
order to demonstrate the hedges’ expected future effectiveness.
Hedge derivatives are recognised at fair value, with the results being assessed daily and
recognised in income and costs for the year. If the hedge is seen to be effective, the Bank will
also recognise the change in fair value of the hedged item, attributable to the hedged risk, in
income for the year. The impact of these valuations is recognised in the “income from assets
and liabilities measured at fair value through profit or loss” account headings. For derivatives,
such as interest rate swaps, with an associated interest component, the periodisation of interest
for the period in progress and liquidated flows are recognised in “interest and similar income”
and “interest and similar costs" in the income statement.
Positive and negative revaluations of hedge derivatives are recognised in specific assets and
liabilities account headings.
Valuations of hedged items are recognised in the account headings in which such assets and
liabilities are recognised.
Trading derivatives
Trading derivatives are all derivative financial instruments that are not associated with effective
hedge operations in accordance with the IAS 39 Standard, including:
Derivatives taken out to hedge assets or liabilities risks recognised at fair value through
profit or loss, thus rendering hedge accounting unnecessary;
Derivatives taken out to hedge risk which does not comprise effective cover under the IAS
39 Standard;
Derivatives taken out for trading purposes.
Trading derivatives are recognised at fair value, with the results being assessed daily and
recognised in income and costs for the year. The impact of these valuations is recognised in the
“income from assets and liabilities measured at fair value through profit or loss” account
headings. For derivatives, such as interest rate swaps, with an associated interest component,
the periodisation of interest for the period in progress and liquidated flows are recognised in
“interest and similar income” and “interest and similar costs" in the income statement.

Annual Report – 2011
133
Positive and negative revaluations are recognised in the “financial assets at fair value through
profit or loss” and “financial liabilities at fair value through profit or loss” account headings,
respectively.
e) Impairment of financial assets
Financial assets at amortised cost
The Bank periodically analyses the impairment of its financial assets recognised at amortised
cost, notably investments in credit institutions.
Signs of impairment are identified on an individual basis.
The following events may comprise signs of impairment:
Failure to comply with contractual clauses, i.e. arrears of interest or capital;
Debtor or debt issuing entities’ significant financial difficulties;
Existence of a strong probability of a declaration of bankruptcy by the debtor or debt
issuing entity;
Granting of facilities to a debtor in financial difficulties which would not be granted under
normal circumstances;
Historical records of collections suggesting that the nominal value will never be fully
recovered;
Data indicating a measurable reduction of the estimated value of the future cash flows of a
group of financial assets since original recognition, although such a reduction cannot be
identified in the group’s separate financial assets.
Whenever signs of impairment on separately analysed assets are identified, the eventual
impairment loss comprises the difference between the book value at the time of analysis and
current value of projected future cash flows expected to be received (recoverable value),
discounted on the basis of the asset’s original effective interest rate.
Available for sale financial assets
As referred to in Note 2.3. b), available for sale financial assets are recognised at fair value, with
fair value changes being recognised in the “fair value reserve” in shareholders’ equity.
Whenever any objective evidence of impairment exists, accumulated capital losses recognised
in reserves, are transferred to costs for the year in the form of impairment losses and
recognised in the “impairment of other assets, net of reversals and recoveries” heading.
In addition to the signs of impairment on financial assets recognised at amortised cost, IAS 39
also provides for the following specific signs of impairment on equity instruments:
Information on significant changes having an adverse impact on the technological, market,
economic or legal environment in which the issuing entity operates, indicating that the cost
of the investment may not be recovered;
A prolonged or significant decline in market value at below cost.

Annual Report – 2011
134
The Bank, on each of its financial statement’s reference dates performs an analysis of the
existence of any impairment losses on available for sale financial assets, considering, for the
said purpose, the nature and specific, individual characteristics of the assets being valued. In
addition to the results of the analysis, the following events were considered to comprise
objective evidence of impairment on equity instruments:
Existence of potential capital losses of more than 50% of the respective cost price;
Situations in which the fair value of the equity instrument remains below its respective cost
price for a period of more than 24 months.
The existence of potential capital losses of more than 30% of the cost price, for more than 9
months, was also considered to comprise objective signs of impairment.
Impairment losses on equity instruments cannot be reversed and any potential capital gains
originated after the recognition of impairment losses are, therefore, recognised in the “fair value
reserve”. Impairment is always considered to exist if additional capital losses are assessed at a
later stage and are recognised in income for the year.
Criteria identical to that of debt instruments are applied for the analysis of impairment on “Tier 1”
securities.
The group also periodically performs impairment analyses on financial assets recognised at
cost, notably unlisted equity instruments whose fair value cannot be accurately measured. The
recoverable value, in this case, comprises the best estimate of future flows receivable from the
asset, discounted at a rate which adequately reflects the risk associated with holding the asset.
The amount of an impairment loss is recognised directly in the income statement for the period.
Impairment losses on such assets cannot be reversed.
2.4. Other tangible assets
Except for assets acquired up to 1998, these are recognised at cost, less depreciation and
accumulated impairment losses. The costs of repair, maintenance and other expenses associated
with their use are recognised as a cost for the year, in the “other administrative expenses” account
heading.
The Bank revalued its fixed assets in 1998, under Decree Law 31/98 of 11 February. As permitted
under the IFRS 1 Standard, the book value, incorporating the effect of the referred to revaluation was
considered as a cost in the transition to the IFRS, as the proceeds, at the time in question, generally
comprised cost, or amortised cost, in accordance with the IFRS, adjusted to take changes to price
indices into account.
Depreciation is calculated and recognised as a cost for the year, on a systematic basis, during the
asset’s estimated useful life, comprising the period in which it is expected to be available for use, i.e.:
Years of useful life
Property 10 - 50
Equipment:
Furniture and materials 4 - 10
Transport material 4
IT equipment 3 - 4
Interior installations 3 - 10
Security equipment 4 - 10
Plant and machinery 5 - 10

Annual Report – 2011
135
Land is not depreciated.
The works carried out by the Bank on its headquarters building over the period 2008-2009 are being
depreciated over a period of ten years.
According to the IAS 36 Standard an impairment loss is recognised in the income statement for the
period whenever the net book value of tangible assets exceeds their recoverable value. Impairment
losses can be reversed and also have an impact on income for the period if there is an increase in
the asset’s recoverable value in the following periods.
The Bank periodically assesses the adequacy of the estimated useful life of its tangible assets.
2.5. Financial leases
Lease operations are recognised as follows:
As lessee
Leased assets are recognised at fair value in assets and liabilities, in line with the processing of the
respective payments of instalments.
The instalments relating to lease agreements are split up in accordance with the respective financial
schedule, whose liability is reduced by the part corresponding to the payment of the capital. Interest
paid is recognised as a financial cost.
As lessor
Leased assets are recognised in the balance sheet as loans, repaid by capital instalments set out in
the financial agreement’s schedule. Interest included in the instalments is recognised as financial
income.
2.6. Intangible assets
This account heading essentially comprises the costs, development or preparation for use of software
used for the development of the Bank’s operations. Intangible assets are recognised at cost, less
amortisation and accumulated impairment losses.
Depreciation is recognised as a cost, on a systematic basis, throughout the assets’ estimated useful
lives for a period of between 3 - 6 years.
Expenses on software maintenance are recognised as a cost for the year in which they are incurred.
2.7. Investments in subsidiaries, associated companies and jointly controlled entities
This account heading includes investments in entities over whose current management the Bank has
effective control with the aim of obtaining economic benefit from their operations, referred to as
subsidiaries. Control usually takes the form of more than 50% of share capital or voting rights.
These assets are recognised at cost and periodic impairment analyses are realised.
Dividends are recognised as income for the year in which they are distributed by subsidiaries.

Annual Report – 2011
136
2.8. Income tax
The Bank, in 2011 and 2010, was subject to IRC (corporate tax) and its corresponding municipal
surcharge with an aggregate tax rate of 26.5%. Starting 1 January 2009, the aggregate tax rate
increased to 14% on amounts of less than €12,500 and 26.5% for amounts in excess of this figure.
With the publication of Law 12 – A/2010 of 30 June, a state tax was introduced, to be paid by all
taxpayers who, in 2010 and in future years have taxable income not exempt from IRC of more than
€2,000,000. The state surcharge comprises 2.5% on the part of the taxable income, subject to and
not exempt from IRC, in excess of the referred to limit of €2,000,000. This disposition implies that the
tax rate used in 2010 and 2011 for the calculation of deferred tax and recognition of income tax for
the period was 29% (Note 14).
Law 64-B/2011 of 30 December (State Budget Law for 2012), temporarily increased the limits and
rates of the state tax on taxpayers in 2012 and 2013, who make taxable profit subject to and not
exempt from IRC of more than €1,500,000. It should therefore be noted that, for 2012 and 2013, the
state surcharge rate on taxable profit of between €1,500,000 and €10,000,000 will increase to 3%,
with the rate applicable on taxable profit subject to and not exempt from IRC of more than
€10,000,000 therefore being 5%. Given the temporal/transitory nature of the new calculation rules on
the state surcharge (only applicable in 2012 and 2013), the deferred tax recorded by the Bank in
2011 did not take the referred to increase in the State Budget for 2012 into account.
The Bank’s Madeira Offshore Branch, however, was exempt from IRC up until 31 December 2011
under article 33 of the Statute of Fiscal Benefits. For the purposes of the application of this
exemption, in accordance with the dispositions of article 34 of the Statute of Fiscal Benefits, at least
85% of the profit attributable to the entity’s global activity should derive from the performance of
operations outside the institutional scope of the Madeira Free Zone.
Total income tax recognised in the income statement includes current and deferred taxes.
Current tax is calculated on the basis of taxable profit for the year, which is different from accounting
income owing to adjustments to taxable profit resulting from costs or income which are not relevant
for fiscal purposes or only considered in other periods.
Deferred tax comprises the impact of temporary deductible or taxable differences between the
balance sheet value of assets and liabilities and their fiscal basis, used to assess taxable profit on tax
recoverable or payable in future periods.
Deferred tax liabilities are normally recognised for all temporary taxable differences, whereas
deferred tax assets are only recognised up to the amount by which the existence of future taxable
profit, permitting the use of the corresponding deductible tax differences or fiscal losses, is probable.
Deferred taxes are not, however, recorded in the following situations:
Temporary differences resulting from goodwill;
Temporary differences originating from the initial recognition of assets and liabilities in
transactions which do not affect accounting income or taxable profit;
Temporary differences resulting from non-distributed profit by subsidiaries and associated
companies, to the extent that the Bank is able to control their reversal and which is not likely to
occur in the foreseeable future.

Annual Report – 2011
137
The principal situations originating temporary differences on a bank level, comprise provisions and
revaluations not accepted for fiscal purposes, deferred commissions and depreciation not accepted
on legal revaluations of tangible assets.
Deferred taxes are calculated on the basis of the tax rates expected to be in force on the date of
reversal of the temporary differences, comprising the approved or substantially approved rates, at the
date of the balance sheet.
Income tax (current or deferred) is recognised in the income statement for the period, except for
cases in which the originating transactions have been recognised in other shareholders’ equity
accounts. In such cases the corresponding tax is also recognised as a charge to shareholders’ equity
and does not affect income for the year.
2.9. Provisions and contingent liabilities
A provision is set up when there is a current (legal or constructive) obligation, resulting from past
events, involving the probable future expenditure of resources and when this may be reliably
assessed. The amount of the provision comprises the best estimate of the amount to be paid to
liquidate the liability at the date of the balance sheet.
When not probable, the future expenditure of resources is considered to be a contingent liability.
Contingent liabilities require no more than a disclosure procedure, unless the possibility of their
payment is remote.
Provisions for other risks are for fiscal, legal and other contingencies.
2.10. Employee benefits
The Bank does not have any retirement pensions liabilities to its employees, who are covered by the
national social security regime, owing to the fact that it is not a signatory to the Collective Wage
Bargaining Agreement for the Banking Sector.
However, with the objective of providing its employees with a retirement subsidy to the standard
social security regime, the Bank, at its own initiative has made contributions with the objective of
paying old age retirement and survivors’ pensions to its employees, in accordance with the terms set
out in the contract.
The Bank pays a percentage of 3.5% of each employee’s annual wages into the fund. Pension costs,
in 2011 and 2010 were €290,391 and €434,464 respectively (Note 31).
The contributions are made in the form of joint membership of the Caixa Reforma Prudente Open
Pension Fund, managed by CGD Pensões – Sociedade Gestora de Fundos de Pensões, S.A..
The Bank does not have any liabilities other than the above referred to contributions owing to the fact
that this is a defined contribution plan.
Short term benefits, including productivity bonuses paid to employees, are recognised in “employee
costs” for the respective period, on an accrual basis.

Annual Report – 2011
138
2.11. Commissions
As referred to in Note 2.3, commissions received on credit operations and other financial instruments,
i.e. commissions charged for originating operations, are recognised as income over the period of the
operation.
Commissions for services performed are usually recognised as income for the period of performance
of the service or as a lump sum if resulting from single acts.
The estimate of the commissions the Bank expects to pay to other credit institutions for the
syndicating of credit operations in which it is involved as lead and in which CGD Group’s initial
exposure is higher than the defined objective, is recognised as accrued costs as a charge to the
“costs of services and commissions” account heading for the year in which the Bank recognises the
income relating to the corresponding commission.
2.12. Securities and other items held under custody
Securities and other items held under custody, notably customers' securities, are recognised in off-
balance sheet account headings at their nominal value.
2.13. Cash and cash equivalents
For the purposes of the preparation of cash flow statements, the Bank considers “cash and cash
equivalents” to be the total amount of the “cash and cash equivalents with central banks” and the
“cash equivalents in other credit institutions” account headings.
2.14. Critical accounting estimates and most relevant judgemental aspects in the
application of accounting policies
In the application of the above referred to accounting policies, the Bank’s board of directors must
produce estimates. The estimates with the greatest impact in the Bank’s separate financial
statements include those set out below.
ASSESSMENT OF IMPAIRMENT LOSSES ON LOANS AND ACCOUNTS RECEIVABLE
As regards provisions for loans and advances to customers, accounts receivable and guarantees and
acceptances given, the Bank complies with the minimum limits defined by the Bank of Portugal (Note
2.3). However, whenever considered necessary, such provisions are complemented to reflect the
Bank’s estimate of the risk of non-recoverability associated with customers. The assessment is
produced on a separate basis by the Bank, using its specific knowledge of its customers’ status and
the guarantees associated with the operations in question.
ASSESSMENT OF IMPAIRMENT LOSSES ON AVAILABLE FOR SALE FINANCIAL ASSETS
As described in Note 2.3. e), capital losses deriving from the valuation of such assets are recognised
as a charge to the fair value reserve. Whenever objective evidence of impairment exists, the
accumulated capital losses recognised in the fair value reserve should be transferred to costs for the
year.
In the case of equity instruments, the assessment of the existence of impairment losses may be
subjective. The Bank determines whether or not impairment exists on such assets through a specific

Annual Report – 2011
139
analysis at each balance sheet date, taking into consideration the definitions provided in the IAS 39
Standard (see Note 2.3. e)). As a general criterion, impairment is always determined when it is
considered, that, owing to the size of the assessment of the capital loss, the full recovery of the
amount invested by the Bank is highly improbable.
In the case of debt instruments classified in this category, including “Tier I” shares classified as equity
instruments, the capital losses are transferred from the fair value reserve to income, whenever there
is any indication of the possible future occurrence of failure to comply with contractually agreed cash
flows, notably on account of financial difficulties, defaults on other financial liabilities, or a significant
deterioration in the issuing entity’s rating.
VALUATION OF FINANCIAL INSTRUMENTS NOT TRADED IN ACTIVE MARKETS
In accordance with the IAS 39 Standard, the Bank values all financial instruments at fair value,
except for those recognised at amortised cost. The valuation models and techniques described in
Note 2.3 are used for the valuation of financial instruments not traded on liquid markets. The
valuations obtained comprise the best estimate of the fair value of the referred to instruments, at the
date of the balance sheet. As referred to in Note 2.3. to guarantee an adequate separation between
functions, the valuation of most such financial instruments is determined by a body that is
independent from the trading function.
A summary of the sources used by the Bank to determine the fair value on financial instruments is
provided in Note 35 – Disclosures on financial instruments, in the “fair value" section.
ASSESSMENT OF TAX ON PROFIT
Tax on profit (current and deferred) is assessed by the Bank on the basis of the rules defined by the
current fiscal environment. In several cases, however, fiscal legislation may not be sufficiently clear
and objective and may give rise to different interpretations. The amounts recognised in such cases
represent the best understanding of the responsible Bank bodies and subsidiaries on the correctness
of the operations although this may be queried by the fiscal authorities.
2.15. Adoption of new standards (IAS/IFRS) or revision of already issued standards
Except for subject matters regulated by the Bank of Portugal, such as those referred to in Note 2.1,
the Bank, in 2011, used the standards and interpretations issued by the International Accounting
Standards Board (IASB) and the International Financial Reporting Interpretations Committee (IFRIC)
which are relevant to its operations and effective for the periods starting 1 January 2011, provided
that they have been approved by the European Union.
The following standards, interpretations, amendments and revisions endorsed by the European
Union and mandatory for financial years beginning on or after 1 January 2011, were adopted for the
first time, in the year ended 31 December 2011:
IFRS 8 and IAS 24 (amendment) – “Operating segments” and “Related Party Disclosures” – This
revision simplifies the definition of «related party», simultaneously eliminating certain internal
incoherencies and providing exemptions for entities associated with public administration as
regards the amount of information such entities must provide regarding transactions with related
parties.

Annual Report – 2011
140
IFRIC 14 (amendment) – “Prepayment of a minimum funding requirement” - These changes
eliminate an unintentional consequence of IFRIC 14 in cases in which an entity subject to a
minimum funding requirement makes a prepayment of contributions when, in certain
circumstances, the entity making such a prepayment would be obliged to recognise expenditure.
If a specific defined benefits plan is subject to a minimum funding requirement, the amendment to
IFRIC 14 determines that such a payment be processed as any other prepayment, as if it were an
asset.
IFRIC 19 – Extinguishing financial liabilities with equity instruments – this interpretation deals with
the following issues:
(a) Classification of own equity instruments issued to fully or partly extinguish a financial liability
are “considerations paid” according to paragraph 41 of IAS 39;
(b) how an entity should initially measure own equity instruments issued to extinguish this
financial liability;
(c) how an entity should process any difference between the amount of the financial liabilities
extinguished and the initial measured amounts of own equity instruments issued.
Improvements to the various IFRS: IFRS 1, IFRS 3 and IFRS 7, IAS 1, 32, 34, 39 and IFRIC 13 –
improvements made to the international financial reporting standards with the aim of simplifying
and clarifying the international accounting standards.
IAS 32 – “Financial Instruments ” – the presentation was changed under the terms of the annex to
Regulation (EC) No.1293/2009.
The application of these standards and interpretations did not have any materially relevant impacts
on the Bank’s financial statements at 31 December 2011.
New, amended or revised standards and interpretations not adopted
The following amendments, mandatory from 1 July 2011, have at the date of the approval of these
financial statements been endorsed by the European Union:
IFRS 7 (amendment) – “Financial instruments - “disclosures” – This revision increases the
disclosure requirements on transactions involving the transfer of financial assets. It aims to
guarantee greater transparency regarding exposure to risks when financial assets are transferred
and the transferring entity retains some involvement (exposure) thereto.
The standards, although having been endorsed by the European Union, were not adopted by the
Bank for the year ended 31 December 2011, owing to the fact that their application was still not
mandatory. No significant impacts on the financial statements deriving from their adoption have been
estimated.
3. OPERATING SEGMENTS
The board of directors receives and analyses the Bank’s financial information every month, split up into business
segments representing its areas of activity by type of origination, designed, as a whole, to ensure a dynamic
investment banking business platform i.e.:
Corporate finance - including debt and equity financial advisory and project finance activities.
Trading and sales including trading and asset and liabilities treasury management operations.

Annual Report – 2011
141
Brokerage - brokerage operations.
Commercial banking - including domestic and international transversal business origination.
Other – Other activities outside the scope of the above referred to categories.
The following tables provide information on operating segments used by the Bank at 31 December 2011 and
2010:
2011
(amounts in euros)Corporate
financeTrading and
salesBrokerage
Commercial banking
Other Total
Interest and similar income 17,376,647 306,742,499 46,535 11,757,728 94,642 336,018,051
Interest and similar costs (10,181,137) (291,482,888) (46,033) (5,764,935) (86,628) (307,561,621)
Net interest income I. 7,195,510 15,259,612 502 5,992,793 8,014 28,456,430
Income from equity instruments - 335,155 - - 2,623,562 2,958,717
Income from services and commissions 47,550,692 991,507 5,233,583 4,679,202 44,522 58,499,506
Costs of services and commissions (4,471,991) (253,395) (1,090,134) (8,220) (1,467) (5,825,207)
Income from financial operations (7,248,297) (24,208,779) (21,112) (219,841) 659 (31,697,370)
Income from the disposal of other assets (776,690) - - (184,000) 1,937 (958,753)
Other operating income (9,424) (30,377) (42,790) 17,362 (1,015,837) (1,081,066)
II. 35,044,289 (23,165,889) 4,079,547 4,284,504 1,653,376 21,895,827
Net operating income 42,239,798 (7,906,277) 4,080,049 10,277,297 1,661,390 50,352,257
Provisions net of recoveries and cancellations 5,445,065 16 4,177 (5,195,545) (1,542,903) (1,289,190)
Value adjustments on loans and advances to customers and amounts receivable from other debtors (net of recoveries and cancellations) (15,835,369) - - (10,561,260) - (26,396,630)
Impairment of other financial assets net of reversals and recoveries 181,128 (4,049,472) - (651,808) - (4,520,152)
Impairment of other assets net of reversals and recoveries (1,403,517) - 2,769 (12,764) 683 (1,412,830)
III. (11,612,693) (4,049,456) 6,946 (16,421,377) (1,542,220) (33,618,801)
Total 30,627,105 (11,955,734) 4,086,995 (6,144,080) 119,170 16,733,456
Other costs and income (15,268,940)
Net income for period 1,464,516
Financial assets held for trading - 788,302,358 8 982,755 - 789,285,121
Other financial assets at fair value through profit or loss - 1,265,598 - 10,021,005 - 11,286,603
Available for sale financial assets - 352,786,431 - 41,112,525 11,928,147 405,827,103
Hedge derivatives - 1,459,895 - - - 1,459,895
Loans and advances to customers 467,594,750 - 2,407,443 222,219,681 10,301,831 702,523,705
Financial liabilities held for trading 733,589,348 733,589,348
Central banks’ resources 56,818,797 138,988,199 292,536 33,335,361 2,701,229 232,136,123
Other credit institutions’ resources 186,842,567 457,047,897 961,974 109,619,785 8,882,705 763,354,930
Customer resources and other loans 4,876,964 - 28,660,869 101,312,369 - 134,850,201
Hedge derivatives - 1,521,387 - - - 1,521,387

Annual Report – 2011
142
2010
(amounts in euros)Corporate
financeTrading and
salesBrokerage
Commercial banking
Other Total
Interest and similar income 13,361,944 250,879,876 38,402 8,771,387 75,745 273,127,354
Interest and similar costs (4,040,140) (233,411,424) (20,276) (2,627,109) (71,508) (240,170,457)
Net interest income I. 9,321,804 17,468,452 18,126 6,144,278 4,237 32,956,897
Income from equity instruments - 242,762 - - 7,081,881 7,324,643
Income from services and commissions 60,859,871 3,379,551 5,452,918 10,450,636 44,426 80,187,402
Costs of services and commissions (8,655,161) (3,538,992) - (6,563) (33,002) (12,233,718)
Income from financial operations 75,718 (16,678,593) (162,514) (716,662) - (17,482,051)
Income from the disposal of other assets - - - - (397) (397)
Other operating income 908,069 98,101 157,517 (59,387) (153,181) 951,119
II. 53,188,495 (16,497,171) 5,447,921 9,668,024 6,939,727 58,746,997
Net operating income 62,510,299 971,281 5,466,047 15,812,302 6,943,964 91,703,893
Provisions net of recoveries and cancellations 319,090 1,961,850 (3,745) 7,030,857 6,652,973 15,961,025
Value adjustments on loans and advances to customers and amounts receivable from other debtors (net of recoveries and cancellations) (6,665,226) - - (8,092,697) - (14,757,923)
Impairment of other financial assets net of reversals and recoveries (181,128) (5,781,839) - (950,295) - (6,913,262)
Impairment of other assets net of reversals and recoveries (950,962) 70 1,183 33,740 33,442 (882,528)
III. (7,478,226) (3,819,919) (2,563) (1,978,395) 6,686,415 (6,592,688)
Total 55,032,074 (2,848,638) 5,463,484 13,833,907 13,630,379 85,111,206
Other costs and income (39,508,077)
Net income for period 45,603,129
Financial assets held for trading - 598,806,317 5 1,213,991 - 600,020,313
Other financial assets at fair value through profit or loss - 2,954,953 - 12,009,094 - 14,964,047
Available for sale financial assets - 382,845,740 - 42,768,213 10,443,146 436,057,098
Hedge derivatives - 1,250,849 - - - 1,250,849
Loans and advances to customers 518,116,799 - 2,662,031 262,934,510 9,953,483 793,666,823
Financial liabilities held for trading - 416,869,550 - - - 416,869,550
Central banks’ resources 92,667,276 176,324,647 476,116 57,041,165 3,648,019 330,157,222
Other credit institutions’ resources 224,256,531 426,708,926 1,152,209 138,040,679 8,828,274 798,986,619
Customer resources and other loans 4,829,715 183,755 22,428,969 87,671,829 - 115,114,269
Hedge derivatives - 1,599,779 - - - 1,599,779
Interest and similar costs were split up over the various business lines on the basis of the average value of the
respective asset allocations to the said segments.

Annual Report – 2011
143
Information on income distribution and the principal balance sheet headings by geographical markets in 2011 and
2010 is set out below:
2011
Portugal Spain Total
(amounts in euros)
Interest and similar income 318,200,555 17,817,495 336,018,051
Interest and similar costs (289,866,052) (17,695,569) (307,561,621)
Net interest income I. 28,334,504 121,927 28,456,430
Income from equity instruments 2,958,717 - 2,958,717
Income from services and commissions 58,415,944 83,562 58,499,506
Costs of services and commissions (5,817,178) (8,030) (5,825,207)
Income from financial operations (31,466,133) (231,236) (31,697,370)
Income from the disposal of other assets (960,690) 1,937 (958,753)
Other operating income (1,079,323) (1,744) (1,081,066)
II. 22,051,337 (155,510) 21,895,827
Net operating income 50,385,841 (33,584) 50,352,257
Provisions net of recoveries and cancellations (1,346,640) 57,450 (1,289,190)
Value adjustments on loans and advances to customers and amounts receivable from other debtors (net of recoveries and cancellations) (20,161,968) (6,234,661) (26,396,630)
Impairment of other financial assets net of reversals and recoveries (4,520,152) - (4,520,152)
Impairment of other assets net of reversals and recoveries (1,412,830) - (1,412,830)
III. (27,441,590) (6,177,211) (33,618,801)
Total 22,944,251 (6,210,795) 16,733,456
Other costs and income (15,268,940)
Net income for period 1,464,516
Financial assets held for trading 788,302,366 982,755 789,285,121
Other financial assets at fair value through profit or loss 11,286,603 - 11,286,603
Available for sale financial assets 405,827,103 - 405,827,103
Hedge derivatives 1,459,895 - 1,459,895
Loans and advances to customers 692,068,513 10,455,192 702,523,705
Financial liabilities held for trading 733,589,348 - 733,589,348
Central banks’ resources 232,136,123 - 232,136,123
Other credit institutions’ resources 744,780,360 18,574,570 763,354,930
Customer resources and other loans 134,850,201 - 134,850,201
Hedge derivatives 1,521,387 - 1,521,387

Annual Report – 2011
144
2010
Portugal Spain Total
(amounts in euros)
Interest and similar income 255,171,098 17,956,255 273,127,353
Interest and similar costs (222,986,668) (17,183,788) (240,170,456)
Net interest income I. 32,184,430 772,467 32,956,897
Income from equity instruments 7,324,643 - 7,324,643
Income from services and commissions 79,797,816 389,586 80,187,402
Costs of services and commissions (12,224,300) (9,419) (12,233,718)
Income from financial operations (16,769,073) (712,979) (17,482,051)
Income from the disposal of other assets (397) - (397)
Other operating income 939,300 11,818 951,119
II. 59,067,989 (320,992) 58,746,997
Net operating income 91,252,419 451,475 91,703,894
Provisions net of recoveries and cancellations 15,909,403 51,622 15,961,025
Value adjustments on loans and advances to customers and amounts receivable from other debtors (net of recoveries and cancellations) (12,836,414) (1,921,509) (14,757,923)
Impairment of other financial assets net of reversals and recoveries (6,913,262) - (6,913,262)
Impairment of other assets net of reversals and recoveries (882,528) - (882,528)
III. (4,722,801) (1,869,886) (6,592,688)
Total 86,529,618 (1,418,412) 85,111,206
Other costs and income (39,508,077)
Net income for period 45,603,129
Financial assets held for trading 598,806,322 1,213,991 600,020,313
Other financial assets at fair value through profit or loss 14,964,047 - 14,964,047
Available for sale financial assets 436,057,098 - 436,057,098
Hedge derivatives 1,250,849 - 1,250,849
Loans and advances to customers 776,249,197 17,417,626 793,666,823
Financial liabilities held for trading 416,869,550 - 416,869,550
Central banks’ resources 330,157,222 - 330,157,222
Other credit institutions’ resources 779,618,693 19,367,927 798,986,619
Customer resources and other loans 115,114,269 - 115,114,269
Hedge derivatives 1,599,779 - 1,599,779
The information set out in the preceding tables comprises the balance sheet and income statements of all of the
Bank’s entities headquartered in Portugal (“Portugal” column) and the Madrid branch (“Spain” column). Each of
the entities performs its activity mainly with customers or resident counterparties domiciled in the same countries
in which they are headquartered.
4. CASH AND CASH EQUIVALENTS WITH CENTRAL BANKS
This account heading comprises the following:
(amounts in euros) 2011 2010
Cash 1,897 1,897
Sight deposits with central banks 2,921,782 8,891,265
2,923,679 8,893,162

Annual Report – 2011
145
The sight deposits with central banks account heading includes deposits with the Bank of Portugal providing for
the demands of the “Minimum Reserve Requirements of the System of European Central Banks” (SEBC). Interest
is paid on these deposits which comprise 2% of the deposits and debt securities with a maturity of up to two
years, excluding the deposits and public debt securities subject to SEBC minimum reserve requirements.
5. LIQUID ASSETS WITH CREDIT INSTITUTIONS
This account heading comprises the following:
(amounts in euros) 2011 2010
Cheques pending collection
In Portugal 3,000 -
Sight deposits
In Portugal 695,643 5,234,907
Abroad 404,707 185,877
Interest receivable 860 -
1,103,350 5,420,784
6. FINANCIAL ASSETS HELD FOR TRADING AND OTHER FINANCIAL ASSETS RECOGNISED
AT FAIR VALUE THROUGH PROFIT OR LOSS
These headings comprise the following:
2011 2010
(amounts in euros) Held for trading
At fair value through profit
or loss Total Held for trading
At fair value through profit
or loss Total
Debt instruments
- Issued by public entities:
. Bonds - 2 2 11,135,157 2 11,135,159
- Issued by other entities:
. Bonds and other securities:
Issued by resident entities 72,523,243 10,021,006 82,544,249 84,170,709 12,950,363 97,121,072 Issued by non-resident entities 9,272 1,265,595 1,274,867 76,048,737 2,013,682 78,062,419
72,532,516 11,286,603 83,819,119 171,354,603 14,964,047 186,318,650
Equity instruments
Issued by resident entities 1,045,069 - 1,045,069 41,197 - 41,197 Issued by non-resident entities 1,970,932 - 1,970,932 1,297,184 - 1,297,184
3,016,001 - 3,016,001 1,338,381 - 1,338,381
Derivatives with positive fair value (Note 7) 713,736,603 - 713,736,603 427,327,329 - 427,327,329
789,285,121 11,286,603 800,571,724 600,020,313 14,964,047 614,984,360
The “debt instruments - issued by other entities” account heading at 31 December 2011 and 2010, included
€70,890,370 and €81,124,157 in bonds convertible into EDP shares issued by Parpública – SGPS, S.A.
respectively.
Collateralised debt securities with a nominal value of €1,550,000 and €75,591,000 respectively (Note 33) were
recognised in this account heading at 31 December 2011 and 2010.

Annual Report – 2011
146
7. DERIVATIVE FINANCIAL INSTRUMENTS
These operations were valued in conformity with the criteria set out in Note 2.3. d), at 31 December 2011 and
2010. Information on the notional and book value thereof, at the said dates, is set out below:
2011
Notional amount Book value
(amounts in euros)Trading
derivativesHedge
derivativesTotal
Assets held for trading
Liabilities held for trading
Hedge derivatives
Total
Derivative financial instruments (Note 6)
OTC
. Swaps
Interest rate 11,162,654,957 14,917,906 11,177,572,863 634,798,840 (654,658,328) (61,492) (19,920,979)
. Caps & Floors 1,940,651,040 - 1,940,651,040 33,343,537 (33,324,740) - 18,796
. Options
on interest rate 600,000,500 - 600,000,500 45,594,226 (45,606,280) - (12,054)
13,703,306,497 14,917,906 13,718,224,403 713,736,603 (733,589,348) (61,492) (19,914,237)
Stock exchange trading
. Futures
Interest rate 30,768,886 - 30,768,886 - - - -
Market value 3,667,000 - 3,667,000 - - - -
13,737,742,383 14,917,906 13,752,660,289 713,736,603 (733,589,348) (61,492) (19,914,237)
2010
Notional amount Book value
(amounts in euros)Trading
derivativesHedge
derivativesTotal
Assets held for trading
Liabilities held for trading
Hedge derivatives
Total
Derivative financial instruments (Note 6)
OTC
. Swaps
Interest rate 10,609,327,929 15,815,750 10,625,143,679 370,958,733 (360,533,298) (348,930) 10,076,505
. Caps & Floors 2,703,102,260 - 2,703,102,260 37,246,105 (37,205,261) - 40,844
. Options
on interest rate 600,000,500 - 600,000,500 19,068,510 (19,079,533) - (11,023)
on currencies 18,205,928 - 18,205,928 53,981 (51,458) - 2,523
13,930,636,618 15,815,750 13,946,452,368 427,327,329 (416,869,550) (348,930) 10,108,849
Stock exchange trading
. Futures
Interest rate 9,870,977 - 9,870,977 - - - -
Market value 3,618,000 - 3,618,000 - - - -
13,944,125,595 15,815,750 13,959,941,345 427,327,329 (416,869,550) (348,930) 10,108,849
The book value of the assets classified as hedged items, at 31 December 2011 and 2010, totalled €11,502,767
and €12,460,591 respectively, including €1,442,632 and €1,491,606 (Note 10), respectively, in respect of value
adjustments.
The book value of the liabilities classified as hedged items, at 31 December 2011 and 2010, also totalled
€6,559,757 and €6,328,521 respectively, including €345,377 and €331,207 (Note 18), respectively, in respect of
value adjustments.

Annual Report – 2011
147
Information on the distribution of derivative financial instruments operations, at 31 December 2011 and 2010 by
periods to maturity (notional amounts) is set out below:
2011
(amounts in euros)
<= 3 months
> 3 months<= 6 months
> 6 months<= 1 year
> 1 year<= 5 years
> 5 years Total
Derivative financial instruments
OTC
. Swaps
Interest rate
Trading 684,687,165 488,815,517 295,149,777 2,711,564,625 6,982,437,872 11,162,654,957
Hedge - - - 14,917,906 - 14,917,906
684,687,165 488,815,517 295,149,777 2,726,482,531 6,982,437,872 11,177,572,863
. Caps & Floors
Trading - - - 1,596,877,847 343,773,193 1,940,651,040
. Options
on interest rate - - - - 600,000,500 600,000,500
684,687,165 488,815,517 295,149,777 4,323,360,379 7,926,211,565 13,718,224,403
Stock exchange trading
. Futures
Interest rate
Trading 30,768,886 - - - - 30,768,886
Market value 3,667,000 - - - - 3,667,000
719,123,051 488,815,517 295,149,777 4,323,360,379 7,926,211,565 13,752,660,289
2010
<= 3 months
> 3 months > 6 months > 1 year
(amounts in euros) <= 6 months <= 1 year <= 5 years > 5 years Total
Derivative financial instruments
OTC
. Swaps
Interest rate
Trading 150,015,131 49,651,922 992,298,873 3,842,407,285 5,574,954,718 10,609,327,929
Hedge - - - 5,000,000 10,815,750 15,815,750
150,015,131 49,651,922 992,298,873 3,847,407,285 5,585,770,468 10,625,143,679
. Caps & Floors
Trading - 114,300,000 608,551,286 925,714,080 1,054,536,894 2,703,102,260
. Options
on interest rate - - - - 600,000,500 600,000,500
on currencies 18,205,929 - - - - 18,205,929
168,221,060 163,951,922 1,600,850,159 4,773,121,365 7,240,307,862 13,946,452,368
Stock exchange trading
. Futures
Interest rate
Trading - 9,870,977 - - - 9,870,977
Market value - 3,618,000 - - - 3,618,000
168,221,060 177,440,899 1,600,850,159 4,773,121,365 7,240,307,862 13,959,941,345

Annual Report – 2011
148
Information on the distribution of derivative financial instruments operations, by counterparty type, at 31
December 2011 and 2010 is set out below:
2011 2010
(amounts in euros) Notional amount Book valueCheques pending
settlement Book value
Contracts on interest rates
Interest rate swaps
Financial institutions 5,712,202,279 (619,470,494) 5,426,720,004 (319,733,434)
Customers 5,465,370,584 599,549,515 5,198,423,675 329,809,938
11,177,572,863 (19,920,979) 10,625,143,679 10,076,504
Caps & Floors
Financial institutions 977,755,520 (29,192,508) 1,351,551,130 (25,977,495)
Customers 962,895,520 29,211,304 1,351,551,130 26,018,339
1,940,651,040 18,796 2,703,102,260 40,844
Options on interest rates
Financial institutions 300,000,000 (45,606,280) 300,000,000 (19,079,533)
General government 300,000,000 45,594,226 300,000,000 19,068,510
Customers 500 - 500 -
600,000,500 (12,054) 600,000,500 (11,023)
Options on currencies
Financial institutions - - 9,102,964 44,388
Customers - - 9,102,964 (41,864)
- - 18,205,928 2,524
Futures
Stock exchange 34,435,886 - 13,488,977 -
13,752,660,289 (19,914,237) 13,959,941,344 10,108,849
8. AVAILABLE FOR SALE FINANCIAL ASSETS
This account heading comprises the following:
(amounts in euros) 2011 2010
Debt instruments
Issued by resident entities
Portuguese public debt 258,560,239 256,848,797
Issued by other entities 94,078,927 95,182,837
Issued by non-resident entities
Public debt 1,216,589 3,570,611
Issued by other entities 32,933,044 55,241,612
390,788,799 410,843,857
Equity instruments
Shares
Gross amount
Issued by resident entities
At historical cost 153,127 153,127
Issued by non-resident entities
At historical cost 11,928,147 17,382,346
12,081,274 17,535,473
Other equity instruments
Gross amount 6,957,030 7,677,768
19,038,304 25,213,241
405,827,103 436,057,098
At 31 December 2011, the “debt instruments – Issued by non-resident entities – public debt” account heading
refers to bonds issued by the Republic of Greece maturing in 2017. The Bank registered impairment of
€3,961,150 on these securities in 2011.

Annual Report – 2011
149
Information on the “equity instruments - shares” account heading at 31 December 2011 and 2010, is set out
below:
2011 2010
(amounts in euros)
% investment
Cost price
ImpairmentFair value
reserveBook value
% investment
Book value
SEIF - South Europe Infrastructure Equity Finance 8.33% 4,883,721 - 1,539,217 6,422,938 8.33% 5,442,832
Corporación Interamericana para el Financiamiento de Infraestructura 9.26% 3,995,672 (1,934,605) 3,444,142 5,505,209 9.26% 5,000,314
MTS Portugal, SGMR, S.A. 4.67% 153,127 - - 153,127 4.67% 153,127
EDP Renováveis, S.A. - - - - - 0.18% 6,939,200
Other 927,903 (927,903) - -
9,960,423 (2,862,508) 4,983,359 12,081,274 17,535,473
Information on movements in this account, for 2011 and 2010, was as follows:
(amounts in euros) 2011
SecurityBalance at 31.12.2010
Purchases/(Sales)
Change in fair value reserve
Exchange differences
Balance at31.12.2011
Cost pricePotential
gain
Equity instruments:
SEIF - South Europe Infrastructure Equity Finance 5,442,832 640,000 340,106 - 6,422,938 4,883,721 1,539,217
Corporación Interamericana para el Financiamiento de Infraestructura 5,000,314 - 337,901 166,994 5,505,209 3,995,672 1,509,537
MTS Portugal ,SGMR, S.A. 153,127 - - - 153,127 153,127 -
EDP Renováveis, S.A. 6,939,200 (6,640,000) (299,200) - - - -
Other - - - - - 927,903 (927,903)
17,535,473 (6,000,000) 378,807 166,994 12,081,274 9,960,423 2,120,851
(amounts in euros) 2010
SecurityBalance at 31.12.2009
Purchases/(Sales)
Change in fair value reserve
ImpairmentExchange
differencesBalance at 31.12.2010
Cost pricePotential
gain
Equity instruments:
EDP Renováveis, S.A. 8,380,068 1,992,977 1,771,615 (5,205,460) - 6,939,200 6,640,000 299,200
SEIF - South Europe Infrastructure Equity Finance 4,052,818 555,000 835,014 - - 5,442,832 4,243,721 1,199,111
Corporación Interamericana para el Financiamiento de Infraestructura 1,992,123 - 2,852,542 - 155,649 5,000,314 1,975,662 3,024,652
MTS Portugal ,SGMR, S.A. 153,127 - - - - 153,127 153,127 0
Other - 927,903 - (927,903) - - 927,903 (927,903)
14,578,136 3,475,880 5,459,171 (6,133,363) 155,649 17,535,473 13,940,413 3,595,060
The Bank was involved in the South Europe Infrastructure Equity Finance (SEIEF) capital increases in 2011 and
2010, investing an amount of €640,000 and €550,000 respectively. The Bank has undertaken to provide up to
€10,000,000 in equity funding at the fund’s request, whenever a new operation is realised.
In June 2008, the Bank acquired 1,263,962 EDP Renováveis, S.A. shares as part of the Initial Public Offering
(IPO) on Euronext Lisbon at a unit price of €8 per share. In 2010 the Bank made several stock market
acquisitions, pursuant to which, at 31 December 2010, investment corresponded to 0.18% of capital. In 2010, The
Bank also recorded impairment of €5,205,460 on these shares. During the course of 2011 the Bank disposed of
all of its investment realising capital gains of €1,204,725 (Note 27).
The “other equity instruments” account heading comprises non-voting preference shares issued by Caixa Geral
Finance Limited, giving a right to a quarterly preferential dividend, at the company’s discretion, equivalent to
annual interest at the Euribor rate plus a spread. Caixa Geral Finance may redeem the preference shares starting
from the tenth year after their issue (June 2014 and September 2015) with a 1% increase in spread if failing to do
so.

Annual Report – 2011
150
The potential capitals losses on shares classified in the “debt instruments” and “other equity capital” account
headings, recognised in the fair value reserve, at 31 December 2011 and 2010, totalled €120,144,029 and
€40,825,517 respectively, of which €100,203,706 and €27,137,908, respectively for government bonds.
The investment in Corporación Interamericana para el Financiamento de Infraestructura was made in 2001 for
USD 4,000,000 . In August 2008, the Bank acquired 1,000,000 shares for a total amount of USD 1,170,000.
Exposure to foreign exchange risk is hedged by funding in US dollars with the change in fair value in 2011 and
2010 resulting from the foreign exchange component being recognised in results.
The Bank reclassified its financial assets held for trading category securities to the available for sales financial
assets category on 1 July 2008, in conformity with the amendment to the IAS 39 Standard approved on 13
October 2008. Owing to the turbulence in the financial markets in 2008, the fact that the Bank does not expect to
dispose of these securities over the short term explains the reason for the transfer between categories.
Information on the impact of the reclassification of these securities, in income and fair value reserves account
headings, excluding their fiscal effect, is set out below:
Amount Amount
(amounts in euros) 31-12-2011 31-12-2010
Fair value 5,652,174 7,424,229
Accrued interest 4,399 3,471
Book value 5,656,573 7,427,700
Fair value reserve (5,865,860) (4,093,805)
Capital gains/losses in income for period - 329,758
Impact in income for period if the reclassification had not been made (1,772,055) (1,602,996)
The fiscal effect is not reflected in the amounts.
Collateralised debt securities with a nominal value of €404,470,000 and €351,180,000 respectively (Note 33)
were recognised in this account heading at 31 December 2011 and 2010.
9. INVESTMENTS IN CREDIT INSTITUTIONS
This account heading comprises the following:
(amounts in euros) 2011 2010
Loans
Branches of other domestic credit institutions 20,000,000 -
Term deposits
In Portugal 6,004,581 6,595,600
Interest receivable 77,038 66,337
26,081,619 6,661,937
At 31 December 2011, “loans” were made to Caixa Geral de Depósitos, S.A. – France Branch and matured in
January 2012.
At 31 December 2011 and 2010, “term deposits” were taken out with Caixa Geral de Depósitos, S.A. and matured
in the first quarter of the following year and were denominated in euros.

Annual Report – 2011
151
10. LOANS AND ADVANCES TO CUSTOMERS
This account heading comprises the following:
(amounts in euros) 2011 2010
Non-securitised domestic credit
Loans 419,484,876 417,661,099
Sight deposit overdrafts 5,693,494 6,002,978
Other credit 10,229,736 9,901,847
Securitised domestic credit
Commercial paper 15,300,000 11,350,000
Foreign loans
Loans 307,963,193 376,082,487
Current account credit 358,573 2,835,682
Sight deposit overdrafts - 1
Other credit 70,773 48,302
Value adjustments related to hedged assets (Note 10) 1,442,632 1,491,606
760,543,277 825,374,002
Interest receivable 3,917,068 2,563,840
Deferred income
Commissions associated with amortised cost ( 2,523,847 ) ( 3,334,398 )
Interest ( 64,427 ) ( 8,704 )
761,872,071 824,594,740
Overdue credit and interest 5,441,555 9,068,087
767,313,626 833,662,827
Provisions for bad debts (Note 19) ( 60,210,686 ) ( 36,795,958 )
Provisions for overdue loans (Note 19) ( 4,579,235 ) ( 3,200,046 )
( 64,789,921 ) ( 39,996,004 )
702,523,705 793,666,823
The Bank also set up a provision for general credit risks totalling €6,281,811 and €7,072,514 at 31 December
2011 and 2010, respectively (Note 19).
This account was broken down as follows, by periods to maturity at 31 December 2011 and 2010:
(amounts in euros) 2011 2010
Up to three months 26,150,000 12,198,917
Three months to one year 20,744,913 12,792,890
One to five years 214,788,278 241,250,807
More than five years 492,808,019 550,292,726
Current account overdrafts 6,052,067 8,838,662
760,543,277 825,374,002

Annual Report – 2011
152
The sectoral distribution of loans and advances to customers, excluding overdue credit, at 31 December 2011
and 2010, was as follows:
(amounts in euros) 2011 2010
Sector of activity Amount % Amount %
Manufacturing
Electricity, water and gas generation and distribution 120,823,388 15.9 135,765,101 16.4
Food beverages and tobacco industries 10,427,577 1.4 11,199,835 1.4
Base metallurgical and metal industries 5,607,273 0.7 5,617,275 0.7
Textiles industry 7,729,834 1.0 7,619,182 0.9
Chemicals and synthetic or artificial fibres manufacturing 9,528,062 1.3 9,881,345 1.2
Paper pulp, card and publishing and printing thereof 552,626 0.1 631,574 0.1
Manufacture of electrical and optical equipment 740,016 0.1 791,294 0.1
Manufacturing 23,101,876 3.0 1,279,848 0.2
Manufacture of articles of rubber and plastics 238,464 0.0 343,083 0.0
Properties, rentals and corporate services
Property activities 56,542,359 7.4 59,433,875 7.2
Other 105,630,199 13.9 138,192,391 16.7
Transport, warehousing and communications 224,330,893 29.5 241,036,829 29.2
Construction 98,798,795 13.0 100,070,640 12.1
Wholesale/retail 2,750,584 0.4 20,510,887 2.5
Health and social security 16,983,095 2.2 17,627,511 2.1
Financial activities 15,857,647 2.1 15,667,970 1.9
Hotels and restaurants 3,875,118 0.5 5,036,398 0.6
Other activities and collective, social and personal services 44,327,976 5.8 42,068,562 5.1
Loans and advances to individual customers 12,697,493 1.7 12,600,402 1.5
760,543,277 100 825,374,002 100
The Bank, in 2011, disposed of credit operations for a global amount of €22,456,571, with a book value of
€23,417,261, comprising capital losses of €960,690 (Note 29).
11. OTHER TANGIBLE ASSETS
Information on movements in the “other tangible assets” account headings for the years 2011 and 2010 is set out
below:
2011
Balance at 31.12.10 Depreciation for period
Write-offs (net) Net amount at 31.12.11
(amounts in euros) Gross amountAccumulated depreciation Acquisitions
Property:
For own use 16,200,020 (4,135,759) 135,095 (492,937) - 11,706,419
Other property 77,843 (77,843) - - - -
Equipment:
Furniture and materials 1,461,813 (1,173,793) 1,651 (61,482) - 228,189
Transport material 148,836 (107,690) - (13,914) (13,317) 13,916
IT equipment 1,937,051 (1,780,923) 143,408 (153,859) - 145,677
Interior installations 1,810,123 (1,767,463) - (11,320) - 31,339
Security equipment 240,087 (240,087) - - - -
Plant and machinery 567,813 (498,342) 1,458 (25,714) - 45,215
Property leases:
IT equipment 17,262 (5,754) - (5,754) - 5,754
22.460.849 (9.787.654) 281.611 (764.981) (13.317) 12.176.508

Annual Report – 2011
153
2010
Balance at 31.12.09 Depreciation for period
Write-offs (net) Net amount at 31.12.10
(amounts in euros) Gross amountAccumulated depreciation Acquisitions
Property:
For own use 16,200,020 (3,656,331) - (479,428) - 12,064,261
Other property 77,843 (77,843) - - - -
Equipment:
Furniture and materials 1,460,699 (1,110,538) 1,114 (63,254) - 288,020
Transport material 148,836 (77,124) (30,565) - 41,147
IT equipment 1,733,031 (1,588,703) 218,864 (207,064) - 156,128
Interior installations 1,810,123 (1,753,376) - (14,087) - 42,659
Security equipment 240,087 (240,087) - - - -
Plant and machinery 567,813 (472,315) - (26,027) - 69,471
Property leases:
Transport material 223,550 (178,840) - - (44,710) -
IT equipment - - 17,262 (5,754) - 11,508
22.462.003 (9.155.159) 237.240 (826.179) (44.710) 12.673.195
12. INTANGIBLE ASSETS
Information on movements in the “intangible assets” account headings for the years 2011 and 2010 is set out
below:
2011
Balance at 31.12.10Acquisitions Transfers
Depreciation forperiod
Net amount at 31.12.11
(amounts in euros)Gross amount
Accumulated depreciation
Automatic data processing systems 4,231,728 (4,149,464) 325,321 68,551 (167,315) 308,822
Intangible assets in progress 306,558 - 11,172 (68,551) - 249,180
4,538,286 (4,149,464) 336,494 - (167,315) 558,001
2010
Balance at 31.12.09Acquisitions
Depreciation for period
Net amount at 31 December 2010
(amounts in euros)Gross amount
Accumulated depreciation
Automatic data processing systems 4,169,605 (3,977,862) 62,123 (171,602) 82,265
Intangible assets in progress 258,192 - 48,366 - 306,559
4,427,797 (3,977,862) 110,489 (171,602) 388,823
At 31 December 2011 and 2010, intangible assets in progress comprised expenditure incurred on the
development of software which was still not in use at the said dates.

Annual Report – 2011
154
13. INVESTMENTS IN SUBSIDIARIES, ASSOCIATED COMPANIES AND JOINTLY
CONTROLLED ENTITIES
The balance on this account heading, at 31 December 2011 and 2010, comprised:
(amounts in euros) 2011 2010
Caixa Desenvolvimento, SGPS, S.A. 2,500,000 2,500,000
Fundo de Capital de Risco Energias Renováveis – Caixa Capital 45,500,000 45,500,000
Caixa Capital – Capital de Risco, S.A. 14,575,724 14,575,724
CGD - Investimentos em Instituições Financeiras, Ltda. 44,419 22,721
CaixaBI – Brasil, Serviços de Assessoria Financeira, Ltda. 3,725 -
62,623,869 62,598,445
In November 2011, the Bank formed CaixaBI Brasil – Serviços de Assessoria Financeira Ltda., in Brazil with the
corporate object of providing consultancy services to companies on capital structuring issues, business strategy
and connected matters, in addition to consultancy and services for mergers and the buying and selling of
companies and Bank financing structuring from other entities. The company is 90% owned by the Bank and 10%
owned by Caixa Desenvolvimento SGPS, S.A..
In July 2010 the Bank acquired 50% of the capital of CGD – Participações em Instituições Financeiras, Ltda.
(CGD Participações), for the amount of €22,721 with the remaining 50% of the capital being held by Banco Caixa
Geral Brasil. This vehicle was set up to acquire 70% of the share capital of Banif Corretora de Valores e Câmbio,
S.A. (Banif CVC) for the amount of 123.9 million reais (€51.3 million at 31 December 2011), as provided for in the
agreement entered into on 2 June 2010. The Bank, in 2011, paid up the capital increase agreed in 2010 for the
amount of 50,000 reais (€21,698) with 65,013,200 reais (€26,910,551) of capital to be paid by CGD Participações
still outstanding. In February 2012 23,750,000 reais (€10,409,818) was paid up.
The definitive contract for the acquisition of Banif CVC was signed on 6 February 2012.
The shareholders’ agreement of Banif Corretora de Valores e Câmbio entered into on the same date considers
the following options:
Put option by Banif Banco de Investimento (Brasil), S.A. (Banif) to CGD Participações, at the exclusive
discretion of Banif, in the period between the 12th and 60th month from the date of the signing of the shares
sales/purchase contract of 2 June 2010. The price will vary on the basis of the net profit for the period up to
the date upon which the option is realised.
Call option on Banif by CGD Participações at the exclusive discretion of CGD Participações, starting from
the 60th month after the signing of the shares sales/purchase contract of 2 June 2010. The price will vary on
the basis of the net profit for the period up to the date upon which the option is realised.
On 16 December 2011, the Investors’ meeting of Fundo de Capital de Risco Energias Renováveis – Caixa
Capital, decided to liquidate the Fund, preferably by the end of first quarter 2012.
Caixa Desenvolvimento reimbursed accessory capital payments for the amount of €13,000,000, in 2010.

Annual Report – 2011
155
The financial data taken from the separate accounts of the subsidiaries for the last financial year can be
summarised as follows:
Percentage investment (%)
Entity(amounts in euros)
Registered office
Currency Direct Effective Date Assets Profit/ (Loss)Shareholders’
equity
Caixa Desenvolvimento, SGPS, S.A. Lisbon Euros 100,00% 100.00% 31-12-2011 4,285,174 31,433 4,127,360
Caixa Capital, S.A. Lisbon Euros 100,00% 100.00% 31-12-2011 39,571,414 5,148,225 38,103,120
FCR Energias Renováveis - Caixa Capital Lisbon Euros 91,00% 91.00% 31-12-2011 33,212,331 1,966,929 33,042,135
CGD - Investimentos em Instituições Financeiras, Ltda. (*)
São Paulo Reais 50,00% 50.00% - - - -
CaixaBI Brasil – Serviços de Assessoria Financeira Ltda São-PauloReais
90,00% 100.00% 31-12-20116,019,000 5,162,365 5,162,365
Euros 2,491,411 2,136,829 2,136,829
(*) No activity in 2011
Caixa Desenvolvimento, SGPS, S.A., formed in 1998, has its registered office in Portugal. Its corporate object is
to operate as a holding company as an indirect form of performing economic activities.
Caixa Capital - Capital de Risco, S.A. (Caixa Capital) has its registered office in Lisbon and was formed on 31
December 1990 under Decree Law 17/86 of 05 February. The company’s corporate object is to support and
promote investment and technological innovation by making temporary equity investments in projects or
companies. It is also authorised to provide assistance to the financial, technical, administrative and commercial
management of its subsidiary companies. It managed five venture capital funds at 31 December 2011.
Fundo de Capital de Risco para Investidores Qualificados Energias Renováveis – Caixa Capital (FCR Energias
Renováveis) was formed in January 2006, with a subscribed capital of €50,000,000 comprising 2,000 investment
units. The fund’s objective is to invest its assets in equity investments in companies with high growth and
appreciation potential, operating in the field of generating electricity from renewable energy sources. The Bank
subscribed for 1,820 investment units with a nominal value of €45,500,000, of which €18,900,000 (Note 20) was
outstanding at 31 December 2011 and 2010.
14. INCOME TAX
Tax assets and liabilities balances, at 31 December 2011 and 2010, were:
(amounts in euros) 2011 2010
Current tax assets
Income tax to be recovered
Current year 14,584,534 8,987,537
Past years 8,399,709 -
22,984,243 8,987,537
Current tax liabilities
Income tax payable ( 1,887,009 ) ( 158,570 )
21,097,234 8,828,967
Deferred tax assets
Temporary differences 58,383,503 27,146,888
Deferred tax liabilities ( 1,990,720 ) ( 2,166,083 )
56,392,783 24,980,805
At 31 December 2011, the “Income tax to be recovered – for period” account heading included €951,974 based
on a complaint filed by the Bank relating to its IRC for 1999 and received in January 2012.

Annual Report – 2011
156
The “income tax to be recovered” account heading, at 31 December 2010, included €657,900 in respect of a
claim made by the Bank on its IRC for 2000 which was received in December 2011.
The following table provides details and information on deferred tax movements in 2011 and 2010:
2011
Balance at31.12.2010
Change
Balance at31.12.2011(amounts in euros)
IncomeShareholders’
equity
Commissions 9,095,194 (3,902,877) - 5,192,318
Valuation of available for sale financial assets 8,419,310 - 22,550,943 30,970,253
Provisions not accepted for fiscal purposes 7,383,420 12,748,530 - 20,131,949
Impairment of available for sale financial assets 271,638 8,880 - 280,518
Property revaluations not accepted for fiscal purposes (188,756) 6,502 - (182,254)
24,980,805 8,861,035 22,550,943 56,392,783
(amounts in euros)
2010
Balance at31.12.2009
Change Rate Change
Balance at31.12.2010
IncomeShareholders’ equity
IncomeShareholders’
equity
Commissions 8,071,277 385,144 - 638,775 - 9,095,196
Valuation of available for sale financial assets 445,032 - 7,455,237 - 519,040 8,419,309
Provisions not accepted for fiscal purposes 9,261,050 (2,734,693) - 857,063 - 7,383,420
Impairment of available for sale financial assets 230,232 18,479 - 22,926 - 271,637
Property revaluations not accepted for fiscal purposes (178,425) 6,080 - ( 16,412 ) - (188,757)
Revaluation of financial hedge derivatives instruments 150,186 (150,186) - - - -
Valuation of other assets at fair value through profit or loss (10,863) 10,863 - - - -
Value adjustments to hedged assets (123,250) 123,250 - - - -
17,845,238 (2,341,063) 7,455,237 1,502,352 519,040 24,980,804
Information on tax on profit recognised in the income statement and the tax burden, measured by the ratio
between the appropriation for tax on profit and net profit for the year before tax is set out below:
(amounts in euros) 2011 2010
With an impact in income for period
Current year tax
IRC for period 2,017,188 12,604,999
Banking sector contribution 677,236 -
Adjustments for past years ( 998,647 ) ( 39,612 )
1,695,777 12,565,387
Deferred tax
Registration and reversal of temporary differences ( 8,861,035 ) 838,711
Total tax in income statement ( 7,165,258 ) 13,404,098
Income before tax and non-controlling interests ( 5,700,742 ) 59,007,227
Fiscal burden in income statement 125,69% 22,72%
With an impact in reserves
Deferred tax – Fair value reserve 22,550,943 7,974,278
Current year tax – Capital gains on treasury shares (Note 21) - 3,913,114
Current year tax 23,400 182,320
Total tax in reserves 22,574,343 12,069,712
Total tax in shareholders’ equity 15,409,084 25,473,810
For the year ended 31 December 2011, the balance in the “adjustments for past years” balance sheet heading
included €951,974 from a complaint filed by the Bank on its IRC for 1999 which was received in January 2012.
Current tax reflected in reserves for the amount of €23,400 and €182,320 in 2011 and 2010, refers to the tax
associated with the revaluation of debt securities sold in 2011 and 2010 and classified as available for sale
financial assets in the year, for the purposes of assessing tax income for past years. The deferred tax recognised
in the same account heading refers to the revaluation during the year of equity investments and debt securities
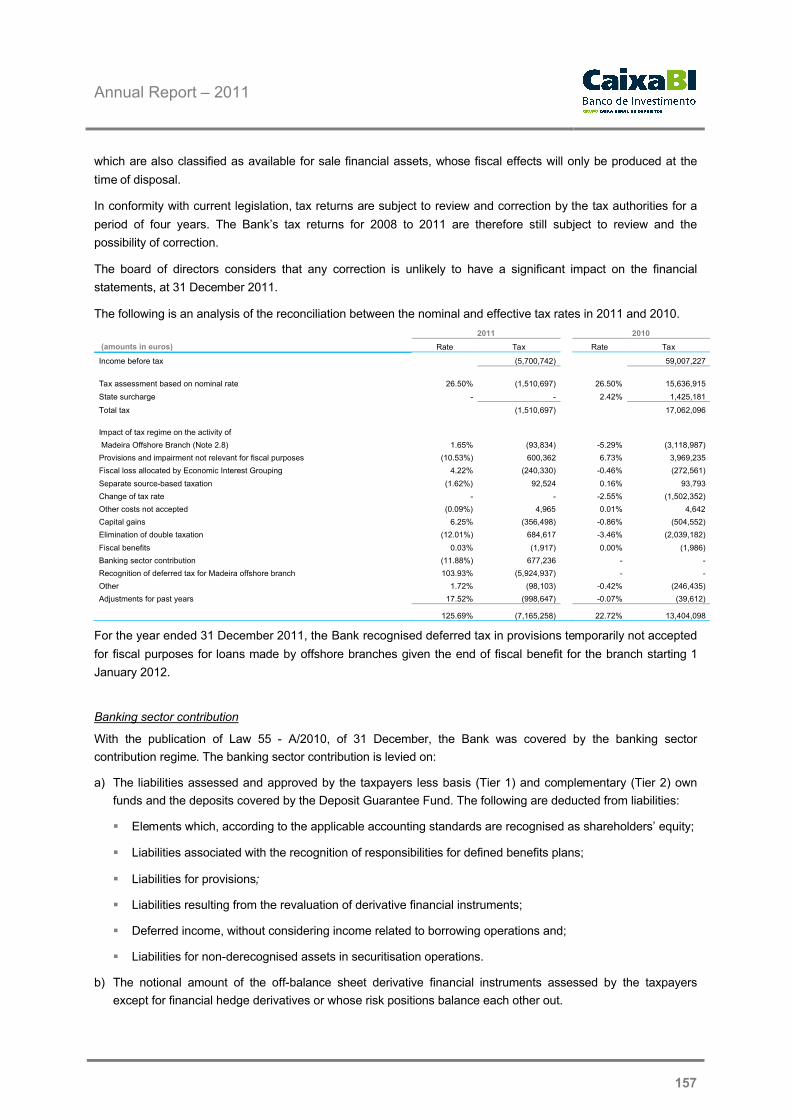
Annual Report – 2011
157
which are also classified as available for sale financial assets, whose fiscal effects will only be produced at the
time of disposal.
In conformity with current legislation, tax returns are subject to review and correction by the tax authorities for a
period of four years. The Bank’s tax returns for 2008 to 2011 are therefore still subject to review and the
possibility of correction.
The board of directors considers that any correction is unlikely to have a significant impact on the financial
statements, at 31 December 2011.
The following is an analysis of the reconciliation between the nominal and effective tax rates in 2011 and 2010.
2011 2010
(amounts in euros) Rate Tax Rate Tax
Income before tax (5,700,742) 59,007,227
Tax assessment based on nominal rate 26.50% (1,510,697) 26.50% 15,636,915
State surcharge - - 2.42% 1,425,181
Total tax (1,510,697) 17,062,096
Impact of tax regime on the activity of
Madeira Offshore Branch (Note 2.8) 1.65% (93,834) -5.29% (3,118,987)
Provisions and impairment not relevant for fiscal purposes (10.53%) 600,362 6.73% 3,969,235
Fiscal loss allocated by Economic Interest Grouping 4.22% (240,330) -0.46% (272,561)
Separate source-based taxation (1.62%) 92,524 0.16% 93,793
Change of tax rate - - -2.55% (1,502,352)
Other costs not accepted (0.09%) 4,965 0.01% 4,642
Capital gains 6.25% (356,498) -0.86% (504,552)
Elimination of double taxation (12.01%) 684,617 -3.46% (2,039,182)
Fiscal benefits 0.03% (1,917) 0.00% (1,986)
Banking sector contribution (11.88%) 677,236 - -
Recognition of deferred tax for Madeira offshore branch 103.93% (5,924,937) - -
Other 1.72% (98,103) -0.42% (246,435)
Adjustments for past years 17.52% (998,647) -0.07% (39,612)
125.69% (7,165,258) 22.72% 13,404,098
For the year ended 31 December 2011, the Bank recognised deferred tax in provisions temporarily not accepted
for fiscal purposes for loans made by offshore branches given the end of fiscal benefit for the branch starting 1
January 2012.
Banking sector contribution
With the publication of Law 55 - A/2010, of 31 December, the Bank was covered by the banking sector
contribution regime. The banking sector contribution is levied on:
a) The liabilities assessed and approved by the taxpayers less basis (Tier 1) and complementary (Tier 2) own
funds and the deposits covered by the Deposit Guarantee Fund. The following are deducted from liabilities:
Elements which, according to the applicable accounting standards are recognised as shareholders’ equity;
Liabilities associated with the recognition of responsibilities for defined benefits plans;
Liabilities for provisions;
Liabilities resulting from the revaluation of derivative financial instruments;
Deferred income, without considering income related to borrowing operations and;
Liabilities for non-derecognised assets in securitisation operations.
b) The notional amount of the off-balance sheet derivative financial instruments assessed by the taxpayers
except for financial hedge derivatives or whose risk positions balance each other out.
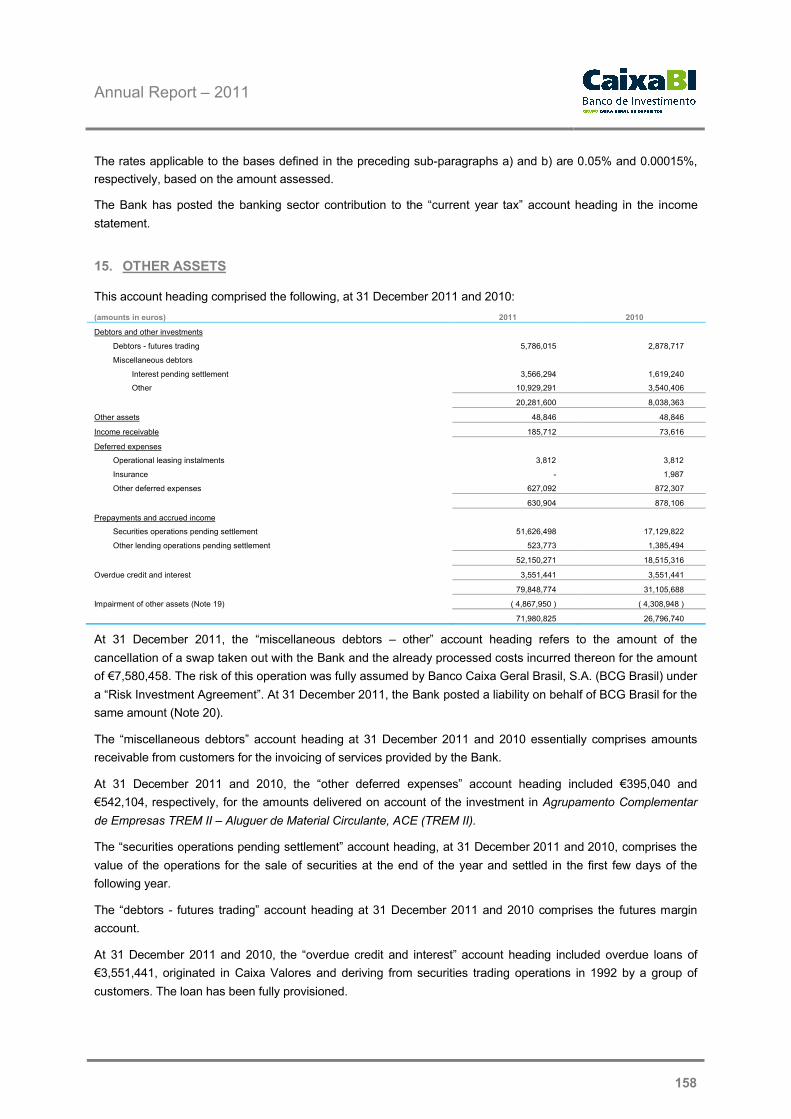
Annual Report – 2011
158
The rates applicable to the bases defined in the preceding sub-paragraphs a) and b) are 0.05% and 0.00015%,
respectively, based on the amount assessed.
The Bank has posted the banking sector contribution to the “current year tax” account heading in the income
statement.
15. OTHER ASSETS
This account heading comprised the following, at 31 December 2011 and 2010:
(amounts in euros) 2011 2010
Debtors and other investments
Debtors - futures trading 5,786,015 2,878,717
Miscellaneous debtors
Interest pending settlement 3,566,294 1,619,240
Other 10,929,291 3,540,406
20,281,600 8,038,363
Other assets 48,846 48,846
Income receivable 185,712 73,616
Deferred expenses
Operational leasing instalments 3,812 3,812
Insurance - 1,987
Other deferred expenses 627,092 872,307
630,904 878,106
Prepayments and accrued income
Securities operations pending settlement 51,626,498 17,129,822
Other lending operations pending settlement 523,773 1,385,494
52,150,271 18,515,316
Overdue credit and interest 3,551,441 3,551,441
79,848,774 31,105,688
Impairment of other assets (Note 19) ( 4,867,950 ) ( 4,308,948 )
71,980,825 26,796,740
At 31 December 2011, the “miscellaneous debtors – other” account heading refers to the amount of the
cancellation of a swap taken out with the Bank and the already processed costs incurred thereon for the amount
of €7,580,458. The risk of this operation was fully assumed by Banco Caixa Geral Brasil, S.A. (BCG Brasil) under
a “Risk Investment Agreement”. At 31 December 2011, the Bank posted a liability on behalf of BCG Brasil for the
same amount (Note 20).
The “miscellaneous debtors” account heading at 31 December 2011 and 2010 essentially comprises amounts
receivable from customers for the invoicing of services provided by the Bank.
At 31 December 2011 and 2010, the “other deferred expenses” account heading included €395,040 and
€542,104, respectively, for the amounts delivered on account of the investment in Agrupamento Complementar
de Empresas TREM II – Aluguer de Material Circulante, ACE (TREM II).
The “securities operations pending settlement” account heading, at 31 December 2011 and 2010, comprises the
value of the operations for the sale of securities at the end of the year and settled in the first few days of the
following year.
The “debtors - futures trading” account heading at 31 December 2011 and 2010 comprises the futures margin
account.
At 31 December 2011 and 2010, the “overdue credit and interest” account heading included overdue loans of
€3,551,441, originated in Caixa Valores and deriving from securities trading operations in 1992 by a group of
customers. The loan has been fully provisioned.

Annual Report – 2011
159
Caixa Valores took legal action against the group of customers in September 1994, accusing them of
responsibility for realising the referred to operations and claiming an amount of €6,003,180 plus interest accruing
since June 1993. As the action is still in progress, the Bank has not recorded any asset related with this situation.
16. CENTRAL BANKS’ RESOURCES
The “central banks’ resources” at 31 December 2011 comprises term deposits with the Bank of Portugal, as
collateral for European Central Bank funding. These deposits are collateralised by securities with a nominal value
of €399,275,000 and €377,321,000 respectively in 2011 and 2010 (Note 33).
(amounts in euros) 2011 2010
Term
Term deposits 232,000,000 330,000,000
Interest payable 136,123 157,222
232,136,123 330,157,222
Information on the periods to maturity of other credit institutions’ resources is set out below:
(amounts in euros) 2011 2010
Up to three months 57,000,000 330,000,000
Three months to three years 175,000,000 -
232,000,000 330,000,000
Fixed rate interest set by the European Central Bank is paid on these deposits.
17. OTHER CREDIT INSTITUTIONS’ RESOURCES
This account heading comprises the following:
(amounts in euros) 2011 2010
Repayable on demand
Sight deposits
Credit institutions In Portugal 282,710 133,661
Credit institutions abroad 1,230 1,230
Term
Very short term resources 435,916,145 470,228,074
Term deposits 318,900,000 327,390,000
Other resources – sight deposit overdrafts - 2,567
Credit institutions’ resources abroad
Other resources – sight deposit overdrafts - 404,341
755,100,085 798,159,873
Interest payable
Credit institutions’ resources in Portugal 8,254,845 826,746
763,354,930 798,986,619
Information on the periods to maturity of other credit institutions’ resources is set out below:
(amounts in euros) 2011 2010
Sight deposits and overdrafts 283,940 541,799
Up to three months 747,516,145 771,818,074
Three months to three years 7,300,000 25,800,000
755,100,085 798,159,873

Annual Report – 2011
160
18. CUSTOMER RESOURCES AND OTHER LOANS:
This account heading comprises the following:
(amounts in euros) 2011 2010
Deposits
Sight 37,845,272 54,615,978
Term 94,705,920 57,981,816
132,551,192 112,597,794
Value adjustments related to hedged liabilities (Note 7) 345,377 331,207
132,896,569 112,929,001
Interest payable on deposits 1,953,632 2,185,268
134,850,201 115,114,269
Customers’ resources and other loans, at 31 December 2011 and 2010, had the following structure in accordance
with their respective periods to maturity:
(amounts in euros) 2011 2010
Repayable on demand 37,845,272 54,615,978
Up to three months 81,206,600 44,405,800
Three months to one year 3,000,000 3,000,000
One to five years 5,000,000 5,000,000
More than five years 5,499,320 5,576,016
132,551,192 112,597,794
19. PROVISIONS AND IMPAIRMENT
Information on movements in the Bank’s provisions and impairment accounts for the years 2011 and 2010 is set out below:
2011
(amounts in euros)
Balance at31.12.10
Net provisions in income
statementUse Transfers
Exchange differences
Balance at31.12.11
Provisions for loans and advances to customers (Note 10):
. Bad debts 36,795,958 26,076,018 (2,661,290) - - 60,210,686
. Overdue credit 3,200,046 320,611 (404,292) 1,412,831 50,039 4,579,235
39,996,004 26,396,630 (3,065,582) 1,412,831 50,039 64,789,922
Provisions for general credit risks (Note 10) 7,072,514 (790,703) - - - 6,281,811
Provisions for other risks and liabilities 2,683,179 2,079,893 - - - 4,763,072
9,755,693 1,289,190 - - - 11,044,883
Impairment of available for sale financial assets (Note 8) 8,006,724 4,520,152 (5,205,460) (559,002) 61,244 6,823,658
Impairment of other assets (Note 15) 4,308,948 1,412,830 - (853,829) - 4,867,950
12,315,672 5,932,982 (5,205,460) (1,412,831) 61,244 11,691,607
62,067,370 33,618,802 (8,271,042) - 111,283 87,526,413

Annual Report – 2011
161
2010
(amounts in euros)
Balance at31.12.09
Net provisions in income
statementUse Transfers
Exchange differences
Balance at31.12.10
Provisions for loans and advances to customers (Note 10):
. Bad debts 23,128,219 14,919,084 (1,251,345) - - 36,795,958
. Overdue credit 1,580,868 (161,161) - 1,669,415 110,925 3,200,046
24,709,087 14,757,923 (1,251,345) 1,669,415 110,925 39,996,004
Provisions for general credit risks (Note 10) 14,690,998 (7,618,484) - - - 7,072,514
Provisions for other risks and liabilities 11,387,267 (8,342,542) (361,546) - - 2,683,179
26,078,265 (15,961,025) (361,546) - - 9,755,693
Impairment of available for sale financial assets (Note 8) 1,737,599 6,913,262 - (779,899) 135,762 8,006,724
Impairment of other assets (Note 15) 4,315,936 882,528 - (889,516) - 4,308,948
6,053,535 7,795,790 - (1,669,415) 135,762 12,315,672
56,840,888 6,592,687 (1,612,892) - 246,687 62,067,370
The Bank ‘s provisions for bad debts and for general credit risks at 31 December 2011 and 2010 were higher than
the limits defined by the Bank of Portugal, to provide for the risk associated with a series of operations for loans
and advances to customers.
Provisions for other risks and liabilities comprise the Bank’s best estimate of eventual amounts to be spent on
settling legal, fiscal and other contingencies.
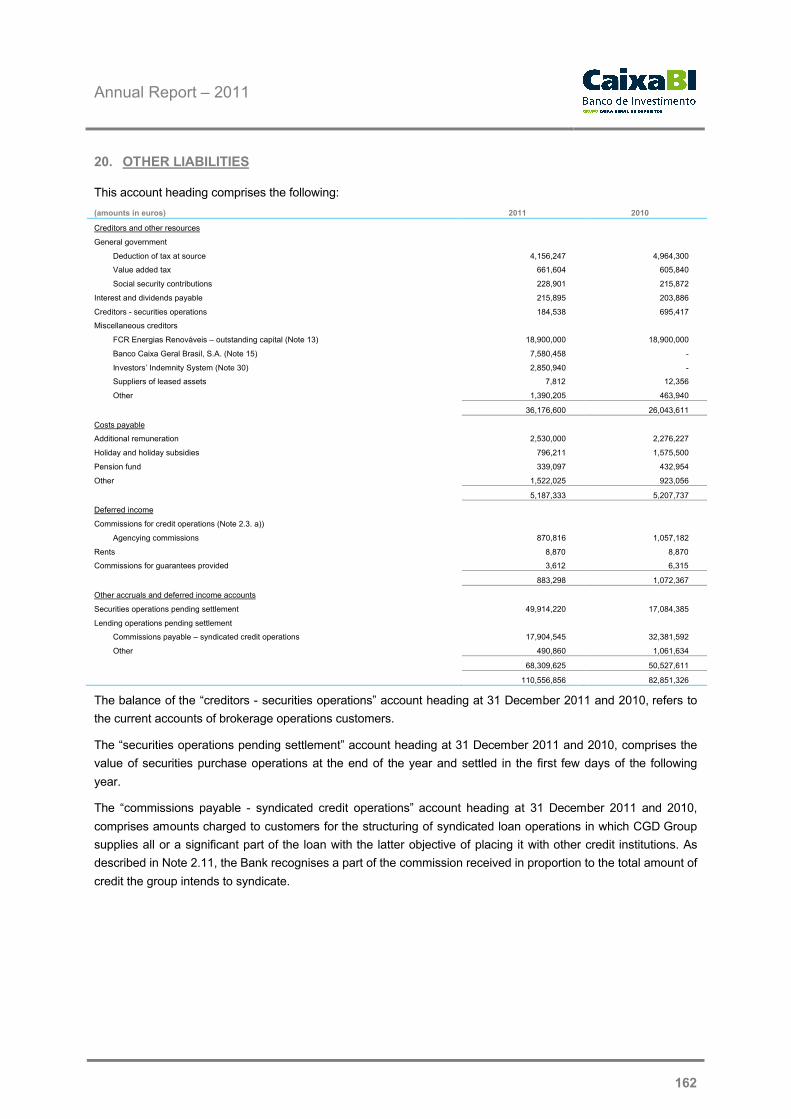
Annual Report – 2011
162
20. OTHER LIABILITIES
This account heading comprises the following:
(amounts in euros) 2011 2010
Creditors and other resources
General government
Deduction of tax at source 4,156,247 4,964,300
Value added tax 661,604 605,840
Social security contributions 228,901 215,872
Interest and dividends payable 215,895 203,886
Creditors - securities operations 184,538 695,417
Miscellaneous creditors
FCR Energias Renováveis – outstanding capital (Note 13) 18,900,000 18,900,000
Banco Caixa Geral Brasil, S.A. (Note 15) 7,580,458 -
Investors’ Indemnity System (Note 30) 2,850,940 -
Suppliers of leased assets 7,812 12,356
Other 1,390,205 463,940
36,176,600 26,043,611
Costs payable
Additional remuneration 2,530,000 2,276,227
Holiday and holiday subsidies 796,211 1,575,500
Pension fund 339,097 432,954
Other 1,522,025 923,056
5,187,333 5,207,737
Deferred income
Commissions for credit operations (Note 2.3. a))
Agencying commissions 870,816 1,057,182
Rents 8,870 8,870
Commissions for guarantees provided 3,612 6,315
883,298 1,072,367
Other accruals and deferred income accounts
Securities operations pending settlement 49,914,220 17,084,385
Lending operations pending settlement
Commissions payable – syndicated credit operations 17,904,545 32,381,592
Other 490,860 1,061,634
68,309,625 50,527,611
110,556,856 82,851,326
The balance of the “creditors - securities operations” account heading at 31 December 2011 and 2010, refers to
the current accounts of brokerage operations customers.
The “securities operations pending settlement” account heading at 31 December 2011 and 2010, comprises the
value of securities purchase operations at the end of the year and settled in the first few days of the following
year.
The “commissions payable - syndicated credit operations” account heading at 31 December 2011 and 2010,
comprises amounts charged to customers for the structuring of syndicated loan operations in which CGD Group
supplies all or a significant part of the loan with the latter objective of placing it with other credit institutions. As
described in Note 2.11, the Bank recognises a part of the commission received in proportion to the total amount of
credit the group intends to syndicate.

Annual Report – 2011
163
21. SUBSCRIBED CAPITAL AND TREASURY SHARES
Subscribed capital comprises 81,250,000 shares with a nominal value of one euro each.
Information on the Bank’s equity structure, at 31 December 2011 and 2010 is set out below:
No. shares %
Gerbanca, SGPS, S.A. 81,016,231 99.7
Other 233,769 0.3
81,250,000 100.0
The Bank owned 4,658,000 of its treasury shares at a cost price of €5,999,453, at 31 December 2009.
The Bank disposed of its treasury shares in June 2010 at €5 each, for €23,290,000 making accounting gains of
€13,377,432, net of tax of €3,913,114 (Note 14), recognised in retained earnings.
22. RESERVES, RETAINED EARNINGS AND PROFIT FOR YEAR
The composition of the reserves and retained earnings account headings at 31 December 2011 and 2010 was as
follows:
(amounts in euros) 2011 2010
Revaluation reserves
Revaluation reserve on fixed assets 4,338,403 4,338,403
Fair value reserve
Potential gains
Debt instruments ( 113,764,751 ) ( 35,385,273 )
Shares 4,983,359 4,522,963
Other equity instruments ( 6,160,983 ) ( 5,440,244 )
( 114,942,375 ) ( 36,302,554 )
Fiscal effect 32,313,249 9,738,905
( 78,290,723 ) ( 22,225,246 )
Other reserves and retained earnings
Legal reserve 45,344,162 40,783,849
Free reserve 69,948,116 43,394,305
Retained earnings 58,550,497 59,061,492
173,842,775 143,239,646
Profit for period 1,464,516 45,603,129
97,016,568 166,617,529
Revaluation reserves
Fixed assets revaluation reserves
The Bank revalued its fixed assets in 1998, under Decree Law 31/98 of 11 February. The increase of €4,338,403,
in the net value of the fixed assets was recognised in the “revaluation reserves” account heading.
Revaluation reserves may only be used to cover accrued losses or for share capital increases.
Fair value reserves
The fair value reserve recognises potential capital gains and losses on available for sale financial assets, net of
the corresponding fiscal effect.
Legal reserve
In conformity with Decree Law 298/92 of 31 December, changed by Decree Law 201/2002 of 26 September, the
Bank is required to set up a legal reserve fund until equal to its share capital or sum of free reserves and retained

Annual Report – 2011
164
earnings, if higher, annually transferring an amount of not Less than 10% of net profits to the reserve. The reserve
may only be used to cover accrued losses or for share capital increases.
Dividends
A resolution was passed at the shareholders’ meeting of 20 May 2011, to distribute €15,000,000 in dividends for
2010.
A resolution was passed at the general shareholders’ meeting of 19 February 2010, to distribute dividends of
€25,025,000 for 2009 of which amount €1,434,664 was allocated to treasury shares.
23. INTEREST AND INCOME AND INTEREST AND SIMILAR CHARGES
These headings comprise the following:
(amounts in euros) 2011 2010
Interest and similar income:
Interest on liquid assets 38,530 33,234
Interest on investments in credit institutions In Portugal 519,043 366,615
Interest on investments in credit institutions abroad 478,950 -
Interest on loans and advances to customers
Domestic credit 14,532,802 10,726,478
Foreign loans 11,595,666 9,330,670
Interest on assets held for trading:
Securities 4,058,409 9,688,398
Interest rate swaps 284,819,060 231,859,582
Interest rate guarantee contracts 554,735 21,292
Interest on other financial assets at fair value through profit or loss 419,709 631,198
Interest on available for sale financial assets 17,441,519 9,282,190
Interest on hedge derivatives 379,974 335,694
Interest on debtors and other investments 179,020 30,364
335,017,417 272,305,715
Commissions received associated with credit operations 1,000,634 821,638
336,018,051 273,127,353
Interest and similar costs:
Interest on central banks’ resources 2,948,338 1,233,861
Interest on credit institutions’ resources 18,965,920 8,643,116
Interest on customer deposits 2,984,155 1,300,238
Interest on financial liabilities held for trading
Interest rate swaps 281,708,242 228,230,808
Interest on hedge derivatives 713,233 745,797
Other Interest and costs
Interest on creditors and other resources 182 282
Other 241,551 16,354
307,561,621 240,170,456
Net interest income 28,456,430 32,956,897
24. INCOME FROM EQUITY INSTRUMENTS
This account heading, in 2011 and 2010 included €2,500,000 and €7,000,000 euros, respectively, on dividends
paid by Caixa – Desenvolvimento, SGPS, S.A. The remaining balance on this account heading for the years 2011
and 2010, comprises dividends relating to available for sale financial assets.

Annual Report – 2011
165
25. INCOME AND COSTS OF SERVICES AND COMMISSIONS
These headings comprise the following:
(amounts in euros) 2011 2010
Income from services and commissions
Commissions for guarantees provided 801,924 777,247
Commissions for commitments to third parties 141,102 135,927
For services provided
Structuring of operations 21,714,993 25,800,539
Agencying 2,636,589 2,365,402
Custodian services 915,021 725,749
Deposit and custody of securities 892,816 976,608
Collections 57,892 70,165
Other services provided 10,895,005 12,760,020
Commissions for operations on behalf of third parties 4,103,767 5,997,283
Other commissions received 16,340,397 30,578,462
58,499,506 80,187,402
Costs of services and commissions
Commissions for banking services provided by third parties 3,505,128 10,577,331
Commissions for operations performed by third parties 1,254,203 1,600,737
Commissions for operations on financial instruments 66,452 50,549
Commissions for guarantees received 1,047 5,101
Other commissions paid 998,377 -
5,825,207 12,233,718
The “other commission received” account heading for 2011 and 2010, essentially includes financial advisory
commissions.
The “costs of services and commissions – for banking services provided by third parties ” account heading for the
years 2011 and 2010 included €3,461,662 and €8,634,475 respectively, relating to commissions to be passed on
to other credit institutions in future syndications in accordance with the policy described in Note 2.11.
26. INCOME FROM ASSETS AND LIABILITIES RECOGNISED AT FAIR VALUE THROUGH
PROFIT OR LOSS
These headings comprise the following:
(amounts in euros) 2011 2010
Income from assets and liabilities held for trading
Equity instruments ( 664,224 ) 16,774,887
Debt instruments ( 4,263,012 ) ( 10,461,822 )
Derivative instruments
Interest rate swaps (26,691,885) 141,252
Futures ( 2,760,516 ) ( 9,152,905 )
Interest rate guarantee contracts 131,614 12,243
Options ( 3,561 ) 26,898
Equity swaps (17,101,307)
Other - 21,989
( 34,251,584 ) ( 19,738,765 )
Income from other financial assets at fair value through profit or loss
Debt instruments ( 755,371 ) ( 508,214 )
Income from hedge operations 75,305 171,964
Value adjustments for hedged assets and liabilities operations ( 63,144 ) ( 147,462 )
( 34,994,794 ) ( 20,222,477 )

Annual Report – 2011
166
27. INCOME FROM AVAILABLE FOR SALE FINANCIAL ASSETS
These account headings comprise the following:
(amounts in euros) 2011 2010
Income from available for sale financial assets
Debt instruments 2,473,485 2,423,464
Equity instruments 1,204,725 96,403
3,678,210 2,519,867
Losses on available for sale financial assets
Equity instruments ( 652,777 ) ( 14,062 )
Debt instruments ( 13,400 ) ( 24,813 )
( 666,177 ) ( 38,875 )
3,012,033 2,480,992
For the year ended 31 December 2011, the balance sheet heading “income from available for sale financial
assets – equity instruments” referred to the capital gains made on the sale of EDP Renováveis, S.A. shares (Note
8).
28. INCOME FROM FOREIGN EXCHANGE REVALUATIONS
This account heading comprises the following:
(amounts in euros) 2011 2010
Revaluation of forward foreign exchange position 285,392 260,892
- ( 1,458 )
285,392 259,434
29. INCOME FROM THE DISPOSAL OF OTHER ASSETS
For the year ended 31 December 2011, the account heading “income from the disposal of other assets”, included
€960,690 in loan disposal losses (Note 10).
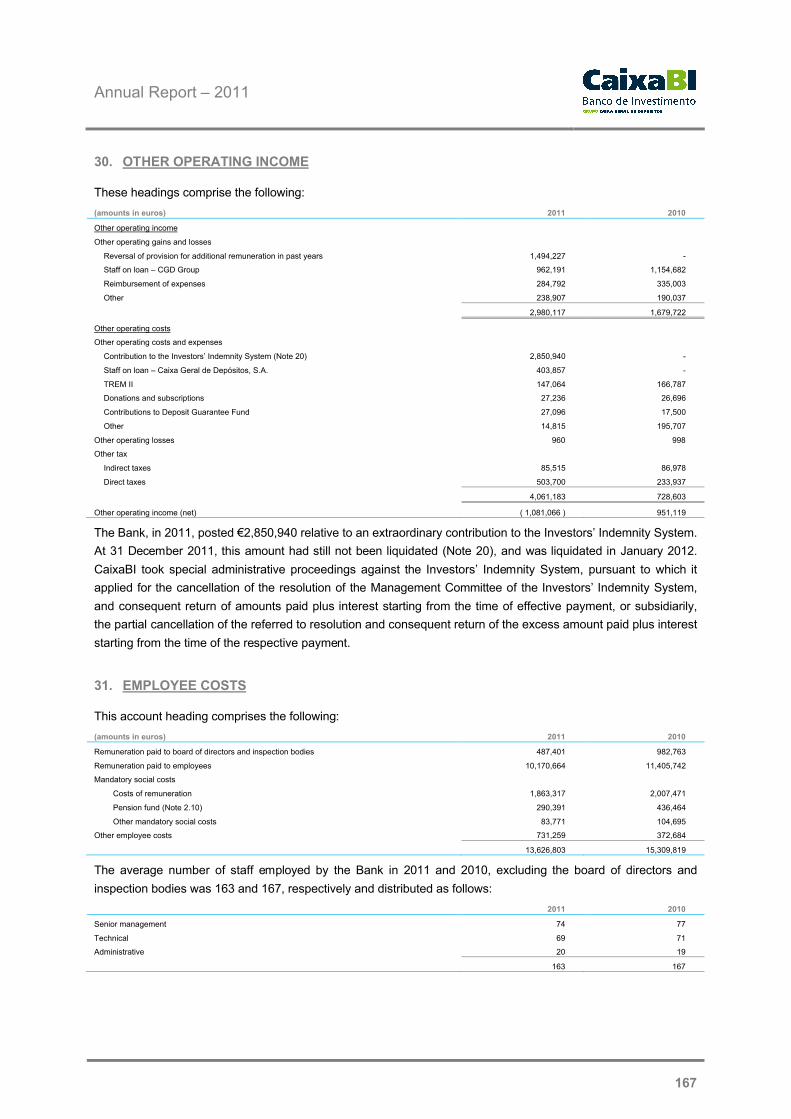
Annual Report – 2011
167
30. OTHER OPERATING INCOME
These headings comprise the following:
(amounts in euros) 2011 2010
Other operating income
Other operating gains and losses
Reversal of provision for additional remuneration in past years 1,494,227 -
Staff on loan – CGD Group 962,191 1,154,682
Reimbursement of expenses 284,792 335,003
Other 238,907 190,037
2,980,117 1,679,722
Other operating costs
Other operating costs and expenses
Contribution to the Investors’ Indemnity System (Note 20) 2,850,940 -
Staff on loan – Caixa Geral de Depósitos, S.A. 403,857 -
TREM II 147,064 166,787
Donations and subscriptions 27,236 26,696
Contributions to Deposit Guarantee Fund 27,096 17,500
Other 14,815 195,707
Other operating losses 960 998
Other tax
Indirect taxes 85,515 86,978
Direct taxes 503,700 233,937
4,061,183 728,603
Other operating income (net) ( 1,081,066 ) 951,119
The Bank, in 2011, posted €2,850,940 relative to an extraordinary contribution to the Investors’ Indemnity System.
At 31 December 2011, this amount had still not been liquidated (Note 20), and was liquidated in January 2012.
CaixaBI took special administrative proceedings against the Investors’ Indemnity System, pursuant to which it
applied for the cancellation of the resolution of the Management Committee of the Investors’ Indemnity System,
and consequent return of amounts paid plus interest starting from the time of effective payment, or subsidiarily,
the partial cancellation of the referred to resolution and consequent return of the excess amount paid plus interest
starting from the time of the respective payment.
31. EMPLOYEE COSTS
This account heading comprises the following:
(amounts in euros) 2011 2010
Remuneration paid to board of directors and inspection bodies 487,401 982,763
Remuneration paid to employees 10,170,664 11,405,742
Mandatory social costs
Costs of remuneration 1,863,317 2,007,471
Pension fund (Note 2.10) 290,391 436,464
Other mandatory social costs 83,771 104,695
Other employee costs 731,259 372,684
13,626,803 15,309,819
The average number of staff employed by the Bank in 2011 and 2010, excluding the board of directors and
inspection bodies was 163 and 167, respectively and distributed as follows:
2011 2010
Senior management 74 77
Technical 69 71
Administrative 20 19
163 167

Annual Report – 2011
168
32. GENERAL ADMINISTRATIVE EXPENDITURE
(amounts in euros) 2011 2010
Specialised services 3,732,861 5,557,033
Maintenance and repairs 1,145,980 1,062,634
Rents and leases 910,038 935,501
Travel and expenses 783,230 707,905
Communications 475,807 429,521
Advertising and publications 379,417 578,459
Water, power and fuel 116,636 118,985
Consumables 98,854 99,825
Publications 57,418 50,436
Staff training 44,805 67,849
Other third party supplies 40,655 43,442
Insurance 4,447 28,942
Other third party services 84,951 115,848
7,875,099 9,796,380
Information on the minimum payments of operational leases on transport and computer equipment at 31
December 2011 and 2010 is set out below:
(amounts in euros) 2011 2010
Up to 1 year 626,250 729,893
From 1 to 5 years 715,955 719,012
33. CONTINGENT LIABILITIES AND COMMITMENTS
Contingent liabilities associated with banking activity are recognised in off-balance sheet account headings as
follows:
(amounts in euros) 2011 2010
Contingent liabilities:
Guarantees and sureties 52,629,393 53,136,289
Asset-backed guarantees
Available for sale financial assets (Note 8) 404,470,000 351,180,000
Financial assets at fair value through profit or loss (Note 6) 1,550,000 75,591,000
458,649,393 479,907,289
Commitments:
Revocable lines of credit 75,066,972 94,521,902
Securities subscriptions 7,921,679 62,511,679
Potential liability to Investors’ Indemnity System 4,188,207 1,722,312
Term liabilities to Deposit Guarantee Fund 162,181 162,182
87,339,039 158,918,075
Liabilities for the provision of services:
Deposit and custody of securities 6,529,834,056 7,794,428,153
The “assets-backed guarantee” account heading, at 31 December 2011 and 2010 comprises the nominal value of
public debt securities pledged, by the Bank, in respect of the following situations:
(amounts in euros) 2011 2010
Pledge on securities in the “ECB assets pool” (Note 16) 399,275,000 377,321,000
Large transactions processing system (SPGT) - 44,200,000
Caixa Geral de Depósitos, S.A. – Euronext 2,500,000 2,500,000
Investors’ Indemnity System (SII) 3,830,000 2,500,000
Deposit Guarantee Fund 415,000 250,000
406,020,000 426,771,000
The object of the Deposit Guarantee Fund is to guarantee customers’ deposits in conformity with the limits
defined by the General Credit Institutions Regime. This takes the form of regular annual contributions. A part of
the said contributions takes the form of an irrevocable commitment to realise the respective contributions when

Annual Report – 2011
169
requested by the Fund. These amounts are not recognised in costs. The total value of commitments assumed
since 1996 totals €162,181.
34. RELATED ENTITIES
All companies controlled by CGD group, associated companies and the Bank’s management bodies are
considered to be entities related with the Bank.
The Bank’s financial statements, at 31 December 2011 and 2010, include the following balances and transactions
with related entities, excluding management bodies:
2011 2010
(amounts in euros)
SubsidiariesOther CGD Group
companiesSubsidiaries
Other CGD Group companies
Assets:
Loans and advances to customers - 217,706 - 153,071
Investments in credit institutions - 26,076,338 - 6,661,937
Financial assets held for trading - 56,717,138 - 33,475,505
Available for sale financial assets 9,477,047 13,914,073
Other assets 44,654 323,659 43,766 170,599
Liabilities:
Financial liabilities held for trading - (694,259,749) - (380,088,137)
Other credit institutions’ resources - (759,350,783) - (793,578,186)
Customer resources and other loans (20,780,786) (55,239,729) (10,117,907) (32,854,152)
Hedge derivatives - (1,521,387) - (1,599,779)
Other liabilities (8,870) (8,484,977) (8,870) (219,833)
Income and costs:
Net interest income (344,943) (114,149,607) (74,429) (103,788,901)
Income from financial operations - (333,116,873) - (78,411,638)
Income from equity instruments 2,500,000 - 7,000,000 242,762
Income from services and commissions (net) 21,508 1,820,624 18,809 (1,214,624)
Operating income 243,157 479,623 266,305 1,029,500
General administrative expenditure - (722,842) - (1,472,263)
Transactions with related entities are generally made on the basis of market values on the respective dates.
Management bodies
The costs incurred on the remuneration of the Bank’s board of directors, in 2011, totalled €480,338 of which
amount €12,940 in respect of contributions to the Caixa - Banco de Investimento pension fund, as described in
Note 2.10 (€923,623 and €14,024, respectively in 2009).
No bonuses were paid to board members in 2011 and 2010.
Two board members have mortgage lending agreements with the Bank for a global amount of €257,041 at 31
December 2011 (€189,369 in 2010 for one of the board members). This is a standard loan for Bank employees
which were taken out prior to the appointment as board members. The Bank has no additional liability or granted
any long term benefit to the board of directors, other than those referred to above.
Information on the amounts paid to the members of boards of directors and inspection bodies, in 2011, is set out
in the management report.
Information on the fees charged by the statutory auditors, in 2011, is set out in the management report.

Annual Report – 2011
170
35. DISCLOSURES RELATING TO FINANCIAL INSTRUMENTS
Management policies on financial risks pertaining to the Bank’s activity
Risk management and control are centralised by CGD’s Risk Management Division. The Bank also has risk
management regulations defining the limits and operating procedures on the management of various risks.
The disclosures required under IFRS 7 - Financial Instruments: Disclosures on the principal types of risks
pertaining to the Bank’s activity are set out below.
Foreign exchange risk
Financial instruments were broken down into the following currencies at 31 December 2011 and 2010:
2011
Currency
Euros USD Sterling Other Total
Assets
Cash and cash equivalents with central banks 2,923,679 - - - 2,923,679
Cash assets with other credit institutions 914,217 43,859 4,183 141,092 1,103,350
Financial assets held for trading
Securities 75,548,510 8 - - 75,548,517
Derivatives (notional) 10,704,665,762 453,187,672 - 4,801,523 11,162,654,957
Derivatives (book value) 634,943,238 78,254,101 - 539,264 713,736,603
Other financial assets at fair value through profit or loss 11,286,603 - - - 11,286,603
Available for sale financial assets 393,132,968 12,691,135 - - 405,824,103
Investments in credit institutions 26,081,619 - - - 26,081,619
Hedge derivatives (notional) 14,917,906 - - - 14,917,906
Loans and advances to customers 765,720,207 1,593,419 - - 767,313,626
Other assets 68,947,083 7,800,294 70,111 31,286 76,848,774
Provisions and impairment (68,077,201) (1,580,670) - - (69,657,871)
12,631,004,591 551,989,817 74,294 5,513,166 13,188,581,867
Liabilities
Financial liabilities held for trading
Derivatives (notional) (10,704,665,762) (453,187,672) - (4,801,523) (11,162,654,957)
Derivatives (book value) (578,117,176) (76,001,887) - (539,264) (654,658,328)
Central banks’ resources (232,136,123) - - - (232,136,123)
Other credit institutions’ resources (748,437,418) (14,917,512) - - (763,354,930)
Customer resources and other loans (133,492,304) (1,357,897) - - (134,850,201)
Hedge derivatives (notional) (14,917,906) - - - (14,917,906)
Other liabilities (102,876,323) (7,629,347) (51,186) (0) (110,556,856)
(12,514,643,011) (553,094,316) (51,186) (5,340,788) (13,073,129,301)
Net exposure (1,104,499) 23,108 172,378 (909,013)

Annual Report – 2011
171
2010
Currency
Euros USD Sterling Other Total
Assets
Cash and cash equivalents with central banks 8,893,162 - - - 8,893,162
Cash assets with other credit institutions 5,291,178 15,519 31,367 82,720 5,420,784
Financial assets held for trading
Securities 165,302,817 7,390,167 - - 172,692,984
Derivatives (notional) 9,968,348,991 635,748,294 - 5,230,644 10,609,327,929
Derivatives (book value) 326,475,073 44,460,471 - 23,189 370,958,733
Other financial assets at fair value through profit or loss 14,964,047 - - - 14,964,047
Available for sale financial assets 423,450,857 5,666,587 6,939,654 - 436,057,098
Investments in credit institutions 6,661,937 - - - 6,661,937
Hedge derivatives (notional) 15,815,750 - - - 15,815,750
Loans and advances to customers 786,587,377 27,195,654 19,879,795 - 833,662,827
Other assets 29,449,596 1,627,484 28,552 57 31,105,688
Provisions and impairment (42,774,321) (1,530,631) - - (44,304,952)
11,708,466,464 720,573,545 26,879,368 5,336,610 12,461,255,987
Liabilities
Financial liabilities held for trading
Derivatives (notional) (9,968,348,991) (635,748,294) - (5,230,644) (10,609,327,929)
Derivatives (book value) (319,786,830) (40,723,279) - (23,189) (360,533,298)
Central banks’ resources (330,157,222) - - - (330,157,222)
Other credit institutions’ resources (730,349,667) (42,206,513) (26,430,439) - (798,986,619)
Customer resources and other loans (113,556,127) (1,558,142) - - (115,114,269)
Hedge derivatives (notional) (15,815,750) - - - (15,815,750)
Other liabilities (82,742,744) (107,351) (1,231) - (82,851,326)
(11,560,757,331) (720,343,579) (26,431,670) (5,253,833) (12,312,786,412)
Net exposure 229,966 447,698 82,777 760,441
The amounts relating to derivatives in the above tables comprise interest rate swaps.
Liquidity risk
Liquidity risk comprises the Bank’s risk of difficulties in securing funds to meet its commitments. An example of
liquidity risk may be the Bank’s incapacity to dispose of a financial asset quickly at close to its fair value.
The analysis of the Bank’s liquidity risk is part of the consolidated liquidity analysis of CGD group’s Asset-Liability
Committee. The Bank has an irrevocable line of credit from CGD, for liquidity requirements of up to one year.
CGD group policy, on the other hand, does not advise direct access to the capital market for securing medium
and long term funding, which is the consolidated liability of CGD group with CGD having a global management
commitment and eventual coverage of the liquidity gaps of its various subsidiaries as a whole.
Under IFRS 7 requirements, the full amount of non-discounted contractual cash flows for the various time bands,
based on the following premises, is set out below:
Customers’ sight deposits are recognised in the “customer resources and other loans” account heading in
“Repayable on demand”;
Sight overdrafts are recognised in the “loans and advances to customers” account headings in “repayable
on demand”;
The “other” column comprises amounts already received or paid which are being deferred;
The amount for derivative financial instruments set out in this table comprises their book value;
Shares and customers’ overdue credit have been classified for unspecified periods.

Annual Report – 2011
172
For operations whose income is not fixed such as on operations indexed to Euribor, the future cash flows
have been estimated at the reference value at 31 December 2011 and 2010.
2011
Contractual periods to maturity
(amounts in euros)Repayable on demand
Up to 3 months
3 months - 1 year
1 - 3 years 3 - 5 yearsMore than 5
yearsUndetermined Other Total
Assets
Cash and cash equivalents with central banks 2,923,679 - - - - - - - 2,923,679
Cash assets with other credit institutions 1,103,350 - - - - - - - 1,103,350
Financial assets held for trading
- Securities - 1,280,943 2,769,988 90,515,045 - - 3,016,001 - 97,581,977
- Derivative financial instruments - 284,960,765 2,805,935 28,534,333 41,634,586 355,800,984 - - 713,736,603
Other financial assets at fair value through profit or loss - 162,954 5,476,471 514,008 7,866,014 2 - - 14,019,449
Available for sale financial assets - 95,696,127 71,242,069 108,060,904 84,645,051 263,406,759 19,038,304 - 642,089,215
Investments in credit institutions - 26,157,720 - - - - - - 26,157,720
Loans and advances to customers 5,693,494 54,798,082 123,383,941 191,528,508 150,034,453 383,218,243 5,441,556 (2,588,274) 911,510,003
Hedge derivatives - - - 1,459,895 - - - - 1,459,895
Other assets 72,666,430 - - - - - 3,551,441 630,904 76,848,774
82,386,953 463,056,591 205,678,404 420,612,693 284,180,104 1,002,425,988 31,047,302 (1,957,370) 2,487,430,665
Liabilities
Central banks’ resources - 57,121,361 - - 180,512,500 - - 237,633,861
Financial liabilities held for trading
- Derivative financial instruments - 304,179,972 2,813,868 29,822,648 45,171,998 351,600,863 - - 733,589,348
Other credit institutions’ resources 283,940 756,577,268 7,491,256 - - - - - 764,352,465
Customer resources and other loans 30,064,130 89,176,070 3,122,000 7,084,877 - 8,088,032 - - 137,535,110
Hedge derivatives - - - - 1,521,387 - - - 1,521,387
Other liabilities 50,101,185 39,816,826 19,755,547 - - - - 883,298 110,556,856
80,449,256 1,246,871,497 33,182,672 36,907,525 227,205,885 359,688,895 - 883,298 1,985,189,027
Liquidity gap 1,937,697 (783,814,905) 172,495,732 383,705,168 56,974,219 642,737,093 31,047,302 (2,840,668) 502,241,638
2010
Contractual periods to maturity
(amounts in euros)Repayable on demand
Up to 3 months3 months - 1
year1 - 3 years 3 - 5 years
More than 5 years
Undetermined Other Total
Assets
Cash and cash equivalents with central banks 8,893,162 - - - - - - - 8,893,162
Cash assets with other credit institutions 5,420,784 - - - - - - - 5,420,784
Financial assets held for trading
- Securities - 12,197,343 10,487,574 28,521,781 108,898,767 53,269,413 1,338,381 - 214,713,260
- Derivative financial instruments - 660,845 11,276,389 42,754,557 29,559,904 343,075,634 - - 427,327,329
Other financial assets at fair value through profit or loss - 78,906 2,222,627 5,606,083 2,887,912 6,130,797 - - 16,926,325
Available for sale financial assets - 13,200,274 44,030,890 149,868,859 106,090,420 236,112,286 25,213,241 - 574,515,971
Investments in credit institutions - 6,716,351 - - - - - - 6,716,351
Loans and advances to customers 6,002,978 38,816,737 101,613,640 238,286,778 173,845,172 394,206,470 9,068,090 (3,343,102) 958,496,763
Hedge derivatives - - - - 1,250,849 - - - 1,250,849
Other assets 26,676,141 - - - - - 3,551,441 878,106 31,105,688
46,993,065 71,670,455 169,631,121 465,038,059 422,533,024 1,032,794,599 39,171,153 (2,464,996) 2,245,366,480
Liabilities
Central banks’ resources - 330,684,444 - - - - - 330,684,444
Financial liabilities held for trading - - - - - - - -
- Derivative financial instruments - 654,243 11,194,927 43,601,034 29,514,548 331,904,798 - - 416,869,550
Other credit institutions’ resources 541,799 798,683,024 - - - - - - 799,224,823
Customer resources and other loans 33,446,495 44,551,146 24,240,671 - 7,046,860 9,839,166 - - 119,124,339
Hedge derivatives - - - - - 1,599,779 - - 1,599,779
Other liabilities 17,788,373 10,521,377 34,569,208 18,900,000 - - - 1,072,368 82,851,326
51,776,668 1,185,094,235 70,004,806 62,501,034 36,561,408 343,343,743 - 1,072,368 1,750,354,262
Liquidity gap (4,783,602) (1,113,423,780) 99,626,314 402,537,025 385,971,616 689,450,856 39,171,153 (3,537,364) 495,012,218
Interest rate risk
Interest rate risk comprises the fair value or cash flow risk associated with a specific financial instrument, if
changed on the basis of changes in market interest rates.

Annual Report – 2011
173
The following is a summary of the type of exposure to interest rate risk at 31 December 2011 and 2010:
2011
(amounts in euros)
Not subject to interest rate risk
Fixed rate Variable rate Total
Assets
Cash assets with other credit institutions - - 1,103,350 1,103,350
Financial assets held for trading
- Securities 3,016,001 72,281,165 251,351 75,548,517
- Derivative financial instruments - 5,579,185,621 5,583,469,336 11,162,654,957
Other financial assets at fair value through profit or loss - 2 11,286,602 11,286,603
Hedge derivatives - 5,000,000 9,917,906 14,917,906
Available for sale financial assets 19,038,304 274,834,888 111,953,912 405,827,103
Investments in credit institutions - - 26,081,619 26,081,619
Loans and advances to customers 2,853,282 11,502,767 752,957,577 767,313,626
Other assets 76,848,774 - - 76,848,774
101,756,362 5,942,804,441 6,497,021,653 12,541,582,456
Liabilities
Financial liabilities held for trading
- Derivative financial instruments - 5,607,667,852 5,554,987,105 11,162,654,957
Central banks’ resources - - 232,136,123 232,136,123
Other credit institutions’ resources - 283,940 763,070,989 763,354,930
Customer resources and other loans - 42,644,333 92,205,868 134,850,201
Hedge derivatives - 9,917,906 5,000,000 14,917,906
Other liabilities 110,556,856 - - 110,556,856
110,556,856 5,660,514,032 6,647,400,085 12,418,470,973
Net exposure (8,800,494) 282,290,409 (150,378,432) 123,111,483
2010
(amounts in euros)
Not subject to interest rate risk
Fixed rate Variable rate Total
Assets
Cash assets with other credit institutions - - 5,420,784 5,420,784
Financial assets held for trading
- Securities 1,338,381 152,590,009 18,764,594 172,692,984
- Derivative financial instruments - 5,287,170,759 5,322,157,171 10,609,327,929
Other financial assets at fair value through profit or loss - 2 14,964,045 14,964,047
Hedge derivatives - 5,000,000 10,815,750 15,815,750
Available for sale financial assets 25,213,241 262,391,931 148,451,926 436,057,098
Investments in credit institutions - - 6,661,937 6,661,937
Loans and advances to customers 5,724,987 12,460,591 815,477,248 833,662,827
Other assets 31,105,688 - - 31,105,688
63,382,298 5,719,613,292 6,342,713,454 12,125,709,044
Liabilities
Financial liabilities held for trading
- Derivative financial instruments - 5,311,592,900 5,297,735,030 10,609,327,929
Central banks’ resources - - 330,157,222 330,157,222
Other credit institutions’ resources - 541,799 798,444,820 798,986,619
Customer resources and other loans - 46,418,370 68,695,899 115,114,269
Hedge derivatives - 10,815,750 5,000,000 15,815,750
Other liabilities 82,851,326 - - 82,851,326
82,851,326 5,369,368,819 6,500,032,971 11,952,253,116
Net exposure (19,469,028) 350,244,473 (157,319,517) 173,455,928
The “financial assets held for trading - shares” account heading at 31 December 2011 and 2010, included
€70,890,370 and €81,124,157 for a portfolio bond whose interest included a fixed-rate component indexed to the
stock market performance of a Portuguese share.

Annual Report – 2011
174
Exposure to interest rate risk, at 31 December 2011 and 2010 can be broken down into the following maturity
periods:
2011
Rate refixing / contractual periods to maturity
(amounts in euros)Repayable on demand
Up to 3 months 3 - 12 months 1 - 3 years 3 - 5 years
More than 5 years Undetermined Other Total
Assets
Cash assets with other credit institutions 1,103,350 - - - - - - - 1,103,350
Financial assets held for trading
- Securities - 1,520,344 - 71,012,172 - - 3,016,001 - 75,548,517
- Derivative financial instruments - 2,045,458,968 4,007,664,882 918,004,402 696,483,618 3,495,043,088 - - 11,162,654,957
Other financial assets at fair value through profit or loss - 6,097,330 5,189,272 2 - - - - 11,286,603
Hedge derivatives - - 9,917,906 5,000,000 - - - - 14,917,906
Available for sale financial assets - 161,678,925 71,449,308 31,066,087 11,452,268 111,142,211 19,038,304 - 405,827,103
Investments in credit institutions - 26,081,619 - - - - - - 26,081,619
Loans and advances to customers 5,693,494 452,772,268 293,296,850 1,194,966 11,502,767 - 5,441,556 (2,588,274) 767,313,626
Other assets 72,666,430 - - - - - 3,551,441 630,904 76,848,774
79,463,274 2,693,609,453 4,387,518,217 1,026,277,629 719,438,653 3,606,185,299 31,047,302 (1,957,370) 12,541,582,456
Liabilities
Financial liabilities held for trading
- Derivative financial instruments - 2,031,939,994 3,992,471,606 929,539,089 698,816,800 3,509,887,467 - - 11,162,654,957
Central banks’ resources - 57,087,512 - - 175,048,611 - - - 232,136,123
Other credit institutions’ resources 283,940 755,688,425 7,382,564 - - - - - 763,354,930
Customer resources and other loans 30,064,130 82,615,994 9,589,874 6,559,757 - 6,020,447 - - 134,850,201
Hedge derivatives - - 5,000,000 - 9,917,906 - - - 14,917,906
Other liabilities 50,101,185 20,825,440 38,746,933 - - - - 883,298 110,556,856
80,449,256 2,948,157,364 4,053,190,978 936,098,846 883,783,317 3,515,907,913 - 883,298 12,418,470,973
Net exposure (985,982) (254,547,912) 334,327,239 90,178,783 (164,344,664) 90,277,385 31,047,302 (2,840,668) 123,111,483

Annual Report – 2011
175
2010
(amounts in euros)Repayable on demand
Up to 3 months
3 - 12 months 1 - 3 years 3 - 5 yearsMore than 5
yearsUndetermined Other Total
Assets
Cash assets with other credit institutions 5,420,784 - - - - - - - 5,420,784
Financial assets held for trading
- Securities - 18,764,594 4,749,672 11,149,370 93,008,533 43,682,434 1,338,381 - 172,692,984
- Derivative financial instruments - 1,857,206,264 3,761,202,878 1,575,642,477 599,041,529 2,816,234,781 - - 10,609,327,929
Other financial assets at fair value through profit or loss - 10,137,956 4,826,089 2 - - - - 14,964,047
Hedge derivatives - - 10,815,750 - 5,000,000 - - - 15,815,750
Available for sale financial assets - 128,454,149 43,298,970 42,586,244 35,191,463 161,313,032 25,213,241 - 436,057,098
Investments in credit institutions - 6,661,937 - - - - - - 6,661,937
Loans and advances to customers 6,002,978 435,031,977 374,442,293 - - 12,460,591 9,068,090 (3,343,102) 833,662,827
Other assets 26,676,141 - - - - - 3,551,441 878,106 31,105,688
38,099,903 2,456,256,877 4,199,335,651 1,629,378,093 732,241,526 3,033,690,837 39,171,153 (2,464,996) 12,125,709,044
Liabilities
Financial liabilities held for trading
- Derivative financial instruments - 1,848,694,819 3,746,332,175 1,589,183,200 601,053,574 2,824,064,160 - - 10,609,327,929
Central banks’ resources - 330,157,222 - - - - - - 330,157,222
Other credit institutions’ resources 541,799 798,444,820 - - - - - - 798,986,619
Customer resources and other loans 33,306,426 44,620,987 24,214,982 - 6,328,521 6,643,354 - - 115,114,269
Hedge derivatives - - 5,000,000 - - 10,815,750 - - 15,815,750
Other liabilities 17,788,373 10,521,377 34,569,208 18,900,000 - - - 1,072,368 82,851,326
51,636,598 3,032,439,225 3,810,116,366 1,608,083,200 607,382,095 2,841,523,264 - 1,072,368 11,952,253,116
Net exposure (13,536,695) (576,182,348) 389,219,285 21,294,893 124,859,431 192,167,573 39,171,153 (3,537,364) 173,455,928
The contents of the above tables were based on the following premises:
the book value of fixed-rate instruments was classified in accordance with their respective period to
maturity;
the book value of variable-rate instruments (e.g. indexed to Euribor), was classified in accordance with the
respective maturity until the next refixing of the rate;
the book value of instruments not subject to interest rate risk (e.g. shares) was included in the
"undetermined" column;
the book value included in the “other” column comprises amounts which have already been received or paid
which are being deferred;
information is provided on notional purchase amounts (as assets) and sales (as liabilities) on interest rate
swaps;
overdue loans to customers and amounts already received or paid were not considered subject to interest
rate risk, and;
customers’ sight deposits, when no interest is paid, are considered as fixed-rate and classified as
“repayable on demand”.
Credit risk
Credit risk comprises financial losses on the defaults of counterparties who have entered into agreements on
financial instruments.

Annual Report – 2011
176
Maximum exposure to credit risk
The following is a summary of the maximum exposure to credit risk, by financial instrument, at 31 December 2011
and 2010:
(amounts in euros) 2011 2010
Type of financial instruments Book value (gross)Provisions/ impairment
Book value (net) Book value (gross)Provisions/ impairment
Book value (net)
Assets:
Cash assets with other credit institutions 1,103,350 - 1,103,350 5,420,784 - 5,420,784
Financial assets held for trading 789,285,121 - 789,285,121 598,681,931 - 598,681,931
Other financial assets at fair value through profit or loss 11,286,603 - 11,286,603 14,964,047 - 14,964,047
Available for sale financial assets 386,788,799 - 386,788,799 410,843,857 - 410,843,857
Investments in credit institutions 26,081,619 - 26,081,619 6,661,937 - 6,661,937
Loans and advances to customers 767,313,626 64,789,921 702,523,705 833,662,827 39,996,004 793,666,823
Hedge derivatives 1,459,895 - 1,459,895 1,250,849 - 1,250,849
Other assets (excluding deferred costs) 76,217,871 4,867,950 71,349,921 30,227,582 4,308,948 25,918,634
2,059,536,883 69,657,871 1,989,879,012 1,901,713,813 44,304,952 1,857,408,861
Off-balance sheet:
Guarantees provided 52,629,393 793,303 51,836,091 53,136,289 253,000 52,883,289
2,112,166,276 70,451,173 2,041,715,103 1,954,850,102 44,557,952 1,910,292,150
Credit quality of financial assets
The Bank does not have an internal rating system. The principal procedures in force in terms of the approval and
monitoring of credit operations designed to ensure an adequate risk level for the Bank’s strategy, are set out
below:
The Bank has a Credit Committee, comprising members of the Executive Committee and managers of
structural organs with any form of involvement in lending. The Bank’s Credit Committee meets once a week
with a minimum of two directors and managers of the structural organs involved in the lending process.
The production of commercial proposals for submission to the Credit Committee is the responsibility of
structural organs (business/product divisions), which require the risk opinion of CGD’s Risk Management
Division, in advance. The proposals approved by the Bank’s Credit Committee are recorded in minutes
which are signed by all present, for later submission to and the final resolution of CGD’s Credit Committees.
A part of credit operations with customers is, inter alia, guaranteed by the following types of collateral:
A pledge on securities;
Bank guarantees;
State-backed;
Mortgage loans for employees; and
Personal guarantees.

Annual Report – 2011
177
Credit quality of debt securities and derivative financial instruments
The following table provides information on the book value of portfolio debt securities net of impairment (excluding
matured securities) according to the Standard & Poor’s or equivalent rating, by type of guarantor or issuing entity
and by the guarantor‘s or issuing entity’s geography, at 31 December 2011 and 2010:
2011
(amounts in euros)
PortugalRest of European
UnionNorth America Other Total
Financial assets held for trading
BB- up to BB+ 71,132,449 - - - 71,132,449
B+ 1,390,795 - - - 1,390,795
Not rated 1,054,342 1,970,925 8 - 3,025,274
73,577,585 1,970,925 8 - 75,548,517
Issued by:
Corporates 1,045,069 1,970,925 8 - 3,016,001
Governments and other local authorities 70,890,370 - - - 70,890,370
Financial institutions 1,642,146 - - - 1,642,146
73,577,585 1,970,925 8 - 75,548,517
Financial assets at fair value through profit or loss
(Fair Value Option)
BB- up to BB+ 2 - - - 2
B+ 0
Not rated 10,021,006 - - 1,265,595 11,286,601
10,021,008 - - 1,265,595 11,286,603
Issued by:
Corporates 10,021,005 - - - 10,021,005
Governments and other local authorities 2 - - - 2
Financial institutions 1 - - 1,265,595 1,265,597
10,021,008 - - 1,265,595 11,286,603
Available for sale financial assets
(net of impairment)
BBB - 10,220,304 886,626 - 11,106,931
BB- up to BB+ 278,087,343 - - - 278,087,343
CCC- up to CCC+ 3,607,431 962,078 - - 4,569,509
D - 1,216,589 - - 1,216,589
Not rated 76,366,775 15,441,652 - - 91,808,427
358,061,549 27,840,624 886,626 - 386,788,799
Issued by:
Corporates 65.778.541 6.621.546 886.626 - 73.286.713
Governments and other local authorities 259.952.398 1.216.589 - - 261.168.987
Financial institutions 32.330.611 20.002.489 - - 52.333.100
358.061.549 27.840.624 886.626 - 386.788.799

Annual Report – 2011
178
2010
(amounts in euros)Portugal
Rest of European Union
North America Other Total
Financial assets held for trading
AAA - - - - -
AA- up to AA+ - 2,959,121 1,950,103 - 4,909,224
A- up to A+ 18,941,806 10,206,097 6,547,954 2,991,545 38,687,401
Less than A- 89,606,291 25,701,924 843,987 11,605,776 127,757,978
Not rated - - - - -
108,548,097 38,867,142 9,342,044 14,597,321 171,354,603
Issued by:
Corporates 1,438,145 25,994,492 - 7,969,055 35,401,692
Governments and other local authorities 92,259,314 - - 3,635,263 95,894,576
Financial institutions 14,850,638 12,872,650 9,342,044 2,993,003 40,058,335
108,548,097 38,867,142 9,342,044 14,597,321 171,354,603
Financial assets at fair value through profit or loss
(Fair Value Option)
AA- up to AA+ 3 - - - 3
Not rated 12,950,361 - - 2,013,682 14,964,044
12,950,365 - - 2,013,682 14,964,047
Issued by:
Corporates 12,950,361 - - - 12,950,361
Governments and other local authorities 2 - - - 2
Financial institutions 1 - - 2,013,682 2,013,684
12,950,365 - - 2,013,682 14,964,047
Available for sale financial assets
(net of impairment)
AAA - - - - -
AA- Up to AA+ - 1,990,343 865,334 - 2,855,676
A- Up to A+ 277,877,471 22,370,126 8,758,272 2,079,738 311,085,607
Less than A- 15,786,884 14,619,754 - - 30,406,638
Not rated 66,495,936 - - - 66,495,936
360,160,291 38,980,222 9,623,606 2,079,738 410,843,857
Issued by:
Corporates 68,518,138 - - - 68,518,138
Governments and other local authorities 258,003,150 3,570,611 - 2,079,738 263,653,499
Financial institutions 33,639,003 35,409,612 9,623,606 - 78,672,220
360,160,291 38,980,222 9,623,606 2,079,738 410,843,857
The Bank, at 31 December 2010 also recognised in “debtors - other” an amount of €2,116,198 relating to interest
on derivative financial instruments in arrears on which impairment of €664,701 was recognised. The book value
recognised in “financial assets held for trading” relating to the said operations totalled €15,555,313.
The Bank, at 31 December 2010 also recognised in “debtors - other” an amount of €1,619,240 relating to interest
on derivative financial instruments in arrears on which impairment of €757,507 was recognised. The book value
recognised in “financial assets held for trading” relating to the said operations totalled €2,736,275.
At 31 December 2011 debt securities issued by “governments and other local authorities” in the rest of the
European Union included bonds issued by the Republic of Greece with a book value of €1,216,589, net of
impairment (impairment on this security was €3,961,150 – Note 19). At 31 December 2010 the book value of
these bonds was €3,570,611.
Credit quality of Investments in credit institutions
The counterparties with which the Bank had contracted “investments in credit institutions” at 31 December 2011,
comprised CGD Group bodies (€26,082,619), with an external rating of BB- (A- on 31 December 2010).

Annual Report – 2011
179
Quality of loans and advances to customers
Information on overdue credit operations at 31 December 2011 and 2010 is set out in the following table:
2011 2010
(amounts in euros)
Performing credit
Non-performing credit
Credit in default
Total CreditPerforming
credit
Non-performing
credit
Credit in default
Total Credit
Lending to companies
Outstanding 750,242,768 - - 750,242,768 815,423,853 - - 815,423,853
Overdue 641,223 410,355 4,389,979 5,441,556 - 3,810,319 5,257,770 9,068,090
750,883,991 410,355 4,389,979 755,684,324 815,423,853 3,810,319 5,257,770 824,491,942
Mortgage loans
Outstanding 9,960,646 - - 9,960,646 9,578,472 - - 9,578,472
9,960,646 - - 9,960,646 9,578,472 - - 9,578,472
Consumer loans
Outstanding 339,861 - - 339,861 371,675 - - 371,675
Total outstanding loans 760,543,275 - - 760,543,275 825,373,999 - - 825,373,999
Total overdue loans 641,223 410,355 4,389,979 5,441,556 - 3,810,319 5,257,770 9,068,090
Provisions for bad debts (60,210,687) - - (60,210,687) (36,795,958) - - (36,795,958)
Provisions for overdue credit (320,611) (4,104) (4,254,519) (4,579,234) - (38,103) (3,161,943) (3,200,046)
Total loans 700,653,200 406,251 135,459 701,194,911 788,578,041 3,772,216 2,095,828 794,446,085
The following classifications were used for the preparation of the above tables:
“Performing loans” – loans without any overdue payments or with balances overdue up to 30 days;
“Non-performing loans ” – loans balances overdue between 30-90 days;
“Loans in default” – loans with balances overdue more than 90 days. In the case of corporate loans, if a
customer has at least one operation with payments overdue for more than 90 days, the full amount of the
customer’s exposure to the group is reclassified to this category.
Market risk
Market risk comprises the risk of an adverse change in fair value or the cash flows of financial instruments
deriving from changes in market prices, including foreign exchange, interest rate and price risks.
The Bank’s market risk is assessed on the basis of the following methodologies:
Value-at-Risk” (VaR) on the trading portfolio, including the securities and derivative financial portfolios;
Sensitivity analysis on the Bank’s other assets and liabilities. This sensitivity analysis is calculated on the
bases of the premises defined in Bank of Portugal Instruction 19/2005.
Trading portfolio
VaR comprises an estimate of the maximum potential loss on a specific assets portfolio, over a specific period
with a given confidence level, assuming normal market operation.
The calculation methodology used is that of historical simulation i.e. future events are fully explained by past
events, based on the following premises:
asset held for: 10 days;
confidence level: 99%;
price sampling period: 720 calendar days;

Annual Report – 2011
180
decay factor = 1, i.e. all observations carry the same weight.
For options, the theoretical price is calculated by the use of adequate models and the use of implicit volatility. No
calculation for correlations is made, owing to the methodology applied; i.e. the correlations are empirical.
The following is a breakdown of VaR at 31 December 2011 and 2010 (thousand euros):
2011 2010
Market VaR :
Interest rate 142 269
Exchange rate 23 76
Price 20 66
Diversification effect (50) (167)
135 244
The diversification effect is calculated implicitly. Total VaR refers to the combined effect of interest rate, price,
foreign exchange and volatility risks.
Bpvs (basis point values), changes in the market value of interest rate positions owing to the parallel movement of
1 basis point on the yield curves are calculated for the trading portfolio and treasury positions. Other sensitivity
indices commonly applicable to options portfolios are also calculated.
Stress testing assessments are realised monthly.
Theoretical backtesting (comparison of the VaR measure with technical results) is performed daily and real
backtesting (comparison of the VaR measure with the real result) monthly. The number of exceptions obtained i.e.
the number of times theoretical or real losses exceed VaR, enable the method’s accuracy to be assessed and any
necessary adjustments made.
Non-trading portfolio
The sensitivity analysis on the non-trading portfolio was carried out to determine the potential impact on the
Bank’s net interest income in 2012, considering a fall of 50 basis points (bps) in reference interest rates and
assuming a parallel movement of the interest rate curve. The Bank’s financial assets and liabilities were
considered for this purpose, excluding:
derivative financial instruments; and
commercial paper.
The principal premises related with the pricing of operations were:
variable-rate operations: market rate plus respective contractual spread;
new fixed-rate operations: market rate plus respective spread equivalent to the difference between the
average rate on live transactions at 31 December 2011 and respective market rate;
new variable-rate operations: the market rate plus the average contractual spread on live transactions at 31
December 2011.
Based on the above referred to premises, the potential positive impact of a 50 basis points fall in reference
interest rates on net interest income for 2012 totals €201,699 (1,993,466 at 31 December 2010). In the event of a
50 basis points increase in reference interest rates, the potential negative impact on the net interest income
forecast for 2012 totals €191,941 (€2,003,045 at 31 December 2010).

Annual Report – 2011
181
Fair value
The Bank maintains a significant part of its assets, notably the whole of its securities and derivatives portfolio, at
fair value through profit or loss.
Reference should be made to the following aspects as regards the principal financial assets and liabilities
recognised at cost:
Interest is paid on almost all investments in and resources with other credit institutions at indexed rates and
short refixing periods;
As shown above, in the section on interest rate risk, the payment of interest on almost all customer deposits
is indexed to Euribor, with short refixing periods. A long term operation at fixed interest rates has been
covered by a hedge derivative for which reason the change in the fair value attributable to the interest rate
risk has already been recognised in the deposit’s book value (see Note 18).
In light of the above, the Bank considers that the book value of its financial assets, net of provisions and its
financial liabilities comprises a reliable approximation of their respective fair value.
The form of assessing the fair value of financial instruments at 31 December 2011 and 2010 is summarised
below:
2011
Financial instruments at fair value
Valuation techniques based on :
Type of financial instruments (amounts in euros)
Assets valued at cost price
Prices in an active market (Level 1)
Market data(Level 2)
Other (Level 3) Total
Assets
Financial assets held for trading - 4,406,796 713,987,955 70,890,370 789,285,121Other financial assets at fair value through profit or loss - 2 - 11,286,602 11,286,603
Available for sale financial assets 153,127 316,816,620 7,456,157 81,401,200 405,827,103
Hedge derivatives - - 1,459,895 - 1,459,895
153,127 321,223,418 722,904,006 163,578,171 1,207,858,722
Liabilities
Financial liabilities held for trading - - 733,589,348 - 733,589,348
Hedge derivatives - - 1,521,387 - 1,521,387
- - 735,110,735 - 735,110,735

Annual Report – 2011
182
2010
Financial instruments at fair value
Valuation techniques based on :
Type of financial instruments (amounts in euros)
Assets valued at Cost price
Prices in an active market (Level 1)
Market data(Level 2)
Other (Level 3) Total
Assets
Financial assets held for trading - 79,727,563 437,749,249 82,543,502 600,020,313Other financial assets at fair value through profit or loss - 2 941,268 14,022,777 14,964,047
Available for sale financial assets 153,127 316,226,996 42,608,044 77,068,931 436,057,098
Hedge derivatives - - 1,250,849 - 1,250,849
153,127 395,954,561 482,549,409 173,635,210 1,052,292,307
Liabilities
Financial liabilities held for trading - - 416,869,550 - 416,869,550
Hedge derivatives - - 1,599,779 - 1,599,779
- - 418,469,329 - 418,469,329
The contents of the above referred to table were based on the following premises:
Prices on active markets correspond to equity instruments listed on a stock market and high liquidity bonds
(Level 1);
Prices of derivative financial instruments are calculated using valuation techniques based on market date
(Level 2);
Portfolio shares valued by indicative bids supplied by contributors external to the group were also
recognised in “Valuation techniques - market date (Level 2)”;
Shares valued by internal CGD Group models are presented in “Valuation techniques – Other (Level 3)”;
This column includes:
- At 31 December 2011, €70,890,370 in bonds convertible into EDP shares issued by Parpública SGPS,
S.A., which were being valued in accordance with an internal model defined by the Bank (€81,124,157 in
2010).
- At 31 December 2011 and 2010, €80,759,654 and €82,067,907, respectively, relating to fixed or
variable-rate bonds issued by Portuguese financial and non-financial companies, in respect of which
there are no active market nor indicative prices supplied by external counterparties. The Bank valued
these securities using a projected cash flow updating model at market interest rates plus a spread the
Bank considers adequate to the issuing entity’s credit risk as a discount rate.
Assets valued at cost are stable financial investments held by the Bank for which no active market exists.

Annual Report – 2011
183
The following is a summary, in 2011 and 2010, of the movements occurring in portfolio securities valued at 31
December 2011 and 2010 by “valuation techniques - other” in addition to the potential and realised capital gains
recognised in the fair value reserve and in income from financial operations:
2011
Income recognised in:
Income for period
(amounts in euros)
Balance at 31.12.2010
Changes to valuation method
Acquisitions/ Disposals
Fair value reserve
Potential EffectiveChange in exchange
rate
Balance at 31.12.2011
Financial assets held for trading 82,543,502 - (4,320,144) - (7,368,457) 35,470 - 70,890,370
Other financial assets at fair value through profit or loss 14,022,777 - (1,983,046) - (753,130) - - 11,286,601
Available for sale financial assets 77,068,931 3,607,431 1,580,159 (1,033,069) - 10,752 166,995 81,401,200
173,635,211 3,607,431 (4,723,031) (1,033,069) (8,121,588) 46,222 166,995 163,578,172
2010
Income recognised in:
Income for period
(amounts in euros)
Balance at 31.12.2009
Changes to valuation method
Acquisitions/ Disposals
Fair value reserve
Potential EffectiveChange in exchange
rate
Balance at 31.12.2010
Financial assets held for trading - 92,659,873 (3,530,712) - (6,641,192) 55,533 - 82,543,502
Other financial assets at fair value through profit or loss 28,759,548 1 (14,249,622) - (487,150) - - 14,022,777
Available for sale financial assets 49,634,184 5,442,832 17,760,165 4,074,303 - 1,800 155,649 77,068,931
78,393,732 98,102,706 (20,169) 4,074,303 (7,128,342) 57,333 155,649 173,635,211
36. CAPITAL MANAGEMENT
The Bank in performing its investment banking operations exercises strict control over the ratio between its assets
management needs and available capital. This management action on the Bank’s capital has been designed to
cater for any default in terms of capital requirements, exceeding reporting obligations and making it possible to
simulate the impacts of hypothetical management decisions on the diverse prudential ratios.
Capital management is designed to optimise the above referred to ratio, with a prudential margin providing for the
resolutions to be passed in terms of the Bank’s asset management.
The Bank’s administration receives periodic internal reports permitting not only the monitoring of the
consequences of the resolutions taken in asset management terms but also the monitoring of the gaps between
real positions and their minimum respective capital requirements.
The procedures used to calculate the Bank’s ratios and prudential limits are based on the dispositions issued by
the Bank of Portugal, as is the case for issues pertaining to the banking system’s supervisory functions. These
regulations represent the legal and regulatory framework governing various prudential matters.

Annual Report – 2011
184
The solvency ratio, at 31 December 2011 and 2010 was assessed as follows:
Separate Accounts(amounts in euros)
2011 2010
Eligible own funds (Base+Complementary-Deductions) (1) 255,416,292 228,373,810
Basis own funds 248,872,093 218,208,798
Paid up capital 81,250,000 81,250,000
(-) Treasury shares - -
Legal, statutory and other reserves 115,292,278 84,178,154
Retained earnings from past years 58,550,496 59,061,492
(-) Intangible assets (558,001) (388,823)
(-) Adjustment - TREM II (395,040) (542,104)
(-) Deferred tax assets associated with provisions for general credit risks - (698,512)
(-) Revaluation differences on available for sale assets - negative fair value (net of tax) (6,160,983) (5,440,244)
(-) Reserves for deferred tax liabilities resulting from the revaluation of available for sale assets 893,343 788,835
Complementary own funds 6,544,199 10,165,012
Revaluation reserves for fixed assets 4,338,403 4,338,403
Revaluation differences on available for sale assets - positive fair value (45%) 2,205,796 2,035,333
Provisions for general credit risks - 3,791,275
Own funds requirements (2) 182,397,595 178,081,849
Credit and counterparty credit risk 139,034,241 126,872,463
(-) 8% Provisions for general credit risks - part not eligible for own funds (502,545) (262,499)
Position risks - debt instruments 30,293,059 36,151,196
Position risks - equity securities 301,886 510,166
Commodity risks - -
Operational risk - Standard method 13,270,954 14,810,523
Solvency ratio 11.20% 10.26%
Legend:
(1) According to Official Notice 12/92
(2) According to current legislation: Official Notices 5/07, 8/07, 9/07

Annual Report – 2011
185
4 Reports and opinions

Annual Report – 2011
186
Report and Opinion of Fiscal Board

Caixa – Banco de Investimento, S.A.
Fiscal Board
REPORT AND OPINION OF FISCAL BOARD
To shareholders,
1. According to the dispositions of article 420 of the commercial companies code, the fiscal
board is responsible for issuing a report on its inspection of the company and an opinion on
the accounts and proposals submitted by the board of directors of CAIXA – Banco de
Investimento, S.A. (hereinafter referred to as CaixaBI), for the year ended 31 December
2011.
2. The inspection of CaixaBI is the responsibility of a fiscal board and a statutory auditor or
statutory audit company, which is not a member of the said body, as provided for in sub-
paragraph b) of no.1 of article 413 of the commercial companies code and CaixaBI’s articles
of association.
3. CaixaBI’s fiscal board for the three year period 2011-2013, was elected at the shareholders’
meeting of 20 May 2011. In light of the expiry of the mandate of one of the fiscal board’s
members, under the terms of article 414-A no. 2 of the commercial companies code and the
resignation of the deputy to the fiscal board, at the shareholders’ meeting of 6 January 2012, a
new chairman and new deputy member of the fiscal board were elected to complete the 2011-
2013 term of office.
4. Pursuant to its responsibilities and taking into consideration the governance model adopted in
CaixaBI and notwithstanding the natural disturbances raised by the facts referred to in the
preceding item, the fiscal board diligently endeavoured to monitor and inspect the
management acts of the board of directors, having, inter alia, scheduled regular meetings with
the board of directors and the statutory audit company, in addition to having been given
access to all documentation and clarifications requested to enable it to understand the basis
upon which decisions were taken.
5. The fiscal board, on 29 June 2011, under sub-paragraph a) of no. 5 of article 25 of Bank of
Portugal (BdP), Official Notice no. 5/2008 of 1 July, issued its opinion on the adequacy and
effectiveness of CaixaBI’s internal control system. Taking into account the limited availability
of time between the appointment of the fiscal board and the production of the referred to
opinion and the necessarily limited nature of the procedures which could be developed, the
fiscal board concluded, however, that it was not aware of any information which could lead it
to consider that CaixaBI’s internal control system did not effectively and adequately comply, in
all materially relevant aspects with the referred to BdP regulation. The fiscal board also
assumed that it would be improving its knowledge of CaixaBI’s operations and internal control
system.
6. The fiscal board analysed the report on corporate governance produced by the board of
directors and makes particular reference to CaixaBI’s high level of compliance with good
governance principles. The fiscal board also assessed the governance model in force in

Caixa – Banco de Investimento, S.A.
Fiscal Board
CaixaBI and considers that it ensures effective separation between management and
inspection functions and is adequate to the activities performed by the Bank.
7. The fiscal board took note of CaixaBI’s high level of compliance with legal guidelines as
pointed out in the board of directors’ report on corporate governance, namely as regards the
management objectives, special disclosure requirements, compliance with the shareholder’s
recommendations, application of reductions to remuneration, public contracting activities and
compliance with the cost reduction plan.
8. The fiscal board took note of the report issued by the statutory auditor on the half yearly
financial statements.
9. The fiscal board also took note of the impairment reports on CaixaBI’s credit and securities
portfolios, produced half yearly by the external auditors, as established by the Bank of
Portugal’s circulars 17/2002/DSB of 14 February and 38/2008/DSB of 29 May.
10. In terms of the Bank’s activity in 2011, reference should be made to the fact that investment
banking operations were heavily penalised by the negative performance of the capital markets
and investors’ aversion to risk on the assets of peripheral eurozone countries. Notwithstanding
this unfavourable environment, CaixaBI had a positive 2011, in terms of its activity, having
been involved in the major operations in its operating market. Its internationalisation strategy
(Brazil and Lusophone Africa), in addition to the reinforcement of its advisory and
intermediation activities (less demanding in terms of liquidity and capital allocations), have
enabled it to achieve good results in terms of commissions (€62 million in comparison to €74
million in 2010), even in a year of a major slowdown of economic activity.
11. As regards CaixaBI’s consolidated accounts for the year ended 31 December 2011, the
following indicators characterised its respective operations:
(i) Net assets were up 8% by €162 million over the preceding year, to €2,162 million,
although deleveraging operations took place during the year with a reduction of 11% in
the loans and advances to customers portfolio (€89 million);
(ii) On the liabilities side, the 13% growth (from €1,725 million to €1,948 million) particularly
derived from the increases recorded in financial liabilities at fair value through profit or
loss (€317 million);
(iii) Shareholders’ equity was down €62 million euros over the preceding year to €214 million,
largely deriving from the €56 million increase in fair value reserves and decrease in
income for the year (from €40 million in 2010 to €8.6 million in 2011);
(iv) Net interest income, including income from equity instruments, was down 12% over the
preceding year (from €33.7 million in 2010 to €29.5 million in 2011), whereas net
operating income was down by around 35% by €32.9 million from €91.9 million in 2010 to
€59 million in 2011, largely on account of income from financial operations (down €31

Caixa – Banco de Investimento, S.A.
Fiscal Board
million) which was heavily penalised by the depreciation of the assets portfolio,
particularly €26 million relating to an IRS taken out with by the Bank on a Greek PPP;
(v) Credit impairment was significantly up over 2010, from €7.3 million to €24.1 million, €20
million of which for loans to companies in the Spanish market. This increase derived from
a prudent balance sheet risk hedging policy in a particularly difficult scenario in terms of
the Portuguese and Spanish economies, in which markets CaixaBI’s credit and
guarantees portfolio is concentrated;
(vi) On a structural costs level reference should be made to the fact that 2011 witnessed a
decrease of €4.2 million over 2010 (down 15%), from €28 million to €23.8 million,
notwithstanding the reinforcement of CaixaBI’s international activity. Employee costs
were down €2.1 million (by 12% over 2010, from €17.4 million to €15.3 million), whereas
general and administrative expenditure was down 20% over the preceding year, from
€10.6 million to €8.5 million);
(vii) Consolidated net income was 79% down by EUR 31.6 million to EUR 8.6 million, over the preceding year, particularly on account of the significant decrease in net interest income and recognition of impairment on securities, as referred to in the preceding items.
12. In terms of CaixaBI’s separate accounts for the year ended 31 December 2011, reference
should be made to the following indicators:
(i) Net assets were up 8% by €163 million to €2,169 million over the preceding year,
notwithstanding deleveraging operations over the course of the year with an 11%
decrease of €91 million in the loans and advances to customers portfolio;
(ii) On the liabilities side, the 13% growth (from €1,758 million to €1,991 million) particularly
derived from increases in financial liabilities held for trading (€317 million);
(iii) Shareholders’ equity was down €70 million over the preceding year to €178 million,
largely on account of the €56 million increase in revaluation reserves and decrease in
income for the year (from €45.6 million in 2010 to €1.5 million in 2011);
(iv) CaixaBI’s separate net income for the year ended 31 December 2011 was down €44.1
million over 2010 to €1.5 million;
(v) CaixaBI’s solvency ratio of 11.2% measured on a separate basis remains solid, in line
with previous years’ figures.
13. In the period following the year end closing of the accounts and pursuant to the functions
provided for in the commercial companies code, the fiscal board analyased the separate and
consolidated annual report for 2011, submitted by the board of directors, which it has
articulated, in technical terms with the statutory auditor.
14. The fiscal board also considered the contents of the “Statutory Audit Certificates” issued by
the statutory auditor on the separate and consolidated accounts for the year ended 31

Caixa – Banco de Investimento, S.A.
Fiscal Board
December 2011, which encompass the statements of financial position, income statements,
comprehensive income, changes to shareholders’ equity and cash flows for the year.
15. OPINION
Taking all of the above into consideration, it is the fiscal board’s opinion that the shareholders’
meeting should:
a) approve the management report and separate and consolidated accounts for 2011,
submitted by CaixaBI’s board of directors;
b) consider the proposal for the appropriation of net income which is an integral part of the
management report;
c) undertake a general assessment of the company’s management and inspection, drawing
the conclusions referred to in article 455 of the commercial companies code.
Lisbon, 12 March 2012
FISCAL BOARD
____________________________________
Miguel José Pereira Athayde Marques
(Chairman)
_____________________________
Pedro António Pereira Rodrigues Felício
(Member)
____________________________________
Maria Rosa Tobias Sá
(Member)

Annual Report – 2011
191
Statutory Audit Certificate – Consolidated Accounts

STATUTORY AUDIT CERTIFICATE
CONSOLIDATED ACCOUNTS
(amounts in euros)
Introduction
1. We have examined the attached consolidated financial statements of Caixa - Banco de
Investimento, S.A. (Bank) and its subsidiaries, comprising the statement of its consolidated
financial position at 31 December 2011, evidencing a total of €2,161,678,743 and shareholders’
equity of €213,815,997, including net income of €8,552,996, its consolidated statements of
results, comprehensive income, changes to shareholders’ equity and cash flows for the year
then ended and corresponding notes.
Responsibilities
2. The Bank’s board of directors is responsible for preparing the consolidated financial statements
with a view to presenting a true and appropriate description of the financial position of the
companies included in the consolidation, their results and consolidated comprehensive income
generated by their operations, changes to consolidated shareholders’ equity and consolidated
cash flows, in addition to using adequate accounting policies and criteria and maintaining
appropriate internal control systems. It is our responsibility to express a professional,
independent opinion thereon, based on our examination of the said financial statements.
Scope
3. Our examination was performed in conformity with the technical standards and revision/audit
directives of the Order of Statutory Auditors4
which require that the examination be planned and
performed with the objective of obtaining an acceptable degree of assurance as to whether the
consolidated financial statements contain any materially relevant distortions. The examination
included verification of specimens of the supporting documents upon which the amounts and
information disclosed in the financial statements have been based and an assessment of
estimates based on judgements and criteria defined by the board of directors and used for the
preparation thereof. The examination also included verification of the consolidation operations
and application of the equity accounting method and whether the financial statements of the
consolidated companies have been appropriately examined; an appraisal of the adequacy of
4Ordem dos Revisores Oficiais de Contas

the accounting policies used, their uniform application and disclosure, based on the
circumstances, verification of the applicability of the going-concern principle and whether the
global presentation of the consolidated financial statements is adequate. Our examination also
included verification of the concordance between the consolidated financial information
contained in the board of directors’ report and the consolidated financial statements. We
consider that our examination has provided us with an acceptable basis upon which to express
our opinion.
Opinion
4. In our opinion, the consolidated financial statements, referred to in paragraph 1 above, provide
a true and appropriate description, in all materially relevant aspects, of the consolidated
financial position of Caixa - Banco de Investimento, S.A. and its subsidiaries at 31 December
2011, the consolidated results and consolidated comprehensive income generated by their
operations, changes to consolidated shareholders’ equity and consolidated cash flows for the
year then ended, in conformity with the International Financial Reporting Standards, as adopted
by the European Union.
Report on other lawful requirements
5. It is also our opinion that the information contained in the board of directors’ report is in
conformity with the financial statements for 2011.
Lisbon, 05 March 2012
Deloitte & Associados, SROC S.A.
Represented by João Carlos Henriques Gomes Ferreira

Annual Report – 2011
194
Statutory Audit Certificate – Separate Accounts

STATUTORY AUDIT CERTIFICATE
SEPARATE ACCOUNTS
(amounts in euros)
Introduction
1. We have examined the attached financial statements of Caixa - Banco de Investimento, S.A.
(Bank) comprising the statement of its separate financial position at 31 December 2011,
evidencing total assets of €2,169,198,024 and shareholders’ equity of €178,266,568, including
net income of €1,465,516, separate statements of results, comprehensive income, changes to
shareholders’ equity and cash flows for the year then ended and corresponding notes.
Responsibilities
2. The Bank’s board of directors is responsible for preparing financial statements with a view to
presenting a true and appropriate description of the Bank’s financial position, the results and
comprehensive income generated by its operations, changes to its shareholders’ equity and cash
flows, in addition to using adequate accounting policies and criteria and maintaining an
appropriate internal control system. It is our responsibility to express a professional, independent
opinion thereon, based on our examination of the said financial statements.
Scope
3. Our examination was performed in conformity with the technical standards and revision/audit
directives of the Order of Statutory Auditors5, which require that the examination be planned and
performed with the objective of obtaining an acceptable degree of assurance as to whether the
financial statements contain any materially relevant distortions. The examination included
verification of specimens of the supporting documents upon which the amounts and information
disclosed in the financial statements have been based and an assessment of estimates, based
on judgements and criteria defined by the board of directors and used for the preparation thereof.
The examination also included verification of whether the accounting policies used are adequate
and their disclosure, based on the circumstances, verification of the applicability of the going-
concern principle and whether the global presentation of the financial statements is adequate.
Our examination also included verification of the concordance between the financial information
contained in the board of directors’ report and the financial statements. We consider that our
examination has provided us with an acceptable basis upon which to express our opinion.
5Ordem dos Revisores Oficiais de Contas

Opinion
4. In our opinion, the separate financial statements, referred to in paragraph 1 above, provide a true
and appropriate description, in all materially relevant aspects, for the purposes specified in
paragraph 5 below, of Caixa - Banco de Investimento, S.A.’s financial position at 31 December
2011, its results and comprehensive income generated by its operations, changes to its
shareholders’ equity and cash flows for the year then ended, in conformity with the Adjusted
Accounting Standards issued by the Bank of Portugal (Note 2).
Emphasis of Matters
5. The financial statements referred to in paragraph 1 above, refer to the Bank’s separate activity
and have been prepared for approval and publication under current legislation and the
requirements of the Bank of Portugal. As indicated in Note 2.7 of the notes to the financial
statements, investments in subsidiaries, associated companies and jointly controlled entities are
recognised at cost and the attached financial statements do not, therefore, include the integral
consolidation effect nor the application of the equity accounting method, which shall be performed
in the consolidated financial statements to be approved and published separately. Additional
information on subsidiaries and associated companies is set out in Note 13 to the notes to the
financial statements.
Report on other lawful requirements
6. It is also our opinion that the financial information contained in the board of directors’ report is in
conformity with the financial statements for 2011
Lisbon, 05 March 2012
Deloitte & Associados, SROC S.A.
Represented by João Carlos Henriques Gomes Ferreira

Annual Report – 2011
197
Report on corporate governance

Annual Report – 2011
198
I Corporate governance

Annual Report – 2011
199
1 Assessment of compliance with good governance principles
Mission, objectives and general operating principles
RecommendationsLevel of compliance*
Obligation of compliance, respect and disclosure, of mission, objectives and policies, established in an economically, financially, socially and environmentally efficient manner, based on demanding quality parameters, designed to safeguard and expand competitiveness, in due respect for established social responsibility, sustainable development and satisfying collective principles and needs;
Accomplished (item 2)
To produce adequate activity plans and budgets in accordance with available resources and sources of finance based on its mission and the established objectives;
Accomplished (item 2)
Adoption of equality plans to achieve effective equality of treatment and opportunities between men and women, eliminating gender-based discrimination and permitting conciliation between employees’ personal, family and professional lives;
Accomplished (item 3)
Reporting of annual information to the supervisor and the general public, on how its mission has been furthered, level of compliance with objectives, means of compliance with the social responsibility and sustainable development policy and means of safeguarding competitiveness (through research, innovation, development and integration of new technologies in the productive process);
Accomplished(item 2/9)
Compliance with legislation and regulations, adopting an ethically irreproachable approach to the application of fiscal regulations, anti-money laundering operations, competition, consumer protection, the environment and labour relationships;
Accomplished (item 3)
Obligation to treat customers, suppliers and other lawfully entitled persons equally, establishing and disclosing the procedures adopted for the acquisition of goods and services, adopting adjudication criteria geared to principles of economy and efficacy, ensuring the efficiency of transactions made, guaranteeing equality of opportunities for all interested parties, providing annual information on all transactions which have not been made under market conditions and a list of suppliers representing more than 5% of external supplies and services;
Accomplished (item 4)
To manage all of the company’s business affairs with integrity (having or subscribing to a code of ethics which entails demanding ethical and deontological behaviour and the disclosure thereof);
Accomplished (item 3)
* Accomplished / accomplished in part / not accomplished / not applicable
Administration and inspection structures
RecommendationsLevel of compliance*
Number of members should not exceed the number in private companies, of a similar dimension operating in the same sector;
Accomplished (item 5)
The governance model should ensure effective separation between administration and inspection functions (with larger more complex companies spining off the supervisory function by creating an audit board or a board for financial issues);
Accomplished (item 5)
Issue of a global assessment report on governance structures and mechanisms in force in the company, by members of the inspection body;
Accomplished (item 5)
The accounts of the larger, more complex companies should be audited by external entities with identical standards to those used for companies admitted to trading in regulated markets, with the members of the inspection body being responsible for the selection, confirmation and contracting of the auditors, approval of any services outside the scope of the audit function and liaising between the company and auditors;
Accomplished (item 5)
Implementation of control system, protecting the company’s investments and assets, including all relevant risks assumed by the company;
Accomplished (item 7)
Promotion of the rotation and limiting of terms of offices of members of the inspection bodies; Accomplished (item 5)
* Accomplished / accomplished in part / not accomplished / not applicable

Annual Report – 2011
200
Prevention of conflicts of interest
RecommendationsLevel of compliance*
Obligation of members of statutory bodies not to be involved in decisions in which they have a personal interest;
Accomplished (item 5)
Obligation of members of statutory bodies to declare any important financial investments they may have in the company;
Accomplished (item 5)
Obligation of members of statutory bodies to declare any relevant relationships with suppliers, customers, credit institutions or other relationships which may create a conflict of interest.
Accomplished (item 5)
* Accomplished / accomplished in part / not accomplished / not applicable
Remuneration and other rights
RecommendationsLevel of compliance*
Annual disclosure of total remuneration (fixed and variable) earned by each member of the board of directors;
Accomplished (item 6)
Annual disclosure of information on remuneration earned by each member of the inspection body;Accomplished (item 6)
Annual disclosure of information on other benefits and incentives (healthcare insurance, use of vehicles and other benefits provided by the company);
Accomplished (item 6)
* Accomplished / accomplished in part / not accomplished / not applicable
Disclosure of relevant information
RecommendationsLevel of compliance*
To publicly and immediately disclose all information off which they are aware, which may have a relevant effect on the company’s economic and financial situation and net worth;
Accomplished (item 8)
To provide for the disclosure of information on the state’s corporate websites, in a clear, relevant and up-to-date manner, of all of the company’s above referred to financial, historical and current information and the identity and résumés of all members of its statutory bodies;
Accomplished (item 8)
To include an item on corporate governance in the board of directors’ report (internal and external regulations binding on the company, information on relevant transactions with related entities, remuneration of members of statutory bodies, sustainability analysis and assessment of level of compliance with GGP);
Accomplished (item 8)
Nomination of ombudsman, when justified. Not applicable
* Accomplished / accomplished in part / not accomplished / not applicable

Annual Report – 2011
201
2 Management guidelines, mission, objectives and policies
Information on management guidelines applicable to CaixaBI, namely strategic guidelines
for the state’s business sector as a whole, general guidelines on the financial sector and
specific guidelines for CaixaBI
CaixaBI, as CGD Group’s investment Bank, complies with the strategic guidelines defined both for the
state’s business sector as a whole and CGD Group in particular.
Mission
CaixaBI’s principal mission is to dynamise the investment banking business platform between Portugal
Spain, Brazil and Lusophone Africa, in its different business areas, providing customers with an international
dimension in any of the above mentioned geographies with an integrated financial service.
This mission is horizontal to the different product areas: project finance, structured finance, corporate finance
– advisory, debt capital market, equity capital market, financial brokerage, research, financing and
structuring areas, syndication and sales and venture capital.
Key strategic objectives
The strategic objectives defined by CaixaBI include:
To operate as a benchmark services provider in a context of major liquidity restrictions.
To strengthen internationalisation with the core objective of developing its medium term operations, with
an approach to internationalisation in line with CGD Group strategy and geared to its natural markets
for the expansion of Portuguese companies: Spain, Brazil, Angola and Mozambique.
In Brazil, to focus on opportunities generated by strong economic growth potential, dynamism of its
capital market, intense cross-border activity and the internationalisation of Brazilian companies
including the target markets of Iberia and Lusophone Africa.
In Lusophone Africa, to exploit the opportunities afforded by the strong economic growth potential of
these geographies, based on the availability of significant natural resources and development of local
infrastructures, in addition to the major interest they attract in terms of foreign direct investment and
particularly for players in CaixaBI’s other target markets.
To consolidate its leading position in investment banking in Portugal.
To strengthen synergies with CGD Group, covering the areas of relationships with major companies,
SMEs and equity market investors (branch office network).
To invest in the Portuguese business relationship with any of the geographies – Portugal, Spain, Brazil,
Angola and Mozambique – as the development hub.
To maintain the lead of the debt area in Portugal and to exploit opportunities in the Brazilian, Angolan
and Mozambican markets, with the support of local CGD Group companies.
In the project finance area, to secure the services of a larger number of banks for the formation of
banking syndicates and increasingly commit to the provision of services in a context of major liquidity
restrictions.

Annual Report – 2011
202
In the structured finance area, to commit to the development of financial advisory business in liabilities
reorganisation processes.
To reposition the Bank in Spain as a services provider, actively endeavouring to increase its visibility
with Spanish companies and investors.
To leverage the Bank’s syndication capacity, expanding its presence to opportunities in the Bank’s
target geographies.
In the equity and mergers and acquisitions areas, to participate as a financial advisor in the privatisation
processes occurring in Portugal over the next few years in addition to exploiting the recovery of the
Portuguese and Spanish markets over time, and sustaining growth rates in the Brazilian and
Lusophone African markets.
To develop the financial brokerage area, in order to consolidate a market share commensurate with the
dimension of the CGD Group.
To implement cross-selling operations in venture capital and investment banking areas, coordinating
the processing of operations and providing customers with value added services.
To form commercial teams on a matrix and technically polyvalent basis (product and country) retaining
human resources with high quality and potential and promoting career development opportunities on an
international level.
Venture capital:
To affirm our leadership of the market, favouring the development of the venture capital industry,
entrepreneurialism, innovation and sustainability, encouraging new globalisation players and
strengthening national decision-making centres.
To reconfigure CGD Group’s venture capital area, ensuring an integrated approach to resources based
on a complementary approach, to anticipate opportunities, strengthen partnerships and mobilise
investors.
To provide a more comprehensive offer, less concentrated on investments of a relevant dimension,
geared to different types of business and economic agents, to respond to the challenges facing the
Portuguese economy which determine investments with greater requirements in terms of the use of
shareholders’ equity, in the business sphere.
To strengthen synergies within CGD Group, allying the advantages of belonging to the largest national
financial group to its specialised knowledge on the reality of companies and the risks incurred.
To reinforce operating standards, incorporating the general trends characterising the process of
sophistication recorded in the financial industry on a level of products, processes and governance.
Information on the annual production of an activities plan and a report providing information on
compliance with the company’s mission, objectives and policies, including social responsibility and
sustainable development polices and safeguarding competitiveness through research, innovation
and the integration of new technologies in terms of production.
CaixaBI develops an annual planning process as part of its activities and budget plan with the aim of
quantifying the strategic objectives applied to its business units over the medium term.

Annual Report – 2011
203
A management information system, comprising a vast range of periodic reports on the various areas of
activity, allows for the control of the execution of the approved plan.
In addition to the description of CaixaBI’s activities, an analysis of sustainability in the economic, social and
environmental domains is set out in the annual report.

Annual Report – 2011
204
3 General operating principles
Internal and external regulations binding upon the company
CaixaBI is governed by its articles of association and a series of internal standards and procedures, adapted
both to the evolution of national and European legislation on its activity, and the regulatory standards issued
by supervisors, i.e. Bank of Portugal (BdP) and Securities Market Commission (CMVM).
CaixaBI has a standards and procedures system, published on its intranet and accessible to all employees,
upon whom it is binding. It covers the most relevant aspects of the company’s operation and activities. The
standards and procedures system establishes the rules and competencies on production, management,
support media, disclosures and access to standards, notably organic structure, personnel policy,
characteristics of products and services and procedures or information of relevance to the performance of its
activity.
Code of conduct
As banking activities should be governed by strict principles of impartiality and transparency, to be complied
with by all employees, CaixaBI has introduced internal standards governing professional deontology, issuing
directives on these issues which have been compiled in a code of conduct published in September 2008 of
which all employees have been informed and which is available at (www.caixabi.pt). Reference should also
be made, in the ethical and deontological sphere, to standards relating to privileged information and
professional secrecy.
Compliance with legislation and regulations
All of CaixaBI’s activity is geared to strict compliance with legal, regulatory, ethical and deontological
standards and good practice. Its respective compliance is monitored by an internal control system.
CaixaBI has adopted an ethically irreproachable attitude to the application of fiscal, anti-money laundering,
competition, consumer protection, environmental and labour regulations.
The Bank has various regulations to which reference should be made on account of their importance. They
include its anti-money laundering handbook, conflicts of interest policy, counterparties and correspondents’
handbook, credit operations procedures handbook, compliance regulations handbook, opening and use of
accounts, prevention of market abuse policy, business continuity plan, global security of information policy,
research office conduct and procedures handbook – financial analysts, management handbook for
operational risk and social responsibility and sustainability.
Internal regulations on financial brokerage activities, defining standards and procedures to be complied with
in financial brokerage activities, prepared on the basis of the dispositions on this subject matter, namely the
securities code (CVM) and dispositions issued by supervisors (Bank of Portugal and Securities Market
Commission) have also been produced and issued and are binding upon employees.
The Bank’s regulations have also been designed to implement professional and personal advancement
policies for its workers, performance management, the performance of functions or activities outside the
Bank, treatment of all workers with dignity and respect, equality of treatment and equal opportunity between
men and women, reconciliation between personal, family and professional lives, employee loans and career
models.

Annual Report – 2011
205
4 Relevant transactions with related parties
All CGD Group companies are considered to be CaixaBI related parties.
Of the transactions with related parties, those deemed to be most relevant occurred with the following
entities:
Caixa Geral de Depósitos, S.A.
Locarent – Companhia Portuguesa de Aluguer de Viaturas, S.A.
Banco Caixa Geral - Brasil, S.A.
Companhia de Seguros Fidelidade - Mundial, S.A.
At 31 December 2011, CaixaBI’s financial statements included the following balances and transactions with
related parties:
2011
(EUR thousand) Caixa Capital CGDOther CGD Group
companies
Assets
Investments in credit institutions 26,082
Securities and derivative financial instruments held for trading
55,168 1,546
Loans and advances to customers 100 118
Other assets 41 295 33
Liabilities
Customer resources and other loans 6,773 64,963
Debt securities
Subordinated liabilities
Other liabilities 9 24 27,361
Provision of guarantees 9,627 3,650
Income
Interest and similar income 90,093 4,107
Income from financial operations 231,048 4,013
Income from services and commissions 1,845 1,835
Other operating income 243 556 327
Costs
Interest and similar costs 130 205,014 3,500
Losses on financial operations 565,161 3,018
Commissions 336 848
Other operating costs 404

Annual Report – 2011
206
Procedures for the acquisition of goods and services
CaixaBI has transparent procedures in place for the acquisition of goods and services, based on adjudication
criteria geared to principles of economy and effectiveness, with internal regulations defining the procedures
to be used for the selection of and relationship with suppliers under an outsourcing regime. The procedures
are described below:
Market enquiries – at least three suppliers per product are normally consulted.
Selection of suppliers – based on a comparison of proposals received.
Authorisation of expenditure – in accordance with the appropriate delegation of competency.
Contracts with goods suppliers and/or service providers – in writing or through formal contract.
Reference should be made to the following as regards the selection of suppliers:
The number of competitors invited to bid should not be less than three unless this is justifiably
impossible or in a situation involving the evolution of already existing solutions and with active contracts
with suppliers.
The following factors, when related with the guarantees put up by competitors, are subject to the Bank’s
technical qualification and assessment:
- The quality of the service provided, from level of performance to availability of solution;
- The quality of the proposed products;
- Fulfilment of conditions and requirements identified and respective performance, which should be set
out in tender documents to be supplied by CaixaBI to the propecting suppliers;
- The functional transversal nature of the current or potential solution;
- Compliance with the agreed schedule.
Based on the same approach, the following factors should be assessed and qualified:
- Adequacy vis-à-vis technical criteria;
- The capacity to integrate with solutions already existing within CaixaBI or CGD Group;
- The existence of success indices in similar projects;
- Commitment to levels of service;
- Commercial and financial terms proposed.
Lastly, differentiating factors should be considered, such as:
- Track record of relationship with CaixaBI;
- Track record of relationship with CGD Group companies;
- Effective independence vis-à-vis CGD Group’s direct competitors;
- Financial stability and seniority;
- Possession of ISO certifications;
- The supplier’s technical qualification, experience and professionalism;
- Ethical behaviour attuned to the principles of social responsibility and sustainability defended by
CaixaBI;
- Customer references (projects and customer portfolios);

Annual Report – 2011
207
- Benefits accruing from the establishing of a medium/long term relationship.
The safeguarding of the correct implementation and maintenance of projects and applications systems
should be set out in a CaixaBI tender document. The contracting process implies a supplier’s acceptance of
and automatic agreement to the Bank’s monitoring and/or inspection activities, at the implementation and/or
maintenance stages and the tender documents should therefore be binding, using general terminology
revised by the Legal Affairs Office but notably covering:
Definition of levels of quality of service;
Definition of adequate monitoring mechanisms for the effective control of the levels of quality of service;
Secrecy undertaking relative to information obtained as part of the provision of services;
Functionality/operationality and, if appropriate, transversal tests.
Transactions which have not been made under market conditions
Contracts usually entered into with CGD Group companies, without consulting the market refer to:
Insurance – with Companhia de Seguros Fidelidade-Mundial;
Vehicles renting – with Locarent - Companhia Portuguesa de Aluguer de Viaturas, S.A.
List of suppliers representing more than 5% of external supplies and services on a separate
basis
The following suppliers represented more than 5% of the external supplies and services, on a separate
basis, in 2011;
Thomson Reuters (Markets) Europe, S.A. (Portugal branch)
Locarent – Companhia Portuguesa de Aluguer de Viaturas, S.A.
Caixa Geral de Depósitos, S.A.
Bloomberg L.P.
Osíris – Viagens e Turismo, Lda.
Evolution of average payment period to suppliers
The evolution of the average payment period to suppliers, in 2011, was as follows:
1st quarter 2nd quarter 3rd quarter 4th quarter
22 days 43 days 39 days 6 days

Annual Report – 2011
208
5 Corporate model
CaixaBI´s governance model, which ensures effective separation between executive and inspection
functions, comprises its shareholders’ meeting, board of directors, fiscal board and statutory auditor other
than a member of the audit board.
CaixaBI Organogram
Board of Directors
ExecutiveBoard
Business Committee Credit Committee InvestmentsCommitteeSteering CommitteeBusiness Continuity
Plan
Operational Risk andInternalControl
Managment Committee
Committees
Shareholders’ Meeting
Fiscal Board andStatutoryAuditor
RemunerationCommittee
Compliance Office
Ália Silva
CorporateDebtFinanceDivision
Paulo Serpa Pinto
Primary Equities MarketDivision
Ana Santos Martins
Corporate Advisory Division
Paulo Oliveira Silva
Syndication and Sales
Leonor Canedo
Project Finance Division
Daniel Santos
Structured Finance Division
Paulo Henriques
Finance and StructuringDivision
Francisco Santos
Research Office
João Miguel Lourenço
Internal Audit Office
Fernando Oliveira
Financial Brokerage Division
Valentim Martins
Legal Affairs Office
Ana Andrade
Strategic PlanningandOrganisation Division
Rita Lourenço
Human and AdministrativeResources
António Carlos Alves
OperationsDivision
Miguel Freire
Marketing andCommunication Office
António Gregório
AccountsDivision
João Gonçalves
Information Systems
Ema Campos
Business Areas
Support Areas

Annual Report – 2011
209
5.1 Statutory bodies
Shareholders’ meeting
The shareholders’ meeting shall comprise a chairman and two secretaries, elected for three year terms of
office by the shareholders’ meeting and who may be re-elected on one or more occasions.
Article 10 of CaixaBI’s articles of association states that all shareholders with one thousand or more shares
registered in their name in the company’s share ledgers are entitled to be present at shareholders’ meetings,
with each block of one thousand shares being entitled to one vote in accordance with no. 2 of article 14.
Shareholders with less than one thousand shares may form groups to make up this number and arrange to
be represented by any group member, to be indicated in a letter to the chairman of the shareholders’
meeting. In the case of the joint ownership of shares, only one of the owners may participate in shareholders’
meetings, and must be given a power of attorney by the others.
Shareholders may arrange to be represented at shareholders’ meetings by informing the chairman of the
meeting, by letter, prior to the meeting’s scheduled date. Shareholders who are singular persons may
arrange to be represented by other shareholders or other lawfully entitled persons. Collective persons shall
be represented by the person nominated for the purpose in question.
The chairman of the shareholders’ meeting shall call an extraordinary shareholders’ meeting whenever
requested by shareholders with the minimum number of shares required by law and who request the
meeting in a letter with a notarised signature providing precise information on the issues to be included on
the agenda and justifying the need for the meeting. A shareholders’ meeting called at the request of
shareholders shall only be held if applicants holding the minimum number of shares required to call the
meeting are present.
There are no limitations on voting rights, nor does any shareholder enjoy special rights and there is no
knowledge of any shareholders’ agreement.
Composition of shareholders’ meeting (2011-2013)
Chairman – José Lourenço Soares
Secretary – Salomão Jorge Barbosa Ribeiro
Secretary – António Pereira Grada Ferreira

Annual Report – 2011
210
Board of directors
The board of directors comprises a minimum of three and maximum of fifteen members elected for three
year terms of office by the shareholders’ meeting and may be re-elected on one or more occasions. The
board of directors shall choose its chairman and may, at its discretion, appoint one or more deputy chairmen
from among their number.
The board of directors is responsible for the Bank’s corporate business affairs and meets whenever called by
its chairman and at least once every three months. Resolutions are taken by an absolute majority of the
members present or represented with the chairman, deputy chairman or respective deputy having the
casting vote. Board of directors’ resolutions are only valid when more than half of its members are present or
represented.
Under the terms of the articles of association, the board of directors delegates the authority to manage the
company’s day-to-day affairs to the executive committee giving it - without prejudice to the faculty of taking
upon itself any of the respective competencies - the authority necessary to make decisions on all issues
related to the Bank’s performance of its activity, with the exception of those issues which cannot be
delegated under no. 4 of article 407 of the commercial companies code.
The board of directors met twelve times in 2011 and the executive committee met weekly.
Composition of board of directors (2011-2013)
Chairman – Jorge Humberto Correia Tomé
Chairman of executive committee – Jorge Telmo Maria Freire Cardoso
Executive director – Gonçalo Vaz Gago da Câmara de Medeiros Botelho
Executive director – Francisco José Pedreiro Rangel
Non-executive director – Rui Manuel do Vale Jordão Gonçalves Soares
Non-executive director – José Pedro Cabral dos Santos
Non-executive director – José Manuel Carreiras Carrilho

Annual Report – 2011
211
Fiscal board
The fiscal board is responsible for inspecting the company. It meets and establishes the contacts considered
necessary for collecting all and any pertinent information on the Bank and other companies included in the
consolidation.
The fiscal board is made up of three acting and one deputising member who perform their duties as set out
by law. It is elected every three years by the shareholders’ meeting, which also appoints its respective
chairman. Members are lawfully entitled to be re-elected.
The members of the fiscal board are not affected by the incompatibilities referred to in article 414-A of the
commercial companies code and are mainly independent in conformity with the recommendation set out in
Bank of Portugal circular letter 24/2009/DSB and article 414 nos. 5 and 6 of the commercial companies
code.
Composition of fiscal board (2011-2013)
Chairman – Miguel José Pereira Athayde Marques
Member – Pedro António Pereira Rodrigues Felício
Member – Maria Rosa Tobias Sá
Deputy – João Barata da Silva
Statutory auditor
The statutory auditor is elected every three years by the shareholders’ meeting with the competencies
defined by law. There is a deputising statutory auditor.
Statutory auditor (2011-2013)
Acting - Deloitte & Associados, SROC represented by João Carlos Henriques Gomes Ferreira
Deputising - Carlos Luís Oliveira de Melo Loureiro

Annual Report – 2011
212
Curriculum Vitae of Members of the Board of Directors and Fiscal Board
Board of Directors
Chairman of Board of Directors
Jorge Humberto Correia Tomé
Date of birth 7 November 1954
Current positions Member of the board of directors of Caixa Geral de Depósitos, S.A., since January 2008
Chairman of the board of directors of Gerbanca, SGPS, S.A., since May 2009
Non-executive board member of Cimpor - Cimentos de Portugal, SGPS since May 2009
Non-executive board member of Parcaixa, SGPS, S.A., since April 2009
Deputy chairman of the board of directors of Banco Caixa Geral - Brasil, S.A., since April 2009
Non-executive board member of Portugal Telecom, SGPS, S.A., since March 2009
Non-executive director of monitoring and strategy committee of Fomentinvest, SGPS, since
May 2008
Chairman of the board of directors of Credip - Instituição Financeira de Crédito, S.A., since
April 2008
Chairman of the board of directors of Caixa - Banco de Investimento S.A., since March 2008
Non-executive board member of Banco Comercial e de Investimentos, SARL (Mozambique)
since August 2007
Chairman of the board of directors of Trem - Aluguer Material Circulante, ACE, since March
2002
Chairman of the board of directors of Trem II - Aluguer Material Circulante, ACE, since March
2002
Former positions Chairman of executive board of Caixa – Banco de Investimento, S.A., from March 2002 to
January 2008
Non-executive board member of Caixa Gestão de Patrimónios, S.A., from September 2001 to
March 2004
Executive director of Caixa – Banco de Investimento, S.A., from July 2001 to March 2002
Non-executive director of BANIF Imobiliária, S.A., from April to June 2001
Non-executive director of BANIF IMO - Sociedade Gestora de Fundos de Investimento
Imobiliário, from June 2000 to June 2001
Director of Sociedade Gestora de Fundos de Pensões, S.A. – Açor Pensões, S.A. (currently
Banif Açor Pensões), from October 1999 to July 2001
Executive board member of “O Trabalho” and “O Trabalho Vida”, insurance companies from
May 2000 to July 2001
Director (executive) of Companhia de Seguros Açoreana, BANIF Group, with direct
responsibility for the financial and administrative, personnel, IT, legal affairs office and life
insurance areas from December 1996 to May 2000
Partner of Coopers & Lybrand in Portugal, responsible for the financial and corporate finance
areas, from June 1995 to November 1996
Director of Banco Pinto & Sotto Mayor responsible for the coordination of the bank’s branch in
France and Sottomayor Bank of Canada (BPSM subsidiary), from February 1995 to May 1995

Annual Report – 2011
213
Chairman of Board of Directors
Jorge Humberto Correia Tomé
Director of Banco Pinto & Sotto Mayor, responsible for international management, IT and
organisational management, administration and Telesotto (BPSM instrumental company for
home banking) from March 1994 to January 1995 (date of the bank’s privatisation)
Executive director of Sociedade de Capital de Risco SULPEDIP, S.A. (currently PME
Investimentos, S.A.), from July 1989 to March 1994
Technical officer in the capital market section of the securities division of Banco Pinto & Sotto
Mayor, from September 1985 to 1986, having worked in the division as a deputy manager and
director from 1986 to 1994
Director of CPG – Sociedade Gestora de Fundos de Investimento FIPOR, on behalf of the
bank
Corporate and industrial projects and tourism sector analysis officer for Banco Pinto & Sotto
Mayor (economic studies division), engaged in April 1983
Technical officer at Coopers & Lybrand, Lda., engaged in February 1980, promoted to senior
auditor in 1982
Technical officer/economist at Instituto de Apoio às Pequenas e Médias Empresas e ao
Investimento (IAPMEI), engaged in September 1979
Academic qualifications Masters in applied economics from the economics faculty of Universidade Nova de Lisboa
Degree in organisation and corporate management from ISCTE

Annual Report – 2011
214
Chairman of Executive Committee
Jorge Freire Cardoso
Date of birth 8 August 1971
Current positions Chairman of the executive committee of Caixa - Banco de Investimento, S.A., since May 2011
Non-executive board member of ZON – Serviços de Telecomunicações e Multimédia, SGPS,
S.A., since January 2008
Non-executive board member of Empark Portugal – Empreendimentos e Exploração de
Parqueamentos, S.A., since February 2010
Non-executive board member of Dornier, S.A., since February 2010
Areas of responsibility Financial brokerage division
Project finance division
Corporate finance advisory division
Equity capital market division
Strategic planning and organisation division
Marketing and communications office
Human and administrative resources office
Former positions Executive director of Caixa – Banco de Investimento, S.A., from March 2008
Non-executive board member of Fomentinvest, SGPS, S.A., from 2007 to 2008
Coordinating director of Caixa – Banco de Investimento, S.A., in the corporate equity finance
division, supervising the primary share, financial advisory and mergers and acquisitions areas
from 2000 to 2008
Director of corporate finance of Banco Efisa, from 1995 to 2000
Consultant of Roland Berger & Partners, from 1993 to 1994
Academic qualifications MBA from INSEAD
Degree in economics from Universidade Nova de Lisboa
Other qualifications/ distinctions
Guest assistant professor at FEUNL

Annual Report – 2011
215
Executive Board Member
Gonçalo Vaz Gago da Câmara de Medeiros Botelho
Date of birth 7 November 1966
Current positions Executive director of Caixa – Banco de Investimento, S.A., since June 2005
Non-executive director of Corporación Interamericana para el Financiamento de Infraestructura
(CIFI), since March 2004
Non-executive director of Portugal-Brazil Chamber of Commerce, since February 2009
Non-executive director of Banco Caixa Geral – Brasil, S.A., since July 2009
Non-executive director of BNI – Banco Nacional de Investimento, since November 2011
Areas of responsibility Corporate debt finance division
Syndication and sales desk
Research office
Internal audit office
CIFI
Spain branch
Africa
Former positions Non-executive director of La Seda de Barcelona, from October 2010 to October 2011
Coordinating director responsible for the international customers division of Caixa Banco de
Investimento, S.A., from 2004 to 2005
Coordinating director responsible for customer division of Caixa - Banco de Investimento, S.A.,
from 2000 to 2004
Board member of CaixaWeb, SGPS, S.A., from 2000 to 2005
Member of the fiscal board of Portugal Telecom, SGPS, S.A., from 2003 to 2007
Non-executive board member of Previsão – Sociedade Gestora de Fundos de Pensões, S.A.,
from 2003 to 2004
Member of the board of directors of Aenor – Auto-Estradas do Norte, S.A. and Operanor –
Operação e Manutenção de Auto-Estradas, S.A., from 1999 to 2000
Coordinating director of major enterprises division of Grupo Mundial - Confiança (Banco Totta
& Açores, Banco Pinto & Sotto Mayor and Banco Chemical Finance), from 1996 to 2000
Sub director responsible for the major enterprises division of Banco Mello de Investimentos,
from 1993 to 1996
Analyst and account manager at Banque Nationale de Paris (Portugal Branch), from 1990 to
1993
Account manager at McCann Eriksson, in 1990
Trainee at Banco Português do Atlântico, from 1989 to 1990
Academic qualifications Financial management programme from Stanford Business School – 1994
MBA specialising in marketing from Universidade Católica Portuguesa – 1993
Degree in corporate management and administration from Universidade Católica Portuguesa –
1989

Annual Report – 2011
216
Executive Board Member
Francisco José Pedreiro Rangel
Date of birth 29 September 1971
Current positions Executive board member of Caixa - Banco de Investimento, S.A., since September 2011
Areas of responsibility Financial and structuring division
Structured finance division
Operations division
Information systems division
Accounts division
Compliance office
Legal affairs office
Former positions Coordinating director responsible for the strategic planning and organisation division of Caixa -
Banco de Investimento, S.A., 2011
Coordinating director responsible for the corporate finance – advisory area of Caixa - Banco de
Investimento, S.A., from 2008 to 2011
Director of the corporate finance – advisory division of Caixa - Banco de Investimento, S.A.,
from 2000 to 2008
Research director of Banco de Mello de Investimentos, from 1996 to 2000
Financial analyst in Lisbon Stock Exchange from 1993 to 1996
Academic qualifications Degree in economics from Universidade Nova de Lisboa
Other qualifications/ distinctions
Assistant professor at FEUNL, from 1998 to 2000

Annual Report – 2011
217
Non-executive Board Member
Rui Manuel do Vale Jordão Gonçalves Soares
Date of birth 19 May 1964
Current positions Executive deputy chairman and chief corporate development officer of Banco Caixa Geral
(Spain), since 2006
Executive chairman of Imobiliária Caixa Geral (Spain), since 2008
Non-executive director of Caixa - Banco de Investimento, S.A., since 2008
Non-executive director of GERBANCA – Sociedade Gestora Participações Sociais, S.A., since
2011
Member of advisory board of consular section of the Portuguese Embassy in Spain, since 2010
Chairman of Spain-Portugal Chamber of Commerce and Industry in Spain, since 2005
Former positions Executive chairman of the board of directors of JustLink – Redes e Conteúdos de Internet,
S.A., from 2003 to 2005
Chairman of the board of directors of IAPMEI – Instituto de Apoio às Pequenas e Médias
Empresas e ao Investimento from 2000 to 2003
Member of general board of Competitiveness Forum from 2000 to 2003
Chairman of shareholders’ meeting of APCRI – Associação Portuguesa de Capital de Risco,
from 2000 to 2003
Director of IPE – Estudos, Projectos e Investimentos, S.A., in 2000
Executive director of the internationalisation area of IPE – Estudos, Projectos e Investimentos,
S.A., in 2000
Chairman of IPE Capital - Soc. de Capital de Risco, S.A., from 1997 to 2000
Board member of EVCA – European Venture Capital Association, from 1995 to 2000
Chairman of APCRI – Associação Portuguesa de Capital de Risco, from 1992 to 2000
Director of IPE Capital - Soc. de Capital de Risco, S.A., from 1992 to 1997
Advisor to the board of directors of IPE - Investimentos e Participações Empresariais, in 1992
Advisor to the board of directors of EGF - Empresa Geral de Fomento, from 1991 to 1992
Project manager at IPE, in the investment and development division from 1987 to 1991
Academic qualifications MBA in international management
Postgraduation in European studies
Degree in corporate management and organisation from Universidade Católica Portuguesa
Other qualifications/ distinctions
Postgraduation coordinator of municipal corporations management at Universidade Católica
Portuguesa
Lecturer at Universidade Católica Portuguesa
Masters in management studies lecturer at Instituto Inter-Universitário de Macau
Lecturer at the Escola de Pós-Graduação da Universidade Lusófona
Lecturer on the Dislogo programme (open and distance training) – UCP
Coordinator of publications prepared by Universidade Católica Portuguesa for Instituto de
Turismo de Portugal

Annual Report – 2011
218
Non-executive Board Member
José Pedro Cabral dos Santos
Date of birth 5 July 1960
Current positions Central director of major enterprises division of Caixa Geral de Depósitos, S.A.
Non-executive director of Caixa - Banco de Investimento, S.A.
Former positions Director (non-executive) of Lusofactor, Sociedade de Factoring, S.A. (2003-2005)
Director of CGD’s major enterprises division, responsible for northern division (1999-2002)
Director of CGD’s northern commercial division, responsible for coordination of the major
companies segment (1998-1999)
Coordinating director of BFE/Grupo BPI (1994-1997)
Director (non-executive) of FINICRÉDITO SFAC (1992-1994)
Technical officer in Finindústria-Sociedade de Investimentos e de Financiamento Industrial and
latterly subdirector of Finibanco (1989-1994)
Technical trainee and latterly senior technical operative at União de Bancos Portugueses
(1984-1989)
Academic qualifications Degree in economics from the faculty of economics of Porto University, in 1983
Other qualifications/ distinctions
Guest assistant lecturer at faculty of economics of Porto University (1983-1988)

Annual Report – 2011
219
Non-executive Board Member
José Manuel Carreiras Carrilho
Date of birth 30 March 1951
Current positions Member of the board of directors of Caixa Capital – Sociedade de Capital de Risco, S.A., since
2000
Member of the board of directors of Caixa Desenvolvimento, SGPS, S.A., since 2000
Member of the board of directors of CaixaBI – Banco de Investimento, S.A., since 2008
Member of the board of directors of Vila Galé – Sociedade de Empreendimentos Turísticos,
S.A., since 2010
Member of the board of directors of Visabeira Imobiliária, SGPS, S.A. since 2006
Member of the board of directors of Visabeira Indústria, SGPS, S.A. since 2006
Member of the board of directors of Visabeira Participações Financeiras, SGPS, S.A. since
2006
Member of the board of directors of Visabeira Turismo, SGPS, S.A. since 2006
Member of the board of directors of Mesquita ETVIA, SGPS, S.A. since 2009
Member of the board of directors of A. Silva & Silva – Imobiliária e Serviços, S.A., since 2002
Member of the board of directors of PP3E – Projectos e Participações em Empreendimentos
de Energia Eléctrica, S.A., since 2003
Former positions Member of the board of directors of Caixa Investimentos – Sociedade de Investimentos, S.A.,
from 2000 to 2002
Chairman of the board of directors of PME Investimentos – Sociedade de Investimentos, S.A.,
from 1996 to 2000
Chairman of the board of directors of PME Capital – Sociedade de Capital de Risco, S.A., from
1996 to 1999
Member of the board of directors of LISPOLIS – Associação para o Pólo Tecnológico de
Lisboa, from 1999 to 2000;
Member of the board of directors of COMPTRIS – Companhia Portuguesa de Capital de Risco,
S.A., from 1998 to 2000
Member of the board of directors of CEDINTEC – Centro para o Desenvolvimento e Inovação
Tecnológica, from 1990 to 1999
Member of the board of directors of IPE – Companhia Portuguesa de Capital de Risco, S.A.,
from 1994 to 1997
Chairman of fiscal board of COMPTRIS – Companhia Portuguesa de Capital de Risco, S.A.,
from 1994 to 1996
Member of the board of directors of SULPEDIP – Sociedade de Capital de Risco, S.A., from
1995 to 1996
Technical operator/regional director of IAPMEI – Instituto de Apoio às Pequenas e Médias
Empresas e ao Investimento, from 1976 to 1995
Academic qualifications Degree in finance, from ISEG
Specialised training in INSEAD (Fontainebleau)
Other qualifications/ distinctions
Guest professor at ISCTE

Annual Report – 2011
220
Fiscal board
Chairman
Miguel José Pereira Athayde Marques
Date of birth 29 April 1955
Current positions Non-executive director of Brisa, CR, S.A.
Chairman of fiscal board of Caixa - Banco de Investimento, S.A.
Professor of management at Universidade Católica Portuguesa
Former positions Chairman of the board of directors of Euronext Lisbon, S.A.
Chairman of the board of directors of Interbolsa, S.A..
Director of Euronext, N.V. (Holland)
Non-executive director of Paris, Brussels and Amsterdam stock exchanges
Member of the executive committee of the New York Stock Exchange
Director of Caixa Geral de Depósitos
Member of the executive committee of Jerónimo Martins
Chairman of board of directors of ICEP
Academic qualifications PhD in corporate management from University of Glasgow, School of Financial Studies
Degree in corporate administration and management from Universidade Católica Portuguesa
(Lisbon)
Member
Pedro António Felício
Date of birth 8 December 1971
Current positions Responsible for the international purchasing division of PT Compras
Member of fiscal board of Caixa - Banco de Investimento, S.A.
Chairman of shareholders’ meeting of Parpública - Participações Públicas (SGPS), S.A.
Former positions Director-general of the Portuguese Treasury and Finances Department
Member of fiscal board of Caixa Geral de Depósitos, S.A.
Executive member of the board of directors of Sagestamo - Sociedade Gestora de
Participações Sociais Imobiliárias, S.A.
Chairman of the board of directors of Agência Nacional de Compras Públicas, E.P.E.
Director of financial services of PT PRO - Serviços de Gestão, S.A.
Academic qualifications Degree in economics from Instituto Superior de Economia e Gestão (ISEG) - Universidade
Técnica de Lisboa.

Annual Report – 2011
221
Member
Maria Rosa Tobias Sá
Date of birth 16 August 1960
Current positions Assistant to Minister of Health
Member of fiscal board of Caixa - Banco de Investimento, S.A.
Chair of fiscal board of PARUPS, S.A., PARVALOREM, S.A. and PARPARTICIPADAS, SGPS,
S.A.
Former positions Chair of advisory board of INRB, I.P.
Head of unit in the European anti-fraud organism
Director of technical advisory section of the Procuratorship General of the Republic
Deputy manager general of the department for European Social Fund affairs
Director of Inspectorate General of Agriculture services
Inspectorate General of Finance inspector
Member of fiscal board of CGD
Chair of fiscal board of Banco Efisa, S.A.
Academic qualifications Degree in economics from Instituto Superior de Economia e Gestão (ISEG) – mathematical
methods area
Deputy
João Barata da Silva
Date of birth 17 March 1947
Current positions Member of fiscal board of IPAI - Instituto Português de Auditoria Interna, since 2002
Chairman of fiscal board of Banco Interatlântico, since 2006
Chairman of fiscal board of Banco Internacional de S. Tomé e Príncipe, since 2006
Chairman of remuneration committee of A Promotora, Sociedade de Capital de Risco, S.A.
Chairman of remuneration committee of Banco Comercial do Atlântico, S.A.R.L.
Chairman of remuneration committee of Garantia, Companhia de Seguros, S.A.R.L.
Deputising member of fiscal board of Parcaixa, SGPS, S.A.
Deputising member of Caixa – Banco de Investimento, S.A.
Former positions Deputising member of fiscal board of Locapor (leasing)
Director of audit department of CGD, from 1991 to 2005
Academic qualifications Higher banking degree (IFB/Universidade Católica)
Degree in economics (ISE - Faculdade Técnica de Lisboa)
Certified accountant (former Instituto Comercial de Lisboa)

Annual Report – 2011
222
Prevention of conflicts of interest
The members of the board of directors are fully aware of their duties not to be involved in discussions and
adoptions of resolutions on certain subject matters and comply with these standards in their activity.
5.2 Specialised committees
CaixaBI has four specialised committees and a remunerations committee whose competencies, composition
and frequency of meetings is set out below.
Business Committee
CaixaBI’s Business Committee meets every week and has the following main functions:
To analyse the main macro and microeconomic events and their expectable impact on the Bank’s
activity;
To analyse the evolution of the financial brokerage business notably volume of market trading and
commissions received;
To monitor the Bank’s activity, notably mandates in progress;
To analyse operations in the pipeline;
To analyse eventual cross-selling business opportunities;
To take note of other matters directly related with the Bank’s operations.
Composition of the Business Committee
Members of Executive Board
Directors, or their deputies, of the following organs:
- Research Office
- Financial Brokerage Division
- Financial and Structuring Division
- Project Finance Division
- Structured Finance Division
- Spain Branch
- Corporate Debt Finance Division
- Equity Capital Market Division
- Corporate Finance Advisory Division
- Syndication and Sales Desk
- Strategic Planning and Organisation Division
- Caixa Capital
Credit Committee
CaixaBI’s Credit Committee is responsible for the competencies delegated to it in credit matters, namely:
To authorise medium and long term operations;

Annual Report – 2011
223
To periodically define limits on short term operations;
To analyse non-performing loans, particularly at their pre-legal and legal proceedings stages when
involving a loss of interest or reduction of assets;
To discuss the specific situation of sectors of the economy;
To define credit and respective credit risk policies;
To define the processes to be submitted to the Extended Credit Committee of CGD (customers or
borrowers who belong to groups of customers with accumulated liabilities of more than €50 million to
CGD and other CGD Group companies) and to the Credit Committee of CGD (customers with
accumulated liabilities of more than €10 million and less than €50 million to CGD and other CGD Group
companies).
The Credit Committee meets every week but may be called on an extraordinary basis, if required.
Composition of the Credit Committee
Members of the Executive Board
Directors, or their deputies, of the following organs:
- Financial and Structuring Division
- Project Finance Division
- Structured Finance Division
- Spain Branch
- Corporate Debt Finance Division
- Equity Capital Market Division
- Corporate Finance Advisory Division
- Strategic Planning and Organisation Division
- Legal Affairs Office
Directors of the Bank’s other organs may be called upon to participate on the Committee
Investments Committee
CaixaBI’s Investments Committee meets every week and has the following main functions:
To monitor the evolution of the Bank’s own portfolio as well as its funding requirements;
To monitor the evolution of the results of the Financial and Structuring Division, in addition to the risk
indicators supplied;
To monitor the evolution and prospects of the relevant financial markets for CaixaBI’s activity;
To issue guidelines on the strategic positioning and risk taking and management in light of the market
environment.
Composition of the Investments Committee
Members of the Executive Board
Management of the Financial and Structuring Division
Directors, or their deputies, of the following organs:
- Corporate Debt Finance Division
- Syndication and Sales Desk

Annual Report – 2011
224
- Strategic Planning and Organisation Division
- Other divisions operating in the capital markets and which interact with the Financial and Structuring Division in such a
capacity
Operational Risk And Internal Control Management Committee
The Operational Risk and Internal Control Management Committee is an Executive Board advisory body,
responsible for the coordination, appraisal and discussion of issues related with operational risk and internal
control management which meets every six months.
The Operational Risk and Internal Control Management Committee is the body responsible for verifying the
conformity of the Bank’s performance with the strategy and policies established for the management of
operational risk and internal control, monitoring the management thereof and proposing action plans to the
executive committee. It is responsible for:
Proposing operational risk management policies;
Proposing the operational risk profile to be adopted by the Bank;
Verifying conformity between the Bank’s operation and operational risk management policies;
Verifying the adequacy of the internal control system;
Monitoring the level of the Bank’s operational risk;
Proposing action plans to the executive committee for reducing operational risk and strengthening the
internal control system.
Composition of the Operational Risk and Internal Control Management Committee
Members of the Executive Committee
Directors, or their deputies, of the following organs:
- Information Systems Division
- Accounting Division
- Strategic Planning and Organisation Division
- Compliance Office
- Internal Audit Office
Directors of the Bank’s other organs may be called upon to participate on the Committee
Steering Committee for the Business Continuity Plan
The Steering Committee for the Business Continuity Plan is responsible for the coordination and
implementation of policies and procedures to guarantee CaixaBI’s continuous operation or prompt recovery,
on the occurrence of events leading to an across-the-board failure of its physical infrastructures or the
impossibility of its employees of occupying their workplaces.
The Steering Committee for the Business Continuity Plan defines and monitors the procedures to be
followed or activated in response to crisis situations of a greater or lesser degree of severity which may affect
operational and technological components and therefore avoiding the prolonged stoppage of CaixaBI’s
activity and accordingly helping to reduce the impacts of crisis events on its activity and customers.

Annual Report – 2011
225
Composition of the Steering Committee for the Business Continuity Plans
Members of executive committee
Directors, or their deputies, of the following organs:
- Compliance Office
- Information Systems Division
- Operational Division
- Strategic Planning and Organisation Division
Directors of other Bank organs may be called to participate on the Committee.
Remunerations Committee
The Remunerations Committee is made up of representatives of the majority shareholder, elected by the
shareholders’ meeting and is statutorily responsible for defining the remuneration of the members of the
statutory bodies for periods of three years.
Composition of the Remuneration Committee
Gerbanca, SGPS, S.A., represented by Henrique Pereira Melo and Vitor José Lilaia da Silva

Annual Report – 2011
226
6 Remuneration of members of statutory bodies
Remuneration policy for members of statutory and inspection bodies
As stipulated in article 23 of CaixaBI’s articles of association, the Remuneration Committee defines the
remuneration of the Board of Directors and inspection bodies.
In the case of the Board of Directors, remuneration is only paid to the Executive Committee.
For further details on the remuneration of statutory bodies please consult the chapter on compliance with
legal obligations in this report on corporate governance.

Annual Report – 2011
227
7 Control system
7.1 Internal control system
In compliance with the dispositions of the Bank of Portugal’s Official Notice 5/2008 in addition to CMVM
Regulation 3/2008, CaixaBI has implemented an internal control system to fulfil the principles and meet the
requirements established in the referred to regulations.
The Bank’s risk control and management, aligned with the strategies and polices defined by CGD Group, are
based on a risk culture present over the whole of its structure which guarantees the identification, analysis
and management of the Bank’s exposure to different risk categories.
In addition to specific regulations whose application is accompanied by the supervisors with the objective of
guaranteeing the strength of the financial system and protection of customers’ interests, best practice in risk
management terms has also been implemented within CaixaBI and contributes to maximising sustained
value creation and the maintenance of the Bank’s solidity.
CaixaBI’s internal control system comprises a collection of strategies, systems, processes, policies and
procedures, defined by the board of directors, in addition to the actions taken by the board and its other
employees, for the purpose of ensuring:
The efficient and profitable performance of activity, over the medium and long term (performance
objectives);
The existence of full, pertinent, reliable, prompt financial and management information (information
objectives);
Compliance with applicable legal and regulatory dispositions (compliance objectives).
CaixaBI also produces an annual internal control report which is submitted for the appraisal of its supervisors
– Bank of Portugal and CMVM.
In order to achieve effective compliance with its defined objectives and to guarantee the quality and
effectiveness of the system over time, CGD Group endeavours to guarantee an adequate control
environment, a solid risk management system, an efficient information and communication system, adequate
control activities and an effective monitoring process.

Annual Report – 2011
228
Risk management process
The risk management process comprises a series of activities performed on a CGD Group level, as set out in
the following six stages.
Risk management process
Risk management process stages
Activity Scope
Definition and adjustment of guidelines, models and processes
Definition/approval by areas, type of risk or portfolios of (i) guidelines, (ii) models and
indicators for risk assessments and (iii) risk management support processes and a
regular assessment thereof for the purpose of the continuous and necessary adaptation
to the economic environment/market conditions, evolution of risk assessment
measures, strategy defined by CGD Group and evolution in terms of internal structure
and information systems.
Identification of risk positions Recognition, characterisation and assessment of portfolio positions or potential
operations (credit, market and liquidity risks).
Identification and characterisation of the processes implemented and occurrence of
losses (operational, compliance and reputational risks).
Assessment of risks and performance
Quantification of exposure to diverse types of risk and performance measurement using
appropriate internal models (per operation, portfolio, process or entity), developed and
implemented on a CGD Group level.
Identificationof risks
Decision
Monitoringcontrol of risks
andperformance
Riskassessment
Taking / Adjusting risk
Definition and adjustment of guidelines, models and processes1
2
3
4
5
6

Annual Report – 2011
229
Activity Scope
Monitoring and control of risks and performance
Decision-making support activities for risk-taking purposes (monitoring of
risks/performance) or adjustment of portfolio risks (risk control), through the
ascertaining or reporting of risk positions, risk and performance levels and verification of
compliance with guidelines.
Decision Interpretation of results from the monitoring and control of risks and performance stage,
expectations of evolution of external variables and decision on the performance of risk-
taking or adjustment actions (reduction of exposure or cover).
Risk taking/adjustments Negotiation and entering into of operations in accordance with previously made
decisions (decision stage) under the scope of business/support processes or for risk
adequacy/cover purposes.
Parties involved in risk management
To ensure the adequate management of the internal control system, responsibilities have been defined for
certain structural bodies which operate in conjunction with the remaining CGD Group structures and entities.
Risk management parties
Scope Involved organs
Definition and adjustment of risk management strategy and policies
Board of Directors and Executive Committee of CaixaBI.
Assets and Liabilities Management Committee (“ALCO”) of CGD Group.
Management of credit risk All CaixaBI structural bodies making loans.
Risk Management Division (DGR) of CGD.
CaixaBI’s Credit Committee, CGD’s Credit Committee and Expanded Credit Committee.
CaixaBI’s Executive Committee.
Management of market risk CaixaBI’s Financial and Structuring Division.
CGD’s Risk Management Division (DGR).
CaixaBI’s Investment Committee.
Management of liquidity risk CaixaBI’s Financial and Structuring Division.
All other CaixaBI structural bodies.
CaixaBI’s Investment Committee.
Management of operational risk
CaixaBI’s Operational Risk Management and Internal Risk Control Committee.
CaixaBI’s Strategic Planning and Organisation Division.
CaixaBI’s Accounting Division.
CaixaBI’s Internal Audit Office.
CaixaBI’s structural bodies of its Spain branch and Caixa Capital.

Annual Report – 2011
230
Scope Involved organs
Management of compliance and reputational risk
CaixaBI’s Compliance Office.
All other CaixaBI structural bodies.
7.2 Control system on the protection of the company’s investments and its
assets
Securities portfolio
The management of CaixaBI’s securities portfolio is subordinated to the risk levels defined for the Bank
adjusted to the budget approved by the board of directors. Several basic objectives have also been defined,
namely:
achieving an adequate level of net interest income for the balance sheet of an investment bank;
establishing a securities portfolio permitting a normal degree of rotation and adequate return in terms of
capital gains;
the investment portfolio’s composition shall be limited to maximum and minimum exposure levels;
safeguarding of a minimum liquidity level required of a financial institution.
The return required from the portfolio comprises a defined ROE level obtained on the daily valuation thereof
at market prices, net of financing costs.
In calculating the allocation of shareholders’ equity to operations, the necessary requirements for hedging
credit, market and operational risks are considered in accordance with current Bank of Portugal rules.
Tradable instruments include bonds, shares, selected asset managers’ funds and their derivatives - futures,
options swaps and forwards traded with the treasury or forex positions in CGD’s trading room.
Credit portfolio
The production of commercial proposals for the Credit Committee (see page 222) is the responsibility of the
structural bodies which submit them for appraisal and which should obtain, in advance, when applicable, the
risk opinion of CGD’s Risk Management Division. According to CaixaBI’s internal regulations, certain
proposals should be subsequently submitted for the approval of CGD’s credit committees.
7.3 Control system for safeguarding customers’ assets held under CaixaBI’s
custodian services
In compliance with the CVM dispositions of no. 4 of article 304-C, the external auditors should issue an
annual report on the adequacy of the procedures and measures adopted by CaixaBI to safeguard its
customers’ assets.

Annual Report – 2011
231
These procedures should ensure the following objectives are met (articles 306 to 306-D of the CVM):
In all acts performed as well as in its accounting and operational records, financial intermediaries
should ensure a clear distinction between their own and each of their customer’s assets.
The opening of insolvency proceedings, corporate recoveries or restructuring of the financial
intermediary does not affect the acts performed by the financial intermediary on behalf of its customers.
A financial intermediary may not, on its interest or on a third party’s behalf, use its customers’ financial
assets or exercise any of the rights thereto pertaining unless approved in writing by their titleholders.
Investment companies may not use moneys received from customers either on their own or on a third
party’s behalf.
The latest opinion of the external auditors available hitherto, for 2010, make it possible to conclude that the
procedures and measures adopted by CaixaBI are adequate to permit compliance, in all materially relevant
aspects, with the dispositions defined under the scope of articles 306 to 306-D, of the CVM.

Annual Report – 2011
232
8 Disclosure of relevant information
8.1 Market relations representative
Ália Pereira da Silva
Rua Barata Salgueiro, 33
1269-057 Lisbon
Telephone: +351 21 313 73 00
Fax: +351 21 352 63 27
Email: [email protected]
8.2 Disclosure of relevant information
CaixaBI provides a large amount of information on its website at www.caixabi.pt.
Based on its website the Bank provides its customers, analysts and general public with permanent access to
relevant, up-to-date information such as the presentation and identification of the Bank, mission, vision and
strategy, history, organisation, relationships, rating, annual report, news, prices, business areas, corporate
governance, sustainability and distinctions.
In addition to the possibility of consulting information on the Bank and its respective activity, the Bank’s
research area provides access to historical and current information of relevance to investors.
8.3 Diagramme of CaixaBI investments
The Bank’s corporate structure comprises adequate investments to provide for its business segmentation
while enabling it to leverage CGD Group’s market intervention capacity, through its constant provision of
quality, value added services to its predominantly large and medium sized corporate customers.
Information on CaixaBI’s equity investments is set out in the following organogram:
100% of CaixaBI Brasil – Serviços de Assessoria Financeira, Ltda.6, headquartered in São Paulo, with
the corporate object of providing advisory and financial consultancy services;
100% of Caixa Capital, SCR, S.A. (“Caixa Capital”), a company managing five venture capital funds;
100% of Caixa Desenvolvimento, SGPS, S.A. (“Caixa Desenvolvimento”), whose activity has been
curtailed following the restructuring of the portfolio of venture capital area subsidiaries; and
91% of FIQ Energias Renováveis, a fund managed by Caixa Capital which has been consolidated with
CaixaBI.
6
Of which 90% is held directly by CaixaBI and 10% indirectly by Caixa Desenvolvimento.
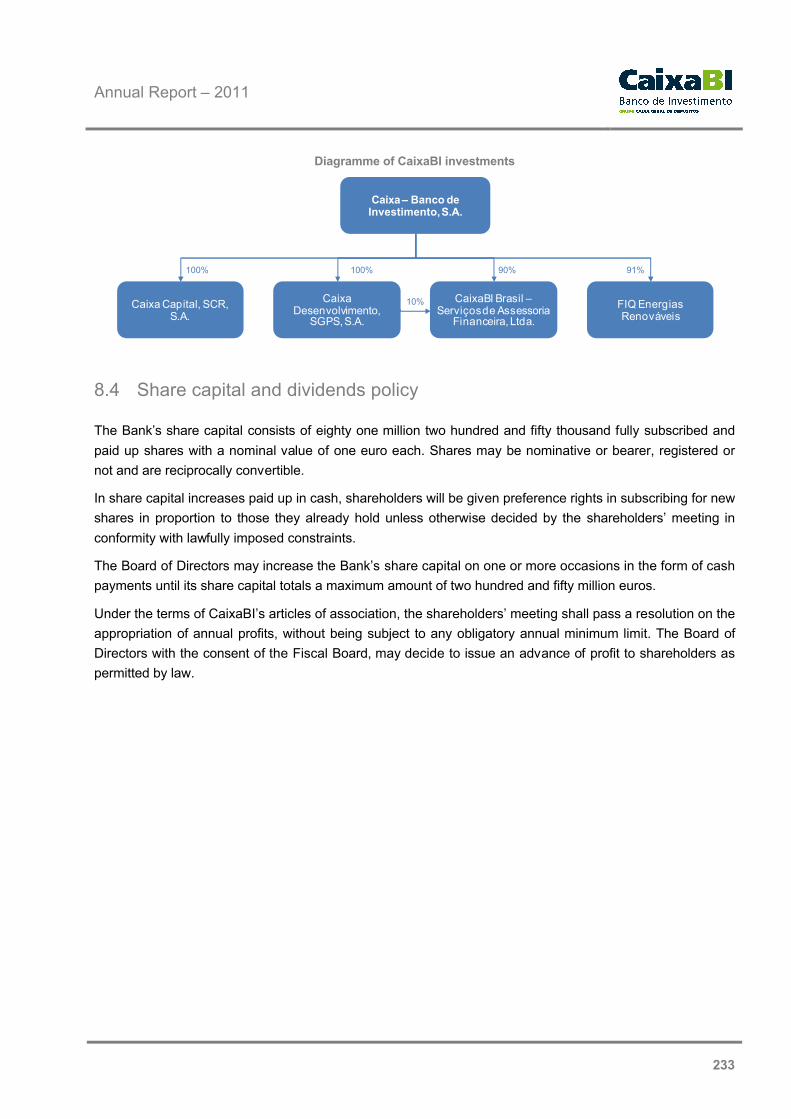
Annual Report – 2011
233
Diagramme of CaixaBI investments
8.4 Share capital and dividends policy
The Bank’s share capital consists of eighty one million two hundred and fifty thousand fully subscribed and
paid up shares with a nominal value of one euro each. Shares may be nominative or bearer, registered or
not and are reciprocally convertible.
In share capital increases paid up in cash, shareholders will be given preference rights in subscribing for new
shares in proportion to those they already hold unless otherwise decided by the shareholders’ meeting in
conformity with lawfully imposed constraints.
The Board of Directors may increase the Bank’s share capital on one or more occasions in the form of cash
payments until its share capital totals a maximum amount of two hundred and fifty million euros.
Under the terms of CaixaBI’s articles of association, the shareholders’ meeting shall pass a resolution on the
appropriation of annual profits, without being subject to any obligatory annual minimum limit. The Board of
Directors with the consent of the Fiscal Board, may decide to issue an advance of profit to shareholders as
permitted by law.
Caixa – Banco de Investimento, S.A.
Caixa Desenvolvimento,
SGPS, S.A.
Caixa Capital, SCR, S.A.
FIQ Energias Renováveis
CaixaBI Brasil –Serviços de Assessoria
Financeira, Ltda.
100% 100% 90% 91%
10%

Annual Report – 2011
234
9 Analysis of economic, social and environmental sustainability
CaixaBI has, since 2004, published an annual sustainability report in the economic, social and environmental
domains as an integral part of its annual report. Over the course of the years society as a whole and the
Bank with it have evolved to thresholds of growing awareness of the importance of social responsibility and
inclusion of sustainable development.
As a member of the largest Portuguese financial group, CaixaBI has always aligned with CGD Group’s
sustainability practice. This has allowed the Bank to intervene with its stakeholders, with a dimension and
effectiveness which it would otherwise have been unable to achieve.
Recognised as a leading, benchmark institution in domestic investment banking terms, CaixaBI has
assumed enhanced responsibilities in the domains of sustainability and social responsibility, practising the
following principles which are transversal to its activity:
An involvement based on ethical business values;
A desire to achieve continuous progress;
Understanding and acceptance of the company’s interdependence with its environmental surrounds;
Long term vision based on responsibilities to future generations;
Principle of prudence as a decision-making rule;
Regular dialogue and consultation with all parties involved;
A desire to inform linked with transparency;
Acceptance of responsibility for the direct and indirect consequences of its activity.
In 2011, the Bank furthered its activity based on the same sustainability strategy, i.e. emphasising business
guidelines based on sustainable development and, simultaneously, contributing to business evolution and
greater competitiveness.
CaixaBI recognises that the value of the sustainable development of its activity is enhanced by the relations
of transparency and trust it has formed with its stakeholders:
Shareholders;
Customers;
Partners;
Suppliers ;
Workers;
Financial markets;
Competitors;
Regulators;

Annual Report – 2011
235
Public opinion;
Community.
CaixaBI favours continuous dialogue and effective involvement with its strategic stakeholders based on
various relationship channels, in line with currently available technological solutions and the social and
economic environment in which the Bank operates.
CaixaBI’s relationship with its stakeholders
Stakeholders Forms of relationship Frequency
Shareholders Shareholders’ meeting
Financial reporting
Annual
Quarterly
Customers CaixaBI website
Complaints management
Advertising
Financial newsletter
Research reports
Internet banking services
Permanent
Permanent
Occasional
Daily
Daily
Daily
Partners CaixaBI website
Events and sponsorships
Permanent
Occasional
Suppliers Meetings and periodical contacts Occasional
Workers Intranet
Training actions
Performance assessments
Internal communication
Permanent
Occasional
Annual
Occasional
Financial markets Research reports
CaixaBI website
Financial newsletter
Daily
Daily
Daily
Competitors Events and sponsorships Occasional
Regulators Regulators’ specific instructions
Requests for clarification
Participation in workgroups
Personal supervisory actions
Public tenders
Production of reports
Permanent
Permanent
Permanent
Permanent
Permanent
Permanent
Public opinion Interviews
Events and sponsorships
Requests for clarification
Research reports
Occasional
Occasional
Occasional
Daily
Community CGD Culturgest Foundation
Protocols with universities
Permanent
Annual
The involvement process with stakeholders should be considered as an evolutive, ongoing process and is
indicative of their impact on the Bank’s activity and the importance of CaixaBI’s activity to the said
stakeholders.

Annual Report – 2011
236
The involvement strategy of CaixaBI’s stakeholders is in line with CGD guidelines, essentially based on four
operating areas:
Identification of strategic stakeholders;
Assessment of material considerations;
Based on dialogue;
Inclusion of information obtained from stakeholders in business and sustainability management.
Involvement with stakeholders permits the identification, comprehension and alignment of their expectations
and concerns in respect of the Bank’s performance in addition to risk management and the identification of
opportunities resulting from the interaction between CGD Group and society.
CGD’s sustainability programme, consolidated in 2010, is based on four essential pillars guiding the Bank’s
activity:
Economic viability;
Financial viability;
Social fairness;
Environmental correctness.
With the formalising and implementation of its sustainability programme and respective model and
management, CGD has translated its desire to implement guideline processes and procedures on all of its
activity in this domain, designed to create value for the Bank.
The management model for CGD’s sustainability programme is based on the formalising of the
responsibilities of each CGD structural body and several CGD Group companies, such as CaixaBI, for the
correct furtherance of the adopted strategies, defined policies and recommendations.
The management model of CGD’s sustainability programme comprises the following structures, with CaixaBI
being represented in the ambassadors’ group and workgroups:
CGD’s Board of Directors
This body has the maximum responsibility for defining sustainability strategy in its approval of proposals and
the respective budgets submitted by the general sustainability committee and the granting of authority to the
structural bodies for implementing the respective actions.
General Sustainability Committee (CGSU)
A Board of Directors advisory body, responsible for the assessment, debate and monitoring of the
implementation of CGD’s sustainability strategy.
Coordination Team
A structure reporting to the communication and brand division, responsible for coordinating the sustainability
programme, proposing projects and actions with workgroups and CGSU and accompanying and controlling
the development of initiatives.

Annual Report – 2011
237
Ambassadors
Responsible for analysing and/or validating the proposals and recommendations generated by the
workgroups for proposal to the CGSU and performing a prospective analysis of opportunities, in the
sustainability sphere, in their intervention area.
Workgroups
Workgroups, in collaboration with the Coordination Team, perform functions designed to develop the
applicability of the defined objectives and approved projects/actions, guaranteeing the efficiency of the
procedures necessary for their furtherance. Workgroups meet every month or whenever the Coordination
Team considers necessary on the basis of the dynamics involved in the activity of each workgroup and in
agreement with the respective teams.
To guarantee the furtherance of this programme’s objectives CGD has defined a sustainability policy which
defines the five main strategic operating areas, always geared to value creation for the CGD Group and its
respective stakeholders:
Responsible banking: to develop balanced, transparent and responsible relationships with customers.
Future promotion: to recognise banking activity’s importance to sustainable development, in the
desire to contribute to a better future.
Environmental protection: to promote an active response to society’s environmental problems.
Involvement with the community: to promote investment in the community and develop society in
general.
Human assets management: to endeavour to develop workers and their respective recognition as
factors of differentiation.
In addition to its sustainability policy, CGD has implemented other guideline policies such as its
environmental policy and community development policy for its activity to promote the integration of
sustainability management.
As an integral and operative part of CGD Group, CaixaBI follows the policies and principles set out in CGD’s
sustainability report, produced to comply with the guidelines corresponding to the maximum level (A+) for the
Global Reporting Initiative as a fundamental tool to guarantee the effective management of the Bank’s
economic, social and environmental activity.
9.1 Economic considerations
The economic dimension of sustainability is measured by organisations’ impacts on the economic conditions
of its stakeholders and on the economic system at all levels, complying with a long term vision to embrace
the disciplines of the environment, social aspects and human resources.
This interdisciplinary nature of economic performance embraces all aspects of economic interactions which
may exist between an organisation and its stakeholders, including the income traditionally recognised in
financial balance sheets. Such financial balance sheets make priority reference to indicators related with a
company’s profitability because they are geared to providing information to managers and shareholders.

Annual Report – 2011
238
Sustainable development indicators, however, cater for other priorities and should permit the implications of
corporate activity in terms of the well-being of its stakeholders to be perceived.
CaixaBI accordingly prepares its activity plans and endeavours to execute them in line with a sustainable
development strategy, reconciling profit ratios required by shareholders, with the need to energise the
business environment comprising customers, therefore impacting the positive effects of its economic and
financial health on the community.
The Bank therefore endeavours to achieve new economic efficiency contexts in its awareness of the fact that
its mission also involves sustained value creation for its stakeholders, comprising the supply of top quality
financial products and services supported by its membership of the largest Portuguese financial group - CGD
Group.
Subject to such behavioural parameters, CaixaBI has succeeded in recognising and exceeding its
customers’ expectations, improving performance levels to a higher quality threshold, acting as a benchmark
market operator based on ethical standards and responsibility, consolidating customers’ trust in CaixaBI.
9.2 Environmental considerations
Although the financial sector is not an area of activity which entails the greatest environmental risks, its
possible intervention role must not be underestimated, in terms of internal operations - power consumption,
water, paper, consumables, fuel, recycling, materials re-use, waste reduction, supplier selection, are, inter
alia, several of the principal direct environmental impacts to be safeguarded.
In addition to such direct intervention, the financial sector’s role, however, is fundamental as from the time
when developers’ projects with an environmental impact apply for advisory services and/or funding.
In this context, CaixaBI’s activity, as an entity supplying credit to companies and investors in the financial
market has an indirect environmental impact.
The introduction of environmental criteria and assessment of environmental risks in terms of project analyses
and companies eligible for support, represent a fundamental contribution to environmental protection.
Securing and structuring operations comprise opportunities for the Bank to express its concerns over the
assessment of the environmental impact of the activity of its corporate customers and include the analysis of
environmental effects on corporate assessments and funding costs.
CaixaBI has made important investments in projects in the environmental area, namely wind farms,
hydroelectric power plants and other renewable energy sources, waste processing and basic sanitation,
which projects have an enormous environmental impact, involving complexity at all levels, including
approvals and environmental monitoring.
9.3 Social considerations
Social considerations are assessed by the analysis of an organisation’s impact on its stakeholders -
employees, suppliers, customers, community, government and society in general - locally, nationally and
globally.

Annual Report – 2011
239
A socially responsible company, therefore, encourages the personal development of its employees through
training and regularly monitoring their health. CaixaBI considers that it has immediate responsibility for
providing its employees with a healthy working environment – providing them with a medical plan to include
their direct family members (spouses and children) and monitoring the health of its employees in the
workplace, arranging for respective annual check-ups – and their professional career development in
approving a multiplicity of training actions, ranging from attendance at seminars to postgraduate courses and
MBAs. The Bank also provides its employees with a complementary retirement plan.
In terms of social considerations, CaixaBI publishes its corporate governance report, adopting a totally
transparent attitude in its relations with all stakeholders. The Bank has published internal regulations
designed to ensure the high ethical standards of its employees, in addition to preventative and inspection
procedures. It has a Compliance Office to verify compliance with standards and regulations in force and a
code of conduct, binding upon all employees, for fraud prevention purposes. CaixaBI has also published an
anti-money laundering handbook providing for collaboration with its supervisors.
As a CGD group member, the Bank is also directly and indirectly involved in diverse sponsorships,
particularly involving the organisation of artistic events in the Culturgest auditorium and helping to promote
national cultural heritage as a basis for providing continuity to a diverse cultural heritage as an important
catalysing force in consolidating a community identity.
On account of their dimension and the importance of their contribution to economic, social and
environmentally sustainable development, reference should be made to the following operations in which
CaixaBI was privileged to participate in 2011:
Indáqua Santo Tirso: refinancing of the water and sewage concession in the municipalities of Santo
Tirso and Trofa, in the sphere of restoring the concession’s economic-financial balance. All of the
original funding was supplied by CGD.
Embraport: construction of a port terminal which, at a first stage will be capable of handling 1.2 million
TEU and will have the capacity to handle bulk liquids, improving the capacity of the Port of Santos
(Brazil) to receive new generation deep keel cargo vessels. The project’s promoters are Odebrecht
Transport, Dubai Port World and Coimex. The project was financed by an A/B Loan from the Inter-
American Development and a Caixa Económica Federal loan in which CGD operated as the MLA for
the IDB A/B loan.

Annual Report – 2011
240
II Compliance with legal guidelines
Compliance with legal guidelines on management objectives
CaixaBI’s shareholders did not establish guidelines or management objectives for 2011 as provided for in
article 11 of Decree Law 300/2007 of 23 August.
Compliance with legal guidelines on special information disclosures
Special information disclosure duties, namely reporting to the Directorate General of the Treasury and
Finance or the Inspectorate General of Finance, are performed on a consolidated basis by Caixa Geral de
Depósitos, S.A., as the group’s parent company.
Compliance with legal guidelines on income obtained from the scope of compliance with
shareholders’ recommendations
The shareholders did not issue any additional recommendations at the time of the approval of the 2010
accounts.
Compliance with legal guidelines on remunerations
Remunerations of statutory bodies
CaixaBI complied with the legal regulations namely the dispositions of article 29 of Law 55-A/2010 of 31
December, not having paid any management bonuses in 2011 to board members.
CaixaBI fully complied with the provisions of article 12 of Law 12-A/2010 of 30 June, having reduced the
gross monthly remunerations of all members of CaixaBI’s executive committee by 5%.
Reference should, herein, be made to the fact that, since January 2011, CaixaBI also levied a reduction of
10% on the monthly gross remunerations of the executive committee, in compliance with sub-paragraph c) of
no. 1 and sub-paragraph q) of no. 9 of article 19 of Law 55-A/2010 of 31 December.

Annual Report – 2011
241
Information on the remunerations of members of CaixaBI’s Executive Committee for 2011
Chairman Executive director Executive director
(amounts in euros) Jorge Cardoso Gonçalo Botelho Francisco Rangel
For period01/01/2011 to 31/12/2011
01/01/2011 to 31/12/2011
26/09/2011 to 31/12/2011
1. Remuneration
1.1. Base annual/fixed remuneration 218,426 206,388 50,573
1.2. Reduction deriving from Law 12-A/2010 10,770 10,319 2,529
1.3. Reduction deriving from Law 55-A/2010 20,462 19,607 4,804
1.4. Effective annual remuneration (1.1.-1.2.-1.3.) 187,195 176,462 43,240
1.5. Attendance vouchers
1.6. Accumulation of management functions
1.7. Variable remuneration
1.8. Exemption from overtime (this account heading is
included in 1.1)22,144 28,150 4,952
1.9. Other (full details)
2. Other benefits and compensation
2.1. Annual limit on mobile communications - - -
2.2. Expenditure on mobile communications 5,811 12,699 68
2.3. Meal allowances 2,120 1,587 699
2.5. Other (1)
3,019 13,296 168
3. Costs of social benefits
3.1. Social protection regime 44,459 42,952 9,474
3.2. Healthcare insurance No individual insurance
3.3. Life insurance No individual insurance
3.4. Personal accidents insurance No individual insurance
3.5. Other (2)
6,552 6,176 1,384
4. Vehicle fleet
4.1. Brand Audi Audi Mercedes
4.2. Model A6 A6 E250
4.3. Type of use (acquisition/LTL/renting/leasing) Renting Renting Renting
4.4. Start year 2009 2009 2009
4.5. End year 2012 2012 2012
4.6. Amount of instalment / annual payment for
company car17,884 17,161 4,407
4.7. Vehicle fuel costs 2,769 2,919 399
4.8. Annual fuel allowance - - -
4.9. Other
5. Additional information
5.1. Option of wages paid by former job (y/n) n n n
5.2. Annual gross remuneration paid by former job
5.3. Social protection regime
5.3.1 Social security (y/n) y y y
5.3.2 Other (specify)
5.4. Performance of paid functions outside group (y/n) n n n
5.5. Other
(1)Allowances
(2) Complementary retirement plans

Annual Report – 2011
242
Former chairman Former executive director
Former executive director
(amounts in euros) Luís Laranjo António Martins Sérgio Monteiro
For period01/01/2011 to 20/05/2011
01/01/2011 to 31/01/2011
20/05/2011 to 27/06/2011
1. Remuneration
1.1. Base annual/fixed remuneration 122,126 14,742 21,364
1.2. Reduction deriving from Law 12-A/2010 4,601 737 295
1.3. Reduction deriving from Law 55-A/2010 8,744 1,401 560
1.4. Effective annual remuneration (1.1.-1.2.-1.3.) 108,781 12,604 20,510
1.5. Attendance vouchers
1.6. Accumulation of management functions
1.7. Variable remuneration
1.8. Exemption from overtime (this account heading is
included in 1.1)- - 2,170
1.9. Other (full details)
2. Other benefits and compensation
2.1. Annual limit on mobile communications - - -
2.2. Expenditure on mobile communications 349 113 719
2.3. Meal allowances 710 233 444
2.5. Other
3. Costs of social benefits
3.1. Social protection regime 6,649 1,128 4,871
3.2. Healthcare insurance No individual insurance
3.3. Life insurance No individual insurance
3.4. Personal accidents insurance No individual insurance
3.5. Other 0 2,793 718
4. Vehicle fleet
4.1. Brand Jaguar Mercedes BMW
4.2. Model XF E250 320D
4.3. Type of use (acquisition/LTL/renting/leasing) Renting Renting Renting
4.4. Start year 2008 2009 2008
4.5. End year Returned in 2011 2012 Returned in 2011
4.6. Amount of instalment / annual payment for
company car7,467 1,469 2,071
4.7. Vehicle fuel costs 1,868 347 133
4.8. Annual fuel allowance - - -
4.9. Other
5. Additional information
5.1. Option of wages paid by former job (y/n) n n n
5.2. Annual gross remuneration paid by former job
5.3. Social protection regime
5.3.1 Social security (y/n) y n y
5.3.2 Other (specify) CGA / Pension Fund
5.4. Performance of paid functions outside group (y/n) n n n
5.5. Other

Annual Report – 2011
243
Information on the remuneration of the members of CaixaBI’s fiscal board for 2011
Chairman Member Member Chairman Member Member
(amounts in euros)Hernani Loureiro
António Ribeiro
João Martins
Eduardo Ferreira
Pedro Felício
Maria Rosa Sá
For period 201020-05-2011
a 21-07-2011
20-05-2011 a
31-12-2011
20-05-2011 a
31-12-2011
Fixed annual remuneration 29.472 27.072 27.072 4.744 14.972 14.972
Reduction deriving from Law 55-A/2010
n.a n.a n.a 166 850 1.497
Effective annual remuneration 29.472 27.072 27.072 4.578 14.122 13.475
Remuneration of statutory auditor
Deloitte & Associados, SROC, represented by João Carlos Henriques Gomes Ferreira
(in euros – exclusive of VAT) 2010 2011
Audit and revision of accounts 83,862 69,883
Other reliability guarantee services 36,845 36,845
Fiscal consultancy 138,895 115,920
Other services 51,400 33,500
The reduction of remuneration under the terms of article 22 of Law 55-A/2010 was complied with.
Remunerations of other workers
Following the entry into force of Law 55-A/2010 of 31 December (State Budget Law for 2011) CGD Group, of
which CaixaBI is a member, applied the appropriate deductions to remuneration, adapted as justified by its
corporate nature and duly authorised by the Secretary of State for the Treasury and Finance. The amount of
the reduction is set out in the summary table relative to compliance with the legal obligations, set out at the
end of this chapter.
Compliance with legal guidelines on the level of public contracting
The Public Contracts Code approved by Decree Law 18/2008 of 29 January, does not apply to CaixaBI.
However, CaixaBI uses the services of Sogrupo – Compras e Serviços Partilhados, Agrupamento
Complementar de Empresas whose mission is to provide services related with human resources
management, negotiation and management of goods and services, based on a CGD Group shared services
unit approach, centralising its activities and common processes, endeavouring, on the basis of economies of
scale and knowledge, to reduce costs, maximise productivity and improve the quality of the service provided.

Annual Report – 2011
244
Compliance with legal guidelines on the level of membership of the National Public
Procurement System
CaixaBI, as in the case of Caixa Geral de Depósitos, S.A., although not a National Public Procurement
System (SNCP) subscriber, has developed the rationalisation of procurement policies for goods and
services, through the use of Sogrupo – Compras e Serviços Partilhados, Agrupamento Complementar de
Empresas, whose activity is subject to a collection of internal and external regulations in line with SNCP
procedures.
Compliance with the costs reduction plan
CaixaBI’s majority shareholder (Gerbanca, SGPS, S.A.) has defined a cost reduction plan for CaixaBI on its
activity in Portugal, to be achieved in 2011, affecting employee costs, its wage bill and administrative
expenditure.
Employee costs were effectively down by 11% in 2011 against 2010. The savings correspond to 130% of the
established objective.
There was an effective reduction of 15% in the wage bill over 2010, corresponding to 189% of the
established savings objective.
General administrative expenditure, was effectively reduced by 23% over 2009, corresponding to 171% of
the established savings objective.

Annual Report – 2011
245
Summary table of compliance with legal obligations
Compliance with legal guidelinesCompliance
Quantification JustificationY N N.A.
Management objectives x Not applicable
Special disclosure requirements x Not applicable
Shareholder’s recommendations for the approval of accounts x Not applicable
Remunerations:
Non payment of management bonuses x
Statutory bodies - reduction of remuneration under article 19 of Law 55-A/2010
x €55,578
Statutory bodies - reduction of 5% through application of article 12 of Law No.12-A/2010
x €29,251
External auditor - reduction of remuneration under article 22 of Law 55-A/2010
x €13,979
Other workers - reduction of remuneration under article 19 of Law 55-A/2010
x €155,781 (a)
Public contracts x Not applicable
Cost reduction plan
Employee costs x 130% (b)
External supplies and services x 171% (b)
(a) Following the entry into force of Law 55-A/2010 of 31 December (State Budget Law for 2011) CGD Group, of which CaixaBI is a
member, applied the appropriate deductions, adapted as justified by its corporate nature which were duly authorised by the
Secretary of State for the Treasury and Finance.
(b) See item on compliance with the costs reduction plan on the preceding page.