CAE INC - Barchart.com
181
CAE INC FORM 40-F (Annual Report (foreign private issuer)) Filed 06/27/14 for the Period Ending 03/31/14 Telephone 514-341-6780 CIK 0001173382 Symbol CAE SIC Code 3690 - Miscellaneous Electrical Machinery, Equipment and Supplies Industry Business Support Services Sector Industrials Fiscal Year 03/31 http://www.edgar-online.com © Copyright 2022, EDGAR Online, a division of Donnelley Financial Solutions. All Rights Reserved. Distribution and use of this document restricted under EDGAR Online, a division of Donnelley Financial Solutions, Terms of Use.
-
Upload
khangminh22 -
Category
Documents
-
view
0 -
download
0
Transcript of CAE INC - Barchart.com

CAE INC
FORM 40-F(Annual Report (foreign private issuer))
Filed 06/27/14 for the Period Ending 03/31/14
Telephone 514-341-6780
CIK 0001173382Symbol CAE
SIC Code 3690 - Miscellaneous Electrical Machinery, Equipment and SuppliesIndustry Business Support Services
Sector IndustrialsFiscal Year 03/31
http://www.edgar-online.com© Copyright 2022, EDGAR Online, a division of Donnelley Financial Solutions. All Rights Reserved.
Distribution and use of this document restricted under EDGAR Online, a division of Donnelley Financial Solutions, Terms of Use.

UNITED STATES SECURITIES AND EXCHANGE COMMISSION
Washington, D.C. 20549
FORM 40-F (Check One) � Registration statement pursuant to Section 12 of the Securities Exchange Act of 1934
or � Annual report pursuant to Section 13(a) or 15(d) of the Securities Exchange Act of 1934
For fiscal year ended: March 31, 2014 Commission File number: 1-31402
CAE INC. (Exact name of Registrant as specified in its charter)
Canada (Province or Other Jurisdiction of Incorporation or Organization)
3699
(Primary Standard Industrial Classification Code Number, if applicable)
Not Applicable (I.R.S. Employer Identification Number, if applicable)
8585 Côte-de-Liesse, Saint-Laurent, Québec, H4T 1G6
514-341-6780 ( Address and Telephone Number of Registrant’s principal executive office)
CT Corporation System, 111 Eighth Avenue, 13 th Floor, New York, NY 10011 (212) 894-8700
( Name, Address and Telephone Number of Agent for Service in the United States)
Securities registered or to be registered pursuant to Section 12(b) of the Act:
Title of Each Class Name of Each Exchange On Which Registered
Common Shares, New York Stock Exchange including associated Common Share purchase rights pursuant to the Registrant’s Shareholder Rights Plan, which purchase rights will trade together with the Common Shares
Securities registered or to be registered pursuant to Section 12(g) of the Act: none
Securities for which there is a reporting obligation pursuant to Section 15(d) of the Act: none
For annual reports, indicate by check mark the information filed with this form: � Annual Information Form � Audited Annual Financial Statements
Indicate the number of outstanding shares of each of the issuer’s classes of capital or common stock as of the close of the period covered by the annual report: 263,771,443 common shares
Indicate by check mark whether the registrant: (1) has filed all reports required to be filed by Section 13 or 15(d) of the Exchange Act during the proceeding 12 months (or for such shorter period that the registrant was required to file such reports); and (2) has been subject to such filing requirements in the past 90 days. Yes � No �

Indicate by check mark whether the registrant has submitted electronically and posted on its corporate Web site, if any, every Interactive Data File required to be submitted and posted pursuant to Rule 405 of Regulation S-T (§232.405 of this chapter) during the preceding 12 months (or for such shorter period that the Registrant was required to submit and post such files). Yes � No �

DISCLOSURE CONTROLS AND PROCEDURES A. Evaluation of disclosure controls and procedures. Disclosure controls and procedures are designed to ensure that information required to be disclosed by CAE Inc. (“CAE”) in reports filed with securities regulatory agencies is recorded, processed, summarized and reported on a timely basis and is accumulated and communicated to CAE’s management, including our President and Chief Executive Officer and Chief Financial Officer, as appropriate, to allow timely decisions regarding disclosure. Under the supervision of the President and Chief Executive Officer and Chief Financial Officer, management evaluated the effectiveness of CAE’s disclosure controls and procedures, as defined in Rule 13a-15(e) and 15d-15(e) under the U.S. Securities Exchange Act of 1934, as amended (the “Exchange Act”), as of March 31, 2014, the end of the period covered by this Annual Report on Form 40-F. The President and Chief Executive Officer and the Chief Financial Officer concluded from the evaluation that the design and operation of CAE’s disclosure controls and procedures were effective as at March 31, 2014.
B. Management’s report on internal control over financial reporting. CAE’s management is responsible for establishing and maintaining adequate internal control over financial reporting, as such term is defined in Rules 13a-15(f) and 15d-15(f) under the Exchange Act.
CAE’s internal control over financial reporting includes those policies and procedures that: (1) pertain to the maintenance of records that, in reasonable detail, accurately and fairly reflect the transactions and dispositions of CAE’s assets; (2) provide reasonable assurance that transactions are recorded as necessary to permit preparation of financial statements in accordance with generally accepted accounting principles, and that CAE’s receipts and expenditures are being made only in accordance with authorizations of its management and directors; and (3) provide reasonable assurance regarding prevention or timely detection of unauthorized acquisition, use or disposition of CAE’s assets that could have a material effect on the financial statements.
Management evaluated the effectiveness of CAE’s internal controls over financial reporting as of March 31, 2014, based on the framework and criteria set forth in Internal Control – Integrated Framework (1992) issued by the Committee of Sponsoring Organizations of the Treadway Commission (COSO), and has concluded that CAE’s internal control over financial reporting is effective as of the end of the period covered by this Annual Report on Form 40-F.
C. Attestation report of the Independent Auditors. PricewaterhouseCoopers LLP, independent auditors who audited and reported on CAE’s financial statements included in this annual report, has issued an attestation report on the effectiveness of CAE’s internal control over financial reporting as of the end of the period covered by this Annual Report on Form 40-F. This attestation report is included in Exhibit 99.2 to this Annual Report on Form 40-F .
D. Changes in internal control over financial reporting. There were no changes to CAE’s internal control over financial reporting during the year ended March 31, 2014 that have materially affected, or are reasonably likely to materially affect, CAE’s internal control over financial reporting.

E. Limitations on the effectiveness of controls. A control system, no matter how well designed and operated, can provide only reasonable, not absolute, assurance with respect to the reliability of financial reporting and financial statement preparation. Accordingly, CAE’s management, including our President and Chief Executive Officer and our Chief Financial Officer, does not expect that CAE’s internal control over financial reporting will prevent or detect all errors and all fraud.
CAE will continue to periodically review its disclosure controls and procedures and internal control over financial reporting and may make modifications from time to time as considered necessary or desirable.
AUDIT COMMITTEE FINANCIAL EXPERT
CAE’s board of directors has determined that it has at least one audit committee financial expert serving on its audit committee. The board of directors has determined that Mr. Paul Gagné is an audit committee financial expert within the meaning of General Instruction B(8)(a) of Form 40-F and is independent as that term is defined by the New York Stock Exchange’s corporate governance standards applicable to CAE.
The Securities and Exchange Commission (the “Commission”) has indicated that the designation of a person as an audit committee financial expert does not impose on such person any duties, obligations or liability that are greater than those imposed on such person as a member of the audit committee and the board of directors in the absence of such designation and does not affect the duties, obligations or liability of any other member of the audit committee or board of directors.
CODE OF ETHICS
CAE has a code of ethics entitled “Code of Business Conduct”. The Code of Business Conduct applies to all officers and employees of CAE, including CAE’s principal executive officer, principal financial officer, principal accounting officer, agents, representatives, contractors, suppliers and consultants. CAE also has a code of ethics called the Board Member Code of Conduct for members of its board of directors. The Code of Business Conduct and the Board Member Code of Conduct are available at CAE’s Internet website, www.cae.com , in the Corporate Governance section. Amendments to the Code of Business Conduct and waivers, if any, for executive officers will be disclosed on CAE’s website. Unless specifically referred to herein, the information on CAE’s website shall not be deemed to be incorporated by reference in this annual report.
PRINCIPAL ACCOUNTANT FEES AND SERVICES

The disclosure provided under section 11 “Approval Of Services” on page 39 of Exhibit 99.1, Annual Information Form, providing details on the fees billed by PricewaterhouseCoopers LLP, the Company’s principal accountant, to CAE in each of the years ended March 31, 2014 and March 31, 2013 for professional services rendered to CAE, is incorporated by reference herein.
AUDIT COMMITTEE PRE-APPROVAL POLICIES AND PROCEDURE S
The disclosure provided under section 11 “Approval of Services” on page 39 of Exhibit 99.1, Annual Information Form, is incorporated by reference herein.
None of the services described above under the captions “Audit-Related Fees” or “Tax Fees” were approved by the Audit Committee pursuant to the de minimis exemption to the pre-approval requirements provided by paragraph (c)(7)(i)(C) of Rule 2-01 of Regulation S-X.
OFF-BALANCE SHEET ARRANGEMENTS
The disclosure provided under section 7.2 “Off balance sheet arrangements” on page 36 of Exhibit 99.3, Management’s Discussion and Analysis, is incorporated by reference herein.
CONTRACTUAL OBLIGATIONS
The disclosure provided under section 6.4 “Contractual Obligations” on page 34 of Exhibit 99.3, Management’s Discussion and Analysis, is incorporated by reference herein.
IDENTIFICATION OF THE AUDIT COMMITTEE
CAE has a separately-designated standing Audit Committee established in accordance with Section 3(a)(58)(A) of the Exchange Act. CAE’s Audit Committee is, as of the date hereof, comprised of the following directors: Katharine B. Stevenson, Paul Gagné, Andrew J. Stevens and Kathleen E. Walsh.

UNDERTAKING AND CONSENT TO SERVICE OF PROCESS
A. Undertaking
CAE Inc. (the “Registrant”) undertakes to make available, in person or by telephone, representatives to respond to inquiries made by the Commission staff, and to furnish promptly, when requested to do so by the Commission staff, information relating to: the securities in relation to which the obligation to file an annual report on Form 40-F arises; or transactions in said securities.
B. Consent to Service of Process
The Registrant has previously filed with the Commission a Form F-X in connection with the Common Shares, including the associated Common Share purchase rights pursuant to the Registrant’s Shareholder Rights Plan, which purchase rights trade together with the Common Shares.

SIGNATURES
Pursuant to the requirements of the Exchange Act, the Registrant certifies that it meets all of the requirements for filing on Form 40-F and has duly caused this annual report to be signed on its behalf by the undersigned, thereto duly authorized.
Date: June 27, 2014 CAE INC.
By: ___________________________________ Name: Hartland J. A. Paterson Title: General Counsel, Chief Compliance Officer and Secretary

EXHIBIT INDEX
Exhibit No.
Description
99.1 Annual Information Form for the fiscal year ended March 31, 2014, d ated June 12, 2014
99.2 Audited annual financial statements for the fiscal year ended March 31, 2014
99.3 Management’s Discussion and Analysis for the fiscal year ended March 31, 2014
99.4 Consent of PricewaterhouseCoopers LLP 99.5 Certification of Marc Parent required by Rule 13a-14(a) or Rule 15d-14(a) 99.6 Certification of Stéphane Lefebvre required by Rule 13a-14(a) or Rule 15d-
14(a) 99.7 Certification of Marc Parent pursuant to 18 U.S.C. Section 1350, as enacted
pursuant to Section 906 of the Sarbanes-Oxley Act of 2002 99.8 Certification of Stéphane Lefebvre pursuant to 18 U.S.C. Section 1350, as
enacted pursuant to Section 906 of the Sarbanes-Oxley Act of 2002 99.9 Notice and Management Proxy Circular dated June 12, 2014 (incorporated
by reference to CAE’s Form 6-K (commission file no. 1-31402) furnished to the Commission on June 27, 2014

2014
ANNUAL INFORMATION FORM
(Fiscal Year Ended March 31, 2014)
CORPORATE OFFICE
8585 Chemin Côte-de-Liesse
Saint-Laurent, Québec
June 12, 2014 Canada H4T 1G6

TABLE OF CONTENTS
1. CORPORATE STRUCTURE OF CAE
1.1 Name, Address and Incorporation
1.2 Inter-corporate Relationships
2. OVERVIEW OF CAE AND THE DEVELOPMENT OF ITS BUSINESS
2.1 Overview
2.2 Geographic and Segment Revenues and Locations
2.3 CAE’s Vision
2.4 Our Strategy and Value Proposition
2.5 Industry Overview and Trends
2.6 Research and Development (“R&D”)
2.7 Production and Services
2.8 Specialized Skills and Knowledge
2.9 Competition
2.10 Components
2.11 Intangible Properties
2.12 Cycles
2.13 Environmental Liabilities
2.14 Employees
2.15 Foreign Operations
3. DESCRIPTION OF THE BUSINESS SEGMENTS
3.1 Simulation Products/Civil (“SP/C”)
3.2 Training & Services/Civil (“TS/C”)
3.3 SP/C and TS/C Market Trends and Outlook
3.4 Simulation Products/Military (“SP/M”)
3.5 Training & Services/Military (“TS/M”)
3.6 SP/M and TS/M Market Trends and Outlook
3.7 Military Contracts
3.8 New Core Markets
4. RISK FACTORS
4.1 Risks relating to the Industry
4.2 Risks relating to the Company
4.3 Risks relating to the Market
5. DIVIDENDS
6. DESCRIPTION OF CAPITAL STRUCTURE
7. MARKET FOR SECURITIES
1

7.1 Trading Price and Volume
8. DIRECTORS AND OFFICERS
8.1 Name and Occupation
8.2 Cease Trade Orders, Bankruptcies, Penalties or Sanctions
9. TRANSFER AGENTS AND REGISTRARS
10. AUDIT COMMITTEE
10.1 Mandate
10.2 Membership
11. APPROVAL OF SERVICES
12. ADDITIONAL INFORMATION
GLOSSARY
SCHEDULE A – SUBSIDIARIES
SCHEDULE B - AUDIT COMMITTEE MANDATE
2

INFORMATION INCORPORATED BY REFERENCE
CAE’s Management’s Discussion and Analysis and our Consolidated Financial Statements for the year ended March 31, 2014, and the notes thereto (“ Consolidated Financial Statements ”) appear in the Annual Report to Shareholders for the year ended March 31, 2014 (“ Annual Report ”). The Consolidated Financial Statements were prepared in accordance with Part 1 of the CPA Canada Handbook, referred to as IFRS. The information contained in the Management’s Discussion and Analysis and the Consolidated Financial Statements for the year ended
March 31, 2014, and the notes thereto, is specifically incorporated by reference into this Annual Information Form (“ AIF ”). Any parts of the Annual Report not specifically incorporated by reference do not form part of this AIF.
Unless otherwise noted, all dollar references in th is Annual Information Form are expressed in Canadia n dollars.
References to fiscal 2014 (“ FY2014 ”) refer to the period from April 1, 2013 to March 31, 2014, references to fiscal 2013 refer to the period from April 1, 2012 to March 31, 2013, and references to fiscal 2012 refer to the period from April 1, 2011 to March 31, 2012.
This AIF contains forward-looking statements about our activities, events and developments that we expect to or anticipate may occur in the future including, for example, statements about
our vision, strategies, market trends and outlook, future revenues, capital spending, expansions and new initiatives, financial obligations and expected sales. Forward-looking statements normally contain words like believe , expect , anticipate , plan, intend , continue , estimate , may , will , should, strategy, future and similar expressions. By their nature, forward-looking statements require us to make assumptions and are subject to inherent risks and uncertainties associated with our business which may cause actual results in future periods to differ
materially from results indicated in forward-looking statements. While these statements are based on management’s expectations and assumptions regarding historical trends, current conditions and expected future developments, as well as other factors that we believe are reasonable and appropriate in the circumstances, readers are cautioned not to place undue reliance on these forward-looking statements as there is a risk that they may not be accurate.
Important risks that could cause such differences include, but are not limited to, risks relating to the industry such as competition, level and timing of defence spending, government-funded military programs, constraints within the civil aviation industry, regulatory rules and compliance and conflict mineral rules, risks relating to CAE such as product evolution, R&D activities, fixed-price and long-term supply contracts, procurement and original equipment manufacturer (OEM) leverage, warranty or other product-related claims, product integration, protection of
intellectual property, key personnel, environmental liabilities and claims arising from casualty losses, integration of acquired businesses, our ability to penetrate new markets, length of sales cycle and our reliance on technology, and risks relating to the market such as foreign exchange, availability of capital pension plan funding, doing business in foreign countries and income tax laws. Additionally, differences could arise because of events that are announced or completed after the date of this AIF, including mergers, acquisitions, other business combinations and
divestitures. You will find more information in the Risk Factors section of this AIF. We caution readers that the risks described above are not necessarily the only ones we face; additional risks and uncertainties that are presently unknown to us or that we may currently deem immaterial may adversely affect our business.
Except as required by law, we disclaim any intention or obligation to update or revise any forward-looking statements whether as a result of new information, future events or otherwise. The
forward-looking information and statements contained in this AIF are expressly qualified by this cautionary statement.
1. CORPORATE STRUCTURE OF CAE 1.1 Name, Address and Incorporation On March 17, 1947 CAE Inc. (“ Company ” or “ CAE ”) was incorporated as Canadian Aviation Electronics Ltd. under the laws of Canada by letters patent. In 1965, the name of the Company was changed to CAE Industries Ltd. and in 1993 the Company changed its name to CAE Inc.
CAE was continued in 1977 under the Canada Business Corporations Act (“ CBCA ”). In 1979, CAE’s articles were amended to change its authorized share capital to an unlimited number
of common shares, and again in 1981 to authorize an unlimited number of preferred shares, issuable in series, with such rights, privileges, restrictions and conditions as the Directors of CAE may determine.
On June 9, 1995, CAE’s articles were amended to authorize the Directors to appoint additional Directors in accordance with the provisions of the CBCA. On April 1, 2001, the Company
amalgamated with CAE Electronics Ltd., our wholly-owned subsidiary.
3

CAE’s registered office is located at 8585 Côte-de-Liesse, Saint-Laurent, Québec , Canada H4T 1G6, telephone: (514) 341-6780, fax: (514) 340-5530.
1.2 Inter-corporate Relationships The direct and indirect subsidiaries and other ownership interests of CAE are set out in Schedule A hereto.
2. OVERVIEW OF CAE AND THE DEVELOPMENT OF ITS BUSINESS 2.1 Overview CAE is a world leader in providing simulation and modeling technologies and integrated training services primarily to the civil aviation industry and defence forces around the globe. We also leverage our simulation capabilities in healthcare and mining markets. We are globally diversified with approximately 8,000 people at more than 160 sites and training locations in approximately 35 countries. In fiscal 2014, we had annual revenue exceeding $2.1 billion, approximately 90% of which came from worldwide exports and international activities. We have the
largest installed base of civil and military flight simulators and a broad global aviation training network. We offer civil aviation, military and helicopter training services in 67 locations worldwide where we train approximately 120,000 civil and military crewmembers annually. Our main products include full-flight simulators (“ FFS ”s), which replicate aircraft performance in a full array of situations and environmental conditions. We apply our simulation expertise and operational experience to help customers enhance safety, improve efficiency, maintain readiness and solve
challenging problems.
Approximately half of our revenue comes from the sale of simulation products, software and simulator updates, and the balance from services including training, maintenance, ab initio pilot training, aircraft crew sourcing and integrated enterprise solutions.
Founded in 1947 and headquartered in Montreal, Canada, CAE has built an excellent reputation and long-standing customer relationships based on nearly 70 years of experience, strong technical capabilities, a highly trained workforce and global reach.
CAE’s common shares are listed on the Toronto and New York stock exchanges under the symbol CAE.
2.2 Geographic and Segment Revenues and Locations CAE’s consolidated revenue from continuing operations in fiscal 2013 and 2014 was $2.035 billion and $2.115 billion , respectively, and is broken down as follows:
4
Revenue by Segment (%) Geographic Distribution of Revenue (%) 2014 2013 2014 2013
SP/C 22 22 US 31 30 TS/C 34 32 Germany 3 4 SP/M 25 28 Other European countries 18 16 TS/M 14 12 UK 12 12 NCM 5 6 Other Asian countries 9 10 100 100 Canada 8 10 Australia 4 4 China 7 8 United Arab Emirates 3 2 Other countries 5 4 100 100
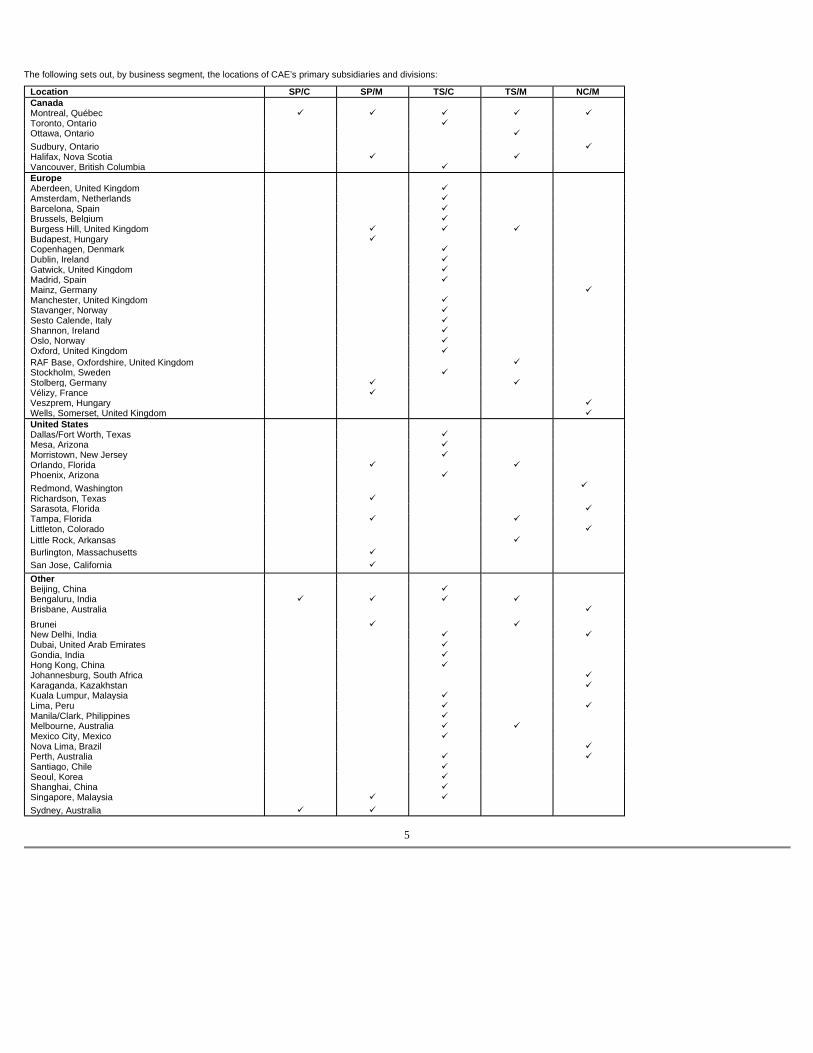
The following sets out, by business segment, the locations of CAE’s primary subsidiaries and divisions:
5
Location SP/C SP/M TS/C TS/M NC/M Canada Montreal, Québec � � � � � Toronto, Ontario � Ottawa, Ontario Sudbury, Ontario
� �
Halifax, Nova Scotia � � Vancouver, British Columbia � Europe Aberdeen, United Kingdom � Amsterdam, Netherlands � Barcelona, Spain � Brussels, Belgium � Burgess Hill, United Kingdom � � � Budapest, Hungary � Copenhagen, Denmark � Dublin, Ireland � Gatwick, United Kingdom � Madrid, Spain � Mainz, Germany � Manchester, United Kingdom � Stavanger, Norway � Sesto Calende, Italy � Shannon, Ireland � Oslo, Norway � Oxford, United Kingdom � RAF Base, Oxfordshire, United Kingdom � Stockholm, Sweden � Stolberg, Germany � � Vélizy, France � Veszprem, Hungary � Wells, Somerset, United Kingdom � United States Dallas/Fort Worth, Texas � Mesa, Arizona � Morristown, New Jersey � Orlando, Florida � � Phoenix, Arizona Redmond, Washington
�
�
Richardson, Texas � Sarasota, Florida � Tampa, Florida � � Littleton, Colorado � Little Rock, Arkansas � Burlington, Massachusetts � San Jose, California � Other Beijing, China � Bengaluru, India � � � � Brisbane, Australia � Brunei � � New Delhi, India � � Dubai, United Arab Emirates � Gondia, India � Hong Kong, China � Johannesburg, South Africa � Karaganda, Kazakhstan � Kuala Lumpur, Malaysia � Lima, Peru � � Manila/Clark, Philippines � Melbourne, Australia � � Mexico City, Mexico � Nova Lima, Brazil � Perth, Australia � � Santiago, Chile � Seoul, Korea � Shanghai, China � Singapore, Malaysia Sydney, Australia
�
� �
�

2.3 CAE’s Vision We intend to be the partner of choice for customers operating in complex mission-critical environments by providing the most innovative modeling and simulation-based solutions to enhance safety and improve efficiency .
2.4 Our Strategy and Value Proposition Our strategy
We are a world-leading provider of modeling and simulation-based training solutions. We have a long history of serving the needs of customers in the civil aerospace and defence and
security markets, and the CAE brand has become synonymous with safety, quality and reliability the world over.
Our focus involves supporting airlines, aircraft operators and defence and security forces with their ongoing, long-term training needs. In defence and security, this means helping forces to ensure mission readiness, and in civil aviation, the necessity for training solutions is driven by the need for uncompromised safety in globally regulated markets. Our unique ability to provide
comprehensive solutions, our technology leadership, proven customer support and a vast global presence differentiates us in our end markets. We are invested in both mature and emerging markets and this enables us to capitalize on current demand and future growth opportunities. Approximately one third of our revenue comes from the U.S., one third from Europe and one third from the rest of the world including the higher growing, emerging markets.
Value proposition The value we provide customers is the ability to enhance the safety of their operations, improve their mission readiness for potentially dangerous situations and lower their costs by helping them become more operationally efficient. We offer a range of product and service solutions to enhance our customers’ planning and decision-making abilities. We also offer a broad global reach, and as a result, we are able to provide solutions in proximity to our customers, which is an important cost-benefit consideration for them.
Our core competencies and competitive advantages include:
- World-leading modeling and simulation technology;
- Comprehensive knowledge of training and learning methodologies;
- Total array of training products and services solutions;
- Broad-reaching customer intimacy;
6

- High brand equity;
- Proven systems engineering and program management processes;
- Best-in-class customer support;
- Well established in emerging markets.
World-leading modeling and simulation technology We pride ourselves on our technological leadership. Pilots around the world view our simulation as the closest thing to the true experience of flight. We have consistently led the evolution of flight training and simulation systems technology with a number of industry firsts. We have simulated the entire range of large civil aircraft in use today, a large number of the leading regional
and business aircraft and a number of civil helicopters. We are an industry leader in providing simulation and training solutions for fixed-wing tanker and transport aircraft, maritime patrol aircraft, trainer aircraft and helicopter platforms for the military. We also have extensive knowledge, experience and credibility in designing and developing simulators for first-to-market aircraft of major aircraft manufacturers. We now use our expertise in modeling and simulation beyond training into other mission-critical
areas, such as emergency response services, where these technologies are used to support superior decision-making capabilities. As well, we have extended these capabilities to the
healthcare and mining markets.
Comprehensive knowledge of training and learning methodologies With nearly 70 years of experience in simulation, we are an industry expert in aviation training and are the industry’s training solution one-stop shop. We are constantly introducing and implementing ways to improve safety and training efficiency, from ab initio to professional pilot training. For instance, data from simulation training sessions is captured, analyzed and
displayed to provide instructors and trainees with real-time feedback on training performance, allowing focus on priority development areas to increase training efficiency. We are also playing a leadership role in supporting airlines toward the adoption of the Multi-Crew Pilot Licence (“ MPL ”) program, the most recent pilot licence introduced by the International Civil Aviation Organization (“ ICAO ”), which embeds the latest advances in learning leveraging simulation. Another example is our industry leadership towards implementing Upset Prevention and
Recovery Training, specifically geared toward preparing pilots to address adverse and extreme flying conditions. In the defence and security market, we are increasingly leveraging our unique training systems integration capabilities to offer customers across air, land, sea and public safety comprehensive training solutions that can include training centres, training services and simulation products. We are using our experience gained in the development of training and learning methodologies in aerospace to bring and enhance modeling and simulation
technologies to our training solutions in the healthcare and mining domains. In healthcare, we offer both training expertise and the widest breadth of simulation training products in the industry, with surgical, patient, and ultrasound simulators and trainers for more than 20 medical specialties. Our simulation centre management system, LearningSpace, effectively captures every aspect of a live simulation, allowing the delivery of instant, multimedia debriefing sessions and ongoing training improvement. In mining, we have borrowed from aviation standards to
introduce new solutions to train mining vehicle operators.
Total array of training products and services solutions We offer a wide array of training products, from desktop trainers to FFSs, addressing both our civil and defence and security customers’ training needs. With a large network of training
centres, we are also a global leader in aviation training providing the complete solution to meet our customers’ training and pilot sourcing needs. Our pilot training programs span over 100 different civilian aircraft models including commercial airliners, business aircraft and helicopters. In the defence and security market, our programs involve training for transport aircraft, helicopters, trainer aircraft, tankers, maritime patrol aircraft, remotely piloted aircraft (“ RPA ”) systems, tanks, armoured fighting vehicles, ships and other platforms. Our range of training
services includes the provision of curricula for pilot type training, cabin crew and maintenance training. Our civil pilot sourcing solution adds value and moves our customers’ businesses forward by identifying, screening, selecting, training and ultimately placing pilots at their airlines. In addition, we deliver civil ab initio pilot training through CAE Oxford Aviation Academy (“CAE OAA ”).
Broad-reaching customer intimacy The realization of our mission to be our customers’ partner of choice is evident in the relationships that we have with most of the world’s airlines, aircraft operators, governments and original equipment manufacturers (“ OEMs ”). Our broad geographic coverage allows us to respond quickly and cost effectively to customer needs and new business opportunities while having a
deep understanding of the regulations and customs of the local market. We operate a fleet of over 259 full-flight and full-mission simulators in 67 civil aviation and military training locations worldwide to meet the wide range of operational requirements of our customers. Among our thousands of customers, we have long-term training services agreements and joint ventures with more than 30 major airlines and aircraft operators around the world and relationships with approximately 50 defence operators in approximately 35 countries.
7

High brand equity We are unique in the simulation industry as the only truly global company focused on modeling, simulation, and training. We continually reinforce our focus, experience and technology leadership as we position the Company with customers around the world. We invest in building and maintaining our brand and reputation as a company committed to innovation that will help
its customers enhance safety, improve efficiency, enhance decision-making and achieve mission readiness. We are focused on offering the aviation industry’s most comprehensive portfolio of simulation products, training services, and crew sourcing with the ability to tailor a flexible training solution to the individual requirements of each of our customers. Our simulation products are rated among the highest in the industry for reliability and availability. This is a key benefit because simulators normally operate in high-duty cycles of up to 20 hours a day, seven days a
week. We design our products so customers can upgrade them, giving them more flexibility and opportunity as products change or new air worthiness regulations are introduced. The CAE brand is synonymous with industry-leading simulation technology as well as superior training and customer support and we strive to be our customers’ partner of choice for any simulation and training related requirement.
Proven systems engineering and program management processes We continue to evolve our technology platform to meet the changing market needs, and to develop solutions and deliver technically complex programs to help ensure that there are trained
and mission-ready aircrew and combat troops around the world. We have a proven track record on delivering complex civil and military first-to-market simulators. Our defence and security business unit has several of its organizations around the world certified to Level 3 or above of the Capability Maturity Model Integration (“ CMMI ”), which is an internationally recognized model of industry best practices in organizational process improvement, project management, systems engineering and software development. Our experience, coupled with our continued
investment in research and development, strengthens our technological leadership as well as our management expertise to provide programs featuring sensor simulation for maritime operations, synthetic tactical environments for naval and fighter operations as well as visualization and common database technologies that deliver rich, immersive synthetic environments for the most effective training and mission rehearsal possible.
Best-in-class customer support We maintain a strong focus on after-sales support, which is often critical in winning additional sales contracts, as well as important update and maintenance services business. Our customer
support practices, including a web-based customer portal, performance dashboard and automated report cards, have resulted in enhanced customer support according to customer comments and feedback.
Well established in emerging markets We pride ourselves in our local presence in each of our global markets, while simultaneously maintaining the efficiencies and advantages of being an international organization. This approach has enabled us to lead in high-growth markets like China, Eastern Europe, the Indian sub-continent, the Middle East, South America and Southeast Asia, where we have been active for
several decades.
2.5 Industry Overview and Trends The civil, defence and security, healthcare and mining markets CAE serves are driven by factors particular to each market.
CAE believes the civil market is most affected by the world gross domestic product, which in turn drives air travel, measured in revenue passenger kilometers (“ RPK ”). This positive RPK generation needs to be satisfied by aircraft deliveries in addition to the existing fleet, and then corrected for attrition. Finally direct factors influence the total offering such as the nature, size and composition of aircraft fleets, aircraft delivery schedules, pilot demographics, certification requirements and market demand for commercial and business air travel, which in particular is
also influenced by corporate profits.
CAE believes the defence and security market is mostly influenced by a combination of defence spending and the nature of military activity. Demand for CAE’s defence and security products and services are also influenced by the degree to which governments globally lean towards the outsourcing of functions to the private sector. As well, CAE’s defence and security business is
affected by the extent to which synthetic training and mission rehearsal solutions gain market acceptance as an alternative to live training, such as flying an actual aircraft or firing an actual weapon.
8

CAE believes the healthcare market is influenced by developments in treatments for healthcare issues and, in some markets, government spending. Demand for CAE’s healthcare products
and services are also influenced by the degree to which synthetic training and treatment rehearsal solutions gain market acceptance as an alternative to the present system of on-the-job learning assisted by seasoned clinicians.
CAE believes the mining market is influenced by economic cycles and GDP growth. Demand for CAE’s mining products and services are also influenced by the need for operational
efficiencies that can be addressed by CAE Mining’s solutions.
2.6 Research and Development (“R&D”) CAE’s competitive strategy is hinged on technology leadership of its products and services. This strategy is underpinned by a strong innovation culture and a long-standing commitment to performing R&D.
CAE uses leading practices in the Global Engineering organization to ensure strategic alignment of the technology roadmap with the business strategy. This special governance mechanism, called the Innovation Board, is held periodically at the most senior executive level of the Company, to align and review the vision and strategic direction for R&D. Making innovation materialize at all levels within CAE’s products, services and processes throughout the operational execution continues to be a strategic priority. To this end, a company-wide “Open Innovation
Challenge” process is deployed to all employees using an internal social media platform to stimulate innovation. Our employees are proud to contribute to the innovation journey leading to new products and services.
We are pleased to report that the strategic initiative of technology convergence is progressing as planned and is already demonstrating benefits. This project consolidates the complete CAE
technology stack into a single common platform that will provide the building blocks for all of CAE’s products for the future.
We were also pleased to introduce in FY2014 the new full flight simulator benchmark in the industry, the CAE 7000XR. This simulator defines new customer experience standards for pilots, for instructors, for maintenance technicians, and for training center operators. It includes new customer interfaces, such as a next generation instructor “office” which provides real time
brief/debrief capabilities. It also features new embedded training capabilities such as upset recovery training systems as mandated by new regulations. This next generation instructor environment is significant. The 7000XR also provides a novel computing infrastructure that leverages cloud big data technologies to provide a superior level of operational efficiency. In addition to the new software design, the hardware for this simulator has been optimized to reduce long-term life cycle operating costs.
Continuing on the success of the 3000 series light helicopter simulator platform introduced in 2012, CAE has developed and launched a new larger version for mid to heavy helicopters. The CAE 3600 series simulator has successfully entered the market with innovative design features such as a 12ft direct projection visual system providing a more immersive experience.
CAE has continued to advance its leadership position in simulation synthetic environments with the release to market of its Dynamic Synthetic Environment (“ DSE ”) product suite. The
complete Presagis software tool set and the complete CAE synthetic software stack have been augmented to be fully dynamic, persistent and inter-operable. This technology places CAE in a leading position to support the military forces vision of joint synthetic training.
As a significant outcome of the 2014 R&D investment, CAE is pleased to report that it has filed for nine patents covering the latest innovations in its products.
In 2009, CAE announced an investment of $714 million in Project Falcon, an R&D program that spanned over five years. Project Falcon concluded successfully in 2014. Significant products and technologies were developed which contributed to the success of the company. We are pleased to report that the Government of Canada has decided to continue its support to CAE’s strategic technology development with a repayable loan of $250 million, which was signed on February 27, 2014 for Project Innovate. CAE launched Project, Innovate, to develop its next
generation of simulation platforms for its civil aviation and defence markets. It will create a state-of-the-art modular system which will be more efficient and much easier to deploy and maintain. The new system will also enhance CAE's user experience. In addition, CAE will develop technologies and training solutions geared towards joint and networked operations in order to be a training systems integrator in air, sea and land domains.
9

2.7 Production and Services Production
CAE’s manufacturing and assembly facilities are located in Montreal, Canada; Tampa & Sarasota, U.S.; Burgess Hill, U.K.; Bengaluru, India; and Stolberg, Germany.
The manufacturing process for CAE Full Flight simulators is complex, involving the coordination of more than 200,000 parts and millions of lines of software code. The manufacture of a
simulator includes six major stages: design, manufacture & assembly, integration & testing, shipping, site installation and final qualification on site. Military simulators, by virtue of their tactical environments and weapons/sensor systems, are more complex and unique than civil simulators and therefore may take more time to design, manufacture and test.
Manufacturing is organized into ten manufacturing cells comprised of the following three major disciplines: electronics (printed circuit board assembly), electrical (cables, cabinets, aircraft
instruments and avionics), and mechanical (sheet metal and machine shop, precision assembly and hydraulics, structural assembly and final assembly). Each cell has its own planning, methodizing and set of specific products to deliver, which establishes clear accountability for manufacturing performance.
Most of our manufacturing and integration activities for civil and military simulation systems are conducted at CAE’s facilities in Montreal, with some integration and update related work also
being conducted at the Tampa, Burgess Hill, Bengaluru, Sydney, and Stolberg sites. The Tampa facility conducts military systems integration and testing activities for simulation equipment destined for U.S. military-related contracts.
Services
CAE’s training and service facilities are based around the world. While our head office is located in Montreal, Canada, CAE provides training and services from 67 locations across South
America, North America, Europe, the Middle East, India, China, Russia and Southeast Asia.
These locations include Type Rating Training Organizations (“ TRTO ”) offering pilot, maintenance and cabin crew training to business and commercial aircraft operators; ab-initio training centres which provide commercial pilot license training to aspiring pilots as part of CAE Oxford Aviation Academy (“ CAE OAA ”) initiative; and several locations from which CAE offers
technical support services to aviation training centres.
CAE’s courseware development is conducted in our Canadian, U.S. and Indian facilities, and CAE’s flight data solutions are offered from Canada.
CAE provides a range of technical support services to civil and military simulator operators, including parts replacement and repairs, installations, relocations, upgrades and technical training.
Customers use CAE’s technical services to answer questions, troubleshoot and receive advice. This extends to service visits by CAE’s engineers to assist in customer maintenance and repair activities. Military and civil upgrade services are not restricted to CAE products; CAE can upgrade most other manufacturers’ simulators. CAE services are offered either in conjunction with a sale of a simulator, through maintenance contracts or individual purchase orders. CAE believes that our service business provides opportunities to influence the upgrade of installed
FFSs while providing valuable insights into customer training needs.
CAE also provides analytical and engineering services that leverage modeling and simulation and other advanced technologies to develop innovative solutions to our clients’ most complex challenges. CAE offers clients a range of services and subject matter expertise, including human factors and human system integration, capability based planning, advanced synthetic
environments, system and software engineering for Command, Control, Communications, Computers, Intelligence, Surveillance and Reconnaissance (“ C4ISR ”) and electronic warfare systems, training systems and services, integrated information environments, and in-service support for fleet operations and maintenance.
2.8 Specialized Skills and Knowledge CAE employs predominantly graduates in engineering and software development, as well as pilots, instructors and other flight training experts. As an industry leader, CAE is able to train our
staff in the technology and software required for simulation software and equipment. Flight trainers are typically recruited from the ranks of former airline or military pilots. Recognizing that engineering talent is at the center of the Company innovation capability, CAE has an industry unique engineering career framework that will benefit the talent pipeline within the CAE engineering community.
10

2.9 Competition We sell our simulation equipment and training services in highly competitive markets. New entrants have emerged in recent years and the competitive environment has intensified as
aerospace and defence companies position themselves to try to take greater market share by consolidating existing civil simulation companies and by developing their own internal capabilities. Most recently, Lockheed Martin, L-3 Communications and Textron have all acquired commercial aircraft simulator competitors. Most of our competitors in the simulation and training markets are also involved in other large segments of the aerospace and defence complex beyond simulation and training. As such, several of them are larger than we are, and may
have greater financial, technical, marketing, manufacturing and distribution resources. In addition, some competitors have well-established relationships with, or are important suppliers to, aircraft manufacturers, airlines and governments, which may give them an advantage when competing for projects for these organizations. In particular, we face competition from Boeing, which has pricing and other competitive advantages over us. Boeing has a licencing model for Boeing civil aircraft simulators which includes a requirement for simulator manufacturers and
service training operators to pay Boeing a royalty to manufacture, update or upgrade a simulator, and to provide training services on Boeing simulators.
Airbus has decided to deepen its services offered to customers for training services. OEMs like Airbus and Boeing have certain advantages in competing with independent training service providers. An OEM controls the pricing for the data, parts and equipment packages that are often required to manufacture a simulator specific to that OEM’s aircraft, which in turn is a critical
capital cost for any simulation-based training service provider. OEMs may be in a position to demand licence royalties to permit the manufacturing of simulators based on the OEM’s aircraft, and/or to permit any training on such simulators. CAE also has some advantages, including being a simulator manufacturer, having the ability to replicate certain aircraft without data, parts and equipment packages from an OEM, and owning a diversified training network that includes joint ventures with large airline operators which are aircraft customers for OEMs. We work with
some OEMs on business opportunities related to equipment and training services.
Periods of economic recession or credit constraints for civil market products lead to heightened competition for each available civil aircraft simulator sale. This in turn leads to a reduction in profit on sales won during that period. Should such conditions occur, we could experience further price and margin erosion.
The markets in which we sell our products are highly competitive. Certain competitors are also CAE’s customers, partners and suppliers on specific programs. The extent of competition for any single project generally varies according to the complexity of the product and the dollar amount of the anticipated award. We believe that we compete on the basis of:
• Quality, performance and flexibility of our products and services;
• Reputation for prompt and responsive contract performance;
• Accumulated technical knowledge, intellectual property and expertise;
• Strong after-sales support;
• Flexibility of product/service offerings being susceptible to tailor-made customer solutions;
• Breadth of product line; and
• Price.
CAE’s future success will depend in large part upon our ability to improve existing product lines, develop new products and technologies in the same or related fields, improve delivery intervals and reduce the costs we incur in producing our products and services.
CAE’s major competitors in the military simulation and training market include Lockheed Martin, L-3 Communications Link Simulation (“ L-3 Communications ”) and Training, Boeing,
Rockwell Collins, Indra Systems, BAE Systems, Flight Safety International, SAIC, Leidos, Raytheon, General Dynamics, Cubic, Elbit, Eurocopter, AgustaWestland, Rheinmetall Defence Electronics, Saab and Textron. Some of these competitors are predominantly local (one country or region) competitors. CAE sometimes partners with these and other competitors to cooperate on program contracts.
CAE’s major competitors in the civil simulation equipment market include Lockheed Martin, Flight Safety International, L3 Communications, Rockwell Collins, Tru Simulation & Training (Textron) and smaller players such as Indra. Some of these competitors are low-cost providers with a limited product portfolio which only addresses a subset of the overall market, while others offer a broader product portfolio. CAE’s major competitors in civil pilot training include Flight Safety International, Boeing Training and Flight Services, Lufthansa Flight Training and
PanAm International Flight Academy (ANA Holdings Inc).
11

2.10 Components CAE deals with a variety of goods and services suppliers across our business segments. Although we are not overly dependent on any single supplier for any key manufacturing components
or services, CAE’s products contain sophisticated computer systems that run on software and operating systems supplied to us by third parties. Such computer systems and software may not always be available to CAE to license or purchase.
The production of CAE simulators is often dependent upon receipt by CAE of data, including confidential or proprietary data, concerning the functions, design and performance characteristics of a product or system, the performance of which CAE’s simulator is intended to simulate. CAE cannot guarantee that we will be able to obtain such data on reasonable terms, or at all. Original manufacturers of these products and systems could object to the simulation by CAE of components of, or the totality of their products or systems, or could request high license fees
that could negatively impact CAE’s profit margins.
Most of the raw materials used in manufacturing (such as sheet metal, wires, cables and electronic integrated circuits) are available off the shelf from multiple commercial sources. The unique parts are the aircraft parts. These are usually available from aircraft manufacturers, the resale market, decommissioned or surplus aircrafts as well as through simulated part manufacturers.
The availability of most parts in a timely manner facilitates a relatively smooth production flow. Aircraft parts, in some instances, may be an exception, especially on new/prototype aircraft types or those out of production. The timely delivery of these parts is often the responsibility of CAE’s customers. CAE’s contracts normally link these aircraft parts delivery dates to the simulator delivery schedules. In cases where such aircraft parts cannot be made available, CAE’s customers rely on CAE’s ability to make simulated parts.
2.11 Intangible Properties We rely in part on trade secrets and contractual restrictions, such as confidentiality agreements and licenses, to establish and protect our proprietary rights. These may not be effective in preventing a misuse of our technology or in deterring others from developing similar technologies. We may be limited in our ability to acquire or enforce our intellectual property rights in some countries.
Intellectual property
Our products contain sophisticated software and computer systems that are supplied to us by third parties. These may not always be available to us. Our production of simulators often depends on receiving confidential or proprietary data on the functions, design and performance of a product or system that our simulators are intended to simulate. We may not be able to
obtain this data on reasonable terms, or at all.
Infringement claims could be brought against us or against our customers. We may not be successful in defending these claims and we may not be able to develop processes that do not infringe on the rights of third parties, or obtain licenses on terms that are commercially acceptable, if at all.
Litigation related to our intellectual property rights could be lengthy and costly and could negatively affect our operations or financial results, whether or not we are successful in defending a claim.
CAE owns certain patents and has filed applications in respect of additional patents. CAE enters into agreements containing non-disclosure and confidentiality clauses with third parties and
has similar provisions in place with our employees to protect our proprietary information and trade secrets. CAE also has internal policies concerning both ethics and intellectual property which guide our employees in their dealings with CAE’s intellectual property and that of third parties.
Given the lengthy delay in obtaining patents (during which some technology may evolve into newer generations), the required detailed patent application disclosure which may permit
competitors to reverse-engineer an invention, and the cost of maintaining and defending patents, CAE believes that certain intellectual property is adequately protected by either maintaining it as a trade secret or selectively disclosing enough of it to forestall anyone else from subsequently claiming it as their own original innovation.
CAE’s agreements with Industry Canada and Investissement Québec (“ IQ ”) restrict, in some cases, CAE’s ability to license (other than to customers) or transfer ownership of intellectual
property deve loped with the program’s support until all funding has been repaid or consent has been obtained.
Given CAE’s many decades of success in the field of aviation simulation, CAE believes that the CAE brand and some of our trademarked products have value in the markets we address.
12

2.12 Cycles The SP/M and TS/M segments sell to government customers such that there is no evident cycle to the intake of orders, but such order levels may vary significantly from quarter to quarter
because of the irregular timing of government orders.
The SP/C segment’s equipment sales to airlines are affected by the cycles of expansion and contraction of the entire commercial airline industry, as well as the availability of credit and general economic conditions.
The TS/C segment’s flight training services do experience an element of seasonality; in times of peak travel (holiday periods, etc.) airline and business jet pilots are often too busy flying aircraft to attend training sessions. TS/C is also affected by the longer wave cycles of the commercial airline industry, though not to the same degree as SP/C.
The Mining segment is primarily tied to operational budgets of mining companies but can be subject to the cyclicality of the mining industry’s commodity prices, given its link to general
economic conditions. Seasonality is not a major factor other than the normal budgeting cycles. Healthcare is subject to the irregular timing of government/military orders.
2.13 Environmental Liabilities We use, generate, store, handle and dispose of hazardous materials at our operations and used to at some of our discontinued or sold operations. Past operators at some of our sites also
carried out these activities.
New laws and regulations, stricter enforcement of existing laws and regulations, the discovery of previously unknown contamination, new clean-up requirements or claims on environmental indemnities we have given may result in us having to incur substantial costs. This could have a materially negative effect on our financial condition and results of operations.
We have made provisions for claims we know about and remediation we expect will be required, but there is a risk that our provisions are not sufficient.
In addition, our discontinued operations are largely uninsured against such claims, so an unexpectedly large environmental claim against a discontinued operation could reduce our profitability in the future.
CAE believes our current operations are in compliance in all material respects with environmental laws and regulations. Environmental protection requirements do not have material financial or operational effects on CAE’s capital expenditures, earnings or competitive position.
CAE operations include, and past operations and those of some past operators at some of CAE’s sites have included, the use, generation, storage, handling and disposal of hazardous
materials which are subject to health and safety and environmental laws and regulations in the various countries in which CAE operates or has operated.
2.14 Employees CAE strives to have practices in place that drive employee development and engagement through employee communications, processes such as Kaizen and its Annual Leadership
Development Process (“ ALDP ”). The Company invests in its employees through technical and leadership training, as well as developmental career moves.
CAE employs approximately 8,000 employees; of these approximately 1,300 are unionized and covered by 28 different collective agreements all over the world. The Company maintains constructive relationships with its unions and strives to achieve mutually beneficial relationships while maintaining cost competitiveness.
2.15 Foreign Operations For the fiscal year ended March 31, 2014, sales to customers outside Canada accounted for approximately 90% of CAE’s revenue such that CAE is very dependent upon foreign sales and operations. CAE expects that sales outside Canada will continue to account for most of its revenue for the foreseeable future.
CAE’s physical presence in countries such as the U.S., Germany, Australia, Singapore and the U.K. has enabled us to develop strong relationships and a good reputation with governments and other defence contractors who are important decision makers regarding defence contracts.
As a result, CAE is subject to risks of doing business internationally, including:
• Currency fluctuations;
• Changes to regulatory requirements;
13

• Changes to domestic and foreign government policies, including requirements to spend a portion of program funds locally and governmental industrial cooperation requirements;
• The complexity and necessity of using foreign representatives and consultants;
• Imposition of tariffs or embargoes, export controls, including U.S., Canadian and foreign arms export controls, currency exchange controls and restrictions, and other trade restrictions affecting countries in which CAE sells our products or services;
• The challenge of managing and operating an enterprise spread over various countries;
• Compliance with a variety of foreign laws; and
• General economic and geopolitical conditions, including international hostilities, inflation, trade relationships and military and political alliances.
The impact of these factors is difficult to predict and any one or more of these factors could adversely affect CAE’s operations in the future.
3. DESCRIPTION OF THE BUSINESS SEGMENTS 3.1 Simulation Products/Civil (“SP/C”) Designs, manufactures and supplies civil flight simulation training devices and visual systems We are the world leader in the provision of civil flight simulation equipment, including FFSs and a comprehensive suite of integrated training procedures trainers, flight training devices and web-based e-learning tools, using the same high-fidelity Level D software as the FFSs. We have designed and manufactured more civil FFSs for major and regional commercial airlines, third-party training centres and OEMs than any other company. We have developed a wealth of experience in developing first-to-market simulators for more than 35 new types of aircraft models,
and in recent years we have been developing simulators for the Airbus A350 XWB, AVIC Medium-Sized Transport, Boeing 747-8, Mitsubishi Regional Jet (“ MRJ ”), ATR42-600 and ATR72-600, Bombardier CSeries, Global 5000/6000, Global 7000/8000 and Learjet 85, Embraer Phenom 100 and 300, Dassault Falcon 7X and the Commercial Aircraft Corporation of China, Ltd (“COMAC ”) ARJ21 and C919. Leveraging our extensive worldwide network of spare parts and service teams, we also offer a full range of support and services. This includes emergency
support, simulator updates and upgrades, maintenance services and simulator relocations.
CAE builds civil simulators for all categories of aircraft including those built by Airbus, Boeing, Bombardier, Cessna, Dassault, Embraer, Gulfstream, Beechcraft and Raytheon. CAE also builds simulators for civil helicopters, including AgustaWestland, Bell Helicopter, Eurocopter and Sikorsky models. Since our inception, CAE has taken orders for and delivered more than
1,500 FFSs and training devices from approximately 140 commercial airlines, aircraft manufacturers and third-party training centres in approximately 35 countries. With nearly 70 years of experience in designing and manufacturing FFSs and other flight training devices, CAE has established long-standing relationships with leading commercial airlines throughout the world.
CAE plans to maintain a leadership position in civil simulation systems by anticipating future customer needs through both our own training experience and trusted relationships with
equipment customers, commitment to innovation and technology, product quality, reliability and efficiency, and continuing efforts to lower costs and shorten delivery cycles. CAE continues to improve on its lead-time, cost, quality and reputation for performance through operational improvements and R&D programs. SP/C is focused on substantially reducing the costs associated with manufacturing simulation equipment intended both for sale to third parties as well as for installation in CAE’s own global network of training centres.
CAE’s capabilities in simulation-based interactive learning, including our leading-edge CAE Simfinity TM system, also complement our traditional strength in FFSs and flight training devices (“FTD ”) . Combined with a growing network of training centres, this complete suite of simulation-based equipment and training products enables CAE to offer airlines and business jet operators a complete range of training solutions.
The use of flight simulators in pilot and crew training is well established within the commercial and business markets. Increased use of simulators has occurred as a result of the growth in commercial and business air travel which, in turn, has driven fleet expansion and increased demand for pilot training. Civil simulator usage has also increased due to advances in technology that enable increased realism and the significant cost savings provided by flight simulation training compared to actual flight time. The use of synthetically-generated reproductions of airport
configurations and use of satellite terrain imagery incorporated into the simulation further enhance the effectiveness of simulation training. Simulators are also utilized by pilots to supplement actual flying time to maintain their certification. Today’s most sophisticated civil flight simulators are rated Level D by the U.S. FAA or receive similar ratings from regulatory authorities in other countries, indicating that a pilot can be certified to fly an aircraft type based solely on simulator training. Flight simulators also allow pilots to experience and learn emergency procedures that
cannot be practiced safely aboard the actual aircraft.
14

Flight simulation equipment is purchased by major and regional airlines, aircraft manufacturers and independent training providers. Simulators are manufactured by a limited number of
companies and are sold based on the criteria of product quality, customer support, delivery, supplier reputation, price and life cycle costs. Typical list prices for civil flight simulation equipment can range from up to US$1 million for sophisticated procedure trainers, from US$2 to US$5 million for an FTD and from US$11 to US$20 million for an FFS, assuming that OEM-supplied data, parts and equipment are included (where OEM data, parts and equipment are supplied by CAE’s customer the pricing will be significantly less).
CAE’s SP/C segment continues to lead the civil market in the sale of FFSs with more than 70% market share of competed civil sales . SP/C continues to invest in technology to improve our product offering in terms of cost, schedule, performance, and additional features that enhance safety and efficiency. Over the past year, CAE’s SP/C segment has continued demonstrating our industry leadership, as evidenced by:
● The launch of the CAE 7000XR Series FFS; an evolution of the industry benchmark;
● The launch of our CAE Tropos™-6000XR CAE’s next generation visual solution.
Simulation Products/Civil won $608.4 million of orders in FY2014, including contracts for 48 full-flight simulators.
3.2 Training & Services/Civil (“TS/C”) Provides business, commercial and helicopter aviation training for flight, cabin, maintenance and ground personnel and associated services We are the largest provider of commercial and helicopter aviation training services in the world and the second largest provider of business aviation training services. We lead the market in the high-growth emerging regions of China, India, the Middle East, South America and Southeast Asia. Through our broad global network of training centres, we serve all sectors of civil
aviation including general aviation, major and regional airlines, helicopter operators and business aviation. We currently operate 239 FFSs and provide aviation training and services in training centres located in more than 25 countries around the world, including simulation-based pilot training services, crew sourcing services and ab initio training. Among our thousands of customers, we have long-term training services agreements and joint ventures with more than 20 major airlines and aircraft operators around the world. We offer a comprehensive range of
training solutions and services, including curriculum development, training centre operations, pilot training, cabin crew training, aircraft maintenance technician training, e-Learning and courseware solutions, and consulting services. We are a leader in flight sciences, using flight data analysis to improve airline safety, maintenance, flight operations and training. CAE Oxford Aviation Academy is the largest ab initio flight school network in the world with ten flight academies and a capacity for training up to 2,000 cadets annually. CAE Parc Aviation is the world’s largest aviation personnel sourcing organization with approximately 1,100 pilots, maintenance crew and other aviation professionals currently on assignment with airlines, aircraft OEMs and
leasing company customers around the world .
CAE continues to expand our global network of strategically located training centres. CAE’s customers at the commercial aviation training centres include major, low-cost and regional airlines that elect to outsource some or all of the training of their pilots and other crew members using either our training instructors or their own. CAE’s training centres are also used by corporate
aviation customers who tend to use third-party training centres as their primary source for simulation training.
TS/C is continually looking for ways to deliver more value to our customers throughout CAE’s global network of training centres. For example, TS/C is continually developing new courseware and related training services to encourage customers to migrate from renting time on a CAE simulator (dry training) to accepting the training and curriculum provided by CAE instructors (wet
training). TS/C is also continuously looking at ways to ensure we are delivering the most cost-effective and competitive training service in the marketplace. This includes optimization of our network, which can include the sale, upgrade, relocation, retirement or introduction of simulators.
Training services is the largest and fastest growing market segment within the flight simulation industry. The training services market consists of sales of training equipment and the provision of facilities, tools, aircraft–specific pilot and maintenance training programs and courseware . Training is provided to pilots, technicians and cabin personnel from commercial and regional airlines, business aircraft operators as well as general aviation aircraft and helicopter operators. Today, approximately 40% of all training capacity around the world is owned and operated by large commercial airlines to provide training for their own pilots. Approximately 2/3 of these training facilities are located in North America and Europe. Commercial airlines also rely on
independent training providers to supplement their training programs. Smaller operators have traditionally outsourced their training to independent training providers or to the aircraft manufacturers. Most aircraft manufacturers are partnering with third-party training providers in order to expand their training infrastructure across the world, while some such as Boeing and Airbus have developed an in-house training division.
15

With the exception of fractional operators, the vast majority of business aircraft operators have very small fleets. As a result, these operators receive their entire training from aircraft
manufacturers or independent training providers.
TS/C has continued to invest in training and services for pilots, aircraft maintenance technicians and cabin crew members. We have also leveraged our core competencies and now provide a wider range of training and services. CAE remains dedicated to serving all segments of aviation on a global scale and this includes expanding our business training platforms within our five training hubs for business aircraft operators located in Europe, Middle East and the U.S. and by propelling our pilot and training services into emerging markets.
CAE’s expanding presence in civil flight training and services has been accelerated during the last fiscal year as follows:
New Programs and Products
− We introduced CAE Tropos™ 6000XR, the latest generation of our market-leading visual image generator for civil aviation training. The software provides a more immersive environment and an enhanced pilot training experience;
− We announced maintenance training on the new Dassault Falcon 2000 LXS and 2000S aircraft platforms, including EASy II and launched CAE RealCase Troubleshooting for the Dassault Falcon 7X, Falcon 900EX EASy, and Falcon 2000EX EASy models;
− We announced the introduction of the CAE 7000XR Series FFS, leveraging the latest advancements in technology and training capabilities and setting a new standard in level D FFSs. This latest evolution of CAE’s industry benchmark FFS is designed to optimize life-cycle costs for our customers and to address new and future training requirements
Expansions
− Our joint venture Emirates-CAE Flight Training (ECFT) inaugurated its second pilot training facility in Dubai, UAE;
− We added 35 new Piper airplanes to our CAE Oxford Aviation Academy fleet;
− ECFT announced that its dual configuration FFS for Bombardier Challenger 604 and Challenger 605 business jets has received certification from various countries and also announced that it will deploy a Bombardier Global 5000/6000 business jets FFS equipped with the Bombardier Vision flight deck, which is expected to enter into service at the end of 2014;
− We announced, with Bombardier, the expansion of the Authorised Training Partner (ATP) agreement in Europe with the addition of a Bombardier Challenger 605 aircraft FFS and the deployment of a new Bombardier Global 5000/6000 business jets FFS equipped with the Bombardier Vision flight deck in our Amsterdam training centre;
− We announced, with Aviation Performance Solutions (APS), an extension of our partnership to provide Upset Prevention and Recovery Training (UPRT) for business aircraft pilots in Europe. The program uses proven e-Learning web-based academics, in-aircraft practical skill development and FFS exercises and scenarios;
− We launched a new MPL training program with Tigerair. In support of this program, we announced that we will open an ab initio ground school training centre in Singapore;
− We commenced training at the CAE Simulation Training P.L. centre in Delhi, India. The training centre is a joint venture between CAE and Interglobe, parent company of IndiGo;
− We announced an agreement with Airbus Helicopters (formerly Eurocopter Group) to create an approved EC225 helicopter training centre in Norway featuring a Level D flight and mission simulator;
− We announced the addition of a fourth Dassault Falcon 7X FFS to our global training network. The simulator is expected to be ready for training in 2015;
− We deployed a Boeing 737 NG FFS to the Air France training centre located in Orly, France;
− We announced, with Dassault, an agreement naming CAE as the exclusive Dassault-Approved Training Provider for the newly-launched Dassault Falcon 5X long-range business jet.
16

3.3 SP/C and TS/C Market Trends and Outlook Market Trends and Outlook In commercial aviation, aircraft capacity and passenger traffic growth are primarily driven by gross domestic product (“ GDP ”). Over the past 20 years, air travel has grown at an average rate of 4.8% and the aerospace industry’s widely held expectation is that long-term average growth for air travel will be approximately 5% annually over the next two decades. The International Air
Transport Association (“ IATA ”) forecasts that by 2017 total passenger demand is expected to increase by 31%, representing 930 million more passengers compared to 2012. Growth rates are higher in the emerging markets than in large and established markets like Europe and the U.S. Continued growth in air travel and re-fleeting requirements have led to record commercial aircraft backlogs and OEM production rates.
In the business and helicopter aviation sector, demand for air travel is primarily driven by corporate profitability and general economic conditions. According to the U.S. Federal Aviation Administration (“ FAA ”), the number of business jet flights has increased by 3.4% in the past 12 months. The industry remains optimistic of further recovery and long-term growth in business aircraft travel, and consistent with this view, major business aircraft OEMs have announced new aircraft programs.
Consolidation of the industry continues as companies position themselves to capitalize on this robust commercial aerospace market
The following secular trends continue to form the basis of our civil market investment hypothesis:
− Expected long-term growth in air travel;
− Demand in emerging markets arising from secular growth and a need for infrastructure to support air travel;
− Aircraft backlogs and delivery rates;
− More efficient and technologically advanced aircraft platforms;
− Long-term demand and shortage of trained aviation professionals (pilots, maintenance, cabin crew).
Expected Long-Term Growth in Air Travel In calendar 2013, global passenger traffic increased by 5.2% compared to calendar 2012. For the first three months of calendar 2014, passenger traffic increased by 5.6% compared to the first three months of calendar 2013. Emerging markets outperformed; passenger traffic in the Middle East, Latin America, Asia/Pacific and Europe growing at 13.3%, 7.1%, 7.0% and 5.2%
respectively, while North America remained stable. The global commercial aircraft fleet increased by 4.0% from March 2013 to March 2014, growing in Asia/Pacific, the Middle East and Latin America by 8.4%, 7.8% and 5.7% respectively, increasing slightly in Europe and remaining stable in North America. Possible impediments to steady growth progression in air travel include major disruptions such as regional political instability, acts of terrorism, pandemics, natural disasters, sharp and sustained increases in fuel costs, major prolonged economic recessions or
other major world events.
Demand in Emerging Markets Arising from Secular Growth and a Need for Infrastructure to Support Air Travel Emerging markets such as China, Eastern Europe, the Indian sub-continent, the Middle East, South America and Southeast Asia are expected to continue experiencing higher air traffic growth over the long term versus mature markets such as North America and Western Europe.
Aircraft Backlogs and Delivery Rates Commercial aircraft OEMs continue to work through record backlog levels of over 12,000 aircraft. Our civil business relies mainly on the already in-service fleet to drive demand as approximately two thirds of our revenue is generated from training and services in support of the global fleet. Our product sales are driven mainly by aircraft deliveries coming from OEMs’production lines. Recent aircraft order intake remains strong, with North American airlines such as Air Canada and American Airlines and airlines in the emerging markets such as Etihad
Airways, Lion Air, VietJet Air and Air Costa leading the intake. We expect the continued high rate of aircraft deliveries to translate into continued high demand for training products and incremental demand for services.
More Efficient and Technologically Advanced Aircraft Platforms More efficient and technologically advanced aircraft platforms will drive the demand for new types of simulators and training programs. One of our strategic priorities is to partner with manufacturers to take an early position on these future programs. In recent years, we have signed contracts with Bombardier for the CSeries aircraft and the Global 7000/8000 aircraft, ATR for the ATR42/72-600 aircraft, Mitsubishi Aircraft Corporation for the MRJ aircraft, Airbus for the A350 XWB aircraft, Dassault for the Falcon 5X, AVIC for the Medium-Sized Transport aircraft
and COMAC for the C919 aircraft. These contracts allow us to leverage our modeling, simulation and training expertise to deliver training solutions, including CAE 7000 Series FFS and the
recently launched CAE 7000XR Series FFS, CAE Simfinity TM procedures trainers, comprehensive training programs and expansion of our network to meet airlines’ training needs. The demand for new and more efficient platforms is driven by better operational flexibility, reduced maintenance costs, reduced fuel costs and improved emissions and environmental footprints.
Airlines are actively seeking ways to reduce fuel costs and the operational risk against further fuel cost fluctuations, as well as ways to obtain benefits offered by new generation aircraft and propulsion technologies.
17

Business jet operators also demand high performance aircraft. Business aircraft OEMs have announced plans to introduce, or have already introduced, a variety of new aircraft models incorporating the latest technologies to enhance performance and operator benefits such as range, speed, comfort and the accessibility of business air travel. Some examples include
Bombardier’s Learjet 70, 75 and 85, Challenger 350 and Global 7000/8000, Embraer’s Legacy Series and Lineage 1000, Gulfstream’s G650, Cessna’s Citation M2 and Dassault’s Falcon 5X.
Deliveries of new-model aircraft are subject to program delays, which in turn affect the timing of FFS orders and deliveries.
Long-term Demand and Shortage of Trained Aviation Professionals (pilots, maintenance, cabin crew) .
Worldwide demand is expected to increase over the long term Growth in the civil aviation market has driven the demand for pilots, maintenance technicians and cabin crew worldwide, resulting in a shortage of qualified professionals in several markets, notably the faster growing emerging markets. Pilot supply constraints include aging crew demographics and fewer military pilots transferring to civil airlines.
New pilot certification processes require more simulation-based training Simulation-based pilot certification training is taking on a greater role internationally with the MPL, with stall and upset prevention and recovery training and with new Airline Transport Pilot (“ATP ”) requirements in the U.S. Indeed, the ICAO and various national and regional aviation regulatory agencies have published new regulatory requirements, standards and guidance on these specific topics.
MPL is an alternative training and licensing methodology which places more emphasis on simulation-based training to develop ab initio students into First Officers of airliners in a specific airline environment. On average, current MPL programs in the industry consist of one third of the training in actual aircraft and two thirds of the training in flight simulation training devices, versus traditional training for other licences that average 80% to 90% in actual aircraft. Today, there are approximately 50 nations that have MPL regulations in place and over 15 of these
nations already use these regulations with training providers and airlines. CAE has MPL programs in Asia and in Europe with various airlines. From a global industry perspective, MPL is producing promising results and over 800 MPL graduates are already flying successfully with their airline. As the MPL methodology continues to gain momentum, it will result in increased use of simulation-based training.
Finally, the FAA in the U.S. enacted its final set of rules on July 15 th , 2013 on new pilot certification and qualification requirements for air carrier operations, requiring pilots to obtain an ATP and Type Rating. As of August 2014, pilots applying for an ATP certificate will be required to complete practical requirements which call for more simulation-based training that includes adverse weather conditions, low energy states, stalls, upset prevention and recovery, and high altitude operations. We believe these new requirements will lead to an increase in demand for
training in simulators.
3.4 Simulation Products/Military (“SP/M”) Designs, manufactures and supplies advanced military training equipment and software tools for air forces, armies and navies
We are a world leader in the design and production of military flight simulation equipment. We offer solutions to help maintain and enhance our customers’ safety, efficiency, mission readiness and decision-making capabilities. We develop simulation equipment, training systems and software tools for a variety of military aircraft, including fast jets, helicopters, trainer aircraft, maritime patrol and tanker/transport aircraft. We also offer simulation-based solutions for land and naval forces, including a range of driver, gunnery and maintenance trainers for
tanks and armoured fighting vehicles (“ AFV ”s) as well as naval command team trainers and wargaming software. We have delivered simulation products and training systems to more than 50 defence operators in approximately 35 countries.
We offer the industry’s most comprehensive range of simulation products related to flight simulation. From desktop trainers to the highest fidelity full-mission simulators, we offer a broad
portfolio of simulation products. We have designed simulators for the greatest variety of helicopters, and are a recognized leader in developing simulators and training systems for transports, tankers, maritime patrol aircraft, lead-in fighter trainers, and combat aircraft. The company is recognized around the world as the leader in developing simulators for the legendary C-130 Hercules aircraft, including all the latest C-130J variants. We are currently developing training systems for military aircraft such as the MH-60S/R, CH-47, NH90, S-70, C-130, C-295, A400M,
C-5, KC-135, A330 Multi-Role Tanker Transport, P-8A, P-3C, M-346, Hawk, Eurofighter, PC-7 and T-6/AT-6 for global military customers. We have developed the CAE UAS Mission Trainer to provide an open, integrated UAS mission training capability for individual and team training with the ability to link to distributed mission operations.
18

Our simulation and training experience extends well beyond the air domain. For decades, CAE has provided a range of products and services related to training ground forces, including solutions for direct and indirect fire, close air support, forward observation, driver training and crew gunnery training. CAE’s command and staff training systems, such as the CAE GESI
constructive simulation system, is used extensively by armies to help develop the decision-making abilities of commanders in C4ISR environments. We are also responsible for the design, manufacture and delivery of full-scale, high-fidelity maintenance trainers as well as virtual desktop trainers for a range of variants of the Bradley Fighting Vehicle, Abrams tanks, and the High Mobility Artillery Rocket System (“ HIMARS ”) for the U.S. Army. In addition, we provide simulation-based solutions for naval forces, including tactical and wargaming software systems to
facilitate the conduct of realistic naval operations training.
New Programs and Products
− We signed a memorandum of understanding with Lockheed Martin as its preferred provider of Canadian F-35 training support, training systems integration, operations and maintenance should Canada select the F-35;
− We signed a memorandum of understanding with General Atomics Aeronautical Systems to pursue international opportunities for CAE to offer its simulation and training systems for the Predator family of remotely piloted aircraft;
− We delivered the latest generation CAE GESI command and staff training system, now operational at the German Army Combat Simulation Center located in Wildflecken, Germany;
− We assisted Ambulance Victoria in Brisbane, Australia with the launch of the Virtual Paramedic, a simulation-based training solution, to help prepare for mass casualty incidents;
− We signed a cooperation agreement to combine CAE’s GESI command and staff training system with Rolands & Associates Joint Theatre-Level Simulation into a new, federated constructive simulation solution called GlobalSim;
− We provided an Emergency Management Information System to the City of Ottawa that will improve multi-agency collaboration and enhance effective decision-making during emergency incidents;
− We are designing and manufacturing a UH-60L/M Black Hawk full-mission simulator to be used by the Mexican Federal Police;
− We are developing a UAS Mission Trainer representing the Predator remotely piloted aircraft for the Italian Air Force.
CAE remains committed to introducing new simulation products that enhance our reputation as a technology leader. A strategic priority for CAE is to continue to bring innovative products and
simulation-based solutions to market. For example, the CAE-developed Common Data Base (“ CDB ”), originally developed for the United States Special Operations Command, has now been adopted by various defence forces including the German Army, Turkish Air Force and Royal Canadian Air Force. The bottom line result is that with the CDB, the creation, modification and correlation of run-time databases is much faster, which makes using simulation for mission rehearsal exercises a real possibility.
Presagis, part of the SP/M segment, is a global leader providing commercial-off-the-shelf (“ COTS ”) modeling, simulation and embedded graphics solutions to the aerospace and defence markets, and is the only developer to deliver a unified COTS software portfolio based on open-standards. Presagis combines cutting-edge technology with innovative services to help customers streamline workflow, reduce project risks, create detailed models and complex simulations, in addition to developing DO-178B certifiable applications.
The military simulation equipment market is driven in part by the introduction of new aircraft platforms, upgrades and life extensions to existing aircraft and a shift to greater use of simulation in pilot training programs due to the high degree of realism and the significantly lower cost compared to live training. CAE expects to improve our lead-time, cost, quality and reputation for performance through continued operational improvements and R&D programs.
Military forces increasingly rely on sophisticated and interrelated weapons systems and equipment, computer systems, visual systems and other advanced technologies to operate in a broadening range of conditions and scenarios. Achieving a high state of operational readiness is a constant goal and challenge for militaries. Simulators enable military organizations to achieve their training and mission rehearsal goals while minimizing the physical use of expensive systems and equipment. In addition, the use of simulators helps to avoid injuries to
personnel and the loss of equipment due to training accidents. Simulators allow for the training of tasks and missions that cannot be practiced in the real world.
19

Flight simulators are used to train pilots to operate a variety of military aircraft including fighter jets, helicopters, transports, tankers and maritime patrol aircraft. Flight simulators permit the
crews of military aircraft to coordinate and improve their combat skills in a safe, cost-effective and realistic range of environments. The U.S. Air Force estimates that one hour in a simulator costs less than six minutes in an actual aircraft. The simulators enable pilots to realistically practice both offensive and defensive tactics, such as firing aircraft weapons systems and avoiding attack from enemy surface and air threats. The immersive environment provided by simulators allows pilots to train for highly demanding maneuvers and life threatening scenarios,
such as rotor failure, missile impact or the effects of exceptional turbulence.
Simulation-based training systems for the land, sea and public safety markets provide similar advantages. With the increasing complexity of land and sea systems equipment, including integrated C4ISR and sophisticated weapon systems, combined with defence forces facing budget pressures, there is a growing tendency toward an increased use of synthetic training for
tanks, armoured fighting vehicles and naval operations. This helps save wear and tear on the weapon system platforms, reduces live firing and track miles, and allows militaries to devote systems to operational requirements.
3.5 Training & Services/Military (“TS/M”) Supplies turnkey training services, support services, systems maintenance and integrated enterprise solutions
We provide turnkey training services, training systems integration expertise and training support services to global defence forces. We also provide a range of training support services such as contractor logistics support, maintenance services, classroom instruction and simulator training in over 80 sites around the world, a variety of modeling and simulation-based integrated enterprise solutions , and a range of in-service support solutions such as systems engineering and lifecycle management.
We are a fully capable training systems integrator with the ability to offer governments, defence forces and original equipment manufacturers (“ OEM ”s) across air, land and sea a comprehensive range of innovative training solutions designed to cost-effectively meet specific training requirements. We are flexible and have a wealth of experience operating and delivering training services across different business models, including government-owned, government-operated; government-owned, contractor-operated; or contractor-owned, contractor-
operated facilities. Our offerings include training needs analysis, instructional systems design, learning management information systems, purpose-built facilities, state-of-the-art synthetic training equipment, curriculum and courseware development, classroom and simulator instruction, maintenance and logistics support, lifecycle support and technology insertion, and financing alternatives.
Examples of our TS/M programs include the Medium Support Helicopter Aircrew Training Facility (“ MSHATF ”) at Royal Air Force (“ RAF ”) Benson in the U.K., the Operational Training Systems Provider (“ OTSP ”) program for the Canadian Forces, the KC-30A multi role tanker transport program for the RAAF, and the KC-135 Aircrew Training System for the United States Air Force (“ USAF ”) at 13 U.S. and international bases. We also provide a range of training support services such as contractor logistics support, maintenance services and simulator training
at over 80 sites around the world.
CAE also provides market-leading consulting and engineering services that leverage modeling and simulation technologies and expertise to develop software-based solutions for decision support and training in complex environments. CAE combines products, software tools and service delivery capabilities into a comprehensive, integrated solutions offering to help customers
improve operational efficiency, develop and maintain mission critical systems and provide software-based decision support and training solutions. CAE helps provide the guidance, expertise, products and engineering services required to help customers operate in critical and highly complex environments. We also provide systems integration, systems engineering and in-service support for operational platforms. We have a wealth of experience providing engineering information environments, fleet management services, lifecycle and integrated logistics, and other
support services designed to efficiently and cost-effectively operate and maintain operational weapon systems.
Expansions
− We commenced construction of the new CAE Brunei Multi-Purpose Training Centre (“ MPTC ”) in Rimba, Brunei Darussalam which is now entering the operational phase. We also announced jointly with the Government of Brunei that the CAE Brunei MPTC will establish an Emergency and Crisis Management Centre of Excellence to support disaster preparedness ;
− We are providing on-site training support services at the Army Aviation Training Centre in Queensland, Australia, following the acceptance into service of the world’s first Level D certified NH90 full-flight and mission simulator;
20

− We installed a CAE 5000 Series King Air 350 simulator at a new training facility in Sale, Australia and will now provide simulator services to the Royal Australian Air Force and Royal Australian Navy through 2018 under a contractor-owned, contractor-operated training program;
− We announced that our Rotorsim training centre in Sesto Calende, Italy, which is a joint venture with AgustaWestland, will expand with the addition of a CAE 3000 Series AW169 helicopter simulator;
− We announced that the world’s first CAE 3000 Series AW189 FFS was certified to Level D and is now ready for training at the Rotorsim training centre in Sesto Calende, Italy;
− We announced that Rotorsim will add a second CAE 3000 Series AW189 helicopter simulator to a new training location in Aberdeen, Scotland to support Bristow helicopters and other North Sea operators.
The TS/M group experiences fairly steady business revenue from our long-term training services and support services contracts.
Given finite defence budgets and resources, governments and defence forces are increasingly scrutinizing their expenditures. Outsourced or privatized training service delivery have demonstrated benefits such as cost-effectiveness, accelerated training delivery and allowing uniformed military personnel to focus on operational commitments. CAE continues to see a growing willingness from defence forces to use synthetic training to meet more and more of their training requirements, as well as increasing demand to use simulation for mission rehearsal.
While synthetic training will never completely replace live combat training, TS/M sees more militaries increasing the number of synthetic training hours as a complement to live training.
Governments show an ever-increasing interest in the efficiencies and service enhancement potential of outsourcing aspects of their military training and support services to the private sector. The openness of national markets to international entrants is always an issue, particularly in the sensitive field of national security. However, many countries have outsourced military training
and support services and have permitted foreign-controlled entities to deliver such services. The multinational approach adopted by some governments to equipment development and procurement has facilitated this evolution in the market for military services.
The industry has responded to this trend by adapting to a greater degree of cooperation in product and service development and provisioning. However, competition remains very vibrant,
subject to national security constraints in certain markets.
Traditionally, modeling and simulation has been used to support training. This specific application is well understood and employed by militaries and civilian agencies around the world. CAE also sees significant growth in taking the simulation out of the simulator and applying simulation across the program lifecycle, including support for analysis and operations. CAE employs
skilled and experienced professionals capable of helping our government and defence customers apply simulation to support analysis, training and operational decision-making. For example, synthetic environments can be developed to support research and development programs and be re-used and refined throughout the program lifecycle, supporting system design and testing, creating the training environments to prepare personnel to use those new systems, and providing the decision support tools necessary to support mission planning in operations.
3.6 SP/M and TS/M Market Trends and Outlook While the U.S. Bipartisan Budget Act for fiscal year 2014 has helped reduce the near-term impact of sequestration cuts and provided the U.S. Department of Defense with greater budget certainty over the current government fiscal year, the timing of contract awards will continue to be difficult to predict as the U.S. military services work to achieve the right balance in military
capacity, capabilities and readiness. This may impact our ability to grow revenue and income in the short term ; however, our view is that the impediment to growth is not the size of the market, but rather the timing of procurements . In Europe, force structure reductions and reduced future investment plans have narrowed the pipeline of new opportunities; however, we maintain a portfolio of recurring business for which we have sized our operations. While the United States and Europe still present modest challenges , we are seeing increased opportunities
originating from regions with growing defence budgets, like Asia and the Middle East where we have an established and growing presence. We also continue to bid on a solid pipeline of global opportunities . In addition, there are encouraging signs for our market specialization and we are confident that the use of simulation-based training will continue to increase in the future. The following trends continue to drive the use of our training centres, services and products in defence:
− Explicit desire of governments and defence forces to increase the use of modeling and simulation to mitigate budget pressures;
− Attractiveness of outsourcing of training and maintenance services;
− Need for synthetic training to conduct mission rehearsal, including joint and coalition forces training;
− Relationships with OEMs as their partner of choice for simulation and training;
21

− Use of modeling and simulation for analysis and decision support.
Explicit desire of governments and defence forces t o increase the use of modeling and simulation to mi tigate budget pressures
More defence forces and governments are adopting simulation in training programs because it improves training effectiveness, reduces operational demands on aircraft, lowers risk compared to operating actual weapon system platforms and significantly lowers costs. For example, the U.S. Air Force (USAF) is making more extensive use of simulation for KC-135 tanker boom operator training, which costs approximately $20,000 for a three-hour training mission in the actual aircraft, but only $1,000 for that same three-hour training mission in simulators. The higher
cost of live training and the desire to save aircraft for operational use are two factors prompting a greater adoption of simulation-based training. Unlike civil aviation, where the use of simulators for training is common practice, there are no regulatory requirements to train in simulators in the military and the nature of mission-focused training demands at least some live training; however, the balance of live and synthetic training is shifting more to simulation.
We have begun to see militaries plan for the increased use of simulation as part of the overall training curriculum. For example, the U.S. Navy reports the share of simulation-based training on some specific U.S. Navy aircraft platforms could rise close to 50% by 2020. Because of the cost associated with conducting live training exercises, most militaries expect to rebalance the mix of live, virtual and constructive (computer-based) training and shift more of the training curriculum to home station virtual and constructive simulation. For example, the U.S. Army is
planning to reduce the use of live training ranges and transfer some of this training to virtual and constructive simulation to reduce costs. This will ultimately create opportunities for simulation-based training centres, services and products. We view CAE as being part of the solution to achieving lower training costs while maintaining or improving readiness.
Attractiveness of outsourcing of training and maint enance services
Defence forces and governments continue to scrutinize expenditures to find ways to reduce costs and allow active-duty personnel to focus on operational requirements, which has an impact on defence budgets and resources. There has been a growing trend among defence forces to consider outsourcing a variety of training services and we expect this trend to continue. For example, during fiscal year 2014 we opened a new military training centre in Australia where the Australian Defence Forces will train their King Air 350 aircrews. This represents the first
simulator services contract that the Australian Defence Forces have signed as part of a contractor-owned/contractor-operated service delivery program. We believe governments will increasingly look to industry for the delivery of training services because they often can be delivered faster and more cost effectively.
Need for synthetic training to conduct mission rehe arsal, including joint and coalition forces trainin g
There is a growing trend among defence forces to use synthetic training to meet more of their mission training requirements. Simulation technology solutions enable defence customers to plan sophisticated missions and carry out full-mission rehearsals in a synthetic environment as a complement to traditional live training or mission preparation. Synthetic training offers militaries a
cost-effective way to provide realistic training for a wide variety of scenarios while ensuring they maintain a high state of readiness. Allies are cooperating and creating joint and coalition forces, which are driving the demand for networked training and operations. Training devices that can be networked to train different crews and allow for networked training across a range of platforms are increasingly important as the desire to conduct mission rehearsal exercises in a synthetic environment increases. We are actively promoting open, standard simulation
architectures, such as the Common Database (CDB), as well as new capabilities such as the CAE Dynamic Synthetic Environment (DSE), to better enable mission rehearsal and joint, networked training.
Relationships with OEMs as their partner of choice for simulation and training We partner with manufacturers in the defence and security market to strengthen relationships and position for future opportunities. OEMs have introduced new platforms and continue to upgrade and extend the life of existing platforms, which drives worldwide demand for simulators and training. For example, Boeing has developed the new P-8A maritime patrol aircraft, Airbus Military has sold and continues to market both the A330 MRTT and C295 globally, Lockheed Martin is successfully marketing variants of the C-130J Hercules transport aircraft and F-35
fighter, Alenia Aermacchi and BAE Systems are selling the M-346 and Hawk lead-in fighter trainers, and AgustaWestland is continuing to develop a range of helicopters such as the AW139, AW169 and AW189. We have established relationships with each of the OEMs on these platforms. We also signed a memorandum of understanding to pursue working with General Atomics Aeronautical Systems, the world’s leading manufacturer of unmanned aircraft systems, on offering training solutions for GA-ASI’s Predator family of remotely piloted aircraft, and during fiscal year 2014 sold a Predator unmanned aerial system (UAS) mission trainer to the Italian Air Force.
22

Use of modeling and simulation for analysis and dec ision support
Traditionally, modeling and simulation have been used to support training, but is now increasingly applied across the program lifecycle, including support for analysis and decision-making
operations. We see governments and defence forces looking to use simulation-based synthetic environments to support research and development programs, system design and testing, intelligence analysis, integration and exploitation, and to provide the decision support tools necessary to support mission planning in operations. As an example, we were recently contracted to establish a training centre and conduct emergency management training for the Brunei Ministry of Home Affairs and see further opportunities to develop integrated modeling and simulation
centres.
3.7 Military Contracts The majority of CAE’s contract revenue in our SP/M and TS/M segments result from contracts with militaries or government bodies performed under predominantly fixed-price contracts with only a small number of cost-plus contracts.
In most instances, under government regulations, certain costs, including certain financial costs, portions of R&D costs, representation expenses, certain types of legal expenses and certain
marketing expenses related to the preparation of bids and proposals, are not allowed for pricing purposes and calculation of contract reimbursement rates under flexibly-priced contracts. Governments also routinely regulate the methods under which costs are allocated to government contracts. CAE is subject to a variety of audits performed by government agencies. These include pre-award audits that are performed at the submission of a proposal to the government. The purpose of the pre-award audit is to determine the basis of the bid and provide the
information required for the relevant government to effectively negotiate the contract. During the performance of a contract the government has the right to request and to examine any labor charges, any material purchase, and any overhead changes to any contract that is active. Upon a contract’s completion, the government may perform a post-award audit of all aspects of contract performance to ensure that CAE has performed in accordance with the terms of the contract.
Government contracts are generally, by their terms, subject to termination by the government either for convenience or default by the contractor. Fixed-price contracts provide for payment
upon termination for items delivered to and accepted by the government and, if the termination is for convenience, for payment of fair compensation of work performed plus the costs of settling and paying claims by terminated subcontractors, other settlement expenses and a reasonable profit on the costs incurred. Cost-plus contracts generally provide that, upon termination, the contractor is entitled to reimbursement of its allowable costs and, if the termination is for convenience, a total fee proportionate to the percentage of the work completed under
the contract. If a contract termination is for default, however, typically:
• The contractor may be paid an amount agreed upon for completed and partially completed products and services accepted by the government ;
• The government may not be liable for the contractor’s costs with respect to unacceptable items, and may be entitled to repayment of advance payments and progress payments, if any, related to the termination portion of the contract; and
• The contractor may be liable for excess costs incurred by the government in procuring undelivered items from another source.
In addition to the right of the government to terminate, government contracts are often conditioned upon the continuing availability of appropriations. Consequently, at the outset of a major
program, such contracts are usually partially funded and additional monies are normally committed to the contract by the procuring agency only as appropriations are made for future fiscal years. Failure to obtain such appropriations normally results in termination of the contract and compensation to the contractor at less than the full value of the contract.
3.8 New Core Markets Healthcare Market Simulation-based training is one of the most effective ways to prepare healthcare practitioners to care for patients and respond to critical situations while reducing the overall risk to patients. Through acquisitions and partnerships with experts in healthcare, we are leveraging our experience and best practices in simulation-based aviation training to deliver innovative solutions to
improve the safety and efficiency of this industry. The healthcare simulation market is growing rapidly, with simulation centres becoming the standard in nursing and medical schools, while proprietary education is now using technology and simulation to compete with public institutions.
We are a leader in simulation-based technology for healthcare with more than 8,000 deliveries of patient, imaging and surgical simulators in medical schools, nursing schools, hospitals,
defence forces and other entities. We have offices located in Canada, the U.S., Hungary and Germany and a network of approximately 50 distributors in more than 50 countries.
23

We generate revenue in five main areas: patient simulators, surgical simulators, ultrasound simulators and task trainers, learning applications/courseware and centre management systems. Our patient simulators offer a high level of believability and life-like responses and teach students and practitioners to intervene with appropriate clinical measures. Our surgical simulators
incorporate haptic technology that allows students and practitioners to acquire skills and practice in performing minimally invasive procedures, including bronchoscopies, endoscopies and catheter-based procedures. Our ultrasound solutions utilize e-learning, ultrasound training models, mannequins and 3D animated displays that allow students and practitioners to become familiar with diagnostic bedside ultrasound and ultrasound-guided procedures. Our simulation learning applications can be embedded within hospital work environments or large teaching institutions, allowing remote delivery of content for self-guided learning and assessment. Our medical simulation centre solutions simplify the operations behind managing complex simulation,
assessment, recording and debriefing.
Market Trends and Outlook
The Healthcare simulation-based market is focused mainly on education, and is estimated upwards of $850 million. Of that, the largest share of the market is represented by the human patient simulation market, which is expected to grow in the double-digit range over the next five years. Our vision is for CAE Healthcare to lead in the broad adoption of simulation-based training solutions for healthcare practitioners to improve patient safety, reduce overall training cost and ultimately save more lives.
Medical simulators can help to reduce medical errors by fundamentally changing the competency assessment and training of healthcare practitioners, just as flight simulators revolutionized pilot certification and training decades ago. In addition to the 850,000 active physicians and 67,000 medical students, there are approximately 3 million nurses and 250,000 nursing students in the U.S. and 8.8 million physicians and 14.5 million nurses worldwide.
The demand for our products and services is driven by the:
− U se of patient simulators to improve training and patient safety;
− Increased adoption of minimally invasive surgery;
− Advances in imaging technology applications in healthcare;
− Increasing healthcare costs;
− Service provider shortages.
Use of patient simulators to improve training and p atient safety
Patient simulators are the most commonly used simulators in the healthcare education and training markets. Human patient simulation provides an opportunity to reduce medical errors by providing opportunities to train for high-risk, low-frequency events.
Increased adoption of minimally invasive surgery
Minimally-invasive surgery (“ MIS ”) is accomplished through small surgical incisions, specialized surgical instruments, and endoscopic or alternative surgical imaging. Due to the advantages of MIS, such as reduced patient trauma and shorter hospitalization periods, it has seen increased adoption in place of previously more invasive surgical procedures. Continuing advances in surgical technology and MIS techniques have established surgery as a leading driver for simulation technology training.
Advances in imaging technology applications in heal thcare
Regulatory reform, the development of affordable technology-driven products and growing industry awareness have advanced the integration of imaging technology into healthcare. Increasing patient awareness of alternative technologies and procedures has helped to pressure insurers and providers to implement advanced imaging technologies. Bedside
ultrasonography has become an invaluable tool in the management of critically ill patients. The hand-carried ultrasound (HCU) can immediately provide diagnostic information that is not accessible by a physical examination alone, provided that healthcare practitioners performing the examinations have adequate training.
Increase in healthcare costs
The growth and increasing cost of medical care is correlated to population growth and healthcare coverage expansion. Longer life expectancy and the baby boomer generation have generated significant demand for healthcare services. Widespread adoption of advanced medical technologies and services could translate into higher demand for training. Experts have demonstrated that medical simulation improves patient outcomes and reduces errors, which can help to mitigate the rate of increase in healthcare costs.
24

Service provider shortages
The World Health Organization has reported that there were 57 countries with critical shortages equivalent to a global deficit of 2.4 million doctors, nurses and midwives worldwide. As students graduate and move into clinical practice, there is a growing need among hospitals for on-boarding programs that transition
the new students to competent practitioner effectively and efficiently. Simulation is now moving from the academic setting into clinical practice to provide a safe environment for clinical training.
Mining market
We have customers in over 90 countries that are currently supported by our offices in Australia, Brazil, Canada, Chile, India, Kazakhstan, Mexico, Peru, South Africa, the U.S. and the U.K. We provide products and services for open pit and underground operations to mining organizations, from large diversified miners to junior miners and consultancies.
We generate revenue by delivering products and services across the mining value chain. Our software products are used for managing exploration and geological data, mine strategy, optimization, detailed design and scheduling for all mining methods and commodities. Our technical consulting team includes experienced geologists and mining engineers, servicing client needs such as managing exploration drilling programs, mining studies, resource evaluation, on-site technical services and business improvement projects. Our CAE Terra mining equipment
simulators leverage our experience in simulation to provide an unrivalled level of realism. Our simulators are integrated with a comprehensive student management system, lesson planning tools and interactive touch panel instructor station. Our training services include workforce development planning, training needs analysis, professional development in technical disciplines and the design and implementation of operator training curriculum. Our operator training courseware is designed for multiple delivery modes including self-paced e-learning, instructor-led
classroom training, procedural training and scenarios delivered in our high fidelity simulators.
Market trends and outlook
Our technology and services are used by customers to increase productivity and improve safety. The factors driving demand for our technology and services are:
− Health and safety priority;
− Declining grades and higher energy consumption resulting in increased cost of extraction;
− Cyclicality of commodity prices;
− Operations management and control.
Health and safety priority
Health and safety standards continue to be an area of focus for improvement through the use of technological advances and increased skills training to create a more highly skilled and better-
educated work force. Mining companies are focusing on automated equipment, remote control of operations and simulation-based training of the workforce as means to improve overall safety.
Declining grades and higher energy consumption resu lting in increased cost of extraction
In the last 30 years, the average grade of ore bodies has halved, while the waste removed to access the minerals has more than doubled, resulting in higher energy use and cost of
extraction. Given the volatility of mineral prices and energy costs, different approaches are needed. These will include the increased use of optimization tools, simulation and scenario analysis within the industry to maximize value and maintain the viability of current operations, while helping mining companies focus on maximizing metal recovery instead of simply maximizing throughput. We are actively involved in finding technology-based solutions for recovering metal using less energy. Our existing tools for optimization and scenario analysis help
mining organizations respond to changing prices and input costs in order to maximize the potential of their existing operations.
Cyclicality of commodity prices
Demand for commodities is highly correlated to economic cycles. This means that in addition to the increased cost of extraction, mining companies will usually experience pricing pressure
during economic contractions. This tends to result in a reduction in capital spending by mining companies and delays in procurements, which negatively affect the business prospects of the mining industry supply chain. However, this factor serves as another driver toward increased use of optimization tools, simulation and scenario analysis within the industry to maximize the efficiency of operations.
25

Operations management and control
With increasing scale and complexity of operations, mining companies are seeking solutions for the real time oversight, coordination, decision-making and remote control of fixed and mobile
assets. We are collaborating in global markets and providing mine operators with an opportunity to integrate our widely used mining systems with other operational management technologies.
4. RISK FACTORS We operate in several industry segments that have various risks and uncertainties. Management and the Board discuss the principal risks facing our business, particularly during the annual
strategic planning and budgeting processes. The risks and uncertainties described below are risks that could materially affect our business, financial condition and results of operation. These risks are categorized as industry-related risks, risks specific to CAE and risks related to the current market environment. These are not necessarily the only risks we face; additional risks and uncertainties that are presently unknown to us or that we may currently deem immaterial may adversely affect our business.
Management attempts to mitigate risks that may affect our future performance through a process of identifying, assessing, reporting and managing risks that are significant from a corporate
perspective .
4.1 Risks relating to the industry 4.1.1 Competition
We sell our simulation equipment and training services in highly competitive markets. New participants have emerged in recent years and the competitive environment has intensified as aerospace and defence companies position themselves to try to take greater market share by consolidating existing civil simulation companies and by developing their own internal
capabilities. Most recently, Textron, Lockheed Martin and L-3 Communications have acquired commercial aircraft simulator competitors. Most of our competitors in the simulation and training markets are also involved in other major segments of the aerospace and defence complex beyond simulation and training. As such, they are larger than we are, and may have greater financial, technical, marketing, manufacturing and distribution resources. In addition, our main competitors are either aircraft manufacturers, or have well-established relationships with, or are
important suppliers to, aircraft manufacturers, airlines and governments, which may give them an advantage when competing for projects for these organizations. In particular, we face competition from Boeing, which has pricing and other competitive advantages over us. Boeing has a licencing model for Boeing civil aircraft simulators which includes a requirement for simulator manufacturers and service training operators to pay Boeing a royalty to manufacture, update or upgrade a simulator, and to provide training services on Boeing simulators.
Airbus has decided to deepen its services offered to customers for training services. OEMs like Airbus and Boeing have certain advantages in competing with independent training service providers. An OEM controls the pricing for the data, parts and equipment packages that are often required to manufacture a simulator specific to that OEM’s aircraft, which in turn is a critical capital cost for any simulation-based training service provider. OEMs may be in a position to demand licence royalties to permit the manufacturing of simulators based on the OEM’s aircraft,
and/or to permit any training on such simulators. CAE also has some advantages, including being a simulator manufacturer, having the ability to replicate certain aircraft without data, parts and equipment packages from an OEM, and owning a diversified training network that includes joint ventures with large airline operators which are aircraft customers for OEMs. We work with some OEMs on business opportunities related to equipment and training services.
We obtain most of our contracts through competitive bidding processes that subject us to the risk of spending a substantial amount of time and effort on proposals for contracts that may not be awarded to us. A significant portion of our revenue is dependent on obtaining new orders and continuously replenishing our backlog. We cannot be certain that we will continue to win contracts through competitive bidding processes at the same rate as we have in the past. The presence of new market participants as noted above, and their efforts to gain market share,
creates heightened competition in bidding which may negatively impact pricing and margins.
Economic growth underlies the demand for all of our products and services. Periods of economic recession, constrained credit, and or government austerity generally lead to heightened competition for each available order. This in turn typically leads to a reduction in profit on sales won during such a period. Should such conditions occur, we could experience price and margin erosion.
4.1.2 Level and timing of defence spending A significant portion of our revenue comes from sales to defence and security customers around the world. We are either the primary contractor or a subcontractor for various programs by Canadian, U.S., European, and other foreign governments. If funding for a government program is cut, we could lose future revenue, which could have a negative effect on our operations.
When countries we have contracts with significantly lower their military spending, there could be a material negative effect on our sales and earnings. In Europe, force structure reductions and reduced future investment plans have narrowed the pipeline of new opportunities . We are also experiencing longer and delayed procurement processes in mature markets, such as the U.S. and Canada, which impacts the timing of contract awards and results in delayed recognition of revenue.
26

4.1.3 Government-funded military programs Like most companies that supply products and services to governments, we can be audited and reviewed from time to time. Any adjustments that result from government audits and reviews
may have a negative effect on our results of operations. Some costs may not be reimbursed or allowed in negotiations of fixed-price contracts. As a result, we may also be subject to a higher risk of legal actions and liabilities than companies that cater only to the private sector, which could have a materially negative effect on our operations.
4.1.4 Civil aviation industry A significant portion of our revenue comes from supplying equipment and training services to the commercial and business airline industry.
If jet fuel prices attain high levels for a sustained period, there could be a greater impetus for airlines to replace older, less fuel-efficient aircraft. However, higher fuel costs could also limit the airlines’ available financial resources, and could potentially cause deliveries of new aircraft to be delayed or cancelled. Airlines may slow capacity growth or cut capacity should sustained high
fuel costs make the availability of such capacity not economically viable. Such a reaction would negatively affect the demand for our training equipment and services.
Constraints in the credit market may reduce the ability of airlines and others to purchase new aircraft, negatively affecting the demand for our training equipment and services, and the purchase of our products.
We are also exposed to credit risk on accounts receivable from our customers. We have adopted policies to ensure we are not significantly exposed to any individual customer. Our policies include analyzing the financial position of certain customers and regularly reviewing their credit quality. We also subscribe from time to time to credit insurance and, in some instances, require a bank letter of credit to secure our customers’ payments to us.
4.1.5 Regulatory rules imposed by aviation authorities We are required to comply with regulations imposed by aviation authorities. These regulations may change without notice, which could disrupt our sales and operations. Any changes imposed by a regulatory agency, including changes to safety standards imposed by aviation authorities such as the U.S. FAA, could mean that we have to make unplanned modifications to
our products and services, causing delays or resulting in cancelled sales. We cannot predict the impact that changing laws or regulations might have on our operations. Any changes could present opportunities or, to the contrary, have a materially negative effect on our results of operations or financial condition.
4.1.6 Sales or licences of certain CAE products require regulatory approvals and compliance The sale or licence of many of our products is subject to regulatory controls. These can prevent us from selling to certain countries, or to certain entities or people in a country, and require us to obtain from one or more governments an export licence or other approvals to sell certain technology such as military related simulators or other training equipment, including military data or parts. These regulations change often and we cannot be certain that we will be permitted to sell or licence certain products to customers, which could cause a potential loss of revenue for us.
If we fail to comply with government laws and regulations related to export controls and national security requirements, we could be fined and/or suspended or barred from government contracts or subcontracts for a period of time, which would negatively affect our revenue from operations and profitability, and could have a negative effect on our reputation and ability to procure other government contracts in the future.
4.1.7 Conflict minerals We are subject to rules of the Securities Exchange Commission (“ SEC ”) issued pursuant to the Dodd-Frank Wall Street Reform and Consumer Protection Act that require public companies to conduct due diligence on and disclose whether certain materials including gold, tantalum, tin and tungsten that originate from mines in the Democratic Republic of the Congo or certain adjoining countries, known as conflict minerals, are used in products that we manufacture. The first report was filed on May 21, 2014 for the 2013 calendar year and we have implemented
appropriate measures to comply with such requirements, including verifying with our suppliers the sources of their minerals. The implementation of these rules could adversely affect the sourcing, supply, and pricing of materials used in our products, although this has not proved to be the case to date. If we determine that certain of our products contain minerals not determined to be conflict free or if we are unable to sufficiently verify the origins for all conflict minerals used in our products, it could have a negative effect on our reputation.
27

4.2 Risks relating to the Company 4.2.1 Product evolution
The civil aviation and defence and security markets in which we operate are characterized by changes in customer requirements, new aircraft models and evolving industry standards. If we do not accurately predict the needs of our existing and prospective customers or develop product enhancements that address evolving standards and technologies, we may lose current customers and be unable to attract new customers. This could reduce our revenue. The evolution of the technology could also have a negative impact on the value of our fleet of FFSs.
4.2.2 Research and development activities We carry out some of our R&D initiatives with the financial support of governments, including the Government of Québec through Investissement Québec (“ IQ ”) and the Government of Canada through its Strategic Aerospace and Defence Initiative (“ SADI ”). In February 2014, CAE and the Government of Canada entered into a new SADI funding program for a five and a
half year period. The level of government financial support reflects government policy, fiscal policy and other political and economic factors. We may not, in the future, be able to replace these existing programs with other government funding and/or risk-sharing programs of comparable benefit to us, which could have a negative impact on our financial performance and research and development activities.
We receive investment tax credits on eligible R&D activities that we undertake in Canada from the federal government and investment tax credits on eligible R&D activities that we undertake in Québec from the provincial government. The credits we receive are based on federal and provincial legislation currently enacted. The investment tax credits available to us can be reduced by changes to the respective governments’ legislation which could have a negative impact on our financial performance and research and development activities.
4.2.3 Fixed-price and long-term supply contracts We provide our products and services mainly through fixed-price contracts that require us to absorb cost overruns, even though it can be difficult to estimate all of the costs associated with these contracts or to accurately project the level of sales we may ultimately achieve. In addition, a number of contracts to supply equipment and services to commercial airlines and defence
organizations are long-term agreements that run up to 20 years. While some of these contracts can be adjusted for increases in inflation and costs, the adjustments may not fully offset the increases, which could negatively affect the results of our operations.
4.2.4 Procurement and OEM leverage We secure data, parts, equipment and many other inputs from a wide variety of OEMs, sub-contractors and other sources. We are not always able to find two or more sources for inputs that we require and in the case of specific aircraft simulators and other training equipment, significant inputs can only be sole sourced. We may therefore be vulnerable to delivery schedule delays, the financial condition of the sole-source suppliers and their willingness to deal with us. Within their corporate groups, some sole-source suppliers include businesses that compete
with parts of our business. This could lead to onerous licencing terms, high licence fees or even refusal to licence to us the data, parts and equipment packages that are often required to manufacture and operate for training, a simulator based on an OEM’s aircraft.
4.2.5 Warranty or other product-related claims We manufacture simulators that are highly complex and sophisticated. These may contain defects that are difficult to detect and correct. If our products fail to operate correctly or have errors, there could be warranty claims or we could lose customers. Correcting these defects could require significant capital investment. If a defective product is integrated into our customer’s equipment, we could face product liability claims based on damages to the customer’s equipment. Any claims, errors or failures could have a negative effect on our operating results and
business. We cannot be certain that our insurance coverage will be sufficient to cover one or more substantial claims.
28

4.2.6 Product integration and program management risk Our business could be negatively affected if our products do not successfully integrate or operate with other sophisticated software, hardware, computing and communications systems that
are also continually evolving. If we experience difficulties on a project or do not meet project milestones, we may have to devote more engineering and other resources than originally anticipated. While we believe we have recorded adequate provisions for risks of losses on fixed-price contracts, it is possible that fixed-price and long-term supply contracts could subject us to additional losses that exceed obligations under the terms of the contracts.
4.2.7 Protection of intellectual property We rely in part on trade secrets and contractual restrictions, such as confidentiality agreements, patents and licences, to establish and protect our proprietary rights. These may not be effective in preventing a misuse of our technology or in deterring others from developing similar technologies. We may be limited in our ability to acquire or enforce our intellectual property
rights in some countries. Litigation related to our intellectual property rights could be lengthy and costly and could negatively affect our operations or financial results, whether or not we are successful in defending a claim.
4.2.8 Intellectual property Our products contain sophisticated software and computer systems that are supplied to us by third parties. These may not always be available to us. Our production of simulators often depends on receiving confidential or proprietary data on the functions, design and performance of a product or system that our simulators are intended to simulate. We may not be able to obtain this data on reasonable terms, or at all.
Infringement claims could be brought against us or against our customers. We may not be successful in defending these claims and we may not be able to develop processes that do not infringe on the rights of third parties, or obtain licences on terms that are commercially acceptable, if at all.
Certain markets in which we operate, including without limitation the healthcare market, are subject to extensive patenting by third parties. Our ability to modify existing products or to develop
new products may be constrained by third party patents such that we incur incremental costs to licence the use of the patent or design around the claims made therein.
4.2.9 Key personnel Our continued success will depend in part on our ability to retain and attract key personnel with the relevant skills, expertise and experience. Our compensation policy is designed to mitigate
this risk.
4.2.10 Environmental liabilities We use, generate, store, handle and dispose of hazardous materials at our operations, and used to at some of our discontinued or sold operations. Past operators at some of our sites also
carried out these activities.
New laws and regulations, stricter enforcement of existing laws and regulations, the discovery of previously unknown contamination, new clean-up requirements or claims on environmental indemnities we have given may result in us having to incur substantial costs. This could have a materially negative effect on our financial condition and results of operations.
In addition, our discontinued operations are largely uninsured against such claims, so an unexpectedly large environmental claim against a discontinued operation could reduce our profitability in the future.
4.2.11 Liability claims arising from casualty losses Because of the nature of our business, we may be subject to liability claims, including claims for serious personal injury or death, arising from:
− Accidents or disasters involving training equipment that we have sold or aircraft for which we have provided training equipment or services;
− Our pilot provisioning;
− Our live flight training operations.
We may also be subject to product liability claims relating to equipment and services that our discontinued operations sold in the past. We cannot be certain that our insurance coverage will be sufficient to cover one or more substantial claims.
29

4.2.12 Integration of acquired businesses The success of our acquisitions depends on our ability to crystallize synergies both in terms of successfully marketing our broadened product offering as well as efficiently consolidating the
operations of the acquired businesses into our existing operations.
4.2.13 Our ability to penetrate new markets We are leveraging our knowledge, experience and best practices in simulation-based aviation training and optimization to penetrate the simulation-based training markets in healthcare and
mining.
As we operate in these markets, unforeseen difficulties and expenditures could arise, which may have an adverse effect on our operations, profitability and reputation. Penetrating new markets is inherently more difficult than managing within our already
established core markets.
4.2.14 Enterprise resource planning (ERP) Following the successful implementation of the Canadian manufacturing portion of the ERP system in fiscal 2013, we continue to invest time and money in the next phases. If the system
does not operate as expected or when expected, we may not be able to realize the expected value of the system and this may have a negative effect on our operations, reporting capabilities, profitability and reputation. A governance process has been designed to mitigate this risk.
4.2.15 Length of sales cycle The sales cycle for our products and services is long and unpredictable, ranging from 6 to 18 months for civil aviation applications and from 6 to 24 months or longer for military applications. During the time when customers are evaluating our products and services, we may incur expenses and management time. Making these expenditures in a period that has no corresponding revenue will affect our operating results and could increase the volatility of our share price. We may pre-build certain products in anticipation of orders to come and to facilitate a faster delivery
schedule to gain competitive advantage; if orders for those products do not materialize when expected, we have to carry the pre-built product in inventory for a period of time until a sale is realized.
4.2.16 Security and information technology We depend on information technology networks and systems to process, transmit and store electronic data and financial information, to manage business operations and to comply with regulatory, legal, national security, contractual and tax requirements. In addition, our business requires the appropriate and secure utilization of sensitive and confidential information belonging to third parties such as aircraft OEMs and national defence forces. An information technology system failure, cyber-attack or breach of systems security could disrupt our
operations, cause the loss of, or unauthorized access to, business information, compromise confidential information, expose us to regulatory investigation and litigation, require significant management attention and resources and could materially and adversely affect our operations, reputation and financial performance. We have implemented security controls, policy enforcement mechanisms and monitoring systems in order to prevent, detect and address potential threats.
4.3 Risks relating to the Market 4.3.1 Foreign exchange
Our operations are global with approximately 90% of our revenue generated from worldwide exports and international activities generally denominated in foreign currencies, mainly the U.S. dollar, the Euro and the British pound. Our revenue is generated approximately one-third in each of the U.S, Europe and the rest of the world.
A significant portion of the revenue generated in Canada is in foreign currencies, while a large portion of our operating costs in Canadian dollars. When the Canadian dollar increases in value, it negatively affects our foreign currency-denominated revenue and hence our financial results. We continue to hold a portfolio of currency hedging positions intended to mitigate the risk to a portion of future revenues presented by the volatility of the Canadian dollar versus foreign currencies. The hedges are intended to cover a portion of the revenue in order to allow the
unhedged portion to match the foreign cost component of the contract. It is not possible to completely offset the effects of changing foreign currency values, which leaves some residual exposure that may impact our financial results. When the Canadian dollar decreases in value, it negatively affects our foreign currency-denominated costs and our competitive position compared to other equipment manufacturers in jurisdictions where operating costs are lower. In order to reduce the variability of specific U.S. dollar and Euro-denominated manufacturing
costs, we also hedge some of the foreign currency costs incurred in our manufacturing process.
30

Business conducted through our foreign operations is substantially based in local currencies. A natural hedge exists by virtue of revenues and operating expenses being in like currencies. However, changes in the value of foreign currencies relative to the Canadian dollar create unhedged currency translation exposure since results are consolidated in Canadian dollars for
financial reporting purposes. Devaluation of foreign currencies against the Canadian dollar would have a negative translation impact and an appreciation of foreign currencies against the Canadian dollar would have the opposite effect.
4.3.2 Availability of capital Our main credit facility, which was extended in October 2013, is scheduled for renewal in October 2018. We cannot determine at this time whether the credit facility will be renewed at the same cost, for the same duration and on similar terms as were previously available.
We also have various debt facilities with maturities until October 2036. We cannot determine at this time whether these facilities will be refinanced at the same cost, for the same durations
and on similar terms as were previously available.
4.3.3 Pension plans We sponsor pension plans for employees in many of our locations. Where plans of a defined benefit nature are provided, funding is based on actuarial estimates and is subject to limitations
under applicable income tax and other regulations. Actuarial estimates prepared during the year were based on several assumptions, amongst which anticipated long-term rate of return on pension plan assets, anticipated mortality experience and projected increases in employee compensation levels. We rely on actuarial funding valuation reports to determine the amount of cash contributions that we are required to contribute to these plans. Where necessary, CAE may be required to make additional contributions to fund plans which are in a deficit position, thus
reducing the availability of funds for other corporate purposes.
4.3.4 Doing business in foreign countries We have operations in 35 countries and sell our products and services to customers around the world. Sales to customers outside North America made up approximately 60% of revenue in
fiscal 2014. We expect sales outside North America to continue to represent a significant portion of revenue in the foreseeable future. As a result, we are subject to the risks of doing business internationally, including geopolitical instability.
These are the main risks we are facing:
− Change in laws and regulations;
− Tariffs, embargoes, controls and other restrictions;
− General changes in economic and geopolitical conditions;
− Complexity and corruption risks of using foreign representatives and consultants.
4.3.5 Income tax laws A substantial portion of our business is conducted in foreign countries and is thereby subject to numerous countries’ tax laws and fiscal policies. A change in applicable tax laws, treaties or regulations or their interpretation could result in a higher effective tax rate on our earnings which could be significant to our financial results.
5. DIVIDENDS We paid a dividend of $0.05 per share in the first and second quarter and $0.06 per share in the third and fourth quarter of fiscal 2014. These dividends were eligible under the Income Tax Act (Canada) and its provincial equivalents.
Our Board of Directors has the discretion to set the amount and timing of any dividend. The Board reviews the dividend policy once a year based on the cash requirements of our operating activities, liquidity requirements and projected financial position. We expect to declare dividends of approximately $63.3 million in fiscal 2015 based on our current dividend policy and the number of common shares outstanding as at March 31, 2014.
CAE’s Dividend Reinvestment Plan provides that Canadian resident shareholders can elect to receive Common Share dividends in lieu of cash dividends. Currently, CAE offers a 2% discount on shares acquired through the Dividend Reinvestment Plan; this is subject to change and the plan terms should be consulted. During fiscal 2012, 2013 and 2014, CAE issued 762,041, 1,228,831 and 1,403,418 common shares, respectively, as stock dividends.
31

6. DESCRIPTION OF CAPITAL STRUCTURE Our authorized capital consists of an unlimited number of common shares without par value and an unlimited number of preferred shares without par value, issuable in series.
Each common share entitles the holder thereof to dividends if, as and when declared by our Directors, to one vote at all meetings of holders of common shares and to participate, pro rata, with the holders of common shares, in any distribution of our assets upon liquidation, dissolution or winding-up, subject to the prior rights of holders of shares ranking in priority to common shares.
As at the close of business on March 31, 2014 and May 31, 2014 respectively, 263,771,443 and 264,017,594 common shares were issued and outstanding. There are no preferred shares issued and outstanding.
7. MARKET FOR SECURITIES The outstanding common shares of CAE are listed and posted for trading on The Toronto Stock Exchange and on the New York Stock Exchange under the symbol CAE.
7.1 Trading Price and Volume
32
CAE Inc. TSX Share Price Information - FY2014
Month Min. Max. Total Volume April-13 9.82 10.99 14 321 827 May-13 10.50 11.44 17 357 762 June-13 10.24 11.00 10 348 390 July-13 10.88 12.02 15 426 990 August-13 10.92 11.94 8 199 709 September-13 10.99 11.75 8 339 924 October-13 10.96 12.24 17 866 233 November-13 11.55 12.54 9 413 714 December-13 11.81 13.81 12 714 613 January-14 13.33 14.99 13 867 264 February-14 13.75 15.27 15 967 258 March-14 14.36 15.54 12 503 925
NYSE Share Price Information - FY2014 Month Min. (USD) Max. (USD) Total Volume
April-13 9.60 10.86 411 665 May-13 10.24 11.25 1 471 693 June-13 9.72 10.58 620 147 July-13 10.32 11.53 504 056 August-13 10.41 11.55 312 225 September-13 10.67 11.38 299 270 October-13 10.58 11.71 903 614 November-13 11.04 11.91 528 577 December-13 11.10 13.29 596 626 January-14 12.53 13.65 684 257 February-14 12.43 13.77 683 990 March-14 13.00 13.99 671 324

8. DIRECTORS AND OFFICERS The Directors of CAE are elected at each annual meeting of shareholders and hold office until the next annual meeting of shareholders or until their successors are elected or appointed. The
names and municipalities of residence of the Directors and Officers of CAE as of the date hereof, the positions and offices held by them in CAE, their respective principal occupations for the last five years, and the year in which they became a Director are set forth below. More information concerning CAE’s Directors may be found in the Management Proxy Circular dated June 7, 2014, in connection with our Annual Meeting of Shareholders to be held on August 13, 2014. In addition to fulfilling all statutory requirements, the Board of Directors oversees and reviews:
(i) the strategic and operating plans and financial budgets and the performance against these objectives; (ii) the principal risks and the adequacy of the systems and procedures to manage these risks; (iii) the compensation and benefit policies; (iv) management development and succession planning; (v) business development initiatives; (vi) the communications policies and activities, including shareholder communications; (vii) the integrity of internal controls and management information systems; (viii) the monitoring of the corporate governance system; and (ix)
the performance of the President and Chief Executive Officer.
The Committees of the Board of Directors are the Audit Committee, the Corporate Governance Committee, the Human Resources Committee and the Executive Committee.
8.1 Name and Occupation DIRECTORS
Name and Municipality of Residence and Year First Became a Director
Principal Occupation
BRIAN E. BARENTS Andover, Kansas, USA (2005)
Brian E. Barents is a Director of several companies. A former Air National Guard Brigadier General and still an active pilot, Mr. Barents was the President, CEO and co - founder of Galaxy Aerospace Company, LP from 1997 to 2001 and before that President and CEO of Learjet, Inc. from 1989 to 1996. He is a past Chairman of the General Aviation Manufacturers Association. He currently serves on the boards of Kaman Corporation, Aerion Corporation and The NORDAM Group. Mr. Barents is a member of both the Human Resources Committee and the Corporate Governance Committee.
HON. MICHAEL M. FORTIER, PC Town of Mount Royal, Quebec, Canada ( 2010)
Michael M. Fortier joined RBC Capital Markets (RBCCM) as a Vice-Chairman in 2010. Prior to joining RBCCM, Mr. Fortier was a partner of Ogilvy Renault LLP (now Norton Rose Fulbright Canada LLP) and a Senior Advisor to Morgan Stanley in Canada. Between 2006 and 2008, Mr. Fortier held various positions in the Government of Canada, as Minister of Public Works and Government Services, Minister of International Trade and Minister responsible for Greater Montreal. Prior to that, Mr. Fortier was active in the investment banking industry, first as a Managing Director with Credit Suisse First Boston (1999-2004) and then as a Managing Director with TD Securities (2004-2006). Mr. Fortier also practiced law with Ogilvy Renault LLP from 1985 to 1999 in the areas of corporate finance and mergers and acquisitions. He was based in London, England for several years during this period. Mr. Fortier is a member of the Corporate Governance Committee.
PAUL GAGNÉ , CPA, CA Senneville, Quebec, Canada (2005)
Paul Gagné is a Director of various public and private companies. Mr. Gagné is the Chairman of Wajax Corporation and also serves on the Audit Committees of the boards of Ainsworth Lumber Co. Ltd. and Textron Inc. Mr. Gagné worked with Avenor Inc. from 1976 to 1997, last serving as its Chief Executive Officer. In 1998, he joined Kruger Inc., where he served as Consultant in Corporate Strategic Planning from 1998 to 2002. Mr. Gagné is a Chartered Professional Accountant. Mr. Gagné is Chairman of the Human Resources Committee and is a member of the Audit Committee.
JAMES F. HANKINSON , CPA, CA Toronto, Ontario, Canada (1995)
James F. Hankinson is a corporate Director. He was the President and Chief Executive Officer of Ontario Power Generation Inc. from 2005 until his retirement in 2009. He has broad management experience in energy, transportation, resource and manufacturing-based businesses. Mr. Hankinson is a Director of ENMAX Corporation, a private company. He served as President and Chief Executive Officer of New Brunswick Power Corporation from 1996 to 2002. In 1973, he joined Canadian Pacific Limited and served as President and Chief Operating Officer from 1990 to 1995. Mr. Hankinson is a Chartered Professional Accountant.
HON. JOHN P. MANLEY, P.C., O.C. Ottawa, Ontario, Canada (2008)
John Manley is President and Chief Executive Officer of the Canadian Council of Chief Executives (not-for-profit), a position he has held since 2010. He is also a director of the Canadian Imperial Bank of Commerce (CIBC) and Telus Corporation. From 2004 to 2009, he served as Counsel to McCarthy Tétrault LLP, a national law firm. Prior to that, Mr. Manley had a 16-year career in politics, serving as Deputy Prime Minister of Canada and Minister in the portfolios of Industry, Foreign Affairs and Finance. He obtained a Bachelor of Arts from Carleton University and a Juris Doctorate from the University of Ottawa, is a certified Chartered Director from McMaster University and holds honorary doctorates from the University of Toronto, University of Ottawa, Carleton University and University of Western Ontario. Mr. Manley chairs the Corporate Governance Committee and is a member of the Human Resources Committee.

33
MARC PARENT Lorraine, Quebec, Canada (2008 )
Marc Parent has been the CEO of CAE Inc. since October 2009. He joined the Corporation in February 2005 as Group President, Simulation Products, was appointed Group President, Simulation Products and Military Training & Services in May 2006, and then Executive Vice President and Chief Operating Officer in November 2008. Mr. Parent has over 30 years of experience in the aerospace industry. Before joining CAE, Mr. Parent held various positions with Canadair and within Bombardier Aerospace in Canada and the U.S. Mr. Parent is past Chairman of the Board of Directors of the Aerospace Industries Association of Canada (AIAC) and of Aéro Montreal (Quebec’s aerospace cluster). Mr. Parent graduated as an engineer from É cole Polytechnique, is a graduate of the Harvard Business School Advanced Management Program and holds an honourary doctorate from École Polytechnique.
GENERAL PETER J. SCHOOMAKER, USA (RET.) Tampa, Florida, USA (2009 )
General Schoomaker is a consultant on defense matters. He is a former four-star U.S. Army general who was recalled from retirement to active duty as the 35 th
Chief of Staff, Army and member of the U.S. Joint Chiefs of Staff from 2003 until 2007. Prior to his first retirement, he served as Commander-in-Chief, U.S. Special Operations Command from 1997 to 2000. He was the owner/President of Quiet Pros, Inc. (defense consulting) from 2000 to 2003. General Schoomaker spent over 35 years in a variety of command and staff assignments with both conventional and special operations forces. General Schoomaker is a Director of several public, private and non-profit companies, the Special Operations Warrior Foundation and was a Director of CAE USA Inc. (from November 2007 to February 2009). General Schoomaker is a member of both the Human Resources Committee and the Corporate Governance Committee.
ANDREW J. STEVENS Gloucestershire, UK (2013)
Andrew J. Stevens is a corporate Director based in the U.K who has operating experience globally in the aerospace and defence sector. Beginning with the Dowty Group, a leading British manufacturer of aircraft equipment (1976-94), Bowthorpe plc (1994-96), Messier-Dowty as Managing Director then Chief Operating Officer (1996-2000) , Rolls-Royce, where he served as Managing Director Defence Aerospace (2001-2003), and Cobham plc as a Board member where he served variously as Group Managing Director, Aerospace Systems, Chief Operating Officer and Chief Executive Officer. (2003-12). Mr. Stevens is a member of the Human Resources Committee and the Audit Committee.
K ATHARINE B. S TEVENSON Toronto, Ontario, Canada (2007)
Katharine B. Stevenson is a corporate Director who serves on a variety of corporate and not-for-profit boards. She was formerly the Treasurer of Nortel Networks C orporation. Prior to joining Nortel Networks C orporation , she was a Vice President of J.P. Morgan & Company, Inc. Ms. Stevenson serves as Director on the board of Canadian Imperial Bank of Commerce (CIBC) and on its Audit Committee. She is also a Director of Valeant Pharmaceuticals International, Inc., serving on its Audit & Risk Committee and Transactions & Finance Committee. She is a Director of Open Text Corporation and a member of its Audit Committee. The CAE Board has determined that such simultaneous service does not impair the ability of Ms. Stevenson to effectively serve on CAE’s Audit Committee. In addition, she served as the Chairperson of OSI Pharmaceuticals, Inc.’s Audit Committee until the sale of the company. Ms. Stevenson is a Governor and past Chair of The Bishop Strachan School and Vice Chairman of the Board of the University of Guelph (as well as Chair ofits Finance Committee). She is certified with the professional designation ICD.D granted by the Institute of Corporate Directors (ICD). Ms. Stevenson chairs the Audit Committee.
KATHLEEN E. WALSH BOSTON, MASSACHUSETTS, USA (2013)
Kathleen E. Walsh is currently CEO of Boston Medical Center, a non-profit 496-bed medical center in Boston, Massachusetts that employs more than 1,200 physicians and 1,500 nurses while also serving as the primary teaching affiliate of the Boston University School of Medicine. Previously she served as Executive Vice President and Chief Operating Officer of Brigham and Women's Hospital, Chief Operating Officer, Novartis Institutes for BioMedical Research for Novartis AG, various positions up to Senior Vice President, Medical Services and Cancer Center at the Massachusetts General Hospital, and previously with four other hospitals. Ms. Walsh is also on the boards of the Greater Boston Chamber Of Commerce, Emmanuel College, and the Advisory Board of the Clinical Center of the National Institutes of Health in Bethesda MD. Ms. Walsh is a member of the Audit Committee.

OFFICERS
1 Where the date 2009 appears, it signifies the beginning of the last five years and not necessarily the date upon which the individual commenced the relevant position or occupation.
The Directors and exevutive officers of CAE as a group as at the date hereof beneficially own, directly or indirectly, or exercise control or direction over 214,475 common shares which represent 0.08% of CAE's outstanding common shares.
8.2 Cease Trade Orders, Bankruptcies, Penalties or Sanc tions None of the Directors of CAE is, or within ten years prior hereto has been, subject to a cease trade or similar order except as set out below.
On May 3, 2012, while Mr. Barents was a Director thereof, Hawker Beechcraft Corporation filed voluntary petitions for reorganization under Chapter 11 of the United States Bankruptcy Code; that company exited Chapter 11 in February 2013 after which Mr. Barents left the Hawker Beechcraft Board of Directors.
34
Name and Municipality of Residence and Office held with CAE
Principal Occupation 1
NICK LEONTIDIS Ile-Bizard,Quebec, Canada
Group President, Civil Simulation Products, Training and Services of CAE; previously Executive Vice-President, Strategy and Business Development (2009 to 2013), Executive Vice President Sales, Marketing and Business Development - Civil Training and Services (2005-2009).
GENNARO (GENE) A. COLABATISTTO Baie d’Urfé, Quebec, Canada
Group President, Defence & Security of CAE, with CAE since 2012; formerly Senior Vice President, Program Development for the Intelligence, Surveillance and Reconnaissance Group at Science Applications International Corporation (2008 – 2012) and before that President of Olive Group North America.
ST É PHANE LEFEBVRE, CPA, CA Town of Mount-Royal, Quebec, Canada
Vice President, Finance and Chief Financial Officer, with CAE since 1997; formerly Vice President Finance, Military Simulation and Training (2005-2011). Mr. Lefebvre is a Chartered Professional Accountant.
HARTLAND J.A. PATERSON Westmount, Quebec, Canada
General Counsel, Chief Compliance Officer and Corporate Secretary, with CAE since 2001.
SONYA BRANCO, CPA, CA Montreal, Quebec, Canada
Vice President and Corporate Controller (2011 to present); formerly Director Planning and Forecasting (2008-2011) and prior to that, Associate Director Mergers and Acquisitions at BCE Inc. (2007-2008). Ms. Branco is a Chartered Professional Accountant.
BRUCE MCCONNELL, CPA, CA Beaconsfield, Quebec, Canada
Director Corporate Finance and Treasurer of CAE Inc (2012-present). Previously, Vice-President with Business Development Bank of Canada (2006-2012). Mr. McConnell is a Chartered Professional Accountant.
BERNARD CORMIER Wolfville, Nova Scotia, Canada
Vice-President, Human Resources since July 2010. Formerly Vice-President Human Resources at Home Depot Canada and Asia (2004-2008), and Vice-President Human Resources at Molson Inc. (2001-2004).

From May 31, 2004 until on or about June 21, 2005, certain Directors, senior officers and certain current and former employees of Nortel Networks Corporation (“ Nortel ”) and Nortel Networks Limited (“ NNL ”), including Mr. Manley as Director, were prohibited from trading in securities of Nortel and NNL pursuant to management cease trade orders issued by the Ontario
Securities Commission (“ OSC ”), the Autorité des marchés financiers (“ AMF ”) and certain other provincial securities regulators (collectively, the “ Regulators ”) in connection with the delay in the filing of certain of their financial statements. The Regulators issued a further management cease trade order on April 10, 2006 in connection with the delay in filing certain 2005 financial statements prohibiting certain Directors, senior officers and certain current and former employees, including Mr. Manley as Director, from trading in securities of Nortel and NNL.
Following the filing of the required financial statements, the OSC and AMF lifted such cease trade orders effective June 8, 2006 and June 9, 2006, respectively, following which the other Regulators lifted their cease trade orders.
Mr. Manley was a Director of Nortel and NNL when Nortel and NNL were granted creditor protection under the Companies’ Creditors Arrangement Act (“ CCAA ”) on January 14, 2009, and
under other similar bankruptcy legislation in the U.S. and other jurisdictions.
Mr. Gagné resigned as Director of Gemofor Inc., a privately held manufacturer of sawmill equipment, in November 2006. Within a year of his resignation Gemofor Inc. filed for bankruptcy. Also, Mr. Gagné was a Director of Fraser Papers Inc. (“ Fraser ”) from April 2004 through February 2011. In June 2009, Fraser initiated a court-supervised restructuring under the
Companies’ Creditors Arrangement Act (“ CCAA ”), and under other similar bankruptcy legislation in the U.S. As part of its restructuring, Fraser sold all of its productive assets and distributed the proceeds from the sale of those assets pursuant to a Consolidated Plan of Compromise and Arrangement which was approved by the courts in February 2011. Fraser’s common shares were suspended from trading on the TSX on June 23, 2009. On March 10, 2011, the OSC issued a cease trade order against Fraser.
9. TRANSFER AGENTS AND REGISTRARS CAE only has common shares issued. CAE’s transfer agent is Computershare Trust Company of Canada located at 100 University Avenue, 9 th Floor, Toronto, Ontario, M5J 2Y1.
10. AUDIT COMMITTEE 10.1 Mandate The mandate of CAE’s Audit Committee is as set out in Schedule B hereto.
10.2 Membership The members of CAE’s Board of Directors’ Audit Committee are:
Ms. Katharine B. Stevenson (chair) Mr. Paul Gagné Mr. Andrew J. Stevens Ms. Kathleen E. Walsh
Each of these members is independent and financially literate.
Ms. Stevenson has extensive financial and accounting experience, including from her services as Treasurer of Nortel Networks Corporation, as Vice President, Corporate Finance with J.P.
Morgan Chase & Co., a global financial services firm based primarily in New York, and as former chair of the Audit Committee of OSI Pharmaceuticals, Inc . She also serves on the Audit Committee of Open Text Corporation, the Audit & Risk Committee of Valeant Pharmaceuticals International Inc. and the Risk Management Committee of Canadian Imperial Bank of Commerce.
Mr. Gagné is a Chartered Professional Accountant. In addition to his current activities set out in the Directors’ table above, he also serves on the Audit Committees of the Boards of Directors
of Ainsworth Lumber Co. Ltd. and Textron Inc. and previously chaired CAE’s Audit Committee.
Mr. Stevens has extensive managerial experience within the aerospace sector. This managerial experience, set out in the Directors’ table above, has provided Mr. Stevens with significant insight into financial issues encountered by companies conducting business within the aerospace sector.
Ms. Walsh is currently the CEO of Boston Medical Center, which is one of the largest safety net hospitals in New England. Ms. Walsh has extensive financial and accounting knowledge gained from her managerial experience, which is outlined in the Directors’ table above.
35

11. APPROVAL OF SERVICES The Audit Committee is responsible for the appointment, compensation, retention and oversight of the work of CAE’s independent auditor. The Audit Committee must pre-approve any audit
and non-audit services performed by PricewaterhouseCoopers LLP (“ PwC ”), CAE’s auditor, or such services must be entered into pursuant to the policies and procedures established by the Committee. Pursuant to such policies the Audit Committee annually authorizes CAE and our affiliates to engage the auditor for specified permitted tax, financial advisory and other audit-related services up to specified fee levels. The Audit Committee has considered and concluded that the provision of these services by PwC is compatible with maintaining PwC’s
independence. The Audit Committee’s policy also identifies prohibited services that PwC is not to provide to CAE.
PwC has advised that they are independent with respect to CAE within the meaning of the Code of Ethics of the Ordre des comptables professionnels agréés du Québec
The following chart shows all fees paid to PwC by CAE and our subsidiaries in the most recent and prior fiscal year for the various categories of services (generic description only).
Audit fees are comprised of fees billed for professional services for the audit of CAE’s annual financial statements and services that are normally provided by PwC in connection with statutory
and regulatory filings, including the audit of the internal controls over financial reporting as required by the Sarbanes-Oxley legislation.
Audit-related fees are comprised of fees relating to work performed in connection with CAE’s acquisitions, translation and other miscellaneous accounting-related services .
Tax fees are related to tax compliance support.
12. ADDITIONAL INFORMATION Additional information, including Directors' and Officers' remuneration and indebtedness, principal holders of CAE's securities, options to purchase securities and interests of insiders in material transactions, where applicable, is contained in the Management Proxy Circular dated June 7, 2014, in connection with CAE's Annual Meeting of Shareholders to be held on August
13, 2014. Additional financial information, including comparative consolidated audited financial statements and MD&A, are provided in CAE’s Annual Report to the shareholders for the financial year ended March 31, 2013. A copy of such documents may be obtained from the Vice President, Global Communications or the Secretary of CAE upon request, or are available online at www.sedar.com, as well as CAE’s website at www.cae.com.
In addition, CAE will provide to any person or company, upon request to the Vice President, Global Communications or the Secretary of CAE, the documents specified below:
(a) When the securities of CAE are in the course of a distribution under a preliminary short form prospectus or a short form prospectus:
(i) one copy of CAE’s annual information form together with one copy of any document, or the pertinent pages of any document, incorporated by reference in such annual information
form;
(ii) one copy of CAE’s comparative financial statements for our most recently completed financial year together with the accompanying report of the auditors and one copy of CAE’s most recent interim financial statements for any period after the end of our most recently completed financial year;
(iii) one copy of the information circular in respect of our most recent annual meeting of shareholders that involved the election of Directors; and
36
FEE TYPE 2014 2013 ($ MILLIONS) 1. Audit services 3.2 2.9 2. Audit-related services 0.2 0.3 3. Tax services 0.9 0.6 Total 4.3 3.8

(iv) one copy of any other documents which are incorporated by reference into the preliminary short form prospectus or the short form prospectus and are not required to be provided under (i) to (iii) above; or
(b) At any other time, one copy of any other document referred to in clauses (i), (ii) and (iii) of paragraph (a) above, provided that CAE may require the payment of a reasonable charge if the request is made by a person or company who is not a security holder of CAE.
37

GLOSSARY For the purposes of this Annual Information Form, the following terms have the meanings set out below:
“AIF” means the Annual Information Form “Annual Report” means the Annual Report to Shareholders for the year ended March 31, 2014 “C4ISR” means Command, Control, Communications, Computers, Intelligence, Surveillance and Reconnaissance “CBCA” means the Canada Business Corporations Act “CCAA” means the Companies’ Creditors Arrangement Act “CE/CDB” means CAE’s Common Environment/Common Data Base “COMAC” means Commercial Aircraft Corporation of China, Ltd “Company” or “CAE” means CAE Inc. “Consolidated Financial Statements” means the Consolidated Financial Statements for the year ended March 31, 2014, and the notes thereto “FFS” means full-flight simulators “FMS” means full-mission simulators “FTD” means flight training devices “FTO” means a flight training organization “FY2014” means fiscal 2014 “HATSOFF” refers to CAE’s joint venture called the Helicopter Academy to Train by Simulation of Flying “HAL” refers to Hindustan Aeronautics Limited “ICAO” means the International Civil Aviation Organization “MD&A” means CAE’s Management’s Discussion and Analysis of Financial Condition and Results of Operations “MPL” means the CAE Multi-crew Pilot License “MSHATF” means CAE’s Medium Support Helicopter Aircrew Training Facility in the U.K. “ OEM ” means the original equipment manufacturer “OTSP” means Canada’s Operational Training Systems Provider program for flight and related training “PwC” means PricewaterhouseCoopers LLP “RAAF” means the Royal Australian Air Force “RPK” means revenue passenger kilometers “RSEU” means revenue simulator equivalent units “SADI” means Canada’s Strategic Aerospace and Defence Initiative “SP/C” means Simulation Products/Civil “SP/M” means Simulation Products/Military “TS/C” means Training & Services/Civil “TS/M” means Training & Services/Military “UAS” means unmanned aerial systems
38

SCHEDULE A – SUBSIDIARIES
Set forth below are the names of all the direct and indirect subsidiaries of CAE as at March 31, 2014. All companies are wholly owned except as noted.
Name of Subsidiary Jurisdiction of Incorporation
Canada 7320701 Canada Inc. .................................................................................................... Canada 8218765 Canada Inc. .................................................................................................... Canada CAE Flightscape Inc. ..................................................................................................... Ontario CAE Healthcare Canada Inc. ........................................................................................ Canada CAE International Holdings Limited .............................................................................. Canada CAE Machinery Ltd. ...................................................................................................... British Columbia CAE Mining Canada Inc. ............................................................................................... Canada CAE Mining Holdings Inc. ............................................................................................. Canada CAE Railway Ltd. .......................................................................................................... Canada CAE Services (Canada) Inc........................................................................................... Canada CAE Simulator Services Inc. ......................................................................................... Québec
CAE Wood Products G.P.
[1]
............................................................................................ Québec
Flight Simulator-Capital L.P. [2]
........................................................................................ Quebec
Flight Simulator Capital Management Inc...................................................................... Quebec Presagis Canada Inc. .................................................................................................... Canada United States
Advanced Medical Technologies, LLC. ......................................................................... Washington CAE (US) Inc. ................................................................................................................ Delaware CAE (US) LLC................................................................................................................ Delaware CAE Civil Aviation Training Solutions Inc....................................................................... Florida CAE Delaware Buyco Inc. Dela Delaware CAE Flight Solutions USA Inc. ...................................................................................... Delaware CAE Healthcare, Inc. ..................................................................................................... Delaware CAE Integrated Enterprise Solutions USA Inc. ............................................................. Delaware CAE Mining North America Inc. .................................................................................... Colorado CAE North East Training Inc.......................................................................................... Delaware CAE Oxford Aviation Academy Pheonix Inc. ................................................................ Arizona CAE SimuFlite Inc. ........................................................................................................ Texas CAE USA Inc. ................................................................................................................ Delaware Embraer CAE Training Services, LLC. (49%)................................................................ Delaware Engenuity Holdings (USA) Inc. ...................................................................................... Delaware GCAT Delaware LLC..................................................................................................... Delaware KVDB Flight Training Services, Inc. (49%).................................................................... Arizona Oxford Airline Training Center Inc. ................................................................................ Arizona Parc U.S. Inc. ................................................................................................................ Delaware Presagis USA Inc. ......................................................................................................... California Rotorsim USA LLC. (50%)............................................................................................. Delaware Europe
ARGE Rheinmetall Defence Electronics Gmbh/CAE Elektronik GmbH (50%) [3]
.............
Germany
Aviation Personnel Support Services Limited. .............................................................. Ireland Backairn Limited ............................................................................................................. United Kingdom CAE Aircrew Training Services plc (78%)...................................................................... United Kingdom CAE Aviation Training B.V............................................................................................. Netherlands CAE Beyss Grundstücksgesellschaft GmbH ................................................................ Germany CAE Center Amsterdam B.V.......................................................................................... Netherlands CAE Center Brussels N.V.............................................................................................. Belgium CAE Centre Copenhagen A/S ....................................................................................... Denmark CAE Centre Oslo AS. .................................................................................................... Norway CAE Centre Stockholm AB ........................................................................................... Sweden CAE Elektronik GmbH ................................................................................................... Germany CAE Engineering Korlátolt Felelısségő Társaság ........................................................ Hungary CAE Euroco S.à.r.l. ....................................................................................................... Luxembourg CAE Global Academy Évora, SA................................................................................... Portugal CAE Healthcare GmbH ................................................................................................. Germany CAE Healthcare KFT ..................................................................................................... Hungary CAE Holdings BV........................................................................................................... Netherlands CAE Holdings Limited.................................................................................................... United Kingdom CAE International Capital Management Hungary LLC................................................... Hungary CAE Investments S.àr.l.................................................................................................. Lu xembourg CAE Luxembourg Acquisition S.àr.l............................................................................... Luxembourg CAE Luxembourg Financing S. àr.l. ............................................................................... Luxembourg CAE Management Luxembourg S.àr.l........................................................................... Luxembourg CAE Mining Corporate Limited ...................................................................................... United Kingdom CAE Mining International Limited .................................................................................. United Kingdom CAE Mining Software Limite d ....................................................................................... United Kingdom CAE Oxford Aviation Academy Amsterdam B.V. ......................................................... Netherlands CAE Parc Aviation Jersey Limited ................................................................................ Jersey CAE Services GmbH...................................................................................................... Germany CAE Services Italia, S.r.l................................................................................................ Italy CAE Servicios Globales de Instrucción de Vuelo (España) S.L. .................................. Spain CAE STS Limited........................................................................................................... United Kingdom CAE Training & Services Brussels NV .......................................................................... Belgium CAE Training & Services UK Ltd. .................................................................................. United Kingdom CAE Training Aircraft B.V............................................................................................... Netherlands CAE Training Norway AS............................................................................................... Norway CAE (UK) plc.................................................................................................................. United Kingdom CAE Verwaltungsgesellschaft mbH............................................................................... Germany

[1] Partnership
[2] Partnership
[3] Partnership
[4] Partnership
39
CVS Leasing Limited (13.39%)...................................................................................... United Kingdom Embraer CAE Training Services (UK) Limited (49%)..................................................... United Kingdom Eurofighter Simulation Systems GmbH (12%) .............................................................. Germany GCAT Flight Academy Malta Limited ............................................................................ Malta Helicopter Training Media International GmbH (50%)................................................... Germany HFTS Helicopter Flight Training Services GmbH (25%)................................................ Germany Mineral Industries Computing Limited............................................................................ United Kingdom Oxford Aviation Academy (Oxford) Limited.................................................................... United Kingdom Oxford Aviation Academy Europe AB............................................................................ Sweden Oxford Aviation Academy European Holdings AB......................................................... Sweden Oxford Aviation Academy Finance Limited.................................................................... Ireland Oxford Aviation Academy Ireland Holdings Limited....................................................... Ireland Oxford Aviation Academy Latvia SIA............................................................................. Latvia Oxford Aviation Academy Norway Holdings AS............................................................. Norway Parc Aviation (UK) Limited............................................................................................. United Kingdom Parc Aviation Engineering Services Limited.................................................................. Ireland Parc Aviation International Limited................................................................................. Ireland Parc Aviation Limited..................................................................................................... Ireland Parc Aviation Services Limited....................................................................................... Isle of Man Parc Interim Limited....................................................................................................... Ireland Parc Selection Limited................................................................................................... Isle of Man Presagis Europe (S.A.) ................................................................................................. France Rotorsim s.r.l. (50%)...................................................................................................... Italy Servicios de Instrucción de Vuelo, S.L. (80%)............................................................... Spain Simubel N.V. (a CAE Aviation Training Company)........................................................ Belgium SIV Ops Training, S.L.................................................................................................... Spain
Other
Asian Aviation Centre of Excellence (Singapore) Pte Ltd.(50%) .................................. Singapore Asian Aviation Centre of Excellence Sdn. Bhd. (50%) .................................................. Malaysia CAE Aircraft Maintenance Pty Ltd. ................................................................................ Australia CAE Aviation Training Chile Limitada [4]
...........................................................................
Chile
CAE Aviation Training International Ltd......................................................................... Mauritius CAE Aviation Training Peru S.A. ................................................................................... Peru CAE Brunei Multi Purpose Training Center SDN BHD (60%)........................................ Brunei CAE Centre Hong Kong Limited.................................................................................... China CAE China Support Services Company Limited ........................................................... China CAE Datamine Peru S.A. .............................................................................................. Peru CAE Dubai LLC (49%)................................................................................................... Dubai CAE Flight & Simulator Services Sdn. Bhd. .................................................................. Malaysia CAE Flight and Simulator Services Korea Ltd............................................................... Korea CAE Flight Training (India) Private Limited (50%)......................................................... India CAE Flight Training Center Mexico, S.A. de C.V. ......................................................... Mexico CAE India Private Limited (76%).................................................................................... India CAE Integrated Enterprise Solutions Australia Pty Ltd.................................................. Australia CAE Japan Flight Training Inc. J Japan CAE Labuan Inc. ........................................................................................................... Malaysia CAE Melbourne Flight Training Pty Ltd.......................................................................... Australia CAE Middle East Holdings Limited (50%) ..................................................................... Dubai CAE Mining Africa (Pty) Ltd. ......................................................................................... South Africa CAE Mining Australia Pty Ltd. ....................................................................................... Australia CAE Mining Brasil Soluçoes em Tecnologia Ltda. ........................................................ Brazil CAE Mining Chile SA .................................................................................................... Chile CAE Mining Services Mexico, S.A. de C.V.................................................................... Mexico CAE New Zealand Pty Limited....................................................................................... New Zealand CAE Shanghai Company, Limited ................................................................................. Shanghai CAE Simulation Technologies Private Limited............................................................... India CAE Simulation Training Private Limited (25%) ............................................................. India CAE Singapore (S.E.A.) Pte Ltd. .................................................................................. Singapore CAE South America Flight Training do Brasil Ltda........................................................ Brazil CAE-LIDER Training Do Brasil Ltda. (50%)................................................................... Brazil China Southern West Australia Flying College Pty Ltd (47%)....................................... Australia Emirates-CAE Flight Training (L.L.C.) (49%)................................................................. Dubai Flight Training Device (Mauritius) Limited...................................................................... Mauritius GCAT Australia PTY Limited ......................................................................................... Australia HATSOFF Helicopter Training Private Limited (50%).................................................... India International Flight School (Mauritius) Ltd. .................................................................... Mauritius Kestrel Technologies Pte Ltd. ....................................................................................... Singapore National Flying Training Institute Private Limited (51%) ............................................... India Oxford Aviation Academy (Australia) Pty Ltd................................................................. Australia Oxford Aviation Academy Holdings Pty Ltd................................................................... Australia Parc Aviation Japan Limited........................................................................................... Japan Philippine Academy for Aviation Training, Inc. (40%).................................................... Philippines Rotorsim Australia Pty Ltd. ............................................................................................ Australia Sabena Flight Academy – Africa (34%) Came Cameroun Simulator Servicios Mexico, S.A. de C.V. ..................................................................... Mexico Zhuhai Free Trade Zone Xiang Yi Aviation Technology Company Limited................... China Zhuhai Xiang Yi Aviation Technology Company Limited (49%)..................................... China


DISCONTINUED OR INACTIVE
40
Name of Subsidiary Jurisdiction of Incorporation
BGT BioGraphic Technologies Inc................................................................................. Canada CAE Beteiligungsgesellschaft mbH................................................................................ Germany CAE Screenplates SA.................................................................................................... France GCAT Flight Academy Germany GmbH........................................................................ Germany ICCU Imaging Inc........................................................................................................... Canada Invertron Simulators plc................................................................................................. United Kingdom ISDAT Simulation SDN BHD (20%)............................................................................... Malaysia Oxford Aviation Academy Finco S.à r.l.......................................................................... Luxembourg Oxford Aviation Academy Luxembourg S.à r.l............................................................... Luxembourg Oxford Aviation Academy Luxembourg 2 S.à r.l............................................................ Luxembourg Oxford Aviation Academy Luxembourg 3 S.à r.l............................................................ Luxembourg Parc-CV Limited............................................................................................................. Ireland Parc Aviation Training Limited....................................................................................... Ireland Xtend Inc........................................................................................................................ Utah ZFB Zentrum für Flugsimulation Berlin GmbH (17%).................................................... Germany

SCHEDULE B – AUDIT COMMITTEE MANDATE
CAE INC.
MEMBERSHIP AND RESPONSIBILITIES OF
THE AUDIT COMMITTEE OF THE BOARD OF DIRECTORS
1. ROLE AND MEMBERSHIP The Audit Committee (the “ Committee ”) shall be a committee of the Board of Directors.
The Committee shall consist of three to five directors (one of whom shall be the Chairman of the Committee). All members of the Committee shall be independent directors, as determined by the Board taking into consideration applicable laws, regulations and other requirements and regulatory guidelines applicable to such determination. Each member shall annually certify to CAE Inc. (“ CAE ” or the “ Company ”) as to his or her independence, in form compliant with the standards of independence set out by regulatory authorities, stock exchanges and other applicable laws, regulations and requirements. Each member shall be able to read and understand financial statements (balance sheet, income statement, cash flow statement) that present a breadth and level of complexity of accounting issues that are generally comparable to the breadth and complexity of the issues that can reasonably be expected to be raised by CAE’s financial statements, or shall become able to do so within a reasonable period of time after joining the audit committee. One member shall qualify as a “financial expert” (as defined by applicable regulation) and therefore have past employment in finance, accounting or any other comparable experience or background providing financial expertise. The Committee composition, including the qualifications of its members, shall comply with the requirements of regulatory authorities, stock exchanges and other applicable laws, regulations and requirements, as such requirements may be amended from time to time.
The Chairman of the Committee and its members shall be elected annually by the Board of Directors following recommendation of the Governance Committee and the Chairman of the Board. If the designated Chairman of the Committee is unable to attend a Committee meeting, the other Committee members present shall elect a replacement Chairman for that meeting.
A majority of members of the Committee shall constitute a quorum.
2. RESPONSIBILITIES Work closely and cooperatively with such officers and employees of CAE, its auditors, and/or other appropriate advisors and with access to such information as the Committee considers to be necessary or advisable in order to perform its duties and responsibilities, as assigned by the Board of Directors, in the following areas:
3. REVIEW OF AUDITED FINANCIAL STATEMENTS 3.1 Review the annual audited consolidated financial statements and make specific recommendations to the Board of Directors. As part of this process the Committee should:
• Review the appropriateness of and any changes to the underlying accounting principles and practices.
• Review the appropriateness of estimates, judgments of choice and level of conservatism of accounting alternatives.
• Review annually with management, external and internal auditors the identification, assessment and resulting mitigation strategy for financial risks, and the input of the integrated risk assessment into the annual audit planning cyclewith subsequent quarterly updates by Chief Financial Officer of any material changes with respect to financial risk assessment. .
• Oversee the review by internal audit of the existence and effectiveness of CAE’s group-wide risk management program.
• Review the annual audited financial statements and actuarial valuation reports, if any, for the Supplementary Pension, Designated Executive Pension Plan, Employee Pension Plan, U.S. 401(K) Retirement Savings Plans and other material pension plans of the Company and its subsidiaries.
4. ENGAGEMENT OF EXTERNAL AUDITORS 4.1 Recommend to the Board of Directors the appointment of the external independent auditor, which shall be accountable to the Board and the audit committee as representatives of
the shareholders. 4.2 Review and approval of engagement letter. As part of this review the committee reviews and recommends to the Board of Directors for their approval the auditors’ fees for the annual
audit. The Committee is responsible for the oversight of the work of the Company’s auditor for the purpose of preparing or issuing an audit report or related work, and the auditor shall report directly to the Committee. The Committee shall pre-approve the engagement of the external auditors for the audit, any audit-related services, advice with respect to taxation matters and other permitted services and fees for such services, including approval processes for any such service that comply with the requirements of regulatory authorities, stock exchanges and other applicable laws, regulations and requirements, as amended from time to time.
4.3 Receipt of a written statement not less than annually from the external auditor describing in detail all relationships between the auditor and CAE that may impact the objectivity and independence of the auditor. Review annually with the Board of Directors the independence of the external auditors and either confirm to the Board of Directors that the external auditors are independent in accordance with applicable listing requirements, laws, regulations and other regulatory guidelines, or
41

recommend that the Board of Directors take appropriate action to satisfy itself of the external auditors’ independence. Review and approve CAE’s hiring policies regarding partners, employees and former partners and employees of the present and former external auditor of CAE.
5. REVIEW AND DISCUSSION WITH EXTERNAL AUDITORS 5.1 Review with the external auditors and management the annual external audit plans and agenda which would include objectives, scope, risks assessments, timing, materiality level
and fee estimate. 5.2 Request and review an annual report prepared by the external auditors of any significant recommendations to improve internal control over financial reporting and corresponding
management responses. 5.3 Request and review an annual report prepared by the external auditors regarding the auditor’s internal quality-control procedures, material issues raised by the most recent internal
quality-control review of the auditors, or by any inquiry or investigation by governmental or professional authorities, within the preceding 5 years, respecting one or more audits carried out by the auditors, and any steps taken to deal with any such issues.
5.4 Hold timely discussions with the external auditors regarding (i) critical accounting policies and practices, (ii) alternative treatments of financial information within generally accepted accounting principles related to material items discussed with management, ramifications thereof and treatment preferred by the external auditor, and (iii) other material written communication between the external auditor and management, including the management letter and schedule of unadjusted differences.
5.5 Meet to review and discuss with the external auditors the annual audited financial statements and quarterly financial statements, including disclosures in management discussion and analysis.
5.6 Meet separately, quarterly, with the external auditors (including the lead partner) . 5.7 Make specific and direct inquiry of the external auditors’ work relating to:
• Performance of management involved in the preparation of financial statements.
• Any restrictions on the scope of audit work.
• The level of cooperation received in the performance of the audit.
• The effectiveness of the work of internal audit.
• Any unresolved material differences of opinion or disputes between management and the external auditors, and be directly responsible for overseeing the resolution of disagreements between management and the external auditors regarding financial reporting.
• Any transactions or activities which may be illegal or unethical.
• Independence of the external auditor including the nature and fees of non-audit services performed by external audit firm and its affiliates.
• Any other matter so desired.
5.8 Provide evaluation and regular feedback to the external auditors . 6. REVIEW AND DISCUSSION WITH INTERNAL AUDITORS 6.1 Review the annual internal audit plan including assessment of audit risk, planned activities, level and nature of reporting, audit organization and annual budget. 6.2 Periodically review the adequacy and effectiveness of the Company’s disclosure controls and procedures and the Company’s internal control over financial reporting, including any
significant deficiencies and significant changes in internal controls. 6.3 Set and communicate to the director of internal audit high expectations and hold him/her and the department accountable for meeting them. Provide guidance on reported potential
management lapses and evaluate the status and implementation of recommendations. 6.4 Meet separately, regularly, with the director of internal audit. 6.5 Make specific and direct inquiry of the internal auditors’ work relating to:
• Any significant recommendations to improve financial, operational and compliance internal controls and corresponding management responses.
• The level of independence of internal audit.
• Any material disagreement with management or scope or restrictions encountered in the course of the function’s work.
• Any other matter so desired.
6.6 Discuss goals and evaluate the performance of the Director of Internal Audit. Oversee at least once every five years an
42

external review of the internal audit function . 7. REVIEW AND DISCUSSION WITH MANAGEMENT 7.1 Review and assess the adequacy and quality of organization, staffing and succession planning for accounting and financial responsibilities (including internal audit). 7.2 Review analyses prepared by management setting forth significant financial reporting issues and judgements made in connection with the preparation of the financial statements,
including analyses of the effect of alternative and/or new GAAP methods on the financial statements. 7.3 Discuss with management the annual audited financial statements and quarterly financial statements and the independent auditor, including CAE’s disclosures under Management’s
Discussion and Analysis of Financial Condition and Results of Operations (“ MD&A ”). 7.4 Review with management the annual performance of external and internal audit and respond to results thereof. 7.5 Review at least annually with management:
• Tax compliance;
• IT and Cyber-Security risks and controls; and
• Capital structure appropriateness and efficiency.
8. REVIEW AND DISCUSSION WITH THE HUMAN RESOURCES COMMITTEE 8.1 On request, provide support to the Human Resources Committee of the Board (“ HR Committee ”) regarding management incentives and related topics (including compensation and
appropriate use of corporate assets). 8.2 Support with the HR Committee in its assessment of the incentive structure and whether it contributes to increased fraud or other risks. 9. REVIEW OF PUBLIC DISCLOSURE DOCUMENTS 9.1 Review all material public documents relating to CAE’s financial performance, financial position or analyses thereon, including financial statements, MD&A, annual and interim
earnings press releases and the Annual Information Form (“ AIF ”), prior to their release. Review and monitor practices and procedures adopted by the Company to assure compliance with applicable listing requirements, laws, regulations and other rules, and where appropriate, make recommendations or reports thereon to the Board of Directors. Discuss CAE’s financial information and earnings guidance, if any, provided to analysts and rating agencies.
9.2 Review major issues regarding accounting principles and financial report presentations, including any significant changes in the accounting principles to be observed in the preparation of the accounts of the Company and its subsidiaries, or in their application; major issues as to the Company’s internal controls; and any special audit steps adopted in light of material control deficiencies.
9.3 Prepare/review such reports of the Committee as may be required by any applicable securities regulatory authority to be included in the Company’s management proxy circular or any other disclosure document of the Company.
9.4 The Committee shall review and approve the procedures set out in the Company’s Corporate Communications & Disclosure Policy and will annually verify that adequate procedures exist within the Company for the review of its disclosure of financial information derived from its financial statements.
10. ETHICAL AND LEGAL COMPLIANCE 10.1 Oversee, review, and annually update the Company’s code of business conduct and the company’s system to monitor compliance with and enforce this code. 10.2 Review, with the Company’s general counsel, legal compliance and legal matters that could have a significant impact on the Company’s financial statements. 11. OTHER RESPONSIBILITIES 11.1 The Board may refer from time to time such matters relating to the financial affairs and risk management of the Company as the Board may deem appropriate. 12. MEETINGS 12.1 The Committee shall meet at such times as deemed necessary by the Board or the Committee and shall report regularly to the Board. 13. ENGAGEMENT OF PROFESSIONAL SERVICES 13.1 The Committee is authorized to engage independent counsel, and other advisers, as it determines necessary to carry out its
43

44
duties. The Company shall provide for appropriate funding, as determined by the Committee, for such services. 14. HANDLING OF COMPLAINTS 14.1 The Committee shall maintain procedures for the receipt, retention and treatment of complaints received by the Company regarding accounting, internal accounting controls or
auditing matters, and the confidential, anonymous submission by employees of the Company of concerns regarding questionable accounting or auditing matters. 15. ANNUAL REVIEW 15.1 The Committee shall review and assess the adequacy of its mandate annually, report to the Board of Directors thereon and recommend to the Board of Directors (for approval) any
proposed changes to its processes, procedures and agendas, as well as this charter. 15.2 The Committee shall also perform an annual evaluation of the composition (including considering periodically rotating its members), independence and performance of the
Committee and shall report to the Chairman of the Governance Committee of the CAE Board of Directors thereon. 16. ORIENTATION AND CONTINUING EDUCATION 16.1 Identify and participate where appropriate or necessary in continuing audit committee education reading and/activities.

CAE INC. CONSOLIDATED FINANCIAL STATEMENTS
Management ’s Report on Internal Control Over Financial Reporti ng 1 Report of Independent Registered Public Accounting Firm 1 Consolidated Financial Statements Consolidated Statement of Financial Position 3 Consolidated Income Statement 4 Consolidated Statement of Comprehensive Income 5 Consolidated Statement of Changes in Equity 6 Consolidated Statement of Cash Flows 7 Notes to the Consolidated Financial Statements Note 1 – Nature of Operations and Summary of Significant Accounting Policies 8 Note 2 – Changes in Accounting Policies 19 Note 3 – Business Combinations 23 Note 4 – Accounts Receivable 23 Note 5 – Inventories 24 Note 6 – Property, Plant and Equipment 24 Note 7 – Intangible Assets 25 Note 8 – Other Assets 26 Note 9 – Accounts Payable and Accrued Liabilities 27 Note 10 – Contracts in Progress 27 Note 11 – Provisions 27 Note 12 – Debt Facilities 28 Note 13 – Government Assistance 30 Note 14 – Employee Benefits Obligations 31 Note 15 – Deferred Gains and Other Non-Current Liabilities 35 Note 16 – Income Taxes 35 Note 17 – Share Capital, Earnings per Share and Dividends 38 Note 18 – Accumulated Other Comprehensive Income (Loss) 39 Note 19 – Employee Compensation 39 Note 20 – Impairment of Non-Financial Assets 39 Note 21 – Other Gains – Net 40 Note 22 – Restructuring, Integration and Acquisition Costs 40 Note 23 – Finance Expense – Net 40 Note 24 – Share-Based Payments 41 Note 25 – Supplementary Cash Flows Information 45 Note 26 – Contingencies 45 Note 27 – Commitments 45 Note 28 – Capital Risk Management 46 Note 29 – Fair Value of Financial Instruments 47 Note 30 – Financial Risk Management 50 Note 31 – Operating Segments and Geographic Information 56 Note 32 – Related Party Relationships 58 Note 33 – Related Party Transactions 61

Consolidated Financial Statements Consolidated Financial Statements
Management’s Report on Internal Control Over Financial Reporting Management of CAE is responsible for establishing and maintaining adequate internal control over financial reporting (as defined in Rule 13a-15(f), 15d-15(f) under the Securities Exchange Act of 1934). CAE’s internal control over financial reporting is a process designed under the supervision of CAE’s President and Chief Executive Officer and Chief Financial Officer to provide reasonable assurance regarding the reliability of financial reporting and the preparation of the Company’s financial statements for external reporting purposes in accordance with Canadian generally accepted accounting principles . As of March 31, 2014, management conducted an assessment of the effectiveness of the Company’s internal control over the financial reporting based on the framework and criteria established in Internal Control – Integrated Framework issued by the Committee of Sponsoring Organizations of the Treadway Commission. Based on this assessment, management concluded that the Company’s internal control over financial reporting as of March 31, 2014 was effective. M. Parent S. Lefebvre President and Chief Executive Officer Vice-president, Finance and Chief Financial Officer Montreal (Canada) May 15, 2014
Report of Independent Registered Public Accounting Firm To the Shareholders of CAE Inc. We have audited the accompanying consolidated statement of financial position of CAE Inc. and its subsidiaries as of March 31, 2014 and March 31, 2013 and the related consolidated income statement, statement of comprehensive income, statement of changes in equity, and statement of cash flows for the years then ended. We also have audited CAE Inc. and its subsidiaries’ internal control over financial reporting as of March 31, 2014, based on criteria established in Internal Control - Integrated Framework (1992) issued by the Committee of Sponsoring Organizations of the Treadway Commission (COSO). Management is responsible for these consolidated financial statements, for maintaining effective internal control over financial reporting, and for its assessment of the effectiveness of internal control over financial reporting, included in the accompanying Management’s Report on Internal Control over Financial Reporting. Our responsibility is to express an opinion on these consolidated financial statements and an opinion on the company’s internal control over financial reporting based on our integrated audits . We conducted our audits in accordance with the standards of the Public Company Accounting Oversight Board (United States). Those standards require that we plan and perform the audit to obtain reasonable assurance about whether the consolidated financial statements are free of material misstatement and whether effective internal control over financial reporting was maintained in all material respects. Our audits of the consolidated financial statements included examining, on a test basis, evidence supporting the amounts and disclosures in the consolidated financial statements, assessing the accounting principles used and significant estimates made by management, and evaluating the overall consolidated financial statement presentation. Our audit of internal control over financial reporting included obtaining an understanding of internal control over financial reporting, assessing the risk that a material weakness exists, and testing and evaluating the design and operating effectiveness of internal control based on the assessed risk. Our audits also included performing such other procedures as we considered necessary in the circumstances. We believe that our audits provide a reasonable basis for our opinions. A company’s internal control over financial reporting is a process designed to provide reasonable assurance regarding the reliability of financial reporting and the preparation of financial statements for external purposes in accordance with generally accepted accounting principles. A company’s internal control over financial reporting includes those policies and procedures that: (i) pertain to the maintenance of records that, in reasonable detail, accurately and fairly reflect the transactions and dispositions of the assets of the company; (ii) provide reasonable assurance that transactions are recorded as necessary to permit preparation of financial statements in accordance with generally accepted accounting principles, and that receipts and expenditures of the company are being made only in accordance with authorizations of management and directors of the company; and (iii) provide reasonable assurance regarding prevention or timely detection of unauthorized acquisition, use, or disposition of the company’s assets that could have a material effect on the financial statements. Because of its inherent limitations, internal control over financial reporting may not prevent or detect misstatements. Also, projections of any evaluation of effectiveness to future periods are subject to the risk that controls may become inadequate because of changes in conditions, or that the degree of
compliance with the policies or procedures may deteriorate .
CAE Year-End Financial Results 2014 | 1

Consolidated Financial Statements In our opinion, the consolidated financial statements referred to above present fairly, in all material respects, the financial position of CAE Inc. and its subsidiaries as of March 31, 2014 and March 31, 2013 and the results of their operations and their cash flows for the years then ended in conformity with International Financial Reporting Standards as issued by the International Accounting Standards Board . Also, in our opinion, CAE Inc. and its subsidiaries maintained, in all material respects, effective internal control over financial reporting as of March 31, 2014, based on criteria established in Internal Control - Integrated Framework (1992) issued by COSO. As discussed in Note 2 – Changes in Accounting Policies to the financial statements, due to the adoption of IAS 19 – Employee benefits (revised 2011) and IFRS 11 - Joint arrangements, the company has changed its method of accounting for employee benefits obligation and investments in joint arrangements in the year ended March 31, 2014, which resulted in the inclusion of April 1, 2012 balance sheet.
1 Montreal, Qu ebec May 15, 2014
1 CPA auditor, CA, public accountancy permit No. A123498
2 | CAE Year-End Financial Results 2014

Consolidated Financial Statements
CAE Year-End Financial Results 2014 | 3
Consolidated Statement of Financial Position As at March 31 March 31 March 31 April 1 (amounts in millions of Canadian dollars) Notes 2014 2013 2012
Restated Restated Assets (Note 2) (Note 2)
Cash and cash equivalents $ 312.3 $ 260.0 $ 254.7
Accounts receivable 4 453.9 401.4 302.3
Contracts in progress : assets 10 256.4 265.6 259.8
Inventories 5 219.5 176.2 146.9
Prepayments 76.6 53.5 46.1
Income taxes recoverable 24.8 141.9 95.5
Derivative financial assets 29 7.3 9.0 10.3
Total current assets $ 1,350.8 $ 1,307.6 $ 1,115.6
Property, plant and equipment 6 1,341.2 1,142.8 993.2
Intangible assets 7 870.7 794.4 527.9
Investment in equity accounted investees 32 234.6 196.9 172.9
Deferred tax assets 16 31.8 31.3 16.9
Derivative financial assets 29 7.5 6.4 7.2
Other assets 8 400.1 211.9 195.2
Total assets $ 4,236.7 $ 3,691.3 $ 3,028.9
Liabilities and equity Accounts payable and accrued liabilities 9 $ 685.0 $ 644.2 $ 556.2
Provisions 11 28.6 49.0 21.6
Income taxes payable 8.3 10.0 9.4
Contracts in progress : liabilities 10 167.4 122.3 110.4
Current portion of long-term debt 12 50.6 70.6 119.3
Derivative financial liabilities 29 24.6 10.3 8.9
Total current liabilities $ 964.5 $ 906.4 $ 825.8
Provisions 11 6.4 7.9 5.5
Long-term debt 12 1,117.9 1,002.8 588.4
Royalty obligations 161.5 160.6 161.6
Employee benefits obligations 14 115.5 136.1 114.3
Deferred gains and other non-current liabilities 15 204.2 191.4 182.5
Deferred tax liabilities 16 166.1 129.9 90.0
Derivative financial liabilities 29 18.4 9.8 9.4
Total liabilities $ 2,754.5 $ 2,544.9 $ 1,977.5
Equity Share capital 17 $ 517.5 $ 471.7 $ 454.5
Contributed surplus 19.5 21.9 19.2
Accumulated other comprehensive income (loss) 18 129.5 (12.0) (6.0)
Retained earnings 775.1 633.0 563.4
Equity attributable to equity holders of the Company $ 1,441.6 $ 1,114.6 $ 1,031.1
Non-controlling interests 40.6 31.8 20.3
Total equity $ 1,482.2 $ 1,146.4 $ 1,051.4
Total liabilities and equity $ 4,236.7 $ 3,691.3 $ 3,028.9
The accompanying notes form an integral part of these Consolidated Financial Statements.

Consolidated Financial Statements
4 | CAE Year-End Financial Results 2014
Consolidated Income Statement Years ended March 31 (amounts in millions of Canadian dollars, except per share amounts) Notes 2014 2013
Restated (Note 2)
Revenue 31 $ 2,114.9 $ 2,035.2
Cost of sales 1,518.0 1,450.4
Gross profit $ 596.9 $ 584.8
Research and development expenses 68.4 60.1
Selling, general and administrative expenses 287.1 264.5
Other gains – net 21 (20.4) (22.4)
After tax share in profit of equity accounted investees 31 (30.0) (20.1)
Restructuring, integration and acquisition costs 22 - 68.7
Operating profit $ 291.8 $ 234.0
Finance income 23 (9.8) (9.4)
Finance expense 23 80.5 74.5
Finance expense – net $ 70.7 $ 65.1
Earnings before income taxes $ 221.1 $ 168.9
Income tax expense 16 30.0 28.2
Net income $ 191.1 $ 140.7
Attributable to: Equity holders of the Company $ 190.0 $ 137.7
Non-controlling interests 1.1 3.0
$ 191.1 $ 140.7
Earnings per share from continuing operations attributable to equity holders of the Company Basic and diluted 17 $ 0.73 $ 0.53
The accompanying notes form an integral part of these Consolidated Financial Statements.

Consolidated Financial Statements
(1) Fiscal 2014 include net losses of $20.0 million reclassified to revenue (2013 - net gains of $7.5 million) and net losses of $3.6 million reclassified to finance expense - net (2013 - net gains of
$0.8 million).
(2) Fiscal 2014 include net losses of $3.8 million reclassified to the related non-financial asset (2013 - net gains of $3.6 million).
(3) An estimated net amount of $31.9 million of losses is expected to be reclassified from other comprehensive income during the next 12 months. Future fluctuation in market rate (foreign exchange rate or interest rate) will impact the amount expected to be reclassified.
The accompanying notes form an integral part of these Consolidated Financial Statements.
CAE Year-End Financial Results 2014 | 5
Consolidated Statement of Comprehensive Income Years ended March 31 (amounts in millions of Canadian dollars) Notes 2014 2013
Restated (Note 2)
Net income $ 191.1 $ 140.7
Items that may be reclassified to net income Foreign currency translation Net currency translation difference on the translation of financial statements of foreign operations $ 184.8 $ 6.0
Net losses on certain long-term debt denominated in foreign currency and designated as hedges of net investments in foreign operations (37.5) (8.8)
Income taxes 16 (4.3) 0.7
Share in foreign currency translation difference of equity accounted investees 16.5 4.6
$ 159.5 $ 2.5
Net changes in cash flow hedges Effective portion of changes in fair value of cash flow hedges $ (49.1) $ (0.5)
Reclassification to income or to the related non-financial asset (1)(2)(3) 27.4 (11.9)
Income taxes 16 5.6 3.2
After tax share in net changes of cash flow hedges of equity accounted investees (0.9) 0.8
$ (17.0) $ (8.4)
Net change in available -for -sale financial instruments Net change in fair value of available-for-sale financial assets 29 $ 0.2 $ -
$ 0.2 $ -
Items that are never reclassified to net income Defined benefit plan remeasurements Defined benefit plan remeasurements 14 $ 13.4 $ (26.0)
Income taxes 16 (3.7) 7.1
$ 9.7 $ (18.9)
Other comprehensive income (loss) $ 152.4 $ (24.8)
Total comprehensive income $ 343.5 $ 115.9
Attributable to: Equity holders of the Company $ 341.2 $ 112.8
Non-controlling interests 2.3 3.1
$ 343.5 $ 115.9

Consolidated Financial Statements
6 | CAE Year-End Financial Results 2014
Consolidated Statement of Changes in Equity Attributable to equity holders of the Company
Year ended March 31, 2014 Common shares Accumulated other Non- (amounts in millions of Canadian dollars, Number of Stated Contributed comprehensive Retained controlling Total except number of shares) Notes shares value surplus income (Note 18) earnings Total interests equity Balances, beginning of year - restated 2 259,979,059 $ 471.7 $ 21.9 $ (12.0) $ 633.0 $ 1,114.6 $ 31.8 $ 1,146.4
Net income - - - - 190.0 190.0 1.1 191.1
Other comprehensive income (loss): Foreign currency translation - - - 158.3 - 158.3 1.2 159.5
Net changes in cash flow hedges - - - (17.0) - (17.0) - (17.0)
Net changes in available-for-sale financial instruments - - - 0.2 - 0.2 - 0.2
Defined benefit plan remeasurements - - - - 9.7 9.7 - 9.7
Total comprehensive income - $ - $ - $ 141.5 $ 199.7 $ 341.2 $ 2.3 $ 343.5
Stock options exercised 24 2,387,556 22.2 - - - 22.2 - 22.2
Optional cash purchase 1,410 - - - - - - -
Transfer upon exercise of stock options - 6.1 (6.1) - - - - -
Share-based payments 24 - - 3.7 - - 3.7 - 3.7
Additions to non-controlling interests - - - - - - 6.5 6.5
Stock dividends 17 1,403,418 17.5 - - (17.5) - - -
Cash dividends 17 - - - - (40.1) (40.1) - (40.1) Balances, end of year 263,771,443 $ 517.5 $ 19.5 $ 129.5 $ 775.1 $ 1,441.6 $ 40.6 $ 1,482.2
Attributable to equity holders of the Company Year ended March 31, 2013 Common shares Accumulated other Non- (amounts in millions of Canadian dollars, Number of Stated Contributed comprehensive Retained controlling Total except number of shares) Notes shares value surplus loss (Note 18) earnings Total interests equity Balances, beginning of year - restated 2 258,266,295 $ 454.5 $ 19.2 $ (6.0) $ 563.4 $ 1,031.1 $ 20.3 $ 1,051.4
Net income - - - - 137.7 137.7 3.0 140.7
Other comprehensive income (loss): Foreign currency translation - - - 2.4 - 2.4 0.1 2.5
Net changes in cash flow hedges - - - (8.4) - (8.4) - (8.4)
Defined benefit plan remeasurements - - - - (18.9) (18.9) - (18.9)
Total comprehensive income - $ - $ - $ (6.0) $ 118.8 $ 112.8 $ 3.1 $ 115.9
Stock options exercised 24 482,250 3.9 - - - 3.9 - 3.9
Optional cash purchase 1,683 - - - - - - -
Transfer upon exercise of stock options - 1.2 (1.2) - - - - -
Share-based payments 24 - - 3.9 - - 3.9 - 3.9
Additions to non-controlling interests - - - - - - 8.4 8.4
Stock dividends 17 1,228,831 12.1 - - (12.1) - - -
Cash dividends 17 - - - - (37.1) (37.1) - (37.1)
Balances, end of year - restated (Note 2) 259,979,059 $ 471.7 $ 21.9 $ (12.0) $ 633.0 $ 1,114.6 $ 31.8 $ 1,146.4 The total retained earnings and accumulated other comprehensive income (loss) for the year ended March 31, 2014 was $904.6 million (2013 – $621.0 million). The accompanying notes form an integral part of these Consolidated Financial Statements.

Consolidated Financial Statements
CAE Year-End Financial Results 2014 | 7
Consolidated Statement of Cash Flows Years ended March 31 (amounts in millions of Canadian dollars) Notes 2014 2013
Restated Operating activities (Note 2)
Net income $ 191.1 $ 140.7
Adjustments to reconcile net income to cash flows from operating activities: Depreciation of property, plant and equipment 6 99.5 93.9
Amortization of intangible and other assets 67.6 48.8
Financing cost amortization 23 1.5 1.6
After tax share in profit of equity accounted investees (30.0) (20.1)
Deferred income taxes 16 27.6 27.6
Investment tax credits (15.6) (22.6)
Share-based compensation 24 9.8 (4.2)
Defined benefit pension plans 14 (9.1) (4.6)
Amortization of other non-current liabilities (25.8) (15.4)
Other (11.8) (6.6)
Changes in non-cash working capital 25 (28.8) (84.6)
Net cash provided by operating activities $ 276.0 $ 154.5
Investing activities Business combinations, net of cash and cash equivalents acquired 3 $ (3.8) $ (285.3)
Capital expenditures for property, plant and equipment 6 (157.4) (96.7)
Proceeds from disposal of property, plant and equipment 15.4 9.2
Capitalized development costs 7 (48.1) (49.6)
Enterprise resource planning (ERP) and other software 7 (13.6) (19.2)
Net proceeds (payments) from equity accounted investees 4.2 (1.4)
Dividends received from equity accounted investees 15.0 11.9
Other (10.2) (2.6)
Net cash used in investing activities $ (198.5) $ (433.7)
Financing activities Net change in restricted cash $ (18.1) $ 0.9
Net effect of current financial assets program 30 - (37.1)
Proceeds from borrowing under revolving unsecured credit facilities 12 641.1 660.4
Repayment of borrowing under revolving unsecured credit facilities 12 (655.3) (606.4)
Proceeds from long-term debt, net of transaction costs 12 67.9 697.9
Repayment of long-term debt 12 (38.0) (360.4)
Repayment of finance lease 12 (27.8) (36.3)
Dividends paid (40.1) (37.1)
Common stock issuance 22.2 3.9
Other (0.5) (1.3)
Net cash (used in) provided by financing activities $ (48.6) $ 284.5
Effect of foreign exchange rate changes on cash and cash equivalents $ 23.4 $ -
Net increase in cash and cash equivalents 52.3 5.3
Cash and cash equivalents, beginning of period 260.0 254.7
Cash and cash equivalents, end of period $ 312.3 $ 260.0
Supplemental information: Dividends received $ 15.4 $ 13.1
Interest paid 55.7 1 47.0
Interest received 8.0 1 6.5
Income taxes paid 22.9 1 22.6
The accompanying notes form an integral part of these Consolidated Financial Statements.

Notes to the Consolidated Financial Statements Notes to the Consolidated Financial Statements (Unless otherwise stated, all amounts are in millions of Canadian dollars) The consolidated financial statements were authorized for issue by the board of directors on May 15, 2014. NOTE 1 – NATURE OF OPERATIONS AND SUMMARY OF SIGNIF ICANT ACCOUNTING POLICIES Nature of operations CAE Inc. and its subsidiaries (or the Company) design, manufacture and supply simulation equipment services and develop integrated training solutions for the military, commercial airlines, business aircraft operators, aircraft manufacturers, healthcare education and service providers and the mining industry. CAE’s flight simulators replicate aircraft performance in normal and abnormal operations as well as a comprehensive set of environmental conditions utilizing visual systems that contain an extensive database of airports, other landing areas, flying environments, motion and sound cues to create a fully immersive training environment. The Company offers a range of flight training devices based on the same software used on its simulators. The Company also operates a global network of training centres in locations around the world. The Company’s operations are managed through five segments: (i) Training & Services/Civil (TS/C) – Provides commercial, business and helicopter aviation training for flight, cabin, maintenance and ground personnel and ab initio pilot training and crew sourcing
services; (ii) Simulation Products/Civil (SP/C) – Designs, manufactures and supplies civil flight simulation training devices and visual systems; (iii) Simulation Products/Military (SP/M) – Designs, manufactures and supplies advanced military training equipment and software tools for air forces, armies and navies; (iv) Training & Services/Military (TS/M) – Supplies turnkey training services, simulation-based integrated enterprise solutions and maintenance and in-service support solutions; (v) New Core Markets (NCM) – Provides, designs and manufactures healthcare training services and devices and mining services and tools. CAE is a limited liability company incorporated and domiciled in Canada. The address of the main office is 8585 Côte-de-Liesse, Saint-Laurent, Québec, Canada, H4T 1G6. CAE shares are traded on the Toronto Stock Exchange and on the New York Stock Exchange. Basis of preparation The key accounting policies applied in the preparation of these consolidated financial statements are described below. These policies have been consistently applied to all years presented, unless otherwise stated. The consolidated financial statements have been prepared in accordance with Part I of the CPA Canada Handbook, referred to as IFRS, as issued by the International Accounting Standards Board (IASB). The consolidated financial statements have been prepared under the historical cost convention, except for the following items measured at fair value: contingent consideration, derivative financial instruments, financial instruments at fair value through profit and loss, available-for-sale financial assets and liabilities for cash-settled share-based arrangements. The functional and presentation currency of CAE Inc. is the Canadian dollar. Basis of consolidation Subsidiaries Subsidiaries are all entities over which the Company has control. Control exists when the Company is exposed to, or has the rights to, variable returns from its involvement with the entity and has the ability to affect those returns through the power over the entity. Subsidiaries are fully consolidated from the date control is obtained and they are no longer consolidated on the date control ceases. Joint arrangements Joint arrangements are entities in which the Company exercises joint control as established by contracts requiring unanimous consent for decisions about the activities that significantly affect the arrangement’s returns. When the Company has the rights to the net assets of the arrangement, the arrangement is classified as a joint venture and is accounted for using the equity method. When the Company has rights to the assets and obligations for the liabilities relating to an arrangement, the arrangement is classified as a joint operation and the Company accounts for each of its assets, liabilities and transactions, including its share of those held or incurred jointly, in relation to the joint operation. The Company presently does not have any joint operations. Under the equity method of accounting, interests in joint ventures are initially recognized at cost and adjusted thereafter to recognize the Company’s share of the profits or losses and movements in other comprehensive income (loss) (OCI) of the investee. When the Company’s share of losses in a joint venture equals or exceeds its interests in the joint ventures, the Company does not recognize further losses, unless it will incur obligations or make payments on behalf of the joint ventures. 8 | CAE Year-End Financial Results 2014

Notes to the Consolidated Financial Statements
Unrealized gains resulting from transactions with joint ventures are eliminated, to the extent of the Company’s share in the joint venture. For sales of products or services from the Company to its joint ventures, the elimination of unrealized profits is considered in the carrying value of the investment in equity accounted investees in the consolidated statement of financial position and in the share in profit or loss of equity accounted investees in the consolidated income statement. Business combinations Business combinations are accounted for under the acquisition method. The consideration transferred for the acquisition of a subsidiary is the fair value of the assets transferred, the liabilities incurred and the equity interests issued by the Company, if any, at the date control is obtained. The consideration transferred includes the fair value of any liability resulting from a contingent consideration arrangement. Acquisition-related costs, other than share and debt issue costs incurred to issue financial instruments that form part of the consideration transferred, are expensed as incurred. Identifiable assets acquired and liabilities assumed in a business combination are measured initially at their fair value at the acquisition date. If a business combination is achieved in stages, the Company remeasures its previously held interest in the acquiree at its acquisition-date fair value and recognizes the resulting gain or loss, if any, in net income. Contingent consideration is classified as a provision and is measured at fair value, with subsequent changes recognized in income. If the contingent consideration is classified as equity, it is not remeasured until it is finally settled within equity. New information obtained during the measurement period, up to 12 months following the acquisition date, about facts and circumstances existing at the acquisition date affect the acquisition accounting. Non-controlling interests Non-controlling interests (NCI) represent equity interests in subsidiaries owned by outside parties. The share of net assets of subsidiaries attributable to non-controlling interests is presented as a component of equity. Changes in the Company’s ownership interest in subsidiaries that do not result in a loss of control are accounted for as equity transactions. The Company treats transactions with non-controlling interests as transactions with equity owners of the Company. For interests purchased from non-controlling interests, the difference between any consideration paid and the relevant share acquired of the carrying value of net assets of the subsidiary is recorded in equity. Gains or losses on disposals of non-controlling interests are also recorded in equity. Financial instruments and hedging relationships Financial instruments Financial assets and financial liabilities A financial instrument is any contract that gives rise to a financial asset of one entity and a financial liability or equity instrument of another entity. Financial assets and financial liabilities, including derivatives, are recognized on the consolidated statement of financial position when the Company becomes a party to the contractual provisions of the financial instrument. On initial recognition, all financial instruments are measured at fair value. When there is a difference between the fair value of the consideration given or received at initial recognition and the amount determined using a valuation technique, such difference is recognized immediately in income unless it qualifies for recognition as some other type of asset or liability. Subsequent measurement of the financial instruments is based on their classification as described below. Financial assets can be classified into one of these categories: fair value through profit and loss, held-to-maturity investments, loans and receivables or available-for-sale. Financial liabilities can be classified into one of the following categories: fair value through profit and loss or other financial liabilities. The determination of the classification depends on the purpose for which the financial instruments were acquired and their characteristics. Except in very limited circumstances, the classification is not changed subsequent to the initial recognition. Financial instruments at fair value through profit and loss Financial instruments classified at fair value through profit and loss (FVTPL) are carried at fair value at each reporting date with the change in fair value recorded in income. The FVTPL classification is applied when a financial instrument: − Is a derivative, including embedded derivatives accounted for separately from the host contract, but excluding those derivatives designated as effective hedging instruments; − Has been acquired or incurred principally for the purpose of selling or repurchasing in the near future; − Is part of a portfolio of financial instruments that are managed together and for which there is evidence of a recent actual pattern of short-term profit-taking; or − Has been irrevocably designated as such by the Company (fair value option). Held-to-maturity investments, loans and receivables and other financial liabilities Financial instruments classified as held-to-maturity investments, loans and receivables and other financial liabilities are carried at amortized cost using the effective interest method. Interest income or expense is included in income in the period as incurred.
CAE Year-End Financial Results 2014 | 9

Notes to the Consolidated Financial Statements Available-for-sale Available-for-sale financial assets are non-derivative financial assets that are designated as available-for-sale or that are not classified in any of the preceding categories. Financial assets classified as available-for-sale are carried at fair value at each reporting date. Unrealized gains and losses, including changes in foreign exchange rates for non-monetary financial assets, are recognized in OCI in the period in which the changes arise and are transferred to income when the assets are derecognized or impairment occurs. Objective evidence of impairment of an equity investment includes a significant or prolonged decline in the fair value of the security below its cost. If a reliable estimate of the fair value of an unquoted equity instrument cannot be made, this instrument is measured at cost, less any impairment losses. Dividends are recognized in income when the right of payment has been established. As a result, the following classifications were determined: (i) Cash and cash equivalents, restricted cash and all derivative instruments, except for derivatives designated as effective hedging instruments, are classified as FVTPL; (ii) Accounts receivable, contracts in progress, non-current receivables and advances are classified as loans and receivables, except for those that the Company intends to sell immediately or in the
near term which are classified as FVTPL; (iii) Portfolio investments are classified as available-for-sale; (iv) Accounts payable and accrued liabilities and long-term debt, including interest payable, as well as finance lease obligations and royalty obligations are classified as other financial liabilities, all of
which are measured at amortized cost using the effective interest rate method.
Transaction costs Transaction costs that are directly related to the acquisition or issuance of financial assets and financial liabilities (other than those classified as FVTPL) are included in the fair value initially recognized for those financial instruments. These costs are amortized to income using the effective interest rate method. Offsetting of financial assets and financial liabilities Financial assets and financial liabilities are offset and the net amount is presented in the consolidated statement of financial position when the Company has a legally enforceable right to set off the recognized amounts and intends to settle on a net basis or to realize the assets and settle the liabilities simultaneously. Impairment of financial assets carried at amortized cost At each reporting date, the carrying amounts of the financial assets other than those to be measured at FVTPL are assessed to determine whether there is objective evidence of impairment. Impairment losses on financial assets carried at amortized cost are reversed in subsequent periods if the amount of loss decreases and the decrease can be related objectively to an event occurring after the impairment was recognized. Fair value hierarchy transfers For financial instruments that are recognized at fair value on a recurring basis, the Company determines whether transfers have occurred between levels in the fair value hierarchy. The assessment is based on the lowest level input that is significant to the fair value measurement as a whole at the end of each period. Embedded derivatives Embedded derivatives are recorded at fair value separately from the host contract when their economic characteristics and risks are not clearly and closely related to those of the host contract. The Company may enter into freestanding derivative instruments which are not eligible for hedge accounting, to offset the foreign exchange exposure of embedded foreign currency derivatives. In such circumstances, both derivatives are carried at fair value at each statement of financial position date with the change in fair value recorded in consolidated net income. Hedge accounting Documentation At the inception of a hedge, if the Company elects to use hedge accounting, the Company formally documents the designation of the hedge, the risk management objectives and strategy, the hedging relationship between the hedged item and hedging item and the method for testing the effectiveness of the hedge, which must be reasonably assured over the term of the hedging relationship and can be reliably measured. The Company formally assesses, both at inception of the hedge relationship and on an ongoing basis, whether the derivatives that are used in hedging transactions are highly effective in offsetting changes in fair values or cash flows of hedged items in relation to the hedged risk. Method of accounting The method of recognizing fair value gains and losses depends on whether derivatives are at FVTPL or are designated as hedging instruments, and, if the latter, the nature of the risks being hedged. All gains and losses from changes in the fair value of derivatives not designated as hedges are recognized in income. When derivatives are designated as hedges, the Company classifies them either as: (a) hedges of the change in fair value of recognized assets or liabilities or firm commitments (fair value hedges); or (b) hedges of the variability in highly probable future cash flows attributable to a recognized asset or liability, a firm commitment or a forecasted transaction (cash flow hedges); or (c) hedges of a net investment in a foreign operation. 10 | CAE Year-End Financial Results 2014

Notes to the Consolidated Financial Statements
Fair value hedge For fair value hedges outstanding, gains or losses arising from the measurement of derivative hedging instruments at fair value are recorded in income and the carrying amount of the hedged items are adjusted by gains and losses on the hedged item attributable to the hedged risks which are recorded in income. Cash flow hedge The effective portion of changes in the fair value of derivative instruments that are designated and qualify as cash flow hedges is recognized in OCI, while the ineffective portion is recognized immediately in income. Amounts accumulated in OCI are reclassified to income in the period in which the hedged item affects income. However, when the forecasted transactions that are hedged items result in recognition of non-financial assets (for example, inventories or property, plant and equipment), gains and losses previously recognized in OCI are included in the initial carrying value of the related non-financial assets acquired or liabilities incurred. The deferred amounts are ultimately recognized in income as the related non-financial assets are derecognized or amortized. Hedge accounting is discontinued prospectively when the hedging relationship no longer meets the criteria for hedge accounting, when the designation is revoked, or when the hedging instrument expires or is sold. Any cumulative gain or loss directly recognized in OCI at that time remains in OCI until the hedged item is eventually recognized in income. When it is probable that a hedged transaction will not occur, the cumulative gain or loss that was recognized in OCI is recognized immediately in income. Hedge of net investments in foreign operations The Company has designated certain long-term debt as a hedge of CAE’s overall net investments in foreign operations whose activities are denominated in a currency other than the Company’s functional currency. The portion of gains or losses on the hedging item that is determined to be an effective hedge is recognized in OCI and is limited to the translation gain or loss on the net investment. Derecognition Financial assets A financial asset (or, where applicable a part of a financial asset or part of a group of similar financial assets) is derecognized when: − The rights to receive cash flows from the asset have expired; − The Company has transferred its rights to receive cash flows from the asset and either has transferred substantially all the risks and rewards of the asset or has neither transferred nor retained
substantially all the risks and rewards of the asset, but has transferred control of the asset.
Financial liabilities A financial liability is derecognized when the obligation under the liability is discharged, cancelled or expires. When an existing financial liability is replaced by another from the same lender on substantially different terms, or the terms of an existing liability are substantially modified, such an exchange or modification is treated as a derecognition of the original liability and the recognition of a new liability, and the difference in the respective carrying amounts is recognized in income. Foreign currency translation Foreign operations Assets and liabilities of subsidiaries that have a functional currency other than the Canadian dollar are translated from their functional currency to Canadian dollars at exchange rates in effect at the reporting date. Revenue and expenses are translated at the average exchange rates for the period. The resulting translation adjustments are included in OCI. When designated as hedges on net investments in foreign operations, translation gains or losses related to long term intercompany account balances, which form part of the overall net investment in foreign operations, and those arising from the translation of debt denominated in foreign currencies, are also included in OCI. Transactions and balances Monetary assets and liabilities denominated in foreign currencies are translated at the prevailing exchange rate at the reporting date. Non-monetary assets and liabilities, and revenue and expense items denominated in foreign currencies are translated into the functional currency using the exchange rate prevailing at the dates of the respective transactions. Foreign exchange gains and losses resulting from the settlement of such transactions are recognized in income, except when deferred in OCI as qualifying cash flow hedges and qualifying net investment hedges. Cash and cash equivalents Cash and cash equivalents consist of cash and highly-liquid investments with original terms to maturity of 90 days or less at the date of purchase. Accounts receivable Receivables are initially recognized at fair value and are subsequently carried at amortized cost, net of an allowance for doubtful accounts, based on expected recoverability. The amount of the allowance is the difference between the asset’s carrying amount and the present value of the estimated future cash flows, discounted at the original effective interest rate. The loss is recognized in income. Subsequent recoveries of amounts previously provided for or written-off are recognized in income.
CAE Year-End Financial Results 2014 | 11

Notes to the Consolidated Financial Statements The Company is involved in a program in which it sells undivided interests in certain of its accounts receivable and contracts in progress: assets (current financial assets program) to third parties for cash consideration for an amount up to $150.0 million without recourse to the Company. The Company continues to act as a collection agent. These transactions are accounted for when the Company is considered to have surrendered control over the transferred accounts receivable and contracts in progress: assets. Inventories Raw materials are valued at the lower of average cost and net realizable value. Spare parts to be used in the normal course of business are valued at the lower of cost, determined on a specific identification basis, and net realizable value. Work in progress is stated at the lower of cost, determined on a specific identification basis, and net realizable value. The cost of work in progress includes material, labour and an allocation of manufacturing overhead, which is based on normal operating capacity. Net realizable value is the estimated selling price in the ordinary course of business, less estimated costs of completion and the estimated costs necessary to generate revenue. In the case of raw materials and spare parts, the replacement cost is the best measure of net realizable value. Property, plant and equipment Property, plant and equipment are recorded at cost less any accumulated depreciation and any accumulated net impairment losses. Costs include expenditures that are directly attributable to the acquisition or manufacturing of the item. The cost of an item of property, plant and equipment that is initially recognized includes, when applicable, the initial present value estimate of the costs required to dismantle and remove the asset and restore the site on which it is located at the end of its useful life. Purchased software that is integral to the functionality of the related equipment is capitalized as part of that equipment. Subsequent costs, such as updates on training devices, are included in the asset’s carrying amount or recognized as a separate asset only when it is probable that future economic benefits will flow to the Company and the cost of the item can be reliably measured; otherwise, they are expensed. A loss on disposal is recognized in income when the carrying value of a replaced item is derecognized, unless the item is transferred to inventories. If it is not practicable to determine the carrying value, the cost of the replacement and the accumulated depreciation calculated by reference to that cost will be used to derecognize the replaced part. The costs of day-to-day servicing of property, plant and equipment are recognized in income as incurred. Gains and losses on disposal of property, plant and equipment are determined by comparing the proceeds from disposal with its carrying amount, and are recognized net within other gains and losses. The different components of property, plant and equipment are recognized separately when their useful lives are materially different and such components are depreciated separately in income. Leased assets are depreciated over the shorter of the lease term and their useful lives. If it is reasonably certain that the Company will obtain ownership by the end of the lease term, the leased asset is depreciated over its useful life. Land is not depreciated. The estimated useful lives, residual values and depreciation methods are as follows:
Leases The Company leases certain property, plant and equipment from and to others. Leases in which substantially all the risks and rewards of ownership are transferred are classified as finance leases. All other leases are accounted for as operating leases. The Company as a lessor With regards to finance leases, the asset is derecognized at the commencement of the lease and a gain (loss) is recognized in income. The net present value of the minimum lease payments and any discounted unguaranteed residual value are recognized as non-current receivables. Finance income is recognized over the term of the lease based on the effective interest rate method. Income from operating leases is recognized on a straight-line basis over the term of the corresponding lease. The Company as a lessee Finance leases are capitalized at the lease’s commencement at the lower of the fair value of the leased item and the present value of the minimum lease payments. Any initial direct costs of the lessee are added to the amount recognized as an asset. The corresponding obligations are included in long-term debt. Finance expense is recognized over the term of the lease based on the effective interest rate method. Payments made under operating leases are charged to income on a straight-line basis over the term of the lease. 12 | CAE Year-End Financial Results 2014
Method Rates/Years
Buildings and improvements Declining balance/Straight-line 2.5 to 10%/3 to 20 years
Simulators Straight-line (10% residual) Not exceeding 25 years
Machinery and equipment Declining balance/Straight-line 20 to 35%/2 to 10 years
Aircraft Straight-line (15% residual) Not exceeding 12 years
Aircraft engines Based on utilization Not exceeding 3,000 hours
Depreciation methods, useful lives and residual values are reviewed and adjusted, if appropriate, on a prospective basis at each reporting date.

Notes to the Consolidated Financial Statements Sale and leaseback transactions The Company engages in sales and leaseback transactions as part of the Company’s financing strategy to support investment in the civil and military training and services business. Where a sale and leaseback transaction results in a finance lease, any excess of sales proceeds over the carrying amount is deferred and amortized over the lease term. Where a sale and leaseback transaction results in an operating lease, and it is clear that the transaction is established at fair value, any profit or loss is recognized in income. If the sales price is below fair value, the shortfall is recognized in income immediately except if the loss is compensated for by future lease payments at below market price, it is deferred and amortized in proportion to the lease payments over the period the asset is expected to be used. If the sale price is above fair value, the excess over fair value is deferred and amortized over the period the asset is expected to be used. Intangible assets Goodwill Goodwill is measured at cost less accumulated impairment losses, if any. Goodwill arises on the acquisition of subsidiaries. Goodwill represents the excess of the aggregate of the cost of an acquisition, including the Company’s best estimate of the fair value of contingent consideration and the acquisition-date fair value of any previous held equity interest in the acquiree, over the fair value of the net identifiable assets of the acquiree at the acquisition date. Gains and losses on the disposal of an entity include the carrying amount of goodwill relating to the entity sold. Research and development (R&D) Research costs are expensed as incurred. Development costs are also charged to income in the period incurred unless they meet all the specific capitalization criteria established in IAS 38, Intangible Assets . Capitalized development costs are stated at cost and net of accumulated amortization and accumulated impairment losses, if any. Amortization of the capitalized development costs commences when the asset is available for use and is included in research and development expense. Other intangible assets Intangible assets acquired separately are measured at cost upon initial recognition. The cost of intangible assets acquired in a business combination is the fair value as at the acquisition date. Following initial recognition, intangible assets are carried at cost, net of accumulated amortization and accumulated impairment losses, if any. The cost of an internally generated intangible asset comprises all directly attributable costs necessary to create, produce, and prepare the asset to be capable of operating in the manner intended by management. Gains and losses on disposal of intangible assets are determined by comparing the proceeds from disposal with its carrying amount and are recognized within other gains and losses.
Impairment of non-financial assets The carrying amounts of the Company’s non-financial assets subject to amortization are tested for impairment whenever events or changes in circumstances indicate that the carrying amount may not be recoverable. Goodwill and assets that are not yet available for use are tested for impairment annually or at any time if an indicator of impairment exists. The recoverable amount of an asset or a cash-generating unit (CGU) is the greater of its value in use and its fair value less costs of disposal. The recoverable amount is determined for an individual asset; unless the asset does not generate cash inflows that are largely independent of those from other assets or groups of assets. In such case, the CGU that the asset belongs to is used to determine the recoverable amount. For the purposes of impairment testing, the goodwill acquired in a business combination is allocated to CGUs or groups of CGUs, which generally corresponds to its operating segments or one level below, that are expected to benefit from the synergies of the combination, irrespective of whether other assets or liabilities of the acquiree are assigned to those units.
CAE Year-End Financial Results 2014 | 13
Amortization Amortization is calculated using the straight-line method for all intangible assets over their estimated useful lives as follows: Amortization period
(in years) Capitalized development costs 5 to 10 Customer relationships 3 to 15 ERP and other software 3 to 10 Technology 3 to 15 Other intangible assets 2 to 40
Amortization methods and useful lives are reviewed and adjusted, if appropriate, on a prospective basis at each reporting date.

Notes to the Consolidated Financial Statements An impairment loss is recognized if the carrying amount of an asset or CGU exceeds its estimated recoverable amount. Where the recoverable amount of a CGU to which goodwill has been allocated is lower than the CGU’s carrying amount, the related goodwill is impaired. Any remaining amount of impairment exceeding the impaired goodwill is recognized on a pro rata basis of the carrying amount of each asset in the respective CGU. Impairment losses are recognized in income. The Company evaluates impairment losses, other than goodwill impairment, for potential reversals at each reporting date. An impairment loss is reversed if there is any indication that the loss has decreased or no longer exists due to changes in the estimates used to determine the recoverable amount. An impairment loss is reversed only to the extent that the asset’s carrying amount does not exceed the carrying amount that would have been determined, net of depreciation or amortization, if no impairment loss had been recognized. Such reversal is recognized in income. Borrowing costs Borrowing costs that are directly attributable to the acquisition or construction of a qualifying asset are capitalized as part of the cost of the asset. A qualifying asset is one that takes a substantial period of time to get ready for its intended use. Capitalization of borrowing costs ceases when the asset is completed and ready for its intended use. All other borrowing costs are recognized as finance expense in income, as incurred. Other assets Restricted cash The Company is required to hold a defined amount of cash as collateral under the terms of certain subsidiaries’ external bank financing, government-related sales contracts and business combination arrangements. Deferred financing costs Deferred financing costs related to the revolving unsecured term credit facilities, when it is probable that some or all of the facilities will be drawn down, and deferred financing costs related to sale and leaseback agreements are included in other assets at cost and are amortized on a straight-line basis over the term of the related financing agreements. Accounts payable and accrued liabilities Accounts payable and accrued liabilities are recognized initially at fair value and subsequently measured at amortized cost using the effective interest method. Provisions Provisions are recognized when the Company has a present legal or constructive obligation as a result of past events, it is probable that an outflow of resources will be required to settle the obligation and the amount can be reliably estimated. Provisions are not recognized for future operating losses. Provisions are measured at the present value of the expenditures expected to be required to settle the obligation using a pre-tax rate that reflects current market assessments of the time value of money and the risks specific to the obligation. The increase in the provision due to passage of time is recognized as a finance expense. When there are a number of similar obligations, the likelihood that an outflow will be required in settlement is determined by considering the class of obligations as a whole. Long-term debt Long-term debt is recognized initially at fair value, net of transaction costs incurred. They are subsequently stated at amortized cost. Any difference between the proceeds, net of transaction costs, and the redemption value is recognized in income over the period of borrowings using the effective interest method. Fees paid on the establishment of loan facilities are recognized as transaction costs of the loan to the extent that it is probable that some or all of the facility will be drawn down. In these cases, the fee is deferred until the drawdown occurs. To the extent that there is no evidence that it is probable that some or all of the facility will be drawn down, the fee is capitalized as a pre-payment for liquidity services and amortized over the period of the facility to which it relates. Share capital Common shares are classified as equity. Incremental costs directly attributable to the issue of new shares or options are shown in equity as a deduction, net of tax, from the proceeds. Revenue recognition Revenue is measured at the fair value of the consideration received or receivable. Revenue is recognized when the amount can be reliably measured, when it is probable that future economic benefits will flow to the Company and when specific criteria have been met for each of the categories, as described below. Multiple component arrangements The Company sometimes enters into multiple component revenue arrangements, which may include a combination of design, engineering and manufacturing of flight simulators and other products, as well as the provision of training services, spare parts and maintenance. When a single sales transaction requires the delivery of more than one product or service (multiple components), the revenue recognition criteria are applied to the separately identifiable components. A component is considered separately identifiable if the delivered item has value to the customer on a stand-alone basis and the fair value associated with the product or service can be reliably measured. 14 | CAE Year-End Financial Results 2014

Notes to the Consolidated Financial Statements
The allocation of the revenue from a multiple component arrangement is based on the fair value of each element in relation to the fair value of the arrangement as a whole. The Company's revenues can be divided into two main accounting categories: construction contracts and sales of goods and services. Construction contracts A construction contract is a contract specifically negotiated for the construction of an asset or of a group of assets, which are interrelated in terms of their design, technology, function, purpose or use. According to its characteristics, a construction contract can be accounted for separately, be segmented into several components which are each accounted for separately, or be combined with another construction contract in order to form a single construction contract for accounting purposes in respect of which revenues and expense will be recognized. Revenue from construction contracts for the design, engineering and manufacturing of training devices is recognized using the percentage-of-completion method when it is probable that the economic benefits associated with the contract will flow to the Company, the revenue, contract costs to complete and the stage of contract completion at the end of the reporting period can be reliably measured and when the contract costs can be clearly identified and reliably measured so that actual contract costs incurred can be compared with prior estimates. The stage of completion is measured by reference to the contract costs incurred up to the end of the reporting period as a percentage of total estimated costs for each contract. When the criteria to use the percentage-of-completion method are not met, construction contract revenue is recognized to the extent of the contract costs incurred that are likely to be recoverable. Provisions for estimated contract losses are recognized in the period in which the loss is determined. Contract losses are measured at the amount by which the estimated total costs exceed the estimated total revenue from the contract. Warranty provisions are recorded when revenue is recognized based on past experience. The cumulative amount of costs incurred and profit recognized, reduced by losses and progress billing, is determined on a contract-by-contract basis. If this amount is positive it is classified in contracts in progress: assets. If this amount is negative it is classified in contracts in progress: liabilities. Post-delivery customer support is billed separately, and revenue is recognized over the support period. Sales of goods and services Software arrangements Revenue from off-the-shelf software sales is recognized when delivery has occurred. Revenue from fixed-price software arrangements and software customization contracts that require significant production, modification, or customization of software is recognized using the percentage-of-completion method. Spare parts Revenue from the sale of spare parts is primarily recognized upon shipment to the customer. Upon shipment, the significant risks and rewards of ownership of the goods are transferred and the Company retains neither continuing managerial involvement to the degree usually associated with ownership nor effective control over the goods sold. Product maintenance Revenue from maintenance contracts is generally recognized on the basis of the percentage-of-completion of the transaction. Training and consulting services Revenue from training and consulting services is recognized as the services are rendered. For flight schools, cadet training courses are offered mainly by way of ground school and live aircraft flight. During the ground school phase, revenue is recognized in income on a straight-line basis, while during the live aircraft flight phase, revenue is recognized based on actual flight hours. Other Sales incentives to customers The Company may provide sales incentives in the form of discounts and volume rebates, these incentives are recorded as a reduction of revenues. Non-monetary transactions The Company may also enter into sales arrangements where little or no monetary consideration is involved. The non-monetary transactions are measured at the more reliable measure of the fair value of the asset given up and fair value of the asset received. Deferred revenue Cash payments received or advances currently due pursuant to contractual arrangements, with the exception of those related to construction contracts, are recorded as deferred revenue until all of the foregoing conditions of revenue recognition have been met.
CAE Year-End Financial Results 2014 | 15

Notes to the Consolidated Financial Statements Employee benefits Defined benefit pension plans The Company maintains defined benefit pension plans that provide benefits based on length of service and final average earnings. The defined benefit asset or liability comprises the present value of the defined benefit obligation at the reporting date less the fair value of plan assets out of which the obligations are to be settled. The defined benefit obligations are actuarially determined for each plan using the projected unit credit method. The present value of the defined benefit obligation is determined by discounting the estimated future cash flows using the interest rate of high-quality corporate bonds that are denominated in the currency in which the benefit will be paid and that have terms to maturity approximating the terms of the related pension obligation. In countries where there is no deep market in such bonds, the market rates on government bonds are used. The value of any employee benefit asset recognized is restricted to the present value of any economic benefits available in the form of refunds from the plan or reductions in the future contributions to the plan (asset ceiling test). Minimum funding requirements may give rise to an additional liability to the extent that they require paying contributions to cover an existing shortfall. Plan assets are not available to the creditors of the Company nor can they be paid directly to the Company. Fair value of plan assets is based on market price information. The Company determines the net interest expense (income) by applying the discount rate used to measure the defined benefit obligation at the beginning of the period to the net defined benefit asset or liability. Actuarial gains and losses arising from experience adjustments, changes in actuarial assumptions and the effect of any asset ceiling and minimum liability are recognized to OCI in the period in which they arise. Past service costs are recognized as an expense as incurred at the earlier of when the plan amendment or curtailment occurs and when the entity recognizes related termination benefits. Defined contribution pension plans The Company also maintains defined contribution plans for which the Company pays fixed contributions to publicly or privately administered pension insurance plans on a mandatory, contractual or voluntary basis. The Company has no legal or constructive obligation to pay further amounts if the fund does not hold sufficient assets to pay the benefits to all employees. Obligations for contributions to defined contribution pension plans are recognized as an employee benefit expense in income as the services are provided. Termination benefits Termination benefits are recognized as an expense when the Company is demonstrably committed, without realistic possibility of withdrawal, to a formal detailed plan to either terminate employment before the normal retirement date, or to provide termination benefits as a result of an offer made to encourage voluntary redundancy. Termination benefits for voluntary redundancies are recognized as an expense, if the Company has made an offer of voluntary redundancy, based on the number of employees expected to accept the offer. Benefits falling due more than 12 months after the reporting date are discounted to their present value. Share-based payment transactions The Company’s five share-based payment plans are segregated into two categories of plans: Employee Stock Option Plan (ESOP), which is considered an equity-settled share-based payment plan; and Employee Stock Purchase Plan (ESPP), Deferred Share Unit (DSU) plan, Long-Term Incentive Deferred Share Unit (LTI-DSU) plan and Long-Term Incentive Restricted Share Unit (LTI-RSU) plan, which are considered cash-settled share-based payment plans. For both categories, the fair value of the employee services received in exchange is recognized as an expense in income. Service and non-market performance conditions attached to the transactions are not taken into account in determining fair value. For the equity-settled plan, the cost of equity-settled transactions is measured at fair value using the Black-Scholes option pricing model. The compensation expense is measured at the grant date and recognized over the service period with a corresponding increase to contributed surplus. The cumulative expenses recognized for equity-settled transactions at each reporting date represents the extent to which the vesting period has expired and management’s best estimate of the number of equity instruments that will ultimately vest. For options with graded vesting, each tranche is considered a separate grant with a different vesting date and fair value, and each tranche is accounted for separately. When the options are exercised, the Company issues new shares and the proceeds received net of any directly attributable transaction costs are credited to share capital. For cash-settled plans, a corresponding liability is recognized. The fair value of employee services received is calculated by multiplying the number of units expected to vest with the fair value of one unit as of grant date based on the market price of the Company’s common shares. The fair value of the ESPP is a function of the Company’s contributions. Until the liability is settled, the Company re-measures the fair value of the liability at the end of each reporting period and at the date of settlement, with any changes in fair value recognized in income for the period. The Company has entered into equity swap agreements with two major Canadian financial institutions in order to reduce its earnings exposure related to the fluctuation in the Company’s share price relating to the DSU and LTI-DSU programs. 16 | CAE Year-End Financial Results 2014

Notes to the Consolidated Financial Statements
Current and deferred income tax Income tax expense comprises current and deferred tax. An income tax expense is recognized in income except to the extent that it relates to items recognized in OCI or directly in equity, in which case it is recognized in OCI or directly in equity, respectively. Current tax is the amount expected to be paid or recovered from taxation authorities on the taxable income or loss for the year, using tax rates enacted or substantively enacted at the reporting date in the countries where the Company and its subsidiaries operate and generate taxable income, and any adjustment to tax payable or receivable in respect of previous years. Management periodically evaluates positions taken in tax returns with respect to situations in which applicable tax regulation is subject to interpretation. It establishes provisions, where appropriate, on the basis of amounts expected to be paid to the tax authorities. Deferred tax is recognized using the balance sheet liability method, providing for temporary differences between the tax bases of assets or liabilities and their carrying amounts in the consolidated financial statements. Deferred income tax is provided on temporary differences arising on investments in subsidiaries, and jointly controlled entities, except where the timing of the reversal of the temporary difference is controlled by the Company and it is probable that the temporary difference will not reverse in the foreseeable future. Deferred tax is measured on an undiscounted basis at the tax rates that are expected to be applied to temporary differences when they reverse, based on the laws that have been enacted or substantively enacted by the reporting date. Deferred tax assets are recognized for all deductible temporary differences and carry forward of unused tax losses. The recognition of deferred tax assets are limited to the amount which is probable to be realized. Deferred tax assets are reviewed at each reporting date and are reduced to the extent that it is no longer probable that a recognized deferred tax asset will be realized. Unrecognized deferred tax assets are reassessed at each reporting date and are recognized to the extent that it has become probable that an unrecognized deferred tax asset will be realized. Deferred tax assets and liabilities are offset if there is a legally enforceable right to offset current tax liabilities and assets, and they relate to income taxes levied by the same tax authority on the same taxable entity, or on different taxable entities which intend to settle current tax liabilities and assets on a net basis or if their tax assets and liabilities will be realized simultaneously. Taxes on income in the interim periods are accrued by jurisdiction using the effective tax rate that would be applicable to expected total annual profit or loss of the jurisdiction. Investment tax credits Investment tax credits (ITCs) arising from R&D activities are deducted from the related costs and are accordingly included in the determination of net income when there is reasonable assurance that the credits will be realized. ITCs arising from the acquisition or development of property, plant and equipment and capitalized development costs are deducted from the cost of those assets with amortization calculated on the net amount. Investment tax credits expected to be recovered beyond 12 months are classified in Other assets. Earnings per share Earnings per share is calculated by dividing the net income for the period attributable to the common shareholders of the Company by the weighted average number of common shares outstanding during the period. The diluted weighted average number of common shares outstanding is calculated by taking into account the dilution that would occur if the securities or other agreements for the issuance of common shares were exercised or converted into common shares at the later of the beginning of the period or the issuance date unless it is anti-dilutive. The treasury stock method is used to determine the dilutive effect of the stock options. The treasury stock method is a method of recognizing the use of proceeds that could be obtained upon the exercise of options in computing diluted earnings per share. It assumes that any proceeds would be used to purchase common shares at the average market price during the period. Only the Company’s stock options have a dilutive potential on common shares. Dividend distribution In the period in which the dividends are approved by the Company’s Board of Directors, the dividend is recognized as a liability in the Company’s consolidated financial statements. Government assistance Government contributions are recognized when there is reasonable assurance that the contributions will be received and all attached conditions will be complied with by the Company. Government assistance related to the acquisition of intangible assets is recorded as a reduction of the cost of the related asset while government assistance related to current expenses is recorded as a reduction of the related expenses. The Company benefits from investment tax credits that are deemed to be equivalent to government contributions.
CAE Year-End Financial Results 2014 | 17

Notes to the Consolidated Financial Statements Contributions are received for Project New Core Markets from Investissement Québec (IQ) for costs incurred in R&D programs. Contributions were received in previous fiscal years for Project Phoenix from Industry Canada under the Technology Partnerships Canada (TPC) program and from IQ. Project New Core Markets and Project Phoenix require the Company to pay royalties. The obligation to pay royalties, recognized as royalty obligations, is recorded when the contribution is receivable and is estimated based on future projections. The obligation is discounted using the prevailing market rates of interest, at that time, for a similar instrument (similar as to currency, term, type of interest rate, guarantees or other factors) with a similar credit rating. The current portion is included as part of accrued liabilities. The difference between government contributions and the discounted value of royalty obligations is accounted for as a government assistance which is recognized as a reduction of related expenses or as a reduction of the cost of the related asset. The Company recognizes the Government of Canada’s participation in Project Falcon and Project Innovate as interest-bearing long-term debt. The initial measurement of the accounting liability is discounted using the prevailing market rates of interest, at that time, for a similar instrument (similar as to currency, term, type of interest rate, guarantees or other factors) with a similar credit rating. The difference between the face value of the long-term obligation and the discounted value of the long-term obligation is accounted for as a government contribution which is recognized as a reduction of costs or as a reduction of capitalized expenditures. Use of judgements, estimates and assumptions The preparation of the consolidated financial statements requires the Company’s management (management) to make judgements, estimates and assumptions that affect the application of accounting policies, the reported amounts of assets and liabilities and disclosures at the date of the consolidated financial statements, as well as the reported amounts of revenues and expenses for the period reported. It also requires management to exercise its judgement in applying the Company’s accounting policies. The areas involving a high degree of judgement or complexity, or areas where assumptions and estimates are significant to the consolidated financial statements are disclosed below. Actual results could differ from those estimates. Changes will be reported in the period in which they are identified. Business combinations Business combinations are accounted for in accordance with the acquisition method; thus, on the date that control is obtained. The consideration transferred and the acquiree’s identifiable assets, liabilities and contingent liabilities are measured at their fair value. Depending on the complexity of determining these valuations, the Company either consults with independent experts or develops the fair value internally by using appropriate valuation techniques which are generally based on a forecast of the total expected future net discounted cash flows. These evaluations are linked closely to the assumptions made by management regarding the future performance of the related assets and the discount rate. Contingent consideration is measured at fair value using a discounted cash flow model based on expected revenues. Development costs Development costs are recognized as intangible assets and are amortized over their useful lives when they meet the criteria for capitalization. Forecasted revenue and profitability for the relevant projects are used to assess compliance with the capitalization criteria and to assess the recoverable amount of the assets. Impairment of non-financial assets The Company’s impairment test for goodwill is based on internal estimates (level 3) of fair value less costs of disposal calculations and uses valuation models such as the discounted cash flows model. The cash flows are derived from the projections approved by management for the next five years. Cash flow projections take into account past experience and represent management’s best estimate about future developments and form part of the Company’s strategic plan approved annually by the Board of Directors. Cash flows after the five year period are extrapolated using estimated growth rates. Key assumptions which management has based its determination of fair value less costs of disposal include estimated growth rates, post-tax discount rates and tax rates. The post-tax discount rates were derived from the respective CGUs’ representative weighted average cost of capital which range from 7.5% to 14.0%. These estimates, including the methodology used, can have a material impact on the respective values and ultimately the amount of any goodwill impairment. Likewise, whenever property, plant and equipment and intangible assets are tested for impairment, the determination of the assets’ recoverable amount involves the use of estimates by management and can have a material impact on the respective values and ultimately the amount of any impairment. Revenue recognition The percentage-of-completion method requires the Company to estimate the work performed to date as a proportion of the total work to be performed. Management conducts monthly reviews of its estimated costs to complete, percentage-of-completion estimates and revenues and margins recognized, on a contract-by-contract basis. The impact of any revisions in cost and earnings estimates is reflected in the period in which the need for a revision becomes known. 18 | CAE Year-End Financial Results 2014

Notes to the Consolidated Financial Statements
Defined benefit pension plans The cost of defined benefit pension plans and the present value of the employee benefits obligations are determined using actuarial valuations. Actuarial valuations involve making assumptions about discount rates, future salary increases, mortality rates and future pension increases. All assumptions are reviewed at each reporting date. Any changes in these assumptions will impact the carrying amount of the employee benefits obligations and the cost of the defined benefit pension plans. In determining the appropriated discount rate, management considers the interest rates of high quality corporate bonds that are denominated in the currency in which the benefits will be paid, and that have terms to maturity approximating the terms of the related pension liability. The mortality rate is based on publicly available mortality tables for the specific country. Future salary increases and pension increases are based on expected future inflation rates for the specific country. Other key assumptions for pension obligations are based, in part, on current market conditions. See Note 14 for further details regarding assumptions used. Government assistance repayments In determining the amount of repayable government assistance, assumptions and estimates are made in relation to discount rates, expected revenues and the expected timing of revenues. Revenue projections take into account past experience and represent management’s best estimate about the future. Revenues after a five-year period are extrapolated using estimated growth rates, ranging from 5% to 9%, over the period of repayments. The estimated repayments are discounted using average rates ranging from 6% to 8.5% based on terms of similar financial instruments. These estimates, along with the methodology used to derive the estimates, can have a material impact on the respective values and ultimately any repayable obligation in relation to government assistance. A 1% increase to the growth rates would increase the royalty obligation at March 31, 2014 by approximately $9.4 million (2013 − $10.2 million). Share-based payments The Company measures the cost of cash and equity-settled transactions with employees by reference to the fair value of the related instruments at the date at which they are granted. Estimating fair value for share-based payments requires determining the most appropriate valuation model for a grant, which is dependent on the terms and conditions of the grant. This also requires making assumptions and determining the most appropriate inputs to the valuation model including the expected life of the option, volatility and dividend yield. Income taxes The Company is subject to income tax laws in numerous jurisdictions. Judgement is required in determining the worldwide provision for income taxes. The determination of tax liabilities and assets involves certain uncertainties in the interpretation of complex tax regulations. The Company provides for potential tax liabilities based on the weighted average probability of the possible outcomes. Differences between actual results and those estimates could have an effect on the income tax liabilities and deferred tax liabilities in the period in which such determinations are made. Deferred tax assets are recognized to the extent that it is probable that taxable profit will be available against the losses that can be utilised. Significant management judgement is required to determine the amount of deferred tax assets that can be recognized, based upon the likely timing and the level of future taxable profits together with future tax planning strategies. The recorded amount of total deferred tax assets could be altered if estimates of projected future taxable income and benefits from available tax strategies are lowered, or if changes in current tax regulations are enacted that impose restrictions on the timing or extent of the Company’s ability to utilise future tax benefits. NOTE 2 – CHANGES IN ACCOUNTING POLICIES
New and amended standard s adopted by the Company Joint arrangements In May 2011, the IASB released IFRS 11, Joint Arrangements , which supersedes IAS 31, Interests in Joint Ventures , and SIC-13, Jointly Controlled Entities – Non-monetary Contributions by Venturers . IFRS 11 focuses on the rights and obligations of a joint arrangement, rather than its legal form as was previously the case under IAS 31. The standard addresses inconsistencies in the reporting for joint arrangements by requiring the equity method to account for interests in jointly controlled entities. The Company previously accounted for its interests in joint ventures using the proportionate consolidation method and now accounts for its interests in joint ventures using the equity method. IFRS 11 was adopted retrospectively effective April 1 st , 2013 in accordance with the transition rules of IFRS 11. Under the equity method, the Company’s share of net assets, net income and OCI of joint ventures will be presented as one-line items on the statement of financial position, the statement of income and the statement of comprehensive income, respectively. In addition, the consolidated statement of cash flows includes the cash flows between the Company and its joint ventures, and not the Company’s proportionate share of the joint ventures’ cash flows. The Company assessed that the classification of its joint arrangements remains the same upon adoption of IFRS 11. When making this assessment, the Company considered the structure of the arrangements, the legal form of any separate vehicles, the contractual terms of the arrangements and other facts and circumstances.
CAE Year-End Financial Results 2014 | 19

Notes to the Consolidated Financial Statements Employee benefits In June 2011, the IASB amended IAS 19, Employee Benefit s . IAS 19 was amended to require the calculation of a net interest that is calculated by applying the discount rate to the net defined benefit liability or asset and to expand the disclosure requirements . As a result, the Company determine d a net interest expense on the net defined benefit liability which is presented as part of the finance expense. The net interest on the defined benefit obligation liability or asset replaces the interest cost on the defined benefit obligation and the expected return on plan assets . The amended IAS 19 was adopted retrospectively effective April 1 st , 2013 in accordance with the transition rules of the amended IAS 19 and additional disclosure is provided in Note 14. Consolidation In May 2011, the IASB released IFRS 10, Consolidated Financial Statements , which replaces SIC-12, Consolidation – Special Purpose Entities , and parts of IAS 27, Consolidated and Separate Financial Statements . The new standard builds on existing principles by identifying the concept of control as the determining factor in whether an entity should be included in a company’s consolidated financial statements. IFRS 10 was adopted retrospectively effective April 1 st , 2013 in accordance with the transition rules of IFRS 10. The Company assessed that the adoption of IFRS 10 does not result in any change in the consolidation status of its subsidiaries. Disclosure of interests in other entities In May 2011, the IASB released IFRS 12, Disclosure of Interests in Other Entities . IFRS 12 requires disclosure for all forms of interests in other entities, including joint arrangements, associates and unconsolidated structured entities. The standard requires an entity to disclose information regarding the nature and risks associated with its interests in other entities and the effects of those interests in its financial position, financial performance and cash flows. IFRS 12 was adopted effective April 1 st , 2013 in accordance with the transition rules of IFRS 12. The new disclosure pursuant to IFRS 12 is included in these annual consolidated financial statements. Fair value measurement In May 2011, the IASB released IFRS 13, Fair Value Measurement . IFRS 13 defines fair value, sets out in a single IFRS a framework for measuring fair value and requires disclosure about fair value measurements. IFRS 13 applies when other IFRS standards require or permit fair value measurements. It does not extend the use of fair value accounting but provides guidance on how it should be applied when its use is already required or permitted by other standards within IFRS. IFRS 13 was adopted prospectively effective April 1 st , 2013 in accordance with the transitional rules of IFRS 13. Other than additional disclosure which is included in Note 29, the adoption of IFRS 13 has no significant impact on the Company’s consolidated financial statements. Financial statement presentation In June 2011, the IASB amended IAS 1, Financial Statement Presentation, to change the disclosure of items presented in OCI, including a requirement to separate items presented in OCI into two groups based on whether or not they may be recycled to net income in the future. The amendments were adopted effective April 1 st , 2013 in accordance with the transition rules of IAS 1. The new OCI requirements are presented in the Company’s consolidated statement of comprehensive income. Financial instrument disclosures In December 2011, the IASB amended IFRS 7, Financial Instrument: Disclosures, on asset and liability offsetting. The amendment requires additional disclosures illustrating the effect or potential effect of netting arrangements associated with the Company’s recognized financial assets and financial liabilities. The amendments were adopted retrospectively effective April 1 st , 2013 in accordance with the transition rules of IFRS 7 and the additional disclosure is included in Note 29. Property, plant and equipment In the 2011 Annual Improvements, the IASB amended IAS 16, Property, Plant and Equipment, to clarify when certain assets are property, plant and equipment or inventory. This amendment clarifies that major spare parts and servicing equipment that meet the definition of property, plant and equipment are not inventory. The 2011 annual improvement amendment removes the requirement for spare parts and servicing equipment used only in connection with an item of property, plant and equipment to be classified as property, plant and equipment. This annual improvement was adopted retrospectively effective April 1 st , 2013 in accordance with the transition rules of IAS 16. The amendment of IAS 16 has no impact on the Company’s consolidated financial statements. Impairment of non-financial assets In May 2013, the IASB amended IAS 36, Impairment of assets regarding disclosures for non-financial assets. This amendment removed certain disclosures related to the recoverable amount of CGUs which had been included in IAS 36 with the issue of IFRS 13. The amendment is not mandatory until January 1 st , 2014, however; the Company has decided to adopt the amendment as of April 1 st , 2013. 20 | CAE Year-End Financial Results 2014

Notes to the Consolidated Financial Statements The following tables summarize the adjustments to the Company’s consolidated statement of financial position as at April 1, 2012 and March 31, 2013, and its consolidated statements of income, comprehensive income and cash flows for the year ended March 31, 2013 as a result of those changes in accounting policies:
CAE Year-End Financial Results 2014 | 21
Summary reconciliation of financial position IFRS 11 IAS 19 March 31, 2013 IFRS 11 IAS 19 April 1, 2012
(amounts in millions) March 31, 2013 Adjustment Adjustment Restated April 1,
2012 Adjustment Adjustment Restated Assets Cash and cash equivalents $ 293.2 $ (33.2) $ - $ 260.0 $ 287.3 $ (32.6) $ - $ 254.7
Total current assets, excluding cash and cash equivalent 1,040.6 7.0 - 1,047.6 860.8 0.1 - 860.9
Property, plant and equipment 1,498.6 (355.8) - 1,142.8 1,293.7 (300.5) - 993.2
Investment in equity accounted investees - 196.9 - 196.9 - 172.9 - 172.9
Other non-current assets 1,046.3 (2.3) - 1,044.0 741.9 5.3 - 747.2
Total assets $ 3,878.7 $ (187.4) $ - $ 3,691.3 $ 3,183.7 $ (154.8) $ - $ 3,028.9
Liabilities and equity Total current liabilities $ 1,002.8 $ (96.4) $ - $ 906.4 $ 883.4 $ (57.6) $ - $ 825.8
Provisions 8.3 (0.4) - 7.9 6.0 (0.5) - 5.5
Long-term debt 1,097.0 (94.2) - 1,002.8 685.6 (97.2) - 588.4
Royalty obligations 160.6 - - 160.6 161.6 - - 161.6
Employee benefits obligations 136.1 - - 136.1 114.2 - 0.1 114.3
Other non-current liabilities 339.4 (8.3) - 331.1 290.7 (8.8) - 281.9
Total liabilities $ 2,744.2 $ (199.3) $ - $ 2,544.9 $ 2,141.5 $ (164.1) $ 0.1 $ 1,977.5
Equity Share capital $ 471.7 $ - $ - $ 471.7 $ 454.5 $ - $ - $ 454.5
Contributed surplus 21.9 - - 21.9 19.2 - - 19.2
Accumulated other comprehensive loss (16.6) 4.6 - (12.0) (9.8) 3.8 - (6.0)
Retained earnings 625.7 7.3 - 633.0 558.0 5.5 (0.1) 563.4
Equity attributable to equity holders of the Company $ 1,102.7 $ 11.9 $ - $ 1,114.6 $ 1,021.9 $ 9.3 $ (0.1) $ 1,031.1
Non-controlling interests 31.8 - - 31.8 20.3 - - 20.3
Total equity $ 1,134.5 $ 11.9 $ - $ 1,146.4 $ 1,042.2 $ 9.3 $ (0.1) $ 1,051.4
Total liabilities and equity $ 3,878.7 $ (187.4) $ - $ 3,691.3 $ 3,183.7 $ (154.8) $ - $ 3,028.9

Notes to the Consolidated Financial Statements
22 | CAE Year-End Financial Results 2014
Reconciliation of net income
Year ended March 31, 2013 As previously IFRS
11 IAS 19 (amounts in millions, except per share amounts) reported Adjustment Adjustment Restated Revenue $ 2,104.5 $ (69.3) $ - $ 2,035.2
Cost of sales 1,482.8 (31.8) (0.6) 1,450.4
Gross profit $ 621.7 $ (37.5) $ 0.6 $ 584.8
Research and development expenses 60.6 (0.5) - 60.1
Selling, general and administrative expenses 269.9 (5.6) 0.2 264.5
Other gains – net (23.4) 1.0 - (22.4)
After tax share in profit of equity accounted investees - (20.1) - (20.1)
Restructuring, integration and acquisition costs 68.9 (0.2) - 68.7
Operating profit $ 245.7 $ (12.1) $ 0.4 $ 234.0
Finance income (7.3) (2.1) - (9.4)
Finance expense 75.5 (6.1) 5.1 74.5
Finance expense – net $ 68.2 $ (8.2) $ 5.1 $ 65.1
Earnings before income taxes $ 177.5 $ (3.9) $ (4.7) $ 168.9
Income tax expense 35.1 (5.7) (1.2) 28.2
Net income $ 142.4 $ 1.8 $ (3.5) $ 140.7
Attributable to: Equity holders of the Company $ 139.4 $ 1.8 $ (3.5) $ 137.7
Non-controlling interests 3.0 - - 3.0
Earnings per share from continuing operations attributable to equity holders of the Company Basic and diluted $ 0.54 $ - $ (0.01) $ 0.53
Weighted average number of shares outstanding (basic) 259.0 - - 259.0
Weighted average number of shares outstanding (diluted) 259.4 - - 259.4
Summary reconciliation of comprehensive income
Year ended March 31, 2013 As previously IFRS 11 IAS 19 (amounts in millions) reported Adjustment Adjustment Restated Net income $ 142.4 $ 1.8 $ (3.5) $ 140.7
Foreign currency translation $ 2.5 $ - $ - $ 2.5
Net changes in cash flow hedge (9.2) 0.8 - (8.4)
Defined benefit plan actuarial losses (22.5) - 3.6 (18.9)
Other comprehensive loss $ (29.2) $ 0.8 $ 3.6 $ (24.8)
Total comprehensive income $ 113.2 $ 2.6 $ 0.1 $ 115.9
Attributable to: Equity holders of the Company $ 110.1 $ 2.6 $ 0.1 $ 112.8
Non-controlling interests 3.1 - - 3.1
$ 113.2 $ 2.6 $ 0.1 $ 115.9
Summary reconciliation of statement of cash flows Year ended March 31, 2013 As previously IFRS 11 IAS 19 (amounts in millions) reported Adjustment Adjustment Restated Cash provided by operating activities $ 204.1 $ (49.6) $ - $ 154.5
Cash used in investing activities (504.9) 71.2 - (433.7)
Cash provided by financing activities 306.7 (22.2) - 284.5

Notes to the Consolidated Financial Statements New and amended standard s not yet adopted by the C ompany Financial Instruments In October 2010 , the IASB released I FRS 9 , Financial Instruments . IFRS 9, which is the first part of a three-part project to replace IAS 39, Financial Instruments: recognition and measurement. This first part addresses the classification and measurement of financial assets and financial liabilities. The IASB is considering making limited modifications to this part, which would include the introduction of a fair value through OCI category for debt instruments that would be based on a company’s business model. In November 2013, the IASB released the hedge accounting part, introducing a new hedge accounting model, together with associated disclosures about risk management activity. Impairment of financial assets, the third part of the project, is still under development. Replacing the multiple rules in IAS 39, the first part of IFRS 9 uses a new approach to determine whether a financial asset is measured at amortized cost or fair value and is based on how a company manages its financial instruments and the contractual cash flow characteristics of the financial assets. The majority of the requirements in IAS 39 for classification and measurement of financial liabilities were carried forward in IFRS 9; however, the portion of the changes in fair value related to the company’s own credit risk, in measuring a financial liability at FVTPL, will be presented in OCI rather than in the income statement. The new hedge accounting model represents a substantial overhaul of hedge accounting that will enable companies to better reflect their risk management activities in their financial statements. The initial mandatory effective date of IFRS 9, set for annual periods beginning on or after January 1, 2015, has been removed by the IASB, and a new date will be determined closer to project completion, however, early application is permitted. The Company is currently evaluating the impact of the standard on its consolidated financial statements. In June 2013, the IASB amended IAS 39 to provide relief from discontinuing hedge accounting when novation of a derivative designated as a hedging instrument meets certain criteria. This amendment will be effective for Company’s fiscal year beginning on April 1, 2014. Similar relief will be included in IFRS 9. Employee benefits In November 2013, the IASB amended IAS 19, Employee benefits . The amendment simplifies the accounting for contributions to defined benefit plans that are independent of the number of years of employee service, for example, employee contributions that are calculated according to a fixed percentage of salary. The amendment is effective for annual periods beginning on or after January 1, 2015, with earlier application permitted. The Company is currently evaluating the impact of the amendment on its consolidated financial statements. NOTE 3 – BUSINESS COMBINATIONS
During the year, the Company paid $3.8 million for business combination transactions of which $0.8 million was for the payment of contingent consideration of previous acquisitions, $2.9 million (€2.1 million) was for the balance of the purchase price for the May 2012 acquisition of Oxford Aviation Academy Luxembourg S.à r.l.(OAA) and $0.1 million was to acquire the assets of RW Consulting and Training Services LTD (RWCTS), a provider of mining training and consulting services. The total consideration transferred for the RWCTS acquisition is $0.4 million, including $0.3 million of contingent consideration. NOTE 4 – ACCOUNTS RECEIVABLE
Accounts receivable are carried on the consolidated statement of financial position net of allowance for doubtful accounts. This provision is established based on the Company’s best estimates regarding the ultimate recovery of balances for which collection is uncertain. Uncertainty of ultimate collection may become apparent from various indicators, such as a deterioration of the credit situation of a given client and delay in collection beyond the contractually agreed upon payment terms. Management regularly reviews accounts receivable, monitors past due balances and assesses the appropriateness of the allowance for doubtful accounts.
CAE Year-End Financial Results 2014 | 23
Details of accounts receivable are as follows: (amounts in millions) 2014 2013
Current trade receivables $ 178.4 $ 144.5
Past due trade receivables 1-30 days 43.3 37.7
31-60 days 17.2 15.5
61-90 days 14.0 14.5
Greater than 90 days 55.5 44.2
Allowance for doubtful accounts (13.8) (9.8)
Total trade receivables $ 294.6 $ 246.6
Accrued receivables 84.4 67.7
Receivables from related parties (Note 33) 30.1 49.9
Other receivables 44.8 37.2
Total accounts receivable $ 453.9 $ 401.4

Notes to the Consolidated Financial Statements
NOTE 5 – INVENTORIES
Write-downs of inventories, net of reversals, in the amount of $0.4 million were made during fiscal 2014 (2013 – net reversal of $0.2 million). NOTE 6 – PROPERTY, PLANT AND EQUIPMENT
24 | CAE Year-End Financial Results 2014
Changes in the allowance for doubtful accounts are as follows: (amounts in millions) 2014 2013
Allowance for doubtful accounts, beginning of year $ (9.8) $ (7.0)
Additions (5.6) (6.8)
Amounts charged off 1.0 2.3
Unused amounts reversed 1.6 1.4
Exchange differences (1.0) 0.3
Allowance for doubtful accounts, end of year $ (13.8) $ (9.8)
(amounts in millions) 2014 2013
Work in progress $ 129.7 $ 103.1
Raw materials, supplies and manufactured products 89.8 73.1
$ 219.5 $ 176.2
The amount of inventories recognized as cost of sales is as follows: (amounts in millions) 2014 2013
Work in progress $ 79.3 $ 64.8
Raw materials, supplies and manufactured products 69.7 40.7
$ 149.0 $ 105.5
Assets Buildings Machinery Aircraft and under Assets and and aircraft finance under (amounts in millions) Land improvements Simulators equipment engines lease construction Total Net book value at March 31, 2012 $ 26.3 $ 161.2 $ 535.1 $ 54.7 $ 7.2 $ 115.0 $ 93.7 $ 993.2
Additions - 17.9 11.8 4.2 0.3 - 62.5 96.7
Acquisition of subsidiaries - 11.7 91.1 2.9 12.8 32.6 - 151.1
Acquisition of assets under finance lease - - - - - 5.0 - 5.0
Disposals - (1.0) (5.1) - (0.1) - (0.3) (6.5)
Depreciation - (12.0) (49.3) (12.3) (1.5) (18.8) - (93.9)
Transfers and others - (0.3) 54.0 (1.6) (2.4) (7.6) (48.2) (6.1)
Exchange differences (0.3) (1.0) (0.5) (0.5) 0.2 3.6 1.8 3.3
Net book value at March 31, 2013 $ 26.0 $ 176.5 $ 637.1 $ 47.4 $ 16.5 $ 129.8 $ 109.5 $ 1,142.8
Additions - 13.7 6.5 13.3 4.0 - 119.9 157.4
Acquisition of assets under finance lease - - - - - 33.4 - 33.4
Disposals (2.2) (2.5) (2.9) - (2.2) - - (9.8)
Depreciation - (14.6) (51.0) (15.3) (2.2) (16.4) - (99.5)
Impairment (Note 20) - (0.6) - - - - - (0.6)
Transfers and others - 4.6 72.0 3.6 (0.1) (2.1) (78.5) (0.5)
Exchange differences 2.7 15.1 77.9 3.4 0.8 12.9 5.2 118.0 Net book value at March 31, 2014 $ 26.5 $ 192.2 $ 739.6 $ 52.4 $ 16.8 $ 157.6 $ 156.1 $ 1,341.2

Notes to the Consolidated Financial Statements
As at March 31 , 2014 , the average remaining amortization period for full-flight simulators is 11.5 years (2013 – 12.0 years). As at March 31 , 2014 , bank borrowings are collateralized by property, plant and equipment for a value of $13.0 million (2013 – $10.0 million). As at March 31, 2014, the net book value of simulators leased out to third parties is $23.4 million (2013 – $22.3 million).
NOTE 7 – INTANGIBLE ASSETS
CAE Year-End Financial Results 2014 | 25
Assets Buildings Machinery Aircraft and under Assets and and aircraft finance under (amounts in millions) Land improvements Simulators equipment engines lease construction Total Cost $ 26.0 $ 302.1 $ 847.9 $ 197.6 $ 24.8 $ 269.0 $ 109.5 $ 1,776.9
Accumulated depreciation - (125.6) (210.8) (150.2) (8.3) (139.2) - (634.1) Net book value at March 31, 2013 $ 26.0 $ 176.5 $ 637.1 $ 47.4 $ 16.5 $ 129.8 $ 109.5 $ 1,142.8
Cost $ 26.5 $ 336.4 $ 1,013.3 $ 224.8 $ 23.7 $ 261.3 $ 156.1 $ 2,042.1
Accumulated depreciation - (144.2) (273.7) (172.4) (6.9) (103.7) - (700.9) Net book value at March 31, 2014 $ 26.5 $ 192.2 $ 739.6 $ 52.4 $ 16.8 $ 157.6 $ 156.1 $ 1,341.2
Assets under finance lease, with lease terms between 2 and 21 years, include simulators, buildings and machinery and equipment, as follows: (amounts in millions) 2014 2013
Simulators Cost $ 223.5 $ 234.2
Accumulated depreciation (89.1) (127.4)
Net book value $ 134.4 $ 106.8
Buildings Cost $ 37.2 $ 34.2
Accumulated depreciation (14.0) (11.2)
Net book value $ 23.2 $ 23.0
Machinery and equipment Cost $ 0.6 $ 0.6
Accumulated depreciation (0.6) (0.6)
Net book value $ - $ -
Total net book value $ 157.6 $ 129.8
Capitalized ERP and Other Goodwill development Customer other intangible
(amounts in millions) (Note 20) costs relationships software Technology assets Total Net book value at March 31, 2012 $ 298.1 $ 71.0 $ 56.8 $ 57.1 $ 27.7 $ 17.2 $ 527.9
Additions – internal development - 49.6 - 19.2 - - 68.8
Additions – acquired separately - - 6.2 - - - 6.2
Acquisition of subsidiaries 149.8 0.8 63.7 1.1 0.8 17.6 233.8
Amortization - (8.9) (12.5) (9.4) (3.9) (3.2) (37.9)
Transfers and others - (8.1) 0.8 (2.6) - - (9.9)
Exchange differences 4.1 0.1 1.0 - 0.1 0.2 5.5
Net book value at March 31, 2013 $ 452.0 $ 104.5 $ 116.0 $ 65.4 $ 24.7 $ 31.8 $ 794.4
Additions – internal development - 48.1 - 13.6 - - 61.7
Additions – acquired separately - - 2.9 - - 0.1 3.0
Acquisition of subsidiaries 0.3 - - - - - 0.3
Amortization - (12.2) (14.5) (12.8) (4.0) (3.5) (47.0)
Transfers and others - (7.9) - (2.4) - 0.3 (10.0)
Exchange differences 50.2 1.5 10.7 0.6 1.8 3.5 68.3
Net book value at March 31, 2014 $ 502.5 $ 134.0 $ 115.1 $ 64.4 $ 22.5 $ 32.2 $ 870.7

Notes to the Consolidated Financial Statements
For the year ended March 31, 2014, amortization of $34.8 million (2013 – $28.6 million) has been recorded in cost of sales, $ 10.6 million (2013 – $7.8 million) in research and development expenses, $1.6 million (2013 – $1.5 million) in selling, general and administrative expenses and nil (2013 – nil) was capitalized. As at March 31, 2014, the average remaining amortization period for the capitalized development costs is 5.5 years (2013 – 5.0 years). The categories of capitalized development costs and ERP and other software both primarily consist of internally generated intangible assets. The Company has no indefinite life intangible assets other than goodwill. NOTE 8 – OTHER ASSETS
26 | CAE Year-End Financial Results 2014
Capitalized ERP and Other development Customer other intangible (amounts in millions) Goodwill costs relationships software Technology assets Total Cost $ 452.0 $ 145.7 $ 146.8 $ 117.5 $ 41.9 $ 50.3 $ 954.2
Accumulated depreciation - (41.2) (30.8) (52.1) (17.2) (18.5) (159.8)
Net book value at March 31, 2013 $ 452.0 $ 104.5 $ 116.0 $ 65.4 $ 24.7 $ 31.8 $ 794.4
Cost $ 502.5 $ 187.8 $ 163.9 $ 130.5 $ 44.8 $ 55.7 $ 1,085.2
Accumulated depreciation - (53.8) (48.8) (66.1) (22.3) (23.5) (214.5)
Net book value at March 31, 2014 $ 502.5 $ 134.0 $ 115.1 $ 64.4 $ 22.5 $ 32.2 $ 870.7
(amounts in millions) 2014 2013
Restricted cash $ 24.1 $ 4.1
Prepaid rent to a portfolio investment 78.6 77.5
Investment in a portfolio investment 1.5 1.3
Advances to a portfolio investment 50.2 33.9
Deferred financing costs (1) 3.8 4.2
Non-current receivables 87.7 80.8
Investment tax credits 138.1 -
Other (1) 16.1 10.1
$ 400.1 $ 211.9
(1)
The related amortization for deferred financing costs for the year amounted to $0.7 million (2013 – $0.8 million). The related amortization for other for the year amounted to $0.4 million (2013 – $0.9 million).
Finance lease receivables The present value of future minimum lease payment receivables, included in the current and non-current receivables is as follows: (amounts in millions) 2014 2013
Gross investment in finance lease contracts $ 97.6 $ 65.4
Less: unearned finance income 40.8 25.0
Less: discounted unguaranteed residual values of leased assets 0.9 0.5
Present value of future minimum lease payment receivables $ 55.9 $ 39.9
Future minimum lease payments from investments in finance lease contracts to be received are as follows: (amounts in millions) 2014 2013
Present value of Present value of Gross future minimum Gross future minimum Investment lease payments Investment lease payments No later than 1 year $ 3.0 $ 2.1 $ 2.7 $ 1.8
Later than 1 year and no later than 5 years 17.6 7.8 11.5 5.3
Later than 5 years 77.0 46.0 51.2 32.8
$ 97.6 $ 55.9 $ 65.4 $ 39.9

Notes to the Consolidated Financial Statements NOTE 9 – ACCOUNTS PAYABLE AND ACCRUED LIABILITIES
NOTE 10 – CONTRACTS IN PROGRESS
The amounts recognized in the consolidated statement of financial position correspond, for each construction contract, to the aggregate amount of costs incurred plus recognized profits (less recognized losses), less progress billings and amounts sold.
Advances received from customers on construction contracts related to work not yet commenced amounts to $31.7 million at March 31, 2014 ( 2013 – $1.6 million). Construction contracts revenue recognized in fiscal 2014 amounts to $763.4 million ( 2013 – $822.3 million). NOTE 11 – PROVISIONS
Restoration and simulator removal In certain situations, simulators are installed at locations that are not owned by the Company. In some of these cases, the Company has an obligation to dismantle and remove the simulators from these sites and to restore the location to its original condition. A provision is recognized for the present value of estimated costs to be incurred to dismantle and remove the simulators from these sites and restore the location. The provision also includes amounts relating to leased land and building where restoration costs are contractually required at the end of the lease. Where such costs arise as a result of capital expenditure on the leased asset, the restoration costs are also capitalized. Restructuring Restructuring costs consist mainly of severances and other related costs. Legal claims The amount represents a provision for certain legal claims brought against the Company. The corresponding charge is recognized in the consolidated income statement within selling, general and administrative expenses. Management’s best estimate is that the outcome of these legal claims will not give rise to any significant loss beyond the amounts provided at March 31, 2014. Warranties A provision is recognized for expected warranty claims on products sold in the last two years, based on past experience of the level of repairs and returns. It is expected that most of these costs will be incurred in the next financial year. Assumptions used to calculate the provision for warranties were based on current sales levels and current information available about returns based on the warranty period of products sold.
CAE Year-End Financial Results 2014 | 27
(amounts in millions) 2014 2013
Accounts payable trade $ 288.1 $ 268.7
Accrued liabilities 255.1 234.7
Amounts due to related parties (Note 33) 16.3 25.3
Deferred revenue 117.3 101.9
Current portion of royalty obligations 8.2 13.6
$ 685.0 $ 644.2
(amounts in millions) 2014 2013
Contracts in progress: assets $ 256.4 $ 265.6
Contracts in progress: liabilities (167.4) (122.3)
Contracts in progress: net assets $ 89.0 $ 143.3
These amounts correspond to: (amounts in millions) 2014 2013
Aggregate amount of costs incurred plus recognized profits (less recognized losses) to date $ 3,128.8 $ 3,094.4
Less: progress billing 3,035.6 2,948.0
Less: amounts sold 4.2 3.1
Contracts in progress: net assets $ 89.0 $ 143.3

Notes to the Consolidated Financial Statements
NOTE 12 – DEBT FACILITIES
Long-term debt, net of transaction costs is as follows:
28 | CAE Year-End Financial Results 2014
Changes in provisions are as follows: Contingent Restoration consideration arising and simulator Restructuring Legal on business Other (amounts in millions) removal (Note 22) claims Warranties combinations provisions Total Total provisions, beginning of year $ 4.0 $ 27.9 $ 5.2 $ 8.4 $ 3.5 $ 7.9 $ 56.9
Additions including increases to existing provisions 0.1 - - 9.2 0.3 10.3 19.9
Amounts used - (16.7) (0.8) (11.7) (0.8) (9.3) (39.3)
Unused amounts reversed (0.4) - (3.8) (0.1) (0.4) (1.4) (6.1)
Changes in the discounted amount - - - - 0.2 - 0.2
Exchange differences 0.6 1.9 0.2 - 0.1 0.6 3.4
Total provisions, end of year $ 4.3 $ 13.1 $ 0.8 $ 5.8 $ 2.9 $ 8.1 $ 35.0
Less: current portion 0.4 13.1 0.4 5.8 0.8 8.1 28.6 Long -term portion $ 3.9 $ - $ 0.4 $ - $ 2.1 $ - $ 6.4
(amounts in millions) 2014 2013
Total recourse debt $ 1,130.3 $ 1,067.6
Total non-recourse debt (1) 38.2 5.8
Total long-term debt $ 1,168.5 $ 1,073.4
Less: Current portion of long-term debt 23.8 43.7
Current portion of finance leases 26.8 26.9
$ 1,117.9 $ 1,002.8
(1)
Non-recourse debt is a debt in a subsidiary for which recourse is limited to the assets, equity, interest and undertaking of such subsidiary and not CAE Inc.
Details of the recourse debt are as follows: (amounts in millions) 2014 2013
(i) Senior notes ($125.0 and US$225.0 maturing between December 2019 and December 2027),
floating interest rates based on bankers’ acceptances rate plus a spread on $50.0 million and interest rate ranging from 3.59% and 4.15% for remaining $75.0 and US$225.0 $ 373.7 $ 353.5
(ii) Senior notes ($15.0 and US$45.0 maturing in June 2016 and US$60.0 maturing in June 2019), average blended rate of 7.15% payable semi-annually in June and December 128.6 119.0
(iii) Senior notes (US$100.0 maturing in August 2021 and US$50.0 maturing in August 2026), average blended rate of 4.47% payable semi-annually in August and February 165.8 152.3
(iv) Revolving unsecured term credit facilities maturing in October 2018 (US$550.0) 54.3 67.5 (v) Obligations under finance lease commitments, with various maturities from May 2014 to October
2036, interest rates from 2.75% to 10.69% 159.2 142.5 (vi) Term loan maturing in June 2014 (outstanding as at March 31, 2014 – US$1.5 and £0.7, as at
March 31, 2013 – US$7.7 and £3.2) 2.8 12.4
Term loan maturing in June 2018 (outstanding as at March 31, 2014 – US$43.2 and £8.5, as at March 31, 2013 – US$43.2 and £8.5) 61.7 55.2
Combined coupon rate of post-swap debt of 7.98% (2013 – 6.92%) (vii) R&D obligation from a government agency maturing in July 2029 139.1 97.5 (viii) R&D obligation from a government agency maturing in July 2035 1.3 - (ix) Term loan maturing in January 2020 (outstanding as at March 31, 2014 – €3.6, as at March 31,
2013 – €4.4), floating interest rate of EURIBOR plus a spread 5.3 5.5 (x) Credit facility maturing in January 2015 (outstanding as at March 31, 2014 – $1.4 and INR 294.2, as
at March 31, 2013 – $2.2 and INR 349.2), bearing interest based on floating interest rates in India prevailing at the time of each drawdown 6.8 8.7
(xi) Term loan, maturing in October 2022 (outstanding as at March 31, 2014 – US$13.7, as at March 31, 2013 – $US15.4), bearing interest at a fixed rate of 4.14% 15.1 15.6
(xii) Other debts, with various maturities from June 2014 to March 2024, average interest rate of approximately 2.53% 16.6 37.9
Total recourse debt, net amount $ 1,130.3 $ 1,067.6

Notes to the Consolidated Financial Statements (i) Represents unsecured senior notes for $125.0 million and US$225.0 million by way of a private placement. (ii) Represents unsecured senior notes for $15.0 million and US$105.0 million by way of a private placement. (iii) Represents unsecured senior notes for US$150.0 million by way of a private placement. (iv) Represents revolving unsecured term credit facilities with a maturity date of October 2018. The available facility amount is US$550.0 million with an option, subject to the lender’s consent, to
increase to a total amount of up to US$850.0 million. The facility has covenants requiring a minimum fixed charge coverage and a maximum debt coverage. The applicable interest rate on this revolving term credit facility is at the option of the Company, based on the bank’s prime rate, bankers’ acceptance rates or LIBOR plus a spread which depends on the credit rating assigned by Standard & Poor’s Rating Services.
(v) These finance leases relate to the leasing of various buildings, simulators, machinery and equipment.
In September 2013 and October 2013, we entered into various finance leases, for the leasing of simulators located in the U.S. These transactions represent a total finance lease obligation of $34.2 million as at March 31, 2014.
(vi) Represents senior financing for two civil aviation training centres. Tranche A is repaid in quarterly instalments of principal and interest while Tranche B begins quarterly amortization in July 2014. (vii) Represents an interest-bearing long-term obligation with the Government of Canada relative to Project Falcon, an R&D program that ended at the end of fiscal 2014, for a maximum amount of
$250.0 million. The aggregate amount recognized at the end of fiscal 2014 was $250.0 million (2013 – $200.8 million) (see Note 1). The discounted value of the debt recognized amounted to $139.1 million as at March 31, 2014 (2013 – $97.5 million).
(viii) In fiscal 2014, the Company entered into an interest-bearing long-term obligation with the Government of Canada relative to Project Innovate, an R&D program extending over five and half years,
for a maximum amount of $250.0 million. The aggregate amount recognized in fiscal 2014 was 2.7 million. The discounted value of the debt recognized amounted to $1.3 million as at March 31, 2014.
(ix) Represents a loan agreement of $5.3 million (€3.6 million) (2013 – $5.7 million (€4.4 million)) for the financing of one of the Company’s subsidiaries. (x) Represents the financing facility for certain of the Company’s operations in India. The financing facility is comprised of a term loan of up to $8.6 million (INR 470.0 million) and working capital
facilities of up to an aggregate of $2.3 million (INR 125.0 million). Drawdowns can be made in INR or any other major currencies acceptable to the lender.
(xi) Represents a term loan maturing in October 2022 to finance simulators. (xii) Other debts include an unsecured facility for the financing of the cost of establishment of an ERP system. The facility is repayable with monthly repayments over a term of seven years beginning
at the end of the first month following each quarterly disbursement. Other debts also include bonds for which US$11.0 million (2013 – US$30.8 million) of letters of credit have been issued to support the bonds for the outstanding amount of the loans. Combined interest rate for these bonds is 1.79% (2013 – 2.15%).
(i) The credit facility to finance the Company’s MSH program for the MoD in the U.K., includes a term loan that is collateralized by the project assets of the subsidiary and a bi-annual repayment that
is required until 2016. The Company has entered into an interest rate swap totalling £0.9 million as at March 31, 2014 (2013 – £1.1 million) fixing the interest rate at 6.31%. The book value of the assets pledged as collateral for the credit facility as at March 31, 2014 is £85.2 million (2013 – £73.2 million).
(ii) Represents collateralized non-recourse financing for a term loan to finance CAE Brunei Multi Purpose Training Centre Sdn Bhd (MPTC). MPTC may also avail an additional amount of up to
US$12.0 million in the form of letters of credit.
CAE Year-End Financial Results 2014 | 29
Details of the non-recourse debt are as follows: (amounts in millions) 2014 2013 (i) Term loan of £12.7 collateralized, maturing in October 2016 (outstanding as at March 31, 2014 –
£1.1, as at March 31, 2013 – £1.3), interest rate of LIBOR plus 1.05% $ 1.9 $ 2.1 (ii) Term loan of US$48.0 collateralized, maturing in March 2028 (outstanding as at March 31, 2014 –
US$33.1, as at March 31, 2013 – US$4.0), interest rate of LIBOR plus 2.50% 36.3 3.7
Total non-recourse debt, net amount $ 38.2 $ 5.8

Notes to the Consolidated Financial Statements
As at March 31, 2014, the Company is in compliance with all of its financial covenants.
NOTE 13 – GOVERNMENT ASSISTANCE
The Company has signed agreements with various governments whereby the latter share in the cost, based on expenditures incurred by the Company, of certain R&D programs for modeling, simulation and training services expertise. During fiscal 2009, the Company announced Project Falcon, an R&D program that extended over five years. The goal of Project Falcon was to expand the Company’s modeling and simulation technologies, develop new ones and increase its capabilities beyond training into other areas of the aerospace and defence market, such as analysis and operations. Concurrently, the Government of Canada agreed to participate in Project Falcon through a repayable investment of up to $250 million made through the Strategic Aerospace and Defence Initiative (SADI), which supports strategic industrial research and pre-competitive development projects in the aerospace, defence, space and security industries. As at March 31, 2014, Project Falcon was completed. During fiscal 2010, the Company announced Project New Core Markets, an R&D program extending over seven years. The aim is to leverage the Company’s modeling, simulation and training services expertise into the healthcare and mining markets. The Québec government, through Investissement Québec, agreed to participate up to $100 million in contributions related to costs incurred before the end of fiscal 2016. During fiscal 2014, the Company announced Project Innovate, an R&D program extending over five and a half years. The goal of Project Innovate is to expand the Company’s modeling and simulation technologies, develop new ones and continue to differentiate its service offering. Concurrently, the Government of Canada agreed to participate in Project Innovate through a repayable investment of up to $250 million made through the SADI. See Notes 1 and 12 for explanations of the royalty obligations and debt. 30 | CAE Year-End Financial Results 2014
Payments required in each of the next five fiscal years to meet the retirement provisions of the long-term debt and face values of finance leases are as follows: Long-term Finance (amounts in millions) debt leases Total 2015 $ 24.5 $ 26.8 $ 51.3
2016 31.9 20.1 52.0
2017 98.2 13.7 111.9
2018 34.4 13.7 48.1
2019 75.9 11.5 87.4
Thereafter 749.1 73.4 822.5
Total payments required $ 1,014.0 $ 159.2 $ 1,173.2
Less: transaction costs (4.7) - (4.7)
$ 1,009.3 $ 159.2 $ 1,168.5
Finance lease commitments The present value of future finance lease commitments, included in debt facilities is as follows: (amounts in millions) 2014 2013
Future finance lease commitments $ 228.1 $ 209.0
Less: Future finance charges on finance leases 61.1 59.2
Less: Discounted guaranteed residual values of leased assets 7.8 7.3
Present value of future minimum lease payments $ 159.2 $ 142.5
Future minimum lease payments for finance lease commitments are as follows: (amounts in millions) 2014 2013
Future Present value of Future Present value of finance lease future minimum finance lease future minimum
commitments lease payments commitments lease payments No later than 1 year $ 35.8 $ 26.8 $ 35.5 $ 26.9
Later than 1 year and no later than 5 years 85.4 59.0 77.8 54.2
Later than 5 years 106.9 73.4 95.7 61.4
$ 228.1 $ 159.2 $ 209.0 $ 142.5

Notes to the Consolidated Financial Statements The following table provides aggregate information regarding contributions recognized and amounts not yet received for the projects Falcon, New Core Markets and Innovate:
NOTE 14 – EMPLOYEE BENEFITS OBLIGATIONS
Defined benefit plans The Company has two registered funded defined benefit pension plans in Canada (one for employees and one for designated executives) that provide benefits based on length of service and final average earnings. The Company also maintains funded pension plans for employees in the Netherlands, United Kingdom and Norway that provide benefits based on similar provisions. The Company, as required by pension legislation, hires independent firms to conduct actuarial valuations. The Company’s annual contributions, to fund both benefits accruing in the year and deficits accumulated over prior years, and the plans’ financial position are determined based on the actuarial valuations. Applicable pension legislations prescribe minimum funding requirements. In addition, the Company maintains unfunded plans in Canada, Germany and Norway that provide defined benefits based on length of service and final average earnings. These unfunded plans are the sole obligation of the Company, and there is no requirement to fund them. However, the Company is obligated to pay the benefits when they become due. As at March 31, 2014, the unfunded defined benefits pension obligations are $66.0 million (2013 – $59.7 million) and the Company has issued letters of credit totalling $53.0 million (2013 – $54.3 million) to collateralize these obligations under the Canadian plan. The funded plans are trustee administered funds. Plan assets held in trusts are governed by local regulations and practices in each country, as is the nature of the relationship between the Company and the trustees and their composition. Responsibility for governance of the plans, including investment decisions and contribution schedules, lies jointly with the Company and the board of trustees. In fiscal 2014, the Company temporarily amended its early retirement provision, as a result, a past service cost of $1.0 million was recognized in the income statement. In fiscal 2013, in accordance with a restructuring plan, the Company reduced its workforce and consequently recognized a curtailment gain of $2.1 million and a settlement loss of $1.3 million. In fiscal 2013, in the acquisition of OAA, the Company assumed two pension plans resulting in additional pension obligations of $2.3 million and additional plan assets of $1.7 million.
CAE Year-End Financial Results 2014 | 31
(amounts in millions) 2014 2013
Outstanding contribution receivable, beginning of year $ 5.8 $ 8.3
Contributions 19.3 29.4
Payments received (20.1) (31.9)
Outstanding contribution receivable, end of year $ 5.0 $ 5.8
Aggregate information about programs The aggregate contributions recognized for all programs are as follows: (amounts in millions) 2014 2013
Contributions credited to capitalized expenditures: Project Falcon $ 3.0 $ 6.4
Project New Core Markets 3.4 3.7
Project Innovate 0.9 -
Contributions credited to income: Project Falcon $ 10.0 $ 17.6
Project New Core Markets 1.5 1.7
Project Innovate 0.5 -
Total contributions: Project Falcon $ 13.0 $ 24.0
Project New Core Markets 4.9 5.4
Project Innovate 1.4 -
There are no unfulfilled conditions or unfulfilled contingencies attached to these government contributions.

Notes to the Consolidated Financial Statements
32 | CAE Year-End Financial Results 2014
The employee benefits obligations are as follows: (amounts in millions) 2014 2013 Funded defined benefits pension obligations $ 406.9 $ 377.7 Fair value of plan assets 357.4 301.3 Funded defined benefits pension obligations – net 49.5 76.4 Unfunded defined benefits pension obligations 66.0 59.7 Employee benefits obligations $ 115.5 $ 136.1
The changes in the funded defined benefits pension obligations and the fair value of plan assets are as follows: (amounts in millions) 2014 2013
Canadian Foreign Total Canadian Foreign Total Pension obligations, beginning of year $ 330.9 $ 46.8 $ 377.7 $ 279.4 $ 41.0 $ 320.4
Current service cost 17.8 1.7 19.5 13.6 1.6 15.2
Interest cost 14.0 1.8 15.8 13.3 1.7 15.0
Past service cost and settlements 1.0 - 1.0 (5.1) - (5.1)
Actuarial loss (gain) arising from: Experience adjustments 5.8 (1.1) 4.7 9.2 (0.7) 8.5
Economic assumptions (24.1) 0.5 (23.6) 28.0 2.4 30.4
Demographic assumptions 13.5 1.2 14.7 - (0.4) (0.4)
Employee contributions 5.1 0.3 5.4 3.6 0.3 3.9
Pension benefits paid (14.2) (1.0) (15.2) (11.1) (0.6) (11.7)
Business combination - - - - 2.3 2.3
Exchange differences - 6.9 6.9 - (0.8) (0.8) Pension obligations, end of year $ 349.8 $ 57.1 $ 406.9 $ 330.9 $ 46.8 $ 377.7
Fair value of plan assets, beginning of year $ 259.2 $ 42.1 $ 301.3 $ 228.6 $ 34.6 $ 263.2
Interest income 11.5 1.6 13.1 11.3 1.3 12.6
Return on plan assets, excluding amounts
included in interest income 14.4 (2.0) 12.4 9.2 3.4 12.6
Employer contributions 32.9 2.1 35.0 22.5 2.2 24.7
Employee contributions 5.1 0.3 5.4 3.6 0.3 3.9
Pension benefits paid (14.2) (1.0) (15.2) (11.1) (0.6) (11.7)
Settlements - - - (4.3) - (4.3)
Business combination - - - - 1.7 1.7
Administrative costs (0.8) (0.2) (1.0) (0.6) - (0.6)
Exchange differences - 6.4 6.4 - (0.8) (0.8) Fair value of plan assets, end of year $ 308.1 $ 49.3 $ 357.4 $ 259.2 $ 42.1 $ 301.3
The actual return on plan assets was $25.5 million in fiscal 2014 (2013 – $25.2 million).
The changes in the unfunded defined benefits pension obligations are as follows: (amounts in millions) 2014 2013
Canadian Foreign Total Canadian Foreign Total Pension obligations, beginning of year $ 49.2 $ 10.5 $ 59.7 $ 47.9 $ 9.2 $ 57.1
Current service cost 2.1 0.2 2.3 2.3 0.1 2.4
Interest cost 2.1 0.4 2.5 2.3 0.4 2.7
Past service cost 0.1 - 0.1 0.6 - 0.6
Actuarial loss (gain) arising from: Experience adjustments 1.1 (0.1) 1.0 (4.5) (0.5) (5.0)
Economic assumptions (1.9) 0.5 (1.4) 3.1 2.0 5.1
Demographic assumptions 3.5 0.1 3.6 - - -
Pension benefits paid (2.6) (0.6) (3.2) (2.5) (0.5) (3.0)
Exchange differences - 1.4 1.4 - (0.2) (0.2) Pension obligations, end of year $ 53.6 $ 12.4 $ 66.0 $ 49.2 $ 10.5 $ 59.7
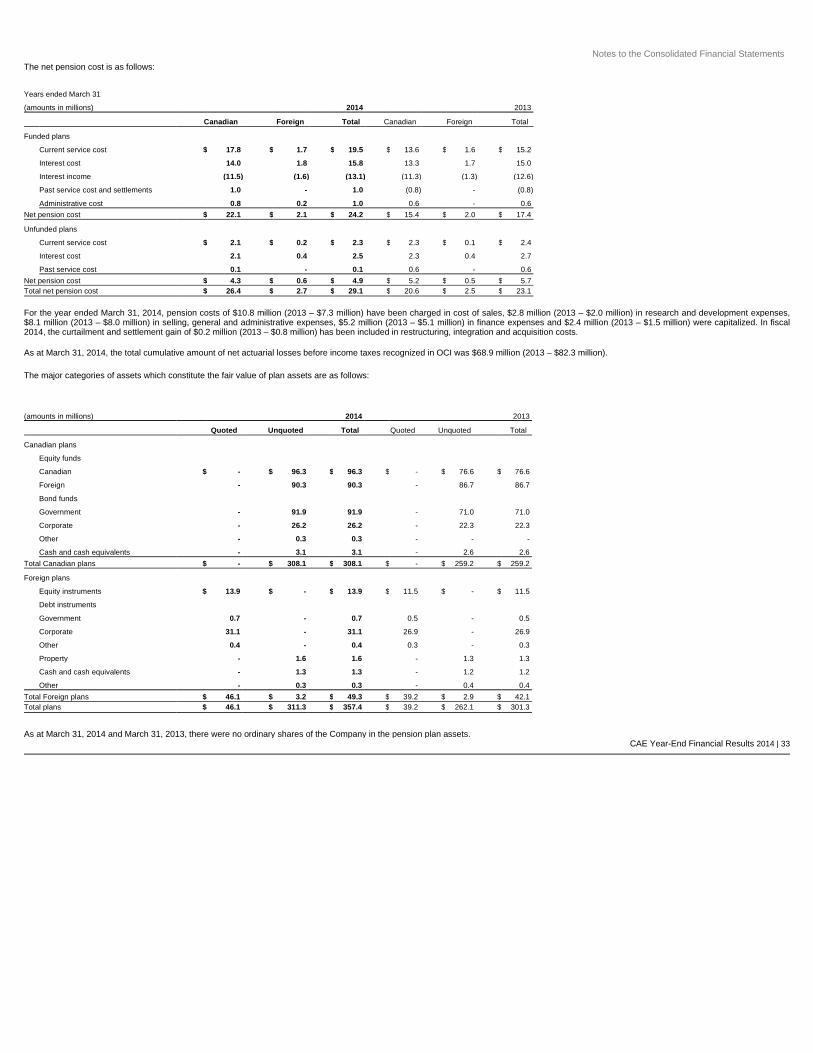
Notes to the Consolidated Financial Statements
For the year ended March 31, 2014, pension costs of $10.8 million (2013 – $7.3 million) have been charged in cost of sales, $2.8 million (2013 – $2.0 million) in research and development expenses, $8.1 million (2013 – $8.0 million) in selling, general and administrative expenses, $5.2 million (2013 – $5.1 million) in finance expenses and $2.4 million (2013 – $1.5 million) were capitalized. In fiscal 2014, the curtailment and settlement gain of $0.2 million (2013 – $0.8 million) has been included in restructuring, integration and acquisition costs. As at March 31, 2014, the total cumulative amount of net actuarial losses before income taxes recognized in OCI was $68.9 million (2013 – $82.3 million).
CAE Year-End Financial Results 2014 | 33
The net pension cost is as follows: Years ended March 31 (amounts in millions) 2014 2013
Canadian Foreign Total Canadian Foreign Total Funded plans Current service cost $ 17.8 $ 1.7 $ 19.5 $ 13.6 $ 1.6 $ 15.2
Interest cost 14.0 1.8 15.8 13.3 1.7 15.0
Interest income (11.5) (1.6) (13.1) (11.3) (1.3) (12.6)
Past service cost and settlements 1.0 - 1.0 (0.8) - (0.8)
Administrative cost 0.8 0.2 1.0 0.6 - 0.6
Net pension cost $ 22.1 $ 2.1 $ 24.2 $ 15.4 $ 2.0 $ 17.4
Unfunded plans Current service cost $ 2.1 $ 0.2 $ 2.3 $ 2.3 $ 0.1 $ 2.4
Interest cost 2.1 0.4 2.5 2.3 0.4 2.7
Past service cost 0.1 - 0.1 0.6 - 0.6
Net pension cost $ 4.3 $ 0.6 $ 4.9 $ 5.2 $ 0.5 $ 5.7 Total net pension cost $ 26.4 $ 2.7 $ 29.1 $ 20.6 $ 2.5 $ 23.1
The major categories of assets which constitute the fair value of plan assets are as follows: (amounts in millions) 2014 2013
Quoted Unquoted Total Quoted Unquoted Total Canadian plans Equity funds Canadian $ - $ 96.3 $ 96.3 $ - $ 76.6 $ 76.6
Foreign - 90.3 90.3 - 86.7 86.7
Bond funds Government - 91.9 91.9 - 71.0 71.0
Corporate - 26.2 26.2 - 22.3 22.3
Other - 0.3 0.3 - - -
Cash and cash equivalents - 3.1 3.1 - 2.6 2.6
Total Canadian plans $ - $ 308.1 $ 308.1 $ - $ 259.2 $ 259.2
Foreign plans Equity instruments $ 13.9 $ - $ 13.9 $ 11.5 $ - $ 11.5
Debt instruments Government 0.7 - 0.7 0.5 - 0.5
Corporate 31.1 - 31.1 26.9 - 26.9
Other 0.4 - 0.4 0.3 - 0.3
Property - 1.6 1.6 - 1.3 1.3
Cash and cash equivalents - 1.3 1.3 - 1.2 1.2
Other - 0.3 0.3 - 0.4 0.4
Total Foreign plans $ 46.1 $ 3.2 $ 49.3 $ 39.2 $ 2.9 $ 42.1 Total plans $ 46.1 $ 311.3 $ 357.4 $ 39.2 $ 262.1 $ 301.3
As at March 31, 2014 and March 31, 2013, there were no ordinary shares of the Company in the pension plan assets.

Notes to the Consolidated Financial Statements
Assumptions regarding future mortality are based on actuarial advice in accordance with published statistics and mortality tables and experience in each territory. The mortality tables and the average life expectancy in years for a member age 45 and 65 are as follows:
34 | CAE Year-End Financial Results 2014
Significant assumptions (weighted average): Canadian Foreign 2014 2013 2014 2013
Pension obligations as at March 31: Discount rate 4.50% 4.25% 3.47% 3.53% Compensation rate increases 3.50% 3.50% 3.03% 2.98% Net pension cost for years ended March 31: Discount rate 4.25% 4.75% 3.53% 4.05% Compensation rate increases 3.50% 3.50% 2.98% 3.01%
As at March 31, 2014 (in years) Life expectancy over 65 for a member Country Mortality table Male at age 45 Male at age 65 Female at age 45 Female at age 65 Canada CPM private tables (employees) 25.1 23.6 26.5 25.4
Canada CPM private tables (designated executives) 26.5 25.1 27.1 26.1
Netherlands AG2012-2062 23.3 21.6 24.4 23.4
Germany Heubeck RT2005G 21.4 18.7 25.3 22.8
Norway K2013 21.8 20.4 25.2 23.2
United Kingdom S1PA 24.2 22.4 26.7 24.7
As at March 31, 2013 (in years) Life expectancy over 65 for a member Country Mortality table Male at age 45 Male at age 65 Female at age 45 Female at age 65 Canada UP94 21.3 19.8 22.9 22.1
Netherlands AG2012-2062 23.3 21.5 24.4 23.3
Germany Heubeck RT2005G 21.3 18.6 25.2 22.7
Norway K2005 19.3 19.3 21.8 21.8
United Kingdom S1PA 24.3 22.0 27.0 24.6
The weighted average duration of the defined benefit obligation is 18.1 years. The following table summarizes the impact on the defined benefit obligation as a result of a 0.25% change in the significant assumptions as at March 31, 2014: Funded plans Unfunded plans (amounts in millions) Canadian Foreign Canadian Foreign Total Discount rate: Increase $ (15.4) $ (2.5) $ (1.8) $ (0.4) $ (20.1)
Decrease 16.5 2.9 1.9 0.4 21.7
Compensation rate: Increase 5.6 0.4 0.3 - 6.3
Decrease (5.5) (0.4) (0.3) - (6.2)

Notes to the Consolidated Financial Statements Through its defined benefit plans, the Company is exposed to a number of risks, the most significant being the exposure to asset volatility, to changes in bond yields and to changes in life expectancy. The plan liabilities are calculated using a discount rate set with reference to corporate bond yields, if plan assets underperform against this yield, this will create a deficit. A decrease in corporate bond yields will increase plan liabilities, although this will be partially offset by an increase in the value of the plans’ bond holdings. The plans’ obligations are to provide benefits for the duration of the life of its members, therefore, increases in life expectancy will result in an increase in the plans’ liabilities.
NOTE 15 – DEFERRED GAINS AND OTHER NON-CURRENT LIAB ILITIES
NOTE 16 – INCOME TAXES
The applicable statutory tax rates are 26.94% in 2014 and 26.74% in 2013. The Company's applicable tax rate is the Canadian combined rates applicable in the jurisdictions in which the Company operates. The increase is due to a change in the mix of income from provincial jurisdictions.
CAE Year-End Financial Results 2014 | 35
Contributions reflect actuarial assumptions of future investment returns, salary projections and future service benefits. The expected contribution for the next fiscal year is as follows: Funded plans Unfunded plans (amounts in millions) Canadian Foreign Canadian Foreign Total Expected contribution – fiscal 2015 $ 18.4 $ 2.1 $ 2.4 $ 0.6 $ 23.5
(amounts in millions) 2014 2013
Deferred gains on sale and leasebacks (1) $ 32.8 $ 36.5
Deferred revenue 95.5 91.8
LTI-RSU/DSU compensation obligations (Note 24) 38.2 29.3
Licence payable 4.4 4.5
Purchase options 16.9 14.7
Other 16.4 14.6
$ 204.2 $ 191.4
(1)
The related amortization for the year amounted to $4.2 million (2013 – $4.5 million).
Income tax expense A reconciliation of income taxes at Canadian statutory rates with the reported income taxes is as follows: Years ended March 31 (amounts in millions, except for income tax rates) 2014 2013
Earnings before income taxes $ 221.1 $ 168.9
Canadian statutory income tax rates 26.94% 26.74%
Income taxes at Canadian statutory rates $ 59.5 $ 45.2
Difference between Canadian and Foreign statutory rates (8.0) (8.7)
Losses not tax effected 5.5 6.5
Tax benefit of operating losses not previously recognized (3.5) (0.3)
Non-taxable capital gain (0.5) (0.1)
Tax impact on equity accounted investees (7.1) (5.8)
Non-deductible items 2.2 6.3
Prior years' tax adjustments and assessments (8.8) (10.1)
Impact of change in income tax rates on deferred income taxes (1.5) (0.5)
Non-taxable research and development tax credits (1.3) (1.6)
Other tax benefits not previously recognized (6.6) (3.9)
Other 0.1 1.2
Income tax expense $ 30.0 $ 28.2

Notes to the Consolidated Financial Statements
During fiscal 2014, a tax recovery of $10.3 million was recorded in income and was due to a favourable decision by the Federal Court of Appeal of Canada rendered April 17, 2013, with respect to the tax treatment of the depreciation and sale of simulators in Canada. Income tax recognized in OCI During fiscal 2014, a deferred tax expense of $2.4 million was recorded in OCI (2013 – tax recovery of $11.0 million). No current income tax expense (recovery) was recognized in OCI for fiscal 2014 or fiscal 2013.
36 | CAE Year-End Financial Results 2014
Significant components of the provision for the income tax expense are as follows: (amounts in millions) 2014 2013
Current income tax expense (recovery): Current period $ 17.6 $ 1.0
Adjustment for prior years (15.2) (0.4)
Deferred income tax expense (recovery): Tax benefit not previously recognized used to reduce the deferred tax expense (10.1) (4.3)
Impact of change in income tax rates on deferred income taxes (1.5) (0.5)
Origination and reversal of temporary differences 39.2 32.4
Income tax expense $ 30.0 $ 28.2
Deferred tax assets and liabilities Deferred tax assets and liabilities are attributable to the following: As at March 31 (amounts in millions) Assets Liabilities Net 2014 2013 2014 2013 2014 2013
Non-capital loss carryforwards $ 54.0 $ 57.2 $ - $ - $ 54.0 $ 57.2
Intangible assets 3.6 4.3 (76.4) (72.3) (72.8) (68.0)
Amounts not currently deductible 26.7 23.7 - - 26.7 23.7
Deferred revenues 8.7 8.8 - - 8.7 8.8
Tax benefit carryover 0.4 0.7 - - 0.4 0.7
Unclaimed research & development expenditures 10.5 10.2 - - 10.5 10.2
Investment tax credits - - (40.3) (31.8) (40.3) (31.8)
Property, plant and equipment 10.3 9.0 (112.7) (95.1) (102.4) (86.1) Unrealized losses (gains) on foreign exchange 1.6 0.7 (7.7) (1.8) (6.1) (1.1)
Financial instruments 8.2 3.1 (0.2) (0.2) 8.0 2.9
Government assistance - - (11.1) (9.9) (11.1) (9.9)
Employee benefit plans 27.3 32.9 - - 27.3 32.9
Percentage-of-completion versus completed contract - - (31.9) (32.7) (31.9) (32.7)
Other 1.3 0.9 (6.6) (6.3) (5.3) (5.4)
Tax assets (liabilities) $ 152.6 $ 151.5 $ (286.9) $ (250.1) $ (134.3) $ (98.6)
(120.8) (120.2) 120.8 120.2 - - Net deferred income tax assets (liabilities) $ 31.8 $ 31.3 $ (166.1) $ (129.9) $ (134.3) $ (98.6)

Notes to the Consolidated Financial Statements
As at March 31, 2014, taxable temporary differences of $565.6 million (2013 – $367.3 million) related to investments in foreign operations, including subsidiaries and interests in joint ventures has not been recognized, because the Company controls whether the liability will be incurred and it is satisfied that it will not be incurred in the foreseeable future.
CAE Year-End Financial Results 2014 | 37
Movements in temporary differences during fiscal year 2014 are as follows: Balance Recognized Recognized Acquisition Exchange Balance (amounts in millions) beginning of year in income in OCI of subsidiary differences end of year Non-capital loss carryforwards $ 57.2 $ (8.1) $ - $ - $ 4.9 $ 54.0
Intangible assets (68.0) (1.9) - - (2.9) (72.8)
Amounts not currently deductible 23.7 2.1 - - 0.9 26.7
Deferred revenues 8.8 (0.4) - - 0.3 8.7
Tax benefit carryover 0.7 (0.3) - - - 0.4
Unclaimed research & development expenditures 10.2 0.3 - - - 10.5
Investment tax credits (31.8) (8.5) - - - (40.3)
Property, plant and equipment (86.1) (7.7) - - (8.6) (102.4)
Unrealized (gains) losses on foreign exchange (1.1) (0.4) (4.3) - (0.3) (6.1)
Financial Instruments 2.9 (0.5) 5.6 - - 8.0
Government assistance (9.9) (1.2) - - - (11.1)
Employee benefit plans 32.9 (2.1) (3.7) - 0.2 27.3
Percentage-of-completion versus completed contract (32.7) 0.8 - - - (31.9)
Other (5.4) 0.3 - - (0.2) (5.3)
Net deferred income tax (liabilities) $ (98.6) $ (27.6) $ (2.4) $ - (5.7) $ (134.3)
Movements in temporary differences during fiscal year 2013 are as follows: Balance Recognized Recognized Acquisition Exchange Balance (amounts in millions) beginning of year in income in OCI of subsidiaries differences end of year Non-capital loss carryforwards $ 41.4 $ 8.8 $ - $ 6.7 $ 0.3 $ 57.2
Intangible assets (39.5) (17.2) - (10.8) (0.5) (68.0)
Amounts not currently deductible 26.4 (4.2) - 1.3 0.2 23.7
Deferred revenues 11.0 (1.8) - (0.1) (0.3) 8.8
Tax benefit carryover 5.2 (4.5) - - - 0.7
Unclaimed research & development expenditures 7.7 2.5 - - - 10.2
Investment tax credits (18.9) (12.9) - - - (31.8)
Property, plant and equipment (83.8) 6.1 - (6.4) (2.0) (86.1)
Unrealized (gains) losses on foreign exchange (4.8) 2.2 0.7 - 0.8 (1.1)
Financial Instruments 0.9 (1.3) 3.2 - 0.1 2.9
Government assistance (3.1) (6.8) - - - (9.9)
Employee benefit plans 27.2 (2.1) 7.1 0.2 0.5 32.9
Percentage-of-completion versus completed contract (36.3) 2.9 - 0.7 - (32.7)
Other (6.5) 0.7 - 0.5 (0.1) (5.4)
Net deferred income tax (liabilities) assets $ (73.1) $ (27.6) $ 11.0 $ (7.9) $ (1.0) $ (98.6)

Notes to the Consolidated Financial Statements
As at March 31, 2014, the Company has $299.2 million (2013 – $288.2 million) of deductible temporary differences for which deferred tax assets have not been recognized. These amounts will reverse during a period of up to 30 years. The Company also has $0.3 million (2013 – nil) of accumulated capital losses carried forward relating to its operations in Canada for which deferred tax assets have not been recognized. These capital losses can be carried forward indefinitely. NOTE 17 – SHARE CAPITAL, EARNINGS PER SHARE AND DIV IDENDS
Share capital Authorized shares The Company is authorized to issue an unlimited number of common shares without par value and an unlimited number of preferred shares without par value, issuable in series. The preferred shares may be issued with rights and conditions to be determined by the Board of Directors, prior to their issue. To date, the Company has not issued any preferred shares. Issued shares A reconciliation of the issued and outstanding common shares of the Company is presented in the Consolidated Statement of Changes in Equity. As at March 31, 2014, the number of shares issued and that are fully paid amount to 263,771,443 (2013 – 259,979,059).
Dividends
The dividends declared for fiscal 2014 were $57.6 million or $0.22 per share (2013 – $49.2 million or $0.19 per share). 38 | CAE Year-End Financial Results 2014
The non-capital losses expire as follows: (amounts in millions) Expiry date Unrecognized Recognized 2015 $ 0.3 $ -
2016 0.3 -
2017 3.7 -
2018 2.5 -
2019 8.7 -
2020 6.2 -
2021 – 2034 24.8 56.3
No expiry date 70.0 113.3
$ 116.5 $ 169.6
Earnings per share computation The denominators for the basic and diluted earnings per share computations are as follows: Years ended March 31 2014 2013
Weighted average number of common shares outstanding 261,312,832 258,982,945
Effect of dilutive stock options 606,705 412,661
Weighted average number of common shares outstanding for diluted earnings per share calculation 261,919,537 259,395,606
As at March 31, 2014, options to acquire 589,040 common shares (2013 – 2,490,041) have been excluded from the above calculation since their inclusion would have had an anti-dilutive effect.

Notes to the Consolidated Financial Statements NOTE 18 – ACCUMULATED OTHER COMPREHENSIVE INCOME (L OSS)
NOTE 19 – EMPLOYEE COMPENSATION
NOTE 20 – IMPAIRMENT OF NON-FINANCIAL ASSETS
Goodwill is monitored by management at the operating segment level.
Goodwill is allocated to CGUs or a group of CGUs, which generally corresponds to the Company’s operating segments or one level below.
The Company’s impairment test for goodwill is based on level 3 fair value less costs of disposal calculations and uses valuation models such as the discounted cash flows model. The cash flows are derived from the projections approved by management for the next five years. Cash flow projections take into account past experience and represent management’s best estimate about future developments and form part of the Company’s strategic plan approved annually by the Board of Directors. Cash flows after the five year period are extrapolated using a constant growth rate of 2.5%. For fiscal 2014, the post-tax discount rates were derived from the respective CGUs’ representative weighted average cost of capital, which range from 7.5% to 14%. In fiscal 2014, an impairment loss of $0.6 million was recognized in TS/C cost of sales following the decision to sell a building. The recoverable amount of $4.8 million was estimated using its fair value, based on a level 2 market price, less costs of disposal. There were no impairment losses in fiscal 2013.
CAE Year-End Financial Results 2014 | 39
Net changes in Foreign currency Net changes in available-for-sale As at March 31 translation cash flow hedges financial instruments Total (amounts in millions) 2014 2013 2014 2013 2014 2013 2014 2013
Balances, beginning of year $ (7.8) $ (10.2) $ (4.6) $ 3.8 $ 0.4 $ 0.4 $ (12.0) $ (6.0)
OCI 158.3 2.4 (17.0) (8.4) 0.2 - 141.5 (6.0)
Balances, end of year $ 150.5 $ (7.8) $ (21.6) $ (4.6) $ 0.6 $ 0.4 $ 129.5 $ (12.0)
The total employee compensation expense recognized in the determination of net income is as follows: (amounts in millions) 2014 2013
Salaries and benefits $ 695.7 $ 639.5
Share-based payments, net of equity swap 19.4 14.0
Pension costs – defined benefit plans (1) 26.7 21.6
Pension costs – defined contribution plans 7.5 8.4
Termination benefits 9.9 49.9
Total employee compensation expense $ 759.2 $ 733.4
(1) Includes net interest on employee benefits obligations (Note 23).
The carrying amount of goodwill allocated to the Company's CGUs per operating segment is as follows: (amounts in millions) SP/C TS/C SP/M TS/M NCM Total Net book value at March 31, 2012 $ - $ 32.3 $ 103.1 $ 37.2 $ 125.5 $ 298.1
Acquisition of subsidiaries - 142.4 - - 7.4 149.8
Exchange differences - 1.8 0.8 0.4 1.1 4.1
Net book value at March 31, 2013 $ - $ 176.5 $ 103.9 $ 37.6 $ 134.0 $ 452.0
Acquisition of subsidiaries (Note 3) - - - - 0.3 0.3
Exchange differences - 27.6 6.3 2.8 13.5 50.2
Transfers 3.8 (3.8) - - - -
Net book value at March 31, 2014 $ 3.8 $ 200.3 $ 110.2 $ 40.4 $ 147.8 $ 502.5

Notes to the Consolidated Financial Statements NOTE 21 – OTHER GAINS – NET
NOTE 22 – RESTRUCTURING, INTEGRATION AND ACQUISITIO N COSTS
Restructuring costs Restructuring costs consist mainly of severances and other related costs. Integration costs Integration costs represent incremental costs directly related to the integration of OAA in the Company’s ongoing activities. This primarily includes expenditures related to redeployment of simulators, regulatory and process standardization, systems integration and other activities. Acquisition costs Acquisition costs include expenses, fees, commissions and other costs associated with the collection of information, negotiation of contracts, risk assessments, and the services of lawyers, advisors and specialists. NOTE 23 – FINANCE EXPENSE – NET
40 | CAE Year-End Financial Results 2014
(amounts in millions) 2014 2013
Disposal of property, plant and equipment $ (5.6) $ (2.7)
Net foreign exchange differences (0.4) (11.4)
Dividend income (1.1) (0.9)
Reversal of contingent consideration arising on business combinations (Note 11) (0.4) (6.1)
Reversal of unused portion of an acquisition-related provision (4.2) -
Other (8.7) (1.3)
Other gains – net $ (20.4) $ (22.4)
(amounts in millions) 2014 2013
Restructuring costs (Note 11) $ - $ 54.9
Integration costs - 7.8
Acquisition costs - 6.0
Restructuring, integration and acquisition costs $ - $ 68.7
(amounts in millions) 2014 2013
Finance expense: Long-term debt (other than finance leases) $ 52.8 $ 45.3
Finance leases 9.8 10.0
Royalty obligations 8.1 10.2
Net employee benefits obligations (Note 14) 5.2 5.1
Financing cost amortization 1.5 1.6
Accretion of other non-current liabilities 1.5 1.7
Other 5.2 3.8
Post interest rate swaps 0.1 (0.4)
Borrowing costs capitalized (1) (3.7) (2.8)
Finance expense $ 80.5 $ 74.5
Finance income: Interest income on loans and receivables $ (1.6) $ (2.0)
Other (8.2) (7.4)
Finance income $ (9.8) $ (9.4)
Finance expense - net $ 70.7 $ 65.1
(1)
The average capitalization rate used during fiscal 2014 to determine the amount of borrowing costs eligible for capitalization was 3.75% (2013 - 3.86%).

Notes to the Consolidated Financial Statements NOTE 24 – SHARE-BASED PAYMENTS
The Company’s five share-based payment plans consist of two categories of plans: the Employee Stock Option Plan (ESOP), which qualifies as an equity-settled share-based payment plan; and the Employee Stock Purchase Plan (ESPP), Deferred Share Unit (DSU) Plans, Long-Term Incentive Deferred Share Unit (LTI-DSU) Plan and the Long-Term Incentive Restricted Share Unit (LTI-RSU) Plans, which qualify as cash-settled share-based payments plans. The effect before income taxes of share-based payment arrangements in the consolidated income statement and in the consolidated statement of financial position are as follows as at, and for the years ended March 31:
The compensation costs listed above include capitalized costs of $0.9 million (2013 – $0.8 million).
The share-based payment plans are described below. There have been no plan cancellations during fiscal 2014 or fiscal 2013.
Employee Stock Option Plan Under the Company’s long-term incentive program, options may be granted to its officers and other key employees of its subsidiaries to purchase common shares of the Company at a subscription price of 100% of the market value at the date of the grant. Market value is determined as the weighted average closing price of the common shares on the Toronto Stock Exchange (TSX) of the five days of trading prior to the effective date of the grant.
As at March 31, 2014, a total of 9,917,220 common shares (2013 – 12,304,776) remained authorized for issuance under the Employee Stock Option Plan (ESOP). The options are exercisable during a period not to exceed seven years (six years for options issued before March 31, 2011), and are not exercisable during the first 12 months after the date of the grant. The right to exercise all of the options vests over a period of four years of continuous employment from the grant date. Upon termination of employment at retirement, unvested options continue to vest following the retiree’s retirement date, subject to the four year vesting period. However, if there is a change of control of the Company, the options outstanding become immediately exercisable by option holders. Options are adjusted proportionately for any stock dividends or stock splits attributed to the common shares of the Company.
CAE Year-End Financial Results 2014 | 41
Compensation Recognized in the consolidated cost/(recovery) statement of financial position (amounts in millions) 2014 2013 2014 2013
Cash-settled share-based compensation: ESPP $ 5.7 $ 5.6 $ - $ -
DSU 4.3 0.9 (8.0) (8.1)
LTI-DSU, net of equity swap (0.8) 3.3 (21.8) (19.3)
LTI-RSU 7.4 1.1 (10.1) (6.5)
Total cash-settled share-based compensation $ 16.6 $ 10.9 $ (39.9) $ (33.9)
Equity-settled share-based compensation: ESOP 3.7 3.9 (19.5) (21.9)
Total equity-settled share-based compensation $ 3.7 $ 3.9 $ (19.5) $ (21.9)
Total share -based compensation $ 20.3 $ 14.8 $ (59.4) $ (55.8)
Outstanding options are as follows: Years ended March 31 2014 2013
Weighted Weighted Number average Number average of options exercise price of options exercise price Options outstanding, beginning of year 7,311,967 $ 10.24 6,473,768 $ 10.20
Granted 2,082,900 11.02 1,755,400 10.16
Exercised (2,387,556) 9.28 (482,250) 8.13
Forfeited (606,623) 11.56 (412,076) 11.61
Expired (976,106) 14.08 (22,875) 11.97
Options outstanding, end of year 5,424,582 $ 10.13 7,311,967 $ 10.24
Options exercisable, end of year 1,768,716 $ 8.60 3,829,769 $ 10.44

Notes to the Consolidated Financial Statements
The weighted average market share price for share options exercised in 2014 was $13.13 (2013 – $10.45).
For the year ended March 31, 2014, compensation cost for CAE’s stock options of $3.7 million (2013 – $3.9 million) was recognized in the consolidated income statement with a corresponding credit to contributed surplus using the fair value method of accounting for awards that were granted since fiscal 2010.
Employee Stock Purchase Plan The Company maintains an Employee Stock Purchase Plan (ESPP) to enable employees of the Company and its participating subsidiaries to acquire CAE common shares through regular payroll deductions or a lump-sum payment plus employer contributions. The Company and its participating subsidiaries match the first $500 employee contribution and contribute $1 for every $2 of additional employee contributions, up to a maximum of 3% of the employee’s base salary. The Company recorded compensation cost in the amount of $5.7 million (2013 – $5.6 million) in respect of employer contributions under the Plan.
Deferred Share Unit Plans The Company maintains a Deferred Share Unit (DSU) plan for executives, whereby an executive may elect to receive any cash incentive compensation in the form of deferred share units. The plan is intended to promote a greater alignment of interests between executives and the shareholders of the Company. A DSU is equal in value to one common share of the Company. The units are issued on the basis of the average closing board lot sale price per share of CAE common shares on the TSX during the last 10 days on which such shares traded prior to the date of issue. The units also accrue dividend equivalents payable in additional units in an amount equal to dividends paid on CAE common shares. DSUs mature upon termination of employment, whereupon an executive is entitled to receive a cash payment equal to the fair market value of the equivalent number of common shares, net of withholdings.
42 | CAE Year-End Financial Results 2014
Summarized information about the Company's ESOP as at March 31, 2014 is as follows: Range of exercise prices Options Outstanding Options Exercisable Weighted Weighted Weighted Number average remaining average Number average Outstanding contractual life (years) exercise price exercisable exercise price $7.29 to $9.69 1,566,419 1.76 $ 7.95 1,343,283 $ 7.67
$10.04 to $11.02 3,230,813 5.76 10.71 201,151 10.25
$11.13 to $13.18 627,350 4.11 12.59 224,282 12.70
Total 5,424,582 4.42 $ 10.13 1,768,716 $ 8.60
The assumptions used for the purpose of the option calculations outlined in this note are presented below: 2014 2013
Weighted average assumptions used in the Black-Scholes options pricing model: Weighted average share price $ 10.95 $ 10.08
Exercise price $ 11.02 $ 10.16
Dividend yield 1.83% 1.60%
Expected volatility 29.83% 33.56%
Risk-free interest rate 1.35% 1.29%
Expected option term 5 years 5 years
Weighted average fair value option granted $ 2.45 $ 2.59
Expected volatility is estimated by considering historical average share price volatility over the option's expected term.

Notes to the Consolidated Financial Statements The Company also maintains a DSU plan for non-employee directors. A non-employee director holding less than the minimum holdings of common shares of the Company receives the Board retainer and attendance fees in the form of deferred share units. Minimum holdings means no less than the number of common shares or deferred share units equivalent in fair market value to three times the annual retainer fee payable to a director for service on the Board. A non-employee director holding no less than the minimum holdings of common shares may elect to participate in the plan in respect of half or all of his or her retainer and part or all of his or her attendance fees. The terms of the plan are essentially identical to the executive DSU Plan except that units are issued on the basis of the closing board lot sale price per share of CAE common shares on the TSX during the last day on which the common shares traded prior to the date of issue.
The Company records the cost of the DSU plans as a compensation expense and accrues its non-current liability in deferred gains and other non-current liabilities on the consolidated statement of financial position. The cost recorded in fiscal 2014 was $4.3 million (2013 – $0.9 million).
Long-Term Incentive (LTI) – Deferred Share Unit Pla n The Company maintains a Long-Term Incentive Deferred Share Unit (LTI-DSU) plan for executives and senior management to promote a greater alignment of interests between executives and shareholders of the Company. A LTI-DSU is equal in value to one common share at a specific date. The LTI-DSUs are also entitled to dividend equivalents payable in additional units in an amount equal to dividends paid on CAE common shares. Eligible participants are entitled to receive a cash payment equivalent to the fair market value of the number of vested LTI-DSUs held upon any termination of employment. Upon termination of employment at retirement, unvested units continue to vest until November 30 of the year following the retirement date. For participants subject to section 409A of the United States Internal Revenue Code, vesting of unvested units takes place at the time of retirement.
The Plan stipulates that granted units vest equally over five years and that following a change of control, all unvested units vest immediately. The cost recorded in fiscal 2014 was $11.0 million (2013 – $3.0 million).
The Company entered into equity swap agreements to reduce its earnings exposure to the fluctuations in its share price (See Note 30).
CAE Year-End Financial Results 2014 | 43
DSUs outstanding are as follows: Years ended March 31 2014 2013
DSUs outstanding, beginning of year 813,191 805,527
Units granted 102,735 97,457
Units redeemed (374,969) (104,807)
Dividends paid in units 10,976 15,014
DSUs outstanding, end of year 551,933 813,191
DSUs vested, end of the year 551,933 813,191
The intrinsic values of the DSUs amount to $8.0 million at March 31, 2014 (2013 – $8.1 million).
LTI-DSUs outstanding are as follows: Years ended March 31 2014 2013
LTI-DSUs outstanding, beginning of year 2,265,712 2,431,314
Units granted 252,970 293,990
Units cancelled (97,164) (85,394)
Units redeemed (505,712) (421,170)
Dividends paid in units 39,479 46,972
LTI-DSUs outstanding, end of year 1,955,285 2,265,712
LTI-DSUs vested at end of year 1,678,942 1,917,003
The intrinsic values of the LTI-DSUs amount to $24.4 million at March 31, 2014 (2013 – $19.0 million).

Notes to the Consolidated Financial Statements Long-Term Incentive – Restricted Share Unit Plans The Company maintains Long-Term Incentive Performance Based Restricted Shares Unit (LTI-RSU) plans to enhance the Company’s ability to attract and retain talented individuals and also to promote a greater alignment of interest between eligible participants and the Company’s shareholders. The LTI-RSUs are share-based performance plans.
Fiscal year 2008 Plan LTI-RSUs granted pursuant to the plan vest after three years from their grant date as follows:
(i) 100% of the units, if CAE shares have appreciated by a minimum annual compounded growth defined as the Bank of Canada 10-year risk-free rate of return on the grant date plus 350 basis points (3.50%) over the valuation period, or, in the case of pro-rated vesting, as of the end of the pro-ration period;
(ii) 50% of the units if, based on the grant price, the closing average price on the common CAE shares has met or exceeded the performance of the companies listed on the Standard & Poor’s Aerospace and Defence Index (S&P A&D index), adjusted for dividends, or, in the case of pro-rated vesting, as of the end of the pro-ration period.
Participants subject to loss of employment, other than voluntarily or for cause, are entitled to conditional pro-rata vesting. The cost recorded in fiscal 2014 was nil (2013 – $0.3 million).
Fiscal year 2011 Plan In May 2010, the Company amended the fiscal year 2008 Plan for fiscal 2011 and subsequent years. LTI-RSUs granted pursuant to the revised plan vest over three years from their grant date as follows: (i) One-sixth of the total number of granted units multiplied by a factor vests every year. The factor is calculated from the one-year Total Shareholder Return (TSR) relative performance of CAE’s share
price versus that of the S&P A&D index for the period April 1 st to March 31 st , immediately preceding each of the 1 st , 2 nd , and 3 rd anniversary of the grant date, according to the following rule:
(ii) One-half of the total number of granted units multiplied by a factor vests in the final year. The factor is calculated from the three-year TSR relative performance of CAE’s share price versus that of
the companies listed on the S&P A&D index for the period April 1 st , immediately preceding the grant date, to March 31 st , immediately preceding the 3 rd anniversary of the grant date, according to the same rule described in the table above.
Participants subject to loss of employment, other than voluntarily or for cause, are entitled to the units vested. The cost recorded in fiscal 2014 was $7.4 million (2013 – $0.8 million).
44 | CAE Year-End Financial Results 2014
Annual TSR relative performance Factor 1st Quartile (0 – 25th percentile) -
2nd Quartile (26th – 50th percentile) 50% – 98%
3rd Quartile (51st – 75th percentile) 100% – 148%
4th Quartile (76th – 100th percentile) 150%
LTI-RSU units outstanding under all plans are as follows: Fiscal Year 2011 Plan Fiscal Year 2008 Plan Years ended March 31 2014 2013 2014 2013
LTI-RSUs outstanding, beginning of year 1,463,639 1,014,155 - 660,733
Units granted 495,198 593,410 - -
Units cancelled (464,284) (138,924) - (5,954)
Units redeemed (350,856) (5,002) - (654,779)
LTI-RSUs outstanding, end of year 1,143,697 1,463,639 - -
LTI-RSUs vested, end of year 765,788 1,060,397 - -
The intrinsic values of the LTI-RSUs amount to $10.1 million at March 31, 2014 (2013 – $6.5 million).

Notes to the Consolidated Financial Statements NOTE 25 – SUPPLEMENTARY CASH FLOWS INFORMATION
NOTE 26 – CONTINGENCIES
In the normal course of operations, the Company is party to a number of lawsuits, claims and contingencies. Although it is possible that liabilities may be incurred in instances for which no accruals have been made, the Company does not believe that the ultimate outcome of these matters will have a material impact on its consolidated financial position. NOTE 27 – COMMITMENTS
CAE Year-End Financial Results 2014 | 45
(amounts in millions) 2014 2013
Cash (used in) provided by non-cash working capital: Accounts receivable $ (14.3) $ (76.6)
Contracts in progress: assets 29.0 (1.8)
Inventories (42.3) (24.8)
Prepayments (4.4) (4.6)
Income taxes recoverable 6.0 (11.5)
Derivative financial assets 19.6 17.9
Accounts payable and accrued liabilities (9.4) 8.2
Provisions (22.6) 19.2
Income taxes payable (1.4) (0.1)
Contracts in progress: liabilities 40.6 12.4
Derivative financial liabilities (29.6) (22.9)
Changes in non-cash working capital $ (28.8) $ (84.6)
The future aggregate minimum lease payments under non-cancellable operating leases are as follows: (amounts in millions) 2014 2013
No later than 1 year $ 53.4 $ 53.3
Later than 1 year and no later than 5 years 130.9 140.2
Later than 5 years 77.5 88.2
$ 261.8 $ 281.7
Rental expenses recorded in the consolidated income statement amount to $54.4 million (2013 – $59.1 million).
Contractual purchase commitments The total contractual purchase commitments are as follows: (amounts in millions) TS/C SP/C Corporate Total 2015 $ 1.9 $ 5.8 $ 4.5 $ 12.2
2016 - 5.3 - 5.3
2017 - 5.3 - 5.3
$ 1.9 $ 16.4 $ 4.5 $ 22.8

Notes to the Consolidated Financial Statements
Joint ventures’ commitments The Company’s total commitments to joint ventures that it has made but not recognized relating to its interests in joint ventures amount to $3.2 million as at March 31, 2014. NOTE 28 – CAPITAL RISK MANAGEMENT
The Company’s objectives when managing capital are threefold: (i) Optimize the Company’s cost of capital;
(ii) Maintain the Company’s financial strength and credit quality;
(iii) Provide the Company’s shareholders with an appropriate rate of return on their investment. The Company manages its capital structure and makes corresponding adjustments based on changes in economic conditions and the risk characteristics of the underlying assets. In order to maintain or adjust the capital structure, the Company may adjust the amount of dividends paid to shareholders, return capital to shareholders, issue new shares, or use cash to reduce debt. To accomplish its objectives stated above, the Company monitors its capital on the basis of the net debt to capital ratio. This ratio is calculated as net debt divided by the sum of the net debt and total equity. Net debt is calculated as total debt, including the short-term portion (as presented in the consolidated statement of financial position and including non-recourse debt) less cash and cash equivalents. Total equity comprises share capital, contributed surplus, accumulated other comprehensive (loss) income, retained earnings and non-controlling interests.
The Company has certain debt agreements which require the maintenance of a certain level of capital. As at March 31, 2014, the Company is compliant with its financial covenants. 46 | CAE Year-End Financial Results 2014
Operating Lease Entitlements as a Lessor Future minimum lease payments receivable under non-cancellable operating leases are as follows: (amounts in millions) 2014 2013
No later than 1 year $ 23.7 $ 11.9
Later than 1 year and no later than 5 years 49.1 20.5
Later than 5 years 24.9 14.4
$ 97.7 $ 46.8
The level of debt versus equity in the capital structure is monitored, and the ratios are as follows: (amounts in millions) 2014 2013
Total debt (Note 12) $ 1,168.5 $ 1,073.4
Less: cash and cash equivalents 312.3 260.0
Net debt $ 856.2 $ 813.4
Equity $ 1,482.2 $ 1,146.4
Net debt: equity 37:63 42:58

Notes to the Consolidated Financial Statements NOTE 29 – FAIR VALUE OF FINANCIAL INSTRUMENTS
The fair value of a financial instrument is determined by reference to the available market information at the reporting date. When no active market exists for a financial instrument, the Company determines the fair value of that instrument based on valuation methodologies as discussed below. In determining assumptions required under a valuation model, the Company primarily uses external, readily observable market data inputs. Assumptions or inputs that are not based on observable market data incorporate the Company’s best estimates of market participant assumptions, and are used when external data is not available. Counterparty credit risk and the fair values of the Company’s own credit risk are taken into account in estimating the fair value of all financial assets and financial liabilities, including derivatives. The following assumptions and valuation methodologies have been used to measure fair value of financial instruments: (i) The fair value of accounts receivable, contracts in progress, accounts payable and accrued liabilities approximate their carrying values due to their short-term maturities; (ii) The fair value of derivative instruments, including forward contracts, swap agreements and embedded derivatives with economic characteristics and risks that are not clearly and closely related to
those of the host contract, are determined using valuation techniques and are calculated as the present value of the estimated future cash flows using an appropriate interest rate yield curve and foreign exchange rate. Assumptions are based on market conditions prevailing at each reporting date. Derivative instruments reflect the estimated amounts that the Company would receive or pay to settle the contracts at the reporting date;
(iii) The fair value of the available-for-sale investment which does not have a readily available market value, is estimated using a discounted cash flow model, which includes some assumptions that are not supportable by observable market prices or rates;
(iv) The fair value of non-current receivables are estimated based on discounted cash flows using current interest rates for instruments with similar terms and remaining maturities; (v) The fair value of provisions, long-term debt and non-current liabilities, including finance lease obligations and royalty obligations, are estimated based on discounted cash flows using current
interest rates for instruments with similar terms and remaining maturities.
CAE Year-End Financial Results 2014 | 47
The carrying values and fair values of financial instruments, by class, are as follows at March 31, 2014: (amounts in millions) Carrying Value Fair Value At Available - Loans & FVTPL
(1) for -Sale Receivables DDHR
(2) Total Financial assets Cash and cash equivalents $ 312.3 $ - $ - $ - $ 312.3 $ 312.3
Accounts receivable - - 431.4 (3) - 431.4 431.7
Contracts in progress: assets - - 256.4 - 256.4 256.4
Derivative financial assets 6.0 - - 8.8 14.8 14.8
Other assets 24.1 (4) 1.5
(5) 133.5 (6) - 159.1 152.8
$ 342.4 $ 1.5 $ 821.3 $ 8.8 $ 1,174.0 $ 1,168.0
Carrying Value Fair Value Other At Financial FVTPL
(1) Liabilities DDHR
(2) Total Financial liabilities Accounts payable and accrued liabilities $ 1.3 $ 529.1
(7) $ - $ 530.4 $ 532.3
Total provisions 2.9 25.3 - 28.2 28.2
Total long-term debt - 1,173.2 (8) - 1,173.2 1,251.9
Other non-current liabilities - 197.5 (9) - 197.5 223.4
Derivative financial liabilities 9.7 - 33.3 43.0 43.0
$ 13.9 $ 1,925.1 $ 33.3 $ 1,972.3 $ 2,078.8
(1)
FVTPL: Fair value through profit and loss. (2)
DDHR: Derivatives designated in a hedge relationship. (3)
Includes trade receivables, accrued receivables and certain other receivables. (4)
Represents restricted cash. (5)
Represents the Company's portfolio investment. (6)
Includes non-current receivables and advances. (7)
Includes trade accounts payable, accrued liabilities, interest payable, certain payroll-related liabilities and current royalty obligations. (8)
Excludes transaction costs. (9)
Includes non-current royalty obligations and other non-current liabilities.

Notes to the Consolidated Financial Statements
The Company did not elect to voluntarily designate any financial instruments at FVTPL; moreover, there have not been any changes to the classification of the financial instruments since inception. As part of its financing transactions, the Company, through its subsidiaries, has pledged certain financial assets including cash and cash equivalents, accounts receivable and other assets. As at March 31, 2014 , the aggregate carrying value of these pledged financial assets amounted to $149.2 million ( 2013 – $55.8 million). Fair value hierarchy The fair value hierarchy reflects the significance of the inputs used in making the measurements and has the following levels:
Level 1: Quoted prices (unadjusted) in active markets for identical assets or liabilities;
Level 2: Inputs other than quoted prices included within Level 1 that are observable for the asset or liability, either directly (i.e., as prices) or indirectly (i.e., derived from prices);
Level 3: Inputs for the asset or liability that are not based on observable market data (unobservable inputs).
Each type of fair value is categorized based on the lowest level input that is significant to the fair value measurement in its entirety.
48 | CAE Year-End Financial Results 2014
The carrying values and fair values of financial instruments, by class, were as follows at March 31, 2013: (amounts in millions) Carrying Value Fair Value At Available- Loans & FVTPL
(1) for-Sale Receivables DDHR
(2) Total Financial assets Cash and cash equivalents $ 260.0 $ - $ - $ - $ 260.0 $ 260.0
Accounts receivable - - 384.1 (3) - 384.1 384.1
Contracts in progress: assets - - 265.6 - 265.6 265.6
Derivative financial assets 5.4 - - 10.0 15.4 15.4
Other assets 4.1 (4) 1.3
(5) 105.9 (6) - 111.3 119.6
$ 269.5 $ 1.3 $ 755.6 $ 10.0 $ 1,036.4 $ 1,044.7
Carrying Value Fair Value Other At Financial FVTPL
(1) Liabilities DDHR
(2) Total Financial liabilities Accounts payable and accrued liabilities $ - $ 501.0
(7) $ - $ 501.0 $ 501.0
Total provisions - 29.7 - 29.7 29.7
Total long-term debt - 1,078.6 (8) - 1,078.6 1,117.3
Other non-current liabilities - 192.5 (9) - 192.5 192.5
Derivative financial liabilities 5.5 - 14.6 20.1 20.1
$ 5.5 $ 1,801.8 $ 14.6 $ 1,821.9 $ 1,860.6
(1)
FVTPL: Fair value through profit and loss. (2)
DDHR: Derivatives designated in a hedge relationship. (3)
Includes trade receivables, accrued receivables and certain other receivables. (4)
Represents restricted cash. (5)
Represents the Company's portfolio investments. (6)
Includes non-current receivables and advances. (7)
Includes trade accounts payable, accrued liabilities, interest payable, certain payroll-related liabilities and current royalty obligations. (8)
Excludes transaction costs. (9)
Includes non-current royalty obligations and other non-current liabilities.

Notes to the Consolidated Financial Statements The following table presents the financial instruments, by class, which are recognized at fair value in the statement of financial position:
Level 3 input sensitivity analysis For the Company’s contingent liabilities arising on business combination, the determination of the discount rate and the expected future cash flows has the most significant impact on the valuation. A reasonably possible 1% increase/decrease in the discount rate or a 10% decrease/increase in the expected future cash flows would not have a significant impact on the Company’s net income.
CAE Year-End Financial Results 2014 | 49
(amounts in millions) 2014 2013
Level 2 Level 3 Total Level 2 Level 3 Total Financial assets At FVTPL Cash and cash equivalents $ 312.3 $ - $ 312.3 $ 260.0 $ - $ 260.0
Restricted cash 24.1 - 24.1 4.1 - 4.1
Forward foreign currency contracts 2.0 - 2.0 4.7 - 4.7
Embedded foreign currency derivatives 1.4 - 1.4 0.7 - 0.7
Equity swap agreements 2.6 - 2.6 - - -
Available-for-sale - 1.5 1.5 - 1.3 1.3 Derivatives designated in a hedge relationship Forward foreign currency contracts 2.1 - 2.1 4.6 - 4.6
Foreign currency swap agreements 6.7 - 6.7 5.4 - 5.4
$ 351.2 $ 1.5 $ 352.7 $ 279.5 $ 1.3 $ 280.8
Financial liabilities At FVTPL Accounts payable and accrued liabilities $ - $ 1.3 $ 1.3 $ - $ - $ -
Contingent liabilities arising on business - 2.9 2.9 - - -
Forward foreign currency contracts 9.4 - 9.4 3.4 - 3.4
Embedded foreign currency derivatives 0.3 - 0.3 1.8 - 1.8
Equity swap agreements - - - 0.3 - 0.3 Derivatives designated in a hedge relationship Forward foreign currency contracts 29.6 - 29.6 6.8 - 6.8
Foreign currency swap agreements - - - 2.7 - 2.7
Interest rate swap agreements 3.7 - 3.7 5.1 - 5.1
$ 43.0 $ 4.2 $ 47.2 $ 20.1 $ - $ 20.1
Changes in Level 3 financial instruments are as follows: (amounts in millions) 2014 2013
Balance, beginning of year $ 1.3 $ 1.3
Total realized and unrealized (losses) gains: Included in income - -
Included in OCI 0.2 -
Issued and settled (4.2) - Balance, end of year $ (2.7) $ 1.3

Notes to the Consolidated Financial Statements
NOTE 30 – FINANCIAL RISK MANAGEMENT
Due to the nature of the activities that the Company carries out and as a result of holding financial instruments, the Company is exposed to credit risk, liquidity risk and market risk, including foreign currency risk and interest rate risk. The Company’s exposure to credit risk, liquidity risk and market risk is managed within risk management parameters approved by the board of directors. These risk management parameters remain unchanged since the previous period, unless otherwise indicated. Credit risk Credit risk is defined as the Company’s exposure to a financial loss if a debtor fails to meet its obligations in accordance with the terms and conditions of its arrangements with the Company. The Company is exposed to credit risk on its accounts receivable and certain other assets through its normal commercial activities. The Company is also exposed to credit risk through its normal treasury activities on its cash and cash equivalents and derivative financial assets. Credit risks arising from the Company’s normal commercial activities are managed in regards to customer credit risk. An allowance for doubtful accounts is established when there is a reasonable expectation that the Company will not be able to collect all amounts due according to the original terms of the receivables (See Note 4). When a trade receivable is uncollectible, it is written-off against the allowance for doubtful accounts. Subsequent recoveries of amounts previously written-off are recognized in income. The Company’s customers are mainly established companies with publicly available credit ratings and government agencies, which facilitates risk monitoring. In addition, the Company typically receives substantial non-refundable advance payments for construction contracts. The Company closely monitors its exposure to major airlines in order to mitigate its risk to the extent possible. Furthermore, the Company’s trade receivables are not concentrated with specific customers but are held with a wide range of commercial and government organizations. As well, the Company’s credit exposure is further reduced by the sale of certain of its accounts receivable and contracts in progress assets to third-party financial institutions for cash consideration on a non-recourse basis (current financial assets program). The Company does not hold any collateral as security. The credit risk on cash and cash equivalents is mitigated by the fact that they are in place with a diverse group of major North American and European financial institutions. The Company is exposed to credit risk in the event of non-performance by counterparties to its derivative financial instruments. The Company uses several measures to minimize this exposure. First, the Company enters into contracts with counterparties that are of high credit quality. The Company signed International Swaps & Derivatives Association, Inc. (ISDA) Master Agreements with the majority of counterparties with whom it trades derivative financial instruments. These agreements make it possible to offset when a contracting party defaults on the agreement, for each of the transactions covered by the agreement and in force at the time of default. Also, collateral or other security to support derivative financial instruments subject to credit risk can be requested by the Company or its counterparties (or both parties, if need be) when the net balance of gains and losses on each transaction exceeds a threshold defined in the ISDA Master Agreement. Finally, the Company monitors the credit standing of counterparties on a regular basis to help minimize credit risk exposure. The carrying amounts presented in Note 4 and Note 29 represent the maximum exposure to credit risk for each respective financial asset as at the relevant dates. 50 | CAE Year-End Financial Results 2014
Fair value hierarchy of items at amortized cost The following table presents the fair value hierarchy of assets and liabilities carried at amortized cost but for which fair value is disclosed: (amounts in millions) 2014
Level 2 Level 3 Total Financial assets Accounts receivable $ - $ 431.7 $ 431.7
Contracts in progress - 256.4 256.4
Other assets Investment in finance leases 38.4 - 38.4
Other - 88.8 88.8
$ 38.4 $ 776.9 $ 815.3
Financial liabilities Accounts payable and accrued liabilities $ - $ 532.3 $ 532.3
Provisions - 28.2 28.2
Long-term debt 1,251.9 - 1,251.9
Other liabilities - 223.4 223.4
$ 1,251.9 $ 783.9 $ 2,035.8

Notes to the Consolidated Financial Statements Liquidity risk Liquidity risk is defined as the potential that the Company cannot meet its cash obligations as they become due. The Company manages this risk by establishing cash forecasts, as well as long-term operating and strategic plans. The management of consolidated liquidity requires a regular monitoring of expected cash inflows and outflows which is achieved through a forecast of the Company’s consolidated liquidity position, for efficient use of cash resources. Liquidity adequacy is assessed in view of seasonal needs, growth requirements and capital expenditures, and the maturity profile of indebtedness, including off-balance sheet obligations. The Company manages its liquidity risk to maintain sufficient liquid financial resources to fund its operations and meet its commitments and obligations. In managing its liquidity risk, the Company has access to a revolving unsecured credit facility of US$550.0 million, with an option, subject to the lender’s consent, to increase to a total amount of up to US$850.0 million. As well, the Company has agreements to sell certain of its accounts receivable and contracts in progress assets for an amount of up to $150.0 million (current financial assets program). As at March 31, 2014 , $79.5 million (2013 – $88.6 million) of specific accounts receivable and $4.2 million (2013 – $3.1 million) of contracts in progress assets were sold to financial institutions pursuant to these agreements. Proceeds were net of $1.1 million in fees (2013 – $1.6 million). The Company also regularly monitors any financing opportunities to optimize its capital structure and maintain appropriate financial flexibility. The following tables present a maturity analysis based on contractual maturity date, of the Company’s financial liabilities based on expected cash flows. Cash flows from derivatives presented either as derivative assets or liabilities have been included, as the Company manages its derivative contracts on a gross basis. The amounts are the contractual undiscounted cash flows. All amounts contractually denominated in foreign currency are presented in Canadian dollar equivalent amounts using the period-end spot rate except as otherwise stated:
CAE Year-End Financial Results 2014 | 51
As at March 31, 2014 Carrying Contractual 0-12 13-24 25-36 37-48 49-60 (amounts in millions) Amount Cash Flows Months Months Months Months Months Thereafter Non-derivative financial liabilities Accounts payable
and accrued liabilities (1) $ 530.4 $ 530.4 $ 530.4 $ - $ - $ - $ - $ -
Total provisions 28.2 28.2 22.2 3.0 0.4 0.4 - 2.2
Total long-term debt (2) 1,173.2 1,764.1 102.0 100.7 156.2 89.7 127.0 1,188.5
Other non-current
liabilities (3) (4) 197.5 390.8 - 35.1 13.6 16.1 17.3 308.7
$ 1,929.3 $ 2,713.5 $ 654.6 $ 138.8 $ 170.2 $ 106.2 $ 144.3 $ 1,499.4
Derivative financial instruments Forward foreign currency contracts (4) $ 34.9 Outflow $ 1,215.2 $ 870.1 $ 233.7 $ 41.9 $ 43.2 $ 19.6 $ 6.7
Inflow (1,179.5) (850.0) (222.8) (40.4) (40.9) (19.0) (6.4)
Swap derivatives on total long-term debt (5) (3.0) Outflow 121.4 15.4 15.5 14.8 13.8 9.8 52.1
Inflow (124.1) (14.8) (15.4) (15.4) (14.7) (10.2) (53.6)
Equity swap agreement (2.6) (2.6) (2.6) - - - - -
$ 29.3 $ 30.4 $ 18.1 $ 11.0 $ 0.9 $ 1.4 $ 0.2 $ (1.2)
$ 1,958.6 $ 2,743.9 $ 672.7 $ 149.8 $ 171.1 $ 107.6 $ 144.5 $ 1,498.2
(1)
Includes trade accounts payable, accrued liabilities, interest payable and certain payroll-related liabilities. (2)
Contractual cash flows include contractual interest and principal payments related to debt obligations and excludes transaction costs. (3)
Includes non-current royalty obligations and other non-current liabilities. (4)
Includes forward foreign currency contracts, but excludes all embedded derivatives, either presented as derivative liabilities or derivative assets. Outflows and inflows are presented in CAD equivalent using the contractual forward foreign currency rate. (5)
Includes interest rate swap and cross currency swaps designated as cash flow hedges either presented as derivative liabilities or derivative assets.

Notes to the Consolidated Financial Statements
Market risk Market risk is defined as the Company’s exposure to a gain or a loss in the value of its financial instruments as a result of changes in market prices, whether those changes are caused by factors specific to the individual financial instruments or its issuer, or factors affecting all similar financial instruments traded in the market. The Company is mainly exposed to foreign currency risk and interest rate risk. Derivative instruments are utilized by the Company to manage market risk against the volatility in foreign exchange rates, interest rates and share-based payments in order to minimize their impact on the Company’s results and financial position. The Company’s policy is not to utilize any derivative financial instruments for trading or speculative purposes. Foreign currency risk Foreign currency risk is defined as the Company’s exposure to a gain or a loss in the value of its financial instruments as a result of fluctuations in foreign exchange rates. The Company is exposed to foreign exchange rate variability primarily in relation to certain sale commitments, expected purchase transactions and debt denominated in a foreign currency, as well as on the net investment from its foreign operations which have functional currencies other than the Canadian dollar (in particular the U.S. dollar (USD), euro (€) and British pound (GBP or £)). In addition, these operations have exposure to foreign exchange rates primarily through cash and cash equivalents and other working capital accounts denominated in currencies other than their functional currencies. The Company also mitigates foreign currency risks by having its foreign operations transact in their functional currency for material procurement, sale contracts and financing activities. The Company uses forward foreign currency contracts and foreign currency swap agreements to manage the Company’s exposure from transactions in foreign currencies and to synthetically modify the currency of exposure of certain financial position items. These transactions include forecasted transactions and firm commitments denominated in foreign currencies. 52 | CAE Year-End Financial Results 2014
As at March 31, 2013 Carrying Contractual 0-12 13-24 25-36 37-48 49-60 (amounts in millions) Amount Cash Flows Months Months Months Months Months Thereafter Non-derivative financial liabilities Accounts payable and accrued liabilities (1) $ 501.0 $ 501.0 $ 501.0 $ - $ - $ - $ - $ -
Total provisions 29.7 30.1 26.5 1.2 1.7 0.4 0.3 -
Total long-term debt (2) 1,078.6 1,555.5 108.7 90.1 83.0 133.9 69.8 1,070.0
Other non-current
liabilities (3) 192.5 396.7 - 15.3 31.5 13.4 15.9 320.6
$ 1,801.8 $ 2,483.3 $ 636.2 $ 106.6 $ 116.2 $ 147.7 $ 86.0 $ 1,390.6
Derivative financial instruments Forward foreign currency contracts (4) $ 0.9 Outflow $ 682.3 $ 519.4 $ 64.2 $ 56.3 $ 18.9 $ 22.2 $ 1.3
Inflow (681.6) (520.2) (63.5) (55.9) (18.8) (22.0) (1.2)
Swap derivatives on total long-term debt (5) 2.4 Outflow 131.3 13.9 14.5 14.4 13.8 13.0 61.7
Inflow (127.0) (12.6) (13.8) (14.3) (14.2) (13.5) (58.6)
Equity swap agreement 0.3 0.3 0.3 - - - - -
$ 3.6 $ 5.3 $ 0.8 $ 1.4 $ 0.5 $ (0.3) $ (0.3) $ 3.2
$ 1,805.4 $ 2,488.6 $ 637.0 $ 108.0 $ 116.7 $ 147.4 $ 85.7 $ 1,393.8
(1)
Includes trade accounts payable, accrued liabilities, interest payable and certain payroll-related liabilities. (2)
Contractual cash flows include contractual interest and principal payments related to debt obligations and excludes transaction costs. (3)
Includes non-current royalty obligations and other non-current liabilities. (4)
Includes forward foreign currency contracts, but excludes all embedded derivatives, either presented as derivative liabilities or derivative assets. Outflows and inflows are presented in CAD equivalent using the contractual forward foreign currency rate. (5)
Includes interest rate swap and cross currency swap contracts either designated as cash flow hedges or as fair value hedges of long-term debt either presented
as derivative liabilities or derivative assets.

Notes to the Consolidated Financial Statements
CAE Year-End Financial Results 2014 | 53
The consolidated forward foreign currency contracts outstanding are as follows: (amounts in millions, except average rate) 2014 2013
Notional Average Notional Average Currencies (sold/bought) Amount
(1) Rate Amount
(1) Rate
USD/CDN Less than 1 year $ 462.6 0.93 $ 560.3 0.98
Between 1 and 3 years 126.1 0.94 80.8 0.98
Between 3 and 5 years 20.8 0.95 18.7 0.98
Over 5 years 6.6 0.94 1.8 0.97
CDN/EUR Less than 1 year 29.8 1.52 17.1 1.32
Between 1 and 3 years 10.2 1.40 - -
Between 3 and 5 years - - 7.7 1.40
EUR/CDN Less than 1 year 56.9 0.68 53.3 0.75
Between 1 and 3 years 39.4 0.72 22.3 0.77
Between 3 and 5 years 3.0 0.73 10.3 0.72
EUR/USD Less than 1 year 62.6 0.72 55.9 0.75
GBP/CDN Less than 1 year 37.2 0.59 47.7 0.63
Between 1 and 3 years 23.2 0.61 26.6 0.62
Between 3 and 5 years 0.2 0.61 1.4 0.62
CDN/GBP Less than 1 year 16.6 1.82 15.3 1.56
Between 1 and 3 years 4.8 1.74 0.6 1.60
CDN/USD Less than 1 year 80.5 1.11 101.7 1.03
Between 1 and 3 years 14.7 1.10 14.9 1.11
Between 3 and 5 years - - 0.3 1.08
GBP/USD Less than 1 year 41.8 0.62 15.9 0.67
Between 1 and 3 years 1.4 0.65 11.5 0.65
Between 3 and 5 years 14.5 0.65 12.7 0.65
USD/EUR Less than 1 year 8.3 1.37 18.6 1.31
SEK/USD Less than 1 year 4.4 6.61 3.7 6.56
Between 1 and 3 years 36.4 6.65 22.1 6.68
Other currencies Less than 1 year 64.6 - 33.5 -
Between 1 and 3 years 21.2 - 2.3 -
Between 3 and 5 years 25.4 - 8.8 -
Total $ 1,213.2 $ 1,165.8 (1)
Exchange rates as at the end of the respective fiscal years were used to translate amounts in foreign currencies.

Notes to the Consolidated Financial Statements The Company has entered into foreign currency swap agreements related to its June 2007 senior collateralized financing, to convert a portion of the USD-denominated debt into GBP to finance its civil aviation training centre in the United Kingdom. The Company designated two USD to GBP foreign currency swap agreements as cash flow hedges with outstanding notional amounts of US$0.4 million (£0.2 million) (2013 – US$1.8 million (£0.9 million)) and US$17.0 million (£8.5 million) (2013 – US$17.0 million (£8.5 million)), amortized in accordance with the repayment schedule of the debt until June 2014 and June 2018 respectively. In fiscal 2013, the Company entered into interest-only cross currency swap agreements related to its multi-tranche private placement debt issued in December 2012, to effectively fix the USD-denominated interest cash flows in CAD equivalent. The Company designated two USD to CAD interest-only currency swap agreements as cash flow hedges with outstanding notional amounts of US$127.0 million ($130.5 million) (2013 – US$127.0 million [$130.5 million]) and US$98.0 million ($100.7 million) (2013 – US$98.0 million [$100.7 million]) corresponding to the two tranches of the private placement until December 2024 and December 2027 respectively. The Company’s foreign currency hedging programs are typically unaffected by changes in market conditions, as related derivative financial instruments are generally held until their maturity, consistent with the objective to fix currency rates on the hedged item. Foreign currency risk sensitivity analysis The following table presents the Company’s exposure to foreign currency risk of financial instruments and the pre-tax effects on net income and OCI as a result of a reasonably possible strengthening of 5% in the relevant foreign currency against the Canadian dollar as at March 31. This analysis assumes all other variables remain constant.
A reasonably possible weakening of 5% in the relevant foreign currency against the Canadian dollar would have an opposite impact on pre-tax income and OCI. Interest rate risk Interest rate risk is defined as the Company’s exposure to a gain or a loss to the value of its financial instruments as a result of fluctuations in interest rates. The Company bears some interest rate fluctuation risk on its floating rate long-term debt and some fair value risk on its fixed interest long-term debt. The Company mainly manages interest rate risk by fixing project-specific floating rate debt in order to reduce cash flow variability. The Company has a floating rate debt through its revolving unsecured credit facility and other asset-specific floating rate debts. A mix of fixed and floating interest rate debt is sought to reduce the net impact of fluctuating interest rates. Derivative financial instruments used to synthetically convert interest rate exposures are mainly interest rate swap agreements. As at March 31, 2014 , the Company has entered into eight interest rate swap agreements with seven different financial institutions to mitigate these risks for a total notional value of $36.0 million (2013 – $36.4 million). After considering these swap agreements, as at March 31, 2014 , 84% (2013 – 83%) of the long-term debt bears fixed interest rates. The Company’s interest rate hedging programs are typically unaffected by changes in market conditions, as related derivative financial instruments are generally held until their maturity to establish asset and liability management matching, consistent with the objective to reduce risks arising from interest rate movements. As a result, the changes in variable interest rates do not have a significant impact on net income and OCI. Interest rate risk sensitivity analysis In fiscal 2014 and fiscal 2013, a 1% increase/decrease in interest rates would not have a significant impact on the Company’s net income and OCI assuming all other variables remained constant. Hedge of share-based payments cost The Company has entered into equity swap agreements with two major Canadian financial institutions to reduce its income exposure to fluctuations in its share price relating to the DSU and LTI-DSU programs. Pursuant to the agreement, the Company receives the economic benefit of dividends and share price appreciation while providing payments to the financial institutions for the institution’s cost of funds and any share price depreciation. The net effect of the equity swaps partly offset movements in the Company’s share price impacting the cost of the DSU and LTI-DSU programs and is reset quarterly. As at March 31, 2014 , the equity swap agreements covered 2,400,000 common shares (2013 – 2,706,816) of the Company.
Hedge of net investments in foreign operations As at March 31, 2014 , the Company has designated a portion of its senior notes totalling US$417.8 million (2013 – US$417.8 million) and a portion of the sale lease back obligation totalling US$16.1 million (2013 – US$17.9 million) as a hedge of its net investments in foreign operations. Gains or losses on the translation of the designated portion of its senior notes are recognized in OCI to offset any foreign exchange gains or losses on translation of the financial statements of foreign operations.
54 | CAE Year-End Financial Results 2014
(amounts in millions) USD € GBP Net Net Net Income OCI Income OCI Income OCI 2014 $ (6.4) $ (19.3) $ 3.4 $ (2.0) $ (0.1) $ (0.2)
2013 $ (1.2) $ (20.6) $ 1.4 $ (1.6) $ (0.2) $ (2.8)

Notes to the Consolidated Financial Statements Letters of credit and guarantees As at March 31, 2014 , the Company had outstanding letters of credit and performance guarantees in the amount of $191.4 million (2013 – $198.7 million) issued in the normal course of business. These guarantees are issued mainly under the Revolving Term Credit Facility as well as the Performance Securities Guarantee (PSG) account provided by Export Development Corporation (EDC) and under other standby facilities available to the Company through various financial institutions.
The advance payment guarantees are related to progress/milestone payments made by the Company’s customers and are reduced or eliminated upon delivery of the product. The contract performance guarantees are linked to the completion of the intended product or service rendered by the Company and to the customer’s requirements. It represents 10% to 20% of the overall contract amount. The customer releases the Company from these guarantees at the signing of a certificate of completion. The letter of credit for the lease obligation provides credit support for the benefit of the owner participant on a sale and leaseback transaction and varies according to the payment schedule of the lease agreement.
Sale and leaseback transactions For certain sale and leaseback transactions, the Company has agreed to guarantee the residual value of the underlying equipment in the event that the equipment is returned to the lessor and the net proceeds of any eventual sale do not cover the guaranteed amount. The maximum amount of exposure is $14.5 million (2013 – $14.5 million), of which $9.6 million matures in fiscal year 2020 and $4.9 million in fiscal year 2023. Of this amount, as at March 31, 2014 , $12.1 million is recorded as a deferred gain (2013 - $12.4 million). Indemnifications In certain instances when the Company sells businesses, it may retain certain liabilities for known exposures and provide indemnification to the buyer with respect to future claims for certain unknown liabilities that exist, or arise from events occurring, prior to the sale date, including liabilities for taxes, legal matters, environmental exposures, product liability, and other obligations. The terms of the indemnifications vary in duration, from one to two years for certain types of indemnities, terms for tax indemnifications that are generally aligned to the applicable statute of limitations for the jurisdiction in which the divestiture occurred, and terms for environmental liabilities that typically do not expire. The maximum potential future payments that the Company could be required to make under these indemnifications are either contractually limited to a specified amount or unlimited. The Company believes that other than the liabilities already accrued, the maximum potential future payments that it could be required to make under these indemnifications are not determinable at this time, as any future payments would be dependent on the type and extent of the related claims, and all available defences, which cannot be estimated. However, historically, costs incurred to settle claims related to these indemnifications have not been material to the Company’s consolidated financial position, net income or cash flows.
CAE Year-End Financial Results 2014 | 55
(amounts in millions) 2014 2013
Advance payment $ 40.6 $ 59.0
Contract performance 31.2 14.7
Lease obligation 26.7 24.2
Financial obligations 81.9 93.1
Other 11.0 7.7
$ 191.4 $ 198.7

Notes to the Consolidated Financial Statements
NOTE 31 – OPERATING SEGMENTS AND GEOGRAPHIC INFORMA TION
The Company elected to organize its businesses based principally on products and services. Operating segments are reported in a manner consistent with the internal reporting provided to the chief operating decision-maker. The Company manages operations through its five segments (see Note 1). Results by segment The profitability measure employed by the Company for making decisions about allocating resources to segments and assessing segment performance is operating profit (hereinafter referred to as segment operating income). The accounting principles used to prepare the information by operating segments are the same as those used to prepare the Company’s consolidated financial statements. Transactions between operating segments are mainly simulator transfers from the SP/C segment to the TS/C segment, which are recorded at cost. The method used for the allocation of assets jointly used by operating segments and costs and liabilities jointly incurred (mostly corporate costs) between operating segments is based on the level of utilization when determinable and measurable, otherwise the allocation is based on a proportion of each segment’s cost of sales.
56 | CAE Year-End Financial Results 2014
Year ended March 31, 2014 (amounts in millions) TS/C SP/C Civil SP/M TS/M Military NCM Total External revenue $ 715.3 $ 461.4 $ 1,176.7 $ 529.3 $ 292.7 $ 822.0 $ 116.2 $ 2,114.9
Depreciation and amortization Property, plant and equipment 80.9 4.7 85.6 7.3 3.6 10.9 3.0 99.5
Intangible and other assets 17.4 7.5 24.9 9.9 21.6 31.5 11.2 67.6
Impairment and reversal of impairment of non-financial assets (Note 20) 0.6 - 0.6 - - - - 0.6
Write-downs and reversals of write-downs of inventories (Note 5) - 0.2 0.2 0.1 0.1 0.2 - 0.4
Write-downs and reversals of write-downs of accounts receivable 0.9 0.3 1.2 2.6 0.3 2.9 (0.1) 4.0
After tax share in profit of equity accounted investees 18.7 - 18.7 (0.2) 11.5 11.3 - 30.0
Segment operating income 96.3 83.5 179.8 77.4 30.4 107.8 4.2 291.8
Year ended March 31, 2013 (amounts in millions) TS/C SP/C Civil SP/M TS/M Military NCM Total External revenue $ 659.8 $ 456.8 $ 1,116.6 $ 562.5 $ 244.0 $ 806.5 $ 112.1 $ 2,035.2
Depreciation and amortization Property, plant and equipment 74.5 4.6 79.1 8.4 3.7 12.1 2.7 93.9
Intangible and other assets 18.0 4.0 22.0 6.9 10.9 17.8 9.0 48.8
Write-downs and reversals of write-downs of inventories (Note 5) - (0.3) (0.3) (0.2) (0.1) (0.3) 0.4 (0.2)
Write-downs and reversals of write-downs of accounts receivable 3.0 0.3 3.3 0.2 - 0.2 0.5 4.0
After tax share in profit of equity accounted investees 14.2 - 14.2 1.5 4.4 5.9 - 20.1
Segment operating income 100.7 88.2 188.9 80.0 27.4 107.4 6.4 302.7

Notes to the Consolidated Financial Statements
Assets and liabilities employed by segment The Company uses assets employed and liabilities employed to assess resources allocated to each segment. Assets employed include accounts receivable, contracts in progress, inventories, prepayments, property, plant and equipment, intangible assets, investment in equity accounted investees, derivative financial assets and other assets. Liabilities employed include accounts payable and accrued liabilities, provisions, contracts in progress, deferred gains and other non-current liabilities and derivative financial liabilities.
CAE Year-End Financial Results 2014 | 57
Operating profit The following table provides a reconciliation between total segment operating income and operating profit: (amounts in millions) 2014 2013
Total segment operating income $ 291.8 $ 302.7
Restructuring, integration and acquisition costs (Note 22) - (68.7)
Operating profit $ 291.8 $ 234.0
Capital expenditures which consist of additions to non-current assets (other than financial instruments and deferred tax assets), by segment are as follows: (amounts in millions) 2014 2013
TS/C $ 137.5 $ 91.2
SP/C 31.2 25.3
SP/M 22.3 31.3
TS/M 20.0 14.5
NCM 16.5 12.6
Total capital expenditures $ 227.5 $ 174.9
Assets and liabilities employed by segment are reconciled to total assets and liabilities as follows: (amounts in millions) 2014 2013
Assets employed TS/C $ 1,946.6 $ 1,697.6
SP/C 417.7 326.8
SP/M 584.5 579.1
TS/M 403.7 303.6
NCM 272.4 249.4
Assets not included in assets employed 611.8 534.8
Total assets $ 4,236.7 $ 3,691.3
Liabilities employed TS/C $ 243.5 $ 232.9
SP/C 344.5 270.4
SP/M 229.6 253.0
TS/M 191.3 151.6
NCM 50.0 50.2
Liabilities not included in liabilities employed 1,695.6 1,586.8
Total liabilities $ 2,754.5 $ 2,544.9

Notes to the Consolidated Financial Statements
NOTE 32 – RELATED PARTY RELATIONSHIPS
Geographic information
The Company markets its products and services globally. Sales are attributed to countries based on the location of customers. Non-current assets other than financial instruments and deferred tax assets are attributed to countries based on the location of the assets. (amounts in millions) 2014 2013
Revenue from external customers Canada $ 174.2 $ 205.3
United States 665.3 617.8
United Kingdom 256.9 236.8
Germany 71.5 71.2
Other European countries 374.6 320.5
United Arab Emirates 67.5 49.2
China 139.5 156.8
Other Asian countries 181.7 198.1
Australia 79.9 91.0
Other countries 103.8 88.5
$ 2,114.9 $ 2,035.2
(amounts in millions) 2014 2013
Non-current assets other than financial instruments and deferred tax assets Canada $ 775.9 $ 600.5
United States 715.9 614.5
Brazil 82.9 83.4
United Kingdom 335.6 285.8
Luxembourg 168.6 144.4
Netherlands 128.0 96.8
Other European countries 300.7 266.0
Asian countries 74.3 47.7
Other countries 105.6 95.6
$ 2,687.5 $ 2,234.7
The following table includes principal investments which significantly impact the results or assets of the Company: Investments in subsidiaries consolidated in the Com pany ’s financial statements: % equity % equity As at March 31 interest interest Name Country of incorporation 2014 2013
7320701 Canada Inc. Canada 100.0% 100.0%
8218765 Canada Inc Canada 100.0% 100.0%
BGT BioGraphic Technologies Inc. Canada - 100.0%
CAE (UK) PLC United Kingdom 100.0% 100.0%
CAE (US) Inc. United States 100.0% 100.0%
CAE (US) LLC United States 100.0% 100.0%
CAE Aircrew Training Services PLC United Kingdom 77.9% 77.9%
CAE Australia Pty Ltd. Australia 100.0% 100.0%
CAE Aviation Training B.V. Netherlands 100.0% 100.0%
CAE Aviation Training Chile Limitada Chile 100.0% 100.0%
CAE Aviation Training International Ltd. Mauritius 100.0% 100.0%
CAE Aviation Training Peru S.A. Peru 100.0% 100.0%
CAE Beyss Grundstücksgesellschaft mbH Germany 100.0% 100.0%
CAE Brunei Multi Purpose Training Centre Sdn Bhd Brunei 60.0% 60.0%
CAE Center Amsterdam B.V. Netherlands 100.0% 100.0%
CAE Center Brussels N.V. Belgium 100.0% 100.0%
CAE China Support Services Company Limited China 100.0% 100.0%
CAE Civil Aviation Training Solutions, Inc. United States 100.0% 100.0%
CAE Delaware Buyco Inc. United States 100.0% 100.0%
CAE Dubai L.L.C. Dubai 49.0% -
CAE Electronik GmbH Germany 100.0% 100.0%
CAE Engineering Korlátolt Felelısségő Társaság Hungary 100.0% 100.0%
CAE Euroco S.à r.l. Luxembourg 100.0% 100.0%
CAE Flight & Simulator Services Sdn. Bhd. Malaysia 100.0% 100.0%
CAE Flight and Simulator Services Korea, Ltd. Korea 100.0% -
CAE Flight Solutions USA Inc. United States 100.0% 100.0%
CAE Flight Training Center Mexico, S.A. de C.V. Mexico 100.0% 100.0%
CAE Flightscape Inc. Canada 100.0% 100.0%
CAE Global Academy Évora, SA Portugal 100.0% 100.0%
CAE Healthcare Canada Inc. Canada 100.0% 100.0%
CAE Healthcare Inc. United States 100.0% 100.0%
CAE Holdings B.V. Netherlands 100.0% 100.0%
CAE Holdings Limited United Kingdom 100.0% 100.0%
CAE India Private Limited India 76.0% 76.0%
CAE Integrated Enterprise Solutions Australia Pty Ltd. Australia 100.0% 100.0%
CAE Integrated Enterprise Solutions USA Inc. United States 100.0% -

58 | CAE Year-End Financial Results 2014
CAE International Capital Management Hungary LLC Hungary 100.0% 100.0%
CAE International Holdings Limited Canada 100.0% 100.0%
CAE Investments S.à r.l. Luxembourg 100.0% 100.0%
CAE Japan Flight Training Inc. Japan 100.0% -
CAE Labuan Inc. Malaysia 100.0% 100.0%
CAE Luxembourg Acquisition, S.à r.l. Luxembourg 100.0% 100.0%
CAE Luxembourg Financing, S.à r.l. Luxembourg 100.0% 100.0%
CAE Management Luxembourg S.à r.l. Luxembourg 100.0% 100.0%
CAE Melbourne Flight Training Pty Ltd Australia 100.0% 100.0%
CAE Mining Canada Inc. Canada 100.0% 100.0%
CAE Mining Corporate Limited United Kingdom 100.0% 100.0%
CAE Mining Holdings Inc. Canada 100.0% 100.0%
CAE North East Training Inc. United States 100.0% 100.0%
CAE Oxford Aviation Academy Amsterdam B.V. Netherlands 100.0% 100.0%
CAE Oxford Aviation Academy Phoenix Inc. United States 100.0% 100.0%
CAE Services (Canada) Inc. Canada 100.0% 100.0%
CAE Services GmbH Germany 100.0% 100.0%
CAE Services Italia S.r.l. Italy 100.0% 100.0%
CAE Servicios Globales de Instrucción de Vuelo (España), S.L. Spain 100.0% 100.0%
CAE Shanghai Company, Limited China 100.0% 100.0%
CAE SimuFlite Inc. United States 100.0% 100.0%
CAE Simulation Technologies Private Limited India 100.0% 100.0%
CAE Simulator Services Inc. Canada 100.0% 100.0%
CAE Singapore (S.E.A.) Pte Ltd. Singapore 100.0% 100.0%
CAE South America Flight Training do Brasil Ltda. Brazil 100.0% 100.0%
CAE STS Limited United Kingdom 100.0% 100.0%
CAE Training & Services Brussels NV Belgium 100.0% 100.0%
CAE Training & Services UK Ltd. United Kingdom 100.0% 100.0%
CAE Training Aircraft B.V. Netherlands 100.0% 100.0%
CAE Training Norway AS Norway 100.0% 100.0%
CAE USA Inc. United States 100.0% 100.0%
CAE Verwaltungsgesellschaft mbH Germany 100.0% 100.0%
Engenuity Holdings (USA) Inc. United States 100.0% 100.0%
Flight Simulator-Capital L.P. Canada 100.0% 100.0%
Flight Training Device (Mauritius) Ltd. Mauritius 100.0% 100.0%
GCAT Flight Academy Germany GmbH Germany 100.0% 100.0%
GCAT Flight Academy Malta Ltd. Malta 100.0% 100.0%
International Flight School (Mauritius) Ltd. Mauritius 100.0% 100.0%
Invertron Simulators PLC United Kingdom 100.0% 100.0%
Kestrel Technologies Pte Ltd. Singapore 100.0% 100.0%
Oxford Aviation Academy European Holdings AB Sweden 100.0% 100.0%
Oxford Aviation Academy Finance Ltd. Ireland 100.0% 100.0%
Oxford Aviation Academy Ireland Holdings Ltd. Ireland 100.0% 100.0%
Oxford Aviation Academy (Oxford) Ltd. United Kingdom 100.0% 100.0%
Oxford Aviation Academy Norway Holdings AS Norway 100.0% 100.0%
Presagis Canada Inc. Canada 100.0% 100.0%
Presagis Europe (S.A.) France 100.0% 100.0%
Presagis USA Inc. United States 100.0% 100.0%
Servicios de Instrucción de Vuelo, S.L. Spain 80.0% 80.0%
Simubel N.V. (a CAE Aviation Training Company) Belgium 100.0% 100.0%
Simulator Sevicios Mexico, S.A. de C.V. Mexico 100.0% 100.0%
SIV Ops Training, S.L. Spain 100.0% 100.0%

Notes to the Consolidated Financial Statements
In fiscal 2014, the unrecognized share of losses of joint ventures for which the Company has ceased to recognize its share of losses when applying the equity method was $1.6 million (2013 - $1.9 million). The cumulative unrecognized share of losses for these entities was $8.9 million at March 31, 2014 (2013 - $7.3 million, April 1, 2012 - $5.4 million). The cumulative unrecognized share of comprehensive loss of joint ventures was $11.0 million (2013 - $11.9 million, April 1, 2012 - $9.2 million).
CAE Year-End Financial Results 2014 | 59
Investments in joint ventures accounted for under t he equity method: % equity % equity As at March 31 interest interest Name Country of incorporation 2014 2013
Asian Aviation Centre of Excellence Sdn. Bhd. Malaysia 50.0% 50.0%
CAE Flight Training (India) Private Limited India 50.0% 50.0%
CAE Japan Flight Training Inc. Japan - 51.0%
CAE-Lider Training do Brasil Ltda. Brazil 50.0% 50.0%
China Southern West Australia Flying College Pty Ltd. Australia 47.1% 47.1%
Embraer CAE Training Services (UK) Limited United Kingdom 49.0% 49.0%
Embraer CAE Training Services, LLC United States 49.0% 49.0%
Emirates-CAE Flight Training LLC United Arab Emirates 49.0% 49.0%
Hatsoff Helicopter Training Private Limited India 50.0% 50.0%
Helicopter Training Media International GmbH Germany 50.0% 50.0%
HFTS Helicopter Flight Training Services GmbH Germany 25.0% 25.0%
National Flying Training Institute Private Limited India 51.0% 51.0%
Philippine Academy for Aviation Training Inc. Philippine 50.0% 50.0%
Rotorsim s.r.l. Italy 50.0% 50.0%
Rotorsim USA LLC United States 50.0% 50.0% Zhuhai Xiang Yi Aviation Technology Company Limited China 49.0% 49.0%

Notes to the Consolidated Financial Statements NOTE 33 – RELATED PARTY TRANSACTIONS
The following table presents the Company’s outstanding balances with its joint ventures:
Other assets include a finance lease receivable of $16.9 million (March 31, 2013 - $19.0 million) maturing in October 2022 and carrying an interest rate of 5.14 % per annum, loans receivable of $8.4 million (March 31, 2013 - $10.4 million) maturing in September 2016 and December 2017 and carrying respectively an interest rate of LIBOR 6 month plus 1% and 11% per annum and a long-term receivable of $5.3 million (March 31, 2013 – $4.9 million) with no repayment term. As at March 31, 2014 and 2013, there are no provisions held against any of the receivables from related parties. The following table presents the Company’s transactions with its joint ventures:
In addition, during fiscal 2014, transactions amounting to $2.7 million (2013 – $4.3 million) were made, at normal market prices, with organizations whose partners or officers included one of the Company’s directors. Compensation of key management personnel Key management personnel have the ability and responsibility to make major operational, financial and strategic decisions for the Company and include certain executive officers. The compensation of key management for employee services is shown below:
60 | CAE Year-End Financial Results 2014
(amounts in millions) 2014 2013
Accounts receivable (Note 4) $ 30.1 $ 49.9
Contracts in progress: assets 13.5 41.3
Other assets 30.6 34.3
Accounts payable and accrued liabilities (Note 9) 16.3 25.3
Contracts in progress: liabilities 6.3 9.3
(amounts in millions) 2014 2013
Revenue from products and services $ 101.0 $ 131.5
Purchases of products and services, and other 11.3 12.3
Other income transactions 2.9 2.8
(amounts in millions) 2014 2013
Salaries and other short-term employee benefits $ 3.8 $ 4.0
Post-employment benefits (1) 1.6 2.0
Termination benefits 2.4 -
Share-based payments 6.4 2.4
$ 14.2 $ 8.4
(1) Includes net interest on employee benefits obligations (Note 14)

Table of Contents Management ’s Discussion and Analysis
1. HIGHLIGHTS 1 2. INTRODUCTION 2 3. ABOUT CAE
3.1 Who we are 3.2 Our vision
4 4 4
3.3 Our strategy and value proposition 3.4 Our operations 3.5 Foreign exchange 3.6 Non-GAAP and other financial measures
4 6
12 14
4. CONSOLIDATED RESULTS 4.1 Results of our operations – fourth quarter of fiscal 2014 4.2 Results of our operations – fiscal 2014
16 16 18
4.3 Consolidated orders and backlog 20 5. RESULTS BY SEGMENT
5.1 Civil segments 5.2 Military segments 5.3 New Core Markets
21 22 26 30
6. CONSOLIDATED CASH MOVEMENTS AND LIQUIDITY 6.1 Consolidated cash movements 6.2 Sources of liquidity 6.3 Government assistance 6.4 Contractual obligations
32 32 33 34 34
7. CONSOLIDATED FINANCIAL POSITION 7.1 Consolidated capital employed 7.2 Off balance sheet arrangements 7.3 Financial instruments
35 35 36 37
8. BUSINESS COMBINATIONS 40 9. BUSINESS RISK AND UNCERTAINTY
9.1 Risks relating to the industry 9.2 Risks relating to the Company 9.3 Risks relating to the market
40 40 42 44
10. RELATED PARTY TRANSACTIONS 45 11. CHANGES IN ACCOUNTING POLICIES
11.1 New and amended standard adopted 11.2 New and amended standards not yet adopted 11.3 Use of judgements, estimates and assumptions
46 46 49 49
12. CONTROLS AND PROCEDURES 12.1 Evaluation of disclosure controls and procedures 12.2 Internal control over financial reporting
51 51 51
13. OVERSIGHT ROLE OF AUDIT COMMITTEE AND BOARD OF DIRECTORS 51 14. ADDITIONAL INFORMATION 51 15. SELECTED FINANCIAL INFORMATION 52

Management’s Discussion and Analysis for the fourth quarter and year ended March 31, 2014
1. HIGHLIGHTS
RESTATEMENT OF COMPARATIVES
Effective April 1, 2013, we implemented the new IFRS 11, Joint Arrangements and the amended IAS 19, Employee Benefits . Certain comparative figures provided for each quarter of the year ended March 31, 2013 have been restated to reflect the adoption of these accounting standards. The adjustments to our consolidated statements of financial position, net income, comprehensive income and cash flows as a result of the changes are discussed further in Changes in accounting policies .
FINANCIAL
FOURTH QUARTER OF FISCAL 2014
Higher revenue over last quarter and higher revenue over the fourth quarter of fiscal 2013 − Consolidated revenue was $583.4 million this quarter, $69.8 million or 14% higher than last quarter and $17.8 million or 3% higher than the fourth quarter of fiscal 2013.
Higher net income attributable to equity holders of the Company compared to last quarter and compared to the fourth quarter of fiscal 2013 − Net income attributable to equity holders of the Company was $60.0 million (or $0.23 per share) this quarter, compared to
$46.1 million (or $0.18 per share) last quarter, representing an increase of $13.9 million or 30%, and compared to $43.1 million (or $0.17 per share) in the fourth quarter of last year, representing an increase of $16.9 million or 39%;
− For the fourth quarter of fiscal 2013, restructuring, integration and acquisition costs recorded were $13.8 million ($10.2 million after tax). Net income before restructuring, integration and acquisition costs 1 was $53.3 million (or $0.20 per share) in the fourth quarter of fiscal 2013.
Positive free cash flow [1] at $105.1 million this quarter − Net cash provided by operations was $124.3 million this quarter, compared to $17.0 million last quarter and $113.7 million in the fourth quarter of last year; − Maintenance capital expenditures 1 and other asset expenditures were $20.4 million this quarter, $20.0 last quarter and $9.8 million in the fourth quarter of last year; − Proceeds from the disposal of property, plant and equipment were $8.5 million this quarter, $0.5 million last quarter and
$1.1 million in the fourth quarter of last year; − Cash dividends were $9.9 million this quarter, $10.6 million last quarter and $10.2 million in the fourth quarter of last year. FISCAL 2014
Higher revenue over fiscal 2013 − Consolidated revenue was $2,114.9 million, $79.7 million or 4% higher than last year.
Higher net income attributable to equity holders of the Company − Net income attributable to equity holders of the Company was $190.0 million (or $0.73 per share) compared to $137.7 million (or $0.53 per share) last year, representing a $52.3 million or 38%
increase; − For fiscal 2013, restructuring, integration and acquisition costs recorded were $68.7 million ($51.2 million after tax). Net income before restructuring, integration and acquisition costs 1 was $188.9
million (or $0.73 per share) in fiscal 2013.
Positive free cash flow at $200.6 million − Net cash provided by operations was $276.0 million this year, compared to $154.5 million last year; − Maintenance capital expenditures and other asset expenditures were $69.9 million this year, compared to $53.6 million last year; − Proceeds from the disposal of property, plant and equipment were $15.4 million this year, compared to $9.2 million last year; − Cash dividends were $40.1 million this year, compared to $37.1 million last year.
Capital employed 1 ending at $2,338.4 million − Capital employed increased by $378.6 million or 19% this year; − Return on capital employed 1 (ROCE) was 11.4% this year compared to 10.2% last year;
− Non-cash working capital 1 decreased by $87.2 million in fiscal 2014, ending at $124.6 million; − Property, plant and equipment increased by $198.4 million; − Other long-term assets and other long-term liabilities increased by $303.8 million and $36.4 million respectively; − Net debt 1 increased by $42.8 million this year, ending at $856.2 million.
[1] Non-GAAP and other financial measures (see Section 3.6).
CAE Annual Report 2014 | 1

Management’s Discussion and Analysis
ORDERS 2 [2]
− The book-to-sales ratio 2 for the quarter was 0.97 x (combined civil was 1.08x, combined military was 0.82x and New Core Markets was 1.0x). The ratio for the last 12 months was 1.13x (combined civil was 1.28x, combined military was 0.92x and New Core Markets was 1.0x);
− Total order intake this year was $2,380.3 million, up $240.6 million over last year; − Total backlog 2 was $4,205.6 million at March 31, 2014, $487.8 million higher than last year.
Civil segments − Training & Services/Civil signed contracts with an expected value of $898.9 million; − Simulation Products/Civil won $608.4 million of orders, including contracts for 48 full-flight simulators (FFSs). Military segments − Simulation Products/Military won $484.7 million of orders for new training systems and upgrades; − Training & Services/Military won contracts valued at $272.1 million.
New Core Markets segment − New Core Markets order intake was valued at $116.2 million.
2. INTRODUCTION
In this report, we , us , our , CAE and Company refer to CAE Inc. and its subsidiaries. Unless we have indicated otherwise: − This year and 2014 mean the fiscal year ending March 31, 2014; − Last year, prior year and a year ago mean the fiscal year ended March 31, 2013; − Dollar amounts are in Canadian dollars. This report was prepared as of May 15, 2014, and includes our management’s discussion and analysis (MD&A) for the year and the three-month period ended March 31, 2014 and the consolidated financial statements and notes for the year ended March 31, 2014. We have prepared it to help you understand our business, performance and financial condition for fiscal 2014. Except as otherwise indicated, all financial information has been reported in accordance with International Financial Reporting Standards (IFRS). All quarterly information disclosed in the MD&A is based on unaudited figures. For additional information, please refer to our annual consolidated financial statements for this fiscal year, which you will find in the annual report for the year ended March 31, 2014. The MD&A provides you with a view of CAE as seen through the eyes of management and helps you understand the company from a variety of perspectives: − Our vision; − Our strategy and value proposition; − Our operations; − Foreign exchange; − Non-GAAP and other financial measures; − Consolidated results; − Results by segment; − Consolidated cash movements and liquidity; − Consolidated financial position; − Business combinations; − Business risk and uncertainty; − Related party transactions; − Changes in accounting policies; − Controls and procedures; − Oversight role of the Audit Committee and Board of Directors. You will find our most recent annual report and annual information form (AIF) on our website at www.cae.com, on SEDAR at www.sedar.com or on EDGAR at www.sec.gov.
2 Non- GAAP and other financial measures (see Section 3.6).
2 | CAE Annual Report 2014
Management’s Discussion and Analysis
ABOUT MATERIAL INFORMATION This report includes the information we believe is material to investors after considering all circumstances, including potential market sensitivity. We consider something to be material if: − It results in, or would reasonably be expected to result in, a significant change in the market price or value of our shares, or; − It is quite likely that a reasonable investor would consider the information to be important in making an investment decision. CAUTION REGARDING FORWARD-LOOKING STATEMENTS This report includes forward-looking statements about our activities, events and developments that we expect to or anticipate may occur in the future including, for example, statements about our vision, strategies, market trends and outlook, future revenues, capital spending, expansions and new initiatives, financial obligations and expected sales. Forward-looking statements normally contain words like believe , expect , anticipate , plan, intend , continue , estimate , may , will , should, strategy, future and similar expressions. By their nature, forward-looking statements require us to make assumptions and are subject to inherent risks and uncertainties associated with our business which may cause actual results in future periods to differ materially from results indicated in forward-looking statements. While these statements are based on management’s expectations and assumptions regarding historical trends, current conditions and expected future developments, as well as other factors that we believe are reasonable and appropriate in the circumstances, readers are cautioned not to place undue reliance on these forward-looking statements as there is a risk that they may not be accurate. Important risks that could cause such differences include, but are not limited to, risks relating to the industry such as competition, level and timing of defence spending, government-funded military programs, constraints within the civil aviation industry, regulatory rules and compliance and conflict mineral rules, risks relating to CAE such as product evolution, R&D activities, fixed-price and long-term supply contracts, procurement and original equipment manufacturer (OEM) leverage, warranty or other product-related claims, product integration, protection of intellectual property, key personnel, environmental liabilities and claims arising from casualty losses, integration of acquired businesses, our ability to penetrate new markets, length of sales cycle and our reliance on technology, and risks relating to the market such as foreign exchange, availability of capital pension plan funding, doing business in foreign countries and income tax laws. Additionally, differences could arise because of events that are announced or completed after the date of this report, including mergers, acquisitions, other business combinations and divestitures. You will find more information in the Business risk and uncertainty section of the MD&A. We caution readers that the risks described above are not necessarily the only ones we face; additional risks and uncertainties that are presently unknown to us or that we may currently deem immaterial may adversely affect our business. Except as required by law, we disclaim any intention or obligation to update or revise any forward-looking statements whether as a result of new information, future events or otherwise. The forward-looking information and statements contained in this report are expressly qualified by this cautionary statement.
CAE Annual Report 2014 | 3

Management’s Discussion and Analysis
3. ABOUT CAE 3.1 Who we are CAE provides the industry’s most comprehensive training solutions based on world-leading simulation technology and integrated training services. Our vision is to be our customers’ Partner of Choice and we take a long term approach to customer relationships. We offer our civil aviation, defence and security and healthcare and mining customers a complete range of highly innovative product, service and training centre solutions designed to help them meet their mission critical needs for safety, efficiency and readiness. We have the broadest global presence in our industry, enabling us to respond to our customers locally, with 8,000 people at more than 160 sites and training locations in 3 5 countries, including our joint venture operations. In fiscal 201 4 , we had annual revenue exceeding $2. 1 billion, approximately 90% of which came from worldwide exports and international activities. We have the largest installed base of civil and military flight simulators , supported by a range of after-sales services. We have the broadest training services network in the world and offer civil aviation and military training services in 67 locations worldwide where we train more than 1 2 0,000 civil and military crewmembers annually. Approximately half of our revenue comes from the sale of simulat ors and related products, and the balance from services including training, maintenance, ab initio (cadet) pilot training and aircraft crew sourcing services. Founded in 1947 and headquartered in Montreal, Canada, CAE has built an excellent reputation and long-standing customer relationships based on nearly 70 years of experience, strong technical capabilities, a highly trained workforce and global reach. CAE’s common shares are listed on the Toronto and New York stock exchanges under the symbol CAE.
3.2 Our vision We intend to be the partner of choice for customers operating in complex mission-critical environments by providing the most innovative modeling and simulation-based solutions to enhance safety and improve efficiency .
3.3 Our strategy and value proposition
Our strategy We are a world-leading provider of modeling and simulation-based training solutions. We have a long history of serving the needs of customers in the civil aerospace and defence and security markets, and the CAE brand has becom e synonymous with safety, quality and reliability the world over. Our focus involves supporting airlines , aircraft operators and defence and security forces with their ongoing, long-term training needs. In defence and security, this means helping forces to ensure mission readiness , and in civil aviation, the necessity for training solutions is driven by the need for uncompromised safety in globally regulated markets. Our unique ability to provide comprehensive solutions, our technology leadership, proven customer support, and a vast global presence differentiates us in our end markets. We are invested in both mature and emerging markets and this enables us to capitalize on current demand and future growth opportunities. Approximately one third of our revenue comes from the U.S., one third from Europe and one third from the rest of the world including the higher growing, emerging markets . Value proposition The value we provide customers is the ability to enhance the safety of their operations, improve their mission readiness for potentially dangerous situations and lower their costs by helping them become more operationally efficient. We offer a range of products and services solutions to enhance our customers’ planning and decision-making abilities . We also offer a broad global reach, and as a result, we are able to provide solutions in proximity to our customers, which is an important cost-benefit consideration for them. Our core competencies and competitive advantages include: − World-leading modeling and simulation technology; − Comprehensive knowledge of training and learning methodologies; − Total array of training products and services solutions; − Broad-reaching customer intimacy; − High brand equity; − Proven systems engineering and program management processes; − Best-in-class customer support; − Well established in emerging markets. 4 | CAE Annual Report 2014

Management’s Discussion and Analysis
World-leading modeling and simulation technology We pride ourselves on our technological leadership. Pilots around the world view our simulation as the closest thing to the true experience of flight. We have consistently led the evolution of flight training and simulation systems technology with a number of industry firsts. We have simulated the entire range of large civil aircraft in use today , a large number of the leading regional and business aircraft and a number of civil helicopters. We are an industry leader in providing simulation and training solutions for fixed-wing tanker and transport aircraft, maritime patrol aircraft , trainer aircraft and helicopter platforms for the military. We also have extensive knowledge, experience and credibility in designing and developing simulators for first-to-market aircraft of major aircraft manufacturers. We now use our expertise in modeling and simulation beyond training into other mission-critical areas , such as
emergency response services, where these technologies are used to support superior decision-making capabilities. As well, we have extended these capabilities to the healthcare and mining markets . Comprehensive knowledge of training and learning methodologies With nearly 70 years of experience in simulation, we are an industry expert in aviation training and are the industry’s training solution one-stop shop. We are constantly introducing and implementing ways to improve safety and training efficiency, from ab initio to professional pilot training. For instance, data from simulation training sessions is captured, analyzed and displayed to provide instructors and trainees with real-time feedback on training performance, allowing focus on priority development areas to increase training efficiency. We are also playing a leadership role in supporting airlines toward the adoption of the Multi-Crew Pilot Licence (MPL) program, the most recent pilot licence introduced by the International Civil Aviation Organization (ICAO), which embeds the latest advances in learning leveraging simulation. Another example is our industry leadership towards implementing Upset Prevention and Recovery Training, specifically geared toward preparing pilots to address adverse and extreme flying conditions. In the defence and security market, we are increasingly leveraging our unique training and systems integration capabilities to offer customers comprehensive training solutions that can include training centres, training services and simulation products. We are using our experience gained in the development of training and learning methodologies in aerospace to bring and enhance modeling and simulation technologies to our training solutions in the healthcare and mining domains. In healthcare, we offer both training expertise and the widest breadth of simulation training products in the industry, with surgical, patient, and ultrasound simulators and trainers for more than 20 medical specialties . Our simulation cent re management system, LearningSpace, effectively captures every aspect of a live simulation, allowing the delivery of instant, multimedia debriefing sessions and ongoing training improvement . In mining, we have borrowed from aviation standards to introduce new solutions to train mining vehicle operators. Total array of training products and services solutions We offer a wide array of training products, from desktop trainers to FFSs, addressing both our civil and defence and security customers’ training needs. With a large network of training centres, we are also a global leader in aviation training providing the complete solution to meet our customers’ training and pilot sourcing needs. Our pilot training programs span over 100 different civilian aircraft models including commercial airliners, business aircraft and helicopters . In the defence and security market, our programs involve training for transport aircraft, helicopters, trainer aircraft , aerial refuelers, maritime patrol aircraft and remotely piloted systems . Our range of training services includes the provision of curricula for pilot type training, cabin crew and maintenance training. Our civil pilot sourcing solution adds value and moves our customers’ businesses forward by identifying, screening, selecting, training and ultimately placing pilots at their airlines. In addition, we deliver civil ab initio pilot training through CAE Oxford Aviation Academy. Broad-reaching customer intimacy The realization of our mission to be our customers’ partner of choice is evident in the relationships that we have with most of the world’s airlines, aircraft operators, governments and original equipment manufacturers (OEMs). Our broad geographic coverage allows us to respond quickly and cost effectively to customer needs and new business opportunities while having a deep understanding of the regulations and customs of the local market. We operate a fleet of over 259 full - flight and full-mission simulators in 67 civil aviation and military training locations worldwide to meet the wide range of operational requirements of our customers. Among our thousands of customers, we have long-term training services agreements and joint ventures with more than 30 major airlines and aircraft operators around the world and relationships with approximately 50 defence operators in approximately 35 countries. High brand equity We are unique in the simulation industry as the only truly global company focused on modeling, simulation, and training. We continually reinforce our focus, experience and technology leadership as we position the Company with customers around the world. We invest in building and maintaining our brand and reputation as a company committed to innovation that will help its customers enhance safety, improve efficiency, enhance decision-making and achieve mission readiness. We are focused on offering the aviation industry’s most comprehensive portfolio of simulation products, training services, and crew sourcing with the ability to tailor a flexible training solution to the individual requirements of each of our customers. Our simulation products are rated among the highest in the industry for reliability and availability. This is a key benefit because simulators normally operate in high-duty cycles of up to 20 hours a day, seven days a week. We design our products so customers can upgrade them, giving them more flexibility and opportunity as products change or new air worthiness regulations are introduced. The CAE brand is synonymous with industry-leading simulation technology as well as superior training and customer support and we strive to be our customers’ partner of choice for any simulation and training related requirement.
CAE Annual Report 2014 | 5

Management’s Discussion and Analysis Proven systems engineering and program management processes We continue to evolve our technology platform to meet the changing market needs, and to develop solutions and deliver technically complex programs to help ensure that there are trained and mission-ready aircrew and combat troops around the world. We have a proven track record on delivering complex civil and military first-to-market simulators. Our defence and security business unit has several of its organizations around the world certified to Level 3 or above of the Capability Maturity Model Integration (CMMI), which is an internationally recognized model of industry best practices in organizational process improvement, project management, systems and software development. Our experience, coupled with our continued investment in research and development, strengthens our technological leadership as well as our management expertise to provide programs featuring sensor simulation for maritime operations, synthetic tactical environments for naval and fighter operations as well as visualization and common database technologies that deliver rich, immersive synthetic environments for the most effective training and mission rehearsal possible. Best-in-class customer support We maintain a strong focus on after-sales support, which is often critical in winning additional sales contracts, as well as important update and maintenance services business. Our customer support practices, including a web-based customer portal, performance dashboard, and automated report cards, have resulted in enhanced customer support according to customer comments and feedback. Well established in emerging markets We pride ourselves in our local presence in each of our global markets, while simultaneously maintaining the efficiencies and advantages of being an international organization. This approach has enabled us to lead in high-growth markets like China, Eastern Europe, the Indian sub-continent, the Middle East, South America and Southeast Asia, where we have been active for several decades. 3.4 Our operations We are a global leader with an extensive range of capabilities to help our customers achieve greater levels of safety, operational efficiency, decision-making capabilities and mission readiness. We offer integrated solutions, which often involve multi-year agreements with our customers to provide a full complement of both products and services. We primarily serve four markets globally: − The civil market includes aircraft manufacturers, major commercial airlines, regional airlines, business aircraft operators, civil helicopter operators, third-party training centres, flight training
organizations (FTOs), maintenance repair and overhaul (MRO) organizations and aircraft finance leasing companies; − The defence and security market includes OEMs, government agencies, public safety organizations and defence forces worldwide; − The healthcare market includes hospital and university simulation centres, medical and nursing schools, paramedic organizations, defence forces, medical societies and OEMs; − The mining market includes global mining corporations, exploration companies, mining contractors and the world’s premier mining consultancies. CIVIL MARKET Training & Services/Civil (TS/C) Provides commercial, business and helicopter aviation training for flight, cabin, maintenance and ground personnel and ab initio pilot training and crew sourcing services We are the largest provider of commercial and helicopter aviation training services in the world and the second largest provider of business aviation training services. We lead the market in growth regions of China, India, the Middle East, South America and Southeast Asia. Through our broad global network of training centres, we serve all sectors of civil aviation including airlines and other commercial operators , helicopter operators and business aviation. We currently operate 239 FFSs, including FFSs operating in our joint ventures, and provide aviation training and services, including simulation-based crew training, crew sourcing, ab initio pilot training and training cent re operations in approximately 30 countries around the world. Among our thousands of customers, we have long-term training centre operation and training services agreements and joint ventures with approximately 30 major airlines and aircraft operators around the world. We offer a comprehensive range of training solutions and services, including curriculum development, training centre operations, pilot training, cabin crew training, aircraft maintenance technician training, courseware solutions and consulting services. We are a leader in flight sciences, using flight data analysis to improve airline safety, maintenance, flight operations and training. CAE Oxford Aviation Academy is the largest ab initio network in the world with 10 academies , a fleet of over 220 aircraft and the resources and expertise to train more than 2,000 cadets annually. CAE Parc Aviation is the global market leader in the provision of flight crew and technical personnel to airlines, aircraft leasing companies, manufacturers and MRO companies worldwide . 6 | CAE Annual Report 2014

Management’s Discussion and Analysis
Simulation Products/Civil (SP/C) Designs, manufactures and supplies civil flight simulation training devices and visual systems We are the world leader in the provision of civil flight simulation equipment, including FFSs and a comprehensive suite of integrated procedures trainers, flight training devices and computer-based tools, using the same high-fidelity Level D software as the FFSs. We have designed and manufactured more civil FFSs for major and regional commercial airlines, third-party training centres and OEMs than any other company. We have developed a wealth of experience in developing first-to-market simulators for more than 35 new types of aircraft models including recent years’ development of simulators for the Airbus A350 XWB, AVIC Medium-Sized Transport, Mitsubishi Regional Jet (MRJ), ATR42-600 and ATR72-600, Bombardier CSeries, Global 5000/6000, Global 7000/8000 and Learjet 85 , Dassault Falcon 5X and the Commercial Aircraft Corporation of China, Ltd (COMAC) ARJ21 and C919. Leveraging our extensive worldwide network of spare parts and service teams, we also offer a full range of support services. This includes emergency support, simulator updates and upgrades, maintenance services and simulator relocations. Market trends and outlook In commercial aviation, aircraft capacity and passenger traffic growth are primarily driven by gross domestic product (GDP). Over the past 20 years, air travel has grown at an average rate of 4.8% and the aerospace industry’s widely held expectation is that long-term average growth for air travel will be approximately 5% annually over the next two decades. The International Air Transport Association (IATA) forecasts that by 2017 total passenger demand is expected to increase by 31%, representing 930 million more passengers compared to 2012. Growth rates are higher in the emerging markets than in large and established markets like Europe and the U.S. Continued growth in air travel and re-fleeting requirements have led to record commercial aircraft backlogs and OEM production rates. In the business and helicopter aviation sector, demand for air travel is primarily driven by corporate profitability and general economic conditions. According to the U.S. Federal Aviation Administration (FAA), the number of business jet flights has increased by 3.4% in the past 12 months. The industry remains optimistic of further recovery and long-term growth in business aircraft travel, and consistent with this view, major business aircraft OEMs have announced new aircraft programs. Consolidation of the industry continues as companies position themselves to capitalize on this robust commercial aerospace market. The following secular trends continue to form the basis of our civil market investment hypothesis: − Expected long-term growth in air travel; − Demand in emerging markets arising from secular growth and a need for infrastructure to support air travel; − Aircraft backlogs and delivery rates; − More efficient and technologically advanced aircraft platforms; − Long-term demand and shortage of trained aviation professionals (pilots, maintenance, cabin crew). Expected long-term growth in air travel In calendar 2013, global passenger traffic increased by 5.2% compared to calendar 2012. For the first three months of calendar 2014, passenger traffic increased by 5.6% compared to the first three months of calendar 2013. Emerging markets outperformed with passenger traffic in the Middle East, Latin America, Asia/Pacific and Europe growing at 13.3%, 7.1%, 7.0% and 5.2% respectively, while North America remained stable. The global commercial aircraft fleet increased by 4.0% from March 2013 to March 2014, growing in Asia/Pacific, the Middle East and Latin America by 8.4%, 7.8% and 5.7% respectively, increasing slightly in Europe and remaining stable in North America. Possible impediments to steady growth progression in air travel include major disruptions such as regional political instability, acts of terrorism, pandemics, natural disasters, sharp and sustained increases in fuel costs, major prolonged economic recessions or other major world events. Demand in emerging markets arising from secular growth and a need for infrastructure to support air travel Emerging markets such as China, Eastern Europe, the Indian sub-continent, the Middle East, South America and Southeast Asia are expected to continue experiencing higher air traffic growth over the long term versus mature markets such as North America and Western Europe. Aircraft backlogs and delivery rates Commercial aircraft OEMs continue to work through record backlog levels of over 12,000 aircraft. Our civil business relies mainly on the already in-service fleet to drive demand as approximately two thirds of our revenue is generated from training and services in support of the global fleet. Our product sales are driven mainly by aircraft deliveries coming from OEMs’ production lines. Recent aircraft order intake remains strong, with North American airlines such as Air Canada and American Airlines and airlines in the emerging markets such as Etihad Airways, Lion Air, VietJet Air and Air Costa leading the intake. We expect the continued high rate of aircraft deliveries to translate into continued high demand for training products and incremental demand for service s.
CAE Annual Report 2014 | 7

Management’s Discussion and Analysis More efficient and technologically advanced aircraft platforms More efficient and technologically advanced aircraft platforms will drive the demand for new types of simulators and training programs. One of our strategic priorities is to partner with manufacturers to take an early position on these future programs. In recent years, we have signed contracts with Bombardier for the CSeries aircraft and the Global 7000/8000 aircraft, ATR for the ATR42/72-600 aircraft, Mitsubishi Aircraft Corporation for the MRJ aircraft, Airbus for the A350 XWB aircraft, Dassault for the Falcon 5X, AVIC for the Medium-Sized Transport aircraft and COMAC for the C919 aircraft. These contracts allow us to leverage our modeling, simulation and training expertise to deliver training solutions, including CAE 7000 Series FFS and the recently launched CAE 7000XR Series FFS, CAE Simfinity TM procedures trainers, comprehensive training programs and expansion of our network to meet airlines’ training needs. The demand for new and more efficient platforms is driven by better operational flexibility, reduced maintenance costs, reduced fuel costs and improved emissions and environmental footprints. Airlines are actively seeking ways to reduce fuel costs and the operational risk against further fuel cost fluctuations, as well as ways to obtain benefits offered by new generation aircraft and propulsion technologies. Business jet operators also demand high performance aircraft. Business aircraft OEMs have announced plans to introduce, or have already introduced, a variety of new aircraft models incorporating the latest technologies to enhance performance and operator benefits such as range, speed, comfort and the accessibility of business air travel. Some examples include Bombardier’s Learjet 70, 75 and 85, Challenger 350 and Global 7000/8000, Embraer’s Legacy Series and Lineage 1000, Gulfstream’s G650, Cessna’s Citation M2 and Dassault’s Falcon 5X. Deliveries of new-model aircraft are subject to program delays, which in turn affect the timing of FFS orders and deliveries. Long-term demand and shortage of trained aviation professionals (pilots, maintenance, cabin crew) Worldwide demand is expected to increase over the long term Growth in the civil aviation market has driven the demand for pilots, maintenance technicians and cabin crew worldwide, resulting in a shortage of qualified professionals in several markets, notably the faster growing emerging markets. Pilot supply constraints include aging crew demographics and fewer military pilots transferring to civil airlines. New pilot certification processes require more simulation-based training Simulation-based pilot certification training is taking on a greater role internationally with the MPL, with stall and upset prevention and recovery training and with new Airline Transport Pilot (ATP) requirements in the U.S . Indeed, the ICAO and various national and regional aviation regulatory agencies have published new regulatory requirements, standards and guidance on these specific topics. MPL is an alternative training and licensing methodology which places more emphasis on simulation-based training to develop ab initio students into First Officers of airliners in a specific airline environment. On average, current MPL programs in the industry consist of one third of the training in actual aircraft and two thirds of the training in flight simulation training devices, versus traditional training for other licences that average 80% to 90% in actual aircraft. Today, there are approximately 50 nations that have MPL regulations in place and over 15 of these nations already use these regulations with training providers and airlines. CAE has MPL programs in Asia and in Europe with various airlines . From a global industry perspective , MPL is producing promising results and over 800 MPL graduates are already flying successfully with their airline. As the MPL methodology continues to gain momentum, it will result in increased use of simulation-based training. Finally, the FAA in the U.S. enacted its final set of rules on July 15 th , 2013 on new pilot certification and qualification requirements for air carrier operations, requiring pilots to obtain an ATP and Type Rating. As of August 2014, pilots applying for an ATP certificate will be required to complete practical requirements which call for more simulation-based training that includes adverse weather conditions, low energy states, stalls, upset prevention and recovery, and high altitude operations. We believe these new requirements will lead to an increase in demand for training in simulators. DEFENCE AND SECURITY MARKET We believe that in the simulation-based training market, we are uniquely positioned to be part of the solution for governments and defence forces to reduc e the cost of military readiness. Three important factors help distinguish our defence business and underlie the large pipeline of opportunities for our modeling and simulation-based solutions. First, we have a unique global position that provides balance and diversity across the world’s defence and security markets. Second, we have a strong, experienced position on enduring aircraft platforms serving both defence and security markets that are expected to have long program lives. Third, and most fundamentally, simulation-based training provides considerable value as defence forces operate in a constrained budget environment yet still need to train and maintain a high state of readiness. Simulation Products/Military (SP/M) Designs, manufactures and supplies advanced training equipment and software tools for air forces, armies, navies and public safety organizations We are a world leader in the design and production of military flight simulation equipment. We offer solutions to help maintain and enhance our customers’ safety, efficiency, mission readiness and decision-making capabilities. We develop simulation equipment, training systems and software tools for a variety of military aircraft, including fighters , helicopters, trainer aircraft, maritime patrol and tanker/transport aircraft and remotely piloted systems . We also offer simulation-based solutions for land and naval forces, including a range of driver and gunnery trainers for tanks and armoured fighting vehicles (AFVs) as well as hands-on and virtual maintenance trainers. We have delivered simulation products and training systems to more than 50 defence operators in approximately 35 countries. 8 | CAE Annual Report 2014

Management’s Discussion and Analysis
Training & Services/Military (TS/M) Supplies turnkey training services, simulation-based integrated enterprise solutions and maintenance and in-service support solutions We are a world-class training systems integrator with the capability to provide comprehensive, turnkey training solutions to global defence and security forces. We provide a range of training support services such as contractor logistics support, maintenance services, classroom instruction and simulator training at over 80 sites around the world , including our joint venture operations. Increasingly, we are offering our training systems integration expertise across air, land, sea and public safety to help our customers create an integrated, immersive training enterprise. We also offer a variety of modeling and simulation-based integrated enterprise solutions, and a range of in-service support solutions such as systems engineering and lifecycle management. Market trends and outlook While the U.S. Bipartisan Budget Act for fiscal year 2014 has helped reduce the near-term impact of sequestration cuts and provided the U.S. Department of Defense with greater budget certainty over the current government fiscal year, the timing of contract awards will continue to be difficult to predict as the U.S. military services work to achieve the right balance in military capacity, capabilities and readiness. This may impact our ability to grow revenue and income in the short term ; however, our view is that the impediment to growth is not the size of the market, but rather the timing of procurements . In Europe, force structure reductions and reduced future investment plans have narrowed the pipeline of new opportunities; however, we maintain a portfolio of recurring business for which we have sized our operations. While the United States and Europe still present modest challenges , we are seeing increased opportunities originating from regions with growing defence budgets, like Asia and the Middle East where we have an established and growing presence. We also continue to bid on a solid pipeline of global opportunities . In addition, there are encouraging signs for our market specialization and we are confident that the use of simulation-based training will continue to increase in the future. The following trends continue to drive the use of our training centres, services and products in defence: − Explicit desire of governments and defence forces to increase the use of modeling and simulation to mitigate budget pressures; − Attractiveness of outsourcing of training and maintenance services; − Need for synthetic training to conduct mission rehearsal, including joint and coalition forces training; − Relationships with OEMs as their partner of choice for simulation and training; − Use of modeling and simulation for analysis and decision support. Explicit desire of governments and defence forces to increase the use of modeling and simulation to mitigate budget pressures More defence forces and governments are adopting simulation in training programs because it improves training effectiveness, reduces operational demands on aircraft, lowers risk compared to operating actual weapon system platforms and significantly lowers costs. For example, the U.S. Air Force (USAF) is making more extensive use of simulation for KC-135 tanker boom operator training, which costs approximately $20,000 for a three-hour training mission in the actual aircraft, but only $1,000 for that same three-hour training mission in simulators. The higher cost of live training and the desire to save aircraft for operational use are two factors prompting a greater adoption of simulation-based training. Unlike civil aviation, where the use of simulators for training is common practice, there are no regulatory requirements to train in simulators in the military and the nature of mission-focused training demands at least some live training; however, the balance of live and synthetic training is shifting more to simulation. We have begun to see militaries plan for the increased use of simulation as part of the overall training curriculum. For example, the U.S. Navy reports the share of simulation-based training on some specific U.S. Navy aircraft platforms could rise close to 50% by 2020 . Because of the cost associated with conducting live training exercises, most militaries expect to rebalance the mix of live, virtual and constructive (computer-based) training and shift more of the training curriculum to home station virtual and constructive simulation. For example, the U.S. Army is planning to reduce the use of live training ranges and transfer some of this training to virtual and constructive simulation to reduce costs. This will ultimately create opportunities for simulation-based training centres, services and products. We view CAE as being part of the solution to achieving lower training costs while maintaining or improving readiness. Attractiveness of outsourcing of training and maintenance services Defence forces and governments continue to scrutinize expenditures to find ways to reduce costs and allow active-duty personnel to focus on operational requirements, which has an impact on defence budgets and resources. There has been a growing trend among defence forces to consider outsourcing a variety of training services and we expect this trend to continue. For example, during fiscal year 2014 we opened a new military training centre in Australia where the Australian Defence Forces will train their King Air 350 aircrews. This represents the first simulator services contract that the Australian Defence Forces have signed as part of a contractor-owned/contractor-operated service delivery program. We believe g overnments will increasingly look to industry for the delivery of training services because they often can be delivered faster and more cost effectively. Need for synthetic training to conduct mission rehearsal, including joint and coalition forces training There is a growing trend among defence forces to use synthetic training to meet more of their mission training requirements. Simulation technology solutions enable defence customers to plan sophisticated missions and carry out full-mission rehearsals in a synthetic environment as a complement to traditional live training or mission preparation. Synthetic training offers militaries a cost-effective way to provide realistic training for a wide variety of scenarios while ensuring they maintain a high state of readiness. Allies are cooperating and creating joint and coalition forces, which are driving the demand for networked training and operations. Training devices that can be networked to train different crews and allow for networked training across a range of platforms are increasingly important as the desire to conduct mission rehearsal exercises in a synthetic environment increases. We are actively promoting open, standard simulation architectures, such as the Common Database (CDB) , as well as new capabilities such as the CAE Dynamic Synthetic Environment (DSE), to better enable mission rehearsal and joint, networked training.
CAE Annual Report 2014 | 9

Management’s Discussion and Analysis Relationships with OEMs as their partner of choice for simulation and training We partner with manufacturers in the defence and security market to strengthen relationships and position for future opportunities. OEMs have introduced new platforms and continue to upgrade and extend the life of existing platforms, which drives worldwide demand for simulators and training. For example, Boeing has developed the new P-8A maritime patrol aircraft, Airbus Military has sold and continues to market both the A330 MRTT and C295 globally, Lockheed Martin is successfully marketing variants of the C-130J Hercules transport aircraft and F-35 fighter, Alenia Aermacchi and BAE Systems are selling the M-346 and Hawk lead-in fighter trainers, and AgustaWestland is continuing to develop a range of helicopters such as the AW139, AW169 and AW189. We have established relationships with each of the OEMs on these platforms. We also signed a memorandum of understanding to pursue working with General Atomics Aeronautical Systems, the world’s leading manufacturer of unmanned aircraft systems, on offering training solutions for GA-ASI’s Predator family of remotely piloted aircraft, and during fiscal year 2014 sold a Predator unmanned aerial system (UAS) mission trainer to the Italian Air Force. Use of modeling and simulation for analysis and decision support Traditionally, modeling and simulation have been used to support training, but is now increasingly applied across the program lifecycle, including support for analysis and decision-making operations. We see governments and defence forces looking to use simulation-based synthetic environments to support research and development programs, system design and testing, intelligence analysis, integration and exploitation, and to provide the decision support tools necessary to support mission planning in operations. As an example, we were recently contracted to establish a training centre and conduct emergency management training for the Brunei Ministry of Home Affairs and see further opportunities to develop integrated modeling and simulation centres. NEW CORE MARKETS (NCM) Healthcare market Simulation-based training is one of the most effective ways to prepare healthcare practitioners to care for patients and respond to critical situations while reducing the overall risk to patients. Through acquisitions and partnerships with experts in healthcare, we are leveraging our experience and best practices in simulation-based aviation training to deliver innovative solutions to improve the safety and efficiency of this industry. The healthcare simulation market is growing rapidly, with simulation centres becoming the standard in nursing and medical schools, while proprietary education is now using technology and simulation to compete with public institutions. We are a leader in simulation-based technology for healthcare with more than 8 ,000 deliveries of patient, imaging and surgical simulators in medical schools, nursing schools, hospitals, defence forces and other entities. We ha ve offices located in Canada, the U.S., Hungary and Germany and a network of approximately 50 distributors in more than 50 countries. We generate revenue in five main areas: patient simulators, surgical simulators, ultrasound simulators and task trainers , learning applications/courseware and centre management systems. Our patient simulators offer a high level of believability and life-like responses and teach students and practitioners to intervene with appropriate clinical measures. Our surgical simulators incorporate haptic technology that allows students and practitioners to acquire skills and practice in performing minimally invasive procedures, including bronchoscopies, endoscopies and cardiac valve replacements. Our ultrasound solutions utilize e-learning, ultrasound training models, mannequins and 3D animated display that allow students and practitioners to become familiar with diagnostic bedside ultrasound and ultrasound-guided procedures. Our simulation learning applications can be embedded within hospital work environments or large teaching institutions, allowing remote delivery of content for self-guided learning and assessment. Our medical simulation centre solutions simplify the operations behind managing complex simulation, assessment, recording and debriefing. Market trends and outlook The Healthcare simulation-based market is focused mainly on education, and is estimated upwards of $850 million. Of that, the largest share of the market is represented by the human patient simulation market, which is expected to grow in the double-digit range over the next five years. Our vision is for CAE Healthcare to lead in the broad adoption of simulation-based training solutions for healthcare practitioners to improve patient safety, reduce overall training cost and ultimately save more lives. Medical simulators can help to reduce medical errors by fundamentally changing the competency assessment and training of healthcare practitioners, just as flight simulators revolutionized pilot certification and training decades ago. In addition to the 850,000 active physicians and 67,000 medical students, there are approximately 3 million nurses and 250,000 nursing students in the U.S. and 8.8 million physicians and 14.5 million nurses worldwide. The demand for our products and services is driven by the: − U se of patient simulators to improve training and patient safety; − Increased adoption of minimally invasive surgery; − Advances in imaging technology applications in healthcare; − Increasing healthcare costs; − Service provider shortages.
Use of patient simulators to improve training and patient safety Patient simulators are the most commonly used simulators in the healthcare education and training markets. Human patient simulation provides an opportunity to reduce medical errors by providing opportunities to train for high-risk, low-frequency events. 10 | CAE Annual Report 2014

Management’s Discussion and Analysis
Increased adoption of minimally invasive surgery Minimally-invasive surgery (MIS) is accomplished through small surgical incisions, specialized surgical instruments, and endoscopic or alternative surgical imaging. Due to the advantages of MIS, such as reduced patient trauma and shorter hospitalization periods, it has seen increased adoption in place of previously invasive surgical procedures. Continuing advances in surgical technology and MIS techniques have established surgery as a leading driver for simulation technology training. Advances in imaging technology applications in healthcare Regulatory reform, the development of affordable technology-driven products and growing industry awareness have advanced the integration of imaging technology into healthcare. Increasing patient awareness of alternative technologies and procedures has helped to pressure insurers and providers to implement advanced imaging technologies. Bedside ultrasonography has become an invaluable tool in the management of critically ill patients. The hand-carried ultrasound (HCU) can immediately provide diagnostic information that is not accessible by a physical examination alone, provided that healthcare practitioners performing the examinations have adequate training. Increase in healthcare costs The growth and increasing cost of medical care is correlated to population growth and healthcare coverage expansion. Longer life expectancy and the baby boomer generation have generated significant demand for healthcare services. Widespread adoption of advanced medical technologies and services could translate into higher demand for training. Experts have demonstrated that medical simulation improves patient outcomes and reduces errors, which can help to mitigate the rate of increase in healthcare costs. Service provider shortages The World Health Organization has reported that there were 57 countries with critical shortages equivalent to a global deficit of 2.4 million doctors, nurses and midwives worldwide. As students graduate and move into clinical practice, there is a growing need among hospitals for on-boarding programs that transition the new students to competent practitioner effectively and efficiently. Simulation is now moving from the academic setting into clinical practice to provide a safe environment for clinical training. Mining market We have customers in over 90 countries that are currently supported by our offices in Australia, Brazil, Canada, Chile, India, Kazakhstan, Mexico, Peru, South Africa, the U.S. and the U.K. We provide products and services for open pit and underground operations to mining organizations, from large diversified miners to junior miners and consultancies. We generate revenue by delivering products and services across the mining value chain. Our software products are used for managing exploration and geological data, mine strategy, optimization, detailed design and scheduling for all mining methods and commodities. Our technical consulting team includes experienced geologists and mining engineers, servicing client needs such as managing exploration drilling programs, mining studies, resource evaluation, on-site technical services and business improvement projects. Our CAE Terra mining equipment simulators leverage our experience in simulation to provide an unrivalled level of realism. Our simulators are integrated with a comprehensive student management system, lesson planning tools and interactive touch panel instructor station. Our training services include workforce development planning, training needs analysis, professional development in technical disciplines and the design and implementation of operator training curriculum. Our operator training courseware is designed for multiple delivery modes including self-paced e-learning, instructor-led classroom training, procedural training and scenarios delivered in our high fidelity simulators. Market trends and outlook Our technology and services are used by customers to increase productivity and improve safety. The factors driving demand for our technology and services are: − Health and safety priority; − Declining grades and higher energy consumption resulting in increased cost of extraction; − Cyclicality of commodity prices; − Operations management and control. Health and safety priority Health and safety standards continue to be an area of focus for improvement through the use of technological advances and increased skills training to create a more highly skilled and better-educated work force. Mining companies are focusing on automated equipment, remote control of operations and simulation-based training of the workforce as means to improve overall safety.
CAE Annual Report 2014 | 11

Management’s Discussion and Analysis Declining grades and higher energy consumption resulting in increased cost of extraction In the last 30 years, the average grade of ore bodies has halved, while the waste removed to access the minerals has more than doubled, resulting in higher energy use and cost of extraction. Given the volatility of mineral prices and energy costs, different approaches are needed. These will include the increased use of optimization tools, simulation and scenario analysis within the industry to maximize value and maintain the viability of current operations, while helping mining companies focus on maximizing metal recovery instead of simply maximizing throughput. We are actively involved in finding technology-based solutions for recovering metal using less energy. Our existing tools for optimization and scenario analysis help mining organizations respond to changing prices and input costs in order to maximize the potential of their existing operations. Cyclicality of commodity prices Demand for commodities is highly correlated to economic cycles. This means that in addition to the increased cost of extraction, mining companies will usually experience pricing pressure during economic contractions. This tends to result in a reduction in capital spending by mining companies and delays in procurements, which negatively affect the business prospects of the mining industry supply chain. However, this factor serves as another driver toward increased use of optimization tools, simulation and scenario analysis within the industry to maximize the efficiency of operations. Operations management and control With increasing scale and complexity of operations, mining companies are seeking solutions for the real time oversight, coordination, decision-making and remote control of fixed and mobile assets. We are collaborating in global markets and providing mine operators with an opportunity to integrate our widely used mining systems with other operational management technologies. 3.5 Foreign exchange We report all dollar amounts in Canadian dollars. We value assets, liabilities and transactions that are measured in foreign currencies using various exchange rates as required by IFRS. The tables below show the variations of the closing and average exchange rates for our three main operating currencies. We used the closing foreign exchange rates below to value our assets, liabilities and backlog in Canadian dollars at the end of each of the following periods:
For fiscal 2014, the effect of translating the results of our foreign operations into Canadian dollars resulted in an increase in revenue of $72.9 million and an increase in net income of $6.1 million, when compared to fiscal 2013. We calculate d this by translating the current year’s foreign currency revenue and net income using the average monthly exchange rates from the previous year and comparing these adjusted amounts to our current year reported results. Three areas of our business are affected by changes in foreign exchange rates:
− Our network of foreign training and services operat ions
Most of our foreign training and services revenue and costs are denominated in local currenc y . Changes in the value of local currencies relative to the Canadian dollar therefore have an impact on these operations’ net profitability and net investment. Gains or losses in the net investment in a foreign operation that result from changes in foreign exchange rates are deferred in the foreign currency translation account (accumulated other comprehensive income), which is part of the equity section of the consolidated statement of financial position. Any effect of the fluctuation between currencies on the net profitability has an immediate translation impact on the consolidated income statement and an impact on year-to-year and quarter-to-quarter comparisons.
12 | CAE Annual Report 2014
2014 2013 Increase U.S. dollar (US$ or USD) 1.11 1.02 9% Euro (€ or EUR) 1.52 1.30 17% British pound (£ or GBP) 1.84 1.54 19%
We used the average foreign exchange rates below to value our revenues and expenses: 2014 2013 Increase U.S. dollar (US$ or USD) 1.05 1.00 5% Euro (€ or EUR) 1.41 1.29 9% British pound (£ or GBP) 1.68 1.58 6%

Management’s Discussion and Analysis − Our simulation products operations outside of Canad a (Australia, Germany, India, Singapore, U.K. and U .S.)
Most of the revenue and costs in these operations from foreign operations are generated in their local currency except for some data and equipment bought in different currencies from time to time, as well as any work performed by our Canadian manufacturing operations. Changes in the value of the local currency relative to the Canadian dollar have a translation impact on the operation’s net profitability and net investment when expressed in Canadian dollars, as described above.
− Our simulation products operations in Canada Although the net assets of our Canadian operations are not exposed to changes in the value of foreign currencies (except for receivables and payables in foreign currencies), a significant portion of our annual revenue generated in Canada is in foreign currencies (mostly U.S. dollar and Euro), while a significant portion of our expenses are in Canadian dollars. We generally hedge the milestone payments of sales contracts denominated in foreign currencies to mitigate some of the foreign exchange exposure. Since less than 100% of our revenue is hedged, it is not possible to completely offset the effects of changing foreign currency values, which leaves some residual exposure that can affect the consolidated income statement. We continue to hold a portfolio of currency hedging positions intended to mitigate the risk to a portion of future revenues presented by the volatility of the Canadian dollar versus foreign currencies. The hedges are intended to cover a portion of the revenue in order to allow the unhedged portion to match the foreign cost component of the contract. With respect to the remaining expected future revenues, our manufacturing operations in Canada remain exposed to changes in the value of the Canadian dollar. In order to reduce the variability of specific U.S. dollar and Euro-denominated manufacturing costs, we also hedge some of the foreign currency costs incurred in our manufacturing process.
Sensitivity analysis We conducted a sensitivity analysis to determine the current impact of variations in the value of foreign currencies. For the purposes of this sensitivity analysis, we evaluated the sources of foreign currency revenues and expenses and determined that our consolidated exposure to foreign currency mainly occurs in two areas: − Foreign currency revenues and expenses in Canada for the manufacturing business – we hedge a portion of these exposures; − Translation of foreign currency of operations in foreign countries. Our exposure is mainly in our operating profit. First we calculated the revenue and expenses per currency from our Canadian operations to determine the operating profit in each currency. Then we deducted the amount of hedged revenues to determine a net exposure by currency. Next we added the net exposure from foreign operations to determine the consolidated foreign exchange exposure in different currencies. Finally, we conducted a sensitivity analysis to determine the impact of a weakening of one cent in the Canadian dollar against each of the other three currencies. The table below shows the typical impact of this change, after taxes, on our yearly revenue and operating profit, as well as our net exposure:
CAE Annual Report 2014 | 13
Operating Net Exposure (amounts in millions) Revenue Profit Hedging Exposure U.S. dollar (US$ or USD) $ 12.6 $ 4.0 $ (3.4) $ 0.6
Euro (€ or EUR) 3.2 0.6 (0.3) 0.3
British pound (£ or GBP) 0.9 0.1 (0.1) 0.0
A possible strengthening of one cent in the Canadian dollar would have the opposite impact.

Management’s Discussion and Analysis 3.6 Non-GAAP and other financial measures This MD&A includes non-GAAP and other financial measures. Non-GAAP measures are useful supplemental information but may not have a standardized meaning according to GAAP. You should not confuse this information with, or use it as an alternative for, performance measures calculated according to GAAP. You should also not use them to compare with similar measures from other companies.
Backlog Backlog is a non-GAAP measure that represents the expected value of orders we have received but have not yet executed . − For the SP/C, SP/M and TS/M segments, we consider an item part of our backlog when we have a legally binding commercial agreement with a client that includes enough detail about each party’s
obligations to form the basis for a contract or an order; − Military contracts are usually executed over a long-term period and some of them must be renewed each year. For the SP/M and TS/M segments, we only include a contract item in backlog when the
customer has authorized the contract item and has received funding for it; − For the TS/C segment, we include revenues from customers with both long-term and short-term contracts when these customers commit to pay us training fees, or when we reasonably expect the
revenue to be generated. The book-to-sales ratio is the total orders divided by total revenue in a given period.
Capital employed Capital employed is a non-GAAP measure we use to evaluate and monitor how much we are investing in our business. We measure it from two perspectives: Capital used: − For the company as a whole, we take total assets (not including cash and cash equivalents), and subtract total liabilities (not including long-term debt and the current portion of long-term debt); − For each segment, we take the total assets (not including cash and cash equivalents, tax accounts and other non-operating assets), and subtract total liabilities (not including tax accounts, long-term
debt and the current portion of long-term debt, royalty obligations, employee benefits obligations and other non-operating liabilities). Source of capital: − In order to understand our source of capital, we add net debt to total equity.
Capital expenditures (maintenance and growth) from property, plant and equipment Maintenance capital expenditure is a non-GAAP measure we use to calculate the investment needed to sustain the current level of economic activity. Growth capital expenditure is a non-GAAP measure we use to calculate the investment needed to increase the current level of economic activity.
Free cash flow Free cash flow is a non-GAAP measure that shows us how much cash we have available to invest in growth opportunities , repay debt and meet ongoing financial obligations. We use it as an indicator of our financial strength and liquidity. We calculate it by taking the net cash generated by our continuing operating activities, subtracting maintenance capital expenditures, investment in other assets not related to growth and dividends paid and adding proceeds from the disposal of property, plant and equipment , dividends received from equity accounted investees and proceeds, net of payments, from equity accounted investees . Gross profit Gross profit is a non-GAAP measure equivalent to the operating profit excluding research and development expenses, selling, general and administrative expenses, other (gains) losses – net , after tax share in profit of equity accounted investees and restructuring, integration and acquisition costs.
Joint venture backlog Joint venture backlog is a non-GAAP measure that represents the expected value of our share of orders that our joint ventures have received but have not yet executed .
Net debt Net debt is a non-GAAP measure we use to monitor how much debt we have after taking into account liquid assets such as cash and cash equivalents. We use it as an indicator of our overall financial position, and calculate it by taking our total long-term debt, including the current portion of long-term debt, and subtracting cash and cash equivalents.
Net income before restructuring, integration and ac quisition costs Net income before restructuring, integration and acquisition costs is a non-GAAP measure we use as a n alternate view of our operating results. We calculate it by taking our net income attributable to equity holders of the Company and adding back restructuring, integration and acquisition costs, net of tax. We track it because we believe it provides a better indication of our operating performance and makes it easier to compare across reporting periods. 14 | CAE Annual Report 2014

Management’s Discussion and Analysis
Non-cash working capital Non-cash working capital is a non-GAAP measure we use to monitor how much money we have committed in the day-to-day operation of our business. We calculate it by taking current assets (not including cash and cash equivalents or the current portion of assets held-for-sale) and subtracting current liabilities (not including the current portion of long-term debt or the current portion of liabilities related to assets held-for-sale).
Operating profit Operating profit is a non-GAAP measure that shows us how we have performed before the effects of certain financing decisions and tax structures. We track operating profit because we believe it makes it easier to compare our performance with previous periods, and with companies and industries that do not have the same capital structure or tax laws.
Research and development expenses Research and development expenses are a financial measure we use to measure the amount of expenditures directly attributable to research and development activities that we have expensed during the period, net of investment tax credits and government contributions.
Return on capital employed Return on capital employed (ROCE) is a non-GAAP measure we use to evaluate the profitability of our invested capital. We calculate this ratio over a rolling four-quarter period by taking earnings from continuing operations attributable to equity holders of the Company excluding interest expense, after tax, divided by the average capital employed.
Segment operating income (loss) Segment operating income or loss (SOI) is a non-GAAP measure and our key indicator of each segment’s financial performance. This measure gives us a good indication of the profitability of each segment because it does not include the impact of any items not specifically related to the segment’s performance. We calculate it by using segment operating profit, including the after tax share in profit of equity accounted investees and exclud ing net finance expense, income taxes, restructuring, integration and acquisition costs and other items not specifically related to the segment’s performance.
Simulator equivalent unit Simulator equivalent unit (SEU) is an operating measure we use to show the total average number of FFSs available to generate earnings during the period. For example, in the case of a 50/50 flight training joint venture, we will report only 50% of the FFSs deployed under this joint venture as a SEU. If a FFS is being powered down and relocated, it will not be included as a SEU until the FFS is re-installed and available to generate earnings .
Unfunded backlog Unfunded backlog is a non-GAAP measure that represents firm military orders we have received but have not yet executed for which funding authorization has not yet been obtained. We include unexercised negotiated options with a high probability that they will be exercised, but exclude indefinite-delivery/indefinite-quantity (IDIQ) contracts.
CAE Annual Report 2014 | 15

Management’s Discussion and Analysis
4. CONSOLIDATED RESULTS [3]
4.1 Results of our operations – fourth quarter of fisca l 2014
Revenue was 14% higher than last quarter and 3% hig her compared to the fourth quarter of fiscal 2013 Revenue was $69.8 million higher than last quarter mainly because: − TS/C’s revenue increased by $26.2 million, or 15%, mainly due to higher revenue generated in North America and Europe as a result of higher simulator utilization rates and a favourable foreign
exchange impact on the conversion of foreign operations into Canadian dollars; − TS/M’s revenue increased by $15.5 million, or 21%, mainly due to higher revenue from North American programs, a favourable foreign exchange impact on the translation of foreign operations and
higher activity from our IES services business; − SP/C’s revenue increased by $15.2 million or 14%, mainly due to higher production levels resulting from an increase in order intake ; − SP/M’s revenue increased by $13.0 million, or 10%, mainly due to higher revenue from North American and Australian programs and a favourable foreign exchange impact on the translation of
foreign operations. The increase was partially offset by lower revenue from Asian programs; − NCM’s revenue remained stable, decreasing by $0.1 million. Lower revenue from CAE Mining was offset by higher revenue from CAE Healthcare. In CAE Mining, revenue was lower due to a
decrease in software licence and consulting services revenue. In CAE Healthcare, higher revenue from surgical simulators and from centre management systems, including the impact from a stronger U.S. dollar against the Canadian dollar, was partially offset by lower patient simulator revenue.
3 Non-GAAP and other financial measures (see Section 3.6).
16 | CAE Annual Report 2014
(amounts in millions, except per share amounts) Q4-2014 Q3-2014 Q2-2014 Q1-2014 Q4-2013 Revenue $ 583.4 513.6 487.5 530.4 565.6 Cost of sales $ 416.9 364.8 353.4 382.9 406.6
Gross profit 3 $ 166.5 148.8 134.1 147.5 159.0
As a % of revenue % 28.5 29.0 27.5 27.8 28.1
Research and development expenses 3 $ 19.9 16.1 14.9 17.5 18.0
Selling, general and administrative expenses $ 76.6 68.6 66.6 75.3 65.5
Other gains – net $ (8.1) (2.0) (5.1) (5.2) (2.9)
After tax share in profit of equity accounted investees $ (8.1) (11.5) (7.5) (2.9) (2.3) Restructuring, integration and acquisition costs $ - - - - 13.8
Operating profit 3 $ 86.2 77.6 65.2 62.8 66.9
As a % of revenue % 14.8 15.1 13.4 11.8 11.8
Finance income $ (2.4) (2.3) (2.3) (2.8) (2.0) Finance expense $ 18.7 21.0 20.9 19.9 19.3 Finance expense – net $ 16.3 18.7 18.6 17.1 17.3
Earnings before income taxes $ 69.9 58.9 46.6 45.7 49.6
Income tax expense $ 10.0 11.3 8.4 0.3 3.9
As a % of earnings before income taxes (income tax rate) % 14 19 18 1 8
Net income $ 59.9 47.6 38.2 45.4 45.7
Attributable to: Equity holders of the Company $ 60.0 46.1 38.3 45.6 43.1 Non-controlling interests $ (0.1) 1.5 (0.1) (0.2) 2.6
$ 59.9 47.6 38.2 45.4 45.7
Earnings per share (EPS) attributable to equity holders of the Company Basic and diluted $ 0.23 0.18 0.15 0.18 0.17

Management’s Discussion and Analysis
Revenue was $17.8 million higher than the same period last year largely because: − TS/M’s revenue increased by $25.8 million, or 40%, mainly due to higher revenue from North American programs, a favourable foreign exchange impact on the translation of foreign operations,
higher activity from our IES services business and higher revenue from our Australian programs; − TS/C’s revenue increased by $22.3 million, or 13%, mainly due to a favourable foreign exchange impact on the conversion of foreign operations into Canadian dollars and higher revenue generated
in Europe and North America as a result of higher simulator utilization rates. The increase was partially offset by lower revenue from our crew sourcing business; − NCM’s revenue increased by $0.6 million or 2%, mainly due to higher revenue from CAE Healthcare, partially offset by lower revenue from CAE Mining. In CAE Healthcare, revenue was higher due
to an increase in surgical and patient simulator revenue, including the impact of a stronger U.S. dollar against the Canadian dollar. In CAE Mining, revenue was lower due to a decrease in software licence and consulting services revenue;
− SP/C’s revenue decreased by $18.3 million, or 13%, mainly due to lower revenue attributed to partially manufactured simulators; − SP/M’s revenue decreased by $12.6 million, or 8%, mainly due to lower revenue from Asian and Australian programs. The decrease was partially offset by a favourable foreign exchange impact on
the translation of foreign operations.
You will find more details in Results by segment .
Operating profit was $8.6 million higher than last quarter and $19.3 million higher compared to the fo urth quarter of fiscal 2013 Operating profit this quarter was $86.2 million or 14.8% of revenue, compared to $77.6 million or 15.1% of revenue last quarter and $66.9 million or 11.8% of revenue in the fourth quarter of fiscal 2013. The increase over the fourth quarter of fiscal 2013 was mainly due to restructuring, integration and acquisition costs of $13.8 million recorded during that quarter. Segment operating income for the fourth quarter of fiscal 2013 was $80.7 million, or 14.3% of revenue. Segment operating income 4 increased by $8.6 million, or 11% compared to last quarter. Increases in segment operating income of $14.4 million for TS/C and $1.0 million for TS/M, were partially offset by decreases in segment operating income of $4.0 million,
$1.6 million and $1.2 million in SP/M, SP/C and NCM respectively. [4]
Segment operating income increased by $5.5 million, or 7% compared to the fourth quarter of fiscal 2013. The increase in segment operating income of $12.0 million from TS/C was partially offset by decreases in segment operating income of $4.7 million, $1.6 million, $0.1 million and $0.1 million from SP/C, NCM, SP/M and TS/M respectively. You will find more details in Results by segment . Net finance expense was $2.4 million lower than las t quarter and $1.0 million lower compared to the fo urth quarter of fiscal 2013 The decrease from last quarter was mainly due to lower finance expense on royalty obligations. The decrease from the fourth quarter of fiscal 2013 was mainly due to lower finance expense on royalty obligations, partially offset by an increase in R&D obligations. Effective income tax rate was 14% this quarter Income taxes this quarter were $10.0 million, representing an effective tax rate of 14%, compared to 19% last quarter and 8% for the fourth quarter of fiscal 2013. The decrease in the effective tax rate from the last quarter was mainly due to a change in the substantively enacted tax rates of Germany, United Kingdom and Norway, the settlement of tax audits in the quarter, as well as the change in the mix of income from various jurisdictions. Excluding the effect of the change in the tax rates and the settlement of tax audits, the income tax rate for the quarter would have been 21%. The increase in the effective tax rate from the fourth quarter of fiscal year 2013 was mainly due to the settlement of tax audits in the fourth quarter of fiscal year 2013, in addition to the change in the mix of income from various jurisdictions.
4 Non-GAAP and other financial measures (see Section 3.6).
CAE Annual Report 2014 | 17

Management’s Discussion and Analysis 4.2 Results of our operations – fiscal 2014
Revenue was 4% or $79.7 million higher than last ye ar Revenue was higher than last year mainly because: − TS/C’s revenue increased by $55.5 million, or 8%, due to the integration into our results of Oxford Aviation Academy Luxembourg S.à r.l. ( OAA) acquired in May 2012, a favourable foreign
exchange impact on the conversion of foreign operations into Canadian dollars and higher revenue generated in North America and Asia as a result of higher simulator utilization rates. The increase was partially offset by lower revenue from our crew sourcing business and our training business in South America and Europe;
− TS/M’s revenue increased by $48.7 million, or 20%, mainly due to new contracts signed in the current year in North America and Australia combined with programs where the construction phase was completed and are now in the in-service support phase for the same regions. The increase was also due to a favourable foreign exchange impact on the translation of foreign operations, increased activity in our IES services business and higher revenue from European programs. The increase was partially offset by the creation of a joint venture in late fiscal 2013 now accounted for as an equity investee, whereas it was previously accounted for as a joint operation and proportionally consolidated;
− SP/C’s revenue remained stable, increasing by $4.6 million. The increase related to higher production levels resulting from an increase in order intake and backlog was offset by lower revenue attributed to partially manufactured simulators;
− NCM’s revenue increased by $4.1 million, or 4%, mainly due to higher revenue from CAE Healthcare, partially offset by lower revenue from CAE Mining. In CAE Healthcare, higher ultrasound task trainer and surgical simulator revenue and higher centre management system revenue, including the impact from a stronger U.S. dollar against the Canadian dollar and an expanded installation base, was partially offset by lower patient simulator revenue. In CAE Mining, revenue was lower due to the cyclical downturn in the mining industry, with lower software licence and consulting services revenue partially offset by an increase in software maintenance revenue;
− SP/M’s revenue decreased by $33.2 million, or 6%, mainly due to lower revenue from certain Australian and North American programs for which the construction phase was completed and we are now in the in-service support phase. The decrease was also due to lower activity in our IES products business and lower revenue from European and Asian programs. The decrease was partially offset by a favourable foreign exchange impact on the translation of foreign operations.
You will find more details in Results by segment. 18 | CAE Annual Report 2014
(amounts in millions, except per share amounts) FY2014 FY2013 Revenue $ 2,114.9 2,035.2
Cost of sales $ 1,518.0 1,450.4
Gross profit $ 596.9 584.8
As a % of revenue % 28.2 28.7
Research and development expenses $ 68.4 60.1
Selling, general and administrative expenses $ 287.1 264.5
Other gains – net $ (20.4) (22.4)
After tax share in profit of equity accounted investees $ (30.0) (20.1)
Restructuring, integration and acquisition costs $ - 68.7
Operating profit $ 291.8 234.0
As a % of revenue % 13.8 11.5
Finance income $ (9.8) (9.4)
Finance expense $ 80.5 74.5
Finance expense – net $ 70.7 65.1
Earnings before income taxes $ 221.1 168.9
Income tax expense $ 30.0 28.2
As a % of earnings before income taxes (tax rate) % 14 17
Net income $ 191.1 140.7
Attributable to: Equity holders of the Company $ 190.0 137.7
Non-controlling interests $ 1.1 3.0
$ 191.1 140.7
EPS attributable to equity holders of the Company Basic and diluted $ 0.73 0.53

Management’s Discussion and Analysis Gross profit was $12.1 million higher than last yea r The gross profit was $596.9 million this year, or 28.2% of revenue compared to $584.8 million or 28.7% of revenue last year. As a percentage of revenue, gross profit was stable when compared to last year. Operating profit was $57.8 million higher than last year Operating profit this year was $291.8 million, or 13.8% of revenue, compared to $234.0 million, or 11.5% of revenue last year. The increase from last year was mainly due to restructuring, integration and acquisition costs of $68.7 million recorded last year. Segment operating income was $302.7 million, or 14.9% of revenue last year. Segment operating income decreased $10.9 million, or 4% compared to last year. Decreases in segment operating income of $4.7 million, $4.4 million, $2.6 million and $2.2 million from SP/C, TS/C, SP/M and NCM respectively, were partially offset by an increase in segment operating income of $3.0 million from TS/M. You will find more details in Results by segment. Net finance expense was $5.6 million higher than la st year
Net finance expense was $70.7 million this year, $5.6 million or 9% higher than last year. The increase was mainly due to higher interest expense resulting from the private placement of senior notes issued in December 2012 and an increase in R&D obligations, partially offset by lower interest expense due to a reduced use of credit facilities and lower finance expense on royalty obligations. Effective income tax rate is 14% This fiscal year, income taxes were $30.0 million, representing an effective tax rate of 14%, compared to 17% for the same period last year. The decrease in the effective tax rate compared to fiscal year 2013 is mainly due to the change in the mix of income from various jurisdictions. Significant elements impacting the 2014 effective tax rate include a favourable decision by the Federal Court of Appeal of Canada, rendered April 17, 2013, with respect to the tax treatment of the depreciation and sale of simulators in Canada, a change in the substantively enacted tax rates of Germany, United Kingdom and Norway as well as the settlement of tax audits during the year. Other than the mix of income, significant elements impacting the fiscal year 2013 tax rate included the settlement of tax audits.
CAE Annual Report 2014 | 19
FY2013 to (amounts in millions) FY2014 Finance expense, prior period $ 74.5 Increase in finance expense on long-term debt (other than finance lease obligations) 7.5 Decrease in finance expense on finance lease obligations (0.2) Decrease in finance expense on royalty obligations (2.1) Increase in other finance expense 1.7
Decrease in borrowing costs capitalized (0.9) Increase in finance expense from the prior period $ 6.0
Finance income, prior period $ (9.4) Decrease in interest income on loans and receivables 0.4 Increase in other interest income (0.8) Increase in finance income from the prior period $ (0.4) Net finance expense, current period $ 70.7

Management’s Discussion and Analysis 4.3 Consolidated orders and backlog Our consolidated backlog was $4,205.6 million at the end of fiscal 2014, which is 13% higher than last year. New orders of $2,380.3 million increased the backlog this year, while $2,114.9 million in revenue was generated from the backlog.
In fiscal 2014, adjustments included $222.4 million related to a positive foreign exchange impact. In fiscal 2013, adjustments included $234.3 million worth of backlog added as a result of the acquisition of OAA and a reduction of an existing order of Level B simulators originating in 2006. The book-to-sales ratio for the quarter was 0.97x. The ratio for the last 12 months was1.13x. Following the implementation of the new IFRS 11, Joint Arrangements , discussed in Changes in accounting policies : − The expected value of orders contracted by our joint ventures in which we have an ownership interest are excluded from CAE’s backlog; − The full value of orders between us and our joint ventures is included in CAE’s backlog. Our consolidated backlog as at March 31, 2013 was restated accordingly. Our combined military unfunded backlog 5 was $406.7 million at March 31, 2014. In addition, our joint venture backlog 5 , which represents the expected value of our share of orders that our joint ventures have received but have not yet executed, was
$392.5 million [5]
at March 31, 2014. These are not included in the consolidated backlog presented in the table above.
You will find more details in Results by segment .
5 Non-GAAP and other financial measures (see Section 5).
20 | CAE Annual Report 2014
Backlog up by 13% over last year (amounts in millions) FY2014 FY2013 Backlog, beginning of period $ 3,717.8 $ 3,379.0
+ orders 2,380.3 2,139.7
- revenue (2,114.9) (2,035.2)
+ / - adjustments 222.4 234.3 Backlog, end of period $ 4,205.6 $ 3,717.8

Management’s Discussion and Analysis
5. RESULTS BY SEGMENT We manage our business and report our results in five segments: Civil segments: − Training & Services/Civil (TS/C); − Simulation Products/Civil (SP/C). Military segments: − Simulation Products/Military (SP/M); − Training & Services/Military (TS/M). New Core Markets (NCM) segment. Transactions between operating segments are mainly simulator transfers from the SP/C segment to the TS/C segment and are recorded at cost. The method used for the allocation of assets jointly used by the operating segments and costs and liabilities jointly incurred (mostly corporate costs) between operating segments is based on the level of utilization when determinable and measurable, otherwise the allocation is based on a proportion of each segment’s cost of sales. Unless otherwise indicated, elements within our segment revenue and segment operating income analysis are presented in order of magnitude.
CAE Annual Report 2014 | 21
KEY PERFORMANCE INDICATORS Segment operating income
(amounts in millions, except operating margins) FY2014 FY2013 Q4-2014 Q3-2014 Q2-2014 Q1-2014 Q4-2013 Civil segments Training & Services/Civil $ 96.3 100.7 36.9 22.5 19.4 17.5 24.9
% 13.5 15.3 18.6 13.1 11.7 9.8 14.1
Simulation Products/Civil $ 83.5 88.2 21.1 22.7 19.6 20.1 25.8
% 18.1 19.3 16.9 20.7 19.0 16.3 18.0
Military segments Simulation Products/Military $ 77.4 80.0 19.3 23.3 18.3 16.5 19.4
% 14.6 14.2 13.7 18.3 14.8 12.0 12.7
Training & Services/Military $ 30.4 27.4 8.7 7.7 6.9 7.1 8.8
% 10.4 11.2 9.7 10.4 10.2 11.6 13.8
New Core Markets $ 4.2 6.4 0.2 1.4 1.0 1.6 1.8
% 3.6 5.7 0.7 4.7 3.7 5.4 6.2
Total segment operating income (SOI) $ 291.8 302.7 86.2 77.6 65.2 62.8 80.7 Restructuring, integration and acquisition costs $ - (68.7) - - - - (13.8)
Operating profit $ 291.8 234.0 86.2 77.6 65.2 62.8 66.9

Management’s Discussion and Analysis Capital employed 6
5.1 Civil segments
FISCAL 2014 EXPANSIONS AND NEW INITIATIVES [6]
Expansions − Our joint venture Emirates-CAE Flight Training (ECFT) inaugurated its second pilot training facility in Dubai, UAE; − We announced the introduction of 35 new Piper airplanes to our CAE Oxford Aviation Academy fleet; − ECFT announced that its dual configuration FFS for Bombardier Challenger 604 and Challenger 605 business jets has received certification from various countries and also announced that it will
deploy a Bombardier Global 5000/6000 business jets FFS equipped with the Bombardier Vision flight deck, which is expected to enter into service at the end of 2014; − We announced, with Bombardier, the expansion of the Authorised Training Partner (ATP) agreement in Europe with the addition of a Bombardier Challenger 605 aircraft FFS and the deployment of
a new Bombardier Global 5000/6000 business jets FFS equipped with the Bombardier Vision flight deck in our Amsterdam training centre; − We announced, with Aviation Performance Solutions (APS), an extension of our partnership to provide Upset Prevention and Recovery Training (UPRT) for business aircraft pilots in Europe. The
program uses proven e-Learning web-based academics, in-aircraft practical skill development and FFS exercises and scenarios;
− We launched a new MPL training program with Tigerair. In support of this program, we announced that we will open an ab initio ground school training centre in Singapore; − We commenced training at the CAE Simulation Training P.L. centre in Delhi, India. The training centre is a joint venture between CAE and Interglobe, parent company of IndiGo; − We announced an agreement with Airbus Helicopters (formerly Eurocopter Group) to create an approved EC225 helicopter training centre in Norway featuring a Level D flight and mission simulator; − We announced the addition of a fourth Dassault Falcon 7X FFS to our global training network. The simulator is expected to be ready for training in 2015; − We deployed a Boeing 737 NG FFS to the Air France training centre located in Orly, France; − We announced, with Dassault, an agreement naming CAE as the exclusive Dassault-Approved Training Provider for the
newly-launched Dassault Falcon 5X long-range business jet.
New programs and products − We introduced CAE Tropos™-6000XR, the latest generation of our market-leading visual image generator for civil aviation training. The software provides a more immersive environment and an
enhanced pilot training experience; − We announced maintenance training on the new Dassault Falcon 2000 LXS and 2000S aircraft platforms, including EASy II and launched CAE RealCase Troubleshooting for the Dassault Falcon
7X, Falcon 900EX EASy, and Falcon 2000EX EASy models; − We announced the introduction of the CAE 7000XR Series FFS, leveraging the latest advancements in technology and training capabilities and setting a new standard in level D FFSs. This latest
evolution of CAE’s industry benchmark FFS is designed to optimize life-cycle costs for our customers and to address new and future training requirements.
6 Non-GAAP and other financial measures (see section 3.6).
22 | CAE Annual Report 2014
March 31 December 31 September 30 June 30 March 31 (amounts in millions) 2014 2013 2013 2013 2013
Civil segments Training & Services/Civil $ 1,703.1 1,612.7 1,515.1 1,520.9 1,464.7 Simulation Products/Civil $ 73.2 52.5 52.5 104.4 56.4
Military segments Simulation Products/Military $ 354.9 382.1 340.9 344.1 326.1 Training & Services/Military $ 212.4 194.6 177.0 174.1 152.0
New Core Markets $ 222.4 217.8 205.7 207.6 199.2
$ 2,566.0 2,459.7 2,291.2 2,351.1 2,198.4

Management’s Discussion and Analysis
TRAINING & SERVICES/CIVIL [7]
TS/C obtained contracts this quarter expected to generate future revenues of $ 247.5 million, including: − A long-term contract with Turkish Airlines for pilot training services; − A long-term contract renewal with Aerovias del Continente Americano S.A. for maintenance of their flight training devices and pilot training services; − A long-term contract renewal with Robert Bosch GmbH for pilot training services; − A long-term contract with WorldWide Jet Charter LLC for pilot training services.
7 Non-GAAP and other financial measures (see Section 3.6).
CAE Annual Report 2014 | 23
COMBINED FINANCIAL RESULTS (amounts in millions, except operating margins) FY2014 FY2013 Q4-2014 Q3-2014 Q2-2014 Q1-2014 Q4-2013 Revenue $ 1,176.7 1,116.6 323.5 282.1 269.3 301.8 319.5
Segment operating income $ 179.8 188.9 58.0 45.2 39.0 37.6 50.7
Operating margins % 15.3 16.9 17.9 16.0 14.5 12.5 15.9
Backlog $ 2,161.7 1,722.6 2,161.7 2,081.9 1,997.0 1,754.4 1,722.6
For the fourth quarter of fiscal 2014, combined civil revenue was $323.5 million, up 15% over last quarter. Both civil segments contributed to the increase mainly resulting from an increase in training revenue due to a higher utilization rate on the FFSs in our network, most notably in North America and Europe, as well as an increase in product revenue due to higher FFS production levels driven by an increase in order intake. Combined civil segment operating margin was 17.9%, up from 16.0% last quarter. The higher margin is the reflection of the increased training revenue following a higher utilization rate on FFS in our training network. For fiscal 2014, combined civil revenue was $1,176.7 million, up 5% over last year mainly as a result of the integration into our results of OAA. Combined civil segment operating margin was 15.3%, down from 16.9% last year. The lower margin was mainly the result of lower utilization on FFS in our training network as well as higher costs associated with the operationalization of new training centres in Asia, relocation of simulators and severance expenses. The combined civil book-to-sales ratio was 1.08x for the quarter and 1.28x on a trailing 12-month basis. The joint venture backlog was $263.1 million at March 31, 2014.
Financial results (amounts in millions, except operating margins, SEU and FFSs deployed) FY2014 FY2013 Q4-2014 Q3-2014 Q2-2014 Q1-2014 Q4-2013 Revenue $ 715.3 659.8 198.4 172.2 166.4 178.3 176.1
Segment operating income $ 96.3 100.7 36.9 22.5 19.4 17.5 24.9
Operating margins % 13.5 15.3 18.6 13.1 11.7 9.8 14.1
Depreciation and amortization $ 98.3 92.5 25.8 23.3 23.9 25.3 23.6
Property, plant and equipment expenditures $ 120.5 71.4 52.9 30.3 16.8 20.5 5.8
Intangible assets and other assets expenditures $ 17.0 19.8 4.0 3.0 2.6 7.4 2.7
Capital employed $ 1,703.1 1,464.7 1,703.1 1,612.7 1,515.1 1,520.9 1,464.7
Backlog $ 1,597.7 1,311.6 1,597.7 1,502.1 1,445.4 1,300.0 1,311.6
SEU 7 191 181 194 190 188 190 187
FFSs deployed 239 227 239 238 233 230 227

Management’s Discussion and Analysis Revenue up 15% over last quarter and up 13% over th e fourth quarter of fiscal 2013 The increase over last quarter was mainly due to higher revenue generated in North America and Europe as a result of higher simulator utilization rates and a favourable foreign exchange impact on the conversion of foreign operations into Canadian dollars. The increase over the fourth quarter of fiscal 2013 was mainly due to a favourable foreign exchange impact on the conversion of foreign operations into Canadian dollars and higher revenue generated in Europe and North America as a result of higher simulator utilization rates. The increase was partially offset by lower revenue from our crew sourcing business. Revenue was $715.3 million this year, 8% or $55.5 m illion higher than last year The increase was mainly due to the integration into our results of OAA acquired in May 2012, a favourable foreign exchange impact on the conversion of foreign operations into Canadian dollars and higher revenue generated in North America and Asia as a result of higher simulator utilization rates. The increase was partially offset by lower revenue from our crew sourcing business and our training business in South America and Europe.
Segment operating income up 64% over last quarter a nd up 48% over the fourth quarter of fiscal 2013 Segment operating income was $36.9 million (18.6% of revenue) this quarter, compared to $22.5 million (13.1% of revenue) last quarter and $24.9 million (14.1% of revenue) in the fourth quarter of fiscal 2013. Segment operating income increased by $14.4 million, or 64%, over last quarter. The increase was mainly due to higher revenue in North America and Europe, gains on disposal of two FFSs and a favourable foreign exchange impact on the conversion of foreign operations into Canadian dollars . Segment operating income increased by $12.0 million, or 48%, over the fourth quarter of fiscal 2013. The increase was mainly due to higher profit from equity accounted investees (joint ventures) , higher revenue in Europe, a favourable foreign exchange impact on the conversion of foreign operations into Canadian dollars and gains on disposal of two FFSs.
Segment operating income was $96.3 million, 4% or $ 4.4 million lower than last year Segment operating income was $96.3 million (13.5% of revenue) this year, compared to $100.7 million (15.3% of revenue) last year. The decrease was mainly due to lower revenue in South America and higher costs associated with the operationalization of new training centres in Asia, relocation of FFSs and severance expenses. The decrease was partially offset by higher profit from equity accounted investees (joint ventures), gains on the reversal of an OAA acquisition-related provision and on disposal of FFSs and the integration into our results of OAA acquired in May 2012. The increase was also explained by a favourable foreign exchange impact on the conversion of foreign operations into Canadian dollars, which was partially offset by an unfavourable foreign exchange impact from the revaluation of our non-cash working capital accounts.
Property, plant and equipment expenditures at $52.9 million this quarter and $120.5 million for the ye ar Maintenance capital expenditures were $7.8 million for the quarter and $28.3 million for the year. Growth capital expenditures were $45.1 million for the quarter and $92.2 million for the year. Capital employed increased by $90.4 million over la st quarter and by $238.4 million over last year The increase in capital employed over the last quarter and over last year was mainly due to higher property, plant and equipment and intangible assets resulting mainly from movements in foreign exchange rates and an increase in the value of our investments in equity accounted investees due to movements in foreign exchange rates and increased profitability.
24 | CAE Annual Report 2014
Backlog was at $1,597.7 million at the end of the y ear (amounts in millions) FY2014 FY2013 Backlog, beginning of period $ 1,311.6 $ 937.4
+ orders 898.9 778.4
- revenue (715.3) (659.8)
+ / - adjustments 102.5 255.6
Backlog, end of period $ 1,597.7 $ 1,311.6
Fiscal 2014 adjustments are mainly due to foreign exchange movements. Adjustments in fiscal 2013 were mainly due to $254.0 million worth of backlog added as a result of the acquisition of OAA. This quarter's book-to-sales ratio was 1.25x. The ratio for the last 12 months was 1.26x. The joint venture backlog was $263.1 million at March 31, 2014.

Management’s Discussion and Analysis
SIMULATION PRODUCTS/CIVIL SP/C was awarded contracts for the following 8 FFSs this quarter: − One Boeing 737-800W FFS to Southwest Airlines; − One Airbus A320 FFS to Lufthansa Flight Training; − One Airbus A320 FFS to CAE Flight Training (India) Private Limited, a joint venture between CAE and InterGlobe; − Five FFSs, three Airbus A320s, one Boeing 737NG and one Boeing 777 to undisclosed customers;
This brings SP/C’s order intake for the year to 48 FFSs.
Revenue up 14% over last quarter and down 13% from the fourth quarter of fiscal 2013 The increase over last quarter was mainly due to higher production levels resulting from an increase in order intake. The decrease from the fourth quarter of fiscal 2013 was mainly due to lower revenue attributed to partially manufactured simulators. Revenue was $461.4 million for the year, stable com pared to last year The increase related to higher production levels resulting from an increase in order intake and backlog was offset by lower revenue attributed to partially manufactured simulators. Segment operating income down 7% from last quarter and down 18% from the fourth quarter of fiscal 2013 Segment operating income was $21.1 million (16.9% of revenue) this quarter, compared to $22.7 million (20.7% of revenue) last quarter and $25.8 million (18.0% of revenue) in the fourth quarter of fiscal 2013. The decrease from last quarter was mainly due lower project margins resulting from a less favourable program mix and higher selling, general and administrative expenses in support of increased sales activity, partially offset by higher revenue, as mentioned above. The decrease from the fourth quarter of fiscal 2013 was mainly due to lower revenue, as mentioned above, and an unfavourable foreign exchange impact. The decrease was partially offset by lower research and development expenses net of government funding. Segment operating income was $83.5 million for the year, 5% or $4.7 million lower than last year Segment operating income was $83.5 million ( 18.1 % of revenue) this year, compared to $ 88.2 million ( 19.3 % of revenue) last year. The decrease was mainly due to an unfavourable foreign exchange impact and higher selling, general and administrative expenses, partially offset by a favourable program mix. Capital employed increased by $20.7 million over la st quarter and by $16.8 million over last year Capital employed was higher than last quarter mainly due to higher contracts in progress assets, partially offset by a decrease in accounts receivable. Capital employed was higher than last year mainly due to an increase in inventories, intangible assets resulting from investments in development costs and accounts receivable, partially offset by increase in contracts in progress liabilities.
CAE Annual Report 2014 | 25
Financial results (amounts in millions, except operating margins) FY2014 FY2013 Q4-2014 Q3-2014 Q2-2014 Q1-2014 Q4-2013 Revenue $ 461.4 456.8 125.1 109.9 102.9 123.5 143.4
Segment operating income $ 83.5 88.2 21.1 22.7 19.6 20.1 25.8
Operating margins % 18.1 19.3 16.9 20.7 19.0 16.3 18.0
Depreciation and amortization $ 12.2 8.6 3.5 3.3 2.5 2.9 3.0
Property, plant and equipment expenditures $ 7.8 4.9 4.1 1.7 0.8 1.2 0.6
Intangible assets and other assets expenditures $ 23.4 20.4 8.0 5.4 4.5 5.5 5.5
Capital employed $ 73.2 56.4 73.2 52.5 52.5 104.4 56.4
Backlog $ 564.0 411.0 564.0 579.8 551.6 454.4 411.0

Management’s Discussion and Analysis
5.2 Military segments
FISCAL 2014 EXPANSIONS AND NEW INITIATIVES
Expansions − We commenced construction of the new CAE Brunei Multi-Purpose Training Centre (MPTC) in Rimba, Brunei Darussalam which is now at the completion phase. The centre is expected to be
operational by the end of spring 2014. We also announced jointly with the Government of Brunei that MPTC will establish an Emergency and Crisis Management Centre of Excellence to support disaster preparedness ;
− We are providing on-site training support services at the Army Aviation Training Centre in Queensland, Australia, following the acceptance into service of the world’s first Level D certified NH90 full-flight and mission simulator;
− We installed a CAE 5000 Series King Air 350 simulator at a new training facility in Sale, Australia and will now provide simulator services to the Royal Australian Air Force and Royal Australian Navy through 2018 under a contractor-owned, contractor-operated training program;
− We announced that our Rotorsim training centre in Sesto Calende, Italy, which is a joint venture with AgustaWestland, will expand with the addition of a CAE 3000 Series AW169 helicopter simulator;
− We announced that the world’s first CAE 3000 Series AW189 FFS was certified to Level D and is now ready for training at the Rotorsim training centre in Sesto Calende, Italy; − We announced that Rotorsim will add a second CAE 3000 Series AW189 helicopter simulator to a new training location in Aberdeen, Scotland to support Bristow helicopters and other North Sea
operators.
New programs and products − We signed a memorandum of understanding with Lockheed Martin as its preferred provider of Canadian F-35 training support, training systems integration, operations and maintenance should
Canada select the F-35; − We signed a memorandum of understanding with General Atomics Aeronautical Systems to pursue international opportunities for CAE to offer its simulation and training systems for the Predator
family of remotely piloted aircraft; − We delivered the latest generation CAE GESI command and staff training system, now operational at the German Army Combat Simulation Center located in Wildflecken, Germany; − We assisted Ambulance Victoria in Brisbane, Australia with the launch of the Virtual Paramedic, a simulation-based training solution, to help prepare for mass casualty incidents; − We signed a cooperation agreement to combine CAE’s GESI command and staff training system with Rolands & Associates Joint Theatre-Level Simulation into a new, federated constructive
simulation solution called GlobalSim; − We provided an Emergency Management Information System to the City of Ottawa that will improve multi-agency collaboration and enhance effective decision-making during emergency incidents; − We are designing and manufacturing a UH-60L/M Black Hawk full-mission simulator to be used by the Mexican Federal Police. 26 | CAE Annual Report 2014
Backlog up 37% compared to last year (amounts in millions) FY2014 FY2013 Backlog, beginning of period $ 411.0 $ 385.5
+ orders 608.4 494.7
- revenue (461.4) (456.8)
+ / - adjustments 6.0 (12.4)
Backlog, end of period $ 564.0 $ 411.0
Fiscal 2014 adjustments are mainly due to foreign exchange movements. Adjustments in fiscal 2013 were mainly due to a reduction of an existing order of Level B simulators originating in 2006. This quarter's book-to-sales ratio was 0.82x. The ratio for the last 12 months was 1.32x. There was no joint venture backlog at March 31, 2014.

Management’s Discussion and Analysis
The combined military unfunded backlog was $406.7 million and the joint venture backlog was $129.4 million at March 31, 2014. SIMULATION PRODUCTS/MILITARY SP/M was awarded $133.1 million in orders this quarter, including contracts from: − Beechcraft Corporation to develop a comprehensive T-6C ground-based training system for the Royal New Zealand Air Force; − The Polish Air Force to provide an SW-4 helicopter full-flight simulator to support training at the Polish Air Force School in Deblin, Poland; − Boeing to manufacture four additional P-8A operational flight trainers for the U.S. Navy.
Revenue up 10% over last quarter and down 8% from t he fourth quarter of fiscal 2013 The increase over last quarter was mainly due to higher revenue from North American and Australian programs and a favourable foreign exchange impact on the translation of foreign operations. The increase was partially offset by lower revenue from Asian programs. The decrease from the fourth quarter of fiscal 2013 was mainly due to lower revenue from Asian and Australian programs. The decrease was partially offset by a favourable foreign exchange impact on the translation of foreign operations. Revenue was $529.3 million this year, 6% or $33.2 m illion lower than last year The decrease in revenue from last year was mainly due to lower revenue from certain Australian and North American programs for which the construction phase was completed and we are now in the in-service support phase. The decrease was also due to lower activity in our IES products business and lower revenue from European and Asian programs. The decrease was partially offset by a favourable foreign exchange impact on the translation of foreign operations.
CAE Annual Report 2014 | 27
COMBINED FINANCIAL RESULTS (amounts in millions, except operating margins) FY2014 FY2013 Q4-2014 Q3-2014 Q2-2014 Q1-2014 Q4-2013 Revenue $ 822.0 806.5 230.3 201.8 191.1 198.8 217.1
Segment operating income $ 107.8 107.4 28.0 31.0 25.2 23.6 28.2
Operating margins % 13.1 13.3 12.2 15.4 13.2 11.9 13.0
Backlog $ 2,043.9 1,995.2 2,043.9 2,024.3 1,942.4 1,960.1 1,995.2
For the fourth quarter of fiscal 2014, combined military revenue was $230.3 million, up 14% over last quarter. The increase was mainly due to higher contribution from new contracts signed this quarter and a favourable foreign exchange impact on the translation of foreign operations. Combined military segment operating margin was 12.2%, down from 15.4% last quarter. The lower margin is due to a more favourable program mix in the previous quarter and higher research and development expenses net of government funding this quarter. For fiscal 2014, combined military revenue was $822.0 million, up 2% over last year mainly as a result of a favourable foreign exchange impact on the translation of foreign operations. Combined military segment operating margin was 13.1%, stable compared to last year. The decrease in margin due to a reversal of a contingent consideration provision which occurred last year, higher selling, general and administrative expenses and higher research and development expenses net of government funding was offset by the margin improvement resulting from our European and North American programs and the increased profitability in our equity accounted investees (joint ventures). The combined military book-to-sales ratio was 0.82x for the quarter and 0.92x on a trailing 12-month basis.
Financial results (amounts in millions, except operating margins) FY2014 FY2013 Q4-2014 Q3-2014 Q2-2014 Q1-2014 Q4-2013 Revenue $ 529.3 562.5 140.5 127.5 123.5 137.8 153.1
Segment operating income $ 77.4 80.0 19.3 23.3 18.3 16.5 19.4
Operating margins % 14.6 14.2 13.7 18.3 14.8 12.0 12.7
Depreciation and amortization $ 17.2 15.3 4.7 4.5 4.1 3.9 4.2
Property, plant and equipment expenditures $ 7.0 5.2 2.3 2.0 1.2 1.5 (0.6)
Intangible assets and other assets expenditures $ 15.3 26.1 5.6 3.5 2.4 3.8 6.8
Capital employed $ 354.9 326.1 354.9 382.1 340.9 344.1 326.1
Backlog $ 682.5 688.7 682.5 669.9 635.4 673.4 688.7

Management’s Discussion and Analysis Segment operating income down 17% compared to last quarter and stable compared to the fourth quarter o f fiscal 2013 Segment operating income was $19.3 million (13.7% of revenue) this quarter, compared to $23.3 million (18.3% of revenue) last quarter and $19.4 million (12.7% of revenue) in the fourth quarter of fiscal 2013. The decrease from last quarter was mainly due to lower volume on Asian programs, higher research and development expenses net of government funding and lower margins on European programs, partially offset by higher volume on North American programs. Segment operating income was stable when compared to the fourth quarter of fiscal 2013. The decrease resulting from lower volume on Asian programs and higher research and development expenses net of government funding was offset by higher margins on North American and European programs. Segment operating income was $77.4 million this yea r, 3% or $2.6 million lower than last year Segment operating income was $77.4 million (14.6% of revenue) this year, compared to $80.0 million (14.2% of revenue) last year. The decrease in segment operating income from last year was mainly due to the reversal of a contingent consideration provision which occurred in the second quarter of fiscal 2013, higher research and development expenses net of government funding and lower volume on Asian programs. The decrease was partially offset by higher margins on European and North American programs. Capital employed decreased by $27.2 million from la st quarter and increased by $28.8 million over last year The decrease from last quarter was mainly due to an increase in accounts payable and accrued liabilities, higher contracts in progress liabilities and lower contracts in progress assets, partially offset by an increase in accounts receivable and foreign exchange movements resulting from the depreciation of the Canadian dollar. The increase over last year was mainly due to a higher investment in other long-term assets and an increase in intangible assets resulting primarily from movements in foreign exchange rates.
28 | CAE Annual Report 2014
Backlog stable compared to last year (amounts in millions) FY2014 FY2013 Backlog, beginning of period $ 688.7 $ 787.2
+ orders 484.7 397.0
- revenue (529.3) (562.5)
+ / - adjustments 38.4 67.0
Backlog, end of period $ 682.5 $ 688.7
Fiscal 2014 adjustments are mainly due to foreign exchange movements. Adjustments in fiscal 2013 were mainly due to the reclassification of equipment procurement from a long-term services contract. This quarter's book-to-sales ratio was 0.95x. The ratio for the last 12 months was 0.92x. Unfunded backlog was $38.0 million and there was no joint venture backlog at March 31, 2014.

Management’s Discussion and Analysis TRAINING & SERVICES/MILITARY
TS/M was awarded $55.9 million in orders this quarter, including contracts from: − Germany's Federal Office of Bundeswehr Equipment, Information Technology and In-Service Support to provide a range of on-site training support services for flight simulation equipment, including
Tornado, C-160 Transall, P-3C Orion, Mk-41 Sea King and the German Forces' pilot selection system; − PWN Excellence Sdn Bhd, based in Subang, Malaysia, to provide comprehensive lifecycle support and maintenance services on an AW139 simulator over the next ten years.
Revenue up 21% over last quarter and up 40% over th e fourth quarter of fiscal 2013 The increase over last quarter was mainly due to higher revenue from North American programs, a favourable foreign exchange impact on the translation of foreign operations and higher activity from our IES services business. The increase over the fourth quarter of fiscal 2013 was mainly due to higher revenue from North American programs, a favourable foreign exchange impact on the translation of foreign operations, higher activity from our IES services business and higher revenue from our Australian programs. Revenue was $292.7 million this year, 20% or $48.7 million higher than last year The increase was mainly due to new contracts signed in the current year in North America and Australia combined with programs where the construction phase was completed and are now in the in-service support phase for the same regions. The increase was also due to a favourable foreign exchange impact on the translation of foreign operations, increased activity in our IES services business and higher revenue from European programs. The increase was partially offset by the creation of a joint venture in late fiscal 2013 now accounted for as an equity investee, whereas it was previously accounted for as a joint operation and proportionally consolidated. Segment operating income up 13% over last quarter a nd stable compared to the fourth quarter of fiscal 2013 Segment operating income was $8.7 million (9.7% of revenue) this quarter, compared to $7.7 million (10.4% of revenue) last quarter and $8.8 million (13.8% of revenue) in the fourth quarter of fiscal 2013. The increase over last quarter was mainly due to higher volume on North American programs and higher margins on European programs, partially offset by lower profit from equity accounted investees (joint ventures). Segment operating income was stable when compared to the fourth quarter of fiscal 201 3. The decrease resulting from higher selling, general and administrative expenses was offset by higher margins on European programs, higher volume on Australian programs and higher profit from equity accounted investees (joint ventures).
Segment operating income was $30.4 million this yea r, 11% or $3.0 million higher than last year Segment operating income was $30.4 million ( 10.4 % of revenue) this year, compared to $ 27.4 million ( 11.2 % of revenue) last year. The increase over last year was mainly due to higher profit from equity accounted investees (joint ventures) and higher volume on North American and European programs. The increase was partially offset by higher selling, general and administrative expenses including costs incurred for start-up activities in certain Asian programs.
Capital employed increased by $17.8 million over la st quarter and by $60.4 million over last year The increase over last quarter was mainly due to higher property, plant and equipment, higher other long-term assets resulting primarily from foreign exchange rates, an increase in non-cash working capital and a higher investment in equity accounted investees as a result of increased profitability. The increase over last year was mainly due to higher other long-term assets resulting primarily from movements in foreign exchange rates, an increase in non-cash working capital, a higher investment in equity accounted investees as a result of increased profitability and higher property, plant and equipment resulting from capital expenditures and movements in foreign exchange rates.
CAE Annual Report 2014 | 29
Financial results (amounts in millions, except operating margins) FY2014 FY2013 Q4-2014 Q3-2014 Q2-2014 Q1-2014 Q4-2013 Revenue $ 292.7 244.0 89.8 74.3 67.6 61.0 64.0
Segment operating income $ 30.4 27.4 8.7 7.7 6.9 7.1 8.8
Operating margins % 10.4 11.2 9.7 10.4 10.2 11.6 13.8
Depreciation and amortization $ 25.2 14.6 7.5 6.9 6.7 4.1 4.8
Property, plant and equipment expenditures $ 19.0 12.1 5.7 2.6 5.1 5.6 7.2
Intangible assets and other assets expenditures $ 1.0 2.4 0.4 0.2 0.1 0.3 0.3
Capital employed $ 212.4 152.0 212.4 194.6 177.0 174.1 152.0
Backlog $ 1,361.4 1,306.5 1,361.4 1,354.4 1,307.0 1,286.7 1,306.5

Management’s Discussion and Analysis
5.3 New Core Markets
FISCAL 2014 EXPANSIONS AND NEW INITIATIVES CAE Healthcare expansions and new initiatives included the following:
Expansions − We signed agreements with new distributors in Bangladesh, Chile, Costa Rica, Germany, India, Malaysia, Malta, Peru, Singapore, Netherlands and United Arab Emirates; − We opened a new training facility with a hospital group in Brazil and began operations; − We partnered with Community Hospital in Long Beach, U.S. to utilize their facilities in order to expand our training centre locations across the West Coast.
New programs and products − We released an update of our LearningSpace audiovisual and performance management system with a new Resource Manager feature that tracks simulation centre assets; − We released an updated version of our VIMEDIX ultrasound simulator operating system with additional user features and pathologies for the VIMEDIX cardiac simulator and VIMEDIX Ob/Gyn; − We released a first trimester endovaginal ultrasound training module for VIMEDIX Ob/Gyn; − We unveiled the CAE Fidelis Maternal Fetal Simulator at the International Meeting for Simulation in Healthcare (IMSH) in San Francisco, U.S.
CAE Mining expansions and new initiatives included the following:
Expansions − We expanded our customer support and sales capability in Columbia; − We entered into a distribution agreement with Simsmart Technologies Inc. to offer their SmartEXEC automated underground ventilation technology to the global market; − We announced a collaboration agreement with Geovariances granting CAE Mining exclusive access to their mining sector geostatistical libraries. Commercial release within the CAE Mining product
suite is expected to be launched in the first quarter of fiscal 2015.
New programs and products − We delivered and commissioned our first underground mining simulator models to the Fresnillo PLC training centre in Mexico; − We launched a cloud-based service for open pit mine optimization that is significantly faster than current methods; − We released major updates to our geological data management system, Sirovision 3D photogrammetry, mapping system and our flagship resource modeling solution including performance
improvements and new functionality for condition simulation; − We released an innovative new drill and blast design system featuring automated design and electronic transfer of data to drill rigs; − We released a major update to our stratigraphic modeling system, with improvements in model calibration, fault modeling and contouring. ORDERS CAE Healthcare sales this quarter included: − Ten ultrasound simulators and five surgical simulators to five National Health Service (NHS) hospitals through the Local Education and Training Board committees of Health Education England; − Three patient simulators, one ultrasound simulator, two ultrasound task trainers, a centre management system and multi-year warranty to a public research university in the U.S.; − Five patient simulators, two ultrasound simulators, two ultrasound task trainers and a multi-year warranty to a private university in the U.S.; − A centre management system to a public university in Saudi Arabia.
30 | CAE Annual Report 2014
Backlog up 4% over last year (amounts in millions) FY2014 FY2013 Backlog, beginning of period $ 1,306.5 $ 1,268.9
+ orders 272.1 357.5
- revenue (292.7) (244.0)
+ / - adjustments 75.5 (75.9)
Backlog, end of period $ 1,361.4 $ 1,306.5
Fiscal 2014 adjustments are mainly related to foreign exchange movements. Adjustments in fiscal 2013 were mainly due to the reclassification of equipment procurement from a long-term services contract. This quarter's book-to-sales ratio was 0.62x. The ratio for the last 12 months was 0.93x. Unfunded backlog was $368.7 million and the joint venture backlog was $129.4 million at March 31, 2014.

Management’s Discussion and Analysis
CAE Mining sales this quarter included: − Resource modeling, stratigraphic modeling and mine planning systems to Kazakhmys PLC in Kazakhstan; − A mine ventilation automation project for Fresnillo PLC’s San Julian mine in Mexico; − Open pit resource modeling and mine planning systems to Swakop Uranium (Pty) Ltd in Namibia.
Revenue stable compared to last quarter and up 2% o ver the fourth quarter of fiscal 2013 Revenue was stable compared to last quarter. Lower revenue from CAE Mining was offset by higher revenue from CAE Healthcare. In CAE Mining, revenue was lower due to a decrease in software licence and consulting services revenue. In CAE Healthcare, higher revenue from surgical simulators and from centre management systems, including the impact from a stronger U.S. dollar against the Canadian dollar, was partially offset by lower patient simulator revenue. The increase over the fourth quarter of fiscal 2013 was mainly due to higher revenue from CAE Healthcare, partially offset by lower revenue from CAE Mining. In CAE Healthcare, revenue was higher due to an increase in surgical and patient simulator revenue, including the impact of a stronger U.S. dollar against the Canadian dollar. In CAE Mining, revenue was lower due to a decrease in software licence and consulting services revenue.
Revenue was $116.2 million this year, 4% or $4.1 mi llion higher than last year The increase was mainly due to higher revenue from CAE Healthcare, partially offset by lower revenue from CAE Mining. In CAE Healthcare, higher ultrasound task trainer and surgical simulator revenue and higher centre management system revenue, including the impact from a stronger U.S. dollar against the Canadian dollar and an expanded installation base, was partially offset by lower patient simulator revenue. In CAE Mining, revenue was lower due to the cyclical downturn in the mining industry, with lower software licence and consulting services revenue partially offset by an increase in software maintenance revenue.
Segment operating income down 86% compared to last quarter and 89% compared to the fourth quarter of f iscal 2013 Segment operating income was $0.2 million this quarter (0.7% of revenue), compared to segment operating income of $1.4 million (4.7% of revenue) last quarter and a segment operating income of $1.8 million (6.2% of revenue) in the fourth quarter of fiscal 2013. The decrease in segment operating income from the last quarter was mainly due to lower revenue from CAE Mining, as mentioned above. The decrease from the fourth quarter of fiscal 2013 was mainly due to lower segment operating income from CAE Mining as a result of lower revenue, partially offset by lower selling, general and administrative expenses.
Segment operating income was $4.2 million this year , 34% or $2.2 million lower than last year Segment operating income was $ 4.2 million (3.6% of revenue) this year, compared to a segment operating income of $ 6.4 million (5.7% of revenue) last year. The decrease from last year was mainly due to lower segment operating income from CAE Mining as a result of lower revenue, partially offset by lower selling, general and administrative expenses.
Capital employed increased by $4.6 million over las t quarter and by $23.2 million over last year The increase over last quarter was mainly due to higher intangible assets mainly as a result of movements in foreign exchange rates, partially offset by an increase in accounts payable and accrued liabilities . The increase over last year was mainly due to higher intangible assets mainly as a result of movements in foreign exchange rates.
CAE Annual Report 2014 | 31
Financial results (amounts in millions, except operating margins) FY2014 FY2013 Q4-2014 Q3-2014 Q2-2014 Q1-2014 Q4-2013 Revenue $ 116.2 112.1 29.6 29.7 27.1 29.8 29.0
Segment operating income $ 4.2 6.4 0.2 1.4 1.0 1.6 1.8
Operating margins % 3.6 5.7 0.7 4.7 3.7 5.4 6.2
Depreciation and amortization $ 14.2 11.7 3.9 3.5 3.3 3.5 4.0
Property, plant and equipment expenditures $ 3.1 3.1 0.7 0.6 0.7 1.1 0.7
Intangible assets and other assets expenditures $ 13.4 9.5 3.8 4.1 2.8 2.7 2.5
Capital employed $ 222.4 199.2 222.4 217.8 205.7 207.6 199.2

Management’s Discussion and Analysis
6. CONSOLIDATED CASH MOVEMENTS AND LIQUIDITY
We manage liquidity and regularly monitor the factors that could affect it, including: − Cash generated from operations, including timing of milestone payments and management of working capital; − Capital expenditure requirements;
− Scheduled repayments of long-term debt obligations, our credit capacity and expected future debt market conditions. [
6.1 Consolidated cash movements
Free cash flow was $105.1 million for the quarter Free cash flow was $ 117.8 million higher than last quarter and $ 0.1 million lower compared to the fourth quarter of fiscal 201 3 . Free cash flow was higher compared to last quarter mainly due to an increase in cash provided by operating activities and favourable changes in non-cash working capital. Free cash flow remained stable compared to the fourth quarter of fiscal 201 3. The decrease related to unfavourable changes in non-cash working capital and higher maintenance capital expenditures was offset by an increase in cash provided by operating activities .
Free cash flow was $200.6 million this year Free cash flow increased $ 117.1 million , or 140 % , compared to last year. Free cash flow was higher compared to last year mainly due to an increase in cash provided by operating activities and favourable changes in non-cash working capital.
Capital expenditures were $65.7 million this quarte r and $157.4 million for the year Growth capital expenditures were $50.6 million this quarter and $111.3 million for the year. Our growth capital allocation decisions are market-driven in nature and are intended to keep pace with the demands of our existing and new customers. Maintenance capital expenditures were $15.1 million this quarter and $46.1 million for the year.
8 Non-GAAP and other financial measures (see Section 3.6).
32 | CAE Annual Report 2014
(amounts in millions) FY2014 FY2013 Q4-2014 Q3-2014 Q4-2013 Cash provided by operating activities* $ 304.8 $ 239.1 $ 96.4 $ 56.2 $ 80.6
Changes in non-cash working capital (28.8) (84.6) 27.9 (39.2) 33.1
Net cash provided by operating activities $ 276.0 $ 154.5 $ 124.3 $ 17.0 $ 113.7
Maintenance capital expenditures 8 (46.1) (31.8) (15.1) (14.4) (2.7)
Other assets (23.8) (21.8) (5.3) (5.6) (7.1)
Proceeds from the disposal of property, plant and equipment 15.4 9.2 8.5 0.5 1.1 Net proceeds (payments) from equity accounted investees 4.2 (1.4) 1.8 0.4 1.4
Dividends received from equity accounted investees 15.0 11.9 0.8 - 9.0
Dividends paid (40.1) (37.1) (9.9) (10.6) (10.2)
Free cash flow 8 $ 200.6 $ 83.5 $ 105.1 $ (12.7) $ 105.2
Growth capital expenditures 8 (111.3) (64.9) (50.6) (22.8) (11.0)
Capitalized development costs (48.1) (49.6) (14.1) (11.7) (12.6)
Other cash movements, net 3.6 3.5 14.0 1.0 1.5
Business combinations, net of cash and cash equivalents acquired (3.8) (285.3) (0.4) (2.9) (0.7)
Effect of foreign exchange rate changes on cash and cash equivalents 23.4 - 9.5 9.3 -
Net increase (decrease) in cash before proceeds and repayment of long-term debt $ 64.4 $ (312.8) $ 63.5 $ (39.8) $ 82.4
* before changes in non-cash working capital

Management’s Discussion and Analysis
6.2 Sources of liquidity We have committed lines of credit at floating rates, each provided by a syndicate of lenders. We and some of our subsidiaries can borrow funds directly from these credit facilities to cover operating and general corporate expenses and to issue letters of credit and bank guarantees. The total amount available through these committed bank lines at March 31, 2014 was US$550.0 million (2013 – US$550.0 million) with an option, subject to lender’s consent, to increase to a total amount of US$850.0 million. There was an equivalent of US$49.1 million drawn under the facilities as at March 31, 2014 (2013 – US$66.5 million) and US$120.4 million was used for letters of credit (2013 – US$121.6 million). The applicable interest rate on this revolving term credit facility is at our option, based on the bank’s prime rate, bankers’ acceptance rates or LIBOR plus a spread which depends on the credit rating assigned by Standard & Poor’s Rating Services. Effective October 1, 2013, we amended our revolving unsecured term credit facilities to extend the maturity date from April 2017 to October 2018. We have an unsecured Export Development Canada (EDC) Performance Security Guarantee (PSG) account for US$150.0 million. This is an uncommitted revolving facility for performance bonds, advance payment guarantees or similar instruments. As at March 31, 2014, the total outstanding for all these instruments translated into Canadian dollars, was $48.8 million (2013 – $62.6 million). We have a facility of €10.0 million with a European bank for the issuance of bank guarantees and letters of credit. The amount used principally in support of our European military operations, translated into Canadian dollars, was approximately $9.5 million (2013 – $9.6 million). We manage a program in which we sell undivided interests in certain of our accounts receivable and contracts in progress assets (current financial assets program) to third parties for cash consideration for amounts up to $150.0 million without recourse to CAE. As at March 31, 2014, we sold $79.5 million of accounts receivable (2013 – $88.6 million) and $4.2 million of contracts in progress (2013 – $3.1 million). In September 2013 and October 2013, we entered into various finance leases for the leasing of simulators located in the U.S. These transactions represent a total finance lease obligation of $34.2 million as at March 31, 2014. In February 2014 we entered into an interest-bearing long-term obligation with the Government of Canada relative to Project Innovate, an R&D program extending over five and a half years, for a maximum amount of $250.0 million. The discounted value of the debt recognized amounted to $1.3 million as at March 31, 2014. We have certain debt agreements which require that we maintain a certain level of capital. As at March 31, 2014, we are compliant with all our financial covenants. We believe that our cash and cash equivalents, access to credit facilities and expected free cash flow will provide sufficient flexibility for our business, the payment of dividends and will enable us to meet all other expected financial requirements in the near term.
CAE Annual Report 2014 | 33
The following table summarizes the long-term debt: As at March 31 As at March 31 (amounts in millions) 2014 2013
Total long-term debt $ 1,168.5 $ 1,073.4
Less: Current portion of long-term debt 23.8 43.7
Current portion of finance leases 26.8 26.9 Long-term portion of long-term debt $ 1,117.9 $ 1,002.8

Management’s Discussion and Analysis
6.3 Government assistance We have signed agreements with various governments whereby the latter share in the cost, based on expenditures incurred by CAE, of certain R&D programs for modeling, simulation and training services expertise. During fiscal 2009, we announced Project Falcon, an R&D program that extended over five years. The goal of Project Falcon was to expand our modeling and simulation technologies, develop new ones and increase our capabilities beyond training into other areas of the aerospace and defence market, such as analysis and operations. Concurrently, the Government of Canada agreed to participate in Project Falcon through a repayable investment of up to $250 million made through the Strategic Aerospace and Defence Initiative (SADI), which supports strategic industrial research and pre-competitive development projects in the aerospace, defence, space and security industries. As at March 31, 2014, Project Falcon was completed. During fiscal 2010, we announced Project New Core Markets, an R&D program extending over seven years. The aim is to leverage our modeling, simulation and training services expertise into the healthcare and mining markets. The Québec government, through Investissement Québec, agreed to participate up to $100 million in contributions related to costs incurred before the end of fiscal 2016. During fiscal 2014, we announced Project Innovate, an R&D program extending over five and a half years. The goal of Project Innovate is to expand our modeling and simulation technologies, develop new ones and continue to differentiate our service offering. Concurrently, the Government of Canada agreed to participate in Project Innovate through a repayable investment of up to $250 million made through the SADI. You will find more details in Note 1 and Note 13 of our consolidated financial statements. ___
6.4 Contractual obligations We enter into contractual obligations and commercial commitments in the normal course of our business. These include debentures, notes and others. The table below shows when they mature.
We also had total availability under the committed credit facilities of US$380.5 million as at March 31, 2014 compared to US$361.9 million at March 31, 2013. We have purchase obligations related to agreements that are enforceable and legally binding. Most are agreements with subcontractors to provide services for long-term contracts that we have with our clients. The terms of the agreements are significant because they set out obligations to buy goods or services in fixed or minimum amounts, at fixed, minimum or variable prices and at various points in time. As at March 31, 2014, we had other long-term liabilities that are not included in the table above. These include some accrued pension liabilities, deferred revenue, deferred gains on assets and various other long-term liabilities. CAE’s cash obligation in respect of the accrued employee pension liability depends on various elements including market returns, actuarial gains and losses and interest rates. We did not include deferred tax liabilities since future payments of income taxes depend on the amount of taxable earnings and on whether there are tax loss carry-forwards available. 34 | CAE Annual Report 2014
Contractual obligations As at March 31, 2014 (amounts in millions) 2015 2016 2017 2018 2019 Thereafter Total Long-term debt (excluding interest) $ 24.5 $ 31.9 $ 98.2 $ 34.4 $ 75.9 $ 749.1 $ 1,014.0 Finance leases (excluding interest) 26.8 20.1 13.7 13.7 11.5 73.4 159.2
Operating leases 53.4 43.1 36.3 29.4 22.1 77.5 261.8
Purchase obligations 12.2 5.3 5.3 - - - 22.8
$ 116.9 $ 100.4 $ 153.5 $ 77.5 $ 109.5 $ 900.0 $ 1,457.8

Management’s Discussion and Analysis
7. CONSOLIDATED FINANCIAL POSITION
7.1 Consolidated capital employed
Capital employed increased $378.6 million, or 19%, over last year The increase over last year was mainly due to higher and property, plant and equipment and higher other long-term assets. Our return on capital employed 9 (ROCE) was 11.4% this year compared to 10.2% last year.
Non-cash working capital decreased by $87.2 million [9]
The decrease was mainly due to lower income taxes recoverable as a result of a reclassification of certain investment tax credits (ITCs) from short-term to long-term, an increase in contracts in progress liabilities and higher accounts payable and accrued liabilities. The decrease was partially offset by an increase in accounts receivable, inventories and prepayments.
Net property, plant and equipment up $198.4 million The increase was mainly due to $157.4 million of capital expenditures and $118.0 million of movements in foreign exchange rates, partially offset by depreciation of $99.5 million.
Other long-term assets up $303.8 million The increase was mainly due to higher other assets as a result of a reclassification of certain ITCs from short-term to long-term and an increase in intangible assets, investment in equity accounted investees and other assets resulting primarily from movements in foreign exchange rates.
Net debt higher than last year The increase was largely caused by the effect of foreign exchange rate changes on long-term debt and new finance leases signed during the year, partially offset by an increase in cash and cash equivalents.
9 Non-GAAP and other financial measures (see Section 3.6).
CAE Annual Report 2014 | 35
As at March 31 As at March 31 (amounts in millions) 2014 2013
Use of capital: Current assets $ 1,350.8 $ 1,307.6
Less: cash and cash equivalents (312.3) (260.0)
Current liabilities (964.5) (906.4)
Less: current portion of long-term debt 50.6 70.6
Non-cash working capital 9 $ 124.6 $ 211.8
Property, plant and equipment 1,341.2 1,142.8
Other long-term assets 1,544.7 1,240.9
Other long-term liabilities (672.1) (635.7)
Total capital employed $ 2,338.4 $ 1,959.8
Source of capital: Current portion of long-term debt $ 50.6 $ 70.6
Long-term debt 1,117.9 1,002.8
Less: cash and cash equivalents (312.3) (260.0)
Net debt 9 $ 856.2 $ 813.4
Equity attributable to equity holders of the Company 1,441.6 1,114.6
Non-controlling interests 40.6 31.8 Source of capital $ 2,338.4 $ 1,959.8

Management’s Discussion and Analysis
Total equity increased by $335.8 million this year The increase in equity was mainly due to net income of $191.1 million and a favourable foreign currency translation of $159.5 million. Outstanding share data Our articles of incorporation authorize the issue of an unlimited number of common shares and an unlimited number of preferred shares issued in series. We had a total of 263,771,443 common shares issued and outstanding as at March 31, 2014 with total share capital of $517.5 million. As at April 30, 2014, we had a total of 263,808,466 common shares issued and outstanding. Dividends We paid a dividend of $0.05 per share in the first and second quarter and $0.06 per share in the third and fourth quarter of fiscal 2014. These dividends were eligible under the Income Tax Act (Canada) and its provincial equivalents. Our Board of Directors has the discretion to set the amount and timing of any dividend. The Board reviews the dividend policy once a year based on the cash requirements of our operating activities, liquidity requirements and projected financial position. We expect to declare dividends of approximately $63.3 million in fiscal 2015 based on our current dividend policy and the number of common shares outstanding as at March 31, 2014. Guarantees As at March 31, 2014, we have a total of $191.4 million outstanding letters of credit and performance guarantees which are not recognized in the consolidated statement of financial position, compared to $198.7 million last fiscal year. Pension obligations We maintain defined benefit and defined contribution pension plans. We expect to contribute approximately $3.8 million more than the annual required contribution for current services to satisfy a portion of the underfunded liability of the defined benefit pension plan. In fiscal 2015, contributions necessary to fund our pension obligations are expected to decrease mainly as a result of improved long-term bond returns and stock market performance.
7.2 Off balance sheet arrangements Although most of our sale and leaseback transactions entered into as part of our TS/C operations are classified as finance leases and their obligations are included in the consolidated statement of financial position, certain sale and leaseback transactions are classified as operating leases and are off balance sheet obligations. Most of our current off balance sheet obligations are from obligations related to operating leases from: − The operation of a training centre for the MSH project with the U.K. Ministry of Defence to provide simulation training services. The operating lease commitments are between the operating company,
which has the service agreement with the U.K. Ministry of Defence, and the asset company, which owns the assets. These leases are non-recourse to us; − Certain buildings that are leased throughout our training network and production facilities in the normal course of business; − Certain FFSs that are leased throughout our training network in the normal course of business. You can find more details about operating lease commitments in Note 27 of our consolidated financial statements. In the normal course of business, we manage a program in which we sell undivided interests in certain of our accounts receivable and contracts in progress assets (current financial assets program) to third parties for cash consideration for an amount up to $150.0 million without recourse to CAE. We continue to act as a collection agent. These transactions are accounted for when we have considered to have surrendered control over the transferred accounts receivable and contracts in progress assets. As at March 31, 2014, $79.5 million (2013 – $88.6 million) and $4.2 million (2013 – $3.1 million) of specific accounts receivable and contracts in progress assets respectively were sold to financial institutions pursuant to these agreements. 36 | CAE Annual Report 2014
Change in net debt (amounts in millions) FY2014 FY2013 Net debt, beginning of period $ 813.4 $ 453.0
Impact of cash movements on net debt (see table in the consolidated cash movements section) (64.4) 312.8
Effect of foreign exchange rate changes on long-term debt 64.6 12.9
Net finance lease additions 31.4 -
Other 11.2 34.7
Increase in net debt during the period $ 42.8 $ 360.4 Net debt, end of period $ 856.2 $ 813.4

Management’s Discussion and Analysis
7.3 Financial instruments We are exposed to various financial risks in the normal course of business. We enter into forward and swap contracts to manage our exposure to fluctuations in foreign exchange rates, interest rates and changes in share price which have an effect on our share-based payments costs. We also continually assess whether the derivatives we use in hedging transactions are effective in offsetting changes in fair values or cash flows of hedged items. We enter into these transactions to reduce our exposure to risk and volatility, and not for speculative reasons. We only deal with highly rated counterparties. Classification of financial instruments We have made the following classifications for our financial instruments: − Cash and cash equivalents, restricted cash and all derivative instruments, except for derivatives designated as effective hedging instruments, are classified as fair value through profit and loss
(FVTPL); − Accounts receivable, contracts in progress, non-current receivables and advances are classified as loans and receivables, except for those that we intend to sell immediately or in the near term,
which are classified as FVTPL; − Portfolio investments are classified as available-for-sale; − Accounts payable and accrued liabilities and long-term debt, including interest payable, as well as finance lease obligations and royalty obligations are classified as other financial liabilities, all of
which are measured at amortized cost using the effective interest rate method. Fair value of financial instruments The fair value of a financial instrument is determined by reference to the available market information at the reporting date. When no active market exists for a financial instrument, we determine the fair value of that instrument based on valuation methodologies as discussed below. In determining assumptions required under a valuation model, we primarily use external, readily observable market data inputs. Assumptions or inputs that are not based on observable market data incorporate our best estimates of market participant assumptions, and are used when external data is not available. Counterparty credit risk and the fair values of our own credit risk are taken into account in estimating the fair value of all financial assets and financial liabilities, including derivatives. The following assumptions and valuation methodologies have been used to measure fair value of financial instruments: − The fair value of accounts receivable, contracts in progress, accounts payable and accrued liabilities approximate their carrying values due to their short-term maturities; − The fair value of derivative instruments, including forward contracts, swap agreements and embedded derivatives with economic characteristics and risks that are not clearly and closely related to
those of the host contract, are determined using valuation techniques and are calculated as the present value of the estimated future cash flows using an appropriate interest rate yield curve and foreign exchange rate. Assumptions are based on market conditions prevailing at each reporting date. Derivative instruments reflect the estimated amounts that we would receive or pay to settle the contracts at the reporting date;
− The fair value of the available-for-sale investment which does not have a readily available market value, is estimated using a discounted cash flow model, which includes some assumptions that are not supportable by observable market prices or rates;
− The fair value of non-current receivables are estimated based on discounted cash flows using current interest rates for instruments with similar terms and remaining maturities; − The fair value of provisions, long-term debt and non-current liabilities, including finance lease obligations and royalty obligations, are estimated based on discounted cash flows using current interest
rates for instruments with similar terms and remaining maturities. A description of the fair value hierarchy is discussed in Note 29 of our consolidated financial statements. Financial risk management Due to the nature of the activities that we carry out and as a result of holding financial instruments, we are exposed to credit risk, liquidity risk and market risk, including foreign currency risk and interest rate risk. Our exposure to credit risk, liquidity risk and market risk is managed within risk management parameters approved by the board of directors. These risk management parameters remain unchanged since the previous period, unless otherwise indicated. Embedded derivatives are recorded at fair value separately from the host contract when their economic characteristics and risks are not clearly and closely related to those of the host contract. We may enter into freestanding derivative instruments which are not eligible for hedge accounting, to offset the foreign exchange exposure of embedded foreign currency derivatives. In such circumstances, both derivatives are carried at fair value at each statement of financial position date with the change in fair value recorded in consolidated net income. Our policy is not to utilize any derivative financial instruments for trading or speculative purposes. We may choose to designate derivative instruments, either freestanding or embedded, as hedging items. This process consists of matching derivative hedging instruments to specific assets and liabilities or to specific firm commitments or forecasted transactions. To some extent, we use non-derivative financial liabilities to hedge foreign currency exchange rate risk exposures.
CAE Annual Report 2014 | 37

Management’s Discussion and Analysis Credit risk Credit risk is defined as our exposure to a financial loss if a debtor fails to meet its obligations in accordance with the terms and conditions of its arrangements with CAE. We are exposed to credit risk on our accounts receivable and certain other assets through our normal commercial activities. We are also exposed to credit risk through our normal treasury activities on our cash and cash equivalents and derivative financial assets. Credit risks arising from our normal commercial activities are managed in regards to customer credit risk. An allowance for doubtful accounts is established when there is a reasonable expectation that we will not be able to collect all amounts due according to the original terms of the receivables (See Note 4 of the consolidated financial statements). When a trade receivable is uncollectible, it is written-off against the allowance for doubtful accounts. Subsequent recoveries of amounts previously written-off are recognized in income. Our customers are mainly established companies with publicly available credit ratings and government agencies, which facilitates risk monitoring. In addition, we typically receive substantial non-refundable advance payments for construction contracts. We closely monitor our exposure to major airlines in order to mitigate our risk to the extent possible. Furthermore, our trade receivables are not concentrated with specific customers but are held with a wide range of commercial and government organizations. As well, our credit exposure is further reduced by the sale of certain of our accounts receivable and contracts in progress assets to third-party financial institutions for cash consideration on a non-recourse basis (current financial assets program). We do not hold any collateral as security. The credit risk on cash and cash equivalents is mitigated by the fact that they are in place with a diverse group of major North American and European financial institutions. We are exposed to credit risk in the event of non-performance by counterparties to our derivative financial instruments. We use several measures to minimize this exposure. First, we enter into contracts with counterparties that are of high credit quality. We signed International Swaps & Derivatives Association, Inc . (ISDA) Master Agreements with the majority of counterparties with whom we trade derivative financial instruments. These agreements make it possible to offset when a contracting party defaults on the agreement, for each of the transactions covered by the agreement and in force at the time of default. Also, collateral or other security to support derivative financial instruments subject to credit risk can be requested by CAE or our counterparties (or both parties, if need be) when the net balance of gains and losses on each transaction exceeds a threshold defined in the ISDA Master Agreement. Finally, we monitor the credit standing of counterparties on a regular basis to help minimize credit risk exposure. The carrying amounts presented in Note 4 and Note 29 of the consolidated financial statements represent the maximum exposure to credit risk for each respective financial asset as at the relevant dates.
Liquidity risk Liquidity risk is defined as the potential that we cannot meet our cash obligations as they become due. We manage this risk by establishing cash forecasts, as well as long-term operating and strategic plans. The management of consolidated liquidity requires a regular monitoring of expected cash inflows and outflows which is achieved through a forecast of our consolidated liquidity position, for efficient use of cash resources. Liquidity adequacy is assessed in view of seasonal needs, growth requirements and capital expenditures, and the maturity profile of indebtedness, including off balance sheet obligations. We manage our liquidity risk to maintain sufficient liquid financial resources to fund our operations and meet our commitments and obligations. In managing our liquidity risk, we have access to a revolving unsecured credit facility of US$550.0 million, with an option, subject to the lender’s consent, to increase to a total amount of up to US$850.0 million. As well, we have agreements to sell certain of our accounts receivable and contracts in progress assets for an amount of up to $150.0 million (current financial assets program). We also regularly monitor any financing opportunities to optimize our capital structure and maintain appropriate financial flexibility.
Market risk Market risk is defined as our exposure to a gain or a loss in the value of our financial instruments as a result of changes in market prices, whether those changes are caused by factors specific to the individual financial instruments or its issuer, or factors affecting all similar financial instruments traded in the market. We are mainly exposed to foreign currency risk and interest rate risk. We use derivative instruments to manage market risk against the volatility in foreign exchange rates, interest rates and share-based payments in order to minimize their impact on our results and financial position. Our policy is not to utilize any derivative financial instruments for trading or speculative purposes.
Foreign currency risk Foreign currency risk is defined as our exposure to a gain or a loss in the value of our financial instruments as a result of fluctuations in foreign exchange rates. We are exposed to foreign exchange rate variability primarily in relation to certain sale commitments, expected purchase transactions and debt denominated in a foreign currency, as well as on our net investment from our foreign operations which have functional currencies other than the Canadian dollar (in particular the U.S. dollar, euro and British pound). In addition, these operations have exposure to foreign exchange rates primarily through cash and cash equivalents and other working capital accounts denominated in currencies other than their functional currencies. We also mitigate foreign currency risks by having our foreign operations transact in their functional currency for material procurement, sale contracts and financing activities. 38 | CAE Annual Report 2014

Management’s Discussion and Analysis
We use forward foreign currency contracts and foreign currency swap agreements to manage our exposure from transactions in foreign currencies and to synthetically modify the currency of exposure of certain financial position items. These transactions include forecasted transactions and firm commitments denominated in foreign currencies. Our foreign currency hedging programs are typically unaffected by changes in market conditions, as related derivative financial instruments are generally held until their maturity, consistent with the objective to fix currency rates on the hedged item. Foreign currency risk sensitivity analysis Foreign currency risk arises on financial instruments that are denominated in a foreign currency. Assuming a reasonably possible strengthening of 5% in the U.S. dollar, euro and British pound currency against the Canadian dollar as at March 31, 2013, and assuming all other variables remained constant, the pre-tax effects on net income would have been a negative net adjustment of $3.1 million (2013 – no significant effect) and a negative net adjustment of $21.5 million (2013 – negative net adjustment of $25.0 million) on other comprehensive income (OCI). A reasonably possible weakening of 5% in the relevant foreign currency against the Canadian dollar would have an opposite impact on pre-tax income and OCI. Interest rate risk Interest rate risk is defined as our exposure to a gain or a loss to the value of our financial instruments as a result of fluctuations in interest rates. We bear some interest rate fluctuation risk on our floating rate long-term debt and some fair value risk on our fixed interest long-term debt. We mainly manage interest rate risk by fixing project-specific floating rate debt in order to reduce cash flow variability. We have a floating rate debt through our revolving unsecured credit facility and other asset-specific floating rate debts. A mix of fixed and floating interest rate debt is sought to reduce the net impact of fluctuating interest rates. Derivative financial instruments used to synthetically convert interest rate exposures are mainly interest rate swap agreements. We use financial instruments to manage our exposure to changing interest rates and to adjust our mix of fixed and floating interest rate debt on long-term debt. The mix was 84% fixed-rate and 16% floating-rate at the end of this year (2013 – 83% fixed rate and 17% floating rate). Our interest rate hedging programs are typically unaffected by changes in market conditions, as related derivative financial instruments are generally held until their maturity to establish asset and liability management matching, consistent with the objective to reduce risks arising from interest rate movements. As a result, the changes in variable interest rates do not have a significant impact on net income and OCI. Interest rate risk sensitivity analysis In fiscal 2014 and fiscal 2013, a 1% increase/decrease in interest rates would not have a significant impact on our net income and OCI assuming all other variables remained constant. Hedge of share-based payments cost We have entered into equity swap agreements with two major Canadian financial institutions to reduce our income exposure to fluctuations in our share price relating to the Deferred Share Unit (DSU) and Long-Term Incentive Deferred Share Unit (LTI-DSU) programs. Pursuant to the agreement, we receive the economic benefit of dividends and share price appreciation while providing payments to the financial institutions for the institution’s cost of funds and any share price depreciation. The net effect of the equity swaps partly offset movements in our share price impacting the cost of the DSU and LTI-DSU programs and is reset quarterly. As at March 31, 2014, the equity swap agreements covered 2,400,000 of our common shares (2013 – 2,706,816). Hedge of net investments in foreign operations As at March 31, 2014, we have designated a portion of our senior notes totalling US$417.8 million (2013 – US$417.8 million) and a portion of the sale lease back obligation totalling US$16.1 million (2013 – US$17.9 million) as a hedge of net investments in foreign operations. Gains or losses on the translation of the designated portion of our senior notes are recognized in OCI to offset any foreign exchange gains or losses on translation of the financial statements of foreign operations. We have determined that there is no concentration of risks arising from financial instruments and estimated that the information disclosed above is representative of our exposure to risk during the period. Refer to the Consolidated Statements of Comprehensive Income for the total amount of the change in fair value of financial instruments designated as cash flow hedges recognized in income for the period and total amount of gains and losses recognized in OCI and to Note 29 of the consolidated financial statements for the classification of financial instruments.
CAE Annual Report 2014 | 39

Management’s Discussion and Analysis
8. BUSINESS COMBINATIONS Fiscal 2014 acquisitions During the year, we paid $3.8 million for business combination transactions of which $0.8 million was for the payment of contingent consideration of previous acquisitions, $2.9 million (€2.1 million) was for the balance of the purchase price for the May 2012 acquisition of OAA and $0.1 million was to acquire the assets of RW Consulting and Training Services LTD (RWCTS), a provider of mining training and consulting services. The total consideration transferred for the RWCTS acquisition is $0.4 million, including $0.3 million of contingent consideration.
9. BUSINESS RISK AND UNCERTAINTY We operate in several industry segments that have various risks and uncertainties. Management and the Board discuss quarterly the principal risks facing our business, as well as annually during the strategic planning and budgeting processes. The risks and uncertainties described below are risks that could materially affect our business, financial condition and results of operation. These risks are categorized as industry-related risks, risks specific to CAE and risks related to the current market environment. These are not necessarily the only risks we face; additional risks and uncertainties that are presently unknown to us or that we may currently deem immaterial may adversely affect our business. In order to mitigate the risks that may impact our future performance, management has established an enterprise risk management process to identify, assess and prioritize these risks. Management develops and deploys risk mitigation strategies that align with our strategic objectives and business processes. Management reviews the evolution of the principal risks facing our business on a quarterly basis and the Board oversees the risk management process and validates it through procedures performed by our internal auditors when it deems necessary.
9.1 Risks relating to the industry
Competition We sell our simulation equipment and training services in highly competitive markets. New participants have emerged in recent years and the competitive environment has intensified as aerospace and defence companies position themselves to try to take greater market share by consolidating existing civil simulation companies and by developing their own internal capabilities. Most recently, Textron, Lockheed Martin and L-3 Communications have acquired commercial aircraft simulator competitors. Most of our competitors in the simulation and training markets are also involved in other major segments of the aerospace and defence complex beyond simulation and training. As such, they are larger than we are, and may have greater financial, technical, marketing, manufacturing and distribution resources. In addition, our main competitors are either aircraft manufacturers, or have well-established relationships with, or are important suppliers to, aircraft manufacturers, airlines and governments, which may give them an advantage when competing for projects for these organizations. In particular, we face competition from Boeing, which has pricing and other competitive advantages over us. Boeing has a licencing model for Boeing civil aircraft simulators which includes a requirement for simulator manufacturers and service training operators to pay Boeing a royalty to manufacture, update or upgrade a simulator, and to provide training services on Boeing simulators. Airbus has decided to deepen its services offered to customers for training services. OEMs like Airbus and Boeing have certain advantages in competing with independent training service providers. An OEM controls the pricing for the data, parts and equipment packages that are often required to manufacture a simulator specific to that OEM’s aircraft, which in turn is a critical capital cost for any simulation-based training service provider. OEMs may be in a position to demand licence royalties to permit the manufacturing of simulators based on the OEM’s aircraft, and/or to permit any training on such simulators. CAE also has some advantages, including being a simulator manufacturer, having the ability to replicate certain aircraft without data, parts and equipment packages from an OEM, and owning a diversified training network that includes joint ventures with large airline operators which are aircraft customers for OEMs. We work with some OEMs on business opportunities related to equipment and training services. We obtain most of our contracts through competitive bidding processes that subject us to the risk of spending a substantial amount of time and effort on proposals for contracts that may not be awarded to us. A significant portion of our revenue is dependent on obtaining new orders and continuously replenishing our backlog. We cannot be certain that we will continue to win contracts through competitive bidding processes at the same rate as we have in the past. The presence of new market participants as noted above, and their efforts to gain market share, creates heightened competition in bidding which may negatively impact pricing and margins. Economic growth underlies the demand for all of our products and services. Periods of economic recession, constrained credit, and or government austerity generally lead to heightened competition for each available order. This in turn typically leads to a reduction in profit on sales won during such a period. Should such conditions occur, we could experience price and margin erosion.
Level and timing of defence spending A significant portion of our revenue comes from sales to defence and security customers around the world. We are either the primary contractor or a subcontractor for various programs by Canadian, U.S., European, and other foreign governments. If funding for a government program is cut, we could lose future revenue, which could have a negative effect on our operations. When countries we have contracts with significantly lower their military spending, there could be a material negative effect on our sales and earnings. In Europe, force structure reductions and reduced future investment plans have narrowed the pipeline of new opportunities . We are also experiencing longer and delayed procurement processes in mature markets, such as the U.S. and Canada, which impacts the timing of contract awards and results in delayed recognition of revenue. 40 | CAE Annual Report 2014

Management’s Discussion and Analysis
Government-funded military programs Like most companies that supply products and services to governments, we can be audited and reviewed from time to time. Any adjustments that result from government audits and reviews may have a negative effect on our results of operations. Some costs may not be reimbursed or allowed in negotiations of fixed-price contracts. As a result, we may also be subject to a higher risk of legal actions and liabilities than companies that cater only to the private sector, which could have a materially negative effect on our operations.
Civil aviation industry A significant portion of our revenue comes from supplying equipment and training services to the commercial and business airline industry. If jet fuel prices attain high levels for a sustained period, there could be a greater impetus for airlines to replace older, less fuel-efficient aircraft. However, higher fuel costs could also limit the airlines’ available financial resources, and could potentially cause deliveries of new aircraft to be delayed or cancelled. Airlines may slow capacity growth or cut capacity should sustained high fuel costs make the availability of such capacity not economically viable. Such a reaction would negatively affect the demand for our training equipment and services. Constraints in the credit market may reduce the ability of airlines and others to purchase new aircraft, negatively affecting the demand for our training equipment and services, and the purchase of our products. We are also exposed to credit risk on accounts receivable from our customers. We have adopted policies to ensure we are not significantly exposed to any individual customer. Our policies include analyzing the financial position of certain customers and regularly reviewing their credit quality. We also subscribe from time to time to credit insurance and, in some instances, require a bank letter of credit to secure our customers’ payments to us.
Regulatory rules imposed by aviation authorities We are required to comply with regulations imposed by aviation authorities. These regulations may change without notice, which could disrupt our sales and operations. Any changes imposed by a regulatory agency, including changes to safety standards imposed by aviation authorities such as the U.S. FAA, could mean that we have to make unplanned modifications to our products and services, causing delays or resulting in cancelled sales. We cannot predict the impact that changing laws or regulations might have on our operations. Any changes could present opportunities or, to the contrary, have a materially negative effect on our results of operations or financial condition.
Sales or licences of certain CAE products require r egulatory approvals and compliance The sale or licence of many of our products is subject to regulatory controls. These can prevent us from selling to certain countries, or to certain entities or people in a country, and require us to obtain from one or more governments an export licence or other approvals to sell certain technology such as military related simulators or other training equipment, including military data or parts. These regulations change often and we cannot be certain that we will be permitted to sell or licence certain products to customers, which could cause a potential loss of revenue for us. If we fail to comply with government laws and regulations related to export controls and national security requirements, we could be fined and/or suspended or barred from government contracts or subcontracts for a period of time, which would negatively affect our revenue from operations and profitability, and could have a negative effect on our reputation and ability to procure other government contracts in the future.
Conflict minerals We are subject to rules of the Securities Exchange Commission (SEC) issued pursuant to the Dodd-Frank Wall Street Reform and Consumer Protection Act that require public companies to conduct due diligence on and disclose whether certain materials including gold, tantalum, tin and tungsten that originate from mines in the Democratic Republic of the Congo or certain adjoining countries, known as conflict minerals, are used in products that we manufacture. The first report is due by May 31, 2014 for the 2013 calendar year and we have implemented appropriate measures to comply with such requirements, including verifying with our suppliers the sources of their minerals. The implementation of these rules could adversely affect the sourcing, supply, and pricing of materials used in our products, although this has not proved to be the case to date. If we determine that certain of our products contain minerals not determined to be conflict free or if we are unable to sufficiently verify the origins for all conflict minerals used in our products, it could have a negative effect on our reputation.
CAE Annual Report 2014 | 41

Management’s Discussion and Analysis
9.2 Risks relating to the Company
Product evolution The civil aviation and defence and security markets in which we operate are characterized by changes in customer requirements, new aircraft models and evolving industry standards. If we do not accurately predict the needs of our existing and prospective customers or develop product enhancements that address evolving standards and technologies, we may lose current customers and be unable to attract new customers. This could reduce our revenue. The evolution of the technology could also have a negative impact on the value of our fleet of FFSs.
Research and development activities We carry out some of our R&D initiatives with the financial support of governments, including the Government of Québec through Investissement Québec (IQ) and the Government of Canada through its Strategic Aerospace and Defence Initiative (SADI). In February 2014, CAE and the Government of Canada entered into a new SADI funding program for a five and a half year period. The level of government financial support reflects government policy, fiscal policy and other political and economic factors. We may not, in the future, be able to replace these existing programs with other government funding and/or risk-sharing programs of comparable benefit to us, which could have a negative impact on our financial performance and research and development activities. We receive investment tax credits on eligible R&D activities that we undertake in Canada from the federal government and investment tax credits on eligible R&D activities that we undertake in Québec from the provincial government. The credits we receive are based on federal and provincial legislation currently enacted. The investment tax credits available to us can be reduced by changes to the respective governments’ legislation which could have a negative impact on our financial performance and research and development activities. Fixed-price and long-term supply contracts We provide our products and services mainly through fixed-price contracts that require us to absorb cost overruns, even though it can be difficult to estimate all of the costs associated with these contracts or to accurately project the level of sales we may ultimately achieve. In addition, a number of contracts to supply equipment and services to commercial airlines and defence organizations are long-term agreements that run up to 20 years. While some of these contracts can be adjusted for increases in inflation and costs, the adjustments may not fully offset the increases, which could negatively affect the results of our operations. Procurement and OEM leverage We secure data, parts, equipment and many other inputs from a wide variety of OEMs, sub-contractors and other sources. We are not always able to find two or more sources for inputs that we require and in the case of specific aircraft simulators and other training equipment, significant inputs can only be sole sourced. We may therefore be vulnerable to delivery schedule delays, the financial condition of the sole-source suppliers and their willingness to deal with us. Within their corporate groups, some sole-source suppliers include businesses that compete with parts of our business. This could lead to onerous licencing terms, high licence fees or even refusal to licence to us the data, parts and equipment packages that are often required to manufacture and operate for training, a simulator based on an OEM’s aircraft.
Warranty or other product-related claims We manufacture simulators that are highly complex and sophisticated. These may contain defects that are difficult to detect and correct. If our products fail to operate correctly or have errors, there could be warranty claims or we could lose customers. Correcting these defects could require significant capital investment. If a defective product is integrated into our customer’s equipment, we could face product liability claims based on damages to the customer’s equipment. Any claims, errors or failures could have a negative effect on our operating results and business. We cannot be certain that our insurance coverage will be sufficient to cover one or more substantial claims. Product integration and program management risk Our business could be negatively affected if our products do not successfully integrate or operate with other sophisticated software, hardware, computing and communications systems that are also continually evolving. If we experience difficulties on a project or do not meet project milestones, we may have to devote more engineering and other resources than originally anticipated. While we believe we have recorded adequate provisions for risks of losses on fixed-price contracts, it is possible that fixed-price and long-term supply contracts could subject us to additional losses that exceed obligations under the terms of the contracts. Protection of intellectual property We rely in part on trade secrets and contractual restrictions, such as confidentiality agreements, patents and licences, to establish and protect our proprietary rights. These may not be effective in preventing a misuse of our technology or in deterring others from developing similar technologies. We may be limited in our ability to acquire or enforce our intellectual property rights in some countries. Litigation related to our intellectual property rights could be lengthy and costly and could negatively affect our operations or financial results, whether or not we are successful in defending a claim.
Intellectual property Our products contain sophisticated software and computer systems that are supplied to us by third parties. These may not always be available to us. Our production of simulators often depends on receiving confidential or proprietary data on the functions, design and performance of a product or system that our simulators are intended to simulate. We may not be able to obtain this data on reasonable terms, or at all. Infringement claims could be brought against us or against our customers. We may not be successful in defending these claims and we may not be able to develop processes that do not infringe on the rights of third parties, or obtain licences on terms that are commercially acceptable, if at all. 42 | CAE Annual Report 2014

Management’s Discussion and Analysis
Certain markets in which we operate, including without limitation the healthcare market, are subject to extensive patenting by third parties. Our ability to modify existing products or to develop new products may be constrained by third party patents such that we incur incremental costs to licence the use of the patent or design around the claims made therein.
Key personnel Our continued success will depend in part on our ability to retain and attract key personnel with the relevant skills, expertise and experience. Our compensation policy is designed to mitigate this risk. Environmental liabilities We use, generate, store, handle and dispose of hazardous materials at our operations, and used to at some of our discontinued or sold operations. Past operators at some of our sites also carried out these activities. New laws and regulations, stricter enforcement of existing laws and regulations, the discovery of previously unknown contamination, new clean-up requirements or claims on environmental indemnities we have given may result in us having to incur substantial costs. This could have a materially negative effect on our financial condition and results of operations. In addition, our discontinued operations are largely uninsured against such claims, so an unexpectedly large environmental claim against a discontinued operation could reduce our profitability in the future. Liability claims arising from casualty losses Because of the nature of our business, we may be subject to liability claims, including claims for serious personal injury or death, arising from: − Accidents or disasters involving training equipment that we have sold or aircraft for which we have provided training equipment or services; − Our pilot provisioning; − Our live flight training operations. We may also be subject to product liability claims relating to equipment and services that our discontinued operations sold in the past. We cannot be certain that our insurance coverage will be sufficient to cover one or more substantial claims.
Integration of acquired businesses The success of our acquisitions depends on our ability to crystallize synergies both in terms of successfully marketing our broadened product offering as well as efficiently consolidating the operations of the acquired businesses into our existing operations.
Our ability to penetrate new markets We are leveraging our knowledge, experience and best practices in simulation-based aviation training and optimization to penetrate the simulation-based training markets in healthcare and mining. As we operate in these markets, unforeseen difficulties and expenditures could arise, which may have an adverse effect on our operations, profitability and reputation. Penetrating new markets is inherently more difficult than managing within our already established core markets.
Enterprise resource planning (ERP) Following the successful implementation of the Canadian manufacturing portion of the ERP system in fiscal 2013, we continue to invest time and money in the next phases. If the system does not operate as expected or when expected, we may not be able to realize the expected value of the system and this may have a negative effect on our operations, reporting capabilities, profitability and reputation. A governance process has been designed to mitigate this risk.
Length of sales cycle The sales cycle for our products and services is long and unpredictable, ranging from 6 to 18 months for civil aviation applications and from 6 to 24 months or longer for military applications. During the time when customers are evaluating our products and services, we may incur expenses and management time. Making these expenditures in a period that has no corresponding revenue will affect our operating results and could increase the volatility of our share price. We may pre-build certain products in anticipation of orders to come and to facilitate a faster delivery schedule to gain competitive advantage; if orders for those products do not materialize when expected, we have to carry the pre-built product in inventory for a period of time until a sale is realized.
Security and information technology We depend on information technology networks and systems to process, transmit and store electronic data and financial information, to manage business operations and to comply with regulatory, legal, national security, contractual and tax requirements. In addition, our business requires the appropriate and secure utilization of sensitive and confidential information belonging to third parties such as aircraft OEMs and national defence forces. An information technology system failure, cyber-attack or breach of systems security could disrupt our operations, cause the loss of, or unauthorized access to, business information, compromise confidential information, expose us to regulatory investigation and litigation, require significant management attention and resources and could materially and adversely affect our operations, reputation and financial performance. We have implemented security controls, policy enforcement mechanisms and monitoring systems in order to prevent, detect and address potential threats.
CAE Annual Report 2014 | 43

Management’s Discussion and Analysis
9.3 Risks relating to the market
Foreign exchange Our operations are global with approximately 90% of our revenue generated from worldwide exports and international activities generally denominated in foreign currencies, mainly the U.S. dollar, the Euro and the British pound. Our revenue is generated approximately one-third in each of the U.S, Europe and the rest of the world. A significant portion of the revenue generated in Canada is in foreign currencies, while a large portion of our operating costs in Canadian dollars. When the Canadian dollar increases in value, it negatively affects our foreign currency-denominated revenue and hence our financial results. We continue to hold a portfolio of currency hedging positions intended to mitigate the risk to a portion of future revenues presented by the volatility of the Canadian dollar versus foreign currencies. The hedges are intended to cover a portion of the revenue in order to allow the unhedged portion to match the foreign cost component of the contract. It is not possible to completely offset the effects of changing foreign currency values, which leaves some residual exposure that may impact our financial results. When the Canadian dollar decreases in value, it negatively affects our foreign currency-denominated costs and our competitive position compared to other equipment manufacturers in jurisdictions where operating costs are lower. In order to reduce the variability of specific U.S. dollar and Euro-denominated manufacturing costs, we also hedge some of the foreign currency costs incurred in our manufacturing process . Business conducted through our foreign operations are substantially based in local currencies. A natural hedge exists by virtue of revenues and operating expenses being in like currencies. However, changes in the value of foreign currencies relative to the Canadian dollar creates unhedged currency translation exposure since results are consolidated in Canadian dollars for financial reporting purposes. Devaluation of foreign currencies against the Canadian dollar would have a negative translation impact and an appreciation of foreign currencies against the Canadian dollar would have the opposite effect.
Availability of capital Our main credit facility, which was extended in October 2013, is scheduled for renewal in October 2018. We cannot determine at this time whether the credit facility will be renewed at the same cost, for the same duration and on similar terms as were previously available. We also have various debt facilities with maturities until October 2036. We cannot determine at this time whether these facilities will be refinanced at the same cost, for the same durations and on similar terms as were previously available.
Pension plans Pension funding is based on actuarial estimates and is subject to limitations under applicable income tax and other regulations. Actuarial estimates prepared during the year were based on assumptions related to projected employee compensation levels at the time of retirement and the anticipated long-term rate of return on pension plan assets. The actuarial funding valuation reports determine the amount of cash contributions that we are required to contribute into the registered retirement plans. Our latest pension funding reports show the pension plans to be in a solvency deficit position. Therefore, we are required to make cash funding contributions. If this reduced level of pension fund assets persists to the date of the next funding valuations, we will be required to increase our cash funding contributions, reducing the availability of funds for other corporate purposes. Doing business in foreign countries We have operations in 35 countries and sell our products and services to customers around the world. Sales to customers outside North America made up approximately 60% of revenue in fiscal 2014. We expect sales outside North America to continue to represent a significant portion of revenue in the foreseeable future. As a result, we are subject to the risks of doing business internationally, including geopolitical instability. These are the main risks we are facing: − Change in laws and regulations; − Tariffs, embargoes, controls and other restrictions; − General changes in economic and geopolitical conditions; − Complexity and corruption risks of using foreign representatives and consultants.
Income tax laws A substantial portion of our business is conducted in foreign countries and is thereby subject to numerous countries’ tax laws and fiscal policies. A change in applicable tax laws, treaties or regulations or their interpretation could result in a higher effective tax rate on our earnings which could be significant to our financial results. 44 | CAE Annual Report 2014

Management’s Discussion and Analysis
10. RELATED PARTY TRANSACTIONS
A list of principal investments which significantly impact our results or assets is presented in Note 32 of our consolidated financial statements. The following table presents our outstanding balances with joint ventures:
Other assets include a finance lease receivable of $16.9 million (March 31, 2013 - $19.0 million) maturing in October 2022 and carrying an interest rate of 5.14 % per annum, loans receivable of $8.4 million (March 31, 2013 - $10.4 million) maturing in September 2016 and December 2017 and carrying respectively an interest rate of LIBOR 6 month plus 1% and 11% per annum and a long-term receivable of $5.3 million (March 31, 2013 – $4.9 million) with no repayment term. As at March 31, 2014 and 2013, there are no provisions held against any of the receivables from related parties. The following table presents our transactions with joint ventures:
In addition, during fiscal 2014, transactions amounting to $2.7 million (2013 – $4.3 million) were made, at normal market prices, with organizations whose partners or officers included one of our directors. Compensation of key management personnel Key management personnel have the ability and responsibility to make major operational, financial and strategic decisions for the Company and include certain executive officers. The compensation of key management for employee services is shown below:
CAE Annual Report 2014 | 45
(amounts in millions) 2014 2013
Accounts receivable $ 30.1 $ 49.9
Contracts in progress: assets 13.5 41.3
Other assets 30.6 34.3
Accounts payable and accrued liabilities 16.3 25.3
Contracts in progress: liabilities 6.3 9.3
(amounts in millions) 2014 2013
Revenue from products and services $ 101.0 $ 131.5
Purchases of products and services, and other 11.3 12.3
Other income transactions 2.9 2.8
(amounts in millions) 2014 2013
Salaries and other short-term employee benefits $ 3.8 $ 4.0
Post-employment benefits 1.6 2.0
Termination benefits 2.4 -
Share-based payments 6.4 2.4
$ 14.2 $ 8.4

Management’s Discussion and Analysis
11. CHANGES IN ACCOUNTING POLICIES 11.1 New and amended standards adopted Joint arrangements In May 2011, the IASB released IFRS 11, Joint Arrangements , which supersedes IAS 31, Interests in Joint Ventures , and SIC-13, Jointly Controlled Entities – Non-monetary Contributions by Venturers . IFRS 11 focuses on the rights and obligations of a joint arrangement, rather than its legal form as was previously the case under IAS 31. The standard addresses inconsistencies in the reporting for joint arrangements by requiring the equity method to account for interests in jointly controlled entities. We previously accounted for our interests in joint ventures using the proportionate consolidation method and now account for our interest s in joint ventures using the equity method. IFRS 11 was adopted retrospectively effective April 1 st , 2013 in accordance with the transition rules of IFRS 11. Under the equity method, our share of net assets, net income and other comprehensive income (OCI) of joint ventures will be presented as one-line items on the statement of financial position, the statement of income and the statement of comprehensive income, respectively. In addition, the consolidated statement of cash flows includes the cash flows between us and our joint ventures, and not our proportionate share of the joint ventures’ cash flows. We assessed that the classification of our joint arrangements remained the same upon adoption of IFRS 11. When making this assessment , we considered the structure of the arrangements, the legal form of any separate vehicles, the contractual terms of the arrangements and other facts and circumstances. Employee benefits In June 2011, the IASB amended IAS 19, Employee Benefits . IAS 19 was amended to require the calculation of a net interest that is calculated by applying the discount rate to the net defined benefit liability or asset and to expand the disclosure requirements . As a result, we determine d a net interest expense on the net defined benefit liability which is presented as part of the finance expense. The net interest on the defined benefit obligation liability or asset replaces the interest cost on the defined benefit obligation and the expected return on plan assets . The amended IAS 19 was adopted retrospectively effective April 1 st , 2013 in accordance with the transition rules of the amended IAS 19 and additional disclosure is provided in Note 14 of our annual consolidated financial statements. Consolidation In May 2011, the IASB released IFRS 10, Consolidated Financial Statements , which replaces SIC-12, Consolidation – Special Purpose Entities , and parts of IAS 27, Consolidated and Separate Financial Statements . The new standard builds on existing principles by identifying the concept of control as the determining factor in whether an entity should be included in a company’s consolidated financial statements. IFRS 10 was adopted retrospectively effective April 1 st , 2013 in accordance with the transition rules of IFRS 10 . We assessed that the adoption of IFRS 10 does not result in any change in the consolidation status of our subsidiaries. Disclosure of interests in other entities In May 2011, the IASB released IFRS 12, Disclosure of Interests in Other Entities . IFRS 12 requires disclosure for all forms of interests in other entities, including joint arrangements, associates and unconsolidated structured entities. The standard requires an entity to disclose information regarding the nature and risks associated with its interests in other entities and the effects of those interests in its financial position, financial performance and cash flows. IFRS 12 was adopted effective April 1 st , 2013 in accordance with the transition rules of IFRS 12 . The new disclosure pursuant to IFRS 12 is included in our annual consolidated financial statements. Fair value measurement In May 2011, the IASB released IFRS 13, Fair Value Measurement . IFRS 13 defines fair value, sets out in a single IFRS a framework for measuring fair value and requires disclosure about fair value measurements. IFRS 13 applies when other IFRS standards require or permit fair value measurements. It does not extend the use of fair value accounting but provides guidance on how it should be applied when its use is already required or permitted by other standards within IFRS . IFRS 13 was adopted prospectively effective April 1 st , 2013 in accordance with the transitional rules of IFRS 13. Other than additional disclosure which is included in Note 29 , the adoption of IFRS 13 has no significant impact on our consolidated financial statements . Financial statement presentation In June 2011, the IASB amended IAS 1, Financial Statement Presentation, to change the disclosure of items presented in OCI, including a requirement to separate items presented in OCI into two groups based on whether or not they may be recycled to net income in the future. The amendments were adopted effective April 1 st , 2013 in accordance with the transition rules of IAS 1 . The new OCI requirements are presented in our consolidated statement of comprehensive income. Financial instrument disclosures In December 2011, the IASB amended IFRS 7, Financial Instrument: Disclosures , on asset and liability offsetting. The amendment requires additional disclosures illustrating the effect or potential effect of netting arrangements associated with our recognized financial assets and financial liabilities. The amendments were adopted retrospectively effective April 1st, 2013 in accordance with the transition rules of IFRS 7 and the additional disclosure is included in Note 29 of our annual consolidated financial statements . 46 | CAE Annual Report 2014

Management’s Discussion and Analysis Property, plant and equipment In the 2011 Annual Improvements, the IASB amended IAS 16, Property, Plant and Equipment, to clarify when certain assets are property, plant and equipment or inventory. This amendment clarifies that major spare parts and servicing equipment that meet the definition of property, plant and equipment are not inventory. The 2011 annual improvement amendment removes the requirement for spare parts and servicing equipment used only in connection with an item of property, plant and equipment to be classified as property, plant and equipment. This annual improvement was adopted retrospectively effective April 1 st , 2013 in accordance with the transition rules of IAS 16 . The amendment of IAS 16 ha s no impact on our consolidated financial statements. Impairment of non-financial assets In May 2013, the IASB amended IAS 36, Impairment of assets regarding disclosures for non-financial assets. This amendment removed certain disclosures related to the recoverable amount of CGUs which had been included in IAS 36 with the issue of IFRS 13. The amendment is not mandatory until January 1st, 2014, however; we ha ve decided to adopt the amendment as of April 1st, 2013. The following tables summarize the adjustments to our consolidated statement of financial position as at April 1, 2012 and March 31, 2013, and our consolidated statements of income, comprehensive income and cash flows for the year ended March 31, 2013 as a result of those changes in accounting policies:
CAE Annual Report 2014 | 47
Summary reconciliation of financial position IFRS 11 IAS 19 March 31, 2013 IFRS 11 IAS 19 April 1, 2012
(amounts in millions) March 31, 2013 Adjustment Adjustment Restated April 1,
2012 Adjustment Adjustment Restated Assets Cash and cash equivalents $ 293.2 $ (33.2) $ - $ 260.0 $ 287.3 $ (32.6) $ - $ 254.7
Total current assets, excluding cash and cash equivalent 1,040.6 7.0 - 1,047.6 860.8 0.1 - 860.9
Property, plant and equipment 1,498.6 (355.8) - 1,142.8 1,293.7 (300.5) - 993.2
Investment in equity accounted investees - 196.9 - 196.9 - 172.9 - 172.9
Other non-current assets 1,046.3 (2.3) - 1,044.0 741.9 5.3 - 747.2
Total assets $ 3,878.7 $ (187.4) $ - $ 3,691.3 $ 3,183.7 $ (154.8) $ - $ 3,028.9
Liabilities and equity Total current liabilities $ 1,002.8 $ (96.4) $ - $ 906.4 $ 883.4 $ (57.6) $ - $ 825.8
Provisions 8.3 (0.4) - 7.9 6.0 (0.5) - 5.5
Long-term debt 1,097.0 (94.2) - 1,002.8 685.6 (97.2) - 588.4
Royalty obligations 160.6 - - 160.6 161.6 - - 161.6
Employee benefits obligations 136.1 - - 136.1 114.2 - 0.1 114.3
Other non-current liabilities 339.4 (8.3) - 331.1 290.7 (8.8) - 281.9
Total liabilities $ 2,744.2 $ (199.3) $ - $ 2,544.9 $ 2,141.5 $ (164.1) $ 0.1 $ 1,977.5
Equity Share capital $ 471.7 $ - $ - $ 471.7 $ 454.5 $ - $ - $ 454.5
Contributed surplus 21.9 - - 21.9 19.2 - - 19.2
Accumulated other comprehensive loss (16.6) 4.6 - (12.0) (9.8) 3.8 - (6.0)
Retained earnings 625.7 7.3 - 633.0 558.0 5.5 (0.1) 563.4
Equity attributable to equity holders of the Company $ 1,102.7 $ 11.9 $ - $ 1,114.6 $ 1,021.9 $ 9.3 $ (0.1) $ 1,031.1
Non-controlling interests 31.8 - - 31.8 20.3 - - 20.3
Total equity $ 1,134.5 $ 11.9 $ - $ 1,146.4 $ 1,042.2 $ 9.3 $ (0.1) $ 1,051.4
Total liabilities and equity $ 3,878.7 $ (187.4) $ - $ 3,691.3 $ 3,183.7 $ (154.8) $ - $ 3,028.9

Management’s Discussion and Analysis
48 | CAE Annual Report 2014
Reconciliation of net income
Year ended March 31, 2013 As previously IFRS
11 IAS 19 (amounts in millions, except per share amounts) reported Adjustment Adjustment Restated Revenue $ 2,104.5 $ (69.3) $ - $ 2,035.2
Cost of sales 1,482.8 (31.8) (0.6) 1,450.4
Gross profit $ 621.7 $ (37.5) $ 0.6 $ 584.8
Research and development expenses 60.6 (0.5) - 60.1
Selling, general and administrative expenses 269.9 (5.6) 0.2 264.5
Other gains – net (23.4) 1.0 - (22.4)
After tax share in profit of equity accounted investees - (20.1) - (20.1)
Restructuring, integration and acquisition costs 68.9 (0.2) - 68.7
Operating profit $ 245.7 $ (12.1) $ 0.4 $ 234.0
Finance income (7.3) (2.1) - (9.4)
Finance expense 75.5 (6.1) 5.1 74.5
Finance expense – net $ 68.2 $ (8.2) $ 5.1 $ 65.1
Earnings before income taxes $ 177.5 $ (3.9) $ (4.7) $ 168.9
Income tax expense 35.1 (5.7) (1.2) 28.2
Net income $ 142.4 $ 1.8 $ (3.5) $ 140.7
Attributable to: Equity holders of the Company $ 139.4 $ 1.8 $ (3.5) $ 137.7
Non-controlling interests 3.0 - - 3.0
Earnings per share from continuing operations attributable to equity holders of the Company Basic and diluted $ 0.54 $ - $ (0.01) $ 0.53
Weighted average number of shares outstanding (basic) 259.0 - - 259.0
Weighted average number of shares outstanding (diluted) 259.4 - - 259.4
Summary reconciliation of comprehensive income
Year ended March 31, 2013 As previously IFRS 11 IAS 19 (amounts in millions) reported Adjustment Adjustment Restated Net income $ 142.4 $ 1.8 $ (3.5) $ 140.7
Foreign currency translation $ 2.5 $ - $ - $ 2.5
Net changes in cash flow hedge (9.2) 0.8 - (8.4)
Defined benefit plan actuarial losses (22.5) - 3.6 (18.9)
Other comprehensive loss $ (29.2) $ 0.8 $ 3.6 $ (24.8)
Total comprehensive income $ 113.2 $ 2.6 $ 0.1 $ 115.9
Attributable to: Equity holders of the Company $ 110.1 $ 2.6 $ 0.1 $ 112.8
Non-controlling interests 3.1 - - 3.1
$ 113.2 $ 2.6 $ 0.1 $ 115.9
Summary reconciliation of statement of cash flows Year ended March 31, 2013 As previously IFRS 11 IAS 19 (amounts in millions) reported Adjustment Adjustment Restated Cash provided by operating activities $ 204.1 $ (49.6) $ - $ 154.5
Cash used in investing activities (504.9) 71.2 - (433.7)
Cash provided by financing activities 306.7 (22.2) - 284.5

Management’s Discussion and Analysis 11.2 New and amended standards not yet adopted
Financial Instruments In October 2010 , the IASB released I FRS 9 , Financial Instruments . IFRS 9, which is the first part of a three-part project to replace IAS 39, Financial Instruments: recognition and measurement. This first part addresses the classification and measurement of financial assets and financial liabilities. The IASB is considering making limited modifications to this part, which would include the introduction of a fair value through OCI category for debt instruments that would be based on a company’s business model. In November 2013, the IASB released the hedge accounting part, introducing a new hedge accounting model, together with associated disclosures about risk management activity. Impairment of financial assets, the third part of the project, is still under development. Replacing the multiple rules in IAS 39, the first part of IFRS 9 uses a new approach to determine whether a financial asset is measured at amortized cost or fair value and is based on how a company manages its financial instruments and the contractual cash flow characteristics of the financial assets. The majority of the requirements in IAS 39 for classification and measurement of financial liabilities were carried forward in IFRS 9; however, the portion of the changes in fair value related to the company’s own credit risk, in measuring a financial liability at FVTPL, will be presented in OCI rather than in the income statement. The new hedge accounting model represents a substantial overhaul of hedge accounting that will enable companies to better reflect their risk management activities in their financial statements. The initial mandatory effective date of IFRS 9, set for annual periods beginning on or after January 1, 2015, has been removed by the IASB, and a new date will be determined closer to project completion, however, early application is permitted. We are currently evaluating the impact of the standard on our consolidated financial statements. In June 2013, the IASB amended IAS 39 to provide relief from discontinuing hedge accounting when novation of a derivative designated as a hedging instrument meets certain criteria. This amendment will be effective for our fiscal year beginning on April 1, 2014. Similar relief will be included in IFRS 9.
Employee benefits In November 2013, the IASB amended IAS 19, Employee benefits. The amendment simplifies the accounting for contributions to defined benefit plans that are independent of the number of years of employee service, for example, employee contributions that are calculated according to a fixed percentage of salary. The amendment is effective for annual periods beginning on or after January 1, 2015, with earlier application permitted. We are currently evaluating the impact of the amendment on our consolidated financial statements.
11.3 Use of judgements, estimates and assumptions The preparation of the consolidated financial statements requires our management to make judgements, estimates and assumptions that affect the application of accounting policies, the reported amounts of assets and liabilities and disclosures at the date of the consolidated financial statements, as well as the reported amounts of revenues and expenses for the period reported. We also require management to exercise its judgement in applying our accounting policies. The areas involving a high degree of judgement or complexity, or areas where assumptions and estimates are significant to the consolidated financial statements are disclosed below. Actual results could differ from those estimates. Changes will be reported in the period in which they are identified.
Business combinations Business combinations are accounted for in accordance with the acquisition method; thus, on the date that control is obtained. The consideration transferred and the acquiree’s identifiable assets, liabilities and contingent liabilities are measured at their fair value. Depending on the complexity of determining these valuations, we either consult with independent experts or develop the fair value internally by using appropriate valuation techniques which are generally based on a forecast of the total expected future net discounted cash flows. These evaluations are linked closely to the assumptions made by management regarding the future performance of the related assets and the discount rate. Contingent consideration is measured at fair value using a discounted cash flow model based on expected revenues.
Development costs Development costs are recognized as intangible assets and are amortized over their useful lives when they meet the criteria for capitalization. Forecasted revenue and profitability for the relevant projects are used to assess compliance with the capitalization criteria and to assess the recoverable amount of the assets.
CAE Annual Report 2014 | 49

Management’s Discussion and Analysis Impairment of non-financial assets Our impairment test for goodwill is based on internal estimates (level 3) of fair value less costs of disposal calculations and uses valuation models such as the discounted cash flows model. The cash flows are derived from the projections approved by management for the next five years. Cash flow projections take into account past experience and represent management’s best estimate about future developments and form part of our strategic plan approved annually by our Board of Directors. Cash flows after the five-year period are extrapolated using estimated growth rates. Key assumptions which management has based its determination of fair value less costs of disposal include estimated growth rates, post-tax discount rates and tax rates. The post-tax discount rates were derived from the respective cash generating units’ representative weighted average cost of capital which range from 7.5% to 14.0%. These estimates, including the methodology used, can have a material impact on the respective values and ultimately the amount of any goodwill impairment. Likewise, whenever property, plant and equipment and intangible assets are tested for impairment, the determination of the assets’ recoverable amount involves the use of estimates by management and can have a material impact on the respective values and ultimately the amount of any impairment. Revenue recognition The percentage-of-completion method requires us to estimate the work performed to date as a proportion of the total work to be performed. Management conducts monthly reviews of its estimated costs to complete, percentage-of-completion estimates and revenues and margins recognized, on a contract-by-contract basis. The impact of any revisions in cost and earnings estimates is reflected in the period in which the need for a revision becomes known. Defined benefit pension plans The cost of defined benefit pension plans and the present value of the employee benefits obligations are determined using actuarial valuations. Actuarial valuations involve making assumptions about discount rates, future salary increases, mortality rates and future pension increases. All assumptions are reviewed at each reporting date. Any changes in these assumptions will impact the carrying amount of the employee benefits obligations and the cost of the defined benefit pension plans. In determining the appropriated discount rate, management considers the interest rates of high quality corporate bonds that are denominated in the currency in which the benefits will be paid, and that have terms to maturity approximating the terms of the related pension liability. The mortality rate is based on publicly available mortality tables for the specific country. Future salary increases and pension increases are based on expected future inflation rates for the specific country. Other key assumptions for pension obligations are based, in part, on current market conditions. See Note 14 of our consolidated financial statements for further details regarding assumptions used. Government assistance repayments In determining the amount of repayable government assistance, assumptions and estimates are made in relation to discount rates, expected revenues and the expected timing of revenues. Revenue projections take into account past experience and represent management’s best estimate about the future. Revenues after a five-year period are extrapolated using estimated growth rates, ranging from 5% to 9%, over the period of repayments. The estimated repayments are discounted using average rates ranging from 6% to 8.5% based on terms of similar financial instruments. These estimates, along with the methodology used to derive the estimates, can have a material impact on the respective values and ultimately any repayable obligation in relation to government assistance. A 1% increase to the growth rates would increase the royalty obligation at March 31, 2014 by approximately $9.4 million (2013 − $10.2 million). Share-based payments We measure the cost of cash and equity-settled transactions with employees by reference to the fair value of the related instruments at the date at which they are granted. Estimating fair value for share-based payments requires determining the most appropriate valuation model for a grant, which is dependent on the terms and conditions of the grant. This also requires making assumptions and determining the most appropriate inputs to the valuation model including the expected life of the option, volatility and dividend yield. Income taxes We are subject to income tax laws in numerous jurisdictions. Judgement is required in determining the worldwide provision for income taxes. The determination of tax liabilities and assets involve certain uncertainties in the interpretation of complex tax regulations. We provide for potential tax liabilities based on the weighted average probability of the possible outcomes. Differences between actual results and those estimates could have an effect on the income tax liabilities and deferred tax liabilities in the period in which such determinations are made. Deferred tax assets are recognized to the extent that it is probable that taxable profit will be available against the losses that can be utilised. Significant management judgement is required to determine the amount of deferred tax assets that can be recognized, based upon the likely timing and the level of future taxable profits together with future tax planning strategies. The recorded amount of total deferred tax assets could be altered if estimates of projected future taxable income and benefits from available tax strategies are lowered, or if changes in current tax regulations are enacted that impose restrictions on the timing or extent of our ability to utilise future tax benefits. 50 | CAE Annual Report 2014

Management’s Discussion and Analysis
12. CONTROLS AND PROCEDURES The internal auditor reports regularly to management on any weaknesses it finds in our internal controls and these reports are reviewed by the Audit Committee. In accordance with National Instrument 52-109 issued by the Canadian Securities Administrators (CSA), certificates signed by the President and Chief Executive Officer (CEO) and the Chief Financial Officer (CFO) have been filed. These filings certify the appropriateness of our disclosure controls and procedures and the design and effectiveness of the internal controls over financial reporting. 12.1 Evaluation of disclosure controls and procedures Our disclosure controls and procedures are designed to provide reasonable assurance that information is accumulated and communicated to our President and CEO and CFO and other members of management, so we can make timely decisions about required disclosure. Under the supervision of the President and CEO and the CFO, management evaluated the effectiveness of our disclosure controls and procedures, as defined in Rule 13a-15(e) and 15d-15(e) under U.S. Securities Exchange Act of 1934 , as of March 31, 2014. The President and CEO and the CFO concluded from the evaluation that the design and operation of our disclosure controls and procedures were effective as at March 31, 2014, and ensure that information is recorded, processed, summarized and reported within the time periods specified under Canadian and U.S. securities laws.
12.2 Internal control over financial reporting Management is responsible for establishing and maintaining adequate internal controls over financial reporting, as defined in Rule 13a-15(f) and 15d-15(f) under the U.S. Securities Exchange Act of 1934 . Internal control over financial reporting is a process designed to provide reasonable assurance regarding the reliability of financial reporting, and the preparation of consolidated financial statements for external purposes in accordance with IFRS. Management evaluated the design and operation of our internal controls over financial reporting as of March 31, 2014, based on the framework and criteria established in Internal Control – Integrated Framework (1992) issued by the Committee of Sponsoring Organizations of the Treadway Commission (COSO), and has concluded that our internal control over financial reporting is effective. Management did not identify any material weaknesses. There were no changes in our internal controls over financial reporting that occurred during fiscal year 2014 that have materially affected, or are reasonably likely to materially affect, our internal controls over financial reporting.
13. OVERSIGHT ROLE OF AUDIT COMMITTEE AND BOARD OF DIRE CTORS The Audit Committee reviews our annual MD&A and related consolidated financial statements with management and the external auditor and recommends them to the Board of Directors for their approval. Management and our internal auditor also provide the Audit Committee with regular reports assessing our internal controls and procedures for financial reporting. The external auditor reports regularly to management on any weaknesses it finds in our internal control, and these reports are reviewed by the Audit Committee.
14. ADDITIONAL INFORMATION You will find additional information about CAE, including our most recent AIF, on our website at www.cae.com, or on SEDAR at www.sedar.com or on EDGAR at www.sec.gov.
CAE Annual Report 2014 | 51

Management's Discussion and Analysis
15. SELECTED FINANCIAL INFORMATION The following table provides selected quarterly financial information for the years 2012 through to 2014.
52 | CAE Annual Report 2014
(amounts in millions, except per share amounts and exchange rates) Q1 Q2 Q3 Q4 Total Fiscal 2014 Revenue $ 530.4 487.5 513.6 583.4 2,114.9
Net income $ 45.4 38.2 47.6 59.9 191.1
Equity holders of the Company $ 45.6 38.3 46.1 60.0 190.0
Non-controlling interests $ (0.2) (0.1) 1.5 (0.1) 1.1
Basic EPS attributable to equity holders of the Company $ 0.18 0.15 0.18 0.23 0.73
Diluted EPS attributable to equity holders of the Company $ 0.18 0.15 0.18 0.23 0.73
Average number of shares outstanding (basic) 260.2 261.0 261.5 262.7 261.3
Average number of shares outstanding (diluted) 260.2 261.5 262.3 264.0 261.9
Average exchange rate, U.S. dollar to Canadian dollar 1.02 1.04 1.05 1.10 1.05
Average exchange rate, Euro to Canadian dollar 1.34 1.38 1.43 1.51 1.41
Average exchange rate, British pound to Canadian dollar 1.57 1.61 1.70 1.83 1.68
Fiscal 2013 Total Revenue $ 462.2 506.5 500.9 565.6 2,035.2
Net income $ 21.9 35.9 37.2 45.7 140.7
Equity holders of the Company $ 21.5 35.6 37.5 43.1 137.7
Non-controlling interests $ 0.4 0.3 (0.3) 2.6 3.0
Basic EPS attributable to equity holders of the Company $ 0.08 0.14 0.14 0.17 0.53
Diluted EPS attributable to equity holders of the Company $ 0.08 0.14 0.14 0.17 0.53
Average number of shares outstanding (basic) 258.4 258.7 259.2 259.7 259.0
Average number of shares outstanding (diluted) 258.6 259.0 259.5 260.2 259.4
Average exchange rate, U.S. dollar to Canadian dollar 1.01 1.00 0.99 1.01 1.00
Average exchange rate, Euro to Canadian dollar 1.30 1.25 1.29 1.33 1.29
Average exchange rate, British pound to Canadian dollar 1.60 1.57 1.59 1.57 1.58
Fiscal 2012 1 Total Revenue $ 427.9 433.5 453.1 506.7 1,821.2
Net income $ 43.5 38.7 46.1 53.7 182.0
Equity holders of the Company $ 43.1 38.4 45.6 53.2 180.3
Non-controlling interests $ 0.4 0.3 0.5 0.5 1.7
Basic EPS attributable to equity holders of the Company $ 0.17 0.15 0.18 0.21 0.70
Diluted EPS attributable to equity holders of the Company $ 0.17 0.15 0.18 0.21 0.70
Average number of shares outstanding (basic) 257.0 257.3 257.6 257.9 257.5
Average number of shares outstanding (diluted) 258.0 258.0 258.0 258.6 258.2
Average exchange rate, U.S. dollar to Canadian dollar 0.97 0.98 1.02 1.00 0.99
Average exchange rate, Euro to Canadian dollar 1.39 1.38 1.38 1.31 1.37
Average exchange rate, British pound to Canadian dollar 1.58 1.58 1.61 1.57 1.58
(1) Figures have not been restated to reflect the adoption of IFRS 11 and IAS 19. Refer to Changes in accounting policies for further details.

Management's Discussion and Analysis
CAE Annual Report 2014 | 53
Selected segment information (amounts in millions, except operating margins) Q4-2014 Q4-2013 FY2014 FY2013 FY2012 1
Civil segments Simulation Products/Civil Revenue $ 125.1 $ 143.4 $ 461.4 $ 456.8 $ 342.5 Segment operating income 21.1 25.8 83.5 88.2 51.6 Operating margins (%) 16.9 18.0 18.1 19.3 15.1 Training & Services/Civil Revenue 198.4 176.1 715.3 659.8 498.4 Segment operating income 36.9 24.9 96.3 100.7 122.2 Operating margins (%) 18.6 14.1 13.5 15.3 24.5 Total Civil segments Revenue $ 323.5 $ 319.5 $ 1,176.7 $ 1,116.6 $ 840.9 Segment operating income 58.0 50.7 179.8 188.9 173.8 Operating margins (%) 17.9 15.9 15.3 16.9 20.7 Military segments Simulation Products/Military Revenue $ 140.5 $ 153.1 $ 529.3 $ 562.5 $ 619.2 Segment operating income 19.3 19.4 77.4 80.0 101.2 Operating margins (%) 13.7 12.7 14.6 14.2 16.3 Training & Services/Military Revenue 89.8 64.0 292.7 244.0 278.1 Segment operating income 8.7 8.8 30.4 27.4 40.9 Operating margins (%) 9.7 13.8 10.4 11.2 14.7 Total Military segments Revenue $ 230.3 $ 217.1 $ 822.0 $ 806.5 $ 897.3 Segment operating income 28.0 28.2 107.8 107.4 142.1 Operating margins (%) 12.2 13.0 13.1 13.3 15.8 New Core Markets segment Revenue $ 29.6 $ 29.0 $ 116.2 $ 112.1 $ 83.0 Segment operating income (loss) 0.2 1.8 4.2 6.4 (13.8) Operating margins (%) 0.7 6.2 3.6 5.7 - Total Revenue $ 583.4 $ 565.6 $ 2,114.9 $ 2,035.2 $ 1,821.2 Segment operating income 86.2 80.7 291.8 302.7 302.1 Operating margins (%) 14.8 14.3 13.8 14.9 16.6
Other $ - $ (13.8) $ - $ (68.7) $ - Operating profit $ 86.2 $ 66.9 $ 291.8 $ 234.0 $ 302.1
(1) Figures have not been restated to reflect the adoption of IFRS 11 and IAS 19. Refer to Changes in accounting policies for further details.

Management's Discussion and Analysis
54 | CAE Annual Report 2014
Selected annual information for the past five years
(amounts in millions, except per share amounts) 2014 2013 2012 1 2011 1
IFRS Revenue $ 2,114.9 $ 2,035.2 $ 1,821.2 $ 1,630.8
Net income 191.1 140.7 182.0 160.9
Equity holders of the Company 190.0 137.7 180.3 160.3
Non-controlling interests 1.1 3.0 1.7 0.6
Average exchange rate, U.S. dollar to Canadian dollar 1.05 1.00 0.99 1.02
Average exchange rate, Euro to Canadian dollar 1.41 1.29 1.37 1.34 Average exchange rate, British pound to Canadian dollar 1.68 1.58 1.58 1.58
Financial position: Total assets $ 4,236.7 $ 3,691.3 $ 3,183.7 $ 2,817.3
Total non-current financial liabilities 2 1,340.2 1,209.3 869.0 757.5
Total net debt 856.2 813.4 534.3 383.8
Per share: Basic EPS attributable to equity holders of the Company $ 0.73 $ 0.53 $ 0.70 $ 0.62
Diluted EPS attributable to equity holders of the Company 0.73 0.53 0.70 0.62
Dividends 0.22 0.19 0.16 0.15
Total equity 5.67 4.43 4.05 3.63
(amounts in millions, except per share amounts) 2010
Previous Canadian GAAP Revenue $ 1,526.3
Earnings from continuing operations 144.5
Net earnings 144.5
Average exchange rate, U.S. dollar to Canadian dollar 1.09
Average exchange rate, Euro to Canadian dollar 1.54 Average exchange rate, British pound to Canadian dollar 1.74
Financial position: Total assets $ 2,621.9
Total non-current financial liabilities 2 457.0
Total net debt 179.8
Per share: Basic earnings from continuing operations $ 0.56
Diluted earnings from continuing operations 0.56
Basic net earnings 0.56
Diluted net earnings 0.56
Basic dividends 0.12
Shareholders' equity 4.52
(1) Figures have not been restated to reflect the adoption of IFRS 11 and IAS 19. Refer to Changes in accounting policies for more details. (2) Includes long-term debt, long-term derivative liabilities and other long-term liabilities meeting the definition of a financial liability.

Consent of Independent Auditor
We hereby consent to the inclusion in this Annual Report on Form 40-F for the year ended March 31, 2014 of CAE Inc. of our report dated May 15, 2014, relating to the consolidated financial statements, and the effectiveness of internal control over financial reporting, which appears in the Exhibit incorporated by reference in this Annual Report.
We also consent to the incorporation by reference in the Registration Statements on Form S-8 (No.
333 – 97185 and 333 - 155366) of CAE Inc. of our report dated May 15, 2014 referred to above.
Montreal, Quebec June 26, 2014
1 CPA auditor, CA, public accountancy permit No.A123498
PricewaterhouseCoopers LLP
1250 René-Levesque Boulevard West, Montréal, Québec, Canada H3B 2G4 T: +1 514 205 5000, F: +1 514 205 5675, www.pwc.com/ca
“PwC” refers to PricewaterhouseCoopers LLP, an Ontario limited liability partnership.

CERTIFICATION REQUIRED BY RULE 13a-14(a) OR RULE 15 d-14(a), PURSUANT TO SECTION 302 OF THE SARBANES-OXLEY ACT
OF 2002
I, Marc Parent, certify that:
1. I have reviewed this annual report on Form 40-F of CAE Inc.;
2. Based on my knowledge, this report does not contain any untrue statement of a material fact or omit to state a material fact necessary to make the statements made, in light of the circumstances under which such statements were made, not misleading with respect to the period covered by this report;
3. Based on my knowledge, the financial statements, and other financial information included in this report, fairly present in all material respects the financial condition, results of operations and cash flows of the issuer as of, and for, the periods presented in this report;
4. The issuer’s other certifying officer and I are responsible for establishing and maintaining disclosure controls and procedures (as defined in Exchange Act Rules 13a-15(e) and 15d-15(e)) and internal control over financial reporting (as defined in Exchange Act Rules 13a-15(f) and 15d-15(f)) for the issuer and have:
(a) designed such disclosure controls and procedures, or caused such disclosure controls and procedures to be designed under our supervision, to ensure that material information relating to the issuer, including its consolidated subsidiaries, is made known to us by others within those entities, particularly during the period in which this report is being prepared;
(b) designed such internal control over financial reporting, or caused such internal control over financial reporting to be designed under our supervision, to provide reasonable assurance regarding the reliability of financial reporting and the preparation of financial statements for external purposes in accordance with generally accepted accounting principles;
(c) evaluated the effectiveness of the issuer’s disclosure controls and procedures and presented in this report our conclusions about the effectiveness of the disclosure controls and procedures, as of the end of the period covered by this report based on such evaluation; and
(d) disclosed in this report any change in the issuer’s internal control over financial reporting that occurred during the period covered by the annual report that has materially affected, or is reasonably likely to materially affect, the issuer’s internal control over financial reporting; and
5. The issuer’s other certifying officer and I have disclosed, based on our most recent evaluation of internal control over financial reporting, to the issuer’s auditors and the audit committee of the issuer’s board of directors (or persons performing the equivalent functions):

(a) all significant deficiencies and material weaknesses in the design or operation of internal control over financial reporting which are
reasonably likely to adversely affect the issuer’s ability to record, process, summarize and report financial information; and
(b) any fraud, whether or not material, that involves management or other employees who have a significant role in the issuer’s internal control over financial reporting.
Date: June 27, 2014
/s/ Marc Parent Name: Marc Parent Title: President and Chief Executive Officer

CERTIFICATION REQUIRED BY RULE 13a -14(a) OR RULE 15d-14(a), PURSUANT TO SECTION 302 OF THE SARBANES-OXLEY ACT OF 2002
I, Stéphane Lefebvre, certify that:
1. I have reviewed this annual report on Form 40-F of CAE Inc.;
2. Based on my knowledge, this report does not contain any untrue statement of a material fact or omit to state a material fact necessary to make the statements made, in light of the circumstances under which such statements were made, not misleading with respect to the period covered by this report;
3. Based on my knowledge, the financial statements, and other financial information included in this report, fairly present in all material respects the financial condition, results of operations and cash flows of the issuer as of, and for, the periods presented in this report;
4. The issuer’s other certifying officer and I are responsible for establishing and maintaining disclosure controls and procedures (as defined in Exchange Act Rules 13a-15(e) and 15d-15(e)) and internal control over financial reporting (as defined in Exchange Act Rules 13a-15(f) and 15d-15(f)) for the issuer and have:
(a) designed such disclosure controls and procedures, or caused such disclosure controls and procedures to be designed under our supervision, to ensure that material information relating to the issuer, including its consolidated subsidiaries, is made known to us by others within those entities, particularly during the period in which this report is being prepared;
(b) designed such internal control over financial reporting, or caused such internal control over financial reporting to be designed under our supervision, to provide reasonable assurance regarding the reliability of financial reporting and the preparation of financial statements for external purposes in accordance with generally accepted accounting principles;
(c) evaluated the effectiveness of the issuer’s disclosure controls and procedures and presented in this report our conclusions about the effectiveness of the disclosure controls and procedures, as of the end of the period covered by this report based on such evaluation; and
(d) disclosed in this report any change in the issuer’s internal control over financial reporting that occurred during the period covered by the annual report that has materially affected, or is reasonably likely to materially affect, the issuer’s internal control over financial reporting; and

5. The issuer’s other certifying officer and I have disclosed, based on our most recent evaluation of internal control over financial reporting, to the
issuer’s auditors and the audit committee of the issuer’s board of directors (or persons performing the equivalent functions):
(a) all significant deficiencies and material weaknesses in the design or operation of internal control over financial reporting which are reasonably likely to adversely affect the issuer’s ability to record, process, summarize and report financial information; and
(b) any fraud, whether or not material, that involves management or other employees who have a significant role in the issuer’s internal control over financial reporting.
Date: June 27, 2014
/s/ Stéphane Lefebvre Name: Stéphane Lefebvre Title: Vice President, Finance and
Chief Financial Officer

CERTIFICATION REQUIRED BY PURSUANT TO 18 U.S.C. SECTION 1350,
AS ENACTED PURSUANT TO SECTION 906 OF THE U.S. SARBANES-OXLEY ACT OF 2002
CAE Inc. (the “Company”) is filing with the U.S. Securities and Exchange Commission on the date hereof, its annual report on Form 40-F for the fiscal year ended March 31, 201 4 (the “Report”).
I, Marc Parent, President and Chief Executive Officer of the Company, certify, pursuant to 18 U.S.C. section 1350, as enacted pursuant to section 906 of the U.S. Sarbanes-Oxley Act of 2002, that:
(i) the Report fully complies with the requirements of section 13(a) or 15(d) of the U.S. Securities Exchange Act of 1934; and
(ii) the information contained in the Report fairly presents, in all material respects, the financial condition and results of operations of the Company.
/s/ Marc Paren Marc Parent President and Chief Executive Officer Date: June 27 , 201 4

CERTIFICATION PURSUANT TO 18 U.S.C. SECTION 1350,
AS ENACTED PURSUANT TO SECTION 906 OF THE U.S. SARBANES-OXLEY ACT OF 2002
CAE Inc. (the “Company”) is filing with the U.S. Securities and Exchange Commission on the date hereof, its annual report on Form 40-F for the fiscal year ended March 31, 201 4 (the “Report”).
I, Stéphane Lefebvre, Vice President, Finance and Chief Financial Officer of the Company, certify, pursuant to 18 U.S.C. section 1350, as enacted pursuant to section 906 of the U.S. Sarbanes-Oxley Act of 2002, that:
(i) the Report fully complies with the requirements of section 13(a) or 15(d) of the U.S. Securities Exchange Act of 1934; and
(ii) the information contained in the Report fairly presents, in all material respects, the financial condition and results of operations of the Company.
/s/ Stéphane Lefebvre Stéphane Lefebvre Vice President, Finance and Chief Financial Officer Date: June 27 , 201 4