Catalytic C–C coupling through C–H arylation of arenes or heteroarenes
Upload
khangminh22Category
view
0download
0
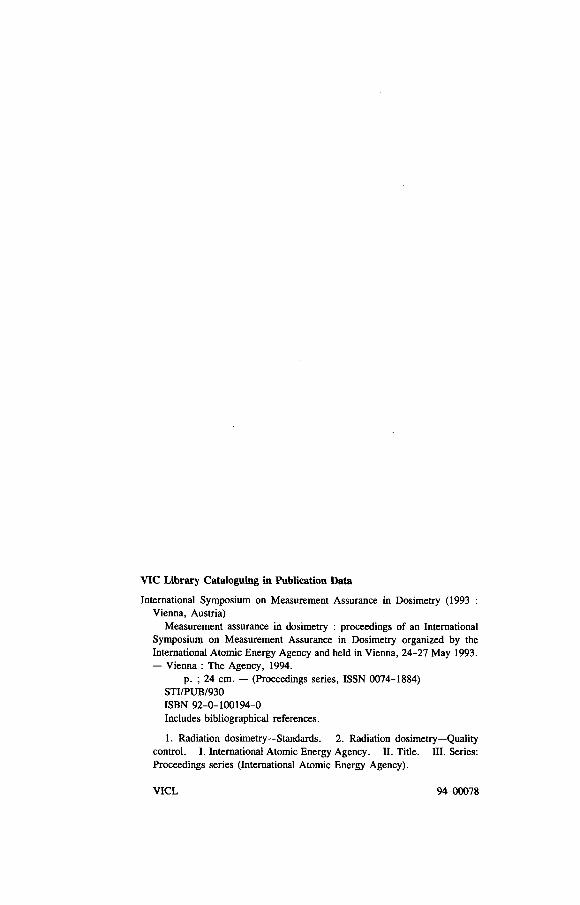
In te rn a t io n a l M e a s u r e m e n t S y s t e m
PrimaryB I P M
QAP S D L sStandards
1 ' t ...............i
---------------C a l i b r a t i o n s ! **«.
У
Secondary I A E A QAS S D L sStandards S S D L
- _______QA Calibrations ^ ---------------
Field U s e r sInstruments (Radiotherapy
Centres)

MEASUREMENT ASSURANCE IN DOSIMETRY

The following States are Members of the International Atomic Energy Agency:
A FG H ANISTAN H AITI PA N A M A
A LB A N IA H O LY SEE PA R A G U A Y
ALG ERIA H U NG ARY PERU
A R G EN TIN A ICELAND PHILIPPINES
AR M E N IA IN D IA PO LAND
AU STR ALIA INDONESIA PORTUGAL
AUSTR IA IR AN , ISLAM IC REPUBLIC OF Q A TA R
BANGLADESH IRAQ R O M AN IA
BELARUS IRELAND RUSSIAN FEDERATION
BELGIUM ISRAEL SAUDI ARABIA
BO LIV IA IT A L Y SENEGAL
BR AZIL JAM AICA SIERRA LEONE
BULG ARIA JAPAN SINGAPORE
CAM BODIA JORDAN SLO VAK IA
CAM EROON KAZAK H STAN SLOVENIA
C A N AD A K E N YA SOUTH AFR ICA
CHILE KOREA, REPUBLIC OF SPAIN
CH INA K U W AIT SRI LA N K A
COLOM BIA LEBANON SUDAN
COSTA RICA LIBERIA SWEDEN
COTE D 'IVO IRE LIB YA N ARAB JAM AH IR IYA SW ITZER LAND
CRO ATIA LIECHTENSTEIN S YR IAN AR AB REPUBLIC
CUBA LIT H U A N IA T H A ILA N D
CYPRUS LUXEMBOURG TU NISIA
CZECH REPUBLIC M AD AG ASCAR TU RKE Y
DEM OCRATIC PEOPLE’S M A L A Y S IA U GANDA
REPUBLIC OF KOREA M A LI UKRAINE
DENM ARK M AR SH ALL ISLANDS UNITED ARAB EMIRATES
DO M INICAN REPUBLIC M AURITIUS UNITED KINGDOM OF GREAT
ECUADOR MEXICO BR ITAIN A N D NORTHERN
EG YPT M ONACO IRELAND
EL SALVAD O R M ONGOLIA UNITED REPUBLIC OF TANZA1
ESTONIA MOROCCO UNITED STATES OF AM ERICA
ETHIOPIA M Y A N M A R U RU G U AY
F IN LA N D NAM IB IA UZBEKISTAN
FRANCE NETHERLANDS VENEZUELA
GABON NEW ZE ALAN D V IE T NAM
G E RM AN Y N ICARAG U A YU G O SLAV IA
G H AN A NIGER ZAIRE
GREECE NIGERIA ZAM B IA
G U A TE M A LA N O R W AY ZIM BABW E
PAKISTAN
T h e A g e n c y ’ s S ta tu te w a s a p p ro v e d o n 2 3 O c to b e r 1 9 5 6 b y th e C o n fe re n c e o n th e S ta tu te o f th e
I A E A h e ld a t U n i t e d N a t io n s H e a d q u a r te r s , N e w Y o r k ; i t e n te re d in to fo r c e o n 2 9 J u ly 1 9 5 7 . T h e H e a d
q u a r te r s o f th e A g e n c y a re s itu a te d in V ie n n a . I ts p r in c ip a l o b je c t iv e is “ t o a c c e le ra te a n d e n la rg e th e c o n t r i b u t io n o f a to m ic e n e rg y to p e a c e , h e a lth a n d p r o s p e r i t y th r o u g h o u t th e w o r ld ” .
© I A E A , 1 9 9 4
P e r m is s io n to r e p ro d u c e o r t ra n s la te th e in f o r m a t io n c o n ta in e d in t h is p u b l ic a t io n m a y b e
o b ta in e d b y w r i t i n g to th e I n te r n a t io n a l A t o m ic E n e rg y A g e n c y , W a g ra m e r s t ra s s e 5 , P .O . B o x 1 0 0 ,
A - 1 4 0 0 V ie n n a , A u s t r ia .
P r in te d b y th e I A E A in A u s t r ia
M a y 1 9 9 4
S T I /P U B / 9 3 0

PROCEEDINGS SERIES
MEASUREMENT ASSURANCE IN DOSIMETRY
PROCEEDINGS OF AN INTERNATIONAL SYMPOSIUM ON MEASUREM ENT ASSURANCE IN DOSIM ETRY
ORGANIZED B Y THE INTERNATIONAL ATOMIC ENERGY AGENCY
AND HELD IN VIENNA, 24 -27 M AY 1993
INTERNATIONAL ATOMIC ENERGY AGENCY VIENNA, 1994
V IC L ib r a r y C a ta lo g u in g in P u b lic a tio n D a ta
International Symposium on Measurement Assurance in Dosimetry (1993 : Vienna, Austria)
Measurement assurance in dosimetry : proceedings o f an International Symposium on Measurement Assurance in Dosimetry organized by the International Atomic Energy Agency and held in Vienna, 24-27 May 1993. — Vienna : The Agency, 1994.
p. ; 24 cm. — (Proceedings series, ISSN 0074-1884) STI/PUB/930 ISBN 92-0-100194-0 Includes bibliographical references.
1. Radiation dosimetry—Standards. 2. Radiation dosimetry—Quality control. I. International Atomic Energy Agency. П. Title. Ш. Series: Proceedings series (International Atomic Energy Agency).
V IC L 94-00078

FOREWORD
The uses o f radiation in medicine and industry are today wide in scope and diversity and there is a need for reliable dosimetry in most applications. In particular, high accuracy in dosimetry is required in the therapeutic use o f radiation. Consequently, calibration procedures for radiotherapy generally meet also the accuracy requirements for applications in other fields, such as diagnostic radiology, radiation protection and industrial radiation processing. The emphasis at this symposium was therefore mainly on radiotherapy dosimetry, but the meeting also included one session devoted to dosimetry in diagnostic radiology.
Radiotherapy is increasing in importance as a modality for cancer treatments. In a large number o f countries, as many as 50-60% of cancer patients receive radiation treatment. This implies that in some advanced countries about 1 person in 6 of the present population will be treated with radiation. Also, in developing countries cancer is now becoming an important health problem as communicable diseases are gradually being controlled.
The International Commission on Radiation Units and Measurements concluded in 1974 that available evidence indicated the need for an accuracy of ± 5 % in the delivery of absorbed dose to a target volume if eradication of the primary tumour was sought. However, the absorbed dose determination includes many steps and the uncertainty in each step must be very small to achieve the required accuracy in the complete procedure.
The first step in this procedure is to establish primary standards for those radiation quantities used in radiotherapy dosimetry (absorbed dose to water, air kerma and exposure). Several o f the papers at the symposium discussed the status o f these primary standards in different countries as well as intercomparisons between primary standards. Primary standards are, however, only available in a few countries. The International Atomic Energy Agency, in co-operation with the World Health Organization, has therefore established a network of Secondary Standard Dosimetry Laboratories (SSDLs) which now includes 72 laboratories in 53 countries. These SSDLs can provide users with dosimeter calibrations traceable to a primary standard. One important role for the IAEA is to carry out a quality assurance programme for the SSDLs in order to improve coherence and accuracy in dosimetry. The activities o f some of the SSDLs were covered at the meeting. On the final day o f the symposium, the practical procedure of using a calibrated ionization chamber to determine the absorbed dose at a point in a water phantom in the user’s beam was discussed.
The complete dosimetry procedure in therapy also includes determination of the dose distribution in the patient. This latter aspect was dealt with at a congress in Prague, organized by the European Society for Therapeutic Radiology and Oncology, which was held directly after the symposium.
The interest in the field of radiotherapy dosimetry is demonstrated by the large number of papers submitted to these two meetings, in all more than two hundred, about one third of which were presented in Vienna.
EDITORIAL NOTE
The Proceedings have been edited by the editorial staff of the IAEA to the extent considered necessary for the reader’s assistance. The views expressed remain, however, the responsibility of the named authors or participants. In addition, the views are not necessarily those of the governments of the nominating Member States or of the nominating organizations.
Although great care has been taken to maintain the accuracy of information contained in this publication, neither the IAEA nor its Member States assume any responsibility for consequences which may arise from its use.
The use of particular designations of countries or territories does not imply any judgement by the publisher, the IAEA, as to the legal status of such countries or territories, of their authorities and institutions or of the delimitation of their boundaries.
The mention of names of specific companies or products (whether or not indicated as registered) does not imply any intention to infringe proprietary rights, nor should it be construed as an endorsement or recommendation on the part of the IAEA.
The authors are responsible for having obtained the necessary permission for the IAEA to reproduce, translate or use material from sources already protected by copyrights.
Material prepared by authors who are in contractual relation with governments is copyrighted by the IAEA, as publisher, only to the extent permitted by the appropriate national regulations.

C O N T E N T S
STATUS OF PRIMARY STANDARDS FOR ABSORBED DOSE, EXPOSURE AND KERMA (Session 1)
Metrology, a precursor o f quality assurance (IAEA-SM-330/68) ..................... 3A. Allisy
Comparisons and calibrations at the Bureau international des poidset mesures in the field of X and y rays (IAEA-SM-330/22) ......................... 15M. Boutillon, A.-M. Perroche
Status o f the primary standard of water absorbed dose for high energyphoton and electron radiation at the PTB (IAEA-SM-330/45) ...................... 25M. Roos, K. Hohlfeld
Absorbed dose measurements at the Netherlands Measurements Institute(IAEA-SM-330/66) ........................................................................................................ 35T. W.M. Grimbergen, E. van Dijk
Study of correction factors and the relative heat defect o f a water calorimetric determination of absorbed dose to water in high energy photon beams(IAEA-SM-330/6) ......................................................................................................... 45J. Seuntjens, A. Van der Plaetsen, K. Van Laere, H. Thierens
An NPL absorbed dose calibration service for electron beam radiotherapy(IAEA-SM-330/34) ........................................................................................................ 61D.T. Bum s, M.R. McEwen, A.J. Williams
The NPL absorbed dose to water calibration service for high energy photons(IAEA-SM-330/35) ........................................................................................................ 73K.E. Rosser, B. Owen, A.R. DuSautoy, D.H . Pritchard,I. Stoker, C.J. В rend
New approach for establishing a primary standard of air kerma in a 60Co7 ray beam (IAEA-SM-330/37) ............................................................................... 83B. Chauvenet, F. Delaunay, J.P. Simoën
INTERCOMPARISON, DISSEMINATION AND TRANSFER (Session 2)
Comparison of primary water absorbed dose standards(IAEA-SM-330/48) ........................................................................................................ 95M. Boutillon, B.M. Coursey, K. Hohlfeld, B. Owen, D .W .O . Rogers
Comparison of exposure standards in the energy region 5-35 keV forX radiation (IAEA-SM-330/7) .................................................................................. 113D. Olejár, O. Kodl, I. Zachariásová, J. Pacholík
Intercomparison of the UK and Swiss primary standards o f X ray exposureand air kerma for 50 kV X rays (IAEA-SM-330/36) ...................................... 119C.J. M oretti, J.A. Heaton, G. Stucki, S. Duane
The long term stability o f the NE type 2561 therapy level secondarystandard ionization chamber (IAEA-SM-330/75) ............................................... 131C.J. M oretti, R.F. Angliss, P.J. O ’Neil
Intercomparison of dose determination as a means of dose qualityassurance in hospital dosimetry (IAEA-SM-330/47) ......................................... 141M .K.H. Schneider
Dosimetric intercomparison of high energy radiotherapy units(IAEA-SM-330/27) ........................................................................................................ 151S. Papadópulos, R. González, E. Dorda, E. Bof, M. Saravi
Intercomparison programme of absorbed dose measurement for 60Coteletherapy units in Turkey (IAEA-SM-330/32) ................................................. 157N. Kiyak, S. Ya$ar, H. Alkan
Dissemination, transfer and intercomparison in radiotherapy dosimetry:The IAEA concept (IAEA-SM-330/69) ................................................................ 165H. Svensson, K. Zsdânszky, P. Nette
IAEA/WHO TLD radiotherapy dosimetry intercomparison for Australia(IAEA-SM-330/70) ........................................................................................................ 177R.B. Huntley, P. Bera, P. Nette
CALIBRATIONS AND QUALITY ASSURANCE PROGRAMMES (Session 3)
Quality assurance and calibration programmes at the SecondaryStandard Dosimetry Laboratory, India (IAEA-SM-330/16) ........................... 193S.C. M isra, A. Kannan, S.B. Naik, P.N .M .R. Vijayam, V.S. Patki
Establishment o f a new Secondary Standard Dosimetry Laboratoryin Prague (IAEA-SM-330/58) ................................................................................... 201J. Novotny, A. Burian, I. Kovár, R. Wágner
Maintenance and dissemination of the radiation exposure standards at theNational Radiation Laboratory, New Zealand (IAEA-SM-330/25) ............. 209K G . Smyth
Stability of ionization chamber instruments: Experience with recalibrationand constancy testing (IAEA-SM-330/40) ............................................................ 217H. Jàrvinen, A. Kosunen, E. Rantanen

Performance tests for dosimeters applied in radiotherapy(IAEA-SM-330/15) ........................................................................................................ 233Kaibao Li, Shian Zhao, Jinsheng Cheng, Zhaoluo Zhao
Uncertainties at the end point of the basic dosimetry chain(IAEA-SM-330/18) ........................................................................................................ 239D.I. Thwaites
The accuracy of delivery of radiotherapy as deduced from extensivequality assurance (IAEA-SM-330/57) ..................................................................... 257E.G. Aird, C. Williams, G.T. M ott
Quality assurance of therapy level measurements at the Secondary StandardDosimetry Laboratory, Sofia (IAEA-SM-330/3) ............................................... 267V. Penchev, Z. Bouchakliev, B. Constantinov, R. Poppitz, K. Ivanova
DOSE, VOLUME AND QUALITY SPECIFICATIONS (Session 4)
ICRU recommendations on “ Dose and Volume Specification forReporting Interstitial Therapy” (IAEA-SM-330/63) ......................................... 277A. Dutreix, D. Chassagne, D. Ash, W.F. Hanson,A.G. Visser, J.F. Wilson, A. Wambersie
Measurements of energy spectra from high dose rate 192Ir sourceswith a Compton scattering spectrometer (IAEA-SM-330/28) ........................ 289H. Nilsson, G. Matscheko, E. Lund, G. Aim Carlsson
Beam quality specifications of photon beams (IAEA-SM-330/54) ..................... 299M. Karls son, H. Nystrorn
A test o f TPRfo as a beam quality specifier for high energy photon beams(IAEA-SM-330/10) ........................................................................................................ 309C.K. Ross, K.R. Shortt, D .W .O . Rogers, F. Delaunay
Determination of radiation quality parameters for high energy photonsand electrons using different types o f detectors (IAEA-SM-330/46) .............. 323K. Derikum, M. Roos
INTERACTION COEFFICIENTS AND CORRECTION FACTORS (Session 5)
Improved calculations o f stopping power ratios and their correlationwith the quality o f therapeutic photon beams (IAEA-SM-330/62) ................ 335P. Andreo
Depth and field size dependence o f ratios of mass energy absorption coefficient, water to air, for kilovoltage X ray dosimetry(IAEA-SM-330/17) ........................................................................................................ 361R.T. Knight, A.E. Nahum

Monte Cario calculated correction factors for an NE 2571 chamberin medium energy photon beams (IÀEA-SM-330/5) ....................................... 371Chang-Ming Ma, A.E. Nahum
Energy expended to create an ion pair as a factor dependent on radiationquality (IAEA-SM-330/74) ......................................................................................... 383M. Zielczyñski, N. Golnik
APPLICATION OF DIFFERENT PROTOCOLS FOR ABSORBED DOSE DETERMINATION (Session 6)
Current status o f dosimetry protocols for megavoltage electron beams(IAEA-SM-330/19) ........................................................................................................ 395D .l. Thwaites
Investigation of some aspects o f the IAEA Code of Practice for absorbeddose determination in photon and electron beams (IAEA-SM-330/61) .. . . 411 A. Leitner, W. Tiefenbôck, J. Witzani, C. Strachotinsky
The increase of accuracy in radiation dosimetry resulting from applicationof the IAEA Code of Practice (IAEA-SM-330/21) ......................................... 419C. Milu
Calibration of electron beams at Chulalongkorn Hospital, Bangkok(IAEA-SM-330/51) ........................................................................................................ 427S. Suriyapee, S. Kanokjiraporn, S. Srimanoroth, D. Leelasomsiri
Comparison of two standard dosimetry protocols for output calibration of^Co teletherapy machines (IAEA-SM-330/38) .................................................. 435C. Tannanonta, V. Boonkitticharoen, T. Layangkul, R. Pirabul
Dose measurements in high energy photon and electron beams using an ionization chamber: Intercomparison between the Italian Protocoland a well tried routine procedure (IAEA-SM-330/67) ................................... 443S. Belletti, A. Fiume, L. Verzeletti, A. Bozza, A. Cavallin
Consistent formalism for kilovoltage X ray dosimetry(IAEA-SM-330/24) ........................................................................................................ 451A.E. Nahum, R.T. Knight
PLANE PARALLEL CHAMBERS (Session 7)
Calibration of parallel plate ionization chambers: Status o f the AmericanAssociation of Physicists in Medicine Protocol (IAEA-SM-330/60) .......... 463P.R. Almond
Plane parallel chambers in electron beams: Monte Carlo findings onthe perturbation factor (IAEA-SM-330/71) .......................................................... 481Chang-Ming Ma, A.E. Nahum

Investigation of the new prototype NPL design of plane parallel chamber(IAEA-SM-330/4) .......................................................................................................... 495Chang-Ming Ma, A.E. Nahum
Optimum calibration of NACP type plane parallel ionization chambers for absorbed dose determination in low energy electron beams(IAEA-SM-330/41) .................................................................................... .................. 505A. Kosunen, H. Jarvinen, P. Sipila
Comparison of three parallel plate ionization chambers for high energyelectron dosimetry (IAEA-SM-330/65) .................................................................. 515U.F. Rosenow, G. Kasten, T. Thienel
BEAM QUALITY DEPENDENCE (Session 8)
Beam quality dependence of IAEA TLDs irradiated in a standardizedgeometry (IAEA-SM-330/72) ..................................................................................... 527H. Nystrom, P. Bera, P. Nette
Intercomparison measurements o f absorbed dose for high energy photon andelectron beams (IAEA-SM-330/50) ......................................................................... 541M .A.H. El-Fiki, M.A. Sharaf, A.M. Kasem
Dosimetry of small and irregularly shaped electron beams for theVarían Clinac 18 linear accelerator (IAEA-SM-330/49) ...... .......................... 547G. Hakin, S. Faermann, Y. Krutman, A. Kushilevski
Thermoluminescent dosimeter response in high energy photon andelectron beams (IAEA-SM -330/26) ......................................................................... 555G. Olivera, R. Sansogne, S. Papadópulos, M. Saravi
DIRECT CALIBRATION IN ABSORBED DOSE TO WATER (Session 9)
Towards a dosimetry system based on absorbed dose standards(IAEA-SM-330/9) .......................................................................................................... 565D .W .O . Rogers, C.K. Ross, K.R. Shortt, N.V. Klassen, A.F. Bielajew
Absorbed dose calibration for high energy X rays: A new service forSecondary Standard Dosimetry Laboratories? (IAEA-SM-330/30) ............. 581A. Meghzifene, M. Arib, R. Guidoum
Application of the calibration for absorbed dose to water for high energyphotons (IAEA-SM-330/20) ....................................................................................... 589K. Ennow, K.J. Olsen
Direct dosimetry calibration at high energy electrons: Past experience andrelation to current protocols (IAEA-SM-330/64) ............................................... 595U.F. Rosenow, G. Kasten

DIAGNOSTIC X RAY DOSIMETRY (Session 10)
National accreditation of instrument calibration (IAEA-SM-330/73) ................ 605P.J. Roberts
Diagnostic dosimeters: Calibration and requirements (IAEA-SM-330/44) .. . . 617H.M. Kramer
Calibration of area-kerma meters (IAEA-SM-330/29) .......................................... 625J.P. Larsson, C.A. Carlsson, G. Aim Carlsson
Dose-area product meter calibration and use (IAEA-SM-330/42) ..................... 633P. Pychlau
The 1990 international intercomparison programme for dosimeters usedin diagnostic radiology (IAEA-SM-330/56) ........................................................ 637K.E. Schnuer, H.M. Kramer
Relation between degree of X ray monochromaticity and dose distributionnon-uniformity of irradiation field (IAEA-SM-330/11) .................................. 649S. Shimizu, K. Minami
Performance evaluation of 500 mA X ray units in selected Department ofHealth hospitals in the Philippines (IAEA-SM-330/43) ................................... 659A.M. Lobriguito, T.U. Battad, D.J. Mopera
Chairmen of Sessions and Secretariat o f the Symposium .................................... 669List of Participants .............................................................................................................. 671Author Index ......................................................................................................................... 689Index of Papers by Number ............................................................................................. 691

STATUS OF PRIMARY STANDARDS FOR ABSORBED DOSE, EXPOSURE AND KERMA
(Session 1)
Chairman
K. HOHLFELDGermany
Co-Chairman
S.C. MISRAIndia
I


IAEA-SM-330/68
Invited Paper
METROLOGY, A PRECURSOR OF QUALITY ASSURANCE
A. A LLISYInternational Commission on Radiation Units
and Measurements,Bureau international des poids et mesures,Sèvres
Abstract
M E T R O L O G Y , A P R E C U R S O R O F Q U A L IT Y A S S U R A N C E .A m e a s u re m e n t p ro ce ss , w h ic h in c lu d e s th e m e th o d o f m e a s u re m e n t, th e in s tru m e n ts ,
th e m e a s u re m e n t c o n d it io n s w ith th e ir re la te d c o r re c tio n s and th e o p e ra to rs , is c o n s id e re d as a p ro d u c t io n p ro ce ss w h ic h has its o w n q u a l i ty and q u a l ity c o n t ro l. T h e q u a l ity o f a m e a su re m e n t p ro ce ss is d e s c r ib e d b y its p re c is io n (s ta tis t ic a l c o n t ro l) , a c c u ra c y , c o m b in e d u n c e r ta in ty an d r e l ia b i l i t y . T h e m o s t im p o r ta n t c h a ra c te r is t ic o f th e q u a l ity o f a m e a s u re m e n t p ro ce ss is th e c o m b in e d u n c e r ta in ty o f its o u tp u t. T h e p r im a ry s ta n d a rd o f a i r k e rm a ra te o f th e B u re a u in te rn a t io n a l des p o id s e t m e su res is a n a lys e d as an e x a m p le , and th e v a r ia b i l i t y in an d b e tw e e n se rie s o f m e a su re m e n ts is c o n s id e re d . T h e in te rc o m p a r is o n o f m e a s u re m e n t p rocesses p ro v id e s a n e x te rn a l q u a l i ty assu rance o f th e ir a c cu ra c ie s . T h e im p o r ta n c e o f c o r re la t io n s is s tressed a n d a n e x a m p le is g iv e n . T h e c a lib ra t io n c h a in is c o n s id e re d in th e l ig h t o f sys tem a n a ly s is . C o m p a ris o n s p e r fo rm e d a t d i f fe re n t le v e ls o f th e c a lib ra t io n c h a in im p ro v e its r e l i a b i l i t y b y t ra n s fo rm in g i t in to a p a ra lle l-s e r ia l sys tem .
1. INTRODUCTION
Metrology is the scientific study of measurement, a process in which the input is the physical quantity to be measured and the output the numerical value, in terms of a specified unit, o f the input quantity. It is instructive to regard measurement as a production process and to compare and contrast measurement processes in the laboratory with mass production processes in industry [1]. Once this point o f view has been adopted, the difference between measurement methodology and industrial process control methodology becomes largely semantic. Moreover, the experience acquired over centuries in metrology can be usefully transferred to the more recent field o f quality control and quality assurance. Not only is metrology a precursor of quality assurance, but the latter just could not exist without the former.
3

4 ALLISY
A measurement process is the realization of a method of measurement in terms of specific apparatus and equipment o f the prescribed kinds, particular conditions that, even at best, only approximate the conditions prescribed, and particular persons as operators and observers. Such a measurement process can be considered as a production process, its output being the numerical value of the physical quantity to be measured. This numerical value is usually obtained by applying corrections to the readings o f the instruments, or their transforms, to compensate for known deviations from ideal execution of the prescribed operations, and for non-negligible effects of variations in uncontrolled variables, such as the effects produced by the environment [1]. Such corrections are usually only known approximately and thus also contribute to the uncertainty o f the output o f the process.
The uncertainty o f the result o f a measurement generally consists o f several components which may be grouped in two categories, denoted for convenience by A and B , according to the way in which their numerical value is evaluated.
The components in category A are estimated objectively by applying statistical methods to a series o f repeated determinations. They are characterized by estimated variances or standard deviations. Where appropriate, covariances should also be estimated [2]. Statistical methods can only be meaningfully applied to a series o f measurements if these measurements may be regarded as a random sample from a population of all conceivable measurements o f a given quantity by the measurement process concerned. If this condition is realized for a certain period, the measurement process has attained what is known in quality control language as a state o f ‘statistical control’ . Type A uncertainties characterize the degree o f mutual agreement among measurements, i.e. the precision o f a measurement process.
The uncertainty components in category В are subjective appreciations made by the experimentalist according to personal experience and judgement. They often concern the corrections which were applied to readings o f the instruments. These components should be characterized by quantities which may be considered as approximations to the corresponding variances or standard deviations and, where appropriate, covariances. Type В uncertainties often govern the accuracy of a measurement process, i.e. the extent to which the measured value o f a quantity agrees with the accepted or consensus value for that quantity.
The combined uncertainty is obtained by applying to the component uncertainties the well known method for the combination of variances (law of propagation of uncertainty). The combined uncertainty is usually expressed in the form of standard deviations.
The totality o f characteristics o f the output o f a measurement process that bear on its ability to satisfy stated and implied needs is called the ‘quality’ [3]. The quality o f the output o f a measurement process is best described by a complete list o f the uncertainty components, together with the specification for each of the methods used
2. T H E M E A S U R E M E N T P R O C E S S A N D ITS C H A R A C T E R I S T I C S

IAEA-SM-330/68 5
to obtain its numerical value. The most important characteristic o f the quality o f a measurement process is the combined uncertainty o f its output.
All the planned activities designed to establish and demonstrate on a continuing basis that the combined uncertainty o f each measurement is suitably small relative to its intended use are called the ‘measurement quality assurance’ .
A measurement process can also be characterized by its reliability, which is defined as the probability o f ‘success’ . An example of success would be that the numerical value o f the combined uncertainty o f a measurement is smaller than or equal to a stated value. The concept o f reliability can be applied not only to a measurement process but also to a system of measurement processes, for example a group of processes which are linked by intercomparisons.
3. STANDARDS AS M EASUREM ENT PROCESSES UNDERSTA TISTICA L CONTROL
In the field o f ionizing radiation metrology, a primary standard of a given physical quantity is essentially an experimental set-up which allows one to attribute a numerical value to a particular sample o f that quantity in terms o f a unit given by an abstract definition. Thus, such a primary standard can be considered as a measurement process and the concepts described in the preceding section apply to it.
The precision of a measurement process can only be characterized meaningfully if the process is in a state o f statistical control. This can be best established by determining repetitively the numerical value o f a given ‘check reference’ which may be considered as constant in time. Figure 1 shows the results o f some 300 determinations o f the air kerma rate from a ^C o source obtained with the air kerma standard
Y e a r
FIG. 1. Variability o f the B IP M a ir kerma rate standard.

6 ALLISY
of the Bureau international des poids et mesures (BIPM) under specified conditions [4]. The experimental results corrected for source decay cover approximately a ten year period. The layperson’s definition of the state o f statistical control certainly applies to these data: “ A measurement process is in a state of statistical control if the amount o f scatter in the data from repeated measurements o f the same item over a period of time does not change with time and if there are no sudden shifts or drift in the data” [5].
In order to analyse the behaviour of the process, the 300 determinations o f air kerma rate represented in Fig. 1 have been grouped into 100 series o f 3 (consecutive) determinations, each series covering a period of approximately one month. It is then possible to quantify the variability within the series and between series, as well as the overall variability, by a statistical technique described in Appendix A. The results are given in Table I.
The closeness o f the variability within series and the overall variability given in Table I characterizes the long term stability o f the process. The somewhat higher value o f the variability between series can probably be explained by some accidental deviations. The measurement process is best characterized by the overall variability.
TA BLE I. VA RIA BILITY OF BIPM AIR KERM A RATE STANDARD
Variability within series (Eq. (A.2))
Variability between series (Eq. (A.3))
Overall variability of process (Eq. (A.4))
Relative value Relative value Relative value
sw = 1.7 x 10^ i b = 2.6 x lO"4 5 = 2 .1 x КИ
(100 series of 3 determinations)
TA BLE П. COMPARATIVE VARIABILITY OF BIPM AIR KERMA STANDARD WITH AND WITHOUT SHUTTER
Variability within series, Variability within series,source moved after each measurement fixed source with shutter
Relative value Relative value
sw = 1.7 x 10⁻⁴ sw = 0.6 X 10“*
(7 series of 10 measurements) (5 series of 10 measurements)

IAEA-SM-330/68 7
ô 1
lia о
'? -1■О
“ -2
2
FIG. 2. Seasonal variations o f the distance between the 60Co source container and standard ionization chamber.
It is always challenging to investigate the physical processes which may explain the variability o f results. In the example discussed here, each individual determination of the 300 shown in Fig. 1 is in fact the mean of 30 measurements. All these individual mean values have approximately the same estimated relative standard deviation, = 0 .3 X 10-4, a value which is 7 times smaller than the overall variability o f the process. This smaller value can be explained by the fact that the ^Co source was kept fixed during the individual measurements within a determination, whereas it was moved between the determinations. The uncertainty due to the positioning of the ^C o source being an important component o f the variability o f the process, it was investigated by using a shutter. The results given in Table П indicate the substantial reduction o f variability which could be achieved.
Additional length measurements have shown a periodic structure due to the seasonal variations o f the length of the building affecting the distance between the source container and the standard ionization chamber. The results o f length measurements made during a period o f three years are given in Fig. 2. It should be noted that such a periodic trend would introduce a correlation between the determinations given in Fig. 1 if no correction were made.
The ultimate limit o f dispersion of the results is given by fundamental physical processes such as the photon noise o f the source and the correlated electron noise o f the charge collected in the ionization chamber. For the measurement process under discussion the effect o f the former predominates. For a mean of 30 measurements with an estimated relative standard deviation = 0 .3 X 10"4, the photon noise introduces a relative uncertainty (Iff) o f the order o f 0 .2 X 10"4. From this result it can be deduced that the sensitivity o f an individual determination by the measurement process is close to the limit set by nature.
This example shows that periodic checks not only provide a quality assurance but may also lead to the investigation of perturbing physical effects.
“ Г 1 1 1 1 1 I I 1 1 1 1 I I 1 I 1— l " l ' 1 1 I I i I I 1 1 1 "1 1 1 1 1...1"J_ T M M ..r T .
— • 4*» -4
.•••
/ '• ■
T• 0.01% —
? . * ." 1
J IF IMIAIMIJ IJ IAISiOINiD JIFtMlAlMIJlJ IAISIOINiD JiFlMlAlMlJlJlAlSlOlNlD JiFlMlAIMiJtJlA
1986 1987 1988 1989
Date

8 ALLISY
Information on the accuracy of measurement processes may be gained by inter- comparing them. This can be achieved by measuring directly or via transfer instruments the same check reference, or, as is usual for absorbed dose measurements, by delivering to chemical or thermoluminescent dosimeters the same reference absorbed dose.
Such intercomparisons provide an external quality assurance of the accuracy of the measurement processes; they also introduce ‘redundancy’ in the system of similar processes which may increase the reliability of each component process.
Figure 3 gives the results of 18 determinations, obtained with 16 primary standards, of the same air kerma rate produced by a 60Co source. The total spread of the results over 20 years, of the order of 0.5% , certainly increases the confidence in the coherence of the measurement processes. It shows that no major biases are introduced in the measurements of the volume of the ionization chamber, the ionization current and the air temperature and pressure, as well as in the corrections for the field uniformity and the wall effects.
In analysing the data given in Fig. 3 one should take into account that they are correlated by the use in each laboratory of the same (uncertain) values of physical constants. In the case of the BIPM standard of air kerma rate, for example, its estimated relative combined uncertainty, s = 3 .6 x 10“3, is obtained by the quadratic sum of two terms, one due to corrections or measurements, se = 1.2 X 10⁻³, and the other due to the uncertain knowledge of the numerical values of physical
4. I N T E R C O M P A R I S O N O F M E A S U R E M E N T P R O C E S S E S
о
l-sc
I- ?I
Y ear
FIG. 3. Comparison of 16 primary standards of air kerma rate. In 1985 the values of all standards were shifted by 0.75% following re-evaluations of the numerical values of physical constants.

IAEA-SM-330/68 9
constants, i k = 3 .4 X 10“3 [6]. If another standard had similar values for se, its correlation coefficient with the BIPM standard would be approximately p = 0 .9 (Eq. (B .l) , Appendix B).
The mean value of the air kerma rate standards was shifted by 0.75% by mutual agreement in 1985 [4], when the numerical values of the implied physical constants were re-evaluated. Such a change should not be compared with the spread given in Fig. 3, simply because the latter contains only biases due to corrections or measurements.
More information on the accuracy of measurement processes can be obtained by comparing the measurements of the same check reference by processes based on different measurement methods and using different instruments. This is the case for the standards of absorbed dose in water which are discussed in another paper of this symposium [7].
5. THE CALIBRATION CHAIN
The calibration chain starts at the primary national (or sometimes international) standard and ends at the user’s level. Such a complex system is a serial system, i.e. a system in which all the individual components must necessarily function correctly in order to achieve a satisfactory operation of the system as a whole.
System analysis permits one to separate a complex system into components which have to be characterized individually. The combined uncertainty and the reliability of the overall system can then be calculated, with the combined uncertainty and the reliability of each component, as well as the structure of the system, being known. The reliability P(S) of a serial system S consisting of two components Si and S2, with reliabilities P(Si) and P(S2), is given by P(S) = [ />(S1|S2)]P(S2) (Fig. 4). This relation indicates that the component having the lowest reliability may heavily influence the reliability of the overall system. The ‘strength’ of a chain is conditioned by its weakest link.
The first component, linked to a primary standard, is a system allowing the transfer to a secondary standard. The quality of such a transfer system is essentially its combined uncertainty as well as its stability in time. Figure 5 indicates the stability in time of five secondary national standards over a period of more than 20 years. It can be inferred from these data that a good transfer instrument introduces an almost negligible uncertainty owing to its stability in time.
Comparisons are usually performed at different levels of the calibration chain (primary, secondary, . .. user), which improves the reliability of the system by transforming it into a parallel-serial system. A complex system has to be monitored and controlled and this is the prime role of a quality assurance programme. Precise rules have been established for the national accreditation of instrument calibration. At the international level, the International Atomic Energy Agency (IAEA) is in the process

10 ALLISY
FIG. 4. Reliability of a serial system: R = P(S) = [P(SI\S2)JP(S2).
Y e a r
FIG. 5. Stability of five secondary standards. Each standard is represented by a different symbol. The value unity was attributed to each standard at its first calibration.
of producing a Code of Practice for quality assurance within a Secondary Standard Dosimetry Laboratory (SSDL) [8]. In this Code of Practice there will be a discussion of the scientific links between the radiation standards of the SSDL and those of the IAEA, as well as of the development of procedures for follow-up action to resolve potential discrepancies. Finally, the Code of Practice will include procedures for internal coherence (quality assurance) within an individual SSDL and develop procedures for inter-SSDL comparisons, thus providing cross-linking of secondary standards.

IAEA-SM-330/68 И
Appendix A
VARIABILITY IN AND BETWEEN SERIES OF MEASUREMENTS
Let us suppose that we have at our disposal the results of к series of n determinations of a given constant quantity. Let x¡j (1 < / ' < & , ! < j < n) be the result
where 3c, is the arithmetic mean of the series. There are к such estimates of the numerical value of a2, each describing the variability of the measurement process within a series. A better estimate of a2 is given by the arithmetic mean
If there is a variability of the measurement process between the series, it can be evidenced by the following estimate of a2:
where x is equal to (1/&)E*=1 x¡.The comparison of the two estimates i * and s£ is an indication of the statisti
cal control of the process.The overall variability of the process is given by a third estimate of a2,
namely
of the determination j in the series i and let a2 be its variance. An estimate of a2 can be obtained by
(A .l)
(A. 2 )
(A.3)¿=1
(A.4)
which is equal to

12 ALLISY
Relation (A.5) indicates that the estimate s2 takes into account the variability both in the series and between the series. It is an estimate for the precision of the measurement process over the period during which the n series of measurements have been performed.
Appendix В
CORRELATION BETWEEN MEASUREMENT PROCESSES
Let X¡ and X¡ be the results of two measurement processes i and j , and let s¡ and Sj be their respective estimated relative combined uncertainties. If each of the processes uses the same physical constants with their estimated relative combined uncertainty sk, one has
S¡ = s l j + si
Sf = Sl j + Sk
where se ¿ is the estimated relative combined uncertainty due to corrections or measurements for process i and sej the corresponding value for process j .
The correlation coefficient p between processes i and j is given approximatelyby
fi = — (B.1)S¡Sj
ACKNOWLEDGEMENTS
I wish to thank all my colleagues of the BIPM for helpful discussions and for the provision of convincing data. I am especially grateful to D. Müller for preparing the manuscript and for very useful comments.
REFERENCES
[1] EISENHART, C., Realistic evaluation of the precision and accuracy of instrument calibration systems, J. Res. Natl. Bur. Stand., С Eng. Instrum. 67 (1963) 161-187.
[2] P.-v. séanc. Com. int. poids mes. 49 (1981) A l l .[3] INTERNATIONAL ORGANIZATION FOR STANDARDIZATION, Quality -
Vocabulary (Trilingual Edition), ISO 8402, Ed. 1, Geneva (1986) 12 pp.[4] P.-v. séanc. Com. int. poids mes. 60 (in press).

IAEA-SM-330/68 13
[5] BELANGER, G., Measurement Assurance Programs, Parti: General Introduction, NBS Special Publ. 676-1, Natl Bureau of Standards, Washington, DC (1984) 64.
[6] BOUTILLON, М., BIPM, Sèvres, private communication, 1993.[7] BOUTILLON, M., COURSEY, B.M., HOHLFELD, K., OWEN, B., ROGERS,
D.W.O., IAEA-SM-330/48, these Proceedings.[8] SSDL Newsletter No. 31, IAEA, Vienna (1992) 4.


IAEA-SM-330/22
COMPARISONS AND CALIBRATIONS AT THE BUREAU INTERNATIONAL DES POIDS ET MESURES IN THE FIELD OF X AND 7 RAYS
M. BOUTILLONBureau international des poids et mesures,Sèvres
A.-M . PERROCHE*Service central de protection contre
les rayonnements ionisants,Le Vésinet,France
Abstract
C O M P A R IS O N S A N D C A L IB R A T IO N S A T T H E B U R E A U IN T E R N A T IO N A L D E S P O ID S E T M E S U R E S I N T H E F IE L D O F X A N D 7 R A Y S .
T h e X an d 7 ra y s e c tio n o f th e B u re a u in te rn a t io n a l des p o id s e t m e su res ( B IP M ) m a in ta in s , w ith a v e ry h ig h s ta b il i ty , re fe re n c e s tandards o f a i r k e rm a and a b so rb e d dose . In te rn a t io n a l c o m p a ris o n s p e r fo rm e d a t th e B IP M s h o w a s ta n d a rd d e v ia t io n a m o n g n a tio n a l la b o ra to r ie s in th e ra n g e o f 0 .2 - 0 .5 % , d e p e n d in g o n th e q u a n t ity m e a su re d and th e e n e rg y u sed . S e c o n d a ry n a tio n a l re fe re n ce s a re a lso a ttache d to th is in te rn a t io n a l sys tem . R ecen t e x p e r im e n ta l v a lu e s o f C f a t “ C o e n e rg y a re p re se n te d a n d c o m p a re d w ith th a t based o n th e C o d e o f P ra c tic e o f th e In te rn a t io n a l A to m ic E n e rg y A g e n c y .
1. INTRODUCTION
The task o f the Bureau international des poids et mesures (BIPM), which works under the supervision of the Comité international des poids et mesures (CIPM), is to ensure worldwide unification of physical measurements. This objective is achieved with the active participation of those national laboratories which have their own standards, to the benefit of themselves and of countries with laboratories less well equipped.
In the X and 7 ray section of the BIPM, the programme includes the accurate measurement o f dosimetric quantities such as exposure, air kerma and absorbed dose. Reference standards are maintained permanently at the BIPM and are available on demand for the benefit of member countries that wish to make international comparisons or to calibrate their secondary standards.
P resen t ad dre ss : B u re a u in te rn a t io n a l des p o id s e t m e su res , P a v il lo n de B re te u il, F -9 2 3 1 2 S èvres C e d e x , F ra n c e .
15

16 B O U T I L L O N and P E R R O C H E
Reference standards have been established at the BIPM for the measurement of air kerma (low and medium energy X rays and 60Co), absorbed dose to graphite and absorbed dose to water ( 60Co) in the field of radiotherapy, and for the measurement of ambient and directional dose equivalent in radioprotection. The ionometric method has been chosen for the determination of the dosimetric quantities because it is flexible, stable and easy to check. This is a procedure of choice for comparing the various determinations made by national laboratories. The particular geometry (flat cylindrical box) of the graphite cavity chambers used as standards in the 60Co beam has been chosen so that the determination of the dosimetric quantities rests on a safe theoretical basis.
The BIPM standards have been described elsewhere [1-3]. The uncertainty of the determination of air kerma is about 0 .2 % and that of absorbed dose to water 0 .4% . Measurements o f air kerma and absorbed dose are periodically carried out under the reference conditions listed in Table I and defined by Section I of the Comité consultatif pour les étalons de mesure des rayonnements ionisants (CCEMRI(I)) [4, 5].
2. S T A B I L I T Y O F T H E B I P M S T A N D A R D S
TA BLE I. CONDITIONS OF MEASUREMENTS
X rays
X ray tube voltage (kV)
Half-value layer (mm Al) 0.04 0.25 1.0 2.3 4.0
10 25 50 50 100 135 180 250
(mm Cu)
Distance from source to reference plane (cm) 50 50 50 50 120 120 120 120
0.15 0.5 1.0 2.5
Co-60
Beam cross-section in reference plane
Distance from source to reference plane
Reference depth for absorbed dose measurement
10 cm x 10 cm
1 m
5 g -cm'2
Uncertainty of: air kermaabsorbed dose to water
0 .2 %0.4%

IAEA-SM-330/22 17
Year
FIG. 1. Experimental values of mCo half-life, a: hagoutine (LMRI); b: Merritt-Taylor (AECL); c: Rytz (BIPM); d: Walz-Weiss (PTB); e: Houtermans (IAEA); f: Rytz (BIPM); g: Rutledge (AECL); h: Unterweger (NIST); i: Boutillon-Perroche (BIPM).
In the case of the X ray beam, the standard deviation of the long term stability, over a period of some twenty years, ranges from 0.15 to 0 .3% , depending on the radiation quality. For the MCo beam, it is as small as 0 .015% . This has allowed us to obtain an experimental determination of the half-life o f this nuclide. The result, Ty2 = 1924.6 + 0 .6 d, is in good agreement with other values published recently (Fig. 1).
For purposes o f radiation protection it was necessary to extend the system of measurable dosimetric quantities to new operational quantities defined by the International Commission on Radiation Units and Measurements (ICRU). The BIPM has therefore developed a standard for the measurement of ambient and directional dose equivalents [6] which is used for the calibration of instruments in this field.
3. COMPARISON OF STANDARDS
During the past two decades, a number of comparisons have been performed between national laboratories and the BIPM under the reference conditions. These comparisons are made either directly, using the standards themselves, or indirectly, by means of calibrated transfer instruments. Table II summarizes the final results.

18 B O U T I L L O N and P E R R O C H E
TA BLE II. INTERNATIONAL COMPARISONS OF X AND y RAY MEASUREM ENTS
Quantity Q measured
Number of laboratories
Standard deviation of results
(%)1Q 6 b i p m 1 ! Q
(%)
Air kerma (X rays)10-50 kV 9 0.1-0.33 0.04-0. I a
Air kerma (X rays)100-300 kV 10 0.2-0.43 0.04-0.3a
Air kerma (Co-60) 17 0.2 0.02
Absorbed dose to graphite (Co-60) 8 0.2-0.3b 0.07-0.2b
Absorbed dose to water (Co-60) 4 0.5C —
a Depending on radiation quality. b Depending on depth.0 At a depth of 5 g -cm-2.
There is a generally good agreement between the standards if we consider the uncertainties involved. The standard deviation is in the range of 0 .2 -0 .4% for measurements in air or in graphite, and about 0.5% for measurements in water.
The results of these comparisons have allowed some of the national laboratories to improve their standards. They have also encouraged the BIPM and other laboratories to strive for improved accuracy. However, some difficulties are not yet sufficiently overcome, and these concern in particular the measurement of absorbed dose to water. Many laboratories are working on these problems [7-9].
4. CALIBRATION OF SECONDARY INSTRUMENTS
Secondary instruments are sometimes used by the national laboratories for indirect comparison of their standards. These also serve as national references for countries which have no primary standards of their own. In this case, the instruments are periodically calibrated (about every five years) to check their long term stability. At present, 13 countries are involved.
The secondary instruments are cavity ionization chambers, which are calibrated at the BIPM under the reference conditions. The chamber stability is

IAEA-SM-330/22 19
checked and the effect o f various parameters on the chamber response (such as dose rate, chamber size and waiting time before beginning a calibration) is estimated. The calibration factor can be given with an uncertainty of about 0.2% (X ray and 60Co) in terms of air kerma and with an uncertainty of 0.5% in terms of absorbed dose to water ( 60Co).
Following the recommendation of the CCEM RI(I) in 1985, the BIPM also contributes to the periodic comparisons of transfer instruments organized by the International Atomic Energy Agency (IAEA) in order to ensure their traceability to the BIPM . Passive dosimeters (TLDs) distributed for intercomparisons are irradiated in the BIPM water phantom at a depth of 5 g -cm ' 2 and returned to the IAEA for processing.
5. DETERMINATION OF C f
Some transfer chambers have been calibrated in the ^C o beam in terms of both air kerma and absorbed dose to water. From this work, an experimental value of the C f factor has been deduced and compared with that obtained by using the IAEA Code of Practice [10].
The main characteristics of these chambers are given in Table III. The electrode of the NE chambers is thin and made of aluminium; for the other chambers it has a fairly large volume and is o f the same material as the wall.
For measurements in water, the same type of waterproof Perspex envelope (about 1.5 mm thick) has been used for all chambers but one. The effect o f the envelope on the chamber reading has been determined by varying its thickness from 1.5
TA BLE Ш. MAIN CHARACTERISTICS OF TRANSFER CHAMBERS
ChamberVolume
(cm3)Radius(mm)
Wallmaterial
wall(g-crrT2)
Capmaterial
cap(g-cm 2
NE 2561 0.325 3.7 Graphite 0.090 Delrin 0.600
NE 2571 0.6 3.15 Graphite 0.065 Delrin 0.551
Capintec(l) 0.65 3.2 C-552 0.050 C-552 0.924
Capintec(2) 0.65 3.2 C-552 0.050 Polystyrene 0.539
Exradin T2 0.5 4.7 A-150 0.115 A-150 0.337
Exradin Tl 0.05 1.7 A-150 0.115 A-150 0.337
Exradin Al 0.5 4.7 C-552 0.182 C-552 0.356

20 B O U T I L L O N and P E R R O C H E
to 7 mm. A linear extrapolation shows a small effect of (0.07 + 0.02)% for an envelope thickness of 1.5 mm. The influence o f the support and the cable of the chamber in water has also been checked, by means of a dummy chamber, and found to be no more than 0 .0 2 %.
During the measurements of the calibration factors, NK and Mw, in air and in water, the chamber axis is placed in the reference plane where the absorbed dose is measured. The statistical uncertainty o f these factors is 0.02% and 0 .03% , respectively, and the total uncertainty of their ratio is 0 .5 %. For comparison with the IAEA values, Mw should be corrected in order to correspond to the depth in water o f Peff, the effective point of measurement. As recommended by the IAEA, Peff is assumed to be shifted from the chamber axis by 0 .5 r towards the source, where r is the inner radius of the chamber. In the reference conditions, the relative variation of the absorbed dose is 0.60% -mm- 1 along the beam axis. The experimental value (Cx)exp is therefore given by
The IAEA value o f C f is given with an uncertainty of 1%. To take into account the presence of the Perspex envelope, the usual perturbation factor p u (see Eq. (25) o f Ref. [10]) must be modified to
produced in the Perspex envelope. The value of p 0 differs very little from the value recommended by the IAEA.
The results are given in Table IV. For chambers o f the same type the (C f)exp values are quite similar, except for the NE 2561 chambers, for which the spread is somewhat larger. These variations are due to small differences in chamber construction.
The uncertainty of the ratio R = (C f)exp/(Cx)IAEA is estimated to be 1.2% . Thus, the discrepancy between experimental and calculated values of C f seems to be hardly significant. It should be noted, however, that the agreement is better for NE chambers having a thin electrode than for the other chambers.
The results from Capintec chambers, with a cap of polystyrene or o f C-552, show a discrepancy (see Table IV) and some checks have therefore been made. Measurements o f cap attenuation were performed in air, using BIPM chambers, with different cap thicknesses. By a linear extrapolation it is possible to obtain a rough
( 1 )
Pu [°^wall,air (Mei/P)w,wall $ (1 Qi).S'perspcx ,air ( en P)w,Perspex
(2 )
where /3 is the fraction of the energy imparted to the cavity which is due to electrons

IAEA-SM-330/22 21
TA BLE IV. VALUES OF C f FOR TRAN SFER INSTRUMENTS (experimental uncertainty: a = 0.5% ; calculated uncertainty: a = 1%)
Chamber Location M JNK (C exp (Ct)lAEA Ratio R
NE 2561 DenmarkFinlandIAEANorwayNetherlands
1.0881.091 1.0841.0911.091
1 . 1 0 1 1.095 1.006
NE 2571 Canada Czech Rep.
1.0991.097
1.108 1.103 1.005
Capintec(l) Norway 1.093 1.103 1.106 0.996
Capintec(2) Canada 1.0931.095
1.1041.105
1.0921.092
1 .0 1 1
1 .0 1 2
Exradin T2 BIPM 1.0921.0921.092 1.0901.093
1.107 1.092 1.014
Exradin TI BIPM 1.103 1.108 1.099 1.009
Exradin Al BIPM 1.095 1 . 1 1 1 1.095 1.016
TA BLE V. VALUES OF kM FOR SOME CHAMBERS
Chamber Material3 ^wall
(g-cm-2)^cap
(g-cm'2)^att
(IAEA)kb k j k
Capintec(l) C-552 0.050 0.924 0.984 0.972 1 .0 12
Exradin Al C-552 0.182 0.356 0.985 0.985 1 . 0 0 0
Exradin Al C-552 0.182 0.712 0.976 0.975 1 . 0 0 1
Exradin T2 A-150 0.115 0.450 0.985 0.982 1.003
SSI A-150 A-150 0.056 0.373 0.990 0.986 1.004
SSI graphite Graphite 0.084 0.384 0.990 0.990 1 . 0 0 0
3 Of wall and electrode.b Present estimate of km by linear extrapolation of experimental data.

22 B O U T I L L O N and P E R R O C H E
Radius (mm)
FIG. 2. Ratio R = (С£)ыр/(С^ М£4 as a function of radius for chambers with a large electrode. Peffis shifted by 0.5r ( • ) or by 0.5(r - relectrode) (o) .
estimate of the correction factor km , which takes into account the attenuation and scatter of the photons in the ionization chamber material, for chambers with wall and cap made in a given material, and to compare the values obtained with the results
given by the IAEA. Caps of C-552, A-150 and graphite were used. Values of кш were derived for some chambers o f similar volume (0 .5 -0 .6 cm3). The results given in Table V show a good agreement, except for the Capintec chamber with a C-552 cap (Norwegian chamber), for which the discrepancy is up to 1.2% . The IAEA value o f km for this chamber seems to be in error, which could explain the difference observed in Table IV for Capintec chambers with different cap materials.
In Fig. 2 are plotted the values of R for chambers with thick electrodes as a function of the inner radius r of the chamber. A significant correlation can be observed between R and r which seems to indicate that the correction of half a radius for the effective point o f measurement Peff is too large. Since the electrode fills a significant portion of the cavity, Peff should probably be shifted by 0 .5(r - relectrode) instead of 0 .5 r. In this case, the results for these chambers would show a reduced spread, as can be seen in Fig. 2 , and agree better with the results of the NE chambers. Moreover, the C f values calculated from the IAEA Code are then in good agreement with the experimental findings.

IAEA-SM-330/22 23
As a result o f the excellent long term stability of our equipment, a given national standard which is compared with the BIPM standard is ipso facto linked to all national standards of the system. This is so whatever the time at which the comparison is performed. Moreover, secondary national references can also be attached to the system. The demand for the services provided by the Ionizing Radiation Section of the BIPM (reference standards, comparisons and calibrations) has increased during the past decade.
Significant progress has recently been made in the determination of absorbed dose to water. The results of the first international comparison between standards are promising and they allow us to check experimentally the validity o f the various codes of calculation which at present are widely used for transferring a calibration in terms of air kerma to one in terms of absorbed dose to water. The results of the present work show that the IAEA Code gives results which are within the claimed uncertainty.
R E F E R E N C E S
[1 ] B O U T IL L O N , М . , H E N R Y , W . H . , L A M P E R T I , P .J . , C o m p a r is o n o f e x p o su re s tan da rd s in th e 1 0 -5 0 k V X ra y ra n g e , M e tro lo g ía 5 (1 9 6 9 ) 1 -1 1 .
[2 ] B O U T IL L O N , M . , N IA T E L , M . - T . , A s tu d y o f a g ra p h ite c a v ity c h a m b e r fo r a b so lu te e x p o s u re m e asu re m en ts o f ^ C o g a m m a ra y s , M e tro lo g ía 9 (1 9 7 3 ) 1 3 9 -1 4 6 .
[3 ] B O U T IL L O N , М . , P E R R O C H E , A . - М . , Io n o m e tr ic d e te rm in a t io n o f a b so rb e d dose to w a te r fo r c o b a lt-6 0 g a m m a ra y s , P h y s . M e d . B io l . 3 8 (1 9 9 3 ) 4 3 9 -4 5 4 .
[4 ] B U R E A U IN T E R N A T IO N A L D E S P O ID S E T M E S U R E S , “ Q u a lité s de ra y o n n e m e n t” , B IP M C o m ité c o n s u lta t i f p o u r les é ta lo n s d e m e su re des ra y o n n e m e n ts io n is a n ts (S e c tio n I ) , V o l . 2 , O f f i l ib , P a r is (1 9 7 2 ) R 1 5 .
[5 ] B U R E A U IN T E R N A T IO N A L D E S P O ID S E T M E S U R E S , “ C o m p a ra is o n s d ’é ta lo ns d e dose a b so rb é e ” , B IP M C o m ité c o n s u lta t i f p o u r le s é ta lo n s de m e su re des ra y o n n e m e n ts io n is a n ts (S e c tio n Г), O f f i l ib , P a r is (1 9 7 9 ) R I(5 ) .
[6 ] P E R R O C H E , A . - M . , B O U T IL L O N , M . , M e a s u re m e n t o f a m b ie n t do se e q u iv a le n t and d ire c t io n a l dose e q u iv a le n t in a “ C o b e a m , R a d ia t. P ro t . D o s im . 2 7 (1 9 8 9 ) 1 3 9 -1 4 8 .
[7 ] R O O S , М . , G R O S S W E N D T , B . , H O H L F E L D , K . , A n e x p e r im e n ta l m e th o d fo r d e te rm in in g th e he a t d e fe c t o f w a te r u s in g to ta l a b s o rp tio n o f h ig h -e n e rg y e le c tro n s , M e tro lo g ía 2 9 (1 9 9 2 ) 5 9 -6 5 .
[8 ] S H O R T T , K .R . , R O S S , C .K . , S C H N E ID E R , M . K . H . , H O H L F E L D , K . , R O O S , М . , P E R R O C H E , A . - M . , A c o m p a r is o n o f a b so rb e d do se s tan dard s fo r h ig h e n e rg y X ra y s , P h y s . M e d . B io l, ( in p re ss ).
[9 ] B U R E A U IN T E R N A T IO N A L D E S P O ID S E T M E S U R E S , N P L - B IP M C o m p a r is o n o f A b s o rb e d D o s e f r o m “ C o G a m m a R a d ia t io n , D o c . C C E M R I( I ) /8 8 -1 4 , O f f i l ib , P a r is (1 9 8 8 ).
[1 0 ] IN T E R N A T IO N A L A T O M I C E N E R G Y A G E N C Y , A b s o rb e d D o s e D e te rm in a t io n in P h o to n an d E le c tro n B ea m s: A n In te rn a t io n a l C o d e o f P ra c tic e , T e c h n ic a l R e p o rts S e ries N o . 2 7 7 , I A E A , V ie n n a (1 9 8 7 ).
6. C O N C L U S I O N S


IAEA-SM-330/45
STATUS OF THE PRIMARY STANDARD OF WATER ABSORBED DOSE FOR HIGH ENERGY PHOTON AND ELECTRON RADIATION AT THE PTB
M. ROOS, K. HOHLFELD Physikalisch-Technische Bundesanstalt,Braunschweig, Germany
Abstract
S T A T U S O F T H E P R IM A R Y S T A N D A R D O F W A T E R A B S O R B E D D O S E F O R H IG H E N E R G Y P H O T O N A N D E L E C T R O N R A D IA T IO N A T T H E P T B .
T h e n a tio n a l p r im a ry s ta n d a rd o f w a te r a b so rb e d do se fo r h ig h e n e rg y p h o to n an d e le c t r o n ra d ia t io n in G e rm a n y is based o n fe r ro u s s u lp h a te d o s im e try . T h e respo nse o f th e s o lu tio n is d e te rm in e d b y to ta l a b s o rp tio n o f h ig h e n e rg y e le c tro n s f r o m a m ic ro t r o n w i th a k n o w n ra d ia n t e n e rg y . T h e e n e rg y de pe nde nce o f th e c h e m ic a l y ie ld o f th e s o lu t io n a t h ig h en e rg ie s is assum ed to b e n e g l ig ib le to w i th in a c ce p ta b le u n c e rta in t ie s . T h e c a lib ra te d F r ic k e s o lu tio n th e re fo re a l lo w s th e beam s o f ^ C o sources to b e m e a s u re d and to s e rve as s tan dard s o f th e P h y s ik a lis c h -T e c h n is c h e B u n d e sa n s ta lt (P T B ) fo r th e q u a n t ity ‘ w a te r a b so rb e d d o s e ’ u n d e r s p e c if ie d c o n d it io n s . B es id es th e re f in e m e n t o f th e p re s e n t p r im a ry s ta n d a rd , th e w a te r c a lo r im e tr ic m e th o d is b e in g d e v e lo p e d as th e s ta n d a rd o f c h o ic e fo r th e fu tu re . I n c o n tra s t to th e p re s e n t m e th o d , i t a l lo w s th e w a te r a b so rb e d do se to b e m e a su re d a c c o rd in g to its d e f in it io n . A m a jo r p ro b le m is th e h a n d lin g o f th e h e a t d e fe c t. T o o v e rc o m e i t , th e P T B chose an e x p e r im e n ta l, a b so lu te d e te rm in a t io n u s in g a to ta l a b s o rp tio n c a lo r im e te r fo r th e h ig h e n e rg y e le c tro n s o f th e m ic ro tro n . I n th is case th e h e a t d e fe c t ne ed n o t n e c e s s a rily b e z e ro — w h ic h is a c ru c ia l c o n d it io n — b u t o n ly s ta b le . In v e s t ig a t io n is u n d e r w a y o f th e h e a t d e fe c t o f w a te r c o n ta in in g c h e m ic a l a d d it iv e s in tro d u c e d to cause a s ta b le h e a t d e fe c t, in d e p e n d e n t o f p o s s ib le im p u r it ie s in th e a b so rb e d do se c a lo r im e te r . T h e w a te r a b so rb e d dose c a lo r im e te r is o p e ra te d a t a w a te r te m p e ra tu re o f 4 ° C to a v o id c o n v e c tio n . I t a l lo w s th e q u o tie n t o f te m p e ra tu re r is e a n d ir r a d ia t io n p e r io d u s in g a ^ C o s o u rc e to be m e a s u re d w ith a re la t iv e s ta n d a rd d e v ia t io n o f a b o u t 0 .1 % fo r th e m e a n o f a d a ily set o f m e a s u re m e n ts . T h e in v e s t ig a t io n o f p o ss ib le in f lu e n c e s a n d in f lu e n c e q u a n tit ie s is p e n d in g .
1. INTRODUCTION
The Radiology Standards Committee o f the Deutsches Institut fur Normung (DIN) recommended in 1985 that the water absorbed dose Dw be used as the mea- surand for therapy dosimeters in the Federal Republic o f Germany [1]. The corresponding unit, the gray (1 Gy = 1 J/l kg), must be realized by the Physikalisch- Technische Bundesanstalt (PTB) by means of a primary standard measuring device.
25

26 R O O S and H O H L F E L D
To obtain an absolute measurement method for the field o f high energy photon and electron radiation, the PTB has developed a chemical method into the national primary standard measuring device. In addition to the chemical method, a calorimet- ric method will be described in closer detail which will be further developed at the PTB and which might, in the long run, supplement or even replace the chemical method as the primary standard measuring device.
2. THE PRESENT PRIM ARY STANDARD, BASED ON THE FERROUS SULPHATE METHOD
In the range of high energy radiation, the use o f the chemical method proves to be advantageous because the response (i.e. the ratio o f the change of the optical density to the absorbed dose) o f the ferrous sulphate solution is the same for photon and electron radiation and in good approximation energy independent [2-4]. Moreover, the absorbed dose Dsol generated in the highly diluted solution differs only slightly from the respective water absorbed dose Dw so that the factor for conversion into Dw deviates from unity only by a few per mille.
FIG. 1. Experimental set-up for the determination of the specific energy imparted by electrons in ferrous sulphate solution, and for the determination of the heat defect of water. (1) Electron beam from the microtron electron accelerator, (2-7) quadrupole lenses of the electron beam guiding system, (8-10) beam transformers for charge measurement, (11) 90° deflection magnet, (12) magnetic spectrometer, (13) ferrous sulphate solution in a vessel in a temperature stabilized container, (14) absorber vessel with water in a flanged vacuum container for the determination of the heat defect of water.

IAEA-SM-330/45 27
FIG. 2. Absorber vessel (3) filled with ferrous sulphate solution and arranged in front of the microtron’s beam tube exit window (1), (2) beam transformer, (4, 5) magnetically coupled stirrer, (6) thermostat with water bath (7).
At the PTB the chemical method has been extended into a fundamental method [5]. The response o f a solution prepared with particular sophistication is determined; within the scope o f a total absorption experiment using high energy electron radiation, this determination is reduced to the measurement o f the electron energy, the electric charge transported in the beam and the mass o f the ferrous sulphate solution. Measurement o f the total absorbed radiant energy is made possible by the specific properties o f the P T B ’s 5 MeV electron microtron. As a result o f the microtron’s acceleration principle, a pulsed electron beam of such an energy stability and selectivity is produced that the relative half-width o f the spectral energy distribution is 0.2% and the radiation can be considered practically monoenergetic. Figure 1 is a schematic representation o f the experimental set-up.
Via a beam guiding system with two pairs o f quadrupole lenses (2, 3, 6 , 7) and a 90° beam deflection chamber (11), the electron beam (1) from the microtron is guided to an absorber vessel (13) filled with ferrous sulphate solution. The charge transported in the beam is measured with an uncertainty of 0.3% [6] using a calibrated beam transformer ( 1 0 ) with an electronic evaluation device arranged behind. Another charge measuring device (8) is operated for checking purposes.
The kinetic energy of the electrons can be determined by means o f a magnetic spectrometer (12) with an uncertainty o f 0.2% [7]. (The components (4, 5, 9, 14) are needed for an experiment which is described in Section 3.)
Figure 2 shows the absorber vessel (3) filled with the ferrous sulphate solution and placed in the water bath (7) o f a thermostat (6 ) arranged below the beam tube exit window (1). A stirrer (4) magnetically coupled to a drive (5), whose sense of rotation can be reversed, ensures a homogeneous distribution of the F e3+ ions and o f the optical density.

2 8 R O O S and H O H L F E L D
The dimensions o f the absorber vessel have been chosen such that the electrons are totally stopped in the ferrous sulphate solution. The radiant energy transferred to the absorber is obtained as the product o f the kinetic energy of the electrons and the charge carried to the absorber divided by the elementary charge.
Corrections are required for:
— Energy loss due to bremsstrahlung escape,— Backscatter o f electrons by the absorber,— Energy loss in the material between the vacuum system and the ferrous sul
phate solution.
The mean absorbed dose generated in the solution is then equal to the mean specific energy (i.e. the expectation value o f the quotient of the radiant energy imparted to the solution and the mass of the solution). The response o f the ferrous sulphate system is obtained by measuring the corresponding change of the homogeneously distributed optical density using a spectral photometer. By varying the fractioning of the irradiation and the parameter dose per beam impulse it is ensured and verified that the dose rate dependence of G, the chemical yield o f the solution, is negligible. The unit o f water absorbed dose can in this way be realized with an overall uncertainty o f about 1 % (95% confidence level, as estimated by Feist [5]).
Since the above described method is highly elaborate — as are all methods currently used with which a comparably low uncertainty o f measurement can be reached — for the dissemination of the unit, the water absorbed dose was measured in a water phantom in the radiation field o f a “ Co 7 source under reference conditions using a calibrated solution dispensed into ampoules, thus making the radiation field a reference radiation field for the water absorbed dose. To avoid uncertainties due to the correction o f temperature dependent properties of the solution (see above), all measurements were carried out with the solution at the same temperature; this was ensured by regulating the temperature by means o f a thermostat.
As regards the use o f the solution under irradiation conditions differing from those prevailing during calibration, it has been assumed that G for photon and electron radiation at energies above 1 MeV is energy independent. It is estimated [5] that the uncertainty introduced by this assumption does not exceed ± 0 .5 % . Additional uncertainties follow from perturbation of the radiation field by the vessel walls.
3. THE W ATER ABSORBED DOSE CALORIM ETER, A PRIMARYSTANDARD FO R THE FUTURE
Besides the refinement o f the present primary standard, the water calorimetric method [8] is being developed as the standard of choice for the future. In contrast to the present method, it allows the water absorbed dose to be measured according to its definition, and possibly with lower uncertainties.

IAEA-SM-330/45 29
For the construction of the P TB’s water absorbed dose calorimeter, use was made o f well proven components o f Domen’s calorimeter [8 ]. Whereas the latter had been designed for ^C o y radiation normally incident from above, the PTB calorimeter has been set up for horizontally incident radiation. It will first be used for ^C o 7 radiation, but it is intended to extend its field of application at a later date to high energy photon and electron radiation. The calorimeter is operated at 4 °C , the temperature at which water has maximum density, so that no convection can occur.
Figure 3 shows the main components o f the calorimeter. The water is contained in a tank (7) made of PMMA, 30 cm in length, 30 cm in width and 30 cm in height. Thermal coupling to the environment has been deliberately reduced by a polystyrene layer (3) and a wooden enclosure (4) covered with aluminium foil. The whole set-up has been placed into a temperature stabilized container, whose temperature can be varied over a wide range. The water temperature can be adjusted by means of a combined heating-cooling device (5). By bubbling gas through fine glass tubes (6 ), the water can be agitated (prior to irradiation) to remove internal temperature gradients and to saturate it with gas o f known composition.
The radiation beam enters through the polystyrene entrance window (9) and strikes the water phantom, the radiation field extending over the whole phantom front surface.
The rise in temperature at the point o f measurement is measured using two thermistors in a detector assembly (1). It consists essentially o f two PMMA rings (between which two thin polystyrene foils have been expanded) by which the thermistors are fixed and electrically insulated from the surrounding water. The thermistors are arranged on two opposite branches o f a Wheatstone bridge; the unbalance o f the bridge is measured by means o f a nanovoltmeter and registered by a recorder as a function of time.
2
FIG. 3. The ■water absorbed dose calorimeter. (1 ) Exchangeable detector assembly fixed in support (2), (3) polystyrene insulation, (4) wooden enclosure covered with aluminium foil, (5) combined heating-cooling device, (6) glass tubes for gas supply, (7) PMMA tank filled with water, (8) axis of the extended radiation field, (9) beam entrance window.

30 R O O S and H O H L F E L D
The radiation induced rise in temperature related to the water absorbed dose is 0 .24 mK/Gy; with the radiation sources available, it usually remains below 1 mK, even at irradiation times o f several minutes.
In the measurement position, the thermistors and the whole temperature measuring device are calibrated against a secondary standard thermometer, which is always on hand. This allows the radiation induced temperature increase to be determined from the change in the thermistors’ resistance, and this with a relative standard deviation of less than 0 . 1 % for the mean of a daily set o f measurements.
If the energy imparted is completely transformed into heat, the water absorbed dose at the point o f measurement is in general obtained by simply multiplying the radiation induced rise in temperature by the specific heat capacity o f water, cp, which is very precisely known. In reality, however, some complications have to be taken into account. For example, all conceivable influences and influence quantities are at present being investigated, special attention being given to the effect o f electrical power dissipated in the thermistors, which causes an increase in temperature of about 2 .5 mK per watt o f thermistor power. At a typical power o f 8 W , the thermistor temperature is approximately 20 mK above the temperature o f the surrounding water. Although this influence has been included in the calibration, it must be ensured that, for example, thermal coupling of the thermistors to the surrounding water is not subject to slow, reversible changes as a result of the irradiation. To investigate this influence, experiments at different powers are being carried out which, on the basis o f a suitable physical model, will possibly allow such influences to be corrected by extrapolating the results to zero heating power.
A considerable complication in water absorbed dose calorimetry results from the radiolysis o f water during irradiation, which means that the heat generated during radiation absorption can differ from the energy imparted by radiation. The relative fraction, which either cannot be measured as heat (in the case o f endothermie chemical reactions) or can be revealed as additional heat (in the case o f exothermic chemical reactions), is referred to as the heat defect. Fletcher [9] used the Boyd- Carver-Dixon model [10] covering the 28 most important reactions from among the reactions concurrently taking place during the irradiation of pure water, in order to calculate the reaction products, rates and energies in the radiolysis o f water, in particular the effects o f gases dissolved in water.
Ross et al. [11] succeeded in confirming, by experiment, the calculated differences in the extent o f the heat defect for various dissolved gases. According to the calculations, the heat defect for the conditions o f interest here, i.e. radiation with low linear energy transfer (LET), excluding the range of low doses, should be zero. The slightest impurities in the water may, however, change the energy balance by several per cent. According to theory, the effect in the range of high energy photon and electron radiation with low LET is independent of the beam quality. To establish the water absorbed dose calorimeter as the primary standard measuring device, the heat defect for the water quality actually found in the calorimeter must be determined by

IAEA-SM-330/45 31
methods which are independent o f dose measurements. For this purpose, two experimental methods have been developed at the PTB which allowed an absolute determination o f the defect to be carried out for the first time. One o f the methods is applied for high energy electron radiation [7], the other in the range o f soft X rays [12].
The first method is based on the total absorption o f electron radiation o f known energy and known particle flux in a water absorber. As for the chemical method used to realize the unit (Section 2), the microtron and its magnetic spectrometer and charge measuring devices provide the prerequisites necessary also for this experiment. As shown in Fig. 1, the electron beam (1) is focused on the entrance window o f the absorber (14) through the quadrupole lenses (2-5). The kinetic electron energy is determined with the magnetic spectrometer ( 12 ); the charge transported in the
beam is determined by means o f the beam transformer (9).The absorber vessel filled with water is arranged in a vacuum container flanged
to the beam guiding system in a temperature stabilized container. Before the
temperature increase produced by the absorbed radiation is measured, a uniform temperature distribution in the absorber is ensured using a magnetically coupled stirrer. The temperature increase is measured using two thermistors arranged on opposite branches o f a Wheatstone AC bridge followed by a lock-in amplifier. Subsequently, the electrical energy is measured which must be supplied by electrical heating to yield the same temperature increase, the heat exchange with the environment being the same. To achieve this, a heating resistor in the absorber is supplied from a highly stable current source. The product o f voltage drop at the heating resistor and time is measured by counting the pulses o f a calibrated voltage to frequency converter.
When determining the heat defect, account must be taken o f the fact that not all the electron energy is absorbed in the absorber. Part o f the energy is lost by backscatter o f electrons and by the bremsstrahlung produced by the slowing down o f the electrons, part o f which leaves the absorber. However, the correction factors differ only slightly from unity and have been determined using a coupled electron-photon transport calculation by the Monte Carlo method.
In this way, the heat defect o f water can be determined in absolute values for the respective correction factor with an uncertainty o f less than 0.5%. For highly pure, preirradiated water, the value zero is obtained for the heat defect.
The uncertainty with which the heat defect can be determined enters fully into the overall uncertainty o f the primary standard measuring device, independent o f the absolute value o f the correction factor. Decisive is the stability o f the defect. It may be expected that the use o f water with chemical additives, which define a stable defect largely independent o f impurities, will in the long run furnish the best results.

32 ROOS and HOHLFELD
For the realization o f the unit o f water absorbed dose for high energy photon and electron radiation, possible methods today are above all ionometric, chemical
and calorimetric methods. At the PTB, the chemical method has been extended into a fundamental measuring method and established as the primary standard measuring device o f Germany. Parallel to this, the water absorbed dose calorimeter is being developed using a method which will allow the water absorbed dose to be measured
according to its definition. It appears that, in the long run, this calorimeter may contribute to a reduction o f the uncertainties by which dose measurements are affected.
4. CONCLUSIONS
REFERENCES
[1] DEUTSCHES INSTITUT FÜR NORMUNG, Begriffe und Benennungen in der radiologischen Technik — Dosisgroflen und Dosiseinheiten, DIN 6814, Teil 3, Beuth, Berlin (1985).
[2] ELLIS, S.C., “ The dissemination of absorbed dose standards by chemical dosimetry: Mechanism and use of the Fricke dosemeter” , Ionizing Radiation Metrology (CASNATI, E., Ed.), Editrice Compositori, Bologna (1977) 163-180.
[3] SVENSSON, H., BRAHME, A., Ferrous sulphate dosimetry for electrons, a re- evaluation, Acta Radiol., Oncol. 18 (1979) 326-336.
[4] NAHUM, A.E., SVENSSON, H., BRAHME, A., “The ferrous sulfate GWalue for electron and photon beams: A semi-empirical analysis and its experimental support” , Seventh Symposium on Microdosimetry (Proc. Symp. Oxford, 1980), Vol. 2 (BOOZ, J., et al., Eds), EUR 7147, Harwood, New York (1981) 841-851.
[5] FEIST, H., Determination of the absorbed dose to water for high-energy photons and electrons by total absorption of electrons in ferrous sulphate solution, Phys. Med. Biol. 27 (1982) 1435-1447.
[6] DERIKUM, K., TRIER, J.O ., “ High accuracy absolute charge measurement of a low intensity electron beam” , paper presented at 1st Eur. Workshop on Beam Instrumentation and Diagnostics for Particle Accelerators, Montreux, 1993.
[7] ROOS, М., GROSSWENDT, G., HOHLFELD, K., An experimental method for determining the heat defect of water using total absorption of high-energy electrons, Metrología 29 (1992) 59-65.
[8] DOMEN, S.R ., An absorbed dose water calorimeter: Theory, design and performance, J. Res. Natl. Bur. Stand. 87 (1982) 211-235.
[9] FLETCHER, J.W ., Radiation Chemistry of Water at Low Dose Rates — Emphasis on the Energy Balance: A Computer Study, AECL-7834, Chalk River Nuclear Labs, Ontario (1982).
[10] BOYD, A.W., CARVER, M.B., DIXON, R.S., Computed and experimental product concentrations in the radiolysis of water, Radiat. Phys. Chem. 15 (1980) 177-185.

IAEA-SM-330/45 33
ROSS, C.K., KLASSEN, N.V., SMITH, G.D., The effect of various dissolved gases on the heat defect of water, Med. Phys. 11 (1984) 653-658.SELBACH, H.-J., HOHLFELD, K., KRAMER, H.-M., An experimental method for determining the heat defect of water using total absorption of soft X-rays, Metrología 29 (1992) 341-348.


IAEA-SM-330/66
ABSORBED DOSE MEASUREMENTS AT THE NETHERLANDS MEASUREMENTS INSTITUTE
T.W .M . GRIMBERGEN, E. V A N DIJK Department o f Electrical Standards
and Ionizing Radiation Standards,Netherlands Measurements Institute,Bilthoven, Netherlands
Abstract
ABSORBED DOSE MEASUREMENTS AT THE NETHERLANDS MEASUREMENTS INSTITUTE.
An absorbed dose to water calibration service for “ Co 7 radiation is under development at the Netherlands Measurements Institute. The service will be based on absorbed dose measured with a graphite calorimeter combined with a method to transfer absorbed dose from graphite to water. Intercomparison of absorbed dose to graphite with the United Kingdom National Physical Laboratory yielded a difference of only 0.05%. After transfer of absorbed dose from graphite to water, the dose was compared with the value measured with an ionization chamber calibrated by the Bureau international des poids et mesures, yielding a difference of 0.25%. Furthermore, the dose derived from the calorimeter measurements was compared with the result of ionization chamber measurements analysed according to the Dutch Code of Practice for the Dosimetry of High-Energy Photon Beams, yielding a difference of 0.7%. More absorbed dose intercomparisons have to be performed before the absorbed dose to water calibration can replace the air kerma calibration service.
1. INTRODUCTION
In 1991 the Dutch primary standards for ionizing radiation were transferred from the Dutch National Institute for Public Health and Environmental Protection (R IVM ) to the Netherlands Measurements Institute (NM I), which is the national standards laboratory in the Netherlands. After the transfer much effort was put into re-establishing the international traceability o f the primary standards for air kerma. Together with these standards a graphite calorimeter was transferred to NM I. Determination o f absorbed dose to water based on measurements with an earlier version o f the NM I calorimeter has been described previously [1-3].
In August 1992 a programme was started to obtain an absorbed dose to water calibration service for ^Co 7 radiation, based on the graphite calorimeter combined with a transfer method for conversion o f absorbed dose from graphite to water. The first aim was to bring the graphite calorimeter into operation and to establish international traceability o f absorbed dose to graphite measurements. At the same time
35

36 GRIMBERGEN and VAN DIJK
different methods for the conversion o f absorbed dose from graphite to water were studied in the literature. This paper describes the methods used to transfer the absorbed dose from graphite to water, the results o f an intercomparison o f absorbed dose to graphite with the United Kingdom National Physical Laboratory (NPL), and finally the preliminary results o f a comparison o f three independent methods to assess the absorbed dose to water in a “ Co beam.
2. M ATERIALS AND METHODS
2.1. Calorimeter measurements
The NM I calorimeter, built in 1985, is a copy o f the calorimeter built by Hofmeester in the late 1970s [1] and is o f the well known NIST design [4]. The calorimeter and accompanying measuring assembly are designed as a transportable system. The calorimeter was tested by the electrical calibration procedure, which yields the change in resistance o f the core thermistor per unit o f electrical energy
dissipated in the core by an additional heating thermistor. The result was within0.1 % o f the original value, measured in 1985. The random uncertainty in the electrical calibration factor derived from repeated electrical calibrations was 0 .2 % .’
The NM I high energy therapy level calibration facility consists o f a 55 TBq 60Co source (January 1993) and a collimator system providing a vertical beam (Fig. 1). Because o f the collimator system, the closest possible distance to the source is about 1.4 m. At this distance, the air kerma rate is approximately 0.13 Gy/min, which is sufficient for ionometric measurements but too low for accurate measure
ments with the N M I calorimeter. Therefore, all calorimetric measurements were performed at the Netherlands Cancer Institute (NK I), Amsterdam. The NK I 60Co therapy unit, which is mainly used for quality control measurements and research purposes, gives an air kerma rate o f approximately 0.5 Gy/min at a distance o f 85 cm from the source.
The irradiation conditions for the calorimeter measurements at NK I were as follows (nominal values): distance from source to calorimeter core 85 cm, field size at surface o f calorimeter 10 X 10 cm2, measuring depth 5 g/cm2. The readings o f the calorimeter were corrected for the effect o f the vacuum gaps around the core (+0.39% ). This correction was calculated using the results o f Monte Carlo calculations o f Boutillon [5].
1 All uncertainties mentioned in this paper refer to one standard deviation.

IAEA-SM-330/66 37
FIG. I. Cross-sectional view of the NMI 60Co 7 ray irradiation facility. 1, collimator system; 2, source container; 3, movable axis with №Co source (in irradiation position).
2.2. Ionization chamber measurements
For the ionometric measurements a cylindrical graphite phantom (diameter 30 cm, thickness and measuring depth variable) and a cubic water phantom (30 X 30 X 30 cm3), both suitable for measurements with the NE 2561 ionization chamber (NE Technology Ltd), were used. Measurements were made with two NE 2561 ionization chambers (serial numbers 183 and 246), connected to an NE 2560 electrometer with an HP 3468A multimeter as a digital readout instrument and placed in both the graphite and water phantoms. For the ionometric measurements in the NK I œCo beam the irradiations took place under the following condi
tions (nominal values): distance from source to detector 85 cm, field size at surface o f phantom 10 X 10 cm2, measuring depths from 3.8 to 5.8 g/cm2. Ionization
chamber readings were corrected for temperature, atmospheric pressure and source decay. The ratio o f absorbed dose to graphite and the chamber readings in the graphite phantom gives the absorbed dose to graphite calibration factor N c.

38 GREMBERGEN and VAN DLJK
2.3. Intercomparison of absorbed dose to graphite
The two N M I chambers were used as transfer instruments for an indirect intercomparison between absorbed dose to graphite standards o f NM I and NPL. This intercomparison was performed in January 1993. Both NM I and N PL measured dose to graphite in the photon beam o f the N PL 60Co Mobaltron unit. NPL made use o f
the three NE 2561 chambers (serial numbers 258, 260 and 261) which are in use as working standards for the N PL absorbed dose calibration service. These chambers were calibrated in the N PL cubic graphite phantom (17 x 17 x 17 cm3) against the N PL calorimeter, which is also o f the NIST design.
The irradiation conditions at NPL were as follows (nominal values): distance from source to detector 70 cm, measuring depth in NM I phantom 5 g/cm2, measuring depth in N PL phantom 5.6 g/cm2, dose rate 0.84 Gy/min.. The dose rate was
measured by N M I and NPL, making use o f their own chambers, electrometers, graphite phantoms and calibration factors. By performing the dose measurements in the same phantom as that in which the chambers were calibrated, the possible influence on the result due to different calibration geometries was cancelled out. In addition, measurements were made with the NPL chambers in the NM I phantom and with the NM I chambers in the N PL phantom. A ll results were normalized to a source to detector distance o f 70 cm and a measuring depth o f 5 g/cm2. Readings were corrected for temperature, atmospheric pressure, air humidity, ion recombination and source decay.
2.4. Transfer of absorbed dose from graphite to water
For the conversion o f absorbed dose from graphite to water two methods were applied. The first method, based on the scaling theorem o f O ’Connor [6 , 7] (also known as the method o f corresponding points), requires all distances to be scaled as the inverse ratio o f the electron densities o f water and graphite (Figs 2(a) and (b)). For the NM I graphite and water phantoms the ratio o f electron densities has the value 1.67. Under the conditions for which the scaling theorem holds, the ratio o f absorbed dose at the corresponding points in the water and graphite phantoms is
given by:
A v 1 0*ei/P)w ffiw
~ 5 7 “ (i.6 7 )2 o w p )c &
where the subscripts w and с refer to water and graphite, respectively, the factor 1/(1.67)2 corrects for the inverse square law, /Zen/p is the mean mass energy absorption coefficient for ^Co 7 radiation, and /3 is the quotient o f the absorbed dose divided by the collision kerma. In this work the value o f 1.1109 was adopted for the

IAEA-SM-330/66 39
(a ) ( b ) ( c )
FIG. 2. (a) Irradiation geometry with graphite phantom; (b) irradiation geometry with water phantom and all dimensions scaled with the ratio of electron densities of water and graphite (scaling factor: 1.67); (c) irradiation geometry with water phantom used in this work.
ratio 0 Xen/p)w/GWp)c [8 ], and the ratio was assumed to be equal to 1 for ^C o 7 radiation.
In the experimental set-up used in this work the requirements for scaling were not completely fulfilled (Fig. 2(c)). Consequently, two corrections had to be made. Firstly, a correction was required for the fact that the measuring depth was not scaled properly. The absorbed dose to graphite measurements were done at 5 g/cm2, instead o f 5.54 g/cm2, which corresponds to a scaled depth o f 5 g/cm2 in water. This correction amounts to 1.5%.
Secondly, a correction had to be made because the source to detector distance was kept the same for both the graphite and water phantoms. In this way, there is no correction for the inverse square law, which is necessary in Eq. (1), but the beam size is smaller than that at the scaled distance. This in turn gives different amounts o f phantom scatter in the water phantom at the scaled distance (142 cm) and the
actual distance (85 cm). Additional measurements were made by NK I to determine the contribution o f head and phantom scatter in the ^C o beam for different beam sizes. The correction factor is given by the ratio o f the phantom scatter factors for the scaled beam size (16.7 x 16.7 cm2) and the actual beam size (10 x 10 cm2) and amounts to 3.6%.

40 GRIMBERGEN and VAN DUK
Both the graphite and water phantoms were assumed to be ‘ large enough’ .Therefore, no corrections were applied for differences in their scaled sizes andshapes. The error caused by making this assumption will be calculated in the near future with the Monte Carlo method. The two correction factors, combined with the ratio o f mass energy absorption coefficients, give the ratio o f absorbed dose to water and graphite at a depth o f 5 g/cm2: Cc_ w = 1.0552 (+ 0.4%).
The second method to transfer absorbed dose from graphite to water makes use o f ionometric measurements in both graphite and water. In this case, the factor Cc-W for conversion o f absorbed dose from graphite to water is given by:
M w NwQ - W = — - — — (2)
M c Nr W
with A/w and Mc the corrected ionization chamber readings in the water phantom and graphite phantom, respectively, and Nw and Nc the chamber calibration factors for absorbed dose to water and graphite, respectively. The ratio o f the absorbed dose calibration factors in water and graphite was determined by NPL [8 ] for the NE 2561 chamber to be 1.1292. The ratio o f chamber readings in water and graphite multiplied by the ratio o f calibration factors gives the ratio o f dose to water and graphite: Cc_ w = 1.0547 ( ± 0.3%). Because o f the excellent agreement o f the two transfer methods (difference <0.05% ) the mean value 1.0550 was adopted for the conversion factor Cc„ w.
2.5. Absorbed dose to water
For the determination o f absorbed dose to water three methods were compared. The first method is based on the calorimetric measurements with the NM I graphite calorimeter and the conversion to water, as discussed in the previous section. The dose to water, Dw NMI, determined in this way is given by:
^w.nmi Dc Cc_ w (3)
The two other methods are based on ionometric measurements. For these measurements, the NE 2561 chamber with serial number 246 was placed in the NM I water phantom in the NK I 60Co beam.
The first ionometric method makes use o f an air kerma calibration factor NK and the Dutch Code o f Practice for the Dosimetry o f High-Energy Photon Beams[9]. The NE 2561 chamber, connected to the electrometer, was calibrated against the Dutch primary standard for 60Co radiation [10]: N k nm[ = 0.9357 Gy/V ( + 0.5%). The dose to water, Dw code, is given by:
^w.code - M wNKNMi Cw u ( 4 )

IAEA-SM-330/66 41
with M w the corrected ionization chamber reading in water and Cw u the air kerma to absorbed dose to water conversion factor. For the NE 2561 in a 60Co beam this conversion factor has the value 1.079 ( + 1.0%), according to the Dutch Code o f
Practice.The second ionometric method was to apply an absorbed dose to water calibra
tion factor, 7VWibipm = 1.0193 Gy/V ( ± 0.5%), measured by the Bureau international des poids et mesures (BIPM ) during an intercomparison between NM I and BIPM in December 1991. The absorbed dose obtained in this way is simply given by:
Av.BIPM = -^w^w.BIPM (5 )
3. RESULTS OF ABSORBED DOSE MEASUREMENTS
The results derived from the calorimeter measurements mentioned in this section are based on the first series o f measurements in the NK I ^C o beam. The random uncertainty o f the mean o f 16 calorimeter runs o f 10 min was +0.15%. The absorbed dose rate to graphite at 5 g/cm2 was 0.4855 Gy/min, with a total uncertainty o f +0.3% . More measurements with the calorimeter are planned in the near future. Therefore, the calorimeter results have to be regarded as preliminary.
3.1. Results of NMI-NPL intercomparison
The ratio o f dose rates to graphite measured by N M I and NPL, making use
o f their own chambers, electrometers, graphite phantoms and calibration factors, was:
= 0.9995^c,NPL
This result indicates that the absolute values o f the absorbed dose measured by the NM I and N PL calorimeters agree to well within the la uncertainties o f 0.5% for NPL and 0.4% for NMI.
The ratio o f absorbed dose rates at 5 g/cm2 in the NM I and N PL phantoms, measured by both NM I and NPL, was:
DC(N M I phantom)— ------- - --------- - = 1.0071 ( ± 0.15%)D C(N PL phantom)

42 GRIMBERGEN and VAN DIJK
The NM I and N PL graphite calorimeters agree to within 0.1% so it was expected that the dose rates in the two phantoms would show similar agreement. However,
the measured ratio o f 1.0071 indicates that there are significant differences between the phantoms. The phantoms may differ in their dimensions, their equivalence in terms o f scattering and the variation o f the density o f graphite used in their construction; at present the cause o f the 0.7% difference is unexplained.
3.2. Absorbed dose to water
The absorbed dose rate to water in the NK I ^C o beam derived from the
calorimeter measurements and conversion to water was Z)w NMi = 0.5122 Gy/min (±0 .4 % ). In the near future, it will be possible to calibrate chambers in the NM I 60Co beam against NE 2561 chambers used as transfer standards, which in turn are calibrated against the calorimeter in the NK I ^Co beam. Allowing for some additional uncertainty due to the use o f transfer standards and differences in irradiation geometries, the estimated uncertainty o f the absorbed dose to water measured in the NM I “ Co beam will be about 0.5%. At a later stage, the NM I ^Co irradiation facility will be replaced by a ^Co therapy unit which will be suitable for calorimetric measurements, so that it will be possible to do all measurements at NM I in the same irradiation geometry.
The corrected reading o f the NE 2561 ionization chamber in the water phantom, combined with the Cw>u factor and the NM I air kerma calibration factor, yielded an absorbed dose rate to water o f D wcoáe = 0.5086 Gy/min ( ± 1.1%).
Applying the absorbed dose to water calibration factor /Vw BIPM, the value
Av.bipm = 0.5135 Gy/min ( ± 0 .6 %) was obtained.
The ratios o f the results o f the two ionometric methods and the calorimetric method are therefore:
- £>w’nmi = 1.007 (+ 1.2%)Г )■£* 'w fcode
and
- Dw’nmi = 0.9975 ( ± 0.7%)Av.BIPM
The agreement between D w N M i a n d ^ w .b i p m seems very satisfactory, although it should be noted that the uncertainty in the ratio £>w NMI/£)w BIpM is relatively large because o f the indirect way o f comparing the absorbed dose to water (using only one chamber as a transfer standard). To reduce the uncertainty a more direct method o f

IAEA-SM-330/66 43
comparing the absorbed dose standards o f NM I and BIPM should be used. The values found for D w code and Dw N M i a l s o agree to within the uncertainties. The
uncertainty in the ratio jDw,NMi^w,code *s mainly determined by the uncertainty in the Cwu factor.
4. CONCLUSIONS
The results o f the intercomparison o f absorbed dose to graphite with NPL give reasonable confidence in the absolute values for absorbed dose to graphite measured with the N M I graphite calorimeter. An intercomparison with BIPM, to be performed
in the near future, should confirm these results. Further work has to be done to explain the difference o f 0.7% in the ionometric measurements in the NM I and NPL graphite phantoms.
The results o f three independent ways to determine absorbed dose to water in a 60Co beam agree to within 1%. By making use o f NE 2561 ionization chambers, calibrated against the graphite calorimeter in the 60Co beam o f NKI, it will be possible in the near future to measure the absorbed dose to water in the ^C o beam o f NM I with an estimated uncertainty o f 0.5%.
ACKNOWLEDGEMENTS
The authors would like to thank B.J. Mijnheer and F.W . Wittkámper o f the Netherlands Cancer Institute for giving them the opportunity to do the measurements in the NK I ^C o beam and for their help with the experiments, and B. Owen and staff o f the National Physical Laboratory, United Kingdom, for their co-operation and hospitality during the intercomparison o f absorbed dose to graphite.
REFERENCES
[1] H O F M E E S T E R , G.H., “Calorimetric determination of absorbed dose in water for
1-25 M e V X-rays”, Biomedical Dosimetry (Proc. Symp. Paris, 1980), IAEA, Vienna
(1981) 235-258.
[2] A A L B E R S , A.H.L., V A N D U K , E., W I T T K A M P E R , F.W., M U N H E E R , B.J.,
“Determination of absorbed dose to water in clinical photon beams using a graphite
calorimeter and a graphite-walled ionization chamber”, Dosimetry in Radiotherapy
(Proc. Symp. Vienna, 1987), Vol. 1, IAEA, Vienna (1988) 37-48.
[3] M U N H E E R , B.J., W I T T K A M P E R , F.W., A A L B E R S , A.H.L., V A N D U K , E.,
Experimental verification of the air kerma to absorbed dose conversion factor C wu,
Radiother. Oncol. 8 (1987) 49-56.

44 GRIMBERGEN and VAN DUK
[4] D O M E N , S.R., L A M P E R T I , P.J., A heat-loss-compensated calorimeter: Theory,
design, and performance, J. Res. Natl. Bur. Stand., A Phys. Chem. 78 (1974)
595-610.
[5] B O U T I L L O N , M . , Gap correction for the calorimetric measurement of absorbed dose
in graphite with a 60Co beam, Phys. Med. Biol. 34 (1989) 1809-1821.
[6] O ’C O N N O R , J.E., The variation of scattered X-rays with density in an irradiated body,
Phys. Med. Biol. 1 (1956) 352.
[7] O ’C O N N O R , J.E., The density scaling theorem applied to lateral electronic
equilibrium, Med. Phys. 11 (1984) 678.
[8] B U R N S , J.E., D A L E , J.W.G., Conversion of Absorbed Dose Calibration from
Graphite into Water, N P L Rep. RSA(EXT)7, NPL, Teddington, U K (1990).
[9] N E T H E R L A N D S C O M M I S S I O N O N R A D I A T I O N D O S I M E T R Y , Code of Practice
for the Dosimetry of High-Energy Photon Beams, Rep. 2, NCS, Bilthoven (1986).
[10] H O F M E E S T E R , G.H., S O M E R W I L , A., Absolute exposure measurements in the
Netherlands in the 10-250 k V X-ray region and for “Со y rays, J. beige radiol. 58
(1975) 481-486.
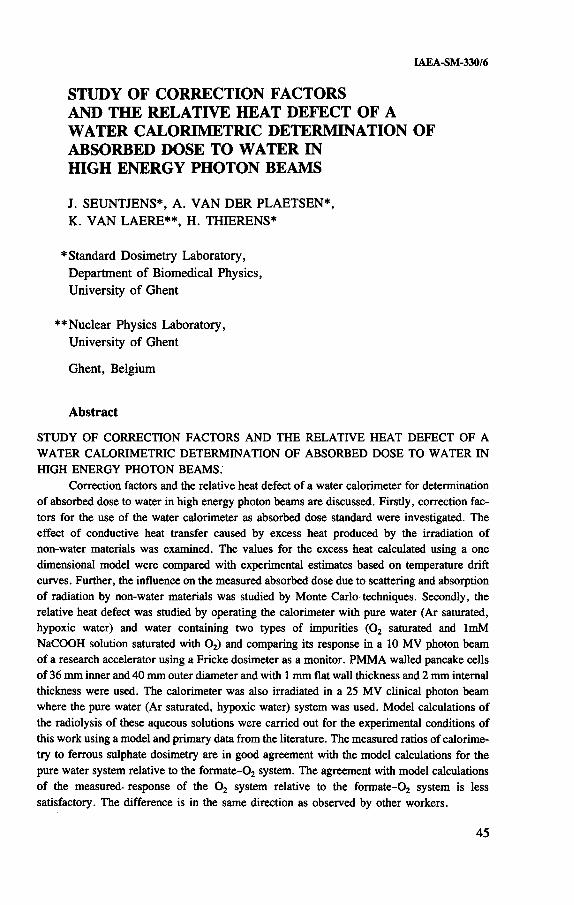
IAEA-SM-330/6
S T U D Y O F C O R R E C T I O N F A C T O R S A N D T H E R E L A T I V E H E A T D E F E C T O F A W A T E R C A L O R I M E T R I C D E T E R M I N A T I O N O F A B S O R B E D D O S E T O W A T E R I N H I G H E N E R G Y P H O T O N B E A M S
J. SEUNTJENS*, A. VAN DER PLAETSEN*,K. VAN LAERE**, H. THIERENS*
* Standard Dosimetry Laboratory,Department of Biomedical Physics,University of Ghent
* * Nuclear Physics Laboratory,University of Ghent
Ghent, Belgium
Abstract
STUDY OF CORRECTION FACTORS AND THE RELATIVE HEAT DEFECT OF A WATER CALORIMETRIC DETERMINATION OF ABSORBED DOSE TO WATER IN HIGH ENERGY PHOTON BEAMS.
Correction factors and the relative heat defect of a water calorimeter for determination of absorbed dose to water in high energy photon beams are discussed. Firstly, correction factors for the use of the water calorimeter as absorbed dose standard were investigated. The effect of conductive heat transfer caused by excess heat produced by the irradiation of non-water materials was examined. The values for the excess heat calculated using a one dimensional model were compared with experimental estimates based on temperature drift curves. Further, the influence on the measured absorbed dose due to scattering and absorption of radiation by non-water materials was studied by Monte Carlo-techniques. Secondly, the relative heat defect was studied by operating the calorimeter with pure water (Ar saturated, hypoxic water) and water containing two types of impurities (0 2 saturated and ImM NaCOOH solution saturated with 02) and comparing its response in a 10 MV photon beam of a research accelerator using a Fricke dosimeter as a monitor. PMMA walled pancake cells of 36 mm inner and 40 mm outer diameter and with 1 mm flat wall thickness and 2 mm internal thickness were used. The calorimeter was also irradiated in a 25 MV clinical photon beam where the pure water (Ar saturated, hypoxic water) system was used. Model calculations of the radiolysis of these aqueous solutions were carried out for the experimental conditions of this work using a model and primary data from the literature. The measured ratios of calorimetry to ferrous sulphate dosimetry are in good agreement with the model calculations for the pure water system relative to the formate-02 system. The agreement with model calculations of the measured- response of the 0 2 system relative to the formate-0 2 system is less satisfactory. The difference is in the same direction as observed by other workers.
4 5

46 SEUNTJENS et al.
In order to reduce basic uncertainties associated with the transfer of the quantity air kerma at ^Co to absorbed dose to water in a high energy photon beam, direct calibration of an instrument in terms of absorbed dose to water is necessary. Absorbed dose standards in this energy range are based on graphite calorimeters yielding the absorbed dose to graphite [1, 2] or on the total absorption of a known amount and energy of high energy electrons in a ferrous sulphate solution [3]. However, the intercomparison of both types of absorbed dose standards for high energy photon beams is much less satisfactory than for the air kerma standards in б0Со y rays. Therefore, work is under way in several standard laboratories to develop absorbed dose standards based on water calorimetry.
Absorbed doses determined using the first generation of open water calorimeters [4, 5] were uncertain owing to an inadequate knowledge of the heat defect of water. Ross et al. [6] have defined the heat defect h (or thermal defect) as:
1. INTRODUCTION
where Ел is the energy absorbed in the water and Eh the energy appearing as a temperature rise. It was shown by Ross et al. [6] that the most important component in the heat defect for radiation with low linear energy transfer (LET) is the chemical heat defect caused by radiation induced chemical reactions. Experimental evidence for the agreement between water calorimetry and a theoretical understanding of the chemical heat defect for low LET radiation supported this finding [7-11].
In highly refined experiments Ross et al. [6] and Klassen and Ross [10] measured the response of a sealed, stirred glass walled water calorimeter in a 20 MV X ray beam containing water with well defined impurities. Their measurements compared excellently with the results of model calculations of the radiolysis of water under the same physicochemical conditions. Schulz et al. [9] also obtained agreement between water calorimetry and ionization chamber dosimetry based on the dosimetry protocol of the American Association of Physicists in Medicine [12], using a large high purity glass-core stagnant hypoxic water calorimeter in “ Co and 4, 6 and 25 MV X rays.
In order to better control the impurities that gave rise to an unpredictable heat defect in large open water calorimeters, an improved version of the NIST water calorimeter was proposed by Domen [13]. The latter design uses a small thin walled glass vessel containing high purity water and suspended in a large water phantom.
In this paper, correction factors and the relative heat defect of a similar stagnant water calorimeter [14, 15] are discussed for high energy photon beams (10 and 25 MV). The calorimeter is filled with three types of solution that are known to

IAEA-SM-330/6 47
exhibit distinct heat defects when irradiated with low LET radiation. The heat defect calculations in this work are performed for the conditions concerning accumulated dose, irradiation time and dose rate under which the irradiations are carried out. In the measurements a Fricke dosimeter served as a monitor.
2. W ATER CALO RIM ETRY
2.1. Calorimeter, equipment and calibration
The water calorimeter employed in the present study is the same as that used
for the determination o f correction factors to ionometry in medium energy X ray beams [15]. Figure 1 shows a cross-section o f the calorimeter with the beam entering from the left. Also shown is the detection vessel, a 4 cm diameter PM M A tube o f0.5 mm wall thickness and 14 cm length, containing high purity water. As a first step in the preparation, the calorimeter phantom is brought to the working temperature o f 25.8°C. The detector vessel is then removed from the calorimeter phantom, rinsed several times, filled with the desired solution and bubbled with high purity A r or 0 2 for 40-60 min. Then the vessel is closed, care being taken that the remaining gas bubble represents no more than 2 % o f the total calorimeter vessel volume, and reinstalled into the calorimeter.
The temperature increase due to radiation is measured using tiny glass thermistor probes (diameter 0.5 mm at the thermistor position) mounted in the centre o f the cylindrical detector vessel. The thermistors are serially connected with an AC
bridge. The out o f balance voltage is converted into a relative resistance change by using a fixed calibrated resistor switched into or out o f the bridge. The calibration o f the thermistor probes and other construction details have been described elsewhere [15, 14].
2.2. Irradiation geometries and calorimeter operation
Firstly, irradiations were performed with a high power research accelerator. The photon beam (TPRfo = 0.70, Em = 2.11 M eV) was generated by 10 MeV electrons impinging on a graphite target. A lead filter was used to flatten the incoming photon fluence distribution. The X ray beam passed through a circular collimator and a parallel plate ionization chamber [16]. The field was 14 cm in diameter at the phantom surface and the distance from the X ray source to the measuring point was 80 cm. Figure 2 shows the irradiation geometry in the lateral direction (jc) at the measuring depth as well as in the depth (г) on the central axis. The vertical broken lines show the (lateral) positions o f the thermistor probe ends (the points where the temperature rise is measured). The irradiation runs in the 10 M V beam were 60 s and the dose rate was 8 Gy/min.

48 SEUNTJENS et al.
P M M A
Styrofoam
expanded\polystyrene
beam
R 100 probe
point of measurement
circulating air
expanded polystyrene measuring depth stirrer window
screws for adj ustment of probes
FIG. 1. Top: cross-section of the calorimeter. The measuring point is located at a depth of 5 cm in the water in the centre of a cylindrical vessel. Bottom: the detection vessel.

IAEA-SM-330/6 49
D is t a n c e (m m )
FIG. 2. Irradiation geometry for the experiments performed with the 10 MV accelerator resulting from a lateral scan (x, circles) and a depth scan (z, full line) using a cylindrical ionization chamber. The zero on the x axis corresponds with the effective point of measurement in both scans. The x positions of the ends of the thermistor probes are indicated with vertical lines.
*E
4)l _3*-»(0
aE«h-
T im e ( s )
FIG. 3. Example of a recorder tracing of a calorimeter run in a clinical 25 MV photon beam (dose rate: 3.5 Gy/min) with 90 s irradiation time.

5 0 SEUNTJENS et al.
Secondly, the calorimeter was used to measure the absorbed dose in a clinical 25 M V (TPRjo = 0.80) photon beam o f a Philips SL25 accelerator. For these measurements the field size was 20 x 20 cm2 and the distance between X ray source and measuring point 100 cm. Figure 3 shows a 90 s calorimeter run in the 25 M V beam with a dose rate o f 3.5 Gy/min. The temperature increase per monitor unit was derived from lipear extrapolations o f the fore- and after-drift to mid-run. One standard deviation on five to six irradiation runs amounted typically to 0.4%.
3. FRICKE DOSIMETRY
Detailed descriptions o f the ferrous sulphate dosimeter have been published by various workers [17-20]. In this work the Fricke dosimeter mainly served as a monitor to compare the variation in calorimeter response with the physicochemical system
used.Fricke dosimetry was performed in the same irradiation geometry as the
calorimetry (in the calorimeter phantom) using small PM M A walled pancake cells o f 36 mm inner and 40 mm outer diameter and with an internal thickness o f 2 mm
and a flat wall thickness o f 1 mm. The radiation beam is incident on one o f the flat sides o f the cell and the measuring point correspónds with the centre o f the cell. A complete Fricke experiment consisted typically o f three irradiations. For these irradiations an absorbed dose o f at least 40 Gy was used. Each Fricke cell was evaluated directly after its irradiation, thus ensuring that storage effects due to spontaneous oxidation were completely negligible compared with the readout o f the irradiated cells. Corrections were applied to take into account the variation o f the radiation chemical yield G and the molar extinction coefficient e with irradiation and readout
temperature respectively.
4. CORRECTION FACTORS FOR A W ATER CALORIM ETRIC DETERM INATION OF ABSORBED DOSE TO W ATER IN
HIGH ENERGY PHOTON BEAMS
Using the stagnant calorimeter the absorbed dose was measured at a point in the centre o f the line connecting the two thermistor probe ends in the vessel. In order to convert the measured signal, assuming no heat defect, to the absorbed dose to
water the following equation is used:
£>w = cwS~l kscfcAni (2 )

IAEA-SM-330/6 51
where cw is the specific heat capacity o f water, S is the mean sensitivity o f the two thermistors as yielded by the calibration procedure against standard thermometry and
ARfo/Rfo is the relative thermistor bead resistance change. The product o f correction
factors consists of:
ksc a correction factor for scattering and absorption o f radiation by the calorimeter
vessel and thermistor probes; kc a correction factor for conductive heat transfer (heat loss or heat gain);feuni a correction factor for the non-uniformity o f the absorbed dose profile in the
measuring plane.
The value o f the last correction is only o f importance in the 10 M V photon beam o f the research accelerator and was evaluated on the basis o f measurements o f dose profiles at the measuring point. This evaluation will not be considered here.
4.1. Correction factor kx for scattering and absorption of radiation by the calorimeter vessel and thermistor probes
This correction was evaluated by performing an EGS4 Monte Carlo simulation o f the whole detector structure in the water phantom and calculating the ratio o f the signal without to the signal with vessel and probes. To this end a simplified
correlated-sampling variance-reduction technique was used [21]. In previous work corrections varying from 0.998 at 100 kV X rays to 1.000 at ^C o were found [15]. In the present work, for the 10 M V beam a photon fluence spectrum resulting from Monte Carlo calculations was used [22]; for the 25 M V beam, a 24 M V spectrum was taken from Mohan et al. [23]. The preliminary results o f this calculation are shown in Table I. Uncertainties represented are la on a set o f 10 batches. Results show that this correction is limited to (0.1 ± 0.4)% for 10 M V.
TABLE I. CORRECTION FACTORS FOR SCATTERING AN D ABSORPTION OF RAD IATIO N BY NON-W ATER M ATERIALS (DETECTION VESSEL AND THERMIS
TOR PROBES)
Beam descriptor/Beam quality кх(TPR^)
10 MV/0.70 0.999 ± 0.004
25 MV/0.80 0.999 ± 0.005

52 SEUNTJENS et al.
4.2. Correction factor kc for excess heat produced by the core wall
Conductive effects caused by non-uniformity o f the dose distribution are negligible for these types o f beams [24]. However, owing to excess heat generated in the wall o f the detector vessel because o f its lower specific heat, the temperature increase on the axis o f the vessel is larger than that o f the water. The correction factor kc takes into account this excess heat and was evaluated by a finite difference calculation. For this calculation a uniform depth dose distribution was assumed for both the 10 M V and the 25 M V photon beam and the rate o f temperature increase o f the vessel wall divided by that o f water was calculated as:
A rwall = ATW (3)\P / wall,w Cwall
where (S/p)waU>w is the (unrestricted collision) stopping power ratio o f the vessel wall material (PM M A) to water and cw/cwall the ratio o f the specific heat capacities o f water to wall. In the model calculation adiabatic boundary conditions are assumed at the points far from the measuring point. Figure 4 shows the calculated excess temperature at the centre o f the vessel against time after irradiation runs o f 60 s and 90 s
T im e a f t e r ir r a d ia t io n s t o p ( s )
F IG . 4. P lo t against tim e o f calculated relative temperature (real/ideal temperature ratio) at
the p o in t o f measurement caused by excess heat produced in the ca lorim eter co re wall f o r a
60 s run (fu ll line ) and a 90 s run (broken line).
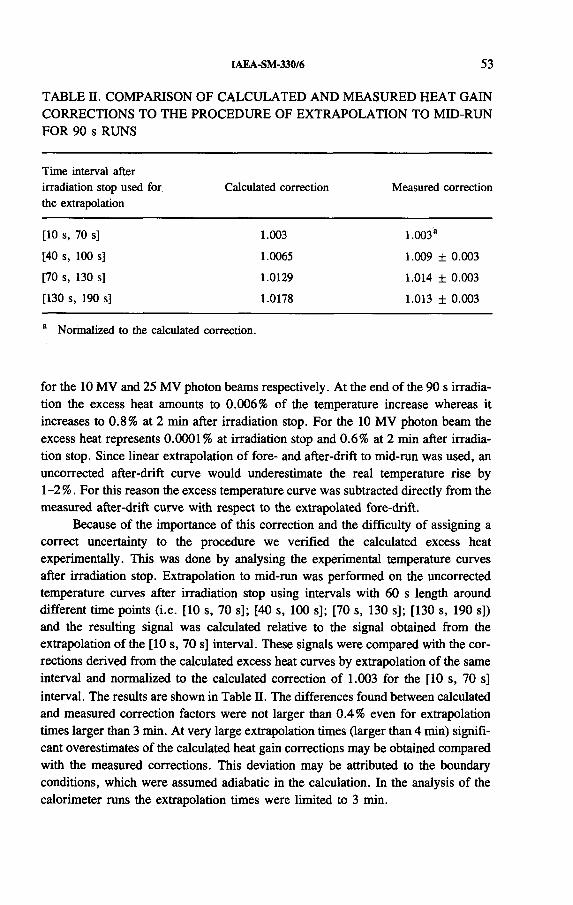
IAEA-SM-330/6 53
TABLE П. COMPARISON OF CALCULATED AN D MEASURED HEAT GAIN CORRECTIONS TO THE PROCEDURE OF EXTRAPO LATIO N TO MID-RUN FOR 90 s RUNS
Time interval after irradiation stop used for the extrapolation
Calculated correction Measured correction
[10 s, 70 s] 1.003 1.003a
[40 s, 100 s] 1.0065 1.009 ± 0.003
[70 s, 130 s] 1.0129 1.014 ± 0.003
[130 s, 190 s] 1.0178 1.013 ± 0.003
a Normalized to the calculated correction.
for the 10 M V and 25 M V photon beams respectively. At the end o f the 90 s irradiation the excess heat amounts to 0.006% o f the temperature increase whereas it increases to 0.8% at 2 min after irradiation stop. For the 10 M V photon beam the excess heat represents 0 .0 0 0 1 % at irradiation stop and 0 .6 % at 2 min after irradiation stop. Since linear extrapolation o f fore- and after-drift to mid-run was used, an uncorrected after-drift curve would underestimate the real temperature rise by 1-2%. For this reason the excess temperature curve was subtracted directly from the measured after-drift curve with respect to the extrapolated fore-drift.
Because o f the importance o f this correction and the difficulty o f assigning a correct uncertainty to the procedure we verified the calculated excess heat experimentally. This was done by analysing the experimental temperature curves after irradiation stop. Extrapolation to mid-run was performed on the uncorrected temperature curves after irradiation stop using intervals with 60 s length around different time points (i.e. [10 s, 70 s]; [40 s, 100 s]; [70 s, 130 s]; [130 s, 190 s]) and the resulting signal was calculated relative to the signal obtained from the extrapolation o f the [10 s, 70 s] interval. These signals were compared with the cor
rections derived from the calculated excess heat curves by extrapolation o f the same interval and normalized to the calculated correction o f 1.003 for the [10 s, 70 s]
interval. The results are shown in Table П. The differences found between calculated and measured correction factors were not larger than 0.4% even for extrapolation times larger than 3 min. A t very large extrapolation times (larger than 4 min) significant overestimates o f the calculated heat gain corrections may be obtained compared with the measured corrections. This deviation may be attributed to the boundary conditions, which were assumed adiabatic in the calculation. In the analysis o f the calorimeter runs the extrapolation times were limited to 3 min.

5 4 SEUNTJENS et al.
5. STUDY OF THE RELATIVE HEAT DEFECT OF THE W ATERCALORIM ETER
5.1. Model calculations of the radiolysis of water
The calorimeter was operated in the 10 M V beam using three physicochemical systems where significantly different heat defects were expected. A pure water system (four times distilled water saturated with Ar), water saturated with 0 2 and
a Im M NaCOOH solution saturated with 0 2 were chosen for this study. The choice o f these three systems is based on the fact that, according to model calculations [6 , 10 ], heat defects are yielded that are endothermie ( + 2 .1 %) for the 0 2
saturated system, exothermic ( - 2 .6 %) for the formate system and close to zero for the pure water system in a steady state situation. However, the exact values o f the heat defect depend on the history o f the irradiations o f the calorimeter and the numbers valid for the work o f Klassen and Ross [10] may deviate slightly from the heat defects observed in our irradiations. For this reason calculations were carried out using the dose rates and absorbed doses o f our experiments.
Heat defect calculations are based on a study o f the radiolysis o f a homogeneous mixture o f water with well defined impurities. The calculated evolution o f product concentrations with time depends on the concentrations C, and on the reac
tion rate constants kj k according to:
d C"— ^ kjkCjCk for all species i (4)
j.k
where the summation is for the reactions leading to the formation o f the componentC, . The heat defect can be calculated from the energy balance o f the product yields using published values for the heats o f formation. For the calculations o f this work the same model, primary yields, rate constants and heats o f formation as those o f Klassen and Ross [10] were used. The product yields were calculated using the code system LSODE [25], which is capable o f solving a coupled set o f stiff differential equations represented by Eqs (4). The simulation time depends on the complexity o f the model and took typically a few minutes on a 486/33 M Hz U N IX system.
The escape o f the gaseous components H2 and 0 2 from the liquid to the gas phase may prevent a stationary state from being reached and may therefore influence the heat defect. In our program gas transfer was taken into account in a simplified fashion by assuming that in the equilibrium situation (i.e. a relatively long time after
irradiation stop) the distribution o f H2 and 0 2 gas between the liquid and gas phases was in agreement with Henry’s law. This was done by adapting the concentrations o f H2 and 0 2 taking into account Henry’s constants for H2 and 0 2 at the calorimeter
temperature and the volumes o f the liquid and gas phases (in fact the volume ratio).

IAEA-SM-330/6 55
TABLE Ш. CALCULATED HEAT DEFECTS FOR THE THREE SYSTEMS USED IN THIS W ORK
System Calculated heat defect, h
Pure water (Ar saturated) +0.2% (endothermie, for 30-70 Gy) +0.1% (endothermie, for 80-160 Gy)
Pure water (0 2 saturated) +2.3% — +2.0% (endothermie, for 0-60 Gy)(1.4mM 0 2) + 1.7% (endothermie, for 160-240 Gy)
(after measurements at lower accumulated doses)+ 1.9% — +1.8% (endothermie, for 200-400 Gy) (after one continued preirradiation)
NaCOOH solution, 0 2 saturated —2.4% (exothermic, for 0-40 Gy)(ImM formate; 1.4mM 0 2) —2.7% (exothermic, for 150-170 Gy)
W e are aware that this simplification yields an overestimation o f the effect o f gas transfer in cases where the gas space is comparable with the volume o f the liquid phase, such as in the calorimeter used in the work o f Klassen and Ross [10]. For our calorimeter, however, where the gas space represented less than 2 % o f the
volume o f the liquid phase, the differences in calculated heat defect between the situations with and without gas transfer were less than 0 .2 %.
The simulated irradiation times amounted to 60 s and the average time between two successive irradiations was 300 s. One set o f experiments consisted typically o f six irradiations, some o f which had interspersed a longer irradiation o f up to several hundred grays, with twice the dose rate used for the individual runs. In any case, the heat defect calculations were carried out for the exact conditions concerning timing, dose rate and dose as encountered during the experiments. The values, averaged over one measuring set, are shown in Table Ш.
5.2. Experimental study of the relative heat defect
O f the three systems used in this work, the formate-02 system contains a scavenger for the OH* radicals and is therefore the least dependent on organic impurities. During the measurements the response o f the calorimeter filled with
ImM NaCOOH and saturated with 0 2 was indeed found to be independent o f accumulated dose and the initial spuriously high calorimeter readings as observed with the other two systems were not produced with this system (Fig. 5). The results o f the determinations o f absorbed dose o f the water calorimeter for the three systems, taking into account the correction factors discussed above, are shown in Fig. 6 . It should be noted that for the irradiations in the 25 M V beam only the pure water

56 SEUNTJENS et al.
A c c u m u la t e d d o s e (G y )
FIG. 5. Relative calorimeter response as a junction of accumulated dose for the formate-02 system (broken line) and 02 system (full line).
system was used. Therefore, in order to show also the 25 M V result in the same
figure, all doses have been normalized on the absorbed dose to water as
determined with the Fricke dosimeter. To this end a constant eG value o f352 X 10" 6 m2 -kg_1 -Gy” 1 [26] and a dose-to-ferrous-sulphate to dose-to-water conversion factor o f 1.003 were incorporated in the calculations. Each point shown corresponds with an average value o f at least six successive steady state calorimeter runs and the error bars represent only la on the calorimeter measurements. The results o f the model calculations o f the heat defect for each o f the systems under the same experimental conditions are shown by the broken lines.
The calorimeter heat defect for the pure water system relative to the formate- 0 2 system is in good agreement with the predicted behaviour based on the model calculations: the calculated difference was 2 .6 % and the measured difference (2.3 ± 0.5)%. The agreement o f the measured heat defect with model calculations for the 0 2 saturated system producing an endothermie heat defect is less satisfactory. The 0 2 system is, relative to the formate-02 system, less endothermie than expected from the calculations: (3.5 ± 0.5)% was the measured difference in heat defect, compared with the 4.3% expected. This deviation has the same sign as observed by Klassen and Ross [10]. The calorimeter response in this case depended much more on the accumulated dose and the impurities initially present (e.g. see Fig. 5). It was also observed that the effect o f impurities extended to larger doses than initially thought. After a more pronounced initial decrease o f the response with
accumulated dose (2-3 % over 50 Gy) a gradual decrease o f calorimeter response o f

IAEA-SM-330/6 57
C a lo r im e t e r s y s t e m
FIG. 6. Results of the absorbed dose determinations using the water calorimeter relative to Fricke dosimetry (with eG = 352 x 10~6 m2-kg1 -Gy~l and 1.003 for the dose-to-Fricke to dose-to-water conversion factor): + 10 MV; о 25 MV.
only 1.9% was observed in the dose range 60-160 Gy before stable response could be obtained in the range from 170 up to 400 Gy with several periods o f continuous irradiation. For the pure water system also preirradiation was necessary for stable
response although not as high as was necessary for the 0 2 saturated system.The fact that in some cases higher accumulated doses were required than ini
tially expected may be due to additional impurities probably arising as a product o f initial impurities or as a result o f the fact that the wall o f the calorimeter vessel is PM M A.
6 . CONCLUSIONS
The operation o f a large water calorimeter containing a thin walled PM M A core and filled with three solutions, each producing a specific heat defect, has been described. In addition, the correction factors for heat loss due to the excess heat produced in the wall, and for scattering and absorption o f radiation have been evaluated.

58 SEUNTJENS et al.
The study o f heat conduction produced by excess heat in the detector vessel wall showed that the temperature on the axis o f the detector vessel can accurately be described using a one dimensional finite difference calculation for extrapolation times o f less than 4 min. For 90 s irradiation runs, corrections are necessary in the ‘ linear to mid-run’ extrapolation procedure, varying from 0.9 to 1.4% for times from 70 to 130 s after irradiation stop.
Scattering and absorption o f radiation influence the measured absorbed dose on the axis o f the vessel. This effect, calculated by Monte Carlo techniques, was shown to be limited to (0.1 ± 0.4)% at 10 MV.
A study o f the response o f the calorimeter showed a good agreement between calculated and measured relative heat defects for the pure water system relative to
the formate-02 system. The deviation o f the calculated and measured heat defects o f the 0 2 saturated system relative to the formate-0 2 system is probably due to impurities persisting at higher accumulated doses.
The water calorimeter allows a direct comparison o f absorbed doses with Fricke dosimetry and therefore determination o f the radiation chemical yield o f the Fricke dosimeter for high energy photons. To this end the number o f physicochemical systems and high energy photon beams will be increased.
REFERENCES
[1] BURNS, J.E ., DALE, J.W .G., DuSAUTOY, A.R., OWEN, B., PRITCHARD, D.H., “New calibration service for high energy X-radiation at NPL” , Dosimetry in Radiotherapy (Proc. Symp. Vienna, 1987), Vol. 2, IAEA, Vienna (1988) 125-132.
[2] INSTITUTE OF PHYSICAL SCIENCES IN MEDICINE, Code of practice for high- energy photon therapy dosimetry based on the NPL absorbed dose calibration service, Phys. Med. Biol. 35 (1990) 1355-1360.
[3] FEIST, H., Determination of the absorbed dose to water for high-energy photons and electrons by total absorption of electrons in ferrous sulphate solution, Phys. Med. Biol. 27 (1982) 1435-1447.
[4] DOMEN, S.R., An improved absorbed dose water calorimeter, Med. Phys. 8 (1981) 552-553.
[5] DOMEN, S.R ., An absorbed dose water calorimeter: Theory, design and performance, J. Res. Natl. Bur. Stand. 87 (1982) 211-235.
[6] ROSS, C.K., KLASSEN, N.V., SHORTT, K.R., SMITH, G.D., A direct comparison of water calorimetry and Fricke dosimetry, Phys. Med. Biol. 34 (1989) 23-42.
[7] ROSS, C.K., KLASSEN, N.V., SMITH, G.D., The effect of various dissolved gases on the heat defect of water, Med. Phys. 11 (1984) 653-658.
[8] SCHULZ, R .J., WUU, C.S., WEINHOUS, M.S., Direct determination of dose-to- water using a water calorimeter, Med. Phys. 14 (1987) 790-796.
[9] SCHULZ, R .J., SAIFUL HUQ, M., VENKATARAMANAN, N., MOTAKABBIR, K.A., A comparison of ionization-chamber and water-calorimeter dosimetry for high- energy X rays, Med. Phys. 18 (1991) 1229-1233.

IAEA-SM-330/б 59
[10] KLASSEN, N.V., ROSS, С.К., Absorbed dose calorimetry using various aqueous solutions, Radiat. Phys. Chem. 38 (1991) 95-104.
[11] ROOS, М., GROSSWENDT, B., HOHLFELD, K., An experimental method for determining the heat defect of water using total absorption of high-energy electrons, Metrología 29 (1992) 59-65.
[12] TASK GROUP 21, RADIATION THERAPY COMMITTEE, AMERICAN ASSOCIATION OF PHYSICISTS IN MEDICINE, A protocol for the determination of absorbed dose from high-energy photon and electron beams, Med. Phys. 10 (1983) 741-771.
[13] DOMEN, S.R., “ The role of water purity, convection and heat conduction in a new calorimeter design” , NRC Workshop on Water Calorimetry (Proc. Workshop, Ottawa, 1988) (ROSS, C.K., KLASSEN, N.V., Eds), NRC-29637, Natl Research Council of Canada, Ottawa (1988) 85-91.
[14] SEUNTJENS, J . , Comparative Study of Ion Chamber Dosimetry and Water Calorimetry in Medium Energy X-ray Beams, PhD Thesis, Univ. of Ghent (1991).
[15] SEUNTJENS, J., THIERENS, H., SCHNEIDER, U., Correction factors for a cylindrical ionisation chamber used in medium energy X-ray beams, Phys. Med. Biol, (in press).
[16] MONDELAERS, W., VAN LAERE, K., BERKVENS, P., UYTTENDAELE, D., “Extracorporeal irradiation in bone tumours therapy at the Ghent low energy high power electron linac” , Proc. 2nd Eur. Particle Accelerator Conf. Nice, 1990, Editions frontières, Gif-sur-Yvette (1990) 1805-1806.
[17] PETTERSON, C., HETTINGER, H., Dosimetry of high-energy electron radiation based on the ferrous sulphate dosimeter, Acta Radiol., Ther. Phys., Biol. 6 (1967) 160-176.
[18] SVENSSON, H., BRAHME, A., Ferrous sulphate dosimetry for electrons. A re- evaluation, Acta Radiol., Oncol. 18 (1979) 326-336.
[19] COTTENS, E ., Geabsorbeerde Dosis Calorimetrie bij Hoge Energie Electronenbun- dels en Onderzoek van de Ijzersulfaat Dosimeter, PhD Thesis, Univ. of Ghent (1980).
[20] MATTSSON, L.O., JOHANSSON, K.A., SVENSSON, H., Ferrous sulphate dosimeter for control of ionization chamber dosimetry of electron and “ Co gamma beams, Acta Radiol., Oncol. 21 (1982) 139-144.
[21] MA, С.-М., Monte Carlo Simulation of Dosimeter Response Using Transputers, PhD Thesis, ICR-PHYS-1/92, Univ. of London and Joint Dept, of Physics, Royal Marsden Hospital, Sutton, UK (1992).
[22] VAN LAERE, K., Study, Construction and Calibration of Dosimetric Systems Based upon cc-Alanine in Accurately Defined Electron and Bremsstrahlung Beams, PhD Thesis, Univ. of Ghent (1992).
[23] MOHAN, R ., CHUI, C ., LIDOFSKY, L ., Energy and angular distributions of photons from medical accelerators, Med. Phys. 12 (1985) 592-597.
[24] ROOS, М., A water calorimetric determination of absorbed dose to water, Thermo- chim. Acta 119 (1987) 81-93.
[25] HINDMARCH, A., The Livermore Solver for Ordinary Differential Equations, Lawrence Livermore Natl Lab., CA (1981).
[26] INTERNATIONAL COMMISSION ON RADIATION UNITS AND MEASUREMENTS, Radiation Dosimetry: Electron Beams with Energies Between 1 and 50 MeV, ICRU Rep. 35, Bethesda, MD (1984).


IAEA-SM-330/34
AN NPL ABSORBED DOSE CALIBRATION SERVICE FOR ELECTRON BEAM RADIOTHERAPY
D.T. BURNS, M.R. McEWEN, A.J. W ILLIAM S National Physical Laboratory,Teddington, Middlesex,
United Kingdom
Abstract
AN N PL A B S O R B E D D O SE C A L IB R A T IO N S E R V IC E F O R E L E C T R O N B E A M
R A D IO T H E R A P Y .
T he electron beam graphite calorim eter developed at the National Physical Laboratory
(N PL) covers the dose range down to 1 Gy at the dose rates used in radiotherapy. T he recent
measurement at N PL o f the specific heat capacity o f the graphite core has reduced the uncer
tainty in the determination o f graphite absorbed dose to less than ± 0 .5 % at the 9 5% confi
dence level. Intercom parison with the N PL high energy X ray primary standard shows
agreem ent to within 0 .2 % . A form alism is presented for a direct electron beam calibration service in term s o f absorbed dose to w ater, based on the graphite calorim eter and using
Sp encer-A ttix cavity ionization theory. A principal feature o f the proposed method is the
M onte C arlo calculation o f the effective electron stopping powers under the calibration condi
tions at N P L. M easurements o f stopping powers and fluence correction factors are also in
progress. It is anticipated that the overall uncertainty in the calibration o f a user cham ber will
be around ± 1 .7 % at the 95% confidence level. The advantages o f such a service include
improved accuracy, sim plicity, no requirement for “ C o or X radiation, and independence from external influences on the long term stability.
1. INTRODUCTION
The use o f electron beams for materials processing and product sterilization led to the development at the United Kingdom National Physical Laboratory (NPL) o f a primary standard graphite calorimeter [ 1 , 2 ] capable o f measuring dose levels above a few hundred grays at energies above 8 MeV. Legislation permitting food irradiation in the UK combined with the international drive towards absorbed dose standards for radiotherapy required the calibration o f dosimetry systems at lower doses and dose rates, and to meet this demand a new graphite calorimeter was developed [3 ,4 ], capable o f measuring graphite absorbed dose at radiotherapy dose levels. This calorimeter has recently been modified to operate at energies down to 3 MeV.
The success o f the calorimeter in operating at radiotherapy levels led to a programme o f work at N PL aimed at introducing a direct calibration service for electron beam ionization chambers in terms o f absorbed dose to water. A crucial
61

62 BURNS et al.
component o f this programme is the conversion o f the measured absorbed dose from graphite to water, and a series o f experimental measurements and Monte Carlo simulations are in progress aimed at reducing the uncertainty on this conversion.
This paper describes the calorimeter system, its calibration and validation. The formalism for the new service is presented and the method o f conversion from graphite to water absorbed dose is described, along with an analysis o f the major uncertainties. The calibration o f user chambers is addressed, and the advantages o f a direct calibration service are discussed.
2. N PL ELECTRON BEAM CALORIMETER
The design and calibration o f the graphite calorimeter system have been described in some detail in Ref. [4]. They are briefly outlined here, with the emphasis on those elements which have been improved in the last two years.
2.1. Calorimeter design
The calorimeter system for use at energies above 8 M eV is shown schematically in Fig. 1. The core is a coin shaped disc o f graphite with a 50 kO glass bead thermistor inserted into a hole drilled radially into the midplane o f the core. This disc is inset into the surface o f a larger graphite block and is thermally isolated from the
h mm a ir g a p
polystyrene beads
FIG. 1. Diagram of the electron beam calorimeter and DC bridge.

IAEA-SM-330/34 63
block by a 0.5 mm air gap. The block dimensions are chosen to be sufficiently large to ensure complete electron scattering, but at the same time small enough that heating o f the block is uniform, in area and in depth, so ensuring minimal heat transfer between the core and the block. Graphite buildup plates are available to position the
core centre at the desired depth.The core and block are completely enclosed in expanded polystyrene. In addi
tion, the exposure area o f the NPL linear accelerator is temperature controlled to
better than ±100 mK. As a result, the temperature drift o f the core is typically0 .2-0.3 mK/min, and dose rates down to a few grays per minute are measurable without the need for active temperature control or evacuation o f the air gaps surrounding the core.
Figure 1 also shows the temperature measurement system, which makes use o f a simple DC Wheatstone bridge arrangement. The power supply for the bridge is constructed from a temperature controlled Zener device; overall stability is typically + 1 ppm over a calibration period. The bridge output voltage is read by the controlling computer at 1 s intervals using a 6 Уг digit voltmeter (D VM ) with a resolution o f 0.1 /¿V. The noise level on a temperature-time trace is typically ±7 /xK
(±0 .1 /¿V). Calibration o f the calorimeter system involves the calibration o f the bridge output against temperature and the measurement o f the specific heat capacity o f the graphite core.
2.2. Temperature calibration and specific heat measurement
The temperature calibration is derived from a transfer standard platinum resistance thermometer (PRT) calibrated against three triple point cells operating in the range 0-36°C. The PRT is used over the temperature range 16-32°C to calibrate the temperature sensitivity o f the thermistors used in the calorimeter to an accuracy o f ±0 .1% . A detailed description o f the thermistor calibration system is given in Ref. [5]. This reference also describes a series o f measurements o f the stability o f thermistors when subject to accumulated radiation doses in excess o f 3 MGy. The results demonstrate that the response o f the thermistor type used in the primary standard does not change at the ±0.05% level when subject to very high doses.
Until recently, the largest source o f uncertainty in the use o f the electron beam calorimeter was that due to the specific heat capacity o f the graphite core, which was estimated to be +0.7% at the 95% confidence level. This problem was addressed by a direct measurement o f the specific heat o f the graphite used in the construction o f the calorimeter. The apparatus and experimental measurements are described in detail in Ref. [6 ]. The results are shown in Fig. 2 and are best fitted by the equation cg = 644.9 + 2.94T (J-kg ' 1 -K "1), where Г is the graphite temperature (°C ). The overall uncertainty in the use o f this equation over the temperature range 20-32° С is estimated to be ±0.16% at the 95% confidence level. Further measurements have shown that this equation also holds within the given uncertainty for different types

64 BURNS et al.
FIG. 2. Specific heat capacity of the graphite used in the construction of the electron beam calorimeter, measured as a function of temperature.
o f amorphous graphite with a bulk density in the range 1.7-1 .8 g/cm3, and also for graphite irradiated to over 3 MGy.
2.3. Performance characteristics and validation
The overall accuracy in the measurement o f graphite absorbed dose in electron beams is now estimated to be +0.5% at the 95% confidence level, the largest single component being due to the effect o f the air gaps around the core. The combined low noise level o f +7 pK and background drift o f less than 0.3 mK/min allow dose rates as low as a few grays per minute to be measured, and total doses down to 1 Gy. As a result o f the recent measurements which demonstrate that both the thermistor calibration and the specific heat are insensitive to large radiation doses, there is no limit on the high doses and dose rates which can be used and the calorimeter is regularly used at industrial dose levels.
External validation o f the calorimeter system is difficult; there are no comparable instruments operating in electron beams to this accuracy. Intercomparisons have been carried out with the high dose graphite calorimeters o f the Rise National Laboratory (Denmark) [7] and the National Institute o f Standards and Technology (United States o f America) [8 ]; agreement at the +2% level is obtained, which is within the overall uncertainty.

IAEA-SM-330/34 65
The best test o f the system is the comparison with the N PL primary standard for high energy X radiation, which is also a graphite calorimeter [9, 10], but o f a more sophisticated design involving an AC bridge measurement system, active temperature control and evacuation o f the air gaps. Although designed for use in X rays, this calorimeter can also be used under limited conditions in an electron beam. The two systems have been compared on six separate occasions; the mean ratio o f responses (electron beam/X ray) in terms o f graphite absorbed dose is 1.002 + 0.002 (statistical uncertainty at the 95 % confidence level). This uncertainty is well within the overall uncertainty in the two systems.
3. BASIS OF NEW ABSORBED DOSE CALIBRATION SERVICE
3.1. Formalism
The primary standard measures the absorbed dose to graphite, D|, under calibration conditions denoted by the superscript g (a measurement depth dg in an undisturbed graphite phantom irradiated with an electron beam o f mean incident energy E0). A reference electron beam ionization chamber, e, irradiated under the same conditions and with its effective point o f measurement at the same point d& measures the absorbed dose to the air in the cavity, Df jrt. Then according to the Spencer-Attix cavity ionization theory
where s|:air is the ratio o f the restricted mass collision stopping power o f graphite to that o f air, calculated over the electron spectrum present at the point d% in the undisturbed graphite phantom, and /?§ is a fluence correction factor for the electron chamber to account for the disturbance o f the electron spectrum at dg due to the presence o f the air cavity and chamber materials.
For the same chamber irradiated in a water phantom under conditions denoted by the superscript w (i.e. with its effective point o f measurement at a depth dv in the water phantom at the same mean incident energyE0), a similar equation applies:
For maximum cancellation o f systematic uncertainties in the calculation o f stopping power ratios and fluence correction factors, the measurement depths in graphite and
water should be chosen such that the electron spectrum at each o f the undisturbed measurement points is. similar. In practice, dg and dw (in g/cm2) are chosen such that
— ПВ, çê . nê ^ g air,e ** g:air И e ( i )
(2 )
(3)
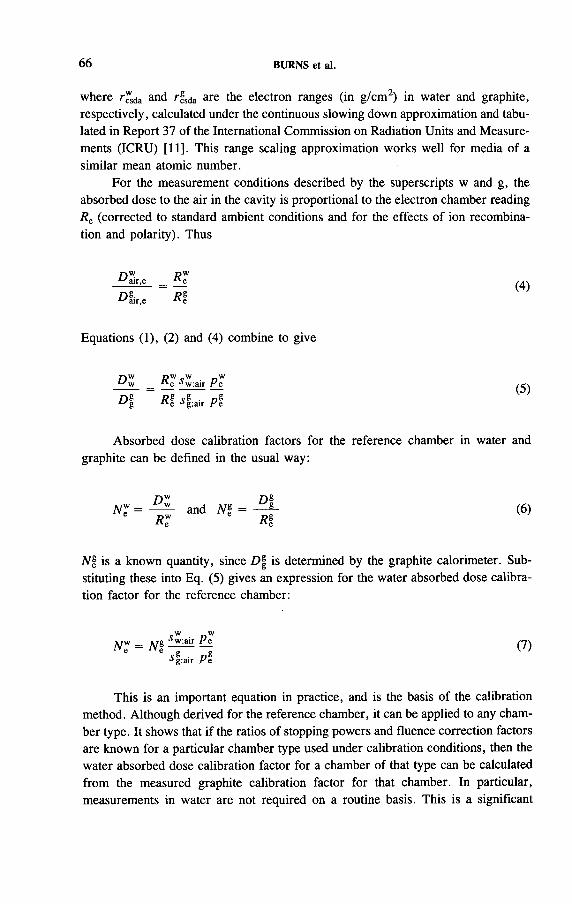
66 BURNS et al.
where r " da and r§sda are the electron ranges (in g/cm2) in water and graphite, respectively, calculated under the continuous slowing down approximation and tabulated in Report 37 o f the International Commission on Radiation Units and Measurements (ICRU) [11]. This range scaling approximation works well for media o f a similar mean atomic number.
For the measurement conditions described by the superscripts w and g, the absorbed dose to the air in the cavity is proportional to the electron chamber reading Re (corrected to standard ambient conditions and for the effects o f ion recombina
tion and polarity). Thus
d :
D %^а 1г,е
КRI
(4)
Equations (1), (2) and (4) combine to give
D v\J R l
D* R î 'g:air
(5)
Absorbed dose calibration factors for the reference chamber in water and
graphite can be defined in the usual way:
n w neN * = — *!_ and дг| = _ _ i_ (6 )
R™ Rf
N § is a known quantity, since D| is determined by the graphite calorimeter. Substituting these into Eq. (5) gives an expression for the water absorbed dose calibration factor for the reference chamber:
К = N fSW D V 3w:air УсçSgrair F&
(7)
This is an important equation in practice, and is the basis o f the calibration method. Although derived for the reference chamber, it can be applied to any chamber type. It shows that i f the ratios o f stopping powers and fluence correction factors are known for a particular chamber type used under calibration conditions, then the water absorbed dose calibration factor for a chamber o f that type can be calculated from the measured graphite calibration factor for that chamber. In particular, measurements in water are not required on a routine basis. This is a significant

IAEA-SM-330/34 67
simplification, since measurements in graphite are very much easier to set up and are more reproducible.
3.2. Ratio of restricted stopping powers
The ratios 5 " :air and s f:air represent the largest component o f uncertainty in using Eq. (7). Assuming that the uncertainty in the air stopping power largely cancels i f the measurement depths are scaled according to Eq. (3), then the stopping power uncertainty arises from two sources: the uncertainty in the monoenergetic values o f the restricted mass collision stopping powers for water and graphite, and the uncertainty in the electron spectra at the measurement depths in water and graphite.
Monoenergetic values for unrestricted mass collision stopping powers due to Berger and Seltzer [12] are recommended in ICRU Report 37 [11]. The uncertainties are difficult to estimate, but arise principally from two components. At lower energies, the uncertainty in the mean excitation energy dominates. Above 2 M eV, the effect on the water stopping power is relatively constant at around ±0.2% (95% confidence level). For graphite, the uncertainty decreases from ±0.6% at 2 M eV to ±0.4% at 8 M eV (8 M eV corresponds to a chamber positioned near the depth ionization peak in a nominal 18 M eV electron beam).
At high energies the stopping power uncertainty is due mainly to the model used for the density effect. For water, the density effect due to Ashley [13] can be used, with an uncertainty estimate at 8 M eV o f ±0.5% (the approximate difference between the restricted stopping powers calculated using the Ashley and Sternheimer density effects). This decreases to less than 0.1% at 2 MeV. For graphite, only the Stemheimer calculation is available, and a larger uncertainty o f ±0.8% at 8 MeV is assumed. In addition, a component o f uncertainty is introduced because the bulk density o f amorphous graphite differs from its crystalline density. The stopping powers calculated for each density differ by 0.8% at 8 M eV and 0.6% at 2 MeV.
Combining these uncorrelated uncertainties in quadrature gives an estimated uncertainty in the water/graphite monoenergetic restricted stopping power ratio o f ±1.3% at the 95% confidence level (over the energy range o f interest). Most other effects are likely to be small in comparison. Uncertainties associated with the overall theoretical framework are likely to be correlated for water and graphite, thus cancelling to a significant extent. This uncertainty estimate is consistent with other recent estimates [14, 15].
The effective stopping power at a depth in a phantom depends upon a knowledge o f the electron spectrum at the point o f interest. The electron spectra are being calculated at present at N PL by Monte Carlo simulations o f the complete experimental geometries, and tested against precisely measured depth ionization distributions. The spectra at the scaled measurement depths in water and graphite are similar and significant cancellation o f the uncertainties is expected. The evaluation o f a ratio o f effective restricted mass stopping powers should not add significantly

68 BURNS et al.
to the uncertainty in the monoenergetic ratio and an overall estimate o f ±1.5% at the 95% confidence level is assumed.
In addition, experimental measurements o f stopping powers are in progress at N PL aimed at reducing the uncertainty in the monoenergetic input data. I f these measurements are successful, it may be possible to determine the water/graphite effective stopping power ratio to an uncertainty o f ± 1 % at the 95 % confidence level.
3.3. Ratio of fluence correction factors
The disturbance o f the electron fluence at the measurement point is due mainly to electron scattering differences between the air and the medium. The effect o f the chamber walls, central electrode and stem should also be included, although the lack o f medium equivalence o f the chamber materials has less effect on the chamber response than for photons.
For a particular chamber type, the ratio o f fluence correction factors in Eq. (7) is required. This is a two stage process. Firstly, the ratio is estimated from a Monte Carlo simulation o f cavity and scattering effects for the reference chamber e. This should be a well constructed plane parallel chamber such as the NACP electron chamber, where the ratio is expected to be close to unity. Calculations o f this type have been performed recently by Ma [16]. The uncertainty in these calculations should be less than ±0.3% . Secondly, from Eq. (5) it is evident that, for a second chamber type, u, used under identical conditions,
Rgu p i R ¡ p i
(the ratio s^air^lair is taken to be independent o f chamber type, i.e. independent o f small variations in the value chosen for the cut-off energy). Then the ratio o f the fluence correction factors for chamber u can be measured relative to that calculated for the reference chamber:
pJ = p J R l_ _ R l_
p i p î R î Ru
Measurements based on this equation are in progress at NPL for those chambers recommended for use in the UK [17, 18]. The experimental uncertainty in theuse o f Eq. (9) should be better than ±0.2% at the 95% confidence level. The overall
uncertainty in the determination o f pu/pl is estimated to be less than ±0.5% at the 95% confidence level.

IAEA-SM-330/34 69
It should be noted that the basic assumption is made that the ratio o f fluence correction factors does not change from chamber to chamber within a given chamber type. This is testable by repeating the measurements for a number o f chamber samples; the uncertainty introduced through this assumption is likely to be
negligible.
4. CALIBRATIO N OF USER CHAMBERS
It is not feasible to use the primary standard calorimeter to calibrate each user chamber directly. Instead, the user chambers are calibrated by direct comparison with the reference chamber. Equation (7) applied to a user chamber u is as follows:
Aft =g:air P 5
( 10 )
The graphite calibration factor TV® for the chamber is easily obtained by comparison with the reference chamber in a graphite phantom; the effective points o f measurement are aligned at the depth dg where the graphite absorbed dose D g is known.
Then by definition
Substituting into Eq. (10) gives
Rs sw dwAft = ^ J b - ^ Ê ü E lL (12)Щ 4air P i
This is the general equation to be used for the routine calibration o f user chambers against the reference chamber in a graphite phantom. The overall uncertainty in N™ is estimated to be around +1.7% at the 95% confidence level and is dominated by the uncertainty in the stopping powers.
5. AD VANTAG ES OF NEW SERVICE
There are a number o f advantages o f a direct calibration in electron beams. The most obvious is overall accuracy, which is improved by almost a factor o f 2 over

70 BURNS et al.
the present UK protocol, particularly i f the measurements o f electron stopping powers at N PL are successful.
A direct calibration also has the advantage o f simplicity; users will be supplied with calibration factors N„ as a function o f a measurable range parameter (most probably the half-value depth R50) and a corresponding calibration depth dw near to the depth ionization peak in water (also specified as a function o f range). For a given electron field, measurement o f the range parameter then tells the user at what depth to position the chamber and the value o f the calibration factor to apply at that depth. This straightforward procedure is clearly less prone to error than that used at present.
Two other advantages are apparent. No measurements in ^C o 7 radiation are involved, which is significant given the worldwide decline in the use o f ^C o in the hospital environment. Also, no conversion factors are required. The significance o f this is that the user cannot be tempted to ‘ improve’ the dosimetry by trying to incorporate the latest values o f certain calculated parameters into such a factor, as has been known to occur with the Ce factor in the UK. This has led to mistakes being made in the past.
This latter point also highlights another advantage o f the proposed service. By incorporating a significant degree o f measurement into the ratios o f stopping powers
and fluence correction factors, the service should be to a large extent independent o f external influences such as a recalculation o f these parameters. This should lead to a more stable long term basis for the calibration service.
REFERENCES
[1] MORRIS, W.T., BURNS, D.T., BARRETT, J.H., “ Standards for electron beam dosimetry” , Radiation Processing for Plastics and Rubber III (Proc. Conf. London, 1987), Plastics and Rubber Inst., London (1987) 1/1—1/7.
[2] BURNS, D.T., MORRIS, W .T., High Dose Calorimetric Standard for Electron Beams, NPL Rep. RS(EXT)101, NPL, Teddington, UK (1988).
[3] BURNS, D.T., MORRIS, W.T., “Recent developments in graphite and water calorimeters for electron beam dosimetry at NPL” , NRC Workshop on Water Calorimetry (Proc. Workshop, Ottawa, 1988) (ROSS, C.K., KLASSEN, N.V., Eds), NRC-29637, Natl Research Council of Canada, Ottawa (1988) 25-30.
[4] BURNS, D .T., MORRIS, W.T., “ A graphite calorimeter for electron beam dosimetry” , High Dose Dosimetry for Radiation Processing (Proc. Symp. Vienna, 1990), IAEA, Vienna (1991) 123-136.
[5] McEWEN, M.R., BURNS, D.T., WILLIAMS, A.J., The Use of Thermistors in the NPL Electron Beam Calorimeter, NPL Rep. RSA(EXT)41, NPL, Teddington, UK (1993).
[6] WILLIAMS, A.J., BURNS, D.T., McEWEN, M.R., Measurement of the Specific Heat Capacity of the Electron Beam Graphite Calorimeter, NPL Rep. RSA(EXT)40, NPL, Teddington, UK (1993).

IAEA-SM-330/34 71
[7] MILLER, A., KO VACS, A., Calorimetry at industrial electron accelerators, Nucl. Instrum. Methods Phys. Res., Sect. В 10/11 (1985) 994-997.
[8] HUMPHREYS, J.C ., McLAUGHLIN, W.L., “Calorimetry of electron beams and the calibration of dosimeters at high doses” , Radiation Processing: State of the Art (Proc. Mtg Noordwijkerhout, 1989), Vol. 2, Radiat. Phys. Chem. 35 (1990) 744-749.
[9] DuSAUTOY, A.R., The UK Primary Standard Calorimeter for Absorbed Dose Measurement, NPL Rep. RSA(EXT)25, NPL, Teddington, UK (1991).
[10] STOKER, I., DuSAUTOY, A.R., The Measuring Assembly for the NPL Primary Standard Absorbed Dose Graphite Calorimeter at Therapy Levels, NPL Rep. RSA(EXT)23, NPL, Teddington, UK (1991).
[11] INTERNATIONAL COMMISSION ON RADIATION UNITS AND MEASUREMENTS, Stopping Powers for Electrons and Positrons, ICRU Rep. 37, Bethesda, MD (1984).
[12] BERGER, M .J., SELTZER, S.М., Stopping Power and Ranges of Electrons and Positrons, NBSIR 82-2550, Natl Inst, of Standards and Technology, Washington, DC(1982).
[13] ASHLEY, J.C ., Density effect in liquid water, Radiat. Res. 89 (1982) 32-37.[14] ROGERS, D.W.O., Uncertainties in Graphite to Air Stopping Power Ratios, Doc.
CCEMRI(I)/91-12, BIPM, Sèvres (1991).[15] BERGER, M .J., “ Electron stopping powers for transport calculations” , Monte Carlo
Transport of Electrons and Photons Below 50 MeV (JENKINS, T.M., et al., Eds), Plenum Press, New York (1989) 57-80.
[16] MA, C.-М., NAHUM, A.E., IAEA-SM-330/71, these Proceedings; and personal communication.
[17] HOSPITAL PHYSICISTS’ ASSOCIATION, Code of practice for electron beam dosimetry in radiotherapy, Phys. Med. Biol. 30 (1985) 1169-1194.
[18] INSTITUTE OF PHYSICAL SCIENCES IN MEDICINE, Addendum to the code of practice for electron beam dosimetry in radiotherapy (1985): Interim additional recommendations, Phys. Med. Biol. 37 (1992) 1477.


IAEA-SM-330/35
T H E N P L A B S O R B E D D O S E T O W A T E R C A L IB R A T IO N S E R V IC E F O R H IG H E N E R G Y P H O T O N S
K.E. ROSSER, B. OWEN, A.R. DuSAUTOY,D.H. PRITCHARD, I. STOKER, C.J. BREND
National Physical Laboratory,Teddington, Middlesex,
United Kingdom
A bstract
T H E N P L A B S O R B E D D O SE T O W A T E R C A L IB R A T IO N S E R V IC E F O R HIGH
E N E R G Y PH O TO N S.
T he National Physical Laboratory (N PL) provides an absorbed dose to water calibration
service for secondary standard dosimeters using 60C o 7 radiation and seven X ray qualities
between 4 and 19 M V . The calibration service is based on a primary standard graphite calorim eter that is used to determine absorbed dose to graphite and to calibrate as ‘working
standards’ three type 2561 ionization cham bers in a graphite phantom. T he calibration factors
for the working standards are converted from graphite to water using both cavity ionization
theory and measurements based on the photon fluence scaling theorem . Hospital dosimeters
are compared with the working standards in water to give secondary standard calibration
factors in absorbed dose to water with an uncertainty o f 0 .7 % ( la ) . T he calibration service
was launched in 1988 and has undergone several developments that have shown calibration factors for a 2561 cham ber to be dependent not only on quality index but also on electron
accelerating potential and beam filtration. How ever, for radiotherapy beam s, which are
generally heavily filtered, the calibration factors depend only on quality index so the N PL
filtrations have been increased to ensure that the calibration factors are applicable to radio
therapy beam s. Cham ber absorbed dose to water calibration factors measured by N PL have been compared with those derived from the Codes o f Practice o f the Hospital Physicists’
A ssociation and the International A tom ic Energy A gency. These Codes are based on 2 M V
X ray or a>C o air kerm a calibration o f the cham ber and the application o f conversion factors to derive absorbed dose to water. T he com parison showed a maximum difference o f 1 .6%
between the three methods that is within the uncertainties for the methods.
1. INTRODUCTION
In the United Kingdom, the National Physical Laboratory (N PL ) develops and maintains primary standards and provides calibration services for secondary standard dosimeters used in thirty regional radiotherapy centres. Each centre follows a UK recommended code o f practice for the calibration o f hospital dosimeters in the particular region by comparison with its secondary standard dosimeter. Calibrated
73

74 ROSSER et al.
dosimeters are used to measure machine output to provide dose data for patient treatment plans and for routine checks o f machine output. N PL ' normally accepts dosimeters for calibration for a limited period during the spring and autumn of each year and it is recommended that the type 2561 and 2611 secondary standard dosimeters (NE Technology Ltd) are recalibrated at three yearly intervals.
In 1988 N PL launched a calibration service [1] for secondary standard dosimeters in terms o f absorbed dose to water for ^Co 7 radiation and seven X ray
qualities between 4 and 19 M V. The X rays are generated by the N PL linear electron accelerator.
The calibration procedure has three stages:
(1) Each year the primary standard graphite calorimeter is used to calibrate three type 2561 ionization chambers in a graphite phantom as ‘working standards’ for eight radiation qualities.
(2) Absorbed dose calibration factors for the working standards are converted from graphite to water.
(3) During the calibration period secondary standard dosimeters are compared with the working standards in a water phantom for the radiation qualities selected by the user from eight service qualities.
An N PL calibration certificate states the absorbed dose to water calibration factors
with an uncertainty o f 0.7% (Iff) for the secondary standard dosimeter as a function o f quality index.
Working standards are introduced because:
(a) Operation o f the calorimeter is time consuming, making it impractical to compare directly each secondary standard with the calorimeter;
(b) Conversion o f absorbed dose from graphite to water is conveniently carried out for chamber calibration factors;
(c) The type 2561 working standards have established long term stability, so their calibration factors provide a check o f the consistency o f the absorbed dose standard.
The Institute o f Physical Sciences in Medicine (IPSM) Code o f Practice [2] recommends procedures for using a secondary standard calibrated in terms o f absorbed dose to water to calibrate other dosimeters and for the measurement o f machine output.
The relationship between the N PL standard for absorbed dose to water and those o f other laboratories is the subject o f another symposium paper [3].
2. ABSORBED DOSE TO W ATER CALIBRATIONS
The N PL primary standard is a graphite calorimeter following the design o f Domen [4]. Absorbed dose to graphite is measured in the 2 cm diameter, 3 mm thick

IAEA-SM-330/35
Graphite calorimeter
75
G a pheating thermistors
FIG. 1. Diagram o f the NPL calorimeter.
graphite disc which forms the core o f the calorimeter (Fig. 1). The core is surrounded by three graphite jackets to isolate it thermally from an extensive graphite phantom. The gaps o f 1 mm between the core and the jackets are evacuated, allowing the calorimeter to be operated adiabatically. During irradiation the energy absorbed by the core raises the core temperature by TR, which is sensed by a thermistor in one arm o f an AC bridge circuit [5, 6 ]. The calorimeter is calibrated by dissipating in the core a measured quantity o f electrical energy, £E, and measuring the corresponding increase in the core temperature, ГЕ. For a core o f mass m, the absorbed dose to graphite, D c , is given by:
Dr =TR
m
In practice changes o f bridge output voltage are measured rather than actual changes
o f temperature.

76 ROSSER et al.
The main corrections to the calorimeter measurements are for the effects o f the gaps around the core [7] and for the energy losses during the electrical calibration, for example in the leads to the heating thermistor in the core.
Each working standard chamber is placed in turn in a cubic graphite phantom o f 17 cm side and compared with the calorimeter at each quality. The centres o f the chambers and the midplane o f the calorimeter core are at the same depth in graphite and at the same distance from the source. The ionization chamber measurements are
corrected to an air temperature o f 20°C, an air pressure o f 101.325 kPa and 50% relative humidity and for ion recombination [8 ]. This comparison gives working standard calibration factors in terms o f absorbed dose to graphite per unit charge, N c. The conversion to factors for absorbed dose to water, Nw, follows the work o f Burns [9], who used cavity ionization theory and the dose ratio method to derive the ratio Nw/Nc. The dose ratio method made use o f the photon fluence scaling theorem with ionization chamber measurements in scaled graphite and water phantoms. The two methods gave N w/Nc values which agreed to within 0.1% over the energy range from ^C o to 19 MV. At each quality the working standard calibration factors in terms o f absorbed dose to graphite are multiplied by the appropriate value o f the ratio NJNç to give the calibration factors for absorbed dose to water.
Secondary standard dosimeters are compared with the working standards in a cubic water phantom o f 26 cm side with the chambers in close-fitting waterproof Perspex (PM M A) sleeves with a wall thickness o f 1.5 mm. The secondary standard calibration factors in terms o f absorbed dose to water per unit charge or per unit electrometer reading are valid for measurements at the centre o f the chamber in its water-
TABLE I. CALIBRATIO N FACTOR UNCERTAINTIES
Source o f uncertaintyUncertainty ( la ) (% )
Measured Estimated
Calibration o f working standards in
graphite by com parison with primary
standard calorim eter 0 . 2 0 .5
Conversion o f working standard calibration
factor from graphite to water __ 0 .5
Com parison o f secondary standard with
working standards in water 0 . 1 0 . 1
Quadrature sum 0 . 2 0 .7
9 5% confidence lim it ( x 2 ) 0 .4 1 .4
O verall 95% confidence lim it 1 .4

IAEA-SM-330/35 77
proof sleeve, for a 10 cm x 10 cm field size at the chamber and at depths in water
o f 5 cm for 60Co and 4, 6 , 8 and 10 M V and 7 cm for 12, 16 and 19 M V radiations.The radiation quality is specified by the quality index, i.e. the tissue-phantom
ratio (TPR jo), which is the ratio o f ionization measurements at depths o f 20 and 10 cm in water for a constant source-chamber distance and a field size o f 10 cm X 10 cm at the chamber.
The uncertainties associated with the calibration factors are given in Table I. The measured uncertainties result from statistical analysis and the estimated uncer
tainties are based on the method o f derivation o f the correction and its likely range.
3. RELATIO N BETWEEN CALIBRATIO N FACTOR, Q U A L ITY INDEXAND ELECTRON ACCELERATING PO TENTIAL
The N PL linear accelerator is a research machine with the X ray tungsten target thickness, the beam flattening filter thickness and any additional beam filtration chosen as required. When the absorbed dose service was launched in 1988 the target thickness o f 1-5 mm was selected to be sufficient to stop the incident electron beam. The conical flattening filter o f copper or tungsten with a peak height o f up to 5 mm flattened the beam profile over a 10 cm X 10 cm field without any additional beam filtration. The calibration o f a type 2561 working standard chamber gave a 60Co factor about 0.7% higher than the curve through the X ray factors (Fig. 2). These lightly filtered X ray beams gave quality index values significantly lower than those for the corresponding radiotherapy beams. Radiotherapy beams are generally heavily filtered because large uniform dose field sizes are required and in some cases the effective energy o f the X ray beam is purposely increased by filtration.
To match more closely the quality index values o f radiotherapy beams, the filtration o f the N PL X ray beams was increased by adding between 5 and 14 cm o f aluminium, depending on the radiation quality. Figure 2 is a plot o f the type 2561 chamber calibration factor N w as a function o f quality index and electron accelerating potential in megavolts. The solid line is the calibration curve for radiotherapy beams and a dashed section is a suggested path for Nw as the beam filtration is increased for a given electron accelerating potential (EAP). A dashed section joins the radiotherapy calibration curve at a minimum value o f the quality index for a given EAP. These minima are plotted as a function o f EAP in Fig. 3 and represent the lowest values o f the quality index for which the radiotherapy calibration curve is valid. Figure 3 also includes a plot o f quality index values for radiotherapy beams from the Protocol o f the American Association o f Physicists in Medicine [10].
The variation o f the chamber calibration factor with beam energy is largely governed by the variation o f the ratio o f the effective mass stopping power o f the chamber in water to that for air. A possible explanation for the dashed sections in Fig. 2 is that the relation between effective stopping power ratio and quality index

78 ROSSER et al.
Q u ality index
FIG. 2. Calibration o f a type 2561 chamber.
is variable for beam filtrations giving quality index values less than the minima shown in Fig. 3. The radiotherapy calibration curve in Fig. 2 represents beam filtrations for which the effective stopping power ratio is fixed in relation to quality index.
4. COMPARISON OF NPL CALIBRATION FACTORS W ITH HPA ANDIAE A CODES OF PRACTICE
N PL absorbed dose to water calibration factors for a type 2561 chamber are compared in Fig. 4 with factors derived from the Codes o f Practice o f the Hospital Physicists’ Association (H PA) [11] and the International Atomic Energy Agency (IAE A ) [12]. The Codes derive absorbed dose to water from 2 M V or ^C o air kerma calibration o f the chamber together with Cx factors in the HPA Code and a series o f chamber dependent factors for the IAE A Code. The N PL factors and the

IAEA-SM-330/35 79
Q ua lity index
FIG. 3. Quality index for radiotherapy beams and minimum values for calibration curve.
Quality index
FIG. 4. Type 2561 chamber calibration factors: comparison of NPL with HPA and IAEA Codes.

80 ROSSER et al.
H PA Code give absorbed dose at the centre o f the chamber. The IA E A Code derives absorbed dose to water at an effective point o f measurement that is forward o f the chamber centre, so the displacement corrections o f Cunningham [13] were used to transfer the IAE A factors to the centre o f the chamber.
The N PL 2 M V air kerma calibration factors used with the HPA and IAE A Codes were measured after 1 January 1992. On this date N PL reduced its 2 M V air kerma standard by 0.8% after adopting the values recommended by the Comité consultatif pour les étalons de mesure des rayonnements ionisants [14] for the physical constants and re-evaluating the corrections to the 2 M V cavity standards using Monte Carlo techniques [15]. To be consistent, the absorbed dose to water factors derived from the HPA Code were increased by 0.2% so that the N PL air kerma calibrations and the HPA and IAEA Codes used the same physical data. In the HPA Code the beam energy was specified in terms o f EAP and it has been assumed that the C\ factors were derived for radiotherapy beams, so the corresponding quality index values have been adopted.
Figure 4(b) shows the ratio o f absorbed dose to water derived from the two Codes o f Practice to that obtained from the NPL calibrations. The dose derived from the HPA Code is 0.9% below the NPL dose for 60Co and the difference decreases to zero at a quality index o f around 0.75. The dose derived from the IAEA Code is 0.9% below the N PL dose for 60Co and the difference increases to a maximum o f 1.6% at a quality index o f 0.70.
5. CONCLUSION
The NPL absorbed dose to water calibration service is the basis o f the IPSM Code o f Practice [2], which the IPSM has recommended should supersede the HPA Code. The agreement between the NPL calibration service and the IAE A Code is within 1 .6 %, which is within the claimed uncertainties.
REFERENCES
[1] B U R N S , J .E . , D A L E , J .W .G ., D u SA U T O Y , A .R ., O W EN , B . , P R IT C H A R D ,
D .H ., “ New calibration service for high energy X-radiation at N P L ” , Dosim etry in
Radiotherapy (Proc. Sym p. Vienna, 1987), V ol. 2 , IA E A , Vienna (1988) 1 2 5 -1 3 2 .[2] IN S T IT U T E O F P H Y S IC A L SC IE N C E S IN M E D IC IN E , Code o f practice for high-
energy photon therapy dosimetry based on the N PL absorbed dose calibration service,
Phys. M ed. B io l. 3 5 (1990) 1 3 5 5 -1 3 6 0 .[3] B O U T IL L O N , М ., C O U R S E Y , B .M ., H O H L FE L D , K ., O W EN , B . , R O G E R S,
D .W .O ., IA E A -SM -330/48, these Proceedings.
[4] D O M EN , S .R . , L A M P E R T I, P .J . , A heat-loss-compensated calorim eter: Theory,
design and perform ance, J . R es. Natl. Bur. Stand., A Phys. Chem . 7 8 (1974) 5 9 5 -6 1 0 .

IAEA-SM-330/35 81
[5] S T O K E R , I . , D u SA U T O Y , A .R ., T he M easuring A ssem bly for the N P L Prim ary
Standard Absorbed D ose Graphite Calorim eter at Therapy L evels, N PL Rep.
R S A (E X T )2 3 , N P L , Teddington, U K (1991).
[6] D u SA U T O Y , A .R ., The U K Prim ary Standard C alorim eter for Absorbed D ose M easurem ent, N P L R ep. R S A (E X T )2 5 , N P L , Teddington, U K (1 9 9 1 ).
[7] O W E N , B ., D u SA U T O Y , A .R ., Correction for the effect o f the gaps around the core
o f an absorbed dose graphite calorim eter in high energy photon radiation, Phys. M ed.
B io l. 3 6 (1991) 1 6 9 9 -1 7 0 4 .
[8] B U R N S , J .E . , R O S S E R , K .E . , Saturation correction for the N E 2560/1 dosem eter in
photon dosim etry, Phys. M ed. B io l. 3 5 (1990) 6 8 7 -6 9 3 .
[9] B U R N S , J .E . , D A L E , J .W .G ., Conversion o f Absorbed D ose Calibration from
Graphite to W ater, N PL Rep. R S A (E X T )7 , N P L, Teddington, U K (1990).
[10] T A S K G R O U P 2 1 , R A D IA TIO N T H E R A P Y C O M M IT T E E , A M E R IC A N A SSO C I
A TIO N O F P H Y S IC IS T S IN M E D IC IN E , A protocol for the determination o f
absorbed dose from high-energy photon and electron beam s, M ed. Phys. 10 (1983)
7 4 1 -7 7 1 .
[11] H O SP IT A L P H Y S IC IS T S ’ A SSO C IA T IO N , Revised Code o f P ractice for the dosi
m etry o f 2 to 35 M V X -ray , and o f caesium -137 and cobalt-60 gamm a-ray beam s, Phys.
M ed. B io l. 2 8 (1983) 1 0 9 7 -1 1 0 4 .
[12] IN T E R N A T IO N A L A T O M IC E N E R G Y A G E N C Y , Absorbed D ose Determ ination in
Photon and Electron Beam s: A n International Code o f P ractice, Technical Reports
Series No. 2 7 7 , IA E A , Vienna (1987).
[13] CU N N IN G H A M , J .R . , SO N T A G , M .R ., Displacem ent corrections used in absorbed dose determination, M ed. Phys. 7 (1980) 6 7 2 -6 7 6 .
[14] C O M IT E C O N SU L T A T IF PO U R L E S E T A L O N S D E M E S U R E D E S R A Y O N N E
M E N T S IO N ISA N T S, Report o f the 8th M eeting o f Section I , Rapport de la 11e ses
sion, B IP M , Sèvres (1985).
[15] M O R E T T I, C . J . , Changes to the National Physical Laboratory primary standards for X -ray exposure and air kerm a, Phys. M ed. B io l. 3 7 (1992) 1 1 8 1 -1 1 8 3 .


IAEA-SM-330/37
NEW APPROACH FOR ESTABLISHING A PRIMARY STANDARD OF AIR KERMA IN A 60Co 7 RAY BEAM
B. CHAUVENET, F. D E LAU N AY, J.P. SIMOËN
Bureau national de métrologie,Laboratoire primaire des rayonnements ionisants,Département des applications et de la métrologie
des rayonnements ionisants,CEA, Centre d’études de Saclay,Gif-sur-Yvette, France
Abstract
NEW APPROACH FOR ESTABLISHING A PRIMARY STANDARD OF AIR KERMA IN A “ Со 7 RAY BEAM.
The determination of a primary standard of kerma in air is generally based on the use of an absolute cavity ionization chamber with graphite walls and filled with air. For laboratories in possession of primary standard graphite calorimeters, it appears possible to derive air kerma from absorbed dose in graphite by a transfer method. This derivation can be achieved using a transfer instrument, e.g. a small air filled cavity chamber, successively irradiated in the graphite phantom at the reference depth and in free air. The advantages of this method are the replacement of an absolute current measurement by a relative one, the replacement of the graphite to air stopping power ratio by the quotient of the stopping power ratio in free air by that in graphite, and the elimination of the effective volume of the chamber and of W, the mean energy expended per ion pair formed in air. In return, a correction factor for the perturbation of the particle fluence, due to the air cavity irradiated in the graphite phantom, must be applied. A critical analysis of the accuracies of both methods is made, the expected gains in metrological safety with the new method are pointed out and preliminary results are presented.
1. INTRODUCTION
In metrology there is a strong interest in developing different methods for the
measurement o f a given quantity. This general practice permits the reduction o f possible systematic errors due, for example, to models involved in the principles o f
a method or to the hypothesis assumed for estimating influence quantities or correction factors. There are still some advantages even when two methods are not totally
independent.
83

84 CHAUVENET et al.
A study has started at the Laboratoire primaire des rayonnements ionisants to explore the possibility o f a new approach for determining a primary standard o f
kerma in air for ^C o 7 rays, based on the existing primary standard o f absorbed
dose to graphite, established with the graphite calorimeter. Although, as will be seen, this method is not totally independent o f the classical one, the expected accuracy and some specific advantages make it o f significant interest.
2. CLASSICAL METHOD
The determination o f primary standards o f air kerma, in ^C o and 137Cs 7 ray beams, is generally based on the use o f absolute cavity ionization chambers with graphite (g) walls and filled with air [1]. The measurement method relies on cavity theory [2 ] and on taking into account the differences in photon attenuation, scattering and energy absorption between graphite and air. The reference value o f air kerma
rate, £ air, in stated conditions, is obtained by application o f the well known relation:
(1 Saii) wall ( 1)
which requires the accurate estimation of:
the ionization current corrected for all influence quantities and all defects due to the detector, to the associated electrometric device and to experimental conditions; around ten different quantities and correction factors are involved in this step.
P the density o f air in the chamber cavity, at stated values o f temperature and pressure.
V the effective volume in which the ionization is collected. For deriving accurately this volume from the cavity geometrical volume, standard chambers are designed specifically and machined to precise dimensions (the cavity volumes are usually not less than 10 cm3).
W/e the quotient by the electronic charge o f the mean energy expended in air per ion pair formed. The internationally recommended value o f this quantity is at present [3, 4]:
— = 33.97 ± 0.06 (J-C-1)e
(this is discussed in Section 4).

IAEA-SM-330/37 85
Sg air the graphite to air ratio o f the mean values o f restricted mass collision stopping powers. This term implies the estimation o f the differential distribution o f the secondary electron fluence entering the chamber cavity, with respect to energy, and is calculated using the recommended published data [3, 5] (this is discussed in Section 4).
(/Zen/p)air,g the air to graphite ratio o f the mean mass energy absorption coefficients,estimated on the basis o f the incident photon energy fluence differential distribution with respect to energy. This term is calculated using the recommended published data [3, 6 ].
gair the fraction o f the energy o f secondary electrons that is lost to brems-strahlung in air, which is calculated for the secondary electron initial energy fluence differential distribution with respect to energy, using recommended published data [5].
/3g the quotient, in graphite, o f absorbed dose by the ‘collision part o fkerma’ , which, in the photon energy range under consideration, is due to the transient character o f the secondary electron equilibrium; this term is calculated [ 1].
fcwall the correction factor for photon attenuation and scatter in the chamber
graphite wall (o f thickness sufficient for establishing transient secondary electron equilibrium); this term is in most cases determined by experiment, by extrapolating to zero wall thickness the ionization currents measured with additional graphite caps.
As will be seen further, since the last four terms are maintained in the new
approach, they will not be discussed here, although the method o f estimation o f the last two has been criticized recently [7].
3. NEW METHOD
At any laboratory in possession o f a graphite calorimeter designed for measuring absorbed dose to graphite, it is possible to derive air kerma by transfer between
graphite and air, using an appropriate detector. The new method is presented for the case where a cavity ionization chamber o f the type used in radiotherapy dosimetry is considered (small air volume, i.e. around 0.5 cm3, and graphite wall).
(a) The chamber is irradiated at the reference point in the graphite phantom, where the dose rate to graphite, D %, is known (by calorimetric measurement). Let /g

86 CHAUVENET et al.
be the corrected ionization current measured; this current is related to the dose
where, besides the terms already defined in Eq. (1),
Pcav is the correction factor for the perturbation o f the particle fluence, due to the air cavity considered in graphite (the geometrical centre o f the chamber is supposed to be at the reference point).
The stopping power ratio differs from the one considered in Eq. (1) because o f the modification o f the photon spectral energy distribution by the graphite phantom.
(b) The chamber is then placed at the same point in free air (with its buildup cap on, for establishing the secondary electron equilibrium). Let /шг be the cor
rected ionization current measured in this situation; it is related to air kerma by Eq. (1). The chamber considered in this method differs from the absolute one used in the classical method mainly by size. Two o f the terms o f Eq. (1), which are chamber dependent, have therefore to be specially determined: /3g and £waU.
(c) By combination o f Eqs (1) and (2), we obtain the relation between Kiir and Z)g, which symbolizes the method:
where, besides the terms already defined in Eqs (1) and (2),
ks is the quotient o f the graphite to air ratios o f the mean values o f restricted mass collision stopping powers, for the secondary electrons entering the chamber cavity, when the chamber is in free air (sgiajr, see Eq. (1)) or in the graphite
phantom CSg>air, see Eq. (2)):
rate by:
D = -®-----s ' Pj r ^g.air 1 cavpv e(2 )
0 8air) wall (3)
(4)

IAEA-SM-330/37 87
There are some important advantages o f the new method. Comparing Eq. (1)(classical method) with Eq. (3), the following remarks may be made:
(1) The determination o f the basic dosimetric characteristic o f the absolute ionization chamber, i.e. the quantity (1 lpV)(Wle) (in G y-C "1), is replaced by themeasured value o f absorbed dose rate to graphite, Dg (which is at present the
dosimetric quantity measured with the highest accuracy). There are two interesting outcomes:— There is no need to know the actual volume, V, o f collection o f ions in the
chamber cavity; one thus avoids the risk o f a systematic error in estimating it from the cavity geometrical volume, which is the only volume measurable.
— There is no need to use the value o f W, the mean energy expended in air per ion pair formed, which has changed several times in the past (with a total increase o f 0.7% since 1969 [8 ]).
(2) The determination, in absolute terms, o f the corrected current /air is replaced by the quotient o f two corrected currents (/a¡r//g), which have values that differ by only a few per cent. Considering that the electrometric device and the air temperature and pressure measuring instruments associated with the
chamber are identical for measurements both in the graphite phantom and in free air, several corrections and possible systematic errors are eliminated:— The uncertainties and the possible errors due to calibrations and corrections
related to the electrometric device (standard capacity, voltmeter, base time, amplifier and influence o f temperature) are eliminated or greatly reduced.
— Corrections for ion recombination and polarization in the chamber, and the associated uncertainties, practically cancel out.
— As regards the characteristics o f air, since the two ionization currents are supposed to be measured in conditions that are as close as possible, a significant reduction o f uncertainties is obtained concerning the standardizing corrections. In particular, the humidity correction, which is the main source o f uncertainty, is eliminated. There is also an elimination o f any possible systematic error resulting from local deviations o f air composition from the standard one.
(3) The graphite to air stopping power ratio is replaced by the quotient o f two such ratios (see definition o f ks, Eq. (4)). The value o f this quotient is very close to one, with a significant increase in accuracy because o f a reduction o f uncertainties and o f systematic errors in the data used for calculation. These data have changed in the past, because o f improvements in the knowledge o f ionization potentials and o f the density effect [5], and any further modification o f the
4. DISCUSSION

88 CHAUVENET et al.
graphite to air stopping power ratio would be o f reduced influence in the newmethod.
On the other hand, there is a critical point in this new method, i.e. the perturbation correction factor P cav, due to the chamber air cavity when irradiated in the graphite phantom, which has to be estimated in absolute terms.
In the following section, a presentation is made o f the first experiments performed and o f the preliminary estimations o f uncertainties.
5. PRE LIM INARY APPLICATIO N OF NEW METHOD
In order to test the new method, a first experiment has been carried out, in a reference ^Co photon beam. This beam was characterized in terms o f absorbed dose to graphite, at a depth o f 5.51 g-cm"2, at 1 m from the source, in a graphite phantom o f dimensions 30 x 30 x 20 cm3. The measurement was made with the
graphite standard calorimeter, with an overall uncertainty o f 0.27% ( la deviation, as for all uncertainties considered in this paper).
The transfer instrument used was a cylindrical air filled Farmer type ionization chamber (NE 2571) with a small cavity volume (0.6 cm3) and a graphite wall. According to the method, this detector was irradiated successively in the phantom at the reference depth and in free air with its additional buildup caps. The measurements were made in both configurations with no more than a one day interval, using exactly the same associated equipment.
The ratio o f the two corrected ionization currents, /air//g, was found to be equal to 1.0264, with a provisional uncertainty o f 0.08% (chamber with its 0.3 cm thick buildup cap, when irradiated in free air).
The stopping power correction factor ks (Eq. (4)) was found to be equal to 0.9990. This value was estimated using the stopping power ratio at 5.51 g-cm " 2
depth, interpolated from the results o f calculation by the Bureau international des poids et mesures (using a Monte Carlo simulation code) in its “ Со y beam and in its graphite phantom [9] (which is very similar to the one considered here). This
value is 0.1% higher than in free air [4]. A provisional uncertainty o f 0.05% was
attributed to the value o f ks.The perturbation correction factor Pcav was calculated using the radial
displacement for cylindrical chambers evaluated experimentally for “ Co beams[10], i.e. 0.6 times the cavity radius. With the effective attenuation coefficient measured in the graphite phantom (0.0265 cm2 - g '1), the value was 0.991, with
a provisional uncertainty o f 0.15%.The absorption coefficient ratio (/xen/p)air,g and the bremsstrahlung correction
gair have the same values in both methods. The correction for photon attenuation and scatter in the chamber wall, &wan, and the quotient, /3g, o f absorbed dose by the

IAEA-SM-330/37 8 9
TABLE I. UNCERTAINTIES ( la (% )) ASSOCIATED W ITH THE INDEPENDENT (OR QUASI-INDEPENDENT) TERMS OF THE TW O METHODS
(provisional values fo r the new method)
Classical method New method
(1 /pV)(W/e) 0.18 0.27
Air 0.14 0.08
■Sg.air 0.30 К 0.05
p1 cav 0.15
Quadrature summation 0.38 Quadrature summation 0.32
collision kerma were estimated the same way as in the classical method. The uncertainties associated with these four quantities therefore have equal or very similar values in the two methods.
The terms o f main interest for comparing the accuracies o f the two methods are those which are independent or quasi-independent. They are, in Eq. (1),
(I¿JpV)(Wle) and sgiair, and in Eq. (3), Dg, ks and P ^ . Their uncertainties are presented in Table I, together with the overall uncertainties on their products. The predominant components are those due to Ù % in the new method and to sg;air in the classical one. The provisional overall uncertainty in the new method (0.32%) is o f the same order as in the classical one (0.38%), but, as already pointed out, the new method offers greater metrological safety as regards possible systematic errors or changes in physical data.
A t present, a provisional value o f air kerma is found to be 1.0% less than the value obtained by the classical method. Before any firm conclusion is drawn, further investigations are to be made, mainly on the estimation o f &wa]1, P^ v and ks.
6 . FUTURE EXPERIMENTS
In order to improve the performance o f the new method, further experiments need to be carried out. The influence o f the graphite phantom size and o f the refer
ence depth on the value o f ks w ill be evaluated. This will be done by means o f transfer measurements from a reference value o f absorbed dose to graphite in a graphite phantom reduced to its minimum size (i.e. the present graphite calorimeter, bare o f any additional piece o f graphite). This will permit validation o f our use o f the published data [4, 9].

90 CHAUVENET et al.
The determination o f Pcav is the most critical point in the transfer method. It has to be tested by use o f transfer ionization chambers o f various shapes and sizes (cylindrical and plane parallel). Moreover, in order not to rely on one kind o f detector, the use o f other adapted transfer instruments could be investigated. The relations considered in Section 3 would o f course then be different. At present, such measurements are prepared with Fricke dosimeters. These experiments would also serve to test the estimation o f £waU.
7. CONCLUSION
The method o f measuring kerma in air presented in this paper avoids the need
for knowledge o f parameters such as V, W in air and sg air, and for absolute estimation o f the ionization current and o f almost all corrections due to influence quantities and to experimental conditions. In return, it is directly dependent on the reference absorbed dose to graphite, measured by calorimetry. Although the level o f accuracy achievable remains at the same order o f magnitude as in the classical method, the method offers a higher metrological safety because it eliminates or greatly reduces some sources o f systematic error, and it is much less sensitive to changes o f the physical data involved. The ultimate step in this direction could consist in deriving
directly (i.e. without a transfer operation) air kerma from absorbed dose to graphite, measured with a specially designed calorimeter reduced to the minimum size (typically 28 mm diameter and 15 mm thickness), similar to one already used in the past [ 11 ], and placed in free air.
The first experiment was performed with equipment and references that are available in most primary laboratories. Further work has to be done to reach a con
clusion on the overall uncertainty and on a final comparison with the conventional
method.
REFERENCES
[1] ATTIX, F.H., “ Dosimetry and calibration of photon and electron beams with cavity ion chambers” , Introduction to Radiological Physics and Radiation Dosimetry, Wiley, New York (1986) Ch. 13.
[2] ATTIX, F.H., “Cavity theory” , ibid., Ch. 10.[3] COMITE CONSULTATIF POUR LES ETALONS DE MESURE DES RAYONNE
MENTS IONISANTS, Rapport de la 11e session, BIPM, Sèvres (1985) R46.[4] BOUTILLON, M., PERROCHE-ROUX, A.-M., Re-evaluation of the W value for
electrons in dry air, Phys. Med. Biol. 32 (1987) 213.[5] INTERNATIONAL COMMISSION ON RADIATION UNITS AND MEASURE
MENTS, Stopping Powers for Electrons and Positrons, ICRU Rep. 37, Bethesda, MD (1984).

IAEA-SM-330/37 91
[6] HUBBELL, J.H ., Photon mass attenuation and energy absorption coefficients from 1 keV to 20 MeV, Int. J. Appl. Radiat. Isot. 33 (1982) 1269.
[7] BIELAJEW, A.F., ROGERS, D.W.O., Implications of new correction factors on primary air kerma standards in “ Co beams, Phys. Med. Biol. 37 (1992) 1283.
[8] INTERNATIONAL COMMISSION ON RADIATION UNITS AND MEASUREMENTS, Radiation Dosimetry: X Rays and Gamma Rays with Maximum Photon Energies Between 0.6 and 50 MeV, ICRU Rep. 14, Bethesda, MD (1969).
[9] NIATEL, М.-T., PERROCHE-ROUX, A.-M., BOUTILLON, М., Two determinations of W for electrons in dry air, Phys. Med. Biol. 30 (1985) 67.
[10] JOHANSSON, K.-A., MATTSSON, L.O., LINDBORG, L., SVENSSON, H., “Absorbed dose determination with ionization chambers in electron and photon beams having energies between 1 and 50 MeV” , National and International Standardization of Radiation Dosimetry (Proc. Symp. Atlanta, 1977), Vol. 2, IAEA, Vienna (1978) 243.
[11] GUIHO, J.P ., SIMOËN, J.P ., “ Contribution à la connaissance des constantes fondamentales Wet G intervenant dans les mesures de dose absorbée” , Biomedical Dosimetry (Proc. Symp. Vienna, 1975), IAEA, Vienna (1975) 611.


INTERCOMPARISON, DISSEMINATION AND TRANSFER
(Session 2)
C h a i r m a n
A.E. NAHUMUnited Kingdom
C o - C h a i r m a n
M. BOUTILLONB I P M


I A E A - S M - 3 3 0 /4 8
Invited Paper COMPARISON OF PRIMARY WATER ABSORBED DOSE STANDARDSM. BOUTILLONBureau international des poids et mesures,Sèvres
B.M. COURSEYNational Institute of Standards and Technology,Gaithersburg, Maryland,United States of America
K. HOHLFELDPhysikalisch-Technische Bundesanstalt,Braunschweig, Germany
B. OWENNational Physical Laboratory,Teddington, Middlesex,United Kingdom
D.W.O. ROGERSNational Research Council Canada,Ottawa, Ontario, Canada
A b s t r a c t
COMPARISON OF PRIMARY WATER ABSORBED DOSE STANDARDS.During the last two decades national laboratories have been developing primary
standards of absorbed dose to water and calibration services for dosimeters based on these standards. A brief description is given of the primary standards of the Bureau international des poids et mesures (BIPM), the United States National Institute of Standards and Technology, the United Kingdom National Physical Laboratory, the National Research Council Canada and the German Physikalisch-Technische Bundesanstalt involved in recent comparisons at high energy photon radiation. As the standards are no longer transportable, ionization chambers and Fricke solution contained in ampoules are used as transfer instruments. At “ Co 7 radiation all comparisons are linked to the BIPM international reference system. The agreement of all primary standards is well within the stated uncertainties, which is around half a per cent for each of these standards. At high energy X rays from linear accelerators a very satisfactory agreement was also found. The characterization of the radiation quality of the accelerator beams needs further investigation. This first ‘snapshot’ of the relation between various absorbed dose to water standards which are at different stages of development reveals a sound basis for the calibration of dosimeters to be used in clinical practice.
95

96 B O U T I L L O N e t a l .
1. INTRODUCTION
During the last two decades national Primary Standard Dosimetry Laboratories (PSDLs), the Bureau international des poids et mesures (BIPM) and other institutes have enhanced their efforts in developing primary standards of water absorbed dose and in calibrating dosimeters in terms of this quantity. Up to now most current international, regional and national dosimetry codes or protocols have been based on air kerma as the basic quantity. But the advantages of using only one quantity from the primary standard to the field instrument lead to considerable simplification and reduced uncertainty in absorbed dose measurement [1]. This intrinsically appealing concept of starting from a water absorbed dose calibration factor N w is in use in some countries [2, 3] and the International Commission on Radiation Units and Measurements (ICRU) has a report committee [4] which is developing a formalism to allow effective use of the new primary absorbed dose standards.
While international comparisons of air kerma or exposure standards have been carried out for many years and their results show very satisfactory agreement [5], such comparisons with respect to water absorbed dose have not yet been reported in the literature. Therefore, information on recent activities in comparing water absorbed dose standards w ill be presented despite the fact that these comparisons are not yet finalized and published, and results may be preliminary. Nevertheless, this information gives confidence to the user of dosimeters calibrated in terms of water absorbed dose.
Throughout this paper uncertainties are expressed as recommended by the Comité international des poids et mesures (CIPM). They are classed as type A when based on statistical analysis and as type В when based on estimates. Both types of uncertainty are stated at the one relative standard deviation level, given in per cent. Where uncertainties are combined or overall uncertainties are given their components were summed in quadrature.
2. PRIMARY STANDARDS OF WATER ABSORBED DOSE
PSDLs have developed various experimental approaches in establishing standards for absorbed dose to water. It is striking that the five institutes participating in the absorbed dose comparisons have chosen five different fundamental methods of measurement. These methods w ill be presented briefly in the following.
2 . 1 . B I P M p r i m a r y w a t e r a b s o r b e d d o s e s t a n d a r d
The BIPM, taking advantage of its experience in ionization measurements for the determination of air kerma and absorbed dose to graphite, has developed an ionometric standard for the determination of water absorbed dose for “ Co y radia-

I A E A - S M - 3 3 0 /4 8 97
tion [6 ]. The cavity ionization chamber, a flat cylindrical box with its cavity divided by a circular collecting plate into two parts, is designed to fu lfil as far as possible the Bragg-Gray requirements and to allow evaluation with high precision of the total perturbation correction factor due to the presence of the chamber in the water phantom. The calculation method for the total perturbation factor is the same as described by Boutillon [7]. The ionization chamber is placed in the BIPM water phantom, a cubic PMMA tank of 30 cm side filled with demineralized water with the midplane of the cavity at the reference depth of 5 g-cm"2. The geometrical reference conditions are those recommended by Section I of the Comité consultatif pour les étalons de mesure des rayonnements ionisants (CCEMRI) [8 ]. The value of W/e (39.97 ± 0.05 J-C"1) entering the determination of water absorbed dose is that recommended by CCEMRI [9]. Boutillon and Perroche-Roux [10] and Rogers have discussed the existence of a correlation between the BIPM primary water absorbed dose standard and the graphite absorbed dose calorimeter via the W/e value. The stopping power ratio sc air has been calculated [11] from ICRU Report 37 [12] as 1.0030 following the recommendation of CCEMRI Section I [9]. The uncertainties of the physical constants, correction factors and measured quantities involved in the ionometric determination of absorbed dose to water have been evaluated in detail and the resulting combined uncertainty at the 1er level is 0.43%.
2 . 2 . N I S T p r i m a r y w a t e r a b s o r b e d d o s e s t a n d a r d
For the purpose of the comparison, the water absorbed dose rate at the “ Co y beam of the National Institute of Standards and Technology (NIST) in the United States of America is based on the average of three different calorimetry systems: the graphite-water absorbed dose calorimeter [13], the graphite absorbed dose calorimeter [14] and the sealed water absorbed dose calorimeter saturated with hydrogen gas [15]. The measurements performed with these calorimeters deviate by +0.19%, -0.04% and —0.15%, respectively, from their mean value. Domen has recently completed an extensive investigation of the sealed water calorimeter in which high purity water was saturated with N2, H2 or H2-0 2 gas as described by Klassen and Ross [16]. Measurements with the H2-0 2 system varied with the initial ratio of hydrogen and oxygen and with accumulated absorbed dose (as expected in closed systems). On the basis of theoretical considerations and the approximately 3700 measurements of absorbed dose in the “ Со y beam at NIST, the H2 system was taken as the best choice. The heat defect for the H2 saturated case is taken as zero.
2 . 3 . N P L p r i m a r y w a t e r a b s o r b e d d o s e s t a n d a r d
The primary water absorbed dose standard at the National Physical Laboratory (NPL) in the United Kingdom is based on a Domen type graphite absorbed dose
98 B O U T I L L O N e t a l .
calorimeter [17] and the conversion from graphite absorbed dose to water absorbed dose, with application of the photon fluence scaling theorem and the cavity ionization theory [18]. The response of the graphite calorimeter in terms of energy divided by mass is determined by dissipating in the calorimeter core a measured amount of electrical energy. In order to avoid the time consuming operation of the calorimeter for calibrating secondary standards, three ionization chambers (NE 2561) are calibrated in a graphite phantom by comparison with the calorimeter as working standards in terms of absorbed dose to graphite. This calibration is converted to absorbed dose to water and secondary standards are calibrated in terms of water absorbed dose by comparison with these working standards in a water phantom [19]. The uncertainty of the primary water absorbed dose standard is about 0.7% at the la level.
2 . 4 . N R C p r i m a r y w a t e r a b s o r b e d d o s e s t a n d a r d
For high energy photons the primary water absorbed dose standard at the National Research Council Canada (NRC) is based upon measurement of the temperature increase induced by the absorption of 20 MV X rays in a water calorimeter[20]. The calorimeter consists of a thin walled glass vessel containing 100 cm3 of highly purified water which is stirred continuously to distribute the absorbed radiation energy homogeneously and to achieve a corresponding temperature distribution. The water is saturated with a 50/50 mixture of H2 and 0 2 gases. The calculated heat defect of this system (—2.4%) agrees well with the measured values [21]. As this calorimeter determines the absorbed dose averaged over its entire volume representing the specific energy imparted, a second step is necessary to measure the absorbed dose at a point in a water phantom. This step is done using the Fricke dosimeter as a transfer standard [22]. A correction factor to take into account the perturbation effects due to the walls of the Fricke irradiation vials (ampoules) must be applied. Its values, which depend on the radiation quality, have been calculated and experimentally verified to within 0.2% [23]. Although measurements in a ^Co beam are under way, by assuming that the radiation chemical yield of the Fe3+ ions of the Fricke solution determined from the comparison of Fricke dosimetry with water calorimetry at 20 MV X rays is independent of radiation quality, it is possible to establish the absorbed dose for ^Co y radiation today. The uncertainty in the absorbed dose to water based on this method is about 0.7%.
The primary water absorbed dose standard for ^Co y radiation implemented in 1976 by W.H. Henry was based upon a graphite calorimeter and an ionometric transfer system. Provided that the effect of the vacuum gaps in the graphite absorbed dose calorimeter is taken into account (the gap correction factor has been estimated to be 1.0037 [24]) the two NRC determinations of water absorbed dose at ^Co y radiation are in good agreement (0.2%). The gap correction factor is not currently included in the NRC calibration service.

I A E A - S M - 3 3 0 /4 8 99
2 . 5 . P T B p r i m a r y w a t e r a b s o r b e d d o s e s t a n d a r d
At the Physikalisch-Technische Bundesanstalt (PTB) in Germany the primary water absorbed dose standard is based upon a chemical method, where the total absorption of 5.6 MeV electrons produced by a microtron is used to determine the radiation response of the Fricke solution in terms of energy imparted divided by the absorbing mass of the solution [25]. By measuring the electron beam current by means of a current transformer combined with a Faraday cup and the electron kinetic energy by means of a bending magnet the total power of the electron beam is determined. Total absorption of the electrons in a vessel (60 mm diameter, 30 mm depth) filled with Fricke solution enables the ratio between the specific radiant energy imparted and the change in optical density of the solution measured spectro- photometrically to be obtained. Small corrections are required for energy losses due to bremsstrahlung and backscattered electrons. By assuming that the radiation chemical yield is the same for ^Co y and high energy radiation as for the totally stopped 5.6 MeV electrons and taking into account the ratio of absorbed dose to water and Fricke solution, a small probe of the Fricke solution placed in a glass ampoule (about 1 cm in diameter and 3 cm long with a wall thickness of 0.5 mm) may then be used to measure the water absorbed dose at a point in the water phantom. The correction of the glass wall effect is now available according to Ref. [23]. Since the response of the Fricke solution was found to be subject to slight variations with time and preparation, the response of each new batch is determined by comparison in the well known radiation field of a ^Co y source, where the water absorbed dose rate has been measured by the method described above. The uncertainty (la) is about 0.7 %. Further and future developments in the primary water absorbed dose standards of the PTB are described in Ref. [26].
3. CALIBRATED TRANSFER INSTRUMENTS USED FOR THECOMPARISONS
As can be seen from Section 2 primary water absorbed dose standards are in most cases more complex than those for air kerma since auxiliary equipment and procedures may be involved, making them no longer transportable. Therefore, direct comparisons as with graphite absorbed dose calorimeters at the BIPM [27] have not been carried out up to now; instead, comparisons are made using transfer instruments. Ionization chambers are suitable transfer instruments as they are easy to carry, have long term stability and are capable of accurate direct readout with a suitable electrometer. The energy dependence of response of ionization chambers as calculated using the formalism and data of the Code of Practice of the International Atomic Energy Agency (IAEA) [28] varies by up to about 4% between “ Со y radiation and high energy photons of 20 MV nominal energy, depending on the ioniza-

100 B O U T I L L O N e t a l .
tion chamber type. Thus, the indirect comparison of primary standards at high energy photon radiation w ill be hampered by the difficulty of characterizing the radiation quality adequately. Fricke solution contained in ampoules as transfer dosimeter offers smaller energy dependence as the perturbation correction factor for the wall effect w ill not vary by more than 1.5% in the worst case reported in Ref. [23]. For bilateral comparisons at high energy photon radiation, transfer instruments allow a comparably easy link to the “ Co reference standards that the BIPM maintains with very high stability [29]. Section I of CCEMRI [30] has recommended all comparisons to be carried out in a manner which links them to the BIPM “ Co reference system.
4. COMPARISON OF PRIMARY WATER ABSORBED DOSE STANDARDS
The comparisons conducted up to now can be divided into three groups, which are treated in the following sections.
4 . 1 . C o m p a r is o n s in th e ® °C o y b e a m a t th e B I P M
The long term stability of the BIPM equipment and of the ^Co irradiation facility is excellent, with a standard deviation of as low as 0.015% over the years[31], allowing even a dosimetric determination of the half-life of the radionuclide. Figure 1 demonstrates that a given national standard compared at ^Co y radiation with that of the BIPM is linked to all other standards involved whenever the comparison is performed. Figure 2, derived from the information given in Ref. [6 ], shows the results of the indirect comparisons carried out up to now.
FIG. 1. The long term reproducibility of the water absorbed dose rate measurement at the 60Со y beam of the B IPM allows all comparisons made over the years to be linked to a common reference. (This figure is taken from Ref. [6].)

I A E A - S M - 3 3 0 /4 8 101
1.010
S 1.000s
щ3Q
0.990
FIG. 2. Results of comparisons of absorbed dose to water at the B IPM and calculated ratios of indirect comparisons. The calculated ratios of the indirect comparisons are given as (^labi^lab2)(^lab2^bipm)- The value for the Netherlands Measurements Institute (NMI) is taken from Ref. [32]. The bars represent the uncertainties of the primary standards as stated by the laboratories.
With the NPL two comparisons were performed with different kinds of transfer instruments. Two ionization chambers (type NE 2561) located in the NPL water phantom were calibrated in terms of water absorbed dose in both the NPL and the BIPM “ Co 7 beam and in a second step calibrated inside the BIPM water phantom in the BIPM “ Co 7 beam. In the second comparison the BIPM beam was produced by a source with four times the activity of that which produced the beam used in the first comparison. Correcting all influences of the conditions of the measurement to the reference conditions (30 cm cubic water phantom, beam cross-section in the reference plane 1 0 cm x 1 0 cm, distance from source to reference plane 1 m, reference depth 5 g-cm ' 2 of water) allows the comparison of calibration factors to be viewed as a comparison of the corresponding standards. The ratio of the calibration factors of the BIPM and NPL compared at both institutes is 0.999 with a precision of 0.07% for the four ratios (two ionization chambers at each institute). The result is also shown in Fig. 2 (NPL1), where the bar relates to the uncertainty of the NPL primary standard.
102 B O U T I L L O N e t a l .
Fifteen Fricke ampoules as transfer instruments were irradiated at the BIPM to doses of 10, 20, 30, 40 and 50 Gy and in the same conditions ampoules of the same batch of solution were irradiated at the NPL. The ratio of the calibration factors determined at the BIPM and the NPL is 1.0026 (NPL2 in Fig. 2).
Since the first report of the results of the comparison [33] some improvements concerning the NPL graphite absorbed dose calorimeter and the calibration measuring chain have been made. At the BIPM the preliminary value of the absorbed dose to water, deduced by calculation from the determination of the absorbed dose to graphite, was superseded by an experimental value based on measurements performed by an ionometric method in a water phantom [6 ]. These changes are incorporated into the present results. The results indicate a very good agreement between the two laboratories and they are well inside the uncertainties resulting mainly from the determination of water absorbed dose. The various correction factors applied at the time of the calibration do not contribute appreciably to the overall uncertainty of the BIPM/NPL comparison of about 0.5%.
The NRC/BIPM, PTB/BIPM and NRC/PTB comparisons are described in more detail in Ref. [34]. Two ionization chambers of type NE 2571 and three of type Capintec PR-06C were chosen as transfer instruments. The reproducibility of the calibration factors typically is at the 0.1% level. Owing to time limitations at the BIPM only three ionization chambers were calibrated. The ratio of the absorbed dose determination at the NRC to that at the BIPM (NRC in Fig. 2) relates to the Fricke dosimetry from water calorimetry at 20 MV. The overall agreement is compatible with the uncertainties stated by the participants in the comparison. The PTB primary water absorbed dose standard implies the use of Fricke dosimeter ampoules in the ^Co 7 reference radiation field. As this standard is the actual starting point of the dissemination chain in Germany, the recently calculated correction factor for the perturbation effect of the glass wall of 0.9977 [23] has not been incorporated in the absorbed dose ratio.
4 . 2 . B i l a t e r a l c o m p a r is o n s a t “ C o y r a d i a t io n
4.2.1. NRC/PTB comparison
The NRC/PTB comparison was conducted in a similar way to the NRC/BIPM and PTB/BIPM comparisons and details can be found in Ref. [34]. Figure 2 reveals that the standards of both laboratories are in good agreement.
4.2.2. NPL/PTB comparison
Three NE 2561 ionization chambers and a waterproof PMMA sheath were used as transfer instruments between the NPL and PTB. The long term stability of the NE 2561 chamber shown by the range of 0.03% in the ratios of NPL working

I A E A - S M - 3 3 0 /4 8 103
TABLE I. COMPARISON OF NPL AND PTB ABSORBED DOSE TO WATER CALIBRATION DATA AT 60Co 7 RADIATION AND HIGH ENERGY X RAYS FOR THE NE 2561 IONIZATION CHAMBER AS TRANSFER INSTRUMENT
Nominalradiationquality
Radiation quality
index, Q
PTB Co-60 calibration factor,
NwIcq (mGy-nC-1)
NPL absorbed dose to water
calibration factor (mGy-nC-1)
MeanNPL/PTB
Serial No.:: 244 293 297 244 293 297
Co-60 101.8 101.3 102.7 102.18 101.66 103.04 1.004
8 MV 0.711 101.5 101.0 102.4 101.53 101.02 102.42 1.000
10 MV 0.725 101.5 101.0 102.4 101.12 100.62 102.02 0.996
16 MV 0.764 100.7 100.2 101.6 99.74 99.28 100.65 0.992
18 MV 0.772 99.66 99.17 100.5 99.46 99.00 100.38 0.998
Note: The NPL results are interpolated and relate to the radiation qualities at the PTB linearaccelerator.
standards and PTB transfer standards, together with radioactive check source measurements before and after each calibration, proved the suitability of the NE 2561 ionization chambers for these comparisons. The NPL radiation source was a Mobaltron therapy “ Co 7 source. The PTB measurements were performed in the PTB “ Co reference radiation field, where the Fricke dosimetry system primary standard [25] was used to establish the reference radiation field in terms of water absorbed dose rate. The calibration factors for the three ionization chambers (in mGy-nC'1) as determined by the NPL and PTB are listed in Table I and give a mean NPL/PTB ratio of 1.004. The uncertainty of 0.9% as the combination of the uncertainties of the two laboratories (Ict) and the mean ratio of the calibration factors are in good agreement. The result fits well with those shown in Fig. 2. A correction factor to the PTB Fricke dosimetry for the effect of the glass ampoule and the air volume in the neck of the ampoule (0.9972 according to Ref. [23]) has not been applied but would not change the result significantly. The reason for not changing this value is that it is the actual standard of the PTB for “ Co 7 radiation and it is used as the basis of the PTB calibration service.
4.2.3. N RC/N IST comparison
The comparison of the absorbed dose to water standards of the NRC and NIST was carried out using Fricke dosimetry and ionization chambers calibrated at the

104 B O L T I L L O N e t a l .
TABLE П. DETERMINATION OF WATER ABSORBED DOSE RATE AT THE NIST “ Со у BEAM USING THE NRC IONIZATION CHAMBERS WITH THE NRC CALIBRATION FACTORS AND THE NIST IONIZATION CURRENT MEASUREMENTS
Ionizationchamber
NRC calibration factor
(mGy-nC'1)
NIST current (10‘ 10 A)
Dose rate (Gy • min"1)
PR-06C-66564 47.673 4.974 8 1.423 0PR-06C-67615 47.385 5.000 6 8 1.421 7NE 2571/1527 45.534 5.198 33 1.420 2NE 2571/667 44.443 5.326 03 1.420 2
Average: 1.421 3 ± 0.001 3 (0.09%)
Note: The reference date for the measurements is 29 October 1991.
TABLE Ш. SUMMARY OF NIST AND NRC ESTIMATES OF WATER ABSORBED DOSE RATE ON THE AXIS AT THE REFERENCE DEPTH OF THE NIST “ Со y BEAM
Method Dose rate (Gy min'1)
Difference from average value
(%)
NIST
Graphite-water calorimeter 1.6533 +0.19Graphite calorimeter 1.6495 -0.04Sealed water calorimeter (H2) 1.6502 -0.15
Average 1.6502
NRC
Transfer by Fricke 1.6309 -0.13Transfer by ionization chamber 1.6350 +0.13
Average 1.6330
Note: The reference date is 2 October 1990.

I A E A - S M - 3 3 0 /4 8 105
NRC as transfer instruments. The consistency of the NRC Fricke dosimetry system at a level of about 0.15% has been demonstrated by quality assurance measurements performed approximately quarterly over many years.
. In the first part of the comparison, eight NRC quartz Fricke vials were irradiated at the NIST using the “ Со y source contained by a Theratron F therapy head with a 15 cm x 15 cm field and at 5 cm depth in a water phantom. Nominal doses between 5 and 20 Gy were delivered. The ratio of the change in optical density measured at the NRC and irradiation time stated by the NIST had a statistical uncertainty (la) of 0.08%. After applying a 0.1% correction to account for the dose gradient over the area of the Fricke vial in the reference plane, the rate of absorbed dose to water at the reference point was determined. The overall uncertainty is estimated to be 0 .8 %.
In the second part of the comparison, four transfer ionization chambers, two of type NE 2571 and two of type Capintec PR-06C previously calibrated at the NRC (primary water absorbed dose standard, see Section 2.4), were taken to the NIST. Using a waterproof sheath of 0.5 mm PMMA, the chambers were located at the reference point in the NIST beam and the absorbed dose rate was determined by multiplying the NRC calibration factors by the ionization currents as read by the NIST. The resulting absorbed dose rate at the NIST and the variance of the determination from the four chambers (0.09%) are shown in Table П.
Table HI summarizes the NRC/NIST results. The average value of the rate of absorbed dose to water in the NIST “ Со y beam as determined by the NRC using two transfer techniques referring to the same primary standard and the average value of the dose rate as determined by the NIST using three different absorbed dose calorimeter standards differ by 1.1%, with the NIST value being larger.
4 . 3 . C o m p a r is o n s a t h ig h e n e r g y X r a y b e a m s
Two comparisons were carried out in high energy X ray beams in 1988 between the NPL and PTB and in 1989 between the NRC and PTB.
4.3.1. NPL/PTB comparison in high energy X ray beams
The NPL and PTB water absorbed dose measurement capabilities have been compared via the calibration of three ionization chambers for X rays between 4 and19 MV nominal energy. The comparison at “ Co described in Section 4.2.2 formed part of this exercise, from which preliminary results are presented elsewhere for discussion [33, 35]. The discrepancies at that time between the two laboratories were considerable. Since then there have been changes to the NPL and PTB measurements, among which those concerning the beam quality specification and adjustment and the correction for the Fricke ampoule glass wall had the largest impacts. In 1992 an increase of 0 .6 % due to the reassessment of the electrical calibration of the

106 B O U T I L L O N e t a l .
TABLE IV. RADIATION QUALITY CORRECTION FACTORS kQ EXPERIMENTALLY DETERMINED AT THE PTB FOR THE NE 2561 IONIZATION CHAMBER(The values used up to now by the PTB have been revised to take into account the
effects of the Fricke glass ampoules.J
Nominalradiationquality
Radiation quality
index, Q
Former PTB kQ values
Revised PTB kQ values
Co-60 — 1.000 1.000
8 MV 0.711 1.004 0.997
10 MV 0.725 1.004 0.997
16 MV 0.764 0.998 0.989
18 MV 0.772 0.989 0.979
Note: The Fricke dosimetry system is used in evaluating the kQ values. The changes in the kQ values reflect the changes in the absorbed dose determination at high energy radiation. Data for the Fricke ampoule effect correction were taken from Ref. [23].
calorimeter and a 0.5% decrease for “ Co 7 radiation due to the calibration method of the working standard ionization chambers were made at the NPL. Measurements at the NPL and NRC have shown that the absorbed dose to water calibration factors N w as a function of radiation quality depend on both radiation quality index Q (same meaning as TPR2o) and beam filtration [36]. The high energy X ray beam of the PTB linear accelerator (Philips SL75/20) as a therapy unit exhibits a heavily filtered radiation quality. In order to make possible a comparison with the filtration usually encountered in radiation therapy the NPL linear accelerator beam filtration was increased between 10 and 19 MV in 1989 and between 4 and 8 MV in 1992.
With the formalism used in Germany [37] and in the PTB for dosimeter calibration the calibration factor is given only at the reference radiation quality, “ Co 7 radiation. For any other radiation quality the change in response is taken into account by applying a correction factor kQ. The product of the calibration factor Nw со f°r “ Co 7 radiation and the radiation quality correction factor kQ is equivalent to the NPL calibration factor N w stated for the radiation quality index Q.
For the purpose of the comparison experimentally determined kQ values are used [38]. Table IV shows the revised kQ values taking into account the Fricke ampoule correction factors.
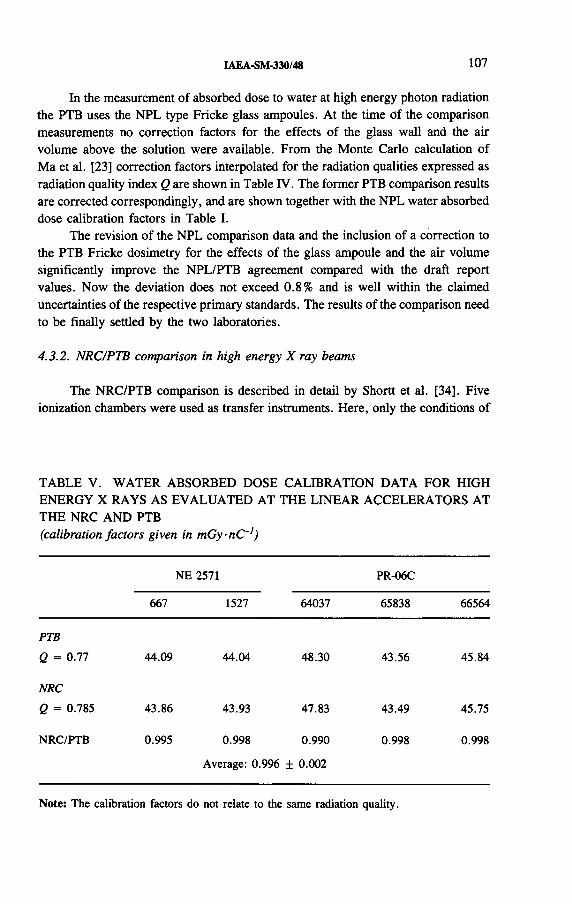
I A E A - S M - 3 3 0 /4 8 107
In the measurement of absorbed dose to water at high energy photon radiation the PTB uses the NPL type Fricke glass ampoules. At the time of the comparison measurements no correction factors for the effects of the glass wall and the air volume above the solution were available. From the Monte Carlo calculation of Ma et al. [23] correction factors interpolated for the radiation qualities expressed as radiation quality index Q are shown in Table IV. The former PTB comparison results are corrected correspondingly, and are shown together with the NPL water absorbed dose calibration factors in Table I.
The revision of the NPL comparison data and the inclusion of a correction to the PTB Fricke dosimetry for the effects of the glass ampoule and the air volume significantly improve the NPL/PTB agreement compared with the draft report values. Now the deviation does not exceed 0.8% and is well within the claimed uncertainties of the respective primary standards. The results of the comparison need to be finally settled by the two laboratories.
4.3.2. NRC/PTB comparison in high energy X ray beams
The NRC/PTB comparison is described in detail by Shortt et al. [34]. Five ionization chambers were used as transfer instruments. Here, only the conditions of
TABLE V. WATER ABSORBED DOSE CALIBRATION DATA FOR HIGH ENERGY X RAYS AS EVALUATED AT THE LINEAR ACCELERATORS AT THE NRC AND PTB (calibration factors given in m Gy-nC~])
NE 2571 PR-06C
667 1527 64037 65838 66564
PTBQ = 0.77 44.09 44.04 48.30 43.56 45.84
NRCQ = 0.785 43.86 43.93 47.83 43.49 45.75
NRC/PTB 0.995 0.998 0.990 0.998 0.998
Average: 0.996 ± 0.002
Note: The calibration factors do not relate to the same radiation quality.

108 B O U T I L L O N e t a l .
the radiation field at the NRC (PTB radiation field, see Section 4.3.1) and the modifications by the PTB to the results now judged to be required are given. At the NRC linear accelerator 20 MeV electrons impinge on a fully stopping aluminium block and a conical aluminium flattening filter is placed 20 cm from the X ray source. This gives a TPRio (Q value) of 0.785 ± 0.004. The difference in beam quality for the20 MV beam of the NRC compared with the 18 MV beam of the PTB (Q = 0.77) may lead to differences in the measured responses. On the basis of calculations following the IAEA formalism [28] for the ionization chambers used, this may amount to 0.7%. As beam quality specification by TPRfo may not be sufficient to characterize the beam in the two laboratories (clinical beam at the NTB, different filtration at the NRC) the NRC calibration factor should be somewhat smaller [36]. The correction factor for the Fricke glass ampoule is applied (Section 4.3.1). The Fricke dosimetry system is used as part of the primary water absorbed dose standard to transfer the fundamental realization of the unit gray to high energy X rays [26]. The results of the NRC/PTB comparison concerning high energy X rays are presented in Table V. The agreement is well within the stated uncertainties of about0.7% each.
5. CONCLUSIONS
Much effort has been made during the last two decades in the fundamental determination of absorbed dose to water and in establishing primary standards for this quantity. A first series of comparisons in terms of water absorbed dose at ^Co 7 radiation and also at high energy X ray beams has been carried out. The laboratories involved in the comparisons use quite different methods in determining absorbed dose to water which have uncorrelated or very weakly correlated uncertainties (mass energy absorption coefficient ratios, energy dependence of the Fricke chemical yield). The agreement at ^Co 7 radiation is good, showing a standard deviation of the results of 0.5%, which is well within the claimed uncertainties.
With respect to air kerma standards as the origin of the measurement chain, the slightly increased spread in the water absorbed dose standards is more than compensated for by the fact that the conversion of the calibration in terms of air kerma to one in terms of absorbed dose to water is not needed. In addition, air kerma standards all use basically the same technique and data, whereas five different approaches were used for the measurement of absorbed dose.
It must be emphasized that this paper can only give a ‘snapshot’ of the water absorbed dose standards in the participating laboratories, which are at different stages in developing such standards, and that further work is under way.

I A E A - S M - 3 3 0 /4 8 109
ACKNOWLEDGEMENTS
The authorship has been restricted to those representing the activities of their laboratories at CCEMRI Section I. It is deeply appreciated that most of the actual work has been done by the scientific members of the laboratories involved. These are mainly: BIPM — A.-M. Perroche and M.T. Niatel; NPL — J.E. Burns, J.W.G. Dale, D.H. Pritchard, A.R. DuSautoy, K.E. Rosser and I. Stoker; NRC — K.R. Shortt, N.V. Klassen and C.K. Ross; NIST — D.L. Bensen,S.R. Domen and P.J. Lamperti; PTB — M. Roos and M.K.H. Schneider.
REFERENCES
[1] ROGERS, D .W .O ., The advantages o f absorbed dose calibration factors, Med. Phys.
19 (1992) 1227-1239.
[2] B U R N S , J.E., D A LE , J .W .G ., D u S A U T O Y , A .R ., O W E N , B ., PR ITCH ARD,
D .H ., “ N ew calibration service for high energy X-radiation at N P L ” , Dosimetry in
Radiotherapy (Proc. Symp. Vienna, 1987), Vol. 2, IA E A , Vienna (1988) 125-132.
[3] H O H LF E LD , K ., “ The standard D IN 6800: Procedures for absorbed dose determina
tion in radiology by the ionization method” , ibid., Vol. 1, pp. 13-22.
[4] H O H LF E LD , K ., Absorbed dose standards for photon irradiation and their dissemina
tion — Status report o f IC R U work, IC R U News (in press).
[5] B U R E A U IN T E R N A T IO N A L DES POIDS ET M ESURES, International Compari
sons Performed at B IPM from May 1988 to M ay 1991, Doc. CCEMRI(I)/91-38,
BIPM , Sèvres (1991).
[6] B O U T IL L O N , М ., PERROCH E, A .-M ., Ionometric determination o f absorbed dose
to water for cobalt-60 gamma rays, Phys. Med. Biol. 38 (1993) 439-454.
[7] B O U T IL L O N , М ., Perturbation correction factor for the ionometric determination of
absorbed dose in a graphite phantom for “ Co gamma rays, Phys. Med. Biol. 28
(1983) 375-388.
[8] C O M ITE C O N S U L T A T IF P O U R LES E T A LO N S D E M E SU R E DES R A Y O N N E
M E N TS IO N ISA N TS , Report o f the 5th Meeting o f Section I, Recommendation R (I), BIPM , Sèvres (1979).
[9] C O M ITE C O N S U L T A T IF P O U R LES E T A LO N S D E M E SU R E DES R A Y O N N E
M E N T S IO N ISA N TS , Report o f the 8th Meeting o f Section I, Recommendation R (I), BIPM , Sèvres (1985).
[10] B O U T IL L O N , M ., PER R O CH E -R O UX , A .-M ., Re-evaluation o f the W value for
electrons in dry air, Phys. Med. Biol. 32 (1987) 213-219.
[11] N IA T E L , М .-T ., PER R O CH E-R O UX , A .-M ., B O U T IL L O N , M ., Two determina
tions o f W for electrons in dry air, Phys. Med. Biol. 30 (1985) 67-75.
[12] IN T E R N A T IO N A L C O M M ISS IO N O N R A D IA T IO N U N IT S A N D M E A S U R E
M E N TS , Stopping Powers for Electrons and Positrons, IC R U Rep. 37, Bethesda, M D(1984).

110 B O U T I L L O N e t a l .
[13] D O M E N , S.R., A Sealed Water Calorimeter for Measuring Absorbed Dose, Doc.
CCEM RI(I)/93-13, B IPM , Sèvres (1993).
[14] D O M E N , S.R ., LA M PER T I, P.J., A heat-loss-compensated calorimeter: Theory,
design and performance, J. Res. Natl. Bur. Stand., A Phys. Chem. 78 (1974) 595-610.
[15] D O M E N , S .R ., A sealed water calorimeter for measuring absorbed dose, J. Res. Natl.
Inst. Stand. Technol. (in press).
[16] K LA SSE N , N .V ., ROSS, C .K ., Absorbed dose calorimetry using various aqueous
solutions, Radiat. Phys. Chem. 38 (1991) 95-104.
[17] CROSS, C ., The Construction o f a Graphite Microcalorimeter for the Measurement of
Absorbed Dose, N P L Rep. RS(EXT)96, N P L , Teddington, U K (1988).
[18] B UR NS, J.E., D A LE , J .W .G ., Conversion o f Absorbed Dose Calibration from
Graphite to Water, N P L Rep. RSA (EXT )7 , N P L , Teddington, U K (1990).
[19] ROSSER, K .E ., et al., IAEA-SM-330/35, these Proceedings.
[20] SHORTT, K .R ., K LA SSE N , N .V ., ROSS, C .K ., SM ITH , G .D ., “ Ferrous sulphate
dosimetry and its role in establishing an absorbed dose to water standard for the
National Research Council o f Canada” , Proc. Workshop on Water Calorimetry
(ROSS, C .K ., K LA SSE N , N .V ., Eds), NRC-29637, N R C , Ottawa (1988) 121-126.
[21] ROSS, C .K ., K LA SSE N , N .V ., SM ITH , G .D ., The effect o f various dissolved gases
on the heat defect o f water, Med. Phys. 11 (1984) 653-658.
[22] ROSS, C .K ., K LA SSE N , N .V ., SHORTT, K .R ., SM ITH , G .D ., A direct comparison
o f water calorimetry and Fricke dosimetry, Phys. Med. Biol. 3 4 (1989) 23-42.
[23] M A , C .-М ., ROGERS, D .W .O ., SHORTT, K .R ., ROSS, C .K ., N A H U M , A .E .,
BIELAJEW , A .F ., W all correction and absorbed dose conversion factors for Fricke
dosimetry: Monte Carlo calculations and measurements, Med. Phys. 20 (1993)
283-292.
[24] B O U T IL L O N , M . , Gap correction for the calorimetric measurement o f absorbed dose
in graphite with a ^ C o beam, Phys. Med. Biol. 3 4 (1989) 1809-1821.
[25] FEIST, H ., Determination o f the absorbed dose to water for high-energy photons and
electrons by total absorption o f electrons in ferrous sulphate solution, Phys. Med. Biol.
27 (1982) 1435-1447.
[26] ROOS, М ., H O H LF E LD , K ., IAEA-SM-330/45, these Proceedings.
[27] C O M ITE C O N S U L T A T IF PO U R LES E T A LO N S D E M E SU R E DES R A Y O N N E
M E N TS IO N ISA N TS , Report o f the llth Meeting o f Section I, B IPM , Sèvres (1991).
[28] IN T E R N A T IO N A L A T O M IC E N E R G Y A G E N C Y , Absorbed Dose Determination in
Photon and Electron Beams: An International Code o f Practice, Technical Reports
Series No. 277, IA E A , Vienna (1987).[29] B U R E A U IN T E R N A T IO N A L DES POIDS ET M ESURES, Report o f the Director o f
B IPM to C IPM 1992, B IPM , Sèvres (1992).[30] C O M ITE C O N S U L T A T IF PO U R LES E T A LO N S D E M E SUR E DES R A Y O N N E
M E N T S IO N ISA N TS , Report o f the 10th Meeting o f Section I, Recommendation R (I),
BIPM , Sèvres (1988).[31] B O U T IL L O N , M ., PERROCH E, A .-M ., IAEA-SM-330/22, these Proceedings.
[32] G R IM B ER G E N , T .W .M ., V A N D U K , E ., IAEA-SM-330/66, ibid.
[33] O W E N , B ., A Summary o f High Energy Photon Absorbed Dose to Water Compari
sons, Doc. CCEMRI(I)/91-2, B IPM , Sèvres (1991).

I A E A - S M - 3 3 0 /4 8 111
[34] SHORTT, K .R ., ROSS, C .K ., SCH NEID ER , M .K .H ., H O H LF E LD , K ., ROOS, М .,
PERROCHE, A .-M ., A comparison o f absorbed dose standards for high energy X rays,
Phys. Med. Biol, (in press).
[35] O W E N , B ., SCH NEID ER , M .K .H ., Comparison o f the N P L and PTB Absorbed
Dose to Water Standards for High Energy Photons, internal report, N P L , Teddington,
U K , 1991.
[36] ROSS, C .K ., SHORTT, K .R ., ROGERS, D .W .O ., D E L A U N A Y , F., IA E A -
SM-330/10, these Proceedings.
[37] D EUTSCH ES IN ST ITU T F Ü R N O R M U N G , Entwurf Dosismessverfahren nach der
Sondenmethode fiir Photonen- und Elektronenstrahlung — Teil 2: Ionisations-
dosimetrie, D IN 6800, Beuth, Berlin (1990).
[38] SCH NEID ER , M .K .H ., “ Korrektionsfaktoren kQ fiir verschiedene Ionisations-
kammer-Bauarten” , Medizinische Physik (LE E T Z , H .K ., Ed.), Hiithig, Heidelberg
(1989) 337-341.


I A E A - S M - 3 3 0 /7
COMPARISON OF EXPOSURE STANDARDS IN THE ENERGY REGION 5-35 keV FOR X RADIATION
D. OLEJÁR, O. KODL,I. ZACHARIÁSOVÁ, J. PACHOLÍK National Institute of Public Health,Prague, Czech Republic
A b s t r a c t
C O M PA R IS O N O F E XPO SURE S T A N D A R D S IN TH E E N E R G Y REG IO N 5-35 keV
FO R X R A D IA T IO N .
A primary standard ionization chamber was constructed for X radiation in the range
from 5 to 35 keV. Its correction factors were estimated and a comparison measurement was
performed with the chamber which was originally used as the primary standard. The new stan
dard chamber will be used, after an international comparison, as the primary standard.
1. INTRODUCTION
Our laboratory (Dosimetry Laboratory for X Radiation) performs metrological activities in the field of standardization of ionizing radiation in the energy range from 5 to 250 keV. It maintains the primary standard for the radiation quantities exposure and air kerma. The X ray equipment used, an Isovolt 400, has been adapted for use in metrology and has two X ray tubes. One of the tubes has an inherent filtration of 3 mm Be and can be supplied with HT ranging from 5 to 150 kV constant tube potential, and the other has an inherent filtration of 4 mm Al and HT ranging from 60 to 400 kV. For the energy range mentioned above we use two primary standard chambers. The chamber used for the range 50-250 keV is a parallel plate free air chamber.
The measuring system is inserted in the pressure vessel, which makes it possible by using different pressures to extend the measured range from 20 up to 400 keV. In the chamber are placed three collector plates, the effective lengths of which are 30, 70 and 100 mm. The construction of the chamber enables us to connect different combinations of plates and in this way change the effective volume of the chamber. The entrance diaphragm is made from uranium and has a diameter of 10 mm. We have participated in several international comparisons with this chamber.
As a primary exposure standard for the energy range 5-35 keV we have used a standard chamber designed according to Greening [1] with minor modifications. We have also participated in several international comparisons with this chamber. Because this chamber has certain imperfections, we constructed a new standard chamber (Fig. 1) based on the modified design of the NBS chamber.
113

114 O L E J Á R e t a l .
FIG . 1. The new ionization chamber. Distance from centre o f collector p la te to diaphragm fro n t edge: 45.0 mm; p la te separation: 40.3 mm; effective length o f co llector plates: 13.426 mm ± 0.05% ; diaphragm diam eter: 4.758 mm ± 0.05% ; chamber voltage: 2000 V.
2 . CONSTRUCTION OF NEW IONIZATION CHAMBER
A cylindrical form of the chamber was designed in order to simplify constructional problems in the manufacture. It is necessary to ensure the alignment of the whole measuring system and the plane parallelism of the electrodes. The critical parts are, from the point of view of the precision of machining and clamping, the diaphragm, collector and guard electrodes. With the collector and guard, a coplanarity of 0.016 mm was achieved.
The individual parts of the chamber are made of brass. The insulation rings, which are inserted between the plates (electrodes) and the outside case, are made of special insulation material. Amber is used for the insulation of the collector plates.

T A B L E I. P A R A M E T E R S
IAEA-SM-330/7
O F X R A Y S O U R C E
115
H V
(kV )
H V L
(mm AI)■®eff
(keV)
Added filter
(mm AI)
1(m A)
X0*A -kg~ ‘)
10 0.041 7.45 0 3.9 11
30 0.182 12.4 0.19 6 111
50 1.02 22.5 1.0 7 64
50 2.24 29.5 4.0 11 30
There is also a set of exchangeable diaphragms with different shapes and dimensions of aperture. From the constructional point of view, the clamping of the collector and guard electrodes in the new chamber represents a better solution and allows more precise determination of the chamber measuring volume.
The chamber shows a lower leakage current and has better shielding. The measurements were performed by using the monitor chamber. The beam axis and the corresponding chamber axis coincided in each position (a laser beam was used for the alignment). The size of the field was limited by using the secondary diaphragms in such a way that the size of the field was sufficient as regards the edge (penumbra) of the beam and, at the same time, the transmission of the useful beam through the wall of the chamber was negligible. The size of the useful beam was 4 x 4 cm2 at a focus to diaphragm distance of 50 cm. The average quadratic error of the ratio of the primary standard chamber to the monitor chamber reading in the set of measurements was < 0 .0 1 % (occasionally it was < 0 .0 2 %).
Table I presents the parameters of the X ray source used during the comparison of the standard chambers, including the X ray tube voltage, the corresponding HVL and the exposure rate in the defining plane of the limiting aperture of the standard ionizing chamber.
3. CORRECTION FACTORS
We have determined the correction factors for the new chamber. Some factors were estimated from data in the literature, some were estimated experimentally and others were calculated. We paid particular attention to the estimation of the correction factors for ionizing current saturation. We performed measurements in the range from 1000 to 2000 V polarizing voltage in steps of 100 V for both polarities and for each energy.
Table П presents the X ray tube voltage and the individual correction factors with the error estimation at the level of one standard deviation.

116 O L E J Á R e t a l .
TABLE II. CORRECTION FACTORS
HT
(kV )
H V L
(mm A l)
Scattered
radiation,
K ,( ± 0 .1% )
A ir
attenuation,
К( ± 0.02%)
Electron
loss,
К( ± 0.1% )
Saturation,
К( ± 0.05%)
10 0.041 0.996 1.065 1.000 1.002 + a
1.002 -
30 0.182 0.997 1.018 1.000 1.000 +
1.001 -
50 1.02 0.998 1.004 1.001 1.000 +
1.001 -
50 2.24 0.998 1.002 1.002 1.001 +
1.001 -
Other correction factors
Field distortion, kd 1.000 ± 0.1%
Transmission through edges o f diaphragm, кt 1.000 ± 0.01%
W all attenuation, kw 1.000 ± 0.02%
Backscatter due to monitor chamber, km 1.000 ± 0.02%
a Polarity o f the polarizing voltage.
4. COMPARISON OF CHAMBERS
In the comparison of the new with the old chamber we estimated experimentally the mass calibration factor of the original chamber, М ъ with the new chamber. From the dimensions of the original chamber, we estimated its effective volume and then also the mass of air in the effective volume, L x. The product M XL X expresses the ratio of exposures estimated by the new and the original chamber. The expressions used in the comparison are presented below:
f T" ^ к*к*-к* (c ‘k8£ M A - - A c Li
^ L¡ = 1.2932V,. (kg)•*1

TABLE Ш. COMPARISON OF NEW AND ORIGINAL CHAMBERS
I A E A - S M - 3 3 0 /7 1 1 7
HT(kV)
HVL (mm Al) M,(+)L, Щ ~ )Ц M\L\
10 0.041 1 .0 0 0 1 .0 0 1 1 .0 0 0
30 0.182 1 .0 0 0 1 .0 0 1 1 .0 0 0
50 1 .0 2 1 .0 0 2 1.003 1 .0 0 2
50 2.24 1.004 1.004 1.004
Note: + /— is the polarity of the polarizing voltage.
1.009
1.007
1.005
^ 1.003
1.001
0.999
0.997
5 9.5 14 18.5 23 27.5 32
£e« (keV)
M,(-)(., M,L,M,(+)/-,
F I G . 2 . M , L ; e s t i m a t e d f o r g i v e n e n e r g i e s .

118 O LEJÁ R et al.
where
Mi is the mass calibration factor (kg"1),Xi is the exposure (C-kg_1),Vi is the chamber volume (m3),Qi is the compensating charge (C),
К ■ • ■ sc are correction factors,1.2932 is the STP air density (kg-rn"3),i = 1 corresponds to the original chamber,i = 2 corresponds to the new chamber.
Table Ш presents the results for individual polarities and the comparison of the two chambers. The agreement between the chambers was better than 0.40%. For energies of 7.45 and 12.4 keV the agreement between the chambers was very good. For energies of 22.5 and especially 29.5 keV the agreement was less good. Figure 2 presents the quantity for the different energies.
5. CONCLUSION
The comparison of the original and the new primary standard chamber led to satisfactory results. This indicates, with regard to the results of comparison of the original chamber and other primary chambers, that with the new standard chamber better agreement should be achievable with the other national primary standards. The new chamber w ill be adopted, after an international comparison, as the primary standard.
REFERENCE
[1] GREENING, J.R., A compact free-air chamber for use in the range 10-50 kV, Br. J. Radiol. 33 (1960) 178-183.

I A E A - S M - 3 3 0 /3 6
INTERCOMPARISON OF THE UK AND SWISS PRIMARY STANDARDS OF X RAY EXPOSURE AND AIR KERMA FOR 50 kV X RAYSC.J. MORETTI*, J.A. HEATON*,G. STUCKI**, S. DUANE*
* National Physical Laboratory,Teddington, Middlesex,United Kingdom
* * Swiss Federal Office of Metrology,Wabem, Switzerland
A b s t r a c t
INTERCOMPARISON OF THE UK AND SWISS PRIMARY STANDARDS OF X RAY EXPOSURE AND AIR KERMA FOR 50 kV X RAYS.
A parallel plate free air ionization chamber and a separate air attenuation correction chamber have been constructed jointly by the Swiss Federal Office of Metrology (OFM) and the United Kingdom National Physical Laboratory (NPL) for use as the Swiss National Primary Standard for exposure and air kerma for X rays generated at voltages between 8 and 50 kV. The designs of both chambers, based on the NPL standard, are outlined and the modifications made to improve the ease of construction and the stability of the electrode systems are highlighted. The results of the dimensional metrology and the correction factors applied to both chambers are given, together with an outline of the methods used to determine them. The two standards have been intercompared at NPL at a number of X ray qualities. As the NPL standard has been compared with the free air chamber held at the Bureau international des poids et mesures, comparison data for the OFM chamber have been derived from the NPL intercomparison and are also given in the paper.
1. INTRODUCTION
For many years the Swiss Federal Office of Metrology (OFM) has relied upon the use of transfer chambers calibrated against the United Kingdom primary standards at the National Physical Laboratory (NPL) as the national standards for X ray air kerma. Thin window ionization chambers used for low energy X rays had, over the years, proved to be less than satisfactory for use as transfer devices. As the search for a suitable chamber had proved fruitless OFM commissioned NPL to
119
120 M O R E T T I e t a l .
manufacture a primary standard free air chamber to a design based on the NPL standard. The work was carried out jointly. NPL modified the original design, manufactured the electrode systems and assembled the primary standard while OFM manufactured the outer casings, the guard bar systems and the defining apertures. Intercomparison between the new OFM chamber and the NPL standard was carried out at NPL during the autumn of 1992. The project was carried out under the auspices of EUROMET.
2. NPL PRIMARY STANDARD
2 . 1 . C h a m b e r d e s ig n
The NPL 50 kV primary standard free air chamber (FAC) is fully described in an NPL report [1] which covers the design specification, metrology and electrical acceptance tests; the correction factors for the chamber are summarized, as are the experiments to determine them and their uncertainties. The chamber has been intercompared with the NPL 300 kV primary standard chamber [2], with the low energy primary standard of the Bureau international des poids et mesures (BIPM) [3,4], and with the Italian low energy primary standard [5]. The principal dimensions of the chamber are given in Table I.
2.1.1. Collecting electrode assembly
The flatness and coplanarity of the collector and the adjacent guard electrodes coupled with the mechanical stability of the assembly lead to a well defined and stable collecting volume. The manufacturing specification calls for a surface flatness of better than 0.5 /xm and coplanarity better than 2.5 /xm; the need for these close tolerances has been confirmed by experiment and calculation.
In this original design the three aluminium alloy electrodes are clamped together using lapped dowel rods insulated with Lucentine to give the required electrical insulation (> 1014 0). Considerable precision machining was required.
2.1.2. Guard bar assembly
Equipotential planes in the guard bar assembly are manufactured from square- section lapped aluminium alloy rods screwed and pinned together; all the frames are then mounted on four insulating pillars. As the comers of the frames can twist, it was found difficult to assemble them with the necessary equality of spacing between planes.
The potential divider is housed in a separate compartment to eliminate any heating effect it might have on the air in the chamber. Connections to the guard bars are made via lead-through insulators.

I A E A - S M - 3 3 0 /3 6 121
TABLE I. PRINCIPAL DIMENSIONS OF THE NPL AND OFM PRIMARY STANDARD CHAMBERS
NPL OFM
Collecting electrode length 19.827 mm 20.311 mmAperture diameter 8.0075 mm 8.0010 mmCollecting volume 998.48 mm3 1021.20 mm3
Polarizing potential 1.5 kVElectrode spacing 62.5 mmElectrode width:
Collector 75 mmGuards 95 mmHT 95 mm
Electrode length:Guards 60 mmHT 140 mm
Distance from defining planeof aperture to chamber centre 88.5 mm 90.1 mmSurface flatness <0.5 цт
Coplanarity and parallelism <2.5 цтп
2.2. Chamber correction factors
The overall correction factors applied to the NPL chamber are given in Table П (taken from Ref. [1]).
2.2.1. Scattered photon correction
The scattered photon correction was determined by placing a series of aluminized Mylar foil tubes of differing thicknesses inside the FAC so that they enveloped the primary beam. The reduction of the ionization current by each tube was determined and, assuming that scattered electrons are stopped, the correction obtained by extrapolating to zero tube thickness; account was taken of the differences in diameter of the beam and tubes and collection of ions by the tube.

122 M O R E T T I e t a l .
c/3Q
<QZ<HC/5
ÍHC< <
PiCU
PUOaz<-jeuZИXHPUozoC/5
Й<eusouСЙШHz
PüJPQCH
Ои V5С3сл
О оО- ”*3X cd0J С
<4-но ЕUiо <g
•д а>се
Q¿тз
vx>ecd■Co
COa.
uooa
o nï° Й g3 ü ü<s „ tsЙ g «
° M
<DaaeS
>ï ^ • tí13 ° э c a" oS gcd H <ü ¿S PQ «
o>•s
><
><
zuc<c
zU<u .
-o 5 g o. .> 2 t*
x -g
x °
oU<<
oU<tu
luO
JeuZ
uwS o й яОн U- X
Щ
t f<a.
i—I <
« I
S oH o >« s e
00I ON Ch
OI 8
40 NO os r-H 00 г - соos 00 os 00 00 00On о On ON os os OnOn о OS os OS On OnО О о ó Ó О
tJ* О Os OS о оOn О Os Os О о оos О On Os о о оOn о Os ON о о оÓ О ©
O O 8 8
00 ON in in00 00 00 00 00On On On os osON Os Os On ONО d © О d
<N r-» CO <N <n tJ-<T) IT) so r* 00 OS ONON ON On Os os OS OsOS ON Os Os os On Osо о О d d О ©
Tj- OS *n m 40•/-> 40 r - 00 ON ON
Os Os ON On ON os OsOn Os OS OS ON Os OS© © d © © © d
Ov-> Г--40 (NГ**
40 ©cs со © V">© © © cs© © © © d
O O m in
»n<N ©V~i © Ю 40 ,© © CN 1Л) ©© © © © ©
VO rt ^ (N
O Not
e:
Non
-ran
dom
un
cert
aint
ies
are
the
sam
e fo
r al
l qu
alit
ies.
I A E A - S M - 3 3 0 /3 6 123
2.2.2. Saturation correction
The ionization current was determined at a number of exposure rates for a range of chamber HTs. Comparison was made between the experimental results and theoretical predictions.
2.2.3. Electric field distortion
The correction required to compensate for the field distortion arising because of the beam apertures in the guard bars was determined by making measurements of the ionization current with the chamber case at earth potential and at HT. Since the potential at the position of the guard bar apertures is approximately half the HT applied to the chamber, the correction is assumed to be half the difference between the two measurements.
2.2.4. H T polarity
The free air chamber is normally used only at negative polarity but a systematic difference between measurements at positive and negative polarity has been observed. The correction is half the difference between the two sets of measurements.
2.2.5. A ir attenuation
Correction for the attenuation of the X ray beam by the air column between the reference point of the chamber, the centre of the aperture, and the centre of the collecting electrode is made on each occasion of use of the FAC. The method chosen by NPL is to use a second free air chamber with two collecting electrodes, the air attenuation chamber (AAC) (see below).
2 . 3 . N o n - r a n d o m u n c e r t a in t ie s i n N P L p r i m a r y s t a n d a r d
The overall non-random uncertainties in the primary standard correction factors are to be found in Ref. [1]. The arithmetic and quadratic sums are 0.56% and0.28% respectively and are the same for all qualities considered in the present paper.
3. NPL AIR ATTENUATION CHAMBER
3 . 1 . C h a m b e r d e s ig n
The principle of operation of the air attenuation chamber is illustrated in Fig. 1. The essential feature is that the distance between the centres of the two col

124 M O R E T T I e t a l .
Primary standard chamber
Collector Guard j Guard
FIG. 1. Air attenuation measurements.
lecting electrodes of the chamber is equal to the attenuating path length in the primary standard. The centre of the first collector of the AAC is at the same focal distance as the aperture of the FAC, and the second collector is at the same distance as that of the FAC. A ll other aspects of the two chambers are essentially the same. The ratio of the currents from the two collectors of the AAC gives the FAC air attenuation correction directly.
This method of determining the correction has been compared with the evacuated tube technique at three qualities as part of the BIPM intercomparison [3]. The two methods agreed to within ±0.15% at the softest quality and to within ±0.05% for the remaining qualities.
3 . 2 . C o r r e c t i o n f a c to r s
The only correction factor applicable to the AAC is due to the difference in length of the two collecting electrodes.
4. OFM PRIMARY STANDARD AND AIR ATTENUATION CHAMBERS
4 . 1 . C h a m b e r d e s ig n s
The designs of the OFM chambers generally follow that of the NPL standard but there are a number of differences, which are described below. Some of these

I A E A - S M - 3 3 0 /3 6 125
changes arise because materials used in the NPL chambers are no longer available. More important changes have been made to improve stability and ease of manufacture and assembly. The structure of the free air chamber is shown in Fig. 2 and the principal dimensions are given in Table I. The method of construction of the air attenuation chamber is similar.
4.1.1. Collecting electrode assembly
The original design was difficult to manufacture and so the OFM chamber was redesigned to give a much simpler structure with the electrodes clamped to substantial lapped sapphire rods, which give both the electrical insulation required and the necessary dimensional stability.
4.1.2. Guard bar assembly
To improve its stability each equipotential plane has been machined from a single piece of aluminium alloy plate. The overall structure of the assembly is unaltered. Each plane has a nominal thickness of 5 mm; the gap between planes is nominally0 . 6 8 mm.

126 M O R E T T I e t a l .
The guard bars are connected to a divider chain of high stability, high precision metal film resistors of nominal value 1 MO. The precision and temperature stability are 0.02% and 15 ppm/°C respectively. The resistor chain consists of pairs of resistors in series (2 МП) between adjoining guard bars, with 1 MQ between the outer guard bars and their adjacent electrodes.
4.1.3. Electrode assembly side plates
The material originally used for the side plates is no longer available. Zerodur, a low thermal expansion glass, has been substituted.
4 . 2 . E le c t r i c a l m e a s u r e m e n ts
4.2.1. Collector-guard insulation
Before the chamber was finally assembled the insulation between each guard and the collector was determined to ensure that leakage currents are sufficiently low.
4.2.2. Guard bar potentials
Following final assembly of the chamber the potential difference between successive guard bars was measured. The values departed by no more than 0.01 % from the nominal values.
4 . 3 . C o r r e c t i o n fa c to r s
The overall correction factors applied to the OFM chamber are summarized in Table I.
4.3.1. Scattered photons
Because of the difficulty of determining the scattered photon correction, the values used for the NPL chamber have been adopted.
4.3.2. Saturation
The ionization current was determined at two exposure rates for a range of chamber HTs and the correction calculated in the same way as for the NPL chamber.

I A E A - S M - 3 3 0 /3 6 127
4.3.3. Electric field distortion
The electric field distortion was determined in the same way as for the NPL chamber. The measurements with the case at HT were 0.08% higher than those with the case at earth. A correction of +0.04% was therefore taken for field distortion.
4.3.4. H T polarity
There was a negligible difference (0.009%) between measurements made with positive and negative polarity, so no correction has been applied.
4.3.5. A ir attenuation
The air attenuation correction is determined on each occasion of use with the AAC.
4.4. Dimensional metrology
4.4.1. Collecting electrode length
The length of the collecting electrode was determined at 27 points by the NPL Division of Mechanical and Optical Metrology. The mean length is recorded in Table I.
4.4.2. Aperture diameter
The mean aperture diameter was determined at OFM by the Section of Length and Optics. Measurements were made in three different planes perpendicular to the axis of the parallel section at 37 equally spaced points on the circumference. The mean diameter is recorded in Table I. The surface roughness of the bore and the length of the parallel section were also determined.
4.4.3. Collector-guard coplanarity
The collector-guard surface profile was determined by measurements on a 25 x 30 grid by the Division of Mechanical and Optical Metrology (NPL). The mean electrode profile along the axis of the assembly, parallel to the beam axis, is shown in Fig. 3. Departures of the mean from nominal are less than ±0.2 цт. The calculated deviations of the electric field lines in the vicinity of the collector-guard gaps are such as to result in a departure from the nominal volume of not more than 0.03%.

128 M O R E T T I e t a l .
Distance along beam axis (mm)
FIG. 3. Mean electrode profile in the vicinity o f the FAC electrode gaps.
5. INTERCOMPARISON
The NPL and OFM chambers were intercompared at NPL over a range of qualities generated at voltages between 8.5 and 50 kV. The results are presented in Table П. As the NPL chamber has been intercompared at BIPM, ratios of the response of the OFM standard to that of BIPM have also been derived for comparison purposes and are included in the table.
The two chambers agree to within the limits of the principal non-random uncertainty affecting the intercomparison, that of the volume determination, estimated to be ±0.1% for each chamber. Other uncertainties are common to both chambers and may be neglected.
REFERENCES
[1] MARSH, A.R.S., WILLIAMS, T.T., 50 kV Primary Standard of Exposure, 1978 Design of Free-Air Chamber, NPL Rep. RS(EXT)54, NPL, Teddington, UK (1982).
[2] WILLIAMS, T.T., Intercomparison between the Primary Standard for 50 kV X-rays and the Primary Standard for 300 kV X-rays at NPL, NPL Rep. RS(EXT)64, NPL, Teddington, UK (1983).

I A E A - S M - 3 3 0 /3 6 129
[3] MARSH, A.R.S., WILLIAMS, T.T., Comparison of Exposure Standards for X-rays Generated between 10 and 50 kV, BIPM/NPL, Doc. CCEMRI(I)/79-6, BIPM, Sèvres(1979).
[4] MARSH, A.R.S., MORETTI, C.J., BIPM/NPL Aperture Intercomparison, Doc. CCEMRI(I)/83-23, BIPM, Sèvres (1983).
[5] MORETTI, C.J., HEATON, J.A., LAITANO, R.F., TONI, M.P., Intercomparison of the Low Energy Primary Standards for X-ray Exposure of NPL and ENEA, Italy, NPL Rep. RSA(EXT)19, NPL, Teddington, UK (1991).

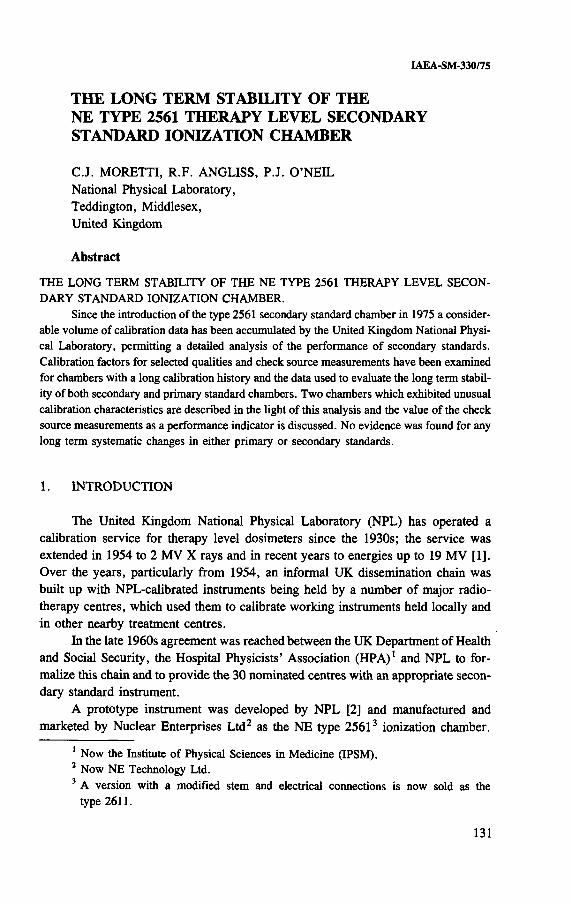
I A E A - S M - 3 3 0 /7 5
THE LONG TERM STABILITY OF THE NE TYPE 2561 THERAPY LEVEL SECONDARY STANDARD IONIZATION CHAMBERC.J. MORETTI, R.F. ANGLISS, P.J. O’NEILNational Physical Laboratory,Teddington, Middlesex,United Kingdom
A b s t r a c t
THE LONG TERM STABILITY OF THE NE TYPE 2561 THERAPY LEVEL SECONDARY STANDARD IONIZATION CHAMBER.
Since the introduction of the type 2561 secondary standard chamber in 1975 a considerable volume of calibration data has been accumulated by the United Kingdom National Physical Laboratory, permitting a detailed analysis of the performance of secondary standards. Calibration factors for selected qualities and check source measurements have been examined for chambers with a long calibration history and the data used to evaluate the long term stability of both secondary and primary standard chambers. Two chambers which exhibited unusual calibration characteristics are described in the light of this analysis and the value of the check source measurements as a performance indicator is discussed. No evidence was found for any long term systematic changes in either primary or secondary standards.
1. INTRODUCTION
The United Kingdom National Physical Laboratory (NPL) has operated a calibration service for therapy level dosimeters since the 1930s; the service was extended in 1954 to 2 MV X rays and in recent years to energies up to 19 MV [1]. Over the years, particularly from 1954, an informal UK dissemination chain was built up with NPL-calibrated instruments being held by a number of major radiotherapy centres, which used them to calibrate working instruments held locally and in other nearby treatment centres.
In the late 1960s agreement was reached between the UK Department of Health and Social Security, the Hospital Physicists’ Association (HPA) 1 and NPL to formalize this chain and to provide the 30 nominated centres with an appropriate secondary standard instrument.
A prototype instrument was developed by NPL [2] and manufactured and marketed by Nuclear Enterprises Ltd2 as the NE type 25613 ionization chamber.
1 Now the Institute of Physical Sciences in Medicine (IPSM).2 Now NE Technology Ltd.3 A version with a modified stem and electrical connections is now sold as the
type 2611.
131

132 M O R E T T I e t a l .
The first chambers were calibrated and issued to UK hospitals in 1975 and most have been regularly recalibrated every three years since then. NPL itself has a number of the chambers, some of which have been in use since 1973 and which have been calibrated more frequently. A ll these calibrations provide an invaluable source of data on ionization chamber stability as well as information on the performance of the primary standards themselves.
2. CALIBRATIONS PERFORMED
Throughout the period under consideration the X ray beam qualities offered by NPL for calibration purposes have been unchanged [3]. Three exposure/air kerma primary standards are used for the calibration service: two of them are parallel plate free air chambers (FACs) and the third standard is based upon the mean response of three cavity chambers with graphite walls and electrodes. The two FACs have a common (overlap) quality of 1 mm AI HVL (50 kV generating potential) and NPL has always made a practice of calibrating all chambers at both of these qualities.
Initially all secondary standard chambers were calibrated over the full range of qualities from 32 kV to 2 MV (0.35 mm AI HVL to 12 mm Cu HVL) but most centres are becoming more selective and instruments are now often calibrated at only a limited range of qualities. However, as the NPL 2 MV quality has, until recently, formed the base for all high energy dosimetry in the UK, via the HPA/IPSM Codes of Practice [4, 5], there is a continuous history of calibration with that quality.
A ll 30 secondary standards were supplied with a radioactive check source4
which is invariably returned with the chamber to NPL. Check source measurements are always made at the time of calibration and provide additional data for analysis.
A number of secondary standard chambers are used by NPL as a quality control tool for the calibration service; one is included with each batch of chambers calibrated. They are calibrated in exactly the same way as the other chambers. A check on the proper operation of the calibration equipment and the stability of the primary standards is then made by comparing the current calibration with previous measurements.
3. LIMITATIONS IN THE ANALYSIS
3 . 1 . C h a m b e r s s e le c te d f o r a n a ly s is
Although the type 2561 chamber is relatively robust it is inevitable that damage or other problems occur over 18 years, breaking the continuous calibration record.
4 N E T e c h n o l o g y ^ S r c h e c k s o u r c e , N E t y p e 2 5 6 2 .

I A E A - S M - 3 3 0 /7 5 133
Chambers selected for inclusion in this analysis have been chosen only from those with the longest histories unaffected by repair or dismantling. Preference has also been given to those with the greatest number of calibrations.
3 . 2 . B e a m q u a l i t ie s
The large amount of data available for each secondary standard chamber precluded the analysis of all beam qualities, so for each FAC primary standard the softest and hardest qualities were selected, i.e. 0.35 mm AI HVL and 1.0 mm AI HVL for the 50 kV primary standard and 1.0 mm AI HVL and 4 mm Cu HVL for the 300 kV standard. The 2 MV primary standard cavity chambers are used for only one beam quality, 12 mm Cu HVL (2 MV generating potential), which, for calibration purposes, is equivalent to ^Co y rays. Intercomparison of secondary standard chamber calibration factors determined with the two qualities with 1 . 0 mm AI HVL is particularly valuable since this permits any variations in the two primary standards to be evaluated. Comparison between the 4 mm Cu and 12 mm Cu HVL qualities may also give some indication of possible changes in their respective primary standards.
4. ANALYSES MADE
4 . 1 . C a l i b r a t i o n u n c e r t a in t y
4.1.1. X ray calibrations
The random and systematic uncertainties in the calibration of an individual secondary standard have been thoroughly analysed by Marsh and Cross [6 ]. For each quality at which an ionization chamber is calibrated they found that the uncertainties at the 95% confidence level were:
(a) Estimated random uncertainty ±0.3%;(b) Non-random uncertainty ± 1 %, calculated by summing in quadrature the esti
mated non-random uncertainties for the primary standard correction factors, the physical quantities involved and the calibration procedure;
(c) Overall uncertainty ±1.1%, calculated by summing in quadrature the random and non-random uncertainties.
When comparing the repeated calibration of a chamber at a given quality it is not necessary to take account of the full non-random uncertainty; the uncertainties

134 M O R E T T I e t a l .
in the correction factors for the primary standard and the physical quantities may be omitted. In these circumstances:
(d) The quadrature sum of the remaining non-random uncertainties is ±0.4%.(e) The overall quadratic sum of the random and remaining non-random uncertain
ties is ±0.5%.
When comparing the results from calibration against two different primary standards the full non-random uncertainty must be taken into account.
4.1.2. Check source measurements
Check source measurements are expressed either as the time taken to achieve a specified instrument reading or as a current, depending on whether the chamber is received for calibration with or without a measuring assembly. Six readings are taken when the instrument is first received and a further six just before the newly calibrated chamber is returned. Readings are corrected for variations in air temperature and pressure and for source decay and the mean and standard error of the mean (seom) of each group of six readings calculated as well as the overall mean.
The random uncertainty in repeat determinations of the check source reading is estimated to be ±0.12% at the 95% confidence level, for measurements made during a given calibration period.
1.01 Г
1.00 -
о 0.99 L4-»u 1 01 r
1.00 -о “•4-» 0.99 L
J-HS i 1.01 г
1.00 ■-
T? 0.99 LоN 1.01 Г
6 1.00 -
uО 0.99 L
z 1.01 r
1.00
0.99 L
О О О x Д DD °П
-o-------- b '
о о K0 oQ ÇS D® ®в 09 Do V^"----------S7_ ^ -JJ”-----------------------
l - a _ 9 -------------- a?
X0 дОX Aо
•9-■
J 9. s i f А ? Is! i
50 kV FAC 0.35 mm Al
50 kV FAC 1.00 mm Al
300 kV FAC 1.0 mm Al
300 kV FAC 4.0 mm Cu
2 M V S T D1 2 mmCu
74 76 78 80 82 84 86 88 90 92Year
FIG. 1. Constancy of calibration factor for a number of secondary standards.

I A E A - S M - 3 3 0 /7 5 135
1 .01
1 .0 0
0.99
0.98
1.02
. О «
74
SUSS
su
Be
1 .01
1 .0 0 •
0.99
0.96
0.97
0.96
т - vM e a n ra t io
-$ v ----- *“O n V
-8 9 - ud
76 78 92
Year
M e a n ra t io
0 ° x O д
П eg ° J * 9 . nH D° BvV
74 76 78 80 82 84 86 88 90 92
Year
FIG. 2. Primary standard constancy: ratios of chamber calibration factors.
4.2. I n d i v i d u a l c h a m b e r s
For each beam quality selected for analysis, calibration factors have been normalized to the mean value. Normalized factors have been plotted against the date at which the measurement was made. Also plotted are the overall uncertainty limits from (e) in Section 4.1.1 of ±0.5%. Figure 1 shows the combined data from a number of chambers.
4 . 3 . C o m p a r is o n s o f p r i m a r y s ta n d a r d s
To investigate the long term relative stability of the two FACs, the ratio of individual secondary standard calibration factors (50 kV FAC/300 kV FAC) determined at 1.00 mm AI HVL during the same calibration session was calculated; this is plotted in Fig. 2. I f there are no systematic differences between primary standard chambers the ratio should be unity.
Figure 2 also shows the ratio of calibration factors determined by the 300 kV FAC and the 2 MV cavity standard (at 4 mm Cu and 12 mm Cu HVL respectively). The factors determined with these two standards cannot be compared directly since calibrations with the latter are made with a thick walled buildup cap fitted; ratios

136 M O R E T T I e t a l .
between the two are thus not expected to be unity but they should stay constant. Uncertainty limits of ±1.6%, the quadrature sum of the individual total uncertainties, are also plotted.
5. FAULTY CHAMBERS
In the course of 18 years, with an average of 25 calibrations each year from the UK and overseas organizations, a number of faulty chambers have been encountered. It is instructive to examine some of these examples in detail.
5 . 1 . C o n t a m in a t e d c h a m b e r
Chamber A had been calibrated on two occasions three years apart with very good agreement. On the third calibration substantial differences in calibration factor were found, with up to 1.7% at 2 mm Al HVL, but with no significant difference for the 2 MV quality. On removal of the graphite cap, traces of a white deposit were found close to the vent with a tiny amount inside the cavity. When the deposit was
3(ЛСОнX<D
UCSЧ-НС
. 213иï2cCV<v>
<Dt í
F I G . 3 . E f f e c t o f c o n t a m i n a t i o n o n c h a m b e r r e s p o n s e .

I A E A - S M - 3 3 0 /7 5 137
F IG . 4. Effect o f electrode corrosion on cham ber perform ance.
removed and the cap replaced, calibration factors returned to values close to those expected. Figure 3 shows the four calibration curves.
It was not possible to identify the contaminant but it was suspected that it was talc from a waterproof sleeve. Users of the instrument had not been aware of any problems.
5.2. Corroded chamber
Chamber В was received for recalibration after two previous calibrations which had agreed well. Visual inspection of the instrument and the initial check source times were satisfactory. The chamber was calibrated first against the 50 kV primary standard, when differences of about 20% were found. Inspection revealed that the hollow aluminium central collecting electrode, which has a wall thickness of less than 0.2 mm, had a hole in it produced by severe corrosion. Figure 4 shows the changes observed. It was necessary to replace the central electrode and insulator assembly and so the subsequent calibration is not comparable, but the curve is added to illustrate the similarity of response of different chambers.

138 M O R E T T I e t a l .
The instrument had not been used for several years and none of the earlier users knew of any problems. It was concluded that the corrosion was probably due to very high humidity in the store where the instrument had been kept.
5 . 3 . B r o k e n g r a p h i t e c a p s
Several instruments have been received for which the initial measurement of the current from the check source was higher than expected; visual inspection of the chamber showed no signs of problems. Removal of the cap revealed in each case a circumferential fracture at the junction of the cap and its flange, allowing the cap to move; the break was hidden by the Delrin nut retaining the graphite cap.
Since no X ray calibrations are carried out until any observed differences between previous and present check source measurements are resolved, the effect of this type of fault on chamber response is not known.
6 . CONCLUSIONS
6 . 1 . I o n i z a t io n c h a m b e r s
Apart from chambers subsequently identified as faulty, the variations in the calibration factors of chambers examined are within the overall uncertainties in the individual factor determinations over periods of up to 15 years, with no evidence of any long term systematic changes in calibration factors. There is some suggestion in the data that there are cyclic changes within the overall uncertainty but the cause of this variability is not clear.
6 . 2 . P r i m a r y s ta n d a r d s
The comparison made between the 50 and 300 kV chambers at 1 mm AI HVL shows no significant long term trend and reinforces the results of direct intercomparisons made between the two standards [7].
The variations in the ratio of calibration factors measured with the 300 kV and2 MV standards are also well within the applicable overall uncertainty limits, with no evidence of any systematic variation in one or other of the standards.
6 . 3 . C h e c k s o u r c e m e a s u r e m e n ts
For correctly working equipment, the random uncertainty in the check source measurements at the time of calibration is typically ±0.12% at the 95% confidence level, based on a large number of measurements. Repeat measurements significantly outside these limits made at about the same time provide a good indication of either

I A E A - S M - 3 3 0 /7 5 139
wrongly applied temperature, pressure or decay corrections or faulty equipment. Agreement between check source measurements from a previous calibration up to three years before, corrected for source decay, and the current calibration is normally in accord with the above uncertainty limit. However, although poor agreement between measurements is a clear indication of a fault the converse is not true; good agreement does not necessarily indicate that the chamber quality response is unchanged since use of the source only checks the chamber volume and the overall functionality of the secondary standard. The use of the check source to correct instrument readings for air density as suggested in Ref. [8 ] is not recommended since a valuable diagnostic test is thereby lost and faulty equipment may be used.
When properly functioning chambers were used with the NE type 2560 measuring assembly the seom of six readings with the check source was ±0.025% or less; higher values of the seom always indicated that the chamber, the measuring assembly or some other aspect of the measurements was faulty in some respect.
REFERENCES
[1] ROSSER, K.E., et al., IAEA-SM-330/35, these Proceedings.
[2] K E M P , L.A.W., The National Physical Laboratory secondary standard therapy-level
X-ray exposure meter, Br. J. Radiol. 45 (1972) 778.
[3] N A T I O N A L P H Y S I C A L L A B O R A T O R Y , X-ray Exposure and Air Kerma Therapy-
level Calibration Service, D R S A D h 002, NPL, Teddington, U K (1993).
[4] H O S P I T A L PHYSICISTS’ ASSOCIATION, Revised Code of Practice for the dosime
try of 2 to 35 M V X-ray, and of caesium-137 and cobalt-60 gamma-ray beams, Phys.
Med. Biol. 28 (1983) 1097-1104.
[5] H O S P I T A L PHYSICISTS’ ASSOCIATION, Code of practice for electron beam
dosimetry in radiotherapy, Phys. Med. Biol. 30 (1985) 1169-1194.
[6] M A R S H , A.R.S., CROSS, C., Review of Uncertainties in the Use of N P L Primary
Standards of X-ray Exposure for the Calibration of Secondary Standards in Terms of
Exposure or Air Kerma, N P L Rep. RS(EXT)109, NPL, Teddington, U K (1988).
[7] W I L L I A M S , T.T., Intercomparison between the Primary Standard for 50 k V X-rays
and the Primary Standard for 300 k V X-rays at NPL, N P L Rep. RS(EXT)64, NPL,
Teddington, U K (1983).
[8] P Y C H L A U , P., S C H Ü L E , E., The exposure rate of a radioactive check device, Phys.
Med. Biol. 11 (1986) 1291.


Ï A E A - S M - 3 3 0 /4 7
INTERCOMPARISON OF DOSE DETERMINATION AS A MEANS OF DOSE QUALITY ASSURANCE IN HOSPITAL DOSIMETRYM.K.H. SCHNEIDER Physikalisch-Technische Bundesanstalt,Braunschweig, Germany
A b s t r a c t
INTERCOMPARISON OF DOSE DETERMINATION AS A MEANS OF DOSE QUALITY ASSURANCE IN HOSPITAL DOSIMETRY.
A service for therapy dosimeter intercomparisons in German hospitals provided by means of mailed Fricke dosimeters has been offered by the Physikalisch-Technische Bundesanstalt (PTB) since 1972. At that time the dosimeters were produced and evaluated by the United Kingdom National Physical Laboratory (NPL). Because of the increasing demand for these dosimeters, since 1985 the PTB has been offering additional Fricke dosimeters produced and evaluated by the PTB. The results of the intercomparisons are reported. The ratio of water absorbed dose measured by ionization dosimeters to that determined with the chemical dosimeters is the measure of the agreement reached in this intercomparison. The mean value of the frequency distribution of these ratios, independent of the type and energy of the radiation applied, is 0.995 with a standard deviation of 0.021, with eight obviously incorrect values left out of account. For “ Co radiation the mean value is 0.998 and the standard deviation 0.019. High energy X rays (after correction for the influence of the dosimeters’ glass walls) furnish very similar data: a mean value of 0.999 and a standard deviation of 0.018. For electron radiation, for which the greatest deviations are found, the results are a mean value of 0.993 and a standard deviation of 0.026. Use of this service is making a valuable contribution to ensuring the quality of therapy dosimetry in hospitals, as about 7% of the data deviate by more than 5% from the doses determined by the Fricke dosimeters. Some suggestions are made on how dosimetry in hospitals can be improved further.
1. INTRODUCTION
Dosimetry in radiation therapy must be performed by qualified personnel using high quality equipment. Absorbed dose determination in hospitals is based on measurements with calibrated therapy dosimeters and the use of a dosimetry protocol. Many hospital physicists wish to have the correctness of the applied doses confirmed by participating in intercomparisons with an independent dosimetry system.
In Germany the Physikalisch-Technische Bundesanstalt (PTB) has offered for many years a service for the voluntary intercomparison of dose measurements performed in hospitals by means of mailed Fricke dosimeters. When it was started in
141

142 S C H N E I D E R
1972, this service was offered in co-operation with the United Kingdom National Physical Laboratory (NPL). At that time the dosimeters were produced and evaluated by the NPL [1, 2]. As only a limited number of dosimeters are available at the NPL and the demand from hospitals has increased, the development of the Fricke technology at the PTB has been continuously improved, and for seven years now this intercomparison service has been offered in parallel by both laboratories. The results presented in this paper refer exclusively to the dosimeters produced, issued and evaluated by the PTB.
The data compiled during the seven years for which this service has been offered can be considered a statistically significant survey of the quality of hospital dosimetry, though it may to a certain degree suffer from the fact that participation is voluntary and that therefore the participants may not be representative (being possibly either very self-confident or very uncertain).
2. DOSIMETERS USED IN INTERCOMPARISONS
For the intercomparisons with ionization dosimetry, mailed Fricke (ferrous sulphate) dosimeters are used. Because of the role of the Fricke dosimeter in the realization of the unit of water absorbed dose [3], there is extensive experience with this dosimeter system in the PTB. The delicate procedure of sealing dosimeter ampoules is well established, and the ampoules are evaluated using a high precision photometer.
The Fricke solution is prepared from tap water, which is distilled six times, partly with bases, with acids and finally with quartz stills. The solution consists of 0.001M (NH4)2Fe(S0 4)2 -6 H20 , 0.4M H2S04 and 0.001M NaCl. After preparation, the solution is kept at 6 °C for at least 30 d in a refrigerator to avoid influences of short term reactions after preparation. The aged solution is then poured into pharmaceutical ampoules of 2.8 mL volume, which are flame sealed by a semiautomatic sealer. Before being finally filled, the ampoules are cleaned by heating, by chromic acid and by rinsing them with water and Fricke solution. Before sealing, they are filled with Fricke solution, preirradiated with 400 Gy, rinsed repeatedly and refilled.
The response of a batch of dosimeters, prepared as described, is determined by calibration in the reference field of the ^Co source, which is part of the primary measuring device and against which the unit of water absorbed dose is maintained [3]. As a result of this calibration, the conversion from the absorbed dose to Fricke solution into the absorbed dose to water is included in the calibration factor of the solution (for “ Co radiation). For high energy X rays this conversion factor varies by less than 0.1% from the value at ^Co [4] and is therefore not applied.
A ll data have been evaluated on the assumption that the Fricke dosimeter as a whole is independent of the type or quality of the radiation. New calculations have

I A E A - S M - 3 3 0 /4 7 143
furnished an energy dependent correction factor in the range of 1 % for the influence of the glass ampoules at high energy X rays. This energy dependent correction factor is applied in this paper to the results obtained by Fricke dosimeters used at high energy X rays.
3. TRACEABILITY TO PRIMARY STANDARD
The water absorbed dose is the quantity to be determined in dosimetry for radiation therapy. In Germany the unit of water absorbed dose is realized in a primary measuring device [3]. In the hospitals, dosimetry is based on ionization chambers, which are usually calibrated in terms of the water absorbed dose. They must be verified if they are to be used in radiation therapy. (Verification means that the instrument reading at “ Со y radiation must be within the limits of ±5% in the verification office. After passing this procedure the instruments are stamped ‘ ‘geeicht’ ’ (‘ ‘calibrated’ ’).) For the time being the Verification Act covers the energy range up to 3 MeV photon radiation. High energy X rays and electron radiation are not included.
The dosimetry of radiation with energies other than that of “ Со y radiation and electron radiation is governed by the German standard DIN 6800 [5]. With respect to the data, this standard is equivalent to the Code of Practice of the International Atomic Energy Agency [6 ], but dissemination is performed directly in terms of the absorbed dose to water. The application of DIN 6800 is recommended, but not prescribed by law.
In DIN 6800 the calibration factor is referred exclusively to “ Со y radiation. Other radiation types or energies are treated as influence quantities and energy dependent correction factors must therefore be applied to the readings of ionization chambers.
The dissemination of the unit of water absorbed dose from the primary standard to the calibration chain by means of standard ionization chambers is outlined in Fig. 1. In the first step, dosimeter manufacturers and verification offices act as secondary standard laboratories (their standards are at the same stage in the hierarchy of standards). In a second step, the unit is disseminated via ionization chambers (therapy dosimeters) from the manufacturers to the hospitals after verification by a verification office.
By means of their calibrated standards (ionization chambers), the dosimeter manufacturers determine the calibration factors of ionization dosimeters produced for hospitals. They apply the uncertainty of their standard, which is stated by the PTB, and add a small uncertainty by which the calibration procedure in their laboratories is affected.
It is the task of verification offices established by the Federal states to verify ionization dosimeters for radiation therapy at regular time intervals in terms of water

144 S C H N E I D E R
F IG . 1. Dissemination o f the unit o f w ater absorbed dose fro m the P T B to the hospitals.
absorbed dose. During the tests the instrument reading must be within the limits of ±5% compared with the verification standard.
In contrast to this two step dissemination, the intercomparison with Fricke dosimeters allows direct reference to be made to the primary standard for water absorbed dose maintained at the PTB. The overall uncertainty of a dosimeter is stated to be 2.1% at the 95% confidence level. For the purpose of intercomparisons, when various dosimeters are traceable to the same primary standard, the uncertainty of this standard can be disregarded and only the smaller uncertainty solely due to the dissemination (about 1% for Fricke dosimeters) must be taken into account. Even smaller deviations can then be detected, which would disappear in the wider limits of the total uncertainty.
Dose intercomparisons in hospitals are performed with ^Co y radiation, high energy bremsstrahlung (X rays) and electron radiation. The reading of the ionization dosimeter is taken as the basis to produce a given absorbed dose in the Fricke dosimeter. I f the ionization chamber is used at high energy radiation, in addition to

I A E A - S M - 3 3 0 /4 7 145
the calibration factor (according to DIN 6800) energy dependent correction factors must be applied to take the type and quality of the radiation used into account. The choice of these correction factors can be influenced by the hospital physicist through negligence or subjective misinterpretation. The physicist should therefore be guided by a dosimetry protocol.
4. RESULTS OF INTERCOMPARISONS
Since 1985 about 600 Fricke dosimeters have been issued for intercomparisons to 33 hospitals (some of them have participated repeatedly). As each user must leave 4 dosimeters unirradiated to allow the change in optical density between irradiated and unirradiated dosimeters to be determined, 420 dosimeters have been irradiated, evaluated and certified. As this intercomparison service is based on voluntary participation, some hospitals did not state the values of the absorbed doses established in the Fricke dosimeters. This lack of information has reduced the total number of comparable data to 365 dosimeters.
The following ionization chambers are used in the hospitals:
PTW M23332 27 (31)PTW M233641 9 (IDNE 2571 2 (6 )PTW M23331 3 (5)PTW M23343 4 (4)NE 2561 1 (D
The second column indicates the number of ionization chambers with different serial numbers. The figures in brackets indicate the number of intercomparisons with Fricke dosimeters in which a particular chamber type participated, independent of the type or quality of the radiation (some of the hospitals participated repeatedly with several chambers).
The last two types of ionization chambers listed are not approved by the PTB for use in legal metrology, which is limited to photon energies up to 3 MeV. They can be used for high energy X rays and electron radiation, which are not subject to legal control.
In the period during which this service has been offered intercomparable results have been obtained for 65 irradiations with “ Со y radiation, 133 with high energy X rays and 167 with electrons.
The ratio of water absorbed dose measured with ionization chambers to that determined with Fricke dosimeters is the measure of the agreement reached in the

146 SCHNEIDER
0.25
0 . 2 0
0.15
f
0 . 1 0
0.05
0
FIG. 2. Frequency distribution f o f the ratio o f water absorbed dose determined with ioniza
tion chambers to that measured with Fricke dosimeters f o r 365 dosimeters, independent o f
radiation type and quality. The mean value is 0.995, the standard deviation 0.021 (eight data
around 1.1 are excluded because they are faulty; see text).
intercomparisons. Figure 2 shows a plot of the frequency distribution/of this ratio for all dosimeters evaluated, independent of the radiation type and quality. This frequency distribution is rather asymmetrical, with a long tail at about 1.1. This tail is obviously due to errors in dosimetry, and was produced by four participants making intercomparisons at electron energies between 12 and 16 MeV (with two Fricke dosimeters for each energy). These data w ill therefore be disregarded in the following. Three of the participants had forgotten to apply the energy dependent correction
0.90 0.95 1 . 0 0 1.05 1 . 1 0 1.15
D./D.ion chem

I A E A - S M - 3 3 0 /4 7 147
factor for electron radiation. In the case of the fourth participant, discussions have not finished. The main distribution in Fig. 2 has a mean value of 0.995 and a standard deviation of 0 .0 2 1 .
Figure 3 shows three distributions according to the type and energy of the radiation used: “ Co y radiation, high energy X rays and electrons. The mean values
0.90 0.92 0.94 0.96 0.98 1.00 1.02 1.04 1.06 1.08 1.10 1.12 1.14
Ц о п ^ ^ c h e m
0.90 0.92 0.94 0.96 0.98 1.00 1.02 1.04 1.06 1.08 1.10 1.12 1.14
D i o r / ^ c h e m0.20
0.15
0.10
0.05
0.90 0.92 0.94 0.96 0.98 1.00 1.02 1.04 1.06 1.08 1.10 1.12 1.14
D i o r / ^ c h e m
FIG. 3. Frequency distributions f of the ratio of water absorbed dose determined with ionization chambers to that measured with Fricke dosimeters for (a) №Co у radiation, (b) high energy X rays and (c) electrons.

148 S C H N E I D E R
and standard deviations for these distributions are 0.998 and 0.019 for “ Co 7 radiation, 0.999 and 0.018 for high energy X rays, and 0.993 and 0.026 for electrons.
The greatest difference between unity and the mean value for electrons points to a possible systematic deviation between ionization and chemical dosimetry; the largest standard deviation points to the fact that greater difficulties are involved in electron dosimetry.
Compared with the results published in an earlier paper referring to the service operated by the NPL [1], the present results reveal some improvement in the dosimetry in hospitals. In the earlier paper the mean values and the standard deviations were 0.994 and 0.031 respectively for “ Co radiation, 0.995 and 0.035 for X rays, and0.987 and 0.029 for electrons. The smaller standard deviations for “ Co radiation and X rays derived from the intercomparisons in the present paper may be due to the fact that water absorbed dose has been introduced, a quantity which is directly realized by a primary standard. For all types of radiation, some of the differences between the mean values published in the present and the former paper are due to reference being made to different primary standards. This is revealed by an intercomparison of the standards in both laboratories: the NPL to PTB ratio of absorbed dose is 1.004 for “ Co 7 radiation. In addition, the old ionization chambers have in general been replaced by new, approved types of better stability, all of which are now calibrated in terms of water absorbed dose.
In the course of time, the stable and reliable “ Co irradiation units w ill disappear from the hospitals. The number of intercomparisons with 60Co 7 radiation is therefore small and decreasing. This does not, however, severely affect the quality of dosimetry in the hospitals. This is proved by the similarity of the mean values and standard deviations of the frequency distributions for both “ Co 7 radiation and high energy X rays.
A systematic difference in all dose measurements between ionization dosimeters and Fricke dosimeters has been found for some of the participants. This points to a possible deviation of the calibration factor for the ionization chambers, for which a value of ±5% is permissible upon verification.
In some cases, especially when electron radiation with energies of about 8 MeV was used, the effective point of measurement of the ionization chamber was not located at the same depth as that of the chemical dosimeter, resulting in greater deviations due to the steep depth dose curve.
Usually deviations of more than ±5% have been discussed with the physicists at the hospitals, but not all of them have been explained. In two cases deviations were caused by the use of a radioactive check source to correct both the air density and a possible drift of the chamber response. The errors arose because a source was used which was not permitted for use with the respective chamber.
In other cases, when ionization chambers were calibrated in terms of air kerma, the physicist simply failed to apply the energy dependent dose conversion factors for photon or electron radiation.

I A E A -S M -ЗЗО /4 7 149
The intercomparison service is a valuable means to ensure confidence in the measurements performed in hospitals and to reduce the uncertainty of water absorbed dose measurements. The hospital physicist can use the result of the intercomparison to correct the previous calibration factor. This is a way to improve the calibration of the ionization dosimeter in the hospital, which has complied with the ±5% limits during verification. As the Fricke dosimeter and, in the final instance, the ionization dosimeter are calibrated with reference to the same primary standard (for ^Co 7 radiation), the uncertainty of about 1 % for the dissemination via Fricke dosimeters, together with the uncertainty of the primary standard, determines the final uncertainty of such a calibration in a hospital.
The number of ^Co sources in hospitals in Germany is decreasing. This part of dosimetry can, however, easily be taken over by X ray dosimetry with energies below 10 MV accelerating voltage. These energies require only a small correction for the glass walls of the Fricke dosimeters.
The results indicate in general good agreement between ionization and chemical dosimetry. Deviations of 3% seem tolerable for a dose assessment. Deviations of more than 5% have been found for about 7% of the intercomparison measurements. In these cases, radiation treatment with an uncertainty of 5 % for water absorbed dose in the tumour, as demanded in Ref. [7], cannot be performed and some help and advice are necessary.
A ll data are influenced by the uncertainty of the calibration factors of the ionization chambers (usually about 2 %) and by the conscientiousness with which the user applies appropriate correction factors.
To improve hospital dosimetry in Germany, several steps can be considered:
— Reduction of the deviations defined by law for the verification of dosimeters— Introduction of mandatory use of the DIN dosimetry protocol— Participation in intercomparisons prescribed by law.
At the moment, the uncertainty of measurements with the primary standard cannot be substantially improved. Nevertheless, for intercomparisons of dosimeters, which are traceable to the same primary standard (as in the case of official tests in verification offices), only the smaller uncertainty by which the dissemination of the unit is affected is of importance and the uncertainty of the primary standard can be disregarded in this case. This leads to the demand for a considerable reduction of the deviations permissible during verification and may consequently result in a more efficient control of dosimeter stability and, in the final instance, an improvement of hospital dosimetry.
The introduction of an official dosimetry protocol to be used in hospitals w ill reduce potential subjective misinterpretation and with this improve the quality of dosimetry. Obligatory participation in intercomparisons w ill help to reveal the appli-
5. CONCLUSIONS

150 S C H N E I D E R
cation of inappropriate correction factors and possible systematic discrepanciesbetween ionization dosimetry and the intercomparison dosimeter.
REFERENCES
[1] SCHNEIDER, FEIST, H., “ Neun Jahre Kalibrierdienst mit chemischenDosimetem” , Medizinische Physik 1981 (BUNDE, E., Ed.), Hüthig, Heidelberg (1982) 181-187.
[2] SCHNEIDER, M.K.H., “ Kalibrierdienst mit chemischen Dosimetem. Englische und deutsche Eisensulfatdosimeter im Vergleich mit Ionisationsdosimetem in Kranken- hausern” , Medizinische Physik 1986 (VON KLITZING, L., Ed.), Hüthig, Heidelberg (1987) 241-246.
[3] FEIST, H., Determination of the absorbed dose to water for high-energy photons and electrons by total absorption of electrons in ferrous sulphate solution, Phys. Med. Biol. 27 (1982) 1435-1447.
[4] MA, C.-М., NAHUM, A.E., Dose conversion and wall correction factors for Fricke dosimetry in high-energy photon beams: Analytical model and Monte Carlo calculations, Phys. Med. Biol. 38 (1993) 93-114.
[5] DEUTSCHES INSTITUT FÜR NORMUNG, Entwurf Dosismessverfahren nach der Sondenmethode fiir Photonen- und Elektronenstrahlung — Teil 2, Ionisations- dosimetrie, DIN 6800, Beuth, Berlin (1990).
[6 ] INTERNATIONAL ATOMIC ENERGY AGENCY, Absorbed Dose Determination in Photon and Electron Beams: An International Code of Practice, Technical Reports Series No. 277, IAEA, Vienna (1987).
[7] INTERNATIONAL COMMISSION ON RADIATION UNITS AND MEASUREMENTS, Determination of Absorbed Dose in a Patient Irradiated by Beams of X or Gamma Rays in Radiotherapy Procedures, ICRU Rep. 24, Bethesda, MD (1976).

I A E A - S M - 3 3 0 /2 7
DOSIMETRIC INTERCOMPARISON OF HIGH ENERGY RADIOTHERAPY UNITSS. PAPADOPULOS, R. GONZALEZ, E. DORDA,E. BOF, M. SARAVICentro Regional dé Referenda para Dosimetría,Comisión Nacional de Energía Atómica,Buenos Aires, Argentina
A b s t r a c t
D O S IM E T R IC IN T E R C O M P A R ISO N O F HIGH E N E R G Y R A D IO T H E R A P Y U N IT S.
Since 1978 the Secondary Standard Dosim etry Laboratory in Buenos A ires, the Centro
Regional de Referencia para D osim etría (C R R ), has been perform ing postal intercomparisons
o f “ C o units using thermoluminescent dosim etry. A detailed evaluation o f the results obtained to date on the 8 8 telecobalt therapy units operating in Argentina is presented in the
paper. The capacity o f the radiation therapy centres to improve their dosimetry is also
discussed. T he C R R has been carrying out dosim etric verifications in linear accelerators used
in radiotherapy since 1982 by means o f F rick e dosim etry. The total uncertainty in the
determination o f dose with this dosim eter is ± 2 .5 % for photons and ± 3 .5 % for electrons.
1. INTRODUCTION
The Secondary Standard Dosimetry Laboratory in Buenos Aires, the Centro Regional de Referencia para Dosimetría (CRR), has been performing postal intercomparisons of “ Co units using thermoluminescent dosimetry since 1978 in order to contribute to the improvement of dosimetric accuracy in radiotherapy. Since 1982, the CRR has been carrying out dosimetric verifications by Fricke dosimetry for linear accelerators used in radiotherapy. This paper describes the results of the intercomparisons and verifications.
2. METHOD
The methodology used for the TLD intercomparisons was described in detail in a previous paper [1 ].
With regard to the Fricke verifications the irradiation procedure was carried out in a water phantom (35 cm x 35 cm X 45 cm). The ferrous sulphate dosimeter was chosen as the reference system since the dosimeter solution is nearly water equivalent for the energies considered here. Since the dosimeters must withstand
151

152 P A P A D O P U L O S e t a l .
transit by post and show minimum storage effects, sealed glass apipoules are used. A cylindrical ampoule of neutral glass is used, with a wall thickness of 0.5 mm and a diameter of 13.5 mm, containing a solution volume of 5 cm3.
With the beam in a horizontal position, the ferrous sulphate dosimeters were suspended from a Lucite holder. The dosimeters were located for electron beams at the depth of the maximum absorbed dose, and in the case of photons at 50 or 1 0 0 mm, depending in both cases on the beam energy.
In the same holder it is possible to introduce an ionization chamber in order to irradiate both simultaneously and to have a double check.
3. RESULTS
The implementation in Argentina in 1989 of the Code of Practice of the International Atomic Energy Agency (IAEA) [2] has helped to promote uniformity of the radiation dose delivered. No data corrections arising from use of the IAEA Code have been performed on results obtained up to 1989. A ll values have been compared with the CRR reference at the time of the comparison.
3 . 1 . C o b a l t u n i ts
After the TLD capsules have arrived at the CRR the evaluated dose (ED) is determined using the CRR calibration curve. This value is compared with the quoted
FIG. 1. Percentage o f 60Co units that had at least once a deviation over certain limits
(N = 88).

I A E A - S M - 3 3 0 /2 7 153
45.5%Without significant deviation
F IG . 2. Percentage o f 60Co units that had a t most once a deviation g reater than 5 , 10 and 20% fN = 88).
|Д| < 5 % 62.7%
5 % < I Д| < 1 0 % 18.6%
F IG . 3. Results o f two successive intercomparisons o f 60 Co units with lAl > 10% in the f irs t o f them (N = 43).

154 P A P A D O P U L O S e t a l .
dose (QD) stated by the participating radiation therapy centre. The percentage deviation is defined by:
QD - EDDev% = ------------- x 100 = AED
A total of 8 8 “ Co units were involved in the comparison. The number of units that at least once exhibited a deviation over certain limits was determined. The results are shown in Fig. 1. From the data obtained up to 1991 (during this period 705 dose determinations were made for “ Co units) it was found that 13.6% of the units never showed a deviation of more than ±5%; 38.6% had at least once a deviation in the range 5% < IAI < 10%, 29.5% a deviation of 10% < 1Д1 < 20% and 12.5% a deviation of 20% < IAI < 30%; and the remainder (5.7%) showed deviations of more than 30% from the CRR reference.
The number of units that had at most once a deviation greater than 5, 10 and 20% with respect to the reference was determined. As shown in Fig. 2, 27.3% of the units had at most once a deviation of 10% < IAI < 20% and 13.6% a deviation of 5% < IAI < 10%, and the same percentage showed a deviation greater than 2 0 %.
A real indication of the improvement of a centre is given by the results of institute intercomparison. The results of two successive intercomparisons with lA l > 10% in the first of them show that in the second intercomparison 62.7% of the 43 units included in the survey now had an acceptable discrepancy of lA l <5% while 18.6% had deviations of 5% < lA l < 10% and 18.6% had IAI > 10% (Fig. 3). For those units that had discrepancies greater than 10% in both intercomparisons (N = 15), the results from 1978 up to 1991 of successive intercomparisons show that 53.3% (N = 8 ) had not yet improved their dosimetry (I AI > 10%), while 33.3% had a deviation of less than 5%.
3 . 2 . L i n e a r a c c e le r a to r s
For linear accelerators used in radiotherapy the CRR carries out dosimetric verifications with the Fricke dosimeter. The total uncertainty in the determination of dose with this dosimeter is ±2.5% for photons and ±3.5% for electrons.
With regard to the national recommendations [3], each centre must have a physicist specialized in radiotherapy and a suitable dosimetric device. This requirement is met fully in the case of accelerators and partly for the cobalt units.
The linear accelerators installed in Argentina have energies of 6-10 MV for photons and 9-18 MeV for electrons.
Each centre had at least ten Fricke verifications. Because of the limited number of linear accelerators available for medical applications in the country (up to 1990
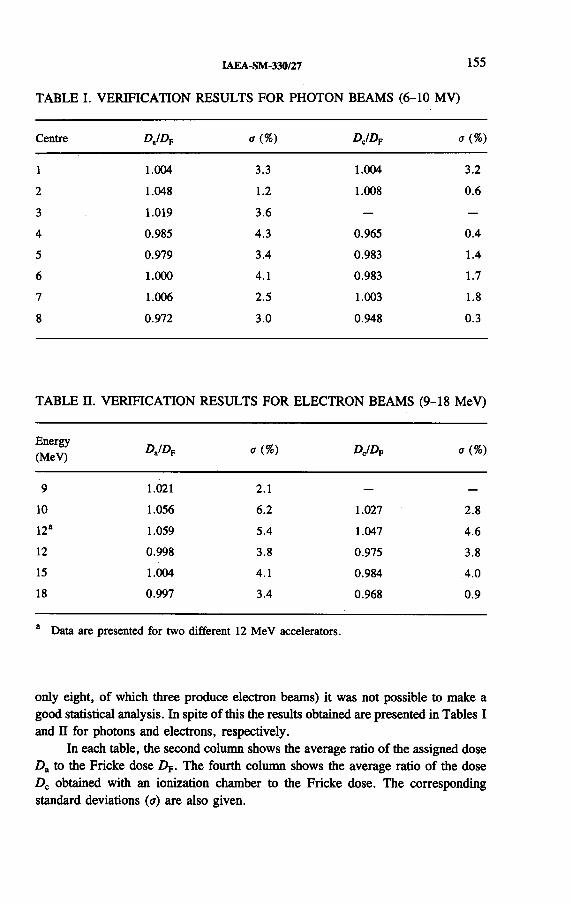
TABLE I. VERIFICATION RESULTS FOR PHOTON BEAMS (6-10 MV)
IAEA-SM-330/27 155
Centre DJDT o{%) DJDV oi.%)
1 1.004 3.3 1.004 3.2
2 1.048 1.2 1.008 0.6
3 1.019 3.6 — —
4 0.985 4.3 0.965 0.4
5 0.979 3.4 0.983 1.4
6 1.000 4.1 0.983 1.7
7 1.006 2.5 1.003 1.8
8 0.972 3.0 0.948 0.3
TABLE П. VERIFICATIO N RESULTS FOR ELECTRON BEAMS (9-18 M eV)
Energy(MeV)
d j d f (%) DJDT ff (%)
9 1.021 2.1 — —
10 1.056 6.2 1.027 2.8
12a 1.059 5.4 1.047 4.6
12 0.998 3.8 0.975 3.8
15 1.004 4.1 0.984 4.0
18 0.997 3.4 0.968 0.9
a Data are presented for two different 12 MeV accelerators.
only eight, of which three produce electron beams) it was not possible to make a good statistical analysis. In spite of this the results obtained are presented in Tables I and П for photons and electrons, respectively.
In each table, the second column shows the average ratio of the assigned dose Da to the Fricke dose Dp. The fourth column shows the average ratio of the dose Dc obtained with an ionization chamber to the Fricke dose. The corresponding standard deviations (a) are also given.
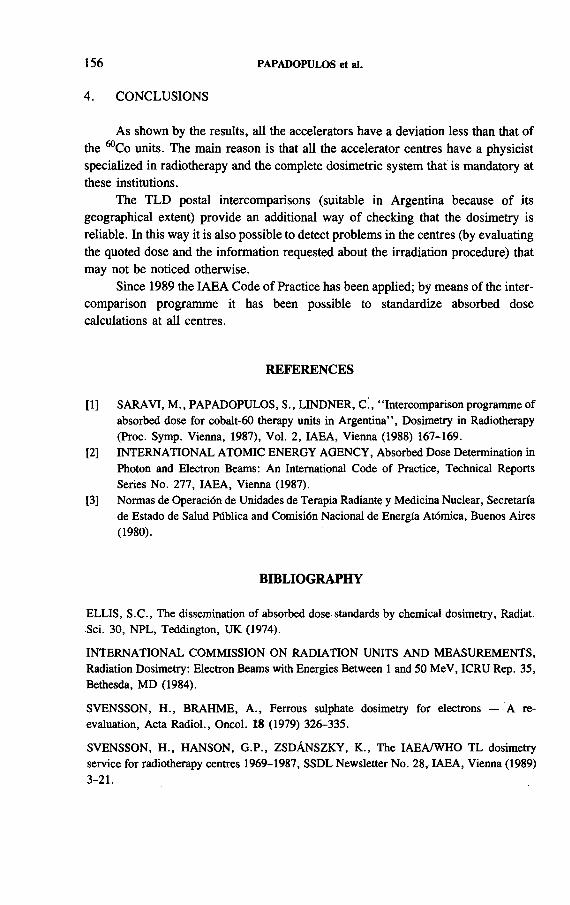
156 PAPADOPULOS et al.
As shown by the results, all the accelerators have a deviation less than that o f
the “ Co units. The main reason is that all the accelerator centres have a physicist specialized in radiotherapy and the complete dosimetric system that is mandatory at these institutions.
The TLD postal intercomparisons (suitable in Argentina because o f its geographical extent) provide an additional way o f checking that the dosimetry is
reliable. In this way it is also possible to detect problems in the centres (by evaluating the quoted dose and the information requested about the irradiation procedure) that may not be noticed otherwise.
Since 1989 the IA E A Code o f Practice has been applied; by means o f the intercomparison programme it has been possible to standardize absorbed dose calculations at all centres.
REFERENCES
[1] SARAVI, М., PAPADOPULOS, S., LINDNER, C., “ Intercomparison programme of absorbed dose for cobalt-60 therapy units in Argentina” , Dosimetry in Radiotherapy (Proc. Symp. Vienna, 1987), Vol. 2, IAEA, Vienna (1988) 167-169.
[2] INTERNATIONAL ATOMIC ENERGY AGENCY, Absorbed Dose Determination in Photon and Electron Beams: An International Code of Practice, Technical Reports Series No. 277, IAEA, Vienna (1987).
[3] Normas de Operación de Unidades de Terapia Radiante y Medicina Nuclear, Secretaría de Estado de Salud Pública and Comisión Nacional de Energía Atómica, Buenos Aires(1980).
BIBLIOGRAPHY
ELLIS, S.C., The dissemination of absorbed dose standards by chemical dosimetry, Radiat. Sci. 30, NPL, Teddington, UK (1974).
INTERNATIONAL COMMISSION ON RADIATION UNITS AND MEASUREMENTS, Radiation Dosimetry: Electron Beams with Energies Between 1 and 50 MeV, ICRU Rep. 35, Bethesda, MD (1984).
SVENSSON, H., BRAHME, A., Ferrous sulphate dosimetry for electrons — A re- evaluation, Acta Radiol., Oncol. 18 (1979) 326-335.
SVENSSON, H., HANSON, G.P., ZSDÁNSZKY, К., The IAEA/WHO TL dosimetry service for radiotherapy centres 1969-1987, SSDL Newsletter No. 28, IAEA, Vienna (1989) 3-21.
4. CONCLUSIONS

IAEA-SM-330/32
INTERCOMPARISON PROGRAMME OF ABSORBED DOSE MEASUREMENT FOR “ Co TELETHERAPY UNITS IN TURKEY
N. K IYA K , S. YA §A R , H. A LK A N Çekmece Nuclear Research
and Training Centre,Istanbul, Turkey
Abstract
INTERCOMPARISON PROGRAMME OF ABSORBED DOSE MEASUREMENT FOR “ Co TELETHERAPY UNITS IN TURKEY.
During the period 1989-1992, three TLD postal dose intercomparisons were performed on a number of мСо teletherapy units in Turkey. The method followed was based on the original IAEA/WHO programme using mailed LiF powder TLDs. The participants were asked to expose capsules filled with LiF to an absorbed dose of 2.0 Gy at a depth of 5 cm in water. The irradiated capsules were measured and evaluated by the Secondary Standard Dosimetry Laboratory (SSDL) at the Çekmece Nuclear Research and Training Centre. The first intercomparison was executed in 1989 as a pilot study involving 12 radiotherapy centres. This intercomparison showed that 9 radiotherapy centres had deviations of less than ±5% in the absorbed dose. Three institutions applied an absorbed dose with deviations exceeding the ±5% limit. The results were also compared with those from the ionometric method. The second and third intercomparisons were performed in 1991 and 1992, respectively, and 17 institutions participated in each comparison. The second intercomparison gave deviations varying between —16.0% and +0.8%, with 14 institutions having deviations within ±5%. The third intercomparison showed deviations exceeding ±5% for six “ Co units. Evaluation of the data sheets demonstrated that some of these units were not controlled by qualified hospital physicists. The studies conducted during the period 1989-1992 show the necessity of an intercomparison programme to provide an accuracy of better than ±5% in radiotherapy. Thus the intercomparison programmes performed by the SSDL have helped to evaluate the accuracy of the clinical delivery of absorbed dose.
1. INTRODUCTION
Obtaining maximum control o f tumours with a minimum o f complications to the normal tissues depends on various factors, especially the accuracy o f the absorbed dose. For this reason, a high degree o f precision and accuracy o f dose delivery to the patients is required in radiation therapy. The Dosimetry Section o f the International Atomic Energy Agency carried out a series o f intercomparison programmes o f absorbed dose for “ Co teletherapy units by post. Some radiotherapy
157

158 KIYAK et al.
centres in Turkey participated in these programmes. After its establishment, our Secondary Standard Dosimetry Laboratory (SSDL) organized a postal dose intercomparison programme covering all “ Co teletherapy machines in Turkey, using IAEA/WHO methods. This work was repeated in 1991 and 1992, and is currently in progress. In the near future it is planned to extend the intercomparison to orthovoltage X ray beams.
2. MATERIALS AND METHODS
The method followed in the intercomparison programmes was based on the original IAEA/WHO programme using mailed LiF powder TLDs [1 ,2 ] . LiF shows extremely good stability as a dosimetric material for “ Со y radiation when properly annealed. The method is outlined step by step below.
2 .1 . Preparation of detectors
The LiF powder (TLD-100) used as detector material was annealed at 400°C for 1 h and then at 80°C for 18 h. The LiF was then put into black plastic capsules with inner dimensions of 3 mm X 20 mm, each capsule containing about 60 mg of LiF. A set of four capsules (one of them marked white for control purposes) was sent to each radiotherapy centre by post together with a holder for their use, an instruction sheet indicating the irradiation conditions and a blank data sheet. The participants were asked to irradiate the three unmarked capsules to a dose of 2 Gy at 5 cm depth in a water phantom at SSD = 80 cm and a field size of 10 X 10 cm2 within two weeks after receipt. The participants were also requested to fill in the data sheet, indicating the method for the absorbed dose calculations and giving information about the irradiation. Over the same period the capsules prepared for calibration procedures were irradiated at our SSDL in the same conditions. After being returned to the SSDL, the capsules irradiated by the participants were evaluated together with the calibration capsules in order to eliminate the fading effect.
2 .2 . Calibration procedures
The capsules filled with LiF powder for calibration purposes were irradiated with known doses of “ Co radiation in the range from 0.5 to 4 .0 Gy at seven dose values. An ionization chamber of type NPL NE 2561, placed along the beam axis in the field of 10 X 10 cm2 at SSD = 80 cm and 5 cm depth in a water phantom, and a measuring assembly of type NPL NE 2560 were used for calibration procedures. The uncertainty of the measurements was evaluated to be less than ± 1 %. The calibration curve was determined for the range 0 .5 -4 .0 Gy of “ Со y radiation and measured values were converted to the dose in grays.

IAEA-SM-330/32 159
Samples of LiF powder are stabilized at 100° С for 15 min before the reading procedure. A Harshaw model 2000 A and В readout system is used for the measurement. The content of the capsules is divided into 11 portions, each weighing 5 mg, and each is separately poured onto the planchette through a vibrating dispenser. The TL peak always appeared at a maximum temperature of 240°C with a heating rate of 9°C /s and in a time period of 30 s. The capsules irradiated by the participants are evaluated together with the capsules irradiated by the SSDL for calibration purposes in order to eliminate the fading effect mentioned before. The readout system sensitivity is checked every 10 s before and after each measurement using the check light source. Then the TL measurements are corrected according to the preceding check source reading. The mean value of every set of 11 corrected readings is taken as the value for establishing a calibration curve using the known doses given to the capsules by the SSDL. The capsules irradiated by the participants are evaluated in
2.3. Measurements and dose evaluation
TABLE I. RESULTS OF FIRST TLD INTERCOMPARISON (PILOT STUDY), 1989
Dose measured by SSDL
Institution (Gy)Dose
DeviationNo.
Capsule 1 Capsule 2 Capsule 3(Gy) (%)
89110 1.96 1.92 1.97 2.00 -2.3
89112 1.98 1.97 1.99 2.00 -1.3
89114 1.95 1.99 1.91 2.03 -3.8
89115 2.05 2.01 2.06 2.00 2.2
89116 1.84 1.89 1.90 2.00 -6.3
89117 1.96 1.93 1.99 2.00 -1.8
89118 2.02 2.10 2.11 2.00 3.8
89119 1.75 1.76 1.80 1.93 -8.9
89120 2.07 2.00 2.03 2.00 1.9
89121 1.84 1.74 1.76 2.00 -11.9
89122 1.61 1.62 1.53 1.56 1.3
89123 1.63 1.63 1.61 1.58 2.9

160 KIYAK et al.
the same way as the calibration samples and the dose given to the capsules is determined using the established calibration curve. The evaluated doses are compared with the doses stated by the teletherapy centres and the percentage deviation of absorbed dose is evaluated.
3. RESULTS AND DISCUSSION
Since 1989 the SSDL has been conducting a postal dose intercomparison programme for all radiotherapy centres in the country which have ^Co teletherapy units. During this period, three intercomparisons have been performed. The first
TABLE П. RESULTS OF SECOND TLD INTERCOMPARISON, 1991
InstitutionNo.
Dose measured by SSDL (Gy)
Capsule 1 Capsule 2 Capsule 3
Dose stated by institution
(Gy)
Deviation
(%)
91111 2.03 1.93 1.95 2.00 -1.3
91113 2.01 2.02 2.01 2.00 0.8
91114 2.01 2.07 1.92 2.00 0.1
91115 1.98 2.00 2.00 2.00 -0.2
91116 2.04 1.93 1.92 2.00 -1.7
91117 1.90 1.87 1.91 2.00 -5.0
91118 1.94 1.94 1.99 2.00 -2.1
91119 1.87 1.91 1.91 2.00 -4.9
91120 1.78 1.85 1.91 2.00 -7.6
91121 1.87 1.94 1.94 2.00 -4.8
91122 1.96 1.92 1.95 2.00 -2.8
91124 1.98 2.00 1.97 2.00 -0.8
91125 1.96 1.90 1.96 1.99 -2.9
91126 1.68 1.67 1.67 2.00 -16.0
91127 1.88 1.84 1.73 1.99 -8.8
91128 1.98 1.97 2.00 2.00 -0.8
91129 1.86 1.98 1.98 2.00 -2.9

TABLE Ш. RESULTS OF THIRD TLD INTERCOMPARISON, 1992
IAEA-SM-330/32 161
InstitutionNo.
Dose measured by (Gy)
Capsule 1 Capsule 2
SSDL
Capsule 3
Dose stated by institution
(Gy)
Deviation
(%)
92118 1.87 1.86 1.88 2.00 -6.2
92117 1.93 1.93 1.91 2.00 -3.7
92119 1.86 1.90 1.88 2.00 -5.7
92120 1.89 1.93 1.94 2.00 -3.8
92112 2.10 2.07 2.13 2.08 1.2
92121 2.01 1.98 1.97 2.00 -0.5
92122 1.95 1.94 1.98 2.00 -2.1
92116 1.87 1.93 1.93 2.00 -4.3
92115 1.75 1.75 1.78 2.00 -11.7
92123 2.21 2.21 2.14 2.00 9.5
92124 1.97 2.04 2.03 2.00 0.8
92125 2.04 2.00 2.04 1.99 1.5
92127 1.98 2.02 2.00 1.99 0.4
92128 1.99 1.97 1.96 2.00 -1.1
92130 2.13 2.17 2.15 2.00 7.8
92126 1.75 1.80 1.80 2.00 -10.5
intercomparison, performed as a pilot study in 1989, was executed in 12 institutions. Following the success of this pilot study, the second and third intercomparisons were performed with the participation of 17 radiotherapy centres in each.
The results of the first intercomparison are listed in Table I. The deviations varied between + 3 .8% and —11.9% and 9 radiotherapy centres had less than ±5% deviation. Evaluation of minor technical details from the data sheets showed that the cause of the —11.9% deviation was a geometrical error and that the deviations of —8.9% and —6.3% were due to dosimetric errors. The results were also compared with those from the ionometric method and the values obtained were in good agreement with the deviations found by the TLD method. The deviation between the results of the TLD and ionometric methods was found to be within ± 1 %. According to the data sheets, all “ Co units were equipped with clinical dosimeters and controlled by hospital physicists [3, 4].

162 KIYAK et al.
TABLE IV . DEVIATIONS BETWEEN MEASUREDDOSE AN D STATED DOSE
InstitutionNo.
1989 1991 1992
110 -2.3
111 -1.3
112 -1.3 1.2
113 0.8
114 -3.8 0.1
115 2.2 -0.2 -11.7
116 -6.3 -1.7 -4.3
117 -1.8 -5.0 -3.7
118 3.8 -2.1 -6.2
119 -8.9 -4.9 -5.7
120 1.9 -7.6 -3.8
121 -11.9 -4.8 -0.5
122 1.3 -2.8 -2.1
123 2.9 9.5
124 -0.8 0.8
125 -2.9 1.5
126 -16.0 -10.5
127 -8.8 0.4
128 -0.8 -1.1
129 -2.9
130 7.8
The results of the second intercomparison are summarized in Table П. One of the participants was the IAEA Dosimetry Laboratory, with a code number of 91129. As seen from the table, only three institutions had more than a ±5% deviation in absorbed dose. The data sheets filled in by the participants showed that the radiotherapy centre with the —16.0% deviation (the largest value) was controlled by a radiotherapist, not by a hospital physicist. Evaluation of the data sheets demonstrated that the cause of the 16.0% deviation was dosimetric error, and that the other excess deviations of 7.6% and 8.8% were due to geometrical errors [5].

IAEA-SM-330/32 163
Table Ш gives the results of the third intercomparison. The table shows that ten of the participants applied absorbed doses with deviations within the limits of ± 5 % considered acceptable. One institution sent the capsules to the SSDL after giving an unknown dose to only one capsule of the set in undesirable conditions. The three institutions which had deviations of —11.7, - 1 0 .5 and + 7.8% did not return their data sheets to the SSDL. For this reason an evaluation of the source of error could not be made since the data sheets indicate the method of calculation of absorbed dose and other details. It is assumed that the cause of these excess deviations could be dosimetric error.
Table IV shows the percentage deviation of the applied dose from the stated dose, covering the results of all the intercomparison programmes performed. The intercomparisons have shown that some of the persons concerned at the radiotherapy centres were ignorant of certain matters in spite of being trained physicists. To improve the situation in radiotherapy, it is considered that all hospital physicists should participate in a training programme organized by the SSDL and that the dosimeters used in the hospitals should be recalibrated regularly.
It is concluded that the method for dose intercomparisons can be used to check periodically “ Co teletherapy units by mail in Turkey. The intercomparison programme has been successful from the point of view of improving the dosimetry situation in the hospitals. Therefore we intend to undertake X ray and electron beam intercomparison programmes, besides that for “ Co units, and we have already initiated the work for development.
REFERENCES
[1] INTERNATIONAL ATOMIC ENERGY AGENCY, Absorbed Dose Determination in Photon and Electron Beams: An International Code of Practice, Technical Reports Series No. 277, IAEA, Vienna (1987).
[2] INTERNATIONAL ATOMIC ENERGY AGENCY, Intercomparison Procedures in the Dosimetry of Photon Radiation, Technical Reports Series No. 182, IAEA, Vienna (1978).
[3] YA§AR, S., KIYAK, N., ALKAN, H., TÜRER, A ., Absorbed dose intercomparison studies for Co-60 therapy units by the SSDL, Istanbul, Turkey, SSDL Newsletter No. 30, IAEA, Vienna (1991) 55-57.
[4] YA§AR, S., KIYAK, N., ALKAN, H., TÜRER, A., Absorbed Dose Intercomparison for Teletherapy Units by Using Mailed TLD, Medical Physics Publications No. 1, Medical Physics Assoc., Istanbul (1990) 200-206.
[5] KIYAK, N., YA§AR, S., ALKAN, H., TÜRER, A., “ 1991 postal dose intercomparison studies for teletherapy units and results” , paper presented at 3rd Medical Physics Congr. Ankara, 1992.


IAEA-SM-330/69
DISSEMINATION, TRANSFER AND INTERCOMPARISON IN RADIOTHERAPY DOSIMETRY: THE IAEA CONCEPT
H. SVENSSON, K. ZSDÁNSZKY, P. NETTE Division of Human Health,International Atomic Energy Agency,Vienna
Abstract
DISSEMINATION, TRANSFER AND INTERCOMPARISON IN RADIOTHERAPY DOSIMETRY: THE IAEA CONCEPT.
In radiotherapy, absorbed dose to water has to be determined with the highest achievable accuracy, considering the delicate balance of radiation damage and radiation benefit for patients. There are many steps in the calibration chain, all of which contribute to the total uncertainty. In a small number of countries primary standards of exposure, air kerma and absorbed dose to water are available and the user can have instruments calibrated against these standards. The International Atomic Energy Agency (IAEA), in co-operation with the World Health Organization (WHO), established in the mid-1970s a Network of Secondary Standard Dosimetry Laboratories (SSDLs) in order to achieve coherence and accuracy of dosimetric measurements in all countries. These laboratories are intended to help to bridge the gap between primary measurement standards and users. The activities of the IAEA/WHO Network are reported. The IAEA is also involved in direct support to radiotherapy departments. A postal dosimetry service, operated in co-operation with WHO, has been in operation for about 25 years and has covered a total of about 1000 radiotherapy centres; results are discussed. Finally, through direct support (through the IAEA’s Technical Co-operation Programme), SSDLs and hospitals have been supplied with equipment, experts and training. Procedures in dosimetry have been developed through co-ordinated research programmes. All these activities have certainly improved the coherence and accuracy of dosimetry worldwide.
1. INTRODUCTION
Since its establishment the International Atomic Energy Agency (IAEA) has had a programme in dosimetry. During the first years, at the end of the 1950s, efforts were concentrated on urgent matters, for instance supplying radiotherapy centres with isodose distribution data [1 -4 ]. Both the IAEA and the World Health Organization (WHO) were aware of the large uncertainties in dosimetry in most radiotherapy centres. A postal dosimetry service was therefore established in 1966, and this is still running.
165

166 SVENSSON et al.
o>ccLUœcc
tu ЯсоОо CD
0 5
y a g iA in N
FIG.
1.
Stati
stica
l dat
a on
activ
ities
of the
IAE
A/W
HO
Netw
ork o
f SS
DLs
from
1985
to
1991
.

IAEA-SM-330/69 167
A more organized activity was needed, however, to further improve the quality in this field. In 1968 the IAE A therefore convened a panel o f experts, who met in Caracas, to discuss the dosimetric requirements o f radiotherapy centres and possibilities for improvement. The experts were not cheered by the information they collected. In the whole o f Latin America there were only five qualified hospital physicists and not a single laboratory that could perform instrument calibration [5]. It was recommended that dosimeter calibration laboratories be set up.
In 1976, the IAE A and W HO were able to notify their Member States o f the formation o f the Network o f Secondary Standard Dosimetry Laboratories (SSDLs).
Today this network includes 72 laboratories in 53 countries. Most o f these laboratories have a broad programme. Calibration o f therapy dosimeters is, however, gener
ally a very important task.The situation has changed during recent years owing to improved possibilities
to eradicate tumours using radiation. New therapy machines make it possible to
better conform the high dose irradiated volume with the tumour or target volume. Further, diagnostic tools are available which in many cases make it possible to out
line the tumour volume more accurately.This ‘new’ therapy, however, requires a much higher accuracy in radio
therapy. The IA E A has tried to adjust its dosimetry programme in accordance with these new conditions. Thus, the IA E A Code o f Practice [6 ] includes recommendations for dosimetry for high energy photon and electron beams. The T L dosimeter
service, which before just covered the ^C o y beam quality, has now been extended to high energy photon and electron beams. Finally, the first step o f a pilot study on a Quality Assurance Network including 45 centres has been completed. It is foreseen that this network should complement the SSDL network in programmes closely related to tests and improvements o f patient dosimetry, the SSDLs being more engaged in direct calibrations o f instruments.
2. SSDL NETW ORK
In a working agreement o f 1976 between the IAE A and WHO it was agreed to set up an “ IAEA/WHO Network o f SSDLs” in order to improve accuracy in applied radiation dosimetry throughout the world. Special criteria for the establishment o f an SSDL were agreed upon. There are two joint scientific secretaries for
the network, one from the IA E A and one from WHO. Since 1986 a special Scientific Committee has regularly been reviewing the programme o f the SSDL network. The
committee includes representatives from the International Bureau o f Weights and Measures (BIPM ), the International Commission on Radiation Units and Measurements (ICRU), Primary Standard Dosimetry Laboratories (PSDLs) and SSDLs.
The SSDLs are annually asked for a report on their major activities. Some o f the statistical data are given in Fig. 1. There were 71 SSDLs in 1991, 48 o f which

168 SVENSSON et al.
TABLE I. RESULTS FROM (a) TLD POSTAL DOSE INTERCOMP ARISON CARRIED OUT W ITH SSDLs ( “ Co O N LY ) AND (b) TLD REFERENCE IRRADIATIONS BY PSDLs (FROM 1983 ONW ARDS)
(a)
Number_ r mean
SSDLs
Дти neg. (%)
А ш pos. (%)
а(%)
Number of SSDLs with |A| > 3.5%
1981-1982 22 -1.4 -4.7 1.6 1.7 3
1983-1984 17 -0.2 -3.2 3.2 1.7 0
1985-1986 23 -1.7 -8.0 5.5 2.6 4
1987-1988 35 -0.7 -5.4 4.1 2.1 3
1989-1990 42 -1.6 -10.0 3.2 2.4 7
1991 49 -1.3 -8.6 1.7 1.7 3
1992 42 -1.8 -34.7 3.6 5.6 5
1981-1992 230 -1.2 -34.7 5.5 2.5 25
A = [(£*SSDL — A a e a V A a e a ] x 100 (%)
(b)Number of reference
irradiations
Ащеап(%)
А т а х n e g .
(%)Атах P O S . а
(%) (%)
45 0.04 -1.4 2.7 0.8
A = K A a e a — ^ P S D l V ^ P S D l ] X 100 (%)
Note: Diaea: absorbed dose to water evaluated in IAEA Dosimetry Laboratory; Dssdl: absorbed dose to water reported by SSDL; Z)PSDL: absorbed dose to water reference value given by PSDL.
supplied an annual report for that year. In addition, there are 14 PSDLs affiliated to the network. Together, these laboratories cover most o f the world. As shown by Fig. 1, the major activities are calibration o f dosimeters for therapy and protection, and evaluation o f personnel dosimeters. During recent years the SSDLs have also been encouraged to help radiotherapy centres directly in calibration o f irradiation
units.The IA E A has, through its technical assistance (in the form o f equipment,
training and experts), supported the establishment o f SSDLs in about forty countries.

IAEA-SM-330/69 169
The establishment period is over in most countries and it is now o f great importance
to utilize the SSDLs and to ensure that the work is o f good quality. The IAE A is therefore at present involved in training and quality assurance programmes for these SSDLs. Two training courses for SSDL staff in each region o f the world have been completed. The training is at present mainly directed at users o f thé SSDL service, medical physicists and radiotherapists. In 1993, courses o f three weeks’ duration are being given in Algeria, Australia, Thailand and Turkey.
A quality assurance programme has been set up for the SSDLs. Since 1981,
T L dosimeters have been sent out for irradiation in “ Co 7 beams. The service is now operated on an annual basis, and the results are given in Table 1(a). As the table
TABLE П. RESULTS OF CARE PROGRAM ME MEASUREMENTS A T SSDLs, 1991-1992
SSDL
Deviation from IAEA calibration, Д (%)
Air kerma Absorbed dose to water
Set 1 Set 2 Set 1 Set 2
A -0.15 -0.17
В -0.03 -0.40
С -0.06 - 1 . 0 0
D +0.75 -0.14
E -0.38 -1.16
F -0.13 +0.04
G -0.35 -0.62
H +0.11 +0.04 +0.78
I +0.71 -0.02
J +0.38 +0.29 +0.03 +0.61
K -0.72 -0.53 -0.06 +2.00
L -0.40 -0.20 +0.05 + 1.40
M -0.31 -0.52 +0.09 -0.03
A = [ ( D s s d l — ^ ia e a V ^ ia e a ! X 100 (%)
Note: Dssdl: absorbed dose to water reported by SSDL; Z)IAEA: absorbed dose to water evaluated in IAEA Dosimetry Laboratory.

170 SVENSSON et al.
shows, most o f the SSDLs have deviations within 3.5%, which was considered to be the accuracy o f the method (on a 2a level), but there are some SSDLs that have fairly large deviations and improvement is needed.
The postal T L dosimeter method as carried out by the IAE A had for a long
period a precision o f about 1% (Iff) (Table 1(b)). Recently, the method has been improved and the precision is now (since 1991) about 0.5%. This is the standard deviation o f the reference irradiations provided by PSDLs for the last 20 intercomparisons. In spite o f these improvements T L dosimetry is not accurate enough for the needs o f some laboratories. The Scientific Committee o f the SSDL network
therefore suggested that these measurements be complemented by means o f two sets o f ionization chamber instruments sent to the SSDLs. The programme known as CARE (Coherent and Accurate Reference) was introduced for this purpose. The
results are given in Table П. The method is much more accurate but has the drawbacks o f long turn-round time, high insurance and transport costs, and customs problems. This method is therefore under discussion.
3. CALIBRATIO N SERVICE FOR SSDLs
In the international measurement system secondary standard instruments are calibrated against a primary standard. The IAE A makes an exception to this rule and calibrates secondary standards o f SSDLs against the IAE A secondary standard. This requires, however, that the IAE A can ensure high accuracy in its procedure.
The secondary standard ionization chambers o f the IA E A Dosimetry Labora
tory are regularly calibrated at PSDLs in order to check their stability. The present reference standard is based on an air kerma calibration from the BIPM from 1986. This is therefore the reference in Table Ш, which presents data on the stability check o f the reference. The table shows that the calibration at the BIPM in June 1991 agrees with this previous calibration. (A recently reported small correction by the BIPM, which would decrease the kerma ratio by 0.14%, has not been included.)
Before 1991, the absorbed dose to water reference standard was based on the BIPM air kerma calibration factor application o f the IAE A Code o f Practice. In 1991 a direct calibration o f a secondary standard chamber in absorbed dose to water was performed at the BIPM. This also did not change our reference standard significantly: DW(IAEA)/Z)W(BIPM ) was 1.001 (Table Ш ). Repeated calibrations at other PSDLs gave similar good agreement, and an adequate accuracy in the IAEA refer
ence standard is therefore proven (Table Ш).Calibrations o f ionization chambers by the IAE A Dosimetry Laboratory for
different SSDLs were made in over ninety beams during 1991-1992, about half o f
them in “ Со y beams for therapy. About 30% o f all calibrations are for protection and environmental purposes.
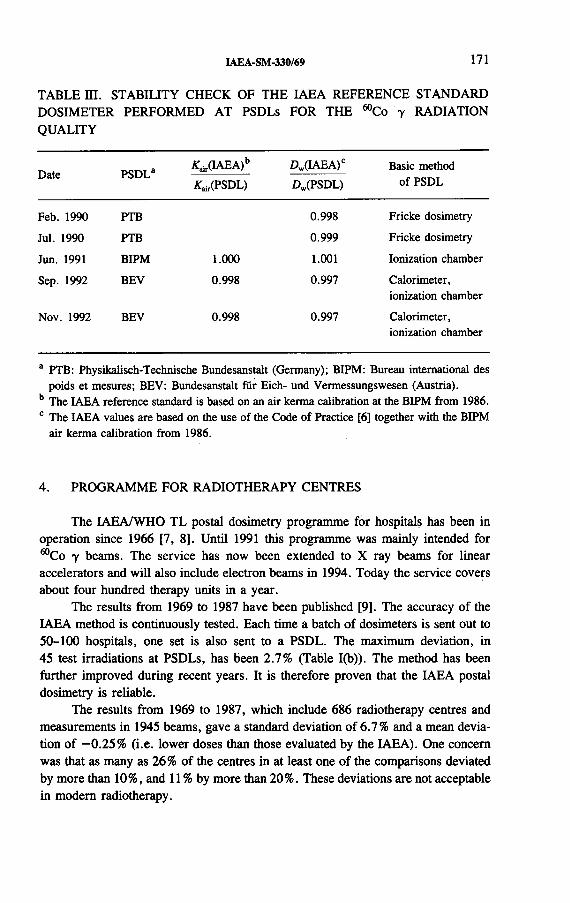
IAEA-SM-330/69 171
TABLE Ш. STABILITY CHECK OF THE IA E A REFERENCE STANDARD DOSIMETER PERFORMED A T PSDLs FOR THE “ Со y RAD IATIO N
Q U A L ITY
Date PSDLatfair(IAEA)b
^air(PSDL)
A»(IAEA)c
Dw(PSDL)
Basic method of PSDL
Feb. 1990 PTB 0.998 Fricke dosimetry
Jul. 1990 PTB 0.999 Fricke dosimetry
Jun. 1991 BIPM 1.000 1.001 Ionization chamber
Sep. 1992 BEV 0.998 0.997 Calorimeter, ionization chamber
Nov. 1992 BEV 0.998 0.997 Calorimeter, ionization chamber
a PTB: Physikalisch-Technische Bundesanstalt (Germany); BIPM: Bureau international des poids et mesures; BEV: Bundesanstalt für Eich- und Vermessungswesen (Austria).
b The IAEA reference standard is based on an air kerma calibration at the BIPM from 1986. c The IAEA values are based on the use of the Code of Practice [6] together with the BIPM
air kerma calibration from 1986.
4. PROGRAM M E FOR RADIOTHERAPY CENTRES
The IAEA/WHO T L postal dosimetry programme for hospitals has been in operation since 1966 [7, 8]. Until 1991 this programme was mainly intended for ^C o y beams. The service has now been extended to X ray beams for linear accelerators and will also include electron beams in 1994. Today the service covers about four hundred therapy units in a year.
The results from 1969 to 1987 have been published [9]. The accuracy o f the IAE A method is continuously tested. Each time a batch o f dosimeters is sent out to 50-100 hospitals, one set is also sent to a PSDL. The maximum deviation, in 45 test irradiations at PSDLs, has been 2.7% (Table 1(b)). The method has been further improved during recent years. It is therefore proven that the IAE A postal dosimetry is reliable.
The results from 1969 to 1987, which include 686 radiotherapy centres and measurements in 1945 beams, gave a standard deviation o f 6.7% and a mean deviation o f -0.25% (i.e. lower doses than those evaluated by the IAEA ). One concern was that as many as 26% o f the centres in at least one o f the comparisons deviated by more than 10%, and 11 % by more than 20%. These deviations are not acceptable in modem radiotherapy.

172 SVENSSON et al.
>.осф3ГУф
- 1 6 - 1 4 - 1 2 - 1 0 - 8 - 4 - 2 0 2 4
Deviation (%)
8 1 0 1 2 1 4 1 6
FIG. 2. TL dosimeter intercomparisons in Europe and the United States o f America in 1992, in which 45 centres participated. The irradiations were made using mCo у and high energy X ray beams. (This is step 1 described in Fig. 4.)
□ PTB
Dw(Wk)/Dw(/Vw) (% )
■ NRC 88 BIPM E60,
BEV
FIG. 3. Test o f the Code o f Practice in Со у beams at different PSDLs. PTB: Physikalisch-Technische Bundesanstalt (Germany); NRC: National Research Council Canada; BIPM: Bureau international des poids et mesures; BEV: Bundesamt für Eich- und Vermes- sungswesen (Austria). (The data are extracted from Ref. [11].)

IAEA-SM-330/69 173
TABLE IV . NEW RECOMMENDED VALUES OF PERTURBATION COR
RECTION FACTOR pu INTRODUCED IN THE IAE A CODE OF PRACTICE FOR M EDIUM ENERGY X RAYS TO CORRECT FOR REPLACEM ENT OF W ATE R BY A IR AND THE CHAMBER W A L L M ATE R IAL [6]
Tubepotential(kV)
HVL(mm Cu)
Perturbation correction factor pu
Value from IAEA Code (table XV), to be replaced
New recommended value
100 0.17 1.10 1.03
120 0.30 1.09 1.03
140 0.49 1.08 1.03
150 0.83 1.06 1.02
200 1.70 1.04 1.02
250 2.47 1.02 1.01
280 3.37 1.01 1.01
Recent investigations by the IA E A indicate a great improvement in most developed countries and some developing countries, with a standard deviation o f around 2% (Fig. 2), but the improvement is slow in other developing countries.
Radiotherapy centres today often have many types o f radiation units, but the
ionization chambers are generally only calibrated at a few beam qualities. The IAEA Code o f Practice [6] describes the procedures to determine absorbed dose to water in conventional X rays, “ Со y beams, and photon and electron beams from accelerators, using a chamber calibrated in air kerma. This Code has been recommended for use in hospitals and SSDLs. An important subject for research is to check the accuracy o f dosimetry when using the Code. A co-ordinated research programme (CRP) has been organized by the IAE A for this purpose [10].
Extensive tests o f the Code were carried out at the “ Со y quality [11]. Four PSDLs determined the air kerma calibration factors for different chambers to derive the absorbed dose to water, DW(NK). This value was then compared with absolute determinations o f absorbed dose to water, D W(NW). The ratio £>w(Afc)/Dw(ATw) was obtained in this way for 17 different types o f chambers and 45 individual chambers. The results are shown in Fig. 3. The mean value was very close to one and the standard deviation 0.75%. Generally, it is therefore proven that the accuracy is good,
but there are deviations o f up to about 2% for two types o f chambers. This might be due to uncertainties in some o f the ‘chamber specific correction factors’ (i.e. fcmfcatt) in the Code. These are all based on calculations. One way to warrant high accuracy using the Code would certainly be to measure with two different types o f

174 SVENSSON et al.
ionization chambers or with chambers that experimentally have been proven to agree with the computation in the Code. The difference in values from different PSDLs, even i f small, needs to be investigated further. This difference does not seem to be chamber type specific as, for instance, the chamber type NE 2561 was used by all the PSDLs.
It was further concluded in the CRP [10] that the method in the IAE A Code for different megavoltage X ray qualities and for electron energies agrees to within
1 % with non-ionometric methods. Again, there might be larger deviations for some types o f chambers.
FIG. 4. The different steps in the Quality Assurance Network. The results from measurements in a simple water phantom, step 1, are shown in Fig. 2. Step 2, the test o f the multipurpose phantom, is now under evaluation. Deviations larger than those indicated should result in repeated comparisons and other actions by the co-ordinating centre.

IAEA-SM-330/69 175
Special problems have been reported with use o f the Code for X rays between about 100 and 150 kV. New perturbation correction factors are now recommended to supersede those given in the Code, the correction being up to 7% (Table IV ).
5. FUTURE WORK
The IA E A Code o f Practice describes principles for dose determination in a reference geometry, i.e. an SSD o f 100 cm and a field size o f 10 cm x 10 cm. A CRP is now dealing with practical procedures for calibration o f accelerator dose
monitors (or timers for ^Co units) at any beam geometry for radiotherapy.Modem radiotherapy requires that the target dose in each individual patient
irradiation is known with high accuracy. Furthermore, it is o f great importance that different centres can compare their results to find the best treatment procedure. Indeed, most research oriented radiotherapy centres participate today in clinical trials. This necessitates that the dose at points o f interest in the patient can be determined in a uniform and accurate way by different centres. Comparisons using human shaped phantoms are needed. A pilot study has been undertaken to test a special programme. The intention is that this should include three different steps (Fig. 4). Step 1 was tested in 45 centres (Fig. 2) and step 2 is under evaluation.
The idea is, in Europe, to organize this work through national centres. These
could be SSDLs but also radiotherapy centres. The IAE A is prepared to give reference irradiations to this type o f network to assure coherence. This work will now proceed and include other regions.
6. CONCLUSIONS
The IA E A has a broad programme in radiotherapy dosimetry which includes:
— Supporting the establishment o f SSDLs to be included in the IAEA/WHO network;
— Direct calibration o f instruments for SSDLs;— A Quality Assurance Network for SSDLs to assure traceability o f calibrations
to the BIPM;
— A postal dosimetry service to hospitals, in co-operation with WHO;— Direct support to some radiotherapy centres;
— Training and co-ordinated research programmes;— Development o f dosimetry methods for use in SSDLs and hospitals.
This programme has certainly improved the coherence and accuracy in many countries but the requirements in modem radiotherapy have at the same time become stricter. Furthermore, much improvement is needed in some developing countries.

176 SVENSSON et al.
ACK N O W LE D G E M E N T
The kind help o f G.P. Hanson, Chief Medical Officer, Radiation Medicine, World Health Organization, in supplying historical information on the establishment o f the IAEA/WHO Network o f SSDLs is appreciated.
REFERENCES
[1] INTERNATIONAL ATOMIC ENERGY AGENCY, Atlas of Radiation Dose Distributions: Single-Field Isodose Charts, Vol. 1, IAEA, Vienna (1965).
[2] INTERNATIONAL ATOMIC ENERGY AGENCY, Atlas of Radiation Dose Distributions: Multiple-Field Isodose Charts, Vol. 2, IAEA, Vienna (1966).
[3] INTERNATIONAL ATOMIC ENERGY AGENCY, Atlas of Radiation Dose Distributions: Moving-Field Isodose Charts, Vol. 3, IAEA, Vienna (1967).
[4] INTERNATIONAL ATOMIC ENERGY AGENCY, Atlas of Radiation Dose Distributions: Brachytherapy Isodose Charts, Sealed Radium Sources, Vol. 4, IAEA, Vienna (1972).
[5] INTERNATIONAL ATOMIC ENERGY AGENCY, Secondary Standard Dosimetry Laboratories: Development and Trends, IAEA, Vienna (1985).
[6] INTERNATIONAL ATOMIC ENERGY AGENCY, Absorbed Dose Determination in Photon and Electron Beams: An International Code of Practice, Technical Reports Series No. 277, IAEA, Vienna (1987).
[7] EISENLOHR, H.H., JAYARAMAN, S., IAEA-WHO cobalt-60 teletherapy dosimetry service using mailed LiF dosemeters. A survey of results obtained during 1970-75, Phys. Med. Biol. 22 (1977) 18-28.
[8] GUSTAFSSON, М., GIRZIKOWSKY, R., BERA, P., “ The IAEA/WHO postal dose intercomparison for radiation therapy” , Dosimetry in Radiotherapy (Proc. Symp. Vienna, 1988), Vol. 2, IAEA, Vienna (1988) 172-174.
[9] SVENSSON, H., HANSON, G.P., ZSDÁNSZKY, K., The IAEA/WHO TL dosimetry service for radiotherapy centres 1969-1987, SSDL Newsletter No. 28, IAEA, Vienna (1989) 3-21.
[10] INTERNATIONAL ATOMIC ENERGY AGENCY, Review of Data and Methods Recommended in the International Code of Practice, IAEA Technical Reports Series No. 277 on Absorbed Dose Determination in Photon and Electron Beams, IAEA- TECDOC, Vienna (in press).
[11] HOHLFELD, K ., ‘ ‘Testing of the IAEA Code: Absorbed dose determination at Co-60 gamma radiation” , ibid.

IAEA-SM-330/70
IAEA/WHO TLD RADIOTHERAPY DOSIMETRY INTERCOMPARISON FOR AUSTRALIA
R.B. H U NTLEYAustralian Radiation Laboratory,Melbourne, Australia
P. BERA, P. NETTE
Department o f Research and Isotopes,International Atomic Energy Agency,
Vienna
Abstract
IAEA/WHO TLD RADIOTHERAPY DOSIMETRY INTERCOMPARISON FOR AUSTRALIA.
Since 1966, the IAEA/WHO postal dose intercomparison service, using TLDs (encapsulated powdered LiF), has been operated to provide dosimetric checks worldwide on beam calibration of “ Co radiotherapy units. The Australian Radiation Laboratory (ARL), Melbourne, has participated repeatedly in intercomparison runs provided for the WHO Western Pacific Region and analysed the results. The expansion of the IAEA/WHO service to cover photon beams from medical accelerators and a worldwide awareness of the necessity of dosimetric quality assurance through measurements in radiotherapy prompted the ARL to ask the IAEA Dosimetry Laboratory for a special batch of TLDs for an Australian intercom- parison covering all radiotherapy centres. In addition, the ARL conducted a survey of all Australian radiotherapy centres with regard to beam qualities in common use. The results of the Australian TLD intercomparison run are reported and compared with the results of a parallel run for Europe and the United States of America. The results demonstrate coherence of dosimetry in each of the two groups of hospitals significantly better than the TLD measurements can reveal. The mean deviation of the dose intercomparison measurements with Australia, however, is significant whereas the result for Europe and the USA is within the uncertainty of the IAEA TLD measurement. This discrepancy cannot be explained with the available data.
1. INTRODUCTION
The International Atomic Energy Agency (IAE A ) started a worldwide postal TLD intercomparison service in 1966 for “ Co radiotherapy units [1]. The World Health Organization (W HO) has organized participation in the programme through
its regional offices since 1968.A set o f four capsules containing powdered LiF is sent to each participating
institution by mail. Using a jig supplied by the IAEA , three o f the capsules are exposed (between stipulated dates) to an absorbed dose to water o f 2 Gy in a water
177

178 HUNTLEY et al.
phantom and returned to the IA E A for evaluation. The fourth capsule, irradiated at the IAE A Dosimetry Laboratory, serves as a control against unexpected fading and accidental exposure. For each intercomparison run, Primary Standard Dosimetry Laboratories (PSDLs) provide known reference doses to TLD capsules, which are used by the IAE A to confirm their dose evaluation procedures.
1.1. TraceabUity
The calibration o f the TLD capsules at the IAE A has previously been based on measurements in a water phantom in a “ Co radiation beam, using a secondary standard ionization chamber with an exposure calibration factor from a PSDL. The
conversion from exposure to absorbed dose has been carried out using an appropriate code o f practice. Since 1986, the calibration o f the chambers has been traceable directly to the Bureau international des poids et mesures (BIPM ), and the code o f practice applied has been the IA E A dosimetry Code [2]. In 1991, the IA E A ’s secon
dary standard ionization chamber was calibrated in terms o f absorbed dose to water at the BIPM. Experiments at the IAE A Dosimetry Laboratory with this chamber have established agreement to within 0.2% between absorbed dose to water values found using an exposure calibration with the IA E A Code and values found from the
Energy: Quality index, D20/D«
FIG. 1. TLD intercomparison in Europe and the USA, 1992: energy calibration curve o f LiF TLD powder.

IAEA-SM-330/70 179
35
28
о 21С <D D О"<Di t 14
7
О ----------------------------1 6 -1 4 -1 2 -1 0 -8 -6 -4 -2 0 2 4 6 8 10 12 14 16
Deviation = 100(Q - £ )/£ (% )
FIG. 2. TLD intercomparison in Europe and the USA, 1992: frequency diagram.
absorbed dose to water calibration. This agreement has been confirmed in several intercomparisons with the German PSDL (Physikalisch-Technische Bundesanstalt) and the Austrian PSDL (Bundesamt fiir Eich- und Vermessungswesen).
1.2. TLD energy dependence
Owing to an increase in the use o f medical accelerators in developing countries, in 1991 the IAE A expanded its TLD service to include high energy X ray beams. Investigations are currently under way for the future inclusion o f electron beams. For photon beams, the necessary correction factors to account for the energy dependence o f the TLDs have been established through two experimental intercomparison runs. Eleven renowned European radiotherapy centres and one long established TLD service in the United States o f America provided reference irradiations to the TLD capsules in terms o f absorbed dose to water, using exposure calibrated ionization chambers and the IA E A Code. The irradiated TLD capsules were evaluated by the IA E A by means o f its usual “ Co calibration procedure. The solid line shown in Fig. 1 is a linear regression o f all these data, and represents the energy
calibration curve o f the TLD powder normalized to the “ Co radiation quality. The points in Fig. 1 include, in addition, the results o f two later intercomparison runs. In these two runs, the previous 12 reference centres participated again, as well as
Number of radiation beams = 116 (36 from Co-60,80 from accelerators)Mean deviation = +0.1°/o(-0.1%)* Standard deviation = ±2.2% (±1.6%)* Max. pos. deviation = +15.1% (+6.1 %)* Max. neg. deviation = -5.9%
Q - Quoted dose E = Evaluated dose * Values excluding one
hospital with deviation =15.1%

180 HUNTLEY et al.
a further 34 radiotherapy centres. Using energy correction factors in accordance with Fig. 1 resulted in the frequency distribution given in Fig. 2, which shows the per
centage deviation between the participant’ s quoted dose (Q) and the IAE A evaluated dose (£).
2. A U STR ALIAN RAD IATIO N LABO RATO RY PARTICIPATION
The Australian Radiation Laboratory (A R L ), Melbourne, has participated in the programme since 1971 for the ^C o radiation quality. The results are shown in Table I. Since 1988, the results have been reported as the percentage deviation o f
TABLE I. A R L PARTIC IPATIO N IN THE IAEA/WHO TLD PROGRAMME
Date Batch-Set100(E - Q)IQ
(%)100(6 - E)IE
(%)100(E - R)/R
(%)PSDLa
27 Jul. 1971 5-317 -0.5
5-324 -1.7
28 May 1975 15-717 -6.9
20 Apr. 1976 17-800 -2.0
14 Oct. 1982 31-1697 -1.4
3 Jun. 1985 40-2275 -0.2 -0.7 RIVM
4 Feb. 1986 43-2458 +2.5 0.0 RIVM
19 Mar. 1987 47-2686 -1.0 -1.0 RIVM
30 Nov. 1988 50-2893 +7.0 -6.5 -2.1 BIPM
50-2894 +6.8 -6.3
10 Jul. 1991 55-3234 +0.3 -0.3 -1.2 BIPM
-1.8 BEV
18 May 1992 57-3374 +0.8 -0.8 -2.1 BIPM
-1.1 BEV
12 Aug. 1992 AUS92-026 +0.9 -0.9 -0.5 BEV
AUS92-027 +0.4 -0.4
Note: Q, quoted dose (by the participant); E, evaluated dose (by the IAEA); R, reference dose (by the PSDLa).
a PSDLs giving reference irradiation: RIVM: Rijksinstituut voor de Volksgezondheid (Netherlands); BIPM: Bureau international des poids et mesures; BEV: Bundesamt fiir Eich- und Vermessungswesen (Austria).

IAEA-SM-330/70 181
the quoted dose from the IA E A evaluated dose, 100(Q - E)IE. Previously, the results were given as the percentage deviation o f the evaluated dose from the quoted dose, 100(5 - Q)/Q. This represents a change from taking the participant as reference to taking the IAEA as reference. The fifth column o f Table I shows the percent
age deviation o f the IA E A evaluation o f reference capsules (irradiated by a PSDL) from the known reference dose delivered by the PSDL.
The variability o f the TLD evaluation is indicated in the results on three occasions (1971, 1988, August 1992) when the A R L was asked to expose two sets o f capsules. Results differed by 1.2, 0.2 and 0.5% respectively for the two sets o f capsules. It is assumed that the doses delivered at the AR L were the same for all six capsules on each occasion. A similar variability is seen between the three capsules comprising
each individual set in the detailed results provided by the IA E A to participants.In 1975 and 1988, there was a systematic deviation o f about 5% in the results
for the W HO Western Pacific Region. In both cases, the A R L result was within 2% o f the mean value for the region. The complete data for the four most recent Western Pacific intercomparisons involving the AR L, in 1987, 1988, 1991 and August 1992, are shown in Figs 3(a)-(d). Earlier data were unavailable at the time o f writing. It
can be seen that the A R L value was very close to the distribution mean on all these occasions. The figures are normalized to enclose the same area to facilitate comparison o f the relative deviations.
3. AU STR ALIAN INTERCOMPARISON, AUGUST 1992 [3]
3 .1 . Radiotherapy beam quality survey
Discussions with the IA E A Dosimetry Laboratory in 1991 led to a special batch o f TLD capsules being made available for an Australian intercomparison (batch AUS92) for photon beams from ^C o units and medical accelerators. As a preliminary step in organizing this intercomparison, a survey o f the Australian radiotherapy centres was conducted to see which beam qualities were in common use. Every effort was made to ensure that every radiotherapy centre in Australia was included. The survey was later updated with more accurate and complete patient attendance data. The results o f the updated survey are shown in Figs 4(a)-(d). The results in terms o f attendances per month are on a logarithmic scale, and beam energies with less than one attendance per month are shown with a small negative column. Attendance data for electron beams are based on figures supplied by only seven centres, and should therefore be interpreted with caution.

Frequ
ency
Frequency
182 HUNTLEY et al.
20
16
12
24
BATCH 47 О = Quoted dose E = Evaluated dose
Number of radiation beams = 35 Mean deviation = +1.5% Standard deviation = ±9.3% Max. pos. deviation = +34% Max. neg. deviation = -18.4%
-18 -15 -12 -9 -6 -3 0 3 6 9 12 15 18
Deviation = 100(0 - E)IE (%)
24
20
16
12
BATCH 50 О = Quoted dose E = Evaluated dose
A R L
Number of radiation beams = 33 Mean deviation = -5 .1 % Standard deviation = ±4.5% Max. pos. deviation = +3.6% Max. neg. deviation= -16.1%
(b)
-18 -15 -12 -9 -6 -3 0 3 6 9 12 15 18
Deviation = 100(0 - E)IE (%)

IAEA-SM-330/70 183
24
20
16>. о с ф £ 12 ф 1—LL
BATCH 55 Q = Quoted dose E = Evaluated dose
Number of radiation beams = 45 Mean deviation = +0.3% Standard deviation = ±3.5% Max. pos. deviation = +14.3% Max. neg. deviation = -7 .7%
(c)-18-15-12-9 -6 -3 0
Deviation = 100(0
9 12 15 18
£)/£ (%)
24
20
16 J
BATCH 57 - 0 = Quoted dose
E = Evaluated dose
A R L Number of radiation beams = 41 Mean deviation = +0.8% Standard deviation = ±6.3% Max. pos. deviation = +22.2% Max. neg. deviation = -10 .5%
2 . 12
(d)
-18 -15 -12 -9 -6 -3 0 3 6 9 12 15 18
Deviation = 100(0 - E)IE (%)
FIG. 3. IAEA/WHO TLD intercomparisons in the Western Pacific Region: (a) batch 47 (March 1987), (b) batch 50 (November 1988), (c) batch 55 (July 1991), (d) batch 57 (May 1992).

lg(m
on
thly
a
tte
nd
an
ce
s)
lg(m
on
thly
a
tte
nd
an
ce
s)
184 HUNTLEY et al.
1
0
-1
(a)
Data based on responses from 21 centres
SF box is 0.01 to 0.15 MV OV box is 0.13 to 0.35 MV
negative column height means < 1 att/month
I П
1 1 1
SF OV Cs Co 4 6 10 18P h o t o n e n e r g y ( M V )
23 25
Data based on responses from 7 centres
negative column height means < 1 att/month
4 5 6 7 8 9 10 12 14 15 16 17 18 20 21 22 25 (b ) E l e c t r o n e n e r g y ( M e V )

Num
ber
of
inst
itute
s N
umbe
r of
in
stit
ute
sIAEA-SM-330/70 185
2 6
22
1 8
1 4
10
6
2
° S F O V C s C o 4 6 1 0 1 8 2 3 2 5(c ) P h o t o n e n e r g y ( M V )
Data based on responses from 27 centres
SF box is 0.01 to 0.15 MV OV box is 0.13 to 0.35 MV
I
II I
2 4
20
1 6
12
— I
! I ■ i ! n ! ВI I I I I I I I I П
4 5 6 7 8 9 1 0 1 2 1 4 1 5 1 6 1 7 1 8 2 0 2 1 2 2 2 5 (d ) E le c t r o n e n e r g y ( M e V )
FIG. 4. Results o f survey o f Australian radiotherapy centres: (a) photon and (b) electron therapy beams by monthly patient attendance; (c) photon and (d) electron therapy beams by number o f institutes.
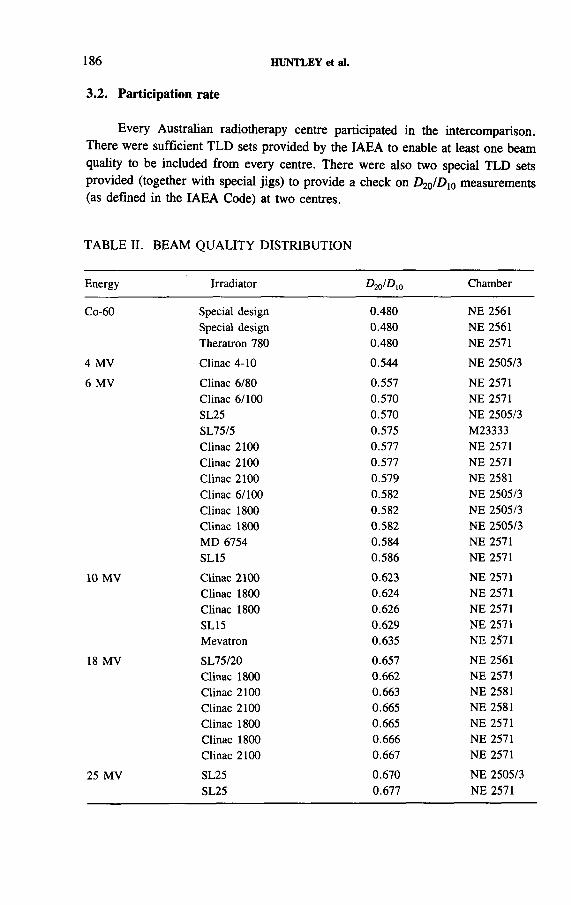
186 HUNTLEY et al.
Every Australian radiotherapy centre participated in the intercomparison. There were sufficient TLD sets provided by the IAE A to enable at least one beam
quality to be included from every centre. There were also two special TLD sets provided (together with special jigs) to provide a check on D20/Dl0 measurements (as defined in the IAE A Code) at two centres.
3.2. Participation rate
TABLE II. BEAM Q U A LITY DISTRIBUTION
Energy Irradiator ^20^10 Chamber
Co-60 Special design 0.480 NE 2561Special design 0.480 NE 2561Theratron 780 0.480 NE 2571
4 MV Clinac 4-10 0.544 NE 2505/3
6 MV Clinac 6/80 0.557 NE 2571Clinac 6/100 0.570 NE 2571SL25 0.570 NE 2505/3SL75/5 0.575 M23333Clinac 2100 0.577 NE 2571Clinac 2100 0.577 NE 2571Clinac 2100 0.579 NE 2581Clinac 6/100 0.582 NE 2505/3Clinac 1800 0.582 NE 2505/3Clinac 1800 0.582 NE 2505/3MD 6754 0.584 NE 2571SL15 0.586 NE 2571
10 MV Clinac 2100 0.623 NE 2571Clinac 1800 0.624 NE 2571Clinac 1800 0.626 NE 2571SL15 0.629 NE 2571Mevatron 0.635 NE 2571
18 MV SL75/20 0.657 NE 2561Clinac 1800 0.662 NE 2571Clinac 2100 0.663 NE 2581Clinac 2100 0.665 NE 2581Clinac 1800 0.665 NE 2571Clinac 1800 0.666 NE 2571Clinac 2100 0.667 NE 2571
25 MV SL25 0.670 NE 2505/3SL25 0.677 NE 2571

IAEA-SM-330/70 187
The beams used in the intercomparison, the accelerator types, the stated D20/Dw values and the measurement chamber types are shown in Table П.
3 .3 . Results
Figure 5 shows the frequency diagram o f the relative deviation between the
participant’s quoted dose and the IA E A evaluated dose. The two sets o f TLD capsules exposed to “ Co by the A R L gave the mean result indicated. A ll centres except one are within 5% o f the IA E A evaluated dose, and all centres except two are within 3% o f the distribution mean (-1 .2 % ).
The centre with all three capsules showing a deviation o f about 15% has explained that a slight ambiguity in the instruction sheet led to a misunderstanding o f the required irradiation set-up. When corrected, the deviation o f that centre
changed to —0.2%.One o f the centres at -4 % discovered a calculation error on re-examination
o f its worksheets. This error was not systematic, and was only made on this occa
sion. When corrected, the result changed to -2 .9% .Another centre had one o f the three capsules assessed at only 48.7% o f the
required dose; this capsule was excluded by the IAE A from the results. The centre concerned has indicated that the number o f monitor units required was set incorrectly for one capsule (the linac used requires the number o f monitor units to be reset for
each exposure).
>.осфDO’Ф
1 4
12
10
8
£ 6
1
Number of radiation beams = 30(3 from Co-60, 27 from accelerators)Mean deviation ■= -0 .7 % (-1.2%)* Standard deviation = ±3.3% (±1.4%)* Max. pos. deviation = +15.4% (+ 1.5%)* Max. neg. deviation= -4.7%
A R L11—
O = Quoted dose E = Evaluated dose * Values excluding one
hospital with deviation =15.4%
T
[1Ï1
. 1 П n , i . 1- 1 6 - 1 4 - 1 2 - 1 0 - 8 - 6 - 4 - 2 0 2 4 6 8 1 0 1 2 1 4 1 6
D e v i a t i o n = 1 0 0 ( Q - £ ) / £ (° /o )
FIG. 5. TLD intercomparison in Australia, 1992: frequency diagram.

188 HUNTLEY et al.
3.4. Protocols
The six beams at six centres (under three administrations) not using the IAEA Code or an adaptation o f it gave deviations o f +0.7, -0 .3 , -1 .3 , -2 .9 , -0 .8 and
-0 .9 % . These are not significantly different from the results o f centres using the IAE A Code, as the precision o f the TLD intercomparison is not sufficient to show such small differences.
3 .5 . Dosimeter calibrations
A ll beam calibrations were based on. ionization dosimeters calibrated for ^Co. Twenty-nine calibrations were traceable to Australian primary standards (14 exposure, 8 air kerma, 5 water absorbed dose and 2 not stated), and one to the National Physical Laboratory o f the United Kingdom. The Australian Nuclear Science and Technology Organisation (ANSTO) (absorbed dose) and A R L (exposure/air kerma) primary standards have been shown [4] to agree to within0.2 %, well within the uncertainty o f the standards (0.5 % for exposure/air kerma and0.8% for water absorbed dose at “ Co).
4. CONCLUSIONS
The combined uncertainty o f the absorbed dose to water determination with the
IA E A ’s TLD system has been established to be 1.5% at the 1 a level, for the “ Co radiation quality. The uncertainty arising from the processing and readout o f the TLD powder is 1.2%. Dosimetry is based on a secondary standard ionization chamber with a BIPM certified air kerma calibration factor (uncertainty 0.17%) and a BIPM certified absorbed dose to water calibration factor (uncertainty 0.3%). Uncertainties due to set-up procedures and ionization chamber charge measurements for the calibration o f the TLDs in the IAE A Dosimetry Laboratory are less than 0.3%. The combined uncertainty o f 1.5% for ^Co was used to establish an acceptance level o f 3.5% for the relative deviation between the participant’ s quoted dose and the IAE A evaluated dose.
Evaluation o f the absorbed dose to water for photon beams from medical accelerators includes the use o f a code o f practice such as the IAE A Code. The use o f such a Code should not alter the above stated acceptance level as long as irradiating hospital and evaluating laboratory apply the Code’s correction factors related to different types o f ionization chambers and these correction factors are compatible. This is supported by the observed spread o f the accelerator results relative to the spread o f the ^C o results in Fig. 1. Therefore the acceptance level o f 3.5% is used for all high energy photon beams.
IAEA-SM-330/70 189
In view o f this, and in view o f the A R L ’s experience over the years, as shown in Table I, there were only two results o f significant concern, and these have been adequately addressed (a single capsule receiving only half the required dose, and a
roughly 15% deviation due to a misunderstanding; see Section 3.3).Six Australian radiotherapy centres (under three administrations) have not yet
adopted the IA E A dosimetry Code. This Code has been recommended for use, in Australia and New Zealand, by the Australasian College o f Physical Scientists and Engineers in Medicine, and calibration factors supplied by the A R L are appropriate for its use. The A R L and ANSTO strongly recommend the use o f the IA E A dosimetry Code in a water phantom by all radiotherapy centres in Australia.
The results o f the Australian and the European and US intercomparison runs
(Figs 5 and 2 respectively) may be compared. In both cases the one outlier o f about 15% was caused by a misinterpretation o f the IA E A ’s instruction sheet and was not a dosimetric problem. Disregarding these two outliers, the standard deviation in each group is equal to the estimated uncertainty o f the TLD measurements. Therefore it can be concluded that the coherence in dosimetry within each o f the two groups o f hospitals is significantly better than the TLD measurements can show. The mean deviation o f the dose intercomparison measurements with Australia, however, is sig
nificant (-1 .2 % ) compared with the result for Europe and the USA (-0 .1 % ). This deviation cannot be explained with the available data, especially as (a) all radiation measurements (except two) in the Australian hospitals are based on their ionization chambers calibrated in PSDLs and (b) the TLD results from the A R L participating in the intercomparison with two sets o f TLDs are —0.9 and —0.4%.
5. FUTURE PLANS
Although the IA E A Dosimetry Laboratory is unable to provide another complete batch o f TLDs for a further Australia-wide intercomparison, it can be expected that a few sets o f TLDs will be made available through the regular IAEA/WHO postal dose intercomparison service in its yearly run for the Western Pacific Region. A corresponding request has been placed with the WHO Regional Office.
The A R L intends to set up an independent TLD intercomparison service for radiotherapy dosimetry as soon as possible. This will be initially for photon beams, and later for electron beams. It is envisaged that more beam qualities will then be included for each centre. In the longer term, the A R L could become part o f the inter
national Quality Assurance Network which has recently been experimentally introduced by the IAEA. This programme covers three dosimetric steps from single field water phantom to multiple field organ phantom measurements.

190 HUNTLEY et al.
REFERENCES
[1] EISENLOHR, H.H., JAYARAMAN, S., IAEA-WHO cobalt-60 teletherapy dosimetry service using mailed LiF dosemeters. A survey of results obtained during 1970-75, Phys. Med. Biol. 22 (1977) 18-28.
[2] INTERNATIONAL ATOMIC ENERGY AGENCY, Absorbed Dose Determination in Photon and Electron Beams: An International Code of Practice, Technical Reports Series No. 277, IAEA, Vienna (1987).
[3] HUNTLEY, R.B., NETTE, H.P., International Atomic Energy Agency/World Health Organization TLD radiotherapy dosimetry intercomparison — Technical report, Australian Physical and Engineering Sciences in Medicine 16 (1993) 44-48.
[4] SHERLOCK, S.J., HARGRAVE, N.J., HUNTLEY, R.B., “ The congruence of the Australian primary standards for absorbed dose and exposure/air kerma” , Report on the Biennial Meetings of the CCEMRI(I), BIPM, Sèvres (1991) 91-93.

C A L IB R A T IO N S A N D
Q U A L I T Y A S S U R A N C E P R O G R A M M E S
(S ession 3 )
Chairman
H. JÁRVINENFinland
Co-Chairman
A. MEGHZIFENEAlgeria


IAEA-SM-330/16
QUALITY ASSURANCE AND CALIBRATION PROGRAMMES AT THE SECONDARY STANDARD DOSIMETRY LABORATORY, INDIA
S.C. M ISRA, A . K A N N A N , S.B. NA IK ,P.N .M .R . VLTAYAM, V.S. PATK I
Radiation Standards Section,Bhabha Atomic Research Centre,
Trombay, Bombay,India
Abstract
QUALITY ASSURANCE AND CALIBRATION PROGRAMMES AT THE SECONDARY STANDARD DOSIMETRY LABORATORY, INDIA.
Radiotherapy centres in India employ №Со and 137Cs machines as well as medical linear accelerators. In order to ensure dosimetry accuracy in all these centres, periodic postal dose intercomparisons are organized by the Secondary Standard Dosimetry Laboratory (SSDL), India. The details of this programme, which monitors the dose to a water phantom under standard irradiation conditions, are discussed, together with some results. In addition, in-air exposure and patient dose intercomparisons are organized when required. Some important features and results obtained are given in the paper. Routine TLD intercomparisons conducted in the country over the past few years show that the dosimetry accuracy is within ±5% for only 70-80% of the “ Co machines, probably owing to the ageing of machines and limited dosimetry support. Patient dose intercomparisons showed marked variations in dose delivered for each fraction during actual treatment. Routine calibration programmes of the SSDL, including brachytherapy source calibrations, are discussed.
1. INTRODUCTION
In India radiotherapy is carried out in a large number o f medical centres using external photon beams from 19 different types o f radiotherapy machine and brachytherapy. To obtain satisfactory cancer cure rates in radiation therapy, it is essential to ensure a dosimetry accuracy o f better than ±5% . In addition it is essential to achieve uniformity in dosimetry. This requires quality assurance o f dosimetric measurement. The Secondary Standard Dosimetry Laboratory (SSDL), India, tries to achieve this through various programmes. Two ongoing programmes are devoted to postal dose TLD intercomparisons and calibrations.
193

194 MISRA et al.
There are about 174 teletherapy machines installed in the country, consisting
o f “ Co and 137Cs machines and medical linear accelerators. The majority o f the “ Co and 137Cs teletherapy machines were installed decades ago and have limited physicist support. It was observed that detailed and frequent dosimetry measurements at these centres have not been made owing to heavy patient workloads. Hence, it was felt that periodic dosimetry intercomparisons would be extremely useful to achieve quality assurance in dosimetry with external beams. Three types o f intercomparison are organized by the SSDL, and they are described below.
2.1. Postal dose TLD intercomparisons
The postal dose TLD intercomparison programme has been organized since 1976 in collaboration with the International Atomic Energy Agency (IAE A ) and the World Health Organization (W HO) and covers therapy centres in India, Myanmar and Sri Lanka. The programme involves the comparison o f the estimated dose given by the physicist to a set o f TLD capsules and the dose evaluated by the SSDL. A set o f three waterproof nylon capsules filled with TLD material (L iF ) is mailed to
the centre for irradiation to 2 Gy. Irradiation is carried out in a water phantom at a depth o f 5 cm using the teletherapy machine for a 10 x 10 cm2 field size. The dose for irradiation is fixed as 2 Gy, since this approximately equals the dose given to patients at each sitting. The irradiated capsules are sent to the SSDL for dose evaluation, which is done in the following manner.
A calibration graph between TLD signal/mg and dose is obtained at the SSDL
for “ Co on the basis o f capsules irradiated to different doses in a water phantom in the dose range 1.5-2.5 Gy. Corrections for sensitivity changes in the reader system are effected by using a number o f check TLD capsules (irradiated to 2 Gy), which are read between the capsules from the institutions. A ll the signals are normalized to the first day o f measurement. The dose to the TLD capsules from each institution is evaluated from the TLD signal and the calibration curve. The percentage deviation between the quoted dose (QD) and evaluated dose (ED) is given as
% deviation = (QD — ED)/ED
Some essential features o f the dose evaluation procedure at the SSDL are
described below:
(a) Use o f the IAE A Protocol [1] for calculation o f the absorbed dose to water at
“ Co;(b) Use o f a monitor chamber located at a convenient depth in the water phantom
to correct for the variation in the dose delivered;
2. TLD INTERCOM PARISONS

Dose deviation Number of machines showing deviations
(%) 1987 1988 1989 1990 1991 1992
< ±5 57 45 40 86 100 45
±5-10 12 17 7 14 24 9
> ±1 0 1 12 4 9 12 4
IAEA-SM-330/16
TABLE I. TLD INTERCOM PARISON RESULTS FOR “ Co M ACHINES
15
14
<-20 -20 t o -10 -10 t o -5 -5 to 0 Oto 5 5 to 10 10 to 20 >20Deviation (%)
FIG. 1. Results o f intercomparison o f 137Cs machines.
(c) Use of PC software developed at the SSDL for dose evaluation and for data tabulation [2];
(d) Use of N2 gas flow to eliminate or prevent formation of an oily deposit on the filter in front of the photomultiplier in the TLD reader.
The overall accuracy in dose estimation as determined by the TLD intercomparison is estimated to be about ± 4 % . Typical TLD intercomparison results obtained by us over the past five years are given in Table I. The general observation is that the deviations are within ± 5 % for only about 70-80% of the ^C o machines.

196 MISRA et al.
Typical results obtained with 137Cs machines over the past few years are shown in Fig. 1. The observed large deviations could be attributed to malfunctioning due to the ageing o f teletherapy machines and infrequent output measurements. On the other hand, we observed that the deviations in dose are within the ±5% limits for all linear accelerators, which we believe to be due to good physics support and frequent measurements. It was found that many o f the physicists calculated the dose from in-air measurements made months or in some cases even years earlier rather
than from water phantom measurements; most o f them calculated the dose after correcting for backscatter and depth dose distribution.
2.2. In-air exposure intercomparisons
The SSDL organizes in-air exposure intercomparisons for ^C o machines in
cases where quick output checks are required. A special Perspex irradiation stand (mailable) for use with ^C o machines has been designed. This can be positioned on
the couch at the required SSD. The TLD capsule is kept at the centre o f a 10 x 10 cm2 field by aligning the optical field to the marking on the stand. To ensure charged particle equilibrium conditions during irradiation, the TLD capsule is sandwiched between two 4 mm thick Perspex sheets. The participant is asked to irradiate three capsules to 200 R (51.6 mC/kg). These irradiated capsules are evaluated at the SSDL. Comparison o f the quoted and SSDL evaluated exposures enables one to derive the required information about the dosimetry status at the therapy
TABLE П. T Y P IC A L PATIENT DOSE INTERCOMPARISON RESULTS
Mean measured Stated dose Deviation Sample Dose range Number of
dose (cGy) (cGy) (%) SD (cGy) samples
Breast 313.0 304.1 +2.9 2.7 304.8-326.9 5
Cervix 213.8 219.0 +5.8 1.7 228.1-237.4 4
Stomach 266.3 248.4 +7.2 1.7 261.2-271.0 4
Cheek and neck 195.6 206.8 -5.7 1.4 194.1-199.9 5
Oesophagus 175.3 177.2 -1.1 1.0 173.6-177.9 5
Abdomen 135.6 123.0 +9.3 5.4 125.2-145.0 5
Larynx 139.3 131.0 +6.0 4.7 130.4-147.2 5
Superior vena cava 237.7 254.7 -7.7 2.0 231.7-244.3 5

IAEA-SM-330/16 197
centre. Similar intercomparisons have been organized in the United States o f America. This irradiation facility at the SSDL is also used as a backup dosimeter during ^C o source transfer operations. The accuracy o f these measurements is expected to be the same as those o f TLD postal dose measurements.
2.3. Patient dose intercomparisons
The patient dose intercomparison programme was organized to investigate the
uniformity and accuracy o f the doses delivered to patients in the various fractions during treatment. For this intercomparison, the TLD capsule is inserted in a Perspex block o f 30 x 20 x 9 mm3 and positioned at the centre o f the radiation field on the skin o f the patient, and is then irradiated. The dose to the capsule is obtained from the skin dose quoted by the physicist after inverse square law correction. The dose evaluation procedure is similar to that described in Section 2.1.
So far, about five such intercomparisons have been conducted, using ^Co beams, covering a number o f treatment sites. A set o f five fractions is covered for each site. Some o f the results obtained during these intercomparisons are given in Table П. They show that the variation o f dose per fraction is exceeding the desired limits in a number o f instances and in certain sites the dose deviation is high. It would seem appropriate to conclude that frequent patient dose intercomparisons will improve the existing situation.
3. CALIBRATIONS
Dose measurements o f gamma or X ray beams used for radiotherapy are required to be carried out with suitable dosimeters to a high degree o f accuracy, with measurement traceability to national and international standards. This can be
achieved by calibrating dosimeters at a national/accredited laboratory. In India, the SSDL is a part o f an apex calibration laboratory in a National Calibration Service programme o f the Department o f Science and Technology. Activities o f the radiation standards laboratory under this programme cover maintenance o f national standards for exposure and dose besides calibration o f dosimeters.
For calibration activities, the SSDL has a medium energy X ray machine (75-250 kV), a “ Co teletherapy machine and a diagnostic X ray machine (40-125 kV). A number o f reference dosimeters, along with in-house calibrated charge measuring systems, are also available.
The majority o f dosimeters used in therapy centres in the country are made at the Bhabha Atomic Research Centre and have Tuftiol walled ion chambers. In practice, most o f them are sent for calibration once every three years. The SSDL calibrates these at “ Co energy, after precalibration tests, in terms o f exposure or air kerma. The overall accuracy o f calibration is o f the order o f ± 3 %. It is proposed

198 MISRA et al.
that the therapy centres use the IAE A Protocol [1] for dose to water evaluation. This involves the knowledge o f correction factors for (a) chamber wall non-air equivalence (fcm) and (b) wall attenuation (fcatt) and the fraction o f total cavity current generated by the proximal wall (pu) at different photon energies. These have been evaluated at the SSDL and confirmed at “ Co and at 6, 10 and 15 M V. A detailed dose evaluation' procedure similar to the one recommended by the IAEA has been formulated for use at therapy centres all over the country. This, it is hoped, will bring about updated dose measurement procedures in India.
In therapy centres there are inadequate facilities to calibrate brachytherapy sources even though many remote/manual afterloading machines are used for routine
interstitial therapy. The SSDL has been providing brachytherapy source calibration since 1985 [3]. Calibration is done in terms o f the radiation output at 1 m. In many cases, on-site calibrations are undertaken. For this purpose a portable dosimeter with a 400 cm3 Bakelite chamber, along with a Perspex calibration jig, has been designed. The charge measuring system employs a varactor DC amplifier. The calibration factor for the 400 cm3 chamber for 137Cs is 7 x 10⁴ Gy/C and is found to be constant (± 3 % ) in the photon energy range 400-1250 keV. Over the past few
years, more than 150 137Cs and “ Co sources and three 192Ir wires have been calibrated at various locations in the country. In all cases, the air kerma rates at 1 m measured by our system were within ±5% o f the values quoted by Amersham Ltd. This facility is made available by the SSDL to therapy centres on request.
For monitoring the calibration accuracy o f regional accredited laboratories under the national calibration scheme, the SSDL proposes to use a calibration assurance dosimeter (CAD). This consists o f a charge measuring system employing an FET operational amplifier and two ionization chambers. A 0.6 cm3 graphite walled
chamber is used for therapy level exposure or dose measurements. A 400 cm3 chamber is used for protection level exposure measurements. The specifications o f the CAD are given below:
— Input amplifier: OPA 104— Nominal input charge sensitivity: 50.3 or 4.97 nC/V— Nominal air kerma calibration factors:
— for 0.6 cm3 chamber at “ Co: 2.12 Gy/V— for 400 cm3 chamber at 137Cs: 357 /¿Gy/V
— Typical standard deviations:— short term: <0.06%— long term: 0.12%.
It is proposed to evaluate the calibration status o f the accredited laboratory by
comparing the CAD calibration factors obtained at the SSDL and at the accredited
laboratory using a standard procedure formulated by the SSDL.

IAEA-SM-330/16 199
Results o f in-phantom intercomparisons conducted by the SSDL at Bombay
show that a dosimetry accuracy o f ±5% is achieved in only about 70-80% o f the ^C o machines, owing probably to ageing o f the machines. It is feasible to investigate large discrepancies in dosimetry by in-air TLD intercomparisons. However, a realistic picture o f patient dose delivery accuracy can be obtained only through patient dose intercomparisons. SSDLs can play an important role in carrying out such intercomparisons in their own particular regions. Since special equipment and expertise are available at many SSDLs in developing countries, they will be better
placed than therapy centres to carry out brachytherapy source calibrations.
4. CONCLUSIONS
ACKN O W LE D G EM EN TS
The authors wish to gratefully acknowledge the valuable help o f J.B. Shigwan and V.D . Kadam in carrying out the TLD measurements. Technical help rendered by P.S. Jadhavgaonkar in the wiring o f the CAD is also gratefully acknowledged.
REFERENCES
[1] INTERNATIONAL ATOMIC ENERGY AGENCY, Absorbed Dose Determination in Photon and Electron Beams: An International Code of Practice, Technical Reports Series No. 277, IAEA, Vienna (1987).
[2] SHIGWAN, J.B., KANNAN, A., “ PC software for use in TLD measurements” , paper presented at Int. Conf. on Medical Physics and Radiation Safety, Bombay, 1992.
[3] NAIK, V.W., VIJAYAM, P.N.M.R., KANNAN, A., JADHAVGAONKAR, P.S., “ Calibration of brachytherapy sources” , Asian Regional Conf. on Medical Physics, Bombay, 1986, Bhabha Atomic Research Centre, Bombay (1986) 221-222.


IAEA-SM-330/58
E S T A B L IS H M E N T O F A N E W
S E C O N D A R Y S T A N D A R D D O S IM E T R Y L A B O R A T O R Y
I N P R A G U E
J. N O VO TNY, A . BURIANInstitute o f Radiation Oncology
I. KO VÁR, R. W ÁGNERInstitute o f Radiation Dosimetry
Prague, Czech Republic
Abstract
ESTABLISHMENT OF A NEW SECONDARY STANDARD DOSIMETRY LABORATORY IN PRAGUE.
A new Secondary Standard Dosimetry Laboratory (SSDL), designed by the Institute of Radiation Oncology and the Institute of Radiation Dosimetry, was established in Prague in 1992. The SSDL was established on the basis of the following needs: to establish a metrology chain for dissemination of dosimetric units in accordance with legal requirements in metrology in the Czech Republic; to calibrate radiotherapy dosimeters under conditions close to those in which radiotherapy units work; and to ensure that the Primary Standard Dosimetry Laboratory (PSDL) has more time for maintaining and developing its standards, as the calibration of a large number of dosimeters is very time consuming. The secondary standard of air kerma and absorbed dose to water at the new SSDL consists of a Chisostat SOI radiotherapy “ Co irradiation unit, an NE 2561 ionization chamber, a Keithley 35617 EBS electrometer and a standard mercury thermometer and barometer. The values of air kerma and absorbed dose to water were transferred from two dosimetry laboratories, from the PSDL in Prague and from the International Atomic Energy Agency (IAEA) SSDL in Seibersdorf, with combined uncertainties of 0.85 and 0.86% respectively (la level). The values of the newly established standards were verified using two independent intercomparison methods. A Calibration Assurance Dosimeter Set (CARE System, IAEA SSDL, Seibersdorf) was used for air kerma and dose to water comparison. In addition, a set of TLD capsules was irradiated within the framework of an international dose intercomparison organized by the World Health Organization and the IAEA. Some other studies have been carried out for routine work with the standards. The programme of further activities at the new SSDL is aimed at introducing quality assurance (QA) into the work of the SSDL, by standardizing all processes on the basis of PC aided protocols for data acquisition and processing. Development of a procedure for testing electrometers and ionization chambers in accordance with Publication 731 of the International Electrotechnical Commission, as well as constitution of standards for other radiation beam qualities, is also considered. A further aim is to introduce a QA programme for radiotherapy departments, including dose intercomparison, a beam data dosimetry service, quality audit in dosimetry and a treatment planning system.
201

202 NOVOTNŸ et al.
1. INTRODUCTION
A new Secondary Standard Dosimetry Laboratory (SSDL), designed by the
Institute o f Radiation Oncology and the Institute o f Radiation Dosimetry, was established in Prague in 1992. It has been set up to fill the existing gap between the Primary Standard Dosimetry Laboratory (PSDL) and the users in the field o f radiation oncology, for the majority o f dosimeter calibrations had previously been performed at the PSDL. The SSDL was established on the basis o f the following needs:
— To establish a metrology chain for dissemination o f dosimetric units in accordance with legal requirements in metrology in the Czech Republic;
— To calibrate radiotherapy dosimeters under conditions close to those in which radiotherapy units work (the kerma rate at the reference point in the PSDL is one and a half orders lower);
— To ensure that the PSDL has more time for maintaining and developing its standards, as the calibration o f a large number o f dosimeters is very time consuming (the number o f dosimeters to be calibrated has been increasing every year).
The established SSDL is to be accredited by the Czech Metrology Institute in accordance with requirements which are similar to those in most developed European countries (i.e. according to the European standard EN 45001-3).
2. CONSTITUTION OF SECONDARY STANDARD OF A IR KERM A AND ABSORBED DOSE TO W ATER
The secondary standard o f air kerma and absorbed dose to water established in the new SSDL in Prague consists of:
— Radiotherapy “ Co irradiation unit (Chisostat SOI)— Ionization chamber (NE 2561)— Electrometer (Keithley 35617 EBS)— Standard mercury thermometer and barometer.
A number o f relative dosimetric parameters which characterize the radiation beam (e.g. buildup characteristics, percentage depth doses and output factors) were determined before constitution o f the secondary standard.
2.1. Measurement of air kerma rate along beam axis
Air kerma rate was measured along the beam axis in the distance range o f 55-300 cm from the source. Only small differences from the inverse square law were found when correction for photon attenuation in air had been taken into account; they
are shown in Fig. 1.

IAEA-SM-330/58 203
FIG. I. Dependence o f correction for inverse square law on distance from source.
The relative dependence o f air kerma rate measured along the beam axis can be described by the following analytical expression, considering all factors (attenuation and scattering o f photons in the source, in the collimator system and in air, as well as the effect o f albedo):
F(Z) = B3 exp(—fi]Z)/(Z + B2) 2
where Z (m) is the distance from the source, Bx and B2 are the parameters found by means o f the Gauss-Newton least squares method for a standard collimator set-up (field size 10 x 10 cm2):
Bx = (-2 .247 ± 1.011) X 10'2 n r 1
B2 = (-1 .735 ± 0.206) X 10-2 m
and B3 = 0.944 15 is the normalizing constant making F ( l ) = 1.
2.2. Dependence of output factor on field size
Air kerma rate was measured for square fields ranging in size from
6 x 6 cm2 to 14 x 14 cm2 in the beam axis at a distance o f 100 cm from the source. A ll measured values o f air kerma rate follow closely a saturation type curve (Fig. 2) given by the equation:
OF(A) = 1 + Q [exp(C2/4o) - exp(C24 )]

204 NOVOTNŸ et al.
Field size (cm)
FIG. 2. Dependence of output factor on field size.
where A (cm) is the field size, Q and C2 are the parameters found by means o f the Gauss-Newton least squares method:
Cx = 0.2340 ± 0.0062
C2 = 0.1938 ± 0.0068 cm '1
and A0 is the standard field size, 10 x 10 cm2.
2.3. Measurement of profiles and isodose curves
Profiles o f beams for different collimator set-ups and for different distances from the source were measured both in air and in water using a Vertec CMS water
phantom. Isodose curves were calculated from these profiles. Figure 3 shows isodose curves for the standard fields, the geometrical conditions o f which are as follows:
— In air at SCD = 100 cm (source-centre distance):— field size on 90% isodose is 10.0 x 10.0 cm2— field size on 50% isodose is 13.5 X 13.5 cm2
— In water at SSD = 75 cm and depth = 5 cm:— field size on 90% isodose is 9.0 x 9.0 cm2— field size on 50% isodose is 10.9 x 10.9 cm2.
Also, the depth dose curve was measured to determine the correction coefficient for the shift o f the effective point from the centre o f an ionization chamber.

IAEA-SM-330/58 205
FIG. 3. Isodose curves for standard fields in (left) air and (right) water.
2.4. Determination of air kerma and absorbed dose to water
The values o f air kerma rate and absorbed dose rate to water were transferred from two dosimetry laboratories (the PSDL in Prague and the International Atomic Energy Agency (IAE A ) SSDL in Seibersdorf) with combined uncertainties o f0.85 and 0.86% respectively (If f level). The resulting values o f the standards for
1 January 1992 were:
— A ir kerma rate: 6.3105 x 10~3 G y-s*1 ± 0.85%— Absorbed dose to water rate: 9.6941 x 10"3 G y-s"1 ± 0.86%.
More details concerning the combined uncertainties are given in Tables I and П. The combined uncertainty o f the standard adjustment (reference field size, reference distance from the source in air and/or reference depth in water) was deter
mined by means o f relative measurements.With the aim o f achieving a good traceability to the IA E A SSDL, a comparison
o f current and pressure has also been performed.
3. M AINTEN ANCE, DEVELOPM ENT AND INTERCOMPARISON
OF STANDARDS
The values o f the newly established standards were verified using two indepen
dent intercomparison methods. A Calibration Assurance Dosimeter Set (CARE System, IA E A SSDL, Seibersdorf) was used for air kerma and absorbed dose to

206 NOVOTNŸ et al.
TABLE I. DETAILED ANALYSIS OF UNCERTAINTIES RELATED TO TRANSFER OF KERMA FROM PSDL AND IAEA SSDL
QuantityUncertainty* (%)
Type A Type В
Transfer of kerma from PSDL using chamber NE 2571
¿(PSDL)
IœT (SSDL) 0.04
0.74
/„(PSDL) 0.02 —
*Mt(SSDL) 0.01 —
*po.(SSDL) — —
(PSDL) 0.01 —
M pSDL) 0.03 —
Distance setting — 0.10
Field size setting 0.18 —
Transfer of kerma from IAEA SSDL using chamber NE 2561
Л^(1АЕА) 0.60
сот 0.04 —
к, (IAEA) 0.01 —
Pressure 0.02 0.10
Temperature 0.02 —
Distance setting 0.02 0.10
Field size setting 0.18 —
a Uncertainty of quantity determination at la level confidence interval.
water comparison. In addition, a set of TLD capsules was irradiated within the framework of an international dose intercomparison organized by the World Health Organization and the IAEA.
Various measurements have been made to check the long term stability of the standards. The first measurements included monitoring of electrometer stability and studies concerning the properties of the electronic barometer and thermometer for routine work at the SSDL.

IAEA-SM-330/58 207
TABLE П. DETAILED ANALYS IS OF UNCERTAINTIES RELATED TO
TRANSFER OF DOSE FROM IAE A SSDL
QuantityUncertainty3 (%)
Type A Type В
^ d,w (IAEA) 0.80 —
cor 0.13 —
K,(LAEA) 0.01 —
0.10
Pressure 0.02 0.10
Temperature 0.02 —
Distance setting 0.02 0.10
Field size setting 0.18
Depth setting 0.05 0.13
a Uncertainty of quantity determination at la level confidence interval.
4. PROGRAMME OF ACTIVITIES A T SSDL
The programme o f further activities at the new SSDL is aimed at development o f sophisticated measurement techniques, both for maintenance o f standards and for work on routine calibration.
A plan for introduction o f quality assurance (Q A ) into the work o f the SSDL, by standardizing all processes on the basis o f PC aided protocols, has been prepared for data acquisition control. It concerns measurement o f ionization current, temperature and pressure, as well as current calibration. A procedure for testing electrometers and ionization chambers in accordance with Publication 731 o f the International Electrotechnical Commission is under development. A water calorimeter has been constructed in co-operation with the PSDL in Prague. Constitution o f standards for other radiation beam qualities is also being considered.
The following programme o f SSDL activities in the field o f radiation physics devoted to medical dosimetry has been developed. A QA programme will be introduced for radiotherapy departments, which will include dose intercomparison,
a beam data dosimetry service, quality audit in dosimetry and a treatment planning system. O f these activities the most progress has been made with the development

208 NOVOTNY et al.
o f a measuring kit for quality audit o f dose delivery in megavoltage therapy. The quality audit kit consists o f a multipurpose irregular phantom (design derived from the IA E A Simple Phantom No. 2), a 0.1 cm3 Vakutronik 70108 ionization chamber
and an M R 1113 electrometer PC board inserted into a laptop computer (forming a very powerful portable system for ionization current measurements; the system offers user-friendly data acquisition and processing according to prescribed protocols).
BIBLIOGRAPHY
INTERNATIONAL ATOMIC ENERGY AGENCY, Absorbed Dose Determination in Photon and Electron Beams: An International Code of Practice, Technical Reports Series No. 277, IAEA, Vienna (1987).
INTERNATIONAL ELECTROTECHNICAL COMMISSION, Medical Electric Equipment— Dosimeters with Ionization Chambers as Used in Radiotherapy, IEC 731, Geneva (1982).
INTERNATIONAL ORGANIZATION FOR STANDARDIZATION, INTERNATIONAL ELECTROTECHNICAL COMMISSION, INTERNATIONAL ORGANIZATION OF LEGAL METROLOGY, INTERNATIONAL BUREAU OF WEIGHTS AND MEASURES, Guide to the Expression of Uncertainty in Measurement, 1st edn, ISO/TAG 4/WG 3, ISO, Geneva (1992).

IAEA-SM-330/25
M A I N T E N A N C E A N D D IS S E M IN A T IO N O F T H E
R A D I A T I O N E X P O S U R E S T A N D A R D S A T T H E
N A T I O N A L R A D I A T I O N L A B O R A T O R Y ,
N E W Z E A L A N D
V.G. SM YTHNational Radiation Laboratory,Christchurch, New Zealand
Abstract
MAINTENANCE AND DISSEMINATION OF THE RADIATION EXPOSURE STANDARDS AT THE NATIONAL RADIATION LABORATORY, NEW ZEALAND.
The modest population of New Zealand and the comprehensive nature of the National Radiation Laboratory (NRL) allow a much greater degree of contact and surveillance of dosimetry practice in each of the radiation therapy departments than is usual in most countries. This arises from the fact that NRL is the regulatory authority for radiation safety, issues Codes of Safe Practice, maintains and disseminates the national primary standards of radiation exposure, and performs safety visits and dosimetry audits. The importance of each of these functions for dosimetry quality in radiation therapy in New Zealand is discussed.
1. INTRODUCTION
New Zealand has a population o f 3.5 million distributed among six main population centres. Each o f these centres has radiation therapy facilities, typically with two or three high energy machines and a kilovoltage X ray machine. This scale o f operation has both advantages and disadvantages for a regulatory body such as the National Radiation Laboratory (NR L). Staff from N R L visit each o f the centres each year and know most o f the clinical medical physicists personally. However, the centres cover a span o f more than 1000 km.
NR L on its own performs many o f the functions that are normally spread among several organizations in more populous countries. It is the national regulatory body for radiation protection. It writes and enforces Codes o f Safe Practice. It performs safety inspections and dosimetry auditing visits. It holds the national primary standards for radiation exposure, and provides an in-house dosimeter calibration service for the hospitals.
This unusual combination o f functions and scale o f operation has resulted in a rather different approach being taken to the problems o f maintaining dosimetry
quality in New Zealand compared with most other countries. It is the purpose o f this paper to highlight these differences.
209

210 SMYTH
The regulation o f the use o f radiation in New Zealand is by the licensing o f the user. Each licence is issued for a particular category o f use and is generally specific to the facilities that are to be used. Licences may be made subject to special conditions, such as compliance with a Code o f Safe Practice. In the case o f radiation therapy a Code has been written by NR L [1] for the use o f external beams. It covers
all aspects o f the process that affect the radiation safety o f the patient, the staff or the public. This Code is mandatory on all licences for radiation therapy. A further
Code dealing with brachytherapy is planned.The Code gives a detailed prescription o f the dosimetry methods to be used
throughout the entire chain from calibration o f the local secondary standard dosimeter to clinical dosimetry and treatment planning. The rationale behind this is to ensure consistency within the dosimetry chain itself, from one hospital to another and internationally, and to reduce human errors by using set methods.
The protocol for reference beam measurement is in general accordance with
the IA E A Code [2] (see below). A primary concern has been to ensure that the dose measurements from which the beam-on time is derived in a treatment plan are directly related to the reference beam measurements, rather than independently taken measurements at dose maximum or some other reference point.
As well as dosimetry methods, the NR L Code requires that dose specification and prescription be in terms o f Report 29 o f the International Commission on Radia
tion Units and Measurements (ICRU) [3]. W e are looking forward to the revision o f this document to encompass the present day three dimensional treatment methods.
2. REG ULATIO N OF DOSIM ETRY METHODS
3. PROTOCOLS FOR REFERENCE BEAM DOSIMETRY
3.1. High energy
The NR L Code requires that reference dosimetry o f high energy therapy beams complies with the IAE A dosimetry Protocol [2]. The IAE A Code has been adapted by NR L for routine use with NE 2505, NE 2561 and NE 2571 ionization chambers. Restricting the coverage to just three chambers has allowed a considerable simplification o f the tables and makes the IAE A Code much easier to use.
The IA E A Code was adopted by all hospitals in both New Zealand and Australia in 1989. The main motivation for this came from the medical physics community. However, there was also strong support from radiation oncologists who were taking
part in inter-hospital clinical trials.

IAEA-SM-330/25 211
The kilovoltage X ray dosimetry part o f the IAE A Code has not been made
a requirement in the NR L Code because o f some unresolved problems. The introduction o f a change o f up to 10% in the form o f a perturbation factor would have created
difficulties with clinicians whose dose prescription is based largely on experience. It appears now that this correction should be much closer to 1.0 [4].
The second problem concerns the reference geometry. In New Zealand, i f radiation therapy is used for treatment o f (non-melanoma) skin cancer, it is the usual practice to use 100 kV X rays (H V L 2.2-2.3 mm A l) in order to produce an even dose up to the required depth. The IAE A Code requires that this be measured at
5 cm depth in water. The dose at this depth is only about 15 % o f the dose maximum when the SSD is 10 cm. This does not seem to be appropriate when the clinically effective dose is delivered in the first centimetre o f depth and is nearly an order o f magnitude larger.
Subsequent to the production o f our Code, the Australasian College o f Physical Scientists and Engineers in Medicine has drafted a dosimetry protocol for X rays up to 150 kV. The protocol uses ICRU Report 23 [5] to derive surface dose to water
from an in-air measurement with a large field ‘reference’ applicator. The measurement is then used to calibrate a parallel plate chamber mounted on the surface o f a water equivalent phantom. The surface dose from all other applicators is then measured using the parallel plate chamber, giving a direct measurement o f backscatter. This method places less reliance on questionable tabulated backscatter data. W e would like to see this method adopted generally.
3.2. K ilovoltage X rays
4. PR IM AR Y RAD IATIO N EXPOSURE STANDARDS
N R L holds primary standards for radiation exposure from low and medium energy X rays and “ С y radiation. The calibration o f all therapy dosimetry in New Zealand is traceable to these.
4.1. X ray standards
A single Pantak X ray generator drives two exposure ranges covering beams from 10 to 300 kV. The plant is controlled by a computer which constantly monitors and adjusts the tube current and voltage to maintain a stable output. The tube voltage has been calibrated using spectroscopy. The computer also controls sequences o f exposures and movement o f instruments in and out o f the beam. It performs quality control test sequences and complete instrument calibration sequences.

212 SMYTH
The two free air ionization standard chambers are o f conventional design [6]. The correction factors for the standard beams have been derived from measure
ments, analytical calculations and the literature [7-9]. They will shortly be reevaluated using Monte Carlo simulation and measured spectra.
A standard set o f beams (combinations o f kilovoltage and filtration) has been chosen to match the kilovoltage o f any therapy beam in New Zealand and to allow matching o f the H V L by interpolation.
The overall uncertainty o f a dosimeter calibration directly against the X ray standard is estimated as 0.33%.
4.1.1. Medium energy range
The medium energy range has been recently constructed around a replacement Comet metal-ceramic medium energy tube. The thin window o f the tube (5 mm beryllium) permits a range o f beams from 15 to 300 kV. The instrument holder is mounted on two sets o f rails. One allows a range o f source to detector distances from
FIG. 1. Diagram o f the shutter on the medium energy X ray tube. The shutter operates by rotating 90° about a vertical axis in the plane o f the diagram.

IAEA-SM-330/25 213
50 cm to 6 m. The other provides a horizontal movement perpendicular to the beam direction allowing the exposure o f up to three different devices, including either the
low or medium energy standard chamber. The shutter design is original, using tungsten discs at the ends o f a tube that rotates 90° to open or close (Fig. 1). The movement is powered by compressed air and takes only 20 ms.
4.1.2. Low energy range
The low energy range has been specially designed to provide the short source to detector distance and high dose rate beam usually measured with small volume low energy X ray chambers. The tube is made by AEG-Telefunken, with inherent filtration o f 1 mm beryllium, and produces X rays from 10 to 160 kV. The shutter is a tungsten disc that is moved back and forth by compressed air. The shutter,
filters, monitor chamber and collimators are o f very compact design and allow a minimum range o f 20 cm.
4.2. ^Co standards
The ^C o standard is maintained with two graphite cavity chambers, one cylindrical with hemispherical ends and a cavity volume o f 6.5 cm2, the other spherical with a volume o f 10 cm2. The response o f the chamber is corrected to give air kerma. The correction factors for this were first calculated using analytical methods [10] and more recently using a Monte Carlo simulation [11]. This work is currently being repeated using the codes EGS4 and ITS.
The overall uncertainty o f a dosimeter calibration directly against the “ Co
standard is estimated as 0.72%. The main contributors to this are the uncertainties in the stopping power and mass energy absorption ratios, and the uncertainty o f determining the cavity volumes.
4.3. NRL-ARL intercomparison
In 1989 an intercomparison was carried out between the primary standards for “ Co and four medium energy X ray beams at NR L and the Australian Radiation Laboratory (AR L ). An N R L NE 2560/2561 dosimeter was calibrated at both centres and the result corrected according to the response measured using a ^Sr check source. Over the five beams the agreement was within 0.4%.
5. CALIBRATIO N OF HOSPITAL DOSIMETRY EQUIPMENT
Twice a year the NR L secondary standard dosimeter (Keithley 35617 EBS electrometer with an NE 2571 0.6 cm3 or PTW M23342 thin window chamber for
214 SMYTH
low energy X rays) is calibrated in each o f the standard beams. A change o f more than 0.3% would be taken as an instrument instability, and this would be inves
tigated. The “ Co calibration is converted to the absorbed dose to air chamber factor as required by the IAE A high energy Protocol.
The NR L secondary standard is taken to each o f the radiation therapy centres in hospitals once a year to calibrate the dosimeters. Each centre has a dosimeter that serves as the local standard, but it is normal to calibrate each instrument that is regularly used for absolute dose measurements as well.
The hospital dosimeters are calibrated against the NRL secondary standard for each radiation quality that is used clinically, by comparison in each kilovoltage X ray beam and one high energy photon beam. This process adds no more than 0.1% to the overall calibration uncertainty when the chambers are exposed simultaneously. This may increase to 0.5% in the case o f low energy X ray chambers exposed individually in a beam with a drifting output.
5.1. High energy calibrations
For high energy dosimetry the absorbed dose to air chamber factor is transferred to the hospital chamber by comparison side by side at 5 cm depth in a Perspex
(PM M A) phantom in a “ Co or 4 or 6 M V photon beam. (The first is preferred but three o f the hospitals have replaced their cobalt machines with 4 or 6 M V linear accelerators.)
When the wall material o f the hospital chamber differs from that o f the secondary standard, this is corrected for, using the formalism o f the IAE A Protocol.
5.2. Kilovoltage X ray calibrations
The N R L secondary standard and the hospital dosimeter are compared in each o f the hospital kilovoltage X ray treatment beams. The chambers are exposed in air, either side by side (0.6 cm3 chambers) or by replacement (thin window chambers). A large applicator is used to help give a uniform field and minimize the scatter.
The exposure calibration factor for the NR L secondary standard, at the exact quality o f the hospital beam (kilovoltage and H VL), is obtained by interpolation o f the factors from standard beams at NR L o f the same kilovoltage and at least three H V L points surrounding the required HVL.
6. AU D ITING OF HOSPITAL DOSIMETRY
Every two years, on the routine calibration visits to hospitals, each o f the high energy therapy beams is independently measured under reference conditions by NR L staff. The N R L secondary standard dosimeter and water phantom are used.

IAEA-SM-330/25 215
FIG. 2. Results o f the 1991 high energy therapy beam dosimetry audit. Each bar represents the percentage deviation o f the hospital dosimetry from the NRL measurement. Adjacent bars not separated by gaps are from individual linear accelerators.
It is not possible to check everything in the time available. The hospital values o f the quality specification parameters and the accuracy o f the mechanical range indi
cator are accepted as given. The exercise is done as an audit o f the medical physicist’ s application o f the dosimetry protocol and to pick up any clinically significant errors.
Results so far show a variation from the NR L measurements o f generally less than 1 % and seldom greater than 2%. This is within the usual specifications for output stability for linear accelerators. The results o f the 1991 audit are given in Fig. 2.
It is intended to extend this audit to include kilovoltage X rays once a widely accepted dosimetry protocol has been adopted.
N R L is currently developing a phantom instrumented with a 16 channel semiconductor diode dosimeter to test the accuracy o f dose delivery in a realistic multifield treatment. The phantom will simulate a chest with a bronchial tumour. It will be put through the normal planning process and the measured doses compared with the treatment plan.
7. CONCLUSION
The modest population o f New Zealand and the comprehensive nature o f NRL allow a much greater degree o f contact and surveillance o f dosimetry practice in each

216 SMYTH
o f the radiation therapy departments than is usual in most countries. This arises from
the fact that N R L is the regulatory authority for radiation safety, issues Codes o f Safe Practice, maintains and disseminates the national primary standards o f radiation exposure, and performs safety visits and dosimetry audits.
REFERENCES
[1] NATIONAL RADIATION LABORATORY, Code of Safe Practice for the Use of Irradiating Apparatus in Medical Therapy, NRL C12, Natl Radiation Lab., Christchurch (1992).
[2] INTERNATIONAL ATOMIC ENERGY AGENCY, Absorbed Dose Determination in Photon and Electron Beams: An International Code of Practice, Technical Reports Series No. 277, IAEA, Vienna (1987).
[3] INTERNATIONAL COMMISSION ON RADIATION UNITS AND MEASUREMENTS, Dose Specification for Reporting External Beam Therapy with Photons and Electrons, ICRU Rep. 29, Bethesda, MD (1978).
[4] SVENSSON, H., IAEA, private communication, 1992.[5] INTERNATIONAL COMMISSION ON RADIATION UNITS AND MEASURE
MENTS, Measurement of Absorbed Dose in a Phantom Irradiated by a Single Beam of X or Gamma Rays, ICRU Rep. 23, Bethesda, MD (1973).
[6] WYCKOFF, H.H., ATTIX, F.H., Design of Free-air Ionization Chambers, Handbook 64, Natl Bureau of Standards, Washington, DC (1957).
[7] CHAPMAN, R.H., McEWAN, A.C., Correction Factors for the NRL Low-energy Primary X-ray Standard Chamber, Rep. NRL 1985/5, Nad Radiation Lab., Christchurch (1985).
[8] McEWAN, A.C., A Review of Correction Factors for the NRL Medium Energy Free- air Primary X-ray Standard Chamber, Rep. NRL 1981/3, Natl Radiation Lab., Christchurch (1981).
[9] McEWAN, A.C., Scattered Photon Corrections in Free-air Ionization Chambers, Rep. NRL 1981/2, Natl Radiation Lab., Christchurch (1981).
[10] McEWAN, A.C., A theoretical study of cavity chamber correction factors for photon beam absorbed dose determination, Phys. Med. Biol. 25 (1980) 39-50.
[11] McEWAN, A.C., SMYTH, V.G., A Monte Carlo Technique for Evaluation of Cavity Ionization Chamber Correction Factors, Rep. NRL 1983/7, Natl Radiation Lab., Christchurch (1983).

IAEA-SM-330/40
S T A B I L I T Y O F I O N I Z A T I O N
C H A M B E R I N S T R U M E N T S :
E X P E R I E N C E W I T H R E C A L I B R A T I O N
A N D C O N S T A N C Y T E S T I N G
H . J À R V I N E N , A . K O S U N E N , E . R A N T A N E N
F in n is h C e n tre fo r R a d ia tio n and N u c le a r S a fe ty ,
H e ls in k i, F in la n d
Abstract
STABILITY OF IONIZATION CHAMBER INSTRUMENTS: EXPERIENCE WITH RECALIBRATION AND CONSTANCY TESTING.
The uncertainty of dose to the patient in radiotherapy should generally not exceed about5 %. This requirement implies that the dose measurements should be accurate to only a few per cent and the accuracy of the calibration of radiotherapy dosimeters should be of the order of 1 %. The demand for high accuracy calls for intensive quality control of dosimetric equipment, to ensure the adequate stability of both standard and field instruments. The methods of quality control as recommended in international publications have been applied to a number of standard and field instruments in the operations of a Secondary Standard Dosimetry Laboratory (SSDL Helsinki). The experience of 10-15 years in the constancy testing and regular recalibration of such instruments is reported. The experience shows that the quality of ionization chamber instruments used is very good: in most cases the long term stability of the calibration factor was of the order of 0.5-1% and is close to type A (statistical) uncertainty of the calibrations. On the basis of this experience suitable frequencies and action levels for constancy testing as well as frequencies for recalibration are suggested.
1. I N T R O D U C T I O N
Se cond a ry standard in s tru m e n ts as w e ll as re fe re nc e and f ie ld in s tru m e n ts fo r
dose m ea su re m e nts in ra d io th e ra p y are g e n e ra lly com posed o f h ig h q u a lity io n iza tio n
cham bers and e le c tro m e te rs. T o m eet the genera l dem and o f a t le a st 5 % accuracy
o f dose to the p a tie n t, the u n c e rta in ty in the dose m ea su re m e nts sh o u ld n o t exceed
a fe w p e r cent, and the re q u ire d accuracy in the c a lib ra tio n o f d o s im e tric in s tru m e n ts
is o f the o rd e r o f 1 % . T h e s e re q u ire m e n ts fo r h ig h accuracy c a ll fo r in te n s iv e q u a lity
c o n tro l p ro c e d ure s to e n su re the s ta b ility o f re sp o nse o f the in s tru m e n t and, accord
in g ly , the v a lid ity o f i t s c a lib ra tio n fa c to r. S e v e ra l re d unda nt m e tho ds o f q u a lity
c o n tro l have been p ro po sed fo r standard cham bers in in te rn a tio n a l recom m enda
t io n s [ 1 , 2 ] , e .g . constancy te s ts u s in g a ra d io a c tive te s t so u rc e , m ea surem e nts at a
f ix e d d istance in a “ С о у beam , and m ea surem e nts o f the ra tio o f c u rre n ts f ro m the
standard and the m o n ito r cham ber in X ra y beam s.
217

TAB
LE
I. IN
STR
UM
EN
TS
USE
D
IN TH
IS
ST
UD
Y
(tota
l nu
mbe
r of
instr
umen
ts in
brac
kets
)
218 JÂRVINEN et al.
9ОCO
О<ü- СU
s•о <NЧОm
CNWZ
соmCNЩZ
соNiЩ
O«n<NUz
u o
c 1 S
s J* s æ .4>
JQ О Осо со сосо со со<4-1 <*н <4-1о о ов а еD V в(А со сл>> >*> >>сл со СОед 00 60с С С'С •с •с9 9СЛ со соЛ я св4> 0> ие В 64->С с С4> 4) О1_Ui fc¡ «->W9 9 9о О Ос С со о О'ел 'Я *33'о о О0> v Vь* (м V*Oí Си си
Or-CN<3"S6Ç/5O*o
üuЩZ
сл»—1 v£SC Г) in»о »о «nГЧ cn csШ Ш ШZ Z Z
o r-CN OJШ tü Z Z
_* esJ S o ÛO H
eo
2eu
s£
0 4)
- H й a«jO c«c es
1 i « X !o o»2 fe
ooce’H*
!*«
- C
.SP « ■° §
В a Ь Я « U■S- E -SS i >,1 § ?¿3 JE3 G Ou o 4>
Chec
k so
urce
of
Sr-9
0 in
all
case
s.
Cons
truct
ed
by ST
UK
.

IAEA-SM-330/40 219
A standard d o s im e try la b o ra to ry w a s e sta b lishe d a t the F in n is h C e n tre fo r
R a d ia tio n and N u c le a r S a fe ty ( S T U K ) in the 1 9 7 0 s (the H e ls in k i Se cond a ry S ta nd a rd
D o s im e try La b o ra to ry jo in e d th e I A E A / W H O N e tw o rk o f S S D L s in 1 9 7 7 ) . S in c e
th e n th e constancy o f th e the ra p y le v e l secondary sta nd a rd s ( Ta b le I ) has been tested
b y the recom m ended m e tho d s. T h e standard cham bers have been rec a lib ra te d tw ic e
at the B u re a u in te rn a tio n a l des p o id s e t m e su re s ( B IP M ) sinc e th e f i r s t c a lib ra tio n
at the N a tio n a l P h y s ic a l L a b o ra to ry ( N P L ) in th e U n ite d K in g d o m . A t the sam e tim e ,
a ll ra d io th e ra p y d o s im e te rs ( f ie ld in s tru m e n ts ) used in F in la n d ( T a b le I ) have been
ca lib ra ted re g u la rly b y th e S S D L , m a in ly at tw o ye a r in te rv a ls , as has been the
rec o m m e nd atio n b y the S S D L .
E x p e rie n c e w ith th e re g u la r re c a lib ra tio n and constancy te s tin g o f standard and
f ie ld in s tru m e n ts is re p o rte d in th is paper. E x a m p le s o f the o b se rv a tio n s and the
re s u lt in g a c tio ns are g iv e n . C o n c lu s io n s o n the q u a lity o f in s tru m e n ts are d ra w n ,
in c lu d in g p ro po se d fre q u e n c ie s and ac tion le v e ls fo r the re c a lib ra tio n s and constancy
te s ts .
2 . M A T E R I A L S A N D M E T H O D S
2.1. Instruments
T h e secondary standard cha m b ers, the ca lib ra ted f ie ld in s tru m e n ts and the
check so u rc e s used fo r constancy te s tin g are g iv e n in T a b le I . T h e p ro te c tio n le v e l
standard is inc lude d fo r c o m p a riso n . O n ly th o se f ie ld in s tru m e n ts a re inc lud e d w h ic h
have been ca lib ra ted a t le a st tw ic e at the S S D L and w h ic h have n o t been re p a ire d
betw een c a lib ra tio n s . T h e to ta l n u m b e r o f d if fe re n t f ie ld in s tru m e n ts ca lib ra ted is
so m e w ha t h ig h e r, in c lu d in g n e w ly purchased in s tru m e n ts and a fe w in s tru m e n ts
w h ic h have und e rgo ne s ig n if ic a n t re p a ir betw een c a lib ra tio n s.
T h e io n iza t io n c u rre n t f ro m the cham ber in each case — w h e th e r in the con
stancy te s t o f a standard o r the c a lib ra tio n o f a f ie ld in s tru m e n t — w a s m easured b y
th e p re c is io n c u rre n t m e a su rin g sy ste m o f the S S D L . T h i s is a c o m p u te rize d sy ste m
o f c u rre n t in te g ra tio n c o n s is tin g o f a K e ith le y 6 4 2 o r 6 1 7 e le c tro m e te r and G enra d
(G e n e ra l R a d io C o m p any) feedback capac ito rs. F o r the f ie ld in s tru m e n ts , the
c a lib ra tio n and th e constancy te s tin g w e re a lso c a rrie d o u t w ith the m e a su rin g assem
b ly b e lo ng ing to the p a rtic u la r in s tru m e n t.
2.2. Constancy tests
T h re e re d und a nt m e tho ds fo r constancy te s tin g o f the secondary sta nd a rd s have
been applied :
(1 ) R e g u la r m ea su re m e nts w ith a ^ S r check so u rc e in a special device o r j ig
e n su rin g h ig h ly re p ro d u c ib le g e o m e try . T h e fre q u e n c y o f te s tin g has m a in ly

220 JÂRVINEN et al.
been once a w e e k fo r the ra py le v e l standards and (g ive n fo r c o m p a riso n) once
a m o n th fo r the p ro te c tio n le v e l standard . T h e s e fre q ue nc ie s w e re chosen,
ra th e r than p e rfo rm in g the te s t in connection w ith each c a lib ra tio n , in o rd e r
to reduce the w o rk lo a d w h e n the sta nd a rd s w e re applied se ve ra l t im e s a w e e k
(o r a m o n th ).
(2 ) M e a su re m e n ts o f a ir ke rm a ra te in a “ С о y beam at a fix e d d istance fro m the
source ( fo r the ra py le v e l th im b le cham bers).
(3 ) M e a su re m e n ts o f the ra tio o f io n iza tio n c u rre n ts f ro m the standard and the
X ra y m o n ito r cham ber at a fix e d d istance fro m the so u rc e a t selected X ra y
q u a lit ie s ( fo r the ra p y le v e l sta nd a rd s, see T a b le П ) . X ra y q u a litie s used fo r
the c a lib ra tio n o f io n iza tio n cham bers fo r the m ea surem e nts o f d ia g nostic
X ra y e q u ip m e nt w e re chosen because these w e re the q u a lit ie s m o s t fre q u e n tly
used in X ra y c a lib ra tio n s.
T h e m ea surem e nts in m e tho ds (2 ) and (3 ) a re n o t separate (e x tra ) m ea sure
m e n ts , b u t a re c a rrie d o u t in connection w ith each c a lib ra tio n o f f ie ld cham bers at
these q u a lit ie s , be ing a p a rt o f the n o rm a l c a lib ra tio n p ro ced ure . M e th o d (3 ) w a s n o t
adopted as a q u a lity c o n tro l p ro cedure u n t i l v e ry re c e n tly , and m o s t o f the re s u lts
p resented have been calculated re tro sp e c tiv e ly f ro m the re c o rd s. F u r th e r d e ta ils o f
the ra d ia tio n q u a lit ie s and o th e r c o n d itio n s are g ive n in T a b le П .
T A B L E П . D E T A I L S O F T H E C O N S T A N C Y T E S T S F O R M E T H O D S (2 )
A N D (3 ) A N D O F T H E C A L I B R A T I O N S
Constancy tests Calibrations
Method (2): Co-60 y beam
Method (3): X ray beam
Distance from source 1 m 1 or 1.2 m 1 m
Field size 10 cm x 10 cm Dia. 10 cm 10 cm x 10 cm
Half-life for decay correction 5.27 years
Monitor chamber 30-363 PTW transmission chamber
Standards NE 2561 NE 2561 NE 2536/3 NE 2561 NE 2536/3
X ray qualities: constant potential, mean energy
75 kV, 30 keV 16 kV, 10 keV 220 kV, 125 keV 50 kV, 25 keV
IAEA-SM-330/40 221
T h e constancy te stin g o f f ie ld cham bers (a t h o sp ita ls ) betw een c a lib ra tio n s has
been c a rrie d o u t b y u s in g the check source su p p lie d w ith the in s tru m e n t ( T a b le I ) .
F o r th is te s tin g o n ly the f ie ld cham bers used b y the S S D L fo r re g u la r d o s im e try
a u d its at h o sp ita ls have been inc lude d.
T h e constancy te s ts a t the S S D L have been c a rrie d o u t in p rin c ip le w ith
m a x im u m care, fo r exam ple by ta k in g due c o n s id e ra tio n o f the s ta b iliza tio n o f the
te m p e ra tu re and ca lcu la ting the re s u lt f ro m a n u m b e r o f repeated m ea su re m e nts. T h e
constancy te s ts o f f ie ld in s tru m e n ts a t the h o sp ita ls w e re c a rrie d o u t in le s s c o n tro lle d
c o n d itio n s , and so m e tim e s w ith in a s h o r t p e rio d a fte r a fe w h o u rs o f tra n s p o rt in
ra th e r d if fe re n t e n v iro n m e n ta l c o n d itio n s.
2 .3 . C a lib ra t io n s
T h e c a lib ra tio n s o f f ie ld cham bers fo r p h o to n beam m e a su re m e nts, c a rrie d o u t
in ^ C o 7 o r X ra y beam s, w e re p e rfo rm e d fre e in a ir b y the su b s t itu t io n m ethod.
In a ^ C o 7 beam the cham ber w a s p ro v id e d w ith a b u ild u p cap. T h e c a lib ra tio n s
o f p a ra lle l p la te cham bers fo r e le c tro n beam m ea su re m e nts w e re c a rrie d o u t in a
^ C o 7 beam at a depth o f 4 m m in a P e rsp e x p ha n to m , accord ing to the ‘ second’
m etho d p ro po sed b y the N o rd ic A sso c ia tio n o f C lin ic a l P h y s ic s ( N A C P ) [3 ] . T h e
p h y sic a l p ro b le m s o f the la tte r type o f c a lib ra tio n s are d isc usse d in a no the r paper at
th is sy m p o s iu m [4 ] . F u r th e r d e ta ils o f c a lib ra tio n s are g iv e n in T a b le П .
3 . R E S U L T S A N D D I S C U S S I O N
3 .1 . C o n s ta n c y te s ts
T h e lo n g te rm re s u lts o f check source m ea su re m e nts fo r the standards are
sh o w n in F ig . 1 and T a b le Ш . T h e re s u lts in F ig . 1 have been n o rm a lize d to re fe r
ence va lu e s obta ined d u rin g the la te st c a lib ra tio n b y the P r im a ry S ta nd a rd D o s im e try
La b o ra to ry ( P S D L ) (c f. T a b le I V ) . A fe w re s u lts w ith e v id e n t la rg e m is ta k e s w e re
d isre g a rd e d in ca lcu la ting the a nnua l m ean d e v ia tio n s. T h e ‘a ction le v e ls ’ used by
th e S S D L are a lso g iv e n in the f ig u re . A sam ple o f the o r ig in a l (unc orrec te d) data
fo r one o f the sta nd a rd s is sh o w n in F ig . 2 .
T h e re s u lts o f a ir ke rm a m ea su re m e nts in a ^ C o y beam are sh o w n in F ig . 3 .
T h e re s u lts have been n o rm a lize d to the re fe re nc e va lue obta ined a fte r the la te st
c a lib ra tio n o f th e secondary standard b y the P S D L . T h e re s u lts o f standard cham ber
to m o n ito r cham ber c u rre n t ra t io s at X ra y beam s are sh o w n in F ig . 4 . T h e re s u lts
have been n o rm a lize d to the f i r s t m ea su re m e nts in 1 9 8 1 . S ta tis t ic a l data o n the check
so u rc e m ea su re m e nts w ith the f ie ld cham bers are g iv e n in T a b le Ш .

222 JÀRVINEN et al.
YEAR
FIG. 1. Results of check source measurements for the secondary standard chambers: annual mean deviations from the reference value.
FIG. 2. Results of check source measurements for one standard chamber (NE 2561-062): uncorrected weekly data.

TAB
LE
Ш.
STA
TIS
TIC
AL
DA
TA
FRO
M
CH
ECK
SO
UR
CE
ME
AS
UR
EM
EN
TS
IAEA-SM-330/40 223
<4OnOn
©ONON
*3сосо>со
U
X
I
D*-*Л (Л О, О)
X) ^ Ё
"3 -всЗ « Û-
w
1 1 л 2** -S
£Os
СМÍN NOо
2тз(Сч>
24>Йн
со
иCd (Агг *- Си о
- , Æ 00о
40cj
ci
свcu
>»boиосоJSM)s
a
H
<r\C4 O n
O
c iONОч
00O s
hJQсосл
i■s
1sCO
«лm(NШZ
CJWz
S
m
rj-c -
wS
o
o00m
vo*TiC4ШZ
O n
© S
Is с ота
<u
5 £о’«-»2
ос4>4>-о
осuтэ00 *> и4) у—ч g (xu -4•ол
сÜ
0>-оviй
а*W 3g a в
яfi
сÇ? S
О9 в oзС/5 <4-1
о 2 i •а>cds i
73>
4)X)˧
1
Mea
n va
lue
from
the
an
nual
st
anda
rd
de
via
tion
s.

224 JÂRVINEN et al.
1.020 • -
1.015 -J*
1.010ш к á* 1005 <2 tcШ^ 1.000 < ш Й^ 0.995 Шte.
0.990
0.985 • -
0.980-l---------------\---------------1--------------- *---------------1--------------\--------------- 1---------------- \-------------*---------------H84 85 86 87 88 89 90 91 92 93
YEAR
FIG. 3. Results of constancy tests, method (2): relative air kerma rate at 60Co beam (NE 2561).
3.2. Calibrations
T h e changes o f th e a ir k e rm a c a lib ra tio n fa c to r o f th e secondary sta nd a rd s at
the c a lib ra tio n s at the P S D L are sh o w n in T a b le I V . T h e changes o f the a ir ke rm a
c a lib ra tio n fa c to r o f f ie ld cham bers a t the c a lib ra tio n s at the S S D L are sh o w n in
F ig . 5 .
3.3. Discussion
I t can be seen f ro m F ig s 1 -3 and f ro m T a b le s i n and I V th a t the s ta b ility o f
the th im b le standard cham ber ( N E 2 5 6 1 ) is v e ry good. T h e re s u lts o f check source
m e a su re m e nts as w e ll as o f th e m ea surem e nts a t ®°Co 7 ra d ia tio n re m a in w e ll
w ith in the applied ac tion le v e l o f 0 .5 % . T h e o b se rved changes o f the c a lib ra tio n fac
to r ( T a b le I V ) can be p a rtly exp la ined b y the d iffe re n c e s o f p r im a ry standards
(betw een N P L and B I P M ) and b y the change o f the c a lc u la tio n p a ra m e te rs, so th a t
th e actual change o f the s e n s it iv ity o f the standard re m a in s le s s tha n 0 .5 % .
A s w o u ld be expected, the s ta b ility o f the p a ra lle l p la te standard cham ber
( N E 2 5 3 6 / 3 ) i s n o t as good as th a t o f the th im b le cham ber, a lth o u g h the s ta b ility is
s t i l l v e ry good: the change o f s e n s it iv ity i s le s s tha n 1 .5 % in 15 y e a rs. R e c a lib ra tio n

RE
LATI
VE
RA
TIO
Of
CU
RR
EN
TS
R
ELA
TIV
E
RATI
O
OF
CU
RR
EN
TS
IAEA-SM-330/40 225
1980
(a)
□ 16 kV I jO m
о 16 kV 1 2 m
■ 50 kV 1Д m
♦ 50 kV 1 2 m
о
г , 9 ♦
0
-n ^ .
□ ^ «• ■ ;
%■
* ♦ oa ♦
°a °t *
1986
YE AR
-nSr*-
o 75 kV 1.0 m
« 75 kV 1Z m
■ 220 kV 1 j0m
° ° ° ¿ a a ° ° о a
(b)
FIG. 4. Results of constancy tests, method (3): relative ratio of currents from the standard chamber and the monitor chamber at X ray beams, (a) Standard/monitor NE 2536/3-R17787;(b) standard/monitor NE 2561-062.

RE
LATI
VE
AI
R K
ER
MA
CA
LIB
RA
TIO
N
FAC
TOR
R
ELA
TIV
E
AIR
KE
RM
A C
ALI
BR
AT
ION
F
AC
TO
R
226 JÂRVINEN et al.
Type A uncertainty o f the cerebration factor
1980
(a)
Type A uncertainty o f the
caBbratkm factor
0.990 «Jû PTW M23331 75 kV x PTWM23331 280 kV o PTWM23331 75 kV * PTW M23331 280 kV
0.985 '* PTW W23342 30 kV ♦ PTW W23342 70 kV ■ PTW W 23342 30 kV • PTW W23342 70 kV
1980
(b)
FIG. 5. Results of calibrations of field instruments: relative air kerma calibration factor from successive recalibrations, (a) Thimble chambers with the precision current measuring system of the SSDL; (b) thimble chambers with measuring assemblies belonging to the particular

IAEA-SM-330/40 227
(с) year
Type A uncertainty o f the calibration factor
О 1.04 •&
aI 0.98 ■
û PTWM23331 75 kV x PTWM23331 280 KV O PTWM23331 75 kV ♦ PTW M23331 280 kV
* PTW W23342 30 kV ♦ PTW W23342 70 kV ■ PTW W23342 30 kV • P TW W23342 70 kV
1984 1985 1986
YEAR
1987 1988
instrument; (c) parallel plate chambers for electron beam measurements with the precision current measuring system of the SSDL; (d) X ray chambers with the precision current measuring system of the SSDL.

T A B L E I V . R E C A L I B R A T I O N S O F S E C O N D A R Y S T A N D A R D C H A M B E R S
228 JÁRVINEN et al.
StandardRelative air kerma calibration factor
Max. diff.1976a 1985 1986b 1993 (%)
NE 2561
- Co-60 1 1.007 0.9995 с 0.7
- 250 kV 1 1.008 с 0.8
NE 2503/3
— 10 kV 1 0.989 0.987 1.3- 50 kV 1 0.992 0.986 1.4
Calibrationlaboratory NPL BIPM BIPM BIPM
a First calibration. b Change of stopping powers. ° New standard.
in 1 9 8 5 w a s ju s t i f ie d because the a nnua l m ean d e v ia tio n reached the action le v e l o f
0 . 8 % , w h ile p a rt o f the re s u lts o f in d iv id u a l m ea su re m e nts c le a rly exceeded th is
le v e l. T h e re s u lts fo r the p ro te c tio n le v e l standard cham ber ( N E 2 5 5 1 ) approached
the ac tion le v e l o f 3 % in 1 9 8 2 (w ith re s u lts o f in d iv id u a l m ea surem e nts a lready
exceeding the le v e l) , lead ing to re p a ir a c tio ns. T h e rea son tu rn e d o u t tó be th e h ig h
vo lta g e e lectrode o f the cham ber, the sh e ll made o f ru b b e r, w h ic h w a s lo s in g i t s
s tre n g th and chang ing the v o lu m e o f the cham ber. T h e m a n u fa c tu re r replaced the
ru b b e r sh e ll w ith a r ig id carbon f ib re s h e ll, a fte r w h ic h the standard w a s reca lib ra te d
in 1 9 8 3 .
T h e re s u lts o f in d iv id u a l constancy te s ts a re so m e tim e s fu l ly o u t o f the accept
able range ( F ig . 2 ) . U s u a lly th e re is a good e xp la na tion fo r such h ig h d e v ia tio n s, e .g .
a fa u lty conne c to r, w h ic h the n sh o u ld lead to the im m ed ia te re p a ir o f the sy ste m .
A lth o u g h the m e tho ds o f constancy te s tin g are s im p le in p rin c ip le , g reat care is
needed in the w o rk , a fa c t w h ic h is il lu s tra te d b y the increased d e v ia tio n s in the case
o f “ te m p o ra ry a ss is ta n t” in F ig . 2 .
T h e re s u lts o f the X ra y beam m ea surem e nts ( F ig . 4 ) are n o t fu l ly und e rsto o d .
S in c e the re s u lts have been calculated re tro sp e c tiv e ly and w e re n o t fo llo w e d
sy ste m a tic a lly in the e a rly y e a rs , the re a so ns fo r the changes cannot be exp la ined fo r
c e rta in . A s th e in s ta b ility o f th e standard cham bers (based on the o th e r re s u lts
described above) cannot e xp la in th e o b se rved h ig h v a ria tio n , the re a so n m u s t be
re la te d to the c h a ra c te ris tic s o f the X ra y beam and the m o n ito r cham ber. P o ss ib le

IAEA-SM-330/40 229
e xp la na tio ns c ou ld be changes o f scattered ra d ia tio n in the beam (because o f d e te rio
ra tio n o f the X ra y tub e , o r changes o f the f i l te r sy ste m o r d ia p h ra g m s), changes o f
the energy re sp o nse o f the m o n ito r cham ber, o r even a change o f the exact p o s it io n
o f the m o n ito r cham ber in the beam . F o r the o ld e r X ra y tube (2 2 0 k V in F ig . 4 (b ))
p a rt o f the change cou ld be a s ig n o f the d e te rio ra tio n o f the tub e . U n t i l m o re
experience is ga ined, i t w o u ld be reasonable to accept a v a ria tio n o f up to 3 - 5 %
w ith o u t fu r th e r exam in a tio n .
T h e s ta b ility o f f ie ld in s tru m e n ts inve stig a te d is a lso v e ry good ( F ig . 5 ) : the
o b se rved change o f the c a lib ra tio n fa c to r i s in genera l le s s tha n 0 .5 % fo r th im b le
cham bers ( fo r m ea su re m e nts in h ig h energy p h o to n beam s, F ig s 5 (a ), (b )) and le ss
than 1 .0 % fo r p a ra lle l p la te cham bers ( fo r m ea su re m e nts in e le c tro n beam s,
F ig . 5 (c )). T h e s ta b ility o f X ra y cham bers fo r m e a su re m e nts in c o n ve n tio n a l X ra y
beam s is a l i t t le w o rse b u t s t i l l n o t v e ry bad: the m a x im u m change o f the c a lib ra tio n
fa c to r is le s s tha n about 2 % fo r th im b le and 4 % fo r p a ra lle l p la te cham bers. T h e
m e a su rin g a sse m b lie s b e lo ng ing to the p a rtic u la r in s tru m e n t seem a lso v e ry sta b le ,
as th e re is no e sse n tia l d iffe re n c e in th e re s u lts w h e th e r the p a rt ic u la r m e a su rin g
a sse m bly o r the p re c is io n c u rre n t m e a su rin g sy ste m o f the S S D L w a s used
( F ig s 5 (a ), (b )). E x c e p t fo r th e X ra y cham bers the o b se rved v a ria tio n s are c lo se to
the e stim a ted type A (s ta tis tic a l) u n c e rta in ty o f the c a lib ra tio n fa c to r.
3.4. Suggested frequencies and action levels
B a se d o n th e above experience, th e suggested fre q u e n c y and ac tion le v e ls fo r
constancy te s tin g b y check source m ea surem e nts as w e ll as the fre q ue nc y fo r re g u la r
re c a lib ra tio n s are g iv e n in T a b le V .
T h e fre q ue nc y o f the re g u la r check source m ea su re m e nts fo r standard cham
b e rs sh o u ld be conside re d w ith resp ect to the fre q ue nc y o f c a lib ra tio n s and o th e r con
stancy te s tin g : fo r se ve ra l c a lib ra tio n s p e r w e e k (o r p e r m o n th ) and w h e n a lso
m e tho ds (2 ) and (3 ) are applied fo r constancy te s tin g (see above), the suggested f re
quency in T a b le V m ay be su ita b le . T h e g ive n ac tion le v e ls re p re se n t d e v ia tio n s
f ro m the re fe re nc e va lu e s, and sh o u ld in it ia te fu r th e r in v e s tig a tio n such as re p e titio n
o f the w h o le m e a su rin g sequence o r checking o f cables and c o nne c to rs. I f i t i s con
f irm e d tha t the ac tion le v e l w i l l be p e rm a nend y exceeded, a re c a lib ra tio n sh o u ld be
in it ia te d .
R e g u la r re c a lib ra tio n s re g a rd le ss o f the re s u lts o f constancy te s tin g are c o n sid
ered necessa ry because:
(1 ) T h e p o ss ib le (s m a ll) change o f the c a lib ra tio n fa c to r w h ic h is n o t suspected
w ith in the ac tion le v e l o f constancy te sts m a y be re a l and can the n be taken
in to account; o r
(2 ) T h e m etho d o f constancy te s tin g m ig h t n o t re ve a l a ll k in d s o f changes in the
cham ber (e .g . change o f energy dependence), o r the m etho d m ay g ive an

TAB
LE
V.
SU
GG
ES
TED
F
RE
QU
EN
CIE
S
AN
D
AC
TIO
N
LEV
ELS
FO
R C
ON
STA
NC
Y
TES
TS
AN
D
FR
EQ
UE
NC
IES
F
OR
RE
CA
LIB
RA
TIO
NS
230 J À R V I N E N e t a l .
0S
1 t» о x: H
слС
<U оcd ¿3 С и g
"я«иcdОн
X
£
Лн
<DJ=и
«S
со cdо>%
Со3 -S
С J - Со -g оw cd w g u 2 s -s re ° s 73ti o
cdu>*O
UcdU*35*3cd
O.3 —tO w
*9 £
>> 2 . V 4>
JC 5 ^ .2 cd +3 4> cdЬм
•S £* s
я -S4> cd
cdD>>
8 -t-.££
¿4O0)pGU
3 —» o w
cou
s «
S *
GO
GO GOE3 О O
mo
mо
cd4)
&CSOsea
gg-p
<U>JJ
G
U<
E 12 73
oC
8 Type
of
meth
od
as sp
ecifi
ed
in the
te
xt.

IAEA-SM-330/40 231
e rro n e o u s in d ic a tio n (e .g . because o f the w ro n g h a lf- l ife o f the check so u rc e
due to im p u r it ie s ) ; o r
(3 ) T h e m e tho ds o f c a lib ra tio n , in c lu d in g the c o n v e rs io n fa c to rs , m ay change
because o f n e w kno w led g e o r im p ro ve d tec hn ique s.
4 . C O N C L U S IO N S
I t can be conc luded th a t the lo n g te rm s ta b ility o f io n iza t io n cham ber in s t r u
m e n ts (cham bers and m e a su rin g a sse m b lie s o r e le c tro m e te rs) o f th e typ e s stu d ie d in
th is w o rk is v e ry good. In m o s t cases the o b se rved v a ria tio n o f the c a lib ra tio n fa c to rs
w ith in the p e rio d o f s tu d y ( 2 - 1 2 y e a rs) i s c lose to the e stim a ted s ta tis tic a l (type A )
u n c e rta in ty o r the re p ro d u c ib ility o f the c a lib ra tio n s.
O n the b a sis o f the experience gained the fre q ue nc ie s and a c tio n le v e ls fo r con
stancy te s tin g and re c a lib ra tio n s can be evaluated as sh o w n in T a b le V . I t sh o u ld be
noted , h o w e v e r, th a t the va lue s in T a b le V re fe r to p a rtic u la r typ e s o f in s tru m e n ts ,
and th e actual va lue s to be app lied w i l l depend o n th e lo c a l c o n d itio n s — m a in ly o n
the q u a lity o f w o rk and eq u ip m e nt. F o r eq u ip m ent o f a q u a lity s im ila r to th a t used
in th is s tu d y th e su g g e stio n s in T a b le V can be used as the f i r s t choice b e fo re m o re
experience is gained.
R E F E R E N C E S
[1] INTERNATIONAL ATOMIC ENERGY AGENCY, Calibration of Dose Meters Used in Radiotherapy, Technical Reports Series No. 185, IAEA, Vienna (1979).
[2] ORGANISATION INTERNATIONALE DE METROLOGIE LEGALE, Secondary Standard Dosimetry Laboratories for the Calibration of Dosimeters Used in Radiotherapy, Doc. OIML D 21, Paris (1990).
[3] NORDIC ASSOCIATION OF CLINICAL PHYSICS, Electron beams with mean energies at the phantom surface below 15 MeV, Supplement to the recommendations by the NACP (1980), Acta Radiol., Oncol. 20 (1981) 401-415.
[4] KOSUNEN, A., JÀRVINEN, H., SIPILÀ, P., IAEA-SM-330/41, these Proceedings.


IAEA-SM-330/15
P E R F O R M A N C E T E S T S F O R D O S I M E T E R S
A P P L I E D I N R A D I O T H E R A P Y
K a ib a o L I , S h ia n Z H A O ,
J in sh e n g C H E N G , Z h a o lu o Z H A O
La b o ra to ry o f In d u s tr ia l H y g ie n e ,
M in is t r y o f P u b lic H e a lth ,
B e ij in g , C h in a
Abstract
PERFORMANCE TESTS FOR DOSIMETERS APPLIED IN RADIOTHERAPY.A quality assurance programme in dose measurement in radiotherapy consists of a
number of steps, one of which is to choose a suitable instrument for precise dosimetry. Two types of dosimeter with ionization chambers developed in China were collected and tested in the Secondary Standard Dosimetry Laboratory in Beijing to determine their major characteristics, including photon energy response, long term stability and chamber assembly leakage. Dosimeters of type NE 2570 were also included in the tests for comparison. The results indicated that some aspects of performance should be improved for domestic dosimeters.
1. I N T R O D U C T I O N
T h e d o s im e te rs used in ra d io th e ra p y p la y an e sse n tia l p a rt in a ch iev ing the
re q u ire d accuracy in dose m e a su re m e nts. In the p a st fe w y e a rs , d if fe re n t typ e s o f
d o sim e te r have been developed in C h in a and these are c u rre n d y em ployed in dose
m ea su re m e nts in ra d io th e ra p y . T h e re fo re , i t is im p o rta n t tha t th e ir p e rfo rm a nc e be
te ste d to in it ia te a q u a lity assurance p ro g ra m m e in ra d io th e ra p y in o u r c o u n try . In
the w o rk desc ribed h e re , som e p e rfo rm a n c e te s ts fo r f ie ld c lass d o s im e te rs w e re
conducted in the Se cond a ry S ta n d a rd D o s im e try L a b o ra to ry in B e ij in g . A to ta l o f
13 d om estic d o s im e te rs o f typ e s N Y L and R T - 1 0 0 w ith c y lin d ric a l cham bers
( th im b le type) w e re collected . S o m e c h a ra c te ris tic s o f the io n iza tio n cham bers are
l is te d in T a b le I . A t the sam e tim e , 5 d o s im e te rs o f type N E 2 5 7 0 w e re inc lude d fo r
c o m p a riso n . S in c e th e re is no re la ted n a tio na l standard o r docum ent ava ilab le fo r th is
k in d o f d o s im e te r a t p re se n t in C h in a , the d o sim e te rs w e re teste d accord ing to the
p ro c e d ure s and re q u ire m e n ts o f P u b lic a tio n 7 3 1 o f the In te rn a tio n a l E le c tro te c h n ic a l
C o m m iss io n ( I E C ) [1 ] .
233

234 LI et al.
F o r the m ea surem e nts o f io n iza tio n cham ber energy re sp o n se , therapy le ve l
q u a lit ie s o f X ra y s generated b y a P h il ip s M G - 3 2 4 ge ne ra to r w e re used ; these are
l is te d in T a b le П . A secondary standard d o s im e te r o f type N E 2 5 7 0 ca lib ra ted at the
N a tio n a l In s t itu te o f M e tro lo g y in B e ij in g w a s em plo yed . T h i s w a s a lso traced to the
In te rn a tio n a l A to m ic E n e rg y A g e nc y ( I A E A ) standard th ro u g h c o m p a riso n s. T h e
e xp e rim e n ta l re s u lts a re g ive n in Ta b le Ш . I t can be seen th a t the l im it s o f v a ria tio n
o f cham ber energy re sp o nse o n average are ± 4 . 1 5 % fo r N Y L - 3 A cham bers,
2. P H O T O N E N E R G Y R ESPO NSE O F IO N IZ A T IO N C H A M B E R S
T A B L E I . C H A R A C T E R I S T I C S O F I O N I Z A T I O N C H A M B E R S U S E D I N
E X P E R I M E N T S
NYL-3A RT-101 NE 2571
Chamber shape Cylindrical Cylindrical Cylindrical
Collecting volume 2 cm3 0.6 cm3 0.6 cm3
Wall material Conducting plastics Graphite Graphite
Electrode material Aluminium Aluminium Aluminium
Measuring assembly NYL RT-100 NE 2570
T A B L E П . C H A R A C T E R I S T I C S O F R E F E R E N C E X R A Y B E A M
Tubevoltage(kV)
Filter added to fixed filtration3
HVL Effectiveenergy(keV)mm Al mm Cu mm Al mm Cu
60 — — 1.90 — 28
100 1.5 — 0.165 (0.160)b 39
130 1.0 0.21 — 0.48 (0.503) 58
180 1.0 0.51 1.00 (1.00) 78
250 1.0 1.59 2.50 (2.51) 122
a The fixed filtration consists of 2.2 mm Be, 2.2 mm Al and the windows and central electrode of the transmission chamber.
b The values in brackets are those of the IAEA Dosimetry Laboratory at Seibersdorf.

IAEA-SM-330/15 235
T A B L E Ш . V A R I A T I O N O F I O N I Z A T I O N C H A M B E R E N E R Ç Y R E S P O N S E
NYL-3A RT-101 NE
Series Limits of Series Limits of Series Limits ofNo. variation No. variation No. variation
(± * ) (± * ) (± %)
0521 3.92 9021 1.12 3390 1.97
0518 4.34 9024 1.67 1054 1.22
79703 2.83 9085 1.85 1433 2.39
79711 3.76 9103 1.92 1554 3.23
79714 3.82 9205 1.65 1843 2.07
81061 4.93 Av. 1.64 Av. 2.18
82515 5.81
91025 3.75
Av. 4.15
1.02
о 1.01f-<cc
$ш 1.00
F
SΠ0.99
0.985 6 7 8 9 10 11 12 1 2 3 4 6 6 7 8 9 10 11 12
TIME (months)
• RT-100*RT-101 + NE2670+2606/3B
(1 9 9 1 ) (1 9 9 2 )__I___I___I__ I___I__ 1__ I__ I___I___I__ I___I__ I___I___I___I___I___I___i_
F IG . 1. Long term stability o f dosimeters.

236 LI et al.
± 1 . 6 4 % fo r R T - 1 0 1 cham bers and ± 2 . 1 8 % fo r N E cham bers. T h e c ha ra c te ristic
o f N Y L - 3 A cha m b ers, o n the w h o le , does n o t m eet the c o rre sp o n d in g re q u ire m e n t
o f I E C P u b lic a tio n 7 3 1 , w h ic h is ± 3 % fo r f ie ld c la ss cham bers.
3 . L O N G T E R M S T A B I L I T Y
L o n g te rm s ta b ility o f d o s im e te rs ( io n iza tio n cham ber to g e the r w ith readout
sy ste m ) w a s m easured u s in g a ^ S r stab le check so u rc e . F o r the se m ea surem e nts a
cham ber o f typ e R T - 1 0 1 w ith the readout sy ste m o f an R T - 1 0 0 w a s used , and an
N E 2 5 0 5 / 3 B cham ber w ith an N E 2 5 7 0 rea do ut sy ste m w a s em ployed as c o m p a ri
so n . T h e e xp e rim e n ta l re s u lts a re sh o w n in F ig . 1. I t can be seen th a t the re la tiv e
re sp o nse v a ria tio n s o f the tw o d o s im e te rs used a re w ith in ± 1 .0 % fo r m o re than one
y e a r, w h ic h m eets the I E C re q u ire m e n t o f ± 1 . 4 % fo r f ie ld c la ss d o s im e te rs . T h e
va lue o f 1 .4 % is the q ua dra tu re su m o f the separate l im it s o f v a ria tio n , w ith 1 % each
fo r the cham ber a sse m bly and the m e a su rin g a sse m bly .
4 . C H A M B E R A S S E M B L Y L E A K A G E
T h e d e te rm in a tio n o f cham ber assem bly leakage w a s made at the m in im u m
ra ted e xp o su re ra te o f 2 .5 8 X 1 0 "4 С - k g '1 -m in "1 u n d e r constant la b o ra to ry con
d it io n s . T h e e xp e rim e n ta l re s u lts ind icated tha t the average leakage v a ria tio n l im it s
fo r f iv e N Y L - 3 A and f iv e R T - 1 0 1 cham bers a re ± 1 . 7 % and ± 1 . 6 % re sp e c tiv e ly ,
w h ic h do n o t m eet the I E C re q u ire m e n t o f ± 1 . 4 % , w h ic h is the o v e ra ll l im i t o f
v a ria tio n re s u lt in g f ro m o u r te s t o f the w h o le in s tru m e n t. T h e m a in reason fo r th is
m ay be the u n s u ita b ili ty o f the e le c trica l cables. In c o m p a riso n , the c o rre sp o n d in g
va lue fo r N E cham bers w a s ± 0 . 2 % .
5 . D I S C U S S I O N
T h e w o rk described he re fo rm s o n ly p a rt o f the te sts to be p e rfo rm e d o n the
d o s im e te rs . I t i s conc luded th a t th e cham bers o f typ e N Y L - 3 A sh o u ld be im p ro v e d
w ith reg ard to th e ir p h o to n energy resp onse . A tte n t io n sh o u ld be paid to assem bly
leakage o f b o th N Y L - 3 A and R T - 1 0 1 cham bers. In a d d itio n , the N Y L - 3 A cham ber,
w ith a se n s it iv e v o lu m e o f 2 c m 3, i s u n su ita b le fo r dose m ea surem e nt in ra d io th e r
apy. F u r th e r w o rk o n the do m e stic io n iza tio n cham ber is nece ssa ry , in c lu d in g the
d e te rm in a tio n o f the cham ber fa c to rs , such as km, km and p u, in o rd e r to adopt the
I A E A P ro to c o l [2 ] .

IAEA-SM-ЗЗО/15 237
R E F E R E N C E S
[1] INTERNATIONAL ELECTROTECHNICAL COMMISSION, Medical Electric Equipment — Dosimeters with Ionization Chambers as Used in Radiotherapy, IEC 731, Geneva (1982).
[2] INTERNATIONAL ATOMIC ENERGY AGENCY, Absorbed Dose Determination in Photon and Electron Beams: An International Code of Practice, Technical Reports Series No. 277, IAEA, Vienna (1987).


IAEA-SM-330/18
U N C E R T A I N T I E S A T T H E E N D P O I N T O F
T H E B A S I C D O S I M E T R Y C H A I N
D . I . T H W A I T E S
D e p a rtm e n t o f M e d ic a l P h y s ic s and M e d ic a l E n g in e e rin g
and
C lin ic a l O n c o lo g y D ire c to ra te ,
U n iv e r s i ty o f E d in b u rg h
and
L o th ia n H e a lth B o a rd ,
W e s te rn G e ne ra l H o s p ita l,
E d in b u rg h , U n ite d K in g d o m
Abstract
UNCERTAINTIES AT THE END POINT OF THE BASIC DOSIMETRY CHAIN.Different approaches to estimating uncertainties in dosimetry are considered and are
shown to support each other. Estimates are also made of the consistency of dosimetry in an optimal situation. Systematic differences between dosimetry protocols are discussed as a cause of inconsistency. Dosimetry intercomparisons up to the level of treatment beam calibration are reviewed, giving quantitative information on the consistency currently achievable in dosimetry. The information from intercomparisons and from uncertainty estimates is seen to be complementary. From the summary of intercomparison results it can be seen that there is scope for achievable improvement in dosimetry at this level, which can be realized by improvements in quality assurance and expansion of quality audit.
1 . I N T R O D U C T I O N
A c c ura c y re q u ire m e n ts in ra d io th e ra p y d o s im e try are based o n c lin ic a l data
co nc e rn ing the steepness and se p a ra tio n o f d o se -e ffe c t c u rve s fo r tu m o u r c o n tro l and
n o rm a l t is s u e c o m p lic a tio n s. C u r re n t in fo rm a tio n leads to recom m ended g enera l
to le ra nc e le v e ls o n dose d e liv e ry o f approaching 3 % , g iv e n as one re la tiv e standard
d e v ia tio n [ 1 - 3 ] . T h i s i s fo r the c u m u la tive u n c e rta in ty on d e live re d dose , i.e . the
dose rece ived b y the p a tie n t a t th e end o f the cha in c o n ta in ing a ll steps c o n tr ib u tin g
to ra d io th e ra p y d o s im e try . In o rd e r to achieve th is o v e ra ll accuracy, the re q u ire
m e n ts at each step m u s t be se t a t sm a lle r l im it s . T h e c lin ic a l d o s im e try cha in has been
ana lysed in d e ta il [4 ] and can be su m m a rize d as:
(a) T h e e sta b lish m e n t o f d o s im e try sta nd a rd s, in c lu d in g the basic p h y s ic a l data
and p ro c e d ure s in v o lv e d in th e d e te rm in a tio n o f the re q u ire d d o s im e tric quan
t i ty in the ra d ia tio n beam s to be used fo r in s tru m e n t c a lib ra tio n a t the standards
la b o ra to ry ;
239

240 THWAITES
(b) T h e c a lib ra tio n o f a lo c a l re fe rence in s tru m e n t a g a inst s ta nd a rd s and o f c lin ic a l
f ie ld in s tru m e n ts aga inst th is loca l re fe re nc e at the h o sp ita l, enab ling the d o s i
m e tric q u a n tity to be tra n s fe rre d fro m sta nd a rd s la b o ra to ry to u se r in a trace
able m a n n e r;
(c) T h e d e te rm in a tio n o f absorbed dose to w a te r in the tre a tm e n t beam in re fe rence
c o n d itio n s , fo llo w in g an accepted d o s im e try p ro to c o l and u s in g a ca lib ra ted
f ie ld in s tru m e n t (beam c a lib ra tio n );
(d) T h e a c q u is it io n o f re la tiv e d o s im e tric data in the tre a tm e n t beam , re fe renced
to beam c a lib ra tio n , to account fo r a ll c lin ic a l tre a tm e n t c o n d itio n s;
(e) T h e tre a tm e n t p la n n in g p ro c e ss, in c lu d in g p a tie n t data a c q u is it io n , dose and
v o lu m e p re sc r ip tio n , tre a tm e n t p lan c o m p uta tio n , etc. ;
( f ) T h e d e liv e ry o f the p re sc rib e d , p lanned and accepted ra d io the ra p y to the
p a tie n t u n d e r day to day c o n d itio n s th ro u g h o u t the tre a tm e n t co u rse .
L e v e ls (a )-(c ) can be v ie w e d as the ‘basic d o s im e try ’ c h a in , e sta b lish in g the
d o s im e tric q u a n tity o f c lin ic a l in te re s t at a re fe re nc e p o in t in a u s e r beam . T h u s beam
c a lib ra tio n lie s at a c rit ic a l p o in t in the o v e ra ll cha in , p ro v id in g the in te rfa c e betw een
basic and c lin ic a l d o s im e try and upon w h ic h a ll subsequent s te p s, and a ll p a tie n t
tre a tm e n ts , a re dependent.
I t is v ita l to e n su re accuracy and c onsistency o f d o s im e try at th e le v e l o f tre a tm e n t
beam c a lib ra tio n . T o th is end , in te rn a tio n a l recom m end ations are made o n c o n s is te n t
data [5 , 6 ] ; c a lib ra tio n s are traceable to p rim a ry sta nd a rd s, w h ic h are in te rcom pa red
[7 , 8 ] ; and d o s im e try p ro to c o ls recom m end standard c a lib ra tio n c o n d itio n s , p ro ce
d u re s and in s tru m e n ta tio n , as w e ll as p h ysic a l data. N e v e rth e le ss , s ig n if ic a n t u n c e r
ta in tie s re m a in , associated w ith the in p u t data and the e xp e rim e n ta l p ro ced ure s a t a ll
stages. D if fe re n c e s e x is t betw een d o s im e try p ro to c o ls . In a d d itio n , desp ite the use
o f a p a rtic u la r p ro to c o l, e r ro rs m ay occur o w in g to inexa ct in te rp re ta tio n o r
im p le m e n ta tio n o f i t s rec o m m e nd atio ns, o r to eq u ip m e nt p ro b le m s o r m is ta k e s.
C u m u la tiv e u n c e rta in tie s to any le v e l can be evaluated in tw o com plem enta ry
w a y s. T h e f i r s t is an a p r io r i e s tim a tio n , c o n s id e rin g p o te n tia l so u rc e s o f u n c e rta in ty
at e ve ry stage and a ss ig n in g reasonable va lue s based on ava ilab le data, experience
o r ju d g e m e n t. S e c o n d ly , d o s im e try in te rc o m p a riso n s can e x p e rim e n ta lly q u a n tify
the achievable to ta l a p o s te r io r i (type A , ra nd o m ) u n c e rta in tie s to a p a rtic u la r le v e l
and can id e n tify som e a p r io r i (type B , syste m a tic ) u n c e rta in tie s . N e ith e r m etho d is
idea l. A sp e c ts o f b o th m etho ds are re v ie w e d and su m m a rize d he re .
2 . U N C E R T A I N T Y E S T I M A T I O N
2 .1 . M e th o d s
A n u m b e r o f ana lyses o f th e ra d io the ra p y p ro c e ss have been m ade, to e stim ate
to ta l c u m u la tive u n c e rta in tie s [ 2 - 4 , 9 - 1 3 ] . O ne o f the m o s t deta iled w a s b y Jo ha ns

IAEA-SM-330/18 241
so n [4 ] . L o e v in g e r and L o f tu s [9 , 1] fo llo w e d tw o schem es, a m in im a l ( lo w e st
acceptable) m odel and an o p tim a l (best practice) m o d e l. M o s t o th e r estim a te s have
c onsid e re d an e sse n tia lly o p tim a l m o d e l. In any approach the c o m b ina tio n o f ra nd o m
and sy ste m a tic u n c e rta in tie s i s n o t s tra ig h tfo rw a rd . In som e cases the estim ated
m a x im u m sy ste m a tic u n c e rta in tie s have been com bined in q ua dra tu re (so m e tim e s
m u ltip lie d b y a fa c to r g re a te r than u n ity ) w ith the estim a ted ra n d o m u n c e rta in ty 9 5 %
confidence l im i t , to produce an o v e ra ll un c e rta in ty [4 , 9 ] . M o s t re c e nt approaches
have dea lt in standard d e v ia tio n s fo r rand om u n c e rta in tie s and e ffe c tive standard
d e v ia tio n s fo r sy ste m a tic u n c e rta in tie s , c o m b in ing b o th types in q ua dra tu re [1 4 , 1 5 ].
T h e e ffe c tive standard d e v ia tio n is the estim ate o f the in te rv a l expected to conta in
the ‘t ru e ’ va lue in about 7 0 % o f cases. T h i s has been obta ined in a n u m b e r o f w a y s ,
b u t a re la tiv e ly s tra ig h tfo rw a rd m etho d is to d iv id e estim ated m a x im u m system a tic
u n c e rta in tie s b y 2 [2 ] .
2.2. Estimated uncertainty in the basic dosimetry chain
F o r the basic d o s im e try cha in , the c u m u la tive u n c e rta in ty up to and in c lu d in g
tre a tm e n t beam c a lib ra tio n in re fe re nc e c o n d itio n s i s o f in te re s t. T a b le I su m m a rize s
the com bined u n c e rta in tie s estim ated b y som e o f the approaches lis te d above, w h e re
the va lue s c o rre sp o n d to one standard d e v ia tio n . T h e m a in c o n tr ib u tio n to the o v e ra ll
u n c e rta in ty at th is le v e l com es fro m in te ra c tio n c o e ffic ie n ts and in p u t p a ra m e te rs,
p a rtic u la rly tho se in v o lv e d in p ro ced ure s c a rrie d o u t b y the u se r [3 , 1 6 ]. T h e
T A B L E I . E S T I M A T E D C O M B I N E D U N C E R T A I N T I E S ( I f f ) , U P T O A N D
I N C L U D I N G T R E A T M E N T B E A M C A L I B R A T I O N I N R E F E R E N C E C O N D I
T I O N S F O R M E G A V O L T A G E P H O T O N S A N D E L E C T R O N S
Reference Co-60
Uncertainty (%)
X rays Electrons
Loevinger and Loftus (1977) [9] (opt.) 1.2(min.) 2.2
Johansson (1982) [4] 2.1 2.5 2.8
IAEA (1987) [16] 2.7 3.4 3.8
Brahme (1988) [3] 2.5 3.3 3.7
Andreo (1990) [17] 1.6 2.5 2.8

242 THw A rres
T A B L E П . A L T E R N A T I V E A P P R O A C H E S T O E S T I M A T I N G S O M E C O N
T R I B U T I N G U N C E R T A I N T I E S (1er) I N T H E B A S I C D O S I M E T R Y C H A IN
Quantity or procedure Co-60
Uncertainty (%)
X rays Electrons
1. Field instrument measurement in therapy beam (as used in Refs [3, 16, 17])
0.5 1.0 1.0
2. Response of monitor of therapy unit [3, 16, 17]
0.5 1.5 1.5
3. Field instrument measurement (alternative — see text)
0.8 0.9 1.0
4. Short term monitor stability 0.2 0.5 0.75
5. Monitor, from output measurement representative values
0.3 0.75 1.25
6. Monitor, as line 5, upper limit (representative values)
0.5 1.0 1.5
7. Step 1 [17], chamber calibration 1 1 1
8. User factors [17]
Combined uncertainty in basic dosimetry chain
1.1 1.4 1.9
9. Using line 4 for monitor 1.7 2.0 2.510. Using line 5 for monitor 1.7 2.1 2.711. Using line 6 for monitor 1.8 2.2 2.8
L o e v in g e r and L o f t u s o p tim a l s itu a tio n va lue s [9 ] a re sm a lle r than m o re recent e s ti
m ates la rg e ly o w in g to the changed in fo rm a tio n o n the u n c e rta in tie s in the re le va n t
m a ss sto p p in g p o w e r ra t io s . A n d re o [1 7 ] has re c e n tly analysed the la te st in fo rm a tio n
o n these in d e ta il and has conc luded th a t a s ig n if ic a n t decrease is w a rra n te d in the
com bined u n c e rta in ty , as sh o w n in the la s t l in e o f T a b le I .
2.3. Alternative approaches
T h e la s t th re e estim a te s in T a b le I have used com m on fig u re s fo r the u n c e rta in
t ie s associated w ith f ie ld in s tru m e n t m ea surem e nts and w ith the the ra p y u n it m o n ito r
( T a b le П ) . O th e r approaches are p o ss ib le . F o r exam ple , a n a ly s is o f the v a ria tio n s

IAEA-SM-330/18 243
in d o s im e te r re sp o n se th ro u g h o u t an in te rc o m p a riso n e xe rc ise [1 8 ] ind icated a
standard d e v ia tio n o f 0 .2 5 % . T h i s can be com bined w ith sy ste m a tic u n c e rta in tie s in
in s tru m e n t n o n - lin e a rity and in re c o m b ina tio n and p o la r ity c o rre c tio n s and w ith
ra n d o m u n c e rta in tie s in set-up p a ra m e te rs. U s in g e stim a te s fo r these w h ic h are
e sse n tia lly in agreem ent w ith th o se g iv e n b y Jo ha nsso n [4 ] p ro duc es th e f ig u re s in
T a b le П ( l in e 3 ) . T h e s e ra th e r increase the estim a tes (c f. l in e 1) fo r ^ C o m ea sure
m e n ts , b u t su p p o rt tho se fo r accelerator m ea su re m e nts. F o r the the ra p y u n it m o n ito r,
i t is a rguab le [4 ] th a t the s h o r t te rm re p ro d u c ib ility ( T a b le П , lin e 4 ) is the appro
p ria te f ig u re , w ith the lo n g e r te rm s ta b ility e n te rin g la te r a t dose d e liv e ry . A l te r
n a tiv e ly f ig u re s f ro m ana lyses o f ro u tin e o u tp u t checks could be use d , w ith the
e xp e rim e n ta l u n c e rta in tie s in th e ir m ea surem e nt re m o ve d . P u b lish e d fig u re s are
availab le (e .g . R e fs [4 , 1 9 , 2 0 ]) . H o w e v e r, each centre has access to data o f th is
typ e . U s in g p u b lish e d fig u re s and data fo r E d in b u rg h m achine s (a v a ry in g betw een
0 .5 % fo r 6 M V p h o to n s and 1 .5 % fo r the e le c tro ns o n one o ld e r m achine) g ive s the
f ig u re s in lin e 5 as reasonab le re p re se n ta tive va lu e s and the f ig u re s in l in e 6 as
re p re se n ta tive up p e r l im it s . T h e s e can be com bined w ith the u n c e rta in tie s fro m
R e f . [1 7 ] in cham ber c a lib ra tio n (S te p 1 in R e f . [1 7 ] , le v e ls (a), (b) above) and in
u se r fa c to rs , rep roduce d in l in e s 7 and 8 . C o m b in in g lin e s 3 , 7 and 8 in q ua dra tu re
w ith lin e 4 , 5 o r 6 g ive s the c u m u la tive e stim a te s in lin e s 9 , 10 and 11 re sp e c tiv e ly .
Th e s e are n o t s ig n if ic a n tly d iffe re n t to th o se fro m R e f . [1 7 ] . R a th e r they il lu s t ra te
tw o p o in ts : the d iffe re n t approaches su p p o rt each o th e r; and the com bined u n c e rta in
t ie s are n o t changed s ig n if ic a n tly b y changing the va lue s o f c o n tr ib u tin g f ig u re s ,
u n le ss they in v o lv e som e o f the la rg e st com ponents.
2 .4 . N P L N „ c a lib ra t io n a n d I P S M /Vw P ro to c o l
T h e la te r estim a te s in T a b le I and those in T a b le П are based on u t i l iz in g a
m o d e m N D ( = N gas) p ro to c o l, in c o rp o ra tin g c o n s is te n t recom m ended p hysic a l data
(e .g . R e f . [ 1 6 ] ) . R e c e n tly the U n ite d K in g d o m N a tio n a l P h y s ic a l La b o ra to ry ( N P L )
has in tro d u c e d a d ire c t absorbed dose to w a te r (V w) c a lib ra tio n se rv ic e [2 1 ] fo r
m egavoltage p h o to n s and the In s t itu te o f P h y s ic a l Sc ience s in M e d ic in e ( I P S M ) [2 2 ]
has p ro v id e d an associated d o s im e try P ro to c o l, w h ic h c la im s sm a lle r u n c e rta in tie s
tha n the a ir ke rm a based approach. T h i s can be checked b y c o n s id e rin g the c um ula
t iv e u n c e rta in tie s in the basic d o s im e try cha in fo llo w in g th is approach. T a b le i n
rep roduce s the com ponent u n c e rta in tie s o f the N w c a lib ra tio n , as quoted b y the N P L
[2 3 , 2 2 ] , g iv in g a com bined u n c e rta in ty o f 0 .7 % ( la ) . E s t im a te d u n c e rta in tie s in the
t ra n s fe r o f th is c a lib ra tio n to a f ie ld in s tru m e n t are th e n lis te d a long w ith th e f ig u re s
f ro m T a b le П fo r u n c e rta in tie s in f ie ld in s tru m e n t m ea surem e nts and in the m o n ito r.
T h e com bined u n c e rta in tie s in the d e te rm in a tio n o f absorbed dose to w a te r in re fe r
ence c o n d itio n s are obta ined as 1 .3 % and 1 .6 % in ^ C o and m egavoltage X ra y
beam s, re sp e c tiv e ly , w h e n the N w c a lib ra tio n and P ro to c o l a re use d . T h e s e can be

244 THWAITES
T A B L E Ш . C O M B I N E D U N C E R T A I N T I E S ( I f f ) I N T H E B A S I C D O S I M E T R Y
C H A I N U S I N G T H E N P L N w C A L I B R A T I O N A N D A S S O C I A T E D P R O T O C O L
[21, 22]
Uncertainty (%)
Quantity or procedure Co-60 X rays
Absorbed dose to water (Nv) calibration of local reference [23] 0.7 0.7
Calibration of field instrument 0.6 0.6
Field instrument measurement (Table II, line 3) 0.8 0.9
Response of therapy unit monitor (Table II, line 6) 0.5 1.0
Combined uncertainty 1.3 1.6
com pared w ith 1 .8 % and 2 .2 % ( T a b le П , lin e 11) w h e n an a ir k e rm a c a lib ra tio n and
an N d p ro to c o l a re use d . T h u s the 7VW m ethod is the m o re accurate b y a ro und 0 .5 %
o v e ra ll (a t the la le v e l) o n the b a s is o f these fig u re s .
3 . C O N S I S T E N C Y I N R A D I O T H E R A P Y D O S I M E T R Y
In ra d io th e ra p y , w h i ls t a b so lu te accuracy is im p o rta n t, i t can be argued tha t
c o nsiste nc y (re p ro d u c ib ility ) in o v e ra ll c lin ic a l d o s im e try is the m o s t v ita l aspect o f
accuracy. C o n sis te n c y is necessary fo r c o n fid e n t t ra n s fe r o f c lin ic a l experience fro m
one centre to a n o th e r, o r fo r c o m p a riso n o f outcom es betw een c e n tre s, o r betw een
techn ique s o r d if fe re n t tim e p e rio d s w ith in a centre . T h u s i t i s c ru c ia l tha t the con
sis te n c y o f the basic d o s im e try stages is tra n sp a re n t and tha t any changes in sta n
d a rd s, in p h y s ic a l data o r in p ro to c o ls are c le a rly docum ented and are associated w ith
a d e fin ite date fo r each change. T h i s has im p lic a tio n s fo r c o m m un ic a tio n betw een
standards la b o ra to rie s and u se rs and betw een c lin ic a l p h y s ic is ts and th e ir ra d io
the ra p y co lleagues. A l l changes m u s t be c a re fu lly q u a n tifie d and v e r ifie d b e fo re
c lin ic a l im p le m e n ta tio n .
T h e estim a te s desc ribed above are fo r o v e ra ll abso lu te accuracy. H o w e v e r,
i f d if fe re n t p ro to c o ls u t i l iz e the sam e c o n s is te n t se t o f p h ysic a l data, the n the to ta l
sy ste m a tic u n c e rta in tie s o n these data do n o t c o n trib u te to d iffe re n c e s in d o s im e try

IA E A -S M - 3 3 0 /1 8 245
u s in g these p ro to c o ls . D isc re p a n c ie s m ay s t i l l re m a in o w in g to d iffe re n c e s in
approach, w h ic h m ig h t in p a rt in c lu d e d iffe re n t se le c tio n o f data. I f a g ro u p o f ra d io
the ra p y c entres are in v o lv e d in in te rc o m p a riso n o r t ra n s fe r o f c lin ic a l in fo rm a tio n ,
b u t they a ll u se the sam e c a lib ra tio n la b o ra to ry and p ro to c o l, th e n m a ny o f the
sy ste m a tic u n c e rta in tie s are re m o ve d f ro m c o n s id e ra tio n s o f d o s im e tric c o n s iste n c y .
I f a s in g le centre and a s in g le ra d ia tio n m o d a lity and q u a lity are o f in te re s t, o n ly the
ra n d o m u n c e rta in tie s associated w ith d o s im e try w i l l be o f im p o rta nc e in th is co nte xt.
I f o th e r q u a lit ie s a re in v o lv e d , som e o f the syste m a tic u n c e rta in tie s are re in tro d u c e d .
I f o th e r m o d a lit ie s a re in v o lv e d , a ll the system a tic u n c e rta in tie s in u se r q u a n titie s and
p ro c e d ure s can again c o n trib u te to the in c o n siste n c y in d o s im e try .
T A B L E I V . E S T I M A T E D C O N S I S T E N C Y I N T H E B A S I C D O S I M E T R Y
C H A I N B A S E D O N A N U N C E R T A I N T Y (1er) A N A L Y S I S
Uncertainty (%)
Quantity or procedure Co-60 X rays Electrons
(a) Optimal situation of centres using a single standards laboratory and a single unambiguous dosimetry protocol
Step 1, common standards laboratory 0.7 0.7 0.7
Field instrument measurement(Table П, line 3) 0.8 0.9 1.0
Therapy unit monitor:— short term (Table П, line 4) 0.2 0.5 0.75— long term (Table П, line 6) 0.5 1.0 1.5
Combined consistency estimate— short term (monitor) 1.1 1.2 1.4— long term (monitor) 1.2 1.5 1.9
(b) Consistency which might be expected to be observed in an optimal dosimetryintercomparison (ion chamber based) in the same group of centres
Consistency estimate(Table IV(a), see text) 1.1 1.2 1.4
Dosimetry intercomparisonmeasurement [18] 0.5 0.5 0.75
Therapy unit monitor (see text) 0.5 1.0 1.5
Combined estimate of expectedmeasured consistency 1.3 1.6 2.2

246 THWAITES
S u c h c o n s id e ra tio n s a lso ra ise the p ro b le m o f the b lu r r in g betw een rand o m and
sy ste m a tic u n c e rta in tie s , w h ic h is p a rtly the rea son fo r the in tro d u c tio n o f the a lte r
na tive te rm in o lo g y . S y ste m a tic u n c e rta in tie s in p a ra m ete rs in v o lv e d in a g ive n se t
o f m ea surem e nts in a p a rtic u la r centre m ay be e ffe c tiv e ly ra n d o m ly d is tr ib u te d
ac ro ss d iffe re n t c e n tre s (o r even ac ro ss d iffe re n t tre a tm e n t u n its , o r th ro u g h tim e ,
in the one ce n tre ). F o r exam ple , th is m ay a ffe c t u n c e rta in tie s in f ie ld in s tru m e n t
c a lib ra tio n , in a range o f fa c to rs in v o lv e d in p ro to c o l im p le m e n ta tio n , in tem pera
tu re , in p re ssu re , and in set-up p a ra m ete rs fo r tre a tm e n t beam m ea surem e nts.
In v ie w o f th is , an a d d itio na l u n c e rta in ty w h ic h m ay be estim ated is th a t re fle c t
in g the consiste nc y betw een ce n tre s. T h i s cou ld be evaluated fo r a n u m b e r o f p o ss i
b le s itu a tio n s . T h e s im p le s t (m o st c o n s iste n t) i s th a t fo r centres ha v in g c a lib ra tio n s
f ro m the sam e sta nd a rd s la b o ra to ry and fo llo w in g a com m on p ro to c o l w h ic h g ive s
l i t t le scope fo r a m b ig u ity in in te rp re ta tio n (e .g . R e fs [2 4 , 2 5 ] ) . In th is case an
u n c e rta in ty (c o nsiste nc y) e stim ate can o m it m any o f the sy ste m a tic u n c e rta in tie s .
T a b le I V (a) p re se n ts the f ig u re s u s in g the same va lue s fro m T a b le П fo r the f ie ld
in s tru m e n t m ea surem e nts and the sm a lle s t and la rg e st estim a tes fo r the therapy u n it
m o n ito r. T h i s can be extended, to estim ate the consiste nc y w h ic h m ig h t be
e x p e rim e n ta lly obse rved in th is g ro u p o f c entres d u rin g a d o s im e try in te rc o m
p a riso n . I f th is i s based o n a s in g le io n iza tio n cham ber m e a su rin g sy ste m and
p ha ntom be ing used w ith a sta nd a rd ize d m e a su rin g p ro ced ure (e .g . R e f . [ 1 8 ] ) , then
the u n c e rta in tie s o f the m ea surem e nts can be reduced som ew ha t com pared w ith
T a b le I I ( l in e 3 ) . T h e a p pro p ria te u n c e rta in tie s fo r the the ra py u n it m o n ito r are tho se
fo r lo n g te rm in s ta b ility ( Ta b le П , lin e 6 ) , b u t th is sug g ests th a t the f ig u re s fro m
T a b le rV (a ) c o n ta in ing the s h o r t te rm u n c e rta in tie s sh o u ld be used in c o m b ina tio n .
O n th is b a s is , T a b le IV ( b ) l is t s the c o n tr ib u tin g data and g iv e s the com bined e stim a te
fo r d o s im e try consiste nc y w h ic h m ig h t be expected to be o b se rved in an in te rc o m
p a riso n in th is o p tim a l s itu a tio n .
4 . D O S I M E T R Y I N T E R C O M P A R I S O N S
4 .1 . A im s a n d m e th o d s
D o s im e try in te rc o m p a riso n s m easure the consiste nc y achieved betw een d if fe r
en t d o s im e try sy ste m s. T h e basic approach is to com pare m e a surem e nts o f g ive n
d o s im e tric p a ra m ete rs obta ined b y d iffe re n t sy ste m s. A lte rn a tiv e ly , pa ram ete rs are
m easured independently u s in g a separate e x te rn a l sy ste m . S y ste m a tic un c e rta in tie s
th a t are com m on to b o th the m e a su rin g sy ste m and th o se u n d e r in v e s tig a tio n are n o t
re c o g n ize d . O b se rve d d e v ia tio n s p ro v id e in fo rm a tio n o n the rand o m un c e rta in tie s
in v o lv e d and on any re m a in in g syste m a tic d iffe re n c e s betw een the v a rio u s sy ste m s.
In te rc o m p a riso n typ e s and th e ir d e sig n c r ite r ia and m e tho ds have been su m m a rize d
re c e n tly b y T h w a ite s and W il l ia m s [2 6 ] .

IAEA-SM-330/18 247
T h e fu r th e r a long the d o s im e try cha in tha t an in te rc o m p a riso n is c a rrie d o u t,
the m o re c o n tr ib u tin g u n c e rta in tie s are assessed to g e th e r. F o r exam ple , d o s im e try
in te rc o m p a riso n s a t the end o f the basic d o s im e try cha in se t o u t to m ea sure absorbed
doses in each ra d io the ra p y centre in re fe rence c o n d itio n s , u s in g a standard se t o f
e q u ip m e nt and p ro c e d ure s. M e a su re m e n ts are com pared w ith lo c a lly stated doses
and o b se rved d e v ia tio n s p ro v id e in fo rm a tio n o n the c u m u la tive ra n d o m u n c e rta in tie s
at th is le v e l ( in c lu d in g tho se associated w ith the in te rc o m p a riso n ), com bined w ith
any sy ste m a tic d iffe re n c e s in d o s im e try sy ste m s used b y the c e n tre s. T h e s e inc lud e
d iffe re n c e s betw een the v a rio u s sta nd a rd s la b o ra to rie s in v o lv e d and in the tra n s fe r
o f c a lib ra tio n s , tho se betw een d o s im e try p ro to c o ls i f m o re tha n one is fo llo w e d ,
th o se in the im p le m e n ta tio n o f these p ro to c o ls b y in d iv id u a l c e n tre s, and any addi
tio n a l d e v ia tio n s due to m is ta k e s o r fo r o th e r re a so n s.
D o s im e try in te rc o m p a riso n s can be c a rrie d o u t at any le v e l in the d o s im e try
cha in , f ro m sta nd a rd s to tre a tm e n t d e liv e ry , and th e v a rio u s typ e s have re c e n tly been
re v ie w e d [2 6 ] . T h e fo llo w in g se c tio n s su m m a rize the re s u lts o f in te rc o m p a riso n s up
to the end p o in t o f the basic d o s im e try cha in fo r m egavoltage p h o to n and e le c tro n
beam s.
4.2. Intercomparisons of standards and their dissemination
P r im a ry standards la b o ra to rie s have re g u la rly com pared th e ir p ro v is io n o f
e xp o su re o r a ir ke rm a . A b r ie f h is to ric a l re v ie w o f som e d ire c t and in d ire c t c o m p a ri
so n s o f “ C o standards has been g iv e n re c e n tly [2 7 ] . A d d it io n a l in fo rm a tio n is
inc lud e d in these P ro c e e d ing s [7 , 8 , 2 8 ] . T h e c o nsiste nc y o f standards p ro v is io n is
ty p ic a lly a ro u n d 0 .3 % (1<j), w ith the o v e ra ll sp read b e ing w ith in 1 % . C o m m o n
sy ste m a tic u n c e rta in tie s are n o t ob se rve d . A s an exam ple o f the se , n e w io n cham ber
c o rre c tio n s , based o n M o n te C a rlo c a lc u la tio n s, p roduce inc rea ses o f 1 % in som e
n a tio n a l standards and a g lo b a l increase o f a ro und 0 .6 % [2 7 ] . C hanges to the U K
( N P L ) a ir ke rm a sta nd a rd s w e re re c e n tly re p o rte d [2 9 ] , due to ad op tion o f basic data
recom m ended b y the C o m ité c o n s u lta t if p o u r le s é ta lons de m e su re des rayo nne
m e n ts io n isa n ts ( C C E M R I ) [5 , 6 ] and re -e va lua tio n o f the c o rre c tio n s fo r the 2 M V
c a v ity sta nd a rd s. T h e re s u lt in g change in N K fo r 2 M V X ra y s is a decrease o f
0 .8 1 % . T h e s e changes are o u ts id e the typ ic a l u n c e rta in ty estim a te s fo r p rim a ry
sta nd a rd s [3 0 ] .
Se cond a ry sta nd a rd s la b o ra to rie s a lso re g u la rly in te rc o m p a re th e ir p e r fo r
mance to assess the c o n siste nc y o f c a lib ra tio n tra n s fe r [ 3 1 - 3 3 ] . R e p o rte d standard
d e v ia tio n s range f ro m a ro und 0 .5 % to a ro und 2 % . T h e R a d io lo g ic a l P h y s ic s C e n te r
in H o u s to n , T e x a s , U n ite d S ta te s o f A m e ric a , ha s re p o rte d re s u lts o f in te rc o m p a ri
so n s o f the c a lib ra tio n fa c to rs o f f ie ld in s tru m e n ts in a la rg e n u m b e r o f ra d io the ra p y
c entres [3 4 ] . T h e percentage o f c a lib ra tio n fa c to rs m easured to be w ith in th e ir 2 %
c r ite r io n has been above 9 0 % sinc e 1 9 8 0 . T h e standard d e v ia tio n o f re s u lts sinc e tha t
t im e is c lose to 1 % .
248 THWAITES
D o s im e try p ro to c o ls can be in c o n s is te n t o w in g to v a rio u s fa c to rs . Th e se
in c lu d e the u se o f d if fe re n t fo rm a lis m s , the in c lu s io n o r o m is s io n o f p a rtic u la r
fa c to rs , the va lu e s o f data in c o rp o ra te d , the w a y the u se r m u s t se lect tho se data, and
d iffe re n c e s in the recom m ended p ro c e d ure s. So m e e a rlie r s tu d ie s used d iffe re n t sy s
te m s and approaches to com pare p ro to c o ls , m e tho ds and d o s im e te rs betw een centres
w ith p a rtic u la r d o s im e try e xp e rtise [3 5 , 3 6 ] . M o re recent w o rk has focused o n the
d iffe re n c e s betw een p ro to c o ls . T h e s e have been assessed b y com paring the absorbed
dose to w a te r ob ta ined b y a p p ly ing the deta iled recom m end ations o f d iffe re n t
p ro to c o ls to m ea surem e nts in the same se t o f beam s w ith the sam e se t o f m e a su rin g
e q u ip m e nt [ 3 7 - 4 5 ] . S o m e stu d ie s have been e x p e rim e n ta lly based, w ith associated
e xp e rim e n ta l u n c e rta in tie s , w h i ls t o th e rs have been based o n a ca lcu la tiona l
approach o n ly . In genera l these c o m p a riso ns have sh o w n tha t m o d e rn a ir ke rm a
c a lib ra tio n based (N K o r N D) p ro to c o ls agree to w ith in ± 1 % o v e r m o s t o f the
m egavoltage p h o to n and e le c tro n beam energy rang e , at le a st fo r g ra p h ite w a lle d
c y lin d ric a l cham bers in a w a te r pha ntom . O th e r cham bers and o th e r p ha ntom s can
in tro d u c e la rg e r d iffe re n c e s.
T h e in tro d u c tio n o f n e w approaches can in tro d u c e a d d itio na l syste m a tic d i f fe r
ences. F o r exam ple , the in tro d u c tio n o f the N P L N w c a lib ra tio n [2 1 ] and associated
P ro to c o l [2 2 ] fo r m egavoltage p h o to n beam s p roduced in c o n siste n c ie s as com pared
w ith the e a rlie r U K P ro to c o l [2 5 ] , even th o u g h the tw o approaches agreed w ith in
com bined o v e ra ll u n c e rta in tie s . I t i s ra th e r com plicated to assess these d isc repanc ies,
as the N w se rv ic e has been m o d ifie d sinc e i t s in tro d u c tio n and th e N P L 2 M V N K
fa c to rs have a lso undergo ne change in th is p e rio d . T h e o r ig in a l c o m p a riso ns [2 2 ]
ind ica ted th a t d iffe re n c e s betw een the tw o approaches la y w ith in 1 .6 % . T h e new
approach gave lo w e r doses fo r X ra y s b u t h ig h e r doses fo r “ C o ; the “ C o N w fac
to rs d id n o t l ie o n the same sm o o th c u rve as the X ra y fa c to rs . V a r io u s c o rre c tio n s
[4 6 ] have sinc e b ro u g h t the “ C o and X ra y N w fa c to rs in to agreem ent. M e a n w h ile
the recent changes to N K (2 M V ) have decreased m egavoltage p h o to n doses, m ea
su re d fo llo w in g th e e a rlie r P ro to c o l [2 5 ] , b y 0 .6 % [2 9 ] . T a k in g a ll these changes
to g e th e r b r in g s the tw o approaches in to good agreem ent (w ith in 0 .5 % fo r
Т Р И 2® > 0 .7 and w ith in 1 % at lo w e r T P R ) , w ith the ne w P ro to c o l n o w g iv in g
h ig h e r m easured doses. N a h u m et a l. [4 0 ] recalcula ted the e a rlie r P ro to c o l f ig u re s ,
u s in g c u rre n t data o n in te ra c tio n c o e ffic ie n ts , and show e d th a t the 1 9 8 3 P ro to c o l [2 5 ]
ra th e r o ve re stim a te s doses com pared w ith the re c a lc u la tio n . U s in g the recalcula ted
data in an a ir ke rm a approach (w h ic h is exactly c o n s is te n t w ith R e fs [1 6 , 2 4 ]) and
c o m pa ring w ith the N w P ro to c o l ind ica tes d iffe re n c e s o f up to 1 .5 % betw een the
tw o approaches. T h i s c o n trib u te s to a w o rse n in g o f c o nsiste nc y (o r p re c is io n ) in c lin
ic a l p ractice betw een centres u s in g the d iffe re n t c a lib ra tio n m e tho ds and associated
P ro to c o ls . T h e d isc repanc ies are w ith in the com bined o v e ra ll u n c e rta in tie s o f the tw o
approaches, b u t re q u ire fu r th e r c o n s id e ra tio n , to m in im iz e a m b ig u ity in c lin ic a l
4.3. Intercomparisons o f dosimetry protocols

IAEA-SM-330/18 249
d o s im e try . D e sp ite th is , the 7VW approach, in one fo rm o r o th e r, has c le ar eventua l
advantages, in c lu d in g reduced o v e ra ll u n c e rta in tie s and s im p lif ic a tio n in u se [4 7 ] .
4.4. Intercomparisons in reference conditions in treatment beams
A re la tiv e ly la rg e n u m b e r o f d o s im e try in te rc o m p a riso n s have been c a rrie d o u t
in c o n d itio n s d u p lic a tin g o r a p p ro x im a tin g tre a tm e n t beam c a lib ra tio n re fe re nc e
c o n d itio n s . So m e o f these have been e sta b lishe d to p ro v id e q u a lity assurance fo r
c lin ic a l t r ia ls , som e w ith the a im o f a sse ssing the u n c e rta in tie s c u rre n tly achievable
w ith in a g iv e n c o u n try o r re g io n , and som e as p a rt o f w id e r q u a lity assurance o r
q u a lity a u d it approaches. T h e s tu d ie s have been based o n v is i t s w ith io n iza tio n
cham ber sy s te m s, o r o n m a ile d d o s im e te rs , u su a lly T L D s . So m e o f the m e tho ds
and/or re s u lts have been re v ie w e d in a n u m b e r o f p u b lic a tio n s [1 8 , 2 6 , 3 4 , 4 4 , 4 8 ,
4 9 ] . T a b le V su m m a rize s the re s u lts f ro m a range o f such in te rc o m p a riso n s at the
end p o in t o f the basic d o s im e try cha in . T h e l i s t is n o t a com plete su rv e y ; a n u m b e r
o f in te rc o m p a riso n s have n o t been fo rm a lly re p o rte d in the lite ra tu re . In a d d itio n ,
som e re p o rte d re s u lts have been superseded b y sub seq uent repeated o r extended
stu d ie s . M a n y in te rc o m p a riso n s are c o n tin u o u s. F o r exam ple , E is e n lo h r and Jayara-
m an [6 0 ] re p o rte d re s u lts f ro m the I A E A / W H O p o sta l d o s im e try se rv ic e , b u t these
have been superseded b y the c o n tin u in g n a tu re o f th is e xe rc ise . S v e n sso n [3 2 ]
re c e n tly re p o rte d obse rved standard d e v ia tio n s fro m th is s tu d y . In c lu d in g re s u lts
fro m a ll p a rtic ip a tin g c o u n tr ie s , a f ig u re o f 6 .7 % is ob ta ined. A n a ly s is b y c o u n try
pro duc es a range o f standard d e v ia tio n s , fo r exam ple fro m 1 .8 to 9 % fo r E u ro p e a n
c o u n tr ie s . A d d it io n a l re s u lts f ro m the I A E A se rv ic e and o th e r in te rc o m p a riso n s can
be fo u n d in these P ro c e e d in g s [6 1 , 3 1 ] .
T h e f ig u re s are p resented he re w ith no deta iled d isc u ss io n . T h e a im is to
d em o nstra te the range o f e x p e rim e n ta lly o b se rved d e v ia tio n s , to il lu s t ra te the o v e ra ll
c o nsiste nc y achieved in p ractice. T h e range ind ica tes th a t th e re is scope fo r genera l
achievable im p ro v e m e n t in the c u rre n t s itu a tio n and som e im p ro v e m e n t i s ty p ic a lly
o b se rved in repeated in te rc o m p a riso n s . T h e spread in in d iv id u a l d is t r ib u t io n s in d i
cates the scope fo r im p ro v e d q u a lity assurance in in d iv id u a l c entres a t the e x tre m e s.
R e a so n s fo r d isc repanc ies have been d isc usse d in m o s t re p o rts and re v ie w s o f in te r
c o m p a riso n s. I t m u s t be noted th a t the in te rc o m p a riso n m etho d c o n trib u te s i t s o w n
u n c e rta in tie s to the o b se rved d is t r ib u t io n s . T h u s , fo r exam ple , the standard devia
tio n s o f T L D based in te rc o m p a riso n s are g re a te r than fo r io n cham ber based
s tu d ie s [6 2 ] .
T h e o b se rved c o nsiste nc y o f basic d o s im e try can be com pared w ith the e s t i
m ated va lu e s. In genera l the tw o approaches o f u s in g estim a te s and u s in g d o s im e try
in te rc o m p a riso n s su p p o rt each o th e r. O b se rve d standard d e v ia tio n s sh o w an in c re a s
in g tre n d o n g o ing fro m ^ C o to X ra y s to e le c tro n s, as do the e stim a ted u n c e rta in
tie s . In te rc o m p a riso n s c a rrie d o u t in the o p tim a l s itu a tio n consid e re d in T a b le I V ,
such as th o se re p o rte d in R e fs [ 1 8 , 4 9 ] , agree w e ll w ith the estim a te s p re sented th e re .

TAB
LE
V.
SU
MM
AR
Y
OF
RE
SU
LTS
FR
OM
D
OS
IME
TRY
IN
TER
CO
MP
AR
ISO
NS
AT
TH
E EN
D
PO
INT
OF
THE
BA
SIC
DO
SIM
ETR
Y
CH
AIN
250 THWAITES
aCO
r o r o - r t s o© CM CM CM
О © © ©
r-©in О 1Л 00 © — —
© © © © ©
о
оX )
e3z
© O n *—1 r - •^ r 1П « n i n r o r - Г*-m 0 0 0 0 e n r o CM CM CM CM ГО CM
© © © © © © © © © © © © © © ©© © © © © © © © © © © © © © ©
4 0 ( N > n *£> r o m r - NO r-~ ON 4 0 ON© © OO © ( N © ON © © 0 0 ON ON© © ON O n © © © © ON © © © O n O n ON
© © *—« 1—< © © © ©
0 0 r o CM 4 0 r - r - CM © ON 0 0 r -1-* > n v o 0 0 i n CM « n m 4 0
r o ( N ( N 0 0
<DCO
a>
X x ''/—s S ' „ „ „
© а д © © © © ©4 0 o I S
4 0 4 0 4 0 4 0 4 0
O , s— Ó O O o ÓU X <u o u U X U U X U
^ X IT x -> OjO ©.2 IS ^О w о a> u U
Цн ¿s £ £Q- IH
> »ТЭ
о‘5ba>C*
-ос03uсо
<с оD_>р"с
edeu4)О
<соD
. £"cds
>счcd .2
* S "O S cS cdГЯЧ °U с о
<с оD> »c’êd
<L>©in
r—ON
<u>с о
VOON
¿4V"cd
JZСО
IГОГ -On
Jû-Z— .CQfc
*1cxz
l / " ) ’’T I— ■
ON 0 0 - H ON
ON r -
2 **2 CoслÉedÛ
coСЛСЛCcdДЗO
vO1П
in00O n
> »x>

IAEA-SM-330/18 251
О T t ON
^ ° ООО
ON СО Г-*CO »—<ООО
X) X Xi x40 es o On <s «n «n 00 oo <s (N (N >—1 о 1—1O o o O o O O d o o o
40 o ON <N On CM 40 ir> 00 »n 00о (S <N <4 со es <N (No o o o O O o o O o o o o oo o o o o o o o o o o o o d
o Tt<N
i nON O ON
0 0
80 0o <4o g с о
ONe n Ci
8СОO o ON O nо O O n o O n О o o ON о O o o O s ON
d d 1—1 о 'шш> 1 O O
O n VO ON 0 0 O O *П 0 0 « n • n с о o < n O«D t n T j-r- 5ON0000 (Nm
m <N 40 o
T3<uс
оVOIоu X
O
X
Ц
X
o' o o o40 40 40 40 406 k , 6 o ó _ o ¿
U X U o U o> U X U X U
û —1 H
QJH
ûJH
<DQ.ol-sШ
■ocЛ
O)2
л ^.1 S
1 * w- C
§ *3 e P
(UQ *o3tü
£со

252 THWAITES
D if fe re n t approaches to e stim a tin g u n c e rta in tie s in d o s im e try su p p o rt each
o th e r, w h i ls t these estim a tes and d o s im e try in te rc o m p a riso n s are a lso seen to be com
p le m e n ta ry . E s t im a te s o f the c onsistency o f d o s im e try can o m it com m on system a tic
u n c e rta in tie s and are sh o w n to re s u lt in re a lis t ic f ig u re s , w h e n com pared w ith
e x p e rim e n ta lly obse rved consiste nc y fro m in te rc o m p a riso n s c a rrie d o u t u n d e r s im i
la r c o n d itio n s . S y ste m a tic d iffe re n c e s in d o s im e try p ro to c o ls c o n trib u te s ig n if ic a n tly
to d o s im e tric in c o n s is te n c y , p a rtic u la rly betw een and N K (o r N D) p ro to c o ls at
the p re se n t tim e . R e v ie w in g the re s u lts o f d o s im e try in te rc o m p a riso n s at the end
p o in t o f the basic d o s im e try cha in ind ica tes scope fo r achievable im p ro v e m e n t in the
c u rre n t s itu a tio n , w h ic h can be re a lize d by im p ro v e m e n ts in q u a lity assurance and
e xp a nsio n o f q u a lity a u d it. T h e b e st p o ss ib le accuracy and c onsistency m u s t be
e nsu re d at th is le v e l, to e sta b lish the subsequent c lin ic a l d o s im e try cha in o n the f i r m
b a sis necessary to achieve the o v e ra ll re q u ire d c lin ic a l accuracy.
R E F E R E N C E S
[1] INTERNATIONAL COMMISSION ON RADIATION UNITS AND MEASUREMENTS, Determination of Absorbed Dose in a Patient Irradiated by Beams of X or Gamma Rays in Radiotherapy Procedures, ICRU Rep. 24, Bethesda, MD (1976).
[2] MDNHEER, B.M., BATTERMAN, J. J., WAMBERSIE, A., What degree of accuracy is required and can be achieved in photon and neutron therapy, Radiother. Oncol. 8 (1987) 237.
[3] BRAHME, A. (Ed.), Accuracy Requirements and Quality Assurance of External Beam Therapy with Photons and Electrons, Acta Oncol. 15 Suppl. 1 (1988).
[4] JOHANSSON, K.-A., Studies of Different Methods of Absorbed Dose Determination and a Dosimetric Intercomparison at the Nordic Radiotherapy Centres, Doctoral Thesis, Univ. of Goteborg (1982).
[5] COMITE CONSULTATIF POUR LES ETALONS DE MESURE DES RAYONNEMENTS IONISANTS, Report of the 8th Meeting of Section I, Rapport de la 11e session, BIPM, Sèvres (1985) R157.
[6] INTERNATIONAL COMMISSION ON RADIATION UNITS AND MEASUREMENTS, Stopping Powers for Electrons and Positrons, ICRU Rep. 37, Bethesda, MD(1984).
[7] ALLIS Y , A., IAEA-SM-330/68, these Proceedings.[8] BOUTILLON, M., COURSEY, B.M., HOHLFELD, K., OWEN, B., ROGERS,
D.W.O:, IAEA-SM-330/48, ibid.[9] LOEVINGER, R., LOFTUS, T., “Uncertainty in the delivery of absorbed dose”,
Ionizing Radiation Metrology (CASNATI, E., Ed.), Editrice Compositori, Bologna (1977) 459.
[10] AMERICAN ASSOCIATION OF PHYSICISTS IN MEDICINE, Physical Aspects of Quality Assurance in Radiation Therapy, Rep. 13, AAPM, New York (1984).
5. C O N C L U S IO N S
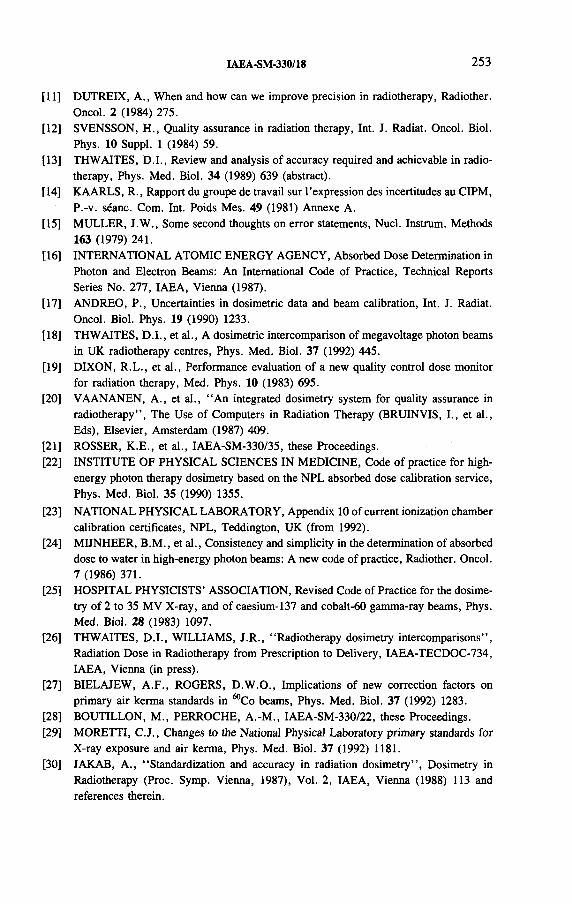
IAEA-SM-330/18 253
[11] DUTREIX, A., When and how can we improve precision in radiotherapy, Radiother. Oncol. 2 (1984) 275.
[12] SVENSSON, H., Quality assurance in radiation therapy, Int. J. Radiat. Oncol. Biol. Phys. 10 Suppl. 1 (1984) 59.
[13] THWAITES, D.I., Review and analysis of accuracy required and achievable in radiotherapy, Phys. Med. Biol. 34 (1989) 639 (abstract).
[14] KAARLS, R., Rapport du groupe de travail sur l’expression des incertitudes au CIPM, P.-v. séanc. Com. Int. Poids Mes. 49 (1981) Annexe A.
[15] MULLER, J.W., Some second thoughts on error statements, Nucl. Instrum. Methods 163 (1979) 241.
[16] INTERNATIONAL ATOMIC ENERGY AGENCY, Absorbed Dose Determination in Photon and Electron Beams: An International Code of Practice, Technical Reports Series No. 277, IAEA, Vienna (1987).
[17] ANDREO, P., Uncertainties in dosimetric data and beam calibration, Int. J. Radiat. Oncol. Biol. Phys. 19 (1990) 1233.
[18] THWAITES, D.I., et al., A dosimetric intercomparison of megavoltage photon beams in UK radiotherapy centres, Phys. Med. Biol. 37 (1992) 445.
[19] DIXON, R.L., et al., Performance evaluation of a new quality control dose monitor for radiation therapy, Med. Phys. 10 (1983) 695.
[20] VAANANEN, A., et al., “An integrated dosimetry system for quality assurance in radiotherapy”, The Use of Computers in Radiation Therapy (BRUINVIS, I., et al., Eds), Elsevier, Amsterdam (1987) 409.
[21] ROSSER, K.E., et al., IAEA-SM-330/35, these Proceedings.[22] INSTITUTE OF PHYSICAL SCIENCES IN MEDICINE, Code of practice for high-
energy photon therapy dosimetry based on the NPL absorbed dose calibration service, Phys. Med. Biol. 35 (1990) 1355.
[23] NATIONAL PHYSICAL LABORATORY, Appendix 10 of current ionization chamber calibration certificates, NPL, Teddington, UK (from 1992).
[24] MUNHEER, B.M., et al., Consistency and simplicity in the determination of absorbed dose to water in high-energy photon beams: A new code of practice, Radiother. Oncol.7 (1986) 371.
[25] HOSPITAL PHYSICISTS’ ASSOCIATION, Revised Code of Practice for the dosimetry of 2 to 35 MV X-ray, and of caesium-137 and cobalt-60 gamma-ray beams, Phys. Med. Biol. 28 (1983) 1097.
[26] THWAITES, D.I., WILLIAMS, J.R., “Radiotherapy dosimetry intercomparisons”, Radiation Dose in Radiotherapy from Prescription to Delivery, IAEA-TECDOC-734, IAEA, Vienna (in press).
[27] BIELAJEW, A.F., ROGERS, D.W.O., Implications of new correction factors on primary air kerma standards in ^Co beams, Phys. Med. Biol. 37 (1992) 1283.
[28] BOUTILLON, М., PERROCHE, A.-M., IAEA-SM-330/22, these Proceedings.[29] MORETTI, C.J., Changes to the National Physical Laboratory primary standards for
X-ray exposure and air kerma, Phys. Med. Biol. 37 (1992) 1181.[30] JAKAB, A., “Standardization and accuracy in radiation dosimetry”, Dosimetry in
Radiotherapy (Proc. Symp. Vienna, 1987), Vol. 2, IAEA, Vienna (1988) 113 and references therein.

254 THWAITES
[31] SVENSSON, H., ZSDÁNSZKY, K., NETTE, P., IAEA-SM-330/69, these Proceedings.
[32] SVENSSON, H., “Quality assurance in radiation therapy dosimetry: Present work and future plans of the IAEA”, paper presented at EORTC Mtg on Quality Control, Leuven, 1989; “The calibration chain”, Radiation Dose in Radiotherapy from Prescription to Delivery, IAEA-TECDOC-734, IAEA, Vienna (in press).
[33] DA SILVA, T.A., NETTE, H.P., ECKERL, H., DREXLER, G., “Intercomparisons with a travelling ionization chamber”, Dosimetry in Radiotherapy (Proc. Symp. Vienna, 1987), Vol. 2, IAEA, Vienna (1988) 159.
[34] HANSON, W.F., et al., “Dosimetry quality assurance in the US from the experience of the Radiological Physics Center”, Proc. Quality Assurance Symp. Galveston, 1991, American College of Medical Physics (1992) 255.
[35] ALMOND, P.R., LAW, J., SVENSSON, H., Comparisons of radiation dosimetry between Houston (USA), Edinburgh (UK) and Umeâ (Sweden), Phys. Med. Biol. 17 (1972) 64.
[36] JOHANSSON, K.-A., SVENSSON, H., “Dosimetric intercomparison at the Nordic radiation therapy centres: Part П, comparison between different detectors and methods”, Studies of Different Methods of Absorbed Dose Determination and a Dosimetric Comparison at the Nordic Radiotherapy Centres, Doctoral Thesis, Univ. of Gôteborg (1982).
[37] MATTSSON, L.O., Comparison of different protocols for the dosimetry of high energy photon and electron beams, Radiother. Oncol. 4 (1985) 313.
[38] MUNHEER, B.M., WITTKAMPER, F.W., Comparison of recent codes of practice for high-energy photon dosimetry, Phys. Med. Biol. 31 (1986) 407.
[39] MUNHEER, B.M., et al., Experimental verification of the air kerma to absorbed dose conversion factor Cw u, Radiother. Oncol. 8 (1987) 49.
[40] NAHUM, A.E., THWAITES, D.I., ANDREO, P., An analysis of the revised HPA dosimetry protocols, Phys. Med. Biol. 33 (1988) 923.
[41] HUQ, M.S., NATH, R., Comparison of IAEA 1987 and AAPM 1983 protocols for dosimetry calibration of radiotherapy beams, Med. Phys. 18 (1991) 26.
[42] INSTITUTE OF PHYSICAL SCIENCES IN MEDICINE, Addendum to the code of practice for electron beam dosimetry in radiotherapy (1985): Interim additional recommendations, Phys. Med. Biol. 37 (1992) 1477.
[43] MUNHEER, B.M., THWAITES, D.I., WILLIAMS, J.R., “Absolute dose determination”, Radiotherapy Physics in Practice (WILLIAMS, J.R., THWAITES, D.I., Eds), Oxford Univ. Press (in press) Ch. 3.
[44] HANSON, W.F., STOVALL, М . , KENNEDY, P., “Review of dose intercomparison at a reference point”, Radiation Dose in Radiotherapy from Prescription to Delivery, IAEA-TECDOC-734, IAEA, Vienna (in press).
[45] THWAITES, D.I., IAEA-SM-330/19, these Proceedings.[46] NATIONAL PHYSICAL LABORATORY, Appendix 9 of current ionization chamber
calibration certificates, NPL, Teddington, UK (from 1992).[47] ROGERS, D.W.O., The advantages of absorbed dose calibration factors, Med. Phys.
19 (1992) 1227.
IAEA-SM-330/18 255
[48] JOHANSSON, K.-A., “Dosimetry audits of radiotherapy institutions in Europe”, ESTRO 6 (Proc. Mtg Lisbon, 1987), ESTRO, Leuven (1987) 303.
[49] WITTKÀMPER, F.W., MUNHEER, B.M., VAN KLEFFENS, H.J., Dose intercomparison at the radiotherapy centres in the Netherlands: Photon beams under reference conditions and for prostatic cancer treatment, Radiother. Oncol. 9 (1987) 33.
[50] SVENSSON, H., Dosimetric measurements at the Nordic medical accelerators: Absorbed dose measurements, Acta Radiol., Ther., Phys., Biol. 10 (1971) 631.
[51] SHALEK, R.J., et al., Quality Assurance for Measurements in Therapy, NBS Special Publ. 457, Natl Bureau of Standards, Washington, DC (1976).
[52] BARRETT, J.H., et al., Dosimetric intercomparison in the British Institute of Radiology fractionation study of 3F/week versus 5F/week in radiotherapy of laryngo- pharynx cancer, Br. J. Radiol. 63 (1990) 125.
[53] SAMULSKI, T., et al., Radiation therapy dosimetry reviews by the Centers for Radiological Physics, Int. J. Radiat. Oncol. Biol. Phys. 7 (1981) 379.
[54] DAWSON, D.J., RAWLINSON, J.A., SHRAGGE, P.C., Ontario accelerator dose intercomparison study, J. Can. Assoc. Radiol. 32 (1981) 49.
[55] JOHANSSON, K.-A., MATTSSON, L.O., SVENSSON, H., Dosimetric intercomparison at the Scandinavian radiation therapy centres, Acta Radiol., Ther., Phys., Biol. 21 (1982) 1.
[56] KIRBY, Т.Н., et al., Mailable TLD system for photon and electron therapy beams, Int. J. Radiat. Oncol. Biol. Phys. 12 (1985) 261.
[57] JOHANSSON, K.-A., et al., Quality assurance control in the EORTC cooperative group of radiotherapy: Dosimetric intercomparison, Radiother. Oncol. 7 (1986) 269.
[58] HANSSON, U., JOHANSSON, K.-A., Quality audit of radiotherapy with EORTC mailed in water TL dosimetry, Radiother. Oncol. 20 (1991) 191.
[59] DAVIS, B., Quality assurance of megavoltage radiotherapy units: Intercomparison of dose at a reference point using a mailed TL dosimetry system, Radiother. Oncol, (in press).
[60] EISENLOHR, H.H., JAYARAMAN, S., IAEA-WHO cobalt-60 teletherapy dosimetry service using mailed LiF dosemeters. A survey of results obtained during 1970-75, Phys. Med. Biol. 22 (1977) 18.
[61] HUNTLEY, R.B., BERA, P., NETTE, P., IAEA-SM-330/70, these Proceedings.[62] KIRBY, Т.Н., HANSON, W:F., JOHNSTON, D.A., Uncertainty analysis of absorbed
dose calculations from thermoluminescence dosimeters, Med. Phys. 19 (1992) 1427.


IAEA-SM-330/57
T H E A C C U R A C Y O F D E L I V E R Y O F
R A D I O T H E R A P Y A S D E D U C E D F R O M
E X T E N S I V E Q U A L I T Y A S S U R A N C E
E . G . A I R D , C . W I L L I A M S , G . T . M O T T
M o u n t V e rn o n H o s p ita l,
N o rth w o o d , M id d le se x ,
U n ite d K in g d o m
Abstract
THE ACCURACY OF DELIVERY OF RADIOTHERAPY AS DEDUCED FROM EXTENSIVE QUALITY ASSURANCE.
Quality control tests that were developed for the Continuous Hyperfractionated Accelerated Radiotherapy (CHART) multicentre clinical trial have been used extensively at Mount Vernon Hospital as well as throughout the United Kingdom. These tests include a series of mechanical and radiation (photons only) checks to be performed on each linear accelerator and simulator. In addition, measurements were made on anatomical phantoms using an ionization chamber. The results of some of these measurements are discussed to show the typical ranges of values measured and how the phantom measurement errors may be caused by variation in beam parameters and errors in basic data.
1. I N T R O D U C T I O N
C o n tin u o u s H y p e rfra c tio n a te d Accelera ted R a d io th e ra p y ( C H A R T ) c o n s is ts o f
a dose o f 5 4 G y in 3 6 fra c tio n s o v e r 12 d a ys, w ith 3 tre a tm e n ts p e r day. T h i s re g im e
i s n o w p a rt o f a ra n d o m ize d c o n tro lle d t r ia l in w h ic h rad ic a l ra d io the ra p y is
com pared w ith C H A R T in the tre a tm e n t o f p a tie n ts w h o have lo c a lly advanced head
and neck cancer. I t w a s developed at M o u n t V e rn o n H o s p ita l in c o lla b o ra tio n w ith
th e G ra y La b o ra to ry .
A q u a lity a u d it p ro g ra m m e has been developed fo r the C H A R T c lin ic a l t r ia l
to e n su re tha t a ll p a tie n ts o n the t r ia l , ir re sp e c tiv e o f th e ir tre a tm e n t c entre , receive
e q u iva le n t tre a tm e n t to a standard approved by the C H A R T S te e rin g C o m m itte e . A
q u a lity assurance team w a s fo rm e d f ro m the s ta f f at M o u n t V e rn o n H o s p ita l w h o are
in v o lv e d w ith the d e liv e ry o f ra d io th e ra p y : a ra d io th e ra p is t, a ra d io g ra p h e r, an
e ng ine e r and a p h y s ic is t . O ne o f the fu n c tio n s o f th is g ro u p w a s to d e v ise a se rie s
o f m echanical and ra d ia tio n te s ts (p h o to n s o n ly ) to be p e rfo rm e d o n the tre a tm e n t
m achine and s im u la to r. In a d d itio n , anatom ical p ha n to m s w e re m a nu fa c tu re d fro m
t is s u e e q u iva le n t p la stic s to s im u la te the p a rts o f the b ody trea ted in the C H A R T t r ia l.
T h e s e w e re designed to accept a sm a ll io n iza tio n cham ber to a llo w m e a surem e nts
o f dose at the tu m o u r s ite to be m ade at each c e n tre . T h i s paper w i l l d e sc rib e these
257

258 AIRD et al.
te s ts . S o m e o f these te s ts have n o w been b ro a d ly adopted as p a rt o f a q u a lity
p ro g ra m m e fo r the ro u tin e te s tin g o f lin e a r accele ra to rs at M o u n t V e rn o n H o s p ita l.
T h e re s u lts o f a y e a r’ s te stin g w i l l be d isc u sse d , to g e the r w ith som e re s u lts o f b o th
m achine checks and p ha ntom m ea surem e nts a t the C H A R T c e n tre s, in o rd e r to
d em o nstra te the degree o f accuracy achieved and w h e re w eaknesses lie .
1.1. Development of tests
T h e ra tio n a le adopted b y th e q u a lity assurance team w a s to d ev ise a se t o f te sts
w h ic h cou ld be com pleted in a one day v is i t , in c lu d in g the pha n to m m ea su re m e nts.
T h e te s ts sh o u ld e ffe c tiv e ly te s t a ll p a ra m ete rs in ro u tin e u se w ith o u t a im in g to be
a c o m p re he nsive acceptance schedule o f te s ts . V a rio u s docum ents — in c lu d in g
P u b lic a tio n s 9 7 6 and 9 7 7 o f the In te rn a tio n a l E le c tro te c h n ic a l C o m m iss io n [ 1 , 2 ] —
w e re used fo r guidance in id e n tify in g w h a t to te s t and the to le ra nce fo r each param e
te r . F o llo w in g se ve ra l m o n th s o f deve lopm e nt and fie ld t r ia ls the f in a l p ro to c o l n o w
co nta ins 4 3 ite m s fo r te s tin g . I t is n o t a p pro p ria te to p u b lish the f u l l p ro to c o l he re ,
b u t som e o f the te s ts a re o u tlin e d b e lo w and o th e rs are d isc usse d in d e ta il.
1.2. Equipment
T h e c r ite r ia fo r the eq u ip m e nt w e re governed b y the accuracy o f te stin g
re q u ire d and the fa c t th a t i t w o u ld have to be m oved a ro und the c o u n try e a sily in
an estate ca r. T h e s e c r ite r ia inc lude d :
— A scann ing sy ste m to f i t any lin e a r accelera tor head,
— A d ig ita l m e a su rin g sy ste m fo r p re c ise p o s it io n in g and m ea surem e nt,
— A n autom atic and re m o te d r iv e b y c o m p ute r,
— T h e a b ility to re c o rd o n d is k and h a rd copy,
— A ro b u s t a sse m bly to w ith s ta n d the s tre s s o f tra n sp o rta tio n ,
— A m o u n tin g j ig th a t does n o t d is to r t w h e n the g a n try is ro ta ted .
T h e B io e n g in e e rin g D e p a rtm e n t a t M o u n t V e rn o n H o s p ita l designed , con
stru c te d and assem bled v a rio u s m o d u le s u s in g apparatus f ro m se ve ra l c om m erc ia l
m a n u fa c tu re rs . A su ita b le j ig w a s su p p lie d b y G ra y te c h (A d d le sto n e , S u r re y ) . T h e
scann ing m o ve m e n t, e le c tro m e te rs, io n iza tio n cha m b ers, c om pute r in te rfa c e and
so ftw a re w e re purc hased f ro m P T W ( F re ib u rg , G e rm a n y ). T h e scanning m o ve m e nt
a llo w s p o s it io n in g to an accuracy o f 0.1 m m w ith a hand pendant c o n ta in ing b o th
the m o ve m e nt ke ys and a re a do u t o f io n cham ber p o s it io n (a ke y fe a tu re o f the op tica l
v e rsu s X ra y te s t, described in S e c tio n 2 .4 ) . T h e io n cham ber w a s used in w a te r
e q u iva le n t p la stic ( W E P ) pha n to m m a te ria l.
I t w a s decided th a t a ll ra d ia tio n u n ifo rm ity scans sh o u ld be p e rfo rm e d as c lose
to w a te r ta n k c o n d itio n s as p o ss ib le . W ith o u t u s in g a w a te r ta n k th is can be achieved
w ith W E P , b u t w ith s u f f ic ie n t v o lu m e to p roduce enough sca tte r w ith o u t o v e rb u rd e n

IAEA-SM-330/57 259
in g the scanner m o to r w ith the w e ig h t o f m a te ria l. I t w a s fo u n d th a t a scanning
b lo c k o f 1 2 .5 cm x 1 2 .5 cm and 14 cm depth p roduced scans th a t w e re id e n tic a l
w ith th o se in w a te r o v e r the fla tte n e d area. T h i s b lo c k w a s made up fro m se ve ra l
shee ts to a llo w scans a t d if fe re n t depths to be m ade.
W h e n u n d e rta k in g such an e x te n sive p ro g ra m m e o f te s ts o v e ra ll m ea surem e nt
t im e has to be w e ig hed aga inst lo s s o f accuracy. T h e c o m p le x ity o f the set-up
re q u ire s a n u m b e r o f cables to be la id and conne ctions to be m ade. T h i s ta sk has been
s im p lif ie d b y a sse m b lin g the d o s im e te rs , c o n tro ls and in te rfa c e in to one crate and
pla c ing th is in s id e the tre a tm e n t ro o m , care be ing taken to e n su re th a t i t i s o u ts id e
the path o f the p r im a ry beam at a ll g a n try ang les. T h e d riv e cables to the scanner
and the io n cham ber cables are the n connected to th is crate and th e re fo re the o n ly
cable to com e o u ts id e the ro o m is the R S 2 3 2 l in k to the c o m p u te r. In m a ny tre a tm e n t
ro o m s th is cable can be d ra w n th ro u g h the ‘ ra t-h o le ’ used fo r d o s im e try cables.
2 . O U T L I N E O F P R O C E D U R E
A c rit ic a l in i t ia l check is made to e n su re th a t the o p tic a l in d ic a tio n o f the
iso c e n tre is at the centre o f the o p tic a l f ie ld and in the centre o f ro ta tio n o f the c o lli
m a to r. I f th is is n o t w ith in the to le ra nc e o f a 2 m m c irc le , the n the te s t p ro g ra m m e
i s aborted u n t i l an a d ju stm e n t can be made.
2.1. Scales and indicators
A t g a n try ang les o f 0 ° and ± 9 0 ° , the la se rs and the v e rtic a l couch m ovem ent
w e re checked w ith a se rie s o f te s ts u s in g s im p le devices such as a p lu m b bob and
a w a te r le v e l. A sm a ll s p i r i t le v e l w a s used to check the angle in d ic a tio n o f the
c o llim a to r (g a n try at 9 0 ° ) .
2.2. Radiation flatness and symmetry
T h e scanning b lo c k is m o un te d so th a t the su rfa c e o f the b lo c k is a t 9 0 cm fro m
th e fo c u s and the io n cham ber is placed a t 1 0 0 cm . A f ie ld s iz e o f 3 0 cm X 3 0 cm
is se t and the b lo c k a lig ned w ith the centre o f the f ie ld . Scans o f the m a jo r axes
(k n o w n as A - В and G - T ) a re made fo r g a n try ang les o f 0 ° , 9 0 ° and 2 7 0 ° . T h e mea
su re d dose is re c ord ed , re la tiv e to a re fe re nc e dose fro m an io n cham ber m ounte d
o n the j ig c lose to the e x it p o rta l o f the tre a tm e n t u n it , at 3 9 p o in ts a c ro ss the f ie ld .
T h e standard m e a sure s o f fla tn e ss and sy m m e try are a u to m a tic a lly calculated fro m
each scan.

260 AIRD et al.
2.3. Radiation field size
In o rd e r to m easure f ie ld s iz e , the cham ber p o s it io n w a s n o t a lte red , b u t the
th ic k n e ss o f W E P above the cham ber w a s reduced to p ro v id e b u ild u p fo r the p a rtic u
la r energy o f p h o to n beam : 1 .5 cm fo r 6 M V , 2 cm fo r 8 M V . I t w a s decided to
concentra te these te s ts o n the p a ir o f c o llim a to rs w h ic h are m o s t used c lin ic a lly fo r
the w id th o f the f ie ld sinc e these w i l l be m o s t in flu e n c e d b y g ra v ity w h e n the g a n try
i s ro ta ted . T h u s th e le n g th o f the f ie ld w a s o n ly m easured at a g a n try angle o f 0 ° ,
b u t f ie ld w id th w a s m easured fo r 0 ° , 9 0 ° and 2 7 0 ° . Because o f t im e re s tr ic t io n
o n ly a 10 cm X 10 cm fie ld w a s m easured , b u t as the team became m o re e ffic ie n t
at the se rie s o f te s ts i t w a s decided to extend the m ea surem e nts to inc lude
5 cm x 5 cm and 2 0 cm x 2 0 cm , to check fo r l in e a r ity and o f fs e t p ro b le m s w ith
f ie ld s iz e se ttin g s . Pe n u m b ra (as m easured w ith a 5 m m d ia m e te r io n cham ber) could
a lso be d e rive d f ro m these m ea su re m e nts v e ry re p ro d u c ib ly .
2.4. X ray field versus optical field
T h e M o u n t V e rn o n team w a s n o t sa tis f ie d w ith the c o nve n tio na l f i lm m ethods
fo r checking the agreem ent o f the X ra y f ie ld w ith the o p tic a l f ie ld since f i lm re q u ire s
a d a rk ro o m and the p ro cess is t im e c o n su m in g . T h e re p ro d u c ib ility is p o o r and i t
i s v e ry d if f ic u lt to c a rry o u t the te s t at a ll at la te ra l g a n try a ng les. A c o m m e rc ia lly
ava ilab le op tic a l d iode connected to the scanner w a s tr ie d , b u t fo u n d to be too
in se n s it iv e and e rra tic .
D u r in g these e x p e rim e n ts i t became o b v io u s to the team th a t the com bined use
o f the m o to r c o n tro lle d sca nner, w ith hand pendant readout and c o n tro l, to g e the r
w ith a sm a ll io n cham ber fo rm e d a v e ry su ita b le and v e rsa tile m etho d fo r checking
f ie ld agreem ent. T h e m etho d f in a l ly adopted evo lve d o v e r a p e rio d o f w e e k s. T h e
io n cham ber is placed in a special p la te (w h ic h had been designed to take the optica l
d iode) in w h ic h i t s e ffe c tive m e a su rin g p o in t i s c lose to the su rfa c e o f the p la te ,
w h ic h is se t to be a t 1 0 0 cm fro m the fo ca l sp o t. A b u ild u p b lo c k can be added to
e n su re f u l l e le c tro n ic e q u ilib r iu m . T h e p la te is w h ite faced w ith a th in b lack c ro ss
o n i t th ro u g h the centre o f the io n cham ber. T h e cham ber and pla te can be m o to r
d riv e n to the edge o f the beam u s in g the hand pendant c o n tro l and the m easure o f
d ose in th is p o s it io n com pared w ith the dose rece ived a t the centre o f the beam (taken
to be 1 0 0 % in each s itu a tio n ) ; the d istance m oved and the percentage dose received
are the n recorded fo r each edge o f the beam. T h e re is s t i l l som e su b je c tiv ity in th is
m etho d . T h e re p ro d u c ib ility o n a s in g le occasion fo r one o b se rv e r is about
± 0 . 2 m m . T o rep roduce the c lin ic a l accuracy at an in d iv id u a l centre a ra d io g ra p h e r
f ro m the tre a tm e n t centre is asked to p e rfo rm th is p a rt o f the te s t w ith the v is it in g
team . T h e re s u lts can be ana lysed in te rm s o f d istance e r ro rs b y m a k ing u se o f the
p re v io u s ly m easured penum bra .
IAEA-SM-330/57 261
W it h the sh o rtn e ss o f t im e ava ilab le i t w a s n o t th o u g h t p ra c tica l to p e r fo rm
m o re than a basic T P R typ e te st. T o save tim e th is w a s com bined w ith the c a lib ra tio n
o f the d o s im e te r to be used in the ana tom ica l pha n to m m e a su re m e nts. T h e cham ber
i s placed at 5 cm depth in W E P w ith the su rfa c e o f the b lo c k a t 1 00 cm F S D . T h e
dose is recorded fo r a fix e d n u m b e r o f m o n ito r u n its . T h i s is repeated w ith the addi
t io n o f a fu r th e r 10 cm th ic k n e ss o f W E P . T h e ra tio o f these re a d in g s is used to f in d
the percentage depth dose in a 10 cm x 10 cm f ie ld a t 10 cm depth u s in g a c a lib ra tio n
c u rv e d ra w n up u s in g M o u n t V e rn o n data.
2.5. Energy check
2.6. W ed ge factor
T h e team d isc usse d o v e r a p e rio d o f w eeks w h a t to m ea sure to check the wedge
fa c to r and came to the c o n c lu s io n th a t i t i s d e v ia tio n o f w edge fa c to r w ith g a n try
angle w h ic h is o f m o s t im p o rta nc e . T h i s v ie w w a s re in fo rc e d fo llo w in g v is i t s to
se ve ra l ra d io th e ra p y centres w h e re p ro b le m s w e re encountered o w in g to change in
wedge p o s it io n w ith g a n try angle. T h e te s t c o n s is ts , th e re fo re , o f com pa ring the
w edge a tte nua tio n w ith the g a n try in i t s la te ra l p o s it io n and fo r b o th c o llim a to r angles
fo r the w edge, i.e . w ith the th ic k end up o r d o w n , w ith the m ean va lue o f wedge
a tte nua tio n at a g a n try angle o f 0 ° .
2.7. Output
F o r com ple teness, the a b so lu te absorbed dose w a s m easured u s in g a U n ite d
K in g d o m standard p ro to c o l [3 ] w ith a F a rm e r d o s im e te r ca lib ra ted a g a inst a secon
d a ry standard d o s im e te r at M o u n t V e rn o n H o s p ita l. P re s s u re and tem p e ra tu re data
w e re p ro v id e d b y the s ta f f at each centre .
2.8. Anatomical phantom measurements
A chest pha n to m w a s co nstruc te d fro m t is s u e e q u iva le n t m a te ria ls . L u n g , bone
and w a te r e q u iva le n t p la s tic s , based o n tho se described in R e p o rt 4 4 o f the In te r
n a tio n a l C o m m iss io n o n R a d ia tio n U n i t s and M e a su re m e n ts [ 4 ] , w e re m a nu fa c tu re d
b y S t . B a r th o lo m e w ’ s H o s p ita l. T h e ta rg e t v o lu m e w ith in the b ro n c h u s w a s chosen
accord ing to a typ ic a l lo w e r segm ent sm a ll v o lu m e . H o le s w e re d r i l le d at f iv e d if fe r
e n t p o in ts w ith in the ta rg e t v o lu m e and w ith in th e sp in a l c o rd , to accept a sm a ll
v o lu m e io n cham ber ( P T W M 2 3 3 6 4 2 ) .

262 AIRD et al.
T h e com plete p ro to c o l described above, e xc lud ing (anatom ica l) p ha ntom mea
su re m e n ts , has been p e rfo rm e d ro u tin e ly a t M o u n t V e rn o n H o s p ita l o n each m achine
at in te rv a ls o f a p p ro x im a te ly one m o n th . In v ie w o f the im m e n se s ize o f th is database
i t is p o ss ib le to d escribe h e re o n ly a lim ite d se t o f re s u lts fo r one o r tw o m achines.
T h e p re c ise na tu re o f the m etho d o f m e a su re m e nt, p a rtic u la rly the v a rio u s f ie ld s ize
te s ts , m akes th is a u n iq u e se t o f data o n the p e rfo rm a n c e o f lin e a r accele ra to rs. F o r
m o st m ea surem e nts a p e rio d o f one ye ar (1 9 9 2 ) has been used.
3.1. Reproducibility of tests
T a b le I sh o w s the re p ro d u c ib ility on an in d iv id u a l occasion o f the key
pa ra m e te rs.
3.2. Variation of parameters with time
T a b le П sh o w s the ty p ic a l v a ria tio n o f the ke y pa ra m ete rs (u s in g the com plete
p ro to c o l) fo r th re e o f the m o d e m lin e a r accele ra to rs o v e r a p e rio d o f one ye ar (1 9 9 2 )
o f q u a lity c o n tro l m ea su re m e nts.
3.3. Range of parameter variation in C H A R T centres
T a b le H I sh o w s som e re s u lts fo r the ke y p a ra m ete rs f ro m the 12 U K C H A R T
t r ia l centres (one lin e a r accelerator at each ce n tre ). T h e tab le de m o nstra te s the range
o f va lue s fo u n d and sh o w s the m a in areas o f w eakne ss to be the change in wedge
atte nua tio n w ith g a n try angle and the d iffe re n c e betw een m easured energy and the
c e n tre ’ s o w n va lue .
3. R E SU LTS
T A B L E I . R E P R O D U C I B I L I T Y O F K E Y
P A R A M E T E R S
Flatness/Symmetry
Radiation field size
Penumbra
± 0 .5 %
Optical field size
Energy
Wedge attenuation
±0.1 mm
±0.1 mm
±0.2 mm
±0.1%
±0.2%

IAEA-SM-330/57 263
T A B L E П . V A R I A T I O N O V E R A Y E A R O F K E Y
P A R A M E T E R S
Flatness/Symmetry 1%
Radiation field size:— Lower jaws ±0.5 mm— Upper jaws ±0.8 mm
Penumbra ±0.1 mm
Optical field size:— Lower jaws ±0.6 mm— Upper jaws ±1.0 mm
Energy ±0.2%
Wedge attenuation ±0.5%
T A B L E Ш . R A N G E S O F V A L U E S O F K E Y P A R A M E T E R S F R O M C H A R T
C E N T R E S
Mean ± SD Range
Flatness 1.050 ± 0.015 1.030-1.067
Symmetry 1.015 ± 0.010 1.003-1.024
Radiation field size (mm):— Lower jaws— Upper jaws
100.0 ± 1.4 99.9 ± 1.1
97.9-101.798.8-102.2
Penumbra (mm):— Lower jaws— Upper jaws
6.0 ± 0.57.0 ± 1.4
5.2-7.1 5.65-10.1
Optical field size (mm):— Lower jaws— Upper jaws
99.5 ± 1.199.6 ± 1.5
98.3-102.197.8-103.0
Energy (difference between centre’s value and measurement (%) 0.6 ± 0.6 -1.7 to +1.7
Wedge attenuation (%) — -4.0 to +4.5
Difference between X ray and optical fields (mm):
— Lower jaws— Upper jaws
0.8 ± 0.6 0.6 ± 0.6
0-2.60-2.3

264 A I R ! ) e t a l .
T A B L E I V . P H A N T O M M E A S U R E M E N T R E S U L T S F R O M 12 U K C H A R T
C E N T R E S
Bronchus phantom
Mean dose to intersection point
Mean dose to other points in target volume
Difference between calculated and measured doses for all points in target volume (for ‘on-axis’ slice) (see Fig. 1)
Range of values -5.5 to +4.5%
Mean +0.3%
RMS difference 2.4%
12 1
10 -
8 ->4о сф e3 0 " cr Ф k.Ü-
4 -
2 -
0 --7.5 -6.5 -5.5 -4.5 -3.5 -2.5 -1.5 -0.5 0.5 1.5 2.5 3.5 4.5 5.5 6.5 7.5
Difference
FIG. 1. Differences between calculated and measured doses for both on- and off-axis within the volume of the bronchus phantom.
Frequency off
Frequency on
148.2 ± 2.9 cGy
151.8 ± 3.2 cGy

IAEA-SM-330/57 265
3.4. Output
T h e range o f d iffe re n c e betw een m easured and stated doses w a s — 2 .5 to
+ 0 . 3 % w ith a m ean d iffe re n c e o f - 1 . 0 % ± 1 .2 % .
3.5. Anatomical phantom measurements
F in a l ly , som e o f the b ro n c h u s p ha ntom m ea su re m e nts are g iv e n in T a b le I V
and F ig . 1. T h e s e a re a ll va lue s fro m w h ic h the actual o u tp u t o n th e day o f m ea sure
m e n t has been excluded b y c a lib ra tin g the m e a sure m e nt cham ber a g a inst the m achine
m o n ito r.
4 . D I S C U S S I O N
T h e p ha ntom re s u lts p resented above exclude the a b so lu te o u tp u t, w h ic h is n o t
the sub jec t o f d isc u ss io n he re . I t i s th e re fo re o f in te re s t to m ake u se o f a ll these m ea
su re m e n ts to t r y to id e n tify the m a in sources o f d iffe re n c e betw een the va lue s mea
su re d fo r the anatom ica l p ha ntom and the calculated va lu e s. T h e re p ro d u c ib ility o f
anatom ica l p ha ntom m ea surem e nts is b e tte r than 1 % . I f w e m ake the fo llo w in g
a ssu m p tio n s about sy ste m e r ro rs :
— E r r o r s in depth dose data 0 .5 %
— E r r o r s in iso d o se data 0 .5 %
— C o rre c tio n fo r F S D 0 .5 %
— C a lc u la tio n o f m o n ito r u n its 0 .5 %
— W e d g e fa c to r 0 .3 %
— In h o m o g e n e ity and o b liq u ity c o rre c tio n 1 %
and com bine these w ith the ty p ic a l changes f ro m w e e k to w e e k th a t w e have
m ea sured , na m ely :
— F la tn e ss 1 .0 %
— E n e rg y 0 .3 %
— W e d g e m o ve m e nt 1 .0 %
the n w e o b ta in a com bined u n c e rta in ty o f ± 2 .0 % , w h ic h is c lose in va lue to the
standard d e v ia tio n fo r the p ha nto m re s u lts .
5 . C O N C L U S IO N
T h e apparatus used fo r these te s ts i s s u f f ic ie n t ly accurate to sh o w changes
w ith in the l im it s o f p e rfo rm a n c e o f the lin e a r accelera tor tested. T h e ranges o f va lue s
o f ke y p a ra m e te rs sh o w h o w w e ll the m a jo r ity o f c entres have p e rfo rm e d . T h e w eak
266 AIRD et al.
areas are in fla tn e ss , ene rgy and wedge a tte nua tio n , w ith the la s t pa ram ete r causing
th e m o s t p ro b le m s w h e re the wedge is attached to the f r o n t o f the head and m oves
in i t s m o u n tin g w h e n the g a n try is ro ta ted . T h e anatom ical p ha ntom m e a surem e nts
sh o w a ty p ic a l standard d e v ia tio n o f 2 .4 % betw een calculated and m easured va lu e s,
w h ic h is p ro b a b ly due to a c o m bina tio n o f se ve ra l e r ro rs o f 1 % o r le ss .
R E F E R E N C E S
[1] INTERNATIONAL ELECTROTECHNICAL COMMISSION, Medical Electric Equipment — Medical Electron Accelerators: Functional Performance Characteristics, Publication 976, IEC, Geneva (1989).
[2] INTERNATIONAL ELECTROTECHNICAL COMMISSION, Medical Electric Equipment — Medical Electron Accelerators in the Range 1 MeV to 650 MeV : Guidelines for Functional Performance Characteristics, Publication 977, IEC, Geneva (1989).
[3] HOSPITAL PHYSICISTS’ ASSOCIATION, Revised Code of Practice for the dosimetry of 2 to 35 MV X-ray, and of caesium-137 and cobalt-60 gamma-ray beams, Phys. Med. Biol. 28 (1983) 1097-1104.
[4] INTERNATIONAL COMMISSION ON RADIATION UNITS AND MEASUREMENTS, Tissue Substitutes in Radiation Dosimetry and Measurement, ICRU Rep. 44, Bethesda, MD (1989).

IAEA-SM-330/3
Q U A L I T Y A S S U R A N C E O F T H E R A P Y L E V E L
M E A S U R E M E N T S A T T H E S E C O N D A R Y S T A N D A R D
D O S I M E T R Y L A B O R A T O R Y , S O F I A
V . P E N C H E V , Z . B O U C H A K L I E V , B . C O N S T A N T I N O V ,
R . P O P P I T Z , K . IV A N O V A
La b o ra to ry o f C lin ic a l D o s im e try
and Io n iz in g R a d ia tio n s M e tro lo g y ,
Q ueen Joanna U n iv e r s i ty H o s p ita l,
S o f ia , B u lg a r ia
Abstract
QUALITY ASSURANCE OF THERAPY LEVEL MEASUREMENTS AT THE SECONDARY STANDARD DOSIMETRY LABORATORY, SOFIA.
The Secondary Standard Dosimetry Laboratory (SSDL), Sofia, has more than 15 years of experience in calibration of therapy level dosimeters for X ray qualities in the range of 5-150 keV effective energy and for мСо y radiation. Some of the methods used for checking the constancy of the secondary standards and evaluating the reliability of the whole complex of equipment and methods used for calibrations are described. The results from comparisons with Primary Standard Dosimetry Laboratories and other SSDLs showed an agreement to within ±2%. Since 1975 a programme for TL postal dose intercomparisons of wCo teletherapy units in Bulgaria has been performed by the SSDL, Sofia. The data analysis showed that 86% of the deviations between stated and measured doses are within ±5%.
1. I N T R O D U C T I O N
T h e accuracy o f dose d e te rm in a tio n and o f dose d e liv e ry is v e ry c rit ic a l fo r
the outcom e o f ra d ia tio n tre a tm e n t. A c c o rd in g to th e In te rn a tio n a l C o m m iss io n o n
R a d ia tio n U n i t s and M e a su re m e n ts ( I C R U ) the dose d e live re d to the ta rg e t v o lu m e
sh o u ld be k n o w n at le a st to w ith in ± 5 % [1 ] . So m e in v e s tig a tio n s ind ica te th a t even
b e tte r accuracy i s p re fe ra b le [2 ] .
T h e ro le o f th e Se c o nd a ry S ta nd a rd D o s im e try La b o ra to ry ( S S D L ) as a l in k
betw een the P r im a ry S ta nd a rd D o s im e try La b o ra to ry ( P S D L ) and the rad io the ra p y
c e n tre s, in p a rtic u la r in c o u n tr ie s w h e re th e re is n o P S D L , is c ru c ia l. O u r la b o ra to ry
w a s e sta b lishe d in the e a rly 1 9 5 0 s as a d o s im e try la b o ra to ry in the D e p a rtm e n t o f
R a d io lo g y and R a d io th e ra p y and w a s developed as an S S D L in th e 1 9 7 0 s . S in c e 1 9 7 7
th e la b o ra to ry has been a m e m be r o f th e I A E A / W H O N e tw o rk o f S S D L s .
In th is paper w e p re se n t o u r experience in q u a lity assurance o f the ra p y le v e l
m e a su re m e nts a t an S S D L .
267

268 PENCHEV et al.
2 . M A T E R I A L S A N D M E T H O D S
W e ca lib ra te c lin ic a l d o s im e te rs in te rm s o f e xp o su re a t chosen q u a litie s in the
e ffe c tive X ra y energy ranges o f 5 - 3 0 and 2 0 - 1 5 0 k e V and at “ С о y ra d ia tio n . T h e
sources fo r X ra y q u a lit ie s a re tw o X ra y the ra p y m a ch ine s: a M u e lle r R T - 1 0 0 fo r
the s o ft X ra y range and a T H X - 2 5 0 (H u n g a ry ) fo r the m e d iu m energy range. B o th
m achines are used o n ly fo r c a lib ra tio n p u rp o se s and are coupled to o p tic a l benches
and equipped w ith a ll the necessary f i l te r s , d ia p h ra g m s, m o n ito r cham bers, la se r
p o in te rs , etc. A deta iled stu d y o f the p ro p e rtie s o f the X ra y g e n e ra to rs , beam s and
m o n ito r cham bers has been made in o rd e r to assess th e ir re lia b ility . T h e y ra y
c a lib ra tio n is c a rrie d o u t w ith a “ C o te le the ra p y u n it used fo r ro u tin e tre a tm e nt o f
p a tie n ts.
V a rio u s io n iza tio n cham bers ( N E 2 5 0 5 / A , N E 2 5 3 2 / 3 , N E 2 5 6 1 , N E 2 5 7 1 )
and m e a su rin g a sse m b lie s ( F a rm e r 2 5 0 2 , N E 2 5 6 0 , N E 2 5 7 0 ) ca lib ra ted at a P S D L ,
m a in ly the N a tio n a l O ff ic e o f M e a su re s ( O M H ) , H u n g a ry , w e re used as secondary
standard cham bers ( S S C h s ) and e le c tro m e te rs. In an S S D L th e y are the e sse n tia l p a rt
o f the c a lib ra tio n fa c ilit ie s as the w h o le w o rk depends o n th e ir s ta b ility . T o check
the s ta b ility o f the secondary standards w e are u s in g se ve ra l m etho ds.
3 . R E S U L T S A N D D I S C U S S I O N
T h e re s u lts f ro m the m ea surem e nts w ith the rad io ac tive check source fo r tw o
S S C h s are p re sented in F ig . 1. I t can be seen th a t th e re has been v e ry good s ta b ility
fo r m o re than te n ye a rs.
H o w e v e r, th is te s t is n o t s u f f ic ie n t to guarantee the constancy o f the cham ber
energy re sp o nse o v e r the w h o le energy rang e . In o rd e r to be able to check th is w e
ca lib ra te in o u r beam s at le a st one m o re cham ber aga inst the S S C h im m e d ia te ly a fte r
i t s c a lib ra tio n at the P S D L . T h e q u a litie s used a re 4 .0 m m A l , 0 .5 m m C u , 1 .5 m m
C u and 3 .2 m m C u H V L and “ C o . T h e s e a d d itio n a l cham bers are p re se rve d and
used fu r th e r o n ly fo r in te rc o m p a riso n s w ith S S C h s at le a st once a ye ar o r w he n
nece ssa ry . T h e consiste nc y o f the energy re sp o nse w a s w ith in the l im it s o f ± 0 . 5 %
fo r “ C o and ± 1 . 0 % fo r X ra y s .
T h e v a st m a jo r ity o f c lin ic a l d o s im e te rs u n d e rg o in g c a lib ra tio n at o u r la b ora
to ry are o f types V A - J - 1 8 and 2 7 0 1 2 , b o th made in the fo rm e r G e rm a n D e m o c ra tic
R e p u b lic . T h e m e a su rin g in s tru m e n ts are m u ltira n g e and have tw o m odes o f opera
t io n : e xp o su re and e xp o su re ra te . S e v e ra l cham bers can be used w ith th e m . A c c o rd
in g to the m a n u fa c tu re r the m easured va lue X i s g ive n b y :
X = M F ¡ F 2F k (scale d iv is io n s )
w h e re M is the scale re a d ing , F i the range se le c tio n fa c to r, F 2 the m ode se lec tion
fa c to r and F k the cham ber fa c to r.

IAEA-SM-330/3 269
0.4 -
0.2
о«■>ФО -0.2
-0.4
1981 1985 1990
Y e a r
FIG. 1. Chronological plot of percentage deviations between the mean value for each year and the control value of the radioactive check source measurements for the SSChs NE 2571(a) and NE 2505/A (+). The deviation of the weighted (according to the number of measurements) general mean value for a period of 12 years for NE 2571 is 0.01% with a standard deviation of ±0.3%. For NE 2505/A (9 years) the deviation of the mean is —0.01% and the standard deviation is ±0.6%.
I n o rd e r to im p ro v e the accuracy o f m ea su re m e nts w e d e te rm in e c o rre c tio n
c o e ffic ie n ts fo r each o f the q u a n titie s o n the r ig h t hand side o f the fo rm u la presented
above. T h e corrected va lue is th e n g iv e n b y :
X c = M k (M )F 1 k 1( F l )F 2 k2(F 2 )F k N x ( R )1
w h e re
k (M ) i s the scale n o n - lin e a rity c o rre c tio n c o e ffic ie n t;
k i ( F i ) i s the range fa c to r c o rre c tio n c o e ffic ie n t;
k2(F 2) i s the m ode fa c to r c o rre c tio n c o e ffic ie n t;
N x is the e xp o su re c a lib ra tio n fa c to r o f the io n iza t io n cham ber ( th is fa c to r
im p lic it ly in c lu d e s a c o rre c tio n c o e ffic ie n t fo r the cham ber fa c to r F k) .
D u r in g th e p e rio d o f la b o ra to ry o p e ra tio n m any d o s im e te rs o f the types m en
tio n e d above have been ca lib ra ted m o re than tw ic e . F o r e ve ry ca lib ra ted d o s im e te r
w e keep the re c o rd s o f a ll m ea su re m e nts and c a lc u la tio ns as w e ll as copies o f c e r t i f i
cates issu e d . T h e accum ulated data fo r m o re tha n ten d o s im e te rs o f each typ e have
been p rocessed and the lo n g te rm s ta b ility o f each o f the c o rre c tio n fa c to rs has been
1 1 R = 2.58 x IQ"4 C/kg.

270 PENCHEV et al.
1 .0 4
"c 1 .0 3031^ 1.02ф(0
1 101
0 .9 9
о
---------------------H V L = 1 .5 m m C u ( о )вое*, (+)
+
+ — А----1----1----1----1----1----1----1----1----1----1----1----1-1978 1980 1985 1990
Y e a r
F IG . 2. C hrono log ica l p lo t o f the exposure ca libration fa cto rs N x / o r medium energy X rays
and 60C o o f a VA-J-18 dosimeter with VA-K-253 ionization chamber. The lines correspond to
the mean value o f the f irs t f iv e calibrations f o r each energy. The standard deviations are
± 1 .8 % f o r X rays and ± 1 % f o r mCo.
d e te rm ine d [ 3 ] . T h e lo n g te rm s ta b ility o f the c o rre c tio n c o e ffic ie n ts k , k x and k2 is
in the o rd e r o f ± 1 % ; th a t o f th e e xp osure c a lib ra tio n fa c to r N x i s in the o rd e r o f
± 1 % fo r ^ C o and ± 2 % fo r the m e d iu m energy X ra y rang e , except fo r the H V L s
o f 2 .0 m m A l and 4 .0 m m A l , fo r w h ic h i t i s ± 2 . 5 % . T w o c o n c lu sio n s can be
d ra w n :
— T h e V A - J - 1 8 and 2 7 0 1 2 d o s im e te rs have good lo n g te rm s ta b ility .
— T h e w h o le c om plex o f m e tho ds and fa c ilit ie s used b y u s in the p ro c e ss o f
c a lib ra tio n sh o w s good re p ro d u c ib ility and lo n g te rm s ta b ility .
A s an exam ple , a c h ro n o lo g ic a l p lo t o f the e xp o su re c a lib ra tio n fa c to rs N x fo r
a p a rtic u la r V A - J - 1 8 typ e d o s im e te r and typ e V A - K - 2 5 3 io n iza t io n cham ber is
presented in F ig . 2 . W e are n o w u s in g such p lo ts to ob ta in a genera l idea o f the q ua l
i ty o f the la b o ra to ry ’ s w o rk . W h e n the va lue o f a c o rre c tio n c o e ffic ie n t o r c a lib ra tio n
fa c to r i s s ig n if ic a n tly o u ts id e th e above m e ntio ne d l im it s w e can take th e necessary
m e a su re s in o rd e r to f in d the re a so ns fo r such a d e v ia tio n .
3.1. Comparisons with other laboratories
T h e in e v ita b le d iffe re n c e s betw een beam p ro p e rtie s and the o th e r c o n d itio n s
o f c a lib ra tio n a t th e P S D L and a t the S S D L lead to u n c e rta in tie s w ith u n k n o w n
m a g n itud e . U s u a lly , i t i s assum ed tha t the y are sm a ll as the e ne rg y re sp o nse o f the
S S C h is sm a ll. N e v e rth e le ss m is ta k e s in d ete rm in a tio n o f beam p ro p e rtie s at the
S S D L cou ld in tro d u c e sy ste m a tic e r ro rs o f unacceptable m a g n itud e . P a rt ic ip a tio n in
in te rc o m p a riso n s w ith o th e r la b o ra to rie s is a m etho d to detect such e r ro rs .

IAEA-SM-330/3 271
T A B L E I . R E S U L T S O F T H E S S D L , S O F I A , F R O M C I R C U L A R I N T E R
C O M P A R IS O N S I N T H E L O W E N E R G Y X R A Y R A N G E B E T W E E N P S D L s O F
T H E F O R M E R C M E A C O U N T R I E S
U, HVL A^SSDLVA^PSDLs)
(kVp) (mm Al)1979 1990
10 0.03 1.001 0.998
30 0.18 1.004 1.003
50 1.0 0.995 1.001
50 2.3 0.997 1.004
TABLE П. RESULTS FROM EN ERG Y X RA Y RANGE
SO M E CO M PARISONS IN THE M E D IU M
Year Laboratory Comparison with:Deviation (%)
Min. Max.
1981 SSDL, Sofia IAEA 0.03 0.7
1984 SSDL, Sofia INORa -0.2 0.8
1987 Circular PSDLsb 0.5 -1.5
1988 SSDL, Istanbul IAEA -0.5 -1.5
a Instituto Nacional de Oncología y Radiobiología, Havana. b PSDLs of the former CMEA countries.
W e have had the o p p o rtu n ity to be inc lude d as o b se rv e rs in a p ro g ra m m e fo r
c irc u la r in te rc o m p a riso n betw een the P S D L s o f the c o u n tr ie s th a t w e re m e m b e rs o f
the fo rm e r C o u n c il fo r M u tu a l E c o n o m ic A ss is ta n c e ( C M E A ) . T h e m etho d w a s to
d e te rm in e a t each la b o ra to ry th e e xp o su re c a lib ra tio n fa c to r o f a w o rk in g standard
cham ber. F o r lo w energy X ra y s i t w a s a tra n sp o rta b le fre e a ir cham ber. T h e ra tio s
o f the N x d e te rm ine d at o u r la b o ra to ry to th e m ean va lue o f the N x d e te rm ine d at
the P S D L s are g iv e n in T a b le I .
T h e c irc u la r in te rc o m p a riso n fo r the m e d iu m energy X ra y range w a s p e r
fo rm e d in 1 9 8 7 . T h e w o rk in g sta nd a rd w a s an N D 1 0 0 2 typ e c a v ity cham ber ( O M H ,
H u n g a ry ) . O u r re s u lts a re g iv e n in T a b le П , w h e re the data fo r som e o th e r c o m p a ri
so n s in th is e ne rg y range in w h ic h w e p a rtic ipate d are a lso su m m a rize d .

272 PENCHEV et al.
F o r “ С о 7 ra d ia tio n w e pa rtic ipated in the I A E A S S D L T L dose in te r-
c o m p a riso n p ro g ra m m e . T h e I A E A D o s im e try La b o ra to ry has d e te rm ine d tha t the
accuracy o f i t s m etho d is about ± 3 . 5 % o n the 2 a le v e l [4 ] . T h e d e v ia tio n s between
the doses stated by u s and tho se m easured a t the I A E A w e re : + 0 . 4 % (1 9 8 0 ) , + 2 . 2 %
(1 9 8 5 ) , - 0 . 0 5 % (1 9 8 7 ) , - 0 . 1 % (1 9 8 9 ) , - 1 . 6 % (1 9 9 1 ) and - 1 . 1 % (1 9 9 2 ) .
T h e re s u lts c ited above p ro ve the v e ry good accuracy o f the the ra py le ve l
m ea su re m e nts achieved at the S S D L , S o fia .
3.2. T L postal dose intercomparison for “Co teletherapy units
A n o th e r a c tiv ity o f the S S D L , S o fia , fo r q u a lity assurance o f dose d e te rm ina
tio n in ra d ia tio n the ra p y is a p ro g ra m m e fo r T L p o sta l dose in te rc o m p a riso n o f a ll
“ C o the ra p y u n its in B u lg a r ia [5 , 6 ] . T h e m etho d used is s im ila r to the I A E A
m etho d . T h e f i r s t ru n w a s c a rrie d o u t in 1 9 75 and 11 ru n s have been accom plished
so fa r . O f 173 re s u lts , 149 (8 6 % ) d e v ia tio n s betw een the dose stated b y the p a r
tic ip a n t and the dose m easured at o u r la b o ra to ry w e re w ith in ± 5 % and 3 d e v ia tio n s
w e re o u ts id e ± 1 0 % . T h e m ean d e v ia tio n w a s 1 . 4 % and the standard d e v ia tio n
± 3 . 3 % .
W h e n the a b so lu te va lue o f the d e v ia tio n is g re a te r than 5 % , the p a rtic ip a n t
i s asked to take u rg e n tly the necessary steps in o rd e r to f in d the source o f the e r ro r .
I f these e f fo r ts fa i l , w e m ake a s ite in sp e c tio n and the u n it is th o ro u g h ly checked and,
i f nece ssa ry , reca lib ra te d .
4 . C O N C L U S IO N S
T h e re q u ire d h ig h accuracy in the ra py le v e l dose m ea surem e nts and d e te rm ina
t io n s can be achieved o n ly i f each step in the sequence o f d o s im e tric p ro ced ure s fro m
the P S D L to the ir ra d ia t io n o f the p a tie n t is p e rfo rm e d v e ry c a re fu lly w ith a p re c is io n
as h ig h as p o ss ib le . I n an S S D L the re lia b ility o f the eq u ip m ent and the p re c is io n
o f the m e tho ds used sh o u ld be m o n ito re d c o n sta n tly . F o r th is p u rp o se som e com m on
m e tho ds are suggested . A p a rt f ro m these m e th o d s, e ve ry la b o ra to ry cou ld elaborate
i t s o w n m e tho ds u s in g the data fro m m e a surem e nts and p ro ced ure s th a t are p e rio d i
c a lly repeated. T h e accuracy o f c a lib ra tio n s p e rfo rm e d by an S S D L can be evaluated
w ith the re s u lts f ro m c o m p a riso n s w ith o th e r S S D L s o r , b e tte r, w ith P S D L s . T h e
re s u lts f ro m the c o m p a riso n s in w h ic h w e pa rtic ipa te d p ro ve the q u ite sa tis fa c to ry
accuracy achieved b y u s .

IAEA-SM-330/3 273
W e w o u ld l ik e to e xp re ss o u r g ra titu d e to the In te rn a tio n a l A to m ic E n e rg y
A g e n c y , in p a rt ic u la r to the D o s im e try S e c tio n , fo r the su p p o rt p ro v id e d to o u r
la b o ra to ry . T h i s has inc lude d se ve ra l g ra n ts fo r re sea rch contra c ts and fo r p a rtic ip a
t io n o f s ta f f m e m b e rs in s tu d y to u rs , tra in in g c o u rse s and sy m p o sia .
A C K N O W L E D G E M E N T S
R E F E R E N C E S
[1] INTERNATIONAL COMMISSION ON RADIATION UNITS AND MEASUREMENTS, Determination of Absorbed Dose in a Patient Irradiated by Beams of X or Gamma Rays in Radiotherapy Procedures, ICRU Rep. 24, Bethesda, MD (1976).
[2] BRAHME, A. (Ed.), Accuracy Requirements and Quality Assurance of External Beam Therapy with Photons and Electrons, Acta Oncol. 15 Suppl. 1 (1988).
[3] BOUCHAKLIEV, Z., CONSTANTINOV, B., PENCHEV, V., IVANOVA, K., POPPITZ, R., Results from the clinical dosimeter state examinations in our country, Stand. Kachestvo 41 1 (1990) 26-29 (in Bulgarian).
[4] SVENSSON, H., ZSDÁNSZKY, K., NETTE, P., IAEA-SM-330/69, these Proceedings.
[5] PENCHEV, V., CONSTANTINOV, B., IVANOVA, K., Postal dose TLD intercomparisons for cobalt-60 teletherapy units in Bulgaria (1975-1980), Isotopenpraxis 193 (1983) 81-85.
[6] CONSTANTINOV, B., PENCHEV, V., IVANOVA, K., “Results of the postal dose intercomparisons for the “Co units in Bulgaria in the period 1975-1987”, Abstracts of 5th Natl Conf. on Biomedical Physics and Engineering with International Participation, Sofia, 1988, Sofia Univ. (1988) 42-43.


D O S E , V O L U M E A N D
Q U A L I T Y S P E C I F I C A T I O N S
(Session 4)
C h a irm a n
P . R . A L M O N D
U n ite d S ta te s o f A m e ric a
C o - C h a irm a n
J . P . S I M O Ë N
Fra n c e


IAEA-SM-330/63
Invited P a p e r
I C R U R E C O M M E N D A T I O N S O N
“D O S E A N D V O L U M E S P E C I F I C A T I O N F O R
R E P O R T I N G I N T E R S T I T I A L T H E R A P Y ”
A . D U T R E I X * , D . C H A S S A G N E * , D . A S H ,
W . F . H A N S O N , A . G . V I S S E R , J . F . W I L S O N ,
A . W A M B E R S I E
In te rn a tio n a l C o m m iss io n on R a d ia tio n U n i t s
and M e a su re m e n ts ,
Be th e sd a , M a ry la n d
Abstract
ICRU RECOMMENDATIONS ON “DOSE AND VOLUME SPECIFICATION FOR REPORTING INTERSTITIAL THERAPY”.
A Draft Report has been prepared for the International Commission on Radiation Units and Measurements by an ICRU Committee on Dose and Volume Specification for Reporting Interstitial Therapy, and has been presented recently to the ICRU Main Commission for approval. The Report lists the various items of interest for reporting interstitial brachytherapy and gives a definition of the main terms. The concepts used are in full agreement with Report 38 on intracavitary therapy in gynaecology (1985) and with the new Report 50 on prescribing, recording and reporting photon beam therapy. The recommendations cover the following items: description of volumes; description of sources; description of technique, source pattern and time pattern; total reference air kerma; and description of dose and dose distribution, prescribed dose, peripheral dose, mean central dose and high and low dose regions. The Report considers the practical application of the recommendations and recommends priorities for the items to be reported depending, on the one hand, on the type of technique used and, on the other hand, on the level of computation available. Temporary implants, permanent implants, single line sources, moving sources and surface applicators are considered in detail.
1. I N T R O D U C T I O N
A D r a f t R e p o rt has been p repared fo r the In te rn a tio n a l C o m m iss io n o n R a d ia
t io n U n i t s and M e a su re m e n ts b y an I C R U C o m m itte e o n D o se and V o lu m e S p e c ifi
ca tion fo r R e p o rt in g In te rs t i t ia l T h e ra p y , and has been p re sented re c e n tly to the
I C R U M a in C o m m iss io n fo r a p p ro va l. T h e f in a l R e p o rt w i l l be p a rt o f a se rie s o f
* Present address: Département de radiothérapie, Centre de lutte contre le cancer Gustave-Roussy, F-94805 Villejuif Cedex, France.
277

278 D U T R E IX e t a l .
I C R U R e p o rts d ea ling w ith dose and v o lu m e sp e c ific a tio n s in ra d io th e ra p y : D o se
S p e c ific a tio n fo r R e p o rt in g E x te rn a l Be a m T h e ra p y w ith P h o to n s and E le c tro n s [ 1 ] ;
P re s c r ib in g , R e c o rd in g , and R e p o rtin g P h o to n B e a m T h e ra p y [ 2 ] ; and D o se and
V o lu m e S p e c ific a tio n fo r R e p o rt in g In tra c a v ita ry T h e ra p y in G yne c o lo gy [ 3 ] .
I t i s n o t the in te n tio n o f the R e p o rt, desc ribed h e re , to encourage u se rs to
depart f ro m th e ir n o rm a l p ractice o f b ra chy the rap y and dose p re sc rip tio n . T h e a im
i s to develop a com m on language w h ic h is based o n e x is t in g concepts. I t sh o u ld be
usab le to d esc rib e w h a t has been done in a w a y th a t can be m o re c lo se ly re la ted to
the outcom e o f tre a tm e n t and one th a t i s g e n e ra lly und e rsto o d .
In o rd e r to re ta in as m uch consiste nc y as p o ss ib le w ith dose and v o lu m e
sp e c ific a tio n fo r e x te rn a l beam ra d io the ra p y i t i s d e sira b le to use the sam e te rm s and
concepts w h e re v e r p o ss ib le . T h e d e fin it io n s o f the p a rtic u la r v o lu m e s used in the tw o
techn ique s are th e re fo re the sam e.
S e v e ra l c la ss ica l sy ste m s o f b ra chy the rap y have developed h is to r ic a lly . B e s t
k n o w n and m o s t w id e ly used w ith o r w ith o u t m o d ific a tio n are the M a n c h e ste r, P a r is
and Q u im b y sy s te m s. T h e te rm ‘ sy s te m ’ denotes a se t o f ru le s w h ic h takes in to
account the source typ e s and s tre n g th s , the g eom e try and the m etho d o f a p p lic a tio n
to o b ta in su ita b le dose d is t r ib u t io n s o v e r the v o lu m e (s) to be trea ted . T h e sy ste m a lso
p ro v id e s a m eans o f ca lcu la ting and sp e c ify in g dose . I t i s im p o rta n t to re m e m b e r tha t
w h ile an im p la n t m ay fo llo w the source d is t r ib u t io n ru le s o f a sy ste m i t does n o t
c o m ply w ith the sy ste m u n le ss the m ethod o f dose sp e c ific a tio n and p re sc r ip tio n is
a lso fo llo w e d .
2 . D E F I N I T I O N O F T E R M S A N D C O N C E P T S
2 .1 . S o u rc e sp e c ific a tio n
I t is recom m ended th a t rad io ac tive so u rc e s fo r b ra chy the rap y be sp e c ifie d in
th e q u a n tity re fe re n c e a ir k erm a ra te . T h e re fe re nc e a ir ke rm a ra te o f a so u rc e is
the ke rm a ra te to a ir , in a ir , at a re fe rence d istance o f 1 m e tre , corrected fo r a ir
a tte nua tio n and sc a tte rin g . F o r th is p u rp o se , the q u a n tity is e xp re ssed in G y -h " 1 a t
1 m e tre o r a m u lt ip le o f th is u n it . F o r lo w dose ra te b ra c hy the ra p y , the u se o f the
m u lt ip le ¡ i G y - h '1 a t 1 m e tre i s recom m ended [4 ] .
T h e c o n tro v e rsy betw een th e p o s it io n s o f F ra n c e and the U n ite d K in g d o m
[ 5 , 6 ] and th a t o f th e U n ite d S ta te s o f A m e ric a [7 ] has been c a re fu lly conside re d and
th e a rg u m e n ts in fa v o u r o f each so lu tio n have been exam ined b y the M a in C o m m is
s io n . C o n s id e rin g th e d e fin it io n s g ive n in R e p o rt 3 8 [ 3 ] , the nam e ‘ re fe rence a ir
ke rm a ra te ’ has been consid e re d as the m o s t c o nve n ie n t and the nam e ‘ s tre n g th ’ has
been re jected as to o vague. T h e M a in C o m m iss io n has co nsid e re d th a t the nam e o f
the q u a n tity im p lie s th a t, in the d e fin it io n , the a ir ke rm a ra te be m easured in re fe r
ence c o n d itio n s , i . e . at 1 m e tre . T h e re fo re the u n it cannot in c lu d e the square m e tre .

I A E A - S M - 3 3 0 /6 3 279
The term ‘strength’ can be used as a general word to qualify the sources, but cannot be included in the definition of a quantity.
2 . 2 . D e s c r ip t io n o f s o u r c e p a t t e r n s
Since essentially all implants irradiate a volume of tissue the term ‘volume implant’ should not be used to describe a specific implant.
(a) A single plane implant is defined as an implant containing two or more sources which lie in the same plane. The words ‘single surface implant’ should be used when the sources lie in a single curved surface.
(b) A two plane implant contains two planes which are generally parallel to each other.
(c) Larger implants can often be described according to the number of planes of sources used.
(d) I f the implant is not performed in recognizable planes then it may be described by the location of the sources relative to a plane passing through the centre of the implant or by a specific geometrical configuration (e.g. sphere or cylinder).
2 . 3 . T o t a l r e f e r e n c e a i r k e r m a
The total reference air kerma is the sum of the products of the reference air kerma rate and the irradiation time for each source. It is proportional to the integral dose to the patient and can also serve as a useful index for radiation protection of personnel.
2 . 4 V o lu m e s a n d p la n e s
The definitions of gross tumour volume and clinical target volume are entirely based on general gross oncological principles and, thus, are identical to the definitions given for external beam radiotherapy by the ICRU in Report 50 [2]. In interstitial brachytherapy the planning target volume is in general identical to the clinical target volume with very few exceptions and the term clinical target volume is used rather than planning target volume.
The treated volume is that volume of tissue, based upon the implant as actually achieved, which is encompassed by the isodose surface the value of which is the peripheral dose. This volume should, ideally, encompass entirely the clinical target volume.
Central plane: In source patterns in which the source lines are rectilinear, parallel and of equal length and the centres of which lie in a plane perpendicular to the direction of the source lines (Fig. 1), this plane is the central plane. When all source lines are not rectilinear, parallel and of equal length the central plane should be chosen perpendicular to the main direction of the source lines and passing through

280 D U T R E I X e t a l .
FIG. 1. Central plane. In an implant where the source lines are rectilinear, parallel and of equal length, the central plane is perpendicular to the direction of the source lines and passes through their centres: (a) planar implant, (b) two plane implant. The mean central dose Dm is the arithmetic mean of the doses in the regions of low dose gradient.
the centre of the implant. The calculation of dose distributions in multiple planes throughout the clinical target volume shows that the position of the central plane is not critical.
2 . 5 . D e s c r ip t io n o f d o s e d is t r ib u t io n
In brachytherapy the dose distribution is non-homogeneous and includes steep dose gradients and regions of high dose. However, within the volume of the implant there are regions where the dose gradient approximates to a plateau. These regions of low dose gradient are equidistant between adjacent neighbouring sources, for sources of identical linear activity (Fig. 2). They are the place where the dose can be calculated most reproducibly by different centres.
In order to provide the minimum of information needed about the dose or dose- rate distribution, the calculation of isodose curves in at least one chosen plane is necessary: the central plane should be chosen for this purpose.
Prescribed dose: For the purposes of the Report the prescribed dose is defined as the dose which the physician intends to give and enters in the patient’s treatment chart. It is not the intention of the Report to encourage users to depart from their normal practice of dose prescription.
Peripheral dose: The peripheral dose is the minimum dose at the periphery of the clinical target volume. It should be equal to the minimum dose decided upon by the clinician as adequate to treat the clinical target volume. The peripheral isodose is the isodose surface corresponding to the peripheral minimum dose. It defines the treatment volume and should entirely encompass the clinical target volume. It corresponds to the prescribed dose in many instances.

I A E A - S M - 3 3 0 /6 3 281
Mean central dose: In the field of brachytherapy, the mean central dose is taken to be the arithmetic mean of the local minimum doses between sources, in the central plane, or in the central planes if there is more than one (in the case of complex implants).
Three practical methods are acceptable for determining mean central dose in the central plane:
(a) In the case of implants with parallel lines, determine the intersection points of the perpendicular bisectors of each triangle formed by the intersections of three adjacent source lines with the central plane, and calculate the local central dose at each of these points. The mean of these local central doses is the mean central dose (Fig. 1).
FIG. 2. Plateau region between radioactive sources. The dose distribution in a plane perpendicular to parallel source lines shows a plateau region of low dose gradient. In this example of three sources, each 6 cm long and with 1.5 cm spacing, the dose varies by less than 2% in the grey region between the sources.

282 D U T R E I X e t a l .
(b) Evaluation of profiles: Calculate dose profiles for one or more axes through the centre of the implant, expected to pass through as many local minima as possible. Determine, by inspection, the local minimum doses. The mean of these local minimum values is the mean central dose.
(c) Inspection of distributions: Plot the dose distribution in the central plane. With isodose lines varying by 5% (at most 10%) of the local dose in the central region, the local minima can be determined by inspection. The mean of these local minima is the mean central dose.
High dose regions: In order to correlate radiation dose with late damage, the high dose regions around sources should be assessed (Fig. 2). It is suggested that a dose of approximately 100 Gy is likely to be significant in determining late effects. In those patients who receive 50-60 Gy as peripheral minimum dose or 60-70 Gy as mean central dose, 100 Gy corresponds approximately to 150% of the mean central dose. It is therefore recommended to report the region receiving more than 150% of the mean central dose.
The high dose regions should be defined as the regions encompassed by the isodose corresponding to 150% of the mean central dose around the sources in any plane parallel to the central plane where a high dose region is suspected. The maximum dimension of all regions in all planes calculated should be reported.
Low dose regions: In order to correlate the local recurrence rate with the dose distribution, it is recommended to report low dose regions. A low dose region should be defined as a region, within the clinical target volume, encompassed by an isodose corresponding to 90% of the prescribed dose. The maximum dimension of the low dose region in any plane calculated should be reported.
Dose uniformity parameters: Two parameters describing dose uniformity for interstitial implants can be derived directly from the concepts of peripheral minimum dose and mean central dose:
(a) The spread in the individual minimum doses used to calculate the mean central dose in the central plane, expressed as a percentage of the mean central dose;
(b) The dose homogeneity index, defined as the ratio of peripheral minimum dose to mean central dose.
Additional representations of dose distribution: In order to obtain a full perception of the dose distribution of an implant, the use of volume dose calculations has been advocated. For this purpose the clinical target volume (or a larger volume including an additional margin) is divided into subvolumes (e.g. cubes) and the dose rate is calculated at the centre of each subvolume. Because of high dose gradients, significant differences in calculated volumes can be observed, depending upon the size of the elementary subvolumes. Volume dose data can also be represented by means of histograms, showing the distribution of parts of the clinical target volume receiving doses within chosen intervals. The value of these alternative representa-

I A E A - S M - 3 3 0 /6 3 283
tions of the dose distribution as possible prognostic factors for treatment outcome has still to be established in clinical research.
2 . 6 . T i m e d o s e f a c to r s
Considerable experience has been gained over many years with conventional dose rates. Even with these conventional treatments it has been recognized that the dose rates within and adjacent to the target volume vary considerably as a function of the distance from the sources and that these variations may be significant in determining effects on both tumour and normal tissues. The development of new afterloading techniques and in particular the use of high dose rate introduce new time dose patterns which require evaluation.
2.6.1. Times and dose rates for temporary implants
Irradiation time is the time during which a radioactive source is present in the patient.
Overall treatment time is the total time elapsed from the beginning of the first irradiation to the end of the last one.
Instantaneous dose rate is the quotient of the dose and the irradiation time.Average dose rate is the quotient of the dose and the overall treatment time.
Average dose rate is a concept useful for continuous low dose-rate irradiations with or without short interruptions as well as for pulsed irradiations.
2.6.2. Time dose pattern for temporary implants
Continuous irradiation: The overall treatment time does not differ from the irradiation time; only the instantaneous dose rate is considered.
Non-continuous irradiation: With the advent of remote afterloading, in most instances the overall treatment time is greater than the total irradiation time (which is the sum of the partial irradiation times) owing to incidental or planned short interruptions during the treatment. The instantaneous dose rate is greater than the average dose rate. In low dose-rate irradiations, when the duration of one given interruption is longer than 1 0 % of the total irradiation time, the irradiation should be considered as fractionated.
Fractionated irradiation: In this type of treatment, irradiation time is divided into multiple fractions. Irradiation time per fraction and interval between fractions are important parameters. In fractionated irradiation the overall treatment time is much greater than the total irradiation time. For fractionated irradiation, the instantaneous dose rate is the quotient of the dose per fraction and the irradiation time per fraction, and the average dose rate is, in general, meaningless. Although the time interval between fractions is usually of the order of a day or days, a low dose-rate

284 D U T R E I X e t a l .
irradiation is considered as fractionated when one given interruption is longer than 1 0 % of the total irradiation time.
Hyperfractionated irradiation: When two or more fractions are given per day, the irradiation is considered as a hyperfractionated irradiation. When the time interval between short high dose-rate irradiations reaches or exceeds 2 h, the irradiation should be considered as a hyperfractionated irradiation. It should be considered as fractionated when the time interval is equal to one or several days.
Pulsed irradiation: When a single high dose-rate source is used to give a sequence of short irradiations to simulate continuous low dose-rate irradiation, the irradiation should be considered as a pulsed irradiation as long as the time interval is shorter than 2 h.
3. RECOMMENDATIONS FOR RECORDING AND REPORTING
The guidelines for reporting dose w ill make it possible to compare results of future brachytherapy practice and to better relate outcome to treatment. In order to report an implant the following should be recorded.
3 . 1 . P a r a m e t e r s r e q u i r e d f o r r e c o r d in g a n d r e p o r t i n g
Description of volumes: The description of the volumes should include as a minimum the gross tumour volume, the clinical target volume and the treated volume.
Description of sources:
(i) Radionuclide used, including filtration, if relevant;(ii) Type of source used, i.e. wire, seeds, seed ribbon, hairpin, needle, etc.;
(iii) Length of each source line used;(iv) Reference air kerma rate of each source or source line;(v) The distribution of the strength within the source.
Description of technique and source pattern: I f the source distribution rules of a standard system have been followed this shall be specified; if not, the source pattern should be described. The following data should also be recorded:
(a) Number of sources or source lines;(b) Separation between source lines and between planes;(c) Geometrical pattern formed by the sources with the central plane of the implant
(e.g. triangles or squares) where relevant;(d) The surfaces in which the implant lies, i.e. planes or curved surfaces;(e) Whether crossing sources are placed at one or more ends of a group of linear
sources;

I A E A - S M - 3 3 0 /6 3 285
(f) The material of the inactive vector used to carry the radioactive sources, if any (e.g. flexible or rigid); whether rigid templates are used; one or both ends;
(g) Type of remote afterloading, if used.
Description of time pattern: The description of the time pattern should include the type of irradiation with the necessary data on treatment and irradiation times. The information on dose and time should provide the necessary data to calculate instantaneous and average dose rates. When the irradiation times of the different sources are not identical they should be recorded.
Total reference air kerma: The total reference air kerma for the total irradiation time should be recorded.
TABLE I. PRIORITIES FOR REPORTING
• • , „ • • a Level of Parameters required for reporting interstitial implants Priority . кr computation
™4Description of volumes:
— Gross tumour volume— Clinical target volume
Description of sources and techniquesDescription of time 1 1
Total reference air kermaDescription of doses:
— Prescribed dose, including pointor surface of prescription j
— Reference doses in central plane:— Mean central dose
r 1 2— Peripheral dose _j
Description of high and low dose regions 2 3
Uniformity parameters >■ 3 3Alternative representation of dose distribution
Dose rates 3 1
a Priority. 1: Concerned with doses in the central plane. 2: Requires calculation outside the central plane. If this is not available then a much more detailed description of source pattern under priority 1 is required. 3. Additional information mostly of clinical research interest.
b Level of computation [8]. 1: No computer needed; 2: hand calculation and/or computer calculation in central plane; 3: 3-D computation needed.

286 D U T R E I X e t a l .
(a) Prescribed dose(b) Peripheral minimum dose(c) Mean central dose.
The following additional information, when available, should be recorded:
(a) Dimension of high dose region(s)(b) Dimension of any low dose region(c) Any dose uniformity data(d) Additional representation of dose distribution, if any.
3 . 2 . P r i o r i t y
Table I gives the three levels of priority and the different levels of dose computation sophistication needed to fu lfil the reporting requirements.
4. PRACTICAL APPLICATIONS OF THE RECOMMENDATIONS
The application of the reporting recommendations given above to existing systems and techniques is developed for the main systems used for temporary implants and permanent implants. The following special cases are also considered:
(a) Single stationary source(b) Moving sources(c) Surface applicators.
REFERENCES
[1] INTERNATIONAL COMMISSION ON RADIATION UNITS AND MEASUREMENTS, Dose Specification for Reporting External Beam Therapy with Photons and Electrons, ICRU Rep. 29, Bethesda, MD (1978).
[2] INTERNATIONAL COMMISSION ON RADIATION UNITS AND MEASUREMENTS, Prescribing, Recording, and Reporting Photon Beam Therapy, ICRU Rep. 50, Bethesda, MD (1993).
[3] INTERNATIONAL COMMISSION ON RADIATION UNITS AND MEASUREMENTS, Dose and Volume Specification for Reporting Intracavitary Therapy in Gynecology, ICRU Rep. 38, Bethesda, MD (1985).
[4] INTERNATIONAL COMMISSION ON RADIATION UNITS AND MEASUREMENTS, Radiation Quantities and Units, ICRU Rep. 33, Bethesda, MD (1980).
[5] COMITE FRANÇAIS «MESURE DES RAYONNEMENTS IONISANTS», Recommandations pour la détermination des doses absorbées en curiethérapie, CFMRI Rapport № 1, Bureau national de métrologie, Paris (1983).
Description o f dose distribution: The following doses should be recorded:

I A E A - S M - 3 3 0 /6 3 287
[6] BRITISH COMMITTEE ON RADIATION UNITS AND MEASUREMENTS, “ Specification of brachytherapy sources” , memorandum from the BCRU, Br. J. Radiol. 57 (1984) 941-942.
[7] AMERICAN ASSOCIATION OF PHYSICISTS IN MEDICINE, Specification of Brachytherapy Source Strength, Rep. No. 21, AAPM, New York (1987).
[8] INTERNATIONAL COMMISSION ON RADIATION UNITS AND MEASUREMENTS, Use of Computers in External Beam Radiotherapy Procedures with High- Energy Photons and Electrons, ICRU Rep. 42, Bethesda, MD (1988).


I A E A - S M - 3 3 0 /2 8
MEASUREMENTS OF ENERGY SPECTRA FROM HIGH DOSE RATE 192Ir SOURCES WITH A COMPTON SCATTERING SPECTROMETER
H. NILSSON, G. MATSCHEKO,E. LUND, G. ALM CARLSSON Department of Radiation Physics,Faculty of Health Sciences,Linkôping University,Linkoping, Sweden
A b s t r a c t
MEASUREMENTS OF ENERGY SPECTRA FROM HIGH DOSE RATE 192Ir SOURCES WITH A COMPTON SCATTERING SPECTROMETER.
A Compton scattering spectrometer has been used for spectral measurement of high dose rate (HDR) 192Ir sources. On the basis of the Compton formula a measured distribution of scattered photons is used for the calculation of the primary spectrum leaving the source. The two main reasons for measuring the photon energy distribution from such HDR sources are, firstly, to obtain accurate input for Monte Carlo calculations of the dose distribution and, secondly, to calibrate ionization chambers. The lack of spectral information causes calibration laboratories great difficulties in such work. A third possible reason concerns quality assurance with respect to source impurities, etc. The measured spectrum shows good agreement with the spectrum expected from theoretical considerations.
1. INTRODUCTION
It is of crucial importance to determine accurately the dose distribution in tissues surrounding high dose rate (HDR) afterloading sources. Most dosimeters are energy dependent and the measured values must therefore be corrected to yield the true dose distribution in tissue. Thus, to obtain accurate correction factors, the energy distribution of the photon fluence and its depth variations must be known [ 1]. This information can be obtained by means of Monte Carlo simulations, provided that the energy spectrum of primary photons emitted in the source through its encapsulation is known. The spectrum from an 192Ir source also includes bremsstrahlung and a small amount of scattered photons. The bremsstrahlung is generated mainly by decelerating (3 particles in the high atomic number iridium core; scattered photons are generated in the source itself and the encapsulation material. The second purpose in measuring the energy fluence is the calibration of ionization chambers. To date there is not a single calibration site which can offer such a calibration for HDR
289

290 N IL S S O N e t a l .
sources. By means of the measuring method presented in this paper it might be possible to correlate chamber reading against air kerma. The spectrum from an HDR 192Ir source was measured by means of a Compton scattering spectrometer, constructed by Matscheko and Ribberfors [2].
2. BACKGROUND
The photon fluence rate from an HDR 192Ir source is in the range of 106-107 crrT2 -s_1 at a distance of 1 m. Energy dispersive detectors cannot measure count rates exceeding 5 X 10⁴ s' 1 without showing line broadening and pile-up effects. To perform accurate spectral measurements a substantial reduction of the count rate must be obtained. This can be done by minimizing the solid angle subtended by the detector from the source. A source to detector distance of approximately 40 m might be necessary with a 10 cm2 detector. Alternatively a small collimator ( < 1 mm diameter) in front of the detector could be used.
The former method requires distances not available in clin ical laboratories. Many practical problems are also connected with the latter method. A collimator with a narrow hole w ill efficiently reduce the solid angle, but since scattered photons are generated in the collimator wall a severe disturbance of the spectrum might result. Moreover, a very small misalignment of such a collimator might cause an uncontrolled reduction of the solid angle of the detector.
Compton scattering [3] offers a third alternative for the reduction of the fluence rate at the detector. Compton scattering is the foundation upon which the present method of spectral measurement is based; this method was used earlier by Yaffe et al. [4] and Matscheko and Ribberfors [2]. With the fluence rate mentioned above the count rate at the detector w ill be well below the above stated level using a Compton spectrometer.
3. COMPTON SCATTERING METHOD
Photons with a primary energy hv w ill, after Compton scattering in an angle в, have an energy hvc given by the well known Compton formula:
hvhv с = --------------- ;---------------- (1)
1 + (hv/moC ) ( 1 — cos в)
In the present method the scattering angle в is fixed at 90° and the energy distribution <¡>hÁhvc) of the scattered photons is measured. A computer program reconstructs the primary spectrum Фhv(hv) at the entrance surface of the scatterer. The first step in this procedure is to calculate the energy distribution of scattered photons. This is
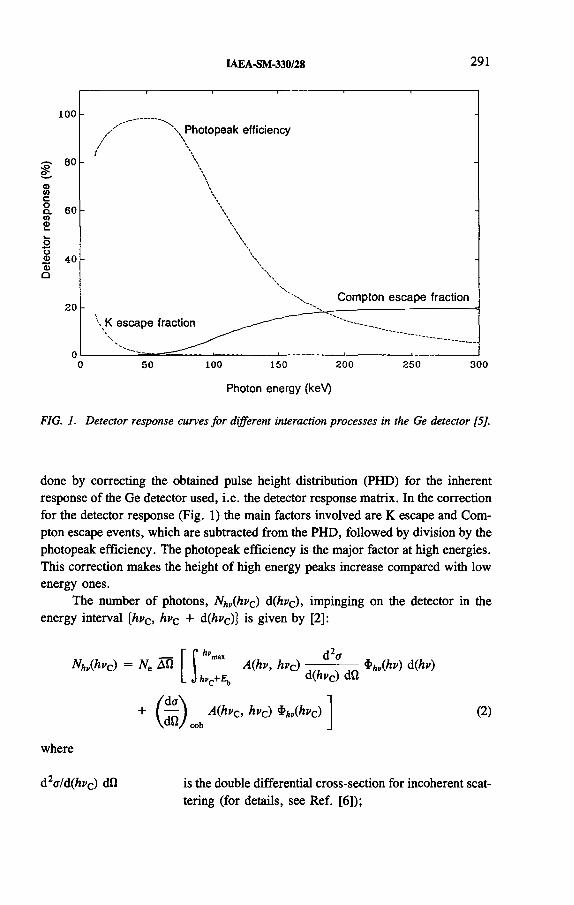
I A E A - S M - 3 3 0 /2 8 291
Photon energy (keV)
FIG. 1. Detector response curves for different interaction processes in the Ge detector [5].
done by correcting the obtained pulse height distribution (PHD) for the inherent response of the Ge detector used, i.e. the detector response matrix. In the correction for the detector response (Fig. 1) the main factors involved are К escape and Compton escape events, which are subtracted from the PHD, followed by division by the photopeak efficiency. The photopeak efficiency is the major factor at high energies. This correction makes the height of high energy peaks increase compared with low energy ones.
The number of photons, N hvQivc) d(hvc), impinging on the detector in the energy interval [hvc, hvc + d ^c )} is given by [2 ]:
d 2ст) bç.+Ej, d(ftvc) dñ
NhvQivc ) = We ДО Г f ши A(hv, hvc) ° Фь(М d(hv)L
( ^ ) A(hvc , hvc) b ht,{hvc) \d0 / COh
(2 )
where
d2a/d(hvc) dO is the double differential cross-section for incoherent scattering (for details, see Ref. [6 ]);

292 N IL S S O N e t a l .
is the total number of electrons in the scatterer;is the mean solid angle subtended by the detector frompoints within the scatterer;is the maximum photon energy in the primary spectrum; is the binding energies of the scattering electrons;
hv,
Ebmax
A(hv, hvc), A(hvc , hvc) are correction factors for attenuation in the scatterer and
The second term on the right hand side of Eq. (2) is the coherent scattering. The factor (dff/dfi)coh is given by:
where r0 is the classical electron radius.Using a low atomic number scatterer and a large scattering angle, for primary
photon energies above 35 keV, it holds that F 2(x, Z) is approximately zero. Thus, the contribution of coherent scattering to the scattered spectrum is negligible. In this energy region the atomic structure factor S(x, Z) ~ 1. The primary spectrum is then given by [2 ]:
$hÂhv) = N hy(hvc)INe \ r \ A(hv0, hvc)(vch Q + v0lvc - sin2 в) Ш (3)
4. EXPERIMENT
Figure 2 shows the set-up for spectral measurements. A source holder was mounted 310 mm above the Lucite scatterer in the Compton spectrometer. The distance between the scatterer and the entrance window on the detector was approximately 200 mm. Measurements were performed using a 4 mm (diameter) rod shaped Lucite scatterer, 40 mm long.
The acquired PHD w ill be due to signals from photons singly and multiply scattered in the scatterer, photons scattered in the air surrounding the scatterer and background photons. In the spectral reconstruction program corrections are made for the multiple scattering and air scattering but not for the background. The background mainly consists of signals from photons (originating from the HDR source) scattered in surrounding materials such as walls, ceiling and floor. The ratio between primary photons reaching the scatterer and scattered photons reaching the detector is about 106 :1. It is therefore important to reduce the background of primary and scattered photons penetrating the lead shielding. The most efficient way to do this is to shield the source. In order to suppress background the source holder therefore was supplied
the air for primary and scattered photons respectively; is the energy dependent fluence of photons.

I A E A - S M - 3 3 0 /2 8 293
Primarybeam
'Sourceholder
Lucitescatterer
Scatteredphotons
Transmittedbeam
= Lead shield
Internalcollimators
Compton spectrometer
Detectorelement
Signal to MCA
FIG . 2. Schematic draw ing o f the measuring geometry, showing the Compton spectrometer and source holder.
with a collimator package cast from a lead alloy. This collimator package (inset, Fig. 2) has an opening in the direction towards the scatterer and an opening in the opposite direction. The latter opening suppresses the amount of backscattered photons which otherwise would contribute to a distorted primary spectrum. A separate background measurement must be performed, either by blocking the entrance collimator or by removing the scatterer. In the latter method a correction must be made for air scattering within the volume that was occupied by the scatterer in the spectral measurement. The background is subtracted from the PHD prior to reconstruction of the primary spectrum.
5. RESULTS
In Fig. 3 the net PHD from a measurement of a 324 GBq 192Ir source is shown. The relative frequency of the peak at about 55 keV is large compared with that of the peaks at 200 keV. The primary spectrum reconstructed from the same PHD is shown in Fig. 4. The relative heights of the peaks at high energies are
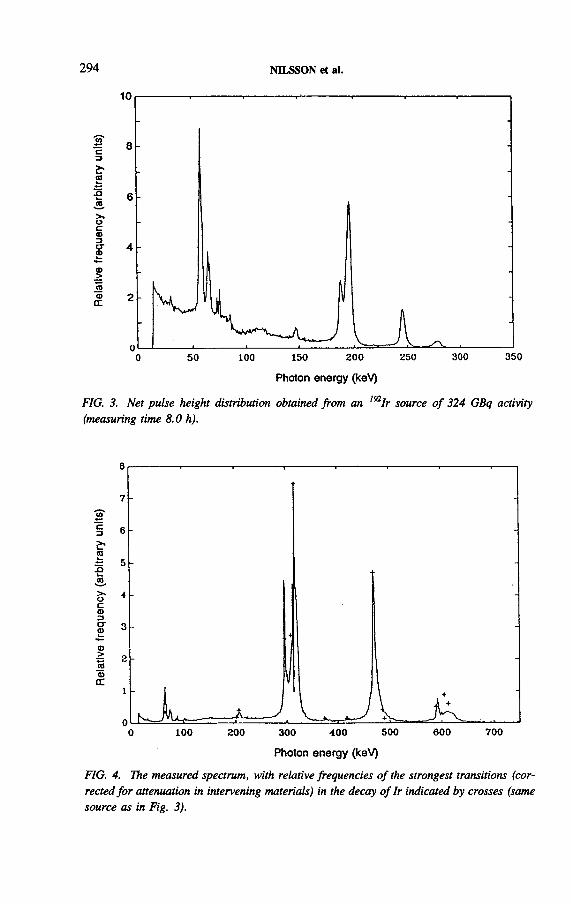
294 N IL S S O N e t a l .
Photon energy (keV)
FIG . 3. Net pulse height d istribu tion obtained from an ,92I r source o f 324 GBq activ ity (measuring tim e 8 .0 h).
Photon energy (keV)
FIG . 4. The measured spectrum, w ith relative frequencies o f the strongest transitions (corrected fo r attenuation in intervening m aterials) in the decay o f I r indicated by crosses (same source as in F ig. 3).

I A E A - S M - 3 3 0 /2 8 295
increased in the reconstructed spectrum compared with peaks at lower energies, i.e. there is a shift of relative frequencies towards higher energies in the reconstructed spectrum compared with the PHD. This shift is due to the corrections for the photopeak efficiency in the detector response correction algorithm (see also the detector response matrix, Fig. 1).
In Fig. 4 crosses indicate the tabulated energies and relative frequencies of the strongest 7 transitions in the decay of 192Ir [7]. These relative frequencies are corrected for attenuation in the iridium core, the stainless steel encapsulation and intervening air according to Ref. [8 ]. They are normalized to the measured spectrum at the most frequent energy line (316.5 keV) of the measured spectrum.
In the PHD, peaks are seen at approximately 58, 65 and 76 keV. The first peak is due to the strongest characteristic X ray lines, at 63, 65 and 67 keV, from the daughter products of Ir and from К X rays from lead. The three К X ray peaks from the daughter products are seen as only one peak at 65 keV in the reconstructed spectrum and hence not resolved. This indicates the limited energy resolution of the spectrometer. The continuous part of the spectrum is bremsstrahlung, caused by decelerating /3 particles emitted in the decay of 192Ir. The triple peak at 295-318 keV in the reconstructed spectrum corresponds to the double peak at 186-194 keV in the PHD. The increased number of peaks is due to an unfolding procedure which corrects for the Compton profile [2].
6 . DISCUSSION AND CONCLUSIONS
The overall resolution of the Compton spectrometer depends on the geometrical energy broadening, dG, the inherent energy resolution of the detector and the Compton profile, dC. Photons reaching the detector are scattered in a range of angles (depending mainly on the dimension of the scatterer and the size of the collimator in front of the detector) rather than a discrete angle. This gives rise to a geometrical energy broadening, dG. The electrons in the scatterer are not at rest as Eq. (1) assumes; the electrons move and give rise to the Compton broadening or Compton profile, dC. These factors contribute to a limitation in energy resolution of the reconstructed primary spectrum [9, 10].
The total energy resolution of the Compton spectrometer is a convolution of these three contributions. The maximum geometrical energy broadening, dG, for a 4 mm Lucite rod and the full width at half-maximum (FWHM) of the Compton profile, dC, for Lucite are plotted as functions of energy in Fig. 5. The inherent energy resolution of the Ge detector is negligible for energies above 50 keV compared with dG and dC.
To be useful for Monte Carlo calculations, a measured spectrum should have an energy resolution of 1-3 keV up to 150 keV and 5-10 keV up to 300 keV. For

296 N IL S S O N e t a l .
Photon energy (keV)
FIG . 5. The maximum geom etrical energy broadening, dG , and the FW HM value o f the Compton broadening, dC , as functions o f energy fo r the Compton spectrometer.
higher energies even a resolution of about 20 keV is sufficient. As can be seen in Fig. 5, it is a favourable coincidence that the demands on the energy resolution in a spectrum intended for Monte Carlo calculations are fulfilled by the Compton spectrometer measurements.
One major problem is the set-up of a scattering angle of exactly 90°. This is solved by iterative angle correction from the energy of the most frequent peaks of scattered photons. Alternatively the true scattering angle could be calculated prior to reconstruction and then this angle could be used in the reconstruction of the primary spectrum.
In order to determine the dose distribution accurately it is important to know if the attenuation in the encapsulation is equal in all directions. Therefore further developments include the possibility to measure the spectrum in directions other than perpendicular to the long axis of the source. Moreover, higher energy resolution can be reached using smaller scattering angles, в [9]. However, reducing the scattering angle makes the detector more transparent since the energies of scattered photons w ill increase accordingly (Eq. (1)). That is, larger correction factors in the detector response matrix must be used, which results in larger uncertainties in the reconstructed spectrum.

I A E A - S M - 3 3 0 /2 8 297
The results show that the Compton spectrometer is a suitable tool for spectral measurements on HDR sources. However, there is still some need for improvements, mainly to lower the influence of collimators and to optimize the detector size and shape. The collimators give rise to characteristic X rays from lead. This component might be reduced by improved shielding and/or redesign of the internal collimators of the spectrometer.
ACKNOWLEDGEMENT
This work was supported with grants from the Swedish Cancer Society.
REFERENCES
[1] MELI, J.A., MEIGOONI, A.S., NATH, R., On the choice of phantom material for the dosimetry of 192Ir sources, Int. J. Radiat. Oncol. Biol. Phys. 14 (1988) 587.
[2] MATSCHEKO, G., RIBBERFORS, R., A Compton scattering spectrometer for determining X ray photon energy spectra, Phys. Med. Biol. 32 (1987) 577.
[3] EVANS, R.D., The Atomic Nucleus, McGraw-Hill, New York (1955) Ch. 23.[4] YAFFE, М., TAYLOR, K.W., JOHNS, H.E., Spectroscopy of diagnostic X rays by
a Compton-scatter method, Med. Phys. 3 (1976) 328-334.[5] CHEN, Chintu, CHAN, Héangping, DOI, Kunio, Energy Responses of Germanium
Planar Detectors Used for Measurement of X-ray Spectra in the Energy Range from 12 to 300 keV: Monte Carlo Simulation Studies, Research Report UCHI-DR/84-01, Univ. of Chicago, IL (1984).
[6] RIBBERFORS, R., BERGGREN, K.-F., Incoherent X ray scattering functions and cross-sections (da/dfi')incoh by means of a pocket calculator, Phys. Rev., A Gen. Phys. 26 (1982) 3325-3333.
[7] INTERNATIONAL COMMISSION ON RADIOLOGICAL PROTECTION, Radionuclide Transformations: Energy and Intensity of Emissions, Publication 38, Pergamon Press, Oxford and New York (1983).
[8] VERHAEGEN, F.,VAN DIJK, E.,THIERENS, H., AALBERS, A., SEUNTJENS, J., Calibration of low activity 192Ir brachytherapy sources in terms of reference air kerma rate with large volume spherical ionization chambers, Phys. Med. Biol. 37 (1992) 2071-2082.
[9] MATSCHEKO, G., ALM CARLSSON, G., Compton spectroscopy in the X-ray energy range, I, Spectrometer design, Phys. Med. Biol. 34 (1989) 185-197.
[10] MATSCHEKO, G., ALM CARLSSON, G., RIBBERFORS, R., Compton spectroscopy in the diagnostic X-ray energy range, П, Effects of scattering material and energy resolution, Phys. Med. Biol. 34 (1989) 199-208.


I A E A - S M - 3 3 0 /5 4
BEAM QUALITY SPECIFICATIONS OF PHOTON BEAMS
M. KARLSSON, H. NYSTRÓM Radiation Physics Department,University of Umeâ,Umeà, Sweden
A b s t r a c t
BEAM QUALITY SPECIFICATIONS OF PHOTON BEAMS.Photon beam quality is normally determined for the central part of a centred field of
a defined size. Today, when there are at least three different methods for field flattening giving significantly different energy variations over the field area, it is important to have more detailed information about the off-axis photon energy. The treatment techniques are, furthermore, becoming more and more complex. Irregular and heavily off-centred beams, dynamic wedges, etc., are now often used in clinical practice. To obtain more detailed information about the energy distribution over the whole field a method based on narrow beam penetration of water (HVL in water) was used. A simple and reliable device for these measurements was constructed and was used in fields with different types of beam flattening to show the drastic difference between them. Measurement data for wedge fields shaped with metal wedges were obtained to show the difference between using dynamic wedges and metal wedges. Another drawback with the commonly used methods for beam quality specification, involving TPRjo and D20IDl0, is the large change in stopping power ratio relative to TPR,q when used for ionization chamber dosimetry. Also, it was recently shown that high energy electrons may affect these ratios in high energy beams. The relationship between HVL in water and the stopping power ratio of water to air, iw air, was shown to be close to linear over the whole energy range from “ Co to 50 MV.
1. INTRODUCTION
Beam quality specifications are used for different purposes: one is to determine correction factors for absolute dosimetry with ionization chambers and relative dosimetry with film and diodes. Another is to specify the beam quality when purchasing or using a medical accelerator. In the first case a measure is needed which can describe uniquely these correction factors with very small errors, whereas in the latter case we need a measure which is easy to understand but may in most cases not need to be very exact. In both cases we do, however, need information about the beam quality in the whole beam available for patient treatment. This cannot be obtained by methods using data only for the central axis of the beam.
299

300 K A R L S S O N a n d N Y S T R Ô M
At present the most common methods used for beam quality specification involve the TPRjo ratio and the D 2qID w ratio [1]. The existing stopping power ratio data [2 ] are calculated for photon beams obtained from specific energy-target-filter combinations describing realistic and ‘conventional’ clinical beams. Stopping powers are then correlated with the penetration properties of the beam, described by TPRiq. Different combinations of energy-target-filter are shown to result in different stopping power ratios for the same TPRjq. Even if new stopping power ratios were calculated for these combinations and correlated to TPRjq, the drawback of the steep slope of sw air versus TPRj® at high energies would remain.
Recently another method based on the percentage depth dose at 10 cm or the depth of 80% of the maximum dose has been suggested [3]. This method is very similar to that used in Ref. [4]. However, as is well known, when a normalization is performed at the dose maximum the percentage dose data w ill be very sensitive to variations in electron contamination. Also, the TPR and D ratios can, at high energies, be affected by differences in contamination of electrons from outside the phantom, as the range of secondary electrons in, for example, a 50 MV photon field can be significantly larger than 1 0 cm in water.
A ll methods described above are based on dose measurements on the central axis of a 10 cm X 10 cm field and no information about the off-centre variation of the beam quality is thus available. This off-centre dependence is essential in the calibration of non-centred beams where the stopping power ratio may not be identical to that at the beam axis. Also, when beam profiles are measured with ionization chambers, film or diodes, the correct factors must be applied. Depending on the beam flattening method, the energy spectrum can differ significantly in different parts of the beam.
In the bremsstrahlung production in the target, the mean energy of the photons in the forward direction is higher than that of the photons generated in larger angles[5]. This is an effect of both the basic electron interaction process [6 ] and the fact that scattered electrons deeper in the target w ill have lower energy and larger angular distribution. These electrons w ill produce bremsstrahlung of lower energy in a wider angular distribution. However, the elementary beam thus produced in the target is not useful for patient treatment without further flattening. The conventional one- element flattening filter used in most treatment units w ill harden the central parts of the beam further. A composite flattening filter of lower atomic number in the periphery w ill harden the beam more effectively also in the peripheral parts of the beam [5]. A third method is to use scanned photon beams where the elementary beam is pointing at the periphery of the available beam.
Instead of using the TPR or D ratios discussed above, we propose a method for photon beam quality determination which is not sensitive to the electron contribution but is much more sensitive to the photon energy and can be used to determine beam quality over the whole field. This method is based on narrow beam penetration of water, expressed as HVL in water, and these HVL data can easily be obtained

I A E A - S M - 3 3 0 /5 4 301
for the whole treatment field. From these penetration data it is possible to determine approximate mean energy distributions by Monte Carlo simulations of some clinical beams. A description of the beam quality in units of mean photon energy would give a much better idea about the beam quality as compared with the TPR and D ratios.
To be able to determine experimentally some quantity which describes the primary photon energy we have designed a device for penetration measurements in different parts of the field. Similar devices have been used by others [7, 8 ] but in these cases were not really designed for safe and easy handling. In the design of this new device for penetration measurements large efforts were undertaken to achieve a device which would be easy to use. Another design criterion was that the results should not be too sensitive to small errors in the experimental set-up.
To verify the simple handling of the device and at the same time show some typical characteristics of clinical beams, a series of measurements have been performed with this device on some clinical beams. In addition, the relation between HVL and sw air was briefly analysed.
2. MATERIALS AND METHODS
The device for penetration measurements (Fig. 1) was designed to determine the narrow beam or ‘good geometry’ attenuation in water of the primary photon beam. It is recommended to adjust the water level close to the expected HVL. The HVL value can then be calculated from the measured transmission value by Eq. (1) as the logarithm of the transmittance as a function of the length of the water column is close to linear [7]:
HVL = a (1)In a
where a is the length of the water column and a is the transmitted fraction.The hole in the primary lead collimator was designed to cover the measuring
detector with a margin of at least 7 mm even with set-up errors included. This margin was chosen to prevent measurements in the penumbra region which might introduce errors into the results, even with small errors in the set-up geometry. The margin for set-up errors was chosen to be 2 mm and the total margin in the projected distance to the detector was thus set at 9 mm. The projected size of the entrance hole at the detector position was approximately 28 mm and with 9 mm margin on each side of the detector there was room for a detector of up to 10 mm diameter. In our case a Si diode (RFA diode, Scanditronix) with a diameter of 2 mm was chosen.
The hole of the exit collimator was large enough not to screen off the primary photons which had passed through the primary collimator. The aim of this collimator

302 K A R L S S O N a n d N Y S T R Ô M
S i d i o d e B u i l d u p c a p
5 0 m m3 0 m m h o l e
m m t h i c k l e a d b l o c k
EоinC O <r W a t e r t u b e
5 0 m m t h i c k l e a d b l o c k
1 8 - 2 0 m m f o c u s e d h o l e
^ A d j u s t m e n t s c r e w
FIG . 1. The HVL measuring device.
was to screen off photons which had been scattered within the water tube. To further minimize this scattering component in the measurements, the inner diameter of the water tube was chosen to be only slightly larger than the diameter of the exit collimator. There was also an air space of 10-20 cm between the water surface and the secondary collimator. An electron stopper which at the same time acted as buildup material was introduced. The buildup cap was introduced in front of the detector mainly to ensure that no electrons from outside the cap would reach the detector. The buildup cap thickness and material are adjusted to the beam quality.
The buildup cap w ill affect the results to a minor extent, as the photon spectrum which is filtered in the water w ill be more penetrating and thus be less affected by the buildup cap as compared with the beam which is not filtered by the water tube. The thickness of the buildup material was chosen to be that which gave the maximum dose for a narrow beam (diameter 30 mm) of the investigated quality. In theory the cap should have been thicker to prevent any possible electron penetration, but a number of measures were undertaken to minimize this effect. Firstly, the narrow tube, the narrow collimation and the air gap between the water tube and second collimator reduced the possible electron contribution. Secondly, the cap was kept as narrow as possible to increase the loss of electrons through scattering out of the cap.
The measurements should be performed with the gantry at an angle of 180°, with the beam pointing vertically upwards. The measuring device is then positioned on top of the shadow tray and the built-in collimator set to give a field which is smaller than the lead block at the bottom of the measuring device. For measurements that are very far off-centre on treatment units with only symmetrical collimators,

I A E A - S M - 3 3 0 /5 4 303
extra lead shielding is recommended to cover the field outside the bottom lead block. Two concentric rings are used to indicate the centre of the entrance and the exit collimator. These rings are used to align the measuring device with the field light of the accelerator, an alignment performed with an adjustment screw. The penetration measurements can be performed in any part of the field by only changing the position and angle of the device. The position is found by first positioning the built-in collimator at the measuring position. The measuring device is then positioned at the edge of the shadow from the collimator. The collimator is moved out and the angle of the device is aligned to the light field.
Different types of clinical photon beams have been evaluated by this device. A conventional 4 MV linac (Varian Clinac 600c) with a conventional flattening filter was equipped with wedge shaping both by dynamic collimation and with metal wedges. A set of data was taken for the open field and for the 45° metal wedge on this unit. In our clinic we also have access to an MM22 Microtron (Scanditronix) with an energy compensating flattening filter for the 21 MV photon beam and an MM50 Racetrack Microtron (Scanditronix) with scanned photon beams. HVL measurements have been performed on these two units to determine energy variations of the primary photons in different parts of the field. Data were also taken with the 45° metal wedge in the 20 MV beam of the MM50 Racetrack Microtron. The HVL for the central part of the beams was compared with sw air as calculated using the International Atomic Energy Agency (IAEA) Protocol [1] for these beams.
3. RESULTS
The device for penetration measurements was used in a number of different beams under different irradiation conditions. This device was found very easy to use and the errors between repeated set-ups were typically less than 1 % in the HVL value. The largest error in the measurements actually seems to be the short term variation in the dosimetry system on some accelerators. These variations were in one case as large as 0.5% of the mean (1 SD) and would thus give errors in the HVL of approximately 1%. These errors were decreased to less than 0.5% by repeated measurements. A quicker method to handle short term variations in treatment units with this kind of instability would probably be to use an external reference. The total measuring time for two full profiles along the two major axes (14 points) was less than two hours.
Measurements were performed along the two major axes to examine possible variations in the different directions. However, no such variations were seen on any of the investigated units. The HVL profiles were thus plotted only in one direction. In Fig. 2, data for the low energy units are plotted as a function of off-centre position and show the characteristic drop in HVL at the periphery.

304 K A R L S S O N a n d N Y S T R Ô M
O f f - c e n t r e p o s i t i o n ( c m )
FIG. 2. Penetration measurements in 15 cm of water (expressed as HVL) for different lowenergy photon beams as a function of off-centre distance.......... Siemens Mevatron XII,10 MV [7]; -------- BBC Dynaray 6 CH, 6 MV;---------- Varian Clinac 600c, 4 MV;-------- Varian Clinac 600c, 4 MV with 45 ° wedge;--------Varian Clinac 600c, 4 MV with45° wedge, across wedge direction.
HVL profiles for the MM50 Racetrack Microtron with a scanning beam system show a significantly different shape as compared with a unit with a ‘conventional’ flattening filter (Varian Clinac 2500) (Fig. 3). Instead of the energy drop at off- centre positions there is actually a slight increase in HVL at the periphery. In the MM22 beam with an energy compensating flattening filter the energy drop is significantly smaller than with the ‘conventional’ filter.
The measurements on a 4 MV beam with a 45° metal wedge show a significant change in HVL when the metal wedge is used as compared with the open field. Also, the wedge shape in the measurement along the wedge direction is shown (Fig. 2). The measurements performed across the wedge direction show a rather constant filtering effect which, however, is higher at the periphery. This is probably due to the fact that the projected thickness of the wedge is slightly larger further off-centre. Another possible explanation could be that the photon energy distribution in the periphery is less filtered and thus more sensitive to attenuation in the wedge.

I A E A - S M - 3 3 0 /5 4 305
O f f - c e n t r e p o s i t i o n ( c m )
FIG. 3. Penetration measurements in 25 cm of water (expressed as HVL) for differenthigh energy photon beams as a function of off-centre distance.---------- Scanditronix MM50Racetrack Microtron, 50 MV;........ Varían Clinac 2500, 24 MV [91;--------ScanditronixMM50 Racetrack Microtron, 20 MV; -------- Scanditronix MM50 Racetrack Microtron,20 MV with 45° wedge;-------- Scanditronix MM22 Microtron, 21 MV.
4. DISCUSSION
As the primary photon energy drops rather quickly off-centre in many treatment units, it was shown that a photon field positioned on the central axis and a field positioned some distance off-centre will have significantly different energy distributions. It is therefore reasonable to argue that the correction factors used in dosimetry should be chosen with regard to this.
An attempt to quantify this effect was made by plotting the HVL determined for the central part of the fields against iw i8ir for beam qualities from “ Co to 50 MV photons (Fig. 4). The stopping power ratios in this plot were obtained according to the IAEA Protocol [1] and will thus include some uncertainties as pointed out above. However, the relationship between sw air and HVL is close to linear over the whole energy range with a slope of about 0.3%/cm water (HVL). The resolution between different beam qualities seems to be good and air can further be deter-

306 K A R L S S O N a n d N Y S T R Ô M
1 , 1 4 1-----------------------------------------------------------------------------------■
1 . 1 3 -
■
1 . 1 2 -- ■
1 .1 1 -
«
< 1 1 -1 0 -
1 . 0 9 -
1 .0 8 -Ш
1.07-1-------------------- 1-------------------- 1-------------------- 1--------------------
10 15 2 0 2 5 30
H V L ( c m )
FIG. 4. Stopping power ratio of water to air, sw air, plotted against HVL in the centre of the beams. sw ajr was calculated according to the IAEA Protocol [1].
mined for off-centred fields, fields compensated with metal wedges, etc. A 45° wedge in a 4 MV beam would reduce 5w air by about 0.3% for a centred field and in a 20 MV field the reduction of a similar wedge would be 0.5% according to this rather approximate plot.
It is likely that a heterogeneous energy distribution may also affect dosimeters other than air filled ionization chambers. Dosimetry systems such as film dosimeters are known to have a marked photon energy dependence which, however, is often disregarded in relative dosimetry by assuming a homogeneous energy distribution within the field. Also, for Si diodes a photon energy dependence is demonstrated, although this can be compensated for in some special cases by partial shielding of scattered photons [10].
Not only is the primary photon fluence important for the energy distribution that a dosimeter will detect; the field size, field shape, compensation methods, etc., will also be of importance. Wedge beams can, for instance, be generated by a couple of basically different methods giving two different dosimetric effects. If wedge fields are generated by dynamic collimators then the energy of the primary photons on the phantom surface remains the same as for an open field. As the photon intensity varies over the field, the relative contribution of scattered photons on the high dose side of the field will be smaller than on the low dose side. As a consequence the mean

I A E A - S M - 3 3 0 /5 4 307
energy at the high dose edge will be higher than at the low dose edge. If, instead, wedge fields are generated by metal wedges, the filtering in the wedge will give a higher primary photon energy at the low dose side of the wedge and probably overwhelm the effects discussed above. For fields of a different shape a similar argument can be made. There are differences in the mean photon energy due to both differences in the distribution of primary photon energy in different treatment units and differences in the scattering conditions depending on field shape.
The HVL measurement data are useful for intercomparison and could be used as input parameters in tables for dosimetric correction factors, etc. However, the intuitive feeling for a value expressed as HVL in water may not be much better than that for the TPR or dose ratios. It has been shown [8] that a recalculation to mean photon energy using a simple relationship between HVL and mean photon energy could be performed. It has also been suggested that the transmission data should be extended to zero field TAR, TPR or TMR, which are used as input parameters in some dose planning algorithms for calculations of irregular fields [7].
In some dose planning systems the full three dimensional volume of the field is characterized by measurements in the whole volume for all relevant field sizes. However, even if this type of field characterization gives the most exact field data, a huge amount of experimental input data would be required to characterize the full field. In most systems the field is interpolated from a smaller set of profiles and depth dose data. Another type of field characterization which is utilized in at least one commercial dose planning system is based on a primary fluence matrix representing the fully uncollimated field and an energy distribution representative for the beam [11]. This method is very flexible and easily adapted for calculating irregular fields which have not been previously measured. In a model like this it is, however, important to take into account the variation in energy spectra over the field. A method to calculate the change in spectral energy distribution over the field could be based on penetration measurements in narrow beam geometry.
ACKNOWLEDGEMENT
This study was supported by grants from the Research Foundation of the Department of Oncology, University of Umeâ.
REFERENCES
[1] IN T E R N A T IO N A L A T O M IC E N E R G Y A G E N C Y , Absorbed D ose D eterm ination in
Photon and E lectron Beam s: An International Code o f Practice, Technical Reports
Series N o. 2 7 7 , IA E A , Vienna (1987).
[2] A N D R E O , P . , B R A H M E , A ., Stopping power data for high energy photon beam s,
Phys. M ed. B io l. 31 (1986) 8 3 9 -8 5 8 .
308 K A R L S S O N a n d N Y S T R Ô M
[3] K O SU N E N , A ., R O G E R S , D .W .O ., Beam quality specification for photon beam
dosim etry, M ed. Phys. 19 (1992) 7 7 4 (abstract).
[4] Central A xis Depth D ose D ata for Use in Radiotherapy, B r. J . R adiol., Suppl. N o. 17
(1983).
[5] B R A H M E , A ., “ Design principles o f therapeutic electron and photon beam s” ,
Principal Aspects o f High Energy Electron A ccelerators in Radiation Therapy (Proc.
W orkshop, Bom bay, 1982) (D A S, K .R ., E d .) , A ssoc, o f M edical Physicists o f India,
Bom bay (1985) 2 6 3 -3 1 1 .[6 ] F E L B IN G E R , K ., H À U FG L Ô C K N E R , H ., N IEM A N N , J . , SC H E E R , М ., Natur-
w issenschaften 4 7 (1960) 55 .
[7] H A N SO N , W .F ., B E R K L E Y , L .W ., P E T E R SO N , М ., O ff-axis beam quality change
in linear accelerator X -ray beam s, M ed. Phys. 7 (1980) 1 4 5 -1 4 6 .[8 ] K A R L SSO N , М ., N Y ST R Ô M , H ., SV E N SSO N , H ., Photon beam characteristics on
the M M 50 racetrack m icrotron and a new approach for beam quality determination,
M ed. Phys. 2 0 (1993) 1 4 3 -1 4 9 .
[9] K R IT H IV A S, G ., R A O , S .N ., Dosim etry o f 24 M V X -rays from a linear accelerator,
M ed. Phys. 14 (1987) 2 7 4 -2 8 1 .
[10] R IK N E R , G ., Characteristics o f a gel shielded p-Si detector in “ C o and 8 and 16 M V
X -ray radiation, A cta R ad io l., O ncol. 2 4 (1985) 2 0 5 -2 0 8 .
[11] A H N E SJÔ , A ., A N D R E O , P ., Determ ination o f effective bremsstrahlung spectra and
electron contamination for photon dose calculations, Phys. M ed. B io l. 3 4 (1989) 1 4 5 1 -1 4 6 4 .

I A E A - S M - 3 3 0 /1 0
A T E S T O F T P R i o A S A B E A M Q U A L I T Y S P E C I F I E R
F O R H I G H E N E R G Y P H O T O N B E A M S
C.K. ROSS, K.R. SHORTT, D.W.O. ROGERS Ionizing Radiation Standards,Institute for National Measurement Standards,National Research Council Canada,Ottawa, Ontario, Canada
F. DELAUNAYLaboratoire primaire des rayonnements ionisants,DAMRI/LPRI,CEA, Centre d’études de Saclay,Gif-sur-Yvette, France
A b s t r a c t
A T E S T O F T P R io A S A B E A M Q U A L IT Y S P E C IF IE R F O R H IGH E N E R G Y PH O TO N B E A M S .
Assuming the response o f ferrous sulphate (Fricke) dosim eter solution to be indepen
dent o f beam quality, the authors measured the calibration factor (absorbed dose to water) for
several ionization cham bers in different high energy X ray beam s. T he prim ary X ray beams
w ere created by allowing 2 0 , 25 o r 30 M eV electrons to impinge on a fully stopping
aluminium target. T he spectral hardness o f the beams was varied by adding various thick
nesses o f aluminium filtration. It was found that using TPR,® as a beam quality specifier can
lead to errors o f up to 1 % in the ionization cham ber calibration factor. Tw o alternative beam quality specifiers, one based on the depth dose distribution near the buildup region, the second
based on the absorbed dose perturbation created by a high Z interface, are shown to specify
uniquely the calibration factor for the six beam qualities used in this w ork. F inally, the authors
used the form alism o f the International Atom ic Energy A gency dosimetry Protocol but with
w ater to a ir stopping power ratios calculated specifically for their X ray beams to calculate
the ionization cham ber calibration factors. T he calculated change in the calibration factor from “ C o 7 rays to high energy X rays is considerably larger than the measured change.
1. INTRODUCTION
Ionization chambers are widely used to establish the absorbed dose to water in high energy X ray beams used for radiation therapy. The measured ionization chamber response is related to the dose to water through the restricted, spectrum averaged, water to air mass stopping power ratio ( iw,a). This quantity depends on the electron spectrum set in motion by the incident X ray beam, which in turn is
309

310 R O S S e t a l .
related to the X ray spectrum. Ideally, a beam quality index for ionization chamber dosimetry should characterize the electron spectrum in water. However, depending on the precision required, it may be adequate to characterize the X ray spectrum. One parameter which has been widely used is the tissue-phantom ratio (TPRjo), defined as the ratio of the dose (for a 1 0 cm x 1 0 cm field) at 2 0 cm to that at 1 0 cm, with the source to chamber distance kept constant. Although TPR?® is mainly sensitive to the X ray spectrum, Brahme and Andreo [1] have shown that it should be a reasonably good quality indicator for ionization chamber dosimetry for a wide range of X ray beams.
On the other hand, Owen [2] has shown that X ray beams constructed with different filtrations but having the same TPR?® may give rise to ionization chamber calibration factors which differ by up to 0.5%. Since this is a rather small discrepancy it does not contradict the conclusions of Brahme and Andreo, but for calibration purposes it means that TPR?o as a beam quality specifier can introduce a significant uncertainty.
LaRiviere [3] has also studied the problem of specifying the beam quality. He concluded that the percentage depth dose at 1 0 cm (%dd(1 0 ) ) 1 or the dose weighted average energy of the X ray beam should be a good quality specifier. Using Monte Carlo calculations, Kosunen and Rogers [4] have extended the proposals of LaRiviere and shown that for all thick target bremsstrahlung beams %dd(10) uniquely specifies swa, but point out that the effects of electron contamination of the X ray beam must be removed before using measured values of %dd(10).
Das et al. [5] have proposed using the perturbation in the absorbed dose created by a high Z interface as a beam quality index. They measured what they called the forward dose perturbation factor (FDPF) for several beam qualities from ^Co to 24 MV. They conclude that the FDPF is more sensitive to spectral changes above about 10 MV than the ionization ratio, which is closely related to TPRfo. Furthermore, it would be expected that both %dd(10) and FDPF should be sensitive to the details of the electron spectrum.
One of our objectives in this work was to test and extend the work of Owen [2], but using a different technique. A second objective was to examine the consistency between our measured results and calculations of ionization chamber response based on the International Atomic Energy Agency (IAEA) dosimetry Protocol [6 ]. Finally, we have tested %dd(10) and FDPF as possible replacements for TPR$! as beam quality specifiers.
At the National Research Council Canada we have a high precision Fricke dosimetry system (see, for example, Ref. [7]). For high energy X ray beams, the response of the Fricke dosimeter is expected to be largely independent of beam quality [8 ]. Our approach has been to use the Fricke dosimeter as a quality independent
1 F o r a 10 cm x 10 cm field at a source to surface distance (SS D ) o f 100 cm .
I A E A - S M - 3 3 0 /1 0 311
dosimeter, and to use it to determine ionization chamber calibration factors in a variety of high energy X ray beams. We have concentrated on X ray beams with TPRjo in the range of 0.75-0.83 since this is the range where the ionization chamber calibration factor as a function of TPR™ is changing most rapidly.
In Section 2 we describe the details of the measurement procedure and of the calculations. The results of the measurements and calculations are reported and discussed in Section 3. The main conclusions are given in Section 4.
2. MATERIALS AND METHOD
In order to simplify the generation of different beam qualities, we implemented a swept electron beam system, thus avoiding the need of flattening filters. The procedure we use is similar to that implemented by Karlsson et al. [9] for their 50 MeV racetrack microtron. The electron beam is swept along the surface of an imaginary cone, with the apex of the cone being fixed at a point on the surface of a plane X ray target. We use a fully stopping aluminium target, and the half-angle of the cone varies from about 4.2° at 20 MeV to 2.8° at 30 MeV. The field flatness is rather insensitive to the cone angle, especially for larger angles. Once a flat distribution was obtained with the swept electron beam, we generated a hardened beam by adding aluminium filtration downstream of the target. These filters were flat slabs, either 10 or 15 cm thick. It was found that adding the extra filtration had little or no impact on the flatness of the dose distribution. Six different beam qualities were studied, and the main parameters associated with each one are given in Table I.
Our X ray beams are directed horizontally and impinge on a water phantom equipped with a three dimensional scanning system. The phantom is a cube approximately 50 cm on a side, and the Lucite walls are 9 mm thick. The entrance face of the phantom was located approximately 125 cm downstream of the upstream face of the target. The X ray beam was collimated by an iron collimator 20 cm thick with an opening that gave a field size of approximately 1 0 cm x 1 0 cm at the measurement depth of 7 cm (a depth of 10 cm was used for the 30 MV beams).
The X ray beam was monitored using a parallel plate ionization chamber (Capintec PS-033) mounted on the inside face of the water phantom. The chamber was mounted with its thin window facing downstream so that the sensitive volume of the chamber was at a depth of about 1 cm. This orientation was chosen so that there would be significant buildup material (about 2 g/cm2) overlying the chamber.
The scanning system associated with the water phantom has a resolution of 0.1 mm. A detector (such as an ionization chamber or a Fricke vial) was mounted on the scanner and moved close to the reference position. The detector was then precisely located at the reference position using a telescope and a mechanical stand-off. The detector generally could be positioned with an uncertainty of about ±0.05 mm.

312 R O S S e t a l .
TABLE I. SUMMARY OF THE PRINCIPAL CHARACTERISTICS OF THE X RAY BEAMS, THE VARIOUS CORRECTION FACTORS REQUIRED AND THE RESULTS OBTAINED FOR kQ
Beam2 0 M V 25 M V 30 M V
label Soft Hard Soft Hard Soft Hard
Electron energy
(M eV )
2 0 2 0 25 25 30 30
Target thickness
(cm Al)
4 .5 4 .5 5 .2 5 .2 6 .0 6 . 0
Sw eep angle (° ) 4 .2 4 .2 3 .4 3 .4 2 .8 2 .8
Hardener thickness
(cm Al)
0 1 0 0 15 0 15
T P R “ (meas) 0 .7 5 8 0 .791 0 .7 8 0 0 .8 1 5 0 .7 9 5 0 .8 2 1
T P R 2q (calc) 0 .7 6 0 0 .7 9 0 0 .781 0 .811 0 .7 9 4 0 .8 2 2
% dd(1 0 ) (calc) 8 2 .7 85 .2 8 6 .6 8 9 .6 90 .1 92 .3
F D P F (meas)' 1.31 1 .36 1 .47 1.57 1 .67 1.75
* wali (calc) 0 .9 8 8 4 0 .9 8 5 3 0 .9 8 6 1 0 .9 8 3 5 0 .9 8 4 8 0 .9 8 2 7
k i t (meas) 1 .0063 1.0055 1 .0039 1 .0046 1 .0048 1 .0056
kf¿ (meas) 1 .0032 1.0031 1 .0 0 2 0 1.0025 1.0031 1.0033
кв (N E 2 571) (meas) 0 .9 7 9 0 0 .9 7 4 3 0 .9 6 9 5 0 .9 6 8 0 0 .9 6 4 9 0 .9 6 5 0
кв (P R -06C ) (meas) 0 .9 8 4 0 0 .9 7 9 4 0 .9 7 3 3 0 .9 7 3 2 0 .9 6 9 5 0 .9 6 8 6
sWj a (cale) 1 .087 1 .079 1 .077 1.068 1 .070 1.062
kQ (N E 2 571) (calc) 0 .9 6 5 1 0 .9 6 1 5 0 .9 5 8 2 0 .9 5 3 7 0 .9 5 3 9 0 .9 4 8 4
kQ (P R -06C ) (calc) 0 .9 6 4 5 0 .9 5 9 7 0 .9 5 7 0 0 .9 5 0 9 0 .9 5 1 7 0 .9 4 5 7
Note: At mCo, fcwal, was calculated to be 1 .000 and k¿áí[ and k lid were measured to be 1.0031
and 1 .0015 respectively. T he estimated relative standard uncertainties on the measured quantities are as follow s: electron energy 1% ; TPR,® 0 .5 % ; F D P F 1% ; and k^ 0 . 1 % ; kQ 0 .3 5 % .

I A E A - S M - 3 3 0 /1 0 313
Four ionization chambers were used in this study. Two were model NE 2571 chambers manufactured by Nuclear Enterprises, and two were model PR-06C chambers manufactured by Capintec. The NE 2571 chambers have graphite thimbles and were identified by serial numbers 667 and 1527. The PR-06C chambers have air equivalent plastic (C-552) thimbles and were identified by serial numbers 66564 and 67615. In order to waterproof the chambers, they were inserted into a close-fitting Lucite sheath with a wall thickness of 0.5 mm. The chambers were read using Keithley model 35617 electrometers which also applied the polarizing voltage (approximately 300 V). For some beam qualities, measurements were made at both polarities so as to be able to estimate the polarity effect.
The ferrous sulphate system, which has a precision of 0.1-0.2%, has already been described [7]. For each beam quality, eight or ten vials were irradiated with a range of doses from about 10 to 40 Gy.
In addition to measurements in high energy X ray beams, measurements were also carried out in a “ Со y ray beam. These measurements served as a check on the sensitivity and stability of the ferrous sulphate system, and permitted us to study how the ionization chamber response per unit absorbed dose changes over the extremes of beam quality encountered in the clinical environment.
For each beam quality the ratio of the ionization chamber response at 10 cm depth to that at 20 cm was measured and denoted by J \o- The corresponding value of TPRio was approximated [6 , p. 29] by applying a 1/r2 correction to 7 0 •
For the interface perturbation measurements, a lead plate, 1 cm thick, was placed at a depth of approximately 7 cm in the water phantom. The plate was square with 15 cm on a side, so that it intercepted completely the primary X ray beam. The absorbed dose downstream of the plate was measured with a diode detector of the type described by Shortt et al. [10]. The sensitive volume of the diode could be brought within a few tenths of a millimetre of the surface of the plate.
Variations in the field flatness over the cross-sectional areas presented by the ionization chambers and the Fricke vials were measured using the same diode probe used for the interface measurements.
When using a dosimetry protocol to calculate how the ionization chamber response changes with beam quality, it is necessary to know the water to air stopping power ratio for each beam quality. Using the EGS4 Monte Carlo system [11] and a user code called ACCEL, the measurement geometry was simulated and X ray spectra were generated for the six beam qualities. These spectra were then used to calculate swa, %dd(10) and TPRjq using precomputed Monte Carlo results for monoenergetic beams [4, 12].

314 R O S S e t a l .
From the ferrous sulphate measurements the change in optical density per monitor unit, AOD/M, was determined. The absorbed dose to water per monitor unit, D J M , is then given by
3. RESULTS AN D DISCUSSION
Ц* _ AOD/M ialr « F K£ KwaU/ídd Ш
M eGpL
where eG (3.505 x 10⁻⁴ m2/J at 25°C)2 is the product of the molar extinction coefficient and the radiation yield of the ferric ion, p is the density (1.023 g/cm3) of the ferrous sulphate solution and L is the optical path length (4.001 cm). The factor Rp converts the dose to Fricke solution to dose to water, and was calculated using EGS4 to be 1.003, independent of beam quality [14]. The correction kE
allows for any dependence of G on beam quality. Until additional calorimetric measurements have been completed, kE has been taken to be unity. The correction for the effect of the quartz vial walls on the absorbed dose delivered to the ferrous sulphate solution ()twall) has been obtained by calculations which have been confirmed by measurements [14]. It has been assumed that TPR2q adequately parametrizes the weak variation of kwal[ with beam quality. Finally, k ^ corrects for variations in the field flatness over the circular area presented by the Fricke vial. Equation (1) gives the absorbed dose to water in a homogeneous phantom at the point defined by the centre of the vial, assuming that the dose gradient along the beam axis is linear over the thickness of the vial (7 mm).
The corrected ionization chamber response per monitor unit, R/M, is given by
— - — kick (2)— , , * d d * s h e a t h \Á>M M
where R ' is the measured response scaled to standard pressure and temperature conditions and corrected for effects due to leakage, saturation and polarity. The centre of the ionization chamber is taken as defining the point of measurement. The correction factor &dd corrects for variations in the field flatness over the area presented by the ionization chamber. The correction ksheath corrects the response for the effect of the waterproofing sheath, and the values measured by Ross and Shortt [15] were used. The maximum effect of the sheath is for the NE 2571 chamber at high ener
2 This value o f eG is based on water calorim etry at 2 0 M V [13]. The results presented
in this paper are independent o f eG.

I A E A - S M - 3 3 0 /1 0 315
gies, where the correction is 0.15%. The absorbed dose calibration factor for the ionization chamber, N®, is obtained from
< \ - ï <3>where D J M is given by Eq. (1). Expressions similar to Eqs (1) and (2) can be written for the measurements using ^Co y rays, with the monitor output M being replaced by the irradiation time T. The ratio of the calibration factor for beam quality Q to that for “ Co is denoted by kQ and is given by
kn = N°/N%° (4)
The various factors required in evaluating Eqs (1) and (2) are summarized in Table I, as well as the values of kQ obtained using Eqs (l)-(4).
The type A (statistical) relative standard uncertainty on the ionization chamber response per monitor unit was typically 0.1%. The uncertainty on the ratio of kQ for the two ionization chamber types is therefore about 0 .2 % since this ratio does not depend on the Fricke dosimetry. The type A uncertainty on the measured change in optical density per monitor unit was typically 0.15%. The determination of N%° and N p also required the ratio of the measured values of k ^ and k¿¿ and the estimated uncertainty on this ratio is 0.15%. The estimated type A relative standard uncertainty on kQ is then 0.35%.
The other factors entering into Eq. (1) introduce systematic effects which affect all the measured data in the same way. One exception is where we have assumed that it is adequately parametrized by TPR2®. The total calculated variation in fcwall for the six beam qualities is 0.5%. It is therefore unlikely that beam specific calculations of /cwal| would differ from our estimates based on TPRjo by more than 0 . 1 % .
It is also possible to calculate kQ using the various dosimetry protocols. For example, the IAEA Protocol [6 ] describes how to use an ionization chamber calibrated in terms of air kerma due to ^Co y rays to determine the absorbed dose to water for high energy photon beams. In the IAEA Protocol, the dose is specified at an effective point of measurement which is upstream of the chamber centre and which varies with the beam quality. On the other hand, for our measurements the centre of the ionization chamber was taken as the point of measurement. The Protocol prescription for obtaining the absorbed dose can be modified to give the dose at the chamber centre by introducing a factor prepl, which can be evaluated from a knowledge of the dose gradient [16]. Then kg is given by
£ ^w,a(6 ) Pwall(Q) PiepÁQ)Q VaiCo) pwau(Co) р [ф(Со)

316 R O S S e t a l .
where pwaII (pu in Ref. [6 ]) is the factor which accounts for the non-water equivalence of the ionization chamber wall. Rogers [17, 18] has evaluated kQ for 38 ionization chambers using Eq. (5). Andreo [19] has also published tables of kQ using a slightly modified version of the IAEA Protocol. Although the two tabulations differ by more than 0.5% for values of TPR2® near 0.60, they agree to better than 0 .2 % for values of TPR2§ greater than 0.72.
For TPRfo in the range of 0.75-0.82, i w>a varies by about 3%, while />wall changes by less than 0.3 % andprepl by about 0.1%. Therefore the change in kQ with beam quality is dominated by the change in i w a. We have evaluated Eq. (5) for the beam qualities studied in this work by using the values of kg as calculated by Rogers [18], but with the IAEA values of swa replaced by values explicitly calculated for our beam qualities. Table I gives the calculated values of i w a and for both chamber typés.
TPR?o
FIG. 1. Measured and calculated values ofkq asa function of the measured TPR f¡¡ for the six beam qualities studied in this work. Data sets having the same maximum X ray energy are joined by lines. The calculated values are based on the formalism of the IAEA dosimetry Protocol but with stopping power ratios calculated specifically for our X ray spectra. The solid and dashed lines are the predictions of the unmodified IAEA Protocol for the PR-06C and NE 2571 chambers respectively.

I A E A - S M - 3 3 0 /1 0 317
FIG. 2. Measured and calculated values of kg as a Junction of the calculated %dd(10) for the six beam qualities studied in this work. Data sets having the same maximum X ray energy are joined by lines.
The measured values of TPR2§ given in Table I were derived from measurements of the absorbed dose at depths of 1 0 and 2 0 cm using both an ionization chamber and a diode. The relative standard uncertainty on the measured values was typically 0.5%, and the values of TPR2q calculated using EGS4 agreed with the measured values to 0.5% or better. Figure 1 shows kQ as a function of TPR2q- This figure shows that TPR?° is not a unique specifier of beam quality, and could lead to discrepancies of up to 1 % in the ionization chamber calibration factor. The calculated values of kQ show the same general trends as the measured values, although the calculated change from ^Co y rays to high energy X rays is about 1.5% greater than we measure. Figure 1 also shows kQ as calculated using the unmodified IAEA Protocol. Since the Protocol considers sw a to be a smooth function of TPRi§, it cannot predict the breaks in kQ as a function of TPRJo- On the other hand, it gives values for kQ which lie closer to the mean of the measured values than does the more detailed calculation. We note that the calculated values of kQ for the beams with heavy filtration lie closest to the predictions of the IAEA Protocol. Finally, Fig. 1 shows that the measured kg for the PR-06C chamber is about 0.5% larger
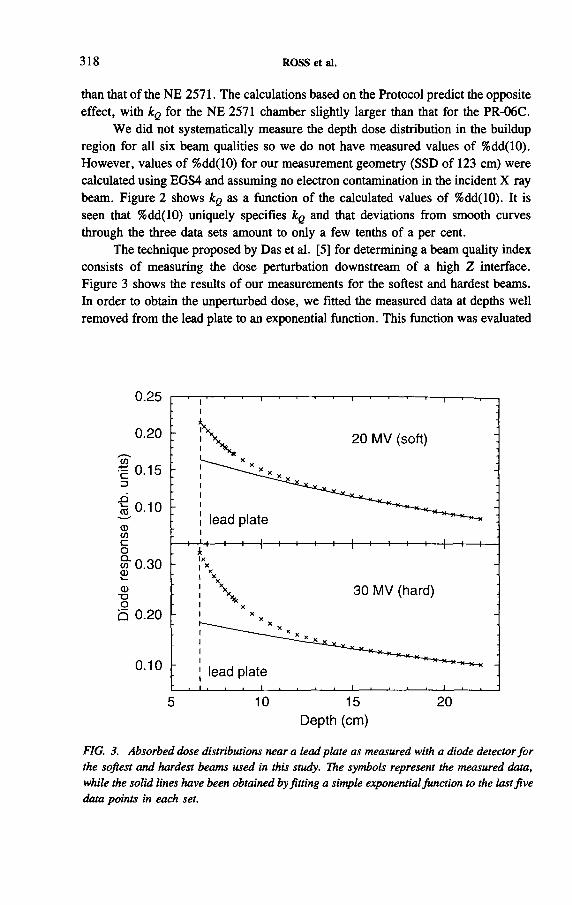
318 R O S S e t a l .
than that of the NE 2571. The calculations based on the Protocol predict the opposite effect, with kQ for the NE 2571 chamber slightly larger than that for the PR-06C.
We did not systematically measure the depth dose distribution in the buildup region for all six beam qualities so we do not have measured values of %dd(1 0 ). However, values of %dd(10) for our measurement geometry (SSD of 123 cm) were calculated using EGS4 and assuming no electron contamination in the incident X ray beam. Figure 2 shows kQ as a function of the calculated values of %dd(10). It is seen that %dd(1 0 ) uniquely specifies kQ and that deviations from smooth curves through the three data sets amount to only a few tenths of a per cent.
The technique proposed by Das et al. [5] for determining a beam quality index consists of measuring the dose perturbation downstream of a high Z interface. Figure 3 shows the results of our measurements for the softest and hardest beams. In order to obtain the unperturbed dose, we fitted the measured data at depths well removed from the lead plate to an exponential function. This function was evaluated
5 1 0 1 5 2 0
D e p th ( c m )
FIG. 3. Absorbed dose distributions near a lead plate as measured with a diode detector for the softest and hardest beams used in this study. The symbols represent the measured data, while the solid lines have been obtained by fitting a simple exponential function to the last five data points in each set.

I A E A - S M - 3 3 0 /1 0 319
FIG. 4. Measured and calculated values of kg as a function of the measured FDPF for the six beam qualities studied in this work. Data sets having the same maximum X ray energy are joined by lines.
at the surface of the plate to approximate the dose which would be obtained if the plate did not perturb the electron fluence. The quality index, FDPF, was then calculated as the ratio of the measured dose at the surface of the plate to the unperturbed dose obtained by extrapolation.
Figure 4 shows kQ as a function of FDPF. Like %dd(10), FDPF is a satisfactory indicator of beam quality for the six beams studied in this work. An advantage of FDPF over %dd(10) is that it is not sensitive to electron contamination in the primary X ray beam. A disadvantage is that it requires the measurement of the absorbed dose in a region where the dose is changing rapidly.
4. CONCLUSIONS
We have measured ionization chamber calibration factors for six high energy X ray beams. The beams were constructed with very different filtrations to maximize the spectral differences. Three different indices for specifying the beam quality were

320 R O S S e t a l .
studied. These were the tissue-phantom ratio (TPR?o). the percentage depth dose at 10 cm (%dd(10)) and the forward dose perturbation factor due to a high Z interface (FDPF). Our measurements show that TPR?® does not uniquely specify the ionization chamber calibration factor, in agreement with the measurements of Owen [2]. The variation in the ionization chamber calibration factor for X ray beams specified only by TPRjo could be as large as 1%. On the other hand, both %dd(10) and FDPF uniquely specify the ionization chamber calibration factor, at least for the range of beam qualities studied here. The uncertainty in kg as a result of using %dd(10) or FDPF as a beam quality index is a few tenths of a per cent.
We have used the formalism of the IAEA dosimetry Protocol but with water to air stopping power ratios calculated specifically for our X ray beams to calculate the change in the ionization chamber calibration factor from “ Co to 25 MV. The calculated change in kg over this range is about 1.5% greater than we measure. This result is independent of the absolute measurement of the absorbed dose, but is based on the assumption that the ferric ion yield, G, of the ferrous sulphate system is independent of beam quality.
Finally, the calculations predict that kg for the NE 2571 chamber should be0.1 or 0.2% greater than that for the PR-06C, while the measurements show the opposite effect, with kg for the PR-06C about 0.5% greater than that for the NE 2571. This measured difference does not depend on any assumptions regarding Fricke dosimetry. Since the cavity dimensions are the same for the two chamber types, the values of i wa and prepl are the same for both chambers. Therefore, within the framework of the standard dosimetry protocols this difference in chamber response must be due to an inadequate evaluation of either the wall correction factor ¿>waJ1 or the central electrode correction pcü. Recent calculations by Ma and Nahum [20] indicate that the electrode correction for the NE 2571 chamber (which has an aluminium electrode) would increase the calculated value of kQ by about0.2% at 25 MV. I f applied, this would worsen the discrepancy between the measured and calculated values of kg for the two chambers. The predicted variation in pwall from ^Co 7 rays to high energy X rays (TPR?q of 0.8) for the NE 2571 and PR-06C chambers is only about 0.5%. Therefore, the measured difference in kg for the two chambers would suggest that the error in pwaü may be almost as large as the correction itself.
REFERENCES
[1] BRAHME, A., ANDREO, P., Dosimetry and quality specification of high energy photon beams, Acta Radiol., Oncol. 25 (1986) 213-223.
[2] OWEN, B., A Summary of High Energy Photon Absorbed Dose to Water Comparisons, Doc. CCEMRI(I)/91-2, BIPM, Sèvres (1991).
[3] LaRIVIERE, P., The quality of high-energy X-ray beams, Br. J. Radiol. 26 (1989) 473-481.

I A E A - S M - 3 3 0 /1 0 321
[4] KOSUNEN, A., ROGERS, D.W.O., Beam quality specification for photon beam dosimetry, Med. Phys. 20 (1993) 1181-1188.
[5] DAS, I.J., KHAN, F.M., GERBI, B.J., Interface dose perturbation as a measure of megavoltage photon beam energy, Med. Phys. 15 (1988) 78-81.
[6] INTERNATIONAL ATOMIC ENERGY AGENCY, Absorbed Dose Determination in Photon and Electron Beams: An International Code of Practice, Technical Reports Series No. 277, IAEA, Vienna (1987).
[7] ROSS, C.K., KLASSEN, N.V., SHORTT, K.R., SMITH, G.D., A direct comparison of water calorimetry and Fricke dosimetry, Phys. Med. Biol. 34 (1989) 23-42.
[8] NAHUM, A.E., SVENSSON, H., BRAHME, A., “ The ferrous sulfate G-value for electron and photon beams: A semi-empirical analysis and its experimental support” , Seventh Symposium on Microdosimetry (Proc. Symp. Oxford, 1980), Vol. 2 (BOOZ, J., et al., Eds), EUR 7147, Harwood, New York (1981) 841-851.
[9] KARLSSON, М., SVENSSON, H., NYSTROM, H., STENBERG, J., “ The 50 MeVrace-track accelerator — A new approach to beam shaping and modulation” , Dosimetry in Radiotherapy (Proc. Symp. Vienna, 1987), Vol. 2, IAEA, Vienna (1988) 307-320.
[10] SHORTT, K.R., ROSS, C.K., BIELAJEW, A.F., ROGERS, D.W.O., Electron beam dose distributions near standard inhomogeneities, Phys. Med. Biol. 31 (1986) 235-249.
[11] NELSON, W.R., HIRAYAMA, H., ROGERS, D.W.O., The EGS4 Code System, Rep. SLAC-265, Stanford Linear Accelerator Center, Menlo Park, CA (1985).
[12] KOSUNEN, A., ROGERS, D.W.O., DDSPR: A Code for Calculating Photon BeamDepth-Dose Curves and Stopping-Power Ratios for an Arbitrary Spectrum, Rep.PIRS-298, Nad Research Council Canada, Ottawa (1992).
[13] KLASSEN, N.V., SHORTT, K.R., ROSS, C.K., “ Calibration of Fricke dosimetry by water calorimetry” , Proceedings of the Seventh Tihany Symposium on Radiation Chemistry (Proc. Symp. Balatonszeplak, 1990), Hungarian Chemistry Soc., Budapest (1991) 543-547.
[14] MA, C.-М., ROGERS, D.W.O., SHORTT, K.R., ROSS, C.K., NAHUM, A.E., BIELAJEW, A.F., Wall correction and absorbed dose conversion factors for Fricke dosimetry: Monte Carlo calculations and measurements, Med. Phys. 20 (1993) 283-292.
[15] ROSS, C.K., SHORTT, K.R., The effect of waterproofing sleeves on ionization chamber response, Phys. Med. Biol. 37 (1992) 1403-1411.
[16] ROGERS, D.W.O., ROSS, C.K., Comparison of IAEA 1987 and AAPM 1983 Protocols for dosimetry calibration of radiotherapy beams, Med. Phys. 19 (1992) 213-214.
[17] ROGERS, D.W.O., The advantages of absorbed dose calibration factors, Med. Phys. 19 (1992) 1227-1239.
[18] ROGERS, D.W.O., Compilation of Quantities Associated with Dosimetry Protocols, Rep. PIRS-291, Nad Research Council Canada, Ottawa (1991).
[19] ANDREO, P., Absorbed dose beam quality factors for the dosimetry of high-energy photon beams, Phys. Med. Biol. 37 (1992) 2189-2211.
[20] MA, С.-М., NAHUM, A.E., Effect of size and composition of the central electrode on the response of cylindrical ionization chambers in high-energy photon and electron beams, Phys. Med. Biol. 38 (1993) 267-290.


I A E A - S M - 3 3 0 /4 6
D E T E R M I N A T I O N O F R A D I A T I O N Q U A L I T Y
P A R A M E T E R S F O R H I G H E N E R G Y P H O T O N S
A N D E L E C T R O N S U S I N G D I F F E R E N T
T Y P E S O F D E T E C T O R S
K. DERIKUM, M. ROOS Physikalisch-Technische Bundesanstalt,Braunschweig, Germany
A b s t r a c t
DETERMINATION OF RADIATION QUALITY PARAMETERS FOR HIGH ENERGY PHOTONS AND ELECTRONS USING DIFFERENT TYPES OF DETECTORS.
Radiation quality parameters for high energy photon and electron beams are measured with different types of detectors. The resulting dose deviations are determined according to the Code of Practice of the International Atomic Energy Agency. For measurements in photon beams the results for the tissue-phantom ratio expression TPR?o obtained with thimble type chambers agree to within 0.2%, with one exception (WE IC10) showing about 1% higher values. Deviations of this magnitude also occur with a diamond detector and some types of silicon diodes. With one diode, almost 6 % lower values were obtained. For this diode the resulting absorbed dose deviations amount to 1 .2 %, whereas they remain below 0 .2 % for the other detector types. For measurements in electron beams the energy parameters measured with different types of ionization chambers agree to within 1 %. For solid state detectors, deviations of up to 5% in E0 occur. In all cases the resulting absorbed dose deviations remain below 0.5%.
1. INTRODUCTION
In the Code of Practice of the International Atomic Energy Agency (IAEA) [1] the use of air filled ionization chambers is recommended for absorbed dose determination in photon and electron beams. However, for relative dose distribution measurements, other types of detectors are also increasingly used. Solid state detectors, such as silicon diodes or diamond detectors, provide higher response and better spatial resolution, for example, and the energy dependence of the stopping power ratios of water to diamond and water to silicon is far smaller at high energies than for water to air.
In this paper we investigate the effect on the absorbed dose measurement when radiation quality parameters are determined from dose distributions measured with different detector types. We investigated thimble type and plane parallel type ionization chambers, some types of silicon diodes and a diamond detector. A ll detectors were operated according to their manuals and all evaluations were done according to Ref. [1].
323

324 D E R I K U M a n d R O O S
2. EXPERIMENT
The measurements were performed on a Philips SL75/20 linear accelerator at nominal accelerating potentials between 6 and 20 MV. The radiation beam was incident horizontally upon a water phantom (PMMA tank with 3.15 mm thick entrance window).
A variable stabilized high voltage supply provided the polarizing voltage. The ionization current was measured by a Keithley 616 electrometer, whose output voltage was converted into a frequency of pulses which were counted for a preset time. The number of counts therefore represents the collected charge.
The calibration of the data collection system allows the measured charge to be traced to the primary standards of the Physikalisch-Technische Bundesanstalt (PTB). Within the measurement ranges of the electrometer several different points were calibrated in order to eliminate non-linearities and offsets, giving a relative uncertainty of the charge reading of about 1 0 "4.
The charge collected by the detector under test was normalized to the respective value of an air filled plane parallel transmission monitor chamber (central electrode diameter 40 mm) mounted on the radiation head of the accelerator.
The uncertainty of the positioning of the detectors was within 0.1 mm. In accordance with Ref. [1] the reading of thimble type chambers was assigned to the point displaced from the chamber centre by 0.5r towards the radiation head for electron beams and by 0.75r for photon beams (r is the internal chamber radius). For plane parallel chambers the reading was assigned to the centre of the front surface of the air cavity. In this case the front wall thickness was scaled to water equivalent range. The reading of the solid state detectors was assigned to the detector reference point as given by the manufacturers.
3. PHOTON RADIATION
3.1. Types of detectors used
For photon beams all ionization chamber types which have been type tested and approved for verification by the PTB were investigated, as well as types WE IC10 and SC RK8305; all of these are thimble type chambers. Chambers that were not waterproof were kept in 1 mm thick close-fitting PMMA sheaths. Several types of semiconductor detectors and a PTW 60003 diamond detector [2] were also tested.
The chambers and the diodes from Nuclear Associates (NA) were irradiated perpendicularly to the detector axis. The diamond detector and the diodes from Scanditronix (SC) were irradiated parallel to the detector axis with the radiation directed towards the front of the probe housing. In order to minimize the leakage current of the diodes, the offset voltage was adjusted by means of the electrometer zero control.

I A E A - S M - 3 3 0 /4 6 325
The photon beam quality is specified by the tissue-phantom ratio expression TPRio, denoted in the following by the radiation quality index Q. The measurements were performed at a constant source-surface distance of 1 0 0 cm at a field size of 10 cm X 10 cm at the phantom surface. From the measured ratio of ionization at 1 0 cm depth in the phantom to that at 2 0 cm, the radiation quality index was obtained by fitting the data of Table ХШ in Ref. [1].
The ionization current was integrated for 20 s, corresponding to an absorbed dose of about 1 Gy at the depth of maximum dose. In order to eliminate possible drifts of the readings, the measurements were repeated ten times, alternating between
3.2. Determ ination o f radiation quality param eter
2
£ 1d d « 0
£ ~ 2о
о
оО - 4
- 6
0 . 7 0 0 . 7 5 0 . 8 0
Оо
FIG. 1. Relative deviations, AQ/Q0, of the radiation quality index Q, measured with various detector types, from the index Q0, measured with chamber type NE 2561, as a junction of Qp.

326 D E R I K U M a n d R O O S
the depths of 10 and 20 cm. The reproducibility of Q determined from the average values was better than 0.1% (la). The uncertainties of the detector positioning are negligible for the determination of Q. The results do not depend on the polarity of the collecting voltage.
Q was measured at nominal accelerating potentials of 8 , 10, 16 and 18 MV. The values obtained at a specific radiation quality agree to within 0.2% (1er) for all thimble type chambers, with the exception of type WE IC10, which gives values about 1 % higher.
In Fig. 1 the results obtained with various detector types are compared with the values Q0 obtained with an ionization chamber of type NE 2561. The figure shows the relative deviations AQ/Qo = (Qx - QoVQo at four radiation qualities. Qx is the value obtained with a specific detector at a beam described by the radiation quality Q0.
The results for the diamond detector PTW 60003 are — as for chamber type WE IC10 — about 1% higher than Q0. The deviations for the diode SC FP1537 change with increasing Q from almost zero to -1 %. The deviations for the diode SC F1436 are even larger (-1.5% ). The largest effect, of almost —6 %, occurs with the diode SC E (grey), an older model of SC F type diodes.
The Q values measured with the diode SC PH (red), an older model of SC FP type diodes, changed by about 1.5% after the diode had been regularly irradiated. The deviations from Q0, originally negligible as previously reported [3], dropped to -1.5% . A similar effect was observed with two diodes of type NA 30487, which also at first showed negligible deviations but later had deviations of about —2 %.
3.3. Influence on absorbed dose
In a photon beam described by the radiation quality Q the absorbed dose to water at the effective point of measurement, (Dw)e, is given by
( D J q M N d (íw,air)c (Pu)e 0 )
where M is the reading of the ionization chamber dosimeter, N D the absorbed dose to air chamber factor and 5w air the stopping power ratio of water to air. The perturbation correction factor pu corrects for the non-water equivalence of the particular ionization chamber type used for the dose measurement.
Absorbed dose deviations resulting from a measured Q deviating from the value Q0 can thus be determined from the quotient
(Dvj)q/(Dv/)q0 = (sw.air)^ (Pu)^C^w,air )qo (Pu)eo (2 )
This ratio was computed for all approved types of ionization chambers under reference conditions for the different radiation qualities. The calculations were done

I A E A - S M - 3 3 0 /4 6 327
according to Section 8 of Ref. [1] and the data tables therein. The absorbed dose deviations are smaller by about a factor of 5 than the deviations in Q. They remain below 0.4% for all detectors investigated with the exception of the diode detector SC E, which introduces dose deviations of up to 1.2%.
4. ELECTRON RADIATION
4.1. Types of detectors used
For electron beams the diamond detector and some silicon diodes were investigated again. In addition the ionization chamber types SC NACP02 and some prototypes of PTW 34001 were tested; both types are plane parallel, as recommended for electron radiation. Above 10 MeV, the waterproof chambers of thimble type, WE ICIO, PTW M233641 and SC RK8305, were tested.
4.2. Determination of energy parameters
The energy parameters, mean energy E 0 and most probable energy at the phantom surface, E p 0, are derived, respectively, from the half-value depth Я50 and from the practical range, Rp, of either depth ionization distributions or depth dose distributions. In both cases É 0 is derived from R 50 by fitting the data of Table IV of Ref. [1]. E p 0 is calculated from Rp using Eq. (2) of Ref. [1].
The measurements were performed at a constant source-surface distance of 100 cm and a field size of 15 cm X 15 cm at the phantom surface. At every depth the ionization current was repeatedly measured, and the relative standard deviation of the mean was well below 0.3%. The curves were measured backwards and forwards in order to ensure that the results would not be affected within the stated uncertainties by drifts of the readings. Such drifts are to be expected in the case of diodes, and are particularly pronounced with n type diodes, since their response decreases with accumulated dose [4]. The results of R 5q measured in both directions agree to within 0 . 2 mm.
The maximum of the measured curves was obtained from a polynomial fit. A straight line was fitted through the steepest range of the descending portion of the distribution. The intersection of this line with a linear fit to the bremsstrahlung background gives R p.
The ionization chamber readings were corrected for ion recombination losses using the theoretical formula of Boag [5] for pulsed radiation. The polarity effect was checked by measuring the curves at both polarities of the polarizing voltage. For the chamber types investigated, the results were independent of polarity.
To determine E 0, all curves measured with ionization chambers were interpreted as depth ionization distributions. The results obtained with the two plane
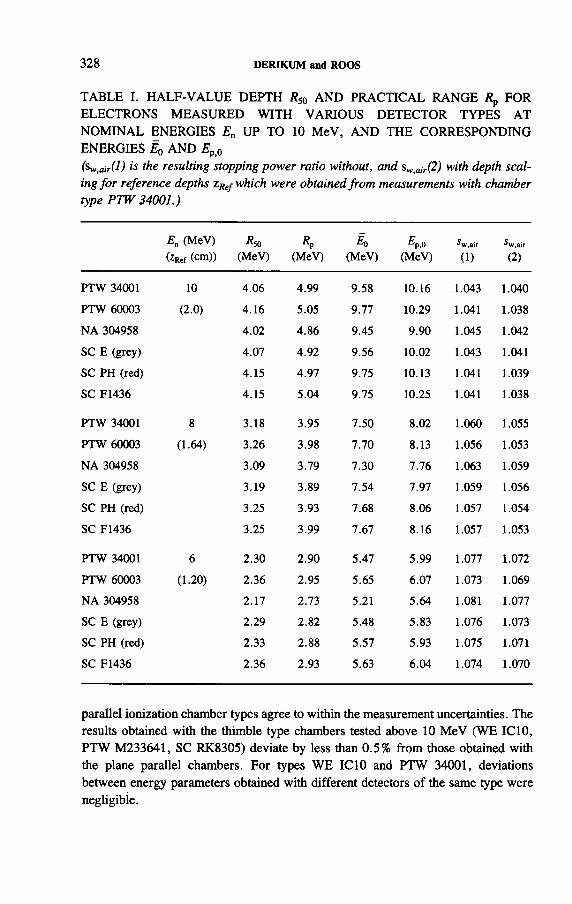
328 D E R I K U M a n d R O O S
TABLE I. HALF-VALUE DEPTH R so AND PRACTICAL RANGE R p FOR ELECTRONS MEASURED WITH VARIOUS DETECTOR TYPES AT NOMINAL ENERGIES E n UP TO 10 MeV, AND THE CORRESPONDING ENERGIES E 0 AND E pfl
(sw,airU) is the resulting stopping power ratio without, and sw air(2) with depth scal
ing for reference depths zRef which were obtained from measurements with chamber type PT W 34001.)
EB (MeV) (¿R ef (cm))
^ 5 0
(MeV)* P
(MeV)Eo
(MeV)Ef.o
(MeV)^w.air
(1)■^w.air
(2 )
PTW 34001 10 4.06 4.99 9.58 10.16 1.043 1.040PTW 60003 (2 .0 ) 4.16 5.05 9.77 10.29 1.041 1.038NA 304958 4.02 4.86 9.45 9.90 1.045 1.042SC E (grey) 4.07 4.92 9.56 1 0 .0 2 1.043 1.041SC PH (red) 4.15 4.97 9.75 10.13 1.041 1.039SC F1436 4.15 5.04 9.75 10.25 1.041 1.038
PTW 34001 8 3.18 3.95 7.50 8 .0 2 1.060 1.055PTW 60003 (1.64) 3.26 3.98 7.70 8.13 1.056 1.053NA 304958 3.09 3.79 7.30 7.76 1.063 1.059SC E (grey) 3.19 3.89 7.54 7.97 1.059 1.056SC PH (red) 3.25 3.93 7.68 8.06 1.057 1.054SC F1436 3.25 3.99 7.67 8.16 1.057 1.053
PTW 34001 6 2.30 2.90 5.47 5.99 1.077 1.072PTW 60003 (1 .2 0 ) 2.36 2.95 5.65 6.07 1.073 1.069NA 304958 2.17 2.73 5.21 5.64 1.081 1.077SC E (grey) 2.29 2.82 5.48 5.83 1.076 1.073SC PH (red) 2.33 2 .8 8 5.57 5.93 1.075 1.071SC F1436 2.36 2.93 5.63 6.04 1.074 1.070
parallel ionization chamber types agree to within the measurement uncertainties. The results obtained with the thimble type chambers tested above 10 MeV (WE IC10, PTW M233641, SC RK8305) deviate by less than 0.5% from those obtained with the plane parallel chambers. For types WE IC10 and PTW 34001, deviations between energy parameters obtained with different detectors of the same type were negligible.

I A E A - S M - 3 3 0 /4 6 329
In order to check the consistency of the IAEA Code the depth ionization distributions obtained with the chambers were converted into depth absorbed dose to water distributions and the corresponding energy-range relationship was applied. I f the stopping power ratios are selected without depth scaling, the mean energies E 0
derived from the depth absorbed dose distributions differ by 2 % at the most from
TABLE П. HALF-VALUE DEPTH R 50 AND PRACTICAL RANGE Rp FOR ELECTRONS MEASURED WITH VARIOUS DETECTOR TYPES AT NOMINAL ENERGIES E n ABOVE 10 MeV, AND THE CORRESPONDING ENERGIES É Q AND E pfi
(sWfair(l) is the resulting stopping power ratio without, and sw air(2) with depth scaling for reference depths г щ which were obtained from measurements with chamber
type PT W 34001.)
En (MeV) (zRef (cm)) (MeV) (MeV)
E0(MeV)
Ep.o(MeV)
w.air(1)
■w.air(2 )
PTW 34001 2 0 8.08 10.08 19.22 20.44 0.991 0.989PTW 60003 (3.0) 8.35 10.16 19.47 20.60 0.990 0.988NA 304958 8.33 1 0 .0 1 19.42 20.29 0.990 0.989SC E (grey) 8 .2 2 10.04 19.16 20.35 0.991 0.989SC PH (red) 8.41 10.13 19.60 20.54 0.989 0.988SC F1436 8.29 10.13 19.33 20.53 0.991 0.988
PTW 34001 16 6.41 7.88 15.21 15.97 0.997 0.995PTW 60003 (2 .0 ) 6 .6 6 8 .0 1 15.54 16.23 0.995 0.994NA 304958 6.56 7.83 15.33 15.87 0.996 0.995SC E (grey) 6.52 7.83 15.23 15.87 0.997 0.996SC PH (red) 6 .6 6 7.93 15.56 16.08 0.995 0.994SC F1436 6.58 7.95 15.37 16.12 0.996 0.995
PTW 34001 12.5 5.12 6.28 1 2 .1 1 12.75 1.019 1.017PTW 60003 (2.09) 5.26 6.34 12.30 12.87 1.018 1.016NA 304958 5.13 6.14 1 2 .0 1 12.48 1 .0 2 0 1.018SC E (grey) 5.19 6 .2 2 12.15 12.64 1.019 1.017SC PH (red) 5.29 6.29 12.37 12.78 1.017 1.016SC F1436 5.24 6.31 12.26 12.82 1.018 1.016

330 D E R I K U M a n d R O O S
the values determined from depth ionization distributions. For energies above 10 MeV these deviations are even less than 1 %. I f the stopping power ratios are selected with depth scaling, the deviations of E 0 from the values deduced from depth ionization distributions are larger, about 3% for all energies.
The curves obtained with the solid state detectors were interpreted as depth absorbed dose to water distributions. The results for the solid state detectors and the PTW 34001 chamber are listed in Table I for nominal energies E n up to 10 MeV and in Table П for higher energies. At the highest energies the values of É 0 obtained with the solid state detectors differ by less than 1 % from the values obtained with the chamber. For lower energies these deviations increase up to about 5%.
The diode readings were also interpreted as being proportional to absorbed dose to silicon. The measured distributions were converted into absorbed dose to water distributions by means of stopping power ratios calculated using the Bragg- Gray relationship in the approximation of Harder [6 ]. Applying this procedure does not significantly improve the results described above.
As expected, interpreting the curves measured by the solid state detectors as depth ionization distributions and applying the corresponding energy-range relation increases the deviations at the highest energies. Compared with the ionization chamber measurements the differences in E q amount to as much as 1 MeV.
4.3. Influence on absorbed dose
For measurements in electron beams it is recommended to use plane parallel flat chambers for the measurement of absorbed dose. For these chambers the perturbation correction factor p n in Eq. (1) is assumed to be unity at high energies. Dose deviations resulting from deviating values of the energy parameters can thus be determined from the corresponding quotient of the stopping power ratios, sw air.
In Ref. [1] two ways are recommended for determining the i w air, giving different results which consequently lead to different values for the absorbed dose. In Table X of Ref. [1] the i w air are given as a function of É 0 and depth in water, z. The sw air can be selected either at the depth of measurement, z, or — in order to take into account the energy and angular spread of the beam — at a scaled depth z ' = zRp/Rp, where Rp is the practical range for monoenergetic electrons of energy E 0, also given in Table X of Ref. [1].
Since the reference depth for absorbed dose determination depends on the measured depth of maximum dose, it may be different if different types of detectors are used for the measurement of the dose distributions. In Tables I and П the stopping power ratios are given with and without depth scaling at the reference depths ZRef as measured with the plane parallel reference chamber PTW 34001. The sw air are obtained by interpolation from Table X of Ref. [1].
Even though deviations of up to 5% occur for E 0, the largest deviations for the i w air are only 0.5%. At low energies the differences between the stopping

I A E A - S M - 3 3 0 /4 6 331
power ratios obtained with the two different methods, both of which are recommended, are of the same magnitude at the reference depth.
5. CONCLUSION
Whereas the absorbed dose deviations, caused by the use of different types of detectors for the determination of radiation quality parameters, remain below 0.5% in most cases, deviations of more than 1 % were also observed. Therefore, no alternative detectors should be used without a thorough check. This is complicated by the finding that the results may depend on the accumulated dose, as observed in the case of TPRio measurements with some types of diodes.
REFERENCES
[1] INTERNATIONAL ATOMIC ENERGY AGENCY, Absorbed Dose Determination in Photon and Electron Beams: An International Code of Practice, Technical Reports Series No. 277, IAEA, Vienna (1987).
[2] KHRUNOV, V.S., et al., Diamond detectors in relative dosimetry of photon, electron and proton radiation fields, Radiat. Prot. Dosim. 33 (1990) 155-157.
[3] ROOS, М., DERIKUM, K., “ Zur Abhângigkeit der Kenngrofien fur die Qualitat hochenergetischer Strahlung von den zur Messung verwendeten Detektoren’ ’, Strahlenschutz im medizinischen Bereich und an Beschleunigem (HARDER, D., Ed.), TÜV Rheinland, Cologne (1990) 298-299.
[4] RIKNER, G., Silicon Diodes as Detectors of Relative Dosimetry of Photon, Electron and Proton Radiation Fields, Doctoral Thesis, Uppsala Univ. (1983).
[5] INTERNATIONAL COMMISSION ON RADIATION UNITS AND MEASUREMENTS, The Dosimetry of Pulsed Radiation, ICRU Rep. 34, Bethesda, MD (1982).
[6 ] INTERNATIONAL COMMISSION ON RADIATION UNITS AND MEASUREMENTS, Radiation Dosimetry: Electron Beams with Energies Between 1 and 50 MeV,ICRU Rep. 35, Bethesda, MD (1984).


INTERACTION COEFFICIENTS AND CORRECTION FACTORS
(Session 5)
C h a i r m a n
D.W.O. ROGERSCanada
C o - C h a i r m a n
J. SEUNTJENS Belgium


I A E A - S M - 3 3 0 /6 2
Invited Paper
IMPROVED CALCULATIONS OF STOPPING POWER RATIOS AND THEIR CORRELATION WITH THE QUALITY OF THERAPEUTIC PHOTON BEAMS
P. ANDREO*Department of Radiation Physics,Karolinska Institute and
University of Stockholm,Stockholm, Sweden
A b s t r a c t
IM P R O V E D C A L C U L A T IO N S O F ST O P PIN G P O W E R R A T IO S A N D T H E IR C O R R E LA T IO N W IT H T H E Q U A L IT Y O F T H E R A P E U T IC PH O TO N B E A M S .
New calculations o f stopping power ratios for the dosimetry o f therapeutic photon
beam s have been performed w here basic data for m onoenergetic beam s are derived using three
different M onte C arlo codes (M C E F and the E G S and IT S system s). Existing estimations o f
the uncertainty o f stopping power ratios for photon beam dosimetry are discussed. ‘In -line’
calculations o f cavity integrals, perform ed directly during the M onte C arlo simulation o f
photon transport, allow a determination o f very low type A (statistical) uncertainties o f
stopping power ratios. A database o f 2 9 energies has been computed which is used to
determine stopping power ratios for clinical bremsstrahlung spectra. A n improved correlation betw een stopping power ratios and the quality o f a photon beam based on the convolution o f
M onte C arlo calculated energy deposition kernels has been obtained. T he convolution method
provides a unique correlation between the two quantities that cannot be obtained solely with
the use o f M onte C arlo calculations. T he new values are compared with those used today in
different dosim etry protocols.
1. INTRODUCTION
The numerical evaluation of Spencer-Attix stopping power ratios for photon (and electron) beam dosimetry requires the knowledge of the complete electron spectrum in the medium. This spectrum can be accurately determined using the Monte Carlo method to simulate the transport of primary photons and their successive generations, taking into account the production and transport of electrons.
* On leave from the U niversity o f Lund, Sweden.
335

336 A N D R E O
Spencer-Attix water to air stopping power ratios were calculated by Andreo and Brahme [1] for a variety of photon beams using the Monte Carlo method to determine electron spectra at different depths in water. The data recommended by SectionI of the Comité consultatif pour les étalons de mesure des rayonnements ionisants (CCEMRI(I)) [2], given in Report 37 of the International Commission on Radiation Units and Measurements (ICRU) [3], were used in these calculations to produce stopping power ratios for the photon energy range employed in radiotherapy. The stopping power ratios calculated in this way are used today in different dosimetry protocols [4-8].
New calculations of stopping power ratios are presented in this work where electron spectra for monoenergetic photons have been calculated using the Monte Carlo codes MCEF [9] and the EGS [10] and ITS systems [11]. The work presented here includes an improved correlation between stopping power ratios and the quality of a photon beam based on the convolution of Monte Carlo calculated energy deposition kernels. The convolution method provides a unique correlation between the two quantities that cannot be obtained solely with the use of Monte Carlo calculations. A database of 29 energies has been computed which is used to determine new stopping power ratios for clinical bremsstrahlung spectra. Existing estimations of the uncertainty of stopping power ratios for photon beam dosimetry are discussed. ‘In-line’ calculations of cavity integrals, performed directly during the Monte Carlo simulation of photon transport, yield a direct determination of very low type A (statistical) uncertainties of stopping power ratios. The results obtained for clinical spectra w ill be compared with the values used today in different dosimetry protocols.
2. STOPPING POWER RATIOS FOR MONOENERGETIC BEAMS:INFLUENCE OF DENSITY EFFECT
Since the calculations by Andreo and Brahme [1], a number of improvements have been implemented in the Monte Carlo code MCEF and in the additional computer programs used for the evaluation of stopping power ratios for monoenergetic beams and bremsstrahlung spectra. The Monte Carlo calculation determines the photon produced electron spectra differential in energy, Ф£, at different depths in a medium (usually water), which are used as input to a separate computer code to evaluate the so-called ‘Spencer-Attix cavity integrals’ defining the stopping power ratio of the medium to the detector [12]. A cut-off energy, Д = 10 keV, the usual lim it of the Spencer-Attix theory for ionization chambers in practical use, is commonly utilized. In practice the integrals are evaluated as a summation over the energy intervals used for scoring the fluence. The increase in computing power today allows more accurate determinations using double precision computer arithmetic in most of the calculation procedures. The availability in our computer environment of

I A E A - S M - 3 3 0 /6 2 337
the two widely used Monte Carlo systems, EGS [10] and ITS [11], offers also the possibility of performing additional and independent calculations using virtually identical input data and Monte Carlo running parameters.
Previous calculations, both during the Monte Carlo calculation of electron spectra and during the determinations of stopping power ratios, were based on electron stopping powers evaluated with a density effect correction according to the parametrization of Stemheimer [13, 14] using the coefficients tabulated in Refs [15, 16], which w ill be referred to as 5analyt. Although differences with the stopping powers given by ICRU 37 [3] are very small, it has been considered that using tabulated data for the density effect correction provides improved consistency in the complete dosimetry procedure. The existence of two sets of data for water in the ICRU 37 tables, namely with density effect corrections according to the Stemheimer model and with the more accurate calculations of Ashley based on semi-empirical dielectric response functions, and their influence on calculated stopping power ratios of monoenergetic electron beams have been discussed by Andreo [17]. The two possibilities have been made available in the actual set of programs for photon beam calculations.
On the use of one or another set of density effect corrections, ICRU 37 [3] stated that when stopping power ratios are calculated relative to water, the use of ¿stem, would be more consistent than ¿>Ash “ provided that the change of the stopping power, due to an improved density effect correction, has the same algebraic sign and approximately the same magnitude as the change in the case of water... It seems reasonable to expect that the condition is satisfied... perhaps... for... low Z materials with approximately the same density and mean excitation energy as water.” It is important to note that when absorbed dose to water is determined as a basic quantity, calculations with stopping powers of other low Z materials relative to water are usually not involved. Therefore the use of the most accurate physical data should be expected to be more appropriate for the evaluation of stopping power ratios. Furthermore, the density effect correction in air is practically negligible for the range of energies used in therapy and therefore it is not involved in sw air. This double choice adds complications to the dosimetry procedure, although fortunately differences between final sets of data computed with the two corrections are usually smaller than the estimated combined uncertainties of stopping power ratios.
The algorithm used in the Monte Carlo code MCEF for the scoring of electron tracks considers the length of the path between consecutive electron interactions subdivided into track segments proportional to the width of the energy bin crossed, following the method developed by Nahum [18]. The fluence is scored accordingly in every energy interval between the initial and final energies along the electron step. The transfer of the Monte Carlo calculated electron spectra to the computer program evaluating stopping power ratios is performed using binary files to avoid loss of precision. A ll the necessary interpolations are performed using a quadratic logarithmic routine.

TABL
E I.
SPEN
CER-
ATTI
X (Д
= 10
keV)
WAT
ER/AI
R ST
OPPIN
G PO
WER
RATIO
S FO
R M
ONOE
NERG
ETIC
PH
OTON
BE
AMS
EVAL
UATE
D WI
TH
THE
ICRU
37 [3]
DENS
ITY
EFFE
CT
CORR
ECTI
ONS
ACCO
RDIN
G TO
STER
NHEIM
ER
AND
ASHL
EY
338 A N D R E O
5g * -2 ^ 5 к"Q _ C3 <'r>я 1 1 -ft -tS
ift, $
*4<3
II
оt£?
oo ?Й ¡3 « Йfe -s
4 3 « « •Si -SО >»ç as aС л ft
'ft*Сft
§со
■ч Й
g ÿ *=> -ê "s* °.« *to °3 ^ <u A s "Ss ° Й4 <*> k • Э е ?
3 ^5 ^ "ss i SI § .« sv -§T x ^3 *>s sS S
§ 8 <Ns a ïte Q
qJ5S•3ftOSi-S
s
.§ g
1 1 it* t •S>I "S § ь !« g ?
l îI
o o O гч —0¿ 3& O H > Co
U
<Js
* 8
Ц * ëÊ « h •“
» s *
■a gJ* 55 и ¿©
•sa .<uТЭuoí
Us s S
£ sh а 'q
>5 /-*ч2* £ fli 4> G 5щ è
m 40 es *•< Tf en 40 in ON o r-in 40 o cn 40 Г-* 00 o en 00es en СП Tf Tf Tf Tf *n m in »nO O O о O O о o o O O o
o1Л o*n o*Ti om o o«D 1Л Ov>
8 8CS 8en 8 8
O O O Ó OS 8 8 84 0 t * - o o O n
O340
Os1П ONr- s ^tcn es
0000r- r -
o00 Tj-m ON«n enTf o oo
r-*cn r-8
cnONO
en00o
Onr*o
cnr-o
cno
4040o 3o
40O
1Пo
os
o © O о © o о o о o o o о
en oo 40 en es o cs ,-h Tf Tt »n in«n o 40 On cn 1Л 00 00 (N Tt 40 40(N cn cn cn '«t Tf Tf Tf »n m in •n 40o o о O ó o o o ó © © © ©
O ON 00 40 40 40 VO »n Tf es loTj- en cn cn en en en en cn en en en es’“J 1—1 1-H i—H—H i-H T-H i—¡
© ON 00 Г- r-* 40 40 40 »n m •n cn r-Tf en en en en en en en en en en en es*“j 1—< >-H-H l-H .. ^ «J m
o o o ow-> «/■> v-> »o
ON cn r- 00 00 en 00 00 m r- © r- 00© 40 On es *n 00 r- es Tf in 40es cn en en Tf Tf Tf Tfr m «n m m 40© © © © © © © © © © © © ©
o«oCS
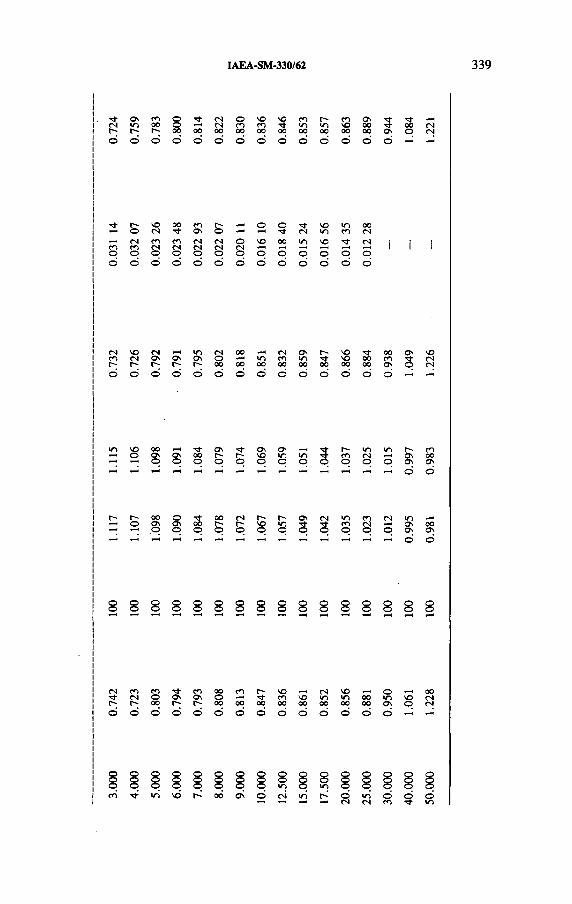
0.74
2 100
1.1
17
1.115
0.
732
0.03
1 14
0.72
4
I A E A - S M - 3 3 0 /6 2 3 39
on соЮ 00 Г- Г-»
2 <N © 40 40 со г- со Oncn со со Tt m щ 40 00
00 00 00 оо 00 00 00 00 00о о о о о о о о о
5OnО
00 (N O (N
г- 40 00 со г- ,—1 о о 40 *П 00о CN On о CN in СО CNCN со со CN CN о 40 00 Ш 40 Tf CNСО CN см CN (N CNо О о О О о о о О о о оО о о О о о о о о © о О
I I
40 CN r-t •n cn 00 CN On f - 40 Tj- 00 ON 40CN 04 On 04 © m CO •П 40 00 соs CMГ- Г- r-> Г" 00 00 00 00 00 00 00 00 ON CN
© о О d © © © © © © © © ©
40 00 ^r On -«i- ON ON r*> »n «n r- COо On On 00 Г-* Г- 40 m Ш CO CN On 00© © © © © © © © © © © © Os On© ©
г- 00 © ■<fr 00 (N r- On CN Ш CO CN mо On© On© 00© r-© Г'© 40© m© 3 s
CO© CN© © OnOn
©
00On©
8 8 8 8 8 8 8 8 8 8 8 8 8 8
CO CO S ’ co 00 CO r- 40 CN 40 PH © pH 00CN © On On © Tj- CO 40 •n in 00 in 40 CNr- 00 Г-* r- 00 00 00 00 00 00 00 00 ON © CN© © © © © © © © © © © © ©

340 A N D R E O
A total of 105 photon histories with initial energies in the interval from 100 keV to 50 MeV (29 energies) have been simulated with MCEF down to 10 keV, using a variable energy cut-off for the electron transport that depends on the incident energy (as does the threshold for knock-on electron production). The width of the scoring depth intervals was equal to 10 mm. The calculations of electron spectra were performed combining the Monte Carlo simulation down to the transport cut-off Tc with a low energy depth independent slowing down calculation below Tc. The geometry of the simulation corresponds to a photon pencil beam incident on a semiinfinite cylindrical water phantom, where the quantities of interest are scored only up to a radius of 56.4 mm but the lateral transport is simulated up to 500 mm. This is considered equivalent to the simulation of an incident 100 mm X 100 mm plane parallel beam (infinite SSD) with quantities scored in the central axis, but with much lower uncertainty. Both electron spectra and energy deposition distributions down to 500 mm are simultaneously determined in every calculation.
Calculated stopping power ratios for monoenergetic photons are given in Table I together with data relevant to the photon beam penetration, which include an ‘effective’ linear attenuation coefficient ц obtained from an exponential fit between 1 0 0 and 2 0 0 mm, and the beam quality descriptor (ratio of absorbed doses at 100 and 200 mm, or TPRjo) obtained both from the fit and from the direct Monte Carlo calculation. In spite of the large number of photon histories simulated and broad depth intervals for scoring, the intrinsic ‘noise’ of the Monte Carlo calculations can be observed in the values around 5 and 15 MeV obtained from the fit. Above approximately 30 MeV the depth of 100 mm is situated in the ascending part of the buildup region (cf. Fig. 4(b)), which makes the ‘effective’ attenuation coefficient negative and consequently this has been excluded from the table. In these cases the fitting is performed beyond the depth of maximum absorbed dose. Electron stopping powers have been evaluated with ICRU tabulated density effect corrections according to Stemheimer and Ashley, both obtained from the EPSTAR (NIST) database [19]. A comparison with the previously calculated data [1], based on the analytical evaluation of the density effect, is shown in Fig. 1. Differences due to the joint effect of the implementations discussed above can be observed to be of the order of a few tenths of a per cent in the largest portion of the therapeutic interval (the maximum difference is 0.3%) when ôStern is used as reference. When ôAsh is used for comparison, the agreement with previous calculations is, however, remarkable as can be seen in the inset. Similar agreement between stopping power ratio calculations based on <5analyt and ôAsh was found in Ref. [17] for electron beams, and indicates that the fitting procedure to obtain the parameters needed for <5analyt performed by Stemheimer et al. [15, 16] for water is probably based on <5Ash .
The same kind of Monte Carlo calculations has been performed using the EGS4 and ITS 3.0 Monte Carlo systems. Andreo [17] described the DOSFL/EGS4 user code to compute simultaneously electron spectra and depth dose distributions, where the same proportional electron tracking algorithm and output to binary files

IAEA-SM-330/62 341
1.150
о Й
ф 1 .1 1 0 5 о о.О) с '5.0 1.070
?<р
о7 1.030
<_<1
<Я- 0.990л5я ?
0.9500 .1 1 .0 1 0 .0 1 0 0 .0
energy (MeV)
FIG. 1. Spencer-Attix (Д = 10 keV) water/air stopping power ratios for plane parallel monoenergetic photon beams with a radius of 56 mm (same area as a 100 mm x 100 mm field) evaluated using the two ICRU 37 density effect corrections for water, Stemheimer (solid line) and Ashley (dashed line). Values from Andreo and Brahme [1] evaluated with <5 ,, are included for comparison (circles). The inset emphasizes the agreement between sw air calcula
tions using ôICRU/Ash. and ^ analyt. '
as in the MCEF code are used. The PRESTA algorithm [20] is implemented in the Monte Carlo code, which is based on the version of the PEGS4 cross-section package including ICRU 37 stopping powers [21]. Although the above mentioned EPSTAR database has been used to extract the data for the density effect correction, PEGS4 data do not include <5Ash in the tabulation for stopping powers of water, but only stem.• F°r the present purposes, a special version of the complete EGS4/PRESTA
system with all variables and arithmetic in double precision has been implemented. A total of 5 x 10⁴ photons with the same incident energies, energy and depth bins for scoring, and geometry as above have been simulated down to 10 keV, using an electron Monte Carlo transport cut-off and knock-on threshold energy of 10 keV as no low energy depth independent slowing down calculation is available in the code. A conservative approach has been used regarding run time parameters of the EGS system, and the default PRESTA settings have been used in combination with a 4% restriction in the maximum electron energy loss per step (ESTEPE in the EGS4 nomenclature). The latter coincides approximately with the default values used in ETRAN and ITS for low Z materials [22].

342 ANDREO
0 .1 1 .0 1 0 .0 1 0 0 .0energy (MeV)
FIG. 2. Spencer-Attix (A = 10 keV) water/air stopping power ratios for plane parallel monoenergetic photon beams with a radius of 56 mm evaluated using three Monte Carlo codes, M CEF (solid line), DOSFL/EGS (circles) and CYLTRAN/ITS (dashed line). All results were evaluated with àICRWStem . M CEF and DOSFL/EGS use a proportional tracking algorithm to score electron fluences, whereas CYLTRAN/ITS utilizes the default algorithm in the code. Squares correspond to ‘in-line ’ calculations of sw air implemented in the CYLTRAN/ITS code yielding type A uncertainties smaller than 0.1%. The inset shows percentage differences relative to the results obtained with the M CEF code.
The same incident energies, electron transport cut-offs, spectral bins and geometry have been used in the simulations with the CYLTRAN/ITS code, and the output of the calculated electron spectra to binary files was implemented in the Monte Carlo system. The photon cut-off was chosen to be 1 keV owing to requirements of the ‘in-line’ calculation of stopping power ratios discussed below. The cross-section generation package XGEN 3 includes ICRU 37 stopping powers, numerical bremsstrahlung cross-sections differential in photon energy, coherent scattering with binding corrections, and binding corrections to incoherent scattering. As with the cross-section package for EGS, XGEN does not include the density effect correction of Ashley in the tabulation of stopping powers for water. The ITS family of codes runs in double precision in VAX/VMS computers, and output options were selected to include both electron spectra and energy deposition distributions. The track scoring algorithm in ITS is very different from the proportional tracking code used

IAEA-SM-330/62 343
in the codes MCEF and DOSFL/EGS4; in ITS a single energy bin is selected at random between the energies at the beginning and at the end of the path length, and the complete path is scored in the selected bin. This algorithm is of the same kind as the default tracking implemented in FLURZ/EGS4 [23] which scores the complete path either at the bin corresponding to the energy at the beginning of the path length or at the centre. Differences with the proportional tracking used above have been described in relation to electron beam calculations [17].
Results of the calculations of water/air stopping power ratios for monoenergetic photons based on <5Steni and using the different Monte Carlo codes are shown in Fig. 2. It can be observed that the results using MCEF (solid line) and DOSFL/EGS4 (circles) agree to better than 0.1% for the largest fraction of the energy range, the maximum deviation being 0.25% at 50 MeV (see inset). In contrast, the default electron fluence calculation in CYLTRAN/ITS (dashed line) yields differences within 0 .2 % for most energies, but they increase with energy up to 0.8% at the highest energy. Such large discrepancies between ITS and the other two codes are interpreted in terms of the different tracking algorithms, as the scoring of large step lengths becomes more inaccurate at high photon energies.
3. ‘IN-LINE’ CALCULATIONS OF STOPPING POWER RATIOS
Estimated combined uncertainties of 2% (specified as two standard errors) were quoted by the ICRU [24] for water/air stopping power ratios in high energy photon beams. Loevinger [25] estimated 1.5% uncertainty (95% confidence limit), justifying the decrease, compared with the ICRU value, in terms of the better knowledge of swair based on Monte Carlo calculations [26]. Loevinger took into account the uncertainty of the relation between i wair and the ‘energy’ of the beam to justify the increase from the 0.5% quoted as one standard deviation (Iff) for the Monte Carlo calculations [26] to his estimation of 1.5%. More recently Berger [27] has reported uncertainties in stopping power ratios for ‘ionization-to-dose conversion’ between 0.5 and 1.0%, probably specified also as an overall uncertainty equal to 2ff (about 95% confidence limit) following the ICRU 37 [3] estimations for stopping powers. None of these references has given details on the procedures or criteria used in the estimations.
Uncertainties in water to air stopping power ratios have been analysed for ^Co y rays and different photon bremsstrahlung spectra [28]. The uncertainties both during the calculation procedure (obtained using the analytical technique of Andreo and Fransson [29]) and during the selection of stopping power ratios as a function of the quality of the user’s beam were considered. Combined in quadrature these uncertainties yielded an average value of 0.65 % (Iff) for the overall uncertainty in the calculation of j w ail values at different depths. Such overall uncertainty is between the approximate Iff values resulting from the 2a or 95% confidence lim it

344 ANDREO
figures quoted above, that is, 0.25-0.50% for Berger [27] and 0.75% and 1% for Loevinger [25] and the ICRU [24] respectively. It is, however, considerably smaller than values reported in Ref. [30], where uncertainties of 1.5% and 0.5% (la) are quoted, respectively, for the calculation of stopping power ratios and for the selection procedure at the user’s beam, and it is also smaller than the 1 % estimated by Rogers [31].
A possible, although very small, influence of the actual number of energy bins used for the calculation of stopping power ratios and their uncertainties (using the technique described in Ref. [29]) has recently been discussed in Refs [31, 32]. It is also important to point out that the iterative Monte Carlo procedure in Ref. [29] does not allow a determination of independent type A and type В uncertainties, which follows the recommendations of the Comité international des poids et mesures [33] or the International Organization for Standardization [34]. The estimated uncertainties in electron stopping powers given by ICRU 37 [3] are overall uncertainties, and therefore the analytical determination w ill also yield an overall uncertainty.
In order to overcome these drawbacks and to be able to determine type A uncertainties alone, an ‘in-line’ calculation of water to air stopping power ratios has been implemented in the CYLTRAN code. Although ITS (as ETRAN) is a Class I code [35, 36] and is therefore based on unrestricted electron stopping powers, the cross-section generation package XGEN contains the ICRU 37 formulation for restricted stopping powers. XGEN uses the maximum energy transfer (electron kinetic energy divided by 2 ) as cut-off parameter and then evaluates unrestricted electron stopping powers [37]. A change of this parameter was the only task needed to compute stopping powers restricted to Д = 10 keV, which were written into external files. The procedure was performed for water and air respectively. CYLTRAN was modified to read in these data files before the simulation loop, making the data available to several routines through a Fortran common block. In the path length scoring subroutine of ITS, direct summations of the products of fluence times restricted stopping power were implemented for both water and air (evaluated by interpolation at a random energy value between the initial and the final energy of the transport step length). Electrons falling below the energy transport cut-off are treated in detail by ITS and ETRAN in a separate subroutine [22], where the products of fluence times unrestricted stopping power were added. Photons below the energy transport cut-off are not treated with the same detail in these Monte Carlo codes, and therefore choosing a very low photon energy transport cut-off minimized their contribution to the integrands. These summations are then direct Monte Carlo evaluations of the cavity integrals using a practically infinite number of energy intervals, and the procedure is equivalent to a very accurate determination of fluence weighted mean values of water and air stopping powers. The squared value of the products above was also scored, allowing determination of the type A uncertainty of each integral directly at the end of the simulation loop [36]; the uncertainties were added in quadrature to yield the combined type A uncertainty of the

IAEA-SM-330/62 345
calculated mean stopping power ratios. For all the energies, calculated standard deviations of the mean stopping power ratios were always below 0.06%, which makes the type A uncertainty of stopping power ratios practically negligible in the calculations reported in this work.
Figure 2 includes the calculations of water/air stopping power ratios using the ‘in-line’ calculation of stopping powers for ITS. The procedure brings the results of ITS into very close agreement (within about 0.2%) with the other Monte Carlo codes in the complete energy range under investigation.
4. ASSIGNMENT OF STOPPING POWER RATIOSTO PHOTON BEAM QUALITY
Calculated stopping power ratios should be assigned to the penetration properties of the photon beam, obtained during the same Monte Carlo calculation. Despite
energy (MeV)
FIG. 3. Beam quality index TPR2,g for plane parallel monoenergetic photon beams with a radius of 56 mm (same area as a 100 mm X 100 mm field) obtained from Monte Carlo calculations using M CEF (full circles), DOSFL/EGS (open circles) and CYLTRAN/ITS (squares). Results from the calculations of Andreo and Brahme [1] are included for comparison (crosses). The line corresponds to determinations of TPR2,% based on the convolution of M CEF calculated energy deposition kernels.

346 ANDREO
£о:>
оJZCL
“Ha>■oSc
8 .
i
t2
Oox:Q.CФ■DO
0 S1
(Bc<D
depth (mm)
FIG. 4. Central axis depth dose distributions for plane parallel monoenergetic photon beams with a radius of 56 mm (same area as a 100 mm x 100 mm field) obtained from the convolution of M CEF calculated energy deposition kernels. Results correspond to (a) incident energies of 0.1, 0.2, 0.3, 0.4, 0.5, 0.8, 1, 2, 3 and 4 MeV; (b) incident energies of 5, 8, 10, 12, 15, 20, 30, 40 and 50 MeV.

IAEA-SM-330/62 347
the large number of photon histories followed and the thick scoring layers used (10 mm), the statistical ‘noise’ inherent to the Monte Carlo simulations shows, however, that all the Monte Carlo calculations yield different TPR2® quality indices, which are also different from the values calculated in Ref. [1]. The different symbols in Fig. 3 show that the results obtained with all the calculations agree to within several per cent, but the agreement is not good enough to ensure a unique TPRio for a given energy. An analysis of the depth dose data shows that the distributions are far from being uniform owing to the Monte Carlo noise. The solution adopted in Ref. [1] was to perform an exponential fit between 100 and 200 mm, and use the obtained ‘attenuation coefficient’ to determine TPRi§. The three Monte Carlo codes used for the stopping power calculations in the present work yield, on average, rather similar depth energy deposition distributions, and their combined results could in principle be used to obtain a weighted mean value of the TPRfo quality index.
In the last few years powerful computational techniques have been developed for photon treatment planning algorithms, which are based on the convolution of Monte Carlo calculated energy deposition (mean energy imparted) kernels, or point
depth (mm)
FIG. 5. A comparison between central axis depth dose distributions for monoenergetic photon beams (radius 56 mm) obtained from Monte Carlo simulations using the codes M CEF (solid histogram) and DOSFL/EGS (dashed histogram) and from the convolution of M CEF calculated energy deposition kernels (solid lines).

348 ANDREO
T P R “ (1 00 m m x 100 m m fie ld )
FIG. 6. Spencer-Attix (A = 10 keV) water/air stopping power ratios for plane parallel monoenergetic photon beams (radius 56 mm) as a Junction of the quality of the beam (TPR2¡°0). The curves correspond to photon beam qualities obtained from the convolution of M CEF calculated energy deposition kernels, using SICRU/Ash and bICRli/Slem in the determination ofswair Results from the direct Monte Carlo calculations of Andreo and Brahme [1] are included for comparison (circles). The inset shows a magnification of the beam quality range most commonly used in radiotherapy.
spread functions, with an exponential function describing the attenuation of the incident photon fluence [38, 39]. The potential of the method as one of the most sophisticated variance reduction techniques available today has been discussed in Ref. [36]. Existing kernels have been computed for uniform media with the simulation of the transport of several million monoenergetic photons, and describe the average fraction of incident energy that is deposited in cylindrical voxels by charged particles during successive photon interactions. The convolution of the kernels yields dose distributions that correspond to the direct simulation of in the order of 1 0 12 photon histories. The extremely low uncertainty obtained with this procedure is, in practice, impossible to achieve when performing ordinary Monte Carlo simulations, and therefore the convolution method was considered the optimal choice to derive TPR?g values. Mackie [40] has demonstrated that MCEF based and EGS4 based databases of kernels agree very well, which provides reliability in any of the two sets of data. For consistency purposes the MCEF database has been adopted here as the

IAEA-SM-330/62 349
Monte Carlo code used both for electron spectra calculations and for the kernels is the same (different Monte Carlo user codes, where scoring and tracking routines of the necessary quantities are not the same, would have been used for the corresponding calculations with the EGS4 system). The MCEF database and formalism used for the present convolutions have been described in Ref. [38].
Depth energy deposition distributions for plane parallel monoenergetic photon beams with a radius of 56.4 mm (same area as a 100 mm x 100 mm field) have been computed for all the incident energies used in the Monte Carlo calculations of electron spectra. Fast Fourier transform subroutines given in Ref. [41] were used in the convolution of the kernels. Results are given in Fig. 4 using semilogarithmic plots, showing extremely smooth distributions. It can be seen that distributions corresponding to photon energies approximately below 5 MeV (Fig. 4(a)) would be poorly described by an exponential function. This is a consequence of the buildup of a large population of low energy photons that are intrinsically present in the Monte Carlo calculated kernels. The convolution calculated TPR2<j quality index for monoenergetic photons has been included in Fig. 3, showing a very smooth variation with the energy of the beam. For comparison purposes, Fig. 5 illustrates differences between the convolved depth dose distributions and those directly obtained from the Monte Carlo calculations, where the noise of the different simulations can be clearly observed despite the number of histories (105 with MCEF; 5 X 10⁴ with EGS) and depth intervals ( 1 0 mm) used in the simulation.
The importance of well defined TPR2® values can be observed in Fig. 6 , where the water/air stopping power ratios for the complete range of monoenergetic photons are plotted against TPR2q obtained from the convolution procedure. Results with TPRio determined from the direct Monte Carlo calculations of Andreo and Brahme [1] are included for comparison, showing the significant influence of the statistical noise (similar fluctuations are obtained with any of the three independent Monte Carlo calculations reported above). The two sets of density effect corrections, ¿stem, and 5Ash , are included in this comparison, and as in Fig. 1 it can be observed that they yield stopping power ratios that differ by up to 0.3 % in the most commonly used therapeutic range, shown in detail in the inset of the figure. Numerical data for the convolution calculated TPR2® values have been included in Table I.
5. STOPPING POWER RATIOS FOR BREMSSTRAHLUNG SPECTRA
The MCEF calculated water/air stopping power ratios and convolved depth doses for monoenergetic photon beams were written into binary files, yielding a database which was used to compute stopping power ratios for bremsstrahlung spectra by the procedure described by Andreo and Nahum [42]. The code to convolve the photon fluences of the input bremsstrahlung spectrum with the data for monoenergetic beams, to yield weighted average stopping power ratios, was rewritten in

350 ANDREO
T P R “ (100 m m x 100 m m fie ld )
FIG. 7. Spencer-Attix (A = 10 keV) water/air stopping power ratios for clinical plane parallel bremsstrahlung beams (radius 56 mm) as a function of the quality of the photon beam (TPR2¡q). Circles correspond to spectra published by different authors (cf. table 2 in Ref. [1]) and the solid line corresponds to spectra calculated in the same reference, the two calculations being performed using (a) b,CRV,stem. and (b) b,CRU/Ash in the determination of s„ air Corresponding calculations from Andreo and Brahme [11 using Sanal% are included for comparison (squares and dashed line respectively).
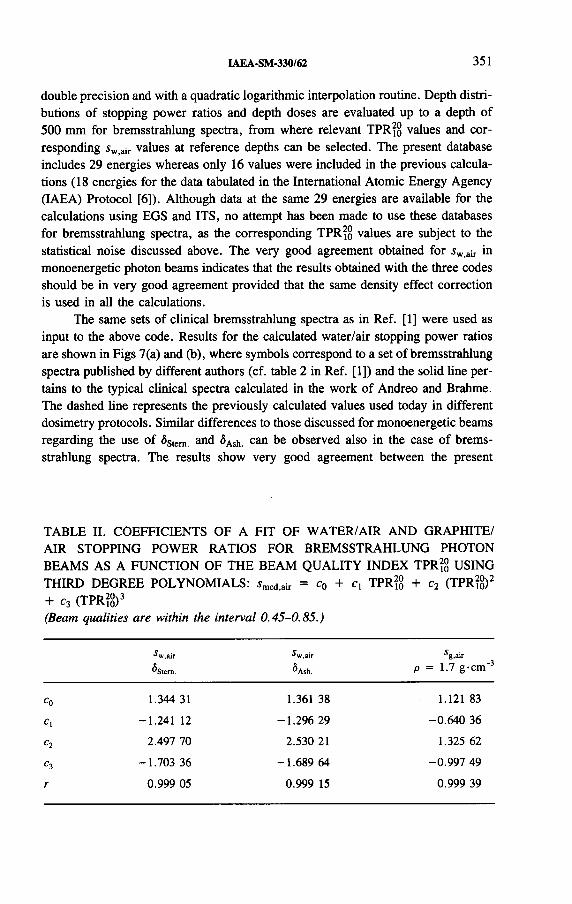
IAEA-SM-330/62 351
double precision and with a quadratic logarithmic interpolation routine. Depth distributions of stopping power ratios and depth doses are evaluated up to a depth of 500 mm for bremsstrahlung spectra, from where relevant TPR2® values and corresponding sw air values at reference depths can be selected. The present database includes 29 energies whereas only 16 values were included in the previous calculations (18 energies for the data tabulated in the International Atomic Energy Agency (IAEA) Protocol [6 ]). Although data at the same 29 energies are available for the calculations using EGS and ITS, no attempt has been made to use these databases for bremsstrahlung spectra, as the corresponding TPRjq values are subject to the statistical noise discussed above. The very good agreement obtained for sw>air in monoenergetic photon beams indicates that the results obtained with the three codes should be in very good agreement provided that the same density effect correction is used in all the calculations.
The same sets of clinical bremsstrahlung spectra as in Ref. [1] were used as input to the above code. Results for the calculated water/air stopping power ratios are shown in Figs 7(a) and (b), where symbols correspond to a set of bremsstrahlung spectra published by different authors (cf. table 2 in Ref. [1]) and the solid line pertains to the typical clinical spectra calculated in the work of Andreo and Brahme. The dashed line represents the previously calculated values used today in different dosimetry protocols. Similar differences to those discussed for monoenergetic beams regarding the use of ôStem and <5Ash can be observed also in the case of bremsstrahlung spectra. The results show very good agreement between the present
TABLE II. COEFFICIENTS OF A FIT OF WATER/AIR AND GRAPHITE/ AIR STOPPING POWER RATIOS FOR BREMSSTRAHLUNG PHOTON BEAMS AS A FUNCTION OF THE BEAM QUALITY INDEX TPRfg USING THIRD DEGREE POLYNOMIALS: smedjair = c0 + Cj TPR?§ + c2 (TPR? § )2
+ c 3 (T P R io ) 3
(Beam qualities are within the interval 0.45-0.85.)
w.airStem.
w.airAsh.
g.airp = 1.7 g-cm’3
Co 1.344 31 1.361 38 1.121 83
Cl -1.241 12 -1.296 29 -0.640 36C2 2.497 70 2.530 21 1.325 62
C3 -1.703 36 -1.689 64 -0.997 49r 0.999 05 0.999 15 0.999 39

352 ANDREO
T P R “ (1 0 0 m m x 100 m m fie ld )
FIG. 8. Spencer-Attix (A = 10 keV) water/air stopping power ratios for clinical plane parallel bremsstrahlung beams (radius 56 mm) as a Junction of the quality of the photon beam (TPR2]o). Lines correspond to polynomial fits of the results obtained with published and calculated spectra, using ICRU 37 density effect corrections ôStem (solid line) and Axk. (dashed line) in the determination ofsw air Corresponding data from the IAEA Code of Practice [6], adapted from the calculations of Andreo and Brahme [1] using àanaly, , are included for comparison (circles).
calculations using ¿>Ash and those in Ref. [1] using <5analyt. (Fig. 7(b)). Figure 7(a) illustrates, on the contrary, differences of up to 0.4% between the use of ôSteni and 5anaiyt. that can be of importance for certain applications, mainly ion chamber calibrations at standard laboratories. It should be stressed that owing to the rapid variation of the water/air stopping power ratios with beam quality at high energies, the experimental determination of TPR2§ should be performed with the greatest possible accuracy in that energy region.
The complete set of water/air stopping power ratios calculated for published and calculated spectra, using the two ICRU 37 [3] density effect corrections <5Stem and 3Ash. in the determination of sw,a¡r> can be fitted to better than 0 .1 % in most of the data points with third degree polynomials. Coefficients of the fit are given in Table П, together with the corresponding correlation coefficient. Figure 8 shows Spencer-Attix (Д = 10 keV) water/air stopping power ratios for clinical plane

IAEA-SM-330/62 3 53
оS
w (N o (N o 00 r f On r t On en 40 00 On 00 40и
$
v» ■S •* en cn en en en (N ÍN O O On 00 r- vo »П<Ш
’S £ < • f-¡© о O о О
J P9 o
WJJ
ZoH
•"«■iQv»
s o g w& £
en •n en (N On »n O 1П O en 40 00 00 г-» in05 S en cn cn en en (S CS cs *«4 O On 00 r- vo «n<№
Xeu
•fî,
ce 2 ^ <л *o -
O о о о о
Wz
WX ■§
c H Q
1—1 PU C DC<ubi
Oh
P¿o -1 O Tfr cn On m «n O r f 00 O es cs ON
;>> f-H v-H O O o On On 00 r- VO mS
(SO H -ss -H <—« *—1 O O o o O O о о№
J<cD
5 ii* <-HсоoИ—(
oOn
2oШ
S
£l-M
P iXH < <N 8 s
<N 8 r- en Г" es r- o cn r f m r f esW O O On ON 00 00 r- 40 •n
s СП es
£o
PU # \ Seu
O O o О о о O о О оo 4J
Q i-"H T-.
IX z s-5s¡o oHH •2z H t jS-H uPh z t G (S r- «n en O VO r** r f 00 es
sVO r- VO m «-Н
Рч rs O' Tt T f r f r f en cn (S On 00 r - 40 mo Í3 8 ~>л ’-j —; J O о о О о
H b z ,-H -H -H —* f-Hcn
P i<C/3
o
< c £
SСЛS<
ssc
<u00 ЧО r^ es 40 VO o en in r- 00 00
D "Slea ,cd § 8 8 S 8 On
OnOnOn
00On
00On
r-On
r-On
40On
inON
спON
esOn
o»
WCQ §
t-<O 1—1 *-H O d d d O O O о о о О
S <Ko~>
>PSH fc>
Л uЩ S c o cn (N ON »n m
gm 00 es СП es Q
K*, ’C 00 00 00 00 r- r- l> vO inS S
cn es Оo Oh
•g"Bû
o o o O O o O O O o o o о 25C/5 —i 1- î - î ~N*
II O
< ZD '1
XJX ■§ <N so r- r- 40 • - 00 en On tj- 00 r f 1П 40 m
pH<
g«n On Os On On ON On 00 00 r - r- VO VO in r f СП cs
5 p «n ОЧ ON On O' ON On On ON On On ON ON ON ON ON OnP5H 6 -&
ù O o d O d O O d d O O О d O О O
ipî
C/3c/5 8 <u
a . ?M 2
XЙüj£
■-«»-C
o VO »n Г4 ON 40 O 00 CM «n r- r - m esЩ CQ Д
‘S*>л Tj- r f Tj- Tt cn en cn ÍN T«H o
s00 r- 40 in
s 1<
T“* О о О оC/5 Q s r¡
_Ç> c h‘ r-î »-< -H *—■ f-î r-¿ у-ч
0
SРЭ
Z<on>*
8
o oc itóОн
1g
8
•2o<uwV*oo
o o(N —Q¿, s O cn 40 On es <n 00 O es r f 40 oo о es r fc N4 H 0ч ô *n •n •n »n VO 40 vO r- t— r^ Г-- 00 00 00
H <*- *t5 H U d о о о O о O о O O o о о о о

354 ANDREO
parallel bremsstrahlung beams (radius 56 mm) as a function of the quality of the photon beam (TPRjo). Lines correspond to polynomial fits of the results obtained with published and calculated spectra, using ICRU 37 density effect corrections ôStem (solid line) and ôAsh (dashed line) in the determination of i w,air- Corresponding data included in the IAEA Code of Practice [6 ], adapted from the calculations of Andreo and Brahme [1] using ¿„„„y , are included for comparison (circles).
The MCEF calculated electron fluences in water have been used also to compute stopping power ratios for materials of interest in dosimetry. Values for the same materials as in the IAEA Code of Practice [6 ] are given in Table Ш, and a comparison between the actual data and the data included in the Code of Practice is shown in Fig. 9. Differences from the existing data are within 0.2% in the most commonly used therapeutic range, with a maximum deviation close to 0.5% at the high energy end. The discrepancies shown are mainly due to the improvements in the calculation procedure reported above, including the use of Sstern instead of ôanalyt for all materials. For the graphite/air ratio both published and calculated spectra have been
T P R “ (1 0 0 m m x 100 m m fie ld )
FIG. 9. Spencer-Attix (A = 10 keV) medium/air stopping power ratios for clinical plane parallel bremsstrahlung beams (radius 56 mm) as a function of the quality of the photon beam (TPR2]q). Lines correspond to calculations performed using bICRV/Stern in the determination of smed.air Corresponding data from the IAEA Code of Practice [6 ] , adapted from the■ calculations of Andreo and Brahme [1] using ôanalyl, are included for comparison (symbols).

IAEA-SM-330/62 355
used to yield the values given in the table, and the coefficients for a fit of sg>air similar to that performed for water are included in Table П. The density effect correction tabulated in ICRU 37 [3] for a (carbon) graphite density of 1.7 g-cm' 3 has been used. For the rest of the materials only calculated bremsstrahlung spectra were used as input to the averaging procedure.
It should be noted that the targets and flattening filters used in the accelerators at some standard laboratories and new clinical accelerators with scanned photon beams are very different from those used in most clinical accelerators. This w ill result in photon beams with different penetration properties compared with those commonly used in clinical practice. An important consequence of such differences is that stopping power ratios given here, or those used today in dosimetry protocols, w ill not necessarily apply to such accelerators, not even when the quality of the beam is specified in terms of TPR2®. It was emphasized in the work of Andreo and Brahme [1] that their data pertained to beams with characteristics similar to those used in clinical practice at that time; they were careful to emphasize that the sw>air- TPRjo correlation given by them should be restricted to such clinical beams. It was observed that the thickness of the target is not as important as the thickness of the flattening filter in deriving a correlation between sw>air and TPR2® close to that calculated for real clinical beams. An investigation of the reasons for having different beam characteristics at standard laboratories and hospitals, in order to take into account these differences in calibration factors supplied to users, has, however, not yet been performed.
6 . CONCLUSIONS
A new set of values of medium/air stopping power ratios is given in this work that constitutes one further step in the homogenization of the data used in the ion chamber dosimetry of photon beams. The use of improved calculations for monoenergetic beams performed with three independent Monte Carlo codes, yielding values within about 0 .2 %, provides a firm consensus and gives reliability to the existing set of data used today in different dosimetry protocols. The assignment of stopping power ratios to the photon beam quality, based on the convolution of Monte Carlo calculated energy deposition kernels, demonstrates the influence of the intrinsic statistical noise of pure Monte Carlo calculations with a feasible number of histories, and shows their inadequacy for this purpose. Analytical calculations combined with Monte Carlo simulations provide a powerful variance reduction technique, which has already proven its validity in modem radiotherapy treatment planning algorithms. Differences of about 0.2-0.3% have been found between the new stopping power data and previous calculations, which for certain materials and at the highest energies can be up to 0.5%. It has been verified, however, that the discrepancies are mainly caused by the use of the two alternative sets of density effect

356 ANDREO
corrections for water tabulated in ICRU 37 [3]. The improved calculations of stopping power ratios and assignment to photon beam quality do not provide, therefore, enough differences to justify a change in the data used for therapeutic photon beams (e.g. in the IAEA Code of Practice [6 ]), although they could be preferred in certain instances for more accurate absorbed dose determinations. The data given here are strictly valid only for photon beams whose target-filter configuration corresponds to ‘standard’ therapeutic accelerators.
Existing estimations and analytical determinations of uncertainties of stopping power ratios have been discussed. Attention has been focused on the difficulties of estimating separate type A and type В uncertainties of stopping power ratios considering the overall uncertainty given in ICRU 37 for electron stopping powers. A method has been implemented where cavity integrals are directly evaluated during the Monte Carlo simulation of photon transport, showing that the largest contribution to the uncertainties of stopping power ratios is of type В whereas type A (due solely to the calculation procedure) is practically negligible.
ACKNOWLEDGEMENTS
Invaluable support has been given by J. Halbleib and co-workers at Sandia National Laboratories to update the ITS system and to perform the in-line calculations of water/air stopping power ratios. The help from A. Eklof with the convolution of the kernels is greatly appreciated. Financial support of the Swedish Radiation Protection Institute and Cancerfôreningen i Stockholm is gratefully acknowledged.
REFERENCES
[1] ANDREO, P., BRAHME, A., Stopping power data for high energy photon beams, Phys. Med. Biol. 31 (1986) 839-858.
[2] COMITE CONSULTATIF POUR LES ETALONS DE MESURE DES RAYONNEMENTS IONISANTS, Report of the 8th Meeting of Section I, BIPM, Sèvres (1985).
[3] INTERNATIONAL COMMISSION ON RADIATION UNITS AND MEASUREMENTS, Stopping Powers for Electrons and Positrons, ICRU Rep. 37, Bethesda, MD(1984).
[4] NEDERLANDSE COMMISSIE VOOR STRALINGSDOSIMETRIE, Code of Practice for the Dosimetry of High-Energy Photon Beams, Rep. NCS-2, Amsterdam (1986).
[5] SWISS SOCIETY OF RADIATION BIOLOGY AND RADIATION PHYSICS, Dosimetry of High Energy Photon and Electron Beams: Recommendations, G. Garavaglia, Ospedale San Giovanni, CH-6500 Bellinzona, Switzerland (1986).

IAEA-SM-330/62 357
[6 ] INTERNATIONAL ATOMIC ENERGY AGENCY, Absorbed Dose Determination in Photon and Electron Beams: An International Code of Practice, Technical Reports Series No. 277, IAEA, Vienna (1987).
[7] SOCIEDAD ESPAÑOLA DE FISICA MEDICA, Suplemento al Documento SEFM № 1-1984: Procedimientos Recomendados para la Dosimetría de Fotones y Electrones de Energías Comprendidas entre 1 MeV y 50 MeV en Radioterapia de Haces Externos, Publ. No. 2-1987, SEFM, Madrid (1987).
[8 ] ASSOCIAZIONE ITALIANA DI FISICA BIOMEDICA, Protocollo per la Dosimetría di Base nella Radioterapia con Fasci di Fotoni ed Elettroni con £max fra 1 e 40 MeV, Fis. Biomed. 6 2 (1988).
[9] ANDREO, P., Monte Carlo Simulation of Electron Transport in Water: Absorbed Dose and Fluence Distributions, Rep. FANZ/80/3, Dept, of Nuclear Physics, Univ. of Zaragoza (1980).
[10] NELSON, W.R., HIRAYAMA, H., ROGERS, D.W.O., The EGS4 Code System, Rep. SLAC-265, Stanford Linear Accelerator Center, Menlo Park, CA (1985).
[11] HALBLEIB, J.A., KENSEK, R.P., VALDEZ, G., SELTZER, S.M., BERGER, M.J., ITS Version 3.0: The Integrated TIGER Series of Coupled Electron/Photon Monte Carlo Transport Codes, Rep. Sand 91-1643, Sandia Natl Labs, Albuquerque, NM (1992).
[12] INTERNATIONAL COMMISSION ON RADIATION UNITS AND MEASUREMENTS, Radiation Dosimetry: Electron Beams with Energies Between 1 and 50 MeV, ICRU Rep. 35, Bethesda, MD (1984).
[13] STERNHEIMER, R.M., The density effect for the ionization loss in various materials, Phys. Rev. 8 8 (1952) 851-859.
[14] STERNHEIMER, R.M., General expression for the density effect for the ionization loss of charged particles, Phys. Rev., В Condens. Matter 24 (1981) 6288-6291.
[15] STERNHEIMER, R.M., BERGER, M.J., SELTZER, S.M., Density effect for the ionization loss of charged particles in various substances, At. Data Nucl. Data Tables 30 (1984) 261-271.
[16] STERNHEIMER, R.M., SELTZER, S.M., BERGER, M.J., Density effect for the ionization loss of charged particles in various substances, Phys. Rev., В Condens. Matter 26 (1982) 6067-6076.
[17] ANDREO, P., Depth-dose and stopping-power data for monoenergetic electron beams, Nucl. Instrum. Methods Phys. Res., Sect. В 51 (1990) 107-121.
[18] NAHUM, A.E., Calculations of Electron Flux Spectra in Water Irradiated with Megavoltage Electron and Photon Beams with Applications to Dosimetry, Thesis, Univ. of Edinburgh, Order No. 77-70006, Univ. Microfilms Int., Ann Arbor, MI (1976).
[19] NATIONAL INSTITUTE OF STANDARDS AND TECHNOLOGY, EPSTAR: Electron and Positron Stopping Powers of Materials, Standard Reference Database 7, NIST, Gaithersburg, MD (1988).
[20] BIELAJEW, A.F., ROGERS, D.W.O., PRESTA: The Parameter Reduced Electron- Step Transport Algorithm for electron Monte Carlo transport, Nucl. Instrum. Methods Phys. Res., Sect. В 18 (1987) 165-181.

358 ANDREO
[21] DUANE, S., BIELAJEW, A.F., ROGERS, D.W.O., Use of ICRU-37/NBS Collision Stopping Powers in the EGS4 System, Rep. PIRS-0173, Natl Research Council Canada, Ottawa (1989).
[22] SELTZER, S.М., “ An overview of ETRAN Monte Carlo methods” , Monte Carlo Transport of Electrons and Photons (JENKINS, T.M., NELSON, W.R., RINDI, A., Eds), Plenum Press, New York (1988) 153-181.
[23] BIELAJEW, A.F., Natl Research Council Canada, Ottawa, private communication.[24] INTERNATIONAL COMMISSION ON RADIATION UNITS AND MEASURE
MENTS, Radiation Dosimetry: X Rays and Gamma Rays with Maximum Photon Energies Between 0.6 and 50 MeV, ICRU Rep. 14, Bethesda, MD (1969).
[25] LOEVINGER, R., “ Dissemination of the unit of absorbed dose by calorimetric and ionometric methods” , Ionizing Radiation Metrology (CASNATI, E., Ed.), Editrice Compositori, Bologna (1977) 141-162.
[26] BERGER, M.J., SELTZER, S.M., DOMEN, S.R., LAMPERTI, P.J., “ Stopping- power ratios for electron dosimetry with ionization chambers” , Biomedical Dosimetry (Proc. Symp. Vienna, 1975), IAEA, Vienna (1975) 589-609.
[27] BERGER, M.J., “ Electron stopping-powers for transport calculations” , Monte Carlo Transport of Electrons and Photons (JENKINS, T.M., NELSON, W.R., RINDI, A., Eds), Plenum Press, New York (1988) 57-80.
[28] ANDREO, P., Uncertainties in dosimetric data and beam calibration, Int. J. Radiat. Oncol. Biol. Phys. 19 (1990) 1233-1247.
[29] ANDREO, P., FRANSSON, A., Stopping-power ratios and their uncertainties for clinical electron beam dosimetry, Phys. Med. Biol. 34 (1989) 1847-1861.
[30] BRAHME, A. (Ed.), Accuracy Requirements and Quality Assurance of External Beam Therapy with Photons and Electrons, Acta Oncol. 15 Suppl. 1 (1988).
[31] ROGERS, D.W.O., The role of Monte Carlo simulation of electron transport in radiation dosimetry, Appl. Radiat. Isot. 42 (1991) 965-974.
[32] ANDREO, P., FRANSSON, A., Estimation of uncertainties in stopping-power ratios using Monte-Carlo methods, Appl. Radiat. Isot. 43 (1992) 1425-1426.
[33] Rapport du Groupe de Travail sur l ’expression des incertitudes au Comité International des Poids et Mesures, Procès-Verbaux 49, Offilib, Paris (1981) A1-A12.
[34] INTERNATIONAL ORGANIZATION FOR STANDARDIZATION, INTERNATIONAL ELECTROTECHNICAL COMMISSION, INTERNATIONAL ORGANIZATION OF LEGAL METROLOGY, INTERNATIONAL BUREAU OF WEIGHTS AND MEASURES, Guide to the Expression of Uncertainty in Measurement, ISO, Geneva (1992).
[35] BERGER, M.J., “ Monte Carlo calculation of the penetration and diffusion of fast charged particles” , Methods in Computational Physics, Vol. 1 (ALDER, B., FERN- BACH, S., ROTENBERG, М., Eds), Academic Press, New York (1963) 135-215.
[36] ANDREO, P., Monte-Carlo techniques in medical radiation physics, Phys. Med. Biol. 36 (1991) 861-920.
[37] HALBLEIB, J., Sandia Natl Labs, Albuquerque, NM, private communication.[38] AHNESJÔ, A., ANDREO, P., BRAHME, A., Calculation and application of Point
Spread Functions for treatment planning with high energy photon beams, Acta Oncol. 26 (1987) 49-56

IAEA-SM-330/62 359
[39] MACKIE, T.R., BIELAJEW, A.F., ROGERS, D.W.O., BATTISTA, J.J., Generation of photon energy deposition kernels using the EGS Monte Carlo code, Phys. Med. Biol. 33 (1988) 1-20.
[40] MACKIE, T.R., “ Applications of the Monte Carlo method in radiotherapy” , TheDosimetry of Ionizing Radiation, Vol. 3 (KASE, K.R., BJARNGARD, B.E.,ATTIX, F.H., Eds), Academic Press, New York (1990) 541-620.
[41] PRESS, W.H., FLANNERY, B.P., TEUKOLSKY, S.A., VETTERLING, W.T.,Numerical Recipes, The Art of Scientific Computing, Cambridge Univ. Press, NewYork (1986).
[42] ANDREO, P., NAHUM, A.E., Stopping power ratio for a photon spectrum as a weighted sum of the values for monoenergetic photon beams, Phys. Med. Biol. 30 (1985) 1055-1065.


IAEA-SM-330/17
DEPTH AND FIELD SIZE DEPENDENCE OF RATIOS OF MASS ENERGY ABSORPTION COEFFICIENT, WATER TO AIR, FOR KILOVOLTAGE X RAY DOSIMETRY
R.T. KNIGHT, A.E. NAHUM Joint Department of Physics,Royal Marsden Hospital and
Institute of Cancer Research,Sutton, Surrey,United Kingdom
A b s t r a c t
DEPTH AND FIELD SIZE DEPENDENCE OF RATIOS OF MASS ENERGY ABSORPTION COEFFICIENT, WATER TO AIR, FOR KILOVOLTAGE X RAY DOSIMETRY.
Values of the ratio of the mass energy absorption coefficient, water to air, 02en/p)w a¡r, are required for insertion into the expression recommended for determining absorbed dose to water, Dw, in kilovoltage X ray beams using an air kerma calibrated ionization chamber. Values for both primary (i.e. free-in-air) spectra and spectra at depths within a water phantom have been calculated for low and medium energy X rays using the Monte Carlo method. These are [(/2en/p)w a¡r]p, for HVLs between 0.05 and 22 mm Al (0.01 and 6 mm Cu), and QIen(z, /)/p)w,air. f°r HVLs between 1 and 22 mm Al (0.03 and 6 mm Cu), at depths (z) between 0 and 10 cm with circular field sizes (/) between 0.5 and 30 cm2 equivalent square. Primary spectra and the corresponding HVLs (in mm Cu or Al) were calculated using the programs of Birch and Marshall. X ray unit target angles and inherent/added filtrations were consistent with those used for the measured spectra of Seelentag et al. The EGS4 (Electron Gamma Shower version 4) Monte Carlo package was used to simulate photon transport within a water phantom through adaptation of the user code FLURZ. Monoenergetic /¡en/p data were extracted from the work of Hubbell. It is evident that the first HVL is inadequate as a unique look-up parameter for Qiea/p)w ,a¡r - The variation of (jxcn(z, f)/p)w ,a¡r with / and z is shown. The dependence of <jlen(z, f)/p)Wtair on /* s significant, especially for less than 10 cm square fields. The corresponding dependence on z is less critical.
1. INTRODUCTION
Values of the ratio of the mass energy absorption coefficient, water to air, (Men/p)w,air> are required for insertion into the expression recommended for determining absorbed dose to water, Dw, using a free-in-air air kerma calibrated ionization chamber [1, 2]. It is shown in Ref. [2] that the expression for determining
361

362 KNIGHT and NAHUM
(Dw)s at the surface of a water phantom for low energy X rays (below 8 mm AI HVL) is:
where (Mu)p is the meter reading free in air, N K is the air kerma calibration factor, B w is the backscatter factor, calculated as a ratio of water kermas, and [(/wWw.airlp is the ratio of the mean mass energy absorption coefficients, water to air, evaluated over the primary X ray energy fluence spectrum which, as a consequence, does not have any dependence on field size or depth.
The expression recommended for determining (Dw)z at a calibration depth z in a water phantom for medium energy X rays (between 8 mm AI and 4 mm Cu HVL) is:
where (Mu)z is the meter reading at depth z, kQ and p¿-¡s are correction factors [2 ], and fen (г, f)/p)w,air is the ratio of the mean mass energy absorption coefficients, water to air, evaluated over the attenuated spectrum at depth z for field size/on the surface.
A table of (jieB(z, /)/p)w>aк factors is provided in the Code of Practice of the International Atomic Energy Agency (IAEA) [1], consisting of values at z = 0, 2 and 5 cm for the quality range 2.24 mm AI (0.072 mm Cu) HVL to 3.37 mm Cu HVL. These values were calculated by Grosswendt [3] using the Monte Carlo method and are specific to one field size only (i.e. 11.3 cm diameter, equivalent to 10 cm square, at 100 cm SSD). Report 23 of the International Commission on Radiation Units and Measurements (ICRU) [4] provides a table of F factors (proportional to (jxen{z, /)/p)w,air)' for the quality range 0.5 mm AI HVL to 4.0 mm Cu HVL. These factor's were also only specific to a 10 cm square field size. However, it was stated that, should the F factors be applied to other field sizes, an error of less than 2% is introduced. The F factors were for equivalent monoenergetic beams with the same HVL as the spectra considered. The HVLs were adjusted to account for the difference in the beam quality between that inside the water phantom and that of the primary beam [4]; no indication was given of any dependence on depth. Seuntjens et al. [5] calculated values of the absorbed dose conversion factor, ‘f (proportional to [(/¡en/p)w,air]p) . 2 for measured primary kilovoltage spectra.
1 F = 2.58 x 10"* [ С - k g '1] (W/e) (]iJp )wMr x 100 [rad-(J- k g ’ 1) - 1] , w he re W/e = 33.7 [J-C1].
2/ = 2.58 x 10"4 [ С - k g '1] (W/e) (/¿en/p)wair X 100 [ r a d - iJ - k g -1) " 1] , w he re W/e =33.85 [ J - C - 1] .
( 1 )
w,air(2 )

IAEA-SM-330/17 363
These data are presented as a function of HVL in mm Al for spectra generated between 50 and 120 kVp, and as a function of HVL in mm Cu for spectra generated between 120 and 250 kVp. Rosser [6 ] calculated values of (/¡en(z, f)lp)w,air using the Monte Carlo method with a geometry equivalent to that used in the calculation of the IAEA values for the quality range 0.15 mm Cu HVL (100 kVp) to 4.0 mm Cu HVL (280 kVp) at 2 cm depth. A calculation of the variation in <jlen(z, /)/p)w,air with depth was also performed for one (the softest) quality.
In order to provide data strictly suitable for insertion into Eqs (1) and (2), calculations of [( /¡ei/p )w ,a ir]P and (/jen(z, f)lp)w>air have been performed using the Monte Carlo method for a comprehensive range of therapeutic low and medium energy X ray spectra. The monoenergetic Ji^Jp data were extracted from Hubbell[7] . 3 The dependence of the & en(z, /)/p)w,air values, as a function of both field size and depth, has been investigated. A comparison of these new data against the aforementioned values has also been performed.
2. METHOD
The ratio of the mean mass energy absorption coefficients, water to air, at a point is calculated as:
where ФЕ is the spectral distribution of the photon fluence at that point, and 0ten(£)/p)w and (neTi(E)lp)air are the monoenergetic values of mass energy absorption coefficient for water and air at energy E. This expression was actually evaluated numerically using a large number of energy intervals.
The EGS4 (Electron Gamma Shower version 4) Monte Carlo system [9] was used to simulate photon transport within a semi-infinite water phantom through adaptation of the National Research Council Canada user code FLURZ. EGS4 is a general purpose software package for the simulation of photon and electron transport within an arbitrary geometry. For this work, the only types of particle interaction necessary were photoelectric absorption, Rayleigh scattering and incoherent scattering. Since the generation of bremsstrahlung is negligible at kilovoltage energies, the transport of secondary electrons could be excluded. This was done by setting the EGS4 parameter ECUT to 0.811 MeV. The EGS4 code was adapted to compensate
3 New monoenergetic цеп(Е)1р data have since been made available [8 ]. For all the given energies below 300 keV the monoenergetic (/ien(£)/p)wair ratios are within approximately 0.3% of the Hubbell [7] data, with one exception (at 8 keV) which is smaller by 0.8%.
(3)

364 KNIGHT and NAHUM
for the effect of electron binding within the incoherent interaction by multiplying the Klein-Nishina differential cross-section by an incoherent scattering function [10]. The user code FLURZ describes transport within a cylindrical phantom with azimuthal symmetry. Fluence within a region is defined to be the sum of the photon track lengths divided by the volume of that region.
The irradiation geometry was that of circular plane parallel beams incident on a very broad water phantom of 20 cm depth. Through utilization of the theorem of reciprocity [1 1 ], fluence through a very thin scoring cylinder (or plane) at a depth, with a pencil beam impinging onto the surface of the phantom, was assumed equal to the fluence at a point coincident with the central axis of the beam, at that depth, for a field size equal to the surface area of the plane. The histories of 5 x 10⁴
photons were followed for each input spectrum until the energy of each fell below 1 keV. Calculations were performed for primary spectra (i.e. with only the scoring cylinder present) and for spectra at selected depths. Calculations of photon fluence were performed for all field sizes simultaneously.
The primary spectra were calculated by using the programs of Birch and Marshall [12], as were the HVLs, in either mm Cu or mm AI. The target material, angles and inherent/added filtrations, used as input to these programs, were either consistent with those utilized in producing the spectra measured by Seelentag et al. [13] or consistent with those used in the Siemens Stabilipan 2 unit at this centre (Royal Marsden Hospital, RMH). The number of energy intervals chosen for the equivalent sum to replace Eq. (3) was 200. Intermediate monoenergetic цеп(Е)/р values were obtained by linear interpolation over the Hubbell [7] data.
Values of [(Á¿en/p)w,air]p> for primary spectra with HVLs between 0.05 and 22 mm AI (0.01 and 6 mm Cu), and values of (/¡en(z, / )/ p )w,air> f°r primary spectra with HVLs between 1 and 22 mm AI (0.03 and 6 mm Cu), for circular field sizes between 0.5 and 30 cm2 equivalent square at г = 0 (surface), 1, 2, 3, 5, 7 and 1 0 cm, were calculated.
A standard (statistical) error was derived for each value of [6 Wp)w,airlp an¿ (Jlen(z, f)lp )w,air by dividing the number of histories into ten separate batches and calculating separate values for that fraction of the histories alone. It has been shown that this technique overestimates the true standard error of such quantities [14], yet the maximum standard error obtained here was only 0 .1 %.
3. RESULTS
The dependence of [(Men/p)w,aidp on HVL is shown in Fig. 1. The largest spread in these values is approximately 2% between 2 and 10 mm AI HVL. A distinction is made between the values attributable to Seelentag et al. [13] spectra and those specific to RMH spectra. The trend in these two sets of values, however, is consistent. Equivalent data from Seuntjens et al. [5] are also plotted for measured

IAEA-SM-330/17 365
1.15
1 .1 0
СО
сфiss.
1.05
1 . 0 0
-j--------1— i i i 11111------- 1— i i j i in ]------- 1— i i i 1111 j-------1— i—i i 1111 г
Seelentag spectra оRMH spectra □Seuntjens et al. (1987) A 50 kVp
♦ 80 kVp* 100 kVp• 120 kVp □о
о <Ьо
Оо
8«О
o e ¿
............................' ■>............... I___ 1 ' I I ■ I I I l i l i l í l i l i l í
0 . 0 1 0 .1 1 .0
HVL (mm Al)ю .о ю о .о
FIG. 1. Ratio o f the free-in-air mean mass energy absorption coefficient, water to air, [G¡-e¿P)w.air]p> as a function o f HVL. Values for 113 Seelentag et al. [13] spectra (circles) and 5 RMH spectra (squares) are shown. The uncertainties are too small to be seen here. Equivalent values from Seuntjens et al. [5] (triangles, diamonds, stars, hexagons) are also included for comparison.
primary spectra between 50 and 120 kVp. These data are in good agreement and a similar spread of values is also evident. An exception, however, occurs for 50 kVp, where the values are approximately 1 % lower.
The dependence of Q.¡en(z, /)/p)w,airon HVL at z = 2 cm is shown in Fig. 2. The spread in these values is similar to that in values of [(/W p)w ,a ir]p - The equivalent data from the IAEA [1], the ICRU [4] and Rosser [6 ] are plotted for comparison. It can be seen that the IAEA [1] values provide a reasonable fit to the data from this work. The much lower ICRU [4] values are attributed to alterations to the recommended monoenergetic /¡en/p data since that time. The higher Rosser [6 ] values are explained by considering that a slightly smaller field size incident on a much smaller water phantom was simulated.

366 KNIGHT and NAHUM
aj £" aC 1
•ÎÎсФ
ISL
1 . 0 1 0 . 0
HVL (mm AI)1 0 0 . 0
FIG. 2. Ratio o f the mean mass energy absorption coefficient, water to air, (jien(z, f)/p)wair, as a function o f HVL for f = 11.2 cm diameter (equivalent to 10 cm square) and z = 2 cm depth in a water phantom. The Seelentag et al. [13] and RMH values are not differentiated here (circles). The equivalent data from the IAEA [1] (squares), the ICRU [4] (triangles) and Rosser [6] (stars) are included for comparison.
The variation of (¡im(z, / )/ p )w,air with field size at z = 2 cm, for the five RMH spectra, is shown in Fig. 3. In general, Q¡en(z, / )/ p )w,air decreases with an increase in field size and the change is more significant for harder beam qualities. For the hardest quality considered here (3 mm Cu HVL) this decrease is almost 2%. Little variation occurs, however, for field radii greater than 1 0 cm.
The variation of (/ten(z, / )/ p )w,air with depth, with / = 11.2 cm diameter, for the five RMH spectra is shown in Fig. 4. No clear trends are discernible for the softer qualities owing to the complicated way in which the spectra alter shape with increase in depth. For the harder qualities, however, a decrease of approximately0.5% is discernible within the first 5 cm, which is consistent with the IAEA data [1].

IAEA-SM-330/17 367
Field radius (cm)
FIG. 3. Ratio of the mean mass energy absorption coefficient, water to air, (jxen(z, í)/f>)Wxa¡r, at z = 2 cm in a water phantom as a funçtion of field size f for five RM H spectra.
Data for [(/W^w.airlp and (¡¡en(z, /)/p)w,ak. for / = 10 cm square (11.2 cm diameter) at z = 5 cm, against HVL in either mm Al or mm Cu, are given in Table I. The accuracy of these values should not be assumed to be better than 1 %.
4. CONCLUSIONS
The agreement between the new [(/¿en//°)w,air]p data and those due to Seuntjens et al. [5] is good, except for the lowest kVp. Excellent agreement exists between the new (¡¡en(z, /)/p)w,air data and the IAEA data [1]. Reasons have been given for the slight difference between the new data and those due to Rosser [6 ].

368 KNIGHT and NAHUM
Depth (cm)
FIG. 4. Ratio of the mean mass energy absorption coefficient, water to air, (jien(z, i)/p)w r, for f = 11.2 cm diameter as a Junction of depth z in a water phantom for five RMH spectra.
It is evident that HVL is inadequate as a unique parameter of either [ (M e n/ p )w ,air] p o f (p -eniz, / ) / p )w ,air- The large number of spectra utilized in acquiring the new data and the significant spread in these values, particularly within the therapy quality range (approximately 1.5 mm Al HVL to 3 mm Cu HVL), strongly suggest that any Q i en/p )w ,a ir data recommended for use in clinical practice cannot be more accurate than 1 % (without a complete description of the spectra).
The variation of G*en(z. /)/p)w>air with field size is significant for field sizes / less than 10 cm square. The currently recommended calibration field size (10 cm square) should not be decreased for this reason. The variation of (/*en(z, /)/p)w,air with depth z is less critical and would not compromise a calibration at a depth different to the currently recommended calibration depth (5 cm).

IAEA-SM-330/17 369
TABLE I. VALUES OF THE RATIO OF THE MEAN MASS ENERGY ABSORPTION COEFFICIENT, WATER TO AIR, FOR THE PRIMARY SPECTRUM, [(/W p)w ,a ir]p , AND AT DEPTH г = 5 cm IN A WATER PHANTOM FOR INCIDENT FIELD S IZ E /= 10 cm SQUARE, (¡Len(z, / )/ p )w,a.r, AGAINST HVL IN mm AI AND mm Cu (the uncertainty is 1% )
mm AI
HVL
mm Cu [(Mei/P)w,air]p (Menfc fi<P)w,air
0 .1 1.0560 .2 1.0470.3 1.0400.4 1.0360.5 1.0320 .6 1.0300 .8 1.0251 .0 1 .0 2 2
1 .2 1 .0 2 0
1.5 1 .0 2 0
2 .0 0.07 1.018 1.0173.0 0 .1 0 1 .0 2 1 1 .0 2 1
4.0 0.15 1.026 1.0245.0 0 .2 1 1.032 1.0286 .0 0.29 1.037 1.0338 .0 0.47 1.047 1.042
1 0 .0 0 .6 8 1.0511 2 .0 1.03 1.06215.0 1.91 1.0802 0 .0 4.46 1.103
8.31 0.5 1.0429.33 0 .6 1.047
10.87 0 .8 1.0561 1 .8 8 1 .0 1.06212.69 1 .2 1.06713.78 1.5 1.07315.24 2 .0 1.08217.47 3.0 1.09319.30 4.0 1 .1 0 1
20.83 5.0 1.10522.45 6 .0 1.108

A C K N O W L E D G E M E N T
T h e fin a n c ia l su p p o rt o f the C ancer R e se a rc h C am pa ign , U n ite d K in g d o m , is
acknow ledged.
370 KNIGHT and NAHUM
R E F E R E N C E S
[1] IN T E R N A T IO N A L A T O M IC E N E R G Y A G E N C Y , Absorbed D ose Determ ination in
Photon and Electron Beam s: An International Code o f Practice, Technical Reports
Series N o. 2 7 7 , IA E A , Vienna (1987).[2] N A H U M , A .E ., K N IG H T , R .T . , IA EA -SM -330/24, these Proceedings.
[3] G R O S SW E N D T , B . , Physikalisch-Technische Bundesanstalt, Braunschweig, private
com m unication, 1986.
[4] IN T E R N A T IO N A L C O M M ISSIO N ON R A D IA TIO N U N IT S A N D M E A SU R E
M E N T S , M easurement o f Absorbed D ose in a Phantom Irradiated by a Single Beam
o f X or Gamma R ays, IC R U Rep. 2 3 , Bethesda, M D (1973).
[5] S E U N T JE N S , J., T H IE R E N S , H ., V A N D E R P L A E T S E N , A ., S E G A E R T , O ., Con
version factor / for X -ray beam qualities, specified by peak tube potential and H V L
value, Phys. M ed. B io l. 3 2 (1987) 5 9 5 -6 0 3 .[6 ] R O S S E R , K .E . , M easurement o f Absorbed D ose to W ater for M edium -Energy X -rays,
N P L Rep. R S A (E X T )3 3 , N P L , Teddington, U K (1992).
[7] H U B B E L L , J .H . , Photon mass attenuation and energy-absorption coefficients from
1 keV to 2 0 M eV , Int. J . Appl. Radiat. Isot. 3 3 (1982) 1 2 6 9 -1 2 9 0 .
[8 ] H IG G IN S, P .D ., et a l., M ass Energy-Transfer and M ass Energy-Absorption C oeffi
cients Including In-Flight Positron Annihilation for Photon Energies 1 keV to
100 M eV , R ep. N IST IR 4 8 1 2 , Natl Inst, o f Standards and Technology, Gaithersburg,
M D (1992).
[9] N E L SO N , W .R ., H IR A Y A M A , H ., R O G E R S , D .W .O ., T he E G S 4 Code System , R ep. S L A C -2 6 5 , Stanford Linear A ccelerator Center, M enlo Park, C A (1985).
[10] K N IG H T , R .T . , Backscatter Factors for Low - and M edium -Energy X -rays Calculated
by the M onte C arlo M ethod, R ep. IC R -PH Y S-1/ 93, Joint Department o f Physics,
Royal M arsden Hospital and Institute o f C ancer R esearch, Sutton, U K (1993).[11] B IE L A JE W , A ., R O G E R S , D .W .O ., in M onte C arlo Transport o f E lectrons and
Photons, Plenum Press, New Y o rk (1988) C h. 18.[12] B IR C H , R ., M A R SH A L L , М ., Computation o f bremsstrahlung X -ray spectra and
com parison with spectra measured with a G e(Li) detector, Phys. M ed. B io l. 2 4 (1979)
5 0 5 -5 1 7 .[13] SE E L E N T A G , W .W ., P A N Z E R , W ., D R E X L E R , G ., P L A T Z , L . , SA N T N E R , F . ,
A Catalogue o f Spectra for the Calibration o f D osim eters, G S F -B er . 5 6 0 , G esellschaft
fur Strahlen- und Umweltforschung mbH M ünchen (1979).
[14] A N D R E O , P ., M onte C arlo techniques in m edical radiation physics, Phys. M ed. B io l.
3 6 (1991) 8 6 1 -9 2 0 .

IAEA-SM-330/5
MONTE CARLO CALCULATED CORRECTION FACTORS FOR AN NE 2571 CHAMBER IN MEDIUM ENERGY PHOTON BEAMS
Chang-Ming MA*, A.E. NAHUM Joint Department of Physics,Royal Marsden Hospital and
Institute of Cancer Research,Sutton, Surrey,United Kingdom
Abstract
M O N T E C A R L O C A L C U L A T E D C O R R E C T IO N F A C T O R S F O R AN N E 2571 C H A M
B E R IN M E D IU M E N E R G Y PH O TO N B E A M S.
T h e paper presents the correction factors, obtained from three separate investigations,
for an N E 2571 cham ber used at a depth in w ater irradiated by a medium energy photon beam
(1 0 0 -3 0 0 k V ). T he correction factors as defined in the International A tom ic Energy Agency
(IA EA ) Code o f Practice (1987) have been calculated by the M onte C arlo method as the ratios
o f the absorbed doses in different geom etries. T he calculations were carried out using a
parallelized E G S 4 (E lectron Gamm a Show er version 4 ) user code running on a multiple transputer system together with the application o f a correlated-sam pling variance-reduction tech
nique. T he results show that the displacement correction factor for a stemless N E 2571 cham ber at 5 cm depth in w ater is about 0 .9 8 8 at 100 k V (4 .2 8 mm A l) and 0 .9 9 4 at 3 0 0 kV
(2 1 .5 mm A l). T he radiation quality correction factor, when the effects o f changes in both
photon energy and angular distribution are considered, varies from about 1 .007 at 100 kV to 1 .0 1 0 at 3 0 0 k V . A separate stem effect correction factor has been investigated which varies
from 1 .0 1 3 at 100 k V to 1 .0 0 5 at 3 0 0 k V . T h e global correction factor for an N E 2571 cham
b er is therefore about 1 .0 0 8 at 100 kV and 1 .0 1 0 at 3 0 0 k V , being close to the recommenda
tions by the International Com m ission on Radiation U nits and M easurements (1 9 7 3 ). This
means that the absorbed dose calculated follow ing the IA E A form alism could be up to 10%
too high for medium energy photon beam s.
1. INTRODUCTION
For medium energy (100-300 kV) photon beams, the absorbed dose to water is usually determined with an ionization chamber calibrated in air in terms of either exposure or air kerma. The exposure or the air kerma at the reference depth (5 cm according to the International Atomic Energy Agency (IAEA) [1]) in water is
* Current address: Ionizing Radiation Standards, Institute for National M easurement
Standards, National R esearch Council Canada, Ottawa, Ontario, Canada K 1A 0 R 6 .
371

372 MA and NAHUM
measured under the reference conditions and then converted to the absorbed dose at the depth of the centre of the chamber in undisturbed water using the relation
Av = ■Wu A^uG‘en/p)w,air (1)
where M n is the chamber reading corrected for temperature and pressure, N K the air kerma calibration factor, ku the radiation quality corection factor which accounts for the change in the chamber response due to the change in the energy distribution of the photon beam in the phantom compared to that used for the calibration in air, pa
the perturbation correction factor which accounts for the effects of the displacement of water by an air volume with the shape of the ionization chamber, and (i*en/p)w,air Ле ratio of mass energy absorption coefficients for water to air averaged over the spectrum present in undisturbed water at the depth of the chamber centre [1 ].
In the work described here we investigate theoretically the global correction factor (i.e. kupa in Eq. (1)) for the commonly used NE 2571 chamber for medium energy X ray dosimetry. The EGS4 (Electron Gamma Shower version 4) Monte Carlo code system [2] has been used to simulate the response of a stemless ionization chamber at different depths in water irradiated by a parallel photon beam of energies between 70 and 300 kV. The correction factor for the stemless chamber (i.e. K p 'a,
see Section 2) has been calculated as the ratio of the absorbed doses (and air kermas) in different simulation geometries. On the basis of the calculations of this study and the results of our previous investigations of the displacement and stem effect correction factors (i.e. p'n and fcstem) for the NE 2571 chamber [3, 4], the radiation quality correction factor and the global factor for an NE 2571 chamber have been obtained. In the next two sections, the definitions of the correction factors and the details of the Monte Carlo calculation are described. The results are discussed in Section 4 together with the comparisons with the experimental data.
2. THEORY
We suppose that ÆTair, c is the air kerma at a point in air for a given beam quality and M c the reading (corrected for temperature and pressure, ion recombination and polarity effect) of an ionization chamber to be calibrated with its centre at the same point. The calibration factor, N K, for this chamber can be obtained as
N K = (2)Mc
By substituting Eq. (2) into Eq. (1) and noting that Dw can be replaced by K w u, the water kerma at the measurement position in water in the absence of the chamber,

IAEA-SM-330/5 373
with the assumption of the existence of charged particle equilibrium and negligible difference between kerma and collision kerma for medium energy photons, the correction factor kupu for the chamber centred at the reference depth in water can be written as
j * w , u M c fc en /P)air,vK pu = — !----------------------L-
^air. c^ u
_ ^a ir, i/^ a ir , сM J M C
where
^"air, u *w , u(Mer/p)air. w (^ )
is the air kerma at the measurement position in undisturbed water. Equation (3) effectively defines the global correction factor kup u as the quotient of the in-water to in-air kerma ratio to the in-water to in-air chamber reading ratio.
There are relatively large uncertainties in the determination of the absorbed dose to water (or the air kerma) at a depth in water irradiated by medium energy X rays, using either water calorimeters [5-7] or a graphite extrapolation chamber[8 ]. Thus the kup u factors derived according to Eq. (3) by comparative measurements with ionization chambers and other dosimetry methods should be verified by an alternative method. The Monte Carlo method serves as such an alternative. The values of c, iTair u, Mc and Aiu can be calculated using the Monte Carlo method and the kupu factor can then be calculated accordingly. In practice, the correction factors are usually calculated by the Monte Carlo method for stemless chambers [3, 7, 9-11], i.e. k^pú is obtained, and therefore a separate stem correction factor kstem is required to account for both the stem effect in air for the calibration and that in water for the measurement [4, 7, 9-11]. The global correction factor for a chamber calibrated in air and used at a depth in a phantom can then be written as
к хРм — kupukslcm (5)
3. MONTE CARLO CALCULATION
3 . 1 . G e o m e t r y a n d s c o r in g
In this work, the correction factors for an NE 2571 chamber in medium energy photon beams have been calculated using the Monte Carlo method. The factor for a stemless chamber of the same dimensions as that of an NE 2571 chamber has
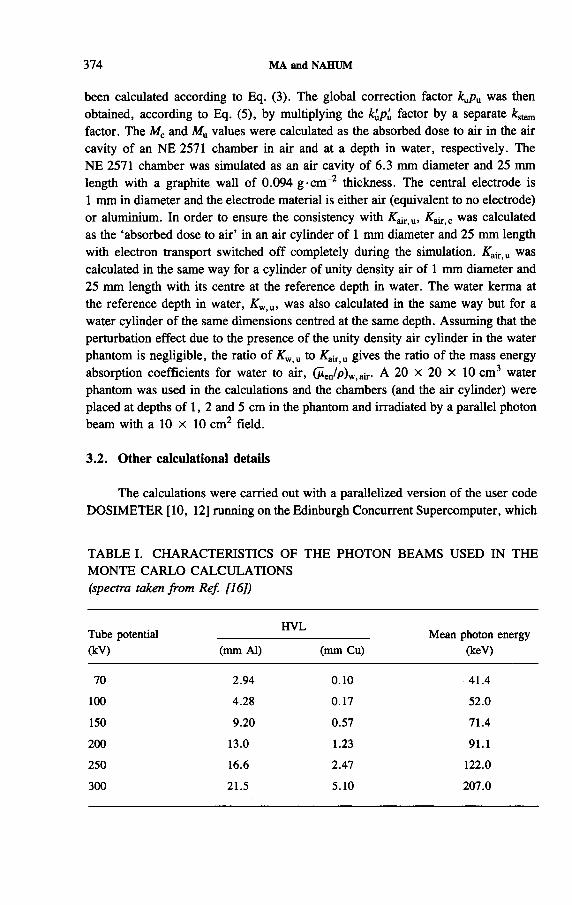
374 MA and NAHUM
been calculated according to Eq. (3). The global correction factor kapu was then obtained, according to Eq. (5), by multiplying the k^p'a factor by a separate fcstem factor. The M c and M u values were calculated as the absorbed dose to air in the air cavity of an NE 2571 chamber in air and at a depth in water, respectively. The NE 2571 chamber was simulated as an air cavity of 6.3 mm diameter and 25 mm length with a graphite wall of 0.094 g-cm-2 thickness. The central electrode is 1 mm in diameter and the electrode material is either air (equivalent to no electrode) or aluminium. In order to ensure the consistency with K^t u, Кз[т с was calculated as the ‘absorbed dose to air’ in an air cylinder of 1 mm diameter and 25 mm length with electron transport switched off completely during the simulation. K aiT U was calculated in the same way for a cylinder of unity density air of 1 mm diameter and25 mm length with its centre at the reference depth in water. The water kerma at the reference depth in water, ATW u, was also calculated in the same way but for a water cylinder of the same dimensions centred at the same depth. Assuming that the perturbation effect due to the presence of the unity density air cylinder in the water phantom is negligible, the ratio of K w a to K siT U gives the ratio of the mass energy absorption coefficients for water to air, (/W p)w ,a¡r- A 20 X 20 X 10 cm3 water phantom was used in the calculations and the chambers (and the air cylinder) were placed at depths of 1, 2 and 5 cm in the phantom and irradiated by a parallel photon beam with a 1 0 x 1 0 cm2 field.
3 . 2 . O t h e r c a lc u la t io n a l d e ta i ls
The calculations were carried out with a parallelized version of the user code DOSIMETER [10, 12] running on the Edinburgh Concurrent Supercomputer, which
TABLE I. CHARACTERISTICS OF THE PHOTON BEAMS USED IN THE MONTE CARLO CALCULATIONS (spectra taken from Ref [16])
Tube potential
(kV )
H V LM ean photon energy
(keV)(mm Al) (mm Cu)
70 2 .9 4 0 . 1 0 4 1 .4
1 0 0 4 .2 8 0 .1 7 5 2 .0
150 9 .2 0 0 .5 7 7 1 .4
2 0 0 13 .0 1.23 91 .1
2 5 0 16 .6 2 .4 7 1 2 2 .0
3 0 0 2 1 .5 5 .1 0 2 0 7 .0

IAEA-SM-330/5 375
is a large Meiko Computing Surface consisting of 423 20-MHz T800 transputers[12]. DOSIMETER employs the PRESTA electron transport algorithm [13] and a correlated-sampling variance-reduction technique [10]. The EGS4 parameters used in the calculations were AE = ECUT = 516 keV, AP = PCUT = 1 keV and ESTEPE = 0.04, based on our previous study [10, 14]. The composition, density and stopping power values of the International Commission on Radiation Units and Measurements [15] have been applied for the materials used in the calculations. The photon spectra were taken from Seelentag et al. [16] (Table I). The incident and first scattered photons were forced to interact in the phantom and in some cases scattered photons were forced to interact only in the air cavity and the chamber walls. The latter method is very efficient for calculating the dose in a small volume within a large phantom resulting from once-scattered photons [10]. The statistical uncertainty was calculated by dividing the total number of particle histories into ten batches and evaluating the estimated variance of the mean using the mean values scored in each batch. In order to achieve a Iff statistical uncertainty of about 1 % in the calculated chamber response at various depths, up to 1 0 9 photon histories were simulated, which took the equivalent of a few hundred days of CPU time on a single transputer.
4. RESULTS AND DISCUSSION
Tables П and П1 give the correction factors k^p'u for stemless Farmer-like ionization chambers with an air electrode and an aluminium electrode, respectively, at a depth in water irradiated by a parallel photon beam of energies between 70 and 300 kV (HVL: 2.94-21.5 mm Al). For a graphite walled Farmer-like chamber, klipú varies with energy from 0.963 at 70 kV to 1.005 at 300 kV. I f a 1 mm diameter aluminium electrode is included in the chamber geometry, the global corrections become smaller (Table Ш). This is actually expected from the design of the NE 2571 chamber (i.e. using an aluminium electrode to compensate for the effect of the variation of the ratio of the mass energy absorption coefficients for graphite to air at lower energies). The factor for a stemless NE 2571 chamber varies from 0.978 at 70 kV to 1.004 at 300 kV. The Monte Carlo calculated ratios of the mass energy absorption coefficients for water to air are consistent (within 1 %) with those given by the IAEA [1] and by other investigators [9, 17, 18] for energies of 70-300 kV.
In a previous investigation of the chamber displacement corrections for ionization chambers in medium energy photon beams [3], the factor p'u has been calculated, using both a simple photon attenuation and scattering method [ 1 0 ] and direct Monte Carlo simulations, as the ratio of the air kerma at the reference depth in undisturbed water to that in the centre of an air cavity of 7.4 mm diameter and26 mm length centred at the same depth. It was found that for an NE 2571 chamber
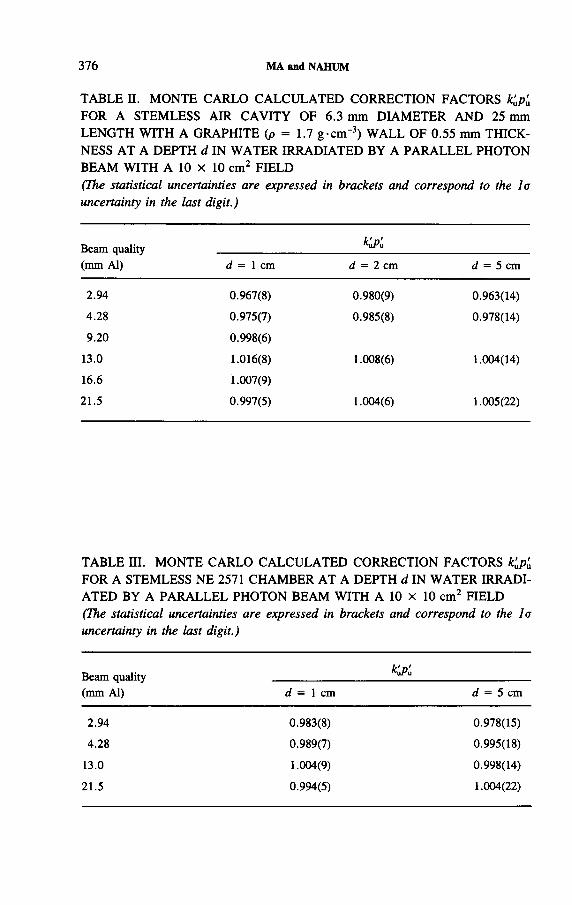
376 MA and NAHUM
TABLE П. MONTE CARLO CALCULATED CORRECTION FACTORS k’üp'ü
FOR A STEMLESS AIR CAVITY OF 6.3 mm DIAMETER AND 25 mm LENGTH WITH A GRAPHITE (p = 1.7 g-спГ3) WALL OF 0.55 mm THICKNESS AT A DEPTH d IN WATER IRRADIATED BY A PARALLEL PHOTON BEAM WITH A 10 X 10 cm2 FIELD(The statistical uncertainties are expressed in brackets and correspond to the la uncertainty in the last digit.)
Beam quality (mm Al)
K pú
d = 1 cm d = 2 cm d = 5 cm
2.94 0.967(8) 0.980(9) 0.963(14)4.28 0.975(7) 0.985(8) 0.978(14)9.20 0.998(6)
13.0 1.016(8) 1.008(6) 1.004(14)16.6 1.007(9)21.5 0.997(5) 1.004(6) 1.005(22)
TABLE Ш. MONTE CARLO CALCULATED CORRECTION FACTORS K p 'a
FOR A STEMLESS NE 2571 CHAMBER AT A DEPTH d IN WATER IRRADIATED BY A PARALLEL PHOTON BEAM WITH A 10 x 10 cm2 FIELD (The statistical uncertainties are expressed in brackets and correspond to the la uncertainty in the last digit.)
Beam quality (mm Al)
K p 'm
d = 1 cm d = 5 cm
2.94 0.983(8) 0.978(15)4.28 0.989(7) 0.995(18)
13.0 1.004(9) 0.998(14)21.5 0.994(5) 1.004(22)

IAEA-SM-330/5 377
оn
о«
оо
фЕ«о
—а.от
H V L (m m A l)
FIG. 1. The displacement correction factor p' for a stemless NE 2571 chamber calculated as the ratio o f the air kerma at 5 cm depth in water to that in an air cavity o f 7.4 mm diameter and 26 mm length centred at the same depth for a parallel photon beam with a 10 X 10 cm2 field (full curve) [3]. The la statistical uncertainties were about 0.3%. The uncertainties in the IAEA [1] values (0) were about 2%. The uncertainties in the Seuntjens et al. [11] results (•) are shown as error bars on the curve.
at 5 cm depth in water irradiated by a parallel photon beam with a 10 x 10 cm2
field, p'n varies with energy from 0.979 at 70 kV to 0.994 at 300 kV (Fig. 1). This is consistent with the results of Seuntjens et al. [11] but differs by up to 10% from the values given by the IAEA [1]. On the basis of the results in Table in for the product k^pú and the values (in Fig. 1) for p¡¡ alone, we can obtain the factor for a stemless NE 2571 chamber, which includes the effects of changes in both photon energy and angular distribution between the in-air calibration and the in-water measurement (Table IV). The factor does not deviate significantly from unity within the calculational uncertainties of between 1.4 and 2.2%.

378 MA and NAHUM
TABLE IV. CORRECTION FACTORS p'w K , fcstem AND GLOBAL CORRECTION FACTORS k»pu FOR AN NE 2571 CHAMBER AT 5 cm DEPTH IN WATER IRRADIATED BY A MEDIUM ENERGY PHOTON BEAM WITH A 10 X 10 cm2 FIELD(The values of p'u and ks(cm were taken from Refs [3] and [4], respectively. k¿ was obtained by dividing column 3 in Table I I I by column 2 in this table. кири was
obtained as the product of column 3 in Table I I I and column 4 of this table. The
statistical uncertainties are given in brackets and correspond to the la uncertainty
in the last digit.)
Beam quality (mm Al) P'a К Arstem
Global factor KPu
2.94 0.979(3) 0.999(15) 1.014(1) 0.992(15)4.28 0.988(3) 1.007(18) 1.013(1) 1.008(18)
13.0 1.001(3) 0.997(14) 1 .0 1 0 (1) 1.008(14)21.5 0.994(3) 1 .0 1 0 (2 2 ) 1.005(1) 1 .0 1 0 (2 2 )
As the к'пр'и factors discussed above are for a stemless NE 2571 chamber, a separate stem effect correction factor fcstem is required, according to Eq. (5), to obtain the global correction factor k j)u. The fcstem factors for commonly used ionization chambers in medium energy photon beams have been calculated previously [4] using the Monte Carlo method. The stem effect correction factors kstem c for a chamber irradiated in air and „ for a chamber irradiated in water were calculated as the ratios of the response of the chamber without a stem to that with a stem. The global stem effect factor &stem was then calculated as the quotient of ^stem u to ¿stem, с • For an NE 2571 chamber calibrated in air and used at 5 cm depth in water for a parallel photon beam with a 1 0 x 1 0 cm2 field, fcstem varies with energy from 1.014 at 70 kV to 1.005 at 300 kV (Fig. 2). The Monte Carlo calculated kstem
factors agreed well with the experiments [7]. The global correction factor kupu, calculated according to Eq. (5) for an NE 2571 chamber, varies from 0.992 to 1.010 for the same energy range (Table IV). These values are within 2%, consistent with the experimental results of Kubo [5] and Mattsson [6 ] (re-evaluated by applying a 3.5% heat defect correction and using the more recent mass energy absorption coefficient values, cf. Ref. [11]) and of Seuntjens et al. [11]. It can be noted that the statistical uncertainty in the calculated kupu values is up to 2 %, which is mainly due to the uncertainties in the calculated k¡¡pú factors.

IAEA-SM-330/5 379
о<0
со
оф
оо
оф
Еф
(п
H V L (m m A l)
FIG. 2. The Monte Carlo calculated kstem factor for an N E 2571 chamber at 5 cm depth in water irradiated by a parallel photon beam with a 10 X 10 cm2 field (9) [4]. The experimental uncertainties in the Seuntjens [7] results ( д ) are shown as error bars on the curve. The statistical uncertainties in the Monte Carlo calculated results were about 0.1%.
5. CONCLUSIONS
It has been found that both and pu vary with photon beam quality. It is also probable that the values w ill be dependent on the particular chamber geometry and wall composition [10]. The Monte Carlo calculated global correction factors (including the chamber stem effect correction) for a Farmer type geometry are close to unity (within statistical uncertainties) but differ significantly from the values given by the IAEA Code of Practice [1]. We suggest that the correction factors for one or two commonly used chambers such as NE 2561 and NE 2571 be investigated thoroughly.

380 MA and NAHUM
ACKNOWLEDGEMENTS
The authors would like to thank J. Blair-Fish and N. Stroud for help in moving the EGS4 code system onto the Edinburgh Concurrent Supercomputer (ECS), and D.W.O. Rogers for valuable comments. They are grateful to the University of Edinburgh for giving them access to the ECS. C.-M.M. acknowledges the National Research Council Canada, Ottawa, for additional financial support. Both authors wish to acknowledge the support of the Cancer Research Campaign, United Kingdom.
REFERENCES
[1] IN T E R N A T IO N A L A T O M IC E N E R G Y A G E N C Y , Absorbed D ose Determ ination in
Photon and Electron Beam s: An International Code o f P ractice, Technical Reports
Series N o. 2 7 7 , IA E A , Vienna (1987).
[2] N E L SO N , W .R ., H IR A Y A M A , H ., R O G E R S , D .W .O ., The E G S 4 Code System ,
Rep. S L A C -2 6 5 , Stanford Linear A ccelerator Center, M enlo Park, C A (1985).
[3] M A , С .-М ., N A H U M , A .E ., Ion Chamber D isplacem ent E ffect Corrections for
M edium -energy X -ray Dosim etry (in preparation).
[4] M A , С .-М ., N A H U M , A .E ., Ion Cham ber Stem E ffect Corrections for Medium-
energy X -ray Dosim etry (in preparation).
[5] K U B O , H ., W ater calorim etric determination o f absorbed dose by 2 8 0 kVp orthovol
tage X -ray s, Radiother. O ncol. 4 (1985) 2 7 5 -2 8 1 .
[6 ] M A T T SS O N , L .O ., Com parison o f W ater Calorim etry and Ionisation Chamber
Dosim etry in 100 and 2 0 0 kV X -ray Beam s, D oc. C C EM R I(I)/85-15, B IP M , Sèvres
(1 9 8 5 ).
[7] S E U N T JE N S , J . , Comparative Study o f Ion Cham ber Dosim etry and W ater C alorim e
try in M edium -energy X -ray Beam s, PhD T hesis, U niv. o f Ghent (1991).
[8 ] SC H N E ID E R , U ., G R O SSW E N D T , B . , K R A M E R , H .M ., “ Perturbation correction factor for X -rays between 7 0 and 2 8 0 k V ” , Dosim etry in Radiotherapy (Proc. Symp.
V ienna, 1 9 8 7 ), V o l. 1, IA E A , Vienna (1988) 1 4 1 -1 4 8 .
[9] S E U N T JE N S , J . , T H IE R E N S , H ., V A N D E R P L A E T S E N , A ., S E G A E R T , O .,
Determ ination o f absorbed dose to water with ionization cham bers calibrated in free air
for m edium-energy X -ray s, Phys. M ed. B io l. 3 3 (1988) 1 1 7 1 -1 1 8 5 .
[10] M A , С .-М ., M onte C arlo Sim ulation o f D osim eter Response Using Transputers, PhD T hesis, U niv. o f London (Inst, o f Cancer R esearch) (1991) (also available as Internal
Report N o. IC R -PH Y S-1/ 92, Royal M arsden Hospital, Sutton, U K , 1992).
[11] S E U N T JE N S , J . , T H IE R E N S , H ., SC H N E ID E R , U ., Correction factors for a cylin
drical ionisation cham ber used in medium-energy X -ray beam s, Phys. M ed. B io l, (in
press).
[12] M A , С .-М ., Implementation o f a M onte C arlo Radiation Transport Code on a Parallel Computer System (in preparation).

IAEA-SM-330/5 381
[13] B IE L A JE W , A .F . , R O G E R S , D .W .O ., P R E S T A : The Param eter Reduced Electron-
Step Transport Algorithm for electron M onte C arlo transport, N ucl. Instrum. Methods
Phys. R e s ., Sect. В 18 (1987) 1 6 5 -1 8 1 .
[14] M A ., С .-М ., N A H U M , А .Е ., B ragg-G ray theory and ion cham ber dosimetry in pho
ton beam s, Phys. M ed. B io l. 3 6 (1991) 4 1 3 -4 2 8 .
[15] IN T E R N A T IO N A L C O M M ISSIO N O N R A D IA T IO N U N IT S A N D M E A S U R E
M E N T S , Radiation Dosim etry: Stopping Pow ers for E lectrons and Positrons, IC R U
Rep. 3 7 , Bethesda, M D (1 9 8 4 ).
[16] S E E L E N T A G , W .W ., P A N Z E R , W ., D R E X L E R , G ., P L A T Z , L . , SA N T N E R , F „
A Catalogue o f Spectra for the Calibration o f D osim eters, G S F -B e r . 5 6 0 , G esellschaft
fur Strahlen- und Umweltforschung mbH M ünchen (1979).
[17] R O S S E R , K ., M easurement o f Absorbed D ose to W ater for M edium -energy X -ray s, N PL Rep. R S A (E X T )3 3 , N P L , Teddington, U K (1 9 9 2 ).
[18] K N IG H T , R .T . , N A H U M , A .E ., IA E A -SM -330/17, these Proceedings.


IAEA-SM-330/74
ENERGY EXPENDED TO CREATE AN ION PAIR AS A FACTOR DEPENDENT ON RADIATION QUALITY
M. ZIELCZYÑSKI, N. GOLNIK Institute of Atomic Energy,Otwock-Swierk, Poland
Abstract
E N E R G Y E X P E N D E D TO C R E A T E AN IO N P A IR A S A F A C T O R D E P E N D E N T ON
R A D IA T IO N Q U A L IT Y .T he energy W expended to create an ion pair is one o f the important factors needed for
determination o f absorbed dose by ionization cham bers and is also a source o f considerable
uncertainty in this procedure, especially for m edical beam s o f high energy heavy particles.
A method for determination o f W is proposed that relates W to the recom bination index o f radi
ation quality, which can be measured in a phantom in the beam considered by means o f the
same ionization cham ber as that used for the determination o f absorbed dose (or with a sim ilar
cham ber). T he method was used to determine the W values for the tissue equivalent cham ber
placed in a water phantom irradiated by a 3 5 0 M eV neutron m edical beam from the Phasotron at the Jo in t Institute for N uclear Research , Dubna. T he accuracy o f W at a phantom depth o f
15 cm is ± 0 .5 % .
1. INTRODUCTION
When using an ionization chamber for determination of absorbed dose in a phantom, one needs to know the energy expended to create an ion pair, W. This quantity is often known with insufficient accuracy, which may lead to considerable uncertainty in the absorbed dose value, especially in the case of medical beams of high energy heavy particles.
Usually W is related to the type and energy of the particles. In general the composition and energy spectrum of the particles depend on many factors, including the position of the point considered in the irradiated phantom, the beam size, the filters used and any other factors modifying the beam and its penetrating ability. The energy spectrum of the particles ionizing the chamber cavity is influenced also by the ionization chamber itself, so it depends on the material and size of the chamber as well.
Determination of the energy spectrum of all the primary and secondary particles at different points in a phantom for different beam dimensions, filters, etc., for a particular ionization chamber — by calculation or by measurements — is unpractical because of the uncertainties involved and the time required. Usually a constant, arbitrarily chosen value of W is taken. However, this simplification introduces an uncertainty into determination of the absorbed dose and also distorts
383

384 ZIELCZYÑSKI and GOLNIK
M o l e c u l a r w e i g h t
FIG. 1. Wa/W? ratio for the following gases: H2, CH4, NH3, tissue equivalent gas, C2H2, N2, C2H4, air, C2H6, 0 2, Ar, C02, N20, C3H8, C2H5OH, C4H,0 and S02.
measurements of, for example, depth dose distributions and the influence of beam size on absorbed dose, and comparison of the dose values determined by different ionization chambers.
Ionization chambers are usually calibrated in a standard field of y radiation from a “ Co source. Therefore, not W but the ratio WIWy is needed for determination of absorbed dose in the investigated beam, where Wy is the energy required for creation of an ion pair in the gas of the chamber irradiated in the standard y field.
Although W is gas dependent, W/Wy can be considered as practically independent of the kind of gas for a large number of gases. In Fig. 1, W/Wy is presented for all the gases for which W values are tabulated by the International Commission on Radiation Units and Measurements (ICRU) [1] for both y and 5 MeV a radiations. For all gases, except hydrogen and ethanol, the W/Wy ratios are constant to within the stated accuracy. It can be deduced that the gas purity and small differences in gas mixture composition practically do not change W/Wy.
The aim of the work described here was to improve the accuracy of determination of the W/Wy ratio. For this purpose we tried to correlate the value of W/Wy with the so-called recombination index of radiation quality, £)4.
The recombination index of radiation quality was introduced some years ago[2 ] as a measurable quantity which approximates very well the quality factor of radiation, Q, as defined in Publication 21 of the International Commission on Radiological Protection (ICRP) [3]. The value of Q4 can be determined using an ionization chamber which is operated at two collecting voltages — near saturation and at a specially chosen lower voltage dependent on the construction of the chamber. Detailed knowledge of the composition and energy spectrum of the radiation is not required.

IAEA-SM-330/74 385
For this work the relation between QA and the quality factor is not essential and 04 is used here just as a quantity dependent on linear energy transfer (LET) which can be measured in a phantom in the beam considered by means of the same ionization chamber as that used for the determination of absorbed dose (or with a similar chamber).
2. RELATION BETWEEN WIWy AND LET
On the basis of existing experimental and calculated data, we have made a hypothesis that W!Wy is correlated with the LET of charged particles if the energy of the particles is higher than a certain threshold. The threshold energy approximately corresponds to the energy for which the stopping power is a maximum for the type of particle considered. Residual ranges for particles with energies below the threshold do not exceed some micrometres of water.
Correlation between the energy expended to create an ion pair and the LET can be roughly explained by the fact that there is a limited number of molecules close to the track of the ionizing particle. In the track of a high LET particle the local ion density is high and the number of ionized molecules is comparable with the total number of molecules touched by the particle track. Interactions of the particle with distant or once ionized molecules result in an increase in W.
Figure 2 shows values of W!Wy for different particles (with energy above the threshold) plotted against the unrestricted LET, L. The W values are taken from published data, mostly for tissue equivalent (TE) gas [1, 4, 5]. I f no data were available for TE gas, we used data for air (electrons) [1] and for nitrogen (0 6+ ions) [6 ]. Values of Wy used were 29.3, 33.97 and 34.5 eV for TE gas, air and nitrogen respectively. Some data were calculated using formulas stated as the best fit to the experimental data [1,2]. Where possible, we used the differential lvalues for particles with ranges well exceeding 10 uglcm 2 of TE gas (which corresponds to a cavity size approximately equal to 8 mm) and the integral W values for particles with lower energies. Values of LET for electrons, protons and a particles have been taken from ICRU collision stopping power tables [7], and those for heavy particles from calculations of Armstrong and Chandler [8 ].
Figure 2 shows that for practical needs W!Wy for charged particles (with energy exceeding the threshold) can be considered as an unequivocal function of LET.
There are hundreds of published experimental data of W for different particles which correspond well (within stated accuracy) with Fig. 2 but were omitted for clarity. This concerns, among others, very low LET particles, such as ц mesons, and very high LET ions. It is obvious that W values for beams of X and у radiation of any energy may also be related to their effective LET, practically equal to the LET for electrons.

386 ZIELCZYÑSKI and GOLNIK
LET (keV/дт)FIG. 2. W/W7 for charged particles plotted against unrestricted LET: о electrons of >1 keV, □ protons of 20 keV to 10 MeV, • a particles of 0.8 MeV to 4 GeV, ▼ C6+ ions of 6-48 MeV, A 0 8+ ions of 3.2-64 MeV, V 0 6+ ions of 34.5 MeV. The curve is plotted according to the relation W = W7/7 + /3fQ4 — 1)] with /3 = 0.0072.
A s shown in Fig. 2, W/Wy is nearly constant at L < 3.5 keV//xm, grows rapidly between 10 and 100 keV/^m and then increases slowly at higher LET. A very similar ¡dependence on LET is observed for the recombination index of radiation quality, Q4. To be precise, Q4 depends on the local ionization density along the track of the ionizing particle [9], and only indirectly on LET. Nevertheless for the purposes of this work Q4 can be expressed as the following function of LET:
Qa = ------------------------------------------------ for L > L q0.96Lq + 0.04L
( 1 )
04 = 0.85 + 0.15L/ÍO for L < Lo
where L q = 3.5 keV//xm.In a search for a correlation between WIWy and Q4 we decided to fit the data
presented in Fig. 2 with the following function:
W = ЖД1 + i3(G* - 1)] (2)
where /3 is a fitted parameter and g 4 is given by relation (1). The result of the

IAEA-SM-330/74 387
2 0
15( О
Í4
1 0
Neutron energy (MeV)
FIG. 3. Energy per ion pa ir and quality factor as functions o f neutron energy.
fit is shown as the curve in Fig. 2. According to Eq. (2) W is equal to Wy for Q4 = 1 (low LET radiation) and increases with LET. The fitted value of /3 is 0 = 0.0072 ± 0.0003.
Figure 2 does not show the data for neutrons. LET spectra of charged particles liberated by neutrons are broad. Neutrons of definite energy cannot be characterized by a single value of LET, and therefore they cannot be introduced into Fig. 2. Nevertheless it is possible to determine single values of Q and Q4 for a particular neutron energy.
Calculated values of W in TE gas [5] and of Q [10] (as defined in ICRP 21[3]) are plotted in Fig. 3 against neutron energy E n. The calculations were performed for kerma conditions, so the results may approximately correspond to the irradiation of a small ТЕ chamber placed in a monoenergetic neutron beam outside the phantom.
There is a striking similarity between the two curves; their correlation factor is 0.97. Therefore Щ Е п) was expressed as a function of Q (En) and fitted with a function similar to that given by Eq. (2). The fitted parameter /3 equals0.007 22 ± 0.000 05, and agrees very well with the /3 value obtained from the data given in Fig. 2.

388 ZIELCZYÑSKI and GOLNIK
3. DISCUSSION
The W -Q dependence given above was obtained for a limited range of neutron energy (0.1-20 MeV). On the basis of available information we expect, however, that the dependence given by Eq. (2) could be used also for neutrons with energies outside this range. For high energy neutrons (20 MeV to 1.1 GeV), Eq. (2) agrees with calculations of W and Q done by Morstin et al. [11], although the accuracy of the calculations is not high enough to confirm unambiguously the validity of our relation. Thermal neutrons also fu lfil Eq. (2), as kerma in TE gas is mostly due to 600 keV protons. The only case for which Eq. (2) cannot be used is a small ionization chamber irradiated free in air by neutrons of intermediate energies (approximately from 10 eV to 10 keV). This case is of no practical importance for radiation therapy, because most often the chamber is placed in an externally irradiated phantom. In such a situation the contribution of intermediate neutrons to the dose is usually negligible. Even if such neutrons are present in the beam, the contribution from n-p and n- 7 reactions due to the neutron thermalization is much higher than from elastic collisions of intermediate neutrons. However, an estimation of the possible contribution of intermediate neutrons may be necessary in certain beams, for which W values would be determined using Eq. (2).
Similarly the contribution to the absorbed dose due to charged particles at the ends of their ranges should be estimated in the case of irradiation with a beam of such particles. Usually in radiotherapy beams the contribution of residual ranges is small and the correction to W is negligible, even in Bragg peaks created at a specific depth. The correction can be estimated by comparing the size of the Bragg peak with the residual ranges of particles having energies below the threshold mentioned at the beginning of this paper. These ranges are equal to 0.5 /xm of water for protons and to some micrometres for heavier ions. It is not necessary to introduce any corrections for the residual range of electrons.
Both corrections — due to residual ranges and due to intermediate neutrons — lead to a somewhat higher value of /3 than was given in the previous section. It seems reasonable to round it up to the value of /3 = 0.008.
4. PRACTICAL APPLICATION
Figure 4 presents the W values experimentally determined along the axis of the medical beam of high energy neutrons (mean energy 350 MeV) from the Phasotron at the Joint Institute of Nuclear Research, Dubna [12]. The beam is assigned for the radiation therapy of large, deeply placed hypoxic tumours. Neutrons are obtained by bombarding the 36 cm thick beryllium target with 660 MeV protons. The beam size was defined by a collimator 10 cm in diameter. The distance from the target to a 50 cm x 60 cm water filled phantom was 9 m. W values were calculated using

ZIELCZYNSKI and GOLNIK 389
Оо
S-CD
Ч&5O'
с3
Depth in phantom (cm H20)
FIG. 4. Energy per ion pair in TE gas and absorbed dose rate in water phantom irradiated by 350 MeV neutrons.
Eq. (2). Q4 was determined at different depths in the phantom using a parallel plate recombination chamber with 2 mm spacing [13].
The maximum of the depth dose distribution in the phantom was observed at 15 cm. The accuracy of W measured at this depth was estimated to be ±0.5%. This value was obtained by the combination of partial uncertainties due to: QA measurements (Д£ 4 = 0.2 results in 0.16% uncertainty of W)-, uncertainty of the /3 value (Д/3 = 0.0005 results in 0.12% uncertainty of W for Q4 = 3.2); correction for residual ranges and intermediate neutrons (0.2%); uncertainty of the Wy value (0.3%); and possible differences of the particle spectrum in the cavities of different chambers used for measurements of absorbed dose and Q4 (0 to 0.4% depending on chambers used).
5. CONCLUSIONS
It has been shown that the energy expended to create an ion pair can be considered as dependent on LET. A simple relation was found between W and the recombination index of radiation quality, Q4. As Q4 is a measurable quantity it can be used for experimental determination of W for radiotherapy needs. The accuracy of the method depends on the kind of radiation and may vary between 0.5 and 2%.

390 IAEA-SM-330/74
For the method described it is not necessary to know the composition and the energy spectrum of particles ionizing the chamber cavity. Moreover, the W value determined by this method corresponds to a definite cavity size, which is just that needed for radiation therapy dosimetry.
Our method is useful for beams of radiation other than X, y and electrons. It seems particularly suitable for neutrons, protons, pions, heavy ions and any new types of radiation beam, especially for which the energy spectrum of secondary particles in a phantom is poorly known.
ACKNOWLEDGEMENT
This work was supported by the Polish Committee for Scientific Research (project number 20930 91.01).
REFERENCES
[1] INTERNATIONAL COMMISSION ON RADIATION UNITS AND MEASUREMENTS, Average Energy Required to Produce an Ion Pair, ICRU Rep. 31, Bethesda, MD (1979).
[2] ZIELCZYÑSKI, М., GOLNIK, N.. MAKAREWICZ, М., SULLIVAN, A.H., “ Definition of radiation quality by initial recombination of ions” , Seventh Symposium on Microdosimetry (Proc. Symp. Oxford, 1980), Vol. 2 (BOOZ, J., et al., Eds), EUR 7147, Harwood, New York (1981) 853-862.
[3] INTERNATIONAL COMMISSION ON RADIOLOGICAL PROTECTION, Data for Protection against Ionizing Radiation from External Sources: Supplement to ICRP Publication 15, Publication 21, Pergamon Press, Oxford and New York (1973).
[4] MAKAREWICZ, М., Ionization and Energy Absorption in Ionization Chambers Used in Fast Neutron Dosimetry, PhD Thesis, Inst, of Atomic Energy, Otwock-Swierk (1992).
[5] SIEBERT, B.R.L., et al., “ New analytical representation of W values for protons in methane-based tissue-equivalent gas’ ’, paper presented at 11th Symp. on Microdosimetry, Gatlinburg, TN, 1992.
[6 ] VARMA, M.N., et al., Experimental determination of W for oxygen ions in nitrogen, Phys. Med. Biol. 20 (1975) 955-962.
[7] INTERNATIONAL COMMISSION ON RADIATION UNITS AND MEASUREMENTS, Linear Energy Transfer, ICRU Rep. 16, Bethesda, MD (1970).
[8 ] ARMSTRONG, T.W., CHANDLER, K.C., SPAR - A FORTRAN Program for Computing Stopping Powers and Ranges for Muons, Charged Pions, Protons and Heavy Ions, Rep. ORNL-W-7405, Oak Ridge Natl Lab., TN (1973).
[9] ZIELCZYNSKI, М., GOLNIK, N., “ Recombination index of radiation quality — Measuring and applications” , paper presented at 11th Symp. on Microdosimetry, Gatlinburg, TN, 1992.

ÏAEA-SM-330/74 391
[10] S IE B E R T , B .R .L . , C A S W E L L , R .S . , C O Y N E , J . J . , “ Calculations o f quality factors
for fast neutrons in m aterials composed o f H, C , N and O ” , Radiation Protection (Proc.
Sym p. Jü lich , 1982), E U R 8 3 8 5 , C E C , Luxem bourg (1983) 1 1 3 1 -1 1 4 0 .
[11] M O R ST IN , K ., et a l., High Energy Neutron Interactions with Tissues and Tissue
Substitutes, R ep. E IR 5 9 4 , Eidgenôssisches Inst, fiir Reaktorforschung, W iirenlingen
(1 9 8 6 ).[12] A B A S O V , V .M ., et a l., Form ing and Study o f a High Energy Neutron Beam from
JIN R Phasotron, Rep. JIN R 1 8 -8 8 -3 9 2 , Jo int Inst, for N uclear R esearch , Dubna (1988)
(in Russian).
[13] Z IE L C Z Y Ñ S K I, M ., et a l., Quality Factor o f the Therapeutic Neutron Beam , Rep.
JIN R 1 6 -9 0 -2 6 5 , Joint Inst, for N uclear Research , Dubna (1990) (in Russian).


APPLICATION OF DIFFERENT PROTOCOLS FOR ABSORBED DOSE DETERMINATION
(Session 6)
ChairmanA. DUTREIX
France
Co-ChairmanV.G. SMYTHNew Zealand


IAEA-SM-330/19
CURRENT STATUS OF DOSIMETRY PROTOCOLS FOR MEGAVOLTAGE ELECTRON BEAMS
D.I. THWAITESDepartment of Medical Physics and Medical Engineering andClinical Oncology Directorate,University of Edinburgh andLothian Health Board,Western General Hospital,Edinburgh, United Kingdom
Abstract
CURRENT STATUS OF DOSIMETRY PROTOCOLS FOR MEGAVOLTAGE ELECTRON BEAMS.
Current electron dosimetry protocols are reviewed and some of their similarities and differences surveyed. The recommendations for cylindrical chambers are applied to three practical beams, of 6 , 10 and 20 MeV nominal energy. Discrepancies in determination of absorbed dose to water obtained by the different protocols lie within ± 1 %, when measurements are made with a graphite walled cylindrical chamber in a water phantom, in conditions where it is appropriate to use a cylindrical chamber. For other chambers, and particularly other phantom materials, discrepancies can be significantly greater. For lower energy electron beams, where plane parallel chambers are recommended, there are still significant problems remaining in the protocols currently in use. These problems, and some of the work being carried out to resolve them, are reviewed. Revisions to protocols are under development to incorporate the results of this work. Calorimeter based direct absorbed dose to water calibration services are under development by some standards laboratories. These need careful evaluation before being introduced into routine clinical electron dosimetry.
1. INTRODUCTION
The evolution of dosimetry protocols has been via a series of stages which have tended gradually to improve absolute accuracy. As each stage develops, however, it can initially produce decreased consistency internationally, owing to differences in protocols in use at a particular time. Then this inconsistency decreases, as a new
395

396 THWAITES
consensus on approach and data is obtained. For megavoltage photons these stages can be readily identified as:
(a) The Cx protocols of the 1960s.(b) The absorbed dose to air (ND, ¿Vgas) protocols, introduced in the 1980s follow
ing the approach developed by the Nordic Association of Clinical Physics(NACP) [1, 2]. Most current protocols are based on this approach, even though some still retain single composite factors for specific designated chambers.
(c) The recent moves towards absorbed dose to water (Nw) protocols [3-6],which have decreased absolute uncertainty, but at the expense of possibly increased inconsistency during the current development period.
For electron beams the sequence is rather less clear-cut, although a similar structure can be recognized. The exposure based methods were extended to electrons in the early 1970s [7, 8 ]. The ND protocols embraced electrons as well as photons, but some significant differences remain between protocols — in approach, in what corrections are included and in the data incorporated — and particularly so for lower energy electrons. ND protocols are still evolving [9, 10], whilst N w protocols for electrons have already been suggested [3, 4, 11, 12] and are under development. This review of the status of electron protocols aims to survey some of the similarities and differences of some protocols now in use and to draw attention to some current problems and possible future developments in electron dosimetry.
2. CURRENT ELECTRON PROTOCOLS
The basic formalism of most current electron dosimetry protocols stems from an in-air air kèrma chamber calibration in a ®°Co beam and can be written in the widely used form (e.g. Refs [13-15])
^ w ,u ( P e f f ) M UN%[( 1 &')^att^-ch]c(-çw,ainPch)u ( 1 )
where Dw u is the absorbed dose to water at the position of the effective point of measurement of the chamber, Peff. A ll the symbols have their usual meanings. In particular, kcb can be expanded to kjcœl, where kcd corrects for the difference in composition between the central electrode and air under calibration conditions (subscript c); pch can be expanded to wauPceiPf. where pwM (and pce\) corrects for the difference in composition between the chamber wall (and central electrode) and water (or phantom material) in the user electron beam (subscript u); p { is the fluence perturbation correction.
Almost all protocols follow this formalism explicitly or implicitly, although the detailed applications may vary [1, 2, 13, 16-19]. Some give data for a wide range
IAEA-SM-330/19 397
of cylindrical chambers, listing all the required factors separately, which must then be individually selected and combined [13, 16]. Whilst this allows flexibility in approach, it also increases the risk of errors in application. The Associazione Italiana di Fisica Biomedica (AIFB) [19] follows the framework exactly, but for a single (ENEA) cylindrical chamber. Another approach is to designate a limited number of chambers and provide single composite factors for a given chamber and for given combinations of electron beam energy and depth of measurement. This reduces the possibility of errors, but narrows chamber choice to only those listed. This approach is followed by the Dutch [15] and Swiss [20] protocols, in conjunction with a direct in-air calibration of the designated chambers, leading to
A v,u — MJ^kÇ (2 )
where С is the composite factor.The United Kingdom protocol [21] designates a single cylindrical electron
chamber (NE 2571). However, it does not use a direct in-air calibration of this chamber. Instead it is based on an in-air air kerma calibration of the specified secondary standard instrument (NE 2561, subscript s) at the national standards laboratory and a transfer of this calibration to the designated electron field instrument (subscript f) in a ^Co beam, but in a PMMA phantom at 5 cm depth. To effect this transfer the two chamber responses are intercompared under these conditions, giving a ratio of readings, R s/R{, and a calibration factor is obtained:
N f = N ^ R J R f (3)
where N { is a factor to convert the chamber reading to air kerma at the centre of thechamber in a ^Co beam under standard measuring conditions, but in phantom-, ks
is a factor to convert the in-air calibration of the secondary standard chamber to an in-phantom calibration, for which the protocol gives the value 0.974. This leads to
Z>w,u = М Д А (4)
where Ce is again a composite factor, but specifically for use with this chamber calibration method. Nahum et al. [14] have derived a full expression for Ce consistent with procedures of the Hospital Physicists’ Association (HPA) [21].
The German protocol [22] is based on the primary standards laboratory providing a chamber calibration in terms of absorbed dose to water for ^Co. It then uses an essentially similar formalism to that in Eq. (1) to convert this to absorbed dose to water in a given electron beam.

398 THWAITES
Inconsistency can be introduced between different protocols by the approach employed, by the techniques recommended, by the inclusion or omission of certain factors and by the values of data incorporated. For example, considering data that are either generally applicable or which apply specifically to cylindrical chambers:
(a) The mean energy of the beam at the phantom surface, E 0, is specified froma measured R 50, the depth at which the beam is attenuated to 50% of its maximum value. There are differences due to the use of ionization or dose 50% depths, to the use of fixed SSD or fixed source-chamber distance and to the relationship used to convert i ?50 to E 0. (A detailed discussion can be found in Ref. [23].) These translate into differences in dose via their effect on the selection of other data. Similarly, Éz, the mean energy at depth z, which is also required for data selection, is calculated (from E 0) by a number of expressions [24] in various protocols, whilst the International Atomic Energy Agency (IAEA) Code of Practice [13] incorporates values derived from Monte Carlo calculations.
(b) The stopping power ratios used are generally Spencer-Attix formulation restricted ratios, with Д = 10 keV. Currently accepted consistent data are thoseincluded in Report 37 of the International Commission on Radiation Units andMeasurements [25]. However, some protocols have selected rather different values [26]. Energy specification can affect the value of sw>air chosen. This is generally a small effect. However, the HPA Protocol [21] presents Ce against E d (= E z) only, where the particular selection is made for combinations of E 0 and z close to dose maximum for a range of beams. Whilst this is satisfactory for measurements close to dose maximum and for lower energy beams at all depths, it can lead to errors of up to 2 % under the worst circumstances [14].
(c) Values of p f for cylindrical chambers are generally taken from Johansson et al. [27], at given values of E z. There are different parametrizatibns of these data in use and the specification of E 0 and E z can affect the value selected. Some protocols [15] have used figures based on other measurements [28].
(d) Small differences exist in the values of some constants and correction factors incorporated into different protocols. For example:(i) A number of protocols ignore central electrode corrections. Others
include overall (‘global’) effects of up to 0 .8 % for the product of &CeLPcei for a Farmer type cylindrical chamber used for electron measurements. Whilst the magnitude of this effect has been disputed [29], recent Monte Carlo calculations [30] have indicated that it is essentially correct for measurements at dose maximum for lower energy electron beams, but that it falls for higher energy beams.
3. SO U R C E S O F IN C O N S IS T E N C Y B E T W E E N PR O T O C O LS
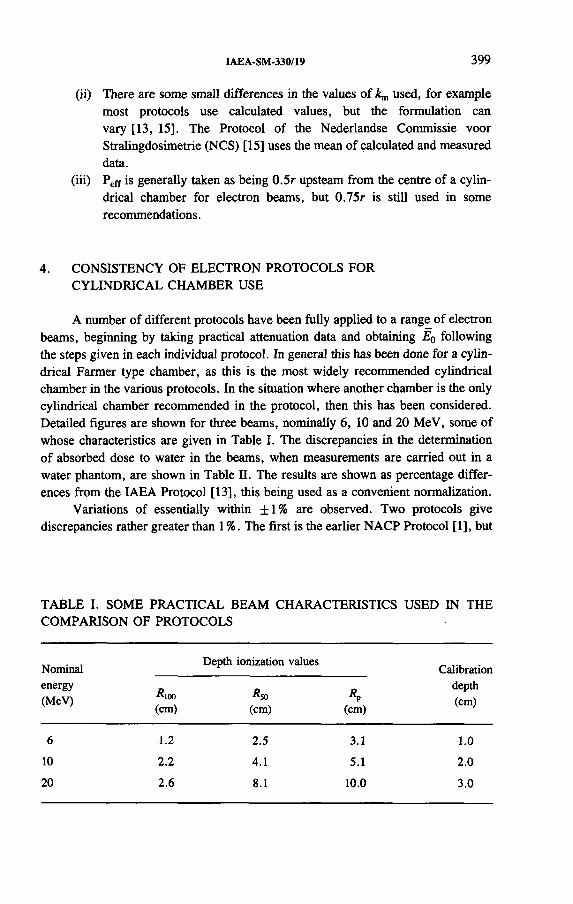
IAEA-SM-330/19 399
(ii) There are some small differences in the values of used, for examplemost protocols use calculated values, but the formulation canvary [13, 15]. The Protocol of the Nederlandse Commissie voor Stralingdosimetrie (NCS) [15] uses the mean of calculated and measured data.
(iii) Peff is generally taken as being 0.5r upsteam from the centre of a cylindrical chamber for electron beams, but 0.75r is still used in somerecommendations.
4. CONSISTENCY OF ELECTRON PROTOCOLS FORCYLINDRICAL CHAMBER USE
A number of different protocols have been fully applied to a range of electron beams, beginning by taking practical attenuation data and obtaining E 0 following the steps given in each individual protocol. In general this has been done for a cylindrical Farmer type chamber, as this is the most widely recommended cylindrical chamber in the various protocols. In the situation where another chamber is the only cylindrical chamber recommended in the protocol, then this has been considered. Detailed figures are shown for three beams, nominally 6 , 10 and 20 MeV, some of whose characteristics are given in Table I. The discrepancies in the determination of absorbed dose to water in the beams, when measurements are carried out in a water phantom, are shown in Table П. The results are shown as percentage differences from the IAEA Protocol [13], this being used as a convenient normalization.
Variations of essentially within ±1% are observed. Two protocols give discrepancies rather greater than 1 %. The first is the earlier NACP Protocol [1], but
TABLE I. SOME PRACTICAL BEAM CHARACTERISTICS USED IN THE COMPARISON OF PROTOCOLS
Nominalenergy(MeV) Rm
(cm)
Depth ionization values
R¡o(cm)
*»(cm)
Calibrationdepth(cm)
6 1 .2 2.5 3.1 1 .0
10 2 .2 4.1 5.1 2 .0
2 0 2 .6 8 .1 1 0 .0 3.0
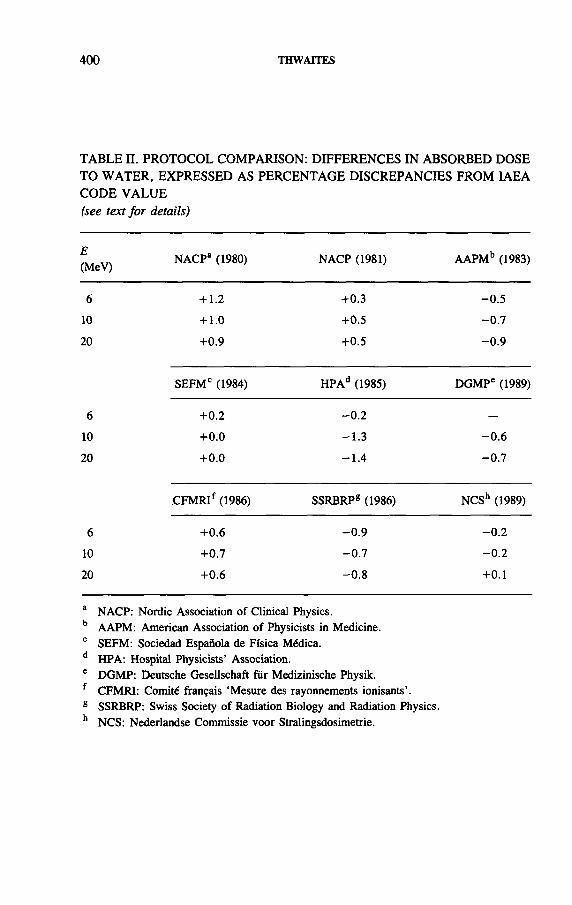
400 TH WAITES
TABLE П. PROTOCOL COMPARISON: DIFFERENCES IN ABSORBED DOSE TO WATER, EXPRESSED AS PERCENTAGE DISCREPANCIES FROM IAEA CODE VALUE (see text for details)
E(MeV) NACPa (1980) NACP (1981) AAPMb (1983)
6 + 1 .2 +0.3 -0.510 + 1 .0 +0.5 -0.72 0 +0.9 +0.5 -0.9
SEFMC (1984) HPAd (1985) DGMPe (1989)
6 +0 .2 - 0 .2
10 +0 .0 -1.3 0 .6
2 0 +0 . 0 -1.4 -0.7
CFMRIf (1986) SSRBRP8 (1986) NCSh (1989)
6 +0 .6 -0.9 - 0 .2
10 +0.7 -0.7 - 0 .2
2 0 +0 .6 - 0 .8 +0 .1
a NACP: Nordic Association of Clinical Physics. b AAPM: American Association of Physicists in Medicine.0 SEFM: Sociedad Española de Física Médica. d HPA: Hospital Physicists’ Association. e DGMP: Deutsche Gesellschaft für Medizinische Physik. f CFMRI: Comité français ‘Mesure des rayonnements ionisants’.8 SSRBRP: Swiss Society of Radiation Biology and Radiation Physics. h NCS: Nederlandse Commissie voor Stralingsdosimetrie.

IAEA-SM-330/19 401
this discrepancy is due to the use of stopping power ratios that were then superseded [2]. The second is the HPA Protocol [21], where the discrepancy is due to the use of single values of Ed only for the selection of Ce. A reanalysis of the HPA Protocol [14] where Ce is selected by É 0 and z gives differences of between 0.5 and 0.7% expressed in the same way, as shown in a preliminary presentationof some of these data [31]. Other differences are due to:
(a) Stopping power ratio (SPR) data — up to 1.3%(b) Energy specification on SPR selection — up to 0.4%(c) Fluence perturbation data — up to 0.2%(d) Energy specification on p f selection — up to 0.3%(e) rrAatt differences — up to 0 .6 %(f) Central electrode effects — up to 0.8%(g) Deviations from the recommended (CCEMRI) set of data for other basic
parameters, e.g. W/e, g, etc. — up to 0.8%.
Taking all these results, including those from the IAEA Code of Practice [13], and averaging (excluding the earlier NACP [1] values) gives discrepancies relative to the mean of within ± 1 %, indicating that in some protocols at least some of the individual parameter discrepancies work in opposition. Whilst results have been presented in detail for three beams only, similar results and conclusions are obtained for other energies. Greater inconsistency between protocols can be introduced if different chambers and different phantom materials are used. For example, cylindrical chambers with significantly different construction materials have been shown in some studies to give larger discrepancies in electron beams [32]. Some protocols allow non-water phantoms for cylindrical chambers, as well as for plane parallel chambers. Discrepancies in recommended fluence ratios can be up to 2% [33].
The overall conclusion is that there is agreement to within ± 1 % between current electron beam protocols, when using a graphite walled cylindrical chamber in a water phantom, in situations where the use of a cylindrical chamber is appropriate. Using other chambers, and particularly other phantom materials, can significantly increase the scope for further inconsistency.
5. USE OF PLANE PARALLEL CHAMBERS
For lower energy electron beams, of mean energy at the depth of measurement of less than around 5 MeV, all modem protocols recommend the use of plane parallel chambers, for well recognized reasons of peaked distributions, steep dose gradients and reduced projected depths at equivalent dose levels. In these circumstances cylindrical chambers become too large and their fluence perturbation corrections become more uncertain. A recent review of the use of plane parallel chambers for electron
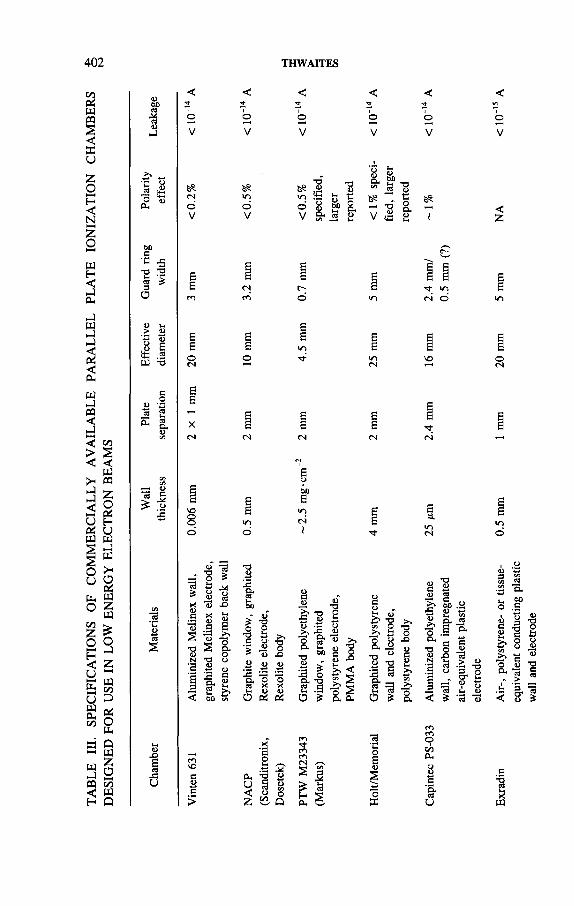
TABL
E III
. SP
ECIF
ICAT
IONS
OF
CO
MM
ERCI
ALLY
AV
AILA
BLE
PARA
LLEL
PL
ATE
IONI
ZATI
ON
CHAM
BERS
DE
SIGN
ED
FOR
USE
IN LO
W EN
ERGY
EL
ECTR
ON
BEAM
S
402 THWAITES
W)03
•a<DJО
V
оV
оV
оV
оV
оСиesоV
«лоV
•о^ ,SоV
§ i t а л иСЛ — Í и.
и 4>а- 5® ~ И « 12
* вн "О XV £
> « w DО с,а> сН-н (Н <Ц-н .¿3
Щ "О
_осеwсво .а>
-з а>5 -5 > .а
е0а
V")ri1
<и Л 'О = о
X
M s^ СЗS 43
•авв ««
4> .Û<5 ВоО-О О
■8
t í 4> & g>*Ы) СЛ
тзоХ>1>
а - О О сТ X X >1 Ü о О ой ей
(D1СЗJ=и
S ~^ и58 S
SS Q
<Г)ÍS
¿4и<я
обо
од
СПоIс/эси
3*и Exra
din
Air
-, po
lyst
yren
e-
or tis
sue-
0.5
mm
1
mm
20 mm
5
mm
NA
< 10
equi
vale
nt
cond
uctin
g p
last
ic
wal
l an
d el
ectr
ode

IAEA-SM-330/19 403
beam dosimetry [34] has surveyed much of the theoretical and experimental work and there are several papers in these Proceedings concerned with plane parallel chambers. Thus this section will only briefly mention the main points o f difference of protocol recommendations for these chambers and some of the current problems and developments.
5 .1 . Cham ber choice
The choice of plane parallel chambers designed for electron beam use is much more limited than for cylindrical chambers. Protocols typically specifically mention only one: or two. Probably the most widely recommended is the NACP design [35]. This chamber is the one included in the IAEA Code of Practice [13], but its treatment is not very specific, essentially referring back to Ref. [2]. In the UK the Vintén 631 [36, 37] was the only designated electron plane parallel chamber, but additional recommendations [9] have also included the Markus and the NACP chambers, recognizing their widespread use and bringing this aspect into line with other European protocols [15, 22]. In North America other designs, notably the Capintec, the Holt/Memorial and the Exradin chambers, are also given consideration in protocol recommendations [10]. A discussion of the required properties for such chambers can be found in Refs [13, 34-37]. Table HI indicates some of the practical characteristics o f the chambers mentioned above.
5 .2 . Calibration o f plane parallel chambers
Mattsson et al. [35] and others more recently [10, 34, 38] have reviewed calibration methods for plane parallel chambers (see also Refs [29, 39, 40]). A number o f authors and protocols recommend calibration by the user against a suitable cylindrical chamber in a high energy (preferably at least 18 MeV) electron beam as the method of choice, but recognize that calibration in photon beams is frequently necessary (e.g. the NACP [2] and protocols following its approach; and the American Association o f Physicists in Medicine (AAPM) [16, 10]). The three basic methods for photon calibration are:
(a) In air, réquiring the choice o f suitable buildup and suitable values o f tt m (e.g. the NCS [15] or the AAPM [10], either by the user or at a standards laboratory).
(b) In phantom, at dose maximum, requiring a choice o f phantom material and similar numerical information as in (a), plus a ^C o backscatter factor (e.g. the NACP [2], at a standards laboratory).
(c) In phantom, at depth, requiring a choice o f phantom material and an appropriate value o f p WaU,c> the correction for non-phantom equivalence in the calibration photon beam (e.g. the Institute o f Physical Sciences in Medi- cine/HPA [9, 21], by the user; and the AAPM [10], at a standards laboratory).

404 THWAITES
TA BLE IV. W ALL CORRECTION FACTORS (pwall;C) FOR PLANE PARALLELCHAMBERS AT DIFFEREN T PHOTON QUALITIES(all values have relative uncertainties (la) o f approximately 0.5% )
Quality NACP chamber Markus chamber
Wittkümper et al. [43] — in water phantom
Co-60 1.013 1.005
QI = 0.62 (4 MV) 1.013 1.005
QI = 0.71 (8 MV) 1.008 1.007
Thwaites [44] — in Perspex (PMMA) phantom
Co-60 1 .0 1 2 1.008
4 MV 1 .0 10 1.007
6 MV 1.009 1.008
Nystrôm and Karlsson [40] ■— in water phantom(corrected values, mean of two sets)
Co-60 1.015
4 MV 1 .0 1 2
These differences can introduce inconsistency. In particular, the problem with all “ Co calibration methods is to provide appropriate values o f the photon response correction factors (kmkm or p Waii,c)- Plane parallel chambers have relatively massive rear wall structures and a mixture o f materials is used in their construction. Simple calculational approaches are not applicable. Thus in most instances direct or indirect experimental values have been used. Many of these values are summarized by Laitano [41] and Rogers [42]. The latter has also carried out extensive Monte Carlo calculations, producing values for these correction factors.
For those protocols which recommend user calibration, a growing problem is the increasing non-availability o f “ Co units in some areas. In these cases calibrations are required at other photon qualities in the range 4 -8 MV. The sparse data on wall correction factors at these qualities [43, 44, 40] indicate only very small changes from the ^C o values, at least for NACP and Markus chambers (Table IV).
5 .3 . Plane parallel chambers in electron beams
Ideally plane parallel chambers are designed to provide a fluence perturbation of unity, by using a guard ring design. The required dimension is often quoted as

IAEA-SM-ЗЗО/19 405
at least 3 mm for typically sized chambers [35, 36]. Experimentally determined values o f p f for plane parallel chambers have been obtained by comparison against cylindrical chambers [27, 45], with the problems o f associated large uncertainties on p f o f those chambers; or against Fricke systems [28], which are also difficult to use at lower electron energies. However, all measurements have indicated that the NACP and Holt chambers have p { equal to unity to within a few tenths o f 1 % , even at the lowest energies investigated. Other chambers have a non-unity p f and some protocols have included data on this in their recommendations. It must be recognized that experimental values obtained in this way will actually provide a composite correction factor which includes all deviations not explicitly included in the account o f chamber response. It has been argued that the apparent non-unity Pf o f the Markus chamber is due in part to other effects [46]. Reference [34] summarizes the experimental and theoretical evidence on p { for plane parallel chambers. Results of Monte Carlo calculations are presented in these Proceedings [47].
Electron backscatter from the materials behind the air cavity can significantly affect the response of the chamber. This will depend on the materials and sizes involved in the chamber construction, on the energy at the point o f construction and on the phantom material. Hunt et al. [48] drew attention to this effect for plane parallel chambers and showed that differences in measured dose can be up to 2 %, owing to deficiencies of electron backscatter. Further data can be found in Refs [49, 50]. No current protocol explicitly takes this into account.
5 .4 . Non-water phantoms
For lower energy electron beams, particularly for plane parallel chamber use, most protocols recognize the need for recommendations on solid phantoms. There are different approaches to depth scaling and to transfer o f dose from the plastic to water, in particular to the magnitudes o f fluence ratio corrections applied. These have been summarized in Refs [33, 34, 51] and produce differences between protocols o f up to 2 %.
6 . CURRENT PROTOCOL DEVELOPMENT
A significant amount o f work has recently been carried out, or is under way: on chamber calibration for plane parallel chambers and the required corrections; on fluence perturbation corrections for cylindrical and plane parallel chambers; on backscatter effects in electron beams; and on non-water phantoms and their corrections. Monte Carlo calculations on a range of problems influencing chamber response in both photon beams (for calibration) and electron beams are providing useful new data. Much of this work has not yet been taken into account in electron

406 THWAITES
dosimetry protocols. Addenda have been produced to some existing protocols (e.g. Refs [9, 10]) to address some immediate problems, whilst revised protocols are under development over the longer term. These changes should result in a reduction of the current inconsistencies between protocols.
Chamber design is one area which could also merit consideration. In particular, plane parallel chamber designs with more uniform construction could have advantages in reducing the problems at calibration and those due to electron backscatter, if matched with phantoms of the same material. The recent introduction of a chamber made largely from epoxy resin based ‘solid water’ [39, 52] is an attempt to meet this requirement.
In the UK, the National Physical Laboratory is already well advanced in the development o f a graphite calorimeter based direct absorbed dose to water calibration service for electron beams [11]. On its eventual introduction, a significant change-over period will be necessary, to ensure consistency of dosimetry through time in any given centre and also between UK dosimetry and other protocols. A revised UK air kerma protocol is already under development, with the intention of addressing the recognized problems with the existing protocol [9, 21]. The Working Party responsible for this intends to monitor the development o f the new service and, if the timing is appropriate, to incorporate both approaches into the new protocol to ensure that consistency is retained.
7. CONCLUSIONS
Electron dosimetry protocols still retain more inconsistencies than megavoltage photon protocols. ND or air kerma protocols are still under development. Modem protocols currently agree to within ± 1 % for the determination of absorbed dose to water when measurements are carried out with a graphite walled cylindrical chamber in a water phantom, in conditions where a cylindrical chamber is appropriate. For other chambers, and particularly for other phantom materials, the discrepancies can be significantly greater. For lower energy electron beams, where plane parallel chambers are recommended, there are still significant problems in the protocols in use. These are connected with chamber design, with chamber calibration and the required correction factors, with backscatter effects and with phantom considerations. Current work is attacking these problems and additional recommendations and/or revised protocols will incorporate the results in the near future. This will decrease the inconsistencies still remaining in electron dosimetry. Calorimeter based direct iVw calibration services are under development in some standards laboratories. These must be carefully evaluated before being introduced into routine clinical electron dosimetry.
IAEA-SM-330/19 407
R E F E R E N C E S
[1] NORDIC ASSOCIATION OF CLINICAL PHYSICS, Procedures in external radiation therapy dosimetry with electron and photon beams with maximum energies between 1
and 50 MeV, Acta Radiol., Oncol. 19 (1980) 55.[2] NORDIC ASSOCIATION OF CLINICAL PHYSICS, Electron beams with mean ener
gies at the phantom surface below 15 MeV, Acta Radiol., Oncol. 20 (1981) 401.[3] ROOS, М., HOHLFELD, K., IAEA-SM-330/45, these Proceedings.[4] ROGERS, D.W.O., ROSS, C.K., SHORTT, K.R., KLASSEN, N.V., BIELAJEW, A.F.,
IAEA-SM-330/9, ibid.[5] ROSSER, K.E., et al., IAEA-SM-330/35, ibid.[6] INSTITUTE OF PHYSICAL SCIENCES IN MEDICINE, Code of practice for high-
energy photon therapy dosimetry based on the NPL absorbed dose calibration service, Phys. Med. Biol. 35 (1990) 1355.
[7] HOSPITAL PHYSICISTS’ ASSOCIATION, A Practical Guide to Electron Dosimetry (5-35 MeV), Rep. 4, HPA, London (1971).
[8] INTERNATIONAL COMMISSION ON RADIATION UNITS AND MEASUREMENTS, Radiation Dosimetry: Electrons with Initial Energies Between 1 and 50 MeV, ICRU Rep. 21, Bethesda, MD (1972).
[9] INSTITUTE OF PHYSICAL SCIENCES IN MEDICINE, Addendum to the code of practice for electron beam dosimetry in radiotherapy (1985): Interim additional recommendations, Phys. Med. Biol. 37 (1992) 1477.
[10] ALMOND, P.R., IAEA-SM-330/60, these Proceedings.[11] BURNS, D.T., McEWEN, M.R., WILLIAMS, A.J., IAEA-SM-330/34, ibid.[12] ROSENOW, U.F., KASTEN, G., IAEA-SM-330/64, ibid.[13] INTERNATIONAL ATOMIC ENERGY AGENCY, Absorbed Dose Determination in
Photon and Electron Beams: An International Code of Practice, Technical Reports Series No. 277, IAEA, Vienna (1987).
[14] NAHUM, A.E., THWAITES, D.I., ANDREO, P., An analysis of the revised HPA dosimetry protocols, Phys. Med. Biol. 33 (1988) 923.
[15] NEDERLANDSE COMMISSIE VOOR STRALINGSDOSIMETRIE, Code of Practice for the Dosimetry of High-Energy Electron Beams, Rep. 5, NCS, Amsterdam (1989).
[16] AMERICAN ASSOCIATION OF PHYSICISTS IN MEDICINE, A protocol for the determination of absorbed dose from high-energy photon and electron beams, Med. Phys. 10 (1983) 741.
[17] SOCIEDAD ESPAÑOLA DE FISICA MEDICA, Procedimientos recomendados para la dosimetría de fotones y electrones de energías comprendidas entre 1 y 50 MeV en radioterapia de haces externos, Publ. No. 1/1984, SEFM, Madrid (1984).
[18] COMITE FRANÇAIS ‘MESURE DES RAYONNEMENTS IONISANTS’, Recommendations pour la mesure de la dose absorbée en radiothérapie dans les faisceaux de photons et d’électrons d’énergie comprise entre 1 MeV et 50 MeV, CFMRI Rep. 2, Chiron, Paris (1985).

408 THWAITES
[19] ASSOCIAZIONE ITALIANA DI FISICA BIOMEDICA, ProtocoUo per la Dosimetría di Base nella Radioterapia con Fasci di Fotoni ed Elettroni con £'max fra 1 e 40 MeV, Fis. Biomed. 6 2 (1988).
[20] SWISS SOCIETY OF RADIATION BIOLOGY AND RADIATION PHYSICS, Dosimetry of High Energy Photon and Electron Beams, G. Garavaglia, Ospedale San Giovanni, CH-6500 Bellinzona, Switzerland (1986).
[21] HOSPITAL PHYSICISTS’ ASSOCIATION, Code of practice for electron beam dosimetry in radiotherapy, Phys. Med. Biol. 30 (1985) 1169.
[22] DEUTSCHE GESELLSCHAFT FÜR MEDIZINISCHE PHYSIK, Praktische Dosimetrie von Elektronenstrahlung und ultraharter Rontgenstrahlung, DGMP-Ber. Nr. 6 , DGMP, Kiel (1989).
[23] MUNHEER, B., THWAITES, D.I., WILLIAMS, J.R ., “Absolute dose determination” , Radiotherapy Physics in Practice (WILLIAMS, J.R ., THWAITES, D.I., Eds), Oxford Univ. Press, Oxford (1993) Ch. 3.
[24] INTERNATIONAL COMMISSION ON RADIATION UNITS AND MEASUREMENTS, Radiation Dosimetry: Electron Beams with Energies Between 1 and 50 MeV, ICRU Rep. 35, Bethesda, MD (1984).
[25] INTERNATIONAL COMMISSION ON RADIATION UNITS AND MEASUREMENTS, Stopping Powers for Electrons and Positrons, ICRU Rep. 37, Bethesda, MD (1984).
[26] ANDREO, P., “Consistency in stopping power ratios for dosimetry” , Dosimetry in Radiotherapy (Proc. Symp. Vienna, 1987), Vol. 1, IAEA, Vienna (1988) 3.
[27] JOHANSSON, K.-A., MATTSSON, L.O., LINDBORG, L., SVENSSON, H., “ Absorbed dose determination with ionization chambers in electron and photon beams having energies between 1 and 50 MeV” , National and International Standardization of Radiation Dosimetry (Proc. Symp. Atlanta, 1977), Vol. 2, IAEA, Vienna (1978) 243.
[28] WITTKAMPER, F.W., et al., Perturbation correction factors for some ionization chambers commonly applied in electron beams, Phys. Med. Biol. 36 (1991) 1639.
[29] ANDREO, P ., et al., On the calibration of plane-parallel ionization chambers for electron beam dosimetry, Phys. Med. Biol. 37 (1992) 1147.
[30] MA, С.-М., NAHUM, A.E., Effect of size and composition of the central electrode on the response of cylindrical ionization chambers in high-energy photon and electron beams, Phys. Med. Biol. 38 (1993) 267.
[31] THWAITES, D.I., “ Accuracy and consistency of electron beam dosimetry” , Proc. IPSM Mtg on Accuracy in Radiotherapy, Phys. Med. Biol. 34 (1989) 641 (abstract).
[32] THWAITES, D.I., Measurements of ionisation in water, polystyrene and a ‘solid water’ phantom material for electron beams, Phys. Med. Biol. 30 (1985) 41.
[33] THWAITES, D.I., “ Phantom materials for electron dosimetry” , paper presented at ESTRO Physics Mtg, Prague, 1993; THWAITES, D.I., SPRUNT, J., Comments on fluence ratios for Perspex phantoms for electron dosimetry, Phys. Med. Biol, (in press).
[34] NAHUM, A.E., THWAITES, D.I., “The use of plane parallel chambers for the dosimetry of electron beams in radiotherapy” , Review of Data and Methods Recom

IAEA-SM-330/19 409
mended in the International Code of Practice, IAEA TRS-277, on Absorbed Dose Determination in Photon and Electron Beams, IAEA-TECDOC, Vienna (in press).
[35] MATTSSON, L.O., JOHANSSON, K.-A., SVENSSON, H„ Calibration and use of plane-parallel ionization chambers for the determination of absorbed dose in electron beams, Acta Radiol., Oncol. 20 (1981) 385.
[36] MORRIS, W .T., OWEN, B ., An ionization chamber for therapy level dosimetry of electron beams, Phys. Med. Biol. 20 (1975) 718.
[37] HOSPITAL PHYSICISTS’ ASSOCIATION, A Practical Guide to Electron Dosimetry Below 5 MeV for Radiotherapy Purposes, Rep. 13, HPA, London (1975).
[38] KOSUNEN, A., JÀRVINEN, H., SIPILÂ, P ., IAEA-SM-330/41, these Proceedings.[39] ATTIX, F.H., A proposal for the calibration of plane-parallel ion chambers by
accredited dosimetry calibration laboratories, Med. Phys. 17 (1990) 931.[40] NYSTRÔM, H., KARLSSON, M ., Correction factors applied to plane-parallel ioniza
tion chambers, Phys. Med. Biol. 38 (1993) 311.[41] LAIT ANO, R.F., et al., Correction factors for calibration of plane-parallel ionization
chambers with a Co-60 gamma-ray beam, Phys. Med. Biol. 38 (1993) 39.[42] ROGERS, D.W.O., Calibration of parallel-plate chambers: Resolution of several
problems using Monte Carlo calculations, Med. Phys. 19 (1992) 889.[43] WITTKÀMPER, F.W., AALBERS, A.H.L., MUNHEER, B .J., Experimental deter
mination of wall correction factors: NACP and Markus plane-parallel ionization chambers, Phys. Med. Biol. 37 (1992) 995.
[44] THWAITES, D.I., “Comparison of recommendations for parallel plate chamber use in different electron dosimetry protocols” , Proc. ESTRO 11 (Malmô, 1992), Radio- ther. Oncol. 24 (1992) S55 (abstract).
[45] KUCHNIR, F .T., REFT, C.S., Experimental values for P„MtX and Prtf\,E f°r f"ive parallel-plate ion chambers — A new analysis of previously published data, Med. Phys. 19 (1992) 367.
[46] ROSENOW, U.F., Univ. of Gottingen, private communication, 1992.[47] MA, С.-М., NAHUM, A.E., IAEA-SM-330/71, these Proceedings.[48] HUNT, M.A., KUTCHER, G .J., BUFfA, A., Electron backscatter corrections for
parallel-plate chambers, Med. Phys. 15 (1988) 96.[49] KLE VENH AGEN, S . С., Implication of electron backscattering for electron dosimetry,
Phys. Med. Biol. 36 (1991) 1013.[50] TABATO, T., ITO, R., Simple calculation of the electron-backscatter factor, Med.
Phys. 19 (1992) 1423.[51] AMERICAN ASSOCIATION OF PHYSICISTS IN MEDICINE, Clinical electron-
beam dosimetry: Report of AAPM Radiation Therapy Committee Task Group No. 25, Med. Phys. 18 (1991) 73.
[52] KUBO, H., Evaluation of two solid water parallel-plate chambers in high-energy photon and electron beams, Med. Phys. 20 (1993) 341.


IAEA-SM-330/61
INVESTIGATION OF SOME ASPECTS OF THE IAEA CODE OF PRACTICE FOR ABSORBED DOSE DETERMINATION IN PHOTON AND ELECTRON BEAMS
A. LEITN ER, W. TIEFENBÓCK, J . WITZANI Bundesamt fiiir Eich- und Vermessungswesen,Vienna
C. STRACHOTINSKYÔsterreichisches Forschungszentrum Seibersdorf,Seibersdorf
Austria
Abstract
INVESTIGATION OF SOME ASPECTS OF THE IAEA CODE OF PRACTICE FOR ABSORBED DOSE DETERMINATION IN PHOTON AND ELECTRON BEAMS.
The Code of Practice of the International Atomic Energy Agency gives recommendations for absorbed dose determination in high energy photon and electron beams with an ionization chamber calibrated free in air in terms of air kerma. Results of investigations into three different aspects of the Code are presented, (a) For various types of commercially available chambers it is shown that in a “ Co beam there is excellent agreement between the absorbed dose determined according to the Code and the absorbed dose derived from calorimeter measurements. (b) Results of an experimental study of the central electrode correction factor for chambers with aluminium electrodes indicate that the recommended values of the Code are slightly overestimated, (c) It is demonstrated that the ‘two-voltage’ technique for the determination of the recombination factor appears to be suitable in a scanned electron beam even at a lack of saturation of about 2 0 %.
1. INTRODUCTION
The Code o f Practice o f the International Atomic Energy Agency (IAEA) [1] outlines the procedural methods for the determination of the absorbed dose to water from radiation beams used for radiotherapy. Furthermore it provides values for the necessary physical interaction coefficients and correction factors. The formalism is based on the use o f ionization chamber dosimeters calibrated in terms o f air kerma. For the use o f the dosimeters in high energy photon and electron beams the calibration quality is recommended to be ^C o 7 radiation. The absorbed dose to water,
411

412 LEITNER et al.
£>w, in the user’s beam quality at the point o f interest (i.e. at the effective point of measurement o f the chamber, Peff) is then given by
Ow(Peff) ^^/)(^w,air)uPuPcel (1)
where
M is the meter reading (corrected for recombination, polarity, temperature andpressure);
Nd is the absorbed dose to air chamber factor (determined at the calibrationquality “ Co);
( w,air)u is the stopping power ratio of water to air at the user’s beam quality;p a is the perturbation correction factor at the user’s beam quality;Pcei corrects for the effect o f the central electrode material.
Nd is related to the air kerma calibration factor NK by
Nd = ЛГ* ( 1 - g)kittkm (2 )
where
g is the fraction of the energy of the secondary electrons lost to bremsstrahlung in air;
k.itt corrects for the attenuation and scatter o f photons in the chamber material;km corrects for the lack o f air equivalence o f the chamber material.
One task o f the present investigation was to test the methodology of the IAEA Code for various types o f ionization chambers at “ Со y rays: the ionometrically determined absorbed dose to water based on an air kerma calibration o f the ionization chambers was compared with the absorbed dose derived from calorimetric measurements. The second task o f the investigation was an experimental determination of the central electrode correction factor in accelerator beams.
The incomplete efficiency in collecting charge in the cavity o f an ionization chamber requires the use o f a correction factor. The Code recommends the ‘two-voltage’ method for the determination of this factor. In the case of pulsed scanned radiation the recombination correction becomes rather important. The validity o f the two-voltage technique was studied in a scanned electron beam with the maximum possible output o f 4 .5 Gy/min at the reference point.
2. M ATERIALS AND METHODS
2 .1 . Radiation beams and reference standards
The measurements concerning the validity o f Eq. (1) were carried out in the “ Co beam of the Picker C8M/80 teletherapy unit o f the Austrian dosimetry labora-

IAEA-SM-330/61 413
tory, which is operated as a co-operative project o f the Bundesamt für Eich- und Vermessungswesen (BEV) and the Ôsterreichisches Forschungszentrum Seibersdorf (ÔFZS) [2]. The nominal air kerma rate at the reference distance (100 cm) was about0.35 Gy/min during the period o f measurements. The field size in the reference plane was 10 cm x 10 cm. The air kerma rate was determined by means o f the national primary standard, which is a cylindrical graphite cavity ionization chamber with a nominal volume of 1 cm3. Details of the chamber and results o f international comparisons are given in Ref. [3]. The absorbed dose rate to water (in the water phantom) was derived from the national primary standard graphite calorimeter, which is based on the design of Domen [4]. Details o f its construction and operation can be found in Ref. [5]. Two methods are employed to derive the absorbed dose rate to water from the absorbed dose rate to graphite, both making use o f a photon fluence scaling theorem [6 ].
The central electrode effect measurements were performed in the 20 MeV (nominal energy) electron beams of four different accelerators (Philips SL75/20, Philips SL25, CGR Saturne 25, Siemens Betatron) and in photon beams with nominal accelerating potentials o f 8 MV (SL75/20), 23 MV (Saturne 25), 25 MV (SL25) and 42 MV (Betatron). The recombination correction measurements were carried out in the 20 MeV scanned electron beam o f the Saturne 25. The reference dosimeters in the recombination studies were ferrous sulphate (Fricke) ampoules provided by the Physikalisch-Technische Bundesanstalt (PTB), Germany.
2 .2 . Ionization chambers
Thirteen different types o f ionization chambers from several manufacturers were tested in the ^C o beam. Their relevant characteristics (internal radii and lengths, nominal volumes, and wall and buildup cap materials) are given in Table I. Four o f the types (PTW M 233642, Wellhôfer IC 10, ÔFZS C C I, Robotron 70 108) are not included in the respective tables o f the Code. The ÔFZS C CI chamber is thick walled (wall thickness 0 .7 g/cm2 o f graphite) for the given radiation quality (^C o), its internal radius is 5 .5 mm and the nominal volume is1 cm 3. Thus it does not fully meet the requirements o f the Code, but nevertheless it was included in the investigations.
Two chambers o f type TK01 were supplied by the manufacturer, the ÓFZS, with central electrodes o f graphite and aluminium, respectively, for the determination of the effect o f the central electrode material. The radius o f the electrodes of these chambers was 1 mm. The recombination effect was studied using one chamber of the type NE 2571 and with the TK01 chamber with the graphite central electrode. An additional chamber o f the TK01 type was used as an external monitor for the accelerator measurements.

414 LEITNER et al.
TA BLE I. CHARACTERISTICS OF IONIZATION CHAMBERS
Chamber
Internaidimensions
Nominal volume (cm3)
Material
Radius(mm)
Length(mm)
Wall Cap
NE 2561 (NPL) 3.7 9.2 0.3 Graphite Delrin
NE 2571 3.15 24.0 0 .6 Graphite Delrin
NE 2581 3.15 24.0 0.6 A-150 PMMA
NE 2505/ЗА 3.15 24.0 0 .6 Graphite PMMA
PTW М233641 2.75 15.1 0.3 PMMA PMMA
PTW M233642 2.75 6.5 0.125 PMMA PMMA
PTW M23331 4.0 2 2 .0 1 .0 PMMA PMMA
PTW M23332 2.5 18.0 0.3 PMMA PMMA
Capintec PR-06 3.2 22.0 0.6 C-552 PMMA
IC 10 (Wellhôfer) 3.0 9.3 0.15 C-552 PMMA
ÔFZS TK01 3.5 12 .0 0.4 Delrin Delrin
ÔFZS CCI 5.5 1 1 .0 1 .0 Graphite (4 mm)
Robotron 70 108 (VAK 252)
1.7 9.8 0.05 Air equivalent PMMA
2 .3 . Electrom eter and water phantom
The currents o f the chambers were measured with digital current integrators (DCI 8500) manufactured by the ÓFZS. The chambers were operated with positive and negative polarizing voltage. The average of the two readings was taken as the ‘true’ value.
The IAEA cubic water phantom (30 cm X 30 cm x 30 cm) was used for the in-water measurements. It was modified in such a way that the carriage for the chamber holder was continuously adjustable. For each type of chamber (except TK01 and Robotron) a special holder o f PMMA was designed with a wall thickness o f 1.5 mm in the active region. The TK01 chamber is watertight and was used without a holder; the Robotron chamber was used with the sheath supplied by the manufacturer.

lAEA-SM-330/61 415
2.4 .1 . Absorbed dose determination in 60Co beam
The chambers o f Table I were calibrated with their buildup caps in terms of air kerma free in air against the primary standard. The Robotron chamber was calibrated with the PMMA buildup cap o f the PTW M233641 chamber since no other suitable cap was available. The thick walled C CI chamber was calibrated without an additional cap.
The Nd factors were then calculated using the kM and km data o f the Code. For the chambers PTW M 233642, IC 10, C CI and Robotron 70 108, km was calculated according to Section 8 o f the Code; fcatt for these chambers was taken to be 0.990.
The next step was to place the chambers in the water phantom without buildup caps with the effective point o f measurement at the reference depth (5 cm). From the measured currents the absorbed dose to water, D(NK), was determined for each chamber using the data o f the Code for sw air and p u. For the chambers TK01, CCI and Robotron 70 108, p u was calculated upon the basis o f Section 8 o f the Code. The D(NK) values were compared with the absorbed dose D c¡¿ which was derived from the primary standard calorimeter.
2.4 .2 . Effect o f central electrode
The reading of the two chambers o f the TK01 type with the different central electrodes o f graphite and aluminium was determined in the ^C o beam (in the water phantom), in the four 20 MeV electron beams and in the 42 M V photon beam. The reference depth in the water phantom was 3 cm in the electron beams and 10 cm in the photon beam. The ratio o f the currents measured in the accelerator beams normalized to the current ratio at “ Co was used to estimate the central electrode correction factor p ce[.
2 .4 .3 . Recombination effect
One Farmer NE 2571 chamber and the TK01 chamber with the graphite electrode were used for testing the recombination effect correction in the scanned 20 MeV electron beam of the Saturne 25 accelerator. The accelerator was operated with the maximum possible output. The absorbed dose rate at the reference point was about 4 .5 Gy/min. The absorbed dose was evaluated with Eq. (1) using sw air and p ü values from the Code. The recombination effect correction factor p s was determined by the two-voltage method using the fit coefficients o f the Code. The voltage ratio was equal to 2. The ionometrically determined absorbed dose was compared
2.4. Methods o f measurement

416 LEITNER et al.
with absorbed dose measured by Fricke ampoules which had been provided and evaluated by the PTB.
3. RESULTS AND DISCUSSION
3.1 . Absorbed dose determination in “ Co beam
Table П gives the results as ratios o f D(NK) to A ab where D(NK) is the absorbed dose to water as derived ionometrically from the air kerma calibration in accordance with the Code, and Э ы is the absorbed dose to water as derived from the calorimeter. The results are based on three chambers of type M 233641, two chambers each of types NE 2561, NE 2571, NE 2581 andM 23332, and one chamber o f each of the other types. The D(NK) values for one type of chamber did not differ by more than 0.2% from each other. The differences between the respective values
TA BLE П. RESULTS OF COMPARISON OF IONOMETRIC AND CALORIMETRIC METHODS FOR ABSORBED DOSE DETERMINATION
Chamber D(NK)/Dcal
NE 2561 (NPL) 1.0 0 1
NE 2571 1.003
NE 2581 1.004
NE 2505/ЗА 1.003
PTW М233641 1.0 0 2
PTW M233642 1.004
PTW M23331 0.996
PTW M23332 1.003
Capintec PR-06 1.003
IC 10 (Wellhôfer) 1.0 0 2
ÔFZS TK01 1.000
ÔFZS CCI 1.0 0 1
Robotron 70 108 1.000
(VAK 252)

IAEA-SM-330/61 4 1 7
of D(NK) and Dcaj are well within the total uncertainty of Dcal, which is estimated to be 0 .6% . This holds true even for the chamber C C I, which is thick walled and without an additional buildup cap and has dimensions larger than recommended in the Code. The mean ratio D(NK)/D ca¡ is 1.002 with a standard deviation o f 0 .2% .
The conclusion can be drawn that following the IAEA Code of Practice the absorbed dose from a ^Co beam can be determined with sufficient accuracy by the types o f ionization chambers which have been under investigation. Furthermore one can conclude that in practice it does not matter whether one determines the absorbed dose from an accelerator beam using Eqs (1) and (2) and a ^Co air kerma calibration factor NK or whether one starts with an absorbed dose to water calibration in a “ Co beam and determines the absorbed dose Ay(Peff) according to
O w (Peff) ^^w (5w ,a irP u Pce l)i/ ('Sv.,air.Pu)c (3 )
where Nw is the absorbed dose to water calibration factor at ^Co and the subscripts u and с refer to the user’s beam quality and the calibration quality (i.e. ^Co).
3 .2 . C entral electrode correction factor
The values o f the central electrode correction factors p cel obtained for an aluminium central electrode with a radius o f 1 mm are:
Pcei = 1.000 ± 0.002 for 8 , 23, 25 and 42 MV photonspcel = 1.008 ± 0 .002 for 20 MeV electrons.
The recommended values o f the Code appear to be somewhat too high:
Pcei,Code = 1 008 for photons above 25 MVPeel,Code = 1-015 for electrons.
3 .3 . Recombination correction factor
The values for the recombination correction factor p s obtained with the two- voltage method in the scanned 20 MeV electron beam are:
Chamber NE 2571: p s = 1.245Chamber TK01: p t = 1.125

418 LEITNER et al.
The absorbed doses D(NK) determined according to Eq. (1) with these values o f p sagreed with the absorbed dose measured with the PTB Fricke ampoules to within 1.5% :
Chamber NE 2571: D(NK)/D Fr[cke = 1.014Chamber TK01: D(NK)/D Frícke = 1.010.
Hence it seems that the two-voltage method for the determination of p s can beapplied even in cases where the value of p s is very large.
R E F E R E N C E S
[1] INTERNATIONAL ATOMIC ENERGY AGENCY, Absorbed Dose Determination in Photon and Electron Beams: An International Code of Practice, Technical Reports Series No. 277, IAEA, Vienna (1987).
[2] LEITNER, A., Radiation Dosimetry and Standards at the Austrian Dosimetry Laboratory, Rep. No. 4296, Ôsterreichisches Forschungszentrum Seibersdorf (1984).
[3] DUFTSCHMID, K.E., LEITNER, A., The Austrian Primary Standards for Ionizing Radiation Dosimetry — Results of International Intercomparisons, Rep. No. 4269, Ôsterreichisches Forschungszentrum Seibersdorf (1984).
[4] DOMEN, S.R., LAMPERTI, P .J., A heat-loss-compensated calorimeter: Theory, design, and performance, J. Res. Natl. Bur. Stand., A Phys. Chem. 78 (1974) 595-610.
[5] WITZANI, J ., DUFTSCHMID, K.E., STRACHOTINSKY, C., LEITNER, A., A graphite absorbed-dose calorimeter in the quasi-isothermal mode of operation, Metrologia 20 (1984) 73-79.
[6] LEITNER, A., “Austrian Radiation Metrology Organization” , New Trends and Developments in Radiation Protection (Proc. Symp. Bologna, 1991) (LEMBO, L., Ed.), Associazione Italiana di Protezione contro le Radiazioni, Bologna (1991) 53-78.

IAEA-SM-330/21
THE INCREASE OF ACCURACY IN RADIATION DOSIMETRY RESULTING FROM APPLICATION OF THE IAEA CODE OF PRACTICE
C. MILUInstitute o f Hygiene and Public Health,Bucharest, Romania
Abstract
THE INCREASE OF ACCURACY IN RADIATION DOSIMETRY RESULTING FROM APPLICATION OF THE IAEA CODE OF PRACTICE.
Recognizing the need of increased accuracy in radiation therapy, in 1987 the International Atomic Energy Agency (IAEA) published an International Code of Practice on Absorbed Dose Determination in Photon and Electron Beams. Taking into account that the uncertainty in the calibration of the radiation beam is an essential component of the total uncertainty in the delivery of treatment, this Code describes methods for determination of absorbed dose in water, based on the use of an air kerma calibrated ionization chamber, and presents procedures for transfer of calibrations from Secondary Standard Dosimetry Laboratories (SSDLs) to users. During the period November 1988-October 1991, the SSDL Bucharest participated in an IAEA co-ordinated research programme to test the Code of Practice for easy applicability and inherent consistency and to complete the data for ionization chambers not yet included in the Code. The paper presents the main results obtained by application of the IAEA Code in ^Co y radiation, using an ionization chamber of type NE 2561, a PTW0.3 cm3 Normal chamber of type M23332 and an IAEA CARE dosimeter (calibration assurance dosimeter). It was demonstrated that the IAEA Code can be applied with accurate results for a variety of dosimeters.
1. INTRODUCTION
The determination of absorbed dose in water is an important task in radiation dosimetry. The well known Code of Practice of the Hospital Physicists’ Association (HPA) [1] recommends a procedure and quotes numerical data which allow an ionization chamber having an exposure calibration factor at one quality in the megavoltage range to be used to determine the absorbed dose at a point in water irradiated by X rays or ^C o y rays. According to this Code, when we measure absorbed dose at a specified depth in a water phantom using an ionization chamber, the instrument reading is proportional to the dose, in water, at the chamber centre, and the factor relating the instrument reading to the dose is a function of quality only.
This statement is expressed by the familiar formula:
D = RNC\
419

420 MILU
where D is the dose in water, R the instrument reading, N the calibration factor (in terms of exposure) and Cx a conversion factor which relates the response o f the chamber to exposure in air to its response to absorbed dose to water in the phantom. For some years this factor was assumed to be constant and a function of the radiation quality only. It was also supposed that it is valid for all types of chamber having a total thickness o f chamber wall plus buildup cap of approximately 0 .6 g -cm '2.
It was soon realized that Cx is actually very dependent on the size, shape and construction of the ionization chamber used and consequently several values for this factor were published during the following years for a variety o f chambers. In this connection the two comprehensive Codes of Practice published by the Nordic Association of Clinical Physics [2] in 1980 and by the American Association of Physicists in Medicine [3] in 1983 should be mentioned. Also, when, in 1983, the HPA published a revised Code of Practice for photon dosimetry [4], which keeps to the original simple procedure using the conversion factor Cx, it made the specification that the provided values o f Cx are for the NE 2561 chamber, widely used as a secondary standard since that period.
2. INTERNATIONAL CODE OF PRACTICE
2 .1 . General presentation
Recognizing the need of increased accuracy in radiation therapy [5] o f better than ± 5 % in the delivery of absorbed dose, the International Atomic Energy Agency (IAEA) in 1987 published an International Code of Practice on Absorbed Dose Determination in Photon and Electron Beams [6 ]. Taking into account that the uncertainty in the calibration of the radiation beam is an essential component of the total uncertainty in the delivery of treatment, this Code describes methods for determination of absorbed dose in water, based on the use o f an air kerma calibrated ionization chamber, and presents procedures for transfer o f calibrations from Secondary Standard Dosimetry Laboratories (SSDLs) to users.
2 .2 . SSD L Bucharest
The SSD L Bucharest was set up in 1969 and has been a member o f the IAEA/WHO Network of SSDLs since 1976, when this network was established. During the period November 1988-October 1991, the SSD L Bucharest participated in an IAEA co-ordinated research programme to test the Code of Practice for easy applicability and inherent consistency and to complete the data for ionization chambers not yet included in the Code.
This paper presents part o f our results obtained by applying the IAEA Code for ^C o y radiation. In this work we used an ionization chamber of type NE 2561
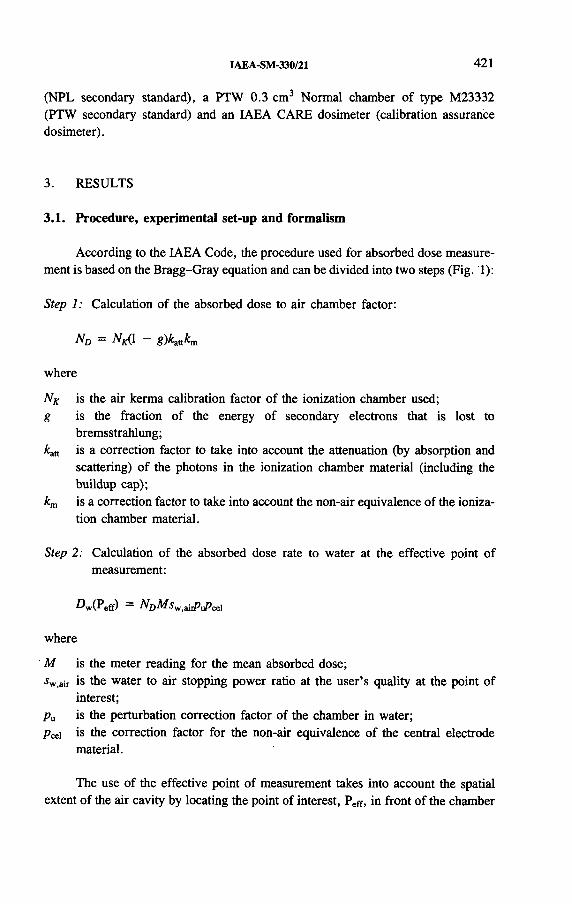
IAEA-SM-330/21 4 2 1
(NPL secondary standard), a PTW 0 .3 cm3 Normal chamber o f type M23332 (PTW secondary standard) and an IAEA CARE dosimeter (calibration assurance dosimeter).
3. RESULTS
3 .1 . Procedure, experimental set-up and formalism
According to the IAEA Code, the procedure used for absorbed dose measurement is based on the Bragg-Gray equation and can be divided into two steps (Fig. 1):
Step 1: Calculation of the absorbed dose to air chamber factor:
Nd = m - g)km km
where
NK is the air kerma calibration factor o f the ionization chamber used;g is the fraction of the energy of secondary electrons that is lost to
bremsstrahlung;is a correction factor to take into account the attenuation (by absorption and scattering) o f the photons in the ionization chamber material (including the buildup cap);
km is a correction factor to take into account the non-air equivalence of the ionization chamber material.
Step 2: Calculation of the absorbed dose rate to water at the effective point of measurement:
^w(Peff) N[)M
where
M is the meter reading for the mean absorbed dose;sw>air is the water to air stopping power ratio at the user’s quality at the point of
interest;p u is the perturbation correction factor of the chamber in water;Pœi is the correction factor for the non-air equivalence of the central electrode
material.
The use of the effective point o f measurement takes into account the spatial extent o f the air cavity by locating the point of interest, Peff, in front o f the chamber

422 MILU
Step 1
у Г"-*--
Step 2
Buildup cap
ND = - ^ - = N K(U g)kMkmС
Dw(Pef.)=A/DMSw.air Pu Peel
■ Axis of ionization chamber
FIG. 1. Calibration set-up and formalism for application of the IAEA Code of Practice.

IAEA-SM-330/21 423
centre, P, to correct for the gradient of fluence within the chamber cavity. The dose at the axis o f the ionization chamber is calculated by using the ratio o f depth doses from published data.
3 .2 . Use o f N PL and PTW secondary standards and CA KE chambers
During the application o f the IAEA Code o f Practice, the calculation of several correction factors required by the formalism was necessary. In Table I are presented the values obtained for the NE 2561, PTW M23332 and CARE ionization chambers.
Table П shows a comparison of results using the two secondary standards and by application of two different Codes o f Practice. Good agreement was obtained by application o f the IAEA Code for both chambers, and between the HP A and IAEA Codes for the NE chamber.
The CARE dosimeter has been used by the IAEA during the last few years for intercomparison purposes. Within the above mentioned IAEA co-ordinated research programme, it was used for checking the applicability of the International Code of Practice.
TA BLE I. FACTORS APPLIED FO R NE 2561, PTW M 23332 AND CARE IONIZATION CHAMBERS
Factor NE 2561 PTW M23332 CARE
8 0.003 0.003 0.003
att 0.995 0.993 0.989
*m 0.984 0.982 0.989
^w,air 1.133 1.133 1.133
a 0.638 0.450 0.540
^wall.air 1.0 0 2 1 .1 0 2 1.080
O ci/ Ow.wall 1.113 1.030 1.042
P u 0.990 1.0 0 0 82 0.996 4
P e e l 1.000 1.000 1.000
N K (mGy/scale division) 9.47 N K N K
A*(Peff) (mGy) 10.3688MSTP 1.102N K M S T P 1.101 N K M S T P

424 MILU
TABLE П. COMPARISON OF CODES OF PRACTICE
Chamber IAEA HPARelative
difference(%)
NE 2561 10.2434 10.2506 +0.07
PTW M233?2
Relative
10.3090 10.3810 +0.70
difference (%) +0.64 + 1.27 —
TA BLE Ш. RESULTS OF MEASUREM ENTS (CARE 002 was used)
CARE INTERCOMPARISON
Step
1 Co-60) 1.4907 Gy/V
2 Ak,w(Co-60) 1.6355 Gy/V
3 D 1.6410 Gy/V (+0.3%)
The methodology of the CARE programme intercomparison measurements as established by the IAEA Dosimetry Laboratory consists o f three steps:
Step 1: Calibration in air, in terms of air kerma of the CARE system, against the secondary standard dosimeter (SSD) available:
A ^ C o / S S D ) SSD il? fo - ЛГаa(№Co) CARE in air. N^Co /C A R E )
Step 2: Calibration in water, in terms of absorbed dose to water, o f the CARE system, by application of the IAEA Code to the standard chamber in water:
A ^ C o / S S D ) SSD in water » D ^ C o /SSD) c a r e in water AT (6°Co/CARE)^ IAEA Code (SSD) w '
Step 3: Absorbed dose measurements using the CARE system in water and by application of the IAEA Code, using the air kerma calibration factor from Step 1, and comparison with the results from Step 2:
A ^ C o / C A R E ) CARE in water > D w( 60C o /C A R E )IAEA Code (CARE)
The results are presented in Table Ш.

IAEA-SM-330/21 4 2 5
The IAEA International Code of Practice can be applied with accurate results for a variety o f dosimeters. In spite o f an apparently complicated calculation procedure, the method is easy to apply.
Apart from these practical details, the following arguments demonstrate that the accuracy is increased by the application of the IAEA Code:
— The air kerma calibration o f a dosimeter has a much smaller uncertainty than the exposure calibration, as the air kerma includes the product o f i grjair and W/e, which is better known than are the separate values (exposure only makes use o f the numerical value of sgr a¡r)-
— Introduction during the air calibration of the two correction factors, kM and km, takes into account that the relation between absorbed dose in the air cavity and air kerma depends on the construction o f the chamber and buildup cap.
— The water to air stopping power ratio used during the in-water measurements is calculated for the actual beam quality, experimentally determined by the ratio o f absorbed dose at 2 0 and 1 0 cm depths.
— The applied perturbation factor is calculated for each specific chamber, using computational methods for interaction coefficients.
— The concept o f effective point o f measurement is used carefully.
By application of this Code, an pverall uncertainty o f less than 3% can be achieved. Several uncertainties still remain, these being due to:
— Errors in positioning of the chamber,— Evaluation o f the temperature and pressure o f the air in the chamber cavity,— The actual effective point o f measurement and transfer o f the calibration to a
reference point,— Uncertainty in the real value o f p œi,— Correction factors used for uncommon chambers.
Although it is well recognized that direct measurement o f absorbed energy should be used for the standard of absorbed dose, the IAEA Code of Practice provides a basis for the determination of absorbed dose with a high degree of consistency and, when carried out correctly, the procedure could lead to improved accuracy of radiation dosimetry.
R E F E R E N C E S
[1] HOSPITAL PHYSICISTS’ ASSOCIATION, A code of practice for the dosimetry of2 to 35 MV X-ray and caesium-137 and cobalt-60 gamma-ray beams, Phys. Med. Biol. 14 (1969) 1-8.
4. DISCUSSION AND CONCLUSIONS

426 MILU
[2] NORDIC ASSOCIATION OF CLINICAL PHYSICS, Procedures in external radiation therapy dosimetry with electron and photon beams with maximum energies between 1
and 50 MeV, Acta Radiol., Oncol. 19 (1980) 55-79.[3] AMERICAN ASSOCIATION OF PHYSICISTS IN MEDICINE, A protocol for the
determination of absorbed dose from high-energy photon and electron beams, Med. Phys. 10 (1983) 741-771.
[4] HOSPITAL PHYSICISTS’ ASSOCIATION, Revised Code of Practice for the dosimetry of 2 to 35 MV X-ray, and of caesium-137 and cobalt-60 gamma-ray beams, Phys. Med. Biol. 28 (1983) 1097-1104.
[5] BRAHME, A., Dosimetric precision requirements in radiation therapy, Acta Radiol., Oncol. 23 (1984) 379-387.
[6] INTERNATIONAL ATOMIC ENERGY AGENCY, Absorbed Dose Determination in Photon and Electron Beams: An International Code of Practice, Technical Reports Series No. 277, IAEA, Vienna (1987).

IAEA-SM-330/51
CALIBRATION OF ELECTRON BEAMS AT CHULALONGKORN HOSPITAL, BANGKOK
S. SURIYAPEE Department o f Radiology,Chulalongkom Hospital,Faculty of Medicine,Chulalongkorn University
S. KANOKJIRAPORN, S. SRIMANOROTH, D. LEELASOM SIRI Division of Radiation Protection Services,Department o f Medical Sciences,Ministry o f Public Health
Bangkok, Thailand
Abstract
CALIBRATION OF ELECTRON BEAMS AT CHULALONGKORN HOSPITAL, BANGKOK.
The calibration of electron beams of 6 , 9, 12, 16 and 20 MeV from the Varían Clinac 1800 linear accelerator at Chulalongkom Hospital in Bangkok is based on the International Atomic Energy Agency Code of Practice. The parameters and qualities of the electron beams were determined by measurement of depth dose in water with a Therados Beam Data Scanner BDS-3 system. During a three year period (1990-1992), constancy checks showed the stability of the beam parameters and qualities. The electron beams were calibrated in a polystyrene phantom at the depth of maximum dose with a Nuclear Enterprises Ltd parallel plate chamber (model NE 2534) connected to an Ionex Dosemaster (model 2590 A). The calibration was repeated in water by the Division of Radiation Protection Services (RPS), Department of Medical Sciences, Ministry of Public Health, which has the responsibility for the quality assurance of therapy machines. In the first two years, the hospital absorbed dose results were0.2-3.5% higher than those measured by the RPS, with the difference increasing to as much as 7.0% in the third year; the increase was especially noticeable for the 6 MeV beam. Therefore the hospital performed measurements in the RPS water phantom and in the polystyrene phantom with the same parallel plate chamber. The output in water was found to be lower than in the polystyrene phantom by about 1.4-2.3% for 9-20 MeV and 4.7% for 6 MeV. The possible causes of the disagreement were examined. It was found that the uncertainty of the scale which determined the position of the chamber in the RPS water phantom was the major problem. Low energy electrons showed a large discrepancy because the absorbed depth dose curve at low energy has a narrow peak of maximum dose. A shift of a few millimetres from the depth of maximum dose resulted in a lower output in the water phantom than in the polystyrene phantom. In addition, the position of the chamber in the polystyrene phantom has to be equivalent to the position in the water phantom. The output in the polystyrene phantom would be changed if the correction were not made. When the measurements were performed with
427

428 SURIYAPEE et al.
the position of the parallel plate chamber in the BDS-3 water phantom precisely determined, the absorbed dose was found to agree to within 3 % with that determined using the polystyrene phantom for all electron beam energies. Calibration of electron beams in the water phantom or in the polystyrene phantom must be done with accurate position setting and considering the equivalent depth in water.
1. INTRODUCTION
Chulalongkom Hospital is a university hospital in Bangkok, Thailand, with 1700 beds. The Division of Radiotherapy in the Department of Radiology is equipped with two “ Co units and one Varian Clinac 1800 linear accelerator which produces 6 and 10 MV X rays as well as 6 , 9, 12, 16 and 20 MeV electron beams. The linear accelerator was installed in 1990 together with a Varian Ximatron CX simulator and General Electric target treatment planning system. Owing to lack of experience in using high energy photon and electron beams, the department applied for an International Atomic Energy Agency (IAEA) fellowship. The project Medical Physics and Clinical Dosimetry for Radiotherapy was undertaken in 1990-1992. The technical assistance provided by experts in the use o f the machine and the dosimetry work was of great benefit in setting up the dosimetry system for high energy photon and electron beams in the hospital. This paper discusses the data collected as part o f the project during 1990-1992. Some difficulties in measurement and determination of electron beams are described.
2. M ATERIALS AND METHODS
The calibration procedures are based on the IAEA Code of Practice [1]. The dosimeter system consists o f a Therados Beam Data Scanner BDS-3 system together with silicon and parallel plate detectors, a Nuclear Enterprises Ltd Ionex Dosemaster (model 2590 A) and a parallel plate chamber (model NE 2534). The phantom for the parallel plate chamber consists o f polystyrene sheet. The dosimeter and chamber were calibrated by the national Secondary Standard Dosimetry Laboratory in the Division o f Radiation Protection Services (RPS), Department o f Medical Sciences, Ministry o f Public Health, Bangkok. The exposure calibration factor Nx was known and the absorbed dose to air chamber factor ND was calculated.
First, the depth ionization curves were obtained with the Therados BDS-3 using the parallel plate detector. For each electron beam energy, scanning was carried out on the axis o f a 15 cm X 15 cm beam at 100 cm SSD in a water phantom. From these curves, the mean energy at the phantom surface (Eo) was determined.

IAEA-SM-330/51 429
The water to air stopping power ratio sw air as a function of E0 and phantom depth was read from Table X in the IAEA Code. The depth ionization curves were converted to depth absorbed dose by multiplying the stopping power ratio for each depth by the ionization reading. From these curves the depth of maximum dose, the halfvalue depth and the practical range were determined, and E0 and Ep 0 (the most probable energy at the surface) were calculated. Then the depth absorbed dose measured by scanning the silicon detector in the water phantom with the same beam set-up was compared with that derived from the depth ionization curve.
Next, the calibration of electron beams was performed at the depth of maximum dose for a 10 cm x 10 cm field and 100 cm SSD in the polystyrene phantom with the parallel plate chamber connected to the NE 2590 A. Recalibration by the RPS, which is also responsible for the quality assurance o f therapy machines, was done annually during the three year period following the installation of the machine. The RPS calibrated the electron beams in a water phantom with its NE 2534 parallel plate chamber. The method of determination of absorbed dose used by the RPS also follows the IAEA Code. In the third year, the results measured in the polystyrene phantom by the hospital did not agree with the results measured in the water phantom by the RPS. Therefore measurements in the water phantom (RPS phantom) and in the polystyrene phantom with the hospital NE 2534 parallel plate chamber were performed on the same day.
The results showed a rather large discrepancy. The measurements were performed again with the hospital parallel plate chamber in the BDS-3 water phantom scanner connected to the electrometer, by which the exact position of the chamber in the water phantom could be set accurately. The measurements in the polystyrene phantom were done next to compare the absorbed dose. The thickness o f polystyrene sheet was set to include a correction for a non-water phantom and the position set to be equivalent to the depth of the chamber in the water phantom for each electron beam energy.
3. RESULTS
3 .1 . Determination o f quality o f beams
Table I shows the values o f the depth of maximum dose (/?юо)> the half-value depth (R5Q) and the practical range (Rp), as well as E0, Ep 0 and swair derived from the depth absorbed dose curves. The calibration is based on these parameters. The depth absorbed dose curves derived from the depth ionization curves are comparable to those measured with the silicon detector. The constancy check of the depth absorbed dose measured with the silicon detector was done annually. The results show that the quality o f the electron beams remained constant during the three year period.

430 SURIYAPEE et al.
TA BLE I. ELECTRON BEAM PARAMETERS
6
N o m in a l e n e rg y (M e V )
9 12 16 20
я ,00 (c m ) 1 .4 2.0 3 .0 2 .5 1.6
во'w'о 2 .5 3 .7 5 .1 6.8 8 .4
R p (c m ) 3 .1 4 .6 6.1 8.2 1 0 .4
£0 (M e V ) = 2.33RS0 5 .8 2 8 .6 2 11.88 1 5 .8 4 1 9 .5 7
Ep0 ( M e V ) = 0 .2 2 + 1 .9 8 Д р + 0 .0 0 2 5 t fp2 6 .3 8 9 .3 8 1 2 .3 9 1 6 .6 2 2 1 .0 8
w.air 1 .0 7 9 1 .0 5 6 1 .0 4 4 1.001 0 .9 7 3
TA BLE П. COMPARISON OF ABSORBED DOSE (cGy/MU) AT DEPTH OF MAXIMUM DOSE FOR 10 cm X 10 cm FIELD AND 100 cm SSD FOR ELEC TRON BEAM S M EASURED B Y CHULALONGKORN HOSPITAL (CH) AND RADIATION PROTECTION SERVICES (RPS) DURING 1990-1992
E n e rg y(M e V )
1990 1991 1992
C H R P S D i f f . (% ) C H R P S D i f f . (% ) C H R P S D i f f . (% )
6 1 .0 0 9 0 .9 9 8 1.1 1 .0 3 0 1 .025 0 .5 1.022 0 .9 5 5 7 .0
9 0 .9 9 3 0 .9 7 5 1.8 1 .025 1.010 1.5 0 .9 9 3 0 .9 5 1 4 .4
12 1.000 0 .9 7 4 2 .7 1 .017 0 .9 9 8 1.9 1 .0 1 4 0 .9 9 8 1.6
16 1.000 0 .9 9 8 0.2 1 .033 1 .013 2.0 1.010 0 .9 7 6 3 .5
20 1.001 0 .9 9 0 1.1 1 .0 3 0 0 .9 9 5 3 .5 1.020 0 .9 7 9 4 .2
3 .2 . Calibration o f electron beams
Table П shows the results, obtained over three years, for dose (calibrated in terms of centigrays per monitor unit) from the electron beams of 6 , 9 , 12, 16 and 20 MeV with 10 cm X 10 cm field and 100 cm SSD. The results o f the first two years show that the absorbed dose determined by the hospital was higher than the RPS value by 0 .2 -3 .5 % . In the third year, the discrepancy rose to as high as 7% for the 6 MeV electron beam. We doubted that the discrepancies were due to the use o f different factors by the RPS for calculation or to the effect o f different phantoms.

IAEA-SM-330/51 431
TA BLE Ш. COMPARISON OF ABSORBED DOSE (cGy/MU) OF ELECTRON BEAM S M EASURED B Y CHULALONGKORN HOSPITAL IN RPS W ATER AND PO LYSTYREN E PHANTOMS
Energy(MeV)
Polystyrenephantom
Waterphantom
Diff.(%)
6 1.0 20 0.974 4.7
9 0.980 0.966 1.4
12 1.027 1.013 1.4
16 1.005 0.985 2 .0
20 1.0 2 0 0.997 2.3
TA BLE IV. COMPARISON OF ABSORBED DOSE (cGy/MU) OF ELECTRON BEAM S M EASURED IN BDS-3 W ATER PHANTOM SCANNER AND PO LYSTYREN E PHANTOM
Energy Polystyrene Water Diff.(MeV) phantom phantom (%)
6 1 .0 10 0.992 1.8
9 0.974 0.963 1.5
12 1.018 1.017 0
16 0.999 0.979 2 .0
20 1.0 0 2 0.973 3.0
Therefore measurements were done in the RPS water phantom and in the polystyrene phantom by the hospital with the same parallel plate chamber. The results given in Table in show a 1 .4-2 .3% higher dose in the polystyrene phantom than in water, except for the 6 MeV electron beam which gave rise to a discrepancy of 4 .7% .
When measurements were done again in the BDS-3 water phantom scanner, the results (Table IV) showed a maximum discrepancy of 3 % for all electron beam energies. The discrepancy was reduced to 1.8% for the 6 MeV beam. With the position of the chamber in the water phantom precisely known and the corrected position o f the polystyrene phantom equivalent to the depth in water, the absorbed doses

432 SURIYAPEE et al.
determined in the polystyrene phantom are comparable to those determined in the water phantom. The polystyrene phantom could be used for the calibration of electron beams, as many protocols recommend [1-3]. Some correction factors would be added for a non-water phantom. A solid phantom has the advantage that the depth of the chamber can be set and measured more accurately.
4. DISCUSSION AND CONCLUSIONS
The depth absorbed dose curves determined with the silicon detector are similar to those derived from the depth ionization curves measured by the parallel plate ionization chamber, so in 1991 and 1992 we checked the quality o f the beams by measuring depth absorbed dose with the silicon detector. The quality of the beams did not change during the three years, so the parameter for calibration would be constant.
The absorbed doses determined by the hospital and the RPS agreed to within 3.5% in the first two years, but in the third year the difference rose to 7% for the 6 MeV electron beam and to as high as 4.4% for the other energies. The discrepancy between the absorbed doses measured in the polystyrene phantom and the RPS water phantom with the hospital chamber was then reduced from 7% to 4.7% for the 6 MeV electron beam and from a maximum of 4.4% to 2.3% for the other energies.
The calibration procedures and calculation methods of the hospital and the RPS are similar. The factors used by the RPS were obtained from the hospital and the IAEA Code of Practice. These factors should not lead to the observed difference in the absorbed doses determined by the two institutes.
The cause of the output discrepancy was suspected to be the difference in the depth of the chamber in the polystyrene phantom and the water phantom for each electron energy. The RPS water phantom was examined. It is a home made water phantom with a holding arm which supports a chamber. By moving the holding arm, the scale attached to the edge of the water phantom can be read to determine the position of a chamber in water. It was found that part o f the holding arm was broken and this was repaired. When a chamber was inserted into the holding arm, it was not parallel to the surface o f the phantom. As the scale reading was calibrated when a chamber was properly fitted into the water phantom, the exact position o f the chamber relative to the surface o f the water phantom could not be determined correctly from the scale reading, which resulted in an error in the output measurement. The lower output in water predominated at low electron energies, especially 6 MeV. The depth absorbed dose curve o f the low energy electron beam shows a narrow peak of maximum dose. When the measurement point was displaced from the depth of maximum dose, the output would be changed. The high electron energies showed a smaller discrepancy in output because the depth dose curve has a broader peak of maximum dose.

IAEA-SM-330/51 433
To determine the position of a chamber in the polystyrene phantom, the depth must be corrected for the non-water phantom. In addition, the 2 mm thickness o f the watertight cover which fitted the parallel plate chamber in the water phantom must be considered. When the depth in the polystyrene phantom was equivalent to the depth of the water phantom, the discrepancy in absorbed dose determined with the two types o f phantom was low. The absorbed dose measured in the BDS-3 water phantom scanner agreed with that measured in the polystyrene phantom to within 3% .
A problem associated with measurement in a polystyrene phantom is charge buildup [4], which results in a continuous increase o f the meter reading. After a number o f measurements, the maximum reading can be as much as 1 % higher than the first reading. To avoid this problem, the phantom should be discharged after two readings and the first reading should be ignored. In addition, the polarity effect was as high as 1.5% , so readings from the two polarities o f - 2 5 0 and + 250 V were averaged.
The polystyrene phantom is good for making a constancy check of the output and energy of the electron beams. Calibration of the electron beams could be done using a polystyrene phantom, with the results comparable to calibration in a water phantom. However, the position of the chamber in the polystyrene phantom must be equivalent to the position of a chamber in the water phantom and some corrections have to be made to convert the measurements to those that would have been obtained in the water phantom.
R E F E R E N C E S
[1 ] I N T E R N A T IO N A L A T O M I C E N E R G Y A G E N C Y , A b s o rb e d D o s e D e te rm in a t io n in P h o to n a n d E le c tro n B ea m s : A n In te rn a t io n a l C o d e o f P ra c tic e , T e c h n ic a l R e p o rts S eries N o . 2 7 7 , I A E A , V ie n n a (1 9 8 7 ).
[2 ] A M E R I C A N A S S O C IA T IO N O F P H Y S IC IS T S I N M E D IC IN E , A p ro to c o l f o r th e d e te rm in a t io n o f a b so rb e d do se f r o m h ig h -e n e rg y p h o to n an d e le c tro n be am s, M e d . P h y s . 1 0 (1 9 8 3 ) 7 4 1 -7 7 2 .
[3 ] H O S P IT A L P H Y S IC IS T S ’ A S S O C IA T IO N , C o d e o f p ra c t ic e fo r e le c tro n b e a m d o s im e try in ra d io th e ra p y , P h y s . M e d . B io l . 3 0 (1 9 8 5 ) 1 1 6 9 -1 1 9 4 .
[4 ] M A T T S S O N , L . O . , S V E N S S O N , H . , C h a rg e b u ild -u p e ffe c ts in in s u la t in g p h a n to m m a te r ia ls , A c ta R a d io l . , O n c o l. 2 3 (1 9 8 4 ) 39 3 .


IAEA-SM-330/38
COMPARISON OF TWO STANDARD DOSIMETRY PROTOCOLS FOR OUTPUT CALIBRATION OF 60Co TELETHERAPY MACHINES
C. TANNANONTA, V. BOONKITTICHAROEN,T. LAYANGKUL, R. PIRABUL Department of Radiology,Ramathibodi Hospital,Bangkok, Thailand
Abstract
C O M P A R IS O N O F T W O S T A N D A R D D O S IM E T R Y P R O T O C O L S F O R O U T P U T C A L IB R A T I O N O F 60C o T E L E T H E R A P Y M A C H IN E S .
T w o p ro to c o ls fo r o u tp u t c a lib ra t io n o f 60C o te le th e ra p y m a ch in e s w e re s tu d ie d in tw o steps. In th e f i r s t s tep , tw o m e th o d s fo r t im e r e r ro r d e te rm in a tio n w e re s tu d ie d b o th in a i r and in w a te r : th e tw o -e x p o s u re m e th o d w ith th e s h o rt e x p o s u re t im e ra n g in g in v a lu e f r o m fs = 0 .1 iL to i s = 0 .7 fL , w h e re tL is th e lo n g e x p o su re t im e ; and th e s in g le /m u lt ip le e x p o su re m e th o d w ith th e n u m b e r o f e x p o su re s ra n g in g f r o m n = 2 to n = 9. T h e re s u lts s h o w e d b e tte r p re c is io n fo r th e tw o -e x p o s u re m e th o d w ith s m a lle r ra t io s o f ts to tL an d fo r th e s in g le /m u lt i- p le e x p o s u re m e th o d w ith th e g re a te r n, a n d a lso s h o w e d b e tte r p re c is io n fo r in -a ir th a n in w a te r m e asu re m en ts in b o th p ro to c o ls . A c o m p a r is o n w as m a d e b e tw e e n th e tw o -e x p o s u re p ro to c o l w ith i s = 0 .2 tL, 0 .3 tL and 0 .5 fL and th e s in g le /m u lt ip le e x p o su re p ro to c o l w ith n = 6. In - a ir m e asu re m en ts s h o w e d th e best re s u lts w ith i s = 0 .2 fL in te rm s o f b o th p re c is io n a n d de ca y con s ta n ts e s tim a te d f r o m th e re g re s s io n o f e xp o su re ra te a g a in s t t im e . In the second step , th e p ro to c o l w ith n = 6 w as used in c o m p a r in g th e o u tp u t v a lu e m e asu re d in a ir w ith th a t m e a su re d in w a te r . T h e do se ra tes a t 5 cm d e p th in w a te r d e te rm in e d b y these tw o m e th o d s o f m e a s u re m e n t w e re c o m p a ra b le to w ith in + 0 .5 % .
1. INTRODUCTION
In view of the significance of increasing the accuracy of dosimetric procedures for improvement o f treatment efficacy, investigations were carried out to gather important information for defining a practical standard protocol which would yield accurate output estimates for ^Co teletherapy machines in our institution. The primary objectives were: (a) to define by experiment a standard procedure from which the most reliable output estimate could be derived; and (b) to compare the accuracy and feasibility of in-air and in-water calibration of the output.
4 3 5

436 TANNANONTA et al.
It was hypothesized that the reliability o f output measurement was strongly dependent on how well one designed a procedure to obtain an accurate estimate of timer error, assuming that all dosimetric instruments were periodically tested. The principle o f error propagation as proposed by Knoll [1] was applied in improving the precision of timer error determined by the two-exposure and single/multiple exposure methods [2 ].
Although in-water measurement at 5 cm depth is recommended by the Hospital Physicists’ Association [3] and the International Atomic Energy Agency [4] to determine the output o f 60Co teletherapy units, output calibration in air is still commonly made in Thailand. An experiment was done to estimate the discrepancy between the doses at 5 cm depth in water as determined by in-air and in-water measurements.
2. EXPERIM EN TAL PROCEDURES AND RESULTS
A Capintec ionization chamber with a volume of 0 .6 cm 3 and 3.22 mm inner radius was used to measure the output from two ^C o teletherapy machines, a Siemens Gammatron-3 and an AECL Theratron-780.
2 .1 . Tim er error determination
Two methods for determination of timer error, the two-exposure method and the single/multiple exposure method proposed by Orton and Seibert [2], were used in this experiment. The timer error e of the former method was calculated from
tsM L - tLM se = --------------------- ( 1 )
Ms - ML
where t and M are the exposure time and meter reading and subscripts s and L stand for short and long exposure time. For the latter method, e was calculated from
e = KM, - Mn m )
Mnff/n) - nM,
where M, and Mn(t/n) are the meter readings for a single exposure time t and n integrated exposures each of exposure time t/n.
In the first step, the timer errors of the Theratron-780 were determined by the two-exposure method with ts ranging in value from 0 .1 iL to 0 .7 iL and by the single/multiple exposure method with n = 2 to n = 9 from both in-air and in-phantom measurements. Then the error propagation proposed by Knoll [1] was

IAEA-SM-330/38 437
í . ' íl
FIG. 1. Percentage precision of timer errors determined by two-exposure method.
N u m b e r o f t im e fra c tio n s
FIG. 2. Effect of time fractionation on reliability of timer error determination (single/multiple exposure method).

438 TANNANONTA et al.
TA BLE I. TIM ER ERRORS AND DECAY CONSTANTS DETERMINED BY TW O-EXPOSURE AND SINGLE/MULTIPLE EXPOSURE PROTOCOLS FOR SIEM ENS GAMMATRON-3 AND AECL THERATRON-780 60Co TELETHERAPY UNITS
G a m m a tro n -3 T h e ra tro n -7 8 0
T im e r e r ro r 1 02X a (m in + S D (% ) ) (m o n th -1)
E r r o r b
(% )
T im e r e r ro r (m in + S D (% ))
1 02X a(m o n th -1)
E r r o r b
(% )
Two-exposure methodts = 0.2tL 0 .0 1 4 + 2 .1 4 1 .0 9 6 + 0 .0 9 0 .0 1 5 + 3 .3 3 1 .054 + 3 .9 2
ts = 0 .3 tL 0 .0 1 4 ± 5 .0 0 1 .083 + 1 .28 0.010 + 6.68 1 .083 + 1 .2 8
ts = 0 .5 i L 0 .0 1 1 + 8 .1 8 1 .147 - 4 . 5 6 0 .0 1 4 ± 7 .8 5 1 .117 - 1 . 8 2
Single/multiple exposure methodn = 6 0 .0 1 3 ± 3 .0 8 1 .1 5 9 - 5 . 6 5 0 .0 1 6 + 2 .5 0 1 .0 1 3 + 7 .6 6
a X is th e o b s e rv e d de ca y ra te c o n s ta n t fo r “ C o , e s tim a te d f r o m th e re g re s s io n o f e x p o su re ra te a g a in s t t im e . (T h e o re t ic a l v a lu e XCo = 1 .0 9 7 x 1 0“2 m o n th -1 .)
b E r r o r = [ ( \ Co - X ) /X Co] x 100.
applied in calculating the precision of the timer errors. The results for the percentage precisions from these exposure methods are shown in Figs 1 and 2. The plots show better precision for the two-exposure method with smaller ratios of ts to tL and for the single/multiple method with a greater number of exposures and show better precision with in-air measurements for both methods.
Further experiments were designed to study specifically the exposure times that showed quite good precision of timer error determination in order to set a reliable and practical protocol. In these experiments, the output measurements in air of both 60Co machines were made by using timer error determination with ts = 0 .2 fL, 0.3fL and 0.5?L for the two-exposure method and n = 6 for the single/ multiple exposure method. Then the decay constants of both machines were estimated from the regression of ten exposure rates against time in both protocols and compared with the theoretical value of 60Co as shown in Table I. Since the precisions of the temperature and pressure correction factors in these output measurements were only 0 .03-0 .07% and the relative sensitivity of the dosimeter used was within ± 0 .6 %, the reliability of the output values mainly depends on the precision of the timer error determination. Table I shows that the two-exposure protocol with ts = 0 .2 rL yielded the best results.

IAEA-SM-330/38 439
2 .2 . Comparison o f in-air and in-water output calibrations
The output o f the Theratron-780 for a 10 X 10 cm 2 field size at 80 cm fromthe source (source-axis distance (SAD) of the machine) and at 5 cm depth in waterwas determined by in-air and in-water measurements. The single/multiple exposure (n = 6 ) protocol was used in both sets o f measurements.
The mean value of three meter readings from the measurements in air was corrected for timer error, temperature and pressure, and exposure calibration factor (Nx) to yield the exposure rate X in air (C -kg"1 -m in '1).
Then the Attix equation [5] for determination of the absorbed dose in an equilibrium sphere of water in free space from the exposure dose and the tissue-air ratio (TAR) for a 10 X 10 cm2 field size at 5 cm depth in water [6 ] were used to calculate the absorbed dose rate in water, D w (Gy/min), as
Before making measurements in the water phantom, the ambient and inphantom (in the Perspex sleeve for chamber insertion) temperatures were recorded hourly and plotted as shown in Fig. 3. This figure shows in the short term plot that in the first 2 h the phantom temperature dropped with a mean rate o f 0 .3 5 °C/h and for the second period of 2 -7 h at 0.15°C/h. The long term plot shows that the phantom temperature remained stable and equal to the room temperature after 24 h.
In accordance with the result of this investigation, the water phantom should be left in the treatment room at least 24 h before making measurements for temperature stabilization so that the ambient temperature can be used to represent the temperature in the phantom or chamber.
The in-water measurements were made with the centre of the chamber at 5 cm depth and 80 cm SAD to reduce the error introduced by the distance setting. Since the chamber inner radius is 3 .22 mm, the effective point o f measurement was at a distance of 79.84 cm and at 4 .84 cm depth in water. TARs for 4.84 and 5 cm depths[6 ] and the inverse square law were applied to the average meter reading to yield the value for 80 cm SAD with 5 cm depth. Dw (Gy/min) at the effective point of measurement was calculated by using the IAEA Code of Practice [7]:
Four sets of dose rate measurements in air and in water were performed and the results, including the in-water to in-air ratios, are shown in Table П. The dose rates determined in water and in air were nearly the same (within + 0 .5 % ). Table II also shows in brackets the dose rates o f the first three measurements corrected by decay factors for the last measurement date. When these values were averaged over the four measurements, the means for the in-water and in-air measurements were found to be equal (52.13 cGy/min).
D w = 37.4 X TAR ¿ 5 (3 )
^w(Peff) Mu Nf) Swiurp u (4 )

440 TANNANONTA et al.
Long term
m 9 m ln -p h a n to m
34c— >|c— >(< A m b ie n t
T im e fo r e q u ilib ra tio n (h)
FIG. 3. Equilibration of ambient and in-phantom temperatures.
TA BLE П. DOSE RATES (cGy/min) FOR 10 X 10 cm 2 FIELD SIZE AT 80 cm SAD WITH 5 cm DEPTH IN W ATER OF THE AECL THERATRON-780 AS DETERMINED B Y IN-AIR AND IN-WATER MEASUREMENTS (The values in brackets are the dose rates corrected fo r decay to the last measurement date.)
D a te o f m e a s u re m e n t In -w a te r In -a irIn -w a te r
In -a ir
3 0 Sep. 1990 7 2 .3 2 + 0 .0 7 7 2 .1 1 ± 0 .1 3 1 .0 0 2 9(5 2 .3 5 ) (5 2 .2 1 )
2 D e c . 1990 7 0 .4 0 ± 0 .0 5 7 0 .5 2 ± 0 .1 3 0 .9 9 8 3(5 2 .1 4 ) (5 2 .2 3 )
2 6 F e b . 1991 6 7 .8 5 + 0 .0 5 6 8 .1 3 ± 0 .0 5 0 .9 9 5 9(5 1 .8 3 ) (5 2 .0 4 )
14 M a r . 1993 5 2 .1 9 ± 0 .0 8 5 2 .0 5 ± 0 .0 2 1 .0 0 2 7

IAEA-SM-330/38 441
In the timer error determination, the two-exposure method with smaller ratios o f is to tL showed better results, in agreement with the experiment of Orton and Seibert [2]. The multiple exposure method with n — 6 showed comparable results with the two-exposure method for ts = 2tL. However, it seems that the two- exposure method (ts = 2tL) is more practical for the determination of timer error if a linear response chamber and electrometer are used since less time is needed.
The results o f the determination of in-air and in-water output for 60Co machines from our experiment disagree with the study of Grant et al. [8] because different values of some factors were used, i.e. the/factor (for the conversion from rôntgens to rads), displacement factor, depth dose table and effective point of measurement.
From the results of this study and our experience, in-air measurement still remains an attractive procedure for 60Co units, for four main reasons. Firstly, the dose rate obtained is more or less equal to the rate obtained by in-water measurement. Secondly, the number of man-hours could be a limiting factor for many hospitals in Thailand. Thirdly, it takes a very long time (24 h) for the temperature in the phantom to decrease to the treatment room temperature. Fourthly, the type of water,i.e. distilled or de-ionized, used in the measurement is not easily obtained. Tap water, though easily available, was far from ideal as a phantom material in output calibration since it was found to absorb nearly 1% of the radiation. Furthermore, in a humid country like Thailand, there may be the additional problem of humidity for in-water measurement if this takes a long time.
3. DISCUSSION AND CONCLUSION
R E F E R E N C E S
[1] KNOLL, G.H., Radiation Detection and Measurement, Wiley, New York (1979) 131 pp.
[2] ORTON, C.G., SEIBERT, J.B ., The measurement of teletherapy unit timer errors, Phys. Med. Biol. 17 (1972) 198-205.
[3] HOSPITAL PHYSICISTS’ ASSOCIATION, A code of practice for the dosimetry of 2 to 35 MV X-ray and caesium-137 and ^Co gamma-ray beams, Phys. Med. Biol. 14 (1969) 1-8.
[4] MASSEY, J.B ., Manual of Dosimetry in Radiotherapy, Technical Reports Series No. 110, IAEA, Vienna (1970).
[5] ATTIX, F.H., Introduction to Radiological Physics and Radiation Dosimetry, Wiley, New York and Singapore (1986) 363 pp.
[6] Central axis depth dose data for use in radiotherapy, Br. J. Radiol., Suppl. 17 (1983) 50 pp.

442 TANNANONTA et al.
[7] INTERNATIONAL ATOMIC ENERGY AGENCY, Absorbed Dose Determination in Photon and Electron Beams: An International Code of Practice, Technical Reports Series No. 277, IAEA, Vienna (1987).
[8] GRANT, W.H., et al., Calibration in water versus calibration in air for cobalt-60 gamma rays, Med. Phys. 4 (1977) 68-69.

IAEA-SM-330/67
D O S E M E A S U R E M E N T S IN H IG H E N E R G Y
P H O T O N A N D E L E C T R O N B E A M S
U S IN G A N IO N IZ A T IO N C H A M B E R : IN T E R C O M P A R IS O N B E T W E E N T H E I T A L I A N P R O T O C O L A N D A W E L L T R IE D R O U T IN E P R O C E D U R E
S. BELLETT I, A. FIUM E, L. VERZELETTI,A. BOZZA, A. CAVALLIN Servizio di Física Sanitaria,Spedali Civili di Brescia,Brescia, Italy
Abstract
DOSE MEASUREMENTS IN HIGH ENERGY PHOTON AND ELECTRON BEAMS USING AN IONIZATION CHAMBER: INTERCOMPARISON BETWEEN THE ITALIAN PROTOCOL AND A WELL TRIED ROUTINE PROCEDURE.
A comparison between a routine dosimetric procedure, in use since the early 1970s, and the Italian Protocol has been carried out on the wide range of photon and electron energies available in the Radiotherapy Department of the Spedali Civili di Brescia. The first method consists of measurements in a PMMA phantom using a Farmer type ionization chamber, calibrated by comparison with the National Physical Laboratory (United Kingdom) reference system of the hospital, whose calibration factor was transferred by the Primary Standard Dosimetry Laboratory at the Ente per le Nuove Tecnologie, l’Energie e l ’Ambiente, in terms of exposure to “ Co radiation. Factors to convert a reading in PMMA, corrected for temperature and pressure and multiplied by a calibration factor, to dose in water were obtained from available published data and from direct measurements with an extrapolation chamber and were never changed, in order to have fixed reference values. The Italian Protocol (1988) defines conditions for making calibration measurements: they must be carried out in a water phantom; a specific ionization chamber (ESC/87, 0.24 cm3, graphite wall) is strongly recommended; the calibration factor is given in terms of dose in the air cavity; factors to convert dose in air to dose in water were calculated specifically for the recommended chamber and their values are all derived from direct measurements on actually used beams. The authors made a comparison between the routine method and the new Protocol: agreement of results was found to be always in the range of overall uncertainty, which means that the old procedure and old dosimetric data may be considered sufficiently accurate. Differences that were noticed (almost systematically underestimated dose values for photons and overestimated values for electrons) are in accordance with the results of a past discussion about the way of deriving exposure to dose conversion factors. To convert routine measurements in PMMA directly to dose in water, the authors deduced a factor that, in the case of electrons, shows a very regular trend and can be fitted with an analytic function.
443

444 BELLETTI et al.
Since the early 1970s, photon and electron beams from ^C o and accelerators have been available in the Radiotherapy Department o f our hospital and we have been using a routine dosimetric procedure based on our own experience [1 ] and the recommendations that were available at the time [2-4]. We never changed our procedure and we did not adopt any of the protocols that were published later, in order to have a fixed reference for the comparison of clinical data and because the basis o f different protocols was not at all stable. During that period, we took part in some intercomparisons, both national and within the Atomic Energy Commission, on photon and electron beams; the results were always satisfactory.
When the Italian Protocol [5], presented for the first time in 1987 at a meeting in Vienna [6 ], became available, we decided to adopt it and to compare the dose values given by the previous routine method with those obtained following the Protocol. We had two aims: the first was to verify our previous dose data; the second was to establish a conversion factor to convert from routine measurements in PMMA to dose in water for various energies and types o f radiation and assuming measurements with the Italian Protocol as reference values.
1. INTRODUCTION
2. M ATERIALS AND METHODS
2.1 . Beam qualities
W e made our measurements on six types o f photon beam, ranging from 5 to 18 MV nominal accelerating potential, and 16 types o f electron beam, ranging from 4 .5 to 24 MeV nominal energy (Table I).
2 .2 . Routine procedure
Our reference consisted o f a National Physical Laboratory (NPL, United Kingdom) 2560 electrometer with an NE 2561 ionization chamber (0.3 cm 3, graphite wall). It was calibrated at the Primary Standard Dosimetry Laboratory of the Ente per le Nuove Tecnologie, l ’Energie e l ’Ambiente (ENEA) in terms of exposure to ^C o radiation, with an overall uncertainty of ± 1 .5 % at the 95% confidence level.
As a routine system we always used a Farmer type ionization chamber of 0 .6 cm 3, with a suitable electrometer, and it was calibrated by comparison with the NPL reference, both chambers being exposed in a beam of our own ^C o unit, in a PMMA phantom of 20 x 20 X 12 cm 3 in which two appropriate holes were manufactured. In particular, in the last few years and in present work we have used a 2581 type (A-150 wall) ionization chamber connected with a Farmer 2570/1 electrometer, for which an uncertainty not larger than ± 2 .5 % in the calibration factor

IAEA-SM-330/67 4 4 5
TA BLE I. ACCELERATORS OPERATING AT THE SPEDALI CIVILI DI BRESCIA , ITA LY
Model TypePhotons:
Nominal accel. potential (MV)
Electrons: Nominal energy
(MeV)
Orion 33 (GE)
Linear 5 None
Orion 47 (GE)
Linear 5 None
Saturne 43 (GE)
Linear 6 , 1 0 , 18 8 energies: 4.5-24
MM 22 Microtron 6 , 10 9 energies: 5-22
was evaluated. The stability o f the systems is periodically checked with the help of a calibrated ^ S r source.
Routine dose measurements were made in a PMMA phantom of 30 x 30 x 15 cm 3, consisting o f slabs o f 3 cm thickness, one o f which had a removable block with a hole suitably shaped for our chamber. The position of the hole was chosen so that the chamber would be at the depth o f maximum dose for ^Co radiation; to reach the measurement depth for other radiation quantities thin slabs o f PMMA were added.
Measurements were made at a 1 m source-surface distance (SSD), at the depth o f maximum dose. Dose in water was derived from a measurement in PMMA as follows:
D = MNX C (1)
where M is the electrometer reading corrected for temperature and pressure, Nx is the calibration factor derived by comparison with the secondary standard and С is a conversion factor depending on the radiation quality (values from the literature of C\ for photons and CE for electrons were used). С values were taken from reports by the International Commission on Radiation Units and Measurements and other reports, compared and modified in accordance with our own experience. The same data were derived by using a PMMA extrapolation chamber and directly applying Spencer-Attix theory.

446 BELLETTI et al.
2 .3 . Italian Protocol
The Italian Protocol is based on the recommended use of an ESC/87 ionization chamber, designed for this purpose at ENEA [7] (graphite wall, 0 .2 cm 3 collecting volume). The electrometer must have some recommended characteristics, and in our case the NPL electrometer mentioned in Section 2 .2 was found suitable for the purpose, except for the power supply, which was furnished separately. The chamber is equipped with a waterproofing sheath and a water phantom has been constructed to allow its use.
The system was calibrated at the ENEA Primary Standard Dosimetry Laboratory in terms of absorbed dose in the air cavity. The calibration factor ND obtained at ^C o radiation is considered to be independent o f beam quality, and its overall uncertainty is ± 2 % at the 95% confidence level.
Dose in the water phantom is measured as:
D = MNd F (2)
where M is the electrometer reading corrected for temperature and pressure and F is the factor prescribed in the Protocol to convert from dose in air to dose in water, and depends on radiation quality.
The Italian Protocol tabulates Fx , for photon beams, as a function of TPR 2®; this quality index was determined directly from measurements with the recommended chamber in a square field of 1 0 x 1 0 cm 2 at a source-chamber distance of 1 m. FE, for electrons, is given as a function o f£ 0, the mean energy at the phantom surface, and of depth. £ 0 is proportional to the half-value depth for electrons, R50. When experimental depth dose curves are used, E0 may be set equal to 2.33Л50, whereas for depth ionization curves the relation £ 0 = 2.38/?50 must be used. Depth ionization curves were measured in 10 cm square electron fields, at 1 m SSD , and divergence correction was applied.
2 .4 . Some clarification about comparison measurements
When speaking of chamber position, we always mean the position o f the effective measurement point, which for water is considered to be shifted from the chamber centre towards the beam source by a distance d , equal to 0 .5 r for electrons and0 .75r for photons (1 and 1.5 mm for the ESC/87 chamber, r = 2 mm). We adopted analogous criteria for measurements in PMMA with the Farmer chamber, which has a 3 mm internal radius, giving shifts o f 1.5 and 2 .3 mm respectively. W e did not take into account possible differences due to the change of phantom material.
The reference point in water was fixed as that of maximum ionization, at 1 m SSD , for both electrons and photons. In the present work we decided to adopt this criterion, though different from the Italian Protocol recommendations for photons,

IAEA-SM-330/67 447
in order to make possible the comparison with our routine procedure, in which the point o f maximum ionization was always taken as a reference. All measurements were made in a 1 0 x 1 0 cm 2 field.
Finally, we included in our comparison also 4 .5 MeV electrons, though for this energy a plane parallel chamber should be used.
Each reading value consisted of the average o f at least two readings after 100 MU of irradiation; measurements with the two methods were made on the same day and as near as possible in time in order to minimize differences caused by monitor chamber response fluctuations.
3. RESU LTS AND DISCUSSION
The results are given in Tables П-IV . Table П presents results for photon beams: D P and D T are doses per monitor unit, in centigrays, as derived from the Italian Protocol and from the routine method. The results show that the percentage difference is usually less than 3% .
The average percentage difference is —1.6% , and this value can be used to derive a factor by which the electrometer reading M can be multiplied to obtain dose. W e called this factor CF and expressed it as the product o f Nx (the old exposure calibration factor), С (the old exposure to dose conversion factor) and 1.016 (the average deviation of previous data from new ones).
Tables HI and IV show the results for electron beams from the Saturne 43 and MM 22 respectively; D P and D t have the same meanings as for photons. The percentage difference is always within 2% , with the exception of the 4 .5 MeV beam from the Saturne 43 (+ 2 .2 % ).
The cumulative factor CF in the tables is used to obtain the dose in water from a measurement in PMMA with the Farmer dosimeter; it is simply the ratio o f D P and M, the reading per monitor unit, corrected for temperature and pressure. CF shows a quite regular energy dependence that allowed us to fit experimental data with an empirical function of the form:
CF = C, - C2 ln(£0C3 + 1) (3)
The best fit parameters were found to be: Q = 1.0490, C2 = 0 .046 31, C3 = 3.7967. The fitting function is shown in Fig. 1 (squares indicate the CF values in Tables HI and IV); with this function it is possible, in principle, to obtain CF for any electron energy.
The percentage differences are almost systematically negative for photons and positive for electrons. We have not tried here to give a detailed explanation of this behaviour, but underline that it is in accordance with the results o f a discussion that took place many years ago [8] about the different ways of deriving Cx and CE, which lead to dose underestimation for photons and overestimation for electrons.

448 BELLETTI et al.
TA BLE П. RESU LTS FO R PHOTON BEAMS (microtron beams in italics, linac beams in bold face)
QualityItalian
ProtocolRoutinemethod
Results of comparison
MV TPR^q F Z)P С DtDiff.(%)
CF
5 0.62 1.119 0.821 0.936 0.822 + 0 .1 0.967
6 0.68 1.114 1.019 0.93 1.009 - 1 .0 0.962
6 0.68 1.114 1.112 0.93 1.078 -3 .1 0.962
10 0.73 1.105 1.083 0.92 1.056 - 2 .5 0.952
10 0.74 1 . 1 0 2 0.957 0.92 0.938 - 2.0 0.952
18 0.77 1.092 0.957 0.91 0.945 -1 .3 0.942
TA BLE Ш. RESULTS FOR SATURNE 43 ELECTRON BEAMS
Energy Italian Routine Results of(MeV) Protocol method comparison
. , Mean at Nominalsurface F DP С A
Diff.(%)
CF
4.5 4.12 1.056 1.049 0.92 1.072 + 2 .2 0.918
7.5 7.16 1.041 1.002 0.89 1.018 + 1 .6 0.892
9 8.47 1.030 1.000 0.88 1.014 + 1.4 0.884
10.5 9.92 1.0 2 0 0.985 0.87 0.998 + 1.3 0.874
12 1 1 1.018 0.986 0.87 1.004 + 1.8 0.871
15 14 0.998 0.984 0.85 0.989 +0.5 0.862
18 17.11 0.984 0.982 0.85 1.000 + 1.8 0.850
24 22.09 0.972 0.980 0.83 0.983 + 1 . 1 0.843

IAEA-SM-330/67
TABLE IV. RESULTS FOR MM 22 ELECTRON BEAMS
449
Energy Italian Routine Results of(MeV) Protocol method comparison
. . Mean at Nominal
surfaceF DP С A
Diff.(%)
CF
5 5.38 1.053 1.045 0.91 1.065 + 1.9 0.910
7 6.97 1.043 1.027 0.89 1.033 + 0.6 0.901
9 8.88 1.030 1.029 0.87 1.037 + 1.8 0.879
1 1 10.97 1.018 0.921 0.87 0.921 0 .0 0.886
13 13 1 .0 10 1.024 0.86 1.032 + 0.8 0.869
16 15 0.993 1.037 0.85 1.041 +0.4 0.863
18 16.84 0.979 1.038 0.85 1.051 + 1.3 0.856
20 18.78 0.972 1.041 0.84 1.043 + 0 .2 0.855
FIG. 1. Factor to convert routine system reading in PMMA to dose in water as a function of mean entrance energy (electron beams) for a Farmer 2581 chamber connected to a Farmer 2570/1 electrometer: CF = C¡ — C2 In(E0C3 + 1).

4 5 0 BELLETTI et al.
The results o f the present work show that our old routine procedure may be considered sufficiently accurate, with a maximum difference from the reference protocol values o f 3% for photons and 2% for electrons. This is a good result for a routine and we believe that our previous dosimetric data may be accepted; moreover, the routine method may be used in the future for daily checks, with the new and more direct factors, for both photon and electron beams, using a practical and experimental procedure.
4. CONCLUSIONS
R EFE R E N C E S
[1] BELLETTI, S., TORNIELLI, G., Una camera di ionizzazione ad estrapolazione per dosimetría X, gamma e beta, Radiol. Med. 50 (1964) 900-913.
[2] AMERICAN ASSOCIATION OF PHYSICISTS IN MEDICINE, Protocol for dosimetry of X and gamma-ray beams with maximum energies between 0.6 and 50 MeV, Phys. Med. Biol. 16 (1971) 376-395.
[3] NORDIC ASSOCIATION OF CLINICAL PHYSICS, Procedures in radiation therapy dosimetry with 5 to 50 MeV electrons and roentgen and gamma rays with maximum photon energy between 1 and 50 MeV, Acta Radiol. 11 (1972) 603-623.
[4] INTERNATIONAL COMMISSION ON RADIATION UNITS AND MEASUREMENTS, Radiation Dosimetry: Electrons with Initial Energies Between 1 and 50 MeV, ICRU Rep. 21, Bethesda, MD (1972).
[5] ASSOCIAZIONE ITALIANA DI FISICA BIOMEDIC A, Protocollo per la dosimetría di base nella radioterapia con fasci di fotoni ed elettroni con Em¡u¡ fra 1 e 40 MeV, Notiz. AIFB 6 2 (1988).
[6] LAITANO, R .F., “ Outline of the Italian Protocol for photon and electron dosimetry in radiotherapy” , Dosimetry in Radiotherapy (Proc. Symp. Vienna, 1987), Vol. 1, IAEA, Vienna (1988) 23-35.
[7] LAITANO, R.F., GUERRA, A.S., QUIÑI, М., Characteristics of the ionization chamber recommended in the Italian Protocol for photon and electron dosimetry in radiotherapy, Phys. Med. 2 (1987) 83-92.
[8] NAHUM, A.E., GREENING, J.R ., Inconsistency in derivation of Cx and CE, Phys. Med. Biol. 21 (1976) 862-864.

IAEA-SM-330/24
CONSISTENT FORMALISM FOR KILOVOLT AGE X RAY DOSIMETRY
A .E. NAHUM, R .T . KNIGHT Joint Department o f Physics,Royal Marsden Hospital and
Institute o f Cancer Research,Sutton, Surrey,United Kingdom
Abstract
CONSISTENT FORMALISM FOR KILOVOLTAGE DOSIMETRY.The formalism for the dosimetry of low and medium energy X ray beams put forward
in the International Atomic Energy Agency (IAEA) Code of Practice has been carefully examined and some important clarifications are presented. It is shown that in the low energy range there are two possible routes to determining the dose at the surface. If the backscatter factor is expressed as a ratio of air kermas then the ratio of the mass energy absorption coefficient, water to air, (Sen/p)wair, must be evaluated for the primary plus scattered photon spectrum present at the water surface and will therefore be field size dependent. If, however, the backscatter factor is expressed as a ratio of water kermas then Qxen/p)w,air should be evaluated for the primary spectrum only, and hence is independent of field size. It is argued that the latter route is easier to follow in practice and should be adopted in future. Furthermore, the backscatter factor has been calculated as a water kerma ratio in recent Monte Carlo studies. In the medium energy range it is emphasized that the factors kQ and p áis (k and p u in the IAEA Code) are strictly corrections to air kerma, not to dose to water, and that the product kepdis should include a correction for the effect of the chamber stem. The (/¡en/p)w air value appearing in the final expression must be evaluated for the photon spectrum present in the undisturbed water phantom at the depth of the chamber centre. Consequently, the (/¿er/P)w,air values required in the two energy ranges are different: field size independent at low energies; depth and field size dependent at medium energies.
1. INTRODUCTION
For many years the dosimetry o f kilovoltage X ray beams was based on the so-called F factors [1], which converted from the calibration in exposure (in rontgens) to absorbed dose in water (in rads); this involved the energy per ion pair, W/e. Secondary standard ion chambers are now calibrated by standards laboratories in terms of air kerma (gray) instead of exposure. A formalism based on air kerma has been set out in the International Atomic Energy Agency (IAEA) Code of
4 5 1
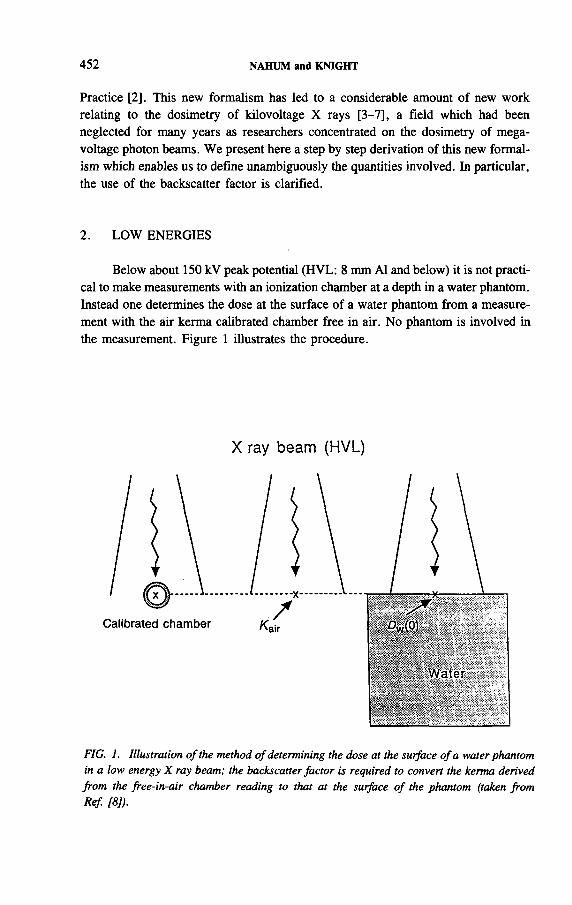
452 NAHUM and KNIGHT
Practice [2]. This new formalism has led to a considerable amount o f new work relating to the dosimetry o f kilovoltage X rays [3-7], a field which had been neglected for many years as researchers concentrated on the dosimetry of megavoltage photon beams. We present here a step by step derivation of this new formalism which enables us to define unambiguously the quantities involved. In particular, the use o f the backscatter factor is clarified.
2. LOW ENERGIES
Below about 150 kV peak potential (HVL: 8 mm Al and below) it is not practical to make measurements with an ionization chamber at a depth in a water phantom. Instead one determines the dose at the surface o f a water phantom from a measurement with the air kerma calibrated chamber free in air. No phantom is involved in the measurement. Figure 1 illustrates the procedure.
X ray beam (HVL)
FIG. 1. Illustration of the method of determining the dose at the surface of a water phantom in a low energy X ray beam; the backscatter factor is required to convert the kerma derived from the free-in-air chamber reading to that at the surface of the phantom (taken from Ref. [8]).

IAEA-SM-330/24 4 5 3
The IAEA [2] gave the following expression for the dose to water at the surface:
but did not explicitly define the backscatter factor B. It was stated that (Mei/P)w,a¡r corresponded to an average over the photon energy fluence distribution at the surface o f the phantom. The factor “ corrects for the difference in spectral distribution of the radiation field used for the calibration and that at the surface o f the phantom” [2]. No guidance was given in Ref. [2] on how values o f could be obtained. We set out below two alternative ways to derive Eq. (1) which make explicit the assumptions involved.
2 .1 . Route num ber one
Step 1: Conversion from air kerma free in air, (A ^ p , to air kerma at the phantom surface, ( Tair)s:
Here the backscatter factor has been written as £ air since Eq. (2) clearly defines this factor as a ratio o f air kermas [7]; the subscript p on K^T denotes that only the primary spectrum is involved.
Step 2: Conversion of air kerma at the surface, (ATair)s, to water kerma at the surface, (Kw)s:
Here GWp)w,air clearly has to be evaluated over the photon energy fluence spectrum present at the phantom surface (z = 0 ), and thus will be field size dependent; hence the (0, f ) in Eq. (3).
Step 3: The final expression for the dose to water at the phantom surface, (Dw)s, can then be written as
( 1 )
(^air)s (A-aiiOpAir (2 )
w,air(3 )
(4 )
where (/sTair)p in Eq. (2) has been replaced by (Mü)pNK and Dw has been equated to ATW. The latter step assumes that there is charged particle equilibrium; this is

454 NAHUM and KNIGHT
discussed in Section 2 .4 . Equation (4) should be compared to Eq. (1), taken from Ref. [2]. It is clear that В in Eq. (1) must be a ratio o f a ir kermas.
The factor in Eq. (1) does not appear in Eq. (4), which shows that this factor is not required. In principle one could include a correction factor for the difference between the free-in-air spectrum used at the standards laboratory to determine the NK factor o f the chamber and the spectrum at the clinic with the same HVL. However, this has not been done.
2 .2 . Route number two
An alternative route from air kerma to dose to water at the surface is now proposed.
Step 1: Instead of first converting to kerma at the surface as in Section 2 .1 , we convert from air kerma to water kerma, both free in air:
where GWP)w,air is evaluated over the primary X ray energy fluence spectrum and therefore has no field size or depth dependence. Strictly the above expression only applies to a ratio o f collision kermas; for (full) kerma the energy transfer coefficient ratio should be used but there is no practical difference between and /xen at kilovoltage energies owing to the entirely negligible bremsstrahlung production in water or air by the secondary electrons.
Step 2: Conversion from water kerma free in air to that at the phantom surface:
where Bw is the relevant backscatter factor, here defined as a ratio o f water kermas.
Step 3: The absorbed dose to water at the phantom surface can now be obtainedfrom
(5 )
(tfw)s = (Kw)pBw (6)
( 7 )
which was arrived at in a similar way to Eq. (4).
IAEA-SM-330/24 455
2 .3 . W hich route should one take?
New theoretical values o f the backscatter factor are now available [7, 9] and these have been shown to be in good agreement with recent experimental measurements [5, 10]. When the backscatter factor is calculated by the Monte Carlo method one can equally easily compute £ air or fiw. In fact, Grosswendt [9] and Knight [7] have given extensive sets o f Bw for a wide range o f HVL values and field sizes. The IAEA [2] gave a table o f В values taken from Grosswendt [11] and stated in the table heading that В was defined as an air kerma ratio. However, Grosswendt [11] gave values for B w , B Pm m a . etc., but not for B air; hence it is not clear that В values in Ref. [2] really are a ir kerma ratios.
The (/¡ei/p)w,airterm in Eq- (7) has no field size dependence as it is evaluated over the primary fluence spectrum existing free in air. Thus only one table o f values o f this quantity is required. New calculations o f this quantity for a range of spectra are now available [12]. The second route is therefore recommended and has been adopted in Ref. [5].
2 .4 . The C PE assumption
In Eqs (4) and (7) it has been assumed that the dose to water at the surface is given by the water kerma at the surface. This is equivalent to assuming that there is charged particle equilibrium (CPE). Strictly speaking this is impossible exactly at the surface. Even in kilovoltage beams there will be a buildup region, although the submillimetre ranges o f the secondary electrons involved make this virtually impossible to measure. In practice (Dw)s in Eqs (4) and (7) can be interpreted as the dose at the minimum depth at which CPE is achieved. The very small amount o f photon attenuation over this depth is thus neglected [13].
Finally, no perturbation due to the measuring instrument is involved in this procedure, in contrast to that at medium energies (see below). The chamber is merely being used as a means o f determining air kerma at a point in the user’s beam. I f it is assumed that the photon spectrum at the standards laboratory is the same as that o f the user’s beam at the same HVL then the construction details o f the chamber are irrelevant.
3. MEDIUM ENERGIES
At higher energies (HVLs between 8 mm AI and 4 mm Cu) the chamber is placed at a depth in the phantom and measures the dose at that depth, rather than at the surface. The IAEA Code [2] followed the International Commission on Radiation Units and Measurements [1] in recommending a depth of 5 cm. The Institute o f Physical Sciences in Medicine [5] has suggested that 2 cm would be a

456 NAHUM and KNIGHT
more practical depth as X ray beams in this quality range are very severely attenuated over a depth o f 5 cm and the magnitude of the dose at 5 cm rarely has any clinical significance.
3 .1 . Ion cham ber as air kerm a meter
Ion chambers do not behave as Bragg-Gray cavities in kilovoltage X ray beams owing to the extremely short range of the secondary electrons; this has recently been explicitly demonstrated in a Monte Carlo study [14]. Consequently one cannot use the same formalism as for megavoltage radiation, i.e. the ND factor and the stopping power ratio [2]. Instead the chamber is treated as an exposure or a ir kerma m eter [ 1 ], i.e. its reading is interpreted as measuring air kerma at a depth in the phantom.
3 .2 . Correction factors
The conversion from air kerma calibration to absorbed dose at depth is not so straightforward as corrections must be made for the effect o f the difference between the spectrum incident on the chamber at the free-in-air calibration and that at the depth of measurement as well as the perturbation caused by the introduction of the chamber into the medium. As with low energies, we shall split the derivation of the absorbed dose to water into several explicit steps.
As the IAEA Code [2] states very clearly, when the chamber is placed at a depth in the phantom, the product MJ^K corresponds to the air kerma at the centre o f a hole in the phantom whose outer dimensions are equal to those o f the outside o f the chamber wall, assuming that the spectrum incident on the chamber is identical to that at calibration. In practice this will not be the case. Both the energy and angular distributions o f the photons at a depth in water will differ from those for the free-in-air situation, owing to filtration of the primary spectrum as well as scatter. The IAEA [2] therefore introduced the factor ku, which we prefer to denote by kQ, to correct for this effect.
Step 1: Conversion from air kerma free in air to air kerma at the centre o f a hole in water at the position of the chamber centre:
(^air)hole = (^air)p^e (8)
The IAEA [2] discussed the numerical value of k and suggested that it could be taken as unity for those chambers with a flat calibration curve, i.e. o f NK against HVL. However, the difference in radiation quality between the free-in-air situation and that at a depth in a phantom is not equivalent to that between beams of different HVL but both free in air. The angular distribution changes markedly owing to scatter

IAEA-SM-330/24 4 5 7
in the former comparison, but not in the latter. This assumption about being unity must therefore be questioned (K. Hohlfeld, private communication).
The next step is to ‘put the water back into the hole’ . This means correcting for the effect o f the extra attenuation and the extra scatter generated by this volume of water, which would be a cylinder in the case o f a cylindrical (e.g. Farmer) chamber. The IAEA [2] introduced the factor pu to correct for this. We prefer to denote it by p tus in order to emphasize that this is a displacement correction. Thus we have:
Step 2: Conversion from air kerma at the centre o f a hole to air kerma at the position of the chamber centre (depth z) in the undisturbed water medium:
(^ a ir )z — (^air)holePdis (9 )
It should be noted that Eq. (9) defines p ils as a ratio o f air kermas. It is exactly the same factor as the one that Cunningham and Sontag [15] calculated analytically for ^C o 7 rays using first scatter from the Klein-Nishina cross-section [8 , 16]. It is physically quite distinct from the correction for the finite size o f the air cavity employed in the megavoltage photon dosimetry formalism [2 ], which treats the chamber as a Bragg-Gray cavity and hence deals with perturbations o f electron fluence, not kerma.
Step 3: The conversion from air kerma to water kerma at depth z is effected by
where the dependence o f (/¡ei/P)w,air on depth (z) and field size (f) has been made explicit.
Step 4: Finally, by equating dose to water with water kerma and replacing (^air)p by the product (M ^ZNK, the expression for absorbed dose to water becomes
which is essentially the same as that given as Eq. (13) in Ref. [2].There has been a great deal o f controversy about the numerical values for the
product fcgPdis for chambers in common use [3-6]. A summary of the current situation and a set o f the values for the NE 2571 Farmer chamber can be found in Ref. [15]. The product kQp ^ should include a correction for the difference in the effect o f the chamber stem on the chamber response between the free-in-air calibra-
( 1 0 )
( I D

458 NAHUM and KNIGHT
tion geometry and the irradiation at a depth in the phantom [4, 15]. Thus one can write [15]:
^QPiis (/Cg /?(]is) stemless stem ( 1 2 )
where &stem is a global correction factor for the stem effect.
4 . SUM M ARY AND CONCLUSIONS
The air kerma based formalism for low and medium energy X ray dosimetry put forward in the IAEA Code [2] represented a major advance over the previous F factor based formalism [1]; for the first time the various correction factors were made explicit. In this paper the new formalism has been ‘put under the microscope’ through the device o f a step by step derivation of the various expressions. It is shown that at low energies, when only a free-in-air measurement is involved, Qimlp) w ,air
need only be evaluated over the primary photon spectrum, thus removing any field size dependence. In this case the backscatter factor must be a water kerma ratio (Eq. (7)). Values o f (/xen P)w,air for the primary spectrum only are given in Ref. [12] together with the field size and depth dependent values for use at medium energies.
At medium energies the chamber is placed at a depth in a phantom and acts as an air kerma meter, not as a Bragg-Gray cavity. The two correction factors, renamed here kQ and />dis, are both defined as air kerma ratios. The product kQp áis should also account for the effect o f the chamber stem, which will be different between the free-in-air and depth-in-phantom situations. The quantity (/¿ei/p)w,air must be evaluated for the particular field size and depth of measurement, for a given HVL.
ACKN OW LEDGEM EN T
A .E.N . acknowledges the support o f the Cancer Research Campaign, United Kingdom.
R EFE R E N C E S
[1] INTERNATIONAL COMMISSION ON RADIATION UNITS AND MEASUREMENTS, Measurement of Absorbed Dose in a Phantom Irradiated by a Single Beam of X or Gamma Rays, ICRU Rep. 23, Bethesda, MD (1973).
[2] INTERNATIONAL ATOMIC ENERGY AGENCY, Absorbed Dose Determination in Photon and Electron Beams: An International Code of Practice, Technical Reports Series No. 277, IAEA, Vienna (1987).

IAEA-SM-330/24 459
[3] SEUNTJENS, J ., THIERENS, H., VAN DER PLAETSEN, A., SEGAERT, 0 . , Determination of absorbed dose to water with ionization chambers calibrated in free air for medium-energy X-rays, Phys. Med. Biol. 33 (1988) 1171-1185.
[4] SEUNTJENS, J . , Comparative Study of Ion Chamber Dosimetry and Water Calorimetry in Medium-Energy X-ray Beams, PhD Thesis, Univ. of Ghent (1991).
[5] Report of the Institute of Physical Sciences in Medicine Working Party on Low- and Medium-Energy X-ray Dosimetry, Phys. Med. Biol. 36 (1991) 1027-1038.
[6] ROSSER, K., Measurement of Absorbed Dose to Water for Medium-Energy X-rays, NPL Rep. RSA(EXT)33, NPL, Teddington, UK (1992).
[7] KNIGHT, R.T., Backscatter Factors for Low- and Medium-Energy X-rays Calculated by the Monte Carlo Method, Rep. ICR-PHYS-1/93, Joint Department of Physics, Royal Marsden Hospital and Institute of Cancer Research, Sutton, UK (1993).
[8] NAHUM, A.E., “Low- and medium-energy X-ray dosimetry” , teaching lecture presented at ESTRO Physics Mtg, Budapest, 1991, Rep. ICR-PHYS-1/91, Joint Department of Physics, Royal Marsden Hospital and Institute of Cancer Research, Sutton, UK (1991).
[9] GROSSWENDT, B ., Dependence of the photon backscatter factor for water on source- to-phantom distance and irradiation field size, Phys. Med. Biol. 35 (1989) 1233-1245.
[10] KLEVENHAGEN, S.K., Experimentally determined backscatter factor for X-rays generated at voltages between 16 and 140 kV, Phys. Med. Biol. 34 (1989) 1871-1882.
[11] GROSSWENDT, B ., Backscatter factor for X-rays generated at voltages between 10 and 100 kV, Phys. Med. Biol. 29 (1984) 579-591.
[12] KNIGHT, R.T., NAHUM, A.E., IAEA-SM-330/17, these Proceedings.[13] GREENING, J.R ., Fundamentals of Radiation Dosimetry, Hilger, Bristol (1981).[14] MA, C.-M., NAHUM, A.E., Bragg-Gray theory and ion chamber dosimetry in photon
beams, Phys. Med. Biol. 36 (1991) 413-428.[15] CUNNINGHAM, J.R ., SONT AG, M.R., Displacement corrections used in absorbed
dose determination, Med. Phys. 7 (1980) 672-676.[16] MA, C.-М., NAHUM, A.E., IAEA-SM-330/5, these Proceedings.


PLANE PARALLEL CHAMBERS(Session 7)
Chairm an
D .I. TH W A ITESUnited Kingdom
Co-Chairman
A. BURIANCzech Republic


IAEA-SM-330/60
Invited Paper
CALIBRATION OF PARALLEL PLATE IONIZATION CHAMBERS: STATUS OF THE AMERICAN ASSOCIATION OF PHYSICISTS IN MEDICINE PROTOCOLP.R . ALMONDJames Graham Brown Cancer Center,Louisville, Kentucky,United States o f America
A bstract
CALIBRATION OF PARALLEL PLATE IONIZATION CHAMBERS: STATUS OF THE AMERICAN ASSOCIATION OF PHYSICISTS IN MEDICINE PROTOCOL.
The paper deals with the calibration and use of plane parallel ionization chambers, and provides specific data for five commercial models: the Capintec PS-033, the Exradin P -ll, the Holt, the NACP and the PTW-Markus. It recommends that the primary means of calibrating such chambers is with high energy electrons at dm¡a in a phantom, intercomparing with a cylindrical chamber whose value has been obtained from a “ Co beam exposure or air kerma calibration traceable to the United States National Institute of Standards and Technology. A^^'is calculated following the procedure of the American Association of Physicists in Medicine (AAPM) 1983 Protocol. The electron beam energy must be high enough to ensure that pj is no smaller than 0.98 and is very close to unity. Pwall is assumed to be unity for both chambers. In general this will mean an incident electron beam energy of at least 18 MeV. Plane parallel chambers may also be calibrated in air at “ Co to obtain A^por jV£p: Values of N ^/(N xAion)p p' and A ap/(NA/lion)p'p' are given for the five chambers mentioned above. These values depend on buildup material of a thickness of 0.5 g/cm2 being added to the front chamber wall, with an outer diameter equal to that of the chamber. The buildup material to be used with each chamber is also listed. Calibration of plane parallel chambers at a depth of 5 g/cm2 in a phantom, using recommended values of РР'£Ь's also described as an alternative method. It has been shown that the values of Kcomp and Pwall recommended in the paper for calibrations in air or in phantom in a “ Co beam are in good agreement with a wide range of experimental data based on Ngis measurements in electron beams and on inair or in-phantom measurements. This good agreement implies that all three methods for determining /Vgas can be treated as equivalent. For plane parallel chambers other than the five considered in the paper, Ngas if required should be obtained by calibration in a high energy electron beam against a cylindrical chamber with known /Vgas, as recommended in the 1983 AAPM Protocol. The described procedure for applying plane parallel chambers in the calibration of electron beams closely follows this protocol. is assumed to be unity but Ppepj values for the Capintec and PTW-Markus chambers depend on electron energy. It is likely that the plane parallel chambers will be used in plastic phantoms for beam calibration purposes, and this protocol follows the AAPM Task Group 25 Protocol in the method of obtaining absorbed dose to water from absorbed dose to plastic.
463

464 ALMOND
This paper presents the recommendations o f Task Group 39 (TG-39) o f the Radiation Therapy Committee o f the American Association o f Phy sicists in Medicine (AAPM). TG-39 was charged with:
(a) Making specific recommendations for the calibration of plane parallel chambers,
(b) Providing guidelines for the determination of absorbed dose from electron beams using calibrated plane parallel chambers.
Although TG-39 has finished its work on the protocol this paper can only represent provisional recommendations since the review process within the AAPM is not yet completed. The final report as approved by the AAPM will appear in Medical Physics in the near future. This paper may not therefore represent the final recommendations o f the AAPM.
1. INTRODUCTION
2. THE CALIBRATION SYSTEM WITHIN THE USA
Radiation standards in the United States o f America are maintained at the National Institute o f Standards and Technology (NIST) in Gaithersburg, Maryland. Although air kerma (exposure) standards are maintained for a number o f X ray energies o f specified HVLs, the highest photon energy is that o f the y rays from “ Co, i.e. 1.25 MeV. No electron beam energies are currently available. An absorbed dose to water standard is also maintained at NIST for “ Со y rays.
In 1983, the AAPM published a protocol for the determination of absorbed dose from high energy photon and electron beams. This was the result o f the activities o f Task Group 21 of the AAPM Radiation Therapy Committee and the protocol has become popularly known as the ‘TG-21 Protocol’ [1]. The Protocol required an ionization chamber having a calibration factor for ^Co y rays directly traceable to NIST. Directly traceable means that the instrument had been calibrated either at NIST or at an Accredited Dosimetry Calibration Laboratory (ADCL). The ADCLs are a joint project between NIST and the AAPM and maintain secondary standards that have been calibrated at NIST. In the USA there are five ADCLs:
— Allegheny - Singer Research Institute, Pittsburgh, Pennsylvania;— К & S Associates, Inc., Nashville, Tennessee;— Memorial Hospital for Cancer and Allied Diseases, New York;— University o f Wisconsin - Madison Radiation Calibration Laboratory, Madi
son, Wisconsin;— University o f Texas M .D . Anderson Cancer Center, Houston, Texas.

IAEA-SM-330/60 465
All ionization chambers in the USA used for calibrating therapy beams are calibrated at least every two years at one of the ADCLs. The highest energy used at the ADCLs is that of ^Co 7 rays and no electron beams are currently available.
The 1983 AAPM Protocol recognized that cylindrical ionization chambers are widely used, and that procedures for their in-air exposure calibration were well established, but the same could not be said for plane parallel chambers. For these chambers, an additional method was presented based upon an intercomparison, by the user, in phantom with a calibrated cylindrical chamber in a beam of high energy electrons to obtain A^aps' — the dose to the gas in the chamber per electrometer reading, corrected for ionic recombination.
Since the development of the 1983 AAPM Protocol, various investigations [2-13] have shown some significant discrepancies and problems in the calibration and use of plane parallel chambers. In particular, various ‘in-air’ calibration techniques have been employed at the ADCLs, with or without the use of additional back- scattering materials, which have resulted in inconsistencies in how the calibration factor should be interpreted when the chamber is used.
Recognizing the need for consistent methods for dealing with these chambers, the AAPM Radiation Therapy Committee constituted Task Group 39 to address these problems.
3. CONSISTENCY WITH THE TG-21 PROTOCOL
Ever since the publication of the TG-21 Protocol certain inconsistencies, ambiguities and errors in it have been pointed out. However, careful analysis and comparison with the International Atomic Energy Agency (IAEA) Code of Practice[14] have shown that the final result obtained with the TG-21 Protocol is only 1-2% different from that obtained using the IAEA Code [15], and the AAPM has chosen to continue with the use of the TG-21 Protocol until such time as a completely new protocol is prepared. To avoid confusion TG-39 decided that its recommendation should be consistent with the TG-21 Protocol. In this protocol the quantity transmitted by the standardizing laboratories is exposure. This has worked well for cylindrical chambers and the change in quantities (exposure to absorbed dose) was accomplished by the introduction of the cavity gas calibration factor Ngas. As an extension of the TG-21 Protocol and for the sake of consistency, the use of Nx was continued. Air kerma, of course, can be used just as easily as exposure and the calibration laboratories provide both exposure and air kerma calibration factors, and for the sake of completeness TG-39 provides for the use of either factor.
However, the calibration of plane parallel chambers presents a number of special problems, which are discussed below. Because of this the task group believes that for these chambers, calibrated under various conditions, should be supplied by standardizing laboratories. Traceability is still maintained, although less

466 ALMOND
слDáW«S<кuJuJJ
3
aswz<cjOhtuO
UСЛOQZ<
ZoьнH
2PQl-HJcuwXH
z
QW
Ucueu<WPQ
OH
СЛ0ЙOHu<tL,
wJPQ<H
T
?s
5Г
" à «.2 *5 ■TJ< o
eCu eo
Ë fc* ¿. 3 8 O i l ¡*¡ ft.
*
BяEa,s2‘3PQ
<uceS
eocce
æo,
U
3Os©
So\
<N r-Г*- so Г-ON On OnО О О
tj- oo in m onoo TJ- 1Л Tf ioCC 00 CO CC 00
r-*Г4o
(N \ D Г-- 4 D ON 'i O N h (f)
8 8 8 8 8
>> > >%
S ,OОч O
&O<
соCU eu
c
CL & Я X
U Щ
û,U<Z
cd5
¡¿
6
uce5
6 2 *3X>ü
•5
oX
oXü
o4>
5o
"8*oT3ce
адin0слСЛ
1О
CLt-о
CL32*3л
>>'ао>»
CLсеслоэ"сЗ>и>сл0
Æн
1Х53СоgСоaх<DО
се;>сесотэссесл• с £7 о
С, Я
dадоc¿
Во
•S .2
^ ад 'С ' кЧ) ч> л * °
Е JО- **.§ -S
% а ■° sи о " •§
оадоQ¿ВО
mat
eria
ls
in co
lum
n
2.
They
ha
ve
an u
nce
rtai
nty
of
±1
%
(Ic
t).
From
E
q.
(3)
for Nx
(R/s
cale
d
ivis
ion
).
From
E
qs
(3)
and
(4)
for NK
(Gy/
scal
e d
ivis
ion
).

IAEA-SM-330/60 467
apparent, th ro u g h the d e te rm in a tio n o f iVgas f ro m N x fo r the standard cham ber
a g a inst w h ic h the plane p a ra lle l cham bers are com pared. In these cases the sta n
d a rd iz in g la b o ra to rie s w i l l m ake the change fro m e xp o su re to absorbed dose , ra th e r
than the u s e r , b u t the p ro c e ss re m a in s e sse n tia lly the sam e.
4 . P L A N E P A R A L L E L C H A M B E R S
A lth o u g h th e re are se ve ra l p lane p a ra lle l io n iza tio n cham bers availab le com
m e rc ia lly w h ic h m ay be used fo r e le c tro n beam d o s im e try , data fo r o n ly fiv e
cham bers a re p re sented in the paper: the Capintec P S - 0 3 3 , the E x ra d in P - l l , the
H o l t , the N A C P and the P T W - M a r k u s . A lm o s t a ll the data fo r p lane p a ra lle l cham
b e rs in the lite ra tu re re fe r to these cham bers and they are the ones m o s t fre q u e n tly
seen b y the A D C L s . D e sc rip t io n s and c h a ra c te ris tic s o f these cham bers have been
p u b lish e d in the lite ra tu re [1 0 , 1 6 ], and they are lis te d in T a b le I .
P la n e p a ra lle l cham bers can have a sizeab le p o la r ity e ffe c t (the d iffe re n c e
betw een the charges collected w h e n p o s itiv e as opposed to negative vo ltage is
a p p lied ). T y p ic a l p o la r ity e ffe c t data have been g iv e n b y H u m p h r ie s and S lo w e y
[ 1 6 ] , K u b o e t a l. [7 ] and M a tts so n e t a l. [9 ] ; h o w e v e r, i t is im p o rta n t to re a lize tha t
som e cham bers m ay n o t be ty p ic a l and va lue s d if fe r in g b y g re a te r than 3 % have been
noted fo r a g iv e n cham ber typ e . M o re o v e r, even la rg e r p o la r ity d iffe re n c e s m ay
o cc ur in th in w in d o w e d cham bers w ith o u t o v e rly in g dose b u ild u p m a te ria l. A l l read
in g s fo r p a ra lle l p la te cham bers sh o u ld th e re fo re be taken w ith b o th p o la r it ie s and
averaged.
5 . N O T A T I O N
T G - 3 9 use s the same n o ta tio n as the T G - 2 1 P ro to c o l and the sy m b o ls used are
g iv e n in the l i s t at the end o f the paper. A ls o sh o w n is the I A E A C ode o f P ra c tic e
[1 4 ] n o ta tio n w h e re i t d i f fe r s f ro m th a t o f T G - 3 9 .
6 . R E C O M M E N D A T I O N S
T h e re c o m m e nd atio ns are in tw o p a rts . T h e f i r s t p a rt deals w ith the q u e stio n
o f the c a lib ra tio n o f p lane p a ra lle l cham bers and is addressed sp e c ific a lly to the
A D C L s . T h e second se t o f recom m end ations p ro v id e s g u id e lin e s to the u se r o n h o w
to e m p lo y the ca lib ra ted p lane p a ra lle l cham bers to d e te rm ine absorbed dose u n d e r
standard c o n d itio n s fo r e le c tro n beam s.
Because the use o f the cham bers re q u ire s tha t th e ir be k n o w n , the recom
m end a tion fo r c a lib ra tin g the cham ber is p resented as m e tho ds fo r d e te rm in in g the

468 ALMOND
N pg£s factors, either directly or indirectly from Nx (or NK, the air kerma calibration
factor).
7. METHODS FOR DETERMINING THE C A V IT Y GAS CALIBRATION
FACTOR FOR A PLANE PA R A LLE L IO N IZATIO N CHAMBER
The three methods described in the following sections are valid methods for determining the value o f the cavity gas calibration factor for a plane parallel ionization chamber, through radiation intercomparison with a NIST-traceable
calibrated cylindrical chamber.The first method, which employs a beam o f high energy electrons for the inter
comparison, is the only method specifically referred to by the 1983 AAPM Protocol[1] for plane parallel chamber calibrations. TG-39 also recommends it as the method o f choice where such an electron beam is available. At present, however, none o f the ADCLs is in a position to offer such a calibration. Thus i f the user wants it, the procedure must be carried out at a local accelerator, not at a standardization laboratory. It was this significant disadvantage that prompted the task group also to recommend other calibration procedures that would be within present AD CL capabilities.
The electron beam method, however, is presented first, not only to be consistent with the 1983 A A PM Protocol, but because it represents the most direct method o f obtaining A^aps' and can be used to obtain the parameters needed for the
other methods. I f N pg£s is required for plane parallel chambers not included in this paper, only this method is recommended since the parameters needed for the other methods are not known to the required accuracy at the present time.
7 .1 . E le c t r o n b ea m m e th o d
It will be useful here to begin by quoting verbatim from the 1983 AAPM
Protocol:
‘ W gas for a plane parallel chamber may be determined as follows. Using the highest electron beam energy available and the cylindrical chamber for which iVgas is known, determine the response per monitor unit at d ^ . Next, place the plane parallel chamber into the same dosimetry phantom taking care to position the inner surface o f its proximal electrode at the depth o f the central axis o f the cylindrical chamber, and determine its response per monitor unit. The cavity gas calibration factor for the plane parallel chamber is given by
A ^s = (MWgasPj0nP repl)Cyl/(M P ion) P P (D
where the terms in the numerator apply to the cylindrical chamber, and those
in the denominator apply to the plane parallel chamber.”

IAEA-SM-330/60 469
Several points need emphasis and/or clarification:
(1) M is the measured average ionization for positive and negative polarities, in coulombs or scale divisions, corrected to air density at 22°C and 760 mmHg, but not corrected for relative humidity, this being assumed to be typical of laboratory conditions (50% ± 25%).
(2) The “ highest electron beam energy available” must be high enough to make the Prepl value for the cylindrical chamber no smaller than 0.98. For a typical Farmer type cylindrical chamber of inner diameter 6.3 mm, an electron beam is required with a mean energy of at least 10 MeV at dmax, the depth of the measurement.
(3) ¿max is taken as the depth of maximum ionization.(4) The correct alignment of the plane parallel chamber for the intercomparison
is with the midpoint of the inner surface of its front wall located on the beam axis at dmia, and the flat chamber walls perpendicular to that axis.
(5) The corresponding correct alignment of the cylindrical chamber is with the midpoint of its ion collecting volume located on the beam axis at dmm, and its axis of rotation perpendicular to the beam axis. This geometry is required because the Prepi factors in the 1983 AAPM Protocol were derived from Ref. [17], in which that alignment was employed.
(6) The equilibrium buildup cap used in the “ Co 7 ray calibration of the cylindrical chamber (e.g. Farmer type) must be removed for all electron beam measurements, and Pwa]1 is taken as unity (hence it does not appear in Eq. (1)).
(7) Electron beam diameters should be large enough to provide complete in-scattering to the beam axis. Conservatively this requires a beam diameter of twice the range Rp of the electrons in the phantom medium. Thus a beam diameter (cm) numerically equal to the incident electron energy (MeV) is ample (assuming unit density).
(8) The quantity in Eq. (1) is derived from the NIST calibration value of Ntf1 or N f l for the chamber according to the procedures in the TG-21 Protocol.
7 .2 . 60C o in - a ir m e th o d
In the “ Co in-air method the intercomparison between the plane parallel chamber and the NIST calibrated cylindrical chamber is performed in a MCo 7 ray beam in air. An exposure or air kerma calibration factor Л^р or N%p' will be obtained for the plane parallel chamber by direct comparison with the cylindrical chamber and Л^ар' is obtained from given Л^ар57 (Л ^ 0П)р'р' values.
The following procedures are to be followed:
(1) The plane parallel chamber must be submitted to the ADCL for calibrationwith the necessary dose buildup material in place, unless the proximal wall is

470 ALMOND
already thick enough, as is the case for the Holt chamber. The added buildup material should have the same outer diameter as the chamber, and be o f the
material specified in Table I. Its thickness should be 0.5 g/cm2 to ensure charged particle equilibrium, to exclude electron contamination that may be present in the ^Co beam and to match the calculated /4wall values given in Table I.
(2) The ^C o beam should be 10 X 10 cm2 at the chamber measurement location,
at a distance o f at least 80 cm from the source.(3) The correct alignment o f the plane parallel chamber for the intercomparison
is with the midpoint o f its ion collecting volume located on the beam axis at the measurement location, and the flat chamber walls perpendicular to that axis. The user-provided buildup material must be in place.
(4) The corresponding correct alignment o f the AD CL cylindrical chamber used in the intercomparison is with the midpoint o f its ion collecting volume located on the beam axis at the measurement location, and its axis o f rotation perpendicular to the beam axis. The buildup cap used in its NIST-traceable calibration must be in place.
(5) No phantom material is to be placed in the beam with either chamber, except
what is already an integral part o f the chamber construction and the buildup material or buildup cap. The applicability o f the factors in Table I depends on this.
(6) Under these conditions, the exposure calibration factor for the plane parallel chamber is given by
Л/£р- = Л$'1М су1/Мрр- (2)
where M cyI and M p p are the meter readings o f the cylindrical and plane parallel chambers under the conditions given above, corrected for temperature and pressure as stated above with A P p- being the average reading for positive and negative polarity. The same equation holds when N x is replaced for both chambers by N K .
(7) The ratios o f Л |ар /(7Ул*4к т ) р'р’ and N p£ / ( N KA ton) p p -, as tabulated in Table I, were obtained from
^yp.p. _ A/%P k ( ty/ ^ gas ^ ion ^ w a llffw a ll
838 " (¿ / Р )^ (Д / Р )£ № РШР
and from Eq. (4) (see item (8) below), where
/3waii = 1-005 for ^C o 7 rays;(L/p)gaasu is the mean restricted mass stopping power ratio for the chamber
wall material relative to the gas (ambient air) inside, obtained from table 1 o f Ref. [1];

IAEA-SM-330/60 471
(/ W p )wSi is Л е mean mass energy absorption coefficient ratio for dry air relative to the chamber wall material, obtained from table 1 o f Ref. [1];
comp (following Rogers [10, 18]) corrects for the composite nature o f the chamber and buildup cap.
The exact version o f the 1983 AAPM Protocol equation for N $as is
used despite several known errors [18-22]. In particular, the Protocol used (H'7e)gas/áwau/3waii where this should have been (W7e)ai 4wall. However, (W/e)¡¿r = 33.97 J 1C and (W e )gasj3waU = 33.9 J/C. Since the two errors cancel to a large degree and since it is desirable to remain consistent with the Protocol, we recommend using the original equations despite the known problems.
(8) I f the NIST calibration o f the cylindrical chamber is stated as an air kerma
calibration factor NK (Gy/C), the value o f Nx (R/C) for use in Eq. (3) can be obtained from
Nx = N ^ 1 - g)lk(W/e)¡tk (4)
where g is the average fraction o f secondary electron kinetic energy that is spent in bremsstrahlung production. NIST takes g as 0.0032 and (W7e)air for dry air as 33.97 J/C for “ Со y rays. Thus for these values Nx = 113.7Afc.
7.3. “ Co in-phantom method
In the ^C o in-phantom method, the intercomparison between the plane parallel chamber and the NIST calibrated cylindrical chamber is performed in a “ Со y ray beam at a depth o f 5 g/cm2 in a phantom o f material selected to match that o f the plane parallel chamber, as described in Ref. [23]. A^aps is related to the known value o f N ^ s by
(M M ion)PP(^VgasP walI) pp- = (M M ion) c5'1( ^ gasP repl/ ,waii)C5'1 (5)
where Afcyl and A/p p are the meter readings o f the cylindrical and plane parallel chambers under the conditions stated above, corrected for temperature and pressure, and M p p- is the average for positive and negative polarity; is obtained from the NIST calibration value o f A^ 1 or /Vjp1 according to the TG-21 Protocol; P repl is taken as unity in the 1983 A A PM Protocol for plane parallel chambers, so it does not appear on the left hand side o f Eq. (5).
Recommended values o f P p¿¡ are given in Table I from Rogers [11]. These
are based upon Monte Carlo calculations and consideration o f approximately ten
published experimental data sets. The recommended P&Jjj values have a systematic

472 ALMOND
uncertainty o f ± 1 % (la ). A mass depth o f 5.0 g/cm2 for the reference plane simplifies positioning so that the proximal surface o f the air gap in the plane parallel chamber can be conveniently and accurately placed at the same depth and at the same distance from the source as the plane through the centre o f the cylindrical chamber. The exact details for carrying out this intercomparison are given in Ref. [23] and are summarized in the TG-39 report.
Because o f the difficulties in calculating P&Uj for other commercial plane
parallel chambers o f non-homogeneous design, it is recommended [9] that the ЛгаВ' values be determined experimentally by comparison o f the ^Co in-phantom method with the electron beam method. By determining the value o f /V|fs from Eq. (1) and inserting it in Eq. (5), one can solve for P&jji. That value can then be
used in subsequent recalibrations o f the same chamber by the ^Co in-phantom method, or for other chambers o f the same design. Future plane parallel chamber
designs should be made as homogeneous as possible to permit more ideal matching o f the phantom medium, making Pwall approximately equal to unity.
In order to perform such an calibration o f a plane parallel chamber the chamber must be enclosed (but vented to atmosphere) in a closely fitting phantom slab 4.0 g/cm2 thick and approximately 25 cm square. The slab medium must be chosen to match the parallel plate chamber material as closely as possible. Usually
the customer desiring the calibration will be expected to submit the plane parallel chamber to the AD CL in such a phantom slab. The plane o f the proximal surface o f the chamber air gap must be located 2.00 ± 0.01 g/cm2 from the proximal face
o f the slab, and be clearly defined by scribe marks on the edges o f the slab.For an AD CL to be able to offer in-phantom ^C o calibrations o f parallel
plate chambers, the AD CL must have a corresponding set o f phantom slabs that are drilled to fit the secondary standard cylindrical chamber which is to be used in the intercomparison. These in-house phantom slabs must be made o f polystyrene, acrylic or graphite to match the phantom slabs submitted and which must match the materials listed in Table I. A Farmer type chamber with a graphite wall and graphite buildup cap in place is recommended as the secondary standard [23]. The total mass thickness o f the graphite wall plus cap should equal the maximum range o f the Compton electrons, which is 0.57 g/cm2 or 3.4 mm o f density 1.7 g/cm3. The central axis o f the chamber must lie on the slab midplane, which also must be indicated by scribe marks.
During the calibration procedure, the plane parallel chamber in its slab and the cylindrical chamber in its slab are to be ‘ sandwiched’ in turn between the same two layers o f acrylic or polystyrene, each 3.0 g/cm2 thick and approximately 25 cm square, as described in Ref. [23]. The chamber slabs, one after the other, would be centred in a 10 x 10 cm2 ^C o у ray beam, with the reference plane at a suitable distance from the source (e.g. 1 m). The chamber slabs, thus enclosed, would be centred one after the other in a 10 X 10 cm2 ^C o у ray beam, with their scribe marks positioned at the same distance (e.g. 1 m) from the source.

IAEA-SM-330/60 473
8. DOSIMETRY PROTOCOL W ITH PLANE PAR ALLE L CHAMBERS
8.1. Dose to the medium
Once A^aps has been calculated, the determination o f absorbed dose for the
user’ s electron beam will proceed according to the TG-21 Protocol.When the chamber is placed in a suitable phantom (medium), the dose to the
medium will be given by
D med = M N lls( l l p ) ^ P lonP repi (6)
where M is the average o f the electrometer readings (in coulombs or scale divisions corrected to 22°C and 760 mmHg) obtained with positive and negative voltage
applied to the chamber. (L ip ) is the ratio o f the mean restricted collision mass
stopping power o f the phantom material to that o f the chamber gas (ambient air) and is given in tables 5-7 o f Ref. [1]. P ion is the factor that corrects for ion recombination losses that occur at the time o f calibration o f the user’s electron beam. P ion is the inverse o f the ionization collection efficiency and has a value equal to or greater than unity. Using the two-voltage technique, Р юп can be obtained from fig. 1 o f a report by Task Group 25 [24] for a voltage ratio o f 2 [1, 25] or from table 1 o f the same report for a voltage ratio o f 5. Other voltage ratios can be used with the formula in Ref. [25]. P repl is the replacement correction, which is discussed below. Although there is some indication in the literature that P walI may differ from unity for some chambers [26], Pwau is taken as unity for electrons in this protocol to be consistent with the 1983 A A PM Protocol and is not included in Eq. (6).
8.2. Replacement correction factor Prepl
In the 1983 A A PM Protocol the replacement correction factor P Kpl is taken as unity for plane parallel chambers irrespective o f electron beam energy. However, since 1983 a number o f investigators [2-4, 7-9, 12, 27, 28] have reviewed this parameter, with the work o f Reft and Kuchnir [8, 29] and Wittkamper et al. [12] being comprehensive summaries o f the data. Two o f the commercial chambers (Capintec and PTW-Markus) that are dealt with in this paper show clear experimen
tal evidence that P Kp\ decreases with decreasing electron energy. Most o f the published data concern the PTW-Markus chamber. An analysis o f this information
shows large uncertainties in many reported Л-epl values and differences o f several per cent for some values at the same energy. The Netherlands Commission on Radiation Dosimetry, in its Code o f Practice for the Dosimetry o f High-Energy Electron

474 ALMOND
TABLE П. P rpeP¡ FACTORS FOR VARIOUS CHAMBERS W HEN THE AVERAGE ELECTRON ENERGY A T DEPTH Z IS FROM 2.5 TO 20 MeV
Ez(MeV)
Holt, NACP, Exradin
PTW-Markus Capintec
2.5 1.000 0.985 0.956
3 1.000 0.988 0.961
4 1.000 0.992 0.970
5 1.000 0.994 0.977
6 1.000 0.996 0.982
7 1.000 0.997 0.986
8 1.000 0.998 0.989
10 1.000 0.999 0.994
12 1.000 1.000 0.996
15 1.000 1.000 0.998
20 1.000 1.000 1.000
Beams [30], considered this situation for the PTW-Markus chambers and recom
mended the following equation for Prcpl (designated p { in its protocol):
Лер, = 1 - 0.041e-°-4Ïz (7)
Table П lists P repl values for the PTW-Markus chamber from this equation. For the Capintec chamber there are only two sets o f data [7, 8]. These have been used to derive the values listed in Table П. There are no experimental values below Ez = 2.5 M eV and the PTW-Markus and Capintec chambers should not be used for energies below this value. For the other chambers, for which the guard ring width is at least 3 mm, /*„ 1 has been found to remain practically constant at unity throughout the energy range covered by Table П.
8 .3 . D e p th o f c a lib ra t io n
For electron beams, the calibration depth is restricted to 4 , , the depth o f maximum ionization in both plastic and water phantoms. Plane parallel chambers are
positioned with the inner surface o f the proximal electrode at dimx, and the dose so
determined is at this depth.

IAEA-SM-330/60 475
8 .4 . S c a lin g fa c to rs a n d d ose t r a n s fe r f r o m p la s t ic to w a te r
Absorbed dose measured with plane parallel chambers in plastic phantoms requires corrections to obtain the dose to water. These have been discussed in detail in Ref. [3]. When secondary electron equilibrium exists and the energy spectra at the point o f interest in both media are the same, then
^w O ^w ) ^m ed Wmed)coll.
' med (8)med
where the depth in water, dw, is related to the depth in the medium, dmed, by
^med Pe ff med
DW■K 50
nmedK S0
(9)
coll.
¿med
^50Peff
is the ratio o f the mean unrestricted mass collision stopping power in med water to that in the solid;
is the fluence factor, i.e. the ratio o f electron fluence in water to that in the solid phantom (ф^ is discussed in detail in Ref. [3]); is the depth o f the 50% dose or ionization; is the effective density o f the medium and is discussed in Ref. [24] (TG-25), where recommended values o f peff are given.
For many plastics (S/p)Zeà is very nearly constant for electrons in the range0.1-50 MeV. The values o f 1.030 for a polystyrene medium and 1.033 for PM M A recommended by the 1983 A A PM Protocol [1] should be used. The fluence factors <£med calculated by Hogstrom and Almond [31] and recommended by TG-25 [24] can be found in tables 8a and 8b o f Ref. [24].
The SSD and collimator field size for electron dosimetry in a plastic phantom should be the same as for a water phantom [24].
9. SUM M ARY
This paper deals with the recommendations o f TG-39 on the calibration and use o f plane parallel ionization chambers, and provides specific data for five commercial models: the Capintec PS-033, the Exradin P - l l , the Holt, the NACP and the PTW-Markus.

476 ALMOND
It recommends that the primary means o f calibrating such chambers is with high energy electrons at dmax in a phantom, intercomparing with a cylindrical chamber whose iVg^s value has been obtained from a NIST-traceable “ Co beam exposure
or air kerma calibration. N|aps is calculated following the 1983 AAPM Protocol procedure. The electron beam energy must be high enough to ensure that is no smaller than 0.98 and P?e£j is very close to unity. P waü is assumed to be unity for both chambers. In general this will mean an incident electron beam energy o f at least 18 MeV.
Plane parallel chambers may also be calibrated in air at “ Co to obtain A/Jp
or A ftp-. Values o f A^as'/(^4ion)p p' and A^aps/(ArAv4j0n)p'p are given in Table I for the five chambers mentioned above. These values depend on buildup material o f a thickness o f 0.5 g/cm2 being added to the front chamber wall and an outer diameter
equal to that o f the chamber. The buildup material to be used with each chamber is also listed in Table I.
Calibration o f plane parallel chambers at a depth o f 5 g/cm2 in a phantom as
described in Ref. [23] but using the P£gji values in Table I is also recommended as an alternative method.
It has been shown that the values o f Гсотр and P waU recommended here for calibrations in air or in phantom in a ^C o beam are in good agreement with a wide range o f experimental data [11] based on N gas measurements in electron beams and on in-air or in-phantom measurements. This good agreement implies that all three methods for determining Ngas can be treated as equivalent.
For plane parallel chambers other than the five considered in this paper, /Vgas i f required should be obtained by calibration in a high energy electron beam against a cylindrical chamber with known 7Vgas, as recommended in the 1983 A APM
Protocol.The described procedure for applying plane parallel chambers in the calibra
tion o f electron beams closely follows the 1983 A A PM Protocol. is assumed to be unity but P prepi values for the Capintec and PTW-Markus chambers depend on electron energy, as indicated in Table П. It is likely that the plane parallel chambers will be used in plastic phantoms for beam calibration purposes, and this protocol follows the A A PM Task Group 25 protocol [24] in the method o f obtaining absorbed dose to water from absorbed dose to plastic.
It must be cautioned again that this paper does not represent the final recommendations o f the American Association o f Physicists in Medicine. This paper sum
marizes the considerations o f Task Group 39 o f the Radiation Therapy Committee o f the A A PM and they are now under review. When the review process is complete, the final report will be published in Medical Physics.

IAEA-SM-330/60 477
LIST O F SYM BOLS
(The equivalent IAEA symbols are given in parentheses
where they differ from TG-39 symbols)
a is the fraction o f ionization due to electrons arising from photon interactions in the chamber wall; (1 - a ) is the fraction o f ionization due to electrons arising from photon interactions in the surrounding material (buildup or phantom).
Aion is the ion collection efficiency, in the “ Co beam, at the time o f calibration and is provided by the calibration laboratory.
Xwall is the correction factor for attenuation and scattering o f gamma rays in
the chamber wall and buildup cap. (fcatt)(3wall is the quotient o f absorbed dose by collision kerma in the chamber wall
(i.e. under conditions o f transient charged particle equilibrium). Its value is implicitly included in all tabulated /4wall values but it is retained explicitly here to conform to the 1983 A A PM Protocol.
ámax is the depth on the central axis at which an ionization chamber gives themaximum reading for electron or photon beams in cm or g/cm2.
£>med is the absorbed dose to the medium at the position o f the chamber, withthe chamber replaced by medium. (D m)
Ez is the mean electron energy at the depth o f measurement (M eV ) and isgiven approximately by Ez = £0(1 - Z/Rp), where E0 is the mean incident energy o f an electron beam (M eV ), Z is the depth o f measurement (cm) and Rp is the practical range (cm).
g is the average fraction o f secondary electron kinetic energy that is spentin bremsstrahlung production.
k = 2.58 x 10"4 С - k g 1 -R -1 or unity i f exposure is stated in C/kg.
^comp is Л е correction factor to account for composite wall materials, includingthe buildup material, in the ionization chamber at the time o f the chamber calibration with ^C o y rays. (km where ( L i p ) ( Men/pÆi^Comp =
(L/p)gas* is the mean restricted mass stopping power ratio for the chamber wallrelative to the gas (ambient air) inside. (iSm air)
M is the measured ionization in coulombs or scale divisions, correctedto air density at 22° С and 760 mmHg, but not corrected for relative humidity, this being assumed to be typical o f laboratory conditions (50% ± 25%).
(f ienJp)waii is the mean mass energy absorption coefficient ratio for dry air relativeto the chamber wall.
ZVgas is the cavity gas calibration factor (Gy/C or Gy/scale division). (ND)NK is the air kerma calibration factor (Gy/C or Gy/scale division) for “ Co
radiation.

Nx is the exposure calibration factor (R/C, R/scale division, С -kg' 1 • C ' 1 orС -k g '1-(scale division)'1) for “ Co radiation.
Р юп is the ion recombination correction factor applicable to the calibration o fthe user’ s beam. (ps)
•Prepi is the correction factor for the replacement o f phantom material by thecavity o f an ionization chamber.
P wal] is the correction factor for the chamber material being different from that
o f the phantom. (The IAEA uses p a, which combines the effects o f P repl and Pwall.)
peff is effective density.
Фтеа is the ratio o f the electron fluence at depth dw in water to that at depth
^med in plastic. dw = <¿medPeff- (5//o)med is the ratio o f the average unrestricted mass collision stopping power o f
water to that o f another medium.(W/e)air = 33.97 J/C is the mean energy expended per unit charge in dry air.
The 1983 AAPM Protocol used ( W/e)50% = 33.7 J/C, which is retained
here for consistency.
478 A L M O N D
REFEREN C ES
[1] TASK GROUP 21, RADIATION THERAPY COMMITTEE, AMERICAN ASSOCIATION OF PHYSICISTS IN MEDICINE, A protocol for the determination of absorbed dose from high-energy photon and electron beams, Med. Phys. 10 (1983) 741-771.
[2] ALMOND, P.R., Use and calibration of plane-parallel chambers, Med. Phys. 18 (1991) 604 (abstract).
[3] CASSON, H., KILEY, J.P., Replacement correction factors for electron measurements with a parallel-plate chamber, Med. Phys. 14 (1987) 216-217.
[4] CINOS, C., LIZUAIN, M.C., FEBRIAN, M.I., Total perturbation correction factor for PTW and NACP plane parallel chambers in electron beams, Radiother. Oncol. 21 (1991) 135-140.
[5] KRITHIVAS, G., KUBO, H., Experimental studies on chamber factors for a parallel- plate ion chamber, Med. Phys. 14 (1987) 491 (abstract).
[6] KRITHTVAS, G., RAO, S.N., Ngas determination for a parallel-plate ion chamber, Med. Phys. 13 (1986) 674-677.
[7] KUBO, H., KENT, L.J., KRITHIVAS, G., Determination of Wgas and Prepl factors from commercially available parallel-plate chambers. AAPM Task Group 21 Protocol, Med. Phys. 13 (1986) 908-912.
[8] KUCHNIR, F.T., REFT, C.S., Experimental values of Pwall x and for fiveparallel-plate ion chambers — A new analysis of previously published data, Med. Phys. 19 (1992) 367.

IAEA-SM-330/60 479
[9 ] M A T T S S O N , L .O . , J O H A N S S O N , K . A . , S V E N S S O N , H . , C a lib ra tion and use o f
p lane-para lle l ion iza tion cham bers fo r the determ ination o f absorbed dose in e lectron
beam s, A c ta . R a d io l., O n co l. 21 (1 9 81 ) 385-399 .
[10 ] R O G E R S , D .W .O . , M o n te C a r lo Calcu lations o f the Response o f Pa ra lle l-P la te C ham
bers in №С о B eam s, R ep . P IR S -0 2 5 9 , N a tl R esearch C ou ncil Canada, O ttaw a (1 9 90 ).
[11 ] R O G E R S , D .W .O . , C alib ration o f paralle l-p la te cham bers: Reso lu tion o f severa l
p rob lem s b y using M o n te C a r lo calcu lations, M e d . Ph ys . 19 (19 92 ) 889-899 .
[12 ] W IT T K Â M P E R , F .W . , T H IE R E N S , H . , V A N D E R P L A E T S E N , A . , D E W A G T E R ,
C ., M U N H E E R , B .J ., Perturbation co rrection factors fo r som e ion iza tion cham bers
co m m on ly app lied in e lec tron beam s, Phys. M e d . B io l. 36 (19 91 ) 1639-1652.
[13 ] W IT T K Â M P E R , F .W . , A A L B E R S , A .H .L . , M U N H E E R , B .J ., E xperim en ta l deter
m ination o f w a ll co rrection factors, Part I I : N A C P and M arkus p lane-para lle l ion iza tion
cham bers, Ph ys . M e d . B io l. 37 (1 9 92 ) 995-1004 .
[1 4 ] I N T E R N A T IO N A L A T O M IC E N E R G Y A G E N C Y , A b so rb ed D ose D eterm ination in
Ph oton and E lectron Beam s: A n In ternational C o d e o f P ractice , T e ch n ica l R eports
Series N o . 277, IA E A , V ien n a (19 87 ).
[15 ] H U G , М . , N A T H , R . , C om parison o f I A E A and A A P M 1983 pro toco ls fo r dosim etry
ca lib ra tion o f rad iotherapy beam s, M e d . Ph ys . 18 (1991 ) 26 -35 .
[16 ] H U M P H R IE S , L .J . , S L O W E Y , T .W . , “ D os im etry instrument in rad iation on co lo g y
physics — 1986” , A A P M M on ograp h N o . 15 (K E R E IA K E S , J .G ., E L S O N , H .R . ,
B O R N , C .G . , E d s ), A m er ica n Inst, o f Ph ys ics , N e w Y o r k (1 9 8 7 ) 110-138.
[17 ] J O H A N S S O N , K . - A . , M A T T S S O N , L .O . , L IN D B O R G , L . , S V E N S S O N , H .,
‘ ‘ A bso rb ed -d ose determ ination w ith ion iza tion cham bers in e lec tron and photon beam s
having en erg ies betw een 1 and 50 M e V ” , N a tion a l and International S tandardization
o f R ad ia tion D os im etry (P ro c . Sym p. A tlan ta , 1977), V o l . 2 , IA E A , V ien n a (1978 )
24 3 -2 70 .
[18 ] R O G E R S , D .W .O . , R O S S , C . K . , T h e ro le o f hum idity and other co rrection factors in
the A A P M TG -2 1 dos im etry p ro to co l, M e d . Phys. 15 (1 9 8 8 ) 40 -48 .
[19 ] T A S K G R O U P 21 , R A D IA T IO N T H E R A P Y C O M M IT T E E , A M E R IC A N A S S O C I
A T IO N O F P H Y S IC IS T S I N M E D IC IN E , Erratum : A p ro toco l fo r the determ ination
o f absorbed dose fro m h igh -en ergy photon and e lectron beam s, M e d . Phys. 11 (1984 )
213.
[20 ] A T T I X , F .H . , Equations fo r ZVgas and N ait in term s o f Nx and N K, M e d . Phys. 16
(19 89 ) 803.
[21 ] R O G E R S , D .W .O . , Fundam entals o f h igh en ergy X -ra y and e lectron beam p ro toco ls ,
A d va n ces in R ad ia tion O n c o lo g y Ph ys ics , A A P M M on og rap h N o . 19, A m er ica n Inst,
o f Ph ys ics , N e w Y o r k (1 9 92 ) 181-223.
[22 ] S C H U L Z , R . J ., e t a l . , C la r ific a t ion o f the A A P M Ta sk G rou p 21 p ro to co l, M e d . Phys.
13 (19 86 ) 75 5 -7 59 .
[23 ] A T T I X , F .H . , A proposa l fo r the ca libra tion o f p lane-para lle l ion cham bers b y A D C L s ,
M e d . Ph ys . 17 (19 90 ) 93 1 -9 33 .
[24 ] K H A N , F .M . , et a l., C lin ica l e lectron -beam dosim etry : R ep ort o f A A P M Radiation
T h erap y C om m ittee Ta sk G rou p N o . 25, M e d . Ph ys . 18 (1991 ) 73 -10 9 .
[25 ] W E IN H O U S , M .S . , M E L I , J .A . , D eterm in in g Pim, the co rrection fa c to r fo r recom b i
nation losses in an ion iza tion cham ber, M e d . Ph ys . 11 (1 9 84 ) 846-849 .

480 ALMOND
[26] KLE VENH AGEN, S. С., Implication of electron backscattering for electron dosimetry, Phys. Med. Biol. 36 (1991) 1013-1018.
[27] CINOS, C., LIZUAIN, M.C., Comparative study of two plane-parallel ionization chambers, Phys. Med. Biol. 33 Suppl. 1 (1988) 95.
[28] GOSWAMI, G.C., KASE, K.R., Measurement of replacement factors for a parallel- plate chamber, Med. Phys. 16 (1989) 791-793.
[29] REFT, C.S., KUCHNIR, F.T.i Measurement of the replacement correction factor for parallel-plate chambers in electron fields, Med. Phys. 18 (1991) 1237-1243.
[30] NETHERLANDS COMMISSION ON RADIATION DOSIMETRY, Code of Practice for the Dosimetry of High-Energy Electron Beams, Rep. 5, NCS, Bilthoven (1989).
[31] HOGSTROM, K.R., ALMOND, P.R., The effect of electron multiple scattering on dose measured in non-water phantoms, Med. Phys. 9 (1982) 607 (abstract).

IAEA-SM-330/71
PLANE PARALLEL CHAMBERS IN ELECTRON BEAMS: MONTE CARLO FINDINGS ON THE PERTURBATION FACTOR
Chang-Ming M A *, A.E. NAHUM Joint Department o f Physics,
Royal Marsden Hospital and Institute o f Cancer Research,
Sutton, Surrey,
United Kingdom
A b s t ra c t
PLANE PARALLEL CHAMBERS IN ELECTRON BEAMS: MONTE CARLO FINDINGS ON THE PERTURBATION FACTOR.
The paper presents Monte Carlo calculated perturbation correction factors for three types of plane parallel ionization chambers (Markus, NACP and Capintec) used in electron beam dosimetry. The EGS4 (Electron Gamma Shower version 4) Monte Carlo code system has been used to model the response of the chambers at a depth in water irradiated by monoenergetic electron beams of energies between 4 and 20 MeV. The perturbation factors were calculated as the ratios of the absorbed dose to air in a thin layer of air centred at the reference depth to that in a wall-less air cavity with its front surface at the same reference depth. The results show that for the NACP and Capintec chambers the perturbation corrections around the depth of maximum ionization were within 0.6% of unity, while for the Markus chamber the perturbation factor was 0.984 for 4 MeV incident energy. It has been found that the response of a wall-less ionization chamber is elevated in the increasing portion of the depth ionization curve but reduced in the descending portion of the curve. Corrections of up to a few per cent were required at these depths for the chambers simulated. This effect may also be corrected for by shifting the effective point of measurement of the chamber.
1. INTRODUCTION
Plane parallel ionization chambers are employed in low energy electron beams owing to their supposedly negligible perturbation effect. By taking the position o f
the effective point o f measurement, Peff, to be at the inside surface o f the entrance window, and assuming that the stopping power ratio for water to air, í w,a¡r, at the
* Current address: Ionizing Radiation Standards, Institute for National Measurement Standards, National Research Council Canada, Ottawa, Ontario, Canada K1A 0R6.
481

482 MA and NAHUM
reference depth in an undisturbed phantom is known, the perturbation factor pa, expressed by the equation
has been assumed to be negligibly different from unity [ 1].
The assumption behind the position o f Peff is that the chamber samples the electron fluence incident through the front window, with all the electrons incident through the side walls prevented from reaching the sensitive air volume owing to the geometry o f the guard ring. This in turn assumes that there are very few electrons travelling at large angles. However, at depths close to or beyond that o f maximum dose such large angle electrons must be present. Theoretical approaches to the problem o f calculating perturbation in gas filled cavities in electron beams have so far been limited by simple assumptions [2, 3]. Small angle multiple scattering theory
has been used and no account has been taken o f the progressive loss o f primary electrons due to range straggling. Olofsson and Nahum [4] attempted to remove this restriction by computing a fine mesh o f straight electron paths across the cavity, but even their approach was limited by the approximations inherent in using angular restrictions o f electrons given by Fermi-Egyes theory.
W e report on the direct Monte Carlo simulation o f the perturbation factors for three types o f commonly used plane parallel chambers, i.e. Markus, NACP and Capintec. The EGS4 (Electron Gamma Shower version 4) Monte Carlo code system [5] has been used in this work together with the application o f a correlated- sampling variance-reduction technique [6]. The perturbation factor was calculated as the ratio o f the absorbed dose to air in a thin layer o f air centred at the reference depth in a water phantom to that in a wall-less air cavity with its front surface at the same reference depth. The definition o f the pu factor is given in the next section.
The details o f the Monte Carlo calculation and the simulation geometry are described in Section 3. The results are described and discussed in Section 4 and the conclusions are given in the final section.
2. THEORY
W e consider the situation in which an ionization chamber is placed at the reference depth in a water phantom irradiated by an electron beam o f incident energy E0. Assuming that the electron fluence at the reference depth in the water phantom in the absence o f the chamber, ФЦ, is known, the absorbed dose to water at the reference depth, Dw, can be calculated according to the modified Spencer-Attix relation [ 1]:
■^w(Peff) air^w.airPu ( 1)
(2)

IAEA-SM-330/71 483
where is the restricted mass collision stopping power o f water (i.e. including only those energy losses due to the generation o f ô particles with energy below the cut-off energy Д), and TE is a track-end term which accounts for the contribution to the absorbed dose o f electrons in the energy range Д to 2Д which undergo inelastic collisions in which both electrons drop below the cut-off energy A (the superscript and subscript denote where the electron fluence is scored and where the track ends
are counted, respectively). For an air cavity positioned with its effective point o f measurement at the same reference depth and assuming that the electron fluence in the air cavity, Фрг, is known, the absorbed dose to air in the cavity is given by an analogous equation:
D“ - imax .
Ф £ г1 4 dE + (TE)|fr (3 )
where L fir is the restricted mass collision stopping power o f air. The ratio o f the absorbed doses is then given by
D n i * dE + (Т Е )*yW
A . ¡r № dE + ( Т Е ) -
n i * dE + (Т Е ) * gmax ф -£ А г dE + (X E )*
Ф £ 1 4 dE + (TE )a ir g ™ * Ф £г1 4 dE + (Т Е )kairair
^w.airPu (4)
where
A,w,air w/
gmax ¿ E + (T E ) 1
is the stopping power ratio for water to air averaged over the electron spectrum at the reference depth in an undisturbed water phantom and
j*max $wL Ar + (TE)™r
A, = ------------------------------------- = ~ (6)gmax ф|тЬ Дг dE + (XE)aafr
is the perturbation correction factor. Equation (6) actually defines the pu factor as

484 MA and NAHUM
the ratio o f the absorbed dose to air at the reference depth in a water phantom in the absence o f the chamber, D¿r, to that in the air cavity o f the chamber, Dair. Equation(6) can be greatly simplified i f one assumes that Ф|1Г has the same shape as Ф£. Then one can write
,<bw
л = Ï * (7)
It is common practice to further divide pa into a number o f independent multiplicative correction factors which account separately for the effects o f the perturbation o f the electron fluence at the measurement position due to the replacement o f water by the air cavity, and the non-water-equivalent chamber wall (includ
ing electrode) and stem (and/or cable), i.e.
Pu PcavPwallPstem
In this work, we only investigate the perturbation effect o f the replacement o f water by a wall-less air cavity, i.e. the pcav factor.
3. M ONTE CARLO CALCULATIO N
3.1. Simulation geometry
Three types o f plane parallel chambers, i.e. Markus, NAC P and Capintec, have been simulated. The Markus chamber has a narrower guard ring (0.3 mm width) compared with the NAC P chamber (3 mm width) and has been shown to exhibit a large in-scattering effect. The Capintec chamber has a thicker air cavity (2.4 mm thickness) compared with the other two chambers (2 mm thickness) and its guard ring width was reported to be either 0.5 or 2.4 mm [7, 8]. The dimensions o f the air cavities o f the chambers studied in this work are given in Table I.
In most cases, a point source o f monoenergetic electrons was used with 95 cm SSD and a 100 cm2 circular field. The electron incident energies were between 4 and 20 MeV. A cylindrical water phantom o f 20 cm diameter and 20 cm thickness was used. The depth o f maximum dose was obtained from the Monte Carlo calculated depth dose curves for the same water phantom and beam set-up (SSD and field size). In order to study the difference between thepcav factor for a point source and that for a broad parallel beam, a parallel beam with a field o f 100 cm2 was used.
In this work, /?cav has been calculated as the ratio o f the absorbed doses,
D^j/Dair, as defined by Eq. (6) for wall-less air cavities o f the same dimensions as the chambers listed in Table I. Dair was obtained as the dose to air averaged over

IAEA-SM-330/71 485
TABLE I. DIMENSIONS OF THE A IR CAVITIES OF THE PLANE PAR ALLE L CHAMBERS STUDIED IN THIS W ORK
ChamberCavity thickness
(mm)Collecting electrode diameter
(mm)Guard ring width
(mm)
Markus 2.0 5.4 0.3
NACP 2.0 10.0 3.0
Capintec 1 2.4 16.0 0.5
Capintec2 2.4 16.0 2.4
the collecting volume o f the air cavity with its front surface positioned at the reference depth. Dá¡r was calculated for a 0.6 mm thick disc o f unity density air (the same density as that o f water) centred at the same reference depth. The diameter o f the air disc was 5.4 mm. Dw was calculated for a 0.6 mm thick disc o f water o f 5.4 mm diameter also centred at the same depth.. Assuming that the perturbation o f the electron fluence due to the introduction o f the thin layer o f air in the water phantom is negligible, the ratio o f Dw to D'úr gives the stopping power ratio 5w air.
In order to investigate the validity o f the assumption that a plane parallel chamber is measuring the dose resulting from the electrons incident through the front window, the fractional doses resulting from the electrons coming through the front, side and back walls have been calculated. The contribution to the dose from the electrons incident through the front wall was eliminated by switching o ff electron transport in a 0.6 mm thick disc o f water o f the same diameter as the air cavity in front o f the air cavity. In this way the dose solely resulting from the electrons incident through the side and back walls was calculated. By further switching o ff electron transport in a 0.6 mm thick ring o f water whose height is the same as the thickness o f the air cavity (2 mm) surrounding the air cavity, the fractional dose resulting from the electrons coming around the edge o f the cavity and incident through the back wall was calculated. These calculations were likely to underestimate slightly the fractional doses because electrons coming through the side and back walls were terminated if they entered the region where electron transport was switched off. In reality, however, some o f them would have been scattered back into the air cavity again and deposited energy there. The fractional dose resulting from the electrons incident through the front wall can be obtained by subtracting the side and back wall dose components from the total dose. This will include the contributions from both the electrons incident through the front wall (first time entering the cavity) and those
scattered back into the cavity through the side and back walls (second time entering

486 MA and NAHUM
the cavity). The former can be estimated by calculating the dose in the air cavity in a water phantom with electron transport switched o ff in a thin ring o f water surrounding the air cavity (see above) and in the regions behind the air cavity. Such information is also useful in evaluating the effects o f electron backscattering from the non-water-equivalent chamber walls (see e.g. Ref. [9]).
3.2. Other calculational details
The Monte Carlo calculations have been carried out using the EGS4 code system with the user code DOSIMETER [10], which employs the PRESTA electron transport algorithm [ 11 ] and a correlated-sampling variance-reduction tech
nique [10]. The EGS4 parameters were set to AE = ECUT = 516 keV, AP = PCUT = 1 keV and ESTEPE = 0.01. The reason for the choice o f low AE and ECUT values is that the scattering effect o f very low energy electrons can be included. The stopping powers given by the International Commission on Radiation
Units and Measurements [12] were used in the calculations. The mass stopping powers for the real and unity density air were the same (i.e. the same density effect corrections). The statistical uncertainty o f the calculation was estimated by dividing the total number o f particle histories into ten batches and evaluating the estimate o f the variance o f the mean using the mean dose values obtained from each batch.
A ll the calculations have been carried out on three HP9000/720 workstations; each is about 30 times faster than a V A X 11/780. It has been found that the computer speed could be slowed down by up to 30% with the windows running and the non- HP-UNIX extension options chosen during the compilation. There was a significant
increase in computing speed when the HP optimization option was turned on but no difference was found between the computing speed with optimization level 2 (the default optimization level) and that with level 3 (the highest level) for the Monte Carlo calculations o f this work. To obtain pav factors with the stated statistical uncertainty required 10-20 d o f CPU time on a single HP9000/720, depending on the electron energy and the phantom depth.
4. RESULTS AND DISCUSSION
4.1. Variation o f with energy at L .
Table П gives the pcav factors for the chambers investigated in this work for electron incident energies between 4 and 20 M eV. The values o f the depth o f maximum ionization, dmax, were estimated on the basis o f the Monte Carlo calculated water depth dose curves. For a Markus chamber, pcm increases with energy from
0.984 at 4 M eV to 1.001 at 20 M eV. The NACP and Capintec2 chambers have similar pcav factors for the energy range investigated. For energies below 10 MeV, the

IAEA-SM-330/71 487
TABLE П. M ONTE CARLO CALCULATED PERTURBATION CORRECTION FACTORS pcav FOR THE W ALL-LESS PLANE PAR ALLE L CHAMBERS A T DEPTH IN W ATER IRRADIATED BY A POINT SOURCE OF
MONOENERGETIC ELECTRONS OF INCIDENT ENERGY E0 W ITH 95 cm
SSD AND 100 cm2 FIELD(The (la ) statistical uncertainty in the calculated correction factors was about 0.3% or better.)
E0(MeV)
max(mm)
Markus NACP Capintec 1 Capintec2
4 8.10 0.984 1.000 0.996 1.000
6 13.7 0.992 1.002 0.997 1.001
8 20.4 0.995 1.003 1.000 1.003
10 25.6 0.996 1.001 0.998 1.003
15 31.5 0.999 1.003 1.004 1.005
20 45.0 1.001 1.005 1.005 1.006
perturbation corrections are nearly negligible but for 20 M eV electrons corrections o f around 0.5% are required. However, these corrections may not be significant compared with the statistical uncertainties (about 0.3%). Owing to the narrower guard ring and the thicker air cavity o f the Capintec 1 chamber the pciW factors for this chamber generally lie between those for the Markus and NAC P chambers. Strictly, the pcav factors given in Table П are only valid for the stated radiation conditions (i.e. incident energy, phantom material, depth, SSD, field size, etc., see below).
4 .2 . V a r ia t io n o f p cav w i t h d e p th
Figure 1 shows the relative dose to air for a Markus chamber, an NACP chamber and a thin disc o f unity density air (see Section 3) in water irradiated by 4 and6 M eV electrons, respectively. Calculations were also made for the Capintec2 chamber but are not shown in the figures as this chamber has nearly the same (within 0.2%) response as that o f the NACP chamber. For comparison, the water depth dose curves are also given in the figures. It is evident that the depth ionization curves obtained using different chambers do not coincide with each other or with the water depth dose curves. The depth o f maximum ionization (i.e. the dose to the cavity air),

488 MA and NAHUM
FIG. 1.
Variation
with depth
of the absorbed dose to
air in an air cavity of
a Markus chamber
and
an NACP chamber
and
in a thin
disc of
unity
density
air, and
the absorbed dose to
water in a thin disc of
water
(see Section
3) in a water phantom
irradiated by
a point source of monoenergetic
electrons
with 95
cm SSD
and
100
cm2 field: (a) 4 MeV, (b) 6 MeV
incident energy.
The
(la) statistical uncertainty
in the calculated doses
was
about
0.4% for the Markus chamber
and
within 0.3% for the rest geometries.

4 M
eV
IAEA-SM-330/71 489
FIG. 2. Variation
with depth
of the
p
cav factors for
the Markus and
NACP
chambers in
a water
phantom
irradiated by
a point
source of
monoenergetic
electrons with 95
cm SSD
and
100
cm2 field: (a) 4 MeV, (b) 6 MeV
incident energy. The
(la) statistical uncertainty
in the calculated
doses
was
within 0.3%.

490 MA and NAHUM
eE
о.Q)Q
suoiioaia pejaiieos^oeq uiojj esop i b u o u o b j j
EE
Q.0)O
SU0J|33|3 P9J3UB9S-8P|S UIOJJ OSOp |BUO|lOejJ FIG. 3. Fractional doses
resulting from
electrons
coming through
(a) the side wall and
(b) the back wall of
the Markus and
NACP chambers at
various
depths in
water
irradiated by
a point source of
monoenergetic
4 MeV
electrons
with 95
cm SSD
and
100
cm2 field
(see Section
3). The
(la) statistical uncertainty
in the calculated fractional doses
was
about 0.005
in (a) and
(b) for total backscattered
electrons, and
about 0.002
in
(b) for
electrons
coming around the edge of
the air cavity.

IAEA-SM-330/71 491
¿max, determined using one chamber can be up to 1 mm different from that determined using another or from the depth o f maximum dose to water. This results in the change in /»<*v with depth as shown in Fig. 2. Corrections o f up to a few per cent are required for depths in the increasing and descending portions o f the depth dose curve. pcav is clearly a function o f depth and different pcm values are expected i f dmax is determined using different chambers or derived from the depth
o f maximum dose to water. This may explain, to some extent, the discrepancies in
Pcav reported in the literature.
4 .3 . F r a c t io n a l dose c a lc u la tio n s
In order to understand the behaviour o f the Markus and NACP chambers at different depths in water in an electron beam, fractional doses resulting from electrons coming through the front, side and back walls have been calculated for a 4 MeV electron beam (Fig. 3). It was found that the dose to the cavity air was mainly due to the electrons coming through the front wall (including those further backscattered into the air cavity through the side and back walls), especially at small depths. The fractional doses resulting from electrons incident through the side and back walls increased with depth. For an NACP chamber, the fractional dose resulting from the electrons incident through the side walls increased from 0.04 at 3 mm depth to 0.12 at 11.2 mm depth (Fig. 3(a)), while for a Markus chamber it increased from
0.11 to 0.29 for the same depth range. Electrons coming around the edge o f the air cavity and incident through the back wall had a very small effect on the chamber response (the fractional dose was smaller than 0.03 at any depth, see Fig. 3(b)). No significant difference has been found between the fractional doses for an NACP chamber at small depths in water when irradiated by a point source and when irradiated by a parallel beam. For larger depths (greater than 8 mm), however, the fractional dose resulting from the electrons coming through the side and back walls with a parallel beam was slightly greater than that with a point source. As the dose to water varies sharply for low energy electrons (the dose decreases by about 20% in the descending portion o f the depth dose curve for a 4 M eV beam over the extended volume o f the air cavity, i.e. 2 mm cavity thickness), a greater than 10% contribution from the electrons coming through the side and back walls will certainly have significant effects on the chamber response.
5. CONCLUSIONS
The pcaV factors for three commonly used plane parallel chambers have been calculated using the Monte Carlo method. For a particular chamber, p ^ varies with both phantom depth and electron energy. In general, at depths around that o f maximum ionization the NAC P and Capintec2 chambers require the smallest perturbation

492 MA and NAHUM
corrections while the Markus chamber exhibits the largest effect o f the electrons coming from the side and back walls on the response o f the chamber. This is consistent with the experimental results reported in the literature. The factors for the Capintec 1 chamber generally lie between those for the Markus and NACP chambers. Larger corrections are required for all the chambers studied in this work at depths in the increasing and descending portions o f the depth dose curve. This could partially be corrected for by shifting the effective point o f measurement o f the chamber.
A C K N O W L E D G E M E N T S
The authors would like to thank W. Charles for setting up the HP computers and D.W .O. Rogers for valuable discussions and comments on the manuscript. C.-M .M . was funded by the National Physical Laboratory, Teddington, United Kingdom, through an Extra Mural Research Agreement; he is grateful to the
National Research Council Canada, Ottawa, Canada, for additional financial
support.
R E F E R E N C E S
[1] INTERNATIONAL COMMISSION ON RADIATION UNITS AND MEASUREMENTS, Radiation Dosimetry: Electron Beams with Energies Between 1 and 50 MeV, ICRU, Rep. 35, Bethesda, MD (1984).
[2] HARDER, D., Einfluss der Vielfachstreuung von Elektronen auf die Ionisation in gas- gefiillten Hohlraumen, Biophysik 5 (1968) 157-164.
[3] SVENSSON, H., BRAHME, A., “ Recent advances in electron and photon dosimetry” , Radiation Dosimetry: Physical and Biological Aspects (ORTON, C.G., Ed.), Plenum Press, New York (1986) 87-170.
[4] OLOFSSON, L., NAHUM, A.E., An improved evaluation of the perturbation factor for ionisation chambers in electron beams, Med. Biol. Eng. Comput. 23 Suppl., Part I (1986) 619-620.
[5] NELSON, W.R., HIRAYAMA, H., ROGERS, D.W.O., The EGS4 Code System, Rep. SLAC-265, Stanford Linear Accelerator Center, Menlo Park, CA (1985).
[6] MA, С.-М., NAHUM, A.E., Calculation of the absorbed dose ratios using correlated Monte Carlo sampling, Med. Phys. (in press).
[7] REFT, C.S., KUCHNIR, F.T., Measurement of the replacement correction factor for parallel-plate chambers in electron fields, Med. Phys. 18 (1991) 1237-1243.
[8] ROGERS, D.W.O., Calibration of parallel-plate chambers: Resolution of several problems by using Monte Carlo calculations, Med. Phys. 19 (1992) 889-899.
[9] HUNT, M.A., KUTCHER, D.J., BUFFA, A., Electron backscatter correction for parallel-plate chambers, Med. Phys. 15 (1988) 96-103.
IAEA-SM-330/71 493
[10] MA, С.-М., Monte Carlo Simulation of Dosimeter Response Using Transputers, PhD Thesis, Univ. of London (Inst, of Cancer Research) (1991) (also available as Internal Report No. ICR-PHYS-1/92, Royal Marsden Hospital, Sutton, UK, 1992).
[11] BIELAJEW, A.F., ROGERS, D.W.O., PRESTA: The Parameter Reduced Electron- Step Transport Algorithm for electron Monte Carlo transport, Nucl. Instrum. Methods Phys. Res., Sect. В 18 (1987) 165-181.
[12] INTERNATIONAL COMMISSION ON RADIATION UNITS AND MEASUREMENTS, Radiation Dosimetry: Stopping Powers for Electrons and Positrons, ICRU Rep. 37, Bethesda, MD (1984).


IAEA-SM-330/4
INVESTIGATION OF THE NEW PROTOTYPE NPL DESIGN OF PLANE PARALLEL CHAMBER
Chang-Ming M A *, A.E. NAH UM
Joint Department o f Physics,Royal Marsden Hospital and
Institute o f Cancer Research,
Sutton, Surrey,
United Kingdom
A b s t ra c t
IN V E S T IG A T IO N O F T H E N E W P R O T O T Y P E N P L D E S IG N O F P L A N E P A R A L L E L
C H A M B E R .
T h e study describ ed is a im ed at investiga ting the new pro to type N ation a l Phys ica l
L a b ora to ry (N P L ) design o f p lane para lle l ion iza tion cham ber, w h ich is m ade fro m P M M A
and based on prin ted c ircu it board m ateria l w ith v e ry thin (0 .0 1 8 o r 0 .035 m m ) layers o f
cop p er as conducting m ateria l. M easurem ents com p arin g the n ew N P L cham bers w ith other
p lane para lle l cham bers (P T W / M a rk u s , N A C P ) h ave show n that the n ew cham ber has a
response that is n early en ergy independent o v e r a certa in range o f e lec tron energ ies . T h e
E G S 4 (E lec tron G am m a S h ow er ve rs ion 4 ) M o n te C a r lo code system has been used in this
w o rk to study the e ffe c t o f thin layers o f cop p er on the inside surface o f the a ir ca v ity on the
cham ber response. T h e results show that e lectron backscattering fro m the thin layers o f copper
p lays an im portant ro le in e leva tin g the dose to a ir in the a ir ca v ity o f the cham ber. Perturba
tion corrections o f 5 -1 5 % are requ ired fo r these cham bers at the depth o f m axim um ion iza tion
in P M M A irrad iated b y m on oen ergetic e lectron beam s o f en erg ies betw een 4 and 20 M e V .
T h e perturbation e ffe c t happens to a lm ost com pensate fo r the va ria tion o f-the stopping p o w e r
ratio fo r P M M A to a ir and th ere fo re results in a n early constant cham ber response o v e r a
certa in e lec tron en ergy range.
1. INTRODUCTION
According to the Hospital Physicists’ Association (HPA) Code o f Practice (1985) for electron beam dosimetry in radiotherapy [1], the measurement o f absorbed dose to water, Dw, in an electron beam is performed using an ionization chamber calibrated in terms o f air kerma in a phantom irradiated by a beam o f ^Co7 rays (to obtain a calibration factor N f for this chamber). The chamber reading M can then be converted to the dose to water through a dose conversion factor Ce, i.e.
Z>w = MNfCe (1)
* Curren t address: Ion iz in g R ad ia tion Standards, Institute fo r N ationa l M easurem ent
Standards, N ation a l Research C ou n cil Canada, O ttaw a, O n tario , Canada K 1 A 0R 6.
495
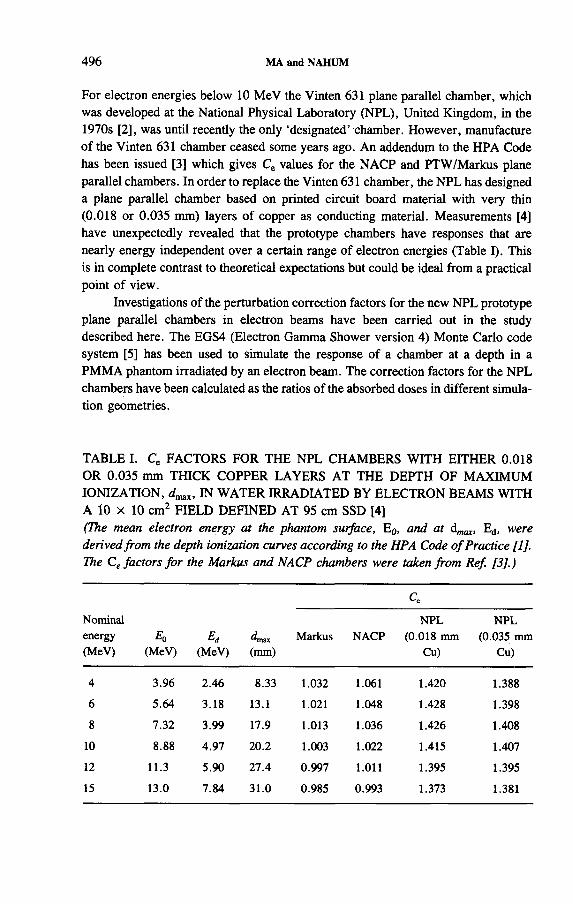
496 MA and NAHUM
For electron energies below 10 M eV the Vintén 631 plane parallel chamber, which was developed at the National Physical Laboratory (NPL), United Kingdom, in the 1970s [2], was until recently the only ‘designated’ chamber. However, manufacture o f the Vintén 631 chamber ceased some years ago. An addendum to the HPA Code
has been issued [3] which gives Ce values for the NACP and PTW/Markus plane parallel chambers. In order to replace the Vintén 631 chamber, the N PL has designed a plane parallel chamber based on printed circuit board material with very thin (0.018 or 0.035 mm) layers o f copper as conducting material. Measurements [4] have unexpectedly revealed that the prototype chambers have responses that are nearly energy independent over a certain range o f electron energies (Table I). This
is in complete contrast to theoretical expectations but could be ideal from a practical point o f view.
Investigations o f the perturbation correction factors for the new N PL prototype plane parallel chambers in electron beams have been carried out in the study described here. The EGS4 (Electron Gamma Shower version 4) Monte Carlo code system [5] has been used to simulate the response o f a chamber at a depth in a PM M A phantom irradiated by an electron beam. The correction factors for the N PL chambers have been calculated as the ratios o f the absorbed doses in different simulation geometries.
TABLE I. Ce FACTORS FOR THE N PL CHAMBERS W ITH EITHER 0.018 OR 0.035 mm THICK COPPER LAYERS A T THE DEPTH OF M AXIM U M
IO N IZATIO N , dun, IN W ATER IRRADIATED BY ELECTRON BEAMS W ITH A 10 X 10 cm2 FIELD DEFINED A T 95 cm SSD [4]
(The mean electron energy at the phantom surface, E0, and at d ^ , Ed, were derived from the depth ionization curves according to the HPA Code o f Practice [1]. The Ce factors for the Markus and NACP chambers were taken from Ref. [3].)
N om in a l
en ergy
(M e V )
E0(M e V )
Ed(M e V )
^max(m m )
Ce
M arkus N A C P
N P L
(0 .01 8 m m
C u )
N P L
(0 .035 m m
C u )
4 3.96 2 .46 8.33 1.032 1.061 1.420 1.388
6 5 .64 3.18 13.1 1.021 1.048 1.428 1.398
8 7.32 3.99 17.9 1.013 1.036 1.426 1.408
10 8.88 4 .97 20.2 1.003 1.022 1.415 1.407
12 11.3 5 .90 27 .4 0 .997 1.011 1.395 1.395
15 13.0 7 .84 31 .0 0.985 0.993 1.373 1.381

IAEA-SM-330/4 497
The definition o f the perturbation correction factor pu for a plane parallel ionization chamber used in electron beams has been discussed in depth in Ref. [6]. In general, assuming that the stopping power ratio for the phantom material to air at the reference depth in the phantom in the absence o f the chamber, sm air, is known,
the absorbed dose to the phantom material at the reference depth, D m, can be calculated as
^m(Peff) — ^m.aitPu air (2)
where Dair is the absorbed dose to air in the air cavity o f the ionization chamber with its effective point o f measurement, Peff (taken to be the centre o f the inner surface o f the entrance window for a plane parallel chamber [ 1]), at the reference depth. Equation (2) effectively defines the perturbation factor pu as correcting for any
deviation o f the chamber response from the predictions o f the Bragg-Gray cavity theory (see e.g. Ref. [7]). The perturbation factor pu can be calculated as
- m , Д
2. THEORY
dE + (T E )m D ,
P* = ~ F I-------:---------------------- -- = 7 Г (3)] д“ # f rL air dE + (Т Е )ШГ air
where Ф” is the electron fluence at the reference depth in a phantom in the absence o f the chamber, Ф“ г the electron fluence in the air cavity o f the chamber with its effective point o f measurement at the reference depth, L air the restricted mass collision stopping power o f air, and TE a track-end term which accounts for the contribution to the absorbed dose o f electrons in the energy range Д to 2Д which undergo inelastic collisions in which both electrons drop below the cut-off energy Д [7].
In practice, pu is usually divided into a number o f independent multiplicative correction factors which account separately for the effects o f the perturbation o f the electron fluence at the measurement position due to the replacement o f water by the
air cavity, and the non-phantom-equivalent chamber wall (including electrode) and stem (and/or cable), i.e.
Pu ~ PcavPwalLPstem (4)
The /?cav factors for wall-less air cavities o f dimensions like those in several commonly used plane parallel chambers, such as Markus, NACP and Capintec, have been reported in Ref. [6]. In this work we investigate the perturbation due to the replacement o f the phantom material by a copper-layered chamber, i.e. pcm and
Pwaib Pitem does not apply.

498 МЛ and NAHUM
3. M ONTE CARLO CALC U LATIO N
3.1. Simulation geometry
The geometrical details o f the prototype N PL chamber are shown in Fig. 1.
There are currently two versions o f this design, depending on the thickness o f the copper layers used in the chamber: (1) 0.018 mm and (2) 0.035 mm. The thickness o f the entrance window is therefore different for each o f the chamber versions. For the chamber with 0.018 mm thick copper layers, the effective point o f measurement was taken to be 0.154 g-cm "2 below the front surface o f the chamber, while for the
chamber with 0.035 mm thick copper layers it was taken to be 0.184 g-cm ’2 below the chamber surface.
The pcav factor has been calculated as the ratio o f the absorbed dose to air in a thin (0.035 mm thickness and 10 mm diameter) disc o f unity density air centred at the reference depth to that in the air cavity with its front surface at the reference depth. The /?wall factor has been calculated as the ratio o f the absorbed dose to air in the wall-less air cavity to that in the air cavity o f the N PL chamber with its effective point o f measurement at the same depth as that o f the wall-less cavity. A point
HT electrode D=30.0 ^4 **
i1.0
T
_ sL1.0
\ ^
и
3.0 l£collector 0=20.0
air cavity Д=28.0 -3.0T
Perspex
copper 0.018
polyimide 0.025
copper 0.018
FIG. 1. Cross-section of the NPL plane parallel chamber with 0.018 m m thick copper layers (dimensions are in millimetres). For a 0.035 m m thick copper-layered version, the geometry
is exactly the same except for the greater thickness of the copper layers.

IAEA-SM-330/4 499
source o f monoenergetic electrons was used with 95 cm SSD and a 100 cm2 circu
lar field. The chamber was placed at the depth o f maximum ionization, dmax, in a 20 x 20 x 20 cm3 cubic PM M A phantom. The values were derived from the
Monte Carlo calculated depth dose curves for the same phantom and beam set-up (SSD and field size).
In order to investigate the effect o f electron backscattering from the thin layer o f copper on the response o f the chamber, calculations o f the absorbed dose in the first three layers (each 0.1 mm thick) o f a water cylinder o f 50 mm diameter and
4 mm thickness irradiated by a pencil beam o f monoenergetic electrons have been carried out. A layer o f water behind the three scoring regions was in turn replaced by a layer o f copper o f the same thickness (0.018, 0.043 , 0.061 and 0.37 mm, respectively). The electron backscatter factor was calculated as the ratio o f the absorbed dose to water averaged over the first 0.3 mm thickness o f water with 3.7 mm thickness o f water as backscattering material to that with a layer o f water behind the dose scoring region replaced by a layer o f copper o f the same thickness plus remaining water as backscattering material.
3 .2 . O th e r c a lc u la tio n a l d e ta ils
The EGS4 Monte Carlo code system has been used to calculate the absorbed doses in various geometries to obtain the perturbation factors for the prototype chambers. The calculations were carried out with the user code DOSIMETER [8, 9], which employs the PRESTA electron transport algorithm [10] and a correlated- sampling variance-reduction technique [8, 11]. The EGS4 parameters were set to AE = ECUT = 512 keV, A P = PCUT = 1 keV and ESTEPE = 0.01. Investigations o f the effect o f ESTEPE for a 4 M eV electron beam showed that the absolute chamber response varied by about 3 % when ESTEPE was reduced from 1.00 to 0.01 but the variation o f the ratio o f the absorbed doses in PM M A and air was within 1 % (the statistical uncertainty in these calculations was about 0.6%). For ESTEPE values smaller than 0.1 the variation o f the dose ratio was negligible compared with the calculational uncertainties. The stopping powers given by the International Commission on Radiation Units and Measurements [12] were used in the calculations. The same mass stopping power values were used for the real and unity density air
(i.e. the same density effect corrections). The calculations were carried out on HP9000/720 workstations. For the calculations discussed in Section 4, it took about 150 h o f CPU time to achieve a statistical uncertainty o f about 1% (equivalent to about 5000 h on a V A X 11/780).
4. RESULTS AND DISCUSSION
Figure 2 shows the pwa¡í factors for the prototype N PL chambers at the depth o f maximum ionization in a PM M A phantom irradiated by a point source o f

500 MA and NAHUM
Incident energy (M eV)
FIG. 2. The perturbation factor pwaU for the copper-layered NPL chambers with their effec
tive point of measurement at d ^ in a P M M A phantom irradiated by a point source of monoenergetic electrons, calculated as the ratio of the absorbed dose to air in a wall-less air
cavity to the dose to air in the air cavity of the NPL chamber (see Section 3).
monoenergetic electrons o f incident energies between 4 and 20 MeV. Corrections o f 5-15 % are required for the prototype chambers in the energy range investigated. The prototype chamber with 0.035 mm thick copper layers requires much larger corrections than the chamber with 0.018 mm thick copper layers. For the latter, pwall decreases with incident energy from about 0.950 at 20 M eV to about 0.907 at 4 M eV, while for the former />waU decreases from about 0.928 to about 0.844 over the same energy range. The (lor) statistical uncertainty in the Monte Carlo calculated wall perturbation corrections was about 1 %.
One o f the possible explanations for the dose increase in an air cavity surrounded by thin layers o f copper is electron backscattering from the copper layer. Figure 3 gives the electron backscatter factor as a function o f energy for copper
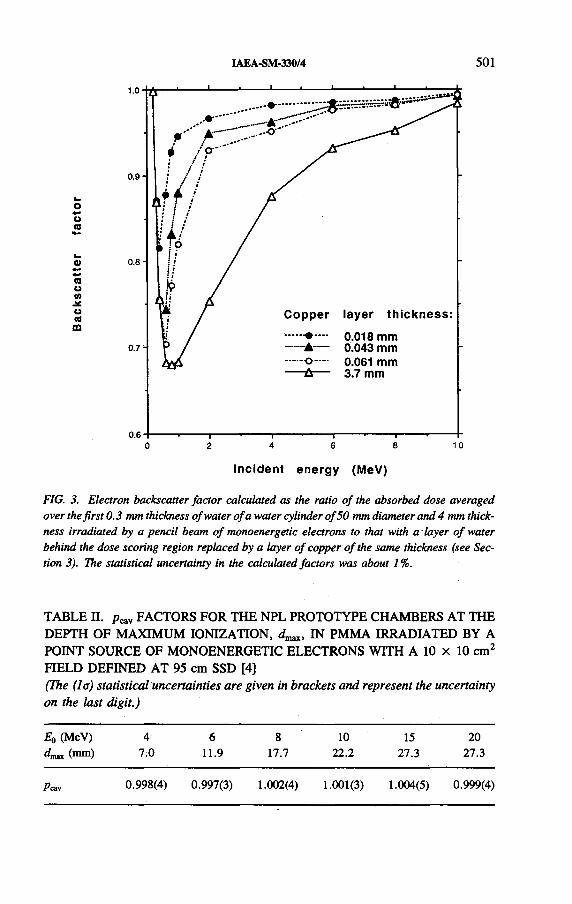
IAEA-SM-330/4 501
оя
ceoM•Xonm
Incident energy (M eV)
FIG. 3. Electron backscatter factor calculated as the ratio of the absorbed dose averaged over the first 0.3 m m thickness of water of a water cylinder of 50 m m diameter and 4 m m thickness irradiated by a pencil beam of monoenergetic electrons to that with a layer of water
behind the dose scoring region replaced by a layer of copper of the same thickness (see Sec
tion 3). The statistical uncertainty in the calculated factors was about 1%.
T A B L E П . p cav F A C T O R S F O R T H E N P L P R O T O T Y P E C H A M B E R S A T T H E
D E P T H O F M A X I M U M I O N I Z A T I O N , d ш , I N P M M A I R R A D I A T E D B Y A
P O I N T S O U R C E O F M O N O E N E R G E T I C E L E C T R O N S W I T H A 10 X 10 c m 2
F I E L D D E F I N E D A T 9 5 cm S S D [4 ]
(The (la) statistical uncertainties are given in brackets and represent the uncertainty on the last digit.)
Eq (MeV) 4 6 8 10 15 20dш (mm) 7.0 11.9 17.7 22.2 27.3 27.3
Peav 0.998(4) 0.997(3) 1.002(4) 1.001(3) 1.004(5) 0.999(4)

502 MA and NAHUM
«<
SQ.
О4-*СВ
а>иотэ
о>
а>ос
Incident energy (MeV)
FIG. 4. Ratio of the absorbed dose to P M M A to the dose to air in the air cavity of the NPL
chamber at the depth of maximum ionization in a P M M A phantom irradiated by a point source
of monoenergetic electrons, normalized to the values for a 20 MeV beam. The (la) statistical uncertainty in the calculated dose ratios was about 1 %. The experimental data were derived
from Ref. [4] by normalizing the Ce factor for the NPL chamber to the values at 22 MeV
nominal energy. The experimental uncertainty was estimated to be about 1 %. The stopping power ratios, sPMMA ш>, were taken from Ref. [13].
layers o f different thicknesses. It can be seen that the effect o f electron backscattering from a thin layer o f copper is a function o f both electron energy and the thickness o f the copper layer. For a 0.018 mm thick copper layer, the absorbed dose in water in front o f the copper layer is increased by up to 20% at about 400 keV but by less than 4% at 4 MeV. For thicker copper layers, the maximum backscattering effect occurs at higher energies. For example, a 0.061 mm thick copper layer increases the dose by more than 30% at 600 keV. For electron energies below 200 keV, electron
ranges become small and so does the effect o f the backscattered electrons. Only the dose in the scoring region very close to the copper layer (the third water layer from

IAEA-SM-330/4 503
the front surface) is elevated, while for the first two water layers the dose is barely affected.
According to the calculations o f this study, the p CiV factor for the N PL cham
ber at dmax is generally unity for the whole energy range investigated (Table П). The 1er statistical uncertainty in the calculated pcav was about 0.5%. Our results
confirm that for a well guarded plane parallel chamber at dmaX, the pCiV factor would be close to unity.
According to Eq. (2), the ratio o f the absorbed dose to PM M A to the dose to air in the air cavity o f an ionization chamber is given by the product o f the stopping power ratio for PM M A to air and the perturbation factor. For the N PL chamber with0.018 mm thick copper layers, the perturbation factor increases with energy by
about 4% from 4 to 10 M eV (Fig. 2). This nearly compensates for the change in
SpMMA.air and therefore results in a nearly constant chamber response over this energy range (Fig. 4). For the chamber with 0.035 mm thick copper layers, the variation o f the chamber response with energy is within 1-2% for energies between 4 and 15 M eV. For higher energies, pa becomes nearly constant and the dose ratio
for PM M A to air decreases with energy at the same rate as 5PM M A,air- For an ideal chamber (i.e. pu = 1), the chamber response will vary with energy at the same rate as the stopping power ratio by nearly 7% for the same energy range. The Monte
Carlo calculations are consistent with the experiments to within the combined uncertainties o f about 1.5%.
5. SUM M ARY
The EGS4 Monte Carlo code system has been used in this work to simulate the response o f the prototype N PL chamber at the depth o f maximum dose in a PM M A phantom irradiated by a point source o f monoenergetic electrons. The perturbation correction factors have been calculated as the ratios o f the absorbed doses in various geometries using a correlated-sampling method. Our calculations strongly suggest that the large perturbation for the copper-layered N PL chamber is the effect o f electron backscattering from the thin layers o f copper surrounding the air cavity. The combined perturbation effect happens to compensate for the variation o f the stopping power ratio for the phantom material to air. The results show that the response o f the N PL chambers is constant to within 1-2% over a certain range o f
electron energies, depending on the thickness o f the copper layers used. It seems possible, therefore, to design a chamber with copper layers o f a particular thickness in order to achieve à constant response over a limited energy range. W e have also investigated the behaviour o f the N PL chambers at other depths besides dma*. We
have found that the energy independence o f the response does not work so well away from dmax. W e attribute this to the fact that the angular distribution as well as the energy distribution changes with depth.

504 MA and NAHUM
ACKN O W LE D G EM EN TS
The authors would like to thank W. Charles o f their department for setting up the HP computers, and D. Bums and R. Sanders o f the National Physical Laboratory, Teddington, for helpful discussions. C.-M .M . was funded by the N PL through an Extra Mural Research Agreement; he is grateful to the National Research Council Canada, Ottawa, for additional financial support.
REFERENCES
[1] HOSPITAL PHYSICISTS’ ASSOCIATION, Code of practice for electron beam dosimetry in radiotherapy, Phys. Med. Biol. 30 (1985) 1169-1194.
[2] MORRIS, W.T., OWEN, B., An ionisation chamber for therapy-level dosimetry of electron beams, Phys. Med. Biol. 20 (1975) 718-727.
[3] INSTITUTE OF PHYSICAL SCIENCES IN MEDICINE, Addendum to the code of practice for electron beam dosimetry in radiotherapy (1985): Interim additional recommendations, Phys. Med. Biol. 37 (1992) 1477-1483.
[4] MA, C.-М., KNIGHT, R.T., NAHUM, A.E., MAYLES, W.P.M., Measurement of the Ce Factors for the Prototype NPL Design of Plane-Parallel Chambers (in preparation).
[5] NELSON, W.R., HIRAYAMA, H., ROGERS, D.W.O., The EGS4 Code System, Rep. SLAC-265, Stanford Linear Accelerator Center, Menlo Park, CA (1985).
[6] MA, C.-М., NAHUM, A.E., IAEA-SM-330/71, these Proceedings.[7] INTERNATIONAL COMMISSION ON RADIATION UNITS AND MEASURE
MENTS, Radiation Dosimetry: Electron Beams with Energies Between 1 and 50 MeV, ICRU Rep. 35, Bethesda, MD (1984).
[8] MA, С.-М., Monte Carlo Simulation of Dosimeter Response Using Transputers, PhD Thesis, Univ. of London (Inst, of Cancer Research) (1991) (also available as Internal Report No. ICR-PHYS-1/92, Royal Marsden Hospital, Sutton, UK, 1992).
[9] MA, С.-М., NAHUM, A.E., Dose conversion and wall correction factors for Fricke dosimetry in high-energy photon beams: Analytical model and Monte Carlo calculations, Phys. Med. Biol. 38 (1993) 93-114.
[10] BIELAJEW, A.F., ROGERS, D.W.O., PRESTA: The Parameter Reduced Electron- Step Transport Algorithm for electron Monte Carlo transport, Nucl. Instrum. Methods Phys. Res., Sect. В 18 (1987) 165-181.
[11] MA, С.-М., NAHUM, А.Е., Calculation of the absorbed dose ratios using correlated Monte Carlo sampling, Med. Phys. (in press).
[12] INTERNATIONAL COMMISSION ON RADIATION UNITS AND MEASUREMENTS, Radiation Dosimetry: Stopping Powers for Electrons and Positrons, ICRU Rep. 37, Bethesda MD (1984).
[13] AMERICAN ASSOCIATION OF PHYSICISTS IN MEDICINE, A protocol for the determination of absorbed dose from high-energy photon and electron beams, Med. Phys. 10 (1983) 741-771.

IAEA-SM-330/41
OPTIMUM CALIBRATION OF NACP TYPE PLANE PARALLEL IONIZATION CHAMBERS FOR ABSORBED DOSE DETERMINATION IN LOW ENERGY ELECTRON BEAMS
A. KOSUNEN, H. JÀRVINEN, P. SIPILÀ Finnish Centre for Radiation and Nuclear Safety,
Helsinki, Finland
Abstract
OPTIMUM CALIBRATION OF NACP TYPE PLANE PARALLEL IONIZATION CHAMBERS FOR ABSORBED DOSE DETERMINATION IN LOW ENERGY ELECTRON BEAMS.
For absorbed dose measurements of low energy electron beams in external radiotherapy, plane parallel ionization chambers are recommended. The calibration of such chambers can be carried out either in a high energy electron beam by comparison with a cylindrical chamber, or in a “ Со y beam on the basis of the known air kerma rate at the calibration point. The former is generally considered as a primary method, while Secondary Standard Dosimetry Laboratories (SSDLs) can usually apply only the latter method. The detailed procedure of “ Со y beam calibration has not been well established, except in the Nordic countries, and it has been shown that the correction factors needed in “ Co calibration are very sensitive to even minor differences in the construction materials of the chambers. New methods for calibration at mCo y beams by the SSDLs have been proposed, and the preferred method is still under discussion. The calibration related correction factors k^, (fcmfcatt)pp and pu pp have been determined experimentally for a number of NACP type plane parallel chambers manufactured by two companies (Scanditronix and Dosetek). Results indicate that up to 3-4% chamber to chamber variations in these factors are possible, as no significant differences between the chambers manufactured by the two companies were detected. Direct calibrations of the NACP plane parallel chambers in electron beams with a single high quality thimble chamber as a reference are recommended.
1. INTRODUCTION
For absorbed dose measurements o f low energy electron beams in external radiotherapy, plane parallel ionization chambers are recommended. According to recommendations by the Nordic Association o f Clinical Physics (NAC P) [1] the NACP type plane parallel chamber shall be used in absorbed dose determinations in low energy electron beams. The N AC P formalism for low energy (< 1 0 M eV ) dose measurements has also been adopted in the Code o f Practice o f the International
Atomic Energy Agency (IAE A ) [2].
505

506 KOSUNEN et al.
The calibration o f plane parallel chambers can be carried out either in a high energy electron beam by comparison with a cylindrical chamber, or in a “ Co 7 beam on the basis o f the known air kerma rate at the calibration point [1 ,2 ]. The former is generally considered as a primary method, while Secondary Standard Dosimetry Laboratories (SSDLs) can usually apply only the latter method. The detailed procedure o f “ Co 7 beam calibration has not been well established [3],
except in the Nordic countries [1], and it has been shown that the correction factors needed in ^Co calibration are very sensitive to even minor differences in the construction materials o f the chambers [4, 5]. New methods for calibration at “ Co 7 beams by the SSDLs have been proposed [3, 5], and the preferred method is still under discussion.
The scope o f the study described here was twofold. Firstly, it was investigated whether there are fundamental differences between NACP type chambers o f nomi
nally the same kind manufactured by two companies (NACP chambers made by Scanditronix, Sweden, and Calcam chambers made by Dosetek, Finland). Secondly,
different calibration methods were studied to find out which one would give the best consistency for plane parallel chamber calibrations. Calibrations in air in a ^Co 7 beam with and without a PM M A backscattering phantom were studied. Calibrations in a water phantom in a ^Co 7 beam were also performed. The consistency o f the direct calibration in an electron beam was also estimated.
Very similar problems have been investigated by several authors, most recently by Rogers [4], Andreo et al. [5] and Wittkamper et al. [6].
2. FORM ALISM , M ATERIALS AND METHODS
2.1. Basic formulas and critical parameters
As far as possible the notation used by the IAE A for the parameters has been adopted. The notation used by the NACP has been adopted for the parameters concerning the NAC P chamber.
The basic aim o f the ionization chamber calibration is to determine the ratio o f the absorbed dose to air inside the air cavity o f the chamber to the charge measured, i.e. the absorbed dose to air factor ND. This is needed for the calculation o f the absorbed dose to water from measurements in water, using the Bragg-Gray principle.
To determine ND from absorbed dose to water measurements and using the cylindrical chamber as a reference, ND can be formulated as follows:

IAEA-SM-330/41 507
where p a is the perturbation correction factor for different electron production and scattering in the chamber wall and in air compared with water, corrects for the
total effect (in calibration and in measurement) o f the central electrode non-air equivalence o f the cylindrical chamber, Mpj is the pressure, temperature and recombination corrected reading o f the electrometer, and indices “ pp” and “ cyl” refer to the plane parallel and cylindrical chambers respectively.
I f the calibration o f the plane parallel chamber is performed in water in a high energy electron beam (method ( 1) in the following) the critical parameters affecting the consistency o f calibrations are the pu and pcei factors for the cylindrical cham
ber. pu for the NAC P plane parallel chamber in the electron beam is assumed to be Г.000 as the chamber is well guarded (3 mm thick guard ring).
I f the calibration is performed in water in a ^Co y beam (method (2) in the following) p ü values for both the cylindrical and the plane parallel chamber become critical. pu for the plane parallel chamber can no longer be taken as 1.000 and the
expected uncertainty is also increased.To determine ND from air kerma measurements and using the cylindrical
chamber as a reference, ND can be formulated as follows:
N ^air(l - g )kpp (2),PP M TM pT, pp
where KaiT is the air kerma free in air at the calibration point, g is the fraction o f the energy o f secondary electrons lost to bremsstrahlung in air and MpTpp is the pressure, temperature and recombination corrected reading o f the electrometer. According to the NACP [1], the measurement by the NACP chamber is performed at a depth o f 4 mm in a Perspex phantom. Factor к р is the product o f three factors, km, katt and the backscatter from the PM M A phantom used in the calibration: km takes into account the lack o f air equivalence o f the ionization chamber material; kM takes into account the attenuation and scatter o f the photons in the ionization chamber material, including the buildup cap.
When air kerma measurement by the NAC P chamber is performed using a graphite buildup cap without the backscattering phantom, the notation (&mfcatt)pp is used instead o f kpp. In the calibration in air in a ^C o у beam (method (3) in the following) the factor Jkpp or (fcmfcatt)pp is the critical parameter.
2.2. Evaluation ô f the consistency o f calibrations
The direct calibration o f the plane parallel chamber in a high energy electron beam (method (1)) must usually be carried out by the user o f the equipment. The consistency to be expected in such calibrations can be evaluated by comparing results o f absorbed dose measurements at various electron beam energies using different

508 KOSUNEN et al.
cylindrical chambers (the reference chambers at calibration). The published values for pu cyl and pœl (Eq. (1)) are then applied.
The consistency o f the calibrations at ^C o y radiation (methods (2) and (3)) is dependent on the consistency o f factor pu>pp (Eq. (1)) or kpp (Eq. (2)) for different
plane parallel chambers, whether exactly or nominally o f the same type. These factors must be considered unknown a priori and their values have to be determined for each nominally different type o f plane parallel chamber. For non-homogenous cham
bers, as the great majority o f plane parallel chambers used in practice are, theoretical calculations o f pu pp and kpp are very difficult and their values must be determined experimentally, making use o f calibration method (1). This is the reason why methods (2) and (3) are considered secondary to method (1), which is considered primary.
The consistency o f calibrations through methods (2) and (3) can now be evaluated by studying the consistency o f pu pp and fepp for different plane parallel cham
bers. By determining ND pp through method (1) in an electron beam, factors pu pp and kpp can be calculated from Eqs (1) and (2) respectively.
2.3. Chambers and other equipment
2.3.1. Calibrations and measurements in electron beams
To estimate the consistency o f calibrations in electron beams with different cylindrical chambers as the reference, the data from nine calibrations o f high energy electron beams (> 1 8 M eV ) were analysed. In each calibration two cylindrical chambers were used, one from the Finnish Centre for Radiation and Nuclear Safety (STUK) and the other from the user. A ll chambers were thimble chambers o f type NE 2571. Data were collected from the routine calibrations performed during site visits by STUK. The accuracy o f these routine measurements was not as high as expected from the proper calibrations o f dosimeters. For example, the output o f the accelerator electron beam was not normalized to an extra reference (see below). Philips SL25, CGR Saturne 20 and Varian Clinac 1800 and Clinac 2500 accelerators were involved. Both scattering foil and scanning beam electrons o f the Saturne accelerators were used.
For the determination o f ND pp needed for the evaluation o f methods (2) and(3), two electron beams o f nominally 20 M eV were used from Varian Clinac 2500 and Clinac 1800 accelerators. The IAE A formalism [2] was followed for the determination o f the energy parameters. The depth dose curve was measured using the NAC P chamber. Two cylindrical ionization chambers o f type NE 2571 were used, one with aluminium and the other with graphite central electrode. The chamber with the graphite central electrode was our own modification (Table I). The latter type was included to check the value o f the pce¡ correction. Three reference ionization chambers (0.1 cm3, Therados RK type) were used parallel to the measuring cham-

TABLE I. CHARACTERISTICS OF THE IO N IZATIO N CHAMBERS USED
IAEA-SM-330/41 509
NE 2561 standard
NE 2571 NE 2571 modified8
Type 1 (separate
waterproof housing)
NACP-1 Calcam-1
Type 2 (watertight)
Calcam-2
Cavity dimensionsLength (mm) 9.2 24.0 24.0 2.0 2.0 2.0Diameter (mm) 7.4 6.3 6.3 16.4 16.4 16.4
WallMaterial Graphite Graphite Graphite Graphite Graphite GraphiteThickness (g/cm2) 0.09 0.065 0.065Thickness (mm) 0.5 0.5 0.5
ElectrodeMaterial Aluminium Aluminium Graphite Graphitized Graphitized Graphitized
polystyrene polystyrene polystyreneDiameter (mm) 1.7 1.0 0.9 10.0 10.0 10.0
Buildup capMaterial Deldrin Graphiteb GraphitebThickness (g/cm2) 0.600
8 Graphite central electrode modification by the authors. b Buildup cap of the SSDL Helsinki.
ber. Two o f the reference chambers were placed at the opposite corners o f the collimated beam in order to control the symmetry o f the beam during the measurements. The third reference chamber was in water below the measuring chamber and all the measurements were normalized to this refemece. At least five readings were taken for each measurement. The symmetry variation was less than 0.5%.
A ll measurements in electron beams were performed at the depth o f maximum dose. The polarity effect o f the chambers (ratio o f the charges collected with negative and positive collecting voltages) was checked and the recombination correction was determined using the Boag formulation. The atmospheric and recombination corrections were taken into account for all chambers used. The polarity effect was less than 0.5% for all the plane parallel chambers and less than 0.2 % for all the cylindrical chambers. The recombination correction was less than 1.5 % for all the plane parallel chambers except for one chamber o f type NACP-01 (serial No. 03-10), for which it was 2.3%. For all the cylindrical chambers the recombination corrections were less than 2.3%.

510 KOSUNEN et al.
2.3.2. Calibrations in water in 60Со y beam
To estimate the consistency o f the calibrations in water in a ^C o y beam, pu for the plane parallel chambers was used as the parameter for comparison and calculated from Eq. (1). ND for the plane parallel chambers was determined from the
comparison with cylindrical chambers in a high energy electron beam. The absorbed dose to water in the ^Co 7 beam was determined by a secondary standard chamber o f type NE 2571. The standard chamber was calibrated for the absorbed dose to water at the Bureau international des poids et mesures (BIPM ) in 1992.
For these calibrations two groups o f the same type o f plane parallel chamber were used: three NACP-1 and two Calcam-1 chambers. Characteristics o f all the ionization chambers used are presented in Table I. The calibrations in water in the ^C o 7 beam were performed at a depth o f 5 cm and a source to chamber distance o f 1 m. The field size was 10 cm X 10 cm. For the NACP chambers the middle o f the air cavity was positioned at the calibration distance.
2.3.3. Calibrations in air in 60Co 7 beam
To estimate the consistency o f the calibrations in air in the “ Co 7 beam, fcpp
and (fcmfcatt)pp were used as the parameters to be compared. Either or (£,Att)pp was calculated from Eq. (2). ND was determined from the comparison o f the plane parallel and the cylindrical chamber in a high energy electron beam (as above). was determined using the secondary standard (NE 2561). The method for determination o f kpp is the same as used by Andreo et al. [5] and Wittkamper et al. [6].
In measurements with the PM M A backscattering phantom three groups o f plane parallel chambers were used: three NACP-1, two Calcam-1 and seven Calcam-2 chambers (Table I). In the air measurements without the backscattering
phantom only the NACP-1 and Calcam-1 chambers were used, and graphite was used as a buildup material. The thickness o f the graphite buildup cap was 3 .95 mm, with a density o f 1.63 g/cm3. The backscatter factor was determined using the NACP-1 and Calcam-1 chambers and four Calcam-2 chambers. In all measurements in air the separate waterproof housing o f the NACP-1 and Calcam-1 chambers was
removed.
3. RESULTS AN D DISCUSSION
The maximum difference between the measured absorbed doses to water inhigh energy electron beams using different cylindrical chambers was 1 .1 %.
The results for the fcpp, (&т&ап)рр and pu pp values are presented in Table П.For ifcpp the variations from chamber to chamber are large for all types o f NACP chamber. For NACP-1 chambers the variation (max./min.) is 1.9%, for Calcam-1

IAEA-SM-330/41 511
TABLE II. VALUES OF kpp, (kJcM)pp AND pu>pp FOR THE NACP TYPE
CHAMBERS TESTED
Chambertype k?P ( nAatt)pp Pu,pp
Type 1Calcam-1 1.000 0.961 1.026
1.032 0.996— Max./min. (%) 3.2 3.6— Mean 1.016 0.979
NACP-1 1.001 0.963 1.0251.020 0.979 1.0101.009 0.966 1.026
— Max./min. (%) 1.9 1.7 1.6— Mean 1.010 0.969 1.020
Type 2Calcam-2 1.017
1.0121.0231.0111.0131.0151.032
— Max./min. (%) 2.1— Mean 1.017
Estimated uncertainty,type A (%) 0.5 0.5 0.7
chambers 3.2% and for Calcam-2 chambers 2.1%. The chamber to chamber variations for all types o f NACP chamber are much larger than the differences between the mean values for the chamber types. The difference in kpp is 0.6% between the mean values o f types NACP-1 and Calcam-1 and 0.7% between those o f types NACP-1 and Calcam-2.
Compared with the к р values reported by other workers significant differences can be found. The kpp value determined by Andreo et al. [5] for NACP-1 chambers was 0.992. Our mean value for NACP-1 chambers is 1.010, which is 1.8% higher. For NACP-2 chambers (watertight model made by Scanditronix) Andreo et al. obtained 0.998 for kpp. Our comparable value for Calcam-2 chambers
(1.017) is 1.9% higher. However, for Calcam-2 chambers these differences can be
512 KOSUNEN et al.
partly explained by the higher measured backscatter. Our experimental backscattering factor, determined with four Calcam-2 chambers, was 1.039 ± 0.001. This is0.8% higher than the value o f 1.031 quoted by Mattsson et al. [7].
For (fcmfcatt)pp the chamber to chamber variation is 1.7% for the NACP-1
chambers tested. The mean value o f (¿mfcatt)pp is 0.969. For the two Calcam-1 chambers the difference is surprisingly high: 3.6%. I f the difference between the thicknesses o f the graphite and Perspex buildup caps (about 0.7% higher attenuation for graphite) and the measured backscatter with the Perspex phantom for both NACP-1 and Calcam-1 chambers (1.031) are taken into consideration, the mean values
obtained for /Cpp and (&nAm)pp are consistent to within 0.5%. Compared with the
results o f Wittkamper et al. [6] our (fcmfcatt)pp values for NACP-1 chambers are about 1.0% smaller. Wittkamper obtained a value o f 0.980. This difference for NACP-1 chambers is explained by the thicker graphite buildup cap that we used.
For pa pp the chamber to chamber variation is 1.6% for the three NACP-1 chambers tested. The mean value o f pu pp is 1.020. Wittkamper obtained 1.012 [6] on the basis o f a comparison o f measurements with plane parallel and thimble type chambers (with pu cyl for a thimble chamber in a “ Со y beam). Our value is based on the direct calibration o f the thimble chamber for absorbed dose to water.
For the NE 2571 chamber with the aluminium central electrode the obtained value o f pœl was 1.006. This is 0.2% lower than thepce\ correction suggested by the IA E A [1].
4. CONCLUSIONS
For factors fcpp, (£щ&ап)рр and Pa.pp, chamber to chamber variations o f up to 3-4% are possible within nominally the same type o f plane parallel chamber, while the differences in the mean values between different types seem to be less than 1 %. I f the mean value o f the factors is used in the calibration o f plane parallel chambers in a “ Со у beam, differences o f up to 2 % are expected when compared with direct calibration in a high energy electron beam.
On the other hand, the consistency o f careful calibrations with the user’s instruments in a high energy electron beam is expected to be somewhat better than about 1%. This could be improved, and the general advantage o f the consistent SSDL calibrations partly retained, i f the known high quality and well controlled equipment o f the SSDL is used as the reference in all electron beam calibrations (e.g. in connection with quality audit site visits by the SSDL).
In summary, direct calibrations in electron beams should be preferred. For the best consistency, the same piece o f high quality reference equipment should be used in all calibrations o f plane parallel chambers in user beams.

IAEA-SM-330/41 513
REFERENCES
[1] NORDIC ASSOCIATION OF CLINICAL PHYSICS, Electron beams with mean energies at the phantom surface below 15 MeV, Supplement to the recommendations by the NACP (1980), Acta Radiol., Oncol. 20 (1981) 401-415.
[2] INTERNATIONAL ATOMIC ENERGY AGENCY, Absorbed Dose Determination in Photon and Electron Beams: An International Code of Practice, Technical Reports Series No. 277, IAEA, Vienna (1987).
[3] ATTIX, F.H., A proposal for the calibration of plane parallel ion chambers by accredited dosimetry calibration laboratories, Med. Phys. 17 (1990) 931-933.
[4] ROGERS, D.W.O., Calibration of parallel-plate chambers: Resolution of several problems by using Monte Carlo calculations, Med. Phys. 19 (1992) 889-899.
[5] ANDREO, P., RODRIGUES, L.N., LINDBORG, L., KRAEPELIEN, T., On the calibration of plane parallel ionization chambers for electron beam dosimetry, Phys. Med. Biol. 37 (1992) 1147-1165.
[6] WITTKAMPER, F.W., AALBERS, A.H.L., MUNHEER, B.J., Experimental determination of wall correction factors, Part П: NACP and Markus plane-parallel ionization chambers, Phys. Med. Biol. 37 (1992) 995-1004.
[7] MATTSSON, L.O., JOHANSSON, K.A., SVENSSON, H., Calibration and use of plane-parallel ionization chambers for the determination of absorbed dose in electron beams, Acta Radiol., Oncol. 20 (1981) 385-399.


IAEA-SM-330/65
COMPARISON OF THREE PARALLEL PLATE IONIZATION CHAMBERS FOR HIGH ENERGY ELECTRON DOSIMETRY
U.F. ROSENOW, G. KASTEN, T. THIENEL Department for Clinical Radiobiology
and Clinical Radiation Physics,
University o f Gottingen,Gottingen, Germany
Abstract
COMPARISON OF THREE PARALLEL PLATE IONIZATION CHAMBERS FOR HIGH ENERGY ELECTRON DOSIMETRY.
Various authors have claimed that the perturbation or replacement correction factor for the Markus electron dosimetry chamber drops from unity at higher electron energies to several per cent lower at the low energy end. Data gained from a comparison with cylindrical chambers showed a larger effect than those obtained from a comparison with Fricke dosimetry, indicating a systematic problem with cylindrical chambers. A similar controversy emerged in respect of the polarization effect. To confirm data obtained earlier and by others from Fricke dosimetry the perturbation effect o f the Markus chambers was again measured. A drop of 2% was reconfirmed. Also, the small polarization effect was reconfirmed. For comparison an NACP and an Attix chamber were investigated. This investigation indicated a small margin for possible improvement of the Markus chamber. To separate the factors influencing the perturbation effect a number of modifications of the Markus chamber were examined. Guard ring size appeared to be only one parameter influencing the replacement correction, the others being collector diameter, plate separation, side wall angle, graphite coating and collector material. With small design modifications the perturbation effect of the Markus chamber can be made unity over the whole energy range while leaving basic characteristics such as the small sensitive volume, the negligible polarization effect and the outer dimensions unchanged.
1. INTRODUCTION
Until recently it was believed that parallel plate ionization chambers would not show a perturbation effect with high energy electrons over the energy range mostly used in radiotherapy (4-20 M eV). This was also claimed for the Markus chamber [1]. Meanwhile, a number o f authors have published data on the replacement correction factor, P repl, o f the Markus chamber with values o f around 2-5% below unity at the low energy end o f the therapeutically useful range. For a compilation o f these data see, for example, Ref. [2]. Another chamber, the NACP chamber, was found to have a flat response over the full energy range. These data were gained by
515

516 ROSENOW et al.
1 О Ez (M eV)
1 5
О GK/1
G G K /2□ KKK
О CK
S RK
д CL• WAM
A RoKa■ RUG• vdP
— - F i t / C C
- F i t / F r
FIG. 1. Compilation of Prep¡ values for the Markus chamber from the literature (from
Ref. [3]; for data sources see Ref. [2]). Open symbols: data from cylindrical chamber comparisons; full symbols: from Fricke dosimetry. Fit/Fr: curve fit with the upper equation to data
derived from comparison with Fricke dosimetry; Fit/CC: curve fit with the lower equation to data derived from comparison with cylindrical chambers. For clarity of presentation only a
few typical error bars are given. They represent 95 % confidence limits. No uncertainties were given for K K K and CK data.
comparison with measurements using cylindrical chambers and are represented in Fig. 1 by open symbols. This methodology has led to a controversy [3] because o f the fact that the use o f cylindrical chambers below 10 M eV is discouraged by modern dosimetry protocols, such as that o f the International Atomic Energy Agency (IAE A ) [4].
More reliable data are gained by comparison o f the parallel plate chambers with Fricke dosimetry, as have been presented by Dutch [5] and Belgian [6] groups as well as our own laboratory [7]. This data group is shown in Fig. 1 as full symbols. W e consider that the difference between them is a basic one despite the large uncertainties involved mainly on the side o f the data based on cylindrical chambers. Figure 1 also shows two possible approaches to curve-fitting these data, in order to emphasize that curve fitting might suggest a general dependence behind the data which might not be real. Both fits or others could deliberately be applied to either o f the two data groups or to the data in total. In this work, wall correction factors are assumed to be unity and thus Frepl = pu, the perturbation correction factor.

IAEA-SM-330/65 517
The Fricke related data in Fig. 1 indicate a pu for the Markus chamber o f at most 2% below unity at about 4 MeV. This would be in contradiction to the suggestion that the cylindrical chamber related data would at least reflect the correct relative difference in response between parallel plate chambers. However, van der Plaetsen has reported a pu o f the NACP chamber 0.8% above unity over the full energy range. This would re-establish the difference o f about 3% between the Markus and NAC P chambers at 4 MeV, while the difference o f 0.8% at 20 MeV would be well within the uncertainty o f the measurements.
Usually it is assumed that pu is predominantly influenced by the size o f the guard ring. This may be true for a typical parallel plate chamber design having a well defined cylindrical collecting volume with sufficient distance to the side wall. Mattsson et al. [8] have determined that the guard ring in this situation should be at least 3 mm wide. However, the Markus chamber has an unusual design which was governed by the intention to build an electron chamber with an extremely small volume and negligible polarity effect. The guard ring in this chamber does not establish a cylindrical collecting volume. It is partly hidden underneath the side wall and serves mainly as an insulator between the side wall and the collector. The side wall is graphitized and at the same potential as the entrance window membrane. There is evidence that the graphite on the side wall reduces the in-scatter from the side wall. The chamber body is made o f PM M A and thus the back wall o f the chamber is, according to Klevenhagen [9], backscatter deficient as compared with a water
equivalent material. Both effects should be expected to compensate for a theoretically insufficient guard ring.
In order to resolve these questions we used home-made modifications o f the Markus chamber with the same sensitive volume but larger guard rings, and performed comparisons o f the Markus chamber, as modified, with an NAC P and an Attix chamber (manufactured by Gammex-RMI, Middleton, Wisconsin, USA) after having established the relative response o f the Markus chamber against Fricke dosimetry.
2. M ATERIALS AN D METHODS
The chambers used in this comparison are listed in Table I. The original Markus chamber o f type PTW M23343 (Mo) (serial No. 100, volume 0.046 cm3) is our backup chamber in the calibration service [10]. The modified Markus chambers have a guard ring width o f 0.3 mm (M ,), a collector o f other material and smaller thickness (M 2), a wider air cavity and guard ring (M 3), a slightly larger collector, a 3.0 mm guard ring width and smaller plate separation (M 4), and a wider
cavity and guard ring plus a slanted side wall (M 5). Chambers M 3 and M 5 have a sensitive volume o f 0.157 cm3; M 5 has an oblique side wall opening towards the entrance window at an angle o f 48°. The volume o f chamber M 4 is 0.045 cm3,

518 ROSENOW et al.
TABLE I. CHAMBER CHARACTERISTICS(The italic figures indicate where a chamber differs from the Markus chamber, Mg.)
ChamberCollector
dia.(mm)
Guard ring width (mm)
Plateseparation
(mm)
Collector thickness (mm)/Material
Side wall angle
О
Sensitivevolume(cm3)
M0 5.4 0.7 2.0 0.5/PMMA 90 0.046
M, 5.4 3.0 2.0 0.5/PMMA 90 0.046
M2 5.4 0.7 2.0 0.3/PE a 90 0.046
M3 10.0 2.1 2.0 0.5/PMMA 90 0.157
M4 6.2 3.0 1.5 0.5/PMMA 90 0.045
M5 10.0 2.5 2.0 0.5/PMMA 48 0.157
Attix 12.7 13.4 1.0 0.13/PE 90 0.127
NACP 10.0 3.0 2.0 0.2/Rexolite 90 0.157
a Polyethylene.
approximately the same as that o f M 0. These variations were what was available at the time o f the investigation. They were expected to allow a reasonable assessment o f the influence o f chamber design characteristics on correction factors. In addition we used a 0.37 cm3 cylindrical chamber (PTW N chamber, No. 23312, our primary standard) with a “ Co calibration traceable to the German national standard laboratory (Physikalisch-Technische Bundesanstalt, PTB) for cross-calibrating the Markus chamber at 15 M eV electrons.
The NAC P chamber has a volume o f 0.157 cm3 (the same as M 3 and M 5). However, it is characterized by a thick graphite entrance window (0.5 mm) and a thin collector.
The Attix chamber has an excessive guard ring o f 13.4 mm width but the smallest plate separation. Its volume is 0.127 cm3, slightly less than that o f the NACP chamber but still close to three times the volume o f the Markus chamber. It has also a large outer diameter o f 6 cm which is double that o f all the other chambers used.
As an absolute dosimetry standard we used Fricke dosimetry, which is also part o f our calibration service. This dosimetry system has been available at our
laboratory for about twenty years and has been proven to be extremely stable and accurate [10]. The solution, consisting o f 1 mol-m '3 ferrous ammonium sulphate, 1 mol-m '3 sodium chloride and 400 mol-m '3 sulphuric acid, was used with
eG = 353.9 X 10'6 m2-kg_1 -G y '1, in accordance with the German standard

IAEA-SM-330/65 519
TABLE П. MEASUREMENT CONDITIONS ( E q is mean energy at phantom surface, z is depth (mm PMMA), Rp is practical range, Ez = Eq(7 - z/Rp) is mean energy at depth.)
E0(M e V )
z(m m )
RP(m m )
Ez(M e V )
17.0 10 73.9 14.7
15.0 10 65 .0 12.7
15.0 15 65 .0 11.5
8.9 10 37.5 6.5
6.1 10 24 .9 3 .8
N o te : A l l m easurem ents w ere done in a P M M A slab phantom
excep t that the A tt ix cham ber w as em bedded in its ow n
slab o f 2 cm o f S o lid W a ter.
DIN 6800/T3 [11], which is 0.5% higher than the value recommended by the International Commission on Radiation Units and Measurements [12].
For the irradiations a Siemens 18 M eV Betatron was available. It was used at the electron energies given in Table П. Owing to problems with beam stability and flatness we could not reach lower energies at the time o f the measurements. A cone- defined circular field o f 10 cm diameter at a phantom to surface distance o f 100 cm was used throughout.
The well established calibration o f the Markus chamber (M 0) against our Fricke dosimetry [10] was repeated and reconfirmed. A ll other chambers were calibrated against chamber M 0 at a nominal electron energy o f 15 MeV. Dose determination at other energies was done following the protocol set up by Markus in our laboratory [10, 13].
For all chambers the saturation was determined at all energies used and the corresponding corrections were applied. In the following we shall address the polarity and perturbation (or replacement) effects only.
3. RESULTS
The polarity effect correction, kp, is taken as the mean o f the readings with positive and negative potential divided by the reading with positive potential at the

520 ROSENOW et al.
TABLE Ш. PO LAR ITY CORRECTION FACTOR, Jkp, FOR CHAMBERS OF TABLE I AN D VARIOUS M EAN INCIDENT ENERGIES, E0, AND M EAN EFFECTIVE ENERGIES A T DEPTH, Ez
ChamberE0 = 5.9 Ez = 1.5
15.02.7
5.9Ъ.1
8.96.7
15.011.7
15.012.8
17.0 MeV 14.8 MeV
Mo 1.0035 1.0034 1.0049 0.9995 0.9973 1.0008
M, 1.0048a 0.9988
M2 1.0024 1.0103 1.0027
M3 0.9999 1.0053 0.9963
M4 1.0021 1.0057 0.9963 0.9985
M5 1.0015 1.0009 0.9997
NACP 0.9922 0.9990 0.9990 1.0011 1.0016 1.0010
Attix 0.9973 1.0011 0.9996 0.9993 1.0009 0.9991
Note: 95% confidence limits: ±0.5% for Ez > 11.7 MeV, ±0.9% for Ez = 6.7 MeV, ±1.2% for Ez = 3.7 MeV and ±1.6% for Ez < 2.7 MeV.
a Three values of 1.0020, 1.0029 and 1.0095, a possible outlier.
FIG. 2. Preplfor the Markus chamber as newly derived from comparison with Fricke dosimetry. The curve jit is taken from Fig. 1 (solid curve) for comparison. The NACP chamber data were obtained from comparison with the Markus chamber. The error bars (for the Markus chamber only at 12.7 and 1.9 MeV) represent one standard deviation. P,epl data obtained for the Attix chamber were 1.045, 1.000, 1.022 and 1.042 for Ez values of 14.1, 12.7, 6.7and 3.8 MeV respectively. They are so different from the measurements of the other chambers that they were not included in the graph.

IAEA-SM-330/65 521
Ez (MeV)
FIG. 3. Replacement correction factors for the Markus chamber and three modifications.
Experimental points are connected by interpolation curves for guidance of the eye only.
entrance window. In the last ten years’ experience with our calibration service for the Markus chamber [10] we have found, on the average, a kp o f 1.0000 ± 0.0020 (one standard deviation) at E0 = 15 M eV (Ez = 11.5 M eV), o f 0.9967 ± 0.0003 at Ea = 5 M eV (Ez = 2.3 M eV ) and o f 0.9970 ± 0.0005 with the ^Sr check source. In this investigation we did not determine the stem effect separately because o f the low polarity effects found. The stem effect is thus contained in the polarity correction factor.
Results o f measurements o f k for the various chambers are compiled in Table Ш. The 95 % confidence limits were found to be mainly dependent on the stability o f the Betatron and thus roughly independent o f chamber type.
The replacement correction factor for the Markus chamber determined from the comparison with Fricke dosimetry is shown in Fig. 2. We were able to reproduce the earlier results, shown in Fig. 1. Correspondingly, for the Markus chamber
modifications is shown in Fig. 3. Again, data for the modified chambers were obtained from a comparison with the Markus chamber.

522 R O S E N O W e t a l .
The polarity correction factor, kp, is, within measurement uncertainty, negligible for all chambers. However, talcing the entries o f Table in at face value, it appears that the Attix chamber has no polarity effect at all. This would have been expected from its design criteria, a thin collecting electrode, extremely wide guard ring and small plate separation. The NACP chamber comes very close to the Attix chamber. Only at Ez = 1.5 M eV did we measure effects o f just below 0.3% for the Attix chamber and o f 0.8% for the NACP chamber. The Markus chamber appears to have a small polarity effect, as reported elsewhere [ 10], leaving, however, very little latitude for improvements. Chamber M 5, with a wider collector and guard ring
and the additionally slanted side wall, may make the polarity effect disappear completely. However, the effect o f the slanted side wall needs more detailed investigation.
The replacement or perturbation correction factors for the Markus chamber o f earlier measurements in this laboratory have been confirmed. There appears to be a 2 % drop below unity at the very low end o f the electron energy spectrum used in radiotherapy. Owing to difficulties with the stability o f our Betatron we could not go to lower energies for measurements at depth o f maximum dose. Determination o f P repl at depth for very low Ez values was considered inappropriate for the same reason. The NAC P chamber did show a 1.3% increase in P repl at Ez = 3.8 MeV,
while - repl remained unity at the higher energies. This result lies somewhere between those reported by others, as cited above. A reason for such a behaviour might be seen in the thickness (0.5 mm) and material (graphite) o f the entrance window. Although measurement inaccuracy has to be considered in any interpretation o f this result it may be interesting to note that the relative difference in P repl as
compared with the Markus chamber is about the same as reported in some o f the cylindrical chamber comparisons referred to above (Fig. 1).
The P repl values determined for the Attix chamber are difficult to explain. They may not be typical for this chamber type. Firstly, we had only one such chamber available and could not cross-check against another o f these chambers. Secondly, the chamber initially had a faulty contact at the collecting electrode which we thought we had repaired successfully. Thirdly, the chamber, the body o f which is made o f Solid Water, was embedded into a slab o f this material o f 2 cm thickness. This assembly was then inserted in our PM M A slab phantom. There might be a problem with the fluence correction, which we could not determine because o f limited availability o f the chamber and, therefore, did not correct for.
Finally, the question whether the low energy dip o f P repl for the Markus chamber could have been removed by design modifications without changing basic features o f that chamber did not find a clear answer. There is some indication that
a wider guard ring and/or a smaller plate separation might lead to an improvement (chamber M 4). Certainly, guard ring size is not the dominating aspect in respect o f
4. DISCUSSION

IAEA-SM-330/65 523
a flat response in Л -epl- Chamber M i was unfortunately destroyed and no longer available for these measurements. Chamber M 2 appears to confirm our expectation, that a backscatter deficient material such as polyethylene as collector material is able to compensate for in-scatter from the side wall. However, the data obtained represent an over-response. Other design features may also have influenced this result.
5. CONCLUSIONS
The polarity effect o f the Markus chamber o f zero at high and o f less than 0.4% at low electron energies has been reconfirmed, while the effect is negligible for the NACP and Attix chambers with a possible exception at Ez = 1.5 M eV, where 0.8%
and 0.3%, respectively, were found. A ll deviations from unity were within measurement uncertainty.
The replacement correction factor reported earlier was also reconfirmed. It appears to begin to drop below unity below Ez = 6 M eV, going down to 0.98 at about 2-3 MeV. For the NAC P chamber we found an increase to 1.013 at Ez = 3.7 M eV, possibly due to the 0.5 mm thick graphite entrance window. The
deviations from unity are believed to be real although they are not statistically significant. The values determined for the Attix chamber could not reasonably be attributed to a replacement correction.
The comparison o f the three chambers indicated that there might be a small margin for possible improvements o f the Markus chamber. Modifications o f this chamber have therefore been investigated. Indications were found that a 3 mm guard ring, an oblique side wall, a larger collector diameter and a smaller plate separation are factors positively influencing the polarity and replacement effects. Backscatter deficient collector material may compensate for in-scatter from the side wall.
ACKNOW LEDGEM ENTS
W e wish to thank M. Roos o f the PTB, Braunschweig, for the loan o f an NACP chamber and B. Slabbaert, Managing Director, Gammex-RMI GmbH, Germany, for the loan o f an Attix chamber.
R EFER EN C ES
[1] MARKUS, B., Eine polarisierungseffektfreie Graphit-Doppelextrapolationskammer zur Absolutdosimetrie schneller Elektronen, Strahlentherapie 150 (1975) 307-320.
[2] REFT, C.S., KUCHNIR, F.T., Measurement of the replacement correction factor for parallel-plate chambers in electron fields, Med. Phys. 18 (1991) 1237-1243.
524 ROSENOW et al.
[3] ROSENOW, U.F., Comments on the experimental determination of the replacement correction factor for parallel-plate ionization chambers in high-energy electron beams, Med. Phys. 20 (1993) 739-741.
[4] INTERNATIONAL ATOMIC ENERGY AGENCY, Absorbed Dose Determination in Photon and Electron Beams: An International Code of Practice, Technical Reports Series No. 277, IAEA, Vienna (1987).
[5] WITTKÀMPER, F.W., THIERENS, H., VAN DER PLAETSEN, A ., DE WAGTER, C., MUNHEER, B.J., Perturbation correction factors for some ionization chambers commonly applied in electron beams, Phys. Med. Biol. 36 (1991) 1639-1652.
[6] VAN DER PLAETSEN, A., SEUNTJENS, J., THIERENS, H., “ Experimental determination of the perturbation correction factors for some ionization chambers commonly applied in electron beams” , 11th Meeting of European Society for Therapeutic Radiology and Oncology, Malmô, Sweden, 1-4 September 1992, Radiother. Oncol. 24 Suppl. 54 (1992) Abstract 208.
[7] ROSENOW, U.F., KASTEN, G., “ Electron energy calibration with the Markus chamber. A reassessment of replacement and polarity correction factors” , poster presented at 32nd Annu. Mtg of American Assoc, of Physicists in Medicine, Saint Louis, MO, 1990, Med. Phys. 17 (1990) 545 (abstract).
[8] MATTSSON, L.O., JOHANSSON, K.A., SVENSSON, H., Calibration and use of plane-parallel ionization chambers for the determination of absorbed dose in electron beams, Acta Radiol., Oncol. 20 (1981) 385-399.
[9] KLEVENHAGEN, S.C., Determination of absorbed dose in high-energy electron and photon radiation by means of an uncalibrated ionization chamber, Phys. Med. Biol. 36 (1991) 239-253.
[10] ROSENOW, U.F., KASTEN, G., IAEA-SM-330/64, these Proceedings.[11] DEUTSCHES INSTITUT FÜR NORMUNG, Dosismefiverfahren in der radio-
logischen Technik. Eisensulfatdosimetrie, DIN 6800/T3, Beuth, Berlin (1980).[12] INTERNATIONAL COMMISSION ON RADIATION UNITS AND MEASURE
MENTS, Radiation Dosimetry: Electron Beams with Energies Between 1 and 50 MeV, ICRU Rep. 35, Bethesda, MD (1984).
[13] MARKUS, B., KASTEN, G., “ The high energy dosimetry system Gottingen — Twelve years controlled accuracy and stability” , Dosimetry in Radiotherapy (Proc. Symp. Vienna, 1987), Vol. 1, IAEA, Vienna (1988) 75-86.

B E A M Q U A L I T Y D E P E N D E N C E
(Session 8 )
Chairman
B.J. M U N H E E R
Netherlands
Co-Chairman
A . LE ITN E RAustria


IAEA-SM-330/72
BEAM QUALITY DEPENDENCE OF IAEA TLDs IRRADIATED IN A STANDARDIZED GEOMETRY
H. NYSTRÔMRadiation Physics Department,University of Umeâ,Umeâ, Sweden
P. BERA, P. NETTE Department of Research and Isotopes,International Atomic Energy Agency,Vienna
Abstract
BEAM QUALITY DEPENDENCE OF IAEA TLDs IRRADIATED IN A STANDARDIZED GEOMETRY.
Since 1968, the International Atomic Energy Agency (IAEA) has operated a postal dose intercomparison service based on TLDs. This service has been giving dosimetric support to hospitals with “ Co teletherapy units in developing countries. The increasing number of medical accelerators installed in developing countries prompted the IAEA to expand the service also to cover high energy X ray beams. For this purpose the energy dependence of the TLDs and a suitable correction procedure for their use were studied. As calibration with high energy X rays was not available from all Primary Standard Dosimetry Laboratories, the extensive practical experience in this field as well as the irradiation facilities of the Radiation Physics Department of the University of Umeâ, Sweden, have been utilized. In addition, ten other renowned radiotherapy departments in Europe and one renowned institute in the United States of America were asked to provide reference irradiations for the TLDs under fixed geometrical conditions (reference point in a water phantom in accordance with the IAEA Code of Practice). Furthermore, reference irradiations were provided to TLDs to determine the parameter D20/Dl0 as a measure of photon beam energy. The participants based their dosimetry on measurements with ionization chambers calibrated in air kerma/exposure and using the IAEA Code of Practice for normalizing the conversion to absorbed dose to water. The irradiated TLDs were evaluated in the IAEA Dosimetry Laboratory with the routine established for “ Co radiation quality, which includes also “ Co reference irradiations by the Bureau international des poids et mesures and the Austrian Bundesamt fiir Eich- und Ver- messungswesen. From the results a calibration curve for energy correction of TLD response normalized at “ Co radiation quality and taking into account the IAEA Code of Practice was established. Uncertainty of absorbed dose to water determination with the IAEA TLD system was evaluated and an acceptance limit of 3.5% established for application in the routine intercomparison runs. TLD evaluation of D20ID¡0 irradiation for beam quality determination indicates a systematic deviation from ionization chamber measurements and makes further studies necessary.
527

528 NYSTRÓM et al.
FIG.
1.
Proc
edur
es f
or IA
EA/W
HO
TLD
inter
comp
ariso
n se
rvice
.

IAEA-SM-330/72 529
Since 1968, the International Atomic Energy Agency (IAEA), together with the World Health Organization (WHO), has operated a routine postal dose intercomparison service, mainly directed to developing countries. The intercomparison measurements are based on encapsulated LiF powder irradiated under certain reference conditions by the participating hospitals to an absorbed dose to water of 2 Gy in a “ Co 7 ray beam. After irradiation the capsules are returned to the IAEA for evaluation. The results are reported to the participating hospital and can be used as a quality control measure. Each intercomparison run is backed up by Primary Standard Dosimetry Laboratories (PSDLs) providing “ Co reference irradiations to LiF capsules. Details of the procedure (Fig. 1) and discussions on achieved results have been reported elsewhere by Eisenlohr and Jayaraman [1] and by Svensson et al. [2].
As indicated in Fig. 1, the return of the irradiated capsules from the hospitals to the IAEA can take up to several months, which represents a problematic step in the procedure owing to fading of the radiation induced LiF signal. This problem has been solved, without unacceptable loss of precision of dose measurements, by two measures: (a) evaluation of the LiF signal is done not earlier than 2 months after irradiation, when the shallow traps in the LiF have already faded away; (b) the irradiations performed by the IAEA to establish the calibration curve (TLD response against dose), as well as those from the PSDLs, are done at the same time as in the hospitals, and all irradiated LiF capsules are evaluated together.
The increasing number of medical accelerators installed in developing countries led to the need for an expansion of the service to cover high energy X ray beams. For this purpose the energy dependence of the TLDs had to be studied.
1. INTRODUCTION
2. MATERIALS AND METHODS
2.1. General
In measuring absorbed dose to water, TLDs have a response dependent on the radiation beam quality. This response is a complicated function of many influencing parameters. The most direct way to get a calibration curve as a function of energy would be to obtain it from a PSDL. PSDLs, however, do not yet provide a calibration service for high energy X rays. Therefore the Radiation Physics Department of the University of Umeâ, Sweden, was asked to provide reference irradiations to the IAEA’s TLDs. Its hospital applied dosimetry with conventional ionization chambers is supported also by Fricke dosimetry [3] and the use of liquid ionization chambers [4]. In addition, ten other renowned radiotherapy departments in Europe and

530 NYSTRÔM et al.
TABLE I. HOSPITALS ACTING AS REFERENCE CENTRES (co -ord in a ted by A. D u tre ix , Radiotherapy D epartm ent, University H ospita l
Saint-Rafaël, Leuven, B elg ium )
Department of Radiation Physics, University of Umeà, Umeâ, Sweden
Radiation Physics Department, MD Anderson Cancer Center, Houston, Texas, USA
Centre Georges-François Leclerc, Dijon, France
Finnish Centre for Radiation and Nuclear Safety, Helsinki, Finland
Department of Radiation Physics, Sahlgrenska Hospital, Goteborg, Sweden
Oncology Department, Malmô Almânna Hospital, Malmô, Sweden
Radiotherapy Department, Nederlands Kankerinstituut, Amsterdam, Netherlands
Radiotherapy Department, University Hospital St-Rafaël, Leuven, Belgium
Department of Medical Physics and Medical Engineering, Western General Hospital, Edinburgh, United Kingdom
Institute of Radiation Oncology, Prague, Czech Republic
Radiation Physics Unit, Institut Gustave-Roussy, Villejuif, France
Department of Medical Physics, University of Florence, Florence, Italy
one renowned institute in the United States of America were asked to act as Reference Centres (RCs) for reference irradiations based on their routine dosimetry (Table I).
All RCs have been provided with a TLD holder (Fig. 2) for irradiation of the TLDs in a vertical beam. The holder consists of a Perspex tube with two holes, at5 and 15 cm from the top. An additional plug is used to adjust these positions to 10 and 20 cm respectively. The holder has to be placed in a water phantom (or a water bucket) having a diameter of not less than 30 cm with the top of the Perspex tube (or Perspex tube with plug) at the water surface and the radiation beam axis in coincidence with the Perspex tube axis. This set-up permitted the RCs to irradiate the TLD capsules in accordance with recommendations given in the IAEA International Code of Practice [5] for: (a) beam calibration at 5 cm water depth (^Co and D 20/Dw < 0.6) and at 10 cm water depth (D 20/DlQ > 0 .6 ), and (b) beam quality index (D 2<J D w) measurements in which TLDs are irradiated simultaneously at 10 and 20 cm water depth.

IAEA-SM-330/72 531
A d d i t i o n a lp l u g
T L D c a p s u l e ( D 5 ° r D i o ) N
T L D c a p s u l e(Ого) N
0 10
'1 50
й НT50
WI I I I
IЦ- I i i i
100
260
FIG. 2. IAEA capsule holder for TLD postal dose intercomparison (dimensions in millimetres; drawing not to scale).
2.2. Perturbation of radiation field by TLD holder
Irradiating the TLDs using the Perspex tube will shield them to some extent. This has to be considered when the TLD measurements are compared with measurements from ionization chambers where no such shielding occurs. The shielding effect was investigated at the University of Umeâ with film dosimetry as well as by calculation using photon attenuation coefficients.
The film measurements were performed in a 4 MV photon beam produced by a Varian Clinac 4 and a 20 MV photon beam from a Scanditronix MM22 microtron. The two units are used for radiation therapy and have a D2o/£10 ratio of approximately 0 .54 and 0 .66 respectively. The film plane was positioned perpendicular to the beam axis in a 10 cm x 10 cm field at 10 and 20 cm depth, and in the 4 MV beam also at 5 cm.
For the measurement at 20 cm depth a TLD capsule was inserted in the 10 cm position. The films, after irradiation, were developed and scanned with an RFA 1 Therados densitometer. The dose profiles were then integrated over the distance covered by the TLD dosimeter (2 cm) and compared with the profile of the undisturbed media. The uncertainty of the relative dose values was estimated to be approximately ± 0 .4 % .

TABLE П. BEAM SHIELDING BY IRRAD IATIO N SET-UP OF TLDs
532 NYSTRÔM et al.
Photon beam
Shielding correction (%)
A A o A o Ac/Ao
4 MV (film) 1.0 0.6 1.6 0.8
1.5 MeV (calc.) 0.4 0.4 1.3 0.9
20 MV (film) 0.0 0.5 0.2
6 MeV (calc.) 0.3 0.8 0.5
As can be seen from Table П, the influence o f the Perspex tube at 5 cm reference depth is about 1 % in the 4 M V beam. The influence is slightly bigger at 20 cm depth but the effect on the D 20/Dw ratio remains at about 1 %. As can be expected, the shielding effect is less at the higher energy as the difference in beam attenuation between water and Perspex decreases with increasing energy. At the 10 cm reference depth o f the 20 M V beam no significant influence o f the tube could be detected.
An attempt was also made to quantify the attenuation differences between water and Perspex by means o f calculations. The general expression
/ = /0e-'u' ( 1)
describes the exponential decrease o f the intensity o f a monochromatic photon beam with absorber thickness x in a ‘narrow beam’ geometry. In a truly ‘broad beam’ geometry the attenuation coefficient ц has to be replaced by цеп, the linear energy absorption coefficient. The present situation is considered to be better approximated by a narrow rather than a broad beam geometry. Hence the difference in dose at the depth x without and with the Perspex could approximately be described by
D J D p = е ( - (2)
In Table П the calculated shielding values are presented and compared with themeasured values under the assumption that 20% o f the TLD capsule is shielded bythe tube.
2.3. Modification in TLD evaluation
A ll intercomparison runs with the RCs followed the scheme indicated in Fig. 1. For beam calibration the RCs were asked to give 2 Gy absorbed dose to water to the TLDs located at the reference point. For beam quality determination,

IAEA-SM-330/72 533
D 10 was prescribed as 2 Gy, resulting in a D 20 between 1 and 1.5 Gy, depending on beam quality. For this reason the ^Co calibration curve (TLÉ) response versus
dose) routinely prepared for each “ Co intercomparison run in the dose range o f 1.5-2.5 Gy in steps o f 0.25 Gy had to be extended down to 0.75 Gy. Tests for supralinearity in the TLD response showed that also in the extended dose range no correction had to be applied. The evaluation o f all TLDs, irradiated by the RCs, with the extended ^C o calibration curve resulted in ^Co equivalent absorbed dose to water. Comparing this ^Co equivalent dose with the quoted absorbed dose to water determined in the RCs with ionization chambers provided the IA E A with a calibration curve o f energy dependent correction factors for its TLD dose intercomparison service.
2.4. Use of cavity theory to describe energy dependence
A theoretical deduction o f the TLD response versus energy has to consider the experimental set-up o f the TLD irradiation. As can be seen from Fig. 2, three different materials are involved in which the photons may interact and give rise to absorbed dose, and hence to a signal, in the LiF powder: the LiF powder itself, the
polyethylene capsule surrounding it and water as the phantom material. In principle, photons could also interact in the Perspex holder, but as Perspex is very water equivalent in this context and as only a minor part o f the phantom volume consists o f Perspex, this effect is ignored.
The extent to which the photons will interact directly with the LiF powder is dependent on the physical size o f the dosimeter and the energy o f the photons. I f the dosimeter can be considered very small compared with the ranges o f the secondary electrons released by photons, the Bragg-Gray theory or the Spencer-Attix extension o f the theory can be used to determine the relation between the dose in the dosimeter and that in the undisturbed medium in the absence o f the dosimeter. If, on the other hand, the dosimeter is very large compared with the ranges o f the secondary electrons (i.e. there is charged particle equilibrium in most o f the volume o f the dosimeter), the relation between dose to dosimeter and dose to water can be
described with the ratio o f the mass energy absorption coefficients. In the case where the dosimeter can be considered neither small nor large, an intermediate situation is true. In the expression developed by Burlin [6 ], a weighting factor d is introduced for this situation:
= [ A i e t . m + ( 1 - ¿ O O W P W m T 1 ( 3 )
The weighting factor d is dependent on the energy o f the electrons in the medium and on the size o f the detector. I f the energy is low and/or the detector is large, d approaches zero; i f the energy is high and/or the detector is small, d approaches unity.

534 NYSTRÔM et al.
In the present situation the dosimeter is surrounded by walls made o f poly
ethylene. Almond and Svensson [7] developed a general expression applicable to the situation where a fraction a o f the dose to the dosimeter is due to electrons released by photons interacting in the wall o f the dosimeter, and a fraction (1 — a ) is due to electrons generated in the phantom material:
— 'S 'w a l l , d e t ( i i e n / p ) m , w a U + d - cOVdetT1 ( 4 )
The weighting factor a is usually taken from the experimental data o f Lempert et al. [8].
As in our case no source o f photon generated electrons could be excluded, Eqs (3) and (4) were combined:
^LiF^^w — ¿[ú^pol.LiFÍMei/PÍw.pol (1 — ^O^w.Lif] 0 ¿)(Men/p)LiF,w (5)
where the indices w, pol and L iF indicate water, polyethylene and TLD powder respectively. The ratio £>LiF/Dw can now be calculated as a function o f quality index, normalized at ^Co. The цеа/р values are tabulated by Hubbell [9] and the S values tabulated in Report 37 o f the International Commission on Radiation Units and Measurements [10].
The uncertainties in the d and a factors mentioned above are large and the theory is very simplified. Differences in <5 ray production between LiF and poly
ethylene are, for instance, not taken into account. L iF has a significantly higher mean excitation potential, with an / value o f 94 eV compared with 57 eV for polyethylene. A higher I value means a higher production o f ô rays, especially at higher energies, and hence a loss o f signal, which is not balanced by incoming ô rays from the polyethylene capsule. Furthermore, differences in scattering properties o f the materials involved were not accounted for. The LiF powder itself consists o f grains with a density o f about 2.6 g-cm"3, but its packing density is considerably lower. As the collision stopping power value is density dependent, owing to the polarity effect, the choice o f density in the calculations will also affect the results.
Therefore the ratio o f Eq. (5) should be compared only qualitatively with experimental results.
3. RESULTS AN D DISCUSSION
3.1. TLD energy calibration curve
The ratio o f the quoted dose o f the RCs and the ^C o equivalent dose evaluated by the IA E A with regard to the TLDs gives a relative energy correction factor which is unity for “ Co radiation quality. Figure 3 presents the values with respect

IAEA-SM-330/72 535
B e a m E n e r g y : Q u a l i t y I n d e x (D ^ D ^ )
. . . . . . T h e o r e t i c a l - - - - - - E s t a b l i s h e d t h r o u g h m e a s u r e m e n t sш I G R : W a t e r p h a n t o m f f l I G R : P e r s p e x p h a n t o mФ U n i v . o f U m e â и B I P M□ B E V
F I G . 3. Energy ca libra tion curve fo r l iF TLD. IG R : Ins titu t Gustave-Roussy, V ille ju if, France; B IP M : Bureau in ternationa l des poids et mesures, P aris; BEV: Bundesamt fü r E ich- und Vermessungswesen, Vienna.
to the University o f Umeâ and two PSDLs: the Bureau international des poids et mesures (BIPM ), Paris, and the Bundesamt fur Eich- und Vermessungswesen (BEV), Vienna. From these results, using linear regression, an energy calibration curve (solid line in Fig. 3) was determined. It corrects the IAE A evaluated ^Co equivalent TLD response at high energy X rays up to 50 M V accelerating potential. For statistical improvements o f this curve and as a quality control measure, PSDLs (including the B IPM ) and the University o f Umeâ were asked to continue to provide reference irradiations for all intercomparison runs already provided as a routine service. The same figure also includes the theoretically derived calibration curve
(broken line) obtained by using Eq. (5). As mentioned above, this curve is based on a very simplified model and therefore only qualitative agreement with the experiment should be expected. Further experimental results, however, might show that linear regression will not be the best fit for the experimental results. In addition, some preliminary correction factors determined by the RC at Villejuif, France, are included in Fig. 3. This RC used an irradiation and evaluation procedure similar to
that o f the IAEA, but its L iF TLD powder is from a different supplier and it performed TLD irradiations using not only a water phantom but also a solid Perspex phantom.

536 NYSTRÔM et al.
B e a m E n e r g y : Q u a l i t y I n d e x ( D 2 0 / D 1 0 )
FIG . 4. Relative energy correction factors from Reference Centrés.
In Fig. 4 we have plotted the results from all other RCs representing the day to day situation o f radiotherapy dosimetry in advanced hospitals. As expected, a bigger spread o f results is observed, but this is about the same at all energies. The best fit for these results can be represented by the calibration curve (solid line) derived from the results obtained by the University o f Umeâ and the PSDLs.
3.2. Quality index measurements with TLDs
In the experimental intercomparison runs with the RCs, D 20/Dl0 irradiation o f TLD capsules was performed and the evaluation carried out by the IAEA. In Fig. 5 the TLD results are plotted against the D 20/Dw quoted by the RCs. The solid line represents the expected fit using the above described correction for shielding caused by the TLD holder and one TLD capsule when the two TLD capsules are irradiated simultaneously.
As can be seen, the mean TLD evaluated D 20/Dw values are slightly lower than the expected values. Results available from the University o f Umeâ do not yet confirm this deviation. More investigations for clarification are under way.
3.3. Uncertainties
The combined uncertainty o f the absorbed dose to water determination with the IA E A TLD system had been established to be about 1.5% for ^C o radiation qual-

IAEA-SM-330/72 537
Q u o t e d Q u a l i t y I n d e x ( D ^ / D , , , )
FIG . 5. Beam quality evaluation w ith TLDs.
ity. This uncertainty took into consideration the BIPM absorbed dose to water calibration factor (0.3%) o f the IAE A secondary standard chamber, the set-up and irradiation procedure to establish the ^C o TLD dose-response curve for each intercomparison run (0.3%) and, as the main component, the uncertainty o f 1.4% related to processing and evaluation o f the TLD powder signal. The quantification o f the last component is based on Fig. 6 .
Originally the laboratory reference powder (LRP) had been used to provide TLD reference readings to correct for sensitivity changes o f the TLD reader. For Fig. 6 the LRP readings before and after the evaluation o f the “ Co TLD dose-
response curve prepared for each batch have been used also to determine the absorbed dose to water to which the LRP had been exposed. This absorbed dose should be the same for all LRP samples, including even those from production charges o f different sensitivity. Figure 6 shows the relative deviation o f this dose (squares) from its progressively determined mean with regard to accumulation o f the batches. The distribution o f these deviations has the above mentioned standard deviation o f 1.4%. This value is a conservative estimate as the irradiation o f the LRP does not accompany the irradiation schedule o f all L iF powder irradiations (see Fig. 1) and is thus subject to additional uncontrolled fading varying from batch to batch.
This is clearly demonstrated by the results (circles) o f reference irradiations provided to TLDs by the PSDLs for each intercomparison batch. The distribution
o f these relative deviations between the IA E A evaluated dose and the dose quoted from the PSDLs has a standard deviation o f 0.8% and its mean deviation is 0.1%.
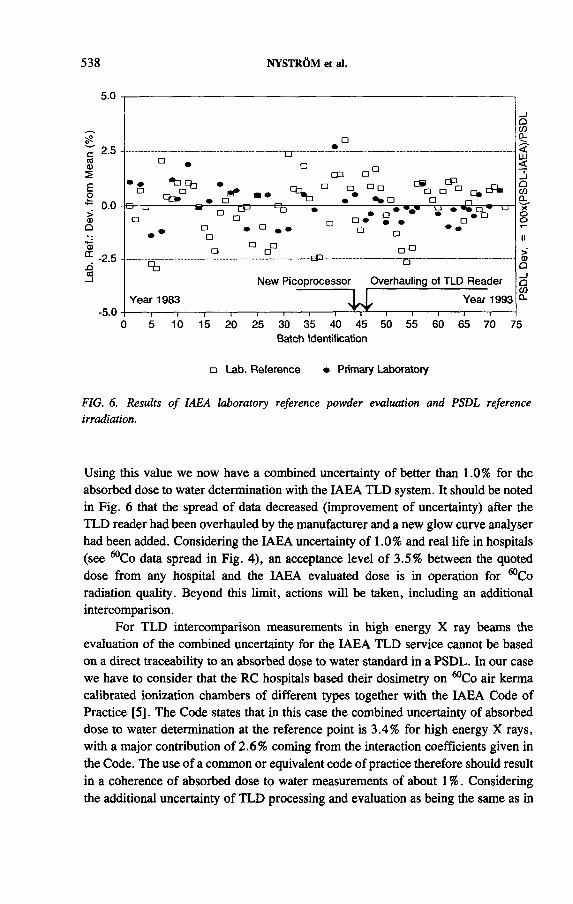
538 NYSTRÔM et al.
N e w P i c o p r o c e s s o r O v e r h a u l i n g o f T L D R e a d e r
- 5 . 0Y e a r 1 9 9 3
5 1 0 1 5 2 0 2 5 3 0 3 5 4 0 4 5 5 0 5 5 6 0 6 5 7 0 7 5B a t c h I d e n t i f i c a t i o n
q L a b . R e f e r e n c e P r i m a r y L a b o r a t o r y
FIG. 6. Results o f IAEA laboratory reference powder evaluation and PSDL reference
irradiation.
Using this value we now have a combined uncertainty o f better than 1.0% for the absorbed dose to water determination with the IA E A TLD system. It should be noted in Fig. 6 that the spread o f data decreased (improvement o f uncertainty) after the TLD reader had been overhauled by the manufacturer and a new glow curve analyser had been added. Considering the IAEA uncertainty o f 1.0% and real life in hospitals
(see “ Co data spread in Fig. 4), an acceptance level o f 3.5% between the quoted dose from any hospital and the IAEA evaluated dose is in operation for “ Co radiation quality. Beyond this limit, actions will be taken, including an additional intercomparison.
For TLD intercomparison measurements in high energy X ray beams the evaluation o f the combined uncertainty for the IA E A TLD service cannot be based on a direct traceability to an absorbed dose to water standard in a PSDL. In our case we have to consider that the RC hospitals based their dosimetry on ^Co air kerma calibrated ionization chambers o f different types together with the IA E A Code o f Practice [5]. The Code states that in this case the combined uncertainty o f absorbed dose to water determination at the reference point is 3.4% for high energy X rays, with a major contribution o f 2 .6 % coming from the interaction coefficients given in the Code. The use o f a common or equivalent code o f practice therefore should result in a coherence o f absorbed dose to water measurements o f about 1 %. Considering
the additional uncertainty o f TLD processing and evaluation as being the same as in

IAEA-SM-330/72 539
the “ Co case, a coherence in TLD results o f about 1.3% should be achievable. The spread o f data in Fig. 3 supports this conclusion. Therefore, the IA E A TLD service operates with only one acceptance limit o f 3.5% for all high energy photon beams.
REFERENCES
[1] EISENLOHR, H.H., JAYARAMAN, S., IAEA-WHO cobalt-60 teletherapy dosimetry service using mailed LiF dosemeters. A survey of results obtained during 1970-75, Phys. Med. Biol. 22 (1977) 18-28.
[2] SVENSSON, H., HANSON, G.P., ZSDÁNSZKY, K., The IAEA/WHO TL dosimetry service for radiotherapy centres 1969-1987, SSDL Newsletter No. 28, IAEA, Vienna (1989) 3-21.
[3] NYSTRÔM, H., KARLSSON, M ., Correction factors applied to plane parallel ionization chambers, Phys. Med. Biol. 38 (1993) 311-322.
[4] WICKMAN, G., NYSTRÔM, H., The use of liquids in ionization chambers for high precision radiotherapy dosimetry, Phys. Med. Biol. 37 (1992) 1789-1812.
[5] INTERNATIONAL ATOMIC ENERGY AGENCY, Absorbed Dose Determination in Photon and Electron Beams: An International Code of Practice, Technical Reports Series No. 277, IAEA, Vienna (1987).
[6] BURLIN, T.E., CHAN, F.K., “ Some applications of cavity theory to condensed-state radiation dosimetry” , Solid State and Chemical Radiation Dosimetry in Medicine and Biology (Proc. Symp Vienna, 1966), IAEA, Vienna (1967) 393-405.
[7] ALMOND, P.R., SVENSSON, H.B., Ionization chamber dosimetry for photon and electron beams: Theoretical considerations, Acta Radiol. Oncol. Radiat. Ther. Phys. Biol. 16 (1977) 177-186.
[8] LEMPERT, G.D., NATH, R., SCHULZ, R. J., Fraction of ionization of electrons arising in the wall of an ionization chamber, Med. Phys. 10 (1983) 1-3.
[9] HUBBELL, J.H., Photon mass attenuation and energy absorption coefficients from1 keV to 20 MeV, Int. J. Appl. Radiat. Isot. 33 (1982) 1269-1290.
[10] INTERNATIONAL COMMISSION ON RADIATION UNITS AND MEASUREMENTS, Stopping Powers for Electrons and Positrons, ICRU Rep. 37, Bethesda, MD (1984).


IAEA-SM-330/50
INTERCOMPARISON MEASUREMENTS OF ABSORBED DOSE FOR HIGH ENERGY PHOTON AND ELECTRON BEAMS
M .A.H . EL-FIKI, M .A . SHARAF Radiation Measurement Laboratory,
National Institute for Standards,Giza
A .M . KASEMExecutive Office for Radiation Protection,Ministry o f Health
Cairo, Egypt
Abstract
INTERCOMPARISON MEASUREMENTS OF ABSORBED DOSE FOR HIGH ENERGY PHOTON AND ELECTRON BEAMS.
In radiotherapy it is customary to derive the dose given to a tumour from ion chamber measurements at a fixed position and measured depth dose curves. As the accuracy of the delivered dose is of critical importance, it is desirable to check the accuracy of the dosimetry by measuring the dose using TLDs at more than one position. For high energy photon (8 MeV) and electron (6-17 MeV) beams intercomparison measurements have been made using a flat ionization chamber and LiF-700 TLD chips. The TLDs used for depth dose measurement were energy independent and had a high response for the energies studied. The intercomparison measurements showed that the TLD system can be used successfully for depth dose determinations.
1. INTRODUCTION
The Nordic Association o f Clinical Physics (NAC P) has adopted recommendations for the determination o f absorbed dose in electron and photon beams [1]. Any system for measuring dose distribution in an irradiated material should have a flat response with energy and a linear response with dose, since for a given exposure the energy spectrum and the dose level will vary throughout the material. In particular, for central axis depth dose measurements, the response o f the system should be linearly related to dose as a function o f depth. To use L iF TLDs for dose distribution and calibration measurements with high energy electrons, the energy and dose
response o f the dosimeter must be known [2]. As the accuracy o f the delivered tumour dose is o f critical importance, intercomparison measurements using TLDs and a flat ionization chamber have been made at our institute.
541

542 EL-FIKI et al.
2. EXPERIM ENTAL WORK
For the purpose o f studying the photon and electron energy and dose response o f Harshaw TLD-700 dosimeters the following standard calibrations, in accordance with the NAC P Protocol [1], were made at the Radiotherapy Department o f the Maadi Military Hospital.
High energy photon and electron beams were obtained from a Philips (M EL) SL75/20 linear accelerator (6 , 10, 12, 14 and 17 M eV electrons). The beams were calibrated by using a cylindrical graphite thimble chamber (NE 2571) in a water tank for photon beams and a flat chamber (NE 2534) in a Perspex phantom for electron beams. The flat chamber was calibrated against the International Atomic Energy
Agency thimble chamber (NE 2571) for E0 = 17 M eV electrons as described in the NACP Protocol [1]. Field sizes o f 10 X 10 cm2 at normal treatment distances were used in all exposures and calibrations.
The dosimeters used in the procedure are inserted and centred in a plate which is machined to accept the chamber and the TLD chips. This plate can be inserted into any desired stack o f plane Perspex sheets so that the dosimeters can be irradiated at
different depths.The Bragg-Gray equation [3] was used for the calculation o f the correction fac
tors to correct the measurements o f air kerma to absorbed dose in water.For calibration purposes, the dosimeters were exposed to radiation from a
Theratron-80 “ Co 7 source. Calibration dose levels varied from 0.5 to 5 Gy.
Thirty LiF-700 TLD chips were used for central axis depth dose measurements. Three o f them were kept as control chips and were not irradiated. The remaining 27 were irradiated in the Perspex phantom, 3 at each depth.
The readings o f the TLDs were done on a Harshaw 3000 TLD system using the optimum parameters and annealing procedures.
3. RESULTS AND DISCUSSION
3.1. Energy dependence of LiF-700 TLD
The energy dependence o f the Harshaw TLDs was measured at different photon energies from 140 keV X rays up to “ Co 7 rays and for electron energies from6 to 17 MeV. The surface dose given to the TLD chips fixed at the water tank was 1 Gy.
Figure 1 shows the results o f the experiments to determine the energy dependence o f the LiF. It was found, as previously reported [4, 5], that the sensitivity o f the TLD decreases with increasing photon energy, and that there is no energy depen
dence for electron energies o f 6-17 MeV, indicating the stability o f the thermo
luminescent mechanism.

IAEA-SM-330/50 543
6
CL
O2
4 6 8 10 12 14 16 18Electron beam energy (MeV)
FIG. 1. Energy dependence of LiF-700 measured from an effective X ray energy of 140 keV up to 8 MeV and from 6 to 17 MeV for electrons.
FIG. 2. Dose dependence curve for LiF-700 dosimeters irradiated with 60Со y rays and 17 MeV electrons.
3.2. Dose dependence
Figure 2 presents the dose dependence results for ^Co y rays and 17 M eV electrons between 0.5 and 5 Gy. It was observed that there is a linear increase in the dosimeter sensitivity over the studied range o f therapy doses, indicating the formation o f traps in the phosphor by the radiation [6 ]. Since the graphs for “ Co
7 rays and 17 M eV electrons are parallel, the efficiency o f trap formation appears to be the same for the two radiation qualities.
01 2 3 4
Absorbed dose (Gy)5

544 EL-FIKI et al.
D e p t h ( c m )
FIG. 3. Depth dose curve for 17 MeV electrons measured with the flat chamber and LiF-700 dosimeter.
3.3. Central axis depth dose measurements
In order to investigate the usefulness o f the dosimeter for dose distribution measurements, central axis depth dose curves were measured in a Perspex phantom for various electron beam energies. In this paper the measurements for 17 M eV will be discussed but the results were similar for electron beam energies o f 6-17 MeV. Depth dose curves were measured using both the flat ionization chamber and the LiF-700 dosimeters. A single exposure was given so that the surface dose at the Perspex phantom was 2 Gy. The thermoluminescence was then determined and the depth dose curve obtained.
Figure 3 compares the results from the flat chamber and L iF experiments. A small difference between the two curves can be seen at depths greater than 4 cm. This may be due to a slight change in sensitivity at the different dose levels associated with the polarization effect [7].
The practical parameter values determined from the central axis depth dose measurements for electron beam energies o f 6-17 M eV using the flat chamber and LiF TLD chips are listed in Table I. Intercomparison o f these data indicates that no significant difference was found between the two techniques.
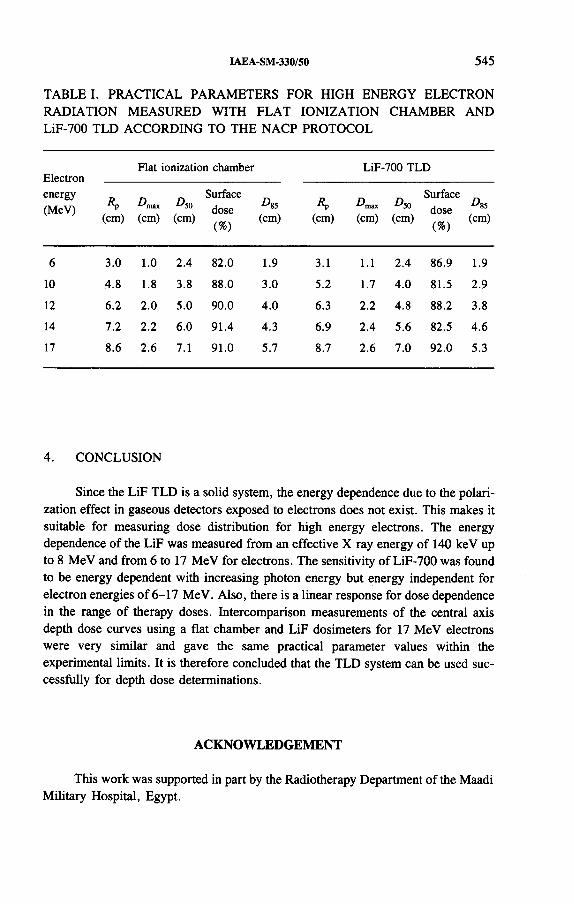
IAEA-SM-330/50 545
TABLE I. PRACTICAL PARAMETERS FOR HIGH ENERGY ELECTRON RAD IATIO N MEASURED W ITH FLA T IO N IZATIO N CHAMBER AND LiF-700 TLD ACCORDING TO THE NACP PROTOCOL
Electronenergy(MeV)
Flat ionization chamber LiF-700 TLD
(cm)^max(cm)
50(cm)
Surfacedose
(%)(cm) (cm)
A™.(cm) (cm)
Surfacedose
(%)
£*85(cm)
6 3.0 1.0 2.4 82.0 1.9 3.1 1.1 2.4 86.9 1.9
10 4.8 1.8 3.8 88.0 3.0 5.2 1.7 4.0 81.5 2.9
12 6.2 2.0 5.0 90.0 4.0 6.3 2.2 4.8 88.2 3.8
14 7.2 2.2 6.0 91.4 4.3 6.9 2.4 5.6 82.5 4.6
17 8.6 2.6 7.1 91.0 5.7 8.7 2.6 7.0 92.0 5.3
4. CONCLUSION
Since the LiF TLD is a solid system, the energy dependence due to the polari
zation effect in gaseous detectors exposed to electrons does not exist. This makes it suitable for measuring dose distribution for high energy electrons. The energy dependence o f the LiF was measured from an effective X ray energy o f 140 keV up to 8 M eV and from 6 to 17 M eV for electrons. The sensitivity o f LiF-700 was found to be energy dependent with increasing photon energy but energy independent for electron energies o f 6-17 M eV. Also, there is a linear response for dose dependence in the range o f therapy doses. Intercomparison measurements o f the central axis depth dose curves using a flat chamber and LiF dosimeters for 17 M eV electrons were very similar and gave the same practical parameter values within the experimental limits. It is therefore concluded that the TLD system can be used successfully for depth dose determinations.
ACKNOWLEDGEMENT
This work was supported in part by the Radiotherapy Department o f the Maadi Military Hospital, Egypt.

REFERENCES
[1] NORDIC ASSOCIATION OF CLINICAL PHYSICS, Procedures in external radiation therapy dosimetry with electron and photon beams with maximum energies between 1
and 50 MeV, Acta Radiol., Oncol. 19 (1980) 55-79.[2] ALMOND, P.R., WRIGHT, A., LONTZ II, J.F., “ Use of lithium fluoride thermo
luminescent dosimeters with high energy electron beams” , Solid State and Chemical Radiation Dosimetry in Medicine and Biology (Proc. Symp. Vienna, 1966), IAEA, Vienna (1967) 53-64.
[3] INTERNATIONAL ATOMIC ENERGY AGENCY, Absorbed Dose Determination in Photon and Electron Beams: An International Code of Practice, Technical Reports Series No. 277, IAEA, Vienna (1987).
[4] PINKERTON, A.P., HOLT, J.G., LAUGHLIN, J.S., Energy dependence of lithium fluoride dosemeters and high electron energies, Phys. Med. Biol. 11 (1966) 129-130.
[5] CROSBY, E.H., ALMOND, P.R., SHALEK, R.J., Energy dependence of lithium fluoride dosemeters at high energies, Phys. Med. Biol. 11 (1966) 131-132.
[6] NAYLOR, G.P., Thermoluminescent phosphors: Variation of quality response with dose, Phys. Med. Biol. 10 (1965) 564-565.
[7] MATTSSON, L.O., JOHANSSON, K.A., SVENSSON, H., Calibration and use of plane-parallel ionization chambers for the determination of absorbed dose in electron beams, Acta Radiol., Oncol. 20 (1981) 385-399.
546 EL-FIKI et al.

IAEA-SM-330/49
DOSIMETRY OF SMALL AND IRREGULARLY SHAPED ELECTRON BEAMS FOR THE VARIAN CLINAC 18 LINEAR ACCELERATOR
G. H AK IN *, S. FAE R M ANN**,Y . KR U TM AN *, A . KUSHILEVSKI*
♦Department o f Nuclear Engineering,Ben Gurion University o f the Negev
♦♦Department o f Oncology,Soroka Medical Center
and Faculty o f Health Sciences,Ben Gurion University o f the Negev
Beersheba, Israel
Abstract
DOSIMETRY OF SMALL AND IRREGULARLY SHAPED ELECTRON BEAMS FOR THE VARIAN CLINAC 18 LINEAR ACCELERATOR.
A dosimetric study of small square and rectangular fields as well as irregular and elongated fields of electron beams was performed in order to find a practical way to calculate their output factors. From profile and percentage depth dose measurements, output factors were obtained for these fields for 6 , 9, 12, 15 and 18 MeV electron beams of a Varian Clinac 18 linear accelerator. They were determined by comparison of the mean incident energies between the irregularly shaped fields and the equivalent square fields, and are consistent with the measured output factors.
1. INTRODUCTION
Many situations occur in radiotherapy where irradiation with electron beams is required, for example in head and neck tumours, the apex o f the lung in certain breast treatments, surgical scars and several types o f superficial tumour. In the majority o f these situations, the shape o f the tumour is irregular, thus requiring an irregular form o f the boost electron fields. The dosimetry o f these secondary collimated electron beams remains one o f the outstanding problems in radiation therapy.
In recent years several authors have tried to generalize the problem through empirical models [1 ,2 ] and analytical models [3, 4] in order to find a practical way to calculate the output factors [5]. In the work described in this paper the dosimetry o f small and irregularly shaped fields o f electron beams was investigated in order to find a practical way to calculate the output factor for these fields.
547

548 HAKIN et al.
The measurements were performed using a Varian Clinac 18 linear accelerator with 6 , 9, 12, 15 and 18 M eV electron beams. Two standard applicators (6 x 6 cm2
and 15 x 15 cm2) were used and several blocked square, rectangular and irregular fields were obtained using Cerrobend blocks mounted on the edge o f the standard
applicator.Profile measurements o f the irregularly shaped (Fig. 1) fields were initially
performed along the major axis in order to check the real position o f the central axis, and measurements were made o f all the square and rectangular fields ( l x l cm2,
2 x 2 cm2, etc., up to 15 X 15 cm2 and 1 x 3 cm2, 2 x 3 cm2, etc., up to 14 x 3 cm2) in order to check the symmetry and flatness. Profiles and central axis depth dose measurements were performed with a Scanditronix RFA-300 automatic field analyser, which employs a small cylindrical ion chamber or diode detector.
Depth ionization curves were obtained and converted to percentage depth doses in accordance with the dosimetry protocol o f the Hospital Physicists’ Association for
electron beams [6 ].Output factors were obtained with a parallel plate ion chamber (Markus
model 2534, Nuclear Enterprises), whose effective point o f measurement is at the inner surface o f the upper plate, connected to a Farmer 2570 electrometer (Nuclear Enterprises) in a polystyrene phantom. Also, the position o f the virtual point source was determined using the inverse slope method.
2. M ATERIALS AN D METHODS
(a)
(c) 4 cm
2.8 cm 3.8 cm
11 cm
(b)
FIG. 1. Shapes of irregular fields used in this study: (a, b) posterior triangle of the neck,(c) apex of the lung.

IAEA-SM-330/49 549
Z (mm)
FIG . 2. Percentage depth dose curves: A, 2 x 2 cm2 field ; B, small apex o f the lung;
C, unblocked 6 x 6 cm2 applicator f o r 12 M eV nominal energy.
3. RESULTS AND DISCUSSION
Figure 2 presents percentage depth dose curves for the 2 x 2 cm2 field, a parabolic field and an unblocked 6 x 6 cm2 field for 12 M eV nominal electron energy. It is seen that the surface dose increases and the mean surface energy decreases as the field area decreases.
Figure 3 presents the output factor as a function o f the side o f the square fields for 6 , 12 and 18 M eV electron energy, and Fig. 4 shows the output factor as a function o f the varying side o f the rectangular fields studied, for the same electron energies as cited above. The output factor dependence on field side (FS) was found to follow a polynomial o f the type
OF = a0 + aj/FS + а2/FS2 (1)
The specific values o f the coefficients for each energy are given in the captions to the figures.
The measured output factors for the smallest fields (1 x 1, 2 X 2,
1 x 3 cm2) are subject to a bigger uncertainty owing to the non-flatness o f the central part o f the profiles for these small and irregular fields (estimated to be ±7% ).

550 HAKIN et al.
Field side (cm)
+ 6 MeV О 12 MeV 0 18 MeV
FIG. 3. Output factor as a function of side o f square field for 6, 12 and 18 MeV and 6 x 6 cm2 applicator. 6 MeV: a0 = 1.1449, a; = —0.6083, a2 = 0; 12 MeV: a0 = 0.9684, a, = 0.2067, a2 = 0; 18 MeV: a0 = 1.069, a, = -0.1082, a2 = 0.
Field side (cm)
+ 6 MeV О 12 MeV 0 18 MeV
FIG. 4. Output factor as a function o f side o f rectangular field with a 3 cm fixed side for 6, 12 and 18 MeV and 6 x 6 cm 2 applicator. 6 MeV: a0 = 1.0295, a; = -0.1462, a2 = -0.2229; 12 MeV: a„ = 0.9404, a, = -0.142 21, a2 = 0; 18 MeV: a<, = 1.05, a, = -0.0863, a2 = 0.

IAEA-SM-330/49 551
TABLE I. COMPARISON OF MEASURED AND CALCULATED OUTPUT
FACTORS
Field size (cm2)
Eo(MeV)
OFa OFb OFc
6 MeV
5 x 3 5.21 0.991 0.987 0.9834 x 4 5.21 0.993
4 x 3 5.19 0.956 0.982 0.9683.7 x 3.7 5.19 0.981
2 x 3 5.03 0.901 0.803 0.8922.6 x 2.6 5.03 0.911
Apex l d 4.79 0.893 0.8851.96 x 1.96 4.79 0.835
12 MeV
5 x 3 10.43 0.912 0.826 0.9133.65 x 3.65 10.43 0.911
4 x 3 10.40 0.905 0.824 0.9083.6 x 3.6 10.40 0.910
2 x 3 9.14 0.869 0.780 0.8822.49 x 2.49 9.14 0.885
Apex l d 9.25 0.876 0.8792.55 X 2.55 9.25 0.887
a Output factor from Eq. (1).b Output factor from square root method [7].c Output factor from equivalent square rule [3].d Small irregular field, apex of lung.
Our approach for calculating the output factor is based on the assumption that the mean incident electron energy (spectral quality) must be the same for the irregular field and its equivalent square field. Examples o f this approach are given in
Table I. Good agreement was achieved between the measured and the calculated output factor. A detailed comparison o f the existing methods [1-4] o f output factor calculation and our proposed approach (based on the mean incident energy equivalence) is under way, the final aim being to develop a computer based algorithm for calculation o f the output factor for irregularly shaped electron beams as a function o f spectral quality (Eo).
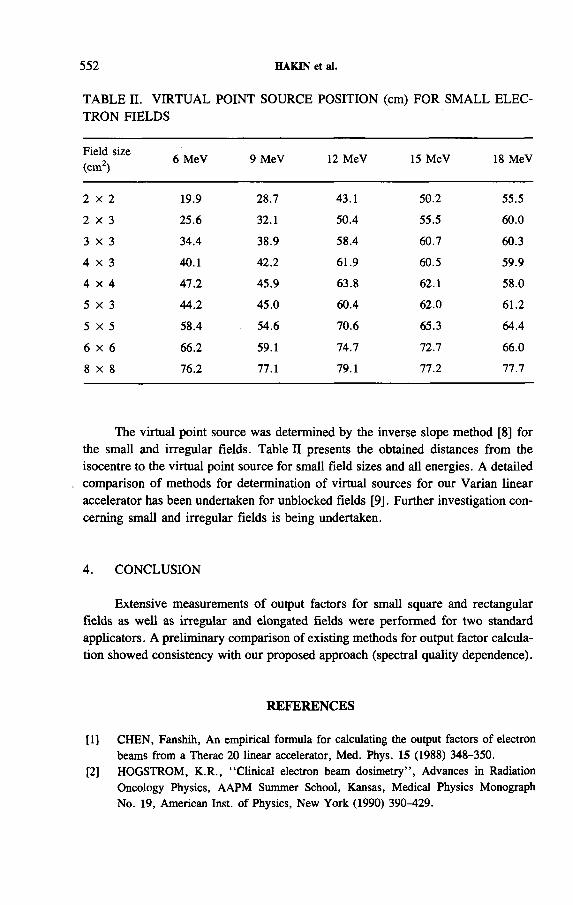
552 HAKIN et al.
TABLE П. V IR TU AL POINT SOURCE POSITION (cm) FOR SM ALL ELECTRON FIELDS
Field size (cm2)
6 MeV 9 MeV 12 MeV 15 MeV 18 MeV
2 x 2 19.9 28.7 43.1 50.2 55.5
2 x 3 25.6 32.1 50.4 55.5 60.0
3 x 3 34.4 38.9 58.4 60.7 60.3
4 x 3 40.1 42.2 61.9 60.5 59.9
4 x 4 47.2 45.9 63.8 62.1 58.0
5 x 3 44.2 45.0 60.4 62.0 61.2
5 x 5 58.4 54.6 70.6 65.3 64.4
6 x 6 66.2 59.1 74.7 72.7 66.0
8 X 8 76.2 77.1 79.1 77.2 77.7
The virtual point source was determined by the inverse slope method [8] for the small and irregular fields. Table П presents the obtained distances from the isocentre to the virtual point source for small field sizes and all energies. A detailed comparison o f methods for determination o f virtual sources for our Varian linear accelerator has been undertaken for unblocked fields [9]. Further investigation concerning small and irregular fields is being undertaken.
4. CONCLUSION
Extensive measurements o f output factors for small square and rectangular fields as well as irregular and elongated fields were performed for two standard applicators. A preliminary comparison o f existing methods for output factor calculation showed consistency with our proposed approach (spectral quality dependence).
REFERENCES
[1] CHEN, Fanshih, An empirical formula for calculating the output factors of electron beams from a Therac 20 linear accelerator, Med. Phys. 15 (1988) 348-350.
[2] HOGSTROM, K.R., “ Clinical electron beam dosimetry” , Advances in Radiation Oncology Physics, AAPM Summer School, Kansas, Medical Physics Monograph No. 19, American Inst, of Physics, New York (1990) 390-429.
IAEA-SM-330/49 553
[3] YU, Hung, The applicability of the method of equivalent squares for photon and electron beams, Phys. Med. Biol. 28 (1983) 1279-1287.
[4] McPARLAND, B.J., A method of calculating the output factors of arbitrarily shaped electron fields, Med. Phys. 16 (1989) 88-93.
[5] KHAN, F.M., et al., Clinical electron-beam dosimetry, Med. Phys. 18 (1991) 73-109.[6] HOSPITAL PHYSICISTS’ ASSOCIATION, Code of practice for electron beam
dosimetry in radiotherapy, Phys. Med. Biol. 30 (1985) 1169-1194.[7] MILLS, M.D., HOGSTROM, K.R., ALMOND, P.R., Prediction of electron beam
output factors, Med. Phys. 9 (1982) 60-68.[8] KHAN, F.M., SEWCHAND, W., LEVITT, S.H., Effect of air space on depth dose
in electron beam therapy, Radiology 126 (1978) 249-252.[9] FAERMANN, S., KRUTMAN, Y., WEINSTEIN, М., “ A comparison of methods of
determination of virtual sources for electron beams” , 6th Varian Users Meeting (Proc.Mtg San Remo, 1988), Varian Int., Palo Alto, CA (1988) 33-36.


IAEA-SM-330/26
THERMOLUMINESCENT DOSIMETER RESPONSE IN HIGH ENERGY PHOTON AND ELECTRON BEAMS
G. OLIVERAInstituto de Física de Rosario,Consejó Nacional de Investigaciones Científicas y Técnicas,
Rosario
R. SANSOGNE, S. PAPADOPULOS, M. SARAVICentro Regional de Referencia para Dosimetría,Comisión Nacional de Energía Atómica,
Buenos Aires
Argentina
Abstract
THERMOLUMINESCENT DOSIMETER RESPONSE IN HIGH ENERGY PHOTON AND ELECTRON BEAMS.
The response of thermoluminescent LiF rods to high energy photon and electron beams has been studied. The TLD response was determined experimentally using the ratio of the thermoluminescent signal (TLS) per unit of absorbed dose in a medium irradiated with high energy X rays or electrons and the TLS per unit of absorbed dose in the same medium exposed to “ Co y radiation. Measurements were made after irradiating LiF rods in a PMMA phantom to doses of about 1 Gy. Experimental data for 6 and 10 MV X rays and electron beams of nominal energies between 6 and 12 MeV were compared with those obtained by applying cavity theories proposed by several authors. In the energy range considered the response of LiF rods per unit of absorbed dose in the PMMA phantom was less for the high energy X ray and electron beams than for “ Со y rays. Once the relationship between the response to different radiation beams and ^Co y radiation has been established a calibration of the TLD system with ^Co y radiation suffices.
1. INTRODUCTION
Thermoluminescent dosimeter systems are widely employed in radiation ther
apy to determine the absorbed dose given to patients. TLD systems require a calibration curve that relates the thermoluminescent signal (TLS) from detectors with the absorbed dose determined by some absolute dosimeter, such as an ionization
chamber.Radiation therapy centres have facilities to treat patients with photon and elec
tron beams o f different energies. Therefore it is necessary to know the response o f a TLD system to radiations o f different kinds and energies in order to determine the
absorbed dose.
555

556 OLIVERA et al.
In the work described in this paper the response (relative to ^Co y rays) o f LiF rods irradiated in a solid PM M A phantom with high energy X rays and electron beams to doses usually employed in radiation therapy is analysed. Experimental results are compared with those obtained by application o f various cavity theories. Also, the feasibility o f performing dose verifications with a LiF system calibrated with ^Co y radiation in a PM M A phantom is examined.
2. EXPERIM ENTAL EQUIPMENT
2.1. Detectors
A PM M A holder for 6 mm X 1 mm x 1 mm LiF rods (Harshaw TLD-700) was constructed in a slab o f 0.30 m x 0.30 m section. The PM M A phantom consists o f several slabs o f different depths (1-10 mm). A cylindrical ionization chamber o f type PTW M23332 can be fitted into one o f these slabs. Another slab has a recess for a parallel plate chamber o f type PTW M23343.
The ionization chambers were previously calibrated against the national Argentine standard NE 2560 chamber (from the Regional Reference Center for
Dosimetry) to obtain the corresponding calibration factors in terms o f air kerma, N K, and absorbed dose, ND [1].
2.2. Irradiation machines
The irradiation machines used for this work belong to the Centro Oncológico de Excelencia Fundación J.M. Mainetti, in Gonnet (Province o f Buenos Aires):
(a) Theratron 80 cobalt therapy unit;
(b) Siemens Mevatron 6740 linear accelerator, producing 6 M V X rays and electrons o f 6 , 7, 9, 10 and 12 M eV nominal energy;
(c) Siemens Mevatron 7445 linear accelerator, producing 10 M V X rays and electrons o f 6 , 7, 8 , 10, 12 and 14 M eV nominal energy.
2.3. Other instrumentation
A Keithley (model 35617 EBS) commercial electrometer was connected to the ionization chambers in order to measure the electrical charge. The readings o f the
TLD detectors were made with a Teledyne Isotope 7300C, which heated each sample to 240°C.

IAEA-SM-330/26 557
The irradiations were performed with vertical beams o f photons and electrons perpendicular to the phantom surface. In the case o f photons, irradiations were made at the maximum o f the depth dose curve and also at the reference depth. Irradiations with electrons were made at 15 mm depth. Measurements and calculations o f absorbed dose in the PM M A phantom were made according to the Protocol o f the American Association o f Physicists in Medicine [2]. The dosimeters were irradiated
to doses o f about 1 Gy. The total uncertainty was ±2% (2a). For electrons the mean energy at the phantom surface, Eq, and the mean energy at irradiation depth z, Ez,
were determined.Each TLD detector was numbered and irradiated in a ^C o beam to determine
its sensitivity factor. This factor, C,, was calculated as the quotient C, = X/X¡, where X¡ is the TLS o f the ith dosimeter and X is the mean o f all the X, values. From a group o f 100 rods, only those whose sensitivity factor was reproducible to within 1 % were selected. For each irradiation point five rods were used. In this way the TLS was obtained as an average o f five values corrected by the appropriate sensitivity factor.
3. EXPERIM ENTAL METHOD
4. C A V IT Y THEORIES
The purpose o f cavity theory is to relate the absorbed dose in a medium, D m, to the absorbed dose in the cavity, D c:
/ = —An
where / is the proportionality factor.
In order to compare theoretical and experimental results the following factors were defined:
/со = and /e,x = ^An Co An e,X
w h ereto and/e,x are the proportionality factors for ^C o and for electrons or high energy X rays respectively.
I f the same dose is administered to the medium for every type o f radiation beam, then:
JS,X _ fe,X _ A e .X
C0 /со A Co

558 OLIVERA et al.
Assuming that the TLS is proportional to the dose results in:
x _ (TLS )e X
/CO (TLS )Co
Thus, by expressing the TLS per unit o f absorbed dose in the medium irradiated with high energy X rays or electrons, normalized to the STL per unit o f absorbed dose in the same medium exposed to “ Co photons, it is possible to obtain the TLD response as a function o f energy for different beams.
The TLDs (rods) used in this work correspond to an intermediate cavity size. In the case o f high energy photons (^C o and X rays) the modification introduced
by Horowitz et al. [3, 4] to the theory o f Burlin was applied. This modification establishes that the mean path length, g, o f electrons traversing the cavity is not equal to the mean path length, g ', o f the electrons created within the cavity due to interaction with photons. Horowitz et al. propose:
/ C L [ 1 + d [C L s“ ‘] + d' [C L C rL ‘] )where
d = ------------ : d ' =Iе dxJ o
* drJo
Î nt.
0
I * '1 tP{d) , gg = \ ------г dt?; g = -
cos â 2
Scm is the continuous energy loss mass stopping power ratio o f cavity tomedium;
t is the cavity thickness;(/ien/p)cm is the mass energy absorption ratio o f cavity to medium;d represents the attenuation o f the secondary electrons generated from the
surrounding medium in the cavity ;/3 is the effective mass attenuation coefficient o f the electron flux penetrat
ing the cavity material;P (d ) is the Klein-Nishina angular distribution function for electrons;Zc, Z,,, are the atomic numbers o f cavity and medium respectively;Ac, Am are the mass numbers o f cavity and medium respectively.
Published data for ¡3 [5-9] were analysed. Nevertheless the calculated result
for /was rather insensitive to /3 values.

IAEA-SM-330/26 559
The values adopted for electron range and stopping power ratio S were those for the continuous slowing down approximation [10]. Values for (¿ten/p)cm were
taken from Ref. [11].Janssens et al. [7] propose the following expression for f.
+ ( ? ) ( l - d - d' )f - dS^ dí v l + ü
where
d' = 1 - e-fe'
For photons and electrons Ogunleye and Fregene [12] derived the following
expression:
I = _ L + A - - L U/ 5cm V * W re
where
x is the thickness o f the cavity (g/cm2);re is the equilibrium depth o f the secondary electrons.
Holt et al. [13] derived an expression for electrons which takes into account the difference in electron scattering properties o f the medium and the cavity material:
~ = Scm( l + ( S cm- l ) ^ - \J \ чтшх/
where
<x> = tp sec 0ms
_ 180 /_/_y /2
1,1,5 7Г E0 W
p is the density o f the cavity material;t is the mean thickness o f the cavity;
Es is a constant, equal to 21 MeV;
Eo is the initial electron energy;I is the scattering thickness travelled in the medium before reaching the cavity;
Xo is the radiation length.

560 OLIVERA et al.
TABLE I. THEORETICAL AND EXPERIM ENTAL VALUES OF /&, FOR6 AND 10 M V X RAYS
Energy(MV)
_ Horowitz Experiment , ,,
y et al. [3, 4]Janssens et al. [7]
Ogunleye and Fregene [12]
6 0.934 0.937 0.971 0.973
10 0.892 0.898 0.978 0.961
TABLE П. THEORETICAL AND EXPERIM ENTAL VALUES OF f Co FOR ELECTRONS OF NO M INAL ENERGIES BETWEEN 6 AND 12 MeV
Nominalenergy(MeV)
Eo(MeV)
Experiment Theory
6 5.9 0.930 0.960
7 6.6 0.933 0.966
9 9.0 0.948 0.978
10 10.1 0.949 0.983
12 11.4 0.951 0.985
5. RESULTS AND DISCUSSION
Theoretical and experimental values o f/ c0 for 6 and 10 M V X rays are given in Table I. The response o f the LiF rods per unit o f absorbed dose to the medium is less for high energy X rays than for ^Co when irradiated in a PM M A phantom (within the total measurement uncertainty o f about 3%).
Very good agreement between measurements and the formulation o f Horowitz and Dubi [3] was found. With the other theories considered here, /*<, is also less than unity for 6 and 10 M V X rays. Nevertheless, differences o f about 4% for 6 M V and 9% for 10 M V were found between theoretical and experimental values.
Table П shows theoretical and experimental values o f f c a obtained for electrons with nominal energies between 6 and 12 M eV. The fourth column corresponds to calculations based on Holt’ s theory for electrons and that o f Horowitz and Dubi for ^Co 7 rays.

IAEA-SM-330/26 561
The response o f the LiF rods per unit o f absorbed dose is less for high energy electrons than for “ Co. The theories applied here describe this, but the values are systematically 3.5% higher than those obtained by experiment.
6 . CONCLUSIONS
This experimental study o f the response o f selected LiF TLDs irradiated in a PM M A phantom with electron and photon beams o f different energies has made possible a verification o f the cavity theories considered here. With theoretical formulations whose final mathematical expression is rather simple, it is possible to predict the response relative to “ Co o f TLDs irradiated in a specified material in high energy X ray and electron beams. However, to obtain accuracy for dose determina
tions the relative response /c’0x must be experimentally determined. Once the relationship between the response to different radiation beams and that to “ Со y radiation has been established, a calibration o f the system with “ Со y radiation
suffices.
ACKNOWLEDGEMENT
W e are grateful to J.M. Mainetti, F. Maylin and H. Rodriguez from the Centro Oncológico de Excelencia Fundación J.M. Mainetti for the use o f facilities and for
their valuable comments.
REFERENCES
[1] INTERNATIONAL ATOMIC ENERGY AGENCY, Absorbed Dose Determination in Photon and Electron Beams: An International Code of Practice, Technical Reports Series No. 277, IAEA, Vienna (1987).
[2] TASK GROUP 21, RADIATION THERAPY COMMITTEE, AMERICAN ASSOCIATION OF PHYSICISTS IN MEDICINE, A protocol for the determination of absorbed dose from high-energy photons and electron beams, Med. Phys. 10 (1983) 741-772.
[3] HOROWITZ, Y.S., DUBI, A., A proposed modification of Burlin’s general cavity theory for photons, Phys. Med. Biol. 27 (1982) 867-870.
[4] HOROWITZ, Y.S., MOSCOVITCH, М., DUBI, A., Modified general cavity theory applied to the calculation of gamma dose in ^Co thermoluminescence dosimetry, Phys. Med. Biol. 28 (1983) 829-840.
[5] BURLIN, T.E., A general theory of cavity ionization, Br. J. Radiol. 39 (1966) 727-734.

562 OLIVERA et al.
[6] PALIWAL, B.R., ALMOND, P.R., Applications of cavity theories for electrons to LiF dosemeters, Phys. Med. Biol. 20 (1975) 547-558.
[7] JANSSENS, A., EGGERMONT, G., JACOBS, R., THIELENS, G., Spectrum perturbation and energy deposition models for stopping power ratio calculations in general cavity theory, Phys. Med. Biol. 19 (1974) 619-630.
[8] EGGERMONT, G., JACOBS, R., JANSSENS, A ., SEGAERT, O., THIELENS, G., “ Dose relationship, energy response and rate dependence of LiF-100, LiF-7 and CaS04-Mn from 8 keV to 30 MeV” , Proceedings of the 3rd International Conference on Luminescence Dosimetry, Rep. 249, Danish Atomic Energy Commission, Rise (1971) 444-460.
[9] EVANS, R.D., The Atomic Nucleus, McGraw-Hill, New York (1955).[10] INTERNATIONAL COMMISSION ON RADIATION UNITS AND MEASURE
MENTS, Stopping Powers for Electrons and Positrons, ICRU Rep. 37, Bethesda, MD (1984).
[11] HUBBELL, J.H., Photon mass attenuation and energy absorption coefficients from 1 keV to 20 MeV, Int. J. Appl. Radiat. Isot. 33 (1982) 1269-1290.
[12] OGUNLEYE, O.T., FREGENE, A.O., Application of cavity theories to high-energy response of LiF dosemeters, Radiat. Res. 87 (1981) 251-264.
[13] HOLT, J.G., EDELSTEIN, G.R., CLARK, T.E., Energy dependence of the response of lithium fluoride TLD rods in high energy electron fields, Phys. Med. Biol. 20 (1975) 559-570.

DIRECT CALIBRATION IN ABSORBED DOSE TO WATER
(Session 9)
Chairman
P. ANDREOSweden
Co-Chairman
S. BELLETTIItaly


IAEA-SM-330/9
In v ited P a p er
T O W A R D S A D O S IM E T R Y S Y S T E M B A S E D O N
A B S O R B E D D O S E S T A N D A R D S
D.W .O. ROGERS, C.K. ROSS, K.R. SHORTT,N .V . KLASSEN, A .F. BIELAJEW Ionizing Radiation Standards,Institute for National Measurement Standards,National Research Council Canada,Ottawa, Ontario, Canada
Abstract
TOWARDS A DOSIMETRY SYSTEM BASED ON ABSORBED DOSE STANDARDS.A review is given of the rationale for establishing primary standards of absorbed dose
in accelerator photon beams and the progress at the National Research Council Canada (NRC) towards establishing these standards. Attention is drawn to the problems that currently exist with primary standards of air kerma in ^Co beams. The world system of air kerma standards is not very robust because they are all very similar and hence possibly subject to undetected common systematic errors. The uncertainties in these standards have been underestimated because the uncertainties in the value of (Wle).d]r and in the graphite to air stopping power ratios in a 60Co beam have been underestimated. The value of the product (W/e)mrsgT air which is used in air kerma standards is almost entirely based on graphite calorimeter measurements. A dosimetry system based on these standards is dependent on external physical data which are subject to change, in particular the electron stopping powers of graphite, water and air. In contrast, primary standards of absorbed dose to water are based on a variety of measurement techniques (graphite and water calorimeters, ionometric measurements and total energy absorption in Fricke solution). These constitute a very robust system which can eliminate systematic errors and a dosimetry system based on them is independent of changeable external data. The NRC primary standard for absorbed dose is based on water calorimetry and transfer to a point in water using Fricke dosimetry. Recent work has indicated larger effects from the Fricke vial walls than previously realized. Another serious problem to overcome is that of photon beam quality specification. It is proposed that percentage depth dose at 10 cm in a 10 x 10 cm2 field at an SSD of 100 cm is a better specifier than TPR2q and effects of electron contamination can be taken into account using a 1 mm lead foil. Finally, it is argued that clinical dosimetry should be based on absorbed dose calibrations in a “ Co beam and correction of the absorbed dose calibration factor to the beam quality of interest using a single correction factor, kq. This simplifies the calibration procedure compared to accelerator calibrations, and greatly simplifies clinical protocols, thereby improving accuracy in the field.
565

566 ROGERS et al.
1. INTRODUCTION
Most current clinical dosimetry is based on air kerma standards and protocols to establish the absorbed dose to water in clinical radiotherapy beams. However, this approach has several problems. From the perspective o f the clinical user, the dosimetry protocols are excessively complex and may reduce the accuracy o f clinical dosimetry as a result o f mistakes. From the perspective o f a standards laboratory, the air kerma standards themselves have problems because o f changes in the theory o f cavity ion chambers and uncertainties in some o f the physical data required. The basic problem is that all the standards are based on the same measurement technique and are thus potentially subject to common errors. These problems are discussed in Section 2.
In contrast, many primary standards laboratories are developing standards o f absorbed dose to water. These are based on different approaches and thus a much more robust system is being put in place. In developing the water calorimetry based standard at the National Research Council Canada (NRC) a variety o f problems have
been studied (thermal heat defect o f water, effects o f Fricke vial walls and beam quality specification). The solutions to these problems will be discussed because they have broader implications.
Once a high energy absorbed dose calibration service is established, the question is how to use it most effectively. Since it is much more expensive to calibrate chambers in accelerator beams than in ^C o beams, and because the vast majority o f dosimetry standards laboratories do not have linear accelerators, any dosimetry protocol based on absorbed dose calibration factors should be based on calibrations in a ^C o beam. Clinical dosimetry based on such a system is much simpler than that based on air kerma calibrations. The German dosimetry protocol is already based on such an approach [1]. The American Association o f Physicists in Medicine (A A PM ) has a task group (TG-51) which is investigating the feasibility o f a dosimetry protocol based on this approach.
2. A IR KERM A STANDARDS AND DOSIMETRY BASED ON THEM
Major primary standards for air kerma in ^C o beams are all based on graphite walled ion chambers. This is a problem because it is hard to detect systematic errors which may affect this type o f measurement. Recent work on cavity chamber theory has uncovered two significant errors which have affected many primary standards. It has been shown that the linear extrapolation to zero wall thickness o f ion chamber response leads to wall attenuation and scatter correction factors which are wrong by up to 1% [2]. Corrections for the point o f measurement in a point source field have also been shown to be wrong by up to 1% [3, 4]. Taken together, these two changes imply that air kerma standards increase on average by

IAEA-SM-330/9 567
1.010
д<D£ 1.005 и
SК 1.000 PQ
cda
£2 0.995
I*=3
0.990
PROPOSED (open circles)
o i
FTB(a)
PTB(c)<b
NSC
0.29! '
mo
"tíшcn
ОS-.Сц
1.010
1.005 g
OQ > а
1.000 g а> «
0.995
i-,=5
ENEA_ NIST
PTB(b)
CURRENT (filled circles)
FIG. 1. Comparison of ratios of various primary standards of air kerma to that of the BIPM using either the original (left hand scale) or recently proposed (right hand scale) corrections for wall attenuation and scatter and point of measurement (from Ref. [5]). The average air kerma increases by about 0.6% but the spread and RMS deviation stay about the same.
about 0.6%, as shown in Fig. 1. The very good consistency between the primary standards is maintained after both changes are applied [5]. These changes demonstrate the fragility o f a system in which all standards are based on the same measurement technique.
A similar concern is that all air kerma standards require knowledge o f the product o f i grjair, the graphite to air stopping power ratio in a “ Co beam, and (W7e)a¡r, the energy deposited in dry air by electrons slowing down. A recent re- evaluation o f the data on (W7e)air implies a decrease by 0.24% to 33.89 + 0.07 J/C [6 ], which is a significant change compared to the previously stated uncertainty o f0.15% [7], and the uncertainty o f +0.07 J/C (la ) only applies when the product with
V.air is used. The uncertainty on (И7е)й itself is ±0.13 J/C (±0 .38% ).Perhaps a more fundamental reservation concerns the internal logic o f a system
based on air kerma standards. Over 90% o f the weight in determining the product (WVe)ailj gr air is from measurements involving graphite absorbed dose calorimeters[6 ]. Thus air kerma standards can be said to be based on graphite calorimeters and one proposal at this symposium makes this fundamental relationship explicit [8]. I f the air kerma standard is used as the basis o f a dosimetry protocol which determines absorbed dose to water, then, at least as applied in a “ Co beam, the air kerma standard amounts to one component o f a very complicated transfer from absorbed dose to graphite to absorbed dose to water. This does not affect the ability o f the system to assign absorbed dose accurately, but it certainly does make it complex!

568 ROGERS et al.
A more practical concern about dosimetry systems based on air kerma stan
dards is that they require the value o f i gr>air in a 60Co beam1 and the uncertainty on this quantity is at least ±0.7% , mostly from the uncertainty on the mean excitation energy o f graphite given in Report 37 o f the International Commission on Radiation Units and Measurements (ICRU) (/ = 78 ± 7 eV ) [10]. More disturbing is a recent high quality measurement o f the I value o f graphite (/ = 86.9 ± 1.2 eV [11]) which implies a 1.2% reduction in the 60Co graphite to air stopping power ratio and thus
major changes in ((f/e)si[ [6 ]. This emphasizes the point that the dosimetry chain based on air kerma standards is dependent on knowledge o f quantities which are not measured or controlled within the measurement system itself. Furthermore, suggestions that {Wle)m may vary with beam quality [9] add further uncertainty to air kerma based dosimetry systems.
Ion chamber buildup caps which are never used in the clinic add another unnecessary complexity to the air kerma based systems since corrections for and details about the buildup cap play an important role in the protocol. The theory concerning these buildup caps is not well investigated (see e.g. Ref. [12]).
In short, clinical dosimetry based on air kerma standards is unnecessarily complex, conceptually awkward, based on a set o f standards which are not very robust and dependent on externally determined radiation related quantities. However, one argument which is raised in defence o f air kerma based systems is that they show
remarkable consistency. This is a desirable goal, but the arguments given above indicate that some o f this consistency may be fortuitous. More importantly, just because one can use any one o f several primary standards or any one o f several dosimetry protocols based on air kerma standards and obtain very similar results in any given beam quality, this tells us nothing about how consistent these results are for differing beam qualities — i.e. 1 Gy in a ^C o beam may be very different from 1 Gy in a 20 M V photon beam and this is unacceptable.
3. ABSORBED DOSE STANDARDS
In contrast to the conceptual and practical problems with air kerma standards, there is a wide variety o f absorbed dose to water standards being developed (for general reviews, see Refs [13, 14]). One significant advantage o f these standards is that they are based on different techniques such as absorbed dose to graphite calorimeters, absorbed dose to water calorimeters, water calorimetry, energy absorption in Fricke solution and ionometric methods. Thus it is much more likely that systematic errors can be minimized or removed.
1 The product (WVe)airj gr air required for the air kerma standard is measured, but the final dose to any medium besides graphite requires knowledge of (Wle)^г alone and hence one needs i gr>air to extract it (see Refs [6 , 9]).

IAEA-SM-330/9 569
1.005
¡2 1.000 CLm
0.995о05О
ffl 0.990
0.985
0.980
1.010
FIG. 2. Results of comparisons of 60Co absorbed dose standards, shown as the ratio to the standard at the BIPM (data deduced from Ref. [14]). The NRCW value is based on the NRC 20 MV water calorimeter calibration o f Fricke and the NRCg value is based on a graphite calorimeter with gap corrections. The NIST value is deduced from a NIST/NRC comparison and the NRCW/BIPM result. The NPL(Fricke) and NPL(ion) values are based on two comparisons using Fricke or ion chambers as transfer instruments. The NPLfPTB) value is based on an NPL/PTB comparison and the known PTB/BIPM result.
A variety o f comparisons o f these standards have been done (e.g. Refs [14, 15]). Figure 2 presents a summary o f results for comparisons in a 60Co beam and less extensive data are also available for accelerator beams [14]. Although the apparent variations between the absorbed dose standards are currently greater than for air kerma standards, these comparisons are testing all o f the various systematic uncer
tainties whereas the comparisons o f air kerma standards are not testing many o f the potential systematic uncertainties (values o f ( W/e)^г, i gr>air, ^waii> point o f measurement, etc.). Some o f the differences found between the current absorbed dose standards reflect known problems which are described below. Not all o f the solutions have been taken into account in all standards yet, but there should be significant progress in the next few years.
In the future the world will have a remarkably robust system o f absorbed dose standards in accelerator photon beams with accuracies o f ± 1 % or better (1 cr). This implies a significant improvement in clinical dosimetry where the overall uncertainty using the International Atomic Energy Agency (IA E A ) Code o f Practice is given as +3 to +4% [16]. At the same time, current indications are that the new standards
1 1 I 1 I I I
NPL( Fr i c k e )• •
N IS T ( N R C )•
N P L ( io n ) e
N R C W N P L (P T B ) :• •
P T B •: N R C 9
1 1 ...1 .. 1 1 1 11 2 3 4 5 6 7
la b o ra to ry

570 ROGERS et al.
are in reasonable accord with the results o f dosimetry protocols and thus introduction o f their use should not cause major changes in a clinic which has been properly applying the current protocols (e.g. Refs [16, 17]).
4. NRC ABSORBED DOSE STANDARD
At NRC we have made considerable progress towards developing primary standards o f absorbed dose to water in high energy photon beams. These are based on water calorimetry and the use o f Fricke dosimetry [18, 19]. Calorimetric methods are used to measure the average temperature rise in a 100 mL volume o f thermally isolated and stirred high purity water which is saturated with various gas mixtures. Using the well known heat capacity o f water and a calculated thermal heat defect for the aqueous solution, one can deduce the average absorbed dose to the water. The container is then filled with about the same quantity o f Fricke solution which is irradiated to a known absorbed dose to water. This calibrates the Fricke solution in the beam quality o f interest after various corrections are applied (e.g. for excess heat transfer from the thin walled glass container to the water, the differences between mass energy absorption coefficients in the water and Fricke volumes). The Fricke solution is then used in a standard NRC Fricke vial to determine the dose at the refer
ence point in the photon beam quality o f interest. This process avoids the need to make any assumptions about variations in the value o f eG with beam quality although to date the standard has only been established in a 20 M V beam.
The overall uncertainty in the standard is ±0.7% (Iff). The 20 M V NRC standard beam is generated by a 20 M eV electron beam hitting a fully stopping aluminium target and is flattened with an aluminium filter [18, 19, 15]. Assuming that eG does not vary between 20 M V and ^C o beams, the 20 M V standard has been shown to be in good agreement with the NRC ^Co absorbed dose to water standard based on a graphite calorimeter (to within 0 .2 % if gap effect corrections are included) or with our Fricke system (to within 0.3% i f the value o f eG given in ICRU Report 35 [20] is used [19]).
In developing this standard we have investigated several problems which are discussed briefly in the next three sections.
4.1. Thermal heat defect of water
A ll calorimeter based standards require knowledge o f the thermal heat defect o f the absorbing medium, i.e. the percentage difference between the energy deposited by radiation and the amount o f heat released. In the case o f water calorimeters this defect can be significant and it depends sensitively on the water quality. W e have studied the relative thermal heat defect o f seven aqueous solutions and found that the calculated values agree well with experimental values, especially

IAEA-SM-330/9 571
for solutions in which OH radicals are scavenged. Also, the calculated value is almost independent o f the parameters in the model for H2 and H2- 0 2 mixtures [19].
The overall uncertainty in the calculated thermal heat defect is +0.5% . For completely pure and isolated water the calculated thermal heat defect is almost 0 , and measurements at the Physikalisch-Technische Bundesanstalt (PTB) are consistent with this value to within measurement uncertainties o f 0.5% [21, 22]. However, to obtain completely pure water requires significant preirradiation o f the entire water volume, which makes large stagnant water calorimeters impractical. To overcome this problem, Domen has developed a large water absorbed dose calorimeter with a small sealed container o f highly pure water in which the sensing elements are placed [23].
4.2. Fricke vial wall corrections
Although the potential for glass walled Fricke vials to affect the dose measured in the vial has been recognized for a long time (see ICRU Report 35 and references therein [20]), many standards laboratories have used quartz- or Pyrex-walled Fricke vials because they are sent out to clinics for measurements and only with quartz vials can chemical storage effects be avoided. In collaboration with Ma and Nahum, a series o f Monte Carlo calculations were done at NRC which showed vial wall effects o f up to 2 % for our standard coin shaped quartz vials in 24 M V beams and about 1 % effects for the thinner walled vials used by the United Kingdom National Physical Laboratory (NPL) and the PTB [24]. Figure 3 shows a comparison o f calculated and measured values o f the ratio o f the dose to Fricke solution in vials made o f quartz and polyethylene. The good agreement strongly supports the calculated values. The NRC standard includes these calculated corrections and the PTB recently began to apply the calculated corrections for its vials [15, 14]. The vial wall effect has also been shown to explain at least part o f the difference between ion chamber and Fricke dosimetry at the N PL [24].
4.3. Photon beam quality specification
Another important issue with accelerator based standards is to ensure the equivalence o f the beam quality, Q, in which calibrations are done and that in which the chamber is to be used. Although TPRio, the standard beam quality specifier, is thought to specify stopping power ratios for ‘ typical’ clinical beams [25], this does
not necessarily apply to the beams used in standards laboratories nor to those delivered by the new scanned photon beam accelerators [26]. For example, Monte Carlo calculations have shown that for beams with the same TPRjq near 0.78, the stopping power ratio in the beam o f the NRC 20 M V standard (generated by 20 MeV electrons on a stopping target o f aluminium and a conical aluminium flattening filter) is about 0.7% less than in a more typical clinical spectrum generated with high Z

572 ROGERS et al.
1.04
* c a lc u la t e d
q------- a m e a s u r e d1.03 fit
Q.
1.00 - +'
0.55 0.60 0.65 0.70 0.75 0.80
FIG. 3. Comparison of the measured and calculated ratio of the dose to Fricke solution in the standard NRC quartz walled vials to that in the polyethylene walled test detector for various photon beam qualities. The calculated value is given by the ratio of the vial wall correction for polystyrene divided by that for Pyrex walls. The dashed line is a least squares fit to the calculated data. The slightly higher measured results may be due to chemical effects from the polyethylene vial.
targets [26]. This might further affect the NRC-PTB comparison mentioned above because the PTB uses a clinical accelerator [15]. Measured data showing how beam quality affects absorbed dose calibration factors are presented in another paper at this symposium [27].
Kosunen and Rogers [26] have shown that the calculated percentage depth dose at 10 cm in a 10 X 10 cm2 beam, %dd(10), is a better specifier o f beam quality than TPR 2o in the sense that it almost uniquely determines the water to air stopping power ratio that applies at the reference depth in any thick target bremsstrahlung beam (Fig. 4) and hence specifies the appropriate absorbed dose calibration factor
which depends primarily on this stopping power ratio. A remarkable feature is that the relationship between the stopping power ratio and %dd(10) is linear and hence, unlike TPRfg, %dd(10) maintains its sensitivity in high energy beams. O f course, when measuring %dd(10) care must be taken to remove the effects o f electron contamination from the measured value o f the dose maximum. By using two very different measured sets o f ‘typical’ clinical data which include electron contamination, a method to account for the electron contamination in clinical beams has been proposed [26]. The effects on %dd(10) are negligible below about 10 M V and increase to

IAEA-SM-330/9 573
1.14
1.13
со¿ 1.11
о'to 1 .Ю
I 1 .09О
сâ 1.07ою 1.06
1.05 I . I .
55 60 65 70 75 80 85 90 95% d ep th d o s e a t 1 0 cm d ep th
FIG. 4. Calculated Spencer-Attix water to air stopping power ratios versus %dd(10) (in a 10 X 10 cm2 beam, SSD = 100 cm) for a wide variety of thick target bremsstrahlung and mCo spectra. A fit to all the bremsstrahlung beams gives
spr (waterI air) = 1.2676 — 0.002 224(%dd(10))
with RMS deviation 0.0013 and maximum deviation 0.003. (Stopping powers from ICRU Report 37 [10]; figure from Ref. [26].)
about 2% in a 24 M V beam. Even a crude estimate o f this contamination reduces the uncertainty in the stopping power ratio to a few tenths o f a per cent. A more rigorous solution is to remove all accelerator specific electron contamination by using a scattering foil near the accelerator head and then determining the correction factor to account for the electron contamination and beam filtering effects o f the foil and air [26]. The advantage o f this is that these corrections are nearly the same for all accelerators o f a given beam quality and need only be determined once. For a1 mm lead foil the corrections are about 1 % for a 24 M V beam [28] and allow stopping power ratios to be determined to within 0.3% for any thick target bremsstrahlung beam by measuring %dd(10) with the scattering foil in place. Routine use o f
the scattering foil would also improve the characteristics o f clinical beams.LaRiviere has shown that another advantage o f %dd(10) is that it provides a
meaningful, well defined and unique specification o f nominal beam energy in megavolts — a number which manufacturers insist on using.
Another possible beam quality specifier (discussed by Ross et al. at this symposium [27]) is the dose perturbation near a high Z interface placed in the phantom in the accelerator beam o f interest.
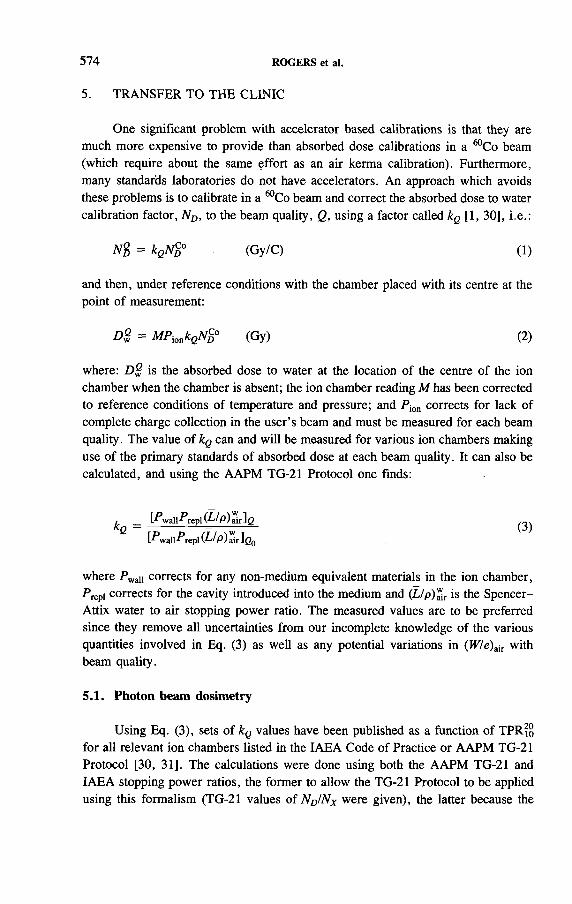
574 ROGERS et al.
One significant problem with accelerator based calibrations is that they are much more expensive to provide than absorbed dose calibrations in a “ Co beam (which require about the same effort as an air kerma calibration). Furthermore, many standards laboratories do not have accelerators. An approach which avoids these problems is to calibrate in a 60Co beam and correct the absorbed dose to water
calibration factor, ND, to the beam quality, Q, using a factor called kQ [1, 30], i.e.:
N% = kQN%° (Gy/C) (1)
and then, under reference conditions with the chamber placed with its centre at the point o f measurement:
D g = M P i00kQNS° (Gy) (2 )
where: D g is the absorbed dose to water at the location o f the centre o f the ion chamber when the chamber is absent; the ion chamber reading M has been corrected to reference conditions o f temperature and pressure; and P ion corrects for lack o f complete charge collection in the user’ s beam and must be measured for each beam quality. The value o f kQ can and will be measured for various ion chambers making use o f the primary standards o f absorbed dose at each beam quality. It can also be calculated, and using the AAPM TG-21 Protocol one finds:
£ _ [Pwall P repl (L I p )ail]Q
G [PwallPrepl(¿/p)a"r]eo
where P wall corrects for any non-medium equivalent materials in the ion chamber, P rep) corrects for the cavity introduced into the medium and (Z/p)^r is the Spencer- Attix water to air stopping power ratio. The measured values are to be preferred since they remove all uncertainties from our incomplete knowledge o f the various quantities involved in Eq. (3) as well as any potential variations in (W7e)air with beam quality.
5.1. Photon beam dosimetry
Using Eq. (3), sets o f kQ values have been published as a function o f TPRfo for all relevant ion chambers listed in the IAE A Code o f Practice or A A PM TG-21 Protocol [30, 31]. The calculations were done using both the A APM TG-21 and IAEA stopping power ratios, the former to allow the TG-21 Protocol to be applied using this formalism (TG-21 values o f N D/NX were given), the latter because the
5. TRANSFER TO THE CLINIC

IAEA-SM-330/9 575
1.00
0.99
0.98
j ? 0.97
0.96
0.95
0.940 .
FIG. 5. Universal kq curves based on ICRU 37 [10] stopping powers for all chambers of walls o f the indicated materials and thicknesses less than 0.25 g/cm2. These curves agree with the individual values for all chambers referred to in the AAPM and IAEA Protocols to within between 0.1% (for graphite, PMMA and Delrin) and 0.4%, depending on the material. (Figure from Ref [30], which also presents analytic formulas for these curves.)
IAE A values are in principle more accurate. The values o f kQ are by definition unity for “ Co beams and decrease to about 0.96 at 24 M V. It has been shown that for chambers o f a given wall material only one fcg-TPRjo curve is needed for walls less than 0.25 g/cm2 thick (Fig. 5) and these curves can be fitted with simple equations [30]. For example, for all commercial graphite walled ion chambers, the value o f kg given by2
kQ = 1 - 0.0877(TPR - 0.57) + 0.5279(TPR - 0.57) 2
- 3.536(TPR - 0.57) 3 (4)
fits to within 0.12% all the individual values calculated using the A A PM value o f P repi and the IAE A stopping power ratios.
I f kq values are calculated following the IAE A Code o f Practice, there are some minor problems because the Code uses an effective point o f measurement
TPR?o
2 There is a typographical error in Ref. [30], where the rows in table Ш wereinverted.

576 ROGERS et al.
JPRfo
FIG. 6. Comparison of kg curves calculated using the original AAPM TG-21 Protocol, the TG-21 approach but with the IAEA data set, and the IAEA Code of Practice with an effective replacement correction factor which accounts for the offset in the point o f measurement (does not go to unity for low energy beams because the point of measurement is defined differently for mCo beams). (From Ref. [30].)
instead o f P rep) corrections. However, kq has been defined with the centre o f the chamber as the point o f measurement and thus one must calculate an effective P repi [32]. As discussed elsewhere, the treatments o f P repi lead to the largest differences between the IA E A and A APM Protocols [30], not only because o f the different ways o f handling the correction but also because o f differences in the original data sets. However, in the present context a more significant issue is that the IAE A Code uses a different point o f measurement for “ Co beams than for any other beam and thus kQ does not go smoothly to unity for low energy beams. Figure 6 compares kQ values calculated in three ways. Except for the aluminium electrode effects at very high energies, the AAPM approach using the more recent IAE A stopping power ratios and the IA E A values appear to converge for high energy beams, but this is only because the differences in P repl at “ Co and in high energy beams nearly cancel.
The advantages o f a system based on absorbed dose standards are as follows:(i) it is very simple to use and understand; (ii) it is in principle more accurate; and (iii) the system o f primary standards upon which it is based is more robust. I f a measured value o f kQ is used, then a further advantage is that the entire system is independent o f a knowledge o f stopping power ratios, (W !e\ ir or variations in

IAEA-SM-330/9 577
(W/e)air with beam quality, as long as the absorbed dose standard is independent o f these quantities — which is usually the case.
The kg formalism is obviously simpler to use than the IAE A and A A PM Pro
tocols, but this is an artificial difference because air kerma based protocols could also be written in terms o f a single, ion chamber specific factor Ce , such that:
D g = M P -^ N kP q (5)
and a complete set o f Cq values is available [31]. However, conceptually the kQ approach is so much simpler to understand that it will be used more accurately in practice. Since many extraneous concepts and factors no longer play any role (e.g.
the thickness and material o f the buildup cap, the cavity length, ^ COmP(^m), /4waii(&at)> etc.), clinical physicists will have more time to understand and take into account more important dosimetry concepts such as the variation in chamber response away from the reference conditions being discussed here.
The second advantage o f the kQ approach, at least in photon beams, is that kQ can be calculated more accurately than the corresponding Cq factor because kQ depends only on the change in various parameters, not their absolute values (e.g. we know relative stopping power ratios more accurately than absolute values). Similarly, kQ can be measured more accurately than Cq because we only introduce the uncertainty in the change in ND (e.g. using the NRC standard, the uncertainty in the thermal heat defect o f water cancels out when measuring kQ). In contrast, to measure Cq introduces the total uncertainty in both the absorbed dose and air kerma standards. This increased accuracy in measuring kg is useful for verification purposes but it must be remembered that when using measured kg or Cq values, the uncertainty in the quantity o f interest, namely D $, depends on the total uncertainty o f the primary standard for absorbed dose in the beam o f quality Q, and not on the “ Co standards for either absorbed dose or air kerma.
The advantage o f the robust nature o f the system o f absorbed dose standards has been dealt with above. Other advantages related to the reduction in uncertainty when using plastic phantoms or waterproofing sleeves are discussed elsewhere [30].
5.2. Electron beam dosimetry
The kQ formalism makes the most sense for photon beams where Eq. (3) for kQ represents ratios o f the same quantity in different beam qualities. The same formalism can be applied in electron beams although the simplicity is lost because the ratios are o f different quantities as well as qualities. Also, kQ becomes a function o f beam quality and depth in the phantom. For simplicity it may prove best to continue to use the cavity gas calibration approach o f the IAE A and AAPM TG-21 Protocols but to determine Ngas (somewhat confusingly called N n in the IAEA Code) from the absorbed dose to water calibration factor, N D, i.e.:

578 ROGERS et al.
A U = ----------- ^ ------------- (Gy/C) (6 )g [Pwall-PreplCi/pÆ^Co
This simplifies the calculation o f N gas considerably compared to using an air kerma calibration factor, and a complete set o f calculated iVgas/iVD values is available [30,
31]. Although this approach means that electron and photon protocols would look different, this only reflects the reality that dosimetry for the two modalities is very different. Part o f the difficulty with present protocols is that various parameters (e.g. P repl and p u) represent different quantities in electron and photon dosimetry.
6 . CONCLUSIONS
Current clinical dosimetry based on air kerma standards has many problems, from intellectual obscurity, to practical complexity, to problems with the standards themselves which are subject to possible common errors. In contrast, clinical photon beam dosimetry based on absorbed dose standards is intellectually clear, simple in practice and founded on a very robust system o f absorbed dose standards which are in the final stages o f development. With these observations in mind, the AAPM TG-51, which is charged with producing a new or revised clinical dosimetry protocol, is investigating the feasibility o f a protocol based on absorbed dose calibration factors. The German protocol is already using this approach [1].
On the basis o f present understanding, changing to an absorbed dose based system will not significantly change the dose determined in careful clinical dosimetry, but because it is so much simpler to use and understand, it is bound to improve clinical practice.
REFERENCES
[1] HOHLFELD, K., “ The standard DIN 6800: Procedures for absorbed dose determination in radiology by the ionization method” , Dosimetry in Radiotherapy (Proc. Symp. Vienna, 1987), Vol. 1, IAEA, Vienna (1988) 13-22.
[2] ROGERS, D.W.O., BIELAJEW, A.F., Wall attenuation and scatter corrections for ion chambers: Measurements versus calculations, Phys. Med. Biol. 35 (1990) 1065-1078.
[3] BIELAJEW, A.F., Correction factors for thick-walled ionisation chambers in point- source photon beams, Phys. Med. Biol. 35 (1990) 501-516.
[4] BIELAJEW, A.F., An analytic theory of the point-source non-uniformity correction factor for thick-walled ionisation chambers in photon beams, Phys. Med. Biol. 35 (1990) 517-538.
[5] BIELAJEW, A.F., ROGERS, D.W.O., Implications of new correction factors on primary air kerma standards in 60Co beams, Phys. Med. Biol. 37 (1992) 1283-1291.

IAEA-SM-330/9 579
[6] ROGERS, D.W.O., Uncertainties in the ^Co graphite to air stopping-power ratio and a re-evaluation of (W7e)alr values, Rep. PIRS-363, Natl Research Council Canada, Ottawa (1993).
[7] BOUTILLON, М., PERROCHE-ROUX, A.-M., Re-evaluation of the W value for electrons in dry air, Phys. Med. Biol. 32 (1987) 213-219.
[8] CHAUVENET, B., DELAUNAY, F., SIMOËN, J.P., IAEA-SM-330/37, these Proceedings.
[9] SVENSSON, H., BRAHME, A., “ Recent advances in electron and photon dosimetry” , Radiation Dosimetry: Physical and Biological Aspects (ORTON, C.G., Ed.), Plenum Press, New York (1986) 87-170.
[10] INTERNATIONAL COMMISSION ON RADIATION UNITS AND MEASUREMENTS, Stopping Powers for Electrons and Positrons, ICRU Rep. 37, Bethesda, MD (1984).
[11] BISCHEL, H., HIRAOKA, T., Energy loss of 70 MeV protons in elements, Nucl. Instrum. Methods Phys. Res., Sect. В 66 (1992) 345-351.
[12] HANSON, W.F., TINOCO, J.A.D., Effects of plastic protective caps on the calibration of therapy beams in water, Med. Phys. 12 (1985) 243-248.
[13] ROGERS, D.W.O., “ New dosimetry standards” , Advances in Radiation Oncology Physics (PURDY, J., Ed.), AAPM Medical Physics Monograph No. 19, American Inst, of Physics, New York (1992) 90-110.
[14] BOUTILLON, М., COURSEY, B.M., HOHLFELD, K., OWEN, B., ROGERS, D.W.O., IAEA-SM-330/48, these Proceedings.
[15] SHORTT, K.R., ROSS, C.K., SCHNEIDER, M.K.H., HOHLFELD, K., ROOS, М., PERROCHE, A.-M., A comparison of absorbed dose standards for high energy X rays, Phys. Med. Biol, (in press).
[16] INTERNATIONAL ATOMIC ENERGY AGENCY, Absorbed Dose Determination in Photon and Electron Beams: An International Code of Practice, Technical Reports Series No. 277, IAEA, Vienna (1987).
[17] TASK GROUP 21, RADIATION THERAPY COMMITTEE, AMERICAN ASSOCIATION OF PHYSICISTS IN MEDICINE, Protocol for the determination of absorbed dose from high-energy photon and electron beams, Med. Phys. 10 (1983) 741-771.
[18] ROSS, C.K., KLASSEN, N.V., SHORTT, K.R., SMITH, G.D., A direct comparison of water calorimetry and Fricke dosimetry, Phys. Med. Biol. 34 (1989) 23-42.
[19] KLASSEN, N.V., ROSS, C.K., Absorbed dose calorimetry using various aqueous solutions, Radiat. Phys. Chem. 38 (1991) 95-104.
[20] INTERNATIONAL COMMISSION ON RADIATION UNITS AND MEASUREMENTS, Radiation Dosimetry: Electron Beams with Energies Between 1 and 50 MeV, ICRU Rep. 35, Bethesda MD (1984).
[21] ROOS, М., GROSSWENDT, B., HOHLFELD, K., An experimental method for determining the heat defect of water using total absorption of high-energy electrons, Metrologia 29 (1992) 59-65.
[22] SELBACH, H.J., HOHLFELD, K., KRAMER, H.M., An experimental method for measuring the heat defect of water using total absorption of soft X-rays, Metrologia 29 (1992) 341-347.

580 ROGERS et al.
[23] DOMEN, S.R., “ The role of water purity, convection and heat conduction in a newwater calorimeter design” , NRC Workshop on Water Calorimetry (Proc. Workshop,Ottawa, 1988) (ROSS, C.K., KLASSEN, N.V., Eds), Rep. 29637, Natl Research Council Canada, Ottawa (1988) 85-91.
[24] MA, C.-М., ROGERS, D.W.O., SHORTT, K.R., ROSS, C.K., NAHUM, A.E., BIELAJEW, A.F., Wall correction and absorbed dose conversion factors for Fricke dosimetry: Monte Carlo calculations and measurements, Med. Phys. 20 (1993) 283-292.
[25] ANDREO, P., “ Current status and future trends of the dosimetry of high-energyphoton and electron beams” , Proc. 7th Congr. Natl Fisica Medica, Oviedo(VIVANCO, J., Ed.), Soc. Española de Fisica Medica, Oviedo, Spain (1989) 9-43.
[26] KOSUNEN, A., ROGERS, D.W.O., Beam quality specification for photon beam dosimetry, Med. Phys. 20 (1993) 1181-1188.
[27] ROSS, C.K., SHORTT, K.R., ROGERS, D.W.O., DELAUNAY, F., IAEA- SM-330/10, these Proceedings.
[28] LI, X.A., ROGERS, D.W.O., Reducing Electron Contamination for Photon-Beam- Quality Specification (in preparation).
[29] LaRIVIERE, P.D., The quality of high-energy X-ray beams, Br. J. Radiol. 62 (1989) 473-481.
[30] ROGERS, D.W.O., The advantages of absorbed dose calibration factors, Med. Phys.19 (1992) 1227-1239.
[31] ROGERS, D.W.O., Compilation of Quantities Associated with Dosimetry Protocols,Rep. PIRS 291, Natl Research Council Canada, Ottawa (1991).
[32] ROGERS, D.W.O., ROSS, C.K., Comparison of IAEA 1987 and AAPM 1983 Protocols for dosimetry calibration of radiotherapy beams, Med. Phys. 19 (1992) 213-214.

IAEA-SM-330/30
ABSORBED DOSE CALIBRATION FOR HIGH ENERGY X RAYS: A NEW SERVICE FOR SECONDARY STANDARD DOSIMETRY LABORATORIES?
A . MEGHZIFENE, M. ARIB, R. GUIDOUM Centre de radioprotection et de sûreté,
Algiers, Algeria
Abstract
ABSORBED DOSE CALIBRATION FOR HIGH ENERGY X RAYS: A NEW SERVICE FOR SECONDARY STANDARD DOSIMETRY LABORATORIES?
A calibration service for high energy X rays used in radiotherapy was introduced by the United Kingdom National Physical Laboratory (NPL) in 1988. A secondary standard dosimeter (type NE 2560 electrometer and type NE 2561 ionization chamber) was calibrated at the NPL in terms of absorbed dose to water for different X ray qualities. This dosimeter is used to calibrate the output of therapeutic X ray beams. Calibration factors, expressed in terms of absorbed dose to water, have been determined using the direct calibration factor obtained from the NPL and dosimetry protocols. The results obtained indicate that the values of the two calibration factors are in good agreement. However, the absorbed dose to water calibration factor obtained by using the NPL factor has a lower measurement uncertainty (2%) than the one determined from dosimetry protocols (over 3%).
1. INTRODUCTION
The purpose o f dosimetry protocols is to outline the procedures that will allow the determination o f a reference absorbed dose to water for photon and electron beams used in radiotherapy. At present, these dosimetry protocols (such as those o f the International Atomic Energy Agency (IAE A ) [1] and the American Association o f Physicists in Medicine (A A PM ) [2]) recommend a formalism based on the use o f an ionization chamber whose calibration is traceable to an air kerma (exposure) standard. Considering the need for measurement traceability as well as for regular calibration o f dosimeters used in radiotherapy, an IAEA/WHO Network o f Secondary Standard Dosimetry Laboratories (SSDLs) was set up in 1976 [3]. The task o f calibrating a reference user dosimeter in terms o f air kerma (exposure) by comparison with a secondary standard is among the main responsibilities o f an SSDL.
In Algeria, an SSDL has been set up through the IAE A Technical Co-operation Programme. This laboratory has been fully operational since 1989. Up to now, user dosimeters from hospitals as well as clinical beams o f “ Co units have been
calibrated by comparison with an electrometer and a graphite walled ionization
581
582 MEGHZIFENE et al.
chamber o f type NE 2561 previously calibrated at the United Kingdom National Physical Laboratory (NPL) in terms o f air kerma. Besides the “ Co units, three linear accelerators have been purchased by hospitals; two o f the accelerators are fully operational.
In view o f the lack o f experience o f medical physicists at the radiotherapy centres combined with the relative complexity o f applying the dosimetry protocols for high energy photons and electrons, it was decided to undertake a study for the introduction o f an absorbed dose calibration service for high energy X ray beams. Under this new service, clinical X ray beams would be calibrated directly with an ionization chamber. This procedure will eliminate the need for the hospital physicist to make the conversions recommended in the dosimetry protocols.
An uncertainty analysis o f the measurements performed for the absorbed dose calibration service as well as o f the absorbed dose derived from the dosimetry pro
tocols has been undertaken.
2. M ATERIALS AND METHODS
For high energy X ray beams, a reference absorbed dose to water has been determined using the IAE A dosimetry Protocol and the direct absorbed dose calibration factor. For both cases, the same measuring assembly (type NE 2560 electrometer and type NE 2561 ionization chamber) has been used.
2.1. IA E A dosimetry Protocol
The absorbed dose to water at the reference point is determined using the
following equation:
^\v(P eff) ^air.u^w.airPuPcel ( 1)
where
Av(Peff) is the absorbed dose to water at the effective point o f measurement, which is taken to be upstream o f the geometrical centre o f the chamber. This shift takes into account the effect o f the spatial extent o f the air cavity. According to the IA E A Protocol, the magnitude o f the shift for high energy photon beams is 0.75r, where r is the chamber internal radius.
Aiir.u is the mean absorbed dose to the air inside the ionization chamber cavity. This quantity is derived from the air kerma calibration factor (NK) using the following equation:
^air.u NgMa( l g)katt&m (2 )

IAEA-SM-330/30 583
where
— Mu is the unit reading value corrected for pressure, temperature and ionrecombination (the humidity correction has not been taken into account);
— g is the fraction o f energy o f secondary charged particles that is convertedto bremsstrahlung in air;
— kM is a correction for attenuation and scattering o f the photons in the wall andbuildup cap o f the ionization chamber;
— km is the factor which takes into account the lack o f air equivalence o f theionization chamber material.
sw air is the stopping power ratio o f water to air at the user’ s beam quality. p ü is the perturbation correction factor at the user’ s beam quality.
Pcei is a correction factor that takes into account the effect o f the non-air equivalence o f the central electrode. For cylindrical chambers and photon beams o f energy up to 25 M eV, this factor is assumed to be equal to 1.
The secondary standard used has been calibrated in terms o f air kerma at the N PL against a 2 M V X ray beam standard. The application o f such a formalism is, in general, not straightforward and necessitates the knowledge o f many coefficients, which are to be found in tables and graphs in various sections o f the IAEA Protocol.
2.2. Absorbed dose calibration method
In the absorbed dose calibration method, the reference absorbed dose to water is determined using the following equation [4, 5]:
A v = NDiUM (3)
where
A v is the absorbed dose to water for the user’ s radiation quality (u);NDa is the N PL absorbed dose calibration factor for the user’s radiation quality; M is the unit reading value corrected for pressure, temperature and ion
recombination.
The merit o f this method was pointed out as early as 1977 by Henry [6 ], who presented the advantages o f using an absorbed dose calibration factor for ^Co radiation treatment. In 1987, Bums et al. [7] reported that a new calibration service, based on a graphite calorimeter, for high energy X rays would be available at the N PL from 1988. The calibrations o f the secondary standard instruments are carried out in a water phantom at different qualities with an overall uncertainty o f about 1.5% at the 95% confidence level. As the radiation qualities at which the secondary standard used in this experiment was calibrated do not correspond exactly to the

584 MEGHZIFENE et al.
radiation qualities o f the clinical X ray beams at the hospitals, the appropriate calibration factors have been obtained by interpolation or extrapolation [5].
The effective point o f measurement for positioning the ionization chamber was taken to be on the chamber axis 5 mm from its tip, as specified in the calibration certificate o f the NPL.
To minimize the effect o f the waterproofing sleeves [8 ] , the same sheath was used for calibrating the standard at the NPL and for calibrating the clinical beams at the hospitals.
The chamber ion recombination correction factor applicable to pulsed radiation could be derived using the ‘half-voltage’ technique. However, as this technique cannot be used on the NE 2560 electrometer, as an alternative the correction factor was derived from an empirical equation [5]:
Kion = 1.0014 + 0.23p (4)
where p is the dose per pulse in the chamber (cGy).The clinical X ray beams used in this work were obtained from two linear
accelerators (Clinac 1800 (Varian) and Saturne II (CGR-MeV)). The quality indices
(TPRio) o f the X ray beams o f the two linear accelerators are as follows:
— Clinac 1800 6 M V 0.676
18 M V 0.777
- Saturne П 10 M V 0.737
18 M V 0.786
The secondary standard dosimeter used in this work was calibrated at three radiation qualities at the NPL. The variation o f the absorbed dose calibration factor, Nd, is plotted against the quality index in Fig. 1. As explained previously, the absorbed dose calibration factor corresponding to a fixed quality index was obtained by interpolation or extrapolation from this figure.
3. RESULTS AND DISCUSSION
Using the IA E A formalism and the absorbed dose calibration factor method ( ‘direct’ method), two sets o f values o f absorbed dose to water (D (IAEA ) and D(direct)) have been obtained. For convenience, the ratio N0 (direct)/ND(IAE A ) as a function o f X ray beam quality is presented in Fig. 2. For all the investigated qualities, the difference between the two methods was found to lie between 0.3 and 0.8%.

IAEA-SM-330/30 585
Q u a l i t y i n d e x ( T P R ? “ )
FIG. 1. Absorbed dose calibration factor o f secondary standard plotted against quality index.
1.020 г
<ш<
1.010
1.000офт55? 0.990
5.64 0.68 0.72Q u a l i t y i n d e x ( T P R “ )
0.76 0.80
FIG. 2. Ratio o f absorbed dose obtained by the direct method to that obtained using the IAEA formalism plotted against quality index.

586 MEGHZIFENE et al.
The component uncertainties corresponding to one standard deviation on the
absorbed dose calibration factor o f the clinical beam are summarized below:
Absorbed dose calibration method
3.1. U ncertain ty analysis
— Absorbed dose calibration factor o fthe primary laboratory (N PL ) 0.7%
— Corrected measurements in the therapy beam 1.0%— Dose monitor o f the therapy unit 1.5%
— Overall uncertainty 1.9%
As the calibration factor was obtained by interpolation, this may increase the reported uncertainty limit o f 1.9%.
IAEA Protocol
— A ir kerma calibration factor o f theprimary laboratory (N PL ) 0.6%
— Interaction coefficients 2.6%— Corrected measurements in the therapy beam 1.0%— Dose monitor o f the therapy unit 1.5%
— Overall uncertainty 3.2%
These results indicate that the direct method has a lower uncertainty limit than
the method based on the IA E A formalism.
4. CONCLUSION
It can be concluded that the method based on the absorbed dose calibration factor gives, for high energy X ray beams, absorbed dose values which are in good agreement with the IA E A formalism. However, the simplicity and the lower uncertainty limit give the direct method a major advantage over the IAE A formalism. This advantage has led primary standard laboratories around the world to develop absorbed dose calibration methods. The authors believe that SSDLs whose principal objective is to improve dosimetric accuracy in radiation therapy should make the necessary efforts to develop transfer techniques for calibrating clinical beams by using the direct method. This applies particularly to a developing country where the calibration o f the beams is often performed by SSDLs and the hospitals are not
equipped with reference dosimeters.

IAEA-SM-330/30 587
ACKNOW LEDGEM ENTS
The authors are indebted to R. Gouadni o f the Centre Pierre et Marie Curie,Algiers, and A . Afiane and M. Aissaoui o f the Central Hospital o f Aïn-Naâdja forhaving permitted the accomplishment o f this work at the radiotherapy centres.
R EFER EN C ES
[1] INTERNATIONAL ATOMIC ENERGY AGENCY, Absorbed Dose Determination in Photon and Electron Beams: An International Code of Practice, Technical Reports Series No. 277, IAEA, Vienna (1987).
[2] TASK GROUP 21, RADIATION THERAPY COMMITTEE, AMERICAN ASSOCIATION OF PHYSICISTS IN MEDICINE, A protocol for the determination of absorbed dose from high-energy photon and electron beams, Med. Phys. 10 (1983) 741-772.
[3] EISENLOHR, H.H., The IAEA/WHO Network of Secondary Standard Dosimetry Laboratories and its function within the metrology system, Int. J. Appl. Radiat. Isot. 29 (1978) 707-711.
[4] HOHLFELD, K , “ The standard DIN 6800: Procedures for absorbed dose determination in radiology by the ionization method” , Dosimetry in Radiotherapy (Proc. Symp. Vienna, 1987), Vol. 1, IAEA, Vienna (1988) 13-22.
[5] INSTITUTE OF PHYSICAL SCIENCES IN MEDICINE, Code of practice for high- energy photon therapy dosimetry based on the NPL absorbed dose calibration service, Phys. Med. Biol. 35 (1990) 1355-1360.
[6] HENRY, W.H., The NRC Absorbed Dose to Water Calibration Service, technical report, Natl Research Council of Canada, Ottawa (1977).
[7] BURNS, J.E., DALE, J.W.G., DuSAUTOY, A.R., OWEN, B., PRITCHARD, D.H., “ New calibration service for high energy X radiation at NPL” , Dosimetry in Radiotherapy (Proc. Symp. Vienna, 1987), Vol. 2, IAEA, Vienna (1988) 125-132.
[8] ROSS, C.K., SHORTT, K.R., The effect of water-proofing sleeves on ionization chamber response, Phys. Med. Biol. 37 (1992) 1403-1411.


IAEA-SM-330/20
APPLICATION OF THE CALIBRATION FOR ABSORBED DOSE TO WATER FOR HIGH ENERGY PHOTONS
K. ENNOWNational Institute of Radiation Hygiene,Branshoj
K.J. OLSENRadiophysical Department,State University Hospital,Copenhagen
Denmark
Abstract
A P P L IC A T IO N O F T H E C A L IB R A T I O N F O R A B S O R B E D D O S E T O W A T E R F O R H IG H E N E R G Y P H O T O N S .
T h e s e co n d a ry s ta n d a rd io n iz a t io n c h a m b e r used fo r ra d ia t io n th e ra p y in D e n m a rk has b e e n c a lib ra te d fre e in a i r a n d in w a te r . T h e p o s s ib le a p p lic a t io n o f th e a b so rb e d do se to w a te r c a lib ra t io n fo r h ig h e n e rg y p h o to n s has b e e n e x a m in e d as a n a lte rn a tiv e m e th o d fo r q u a lity c o n t ro l o f d o s im e try a t D a n is h h o s p ita ls a n d as a m e an s o f c a lib ra t io n o f th e io n c h a m b e rs used b y th e h o s p ita ls . T h e p r e l im in a ry re s u lts o f th e q u a l ity c o n t ro l m e asu re m en ts a re re p o rte d . F o r h ig h e n e rg y p h o to n s th e chan ge in c a lib ra t io n w o u ld re s u lt in a ch a n g e in th e d o s im e try o f th e o rd e r o f 1 % .
1. INTRODUCTION
The status of reference dosimetry in Danish radiotherapy centres following the introduction of the International Atomic Energy Agency (IAEA) Protocol [1] has been examined in a quality assurance (QA) programme [2]. As a part of this QA programme we visited the six departments that use high energy photons and electrons. One of the features of the QA programme was to use ion chambers calibrated in absorbed dose to water to give an alternative method for determination of the absorbed dose needed for the clinical situation.
The absorbed dose to water was measured by the visiting team using standard dosimeters and compared with the reference dose value stated by the local physicists. Good agreement was found in the comparison [2] although it was estimated that there might exist a systematic difference.
589

590 ENNOW and OLSEN
A secondary standard chamber of type NE 2561 was used for the photon measurements. The chamber had been calibrated in 1990 for absorbed dose to water in a water phantom by the Bureau international des poids et mesures in Paris as well as free in air for the quantity air kerma. The two calibrations were compared for the “ Co beam in Copenhagen (Therados 780 C) by measurements in a water phantom. The absorbed dose to water, £)w, was determined by two methods:
(1) The centre of the chamber was placed at the reference depth of 5 cm and directmeasurements were performed using the absorbed dose calibration factor, N w:
Dw = A/(centre)<JVw
(2) The chamber was shifted so that the ‘effective point of measurement’ ,i.e. 0.5r, was at the reference depth. The dose was calculated from the airkerma calibration factor, NK, following the IAEA Protocol [1]:
A , ^ (P e ff)c ^ irO 8)kmkatt (■i w,air)ci’u,c
(see Ref. [1] for explanation of the different factors).
The absorbed dose measured according to method (2) could be used to calculate a value for the absorbed dose to water calibration factor, N ^ K ), derived from the air kerma calibration:
_ NKM (Pdf) ( 1 g) /cmaIt w,airPuw M(centre) Af(centre)
In our ^Co beam with SSD = 100 cm the two calibrations for the NE 2561 chamber were in good agreement. The absorbed dose measurement by method (1) was a little higher than the dose determined according to method (2). The ratio of N w to N W(K) was 1.001 ± 0.0005 (la). The uncertainty given is statistically determined (type A) in repeated set-ups of water phantom and chamber.
For high energy X ray beams the measurements were carried out with the centre of the chamber placed at the reference depth in the water phantom. The reference depths are given in the IAEA Protocol (Ref. [1], table VII). The quality of each X ray beam is characterized by the value of the tissue-phantom ratio, TPRiq. The absorbed dose to water calibration factor for high energy photons was derived from information given by the United Kingdom National Physical Laboratory (NPL) in
2. MEASUREMENTS

IAEA-SM-330/20 591
Ос"Э»ОЕ
1 0 2
1 0 1
1 0 0
99
103
97
960.5
° N P L
* A N D REO
i IAEA
о ж ' о
ж
ъ
0.6 0.7 0 . 8 0.9
FIG. 1. Calculated absorbed dose to water calibration factors, Nw, for an ionization chamber of type N E 2561. Comparison of values is based on three different sets of data: open squares (NPL): from water calibration and Ref. [3]; asterisks (Andreo): from water calibration and Ref. [4]; and solid squares (IAEA): from air kerma calibration and Ref. [1].
Ref. [3] for the type NE 2561 chamber. The values in table 4.5 of Ref. [3] were used to calculate N w as a function of TPRjq by normalizing to the known value for “ Co. The values used are shown in Fig. 1 and some of them in Table I. For the TPRj® range of 0 .6 - 0 . 8 the absorbed dose measured using the water calibration factor and the calculated N w was higher than the dose stated by the physicists. The differences relative to the measured value varied from 0 to 2%, as shown in Fig. 2, with an average value of 0.8%. The uncertainty of the measurements (la) is given for one of the points.
Since we suspected a systematic difference, four of the X ray beams (4, 8 , 10 and 18 MV) covering a TPR?® range from 0.65 to 0.79 were measured with the NE 2561 chamber using both the water calibration and the air kerma calibration, similarly to the two methods mentioned above for “ Co. This revealed a 0.5-0.6% higher absorbed dose using the water calibration. From these measurements we calculated the calibration factors N W(K) derived from the air kerma calibration using the equation given above. These values are included in Table I and Fig. 1. The disagreement between N w and N V(K) is of the same order as the differences between the measured and stated doses shown in Fig. 2.

592 ENNOW and OLSEN
TABLE I. ABSORBED DOSE TO WATER CALIBRATION FACTOR FOR IONIZATION CHAMBER NE 2561 (SERIES No. 068)(Nw was calculated from the water calibration using information in Ref. [3] and
NW(K) was calibrated from the air kerma calibration using the equation in the text.)
TPR ^oNw
(m G y /n C )NW(K)
(m G y /n C )(Nw - NJK))/NW
(% )
8 П о 1 0 0 .3 7 1 0 0 .2 7 0.10
0 .6 5 3 1 0 0 .6 4 1 0 0 .0 8 0 .5 6
0 .7 1 2 9 9 .9 3 9 9 .5 8 0 .3 5
0 .7 3 6 9 9 .4 6 9 8 .8 5 0 .6 1
0 .7 8 6 9 8 .2 6 9 7 .5 5 0 .7 2
3. DISCUSSION
Since the initiation of this project a number of publications on the calculation of absorbed dose quality factors for photon beams have appeared. Among these publications we have chosen that by Andreo [4]. The photon beam quality factor kQ for chamber NE 2651 is given in table 2 of Ref. [4] and the calibration factors for different TPRs have been calculated by multiplication by the value for “ Co: N w = koNwc. These values, marked “ Andreo” , are compared with the values calculated from Ref. [3], marked “ NPL” , in Fig. 1.
It can be seen from Fig. 1 that there is good agreement between the two sets of data, which was also demonstrated in fig. 4 of Ref. [4]. Also shown in Fig. 1 are the values of N W(K) from Table I derived from the air kerma calibration and the IAEA Protocol. These calibration factors are lower than the factors derived from the water calibration. It is assumed that the TPR given in Refs [3] and [4] as well as the TPR measured for the X ray beams in Table I is a proper quantity to characterize the radiation beams for this comparison.
The ratio of the charges measured at different depths, M(Peff)/Af(centre), is an essential part of the calculation of N V(K). It is assumed that the shift to 0.75r for high energy photons recommended in the IAEA Protocol is correct. It has been suggested that a shift of 0.6r should be more consistent with experimental work [5]. I f0.6r had been used the difference between N w and N W(K) would have been less and the suggestion is therefore supported by our results.

IAEA-SM-330/20 593
■оi 4СОCOф
I 3 ф со «i 2 тз
ф |_ э сосо ч ф 1 Е
I о. *> фО
-10 . 6 0.7 0 . 8 0.9
TPRÍ
FIG. 2. The difference between the absorbed dose to water for 15 high energy X ray beams as measured by the Quality Control Team using water calibration and by the local physicist using an air kerma calibration (see Ref. [2]).
4. CONCLUSION
The absorbed dose to water for high energy photon beams was determined from measurements in a water phantom using an NE 2561 ionization chamber. Two different calibration factors were used and the calculated absorbed dose showed a systematic difference of the order of 1 %. Although the differences found were less than the total uncertainty for the assessment of absorbed dose, as calculated in the IAEA Protocol (i.e. a combined uncertainty of 3.2%), the problem has to be examined further.
It would be an advantage for the hospital physicists to be able to determine directly the absorbed dose to water but today the introduction of a new calibration of their instruments would result in a shift in the dosimetry.
We suggest that more effort be devoted to solving this disturbing problem before we change the calibration. This could be done in connection with a revision of the IAEA Protocol.
594 ENNOW and OLSEN
R E F E R E N C E S
[1] INTERNATIONAL ATOMIC ENERGY AGENCY, Absorbed Dose Determination in Photon and Electron Beams: An International Code of Practice, Technical Reports Series No. 277, IAEA, Vienna (1987).
[2] OLSEN, K.J., ENNOW, K.R., Quality Assurances in Radiation Therapy Dosimetry in Denmark, Report 1993, Rigshospitalet, Copenhagen (1993).
[3] BURNS, J.E., DALE, J.W.G., Conversion of Absorbed Dose Calibration from Graphite into Water, NPL Rep. RSA(EXT)7, NPL, Teddington, UK (1990).
[4] ANDREO, P., Absorbed dose beam quality factors for the dosimetry of high-energy photon beams, Phys. Med. Biol. 37 (1992) 2189-2211.
[5] SSDL Newsletter No. 31, IAEA, Vienna (1992).

IAEA-SM-330/64
DIRECT DOSIMETRY CALIBRATION AT HIGH ENERGY ELECTRONS: PAST EXPERIENCE AND RELATION TO CURRENT PROTOCOLS
U.F. ROSENOW, G. KASTEN Department for Clinical Radiobiology
and Clinical Radiation Physics,University of Gottingen,Gottingen, Germany
Abstract
D IR E C T D O S IM E T R Y C A L IB R A T IO N A T H IGH E N E R G Y E L E C T R O N S: P A ST
E X P E R IE N C E A N D R E L A T IO N T O C U R R E N T P R O T O C O L S.
T he method o f direct calibration o f M arkus cham bers, parallel plate ionization cham
bers for electron dosim etry, at high energy electrons set up by M arkus and Kasten in the late
1970s is reviewed. T he aspects considered are the long term stability o f the primary standards used as well as that o f the M arkus cham ber, and the com parison with other dosimetry pro
tocols which generally rely on a “ C o air kerm a calibration. T he stability o f the prim ary stan
dards over the past 15 years turned out to be excellent. T he stopping power ratios o f water
to air in this system plotted against the mean energy at depth fall on a universal curve. The
d ifference from the stopping power ratios o f the other protocols which also depend on mean
initial energy appears to be compensated for by the assumption o f a perturbation effect o f unity
over the full energy range.
1. INTRODUCTION
In 1975 Markus introduced a method for calibrating parallel plate electron chambers, nowadays known as Markus chambers, directly at high energy electrons. Naturally, this method was not traceable to the national calibration laboratory. Markus applied two standards which might be considered absolute dosimetry standards. One of them consisted of ionization measurements with a specially designed graphite double extrapolation chamber [ 1] by which exposure to an air cavity approaching zero volume inside a graphite phantom was measured. The dose to the air volume is then Da = (И7е)/а, where 7a = NJA, 7Va is the exposure calibration factor and M is the reading corrected for air density. W = 33.73 eV was used, which is lower by 0.36% than the presently recommended value of 33.85 eV for dry air given in Report 35 of the International Commission on Radiation Units and Measurements (ICRU) [2]. Dose to water is then derived as D w = ,çw aDa, where sw a is the mean mass stopping power ratio of water to air.
595

596 ROSENOW and KASTEN
Markus determined sw a from a comparison of the ionization dose with another absolute dose measurement, Fricke dosimetry. The dose to the nearly water equivalent ferrous sulphate solution is given by Dw = N A(E - E 0)/lpeG, where N a is the Avogadro constant, E — E 0 the radiation induced change in extinction,I the length of the optical path in the solution, p the density of the solution, e the extinction coefficient and G the chemical yield. Parameter values e = 2190 ± 3 L -то Г 1 -cm-1 and G = (15.6 + 0.6) x 10“2 eV' 1 = 1.616 x 10“6 mol-1 -kg-Gy were used in accordance with the German standard DIN 6800/T3 [3]. Thus, the product 6G is equal to 353.9 т 2 -тоГ ], which is about 0.5% higher than the ICRU 35 recommended value of 352, which practically cancels out against the lower W value used. From both independent methods to determine dose to water the mass stopping power ratio can be determined as sw a = const (E — E 0)/Ja.
A PTW 23312 cylindrical chamber (N chamber) of 0.37 cm3 volume was calibrated against the double extrapolation chamber as standard instrument for the calibrations. Since 1978 all calibrations of Markus chambers in our laboratory have been performed against the mean dose determined with this chamber and the Fricke dosimetry standard. In addition, one Markus chamber (M23343, serial No. 100) was intermittently calibrated and used as an additional backup standard.
Initially the Markus chambers were manufactured in our laboratory (type E); since October 1980 these chambers, following some modifications, have been manufactured by PTW-Freiburg, Germany (type 23343 with a preceding В, M, N, or R depending on the type of cable connector).
Markus and Kasten summarized the experience with the calibrations of these chambers at a dosimetry symposium in Vienna in 1987 [4]. In this presentation we shall update that report and discuss some additional aspects and data derived with the calibration of Markus chambers [5, 6 ].
2. CALIBRATION STATISTICS AND LONG TERM STABILITY
Since 1979 a total of 1164 chambers have been calibrated with the calibration method described, 160 of them of the E series and 1004 of type PTW 23343.
Occasionally, chambers are sent to us for recalibration. This provides us with a means of checking the stability of the individual chambers as well as the calibration system as such. The experience with recalibration is summarized in Fig. 1, wherecalibrations from 1990 or earlier are related to the 1992 calibrations of the individualchambers. Chamber sensitivity was always determined by means of a 90Sr check source. Therefore, the check source readings at the time of calibration could be decayed to the day of the 1992 calibration, and previous and present chamber calibration compared. A half-life of 28.7 years was used, derived from a publication of the German national standards laboratory, the Physikalisch-Technische Bundesanstalt (PTB) [7]. Since we have no records of chamber histories, i.e. of damage or repair,

IAEA-SM-330/64 597
Y e a r s s i n c e c a l ib r a t io n
FIG. 1. Ratio o f past calibration factors o f individual chambers to the individual calibration
factor o f these chambers obtained in 1992. Thin lines connect data o f single chambers. The
thick line represents an exponential f i t to a ll chamber data which could be explained by a half-
life o f the 90Sr check sources o f 27.1 years, o r 27.5 years i f the point in parentheses were
excluded.
the data in Fig. 1 may contain step changes in sensitivity due to mechanical alterations. This possibility should be taken into account and might in fact be obvious for one or two data point's. Few such data collected over a period of up to 11 years should be available elsewhere.
The majority of the data fall within ±1%, which we consider remarkable. In Fig. 1 the average for all chambers is also shown (thick line), indicating a slight drift. One may be tempted to attribute this drift to a half-life of the 90Sr check sources lower than 28.7 years. Actually, 28.15 years is also used [8 ]. However, the half-life which would result from the average is 27.1 years, or even 27.5 years if the point in parentheses is omitted from the averaging.
The long term stability of the calibration system may more directly be derived from a comparison of the dose determinations with Fricke dosimetry and with ionization dosimetry using our primary standard chamber. There have been 144 calibration sessions so far with an average of eight Markus chambers calibrated per session. As described above, at these sessions the dose per 1 0 0 0 monitor units is determined independently for the standard chamber (PTW 23312) and the Fricke dosimetry system. The percentage difference between the ionization chamber dose and the Fricke dose in these 144 calibration sessions is shown in Fig. 2. In about half of the calibration events the difference between the two systems was within +0.25%. With a few exceptions, results are within +0.75%. These calibrations have been performed at

598 ROSENOW and KASTEN
80q7 0 -!60 J
uV 50PÛa 40-3 -
Z ЗОН20i1 0 -
Mean -0.08%SE 0.03%Min. -1.48%Max. 0.91%
-1.5 - 1 -0.5 0 0.5 1% Difference Ion.Ch./ Fricke
FIG. 2. Percentage difference in the dose per 1000 monitor units between the standard ionization chamber and the Fricke dosimetry system, determined in 144 calibration sessions (1979-1992).
three different Siemens Betatrons of 15 MeV (up to June 1986), 42 MeV (August 1986 to October 1990) and 18 MeV (since December 1990). The standard Markus chamber (M-100) underwent occasional physical changes. For 12 calibrations in a longer period between 1987 and 1991 where the chamber remained unchanged, the percentage difference in the calibration factor was five times within +0.25%, two times within +0.25-0.75%, three times within +0.75-1.25% and once -1.46%. Deliberately, a calibration in 1987 was taken as the reference.
3. COMPARISON WITH OTHER DOSIMETRY PROTOCOLS
Present dosimetry protocols for electron (and photon) dosimetry are based on chamber calibration factors derived with ^Co y radiation. Only the German DIN 6800/T2 [9] also includes the option to apply the Markus calibration method addressed here. Therefore, it should be of interest to compare the unique Markus method of direct calibration at high energy radiation [4, 10] with the ^Co based protocols. We have done this for the M-100 chamber using DIN 6800/T2 [9] and the Protocols of the International Atomic Energy Agency (IAEA) [11], the American Association of Physicists in Medicine (AAPM) [12] and the ICRU [2] for E0 =
15 MeV and 6 MeV electrons. We assumed an identical /Va, the “ Co exposure calibration factor, for all Protocols which we derived from a comparison of the

IAEA-SM-330/64 599
TABLE I. PERCENTAGE DIFFERENCES RESULTING FROM APPLICATION OF DOSIMETRY PROTOCOLS TO THE MARKUS CALIBRATION METHOD AT ELECTRON RADIATIONS OF 15 AND 6 MeV INCIDENT ENERGY
E0 (M eV ) DIN IA EA A A PM IC R U
15 + 0 .1 - 0 . 7 - 1 .1 + 0 .4
6 + 0 . 6 + 1 .2 + 0 .5 + 1.5
Markus and the standard 23212 cylindrical chamber in 5 cm equivalent water depth in a PMMA phantom. The standard chamber has a 60Co calibration factor traceable to the national standard (PTB).
The results are summarized in Table I as the percentage difference resulting from application of the Protocols to the Markus and PTW methods. The generally small differences result mainly from the stopping power ratios used and the treatment or, in the case of the Markus method, the absence of perturbation correction factors. The direct calibration method of Markus is in very good agreement with the other Protocols. This may be surprising considering the fact that in the dosimetry system of Markus no corrections are applied to the Markus chamber readings other than for air density and saturation. The polarity effect of that chamber is negligible. However, recent measurements [13-15] indicate that the perturbation correction factor, pa, might deviate from unity at low energies by up to 2%. A look at the stopping power ratios w ill explain this apparent discrepancy.
The mean stopping power ratios as determined by Markus are presented in Fig. 3 in comparison with stopping power ratios taken from the AAPM Task Group 21 (TG-21) Protocol [12], which are also used in other current dosimetry protocols. The latter have been replotted over the mean energy at depth z, E z, calculated from the energy-range formula E z = E p0 - 3.51 {ZIA)pz, or E z = E p0 -
1.955z for water [4]. E p0 is the most probable electron energy at the surface, and Z and A are the effective order number and effective mass number respectively. Most of the TG-21 stopping power ratios are within ± 2 % of those measured by Markus, and approximated by a curve given by Trier [16]. Markus did not see differences related to the initial energy of the electrons. There is no evidence that this might be specific to the Betatron spectra used throughout. Markus also assumed a perturbation correction factor, pa, of unity over the electron energy range in question. It therefore appears that the deviation of pu from unity might already have been incorporated into the Markus stopping power ratios. This is quite evident from the 5 MeV curve for the TG-21 stopping power ratios, which is mostly above the Markus curve.
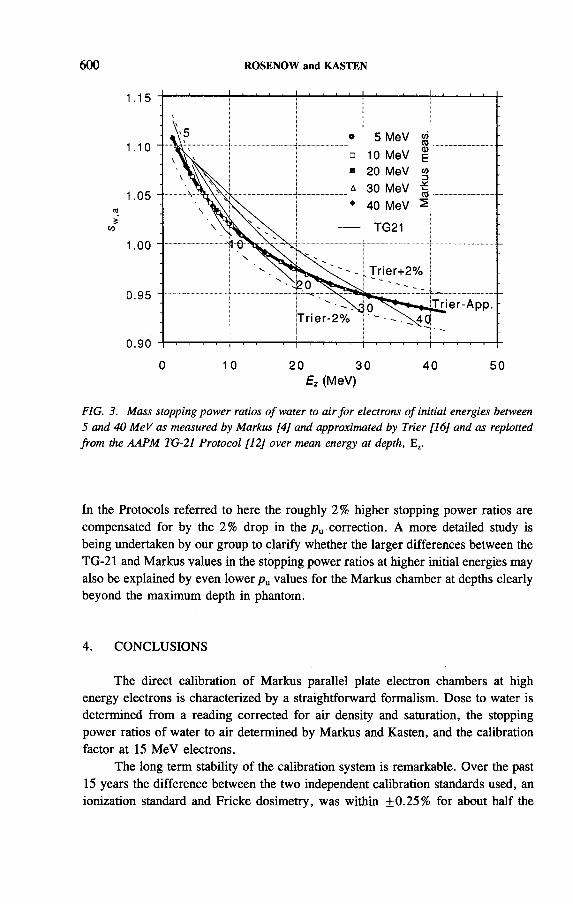
600 ROSENOW and KASTEN
Ez (M eV )
FIG. 3. Mass stopping power ratios o f water to air for electrons o f initial energies between 5 and 40 MeV as measured by Markus [4] and approximated by Trier [16] and as replotted from the AAPM TG-21 Protocol [12] over mean energy at depth, Ez.
In the Protocols referred to here the roughly 2 % higher stopping power ratios are compensated for by the 2% drop in the p u correction. A more detailed study is being undertaken by our group to clarify whether the larger differences between the TG-21 and Markus values in the stopping power ratios at higher initial energies may also be explained by even lower p a values for the Markus chamber at depths clearly beyond the maximum depth in phantom.
4. CONCLUSIONS
The direct calibration of Markus parallel plate electron chambers at high energy electrons is characterized by a straightforward formalism. Dose to water is determined from a reading corrected for air density and saturation, the stopping power ratios of water to air determined by Markus and Kasten, and the calibration factor at 15 MeV electrons.
The long term stability of the calibration system is remarkable. Over the past 15 years the difference between the two independent calibration standards used, an ionization standard and Fricke dosimetry, was within ±0.25% for about half the

IAEA-SM-ЗЗО/64 601
calibrations. Repeated calibrations of individual chambers confirm the stability of the system as well as that of the chamber sensitivities.
This calibration system is in close agreement with other current dosimetry protocols. The stopping power ratios used in the system are uniquely dependent on the mean electron energy at depth, E z, and independent of the initial mean energy of the electrons at the surface. They agree with stopping power ratios used in other protocols mostly to within ±2%. It appears that any perturbation effects at lower energies are already incorporated in these stopping power ratios.
REFERENCES
[1] M A R K U S , B . , Eine polarisierungseffektfreie Graphit-Doppelextrapolationskamm er
zur Absolutdosim etrie schneller Elektronen, Strahlentherapie 150 (1975) 3 0 7 -3 2 0 .[2] IN TE R N A TIO N A L C O M M ISSIO N ON R A D IA T IO N U N IT S A N D M E A S U R E
M E N T S , Radiation Dosim etry: E lectron Beam s with Energies Betw een 1 and 5 0 M eV ,
IC R U Rep. 3 5 , Bethesda, M D (1984) 6 6 pp.[3] D E U T SC H E S IN ST IT U T F Ü R N O R M U N G , Dosism eBverfahren in der radio-
logischen Technik. Eisensulfatdosim etrie, D IN 6800/T3, Beuth, B erlin (1980).
[4] M A R K U S, B . , K A ST E N , G ., “ T he high energy dosimetry system Gottingen —
Tw elve years controlled accuracy and stability” , Dosim etry in Radiotherapy (Proc.
Sym p. V ienna, 1987), V o l. 1, IA E A , V ienna (1988) 7 5 -8 6 .[5] M A R K U S, B . , E ine Parallelplatten-Kleinkam m er zur D osim etrie schneller Elektronen
und ihre Anwendung, Strahlentherapie 152 (1976) 5 1 7 -5 3 2 .
[6 ] M A R K U S, B . , “ Ionization cham bers, free o f polarity effects, intended for electron
dosim etry” , Dosim etry in Agriculture, Industry, Biology and M edicine (Proc. Symp.
V ienna, 1972), IA E A , Vienna (1973) 4 6 3 -4 7 3 .[7] SC H Ô T Z IG , U ., SC H R A D E R , H ., Halbwertszeiten und Photonen-
Em issionswahrscheinlichkeiten von hâufig verwendeten Radionukliden, Rep. P T B -
Ra-16/3, Physikalisch-Technische Bundesanstalt, Braunschweig (1989).
[8 ] D U T R E IX , A ., M A R IN E L L O , G ., W A M B E R S IE , A ., D osim étrie en Curiethérapie, M asson, Paris (1982) 2 7 0 pp.
[9] D E U T SC H E S IN ST IT U T F Ü R N O R M U N G , D osism eBverfahren nach der Sonden-
methode fur Photonen- und Elektronenstrahlung. Ionisationsdosim etrie, Entwurf, DIN
6800/T2, Beuth, B erlin (1990) (published draft).
[10] P T W -F R E IB U R G , U sers M anual for the E lectron Cham ber A ccording to M arkus, P TW -Freiburg .
[11] IN T E R N A T IO N A L A T O M IC E N E R G Y A G E N C Y , Absorbed D ose D eterm ination in
Photon and Electron Beam s: A n International Code o f Practice, Technical Reports
Series N o. 2 7 7 , IA E A , Vienna (1987) 9 8 pp.
[12] T A S K G R O U P 2 1 , R A D IA TIO N T H E R A P Y C O M M IT T E E , A M E R IC A N A SSO C I
A TIO N O F P H Y S IC IS T S IN M E D IC IN E , A protocol for the determination o f
absorbed dose from high-energy photon and electron beam s, M ed. Phys. 10 (1983)
7 4 1 -7 7 1 .

[13] R O SE N O W , U .F . , K A ST E N , G . , “ Electron energy calibration with the M arkus cham
ber. A reassessment o f replacement and polarity correction factors” , poster presented
at 32nd Annu. M tg o f Am erican A ssoc, o f Physicists in M edicine, Saint Louis, M O ,
1 990 , M ed. Phys. 17 (1 9 9 0 ) 545 (abstract).[14] R O SE N O W , U .F . , Comm ents on the experimental determination o f the replacement
correction factor for parallel-plate ionization cham bers in high-energy electron beam s,
M ed. Phys. 2 0 (1993) 7 3 9 -7 4 1 .
[15] R O SE N O W , U .F . , K A ST E N , G ., T H IE N E L , T ., IA EA -SM -330/65, these
Proceedings.[16] T R IE R , O ., Praktische Physik, 23rd edn (K O H LR A U SC H , F . , E d .) , Teubner, Stutt
gart (1985) para. 9 . 8 .6 .3 .
602 ROSENOW and KASTEN

DIAGNOSTIC X RAY DOSIMETRY(Session 10)
Chairm an
P .J . R O B E R T SUnited Kingdom
Co-Chairm an
A. BENIN IIAEA


IAEA-SM-330/73
Invited Paper
NATIONAL ACCREDITATION OF INSTRUMENT CALIBRATION
P.J. ROBERTSSouthampton University Hospitals,Southampton,United Kingdom
Abstract
N A T IO N A L A C C R E D IT A T IO N O F IN ST R U M E N T C A L IB R A T IO N .
A main function o f prim ary standards laboratories is to provide user access for
traceability standards and this is achieved increasingly through networks o f accredited secon
dary laboratories. T h e co-operation between prim ary standards laboratories and the establish
m ent o f accreditation bodies are described. A ccreditation bodies have also established
international co-operation and the system o f mutual recognition agreem ents is described
for western Europe. National measurement and calibration services are available in most
European countries and the system w hich has evolved for accreditation in the United Kingdom
is described in detail as one exam ple. C riteria for accreditation o f laboratories have been published by international organizations and these are follow ed closely by accreditation bodies and
the laboratories they accredit to ensure international com patibility. Com pliance with quality
standards as well as calibration accuracy is an essential prerequisite for accreditation.
1. INTRODUCTION
Traceable measurement of radiation exposure is essential for the comparison of therapeutic or diagnostic exposures of patients and indeed for comparison of occupational exposures. This is true not only for individual measurements within a hospital and between hospitals within a country but also between countries within which such measurements are made.
The worldwide system of national primary standards laboratories and Secondary Standard Dosimetry Laboratories makes possible such traceability. This system is well appreciated in the field of therapeutic radiation dosimetry but the concept of comparisons in the fields of occupational and diagnostic radiation dosimetry, where individual exposures are so much lower, is much more recent. However, the principles of measurement traceability are identical.
605

606 ROBERTS
2 .1 . National standards laboratories
Industrialized nations have to operate standards laboratories to maintain measurement standards and act as a focus for their national measurement systems. In each country there is usually a single focus (e.g. the Physikalisch-Technische Bundesanstalt (PTB) in Germany, the National Institute of Standards and Technology (NIST) in the United States of America, the National Physical Laboratory (NPL) in the United Kingdom or the National Measurement Laboratory (NML) in Australia); sometimes the function of the standards laboratory is split between two sites or laboratories (e.g. the National Research Laboratory of Metrology (NRLM) and the Electrotechnical Laboratory (ETL) in Japan, or the Istituto di Metrologia “ G. Colonnetti” (IMGC) and the Istituto Elettrotecnico Nazionale (IEN) in Italy). Occasionally, the function is distributed amongst a number of laboratories and coordinated by a central bureau (e.g. the Bureau national de métrologie (BNM) in France), but this is rarer. The current trend throughout the world is very much towards single national laboratories and several countries are in the process of building new or enlarged facilities (e.g. Ireland, the Republic of Korea, Mexico, Portugal and Singapore).
There are currently 15 primary standards laboratories for radiation measurements. The primary role of the national standards laboratories is to ensure:
(a) That their standards realize the SI units in accordance with the definitions of the General Conference on Weights and Measures (CGPM), including any research and development associated with this; and
(b) That users have access to these standards to provide traceable measurements, either directly, or indirectly through a national accredited measurement system.
The first of these functions relies heavily on the Bureau international des poids et mesures (BIPM) in France as the focus for the results of laboratory intercomparisons for national standards laboratories throughout the world. Such intercomparisons give scientific assurance on the accuracy associated with the standards.
2 .2 . Regional co-operation among national standards laboratories
National standards laboratories cannot operate in isolation from each other if measurements are to be compared between countries. Co-operation between laboratories provides mutual support even with a focus like the BIPM for intercomparison results. In 1973, a western European metrology conference was held at the NPL and this was perhaps the first example of regional co-operation in metrology. A wide ranging discussion on all aspects of standards and metrology took place and it was
2. PRIMARY STANDARDS

IAEA-SM-330/73 607
agreed at that first conference to continue to meet on a regular but informal basis as the Western European Metrology Club (WEMC). The membership was drawn from national standards laboratories throughout Europe and the WEMC met every year or two from its inception, at various venues around Europe.
Over ten years later, at the 1986 meeting of the WEMC, it was proposed that a more formal co-operation be developed with collaboration in measurement research, shared facilities and multinational traceability arrangements, providing a European network for multilateral intercomparisons of primary standards laboratories. This new co-operation was named EUROMET, European Collaboration in Measurement Standards. The WEMC was dissolved and the EUROMET Memorandum of Understanding was signed by 17 national metrology institutes and the European Commission.
Other regional groupings of national standards laboratories have also evolved, for example in the Nordic countries, in the Asia and Pacific region (17 member States), in Africa, in eastern Europe, in North and Central America and in Latin America. Although collaboration between these various regional groupings is not yet fully established, multilateral intercomparisons between primary laboratories are being organized increasingly on a regional basis within these co-operative arrangements.
The most important link for national standards laboratories may be through the International Committee on Weights and Measures (CIPM), which aims to establish a truly global network of primary standards comparisons.
3. ACCREDITATION
The second main function of the primary laboratories is to provide user access for traceability standards and this is increasingly achieved through a network of accredited secondary laboratories. Accreditation of laboratories for calibration or testing brings obvious benefits such as confidence in the measurements that are made, both by the laboratories and by their customers, improvements in measurements through effective quality assurance, and acceptance of the results by all those concerned in their application. Most countries which have their own primary standards laboratories have evolved national systems of measurement traceability through accreditation of secondary laboratories under the auspices of the standards laboratory.
However, the network of Secondary Standard Dosimetry Laboratories (SSDLs) for radiotherapy dosimetry, established by the International Atomic Energy Agency (IAEA) and the World Health Organization (WHO), allows the transfer of traceable radiotherapy dosimetry particularly to those countries which do not themselves have a primary standards laboratory. In this case a team of IAEA experts w ill visit, test and accredit the SSDL to ensure traceability of dose measurement. The IAEA then acts as the focus for intercomparisons of SSDLs.

608 ROBERTS
3 .1 . Accreditation in the United Kingdom
In the UK, the NPL operates the National Measurement Accreditation Service (NAM AS) as the UK accreditation body. NAM AS covers a wide variety of calibration and testing fields, only one of which is radiation calibrations. The aim of NAM AS is to provide a national, unified laboratory accreditation service to ensure the quality and standing of the UK calibration and testing laboratories. Such a comprehensive system should also eliminate the need for multiple assessments, particularly between countries, as long as confidence in the accreditation system and its application in the secondary laboratories is properly established in accordance with international standards.
NAMAS has now completed over 1400 accreditations of calibration and testing facilities covering the whole range of possible measurements in private and public sector laboratories. Accreditation follows assessment against criteria laid down in Guide 25 of the International Organization for Standardization (ISO) and the International Electrotechnical Commission (IEC) [1] (essentially the ISO 9000 [2] quality management standard, with additional requirements for testing laboratories). As well as disseminating good measurement practice to industry, NAMAS takes much of the calibration and testing workload away from the NPL. For example, in 1992, the NPL issued 3500 certificates, while NAMAS laboratories issued about 325 000 certificates.
NAMAS also has a worldwide reputation in laboratory accreditation, with countries from all parts of the world seeking advice and guidance on setting up and developing laboratory accreditation schemes. Consultancies on laboratory accreditation have been provided, for example, for Brazil, China, Hungary, Indonesia, Jordan, Malaysia, Mauritius, Poland, Saudi Arabia, Singapore and Tunisia.
Assessor training courses run by NAMAS also assist overseas accreditation bodies in operating their systems in accordance with internationally agreed criteria (ISO/IEC Guide 58 [3]). This forms a vital link in the chain for international recognition of calibration and testing reports issued by accredited laboratories.
3 .2 . Regional co-operation o f accreditation bodies
National accreditation bodies for calibration and testing laboratories have been in existence for a shorter period than standards laboratories but international collaboration has been developed in a similar way. The first regional grouping of accreditation authorities to be formed was WECC, the Western European Calibration Cooperation. WECC had its origins in the WEMC as a working group on calibration. Its aim is to reach an agreement on the equivalence of the operation of calibration services and the certificates issued by the accredited laboratories. It has played an important part in stimulating the establishment of national calibration services in western Europe and the development of bilateral and multilateral recognition agree

IAEA-SM-330/73 609
ments. The Memorandum of Understanding formally establishing WECC was signed in 1989 and ensures that each scheme is recognized by the other members, that measurement certificates are accepted without further assessment by other schemes and that the members w ill seek promotion of the agreement.
The WEGC mutual recognition agreement (MRA) which followed has now been signed by 11 countries, including Denmark, Finland, France, Germany, Italy, the Netherlands, Norway, Sweden, Switzerland and the UK.
A parallel grouping to WECC for accreditation of testing laboratories, the Western European Laboratory Accreditation Cooperation (WELAC), was also formed in 1989. WELAC embraces all countries that are members of the European Communities (EC) and the European Free Trade Association (EFTA) and a multilateral agreement for this co-operation, covering six specific members, Denmark, France, the Netherlands, Spain, Sweden and the UK, was signed in 1992.
The goals of both organizations are to ensure the quality and traceability of measurement and test results in trade and industry, as well as in other fields, such as health care and the environment. WECC and WELAC are harmonizing, coordinating and integrating their activities to strengthen the metrology chain.
Other regional groupings of national accreditation bodies seem likely to follow the precedent of WECC and WELAC, but in some cases accreditation issues are included in the scope of the co-operation between the national standards laboratories.
Following a conference in 1977 to discuss the role of accreditation in implementing the standards code of the General Agreement on Tariffs and Trade (GATT), the International Laboratory Accreditation Conference (ILAC) was formed and has met regularly ever since. Initially, there were only a handful of national accreditation bodies concerned, namely the National Association of Testing Authorities (NATA) in Australia, STP (replaced by the Dansk Akkreditering, DANAK) in Denmark, the Testing Laboratory Registration Council (TELARC) in New Zealand, the BNM in France and NAMAS (formerly the British Calibration Service, BCS) in the UK. Now there are over thirty national accreditation bodies involved and ILAC operates several task forces, mostly devoted to the international harmonization of accreditation procedures and mutual recognition agreements. Its recommendations are published as ISO/IEC Guides.
Mutual recognition agreements are based on the confidence that each accreditation body has in the operation of the others. This confidence is achieved by technical co-operation and openness demonstrated through a programme of evaluation and re-evaluation of each other’s organizations to satisfy themselves that their counterparts in other countries are interpreting and applying standards in a similar way in their assessments and accreditations.
Re-evaluation of current members of the WECC agreement group is carried out at four-yearly intervals by teams drawn from senior and other experienced permanent staff of national accreditation schemes, working to the Euronorms EN 45 002 and EN 45 003, to monitor standards of operation. The calibration

610 ROBERTS
laboratory accreditation services in Finland (the Finnish Calibration Service, FCS) and the Netherlands (the Netherlands Calibration Service, NKO) were visited by WECC teams during 1992. Continuing compliance with standards was confirmed in both cases. NAM AS was also evaluated recently and although initially there were some non-compliances these have been remedied. The main outcomes were for NAMAS to provide more information to laboratories and to make assessment reports more comprehensive.
WECC interlaboratory comparison programmes (measurement audits) are an important element in the monitoring of the performance of calibration laboratories accredited by WECC member bodies. Each programme is organized by one of the WECC members and carefully chosen artefacts are circulated for measurement to several selected accredited laboratories in each country.
3 .3 . Regional co-operation o f testing and calibration laboratories
A number of national, European and global collaborations have evolved to represent the interests of the individual calibration and testing laboratories. At the national level, the British Measurement and Testing Association (BMTA) acts as a forum to represent the interests of the UK testing and measurement industry. Formed in early 1990, the BMTA acts as a national focus for the industry’s input to European discussions.
At the European level, EUROLAB was formed in 1990 to facilitate technical co-operation between testing laboratories, to promote mutual acceptance of test results and to provide co-ordinated input to the European Organization for Testing and Certification (EOTC). The EOTC was formed in 1990 by the European Commission, EFTA and the European Committee for Standardization together with the European Committee for Electrotechnical Standardization (CEN/CENELEC) to act as a European focal point for all issues relating to conformity assessment, including testing and calibration (WECC has been formally designated as an Agreement Group within the EOTC).
Finally, at the global level, the International Union of Independent Laboratories (UILI) serves as an international network of independent laboratories and consultants, mostly in the testing field.
There is active collaboration between the calibration and testing organizations and the laboratory accreditors, for example between NAMAS and the BMTA, between WELAC/WECC and EUROLAB, and between ILAC and UILI.

IAEA-SM-330/73 611
4 .1 . Accreditation need
The need for accreditation of measurement stems from the general need for product assurance. In the specific case of radiological measurement it is clear that radiotherapy dosimetry needs to be universally assured and applicable. For any form of intercomparison of radiation doses, whether for diagnostic radiology or at the very low level of occupational exposure, unless calibrations and tests are traceable through an accreditation system, there can be little confidence in the measurements themselves.
The function of a calibration laboratory is different from that of a testing laboratory. Calibration establishes the relationship between values indicated by a measuring instrument and the corresponding known value of the measurand, whilst a test consists of the determination of one or more characteristics of a given product, process or service according to a specified procedure. In most cases calibrated instruments w ill be used in the process of testing, which may therefore be seen as one of the possible end uses of calibration.
On a legal front in Europe, each new Directive from the European Economic Community (EEC) requires Member States to notify the European Commission of bodies that are designated as competent to test or certify under the particular terms of the Directive. In the application of the 1980 Euratom Directive in the UK, for example, all radiological measuring instruments must undergo a formal test, and if necessary a recalibration, every year (although 14 months is allowed). However, at the moment, although such measurements must be traceable, there is no legal requirement for the testing and recalibration to be performed by an accredited laboratory. There is little doubt that the use of accredited laboratories w ill become the norm in due course as customers feel the need for such assurances. In any case accreditation provides legal credibility as to the measurement, for example in the event of a radiation overexposure.
4 .2 . Accreditation criteria/requirements
General requirements to demonstrate the technical competence of calibration or testing laboratories and general requirements for the accreditation of such laboratories have been published in ISO/IEC Guides, e.g. ISO/IEC Guide 25. They have also formed the basis for the EN 45 000 series of Euronorms relating to accreditation and calibration/testing which are the criteria that are used by the WECC and WELAC members to accredit laboratories. These guides are widely recognized and used by many countries as the basis for the accreditation criteria and regulations of laboratory accreditation schemes.
4. ACCREDITATION OF LABORATORIES IN THE UNITED KINGDOM

612 ROBERTS
NAMAS accreditation is only granted to a laboratory after a rigorous assessment against stringent criteria detailed in the NAMAS Accreditation Standard, M10 [4], and the NAMAS Regulations, M il [5]. The NAMAS Accreditation Standard is consistent with the provisions of ISO/IEC Guide 25 and EN 45 001. Compliance with the NAMAS Accreditation Standard also means that NAMAS accredited laboratories may be considered as meeting those requirements concerned with the adequacy of calibration or testing in the ISO 9000, EN 29 000 and BS 5750 [6 ] series of specifications relating to quality assurance.
To achieve an accredited status, laboratories have to demonstrate that they operate a quality system formally documented in a quality manual which complies with NAMAS requirements. Assessment visits are made by a team of independent trained technical assessors who perform a critical examination of all aspects of the laboratory operation. This examination includes administration and management procedures, staff, training, equipment calibration and servicing, measurement procedures, traceability of measurement, accommodation and environment, certificates and reports issued and records.
The NAMAS Audit Measurement Scheme makes independent audits of some 450 calibration laboratories but does not extend at the present to proficiency testing of NAMAS accredited testing laboratories. It functions by sending out equipment for calibration to laboratories and asking them, to provide NAMAS calibration certificates by using their normal procedures. The purpose of the audit is to check the consistency of measurements and in particular to check the quality system of the accredited laboratory. To this end, certificate layout and content, care of submitted equipment, accuracy of booking systems, adherence to customers’ requirements and agreed turn-round times are inspected in addition to measurement performance.
As well as routine audit measurements in support of NAMAS accreditation, laboratories may be required to participate in interlaboratory comparisons organized by WECC. The purpose of these exercises is to add to confidence in the activities of the national accreditation bodies in western Europe and beyond.
4.2 .1. O rganiza tion and audit
4.2.2. Resources (staff and equipment)
Laboratory accreditation based on EN 45 001 and ISO/IEC Guide 25 covers not only the quality system but also the in-depth verification of the technical ability of the laboratory to do the job. The latter includes training and qualifications of personnel, correctness of technical methods and operational procedures and their implementation, reliable estimates of uncertainties, suitability of equipment and control of environmental conditions.

IAEA-SM-330/73 613
4.2.3. Procedures/Protocols
As a typical accrediting body, NAMAS issues guidance material for laboratories to follow but it does not do this in isolation. The guidance is produced by working groups of appropriate experts from all sectors, for example the laboratories themselves, the customers, the manufacturers and the laboratories with a potential interest in their own accreditation. Over one hundred accredited laboratories across the whole spectrum of NAMAS calibration and testing fields are represented in the NAMAS Advisory Committee and working group structure. This structure enables the views of the experts to be taken into account in producing the specific protocols published by NAMAS. These appear in the form of NAMAS Information Sheets, for example NIS 0811, Calibration of Radiological Protection Level Instruments: X, Gamma and Beta Rays [7], and NIS 0825, The Expression of Uncertainty in Radiological Measurements [8 ].
These procedures must be followed and to become accredited the laboratories must have protocols in place demonstrating their application and good practice.
4.2.4. Traceability I Certificates
Control needs to be exercised over all gauges, instruments, sensors and special test equipment, together with jigs, fixtures and process instrumentation, that can affect the specified characteristics of the measurement process. One element of this control is the periodic calibration of the secondary standard dosimetry instruments to maintain traceability to the nationally recognized measurement standards.
Sometimes there w ill be one or more intermediate steps in the calibration chain. Typically the measuring instrument w ill be calibrated either by a calibration laboratory or in-house against a reference standard which in turn has been calibrated by a calibration laboratory. The reference standards of the calibration laboratory w ill have been calibrated periodically by another calibration laboratory of a better capability or at a national standards laboratory to maintain traceability.
The overriding concern of the accreditation body has to be for the validity of the calibration certificates and test reports.
4 .3 . Radiological measurements
SSDLs for occupational and diagnostic dosimetry need to be able to measure a range of air kerma rates from well specified radiation sources. The latter are usually from a selection of “ Co, 137Cs, 241Am and the ISO X ray spectral series. The range of rates requiring measurement is from less than 2 /¿Gy/h to about 4 Gy/h.
Accreditation for measurement of ambient dose equivalent is also needed in these fields, particularly as the calibration of legally regulated personal dosimetric
614 ROBERTS
systems in the UK relies on such measurement traceability. Of increasing importance is the calibration of thermoluminescent dosimeters in the field of diagnostic radiology dosimetry and of dose-area product meters. The Institute of Physical Sciences in Medicine (London) recently prepared a national protocol for these calibrations [9].
Another major requirement in diagnostic radiology is the measurement of peak kilovoltage from X ray tubes and it is likely that at least one UK laboratory w ill be accredited in the near future by NAMAS for the calibration of peak kilovoltage meters.
4 .4 . Accredited laboratories
In the UK, of the 1400 laboratories which are accredited by NAMAS only2 are accredited at the moment for radiation dosimetry calibration and there are 9 accredited radiological testing laboratories.
The first NAMAS dosimetry accreditation was achieved in October 1990 at the AEA Winfrith Technology Centre in Dorset. This was followed by the more recent accreditation of the Defence Radiological Standards Centre (DRASTAC) based at Aldermaston in Oxfordshire.
Other laboratories are preparing themselves for NAMAS accreditation and the National Radiological Protection Board (NRPB) at Chilton, the John Perry Laboratory at St George’s Hospital in London and the Regional Radiation Physics and Protection Service (RRPPS) in Birmingham are happy for this to be known. It should only be a matter of months before their inspections are complete and they receive their accreditation certifications.
5. CONCLUSION
The goal of accreditation of instrument calibration for diagnostic radiology dosimetry must be the authenticated and assured calibration accuracy of radiological measurements. National accreditation schemes, associated with international agreements and intercomparisons, w ill achieve this.
ACKN O W LEDG EM EN TS
The following organizations provided significant help in the preparation of information for this presentation and considerable thanks are due to them: AEA Winfrith (J. Simpson), the BIPM (A. Allisy), DRASTAC (R. Hedley), the John Perry Laboratory (M. Fitzgerald), NAMAS (I. Goodier), the NPL (J. Hunt), the NRPB (P. Burgess) and the RRPPS (D. Temperton).

IAEA-SM-330/73 615
R E F E R E N C E S
[1] IN T E R N A T IO N A L O R G A N IZ A TIO N F O R ST A N D A R D IZ A T IO N , IN T E R N A
T IO N A L E L E C T R O T E C H N IC A L C O M M ISSIO N , G eneral Requirem ents for Com
petence o f Calibration and Testing Laboratories, ISO/IEC Guide 2 5 , IS O , Geneva
(1990).
[2] IN T E R N A T IO N A L O R G A N IZ A TIO N F O R ST A N D A R D IZ A T IO N , Quality
M anagem ent and Quality A ssurance Standards, ISO 9 0 0 0 series, Geneva.[3] IN T E R N A T IO N A L O R G A N IZ A TIO N F O R ST A N D A R D IZ A T IO N , IN T E R N A
T IO N A L E L E C T R O T E C H N IC A L C O M M ISSIO N , Calibration and Testing Labora
tory A ccreditation System s — G eneral Requirem ents for Operation and R ecognition,
К О Л Е С Guide 5 8 , IS O , Geneva (1993).
[4] N A T IO N A L M E A SU R E M E N T A C C R E D IT A T IO N S E R V IC E , N A M A S A ccredita
tion Standard, M 1 0 , N A M A S, Teddington, U K (1989).
[5] N A TIO N A L M E A SU R E M E N T A C C R E D IT A T IO N S E R V IC E , N A M A S Regula
tions, M U , N A M A S, Teddington, U K (1989).
[6 ] B R IT IS H ST A N D A R D S IN ST IT U T IO N , Quality System s, B S 5 7 5 0 series, B S I,
London.
[7] N A TIO N A L M E A SU R E M E N T A C C R E D IT A T IO N S E R V IC E , Calibration o f Radio
logical Protection L evel Instrum ents: X , Gamm a and Beta R ays, N IS 0 8 1 1 , N A M A S, Teddington, U K (1989).
[8 ] N A T IO N A L M E A SU R E M E N T A C C R E D IT A T IO N S E R V IC E , T he Expression o f
Uncertainty in Radiological M easurem ents, N IS 0 8 2 5 , N A M A S, Teddington, U K
(1990).
[9] D O S IM E T R Y W O R K IN G P A R T Y , IN S T IT U T E O F P H Y S IC A L SC IE N C E S IN
M E D IC IN E , National Protocol for Patient D ose M easurements in D iagnostic Radiol
ogy, Natl Radiological Protection Board , Chilton, U K (1992).


IAEA-SM-330/44
DIAGNOSTIC DOSIMETERS: CALIBRATION AND REQUIREMENTS
H.M. KRAMERPhysikalisch-Technische Bundesanstalt,Braunschweig, Germany
Abstract
D IA G N O ST IC D O S IM E T E R S : C A L IB R A T IO N A N D R E Q U IR E M E N T S .
In the fram ew ork o f quality assurance program mes in diagnostic radiology, dosimeters play an important role as their perform ance affects the results which can be obtained with such
program m es. On the basis o f a European intercom parison program me in which some 170 instruments w ere exam ined and which helped to establish a working group o f the International
E lectrotechnical Com m ission (IE C ) dealing with diagnostic dosim eters, an outline is given o f
how and under what conditions they should be calibrated and the specifications they should
m eet. T he calibration o f dosim eters, including calibration with respect to mammographie radi
ation qualities, is described in term s o f the reference and standard test conditions which are
used in the Physikalisch-Technische Bundesanstalt and which are currently under considera
tion in the IE C working group. Consideration is given to the magnitude o f acceptable intrinsic
errors. T he specifications o f dosim eters are treated in term s o f the relevant influence quantities
and o f acceptable lim its o f variation o f the response due to these influence quantities. An
attempt is made to elaborate the critical physical or technical param eter through which a given
influence quantity may affect the result o f a dose or dose rate m easurement. On the basis o f
the requirements presented, an attempt is made to derive a realistic estimate o f the overall m ea
surement uncertainty for field instruments in com pliance with the requirem ents.
1. INTRODUCTION
With the advent of quality assurance programmes in diagnostic radiology in numerous countries all over the world quantitative dose measurements have become more important. The results of such measurements are usually assessed with respect to a nominal value for the quantity under inspection. Deviations of a measured value from its nominal value are acceptable as long as they are within certain agreed tolerance margins. Alternatively — depending on the nature of the quantity to be measured — there may be an upper or a lower lim it marking the transition from an acceptable to an unacceptable situation. In all cases meaningful results can only be obtained if the measuring instrument employed has uncertainties which are substantially smaller than the tolerance margins or the ‘sharpness’ of an upper or a lower limit.
Regardless of whether such measurements are carried out on a mandatory or on a voluntary basis, it is obvious that incorrect results give the impression either
617
618 KRAMER
that malfunctioning equipment is in order or that properly functioning equipment appears to be faulty. In the first case an avoidable radiation exposure to the patient or personnel remains undetected, while in the second case unnecessary, potentially costly repairs may be initiated.
The reliability of the results of dose measurements is usually secured by two separate but complementary concepts. The first, which is of an immediate character, consists of a calibration of the dosimeter in the quantity to be measured and under conditions similar to those of the intended usage. The second concept deals more with the long term stability and focuses on securing the fulfilment of certain requirements on the reliability of the instrument. Owing to the small electrical currents or charges associated with dose measurements, diagnostic dosimeters are delicate in nature and as such subject to a great number of influence quantities. An influence quantity has a bearing on the result of a measurement without being the objective of this measurement. For example, radiation quality, atmospheric conditions and electromagnetic interferences are some of the influence quantities in dosimetry. For a reliable dosimeter there must be some limits on the magnitude of the effect that such influence quantities may have. This may be expressed in the form of quantitative requirements on dosimeters. Proof of the fulfilment of requirements can be given in several ways: by a type test, a pattern approval which is a type test in the context of legal metrology, or in the framework of a quality assurance system of the manufacturer covering the design and the production of the instruments. The Directive for Medical Devices currently under preparation by the Commission of the European Communities intends either of the latter two concepts to be applicable to diagnostic dosimeters.
2. CALIBRATION OF DIAGNOSTIC DOSIMETERS
There are two different meanings associated with the word calibration. The first is that the indication of a dosimeter, whose reference point is positioned at the point of test, is compared with the conventional true value of the quantity to be measured. The calibration factor is the ratio of the conventional true value to the indication. The second meaning implies that it is verified that the indication of the instrument under test is ‘sufficiently’ close to the conventional true value of the quantity to be measured. While the second definition applies predominantly to radiation protection dosimeters, the first is more applicable to diagnostic dosimeters, which have substantially smaller margins of measurement uncertainty.
The quantity to be measured in diagnostic radiology is the air kerma in grays. Sometimes the measurand is also absorbed dose to air, which under electronic equilibrium is essentially equal in value to the air kerma. The conventional true value of the air kerma is ideally determined with a primary standard as maintained by most
IAEA-SM-330/44 619
of the national standards laboratories. As in the great majority of cases this is not practicable, usually a reference standard is employed which must be traceable to a primary standard. The result of a measurement with the reference standard is considered to be the conventional true value.
A calibration is performed under so-called reference conditions. In practice the adjustment of influence quantities to their reference values can only be made with a limited accuracy or is scarcely possible at all, as for example in the case of atmospheric pressure. So-called standard test conditions therefore describe the range of values that influence quantities may have during a calibration. At present neither internationally agreed reference conditions nor standard test conditions exist. However, under the title Dosimeters with Ionization Chambers as Used in Radiography, Including Mammography, and Fluoroscopy, work on laying down such conditions is under way in Working Group 3 (WG 3) of Sub-Committee 62C of the International Electrotechnical Commission (IEC). This working group also came into existence as a consequence of a European intercomparison of diagnostic dosimeters in 1990 [1-3]. In this exercise, which is described in greater detail in a separate contribution to this symposium [4], some 170 dosimeters in 19 European countries were examined. The results of this intercomparison formed a substantial input to the work of WG 3.
Table I gives an impression of how the reference and standard test conditions could look in the future standard. With the exception of the radiation quality for mammography, these conditions are currently applied by the Physikalisch- Technische Bundesanstalt (PTB) for the calibration of diagnostic dosimeters.
While the reference values of most of the influence quantities in Table I are very similar to those for other kinds of dosimeters such as radiotherapy or radiation protection instruments, significant differences are found for the radiation qualities. As neither of the radiations from the radionuclides 137Cs and ^Co often used for calibrations is acceptable for the energy range applicable to diagnostic radiology, radiation qualities for X ray diagnostics have been elaborated in Working Group 13 of Sub-Committee 62B of the IEC. The document entitled X-Ray Equipment Operating up to 400 kV; Radiation Conditions for Use in the Determination of Characteristics of Diagnostic X-Ray Equipment has currently reached the status of a Draft International Standard (DIS). It has not yet been published as such, but can be referred to as SC 62B (Sec) 144 [5].
Dosimeters intended to be used in mammography should be calibrated with X rays from a Mo anode tube with 30 /¿m Mo filtration and a phantom 45 mm in thickness with 10.5 mm polyethylene outside walls and 24 mm water in between. For calibrations this phantom should be positioned in the vicinity of the focus so as to reduce the effect of scattered radiation. At the PTB a 2 mm Al filter is used instead of the water-polyethylene phantom. For conventional diagnostic radiology there are two reference radiation qualities, both with 70 kV tube voltage, simulating the unattenuated beam and the radiation quality, without scattered radiation, behind a patient.

620 KRAMER
TABLE I. REFERENCE AND STANDARD TEST CONDITIONS FOR DIAGNOSTIC DOSIMETERS
Influence quantity Reference conditions Standard test conditions
Tem perature 2 0 °C
Relative humidity 60% 3 0 -7 5 %
A ir pressure 101 .3 kPa Atmospheric pressure
D ose rate A s at calibration R eference value ± 1 0 %
Radiation quality Mammography 2 8 k V , M o anode, filtration:
30 цт M o + 21 mm polyethylene
+ 24 mm H20
R eference value
Conventional diagnostic
unattenuated beam7 0 k V , W anode, filtration:
2 .5 mm AI
R eference value
Conventional diagnostic
attenatued beam
7 0 k V , W anode, filtration:
2 3 .5 mm AIR eference value
Angle o f incidence D irection stated by m anufacturer R eference value ± 5 °
Operating voltage Nominal voltage R eference value ± 1 %
External fields Z ero Insignificant
This division was introduced as these two kinds of measurements are usually performed with differently sized ionization chambers so as to take account of the large difference in dose rate. The partitioning allows the calibration to be matched more closely to practical use.
The maximum intrinsic error, i.e. the error under reference conditions, laid down in the working document of WG 3 is given in Table П. The presented figures include the uncertainty introduced by the lack of perfection of the primary standard, possible instabilities of the reference standard and the uncertainties of the transfer measurements.
3. REQUIREMENTS ON DIAGNOSTIC DOSIMETERS
The influence quantities almost inevitably relevant to diagnostic dosimeters are photon energy, direction of radiation incidence, dose rate for integrating dosimeters, ambient temperature, atmospheric pressure, humidity, supply voltage and electromagnetic interferences. In specific cases other influence quantities may also be applicable, such as resistivity with respect to mechanical shock or watertightness.

IAEA-SM-330/44 621
TABLE П. MAXIMUM INTRINSIC ERRORS FOR DOSE MEASUREMENTS IN DIAGNOSTIC RADIOLOGY
Quantity Range o f measurementIntrinsic error,
/ (% )
A ir kerm a, КMeasurements in attenuated beam
К > 1.0 ixGy 5
A ir kerm a rate, К 0.1 iiGy/s < К < 1.0 /íGy/s ( l / 9 ) ( 9 5 - 5 0 /Q a
К > 1.0 nGy/s 5
Measurements in unattenuated beam and in mammographyA ir kerm a, К 10 fiGy < К < 100 ¡iGy (1 /9 X 9 5 - 0 . 5 t f ) b
t f > 100 ¿iGy 5
A ir kerm a rate, К 10 ¿iGy/s < К < 100 /¿Gy/s ( l / 9 ) ( 9 5 - 0 .5 t f ) a
К > 100 /tGy/s 5
a К in piGy/s.
b К in nGy.
For each of these influence quantities a so-called rated range needs to be specified over which the response of the dosimeter varies only within given limits. During the test of a dosimeter usually only one influence quantity is varied, while all others are kept at their reference values. The magnitude of the rated range can be stated by the manufacturer of the instrument or there can be certain minimum rated ranges laid down in national or international standards.
Up to now standards or similar regulations describing minimum requirements exist only in a very few countries and no international standard is available. However, in the above mentioned WG 3 of IEC Sub-Committee 62C such requirements are being elaborated. In the following a brief account w ill be given of the status.
Table in presents an overview of the most important influence quantities. The radiation qualities are those from the document SC 62B (Sec) 144 [5]. From this document, the series RQR for the unattenuated and RQA for the attenuated beam have been selected for conventional diagnostic radiology. The radiation qualities for mammography have also been chosen from SC 62B (Sec) 144. The minimum rated range indicates the range of tube voltages and filtrations over which the response may not vary by more than ±5%, as shown in the last column of Table Ш. This requirement is to ensure that a dosimeter compatible with the standard can essentially be used in all beams encountered in X ray diagnostics.

622 KRAMER
слИ
HZ<¡эO 'щиZшо
W
CQ<н
я ^1 iJ fe
SО
•3со 3оН
v .
Iо>
<s13оН
v00Яо>ох>э
Н
з
<£а
Ш
>
ОГ-»
>моГ-*
I«п
>
огч
оV) О»П
>мого
о2на.
£f»пгч
о2
>
§Iсм
6cd4>х>
?евС4)
^ SR fcS со со со
СО
а>»X)
■8всо
g I
лв>»X)
ТЭ0)2со
о-о
-Н
32 *«
S о
>»х>
¿3со
UоОСМ
ЧОО
IО
ОГОI1П
§С СЛ я•5 Ё *
оÛ
сьО
4>Q<
5 i< Н
ОЧО
fcSm
(2cdX)
еРл
в~оЬосм><све
«ПГ-*Iосм
3£(4-13сСО£>>XI
*83со
>>•3£
c¿
аСи£о
ÜÛ03£о

IAEA-SM-330/44 623
The requirements on dose rate focus on two subjects, the saturation loss in the ionization chamber and the possible effect of clipping in the electrometer amplifier. The latter denotes the possibility that the electrometer in its current mode reaches its maximum output voltage. In a possible subsequent integration of this (cut-off) signal, this overload situation could remain unidentified, leading to a dose value which is too small. The specification of the upper and lower limits of the rated range for the dose rate is left to the manufacturer.
For diagnostic dosimeters the dependence of response on the direction of radiation incidence is not critical as this direction is usually known; the requirement made is to ensure that small misadjustments of the detector in the beam are irrelevant to the result of a measurement. However, there may be situations in which significant amounts of scattered radiation enter the chamber at angles substantially larger than 5°. When this is suspected, the variation of response with the direction of radiation incidence should be examined by the user. It should be added that measurements in fields with a mixture of scattered and direct radiation are delicate in nature, requiring special attention in the selection of a suitable detector.
For mains operated dosimeters the requirement on stability in response with changing supply voltage should usually be met over the entire range of voltages found, e.g. for 200-240 V for a nominal voltage of 230 V. For battery operated dosimeters the range of supply voltages which can be covered by a dosimeter is not important. As long as the ‘battery low’ indicator is not activated, regardless of the range over which this may be the case, the response of the dosimeter must be within ±3% of its value under reference conditions; i.e. the sensitivity of the ‘battery low’ circuit must be matched to the sensitivity of the electronics against varying supply voltages.
For unsealed ionization chambers the requirement for atmospheric pressure and its variation must be fulfilled after the indicated value has been corrected for the density of air. Apart from the exceptions when the atmospheric pressure at sea level is outside the range between 98 and 104 kPa, at sea level no correction for the density of air is necessary if a variation of response of ± 3 % is tolerated. The rated range covers substantially smaller air pressures as they occur with increasing altitude. An atmospheric pressure of 80 kPa corresponds to an altitude of 1675 m above sea level.
The combination of temperature and air humidity forms an exception amongst the influence quantities as they vary in a correlated way. This is because in practice these two quantities are often closely linked. There are certain climatic situations in which relatively high temperatures occur together with high humidity. The requirement takes account of this effect in choosing similar conditions for the test. However, there is the restriction that the absolute humidity should not exceed 2 0 g/m3, a value above which unsealed ionization chambers often suffer from excessive leakage currents.

624 KRAMER
The electromagnetic compatibility comprises a variety of requirements which are taken from IEC 801 [6 ]. These can be grouped into the following categories: exposure to electromagnetic radiation in the frequency range from 80 MHz to1 GHz, electrostatic discharge onto all accessible parts, including connectors and interfaces, and disturbance of mains supply. In each of these categories there are various severity levels and diagnostic dosimeters are treated under level 3. This implies RF fields with a field strength of 10 V/m, various bursts, short term interruptions and superimposed RF on the mains supply and discharges with 5 and 8 kV, depending on whether the part on which the discharge is inflicted is electrically nonconducting or conducting.
For an assessment of the uncertainty associated with a dose measurement the intrinsic error and the uncertainties due to the various influence quantities have to be taken into account. In the most simple estimate the root of the sum of the squares of all uncertainties and errors could be formed, leading to a resulting value of 11.3 %. In most practical cases this can be considered a rather conservative measure as the various influence quantities may result in deviations of opposite signs, leading to mutual cancellation. Dosimeters in line with the requirements described above can therefore be considered to have an uncertainty of usually not more than ± 1 0 % under field conditions.
R EF E R E N C E S
[1] K R A M E R , H .M ., European intercomparison o f diagnostic dosem eters: Calibration o f
the reference dosem eters, Radiat. Prot. D osim . 43 (1992) 7 5 -7 9 .
[2] JU R A N , R ., N O E L , A ., O L E R U D , H .M ., European intercomparison o f diagnostic
dosem eters: Perform ance o f the program me, Radiat. Prot. D osim . 4 3 (1992) 8 1 -8 6 .
[3] C L A R K , M .J . , D E L G A D O , A ., H JA R D E M A A L , O ., K R A M E R , H .M .,
Z O E T E L IE F , J . , European intercomparison o f diagnostic dosem eters: R esults, Radiat.
Prot. D osim . 43 (1992) 8 7 -9 1 .[4] SC H N U E R , K .E ., K R A M E R , H .M ., IA E A -SM -330/56, these Proceedings.
[5] IN T E R N A T IO N A L E L E C T R O T E C H N IC A L C O M M ISSIO N , X -R ay Equipment
Operating up to 4 0 0 k V ; Radiation Conditions for U se in the D eterm ination o f Charac
teristics o f D iagnostic X -R ay Equipment, SC 6 2 B (Sec) 144, IE C , Geneva (1991).[6 ] IN T E R N A T IO N A L E L E C T R O T E C H N IC A L C O M M ISSIO N , Electrom agnetic Com
patibility for Industrial-Process M easurement and Control Equipm ent, Part 1 : General
introduction (1 9 9 1 ); Part 2 : Electrostatic discharge (1 9 9 1 ); Part 3 : Radiated elec
trom agnetic field requirem ents, W orking Group Docum ent (1 9 9 3 ); Part 4 : E lectrical
fast transient burst requirem ents (1988); International Standard 8 0 1 , IE C , Geneva.

IAEA-SM-330/29
CALIBRATION OF AREA-KERMA METERS
J.P. LARSSON, C.A. CARLSSON, G. ALM CARLSSON Department of Radiation Physics,Faculty of Health Sciences,Linkôping University,Linkôping, Sweden
Abstract
C A L IB R A T IO N O F A R E A -K E R M A M E T E R S .Tw o large area, plane ionization cham bers (m onitors) w ere calibrated to measure the
integral o f air collision kerm a over an area, i^ Ciair dA. Because o f the field inhomogeneities
determinations o f iair dA w ere derived according to its definition using an X ray film
calibrated with 8 0 T L dosim eters. A sim plified calibration method is frequently used which
approxim ates JKc aiT dA with the product o f field area and kerm a in the centre o f the field.
Sim plified calibrations w ere perform ed for different field areas and distances from the focus.
Deviations between the two methods w ere found to vary with both field area and distance from
the focus. T he main reasons for the deviations are different anode filtrations (heel effect) and the influence o f o ff-focal radiation, which cause field inhom ogeneities in Kcsïil. T he influence
o f o ff-focal radiation varies with distance from the focus.
1. INTRODUCTION
Large area, plane ionization chambers (monitors) [1-4] placed on the casing of an X ray tube are intended to measure the energy imparted to the patient. The first step is to calibrate the monitor to measure the integral of air collision kerma over an area determined by the movable collimators and the extent of the off-focal radiation, i rc>air dA [2]. Neglecting the attenuation in air, ¡/Tc air dA (area-kerma) is independent of distance. The product of field area and kerma in the centre is independent of distance only if the extension of focus is negligible.
The second step in the calibration is to calculate energy fluence from kerma, that is to determine the radiant energy incident on the patient from the area- kerma [5]. This step is made by means of mass energy absorption coefficients for air and known X ray spectra. The third step is to determine the fraction of the incident energy which is imparted to the patient [5]. In this paper only the first step is treated, particular attention being given to the influence of anode angle and focal extension.
625

626 LARSSON et al.
FIG. 1. Experimental arrangement for calibration of the monitor to measure area-kerma.
2. MATERIALS AND METHODS
2 .1 . Calibration geometry
The calibration geometry is shown in Fig. 1. The area-kerma is determined in the plane (parallel to the monitor) with the calibrated ionization chamber. The ratio of area-kerma to the ionizing charge of the monitor is the calibration factor. The area-kerma must be determined under scatter free conditions, otherwise step 2 cannot be performed. An ionization chamber with a calibration traceable to international standards laboratories was used to determine K c air in the centre of the field.
2 .2 . Inhomogeneity o f radiation field
Outside the field centre K c¡ait was determined by means of isodensity curves on film (Fig. 2). The optical density was calibrated with 80 TL dosimeters. Dosimeters of both LiF and Li2B40 7 were used.
Because of the different anode filtrations of photons emitted in different directions from the anode, there are not only variations in the K c ail rate in the field (heel effect) but also variations in the spectral distribution of the photons.
Weighted averages of the quotient of the mass energy absorption coefficients, (Men/p ) LiF > were calculated using spectral distributions measured by Svahn [6 ] in different emission angles and were found to be consistent to within ± 1 %. Relative values of the TL signals could thus be used to represent relative air kerma values.
As the field in Fig. 2 is nearly homogeneous within the projection of the 1 0 cm2 collimator it seems reasonable to use a small collimator and to determine \Kc<air àA from the product of K c air in the centre and the field area A.

IAEA-SM-330/29 627
10
FIG. 2. Isodensity curves obtained with an extra collimator (Fig. 1) of area 100 cm2 (central value of relative density set to 100). Tube potential was 150 kV and anode angle 17.5°. In the figure, areas of smaller collimators are projected.
2 .3 . Scattered radiation from extra collimators
To measure scattered radiation from the extra collimators, the same set-up as in Fig. 1 was used but the ionization chamber was displaced to 1000 mm from the focus and used to correct for output variations. Measurements were performed with a monitor at different distances (ranging from 5 to 600 mm) from the extra collimators (sizes 5, 25 and 100 cm2).
3. RESULTS
3 .1 . Calibration of two different area-kerm a monitors
Two area-kerma monitors were calibrated to measure JATC air dA. One is the commercially available Diamentor [4], the other was described and used by Carlsson [3].
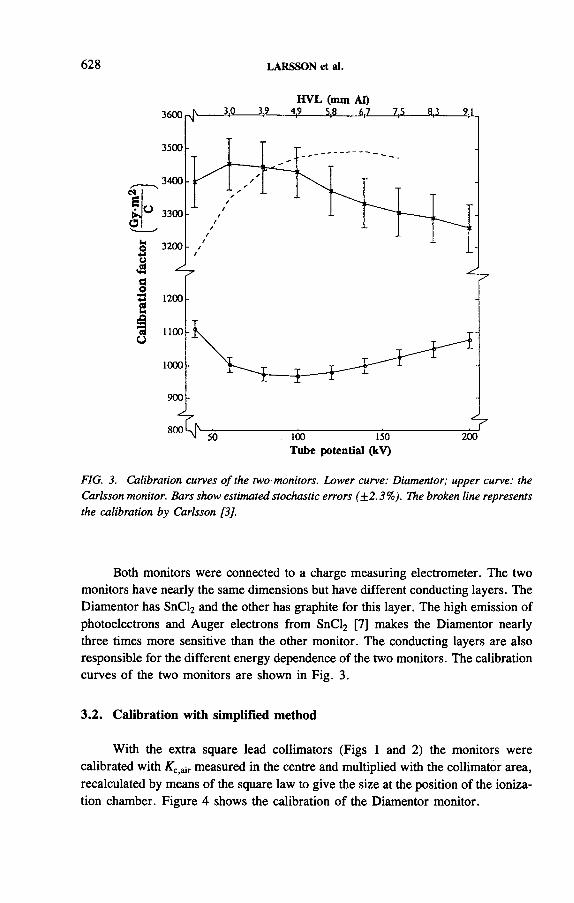
628 LARSSON et al.
HVL (mm AO
FIG. 3. Calibration curves o f the two monitors. Lower curve: Diamentor; upper curve: the Carlsson monitor. Bars show estimated stochastic errors (±2.3%). The broken line represents the calibration by Carlsson [3].
Both monitors were connected to a charge measuring electrometer. The two monitors have nearly the same dimensions but have different conducting layers. The Diamentor has SnCl2 and the other has graphite for this layer. The high emission of photoelectrons and Auger electrons from SnCl2 [7] makes the Diamentor nearly three times more sensitive than the other monitor. The conducting layers are also responsible for the different energy dependence of the two monitors. The calibration curves of the two monitors are shown in Fig. 3.
3 .2 . Calibration with simplified method
With the extra square lead collimators (Figs 1 and 2) the monitors were calibrated with ATc air measured in the centre and multiplied with the collimator area, recalculated by means of the square law to give the size at the position of the ionization chamber. Figure 4 shows the calibration of the Diamentor monitor.
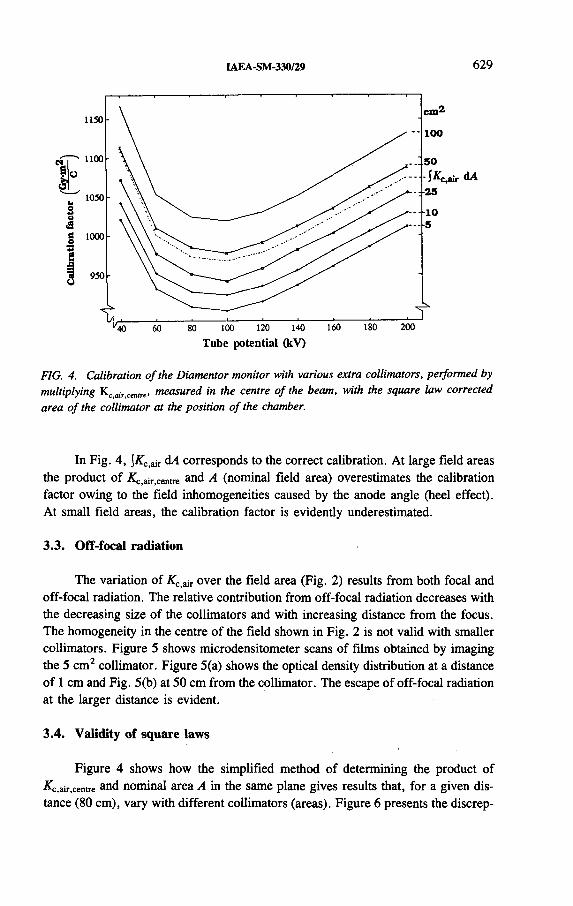
IAEA-SM-330/29 629
FIG. 4. Calibration of the Diamentor monitor with various extra collimators, performed by multiplying Kc ajr cemr€> measured in the centre of the beam, with the square law corrected area of the collimator at the position of the chamber.
In Fig. 4, \KC'W dA corresponds to the correct calibration. At large field areas the product of ATC air centre and A (nominal field area) overestimates the calibration factor owing to the field inhomogeneities caused by the anode angle (heel effect). At small field areas, the calibration factor is evidently underestimated.
3 .3 . Off-focal radiation
The variation of K C íáT over the field area (Fig. 2) results from both focal and off-focal radiation. The relative contribution from off-focal radiation decreases with the decreasing size of the collimators and with increasing distance from the focus. The homogeneity in the centre of the field shown in Fig. 2 is not valid with smaller collimators. Figure 5 shows microdensitometer scans of films obtained by imaging the 5 cm2 collimator. Figure 5(a) shows the optical density distribution at a distance of 1 cm and Fig. 5(b) at 50 cm from the collimator. The escape of off-focal radiation at the larger distance is evident.
3 .4 . Validity o f square laws
Figure 4 shows how the simplified method of determining the product of ^c,air,centre and nominal area A in the same plane gives results that, for a given distance (80 cm), vary with different collimators (areas). Figure 6 presents the discrep-

630 LARSSON et al.
FIG. 5. Microdensitometer scans across the field (perpendicular to the anode-cathode direction) at (a) 1 cm and (b) 50 cm from the extra collimator (5 cm2)
ancy between jK c ail dA and the air kerma /lATCiairiCentre for one collimator (25 cm2) and varying distances. The results are presented as
air,centre i^c,a ir
5*c,air ¿Л
as a function of focus-chamber distance. I f A and £c,air,centre followed the direct and inverse square laws, this expression should be independent of distance. The deviations can mainly be explained by the escape of off-focal radiation.
3 .5 . Scattered radiation from extra collimators
The influence of scattered radiation from the extra collimators to the monitors was measured and found to be negligible (<1%). However, at large distances(10-30 cm, depending on collimator size) from the extra collimator the monitorreading decreased because of the escape of off-focal radiation.
4. DISCUSSION AND CONCLUSIONS
There are some remaining problems, discussed below, in calibrating area- kerma meters to measure jATCiair dA.

IAEA-SM-330/29 631
w►»оaло ,2о.9Q
F o c u s -c h a m b e r d istan ce (cm )
FIG. 6. Discrepancy between ¡K ca„. dA and the area-kerma AKc air cenlre, calculated with a simplified method, using the blackened area on an X ray film to estimate the nominal field area A (25 cm2 at 30 cm from focus).
4 .1 . Problems using simplified method
(a) At large fields the simplified method neglects the low values of K c air caused by the heel effect (Fig. 2). This results in an overestimate of the calibration factor (Fig. 4).
(b) At small fields, escape of off-focal radiation results in an underestimate of the calibration factor (Fig. 4).
4 .2 . General problems
(a) A proper determination of ir àA gives the correct calibration independent of the distance from the focus to the plane in which K c>air is measured. It is, however, a delicate task to collect the contributions to area-kerma from all photons transmitted by the monitor. The off-focal radiation gives low values of K c air spread over a large area.
(b) Standards laboratories calibrate ionization chambers with narrow energy spectra. Wide spectra are used in diagnostic radiology. The large variation of the mass attenuation and mass energy absorption coefficients at energies below 30 keV makes measurement of ATc air difficult.

632 LARSSON et al.
(a) The fraction of the incident energy reaching the patient is, owing to the escape of off-focal radiation, smaller than hitherto reported [5, 8 ].
(b) An area-kerma meter need not be recalibrated if moved to another X ray tube. For further conversion of area-kerma to energy imparted to the patient, however, the X ray spectrum must be known.
(c) It is recommendable to use a charge measuring electrometer. By this means, calibrations performed in 1963 and 1993 could be compared (Fig. 3).
(d) It could be advantageous to calibrate area-kerma meters at authorized standards laboratories.
4.3. Observations and recommendations
R E F E R E N C E S
[1] R E IN SM A , K ., D osem eters for X -ray D iagnosis, Philips, Eindhoven (1962).
[2] C A R L SSO N , C ., D eterm ination o f integral absorbed dose from exposure m easure
m ents, A cta R adiol., T h e r ., P h y s., B io l. 1 (1963) 4 3 3 -4 5 8 .
[3] C A R L SSO N , C ., Integral absorbed doses in roentgen diagnostic procedures. I. The dosem eter, A cta R adiol., T h er ., P hys., B io l. 3 (1965) 3 1 0 -3 2 6 .
[4] P Y C H L A U , H ., P Y C H L A U , P . , “ E in D iagnostik-D osim eter — Grundform und
Abwandlung” , D eutscher Rôntgenkongress 1963 , Fortschr. Rôntgenstr. 100 Suppl.
(1964) 1 7 7 -1 8 0 .
[5] C A R L SSO N , C .A ., A L M C A R L SSO N , G ., “ Dosim etry in diagnostic radiology and
computerized tom ography” , The Dosim etry o f Ionizing Radiation, V ol. 3 (K A S E ,
K .R ., B JÀ R N G A R D , B .E . , A T T IX , F .H ., E ds), Academ ic Press, New Y o rk (1990) 1 6 3 -2 5 7 .
[6 ] SV A H N , G . , Diagnostic X -ray Spectra. A Study o f the E ffects o f High Tension Ripple,
Large X -ray Tube Currents, E xtra-focal Radiation and Anode Angulation with G e(Li)
Spectroscopy, PhD T hesis, U niv. o f Lund (1977).
[7] A L M C A R L SSO N , G ., Dosim etry at interfaces: Theoretical analysis and m easure
ments by means o f thermoluminescent L iF , A cta R adiol., Suppl. 332 (1973).
[8 ] SH R IM P T O N , P .C ., W A L L , B .F . , JO N E S , D .G ., F IS H E R , E .S . , T he measurement o f energy imparted to patients during diagnostic X -ray exam inations using the Diam en-
tor exp osu re-area product m eter, Phys. M ed. B io l. 2 9 (1984) 1 1 9 9 -1 2 0 8 .

IAEA-SM-ЗЗО/42
DOSE-AREA PRODUCT METER CALIBRATION AND USE
P. PYCHLAUPhysikalisch-Technische Werkstatten
Dr. Pychlau GmbH,Freiburg, Germany
A bstract
D O S E -A R E A P R O D U C T M E T E R C A L IB R A T IO N A N D U SE .D o se-area product meters have been in use since 1960 and are a useful tool for estim at
ing the radiation burden delivered to patients during diagnostic procedures. A dose-area
product m eter consists o f a large, flat, light transparent ionization cham ber and an electrom e
ter. T he cham ber is mounted at the opening o f the light beam diaphragm. It is calibrated for
all focal distances greater than that at which it is installed. Because the dose depends on the
inverse square law and the field size increases with the square o f the distance the product is
— neglecting air absorption — independent o f the focal distance. D o se-area product meters
should be constructed in such a way that they are able to measure the d ose-area product from
fluoroscopy and radiography. Requirem ents for d ose-area product m eters are laid down in
Publication 5 8 0 o f the International E lectrotechnical Com m ission.
Dose-area product meters have been in use for more than three decades. It is therefore no new instrument but its acceptance has mainly been restricted to Germany, where the greatest number are in use. About five years ago the situation started to change and an increasing interest in measuring the dose-area product (DAP) can be observed. The United Kingdom and the Scandinavian countries have regulations which support and propose the use of such meters but also in the United States of America interest is growing.
Why should DAP be measured? It was in the late 1950s that teaching hospitals in Germany articulated the requirement for an instrument which measures the total burden of ionizing radiation received by a patient during diagnostic procedures. From the beginning it was evident that measuring the entrance dose to the patient would only be reasonable in the case of radiographs where geometry and field size were known and could be used for calculations afterwards to find the energy absorbed.
However, the requirement was to have an instrument useful also for fluoroscopy . It soon became clear, therefore, that besides the entrance dose the field size is an important quantity which should be included in the measurement. Further,
633

634 PYCHLAÜ
it was required that the use of such an instrument should not handicap routine work and should not be restricted to scientific investigations only. In the early 1960s there were three different types of instrument in use. A ll three had in common a flat ionization chamber mounted at the radiation exit of the housing of the light beam diaphragm and an electrometer which was able to cope with the small dose rates from fluoroscopy and the pulses of electrical charge from radiographs. But the three differed in the quantity in which the measured value was indicated. From these three quantities — energy absorbed, volume dose and DAP — only DAP survived, for various reasons. One reason was pure pragmatism: checking of the correct calibration of a field instrument by a hospital physicist or technician can in the case of the DAP be done easily by exposing a film to obtain the field size and measuring the dose in the same place. Volume dose and energy absorbed could not so easily be checked.
Rather soon also a light transparent chamber was developed which could be fixed permanently without affecting the light beam diaphragm, as was the case with the first designs, in which the chamber had to be slid aside in order to use the diaphragm.
So, for about 25 years we have had a DAP meter with a light transparent chamber fixed to the housing of the light beam diaphragm which measures during fluoroscopy and radioscopy. This meter can be used routinely in all diagnostic procedures without being a handicap. The meter can further distinguish — for example in the case of scientific investigations — between the DAPs from fluoroscopy and from radioscopy and show these on different displays.
Which are the quantities influencing the DAP? Tube potential, tube current and filter thickness result in the dose rate, this multiplied with time gives the dose, and this multiplied with field size gives the DAP. Focal distance was not mentioned here because as the dose decreases with the inverse square law and the field size increases with the square of the distance, so the product remains constant. A ir absorption of the radiation is in this case neglected.
The calibration in a calibration laboratory, as also described in Publication 580 of the International Electrotechnical Commission (IEC) [1], w ill now be discussed. First, the homogeneity across the beam used for calibration must be checked. Secondly, the precise field size and dose at a given focal distance must be measured and the DAP calculated. At this focal distance a reference chamber must be placed. This must be a plane parallel chamber with a size at least equal to the field size of the beam at the above mentioned focal distance. This plane parallel chamber is then the reference chamber for the following procedure. The chamber under calibration is placed in the beam at any focal distance between the focus and the reference chamber. In this set-up a chamber of a DAP meter can be calibrated. This set-up differs in principle from that known for calibrating therapy dosimeters. There the chamber under calibration and the reference chamber are at the same focal distance and are irradiated equally. Here, in the calibration of a DAP meter, the reference is behind

IAEA-SM-330/42 635
the chamber under calibration, that is, at a greater focal distance. The DAP chamber is, therefore, calibrated for all focal distances greater than that at which it is installed. This is similar to the calibration of a monitor as used in linear accelerators in radiation therapy.
In addition to this first calibration step, IEC Publication 580 requires a check of the constancy of response over the area of the chamber. For this purpose different parts of the chamber are irradiated in turn and the results are compared. A chamber calibrated and checked in this way can then be used in the field at over-couch installations. The situation differs at under-couch installations. The difference is caused by the couch which, in the case of the under-couch installation, is between the chamber and the patient. The couch is then an absorber which influences the calibration made in the laboratory. Therefore, a recalibration must be made after the final installation by exposing a film to obtain the area and measure the dose in the same plane. We see here the advantage of the quantity DAP in practical use.
As stated at the beginning, the request for this type of meter came from teaching hospitals. The request is now repeated in different regulations that DAP meters should be installed at fluoroscopy facilities where radiologists are educated. For this purpose modern DAP meters have an RS 232 computer port and software for the computer which shows how the DAP increases over time during the diagnostic procedure. The gradient of the curve indicates a small or large field size, peaks indicate single radiographs in between and from the x axis one sees the time needed for the examination. This graph is an even better tool in education than just the final value of the DAP. Use of such a graph is not brand new but was proposed as early as 1983 [2].
Besides teaching, the DAP can also be used for comparing different techniques of diagnostic procedures. For example, when the fluorescent screen was replaced by the image intensifier and television chain, everyone expected a reduction of radiation and was surprised by the observed increase. The reason was soon found: the radiologists were so fascinated by the new, brilliant technique that they forgot about the time and examined longer than before. Today we have a similar situation in digital subtraction angiography. The picture in its digital form is manipulated by the firmware in such a way that the radiologist no longer sees whether too high a dose rate is used.
Finally, the DAP can also be used for quality assurance of X ray machines. After the installation of a DAP meter, a radiographer or radiological technical assistant w ill soon develop an awareness of whether the figure on the display is in the usual relation to a special diagnostic procedure. A missing filter, a wrong kilovoltage setting, etc., w ill cause unusual DAP values.
In summary, we have seen that a DAP meter is used today for teaching radiologists and comparing different diagnostic procedures and also as an aid in quality assurance.

636 PYCHLAU
R EFE R E N C E S
[1] IN T E R N A T IO N A L E L E C T R O T E C H N IC A L C O M M ISSIO N , A rea Exposure
Product M eter, Publication 5 8 0 , IE C , Geneva (1 9 7 7 ).
[2] D ose Reduction in D iagnostic Radiology (Proc. M tg London, 1983), Conference
Report Series N o. 4 2 , Hospital Physicists’ A ssoc., London (1984).

IAEA-SM-330/56
THE 1990 INTERNATIONAL INTERCOMPARISON PROGRAMME FOR DOSIMETERS USED IN DIAGNOSTIC RADIOLOGY
K.E. SCHNUERDirectorate-General for the Environment,
Nuclear Safety and Civil Protection,Commission of the European Communities,Luxembourg
H.M KRAMERPhysikalisch-Technische Bundesanstalt,Braunschweig, Germany
Abstract
T H E 1990 IN T E R N A T IO N A L IN T E R C O M P A R ISO N P R O G R A M M E F O R D O SI
M E T E R S U SE D IN D IA G N O ST IC R A D IO L O G Y .
T he paper describes the m easurements, evaluation and analysis o f the program me
funded by the Com m ission o f the European Communities for the intercomparison o f dosim eters used in diagnostic radiology. National co-ordinators from 19 European countries
provided dosim eters for calibration by the Physikalisch-Technische Bundesanstalt (P T B ) in
order to use the dosim eters as secondary standards. Approxim ately 170 different users o f diag
nostic X ray installations and mammography equipment carried out the measurements accord
ing to a protocol prepared by the P T B . T he aim o f this intercom parison was to obtain
inform ation on the accuracy o f the diagnosic dosim eters and the errors arising in the use o f these instruments for quality control and for constancy and acceptance test m easurements. The
results o f extensive analysis o f the measurements showed that certain types o f dosim eter
tended to perform w ell, particularly those with a linear energy response curve. The results o f the m easurements carried out on mammography equipment provided evidence that there
is a great scope for improvement in the accuracy. T he paper presents the protocol and some
typical results o f measurements by individual participants. Histograms are presented that show
the deviations from the correct values o f measurements for different energies, cham ber posi
tions and manufacturers.
1. INTRODUCTION
The Treaty of 1957 establishing the European Atomic Energy Community (Euratom) was an essential prerequisite for the development of a strong nuclear industry in Europe. Among other things the Treaty provides that the European Community (EC) shall lay down Basic Safety Standards for the protection of the health
637

638 SCHNUER and KRAMER
of workers and the general public against the dangers arising from ionizing radiation and ensure that they are applied [1 ].
The dimensions of this obligation are clear when we remember that the Basic Safety Standards are binding on all Member States and the Euratom Treaty obliges them to lay down appropriate national laws or regulations to ensure compliance with these standards, which can be considered to be at the centre of the European radiation protection policy, first issued in 1959. In 1976, in 1980 and most recently in 1984 the Basic Safety Standards were modified and revised to take into account the continuous scientific development in the field of radiation protection.
In addition to this major activity the EC fulfils its obligation under the Treaty to ensure that all organizations associated with radiation protection have access to the best technical facilities. Thus, the EC is involved in initiatives of the Commission of the European Communities (CEC) such as the publication of guidelines, the organization of scientific seminars, the financing of studies and the co-ordination of groups of experts, as well as co-operation in activities and programmes of other international organizations.
It was not possible for the CEC and its relevant services to ignore the fact that medical exposure to radiation is at present, apart from natural background radiation, by far the major source of exposure to ionizing radiation of the general public and therefore the EC was obliged to enact complementary provisions in order to take into account the rapid growth of the medical use of ionizing radiation in diagnosis and therapy. In 1984 the EC laid down a Council Directive for the protection of persons undergoing medical examination or treatment [2]. This ‘patient Directive’ closes a gap in the radiation protection field due to the fact that a person receiving medical exposures may exceed dose limits as laid down in the Basic Safety Standards for the general public.
Article 25 of the 1980 Directive on the Basic Safety Standards states that testing and examination of protective devices and measuring instruments in radiation protection shall comprise regular checking that measurement instruments are serviceable and correctly used. Article 25, together with Article 124 of the Euratom Treaty, forms the legal background for the performance of intercomparison programmes of radiation measurement equipment.
2. PERFORMANCE OF INTERCOMPARISON PROGRAMME
In 1990 the CEC supported and financed an intercomparison programme for dosimeters used in diagnostic radiology. The aim of this programme was to obtain information on the measurement errors of measurement chambers and dosimeters used for acceptance tests, constancy tests and quality control in diagnostic radiology. It was carried out through the Member States of the EC and in addition in all Member States of the European Free Trade Association and the former German Democratic

IAEA-SM-330/56 639
Republic. In each participating country a national institute was nominated to coordinate the activities within its area of responsibility.
On the basis of the experience gained from a restricted intercomparison programme performed during 1988 it was decided to perform this large exercise in the following way. Each national co-ordinator was requested to provide the reference dosimeter and measurement chambers to the Physikalisch-Technische Bundesanstalt (PTB) in Braunschweig, Germany, for calibration in order to use the dosimeter as a secondary standard. This was decided as a compromise between the desired assessment of the measurement results of a large number of dosimeters and the practicability of the programme.
The national co-ordinators conducted the measurements by using this secondary standard reference dosimeter for intercomparison with dosimeters used in the respective X ray departments. They either performed the measurements directly in the X ray departments or requested participants to bring their dosimeters into institutes. In some countries the national co-ordinators managed the intercomparison programme in close collaboration with their respective societies of medical physicists or health protection.
The national co-ordinators and participants were free in the selection of the type and manufacturer of the dosimeters and measurement chambers to be used as reference or measurement instruments. A total of 18 national co-ordinators intercom- pared 203 dosimeters with 162 participants [3].
3. CALIBRATION OF REFERENCE DOSIMETERS
The reference dosimeters of the 19 participating national centres were either shipped to the PTB or brought personally by the national co-ordinator and returned after being calibrated. It was necessary to respect a very tight time schedule in order to perform the bulky calibration work at the one primary standard facility.
The X ray energy used in diagnostic radiology covers a wide range, between 8 and 150 keV. The lower end, used for mammography, corresponds to tube voltages of 25-35 kV, with tube voltages of 50-150 kV providing the radiation quality for conventional radiology. Tables I and П show the four calibration series performed with each reference instrument and the respective ionization chambers.
The dosimetric quantity to be measured was air kerma, which has the advantage of being measurable and convertible into effective dose equivalents of standard patients. The parameters influencing the accuracy of dose measurement include radiation qualities, dose rates, air density and electromagnetic and static fields. The primary standard gives the exact and correct value of air kerma [4]:

640 SCHNUER and KRAMER
TABLE I. RADIATION QUALITIES USED IN THE INTERCOMPARISON: CONVENTIONAL RADIOLOGY(Filtrations are total filtrations, i.e. including inherent filtration; anode material, tungsten.)
Ux(kV )
Filtration (mm Al)
1st H V L
(mm Al)E
(keV)
Unattenuated beam, 50-150 kV, DV series50 2 .5 1 .8 3 2 .0
70 2 .5 2 .4 5 3 9 .2
90 2 .5 3 .1 0 4 6 .0
120/125 2 .5 4 .3 0 5 4 .3
140/150 2 .5 5 .4 0 6 4 .5
Beam behind filter, 50-150 kV, DH series50 12.5 3 .4 0 3 8 .8
70 2 3 .5 6 . 2 0 5 1 .8
90 3 2 .5 9 .0 0 6 2 .9
120/125 4 2 .5 11 .5 0 7 6 .3
140/150 5 0 .0 12 .9 0 9 2 .5
TABLE II. RADIATION QUALITIES USED IN THE INTERCOMPARISON: MAMMOGRAPHY(Filtrations are total filtrations, i.e. including inherent filtration; anode material: molybdenum.)
ut(kV)
Filtration(mm)
1st H V L
(mm Al)
E(keV)
Unattenuated beam, MV series25 0 .0 3 Al 0 .2 8 2 14 .2
30 0 .0 3 Al 0 .3 3 7 15 .0
35 0 .0 3 Al 0 .3 7 4 15 .6
Beam behind filter, MH series25 0 .0 3 M o + 2 .0 A1 0 .5 8 0 18.2
30 0 .0 3 M o + 2 .0 Al 0 .6 7 0 19.1
35 0 .0 3 M o + 2 .0 Al 0 .7 4 9 2 0 . 0
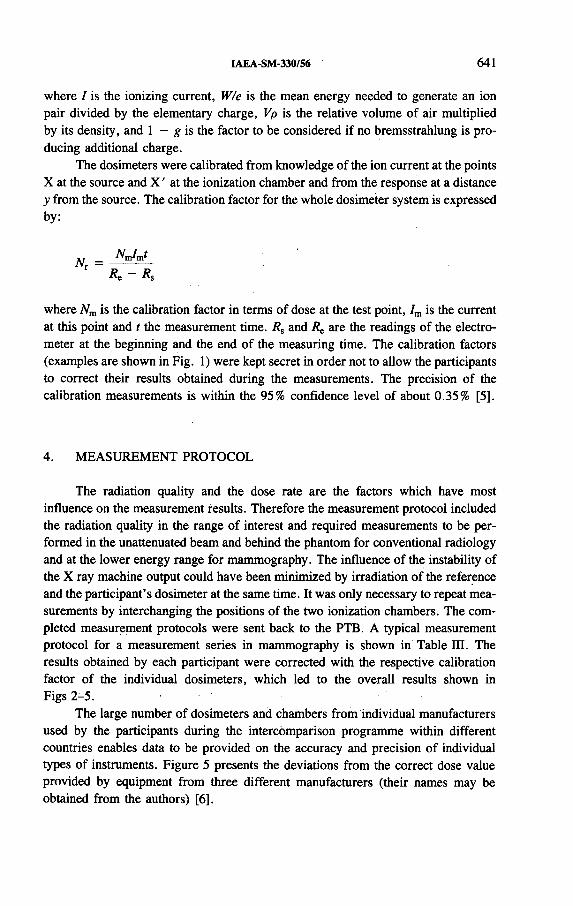
IAEA-SM-330/56 641
where I is the ionizing current, W/e is the mean energy needed to generate an ion pair divided by the elementary charge, Vp is the relative volume of air multiplied by its density, and 1 — g is the factor to be considered if no bremsstrahlung is producing additional charge.
The dosimeters were calibrated from knowledge of the ion current at the points X at the source and X ' at the ionization chamber and from the response at a distance y from the source. The calibration factor for the whole dosimeter system is expressed by:
N =
R e - R ,
where N m is the calibration factor in terms of dose at the test point, /m is the current at this point and t the measurement time. R s and R t are the readings of the electrometer at the beginning and the end of the measuring time. The calibration factors (examples are shown in Fig. 1) were kept secret in order not to allow the participants to correct their results obtained during the measurements. The precision of the calibration measurements is within the 95% confidence level of about 0.35% [5].
4. MEASUREMENT PROTOCOL
The radiation quality and the dose rate are the factors which have most influence on the measurement results. Therefore the measurement protocol included the radiation quality in the range of interest and required measurements to be performed in the unattenuated beam and behind the phantom for conventional radiology and at the lower energy range for mammography. The influence of the instability of the X ray machine output could have been minimized by irradiation of the reference and the participant’s dosimeter at the same time. It was only necessary to repeat measurements by interchanging the positions of the two ionization chambers. The completed measurement protocols were sent back to the PTB. A typical measurement protocol for a measurement series in mammography is shown in Table Ш. The results obtained by each participant were corrected with the respective calibration factor of the individual dosimeters, which led to the overall results shown in Figs 2-5.
The large number of dosimeters and chambers from individual manufacturers used by the participants during the intercomparison programme within different countries enables data to be provided on the accuracy and precision of individual types of instruments. Figure 5 presents the deviations from the correct dose value provided by equipment from three different manufacturers (their names may be obtained from the authors) [6 ].

Cal
ibra
tion
fact
or
642 SCHNUER and KRAMER
FIG. 1. Examples of calibration factors for (a) an ionization chamber, (b) a diagnostic dosimeter: a , о conventional diagnosis, in front of and behind the phantom; д , + mammography, in front of and behind the phantom.

IAEA-SM-330/56 643
TA BLE Ш. TYPICAL M EASUREM ENT PROTOCOL FOR A M EASUREMENT SERIES IN MAMMOGRAPHY
M easurements mammography, unattenuated beam
Date o f m easurement:
D etector N o .: Readout device N o.:
Atm . press.: hPa Tem p.: °C
Focu s-detector distance: cm ; M eas, range: full scale defl.
Calibration factor o f user’s dosim eter, value: Unit:
Tube charge: m A -s
Exp. tim e: ms
к»: кл:
+ 4(4) | Мг(5) | Мг(6 )M p ( l) М р(2 ) М р(3 ) М р(4 ) М р(5 ) М р(6)
Tube charge: m A -s
E xp . tim e: ms
к»: kd:
Anode
mat.ut
(kV )
Total
fdtr.
(mm)
No. Mp M r
1
2
M o 30 0 .0 33
M o 4
5
6
Anode
mat. (kV )
Total
filtr.(mm)
No. Mx
1
2
M o 25 0 .0 33
M o 4
5
6
M r( 1) + Л^(2) + M r(3)
M .( l ) Mp(2) M p(3)
Mr(4 ) Л ^ (6 )
Mp(4) Мр(5) Мр(6 )

644 SCHNUER and KRAMER
FIG. 2. Examples of measurement series by two different participants with (a) poor results, (b) excellent results for both mammography and conventional diagnosis. DV, DH: conventional diagnosis, in front of and behind the phantom; MV, MH: mammography, in front of and behind the phantom.

Frac
tion
(%)
Frac
tion
(%)
IAEA-SM-330/56 645
40 35 30 25 2 0
15 1 0
5 0-60 -40 -20 0 20 40 60
40 35 30 25 2 0
15 1 0
5 0-60 -40 -20 0 20 40 60
D evia tion (% )
FIG. 3. Histograms of results of all measurements on conventional diagnosis equipment (a) in front of and (b) behind the phantom.

646 SCHNUER and KRAMER
40 35 30
Co4 25С О
'о 20 Ш i_IL 15
1 0
5 0-60 -40 -20 0 20 40 60
D evia tion (% )
FIG. 4. Histogram of results of all measurements on mammography equipment.
5. CONCLUSION
A recent CEC study on radiation doses to patients from standard types of X ray diagnosis performed in 1989 through 150 medical X ray departments within the EC gave very unsatisfactory results in terms of the relation between image quality and dose to the patient [7].
Dose variations by a factor of 10 for the same type of X ray examination were the mean result. An extreme case revealed dose variations by a factor of 187 for skull examination in the paediatric group of patients. This result shows that regular dose measurements are an important factor in achieving constant and optimum image quality by exposing the patient to the lowest possible dose. In the whole chain of image generation the radiation dose at the film screen level is the essential parameter to control in order to achieve this aim. To measure this dose value with the highest possible precision and accuracy forms the basis for all other quality control criteria.
This extensive intercomparison programme showed that the accuracy of the majority of the 2150 measurements on conventional and mammography X ray sets was within a deviation of ±10%. However, the dosimeters made by different manufacturers showed widely differing results, so it is clear that there is room for improvement of dose measurements, particularly in mammography.

IAEA-SM-330/56 647
40
35
30
§25
f 2 0 £
15
10
5
0-60 -40 -20 0 20 40 60
40
35
30
1 25
■B 2 0О CO
* 15
10
5
0-60 -40 -20 0 20 40 60
40
35
30
£ 25с о■§ 2 02 u.
15
10
5
0-60 -40 -20 0 20 40 60
Deviation (%)
FIG. 5. Deviations from correct dose value provided by equipment from three different manufacturers.
Sample size 485, o=8.0% —
E (c) E_l —i— t— * I i I i l-
Sample size 342, 0=163%
E (b)
: ) I I L I x£L i I I I I
648 SCHNUER and KRAMER
Instruments with a flat energy response have clear advantages whereas other instruments require extensive correction factors in order to provide good results with various X ray qualities. Furthermore, the programme demonstrated that the use of dedicated equipment for the different X ray applications is of advantage in obtaining better results.
This international intercomparison programme for diagnostic dosimeters was a unique opportunity to compare methods and instruments and provided results traceable to a primary standard. The programme was completed by a seminar on dosimetry and diagnostic radiology which covered all aspects of the reduction of radiation doses in the medical sector. The intercomparison programme contributed largely to this seminar [8 ].
A C KN O W LED G EM EN T
The authors would like to thank the national co-ordinators, whose commitment and work helped to bring the intercomparison to a successful conclusion.
R E F E R E N C E S
[1] Council D irective o f 15 July 1980 amending the D irectives laying down the basic safety
standards for the health protection o f the general public and w orkers against the dangers o f ionising radiation, C E C , Luxem bourg.
[2] Council D irective o f 3 Septem ber 1984 laying down basic m easures for the radiation
protection o f persons undergoing m edical exam ination or treatment, C E C , Luxem bourg.
[3] JU R A N , R ., N O E L , A ., O L E R U D , H .M ., European intercomparison o f diagnostic
dosem eters: Perform ance o f the program me, Radiat. Prot. D osim . 43 (1992) 8 1 -8 6 .[4] R E IC H , H. (E d .), Dosim etrie ionisierender Strahlung, Teubner, Stuttgart (1990)
342 pp.
[5] K R A M E R , H .M ., European intercomparison o f diagnostic dosem eters: Calibration o f
the reference dosem eters, Radiat. Prot. D osim . 43 (1992) 7 5 -7 9 .
[6 ] C L A R K , M .J . , D E L G A D O , A ., H JA R D E M A A L , O ., K R A M E R , H .M ., Z O E T L IE F , J . , European intercomparison o f diagnostic dosem eters: R esults, Radiat. Prot. D osim . 43 (1992) 8 7 -9 1 .
[7] SC H N E ID E R , K ., et a l ., Results o f a dosimetry study in the European Community on
frequent X ray exam inations in infants, Radiat. Prot. D osim . 43 (1992) 3 1 -3 6 .[8 ] K R A M E R , H .M ., SC H N U E R , K . (Eds), Dosim etry in Diagnostic Radiology (Proc.
Sem . Luxem bourg, 1991), R ep. E U R 14180 E N , Radiat. Prot. D osim . 43 1 -4 (1 9 9 2 ).

IAEA-SM-330/11
RELATION BETWEEN DEGREE OF X RAY MONOCHROMATICITY AND DOSE DISTRIBUTION NON-UNIFORMITY OF IRRADIATION FIELD
S. SHIMIZU, K. MIN AMI Radiation Dosimetry Division,Japan Atomic Energy Research Institute,Tokai, Ibaraki,Japan
Abstract
R E L A T IO N B E T W E E N D E G R E E O F X R A Y M O N O C H R O M A T IC IT Y A N D D O SE
D IST R IB U T IO N N O N -U N IF O R M IT Y O F IR R A D IA T IO N F IE L D .
It is im possible to obtain radioisotopes having single photon energies as dose calibration
radiation sources necessary in calibrations up to 3 0 0 keV - T herefore, X ray generators are
used as calibration sources in this energy region for calibrating personal dosim eters and survey
m eters. X ray energy spectra are, how ever, generally continuous and the spectrum is thus
made m onochrom atic by filtration. T he degree o f m onochrom aticity is shown by the quality index (corresponding to a hom ogeneity coefficien t), and this is utilized in the calibration o f
measuring instruments. It was found that thé degree o f m onochrom aticity has a large influence
on the dose distribution uniform ity o f the irradiation field for calibration. T he reason was
clarified by a survey o f the angular distribution o f dose intensity and spectral analysis. On the
basis o f the results, it becam e possible to specify the extent o f an irradiation field that can be
used for calibration, thereby raising considerably the calibration accuracy for measuring
instruments.
1. INTRODUCTION
A test of radiation measuring instruments is generally made for dose linearity, the energy characteristic, directional dependence and reproducibility. Low energy y ray emitting nuclides used in the energy characteristic test include 241 Am (60 keV), 57Co (122 keV) and 51Cr (320 keV). However, it is difficult technically and economically to prepare y ray sources using such nuclides and obtain high dose rates because some nuclides have short half-lives. Therefore, in the calibration of instruments in the low or intermediate energy region (10-300 keV) an X ray generator is used instead of y ray sources.
In a test of radiation measuring instruments with an X ray generator, the generated X rays are filtered by a suitable metallic filter so that the continuous X ray spectrum is made monochromatic, thereby narrowing the spectral distribution. Before such a test, it is extremely important to examine and clarify the following: stability
649

650 SHIMIZU and MINAMI
of exposure rate, X ray quality, X ray spectrum, uniformity o f the irradiation field and the scattered X ray component.
In the present paper, causes of the relation between the degree of monochroma- ticity o f continuous X ray radiation and the non-uniformity of the dose distribution o f the irradiation field are described.
2. CONFIGURATION AND PERFORMANCE OF X RAY CALIBRATIONSY STEM USED IN EXPERIM ENT
The X ray calibration system (Pantax Limited, type HF-420C) consists o f the following: an X ray tube, a high voltage generator, a cooling device, an X ray beam shutter, a collimator, a shielding box, a filter insertion case, a control device and an interlock circuit. In order to make various performance tests o f radiation measur-
FIG. 1. X ray calibration system consisting of shutter, collimator and shielding box (dimensions in millimetres).

IAEA-SM-330/11 651
ing instruments with high accuracy, the X ray tube contained in the shielding box is further placed within a lead box of 2.5 cm wall thickness to shield for leaking X rays, as shown in Fig. 1. In front of the X ray tube are the shutter and collimator, and in front of the shutter is the filter insertion case. A laser beam centre marker is located just in front of the system.
The X ray calibration system thus has the following features. (1) With the shutter closed, the tube voltage and the tube current can be set. After X ray generation has been stabilized, the shutter is opened for X ray irradiation. (2) The filter can be easily changed. (3) The collimator can be easily replaced too. The collimator is of6 cm thick lead. By using different collimators, the beam spread angle can be varied to 7.5, 10, 15 and 30°.
The target of the X ray tube (AGF-Telefunken) is of tungsten and the window is of 7 mm thick beryllium. For the tube itself, metal ceramic is used. The stabilities in the voltage and the current to the X ray tube are both ±0.04%. The voltage applied to the tube is 10-400 kV, so that various types of X ray spectra, from soft to hard, can be obtained.
The shutter time is 1.9 s. The uncertainty in the exposure value caused by the shutter operation is up to 0.5% when the irradiation time is over 6 min. The shutter is of 3 cm thick lead.
When X rays are generated with a tube voltage of 400 kV and a tube current of 10 mA, the leaked dose rate, with the shutter closed, at a point 1 m away is0.15 mGy/h. The leak factor obtained by dividing this leaked dose rate by the dose rate with the shutter fully open is thus 2 x 10'4%.
FIG. 2. Points o f measurement o f dose distribution and geometrical relation between target o f X ray tube and irradiation field.

652 SHIMIZU and M I N A M I
V1
ЭП|ОЛ Э А ||0 |Э у
— О О
ЭП|0А ЭЛ1|0|Эу
--|8
- 8
FIG
. 3.
Dose
di
strib
utio
n of
irrad
iatio
n fie
ld alo
ng
the
horiz
onta
l ax
is an
d ve
rtica
l ax
is (a-
b and
c-d
in
Fig.
2).
(a)
No
addi
tiona
l fil
ter;
(b)
QI
=
0.5;
(c)
QI
= 0.
8.
Full
lines
: me
asur
ed
valu
es;
brok
en
lines
: ca
lcula
ted
valu
es.

IAEA-SM-330/11 653
3. MEASUREMENT OF DOSE DISTRIBUTION UNIFORMITY OFIRRADIATION FIELD
A radiation distribution measuring device which is able to move a detector freely in the horizontal and the vertical direction was prepared. An ionization chamber (Victoreen, type 550-4 with volume 33 cm3) was connected to this device. By remote handling the detector was shifted at 10 cm intervals in the horizontal and the vertical direction to measure the dose distribution of the irradiation field. Measurements were made at a position 1 m from the focus-of the X ray tube. The measuring points are shown in Fig. 2. The measurements were made for non-filtered X rays and for X rays with quality index (QI) values of 0.5 and 0.8. The beam spread angle was 30°.
The value of QI is obtained by dividing the effective X ray energy (£eff) by the maximum voltage applied to the X ray tube (£max); this is a common method in Japan. The value then corresponds approximately to the homogeneity coefficient. For example, in the wide spectrum series of ISO 4037 [1], homogeneity coefficients in the range 0.8-0.86 correspond to QIs of 0.62-0.7; in the narrow spectrum series, homogeneity coefficients of 0.88-0.97 correspond to QIs of 0.76-0.84 [2].
Results of the measurement of the uniformity of the irradiation field dose distribution are shown in Fig, 3. The upper curves show the dose distribution along the horizontal axis (a-b) of the irradiation field in Fig. 2, while the lower curves show the dose distribution along the vertical axis (c-d). All values are normalized to the dose value at the centre of the irradiation field. The horizontal axes show the distances along a-b and c-d as measured from the centre of the irradiation field, i.e. the centre of the X ray beam, and the irradiation angles of the collimators. For instance, it is shown that when a collimator of irradiation angle 7.5° is used, the radius of the irradiation field at a distance of 1 m is 13.2 cm. The broken line shows the dose distribution obtained by calculation when it is assumed that X rays are generated isotropically from the focus of the X ray tube.
In the case of “ no additional filter” (Fig. 3(a)) the dose varies greatly along the horizontal axis. The doses are lower on the ‘a’ side and higher on the ‘b’ side. Along the vertical axis, the dose scarcely varies.
In the case of an additional filter, i.e. QI = 0.5 (Fig. 3(b)), the dose distribution along the horizontal axis is in a semicircular form with the X ray beam centre as the apex. The curve indicates that in Fig. 3(a) the higher doses on the ‘b’ side are due to the low energy X ray component and decrease with the additional filter. Along the vertical axis, the doses on both the ‘c’ and ‘d’ sides are lower than those in Fig. 3(a). This indicates that the doses on both sides of the vertical axis due to the low energy X ray component decrease with the additional filter.
In the case of a further additional filter, i.e. QI = 0.8 (Fig. 3(c)), the dose distribution along the horizontal axis varies greatly. Compared with Fig. 3(a), the dose distribution is reversed: the X ray dose values become higher on the ‘a’ side and

654 SHIMIZU and MI.NAMI
lower on the ‘b’ side. This is explained as follows. The doses on the ‘a’ side are due to higher energy components as compared with those on the ‘b’ side; then the attenuation rate caused by the additional filter on the ‘a’ side was less than that on the ‘b’ side. (In contrast, the doses on the ‘b’ side due to low energy X ray components decrease still further with the additional filter.) Along the vertical axis, the doses on both the ‘c’ and ‘d’ sides are reduced still further from those in Fig. 3(b) by the additional filter.
4. X RAY SPECTRUM MEASUREMENT IN IRRADIATION FIELD
For the purpose of analysing in detail the cause of the great change in dose on the ‘a’ and ‘b’ sides of the horizontal axis resulting from the additional filter, spectra were measured on both sides of the horizontal axis with the X ray beam centre axis as 0° by means of a Ge detector [3].
As shown in Fig. 4, X ray spectra were measured at a position 4 m from the X ray tube with the Ge detector set in a shielding box having a spectrum measurement collimator. In this case, the X ray tube current is set at the minimum value for stabilized X ray generation. The collimator of 1 or 5 mm opening diameter is easily replaced. In the case of X ray tube voltages up to 150 kV, without an additional filter, spectrum measurements were made with the 1 mm collimator. Other spectrum measurements were made with the 5 mm collimator.
FIG. 4. X ray spectrum measurement system.

IAEA-SM-330/11 655
5ф
>*О)w<DС
LU
Ф
ФСш
<0
( . 01.) siunoo rG.
5. X
ray
spec
tra
meas
ured
(a)
on
the
'a ’ (
targ
et)
side
and
(b)
on the
‘b
’ (ca
thod
e) s
ide
of the
ho
rizo
ntal
axis
in
the
irrad
iatio
n fie
ld m
easu
red
> a Ge
de
tect
or
with
out
an ad
ditio
nal
filte
r.

656 SHIMIZU and M I N A M I
X ray spectra measured with an X ray tube voltage of 60 kV, without an additional filter, are shown in Fig. 5. In the figure, a small peak at 8.39 keV is the L characteristic X ray of the tungsten target. Figure 5(a) shows a spectrum at the X ray central axis (0°) and spectra measured after shifting the Ge detector in the ‘a’ direction to 5, 10 and 13°. Compared with the spectrum at position 0°, the spectrum at position 13° has moved to a higher energy region. Figure 5(b) shows X ray spectra after shifting the Ge detector in the ‘b’ direction to 5, 10 and 13°. Compared with the spectrum at position 0°, the spectrum at position 13° has moved to a lower energy region.
From the spectrum measurement results presented above, the following explanation can be given. Generally, on the ‘a’ side of the horizontal axis continuous high energy X rays predominate and on the ‘b’ side continuous low energy X rays predominate. Accordingly, when the continuous X rays are made monochromatic by an additional filter, the dose distribution of the irradiation field varies with the degree of monochromaticity as shown in Fig. 3.
5. CONCLUSION
When an X ray generator is used in the calibration of measuring instruments, the degree of monochromaticity of the X rays is closely related to the dose distribution non-uniformity of the irradiation field. Caution is thus necessary in this respect.
Generally speaking, calibration should be made in a small irradiation field by narrowing the X ray beam sufficiently. However, in the case of personal dosimeters, for instance, several dosimeters have to be irradiated at the same time to raise the calibration efficiency when a reproducibility test or energy characteristic test is to be made. To have a wide irradiation field, a beam collimator of large irradiation angle is thus used. In this case, unless the dose distribution in the irradiation field where the personal dosimeters are set is uniform, there will be some variation in the individual calibration values of the dosimeters. However, this variation in calibration constants of personal dosimeters when many are calibrated using an X ray generator is complicated and difficult to elucidate, so that improving calibration accuracy is not easy.
In the present study, the following was found. The doses in the irradiation field vary with applied X ray voltage and quality index and also significantly along the horizontal (a-b) axis. In contrast, the doses do not vary so much along the vertical (c-d) axis. Conventionally, for the purpose of efficient panoramic irradiation, personal dosimeters are arrayed on the straight horizontal a-b line extending for ±20 cm at a position 2-3 m from the X ray tube, as shown in Fig. 6. The uncertainty of the dose distribution of the irradiation field with different irradiation conditions is ±15% maximum.

IAEA-SM-330/11 657
Vertical New configuration ofaxis personal dosimeters
FIG. 6. Configuration o f personal dosimeters for calibration in irradiation field.
On the basis of the results of the present study, dosimeters should be calibrated in an elliptical field with the vertical axis extending ±20 cm and the horizontal axis extending ± 10 cm at a position 3 m or more away from the X ray tube target, as shown in Fig. 6. The dose distribution uncertainty of the irradiation field is thus up to ±2% , so that the calibration accuracy of the dosimeters is remarkably improved.
REFERENCES
[1] INTERNATIONAL ORGANIZATION FOR STANDARDIZATION, X and Gamma Reference Radiations for Calibrating Dosemeters and Dose Ratemeters and for Determining their Response as a Function of Photon Energy, ISO 4037, Geneva (1979).
[2] YAMAGUCHI, Y ., MIHARA, A., CHIDA, T ., MIN AMI, K., Measurement of Specifications of X-ray Quality for Calibration, Rep. JAERI-M 84-232, Japan Atomic Energy Research Inst., Tokyo (1984).
[3] SEELENTAG, W .W ., PANZER, W ., DREXLER, G., PLATZ, L ., SANTNER, F ., A Catalogue of Spectra Used for the Calibration of Dosemeters, GSF-Ber. S 560, Gesellschaft fiir Strahlen- und Umweltforschung mbH München (1979).


IAEA-SM-330/43
P E R F O R M A N C E E V A L U A T I O N O F
5 0 0 m A X R A Y U N I T S I N S E L E C T E D
D E P A R T M E N T O F H E A L T H H O S P I T A L S
I N T H E P H I L I P P I N E S
A.M. LOBRIGUITO, T.U. BATTAD, D.J. MOPERA Radiation Health Service,Department of Health,Manila, Philippines
Abstract
PERFORMANCE EVALUATION OF 500 mA X RAY UNITS IN SELECTED DEPARTMENT OF HEALTH HOSPITALS IN THE PHILIPPINES.
New diagnostic X ray units that are installed in Department of Health hospitals in the Philippines have to be acceptance tested prior to clinical use. Performance testing is required by the Department of Health to be undertaken by the Radiation Health Service and only those units that comply with the performance standards are approved for use. The performance testing includes physics tests for the following: X ray and light field congruence, beam perpendicularity, focal spot size, kilovoltage, timer, output reproducibility and linearity, beam quality, grid alignment and exposure rate. Quality control test tools are used in these tests, and for accurate measurement of the output and exposure rate a Pitman dosimeter (model 37D) with a 35 cm3 ionization chamber is used. Aluminium sheets of various thicknesses are used for the test of the half-value layer for beam quality. A check for leakage radiation is done with the collimator shutters closed and using the highest radiographic factors (peak kilovoltage, current and time). A survey meter is used to take readings of exposure rate at 1 m from the anode, cathode, tube front and tube back. The paper evaluates the results of these tests done on 16 Shimadzu ED 150 X ray units donated to selected hospitals. Performance standards of the Radiation Health Service were the basis for judging the acceptability of these units. The result of each test was rated as acceptable or not acceptable. Corrective actions have been recommended to the supplier for those units that did not conform with the performance standards. Problems contributing to non-compliance with the standards have been analysed and solutions recommended. Image quality was studied for units with a satisfactory power supply. This was done by evaluating the contrast on the radiograph of a bone tissue phantom. The optical density of the film was plotted against bone thickness and the output determined.
1. INTRODUCTION
The Radiation Health Service (RHS) of the Department of Health (DOH) in the Philippines is the national regulatory agency charged with protecting the public from the hazards of electrically produced ionizing and non-ionizing radiation. This agency also renders medical physics services to both private and Government
659

660 LOBRI G UI TO et al.
hospitals. In this capacity, 15 medical physicists of the RHS undertake acceptance testing of newly installed medical imaging units. In June 1992,' the DOH issued a circular to DOH hospitals that all newly acquired diagnostic X ray units and accessories must be acceptance tested by the RHS prior to their clinical use to ensure that these units comply with the performance standards of the RHS.
The Philippines imports all new diagnostic X ray units and X ray tubes from different countries. The units are assembled on site and the engineers of the suppliers perform the calibration. Since there is no agency that conducts acceptance testing of new diagnostic X ray units except the RHS, not all units installed have been acceptance tested prior to clinical use.
The DOH, through the Japan International Cooperation Agency, acquired 16 500-mA Shimadzu X ray units with radiographic and conventional fluoroscopic modes. Acceptance testing, by means of physics tests, was performed on these units after installation. Results o f the physics tests were compared with the performance standards. This paper describes the work to determine whether these units conformed with the set standards. In addition, the image quality of radiographs produced by selected X ray units having different outputs is analysed.
2. METHOD
Since the fluoroscopic mode is a conventional type, only selected physics tests were performed in this mode (kilovoltage check, focal spot size check and exposure rate measurement). The acceptability or non-acceptability of the result was based on the performance standards (Table I). A leakage radiation measurement was also conducted and an analysis o f the image quality was made using a bone tissue phantom.
2.1. Physics tests
The physics tests (Table I), except for the leakage radiation and exposure rate measurements, were performed with test tools supplied by Radiation Measurement Inc. (United States of America). Every test had its own performance standard set by the RHS.
2.1.1. Collimator check
The collimator check uses a collimator test tool and an 8 in 1 x 10 in film in a cassette. In this test, the congruence of the X ray field with the light field and
1 1 in = 25.4 mm.

TABLE I. PERFORMANCE STANDARDS FOR THE DIFFERENT PHYSICS TESTS
IAEA-SM-330/43 661
Test Perform ance standard
Kilovoltage check 5 kVp difference
T im er check 1 0 % o f actual time
Focal spot size check 0 .5 o f specified focal spot size
C ollim ator check
— X ray and light field congruence 2 % o f source to im age receptor distance
— Beam perpendicularity 1 .5 ° with the perpendicular
Output reproducibility check C oefficient o f variation < 0 .0 5
Output linearity check C oefficient o f linearity < 0 . 1
Beam quality measurement X^Xf < 2 . 0
Leakage radiation measurement Exposure at 1 m < 2 5 .8 /xC/kg
Grid alignment check Centre hole optical density must be the highest
Exposure rate measurement A ir kerm a rate < 5 R/min
the beam perpendicularity are determined. The acceptable limit is 2% of the source to image receptor distance (SID) o f 100 cm for the X ray and light field congruence. The beam perpendicularity should not exceed 1.5° from the vertical. The misalignment o f the X ray and light fields is measured from four sides of the field.
2.1.2. Kilovoltage check
A digital peak kilovoltage meter is used to check whether the obtained kilovoltage is the same as that which is set on the control. The test checks the 60, 70, 80, 90 and 100 kVp settings at various current and time settings. The tolerance limit is a 5 kVp difference between the actual and measured values. In this test, there is no specified SID. The distance or the current-time product may be varied if the kilovoltage meter does not display any reading.
2.1.3. Timer check
The timer check is performed using a digital timer test tool. The kilovoltage is set at 70 kVp with SID set at 100 cm. This test may be performed by determining

662 LOBRI GU IT O et al.
the number of pulses or the time in seconds. Time settings of 0.05, 0.10, 0.20 and0.50 s are used. The corresponding numbers of pulses for these time settings are6, 12, 24 and 60 pulses. The acceptable limit is ±10% of the time set.
2.1.4. Focal spot size check
A focal spot test tool is used to check whether the focal spot size of the X ray tube is as specified. This test tool consists of 12 bar pattern groups of different sizes. Each group consists of six slots, with three horizontal and three perpendicular.
The X ray tube has two focal spot sizes: the small focal spot is for 100 mA and below and the large focal spot is for 200 mA and above. The test is performed using a non-screen film and a 61 cm focus to film distance. The current is set at 100 mA for the small focal spot and 200 mA for the large focal spot, with time settings of 0.05 and 0.025 s respectively. The size of the focal spot is determined by looking at the pattern group which can be resolved in both the horizontal and vertical slots. The small focal spot size is 1 mm x 1 mm and the large focal spot size is 2 mm x 2 mm. The tolerance limit is 0.5/, w h e re /is the indicated focal spot size.
2.1.5. Output reproducibility check
The output reproducibility check is done using a Pitman model 37D exposure meter with a 35 cm 3 ionization chamber. The output is measured using an 80 cm SID at 60, 80 and 100 kVp settings and 40 mA • s with current and time settings varying. The output (mR)2 is measured for every setting. The coefficient of variation is calculated using the formula:
CV = [ЭД- - X ) 2/(N - 1 )}m IX
where X¡ is the output for trial i, X the average output and N the number of trials. The coefficient o f variation must not exceed 0.05.
2.1.6. Output linearity check
The output linearity check determines whether the output (m R-m A"1 -s-1) remains constant when the kilovoltage and distance are maintained constant. This check uses the Pitman exposure meter set at 80 kVp and placed at 100 cm SID. The current and time settings are varied but their product should be 40 mA • s. The current settings used are 50, 100, 200 and 400 mA. The exposure for each current-time combination is recorded.
2 1 R = 2.58 x 10" C/kgj

IAEA-SM-330/43 663
The coefficient o f linearity is calculated using the equation:
coefficient o f linearity C max ^minVC^max - inin)
This coefficient must not exceed 0.1.
2.1.7. Beam quality (HVL) measurement
The test for beam quality is performed using the same Pitman exposure meter and ionization chamber placed at 100 cm SID. The kilovoltage settings are 60, 90 and 120 kVp, for which aluminium filters o f 1.3, 2.6 and 3.2 mm thickness, respectively, are used. The output (mR) is measured with and without the filter. The beam quality is determined by dividing the average output reading without the filter (X¿) by the average output reading with the filter (Xf): XrfXf must not exceed 2.0.
2.1.8. Grid alignment check
A grid alignment test tool is used for the grid alignment check. The settings are 60 kVp and 3 mA • s, with an SID of 100 cm. An 8 in X 10 in film in a cassette is used with a movable grid. This test is performed for both the stationary and the moving grid o f the X ray unit.
2.1.9. Fluoroscopic exposure rate measurement
The tabletop air kerma rate is measured using the fluoroscopic mode. This test uses the Pitman exposure meter with the same ionization chamber placed on the tabletop. Settings o f 70 kVp and 1.0 mA are used, together with the lowest exposure time. The air kerma rate should not exceed 5 R/min.
2 .2 . Leakage rad iation m easurem ent
Leakage radiation is measured using a Keithley survey meter. Readings are taken with the collimator shutters closed and using the highest radiographic factors. For this particular test, settings of 70 kVp and 40 m A -s were used. Measurement o f the leakage radiation is done on the cathode side, anode side, tube front and tube back at 1 m from the X ray tube. The exposure must not exceed 25.8 /¿C/kg.
2 .3 . Im age quality
In diagnostic X ray imaging, the image quality is demonstrated by means of the contrast. The contrast reflects the relationship between the optical densities of

664 LO BRIGUITO et al.
FIG. 1. Experimental arrangement showing the bone tissue phantom, movable grid, film in screen and exposure monitoring device.
FIG. 2. Optical density as a junction o f bone thickness.

IAEA-SM-330/43 665
the film on specific body parts. Radiographic contrast is influenced by subject contrast and film contrast [1]. The subject contrast is due to the attenuation of radiation through the thickness of the subject irradiated, while the film contrast is due to the film characteristic, which is demonstrated by the characteristic curve.
Film contrast measurements are taken from the useful range of a radiographic film, which is between optical densities of 0.4 and 2.2 on the characteristic curve. Since the attenuation of the X ray beam is exponential, the logarithmic film response will give a linear relationship between optical density and thickness of the medium [2].
Subject contrast, and so radiographic contrast, are affected by the quality of radiation. The higher the kilovoltage the greater the penetrating ability of the radiation. A high kilovoltage affects the absorption characteristics o f the medium and therefore produces additional optical density.
The quality o f the image produced by the diagnostic X ray units tested is analysed by investigating the radiographic contrast o f the bone tissue phantom. This phantom consists o f a bone immersed in water in a Perspex container with dimensions of 30 cm X 30 cm x 30 cm, as shown in Fig. 1. The depth of the water can be varied to simulate different patient thicknesses. Prior to measurement, the phantom is irradiated using various radiographic factors to determine which factors result in a visible radiograph.
The optical density obtained is plotted against the bone thickness at certain kilovoltage settings (Fig. 2). The output o f the machine (mR-mA-1-s"1) is also noted.
3. RESULTS AND DISCUSSION
Comparing the results o f the physics tests with the performance standards (Table П), it was found that all o f the units tested complied with the specified limits for focal spot size and leakage radiation. O f the 16 units tested, 15 units (94%) were acceptable in terms of kilovoltage, timer, X ray and light field congruence and beam perpendicularity. Recalibration of the 60 kVp setting was recommended for one unit. Timer setting recalibration has been recommended for another X ray unit. For one unit it has been recommended that the position o f the collimator bulb be adjusted to correct the misalignment of the light field with the X ray field.
The tests o f output reproducibility, output linearity and beam quality were performed on 14 units only, owing to the malfunctioning of the exposure meter. All of these units proved acceptable in terms of output reproducibility and beam quality, i.e. the output was shown to be consistent at a particular setting of current and time. The results also show that the additional filter provided for all the machines is adequate. For the output linearity check, two units gave unacceptable results, i.e. there was no consistency of radiation output at different current settings. For these two

666 LO BRIGUITO et al.
TABLE П. RESULTS OF ACCEPTANCE TESTING PERFORMED ON SHIMADZU ED 150 X RAY UNITS
TestNumber o f units
acceptablePercentage
Radiography
K ilovoltage check 15 9 4
T im er check 15 94
F ocal spot size check 16 1 0 0
X ray and light field congruence 15 94
Beam perpendicularity 16 1 0 0
Output reproducibility check 14 1 0 0
Output linearity check 1 2 8 6
B eam quality measurement 14 1 0 0
Leakage radiation measurement 16 1 0 0
Grid alignment check 16 8 6
Fluoroscopy
K ilovoltage check 1 0 62
F ocal spot size check 16 1 0 0
Exposure rate measurement 14 1 0 0
units recalibration of the current settings has been recommended. The grid alignment check showed that only 86% o f the units were acceptable. Corrective actions have been recommended.
The fluoroscopic mode test results showed that all 16 units were acceptable in terms of focal spot size and only 10 units (62%) gave acceptable results in the kilovoltage check. The exposure rate measurement was performed on only 14 units and all these units showed acceptable results.
Optical density was plotted against bone thickness and with the least squares method of curve fitting a straight line was obtained. The slope of the straight line is the contrast o f the radiographic image. Figure 2 shows that at 60 and 90 kVp the contrast is acceptable. In establishing radiographic factors, it was found that an output o f 6-11 raR -m A '1- s '1 gives a good contrast.

IAEA-SM-330/43 667
O f the 16 X ray units which were acceptance tested, only 12 were found acceptable for clinical use. Although these units are brand new, there are still corrective measures that have to be undertaken. The faults may have been caused by the method of transport or installation. Generally, the specifications such as added filtration and focal spot size are being complied with. Recalibration and adjustments are the compliance requirements for the unacceptable X ray units.
This study has shown that a performance test must be done for new X ray units. This test should also be undertaken for reconditioned units. A possibility would be to undertake a programme for the issuance o f approval certificates.
4. C O N C L U S I O N
REFERENCES
[1] D O N O H U E, D .P ., A nalysis o f Radiographic Q uality, 2nd edn, A spen, R ockville , M D
(1 9 8 4 ).[2] R EG A N O , L . J . , SU T T O N , R .A ., Radiation dose reduction in diagnostic X -ray proce
dures, Phys. M ed. B io l. 3 7 (1 9 9 2 ) 1 7 7 3 -1 7 8 8 .
BIBLIOGRAPHY
N A TIO N A L C O U N C IL ON R A D IA T IO N P R O T E C T IO N A N D M E A SU R E M E N T S ,
M edical X -R ay Electron Beam and Gam m a-Ray Protection for Energies up to 5 0 M eV , N C R P , W ashington, D C (1989).
Physics o f M edical Im aging, M acm illan India, Bom bay (1 9 9 1 ).

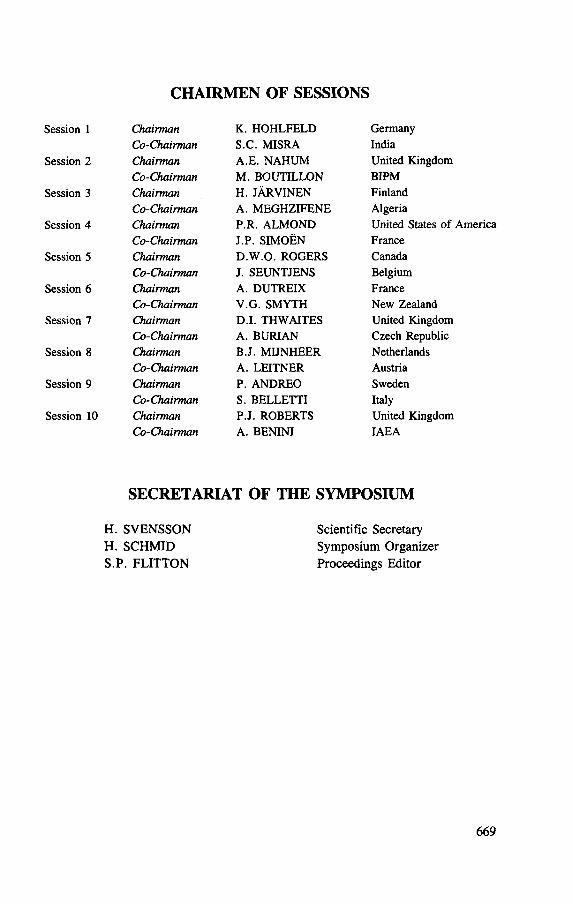
C H A I R M E N O F S E S S I O N S
Session 1
Session 2
Session 3
Session 4
Session 5
Session 6
Session 7
Session 8
Session 9
Session 10
C h a i r m a n K . H O H L FE L D Germany
C o - C h a i r m a n S .C . M ISR A India
C h a i r m a n A .E . N A H U M United Kingdom
C o - C h a i r m a n M . B O U T IL L O N B IP M
C h a i r m a n H . JÀ R V IN E N Finland
C o - C h a i r m a n A . M E G H Z IF E N E Algeria
C h a i r m a n P .R . A LM O N D United States o f A m erica
C o - C h a i r m a n J .P . SIM O ËN France
C h a i r m a n D .W .O . R O G E R S Canada
C o - C h a i r m a n J . SE U N T JE N S Belgium
C h a i r m a n A . D U T R E IX France
C o - C h a i r m a n V .G . SM Y T H New Zealand
C h a i r m a n D .I . T H W A IT E S United Kingdom
C o - C h a i r m a n A . BU R IA N C zech Republic
C h a i r m a n B .J . M U N H E ER Netherlands
C o - C h a i r m a n A . L E IT N E R Austria
C h a i r m a n P. A N D REO Sweden
C o - C h a i r m a n S . B E L L E T T I Italy
C h a i r m a n P .J . R O B E R T S United Kingdom
C o - C h a i r m a n A . B EN IN I IA E A
S E C R E T A R I A T O F T H E S Y M P O S I U M
H. SVENSSON Scientific SecretaryH. SCHMID Symposium OrganizerS.P. FLITTON Proceedings Editor
669


L I S T O F P A R T I C I P A N T S
A albers, A .H .L .
Abdel M essih , Y .F .
A ird, E .G .
A leinikov, V .E .
A l-H aj, A .
A l-K hatib, F .
A llisy , A .
Almond, P .R .
Althof, V.
Netherlands M easurem ent Institute,
Schoem akerstraat 9 7 ,
N L -2628 V K D elft, Netherlands
Faculty o f M edicine and Health Scien ces,
United A rab Em irates University,P .O . B o x 17666 ,
AI A in, United A rab Em irates
M edical Physics Department,Mount V ernon Hospital,
Rickm answ orth Road,
Northwood, M iddlesex HA 6 2R N ,
United Kingdom
Join t Institute fo r N uclear R esearch ,
141980 Dubna, M oscow Region,
Russian Federation
Biom edical Physics Department,
K ing Faisal Specialist Hospital and R esearch C entre,
P .O . B o x 3 3 5 4 ,
Riyadh 1 1211 , Saudi A rabia
T a warn Hospital,P .O . B o x 15258 ,
A I A in, United A rab Em irates
Bureau international des poids et m esures,
Pavillon de Breteuil,
F -9 2 3 1 2 Sèvres C edex, France
Jam es Graham Brow n C ancer Center,
University o f Louisville,5 2 9 South Jackson Street,
Louisv ille, K Y 4 0 2 0 2 , United States o f A m erica
Institute for Radiotherapy and Curietherapy, Fesevurstraat 11,
N L -7415 C M D eventer, Netherlands
671

672 LIST O F PARTICIPANTS
A ndré, L .
Andreo, P.
Bangsgaard, J .P .
B ea l, A.
Beauvais, H.
B elañ , J .
B elletti, S .
B enini, A .
B era , P.
Department o f Radiation Physics,
University o f B ern,
C H -3010 B ern , Switzerland
Department p f Radiation Physics,
Karolinska Institute,
Stockholm U niversity,
P .O . B o x 6 0 2 1 1 ,
S -1 0 4 01 Stockholm , Sweden
Radiofysisk Laboratorium ,
Odense U niversity Hospital,
SD R Boulevard 2 9 ,
D K -5000 Odense C , Denm ark
Taw am Hospital,
P .O . B o x 15258 ,
A l A in, United Arab Em irates
Service Radiothérapie,
Hôpital du V al-de-G râce,
7 4 , boulevard de Port R oyal,
F -7 5 2 3 0 Paris C edex 0 5 , France
Slovak Institute o f M etrology,
K arloveská 6 3 ,
842 85 Bratislava, Slovakia
Servizio di F isica Sanitaria,
Spedali C ivili di B rescia ,
Piazza le Spedali C ivili 1,
1-25100 B rescia , Italy
Division o f N uclear Safety,
International Atom ic Energy A gency,
W agram erstrasse 5 , P .O . B o x 100,
A -1400 Vienna, Austria
A gency’s Laboratory,International Atom ic Energy A gency,
W agram erstrasse 5 , P .O . B o x 100,
A -1400 V ienna, Austria

LIST O F PARTICIPANTS 673
Binder, W . Universitatsklinik fur Strahlentherapie,
A llgem eines Krankenhaus,
A lserstrasse 4 ,
A -1 0 9 0 V ienna, Austria
B je rk e , H. N orw egian Radiation Protection Authority,
P .O . B o x 5 5 ,
N -1345 0 ste rà s , Norway
Bocanek, J . N uclear Regulatory Authority,
B a jkalská 2 7 , P .O . B o x 2 4 ,
82 0 0 7 Bratislava, Slovakia
Bôhm , J . Physikalisch-Technische Bundesanstalt,
Postfach 334 5 ,
D -3 8 1 1 6 Braunschw eig, Germany
Boutillon, M . Bureau international des poids et m esures, Pavillon de Breteuil,
F -9 2 3 1 2 Sèvres C edex, France
B rid ier, A . C entre de lutte contre le cancer G ustave-Roussy,
3 9 -5 3 , rue C am ille Desm oulins,F -9 4 8 0 5 V ille ju if C edex, France
Brouw er, W . Radiotherapy Department,
N ijm egen University Hospital,
P .O . B o x 9 1 0 1 ,N L -6 5 0 0 H B N ijm egen, Netherlands
Buchheit, I. C entre A lexis Vautrin,
Route de Bourgogne,F -5 4 5 1 1 Vandoeuvre-les-Nancy, France
Burian, A . Institute o f Radiation Oncology,
Na T ru hláfce 100,
180 0 0 Prague 8 , C zech Republic
B u m s, D .T . National Physical Laboratory, Teddington, M iddlesex TW 11 0 L W ,
United Kingdom

674 LIST O F PARTICIPANTS
Chauvenet, B.
Christodoulides, G.
Constantinov, B .
Costa, A .
C sete, I.
Cuaron, A .
Czap, L .
D adasbilge, A .K .
D e G root, R .
Bureau national de m étrologie,
D A M RI/LPRI,
C E A , Centre d’études de Saclay,
B .P . 5 2 ,
F -9 1 1 9 3 G if-sur-Y vette C edex, Fran ce
Radiation Dosim etry Laboratory,
M edical Physics Department,
N icosia General Hospital,
N icosia, Cyprus
Laboratory o f C linical Dosim etry
and Ionizing Radiations M etrology,
Queen Joanna U niversity Hospital,
8 B elo M ore Street,
B G -1 5 2 7 So fia , Bulgaria
Centre de lutte contre le cancer Antoine-Lacassagne,
36 , voie Rom aine,
F -0 6 0 5 4 N ice C edex, France
National O ffice o f M easures,
P .O . B o x 19,
H -1531 Budapest 126, Hungary
D ivision o f Human Health,
International Atom ic Energy A gency,
W agram erstrasse 5 , P .O . B ox 100,
A -1400 Vienna, Austria
A gency’s Laboratory,International Atom ic Energy A gency,
W agram erstrasse 5 , P .O . B o x 100,
A -1400 V ienna, Austria
Institute o f Oncology,Capa, Topkap,
T R -3 4 3 9 0 Istanbul, Turkey
RadSafe,7 Grange Road,Kew 3 1 0 1 , V ictoria , Australia

LIST O F PARTICIPANTS 675
Delaunay, F .
D erikum , K .
D esai, R .
D olo , J .-M .
D u ftsch m id .K .
D urosinm i-Etti, F .
D utreix, A .
E l-F ik i, M .A .H .
Ennow , K .
Faerm ann, S .
Bureau national de m étrologie,
D A M RI/LPR I,
C E A , Centre d ’études de Saclay,
B .P . 5 2 ,
F -9 1 193 G if-sur-Y vette C edex, France
Physikalisch-Technische Bundesanstalt,
Postfach 334 5 ,D -3 8 116 Braunschw eig, Germany
Sahid R ajaee C ancer Hospital,
Babol Sar, Islam ic Republic o f Iran
D TA /D A M RI/LM RI,
C E A , Centre d’études de Saclay,
B .P . 5 2 ,F -9 1 193 G if-sur-Y vette C edex, France
Austrian R esearch Centre Seibersdorf,
A -2444 Seibersdorf, Austria
D ivision o f Human Health,
International Atom ic Energy A gency,
W agram erstrasse 5 , P .O . B o x 100,
A -1400 V ienna, Austria
Département de radiothérapie,
Centre de lutte contre le cancer G ustave-Roussy, 3 9 -5 3 , rue C am ille Desm oulins,
F -9 4 8 0 5 V ille ju if C edex, France
Radiation M easurement Laboratory,
National Institute for Standards,
T ersa Street, Pyramid Road, P .O . B o x 136,
G iza, Egypt
National Institute o f Radiation Hygiene,
Frederikssundsvej 37 8 ,D K -2 7 0 0 B ransh o j, Denm ark
Department o f O ncology,
Soroka M edical Center
and Faculty o f Health Sciences,
B en Gurion U niversity o f the N egev,
P .O . B o x 151,Beersheba 8 4 1 0 1 , Israel

676 LIST O F PARTICIPANTS
G aál, P.
G ábris, F .
Gantchew , M .
Garavaglia, G .
G irzikow sky, R .
G laeser, L .
G recescu , M .
G rim bergen, T .W .M .
Grindborg, J . -E .
Hanson, W .
National Institute o f Hygiene and Epidem iology,
Tm avská 5 2 ,
826 45 Bratislava, Slovakia
Slovak Institute o f M etrology,
Karloveská 6 3 ,
842 85 Bratislava, Slovakia
Dosimetry Laboratory,
National O ncological Centre,
Ulitsa Plovdivsko Pole 6 ,
B G -1 1 5 6 So fia , Bulgaria
Ospedale San Giovanni,
C H -6500 Bellinzona, Switzerland
D ivision o f Human Health,
International Atom ic Energy A gency,
W agram erstrasse 5 , P .O . B o x 100,
A -1400 V ienna, Austria
Strahlenklinik - K lin ische Strahlenphysik,
Universitatsklinikum Essen ,
Hufelandstrasse 5 5 ,D -45147 Essen , Germany
Institut de radiophysique appliquée,
Centre universitaire,
C H -1015 Lausanne, Switzerland
Ioniserende Stralingsstandaarden,
Nederlands M eetinstituut,P .O . B o x 1,
N L -3720 Bilthoven, Netherlands
Swedish Radiation Protection Institute,
B ox 6 0 2 0 4 ,
S -1 0 4 01 Stockholm , Sweden
Department o f Radiation Physics,
Radiological Physics Centre 5 4 7 ,
M .D . Anderson Hospital and Tum or Institute,
University o f T exas,
1515 H olcom be Boulevard,Houston, T X 7 7 0 3 0 , United States o f A m erica

LIST O F PARTICIPANTS 677
H argrave, N. Australian Radiation Laboratory,
Low er Plenty Road,
Y allam bie 3 0 8 5 , V ictoria , Australia
Haverkamp, U . Radiotherapy Department,
U niversity o f M ünster,
A lbert Schw eitzer-Strasse 3 3 ,
D -4 8 1 4 9 M ünster, Germany
Hohlfeld, K . Physikalisch-Technische Bundesanstalt,
Postfach 334 5 ,
D -3 8 0 2 3 Braunschw eig, Germ any
H ôver, K .-H . Deutsches Krebsforschungszentrum H eidelberg,
Im N euenheim er Feld 2 8 0 ,
D -6 9 1 2 0 Heidelberg, Germany
Ibn Seddik, A . Institut national d ’oncologie,
B .P . 6 2 1 3 ,
Rabat, M orocco
Ionescu-Farca, F . Ràtisches Kantonspital,
C H -7000 Chur, Switzerland
Izew ska, J . Radiation Physics Department,
C ancer C entre,W aw elska 15, P .O . B o x 4 7 ,
P L -0 0 -0 7 3 W arsaw 2 2 , Poland
Jàrvinen , H. Finnish Centre fo r Radiation and N uclear Safety,
P .O . B o x 2 6 8 ,S F -0 0 1 0 1 H elsinki, Finland
Jurina, V . M inistry o f Health o f the Slovak R epublic,
Bratislava, Slovakia
K arlsson, M . Radiation Physics Department,
U niversity o f Um eâ,
S-901 85 U m eâ, Sweden
K iyak, N. Ç ekm ece N uclear R esearch and Training Centre, P .K . 1, Atatürk Havalim am,
Istanbul, Turkey
678 LIST O F PARTICIPANTS
Kosunen, A. Finnish Centre for Radiation and N uclear Safety,
P .O . B o x 26 8 ,
SF -00101 Helsinki, Finland
K otze, T . Radiation Control D irectorate,
Department o f National Health,
Private Bag X 6 2 ,
B ellv ille 7 5 5 0 , South A frica
K ralik , G. N uclear Regulatory Authority,
Bajkalská 2 7 , P .O . B o x 2 4 ,
8 20 0 7 Bratislava, Slovakia
K ram er, H .M . Physikalisch-Technische Bundesanstalt,
Postfach 3 345 ,
D -38023 Braunschw eig, Germany
K raus, B . Abteilung III/8 ,
, Bundesministerium fur Gesundheit, Sport
und Konsum entenschutz,
Radetzkystrasse 2 ,
A -1030 V ienna, Austria
K rotil, J . State O ffice for N uclear Safety ,
Slezská 9 ,
120 2 9 Prague 2 , C zech Republic
K ugler, P. Cranachstrasse 5a,
A -l 130 V ienna, Austria
Kuntz, F . A E R IA L ,2 3 , rue du L oess,
F -6 7 0 3 7 Strasbourg C edex, France
L abeck , W . Krankenhaus der Barm herzigen Schw estem ,
Seilerstatte 4 ,A -4010 L inz, Austria
Laborecky, M . Nuclear Regulatory Authority,
Bajkalská 2 7 , P .O . B o x 2 4 , 8 2 0 0 7 Bratislava, Slovakia
Laginová, V . National C ancer Institute,
Heyduková 10,812 50 Bratislava, Slovakia

LIST O F PARTICIPANTS 679
Larsson, J.P.
Leitner, A.
Lenglet, W.
Li, Kaibao
Lobodziec, W.
Lobriguito, A.M.
Loos, M.
Ma, Chang-Ming
Machi, S.
Malgieri, F.
Department of Radiation Physics,Faculty of Health Sciences,Linkôping University,S-581 85 Linkôping, Sweden
Bundesamt fiir Eich- und Vermessungsv/esen, Arltgasse 35,A-1163 Vienna, Austria
Radiotherapeutisch Instituut Friesland, Borninastraat 36,NL-8934 AD Leeuwarden, Netherlands
Laboratory of Industrial Hygiene,Ministry of Public Health,2 Xinkang Street, Deshengmenwai,100 088 Beijing, China
Centre of Oncology,Armii Krajowej 15,PL-44-101 Gliwice, Poland
Radiation Health Service, Department of Health, San Lazaro Compound,Santa Cruz, Manila 1003, Philippines
SCK/CEN,Boeretang 200,B-2400 Mol, Belgium
Ionizing Radiation Standards,Institute for National Measurement Standards, National Research Council Canada,Ottawa, Ontario, Canada K1A 0R6
Department of Research and Isotopes, International Atomic Energy Agency, Wagramerstrasse 5, P.O. Box 100,A-1400 Vienna, Austria
Istituto Tumori Nazionale,Via Semmola 1,1-80131 Naples, Italy

680 LIST O F PARTICIPANTS
Matscheko, G. Department of Radiation Physics, Faculty of Health Sciences, Linkóping University,S-581 85 Linkóping, Sweden
Meghzifene, A. Centre de radioprotection et de sûreté,2, boulevard Frantz Fanon, B.P. 1017, Algiers, Algeria
Mehta, K. Division of Human Health, International Atomic Energy Agency, Wagramerstrasse 5, P.O. Box 100, A-1400 Vienna, Austria
Melchor, M. Fundación Jiménez Díaz, Avenida Reyes Católicos 2, E-28040 Madrid, Spain
Mijnheer, B.J. Department of Radiotherapy, Netherlands Cancer Institute, Plesmanlaan 121,NL-1066 CX Amsterdam, Netherlands
Milu, С. Institute of Hygiene and Public Health, SSDL Bucharest,1-3 Dr. Leonte Street,RO-76256 Bucharest 35, Romania
Minami, K. Radiation Dosimetry Division, Department of Health Physics,Japan Atomic Energy Research Institute, Tokai-mura, Naka-gun,Ibaraki-ken 319-11, Japan
Misra, S.C. Radiation Standards Section, Bhabha Atomic Research Centre, Trombay, Bombay 400 085, India
Moretti, C.J. National Physical Laboratory, Teddington, Middlesex TW11 0LW, United Kingdom

LIST O F PARTICIPANTS
Nahum, A.E.
Naudy, S.
Nette, P.
Nilsson, B.
Nilsson, H.
Nilsson, U.
Olejár, D.
Olsson, L.E.
Perroche, A.-M.
Pietraszek, W.
Joint Department of Physics,Royal Marsden Hospital
and Institute of Cancer Research, Downs Road, Sutton, Surrey SM2 5PT, United Kingdom
Centre Georges François Leclerc,1, rue du Professeur Marion,F-21034 Dijon Cedex, France
Division of Human Health,International Atomic Energy Agency, Wagramerstrasse 5, P.O. Box 100, A-1400 Vienna, Austria
Department of Radiation Physics, Karolinska Institute,Stockholm University,Box 60211,S-104 01 Stockholm, Sweden
Department of Radiation Physics,Faculty of Health Sciences,Linkôping University,S-581 85 Linkôping, Sweden
Swedish Radiation Protection Institute, Box 60204,S-104 01 Stockholm, Sweden
National Institute of Public Health, Srobárova 48,142 00 Prague 10, Czech Republic
Department of Medical Technology, Sundsvalls Sjukhus,S-851 86 Sundsvall, Sweden
Bureau international des poids et mesures, Pavillon de Breteuil,F-92312 Sèvres Cedex, France
Swietorkrzyskie Centrum Onkologii,Ulitsa Jagielloriska 74B,PL-25-734 Kielce, Poland

682 LIST O F PARTICIPANTS
Pszona, S.
Pulido Valente, F.
Pychlau, P.
Rahim, H.
Ribas, M.
Roberts, P.J.
Rogers, D.W.O.
Roos, M.
Rosenow, U.F.
Ross, C.K.
Soltan Institute for Nuclear Studies,PL-05-400 Otwock-áwierk, Poland
Avenida das Tulipas 10, 20 Esq.,Miraflores Alfeá,P-1495 Lisbon, Portugal
PTW-Freiburg,Lorracher Strasse 7,D-79115 Freiburg, Germany
Institut fur Radiothérapie, Landeskrankenanstalt Salzburg,A-5020 Salzburg, Austria
Unidad Radiofísica i Radioprotección,Hospital Santa Creu i Sant Pau,Avenida Sant Antonio M. Claret 167,
s E-08025 Barcelona, Spain
Medical Physics,Southampton General Hospital,Tremona Road,Southampton S09 4XY, United Kingdom
Ionizing Radiation Standards,Institute for National Measurement Standards, National Research Council Canada,Ottawa, Ontario, Canada K1A 0R6
Physikalisch-Technische Bundesanstalt, Postfach 3345,D-38023 Braunschweig, Germany
Department for Clinical Radiobiology and Clinical Radiation Physics,
University of Gottingen,Von Siebold Strasse 3,D-37075 Gottingen, Germany
Ionizing Radiation Standards,Institute for National Measurement Standards, National Research Council Canada,Ottawa, Ontario, Canada K1A 0R6

LIST O F PARTICIPANTS 683
Rosser, K.E.
Roth, A.
Rubio-Goday, A.M.
Rudén, B.-I.
Saraví, M.
Sàtherberg, A.
Saunders, J.E.
Sayadi, Y.
Schachner, J.
Schaeken, R.
National Physical Laboratory,Teddington, Middlesex TW11 OLW,United Kingdom
Strahlenklinik,Evangelische Bethesda Krankenhaus GmbH, Bocholder Strasse 11-13,D-45355 Essen, Germany
Servicio de Radiofísica y Protección Radiológica, Hospital Universitario ‘Germans Trias i Pujol’, Carretera Canjet s/n,E-08916 Badalona, Spain
Department of Hospital Physics,Karolinska Hospital,P.O. Box 60500, S-104 01 Stockholm, Sweden
Gerencia de Area Radioisótopos y Radiaciones, Comisión Nacional de Energía Atómica,Avenida del Libertador 8250,1429 Buenos Aires, Argentina
Radiation Physics Department,University of Umeà,S-901 85 Umeâ, Sweden
Medical Physics Department,St.Thomas’ Hospital,London SE1 7EH, United Kingdom
Centre Hospitalier de Beauvais,Avenue Leon Blum,B.P. 319,F-60021 Beauvais Cedex, France
Institut fur Krankenhausphysik,Krankenhaus Lainz,Wolkersbergenstrasse 1,A-1130 Vienna, Austria
A.Z. Middelheim,Lindenreef 1,B-2060 Antwerp, Belgium
684 LIST O F PARTICIPANTS
Schmidt, W.
Schmitzer, C.
Schneider, M.K.H.
Schnuer, K.E.
Schultz, F.
Sembo, G.
Seuntjens, J.
Shaw, J.
Simoën, J.P.
Smyth, V.G.
Universitatsklinik fur Strahlentherapie, Allgemeines Krankenhaus,Alserstrasse 4,A-1090 Vienna, Austria
Austrian Research Centre Seibersdorf, A-2444 Seibersdorf, Austria
Physikalisch-Technische Bundesanstalt, Postfach 3345,D-38116 Braunschweig, Germany
Directorate-General XI-A-1,Commission of the European Communities, Centre Wagner C331,L-2920 Luxembourg, Luxembourg
TNO Medical Biological Laboratory,P.O. Box 5815,NL-2280 HV Rijswijk, Netherlands
Terapeutisk Radiofysik, MFT,Sahlgrenska Sjukhuset,S-413 45 Gôteborg, Sweden
Standard Dosimetry Laboratory,Department of Biomedical Physics, University of Ghent,Proeftuinstraat 86,B-9000 Ghent, Belgium
Clatterbridge Centre for Oncology, Bebbington, Wirral L63 4JY,United Kingdom
Bureau national de métrologie, DAMRI/LPRI,CEA, Centre d’études de Saclay,B.P. 52,F-91193 Gif-sur-Yvette Cedex, France
National Radiation Laboratory,108 Victoria Street,P.O. Box 25-099,Christchurch, New Zealand

LIST O F PARTICIPANTS
Spellborg, H. Radiofysisk Laboratorium, Odense University Hospital, SDR Boulevard 29,DK-5000 Odense C, Denmark
Stadtmann, H. Austrian Research Centre Seibersdorf, A-2444 Seibersdorf, Austria
Strachotinsky, C. Austrian Research Centre Seibersdorf, A-2444 Seibersdorf, Austria
Stucki, G. Swiss Federal Office of Metrology, Lindenweg 50,CH-3084 Wabem, Switzerland
Sultansei, N. Krankenhaus Lainz, Wolkersbergenstrasse 1, A-1130 Vienna, Austria
Suriyapee, S. Department of Radiology, Chulalongkom Hospital, Rama IV Road,Bangkok 10330, Thailand
Tabushi, K. Saitama Cancer Center, 818 Komuro, Ina, Saitama 362, Japan
Tannanonta, C. Department of Radiology, Ramathibodi Hospital, Rama VI Road, Phayathai, Bangkok 10400, Thailand
Ten Haken, R. Department of Radiation Oncology, University of Michigan,UH-Rm, B2C438, Box 0010,1500 E. Medical Center Drive,Ann Arbor, MI 48109-0010,United States of America
Thwaites, D.I. Department of Medical Physics and Medical Engineering,
University of Edinburgh,Western General Hospital,Edinburgh EH4 2XU, United Kingdom

686 LIST O F PARTICIPANTS
Tolli, H. Terapeutisk Radiofysik, MFT, SaMgrenska Sjukhuset,S-413 45 Gôteborg, Sweden
Tverâ, К.
Valen, H.
Norwegian Radium Hospital, Montebello,N-0310 Oslo, Norway
Department of Radiation Physics, Haukeland Hospital,N-5021 Bergen, Norway
Valinta, D. Centre de lutte contre le cancer René Huguenin, 35, rue Dailly,F-92210 Saint-Cloud, France
Van Dam, J. Division of Oncology,University Hospital Saint-Rafaël, Capucijnenvoer 33,B-3000 Leuven, Belgium
Van der Hulst, P. Department of Radiotherapy, Groningen Academic Hospital, Postbus 30.001,NL-9700 RB Groningen, Netherlands
Van Loon, R. Vrije Universiteit Brussel, Pleinlaan.2,B-1050 Brussels, Belgium
Vana, N. Atominstitut der Ôsterreichischen Universitaten, Schiittelstrasse 115,A-1020 Vienna, Austria
Verzeletti, L. Servizio di Fisica Sanitaria, Spedali Civili di Brescia, Piazza le Spedali Civili 1, 1-25100 Brescia, Italy
Von Arx, A. Société suisse de radiobiologie et de physique médicale,
Ringstrasse 5,CH-4600 Olten, Switzerland
LIST O F PARTICIPANTS 687
Wágner, R.
Waligorski, M.
Zeman, J.
Zemzami, A.
Zielczyñski, M.
Zsdánszky, К.
Zyromski, P.
Institute of Radiation Dosimetry,Na Truhlárce 34/69,180 00 Prague 8, Czech Republic
Medical Physics Department,Kraków Centre of Oncology,Ulitsa Gamcarska 11,PL-31-115 Kraków, Poland
Slovak Institute of Metrology,Karloveská 63,842 65 Bratislava, Slovakia
Centre de radiothérapie et d’oncologie de Maubeuge,11, rue de la Croix,F-59600 Maubeuge, France
Institute of Atomic Energy,E-l,PL-05-400 Otwock-àwierk, Poland
Division of Human Health,International Atomic Energy Agency, Wagramerstrasse 5, P.O. Box 100,A-1400 Vienna, Austria
CEA, Centre d’études de Valduc,B.P. 14,F-21120 Is-sur-Tille, France


A U T H O R I N D E X
Aird, E.G .: 257 Alkan, H.: 157 Allisy, A.: 3Aim Carlsson, G.: 289, 625 Almond, P.R.: 463 Andreo, P.: 335 Angliss, R .F.: 131 Arib, М.: 581 Ash, D.: 277 Battad, T.U .: 659 Belletti, S.: 443 Bera, P.: 177, 527 Bielajew, A .F.: 565 Bof, E.: 151Boonkitticharoen, V.: 435 Bouchakliev, Z.: 267 Boutillon, М.: 15, 95 Bozza, A.: 443 Brend, C .J.: 73 Burian, A.: 201 Burns, D .T.: 61 Carlsson, C.A.: 625 Cavallin, A.: 443 Chassagne, D.: 277 Chauvenet, B.: 83 Cheng, Jinsheng: 233 Constantinov, B.: 267 Coursey, B.M .: 95 Delaunay, F.: 83, 309 , Derikum, K.: 323 Dorda, E.: 151 Duane, S.: 119 DuSautoy, A .R .: 73 Dutreix, A.: 277 El-Fiki, M .A .H .: 541 Ennow, K.: 589 Faermann, S.: 547 Fiume, A.: 443 Golnik, N.: 383 González, R.: 151
Grimbergen, T.W .M .: 35 Guidoum, R.: 581 Hakin, G.: 547 Hanson, W .F.: 277 Heaton, J.A .: 119 Hohlfeld, K.: 25, 95 Huntley, R.B.: 177 Ivanova, K.: 267 Jârvinen, H.: 217, 505 Kannan, A.: 193 Kanokjiraporn, S.: 427 Karlsson, М.: 299 Kasem, A.M .: 541 Kasten, G.: 515, 595 Kiyak, N.: 157 Klassen, N .V.: 565 Knight, R .T.: 361, 451 Kodl, O.: 113 Kosunen, A.: 217, 505 Kovár, I.: 201 Kramer, H .M .: 617, 637 Krutman, Y.: 547 Kushilevski, A.: 547 Larsson, J.P .: 625 Layangkul, T.: 435 Leelasomsiri, D.: 427 Leitner, A.: 411 Li, Kaibao: 233 Lobriguito, A .M .: 659 Lund, E.: 289 Ma, Chang-Ming: 371, 481,
495Matscheko, G.: 289 McEwen, M .R.: 61 Meghzifene, A.: 581 Milu, С.: 419 Minami, К .: 649 Misra, S .С.: 193 Mopera, D .J.: 659 Moretti, C .J.: 119, 131
689

690 A U T H O R INDEX
Mott, G .T.: 257 Nahum, A .E.: 361, 371, 451,
481, 495 Naik, S.B.: 193 Nette, P.: 165, 177, 527 Nilsson, H.: 289 Novotny, J.: 201 Nystróm, H.: 299, 527 Olejár, D.: 113 Olivera, G.: 555 Olsen, K .J.: 589 O ’Neil, P .J.: 131 Owen, B.: 73, 95 Pacholík, J.: 113 Papadópulos, S.: 151, 555 Patki, V.S.: 193 Penchev, V.: 267 Perroche, A.-M .: 15 Pirabul, R.: 435 Poppitz, R.: 267 Pritchard, D .H .: 73 Pychlau, P.: 633 Rantanen, E.: 217 Roberts, P.J.: 605 Rogers, D .W .O .: 95, 309, 565 Roos, М .: 25, 323 Rosenow, U .F.: 515, 595 Ross, C.K.: 309, 565 Rosser, K .E.: 73 Sansogne, R.: 555 Saraví, М.: 151, 555 Schneider, M .K .H .: 141 Schnuer, K .E.: 637 Seuntjens, J.: 45 Sharaf, M .A .: 541
Shimizu, S.: 649 Shortt, K.R.: 309, 565 Simoën, J.P .: 83 Sipilà, P.: 505 Smyth, V.G.: 209 Srimanoroth, S.: 427 Stoker, I.: 73 Strachotinsky, C.: 411 Stucki, G.: 119 Suriyapee, S.: 427 Svensson, H.: 165 Tannanonta, C.: 435 Thienel, T.: 515 Thierens, H.: 45 Thwaites, D .I.: 239, 395 Tiefenbôck, W .: 411 Van dér Plaetsen, A.: 45 van Dijk, E.: 35 Van Laere, K.: 45 Verzeletti, L.: 443 Vijayam, P .N .M .R .: 193 Visser, A .G.: 277 Wágner, R.: 201 Wambersie, A.: 277 Williams, A .J.: 61 Williams, C.: 257 Wilson, J.F .: 277 Witzani, J.: 411 Ya§ar, S.: 157 Zachariásová, I.: 113 Zhao, Shian: 233 Zhao, Zhaoluo: 233 Zielczyñski, М .: 383 Zsdánszky, К .: 165

3.4.5.6 .
7.9.
1 0 .
1 1 .15.161718.19.2 0 .21
2 2 .
24.25.26.27.28.293032.34.35.36.37.38.40.41,
. 633
. 659
. 617
. 25
. 323
. 141
. 95
. 547
. 541
. 427
. 299
. 637
. 257
. 201
. 463
. 411
. 335
. 277
. 595
. 515
. 35
. 4433
. 165
. 177
. 481
. 527
. 605
. 383
. 131
I N D E X O F P A P E R S B Y N U M B E R
Page
. 267
. 495
. 371 , 45 . 113 . 565 . 309 . 649 . 233 . 193 . 361 . 239 . 395 . 589 . 419 . 15 . 451 . 209 . 555 . 151 . 289 . 625 . 581 . 157 . 61 . 73 . 119 , 83 . 435 . 217 . 505
-SM-330/IAEA-
4 2 .......4 3 .......
4 4 .......
4 5 .......
4 6 .......
4 7 .......
4 8 .......
4 9 .......
5 0 .......
5 1 .......5 4 .......
5 6 .......
5 7 .......
5 8 .......6 0 .......
6 1 .......
6 2 .......
6 3 .......
6 4 .......
6 5 .......
6 6 .......
6 7 .......
6 8 .......6 9 .......
7 0 .......7 1 .......
7 2 .......
7 3 .......7 4 .......
7 5 .......

93-0
2515
HOW T O ORDER IAEA PU BLICATIONS
☆ ☆ In the United States o f America and Canada, the exclusive sales agent forIAEA publications, to whom all orders and inquiries should be addressed, is:
UNIPUB, 4611-F Assembly Drive, Lanham, M D 20706-4391, USA
☆ ☆ In the following countries IAEA publications may be purchased from the sourceslisted below, or from major local booksellers. Payment may be made in local currency or with UNESCO coupons.
ARGENTINA
AU STRALIABELGIUM
CHILE
CHINA
FRANCE
G ERM AN Y
HUNGARYINDIA
ISRAELITALY
JA P A NNETHERLANDS
PAKISTANPO LAND
ROMANIA RUSSIAN FEDERATION
SLO VAK REPUBLIC SOUTH AFR ICA
SPAIN
SWEDEN UNITED KINGDOM
YUGO SLAVIA
Comisión Nacional de Energía Atómica, Avenida del Libertador 8250, RA-1429 Buenos AiresHunter Publications, 58A Gipps Street, Collingwood, Victoria 3066 Service Courrier UNESCO, 202, Avenue du Roi, B-1060 Brussels Comisión Chilena de Energía Nuclear, Venta de Publicaciones, Amunategui 95, Casilla 188-D, Santiago IAEA Publications in Chinese:China Nuclear Energy Industry Corporation, Translation Section,P.O. Box 2103, BeijingIAEA Publications other than in Chinese:China National Publications Import & Export Corporation,Deutsche Abteilung, P.O. Box 88, BeijingOffice International de Documentation et Librairie, 48, rue Gay-Lussac, F-75240 Paris Cedex 05UNO-Verlag, Vertriebs- und Verlags GmbH, Dag Hammarskjôld-Haus, Poppelsdorfer Allee 55, D-53115 Bonn Librotrade Ltd., Book Import, P.O. Box 126, H-1656 Budapest Oxford Book and Stationery Co., Scindia House, New Delhi-110 001 YOZMOT Literature Ltd., P.O. Box 56055, IL-61560 Tel Aviv Librería Scientifica Dott. Lucio di Biasio “ AEIOU” ,Via Coronelli 6, 1-20146 MilanMaruzen Company, Ltd, P.O. Box 5050, 100-31 Tokyo International Martinus Nijhoff International, P.O. Box 269, NL-2501 AX The Hague Swets and Zeitlinger b.v., P.O. Box 830, NL-2610 SZ Lisse Mirza Book Agency, 65, Shahrah Quaid-e-Azam, P.O. Box 729, Lahore 3 Ars Polona, Foreign Trade Enterprise,Krakowskie Przedmieácie 7, PL-00-068 Warsaw llexim, P.O. Box 136-137, Bucharest Mezhdunarodnaya Kniga, Sovinkniga-EA,Dimitrova 39, SÚ-113 095 MoscowAlfa Publishers, Hurbanovo námestie 3, SQ-815 89 Bratislava Van Schaik Bookstore (Pty) Ltd, P.O. Box 724, Pretoria 0001 Dfaz de Santos, Lagasca 95, E-28006 Madrid Dfaz de Santos, Balmes 417, E-08022 Barcelona Fritzes Information Centre, S-106 47 Stockholm HMSO, Publications Centre, Agency Section,51 Nine Elms Lane, London SW8 5DRJugoslovenska Knjiga, Terazije 27, P.O. Box 36, YU-11001 Belgrade
☆ Orders (except for customers in Canada and the USA) and requests for information may also be addressed directly to:
$ iK ) Л ®a,es ancl Promotion Unit ^ ^ International Atomic Energy Agency
Wagramerstrasse 5, P.O. Box 100, A-1400 Vienna, Austria


INTERNATIONAL ATOMIC E N E R G Y A G EN CY VIENNA
ISBN 9 2 - 0 - 1 0 0 1 9 4 - 0 ISSN 0 0 7 4 - 1 8 8 4
Copyright © 2022 FDOKUMEN