treatment of criminals at mari - Institutional Repository Home
Upload
khangminh22Category
view
4download
0
GEOGRAPHICAL INFORMATION SYSTEM MANAGEMENT TOOL
FOR UNDERGROUND ELECTRICAL AND TELECOMMUNICATION
NETWORKS: Case of the University of Zambia
BY
TWATAIZYA MINANGO
A Dissertation submitted to the University of Zambia in partial fulfillment of the
requirements for the degree of
Master of Science in Geo-Information Science and Earth Observation
University of Zambia
Lusaka
2022

DECLARATION
I, the undersigned declare that the work in this dissertation is original except where indicated by
special reference in the text and no part of the research has been submitted for any degree, diploma
or academic qualification. I further declare that the research has not been presented to any other
College/University for examination either in Zambia or outside Zambia.
Name:...........................................................................................................................................
Signature:............................................................................................Date:.....................................

COPYRIGHT DECLARATION
All rights reserved. No part of this dissertation must be reproduced, stored in any retrieval system
or transmitted in any form or by any means such as photocopying, recording, or otherwise without
written permission, of the author or the University of Zambia (UNZA).

CERTIFICATE OF APPROVAL
This document by TWATAIZYA MINANGO is approved as partial fulfillment of the
requirements for the award of the degree of Master of Science in Geo-Information Science and
Earth Observation of the University of Zambia.
Examiner 1:.........................................................................Signature:….................Date:.................
Examiner 2:.........................................................................Signature:….................Date:.................
Examiner 3:.........................................................................Signature:….................Date:.................
Chairman Board of Examiners
Name:..................................................................................Signature:….................Date:.................
Supervisor:..........................................................................Signature:….................Date:.................
iv
ABSTRACT
The university of Zambia’s electricity provides power to operate campus infrastructure such as hostels, lecture rooms, library etc. While telecommunication utilities provide telephone, intranet and internet services. The power and communication utilities are supplied by underground cables. However, the current management system lacks spatial information about these cables. This due to the fact that the current system is based on out dated maps and drawings that lack locational data. This problem has resulted in the cutting of these utility cables during day to day construction of new infrastructure within campus. Therefore, the aim of this study was to develop a spatial model for managing the underground electrical and telecommunication networks at the University of Zambia using Free and Open Source Software (FOSS). To achieve this the first objective was to map the electrical and telecommunication networks and was addressed by using GPS. The second objective was to design a centralized desktop based GIS system for the mapped electrical and telecommunication networks. This objective was addressed by creating a spatial database using PostgreSQL with PostGIS extension to digitally store the mapped networks. QGIS software was used to develop the GIS model. The third objective was to develop prototypes based on web and mobile based GIS technology. This was addressed by developing a web-based GIS application using Leaflet Java Script library. The proposed management system will provide digital storage of spatial information which would allow for easy access, querying and analysis of spatial data as well as provide easy way of updating new data into the system. This study proposed the development of the underground electrical and telecommunication utility management system using GIS technology. The underground cables were mapped and stored digitally. The desktopGIS and WebGIS management systems were also developed. The mobileGIS application was developed for field work purposes. The developed system provided tools that could help in decision making concerning modifications and updates in future. This study proposed the development of the underground electrical and telecommunication utility management system using GIS technology. The underground cables were mapped and stored digitally. The Desktop, Web and Mobile based GIS management system prototypes were also developed.
Keywords: Electrical, Telecommunication, QGIS, PostgreSQL, PostGIS, WebGIS, MobileGIS

v
ACKNOWLEDGMENTS
Foremost, I would like to thank the Lord Almighty for guiding throughout this work. Besides the
Lord Almighty, I would like to express my deepest appreciation to all those who provided me the
possibility to complete this report. A special gratitude I give to the German Federal Ministry of
Education and Research (BMBF) for awarding me the scholarship. The BMBF through the
Southern African Science Service Centre for Climate Change and Adaptive Land Management
(SASSCAL) Task 303 initiative provided financial support towards my tuition fees. Furthermore,
I would also like to acknowledge with much appreciation the crucial role of the University of
Zambia Resident Engineers (Electrical department) Mr. Henry Londaisha and Mr. Raphael
Chisenga for the help they gave me during the field work exercise and the useful information they
provided on the electrical component of study. Lastly, I would like to give special thanks to Zamtel
staff members Mr. Kayumba, Lumet for and University of Zambia Telecommunications manager
Mr. Chipulu for orienting me on the telecommunication network setup.
vi
TABLE OF CONTENT
ABSTRACT .................................................................................................................................. iv
ACKNOWLEDGMENTS ............................................................................................................ v
LIST OF FIGURES ..................................................................................................................... ix
LIST OF TABLES ....................................................................................................................... xi
LIST OF ACRONYMS .............................................................................................................. xii
CHAPTER ONE: INTRODUCTION ......................................................................................... 1
1.1 Background ..................................................................................................................... 1
1.2 Problem Statement .......................................................................................................... 3
1.3 Aim ................................................................................................................................. 4
1.4 Objectives ....................................................................................................................... 4
1.5 Research Questions ......................................................................................................... 4
1.6 Significance..................................................................................................................... 4
CHAPTER TWO: LITERATURE REVIEW ............................................................................ 6
2.1 Overview ......................................................................................................................... 6
2.2 Management of University Utility Services ................................................................... 6
2.2.1 Electrical Networks ................................................................................................... 6
2.2.2 Communication Networks ........................................................................................ 7
2.2.3 Water Networks ........................................................................................................ 7
2.2.4 Waste Water Management ........................................................................................ 8
2.2.5 Solid Waste Management ......................................................................................... 8
2.3 GIS .................................................................................................................................. 9
2.3.1 Components of GIS................................................................................................. 10
2.3.2 Categories of GIS Software .................................................................................... 11
2.3.2.1 Commercial GIS .................................................................................................. 12
2.3.2.2 Open Source GIS ................................................................................................. 12
2.4 GIS Architecture ........................................................................................................... 12
2.4.1 DesktopGIS ............................................................................................................. 12
2.4.2 WebGIS................................................................................................................... 13
2.4.3 Mobile GIS.............................................................................................................. 14
2.5 QR Code........................................................................................................................ 15
vii
2.6 Location Based Services ............................................................................................... 16
2.7 Shortest Path Algorithms .............................................................................................. 17
2.7.1 Dijkistra algorithm .................................................................................................. 17
2.7.2 Floyd algorithm ....................................................................................................... 17
2.7.3 A-Star Algorithm .................................................................................................... 17
2.8 Related Works ............................................................................................................... 18
CHAPTER THREE: METHODOLOGY ................................................................................ 28
3.1 Study Area .................................................................................................................... 28
3.2 Research Design............................................................................................................ 29
3.3 Data Collection ............................................................................................................. 30
3.4 Data Processing ............................................................................................................. 34
3.5 System Design .............................................................................................................. 37
3.5.1 Database Layer........................................................................................................ 39
3.5.1.1 Relational Database ......................................................................................... 39
3.5.1.2 Spatial database Creation ................................................................................. 41
3.5.2 Server-Side Layer ................................................................................................... 42
3.5.2.1 Web Server ...................................................................................................... 42
3.5.2.2 Map Server ...................................................................................................... 43
3.5.2.3 Web Feature Services ...................................................................................... 44
3.5.3 Client-Side Layer .................................................................................................... 44
3.5.3.1 JavaScript Libraries ......................................................................................... 45
3.5.3.2 Asynchronous JavaScript and XML ................................................................ 46
3.5.3.3 Content Management System .......................................................................... 46
3.5.3.4 DesktopGIS ..................................................................................................... 47
3.5.3.5 WebGIS ........................................................................................................... 48
3.5.3.6 MobileGIS ....................................................................................................... 48
3.6 QR Code Generation ..................................................................................................... 49
3.7 QR Code Reader ........................................................................................................... 50
3.8 Leaflet Routing Machine .............................................................................................. 50
3.9 Use Case Diagrams ....................................................................................................... 51
3.10 Sequence Diagram ........................................................................................................ 54
3.11 Class Diagram ............................................................................................................... 54

viii
3.12 Deployment Diagram .................................................................................................... 55
3.13 Hardware Tools ............................................................................................................. 57
CHAPTER FOUR: RESULTS .................................................................................................. 59
4.1 Overview ....................................................................................................................... 59
4.2 Mapping the Existing Electrical and Telecommunication Cable Networks ................. 59
4.3 Designing a SDBMS for Electrical and Telecommunication Cable Networks ............ 60
4.4 Development of the SDBMS Prototype using Web and Mobile Technologies............ 62
4.4.1 Login Management System .................................................................................... 62
4.4.2 WebGIS Application ............................................................................................... 63
4.4.2.1 Distance Measuring Tool ................................................................................. 67
4.4.2.2 Location Button ............................................................................................... 68
4.4.2.3 Side Bar Menu ................................................................................................. 69
4.4.2.3.1 Substation Search Bar ................................................................................. 70
4.4.2.3.2 Joint Box Search ............................................................................................ 71
4.4.2.3.3 Electrical Cable Buffer ................................................................................ 72
4.4.2.3..4 Telecommunication Cable Buffer ................................................................ 73
4.4.2.4 Coordinate Marker ........................................................................................... 74
4.4.3 MobileGIS Application ........................................................................................... 75
CHAPTER FIVE: DISCUSSION .............................................................................................. 82
5.1 Discussion of Results .................................................................................................... 82
CHAPTER SIX: CONCLUSION AND RECOMMENDATIONS ........................................ 84
6.1 Conclusion .................................................................................................................... 84
6.2 Recommendations ......................................................................................................... 84
REFERENCES ............................................................................................................................ 85
APPENDICES ............................................................................................................................. 92
ix
LIST OF FIGURES
Figure 1.1: Cut 11KV electrical cable during construction of the East Park mall extension
(Source: by Author) ........................................................................................................................ 3
Figure 3.1: Methodology Flow Chart ........................................................................................... 30
Figure 3.2: Screenshot of mapped underground telecommunication network ............................. 31
Figure 3.3: Screenshot of the mapped underground electric network .......................................... 32
Figure 3.4: Scanned map showing the substations at the University of Zambia (Source: The
Resident Engineer’s Office, University of Zambia) ..................................................................... 33
Figure 3.5: CAD drawing showing the distribution of the Electrical Networks at the University
of Zambia (Source: The Resident Engineer’s Office, University of Zambia) .............................. 34
Figure 3.6: GPS points loaded in QGIS software ......................................................................... 35
Figure 3.7: Digitization of Underground Electrical network line ................................................. 36
Figure 3.8: Digitization of Underground Telecommunication network line ................................ 36
Figure 3.9: Digitization of campus buildings ............................................................................... 37
Figure 3.10: System Design Flow diagram................................................................................... 38
Figure 3.11: ERD for login information tables ............................................................................. 40
Figure 3.12: Creation of PostgreSQL/PostGIS spatial database ................................................... 41
Figure 3.13: Importing of shapefiles into PostgreSQL/PostGIS spatial database ........................ 42
Figure 3.14: ID structure of the MCB switches ............................................................................ 49
Figure 3.15: Creating QR Code for MCB ID ............................................................................... 50
Figure 3.16: UML diagram for the WebGIS application. ............................................................. 52
Figure 3.17: UML diagram for the mobile application................................................................. 53
Figure 3.18: Login system sequence diagram............................................................................... 54
Figure 3.19: Class diagram for login system ................................................................................ 55
Figure 3.20: GIS prototype deployment diagram ......................................................................... 56
Figure 4.1: Mapped underground Electrical and Telecommunication networks .......................... 59
Figure 4.2: Connection to the spatial database in QGIS ............................................................... 60
Figure 4.3: Customized DesktopGIS for underground electrical and telecommunication networks
at UNZA........................................................................................................................................ 61
Figure 4.4: Home page of the login management system ............................................................. 62
Figure 4.5: User logging into the webGIS page anagement system ............................................. 62

x
Figure 4.6: Components of the developed WebGIS application .................................................. 63
Figure 4.7: WebGIS application showing the underground electrical and telecommunication
network at UNZA overlaid on Google satellite imagery basemap. .............................................. 65
Figure 4.8: WebGIS application with OSM raster as the basemap layer ..................................... 66
Figure 4. 9: WebGIS application with Google maps raster as the basemap layer ........................ 66
Figure 4.10: Distance calculation using the distance measuring tool. .......................................... 67
Figure 4.11: Demonstration of the location button tool. ............................................................... 68
Figure 4.12: Components of the side bar menu ............................................................................ 69
Figure 4.13: Results of the Substation search. .............................................................................. 70
Figure 4.14: Result of an invalid substation ID search by the user. ............................................. 71
Figure 4.15: Result of the joint box search. .................................................................................. 71
Figure 4.16: Result of an invalid joint box ID search by the user. ............................................... 72
Figure 4.17: Result of the electrical line buffer tool. .................................................................... 72
Figure 4.18: Result of the telecommunication line buffer tool. .................................................... 73
Figure 4.19: Using the coordinate marker tool. ............................................................................ 74
Figure 4.20: Dragging a point marker to another position using the edit marker tool. ................ 75
Figure 4.21: MobileGIS Application interface. ............................................................................ 76
Figure 4.22: QR Code Scanning Process. ..................................................................................... 77
Figure 4.23: QR Reader Screen. ................................................................................................... 78
Figure 4.24: Attribute information of an MCB displayed after Successfully read QR code. ....... 79
Figure 4.25: Navigating to destination point. ............................................................................... 80
Figure 4.26: Features screen with sub-screens showing attributes of each feature. ..................... 81

xi
LIST OF TABLES
Table 3.1: Relationship between objectives and tools .................................................................. 28
Table 3.2: Hardware Tools Specifications .................................................................................... 58
Table 4.1: Description of the WebGIS application tools .............................................................. 64

xii
LIST OF ACRONYMS
AJAX Asynchronous JavaScript and XML
AR Augmented Reality
CAD Computer Aided Design
CSS Cascaded Style Sheets
CSV Comma Separated Values
DBMS Database Management System
DEM Digital Elevation Model
ERD Entity-Relationship Diagram
ESRI Environmental Systems Research Institute
FOSS Free Open Source Software
GIS Geographic Information System
GPS Global Positioning System
GUI Graphical User Interface
HTML HyperText Markup Language
HTTP HyperText Transfer Protocol
ID Identification number
IDE Integrated Development Environment
JS JavaScript
JSP Java Server Pages
JVM Java Virtual Machine
KML Keyhole Markup Language
KV Kilo Volts
LBS Location Based Services
MCB Main Circuit Breaker
OGC Open Geospatial Consortium
OSM Open Street Map

xiii
POI Point of Interest
QR Quick Response
RTK Real Time Kinematic
SDBMS Spatial Database Management System
SDK Standard Development Kit
SQL Structured Query Language
UML Universal Modelling Language
UNZA University of Zambia
URL Uniform Resource Locator
WCS Web Coverage Service
WFS Web Feature Service
WMS Web Map Service
XML Extended Markup Language
1
CHAPTER ONE: INTRODUCTION
1.1 Background
The University of Zambia (UNZA) is an expanding public University. This growth naturally
necessitates the acquisition of new properties and development of University infrastructure. One
of the key areas of focus for managing the University facilities is optimal use of utility spatial
information. In particular, utilities such as electricity and telecommunication networks are
essential for the smooth running of a university. Electricity provides for all power needed to
operate university infrastructure such as hostels, lecture rooms, library etc. While
telecommunication utilities provide campus infrastructure with telephone, intranet and internet
services.
Most of the information on electricity network used in managing the University facilities have
been primarily based on scanned copy drawings. However, these drawings have become largely
inaccurate because they have not been updated in a very long time. These are no longer appropriate
for real time decision making because they are unable to act in response to changing circumstances.
In addition, they also lack spatial information of the electricity networks which makes it difficult
to locate them. Therefore, there is need to introduce an improved system that is capable of handling
spatial component of electric networks. With the availability of Geographical Information Science
(GIS) technology it is possible.
GIS belongs to the family of information systems. However, GIS is different from other
information systems because additionally it deals with spatial data (or geodata). GIS is a special
case of information system in which “information is derived from the interpretation of data which
are symbolic representations of features” (Maguire , et al., 1991). In developing countries however,
GIS is not used to address pressing needs in ways that are sustainable. This can be due to numerous
challenges existing when implementing GIS, which are mostly organizational (Chikumba, 2018).
This can be attributed to the fact that most organizations are not conversant with GIS or they are
not financially capable to implement this technology. But the introduction of Free and Open
Source Software (FOSS) has brought about the availability of GIS technology without any cost.
The emergence of FOSS based GIS has opened doors towards the implementation of GIS in
organizations. Over the last few years the world FOSS has experienced some major changes

2
(Steiniger & Bocher, 2008). FOSS has grown mainly due to its improved quality and economic
(Ballatore, et al., 2011). FOSS software has become a reliable alternative for many users,
especially those working in the fields of scientific research institutions, non-profit organizations
or small business, where limited budgets cannot provide the cost of installing and maintaining the
commercial software (Mohammed, 2014).
According to (Grise, et al., 2012) GIS can be used to improve operations, update network
information and provide easy access to spatial data. Web-GIS based Utility Management System
(WGUMS) has the potential to be used to visualize and maintain electricity and telecommunication
utility assets in terms of database and operations. It would provide GIS functionalities over the
web as well as a Graphic User Interface (GUI). This would aid in the effective management of the
utility networks. (Rajeshkumar, et al., 2017) also state that by using GIS technology, complexities
of utility network can be simplified and maintenance cost can be reduced to some extent.
Geographic Information System (GIS) and web GIS technology can help resource managers in
providing improved services. Traditional approaches are very complex to manage utility
information, that upswings the need for the development of a (WGUMS) system.
MobileGIS extends GIS functionalities to mobile smart phones. Technological advancements have
given people more access to more difficult information. One of the ease that can be felt is access
to a spatial and geographic area or geographic information that currently has been digitized or
commonly called digital mapping (Ramadiani, et al., 2018).
With the increase in computing power of efficient processors, broadband Internet access and
productivity-enhancing applications, Smart phones and tablets have the ability to store information
such as personal and laptop computers (Bröring, et al., 2012). Reference (Liao, et al., 2016) states
that the use of smart phones saves money by not having to buy separate equipment and facilitates
faster access to information at anytime, anywhere.
Somers (Somers, 1998) states that GIS implementation is unique to a particular organization or
context. Therefore, this study focusses on the improvement of the management of electricity and
telecommunication networks at UNZA by implementing GIS to the current management system
using open source technology.

3
1.2 Problem Statement
The resident engineers at the university of Zambia are dedicated in managing the electricity
network systems in campus. The current management system being used involves storage of
electrical utility networks in form of scanned documents. These documents are outdated and do
not indicate the currently developed infrastructure. The system also lacks spatial information on
electricity network lines. This makes it very difficult to precisely locate these underground
electricity cables. With the day to day construction works within the campus, underground electric
cables are vulnerable to being cut due to the lack of spatial information. Therefore, the university
runs the risk of experiencing power blackouts. Thus, there is a need to develop a spatial data
management system that can address the above-mentioned problems, which is the aim of the
proposed research.
Date: 9th June 2019
Figure 1.1: Cut 11KV electrical cable during construction of the East Park mall extension (Source: by Author)

4
Figure 1.1 shows the cut 11KV underground electrical cable as a result of excavation during the
construction works of the East Park mall extension. This was due to lack of spatial data on the
electrical cable.
1.3 Aim
To develop a system for managing the underground electrical and telecommunication networks at
the University of Zambia.
1.4 Objectives
i. To map the existing electrical and telecommunication cable networks at the University of
Zambia.
ii. To design a Spatial Database Management System (SDBMS) for electrical and
telecommunication cable networks.
iii. To develop an SDBMS prototype based on the design in (ii) using web and mobile
technologies.
1.5 Research Questions
i. How can we map the underground electrical and telecommunication cable networks at the
university of Zambia?
ii. To what extent can an SDBMS be developed based on web and mobile technologies to
electrical and telecommunication cable networks?
iii. How can a prototype be developed based on the SDBMS in (ii)?
1.6 Significance
The purpose of this study is to provide an improved way of managing the spatial information of
the service line cables. The resident engineers will greatly benefit from this study as it would
overcome the challenges and shortcomings that there are currently experiencing. This would will
provide them with a much more efficient way of handling spatial information of the electric cables
as well as provide spatial information to easily locate the exact paths of the electrical line networks.
The proposed electrical utility management system will provide digital storage of spatial

5
information which would allow for easy access, querying and analysis of spatial data as well as
provide easy way of updating new data into the system. It will also help in making better decisions
when planning for new or modification of existing connections.

6
CHAPTER TWO: LITERATURE REVIEW
2.1 Overview
This chapter reviews the works related to this study. It describes how universities in general
manage their utility services. This chapter describes Geographical Information Systems (GIS), its
components, types and how this technology is being implemented globally. The review of
literature focused on mainly the previous works similar to this study. This involved identification
of tools, methods and methodologies used in these works.
2.2 Management of University Utility Services
The campus utilities unit has the responsibility to provide utilities in an economic, efficient, safe
and timely manner. The service utilities include electricity, communication networks, water and
sewer. The management of these utilities by universities are described.
2.2.1 Electrical Networks
Of school buildings, university building requires various case analysis unlike buildings in the
elementary, middle and high schools in accordance with its characteristic for variables such as
characteristic of department, construction structure and material, the number of persons admitted
and schedule (Lee, et al., 2012). Today, the amount of energy consumption at the university
campuses is huge (Kim , et al., 2010). A university is usually made up of an electric mix of
buildings, including research facilities, libraries, offices, auditoriums, dormitories, classrooms,
dining halls, and in this case a central steam-heating plant, individual building chillers for air
conditioning, thousands of lighting fixtures and exit lights. Therefore, energy management is a
major concern on university campuses (Shyr & Chen, 2017). Understanding the energy use of
university campuses other than individual educational or research buildings is an important
precondition of understanding how to improve the energy efficiency and make a good energy
planning of campus building complexes (Evangelinos , et al., 2009). (Bonnet , et al., 2002)
developed a tool allowing the diversity of activities and end-uses of electricity and water to be
addressed when analyzing energy demand and the environmental impact on a campus. (Chung &
Rhee, 2014) conducted an on-site survey of existing university buildings to determine their current
energy use patterns and energy saving strategies for improving their energy efficiencies.

7
2.2.2 Communication Networks
The increasing demand for high performance network (i.e. high throughput and low delays on an
end to-end basis, a degree of fairness in accessing available channel bandwidth among active users
on the network, and a quality of service provisioning) has challenged network researchers to design
network architectures capable of delivering a high quality of service to end users (Sarkar & Byrne
, 2005). The network infrastructure design becomes critical part for some IT organization recent
years. An important network design consideration for today's networks is creating the potential to
support future expansions; reliable and scalable networks (Mulyawan, 2011). The high-level
strategy for central IT provision, including data and voice networks, is determined by the
Information Communications Technology Committee (ICTC). IT Services is responsible for the
campus networks. IT Services is responsible for administering all network devices such routers,
switches, gateways, firewalls, network wall sockets, wireless access points and wall sockets
forming the University network infrastructure. The Campus network cabling extends to nearly all
University buildings and departments and is also the responsibility of IT Services (Nelson, 2011).
Secured network protects an institution from security attacks associated with network. A university
network has a number of uses, such as teaching, learning, research, management, e-library, result
publishing and connection with the external users. Network security will prevent the university
network from different types of threats and attacks (Bin Ali , et al., 2015).
2.2.3 Water Networks
Institutions of higher education have the potential to foster sustainable and integrated water
management through their education, research, service, and operational activities (Cortese, 2003).
Sustainable water management can make a contribution to schools by providing benefits in
educational, financial and environmental aspects (CIRIA, 2006). Sustainable water management
is needed to ensure quality supplies of our vital water resources in the face of growing human
demand for water, high levels of pollution, and increasing spatial and temporal variability
associated with climate change. Universities and colleges have missions, resources, and contexts
that could enable them to lead the process of developing and applying sustainable and integrated
water resource management. While water may not currently be at the top of the agenda in campus
sustainability, many institutions are making great strides in implementing water conservation
measures and best management practices with respect to water. There are many different best

8
management practices and technologies developed over the years to conserve water, recover and
recycle water, improve water quality, regulate and treat storm water and minimize impacts to
aquatic and wetland ecosystems. Universities are to differing extents adopting and adapting these
diverse BMPs to resolve water challenges and meet the needs of their campus and local
community. More and more campuses are developing water conservation plans, storm water
management plans, and watershed management plans (McHugh, et al., 2011).
2.2.4 Waste Water Management
Wastewater management or the lack of, has a direct impact on the biological diversity of aquatic
ecosystems, disrupting the fundamental integrity of our life support systems, on which a wide
range of sectors from urban development to food production and industry depend. It is essential
that wastewater management is considered as part of integrated, ecosystem-based management
that operates across sectors and borders, freshwater and marine (Corcoran, et al., 2010). Managing
a sewer system means making sure the system’s performance criteria are met. Most of the day-to-
day basic activities are object-focused, with investigation and assessment aimed primarily at
changing the condition of a system’s objects, for example by replacing sewer pipes without
changing their diameter. If the pipes of a sewer are no longer strong enough and in danger of
collapse, the sewer must be replaced. The result will be a modified structural condition, but if the
dimensions of the sewer do not change, the change does not affect the original performance of the
system as a whole. Maintaining the required discharge capacity is a part of system management
(Clemens, et al., 2009). Campus sewage generally has the following characteristics:1) Water, water
quality and stability of pollutants, mainly organic matter. 2) Biodegradable, and up to two emission
standards. 3) Large amount of sewage discharge, to meet the characteristics of landscape water
consumption, easy to achieve water balance. 4) Sewage treatment can be carried out in the school,
the implementation of convenient and quick, as landscape water reuse water, has a high guarantee
rate (Liu, et al., 2016).
2.2.5 Solid Waste Management
Waste is often regarded as consisting of materials that are no longer considered valuable and which
are subsequently disposed of (Tchobanaglous, 1993). With the increasing rate of solid waste
generation, and awareness and regulations (for recycling and recovery, management and source

9
reduction by intervening at production and consumption level), various institutions have got
involved into one or more aspects of solid waste management chain (Aseto, 2016). Waste
management infrastructure is largely nonexistent in most institutions in Africa. Improvements in
infrastructure in key institutions in the continent are urgently needed to combat the severe
repercussions of poor waste management (Ogbaji & Kunene, 2008). According to (Starovoytova
& Namango, 2018) universities are the-providers of the-highest-level of recognized, structured
education, in any-country. Institutional wastes constitute about 23 per cent of the total solid wastes
generated in Nairobi. The collection and disposal of waste in the city is undertaken by the
institutions themselves, often involving private waste collectors. Partnerships between local
authorities and private and public institutions, to facilitate sharing of waste management
responsibilities and financial burden are common in Nairobi (Ikiara, 2006). As such,
neighbourhood or residential associations have emerged in many middle and high-income
residential areas to organize provision of failed public infrastructure services (Kiprop, 2008).
2.3 GIS
The Acronym GIS stands for Geographic Information System. “As the name suggests, a GIS as a
system means it is a tool for working with geographic information” (Otto & Rolf, 2009). This
describes GIS as the software and hardware used for a specific purpose. Geographic Information
Systems describes the “what” and “where” of a geographical phenomenon. GIS has also been
defined as Geographic Information Science. Finally, the "science of GIS" position insists on a
more intimate and reciprocal connection between tool and science, involving research on a set of
basic problems (Wright, et al., 1997). The term science suggests that it is the conceptualization of
how to implement GIS. It describes how to store, collect and analyze spatial data. Thus, today (as
of 2019), by convention, GIS is worldly known as a science. GIS can simply be described as is the
integration of hardware, software and personnel to capture, store, analyze, manipulate, manage
and display geographic data.
In 1960, Dr. Rodger Tomlinson developed the world’s first true operational GIS in Ottawa,
Canada. The GIS provided functionalities such as overlay, measurement, scanning and digitizing
and supported a coordinate system. In the early 1980s database capabilities were incorporated to
provide storage of attribute data and GIS software was commercialized. The 21st century has seen
an increase in the use of GIS as it is being applied in many diverse industries such as land

10
management, health, asset management, land use change, utility and transportation networks etc.
It is evident that GIS has evolved from time to time due to its wide spread use and advancement
in technology.
2.3.1 Components of GIS
GIS integrates hardware, software, data, people, methods and network and hence define the
components of a GIS.
Figure 2.1: The 6 components of a GIS (Source: by author)
1) Hardware: The computer on which a GIS operates. A wide range of hardware types, from
centralized computer servers to desktop computers used in stand-alone or networked
configurations. Hardware refers to the devices used by end users such as GPS, Personal Computer
(PC), scanners, printers, plotters and sensors. Data storage and manipulation is done using a range
of processor. 2) Software: GIS software provides the functions and tools needed to store, analyze,
and display geographic information. Key software components are tools for the input and
manipulation of geographic information; a database management system (DBMS); tools that
support geographic query, analysis, and visualization; a Graphical User Interface (GUI) for easy
Network
GIS
Software
People
Data
Hardware
Methods

11
access to tools Software parts relates to the processes used to define, store and manipulate the data.
Different models are used to provide efficient means of storage retrieval and manipulation of data.
Major GIS software developers include ESRI, Intergraph, AutoDesk, Open Source etc. 3) Data:
Data can be said to be the core of GIS and is possibly the most important component of a GIS. GIS
data is combination of graphic and tabular data (Attribute data). A GIS will integrate spatial data
with other data resources and can even use a DBMS, used by most organizations to organize and
maintain their data, to manage spatial data. Graphic data can be vector or raster. Both type of data
can either be created in house using GIS software, purchased or obtained freely. 4) People: GIS
technology is of limited value without the people who manage the system and develop plans for
applying it to real world problems. GIS users range from technical specialists who design and
maintain the system to those who use it to help them perform their everyday work. People are
involved in all phases of development of a GIS system and in collecting data. They include
cartographers and surveyors who create the maps and survey the land and the geographical
features. They also include system users who collect the data, upload the data to system,
manipulate the system and analyze the results. 5) Methods: These are the algorithms that work
inside a GIS that enables the end user to perform GIS functions. GIS functionality includes
overlaying, spatial analysis, route finding etc. Methods are step by step processes that work in the
background as the user conducts GIS operations. 6) Network: network refers to both the computer,
and social network. Both of these networks assist in the dissemination of data. Where the
dissemination of data is through transferring of data sets or collaboration, sharing the data from a
GIS is a very common and useful operation. Additionally, these networks allow for the display of
information in the form of web maps, web applications, or even paper maps using our social
network. Network component integrates all other components of GIS.
2.3.2 Categories of GIS Software
GIS software can be categorized as being Commercial or Open Source. Commercial source
requires for license for software use. On the other hand, use of open source software does not
require a license.
12
2.3.2.1 Commercial GIS
Commercial GIS, also called Proprietary GIS, is a GIS software that is developed for sale to the
end users. These types of GIS software require that a license is bought from a vendor before use.
Examples of commercial GIS software include Esri’s ArcGIS, Intergraph, Autodesk, MapInfo,
Map Maker etc. These offer a large variety of tools and functions available for use to the end user.
However, these tools are not customizable by the user and cannot be modified. But some
commercial software like ArcGIS for example provide a programming console for the user to
manipulate data in certain ways.
2.3.2.2 Open Source GIS
Open Source GIS software is a GIS software that uses an open development process and licensed
to include source code. These can be accessed freely, shared and modify the initial source code of
the software. They are also known as Free Open Source Software (FOSS) GIS software and hence
available to GIS end user for free. just like the commercial GIS software, FOSS GIS software
provides a large variety of tools and the programming console but they are customizable. The
development of plugins by various GIS programmers as offered the end user with a wide variety
of tools available for use. One can develop their own plugin and can be shared with anyone.
Examples of FOSS GIS software includes QGIS, GRASS-GIS, SAGA-GIS, ILWIS, OpenJump,
uDig etc.
2.4 GIS Architecture
2.4.1 DesktopGIS
According to (Esri, 2019) Desktop GIS is a mapping software that is installed onto and runs on a
personal computer and allows users to display, query, update, and analyze data about geographic
locations and the information linked to those locations. Desktop GIS is a the most widely used
type of GIS. Desktop GIS allows users to perform GIS functions such as data entry, storage, spatial
analysis, data manipulation and mapping etc. on the desktop computer. In addition to the
mentioned functionalities, Desktop GIS has the capabilities of connecting to web map services.
All what is required is that its connected to the internet. Desktop GIS can either be commercial for
example ArcGIS or FOSS, for example QGIS. Therefore, it has been used to provide solutions
for land surveying, agriculture, utilities telecommunications, transportation, wildlife,
13
environmental management and many other industries. Desktop GIS represents the real world on
a computer similar to the way maps represent the world on paper. However, desktop GIS has power
and flexibility that paper maps lack. The scale of the map influences the size of what appears on
it. With GIS, however, you can store and link huge amounts of information about the objects
represented on maps. These objects are called features. Each map feature has a location, a
representative shape, and a symbol that represents one or more of its characteristics. Because
features on maps are organized according to relative location or position, maps are good for
showing the relationships among feature locations.
2.4.2 WebGIS
The web GIS development process faces new challenges such as technology innovations,
voluminous data transfer rates and non–specialist users (Alesheikh, et al., 2002). Several
developments have taken place in the road to modern day web based GIS systems (Mushonga, et
al., 2017). WebGIS is any GIS that uses Web technologies. The simplest form of webGIS should
have at least a server and a client, where the server is a Web application server, and the client is a
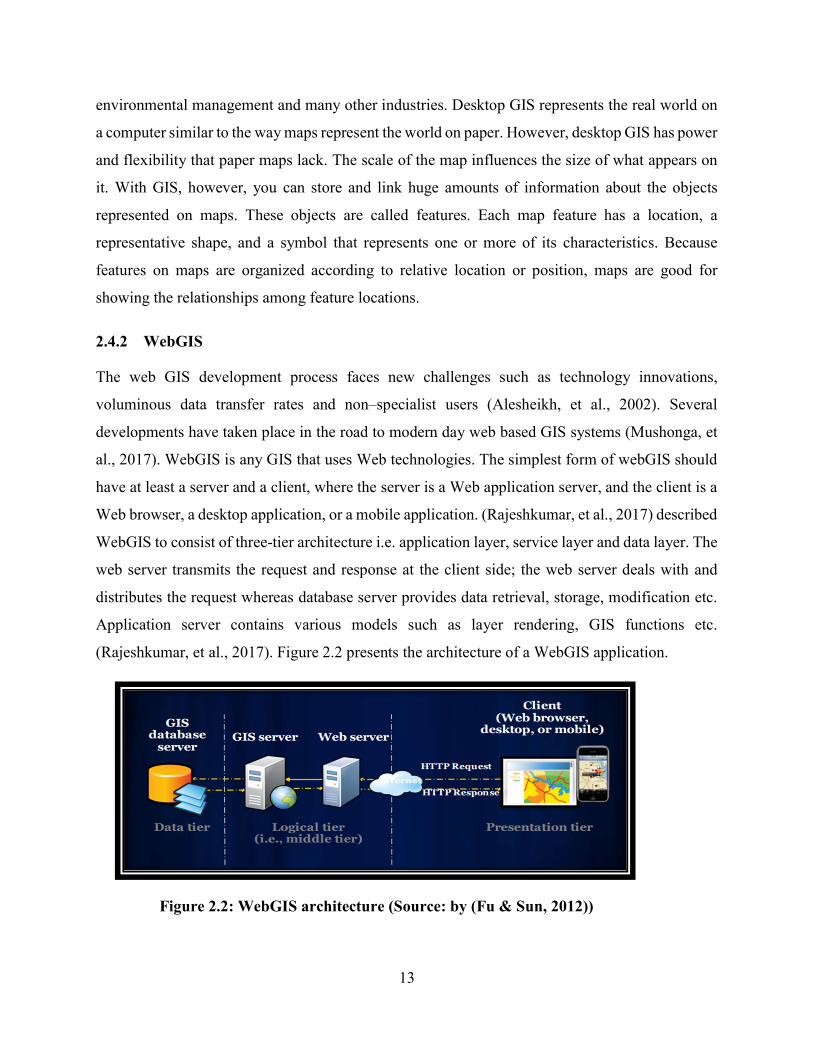
Web browser, a desktop application, or a mobile application. (Rajeshkumar, et al., 2017) described
WebGIS to consist of three-tier architecture i.e. application layer, service layer and data layer. The
web server transmits the request and response at the client side; the web server deals with and
distributes the request whereas database server provides data retrieval, storage, modification etc.
Application server contains various models such as layer rendering, GIS functions etc.
(Rajeshkumar, et al., 2017). Figure 2.2 presents the architecture of a WebGIS application.
Figure 2.2: WebGIS architecture (Source: by (Fu & Sun, 2012))

14
The application layer also called Presentation tier is the layer of user interaction. Its focus is on
efficient user interface design and accessibility. As system is prototyped on the Internet so users
are allowed to access the system by using a web browser, desktop or mobile phone. These are
known as the clients. The client makes the sends and receives requests to/from the server via the
internet. The Service layer or Logic Tier consists of the server. The server consists of two
components i.e. Web Server and Web Map Server. Web server interacts with the client through a
web browser. It delivers web pages to the client and to an application by using the web browser
and HTTP protocols respectively. Web Map Server provides set of tools for building spatially
enabled web mapping applications and web services. It makes it possible to access and display
spatially enabled content of the spatial database and enable querying and analysis of the displayed
data. The third component is the data layer. It is part of the server. It consists of the database were
the shapefiles, imagery, documents and maps are stored. Not only does the database provide
storage capabilities but also data retrieval, update and modification functions. Moreover, the
database must be capable of storing both spatial (geographical information) and non-spatial data
(tabular data) and hence called a spatial database. The Web Server to queries the spatial database
based on the instruction requested from the client.
2.4.3 Mobile GIS
Mobile-GIS is a Geographical Information System based on mobile computing and mobile Internet
(Kumar & Mutreja, 2013). The use of mobile communication devices in field data collection is
increasing due to the emergence of embedded Global Position Systems (GPS) and Wi-Fi Internet
access (Lwin & Murayama, 2011). The implementation of Real-time field survey using Android-
based interface of mobile GIS network. Real-time field survey and ground truth was made readily
available for GIS researchers back in an office while a survey team was reporting from the field
via a mobile network (Jeefoo, 2015).
The technology used by mobile GIS applications is well developed and defined to be consistent
with the GIS-technology development. This GIS engine, which uses a powerful, centralized server,
performs the data-management role. It provides the basic software development for spatial analysis
in addition to query-based procedures. This type of GIS engine feeds the processed data into the
enterprise network for those who access the network on an on-demand basis. Being able to access
the same database over the same corporate network on demand when needed is a big advantage.
15
This connection is a physical connection, either directly through an enterprise node or through the
Internet. The entire enterprise can also use the Internet for the distribution of data throughout the
enterprise as well as between different enterprises. The current state-of-the-art presents mobile
devices with average computing power that allow it to operate its installed applications (Abdalla,
2016).
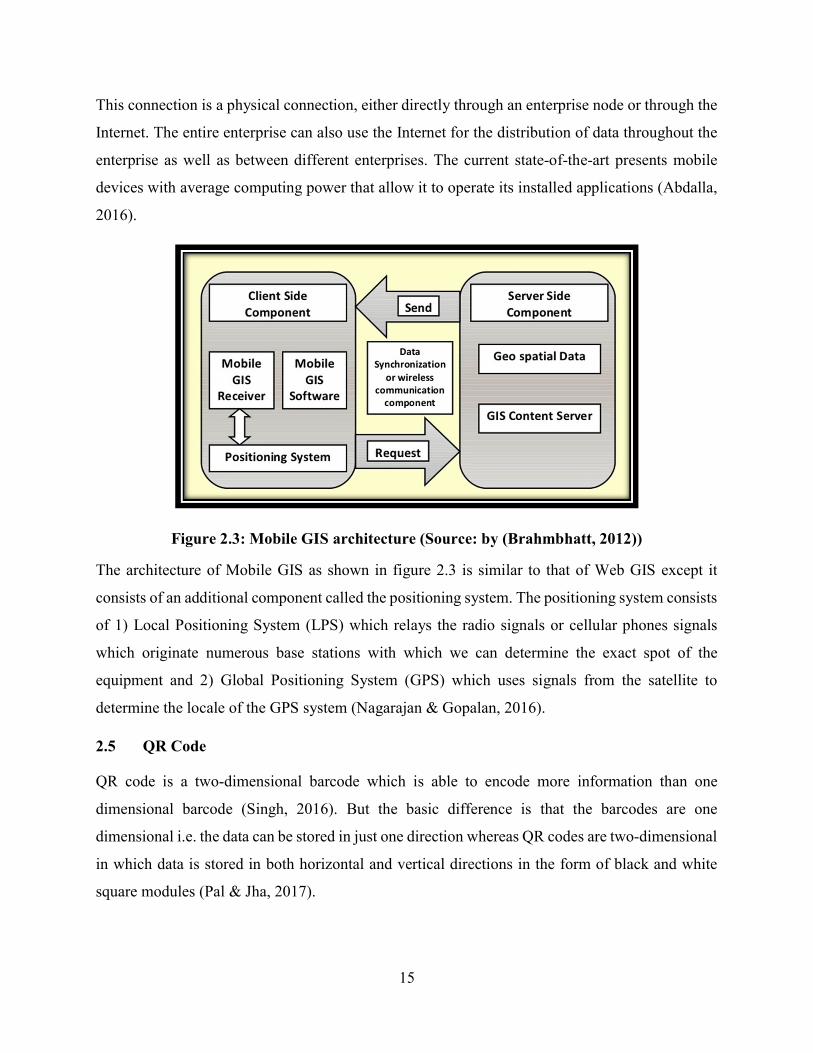
Figure 2.3: Mobile GIS architecture (Source: by (Brahmbhatt, 2012))
The architecture of Mobile GIS as shown in figure 2.3 is similar to that of Web GIS except it
consists of an additional component called the positioning system. The positioning system consists
of 1) Local Positioning System (LPS) which relays the radio signals or cellular phones signals
which originate numerous base stations with which we can determine the exact spot of the
equipment and 2) Global Positioning System (GPS) which uses signals from the satellite to
determine the locale of the GPS system (Nagarajan & Gopalan, 2016).
2.5 QR Code
QR code is a two-dimensional barcode which is able to encode more information than one
dimensional barcode (Singh, 2016). But the basic difference is that the barcodes are one
dimensional i.e. the data can be stored in just one direction whereas QR codes are two-dimensional
in which data is stored in both horizontal and vertical directions in the form of black and white
square modules (Pal & Jha, 2017).

16
QR code can encrypt byte, binary, numeric, alphanumeric and kanji (a series of Japanese
characters) unlike one dimensional barcodes (Bagherinia & Manduchi, 2011). The use of QR codes
have become very common and have been used in various number of ways. QR codes are useful
due to the fact that they can store large amount of text data as compared to the traditional barcodes.
QR code has many advantages as it can encode relatively larger amount of marker information in
an easy and standard way, also it has the capability of error correction. In Japan, it contributed
greatly for the management of automative industry to work efficiently in a wide range of tasks
from production to shipping to the issuing of transaction slip (Bhargava, et al., 2015). Due to its
uniqueness and effectiveness, these codes have become popular worldwide extending themselves
to fulfil the large amounts of data, user wants to store with much of safety and resistance capability
to damage and dirt (Schulz, 2013) (Jackson, 2011).
2.6 Location Based Services
Location Based Services (LBS) refers to a broad range of services that are based on (or enhanced
by) information about the physical location of a user and/or device. It becomes a popular and
important way to provide real-time information and guidance (Babu, et al., 2016). According to
(Yun, et al., 2013) popularization of smartphones has led to greater use of various location-based
services. With the growth in the popularity of smartphones, more attention is being paid to the
LBS industry (Ryu, 2010).
LBS offer many advantages to the mobile users to retrieve the information about their current
location and process that data to get more useful information near to their location. To make LBS
work, different system components are needed, i.e., mobile devices, positioning, communication
networks, and service and content provider. Mobile device: A client for the user to request and
receive the needed information according to his/her location in mobile environments; The
positioning component determines the current location of the user; The communication network
(for example cellular network or WiFi network) transfers the data and service request of the user
from his/her mobile device to the service and content provider, and sends the requested information
back to the user’s device; The service and content provider processes the user’s requests, and
returns the needed information (Huang & Gao, 2018).

17
2.7 Shortest Path Algorithms
2.7.1 Dijkistra algorithm
Dijkstra's algorithm (named after its discover, E.W. Dijkstra) solves the problem of finding the
shortest path from a point in a graph (the source) to a destination. The algorithm finds the shortest
path between two specific nodes as well as the shortest path between a node and all other nodes in
the graph (Amiri & Mansourian, 2012). Dijkstra‘s Algorithm solves the single-source shortest path
problem for a graph with nonnegative edge path costs, producing a shortest path tree. This
algorithm is often used in routing and other network related protocols (Alam & Faraq, 2019).
2.7.2 Floyd algorithm
Floyd-Warshall's algorithm is one of the variants of dynamic programming, a method that solves
problems by looking at the solution to be obtained as an interrelated decision. This means that
solutions are formed from solutions that come from the previous stage and there is the possibility
of more than one solution (Novandi, 2013).
The purpose of this Floyd algorithm is to find the shortest paths in a weighted graph with positive
or negative edge weights. The purpose of this Floyd algorithm is to find the shortest paths in a
weighted graph with positive or negative edge weights. A single execution of the algorithm will
find the lengths (summed weights) of the shortest paths between all pairs of vertices, though it
does not return details of the paths themselves. This algorithm can algorithm will find the lengths
(summed weights) of the shortest paths between all pairs of vertices, though it does not return
details of the paths themselves (Sangaiah, et al., 2014).
2.7.3 A-Star Algorithm
This algorithm was first described in 1968 by Peter Hart, Nils Nilsson and Bertram Raphael. The
whole area is divided into grids. Now the search area is a simple two-dimensional array. Each item
in the array is a rectangle and is recorded as either walkable or unwalkable. The process of finding
the path is essentially finding out which squares/rectangles must be traversed trough so as to reach
the destination. square/rectangle from the initial one. Once the rectangles have been identifying,
the rover needs to move from the centre of one rectangle (called “node”) to that of the next, until
the destination is reached. The path is found by starting at the initial point, checking the adjacent
18
squares, and generally searching outward until we find our target. Look at all the reachable or
walkable squares adjacent to the starting point, ignoring squares with walls, water, or other illegal
terrain (which are basically obstacle) (Gopikrishnan, et al., 2017). The A-Star algorithms can,
during searching, judge the movement of target point by referring heuristic information, it does
not need to thumb through the map, so that the calculating complexity is relative simple, and
effective fast searching can be achieved (Liu & Gong, 2011).
2.8 Related Works
(Bajaj & Adhave, 2016) looked towards improving the management and maintenance of
underground electricity network infrastructure that was previously using data on papers,
spreadsheets tabular format, maps, etc. they discovered that this type of data was insufficient to
locate the exact positions, maintain and update the data. The aim of the study was to address these
issues, they suggested using GIS technology. The methodology used involved database
development, map creation and publishing. GPS technology on a smart phone was used to obtain
coordinates of the electrical components. A web-based GIS prototype was developed using QGIS.
It consisted of a geodatabase to store all the mapped data. Maps were able to be displayed using
the web browser.
(Sharma, et al., 2013) developed an electricity utility network using GIS to overcome the challenge
of inefficient electricity supply, thefts and fault management in Uttar Pradesh, India. A network
map of high tension, low tension, pole, transformer etc were digitized into individual layers in
ArcMap software. The Electric GIS (EGIS) application was able to show information about power
distribution centers, sub stations, pole lines located in an area etc. the EGIS also helped in
providing better service delivery to consumers, producing improved customer complaints reports
and stop power thefts.
(Crawford, et al., 2012) described the design and implementation of a GIS for the City of Calhoun
was established in order to efficiently manage their utility distribution systems and replace the
existing CAD system. The CAD system was not spatially referenced. To overcome this problem a
GIS system was built using ArcGIS Server Enterprise Advance. The utility system comprised of
3 layers; water, sewer and electric layer. The electric layer helped the crews quickly identify the

19
location of outages and the Electric Utility locate requests were being done mostly in the office
using GIS instead of in the field. However, the GIS system was based on ArcMap software which
is a commercial software and expensive. This proposed research will use open source applications
such as GeoServer and PostreSQL to build an electric GIS system similar to that of (Crawford, et
al., 2012).
(Okello, et al., 2017) conducted a study at the Copperbelt University. The aim of the study was to
develop a WebGIS for effectively and efficiently managing the water utilities at the Copperbelt
University using PostgreSQL/PostGIS, QGIS and GeoServer. This was to address the University’s
dependancy on paper-based water utility maps which had not been updated in a long time. The
framework for the WebGIS was structured to provide a centralized system with web-based access
to accurate and updated information on utility spatial information throughout the University. The
results of the study showed successful integration of PostgreSQL/PostGIS database with QGIS for
desktop mapping and GeoServer for web mapping. The web application has several tools like
query, zoom, view, search and identify, that provide an interactive interface to the spatial data
without location restrictions. These tools provided both visualization and analytical functions that
create patterns and relationships from diverse data sources. WebGIS application development
platform used PostgreSQL, PostGIS, Geoserver, OpenLayers and Apache server for building
WebGIS applications across web browsers, desktops, and mobile devices.
( Khawash, et al., 2015) used the GIS approach to map the electrical distribution network of
Phuentsholing town. The methodology used in this study involved for steps. Step 1 data
acquisition involved collection of existing maps of distribution network, base map, and diagrams.
A handheld GPS was used to collect the positions the distribution transformer, poles and consumer
cables as well as a base map consisting of buildings and roads was obtained. Attribute data about
the electrical network and consumer details were obtained. In Step 2, digitization involved
georefencing of the base map then all the features of map were digitized with various shapefiles
for buildings, roads, transformers, feeder pillars, mini-feeder pillars and underground distribution
lines. Step 3 a spatial database was designed by creating tables in ArcMap for storing details for
all the mapped features. Attribute data was entered into the respective tables. Step 4 was the use
of a Digital Elevation Model (DEM) to determine the accuracy of the data collected in the field by
the resolution.

20
(Anbazhagan, et al., 2013) carried out a study to map infrastructure facility for Periyar University
campus through GPS, GIS and remote sensing techniques. High resolution remote open source
Google Earth image with 1.65m spatial resolution (dated 26th Jan 2011) was used to map the
various infrastructure facilities inside the University campus. The image was used to digitize
buildings, roads, foot paths and water bodies online and saved as a KML file format. QGIS was
used to convert the KML file into Shapefile format. A GPS was used to capture the position of
utility poles.
(Abdulrahman & AL-Ramadan, 2013) described the possible applications of GIS in electrical
power system, how GIS helps to determine the optimal path for transmission lines, how it helps to
forecast the growth of load and substation location, and how it is easier to manage disasters and
locates fault using GIS. In this study a survey was conducted using a differential GPS to map
electrical consumers and their service connections. The mapped features were then digitized
through GIS mapping, indexing and codification of electrical consumers. This data was entered
into the designed geodatabase. “GIS technology can be used to analyze the selection of suitable
areas for transmission lines implementing optimal routing algorithms based on electrical. This was
achieved using the ArcMap Buffering tool and site suitability criteria to determine the optimal
route of the high-tension line near a populated area to protect the inhabitants from strong electric
and magnetic field effects. To forecast load growth of the geographical area data such as current
land use, transportation infrastructure, mountain slopes and urban centers and then location of new
load additions which expected, are required. GIS maps can be combined with real time line loading
information to identify lines with increased risk of flashovers and faults. Conversely, if the
mapping of voltage, load or generation profiles can be used to visualize the system-wide operating
conditions, such as overloaded components, and help operators locate trouble spots in the grid with
just a look at the screen.” (Abdulrahman & AL-Ramadan, 2013).
(Omogunloye, et al., 2013) proposed direct application of GIS to proffer solutions to
telecommunications masts distribution, the spread and their locations. Analyses of the results
obtained showed the spatial distribution of the masts around Lagos state and Highlights the
different logical paths the GIS can be queried to achieve the required results. The study provided
a Geospatial analysis of Mast Management distribution and Telecommunication Service in Lagos
State. Franson Coordinate Converter, Autodesk 3ds Max 2008, ESRI ArcGIS 9.2 Desktop, Google
21
Earth Plus 5.0, Surfer 8.0 and Autodesk AutoCAD 2006 software to produce the GIS and carry
out manipulation operations. A DEM was created to render a 3D model from the contours
generated from Google Earth software.
(Persai & Katiyar, 2015) analysed the use of GIS technology to facilitate planning and
management of the telecom utility in Bhopal city, India. Techniques such as marking radiation
affected zones, coverage area calculation and identification of alternate routes in case of faults
were analysed using a digital map. Base map and land use cover maps were prepared using Google
Earth images. Coverage analysis, mast density analysis, radiation zoning area and calculation of
radiation affected areas were conducted using the Spatial Analyst tool embedded in ArcMap
software. GPS was used to provide the location data of telecom tower utilities.
The study by (Rajeshkumar, et al., 2017) presented a conceptual design model of a Geographic
Information System (GIS) for a Web-based utility management system using open source
technologies. The developed WebGIS application contained physical information like campus
boundary, buildings, roads, water supply lines, drainage lines, firefighting lines, pump house,
wells, bore points, recharge wells, power substations, electrical light poles, solar light poles,
nursery area and trees. The WebGIS management system was used to visualize and maintain utility
assets in terms of database and operations, thus it has the potential to manage the scattered data
into a single platform. The WebGIS system was developed using various open source software
and libraries, which were directly involved in web application, while many other desktop GIS
applications were used in preprocessing of spatial database is a database server for storage and
transaction management. In the developed application, the open source database PostgreSQL with
PostGIS extension could support spatial features very well. GeoServer formed a core component
of the Geospatial Web. The interactive web user interface was designed using the ExtJS and the
GeoExt frameworks with the OpenLayers libraries which were used as a main map client. Finally,
a dynamic Styled Layer Descriptor (SLD), generated with an open source software script is
incorporated for creating Interactive and user-oriented maps were created using an open source
software script called User-Friendly Desktop Internet GIS (uDig).
(Zerihun, 2017) developed a web based GIS interactive map is to promote and improve tourism
industry of the area. It was produced using free and open source software’s for fast processing,
displaying, sharing, and distribution of tourism information using world wide web. PHP, HTML
22
script language and QGIS2leaflet plugins were used in the development of web GIS portal. The
collected tourist service and tourist attraction data were prepared to feed the data in QGIS software.
ArcMap and QGIS software were both used to process raw GPS data into shapefile data format.
All tourist service and tourist attraction data were processed on a Wamp server using a proper data
base format. The web based GIS was created using FOSS (free and open source software) called
Wamp (Windows/Apache/MYSQL/PHP) server. Wamp server contains MYSQL as database
server, PHP as application server, apache as web server, and finally operating system for delivering
tabular information for tourism development in easy and readable way for internet users. Code
Lobster was used as the integrated development environment primarily (IDE) for coding in PHP,
HTML, CSS and Java script programming languages develop the webGIS application.
In India, (Tyagi, 2014) created a web GIS based database for the tourism industry of Eastern Uttar
Pradesh. Open source Map Guide (Autodesk), a web based platform has been used to customize
and display GIS layers (prepared using Arc GIS 9.2) on web. GPS technology has also been used
for the generation of the spatial data. Information about tourist destinations, excursion points
around these destinations, available infrastructure had been collected through primary survey using
a GPS. Historical background of destinations, fair and festivals, tourist statistics and existing.
Spatial and non-spatial database has been created using Arc-GIS 9.2. The GIS based database was
made web enabled using open source GIS from Autodesk-Map Guide. Text (in HTML),
photographs, video clippings with commentary (for virtual sightseeing) of the destinations as well
as excursions and infrastructure details were linked with the point data plotted on the tourist maps
of Eastern U.P. and tourist centres located in the region.
(Singh , et al., 2012) This paper conveyed an efficient approach to customize and integrate an open
source web GIS system based on Mapserver as a web GIS server and PostgreSQL/PostGIS as an
object oriented relational database management system (ORDBMS) for effective dissemination,
sharing and management of spatial information over the internet. An open source web application
tool built on top of MapScript using the PHP programming language was used as for development
of interactive user interface. The configurable Web Mapping Client Components (CWC2) tags
were added to HTML template pages in order to deploy the mapping contents to a web application.
Singh P.S. et al., (2012) observed that “the present system developed using open source software
enables user to view, update, customized retrieval, query and analysis of natural resources

23
information for specific needs. The adopted approach and its implementation using PostgreSQL,
PostGIS, PHP, Apache and UMN MapServer to develop a Web Based GIS application provide
public users data sharing and mapping services. It shares the information and geospatial datasets
allowing users with limited GIS knowledge to access the information customized for specific
applications that will reduce operation costs management and assists people in their decision-
making process.”
(De Filippis , et al., 2010) developed a WebGIS application to support researches of Consorzio
Tuscania Project on precision viticulture in Tuscany. The aim was to assess the impact of different
vineyard canopy management techniques on grape quality. The other goal was to build a Web
service to support operational applications for agronomic treatments and grape harvest and to
provide digital images for mobile devices that can be also integrated on agricultural machineries.
A geoportal was also developed to organize geospatial data and services through a viewer, a
catalogue containing metadata records and a geodatabase where all data and results were stored.
The user interface was designed using open source tools in order to guarantee the web application
sustainability and the implementation of customized geospatial functions required by the project
stakeholders. MapServer was used with PHP/Ajax technologies to develop all components of Web
mapping application and PostgreSQL was used as data warehouse for geodata and alphanumeric
data management.
(Bandibas & Takarada, 2019) designed a mobile application and a web-based geographic
information system for an efficient and cost-effective sharing of geological hazards information in
East and Southeast Asia. Free and Open Source Software (FOSS) was also used for other important
spatial data processing and sharing operations. The mobile application was developed to access
and share the system’s geospatial contents by sending requests via web services. The mobile
application provided an interface for the users to easily access geological hazard information such
as active fault, active volcanoes, shorelines inundated by tsunamis, and historical and real time
seismic events.
(Lwin & Murayama, 2011) developed a personal field data collection software called Ultra Mobile
Field GIS (UM-Field GIS), to collect field data using either Google Maps or a pre-installed map
which allows users to create, edit and modify the survey items and attach multimedia information.
The overall system was built on Microsoft ASP.NET with an AJAX Extension and VDS

24
Technologies (Web Mapping Components for ASP.NET). Lwin K. & Murayama Y. (2011)
suggested that “AJAX, web applications can asynchronously retrieve data from the server in the
background without interfering with the display and behavior of the existing page. The use of
AJAX techniques has led to an increase in interactive and dynamic interfaces on web pages”.
(Wu, et al., 2016) designed a mobile application called Tigermap to make the campus map process
much easier and user-friendly for students and visitors to use. The mobile application created a
digital or electronic campus map for the students and guests at Tuskegee University. Some of the
features of the mobile applications are to locate and describe the buildings on the campus. The
main software used to develop this mobile application was the Android SDK with Eclipse the
Android SDK is a software development kit used to develop the applications for the Android
platform.
(Pispidikis & Dimopoulou, 2015) analysed technologies for the architecture of the WebGIS
systems, to investigate the possibilities and to develop the appropriate free technologies, so as to
design and implement a spatial content management system for the web. The development of the
application was based on ExtJS framework and therefore the basic language of implementation is
the JavaScript. PostgreSQL/PostGIS was used as database, while to get data from it, the server-
side programming language PHP was used. For the publication of spatial data on the Internet the
Web-mapping server GeoServer has been used, while their web cartographic representation was
through the OpenLayers. Finally, the Apache HTTP server was used as server. In the second stage,
the web application of the system’s implementation was created. The user fills up tabs with data
relating to personal information and data concerning the connection to the spatial database. Then,
by using this information and the “sql” file, the appropriate tables are created in the database; at
the same time, a “php” file that contains the login information to the database is also created. In
addition, implemented installation of GeoServer with the following plugin: geoserver-xx-
SNAPSHOT-printing-plugin, in order to be able to print data in pdf. In the third stage, the interface
was created both for the spatial content management system and the web application for the online
users’ requests. The first application was created in a way to be connected with both the database
implemented in the preceding step and the GeoServer.
(Behncke & Ehlers, 2012) designed and developed a gastronomic web portal application for the
city of Osnabrück (Germany). It was named “OsnaGo” and was based on PHP, JavaScript/ AJAX,
25
HTML, CSS, SQL (PostgreSQL) components. The portal integrates also an extensive list of
WebMapping applications for desktop PCs which were based on MapFish, MapServer,
PostgreSQL, PostGIS, and pgRouting. The mobile WebMapping solution had GIS functions such
as navigation, zooming, activation and deactivation of layers, filtering objects and routing.
(Bhatia, et al., 2018) created a web GIS application using open source tools. The web GIS had
basic functionalities like pan, zoom, home, info window, measure, legend button, geo-location,
search bar, layer selection, mini map, attribution, mouse position etc. Leaflet Javascript Library to
create the GUI (Graphical User Interface). Bhatia T. S. et al., (2018) proposed a simple, easy to
use and a fast process to create a web GIS.
(Liao, et al., 2016) created a mobile based GIS application to monitor protected forest areas in
real-time. Environmental parameters were monitored via a Wireless Sensor Network (WSN)
which was designed using iOS mobile development platform and ArcGIS related software. The
developed MobileGIS application was capable of capturing the user’s location via GPS
functionality and display with GIS to allow the user to modify the data obtained in by the sensor.
The system sensor layer collected the forest eco-environmental parameters by using GPS,
temperature, humidity, wind speed and wind direction sensors in real time.
In a study conducted in Zambia, (Neene & Kabemba, 2017) presented the development of the
mobile GIS property mapping application. Affordable open source development software tools
and mobile cloud computing mapping services were used in the development and implementation
of the mobile mapping application. The mobile application system requirements for the study were
formulated from the survey that was conducted at Kafue local authority. The survey used
questionnaires and interviews to inform the design of the mobile mapping application. Trial
mapping area was mapped by using the embedded GPS unit of the mobile phone and
OpenStreetMap mapping tools to include roads and points of interest. The developed mobile
application was trialed in the Parkview Estates of Kafue local authority. The attribute, spatial and
image data was captured in real time on the ground from residents after consent was obtained to
have their properties mapped. The property data was stored on the laptop computer. Ten properties
were successfully mapped. Spatial data was obtained using a combination of MapBox raster maps
and the Mobile Device's GPS unit in conjunction with OpenStreetMaps vector maps from the
mobile cloud computing services (Neene & Kabemba, 2017).

26
In India, (Singh, et al., 2015) conducted a study using pgRouting. pgRouting which is an extension
to PostgreSQL and PostGIS provided libraries for the Shortest Path through various algorithms
like Dijkstra, and A-Star functions. pgRouting functions are based on costs. Extensive path
analysis was done to give the shortest and alternate path based on different disaster conditions
affecting road networks such as occurrence of sudden floods and single and multiple obstructions
of road segments due to landslides. The pgRouting normal relational schema for routing consisted
of three sets of tables: first, the main road relational table storing the geometrical entity of the road;
second, the road_vertices_pgr table holding the topological architecture of the road; and third, the
spatial_ref_sys relational table that holds information on various projection types of the
geometrical data. The computation of the shortest and alternate route to the target destination is of
prime importance in case of disaster. pgRouting can be effectively used for implementing the real
road scenarios. The approach had the ability to find the shortest path in cases where there are single
or multiple obstructions of road segments. The system also could compute the minimal path for
the source-target pair in case of road affected, resulting to the inundation of a group of adjacent
road segments due to disasters like flash floods and other multi-hazards. It could also dynamically
calculate the path to be traversed when there was increase in areas inundated due to floods. The
results of real simulated flood scenario, if available, could be consumed as an external service to
present system and generate alternate minimal paths for change in inundation areas in different
time intervals (Singh, et al., 2015).
In a paper presented by (Jang, 2010), QR code was used to determine the user’s current location
and collaborating internal Point Of Interest (POI) data to provide indoor navigation information.
A scenario-based approach was presented to develop a mobile Augmented Reality (AR) indoor
navigation system which could be used in defined areas such as museums or exhibition centres.
Two scenarios that use QR codes to give indoor positioning data to navigation systems that have
an AR interface were constructed. The common functions in the two scenarios are the decoding of
QR codes and the ability to provide directions in an AR view. In the first scenario, the list of POIs
is displayed; the QR code is decoded; then the direction information in an AR view is displayed.
In the second scenario, the list of POIs or Categories is displayed; the list of POIs is displayed; the
direction information in an AR view is displayed; then the list of POIs is ordered by distance from
the current user location. In cases where high-accuracy positioning is not required, QR codes could
be the cheapest and easiest positioning method for an indoor navigation system. it was suggested

27
that an AR interface could be a new visualization method for GIS data such as POI locations,
directions, and so on. In addition, an AR navigation system can be efficiently implemented within
defined areas such as university campuses, shopping centres, museums, and so on (Jang, 2010).

28
CHAPTER THREE: METHODOLOGY
3.1 Study Area
The University of Zambia is a public university located in Lusaka approximately 15.39 degrees
south and 28.33 degrees east along Great East Road. It is Zambia's largest learning institution.
UNZA was established in 1965 and officially opened to the public on 12 July 1966. It is the oldest
public university in Zambia.
Table 3.1: Relationship between objectives and tools
No. Objective Research Question Methods/Tools
1. To map the existing
electrical and
telecommunication
cable networks at the
University of
Zambia.
How can we map the
underground electrical and
telecommunication cable
networks at the university of
Zambia?
Use of GPS equipment to get the
coordinate point locations of all
networks.
Use of QGIS software to perform
data clean-up operations.
On-screen digitizing from aerial
photography using Google Earth
satellite imagery.
2. To design a Spatial
Database
Management System
(SDBMS) for
electrical and
telecommunication
cable networks.
To what extent can an
SDBMS be developed
based on web and mobile
technologies to electrical
and telecommunication
cable networks?
System requirements were
obtained from the Resident
Engineer.
PostgreSQL/PostGIS to develop
the spatial database.
QGIS desktop software was
used to develop the desktopGIS
3. To develop an
SDBMS prototype
based on the design
How can a prototype be
developed based on the
SDBMS in (ii)?
Using Leaflet JS library to
design the web based GIS
application.

29
in (ii) using web and
mobile technologies.
Turf JS library to enable spatial
analysis functionalities on the
web based GIS application.
GeoServer was used as the map
server to access the spatial
database via the web.
Table 3.1 shows the relationship between the objectives, research questions and the tools. Each
objective Each tool and/or method helps in answering the research question. This provides a
solution towards achieving the respective objective.
3.2 Research Design
(MacMillan & Schumacher, 2001) define it as a plan for selecting subjects, research sites, and data
collection procedures to answer the research question(s). They further indicate that the goal of a
sound research design is to provide results that are judged to be credible. (Durrheim, 2004),
research design is a strategic framework for action that serves as a bridge between research
questions and the execution, or implementation of the research strategy. (Tobi & Kampen, 2018)
state that the focus in research design must be the production of the knowledge required to achieve
that objective. The methodology of this research study was conducted as indicated in the
methodology flow chart in figure 3.1.

30
Figure 3.1: Methodology Flow Chart
3.3 Data Collection
Both primary and secondary data were collected. Primary data collection involved firstly by
conducting a reconnaissance survey in the field with guidance of the Resident Engineer and the
path of the existing underground electrical and telecommunication network was noted using the
Measurer mobile application.

31
Figure 3.2: Screenshot of mapped underground telecommunication network
Figure 3.2 shows the screenshot of telecommunication joint boxes mapped using the measurer
mobile phone application. The markers indicate the location of each individual
telecommunication network joint box.

32
Figure 3.3: Screenshot of the mapped underground electric network
Figure 3.3 shows the mapping of the underground electric network mapped using the measurer
mobile phone application. Each marker indicates the corner points of the electrical network line.
Precise mapping of underground electrical lines involved using an RTK GPS based on the
imported coordinates obtained from Measurer mobile application. The GPS was used to capture

33
the coordinates of the location of the network lines. Buildings were mapped through on-screen
digitization from Google based.
The Existing CAD drawing and scanned map showing the campus electricity networks were
collected as secondary data. The scanned maps, as shown in figure 3.4, indicated the distribution
of the electrical substations within University of Zambia area. Unfortunately, drawings and maps
for telecommunication networks were nonexistent. While the CAD drawing in figure 3.5 had
shown the distribution and connection of the 11KV electrical network lines in form of a circuit
diagram.
Figure 3.4: Scanned map showing the substations at the University of Zambia (Source: The Resident Engineer’s Office, University of Zambia)
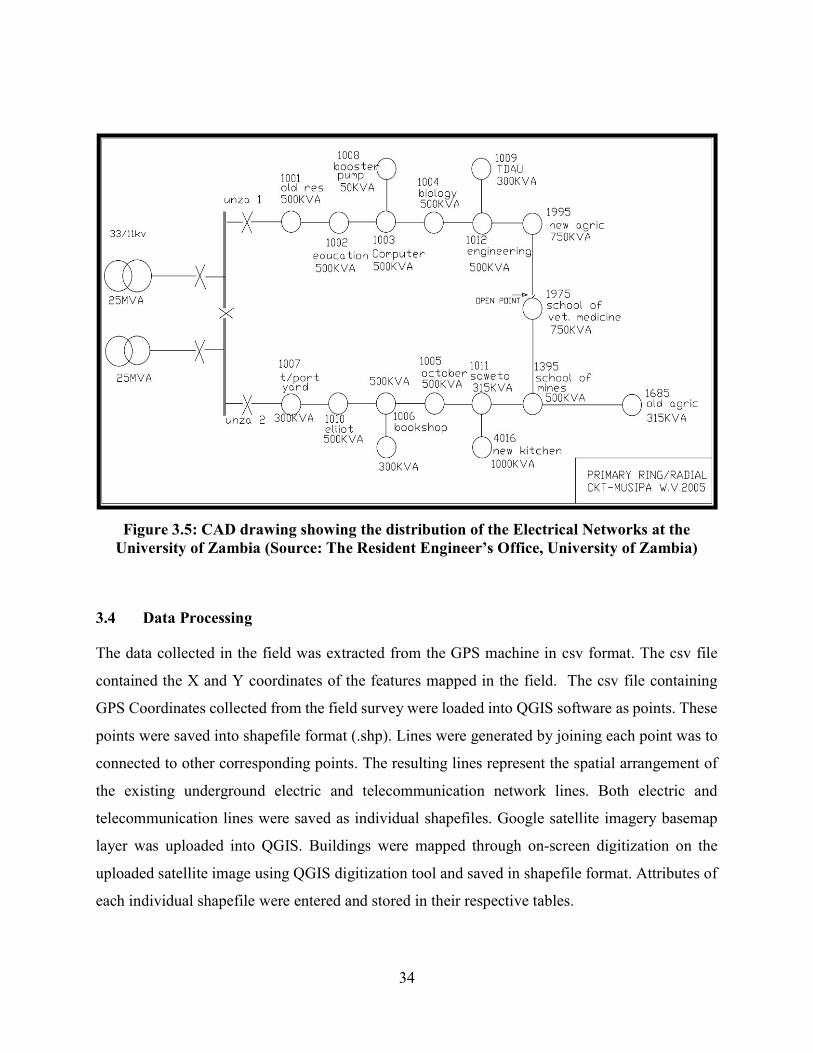
34
Figure 3.5: CAD drawing showing the distribution of the Electrical Networks at the University of Zambia (Source: The Resident Engineer’s Office, University of Zambia)
3.4 Data Processing
The data collected in the field was extracted from the GPS machine in csv format. The csv file
contained the X and Y coordinates of the features mapped in the field. The csv file containing
GPS Coordinates collected from the field survey were loaded into QGIS software as points. These
points were saved into shapefile format (.shp). Lines were generated by joining each point was to
connected to other corresponding points. The resulting lines represent the spatial arrangement of
the existing underground electric and telecommunication network lines. Both electric and
telecommunication lines were saved as individual shapefiles. Google satellite imagery basemap
layer was uploaded into QGIS. Buildings were mapped through on-screen digitization on the
uploaded satellite image using QGIS digitization tool and saved in shapefile format. Attributes of
each individual shapefile were entered and stored in their respective tables.

35
Figure 3.6: GPS points loaded in QGIS software
In Figure 3.6 GPS field data was extracted in csv file format. The csv file was then imported in
QGIS. Point data was categorized as electrical (red) and telecommunication (blue) points. Figure
3 demonstrates the digitization of the electrical network line. Figure 3.7 and Figure 3.8 illustrate
the digitization process of the electrical and telecommunication network lines. Using the QGIS
line digitization tool lines were drawn by connecting points. Figure 3.9 demonstrates the
digitization of UNZA building using the Polygon digitization tool in QGIS. A polygon was drawn
by clicking on the corner points of each building.
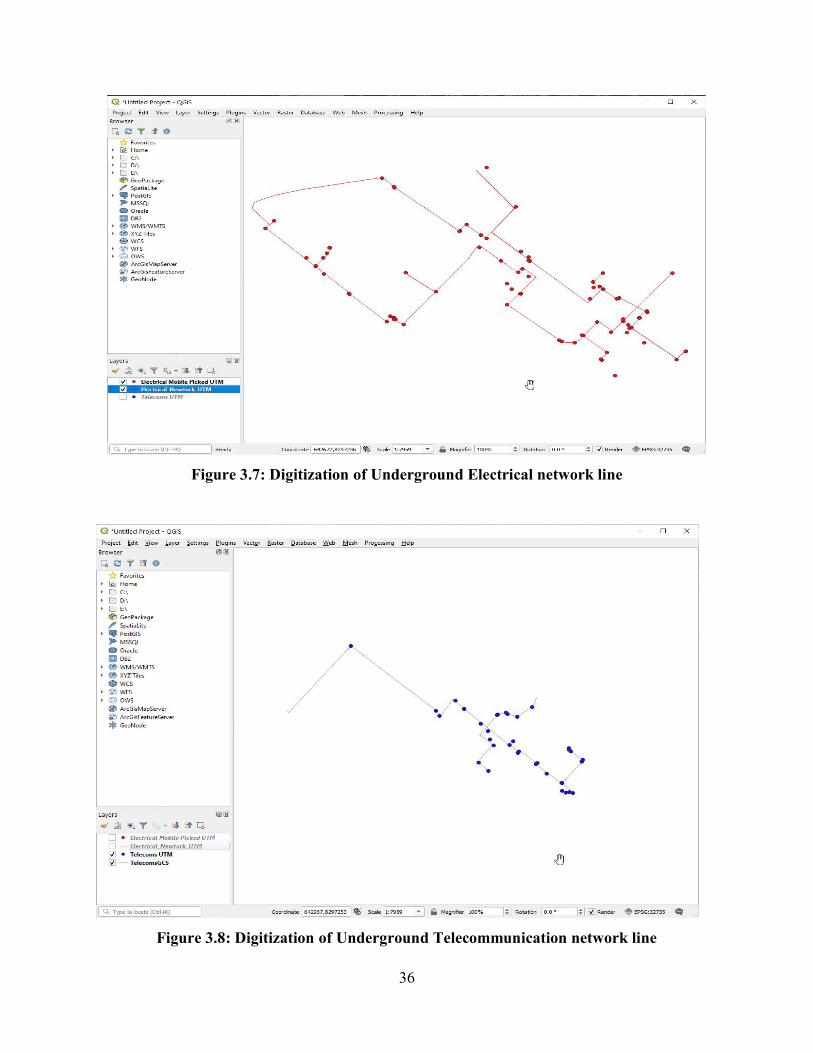
36
Figure 3.7: Digitization of Underground Electrical network line
Figure 3.8: Digitization of Underground Telecommunication network line
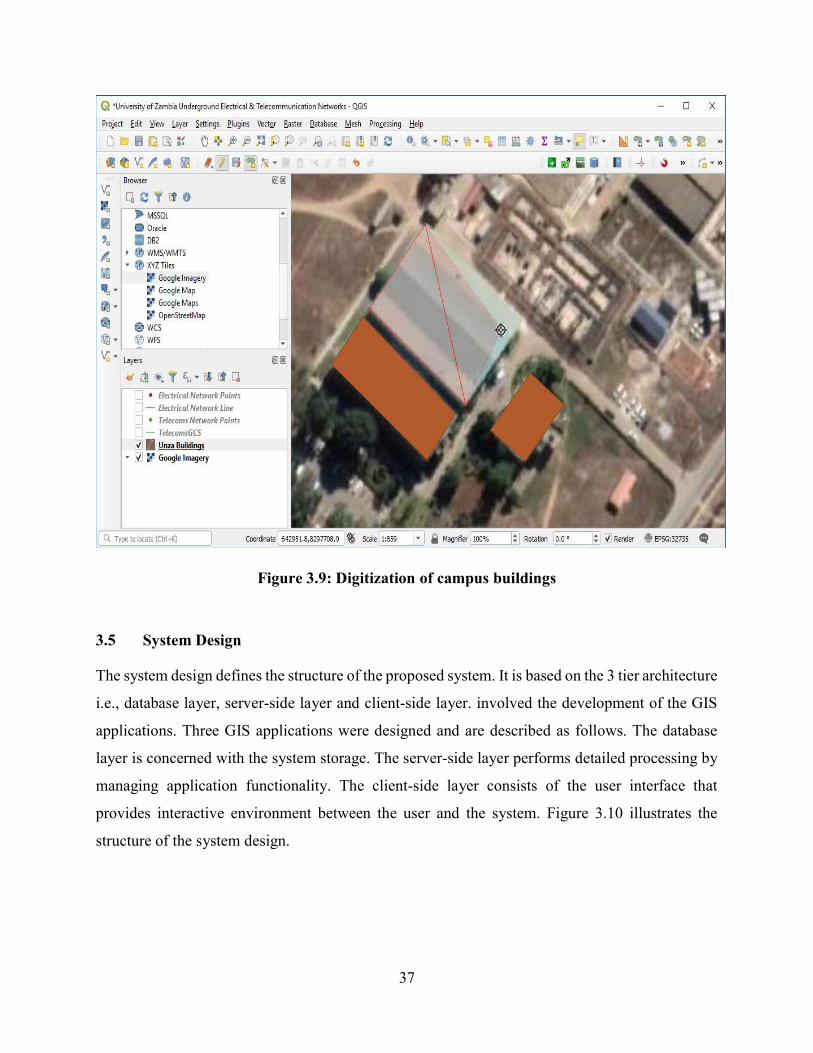
37
Figure 3.9: Digitization of campus buildings
3.5 System Design
The system design defines the structure of the proposed system. It is based on the 3 tier architecture
i.e., database layer, server-side layer and client-side layer. involved the development of the GIS
applications. Three GIS applications were designed and are described as follows. The database
layer is concerned with the system storage. The server-side layer performs detailed processing by
managing application functionality. The client-side layer consists of the user interface that
provides interactive environment between the user and the system. Figure 3.10 illustrates the
structure of the system design.

38
Figure 3.10: System Design Flow diagram

39
3.5.1 Database Layer
The database layer deals with the proposed system's data storage. It includes the data storage
system and the layer of data access. It houses database servers that store and retrieve information.
Data is kept separate from application servers or business logic in this tier. The function of the
database layer is to store information. The database stores both non spatial and spatial data.
The database was designed using PostgreSQL. PostgreSQL is a general purpose and an advanced
open source object-relational database management system. PostgreSQL supports geographic
objects so it can be used as a geospatial data store for location-based services and geographic
information systems (PostgreSQL, 2019). PostgreSQL offers many features that help developers
to build applications and help administrators to build fault-tolerant environment by protecting data
integrity. It therefore allows the addition of custom functions developed using different
programming languages. Because of these functions PostgresSQL will be used to manage the
spatial database. PostgreSQL is a general purpose and object-relational database management
system. the most advanced open source database system. It is compatible with various platforms
using all major languages and middleware and supports for multi-version concurrency control.
PostgreSQL version 9.5.3 was used in this study.
PostGIS is a spatial database extender for PostgreSQL object-relational database. It adds support
for geographic objects allowing location queries to be run in SQL. It is open source. PostGIS will
be used to increase management capabilities of PostgreSQL by adding geospatial types and
functions to enhance spatial data (PostGIS, 2019). It is used to store and query both the spatial and
non-spatial attributes of data.
3.5.1.1 Relational Database
Non spatial data, also known as attribute data, is managed by a relational database. The database
consists of a collection of tables to store the attribute data. The relational database is based on
PostgreSQL which handles attribute data and contains the user’s login information. The Entity-
Relation Diagram (ERD) in figure 3.11 shows the relationship between the attribute tables.

40
Figure 3.11: ERD for login information tables
Content Management system information is stored in 4 attribute tables namely users, pages, groups
and user_group_link tables as shown in fig 3.11. The users table stores the user’s details such as
the userID, firstname, lastname, username, password etc. The users table stores a user’s login
information. The groups table stores the records of the group i.e., Admin, Guest and Stuff. These
groups restrict user interaction with the web based system. The user depending on the group, can
view a particular page. Admin Handle the administration of users, groups and pages for this web
site. Each user is assigned to a group after successfully registering and this information is stored
in the groups table. This table provides the groupID, group name and description. The pages table
contains the records of pages that enable administrator functionality. It stores the pageID, page
name, URL (Uniform Resource Locator) and the groupID. The administrator manages the content
management system as by adding groups, assign users and pages to groups, edit and delete users,

41
groups and pages. The users_group_link table provides the link the user and the respective group
the user belongs to.
3.5.1.2 Spatial database Creation
The spatial database was created by adding PostGIS extension to the PostgreSQL based database.
PostGIS extension enables the relational database to handle spatial data as well. Spatial data is the
geographical data that is stored in the database. Thus PostGIS allows for storage of the mapped
data in shapefile format. Security parameters were defined to grant administrator privileges.
Therefore, access to this spatial database required the administrator to enter their login details. The
substation points, joint boxes, buildings, electrical and telecommunication shapefiles were
imported and stored in the spatial database. Each shapefile is has a table that stores the geometry
of the mapped data accompanied by attribute data.
Figure 3.12: Creation of PostgreSQL/PostGIS spatial database

42
Figure 3.13: Importing of shapefiles into PostgreSQL/PostGIS spatial database
Figure 3.12 shows the spatial database creation process using PostgreSQL extended by PostGIS.
The name and security parameters were defined. PostGIS Shapefile Import/Export manager was
used to import the digitized shapefiles into the spatial database as shown in Figure 3.13.
3.5.2 Server-Side Layer
The Server-side layer is also called the Application Tier, logic tier, business logic or logic tier. The
function of this layer is to perform detailed processing as it controls the functionality of the
application. It is concerned with providing services to the client layer i.e., another computer
program and its user. The client sends requests to the server reads. The server reads the request
and retrieves information from the database. This information is then sent to the client. The server
side layer consists of 2 components, the web server and map server.
3.5.2.1 Web Server
A Web server is a computer program that serves requested HTML pages or files. A web server
first has to store the website's files, namely all HTML documents and their related assets, including
images, CSS stylesheets and JavaScript files. The web server has to always be up and running,
connected to the Internet and have the same IP address. On a web server, the HTTP server
processing and answers incoming requests. On receiving a request, an HTTP server first checks

43
whether the requested URL matches an existing file. The web server sends the file content back to
the browser.
The web server was managed by Apache Tomcat. Apache Tomcat was used to implement Java
Servlets and JavaServer Pages (JSP) to promote an effective Java server environment. Apache is
an HTTP Server, serving HTTP and provides web services. Tomcat is a Servlet and JSP Server
serving Java technologies. Apache is a software that runs on a server. It connects between a server
and the web browsers while delivering files back and forth between them. The server and the client
communicate through the HTTP protocol and Apache is responsible for the smooth and secure
communication between the two machines.
Tomcat runs a Java virtual machine (JVM) and every single HTTP request from a browser to
Tomcat is processed in the Tomcat process in a separate thread. Tomcat acts as a development
server on the desktop when building applications that use Java-based dynamic web technologies
such as JavaServer Pages (JSP). JSP is a server side technology that is used for creating web
application. JSP technology provides a simplified but quick way of creating dynamic web content.
This technology permits the fast development of web-based applications that are server and
platform-independent.
3.5.2.2 Map Server
Map server is responsible for handling map services on the web. A map service is the way that you
make maps available to the web. It makes maps, features, and attribute data available inside many
types of web applications. Feature services enable you to serve features over the Internet and
provide the symbology to use when displaying the features. It allows clients can execute queries
to get features and perform edits that can be applied to the server. A map server supports display
and querying of hundreds of raster, vector, and database formats. It is capable of running on various
operating systems such as Windows, MacOS and Linux. In this study, Geoserver is used as the
map server.
GeoServer is an open source software server written in Java that allows users to share and edit
geospatial data. Designed for interoperability, it publishes data from any major spatial data source
using open standard (Geoserver, 2019). GeoServer is distributed under free and open source
software that is OGC compliant (Okello, et al., 2017). GeoServer can input spatial data in a wide
variety of format and deliver them in a number of open standards-based services. It is a subset of

44
a web server model specially designed to share and publishes the Geographical information over
the internet. It utilizes Web Mapping Service (WMS), Web Feature Service (WFS), Web Coverage
Service (WCS) and many other open protocols for transfer the Geographical information, such as
maps, spatial attributes and Feature data sets. GeoServer can read from many different data
sources, from files on the local disk to databases. It brings together mature and stable open-source
software projects under a consistent and easy-to-use interface allowing users, with little training,
to quickly and easily share data and create interactive maps. GeoServer version 2.15.1 was used
in this study.
3.5.2.3 Web Feature Services
The Web Feature Service (WFS) is a standard created by the Open Geospatial Consortium (OGC)
for creating, modifying and exchanging vector format geographic information on the Internet using
HTTP. The WFS standard defines the framework for providing access to, and supporting
transactions on, discrete geographic features in a manner that is independent of the underlying data
source. Through a combination of discovery, query, locking, and transaction operations, users have
access to the source spatial and attribute data in a manner that allows them to interrogate, style,
edit (create, update, and delete), and download individual features. The transactional capabilities
of WFS also support the development and deployment of collaborative mapping applications
(Geoserver, 2019). The WFS protocol is used to return geographic feature data. It allows users to
create their own maps and applications from the data, to convert data between certain formats, and
be able to do raw geographic manipulations of served data. The WFS eliminates time-consuming
data translation and facilitate reuse of existing geospatial data over the web (Zhang & Li, 2005).
3.5.3 Client-Side Layer
The client-side layer, also known as the presentation tier, is a graphical user interface (GUI) that
communicates with the other two tiers. This tier is concerned with displaying information related
to services available on the web. This tier communicates with other tiers by sending results to the
browser and other tiers in the network. JavaScript makes a request to the server, interprets the
results, and update the current screen. Server data is received in XML format as the response to
the client request. The client side layer consists of the DesktopGIS, WebGIS, MobileGIS,
JavaScript Libraries, and the content management system.

45
3.5.3.1 JavaScript Libraries
Leaflet is a widely used JavaScript library for web mapping and mobile-friendly interactive maps.
Leaflet.js is open source and has a very vibrant and active developer community (Lewin, 2016).
Leaflet is designed with simplicity, performance and usability in mind. It supports most mobile
and desktop platforms. Leaflet allows developers without a GIS background to very easily display
tiled web maps hosted on a public server, with optional tiled overlays. It's software that works on
webpages and makes interactive maps possible. Leaflet requests tiles from servers, displays and
animates them, and supports other overlays. Although the core library is very small by design,
there are numerous plugins available to extend the functionality of web-mapping applications.
Leaflet uses basic HTML, CSS, and JavaScript (specifically, the Leaflet JavaScript library) to
create a series of progressively HTML (HyperText Markup Language) allows us to structure
content for our web page. CSS (Cascading Style Sheets) gives us control of the style and visual
presentation of our web page (Leaflet, 2019). We will use it in the placement and sizing of the map
and to customize some Leaflet elements. JS (JavaScript) gives us the ability to add interactivity to
our web page. Leaflet JS library was used in this research because it is generally simpler and
smaller in terms of storage size.
The leaflet map was connected to Geoserever to access the shapefiles. However, shapefiles are not
compatible with Leaflet and were automatically converted to GeoJSON format via the WFS leaflet
plugin. GeoJSON is a GIS format for representing simple geographical features, along with their
non-spatial attributes. It also uses the JavaScript Object Notation (JSON) format.
Turf.js is a JavaScript library for spatial analysis. It includes traditional spatial operations, helper
functions for creating GeoJSON data, and data classification and statistics tools. Turf can be added
to your website as a client-side plugin, or you can run Turf server-side with Node.js. It helps
analyze, aggregate, and transform data in order to visualize it in new ways and answer advanced
questions about it. Turf is modular as it is a collection of small modules. A lot of functions in Turf
exist within the modules (TurfJS, 2019). Turf is Fast and takes advantage of the newest algorithms
and doesn’t require you to send data to a server.
46
3.5.3.2 Asynchronous JavaScript and XML
Ajax is a client-side script that communicates between a server/database (Teresa, et al., 2018). By
allowing scripts being executed inside the user’s browser to communicate with a remote server, it
enables new forms of interaction for web-pages and applications (Kluge, et al., n.d.). Web
applications are able to asynchronously send and retrieve data from a server through AJAX.
Therefore, AJAX allows web pages to be updated asynchronously by exchanging small amounts
of data with the server behind the scenes. The display of an existing page is not affected during
this process. Thus web pages are updated without the need of reloading them.
By using AJAX technology, the web map page appears more responsive since small packets of
data are exchanged with the server and web pages are not reloaded each time that a user makes an
input change. Ajax enables the web map application to load the shapefiles from Geoserver. Via
WFS, leaflet JS requests the shapefile data from Geoserver and are displayed on the web browser
without the interruption of constant web page reloading. This interaction process happens quickly
with only portions of the page reloading and refreshing. A user can continue to use the application
while the client program requests information from the server in the background.
3.5.3.3 Content Management System
A content management system (CMS) is software that helps to create, manage, and modify content
on a website. without the need for specialized technical knowledge. A content management system
tool helps you build a website without needing to write all the code from scratch. CMS handles all
the basic infrastructure stuff for creating web pages, storage of files and management of user login
system. The main objective of the Login Management System is to manage the details of
Username, Password, Email, Changing Password, Permission and Authorization. It manages all
the information about Username, Groups, Permission and Authorization, Username. The system
is built at an administrative end. Therefore, only the administrator is guaranteed the access. The
purpose of the system is to build an application program to reduce the manual work for managing
the Username, Password, Groups, Email. It tracks all the details about the Email, Changing
Password, Permission and Authorization.
The login management system was designed using PHP programming language and provided the
following functions:

47
Provides the searching facilities based on various factors. Such as Username, Email,
Changing Password, Permission and Authorization.
Manage Groups details for Permission and Authorization details.
Track all the information of Password, Groups, Changing password
Manage password information
Manage username information
Editing, adding and updating of records
The CMS is linked to the database via a PHP connection. PostgreSQL is storage operations of the
login information as they are stored in tables. The login system sends SQL requests to the database
via the web server to retrieve user login information. The query is run in the database to retrieve
the information from the database tables. The response is sent back to the CMS via JSP services
running on the web server.
3.5.3.4 DesktopGIS
The desktop based GIS acts as the central control system on the client side. was designed using
QGIS software. QGIS is a free and open source desktop GIS software that enables the user to
visualize, manage, edit, analyze data, and compose printable maps. QGIS functions as geographic
information system (GIS) software, allowing users to analyze and edit spatial information, in
addition to composing and exporting graphical maps. QGIS supports both raster and vector layers;
vector data is stored as either point, line, or polygon features and raster data stored as images or
coverages. QGIS is interoperable as it supports numerous file formats and databases as well as
web services. QGIS can connect to PostGIS and mySQL databases. Web services, including Web
Map Service and Web Feature Service, are also supported to allow use of data from external
sources. QGIS integrates with other open-source GIS packages, including GRASS GIS, and
GeoServer. QGIS is also customizable as it provides freedom to tailor the application to your
needs, from custom data input forms to personalized user interfaces and workflows. In this study
QGIS version 3.8.1 was used. QGIS toolbar was customized to display the appropriate tools
suitable for the end user. These tools include distance measuring, area calculation, spatial
buffering, zooming and panning capabilities. The QGIS was connected to the spatial database to
access the stored shapefiles. These shapefiles are displayed as layers in QGIS. Three basemaps,
OSM, Google maps and Google satellite imagery, were added in QGIS as tile layers upon which
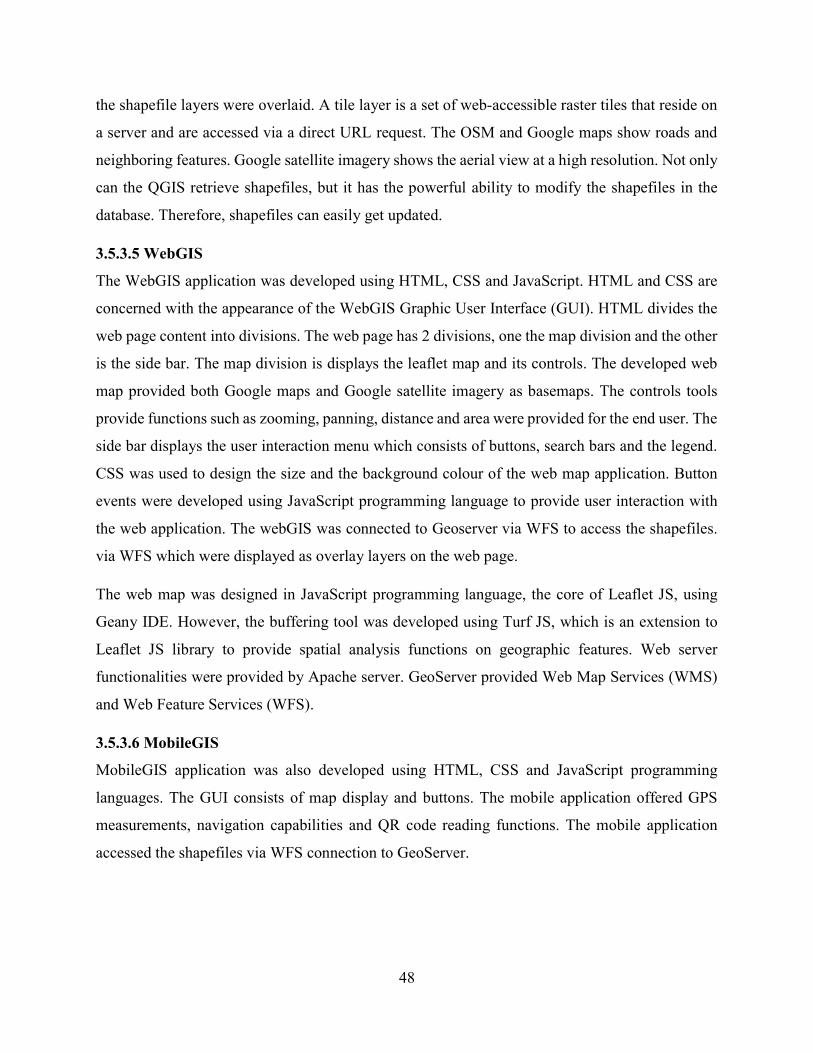
48
the shapefile layers were overlaid. A tile layer is a set of web-accessible raster tiles that reside on
a server and are accessed via a direct URL request. The OSM and Google maps show roads and
neighboring features. Google satellite imagery shows the aerial view at a high resolution. Not only
can the QGIS retrieve shapefiles, but it has the powerful ability to modify the shapefiles in the
database. Therefore, shapefiles can easily get updated.
3.5.3.5 WebGIS
The WebGIS application was developed using HTML, CSS and JavaScript. HTML and CSS are
concerned with the appearance of the WebGIS Graphic User Interface (GUI). HTML divides the
web page content into divisions. The web page has 2 divisions, one the map division and the other
is the side bar. The map division is displays the leaflet map and its controls. The developed web
map provided both Google maps and Google satellite imagery as basemaps. The controls tools
provide functions such as zooming, panning, distance and area were provided for the end user. The
side bar displays the user interaction menu which consists of buttons, search bars and the legend.
CSS was used to design the size and the background colour of the web map application. Button
events were developed using JavaScript programming language to provide user interaction with
the web application. The webGIS was connected to Geoserver via WFS to access the shapefiles.
via WFS which were displayed as overlay layers on the web page.
The web map was designed in JavaScript programming language, the core of Leaflet JS, using
Geany IDE. However, the buffering tool was developed using Turf JS, which is an extension to
Leaflet JS library to provide spatial analysis functions on geographic features. Web server
functionalities were provided by Apache server. GeoServer provided Web Map Services (WMS)
and Web Feature Services (WFS).
3.5.3.6 MobileGIS
MobileGIS application was also developed using HTML, CSS and JavaScript programming
languages. The GUI consists of map display and buttons. The mobile application offered GPS
measurements, navigation capabilities and QR code reading functions. The mobile application
accessed the shapefiles via WFS connection to GeoServer.

49
3.6 QR Code Generation
In addition to the mapping of the substations and the 11KV high voltage level electrical network,
medium level voltage network running from substation 1004 was mapped. The SUB 1004 supplies
power to 3 campus buildings i.e. Animal Care, Biological Sciences and Chemistry buildings. The
main MCB switches, the main control switches of each of these buildings, were mapped. A unique
Identification Number (ID) was given to each MCB. The structure of the ID structure is shown in
Figure 3.14.
Figure 3.14: ID structure of the MCB switches
In Figure 3.14, the ID consists of 3 parts i.e. the ID of the substation that supplies power to the
building; the ID of the campus building its located in; room number in which the MCB switch is
found. Having tagged the main switches, QR codes were generated to encrypt the ID for each
MCB. These QR codes were placed on substation switchgears that control power to each building.
The QR codes were placed besides the switchgear that is associated to the main LNB of each
building. A QR code generator was used to generate the QR codes. The QR code generator web
page was designed using HTML, CSS and qrcode.js file.
1004138301
Building ID
Substation ID Room Number
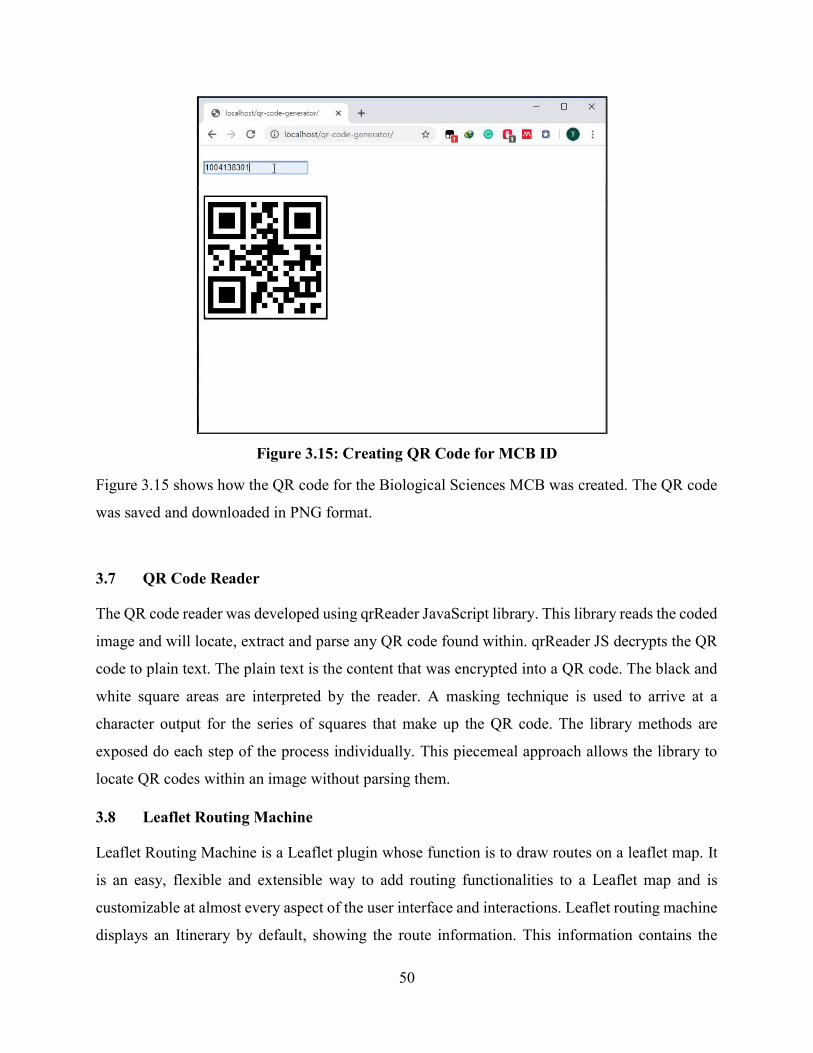
50
Figure 3.15: Creating QR Code for MCB ID
Figure 3.15 shows how the QR code for the Biological Sciences MCB was created. The QR code
was saved and downloaded in PNG format.
3.7 QR Code Reader
The QR code reader was developed using qrReader JavaScript library. This library reads the coded
image and will locate, extract and parse any QR code found within. qrReader JS decrypts the QR
code to plain text. The plain text is the content that was encrypted into a QR code. The black and
white square areas are interpreted by the reader. A masking technique is used to arrive at a
character output for the series of squares that make up the QR code. The library methods are
exposed do each step of the process individually. This piecemeal approach allows the library to
locate QR codes within an image without parsing them.
3.8 Leaflet Routing Machine
Leaflet Routing Machine is a Leaflet plugin whose function is to draw routes on a leaflet map. It
is an easy, flexible and extensible way to add routing functionalities to a Leaflet map and is
customizable at almost every aspect of the user interface and interactions. Leaflet routing machine
displays an Itinerary by default, showing the route information. This information contains the
51
starting point, distance, direction, turning points, road name and the destination point. The starting
and destination points are marked on the leaflet map and the plugin calculates the route. The plugin
also gives alternative routes that can be used. Routing is based on the Open Street Map (OSM)
road paths.
3.9 Use Case Diagrams
To model a system, the most important aspect is to capture the dynamic behaviour. To clarify a bit
in details, dynamic behaviour means the behaviour of the system when it is running /operating.
UML (Unified Modelling Language) is a standard language for specifying, visualizing,
constructing, and documenting the artifacts of software systems. UML is not a programming
language but tools can be used to generate code in various languages using UML diagrams. In
UML there are five diagrams available to model dynamic nature and use case diagram is one of
them (Mule & Waykar, 2015). One such diagram is the use case diagram. A use case diagram is a
graphical model that helps the user in understanding the features and functionality of the software
application. It describes how the user interacts with the system by specifying steps of how to
accomplish a task (Pressman , 2005). They are used for documenting system requirements. They
may also be used for communication both between various participants in a software project, i.e.
system developers, its future users and owners (Klimek & Szwed, 2010). Use Case diagrams show
the pictorial representation of scenarios by which the user can use a system. Components of a use
case diagram include the actor, use case and relation. The actor is the interacts with the system.
The use case are the functions or services provided by the system. The relation shows the
relationship between the actor and system through the use cases. A relation can either be an Include
relation or Extend relation. The Include relation shows mandatory behavior. It indicates that the
base use case is incomplete by itself as it requires another use case to function. The Extend relation
shows optional behavior. It illustrates that the base use case is not dependent on another use case
to function. The end user being the primary actor represents the Resident Engineer who interacts
with the system by initiating the mobile application. The Resident Engineer logs in and gets access
to the WebGIS application functions. The WebGIS can only be accessed via an internet
connection. Functions provided by the WebGIS application are indicated as base use cases in
figure 3.16. The server (Geo Server) is the secondary actor and interacts with the system but not
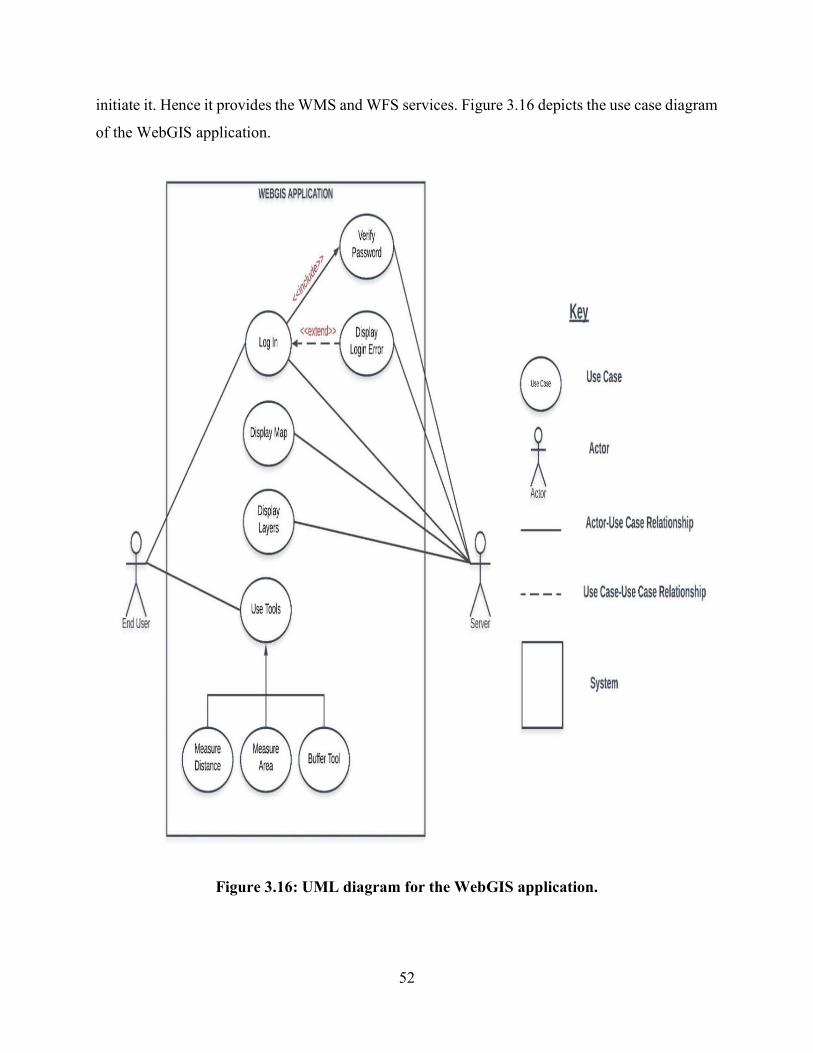
52
initiate it. Hence it provides the WMS and WFS services. Figure 3.16 depicts the use case diagram
of the WebGIS application.
Figure 3.16: UML diagram for the WebGIS application.
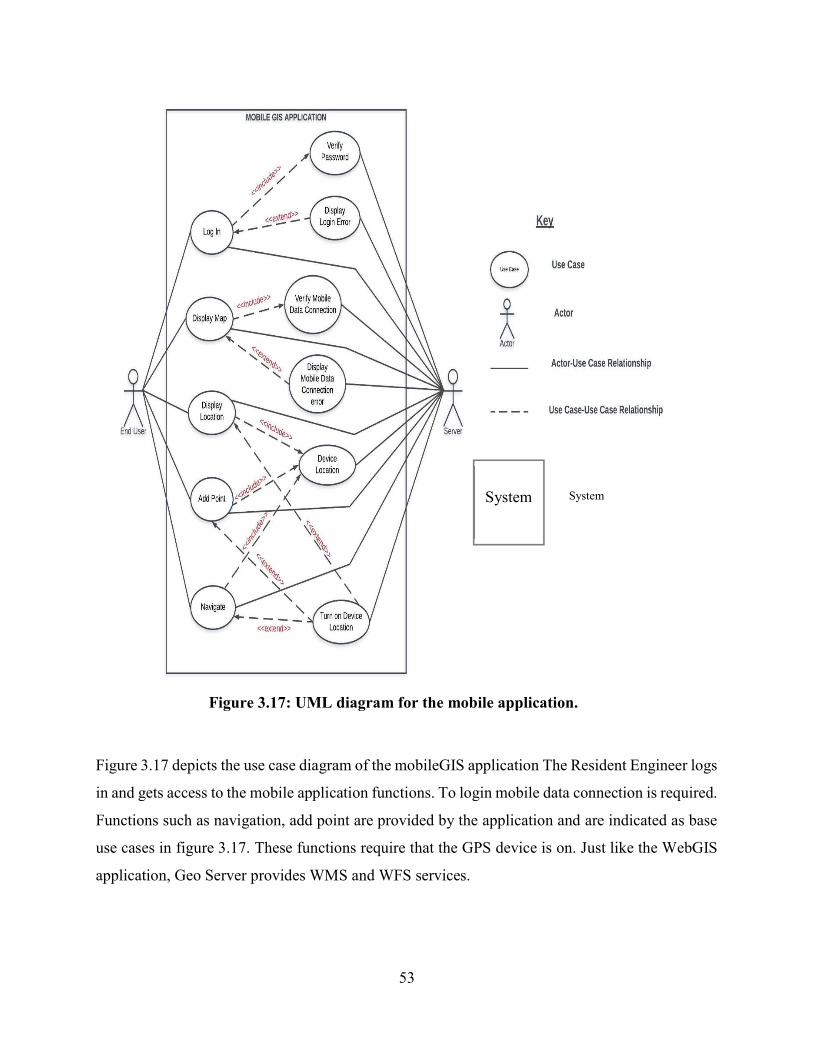
53
Figure 3.17 depicts the use case diagram of the mobileGIS application The Resident Engineer logs
in and gets access to the mobile application functions. To login mobile data connection is required.
Functions such as navigation, add point are provided by the application and are indicated as base
use cases in figure 3.17. These functions require that the GPS device is on. Just like the WebGIS
application, Geo Server provides WMS and WFS services.
System System
Figure 3.17: UML diagram for the mobile application.

54
3.10 Sequence Diagram
A sequence diagram shows the interaction between objects in sequential order. It describes how
and what order the objects in the system function. It also shows sequence of messages exchanged
between objects needed to execute the functionality. Figure 3.18 shows the event sequences
between objects when logging in into the system.
Figure 3.18: Login system sequence diagram
3.11 Class Diagram
A class diagram illustrates the relationship between classes, objects, attributes and operations in
an object-oriented system. It models the static structure of the system and is used to translate the
into programming code. In figure 3.19 the classes represent entities with similar characteristics.
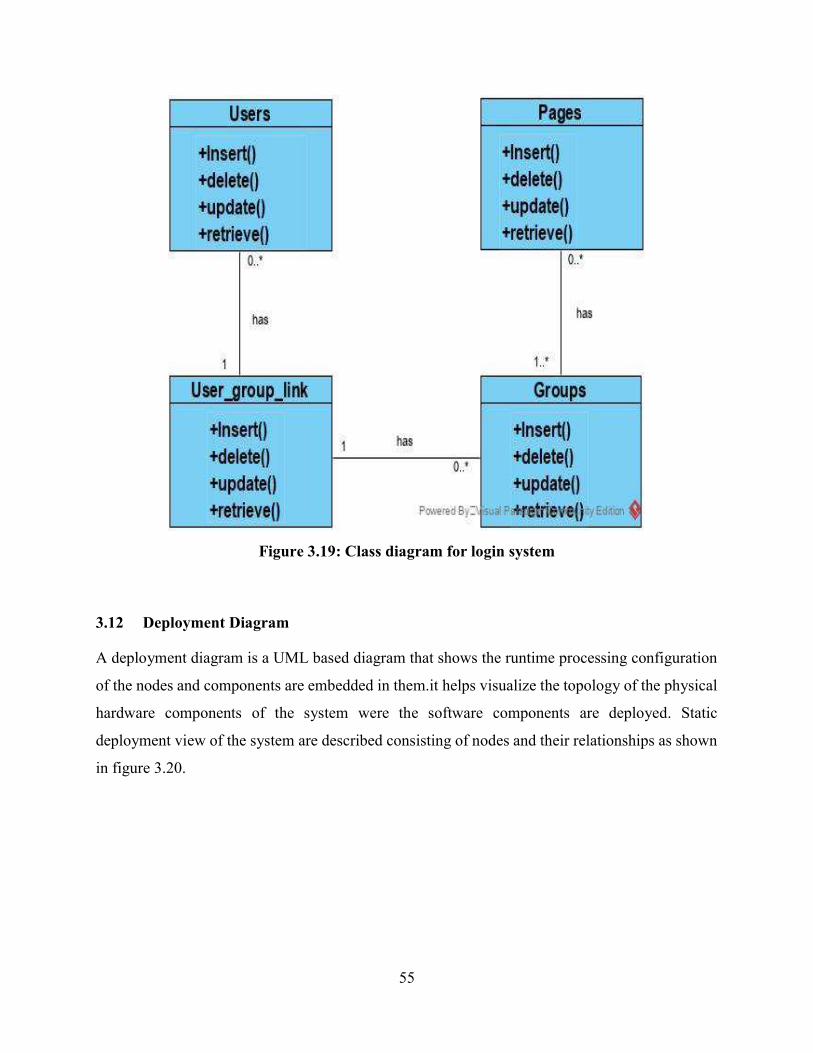
55
Figure 3.19: Class diagram for login system
3.12 Deployment Diagram
A deployment diagram is a UML based diagram that shows the runtime processing configuration
of the nodes and components are embedded in them.it helps visualize the topology of the physical
hardware components of the system were the software components are deployed. Static
deployment view of the system are described consisting of nodes and their relationships as shown
in figure 3.20.

56
Figure 3.20: GIS prototype deployment diagram
57
3.13 Hardware Tools
The Global Positioning System (GPS) is a satellite-based navigation system that consists of 24
orbiting satellites (Kanabar, et al., 2018). It sends the details of their position in space back to
earth. GPS has many applications in diverse areas. It is available to any user with a GPS receiver.
It has its usefulness in military, weather conditions, vehicle location, farms, mapping and many
other areas. The Global Positioning System (GPS) uses a network of satellites which let people
with GPS receivers pinpoint their location anywhere in the world (Abulude, et al., 2015). In this
study 2 types of GPS devices were used, 1) Handheld GPS and 2) RTK GPS. A mobile phone was
used as a handheld GPS device. The rapid advancement of technology has brought about GPS
functionality embedded in mobile phones. With aid of a mobile application installed on the phone,
the position of the device is marked. Measurer GPS is an application that that provides GPS
functions such as capturing coordinates, measuring distances and areas on an Android mobile
phone. Coordinates of measured points can be stored and exported to other formats such as CSV
and KML. This application displays the device position on a google map satellite image. The
accuracy of Measurer mobile application GPS readings was within 0.5m-1m. The Real-Time
Kinematic Global Positioning System (RTK-GPS), also known as Differential GPS, is an integral
part of topographic surveys. (Kizil & Tisor, 2011) states that RTK is a technique employed in
practices where precision is a must. In RTK, corrected GPS signals are transmitted in real time
from a base receiver at a known location to one or more rover receivers. In this method, the base
receiver remains stationary and is attached to a radio transmitter. The rover receiver is mobile and
is attached to a radio receiver (El-Rabbany, 2002). The base receiver measurements and
coordinates are transmitted to the rover receiver via the radio communication. The built-in
software in a rover receiver combines and processes the GPS measurements collected at both the
base and the rover receivers to obtain the rover coordinates. The communication coverage between
a base and a rover receiver is within a radial distance of 10-15km and may reach 20km. RTK GPS
record measurements at an accuracy of 1cm. CHC X91 series 2006 model was used to in this study.

58
Table 3.2: Hardware Tools Specifications
Hardware Specifications CHC X91 GPS Satellite Tracking: GPS, GLONASS, SBAS, Galileo,
BeiDou RTK: H: 8 mm + 1 ppm RMS, V: 15 mm + 1 ppm RMS Post Processing: H: 3 mm + 0.5 ppm RMS, V: 5 mm + 0.5
ppm RMS CHC radio modem internal Rx: 430-450/450-470 MHz Power consumption: 2.6 W Li-ion battery capacity: 2200 mAh Software: CHC’s Landstar field data collection software
HP Envy 17 Notebook Laptop Storage: 256GB SSD & 1TB HHD Processor: 4th Gen Intel Core i7 @ 2.40GHz Memory: 16GB RAM Graphics Card: 2GB Nvidia GeForce GT 740M Resolution: 1920 x 1080 pixels
Huawei Honor 8X Mobile Phone
Storage: 128GB Processor: HiSilicon Kirin 710 octa-core @ 2.2GHz Memory: 6GB RAM OS: Android 9 Display: 6.50 inches (2340 x 1080) Camera: 16MP front & 20MP rear

59
CHAPTER FOUR: RESULTS
4.1 Overview
In this chapter, the research findings according to the system design are presented. Firstly, the
results of the field survey conducted were presented on a map. The developed the central desktop
based system is also presented. Finally, the interfaces and functions of both the web and mobile
based prototypes are shown in this chapter.
4.2 Mapping the Existing Electrical and Telecommunication Cable Networks
The first objective was to map the existing electrical (11KV cable) and telecommunication
networks at the University of Zambia. Fig.3 shows the mapped underground network lines.
Figure 4.1: Mapped underground Electrical and Telecommunication networks
The network lines were mapped using the RTK GPS equipment. In Figure 4.1 the red lines
represent the 11KV electrical cable and the blue lines represent the telecommunication cable. The
red polygons represent the electrical substations and the blue polygons represent the
telecommunication joint-boxes.
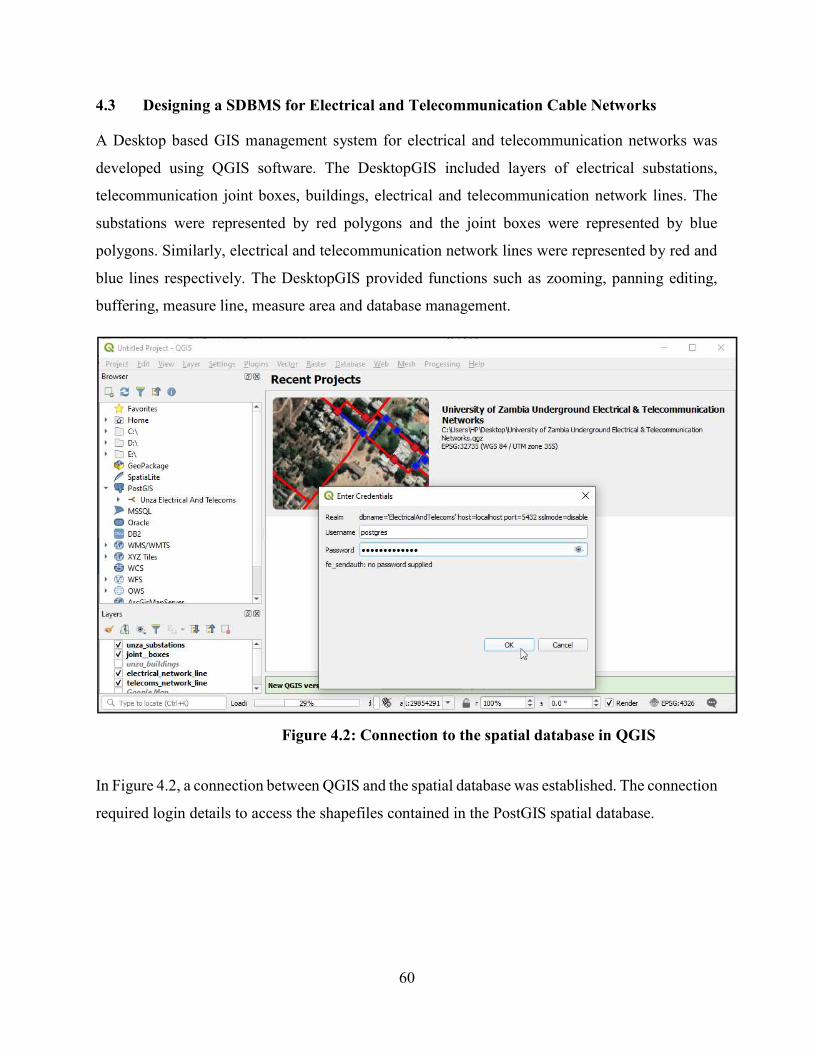
60
4.3 Designing a SDBMS for Electrical and Telecommunication Cable Networks
A Desktop based GIS management system for electrical and telecommunication networks was
developed using QGIS software. The DesktopGIS included layers of electrical substations,
telecommunication joint boxes, buildings, electrical and telecommunication network lines. The
substations were represented by red polygons and the joint boxes were represented by blue
polygons. Similarly, electrical and telecommunication network lines were represented by red and
blue lines respectively. The DesktopGIS provided functions such as zooming, panning editing,
buffering, measure line, measure area and database management.
In Figure 4.2, a connection between QGIS and the spatial database was established. The connection
required login details to access the shapefiles contained in the PostGIS spatial database.
Figure 4.2: Connection to the spatial database in QGIS
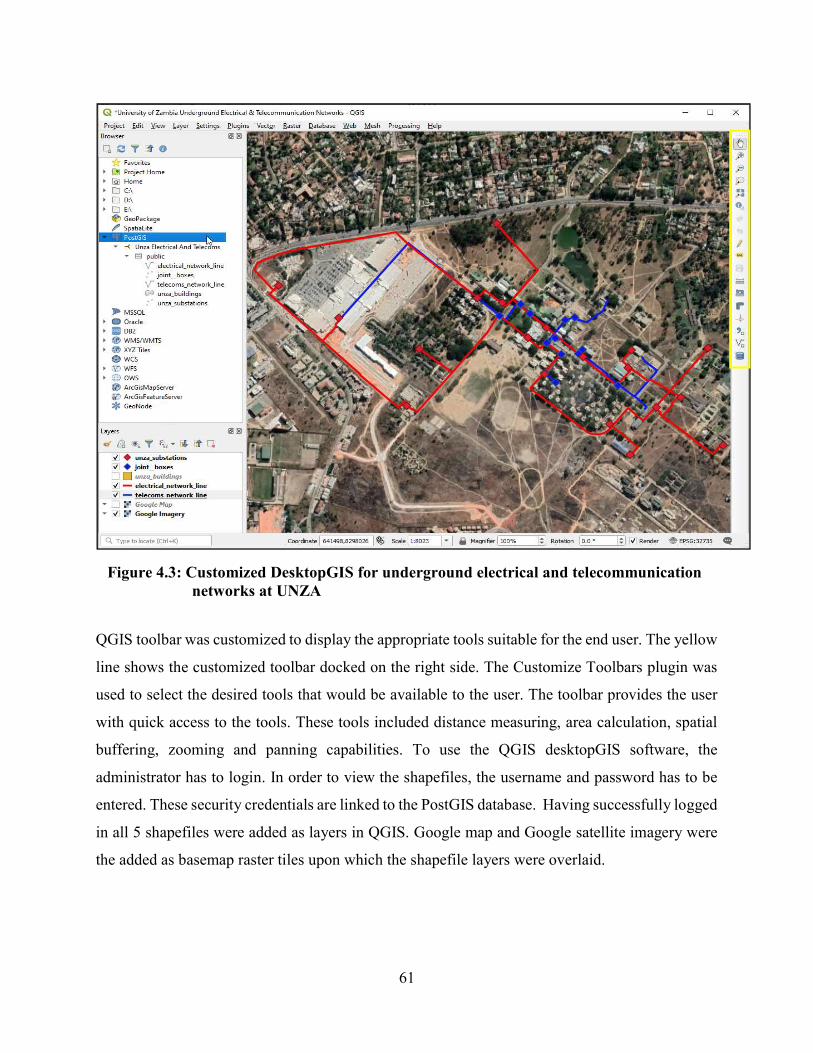
61
QGIS toolbar was customized to display the appropriate tools suitable for the end user. The yellow
line shows the customized toolbar docked on the right side. The Customize Toolbars plugin was
used to select the desired tools that would be available to the user. The toolbar provides the user
with quick access to the tools. These tools included distance measuring, area calculation, spatial
buffering, zooming and panning capabilities. To use the QGIS desktopGIS software, the
administrator has to login. In order to view the shapefiles, the username and password has to be
entered. These security credentials are linked to the PostGIS database. Having successfully logged
in all 5 shapefiles were added as layers in QGIS. Google map and Google satellite imagery were
the added as basemap raster tiles upon which the shapefile layers were overlaid.
Figure 4.3: Customized DesktopGIS for underground electrical and telecommunication networks at UNZA

62
4.4 Development of the SDBMS Prototype using Web and Mobile Technologies.
4.4.1 Login Management System
To access the WebGIS application, the user has to log in by entering the username and password.
Figures 4.4 and 4.5 show the logging in process.
Figure 4.4: Home page of the login management system
Figure 4.5: User logging into the webGIS page anagement system
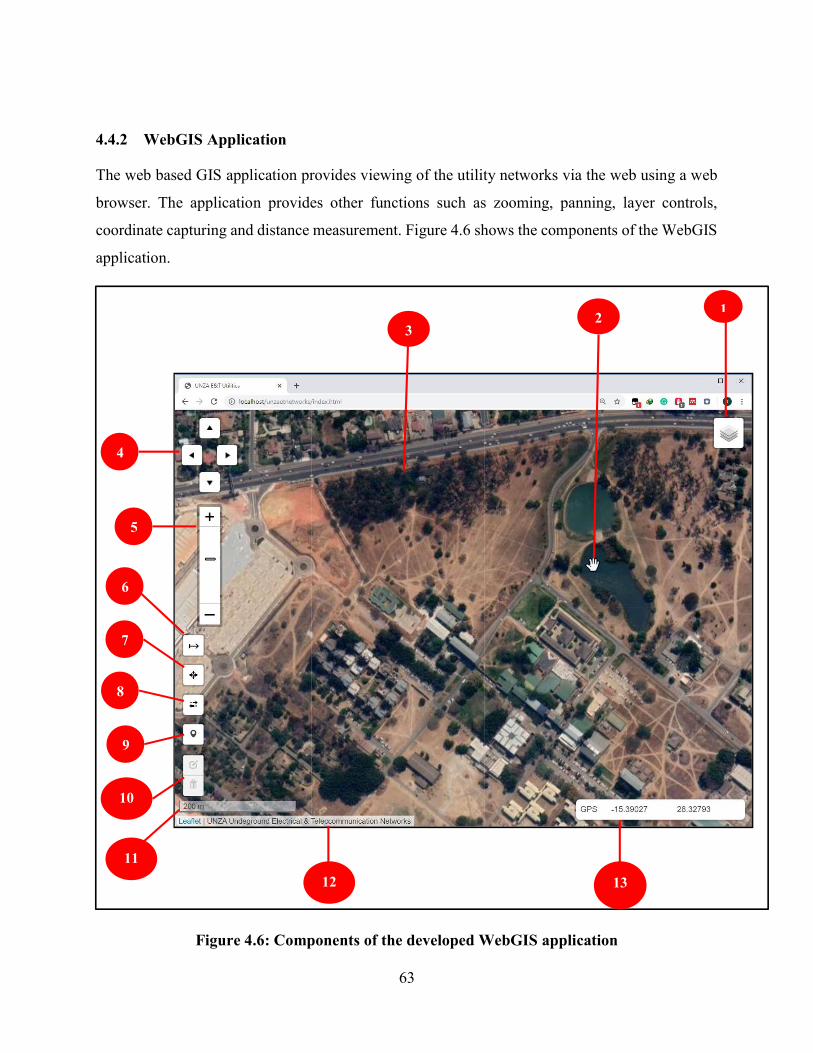
63
4.4.2 WebGIS Application
The web based GIS application provides viewing of the utility networks via the web using a web
browser. The application provides other functions such as zooming, panning, layer controls,
coordinate capturing and distance measurement. Figure 4.6 shows the components of the WebGIS
application.
Figure 4.6: Components of the developed WebGIS application
4
5
6
7
8
10
9
13
1 2
3
11
12

64
Table 4.1: Description of the WebGIS application tools
No. Tool Description
1 Layer Control Displays Overlay and Basemap layers.
2 Mouse Icon Provides basic mouse functions such as clicking, hovering
over the map and panning.
3 Map Canvas Displays the leaflet basemap map.
4 Pad Control Moves map up, down, left or right.
5 Zoom Slider Controls the map Zoom level.
6 Measure Button Calculates distance between 2 consecutive points.
7 Location Button Displays the current location of the user.
8 Side-bar Button Opens and closes the side-bar menu.
9 Coordinate Marker Allows the user to get the map coordinates by placing a point
marker on the map.
10 Edit Marker Allows the user to drag and delete the point marker on the
map.
11 Scale Bar Displays the map scale of the current zoom level in metres.
12 Attribution Control Displays the attribution data associated with the map.
13 Coordinates
Displays the latitude and longitude coordinates based on the
mouse pointer movements on the map. Coordinates are
displayed in decimal degrees.
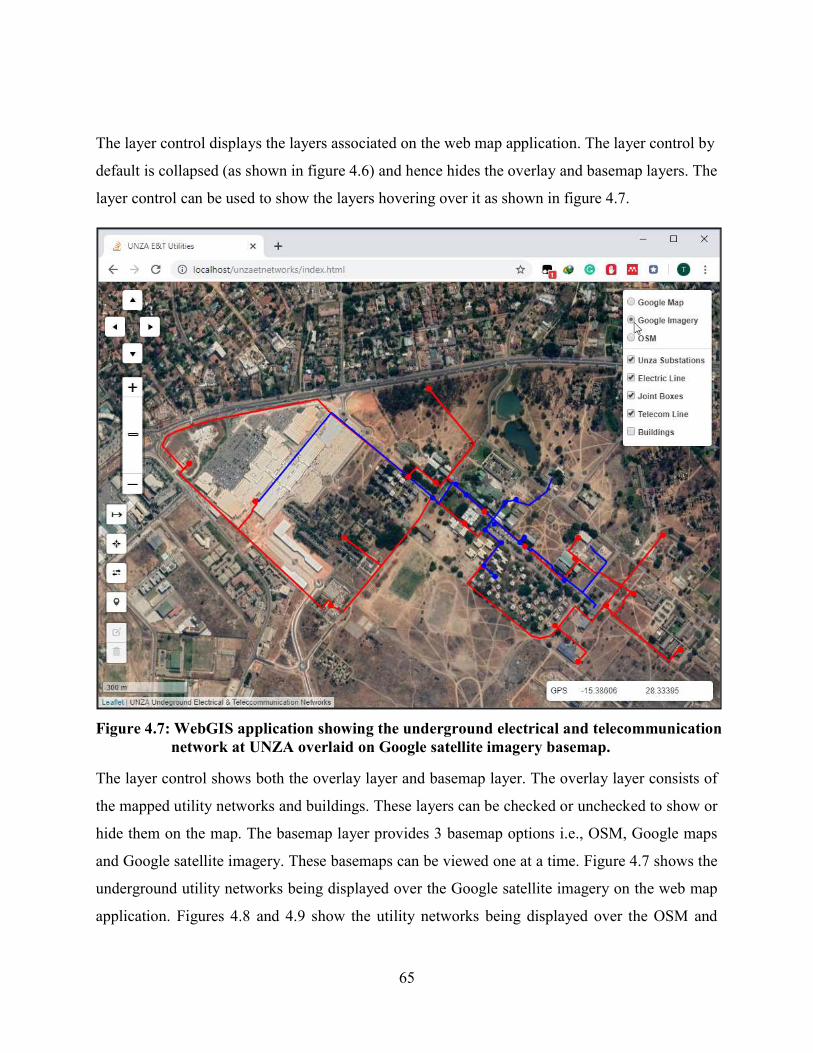
65
The layer control displays the layers associated on the web map application. The layer control by
default is collapsed (as shown in figure 4.6) and hence hides the overlay and basemap layers. The
layer control can be used to show the layers hovering over it as shown in figure 4.7.
Figure 4.7: WebGIS application showing the underground electrical and telecommunication network at UNZA overlaid on Google satellite imagery basemap.
The layer control shows both the overlay layer and basemap layer. The overlay layer consists of
the mapped utility networks and buildings. These layers can be checked or unchecked to show or
hide them on the map. The basemap layer provides 3 basemap options i.e., OSM, Google maps
and Google satellite imagery. These basemaps can be viewed one at a time. Figure 4.7 shows the
underground utility networks being displayed over the Google satellite imagery on the web map
application. Figures 4.8 and 4.9 show the utility networks being displayed over the OSM and

66
Google map basemaps respectively. In both figures the buildings layer was checked to show the
mapped campus buildings on the web map.
Figure 4.8: WebGIS application with OSM raster as the basemap layer
Figure 4. 9: WebGIS application with Google maps raster as the basemap layer
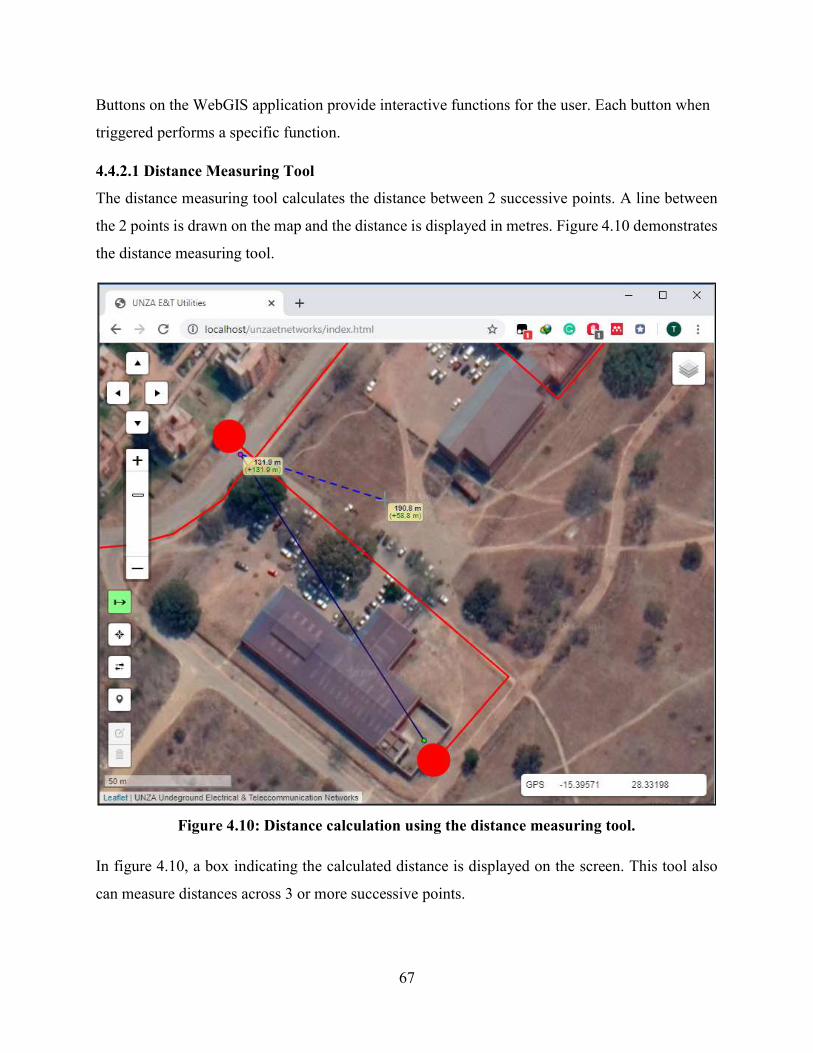
67
Buttons on the WebGIS application provide interactive functions for the user. Each button when
triggered performs a specific function.
4.4.2.1 Distance Measuring Tool
The distance measuring tool calculates the distance between 2 successive points. A line between
the 2 points is drawn on the map and the distance is displayed in metres. Figure 4.10 demonstrates
the distance measuring tool.
Figure 4.10: Distance calculation using the distance measuring tool.
In figure 4.10, a box indicating the calculated distance is displayed on the screen. This tool also
can measure distances across 3 or more successive points.
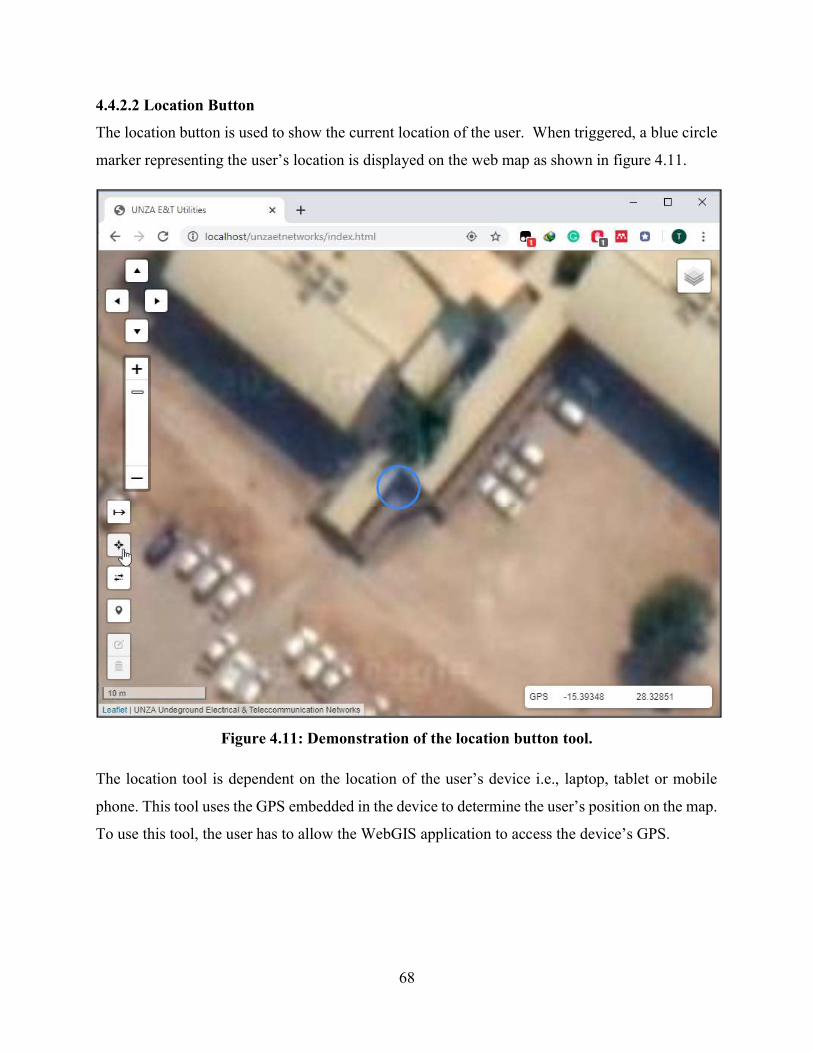
68
4.4.2.2 Location Button
The location button is used to show the current location of the user. When triggered, a blue circle
marker representing the user’s location is displayed on the web map as shown in figure 4.11.
Figure 4.11: Demonstration of the location button tool.
The location tool is dependent on the location of the user’s device i.e., laptop, tablet or mobile
phone. This tool uses the GPS embedded in the device to determine the user’s position on the map.
To use this tool, the user has to allow the WebGIS application to access the device’s GPS.
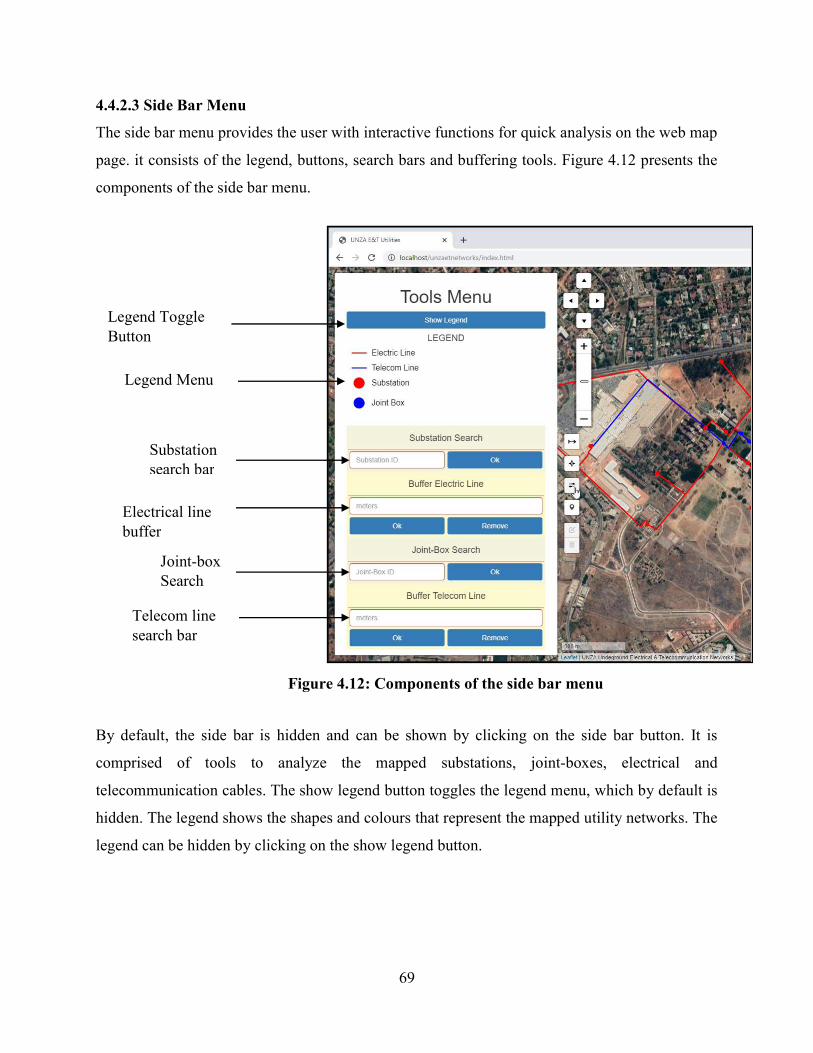
69
4.4.2.3 Side Bar Menu
The side bar menu provides the user with interactive functions for quick analysis on the web map
page. it consists of the legend, buttons, search bars and buffering tools. Figure 4.12 presents the
components of the side bar menu.
By default, the side bar is hidden and can be shown by clicking on the side bar button. It is
comprised of tools to analyze the mapped substations, joint-boxes, electrical and
telecommunication cables. The show legend button toggles the legend menu, which by default is
hidden. The legend shows the shapes and colours that represent the mapped utility networks. The
legend can be hidden by clicking on the show legend button.
Legend Toggle Button
Legend Menu
Substation search bar
Electrical line buffer
Joint-box Search
Telecom line search bar
Figure 4.12: Components of the side bar menu

70
4.4.2.3.1 Substation Search Bar
The substation search bar enables the user to search the substations by the substation ID. The user
inputs the ID number in the search bar and clicks on the ‘Ok’ button. If the search is valid, the
screen zooms in to the substation matching the ID and a blue indicatory marker is placed on the
substation location as shown in figure 4.13.
Figure 4.13: Results of the Substation search.
In figure 4.13, the successful results of a substation search are shown. The attributes of the
substation are displayed on the substation search menu. The attributes consist of the Substation
ID, name, alias and the category. When the ID input by the user is nonexistent, and invalid message
is displayed on the search bar status menu as shown in figure 4.14.
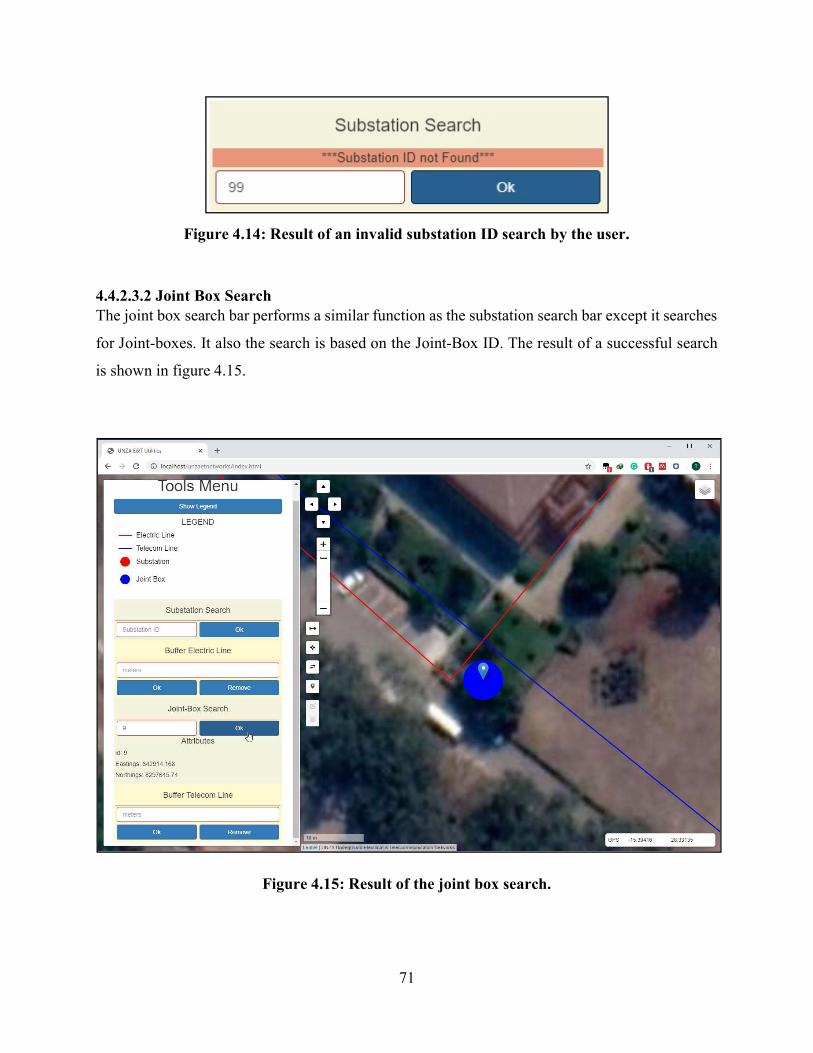
71
Figure 4.14: Result of an invalid substation ID search by the user.
4.4.2.3.2 Joint Box Search The joint box search bar performs a similar function as the substation search bar except it searches
for Joint-boxes. It also the search is based on the Joint-Box ID. The result of a successful search
is shown in figure 4.15.
Figure 4.15: Result of the joint box search.

72
Figure 4.15 shows the successful search of a joint box and the attributes are displayed on the Joint-
Box search menu. The attributes show the joint box ID, the easting and northing coordinates of the
joint box in Universal Transverse Mercator (UTM) coordinate system.
Figure 4.16: Result of an invalid joint box ID search by the user.
An invalid message pops up on the joint box menu when there is no joint box found from the user’s
invalid input as shown in figure 4.16.
4.4.2.3.3 Electrical Cable Buffer
The WebGIS application also offers the user with the buffering tool. A buffer zone based on a
particular distance can be displayed on the web map application as shown in figure 4.17.
Figure 4.17: Result of the electrical line buffer tool.

73
In figure 4.17, a 20 metre buffer was applied on the electrical network line. The shaded area in red
and bounded by red dashed lines shows the area that is 20 metres away from the electric network
cable. This can be used to visually inspect what features that are within a certain distance of the
electrical network cable. By clicking on the ‘Remove button’, the buffer area can be cleared off
the screen.
4.4.2.3..4 Telecommunication Cable Buffer
Similarly, a buffer zone surrounding the telecommunication network cable can be displayed on the
web map application. A blue shaded area bordered by blue dashed lines is drawn around the cable
depending on the distance input by the user as shown in figure 4.18.
Figure 4.18: Result of the telecommunication line buffer tool.

74
4.4.2.4 Coordinate Marker
Coordinates on the web map can be obtained by triggering the coordinate marker button. The user
can point on the screen using the mouse to get the coordinates of a point of interest. The coordinate
marker tool allows the user to draw a point marker on the point of interest. The marker displays
the latitude and longitude coordinates on the screen as illustrated in figure 4.19.
Figure 4.19: Using the coordinate marker tool.
The coordinate marker tool allows the user to place multiple point markers on the web map to get
the coordinates of multiple locations as shown in figure 4.19. The coordinate marker tool
automatically triggers the edit marker tool. The edit marker tool enables the user to change the
position of the point marker by dragging it to another location as shown in figure 4.20. The point
markers can be removed from the web map screen by clicking the delete layer button.

75
Figure 4.20: Dragging a point marker to another position using the edit marker tool.
4.4.3 MobileGIS Application
Figure 4.21 shows the components of the developed mobile application prototype. The 8
components are shown in figure 4 and each provide useful functions to the end user. The home
screen displays the leaflet map and buttons. The leaflet map shows the underground electrical and
telecommunication network overlaid on the Google satellite imagery base map. OSM and Google
Map are the other alternative basemaps provided by the application. The red lines represent the
11KV electrical cable and the blue lines represent the telecommunication cables. substations are
represented by red dots and blue dots represent telecom joint-boxes. The Zoom control is used to
adjust the zoom level of the basemap.

76
The flow diagram in figure 4.22 illustrates the background process when reading a QR code. When
the QR code is scanned, the code is read and the QR content is extracted. The content is then
compared with the MCB ID stored in the database. If the comparison yields a match, the attributes
of the MCB are displayed else nothing will be displayed.
1
3
4 5 7 6 8
2
Figure 4.21: MobileGIS Application interface.
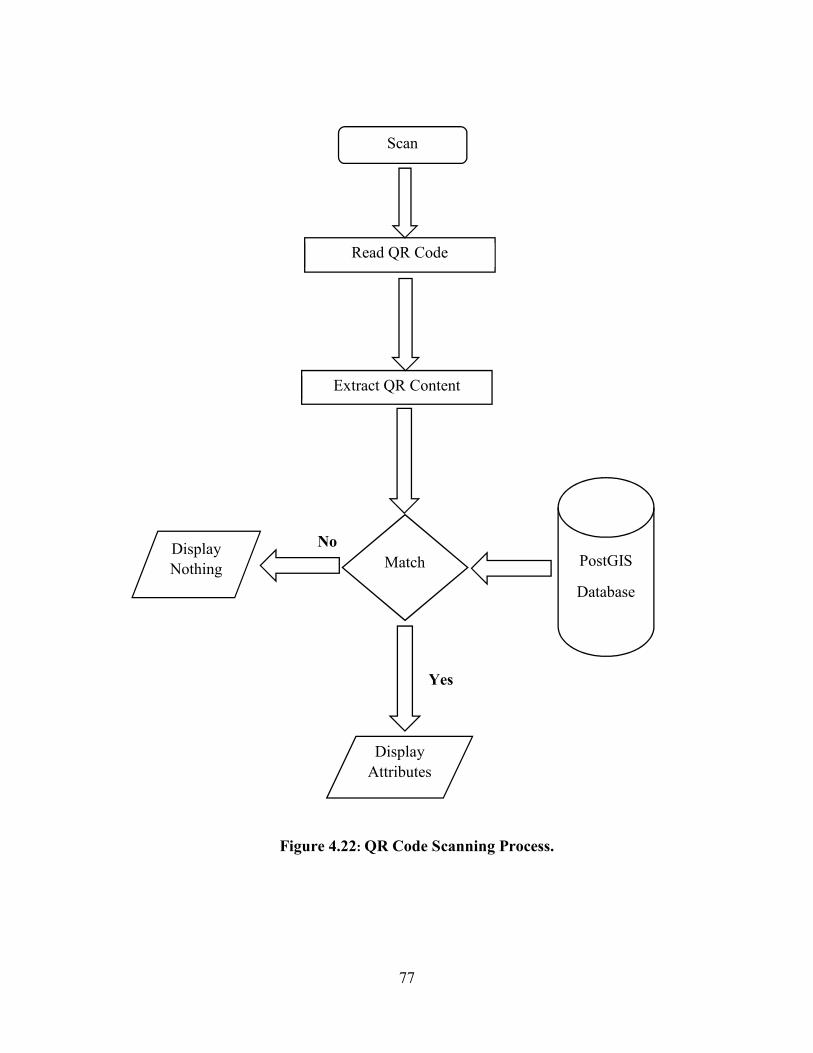
77
Scan
Extract QR Content
Match Display Nothing
Display Attributes
Read QR Code
PostGIS
Database
No
Yes
Figure 4.22: QR Code Scanning Process.

78
Figure 4.23: QR Reader Screen.
Figure 4.23 shows the QR Reader screen before a QR code has been scanned. At the initial stage
the QR content is blank because no QR code exists in the window. The user taps the scan button
which triggers the mobile phone camera to scan and capture the QR code. A QR code is
successfully scanned once it appears on the window. QR content displays the text that has been
decoded by the QR reader. This text is compared to the MCB ID in the database. If there is a
match, attribute information of the MCB is displayed on the screen as shown in figure 4.24.

79
Figure 4.24: Attribute information of an MCB displayed after Successfully read QR code.
In figure 4.24a, the QR code for the Biological Sciences MCB was successfully read. The ID, alias,
building and voltage for this MCB were displayed. When the ‘Zoom to layer’ button is tapped, the
Home Screen is displayed with the map zoomed to the MCB location as shown in 4.24b. The green
dot represents the location of the MCB.
a) b)

80
Figure 4.25: Navigating to destination point.
Figure 4.25 shows the mobile application routing functionality. The user places a marker to the
point of interest as the destination point. The user’s current location is determined and is the
starting point. The Leaflet Routing Machine determines the path based on the OSM road network.
The determined route between the 2 markers is drawn along the path in cyan as shown in figure
4.25. The itinerary displays the routing information.

81
The Features screen in figure 4.26 shows the list of features of the mapped underground electrical
and telecommunication networks. The electrical features include the substations and electrical
cables. The joint-boxes and telecom cables constitute the telecommunication network. Each
feature has a sub screen that shows a table of components and their respective attributes. These
attribute information is retrieved from the PostGIS database.
Figure 4.26: Features screen with sub-screens showing attributes of each feature.

82
CHAPTER FIVE: DISCUSSION
5.1 Discussion of Results
The findings have established that the current electrical and telecommunication utility
management system uses outdated drawings. The system has no central point of data storage as
information is transferred from person to person. Therefore, the system relies on the memories of
experienced personnel when passing on information to new personnel. This method of data sharing
is subject to changes over time due to memory loss and the information may become inaccurate.
Therefore, this study provides a better alternative and efficient system to overcome the lapses of
the current one.
To improve the current system, firstly the electrical and telecommunication networks have to be
mapped. High precision mapping methods were used was to conduct the field survey. Some
previous studies described in the literature review, handheld GPS devices, with an accuracy of
about 5 metres was used to map. However, in this study RTK GPS equipment was used to conduct
the mapping exercise at an accuracy of 1cm. A map of the utility networks at UNZA was produced.
This map shows the location of the utility networks and how they are distributed within campus
premises.
The PostgreSQL/PostGIS based database provides digital storage of the mapped utility networks
in form of shapefiles. The database also provides security and integrity of the data stored data. The
security parameters restrict access to the mapped data and privileges are granted to the
administrator.
The DesktopGIS was developed using QGIS open source software. The PostGIS extension makes
it possible for QGIS to connect with the database. This compatibility enables QGIS to access the
shapefiles and hence are displayed as layers. QGIS provides display, querying, spatial analysis and
manipulation functions. These functions facilitate an effective way of managing the mapped utility
networks. QGIS has the power to update the database when changes are made to the shapefiles
hence, the desktop based GIS acts as central part of the system.
The web based GIS application was developed to extend desktopGIS functions to a web browser.
Leaflet JS library was used to develop a simple web application that enables mapping functionality
on the web browser. The web application provides a user friendly interface that allows the user to
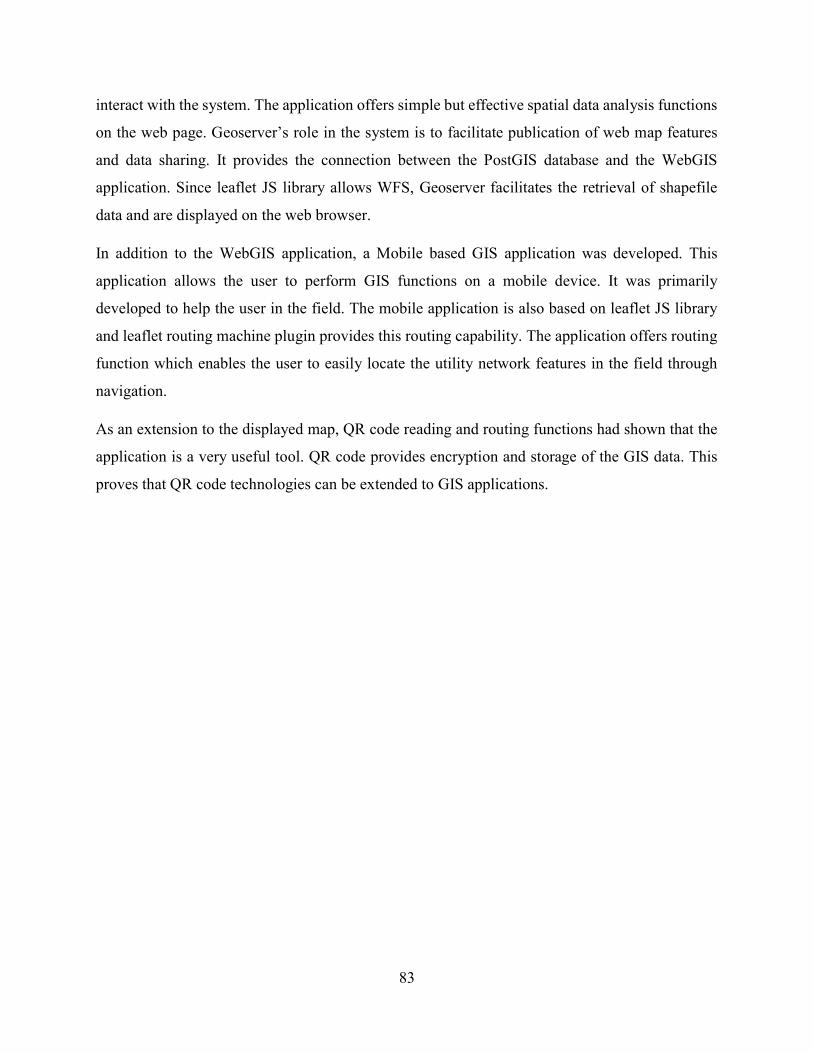
83
interact with the system. The application offers simple but effective spatial data analysis functions
on the web page. Geoserver’s role in the system is to facilitate publication of web map features
and data sharing. It provides the connection between the PostGIS database and the WebGIS
application. Since leaflet JS library allows WFS, Geoserver facilitates the retrieval of shapefile
data and are displayed on the web browser.
In addition to the WebGIS application, a Mobile based GIS application was developed. This
application allows the user to perform GIS functions on a mobile device. It was primarily
developed to help the user in the field. The mobile application is also based on leaflet JS library
and leaflet routing machine plugin provides this routing capability. The application offers routing
function which enables the user to easily locate the utility network features in the field through
navigation.
As an extension to the displayed map, QR code reading and routing functions had shown that the
application is a very useful tool. QR code provides encryption and storage of the GIS data. This
proves that QR code technologies can be extended to GIS applications.
84
CHAPTER SIX: CONCLUSION AND RECOMMENDATIONS
6.1 Conclusion
This study presented the use of GIS technology to improve UNZA’s management of underground
electrical and telecommunication network system. This was due to the fact that the current
management system relied on outdated layout drawings. Firstly, the existing underground utility
networks were mapped and digitally stored. Secondly, a centralized desktop based GIS system was
developed to manage these networks on a computer. Finally, the system was extended to web and
mobile based technologies. In this study, free and open source software were used to develop the
system. The developed system provided tools that could help in decision making concerning
modifications and updates in future. Thus from the results, the system will provide an effective
and efficient way of managing the utility networks.
6.2 Recommendations
The following recommendations are outlined as follows:
I. Mapping of underground cables should be conducted by combining GPS mapping
techniques with the use of underground cable locator equipment. This would not only
provide a very precise cable route but also how deep these cables are with respect to the
ground.
II. Other than mapping high voltage electrical networks, there is a need to also map the
medium and low voltage networks.
III. The system should be integrated with other campus utilities such as water and sewer
networks.
IV. Installation of sensors for real-time fault detection. This would very useful as it would bring
about quick response in an event of a fault occurring.

85
REFERENCES
Khawash, S., Lhamo, C. & Drukchen, N., 2015. GIS APPROACH TO ELECTRICAL DISTRIBUTION NETWORK OF PHUENTSHOLING TOWN. Thimphu, Proceedings of the 1st International Seminar on Renewable Energy and Sustainable Development.
Abdalla, R., 2016. Introduction to Geospatial Information and Communication Technology (GeoICT). Jeddah: Springer International Publishing AG.
Abdulrahman, M. & AL-Ramadan, M., 2013. Applications of GIS in Electrical Power System. pp. 1-6.
Abulude, F. O., Akinnusotu, A. & Adeyemi, A., 2015. GLOBAL POSITIONING SYSTEM AND ITS WIDE APPLICATIONS. Continental J. Information Technology, 9(1), pp. 22-32.
Alam, A. & Faraq, O., 2019. Finding Shortest Path for Road Network Using Dijkstra’s Algorithm. Bangladesh Journal of Multidisciplinary Scientific Research, 1(2), pp. 41-45.
Alesheikh, A. A., Helali, H. & Behroz, H. A., 2002. Web GIS: technologies and its applications. Web GIS: technologies and its applications, Volume 15.
Amiri, A. & Mansourian, A., 2012. Automatic Geospatial Web Service Composition for Developing a Routing System, Lund: Lund University.
Anbazhagan, S., Ramesh, V. & Balamurugan, M., 2013. Geoinformatics in Infrastructure Facility Mapping and Development Planning in a University Campus. International Journal of Earth Sciences and Enginnering, 6(1), pp. 1533-1540.
Aseto, S., 2016. Waste management in higher education institutions: A case study of university of Nairobi, Kenya. Nairobi: Department of Geography Environmental- Studies, University of Nairobi.
Babu, S., Vijayalakshmi, Y. & Murthy, A., 2016. Improving Performance and Privacy in Location Based Service Applications Using Gps. IOSR Journal of Computer Engineering (IOSR-JCE), pp. 28-31.
Bagherinia, H. & Manduchi, R., 2011. A theory of color barcodes A Theory of Color Barcodes. s.l., s.n.
Bajaj, S. & Adhave, A., 2016. Mapping of Underground Electricity Network using GIS Software for Aurangabad City. International Journal of Innovative Research in Science, Engineering and Technology, 5(7), pp. 12653-12658.
Ballatore, A., Tahir, A., McArdle, G. & Bertolotto, M., 2011. A comparison of open source geospatial technologies for web mapping. International Journal of Web Engineering and Technology, Volume 10, pp. 1-21.

86
Bandibas, J. & Takarada, S., 2019. Mobile Application and a Web-Based Geographic Information System for Sharing Geological Hazards Information in East and Southeast Asia. Journal of Geographic Information System, Volume 11, pp. 309-320.
Behncke, K. & Ehlers, M., 2012. The Relevance of Web Mapping Infrastructures in a Web Portal for Desktop and Mobile Devices: A Case Study. Journal of Geographic Information System, Volume 4, pp. 514-520.
Bhargava, A., Bhondekar, A. P. & Sidhu, B. S., 2015. Generation and Recognition of Covert Quick Response (QR) Codes, Bathinda: GIANI ZAIL SINGH PUNJAB TECHNICAL UNIVERSITY CAMPUS.
Bhatia, T. S., Singh, H., Litoria, P. K. & Pateriya, B., 2018. Web GIS Development using Open Source Leaflet and Geoserver Toolkit. IJCST, 9(3), pp. 29-33.
Bin Ali , N. M., Emran , M. & Parvez, M., 2015. Design and Implementation of a Secure Campus Network. International Journal of Emerging Technology and Advanced Engineering, 5(7), pp. 370-374.
Bonnet , J. F., Devel , C., Faucher, P. & Roturier, J., 2002. Analysis of electricity and water end-uses in university campuses: case-study of the University of Bordeaux in the framework of the Ecocampus European Collaboration. Journal of Cleaner Production, 10(1), pp. 13-24.
Brahmbhatt, K., 2012. Mobile GIS Mobile Geographical Information System. s.l.:s.n.
Bröring, A., Remke, A. & Lasnia, D., 2012. SenseBox - A generic sensor platform for the web of things. s.l., s.n., pp. 186-196.
Chikumba, P. A., 2018. Integrative Approach of Implementing Geographic Information System for Health Management: Lessons Learnt from Malawi. American Journal of Information Systems, Volume 6, pp. 5-12.
Chung, M. H. & Rhee, E. K., 2014. Potential opportunities for energy conservation in existing buildings on university campus: A field survey in Korea. Energy and Buildings, Volume 78, pp. 176-182.
CIRIA, 2006. Sustainable water management in schools. s.l.:s.n.
Clemens, F. et al., 2009. Sewer Systems Module for Higher Professional Education. 2 ed. The Hague: KIVI/NIRIA.
Corcoran, E. et al., 2010. Sick Water? The central role of waste water management in sustainable development, Norway: Birkeland Trykkeri AS.
Cortese, A. D., 2003. The critical role of higher education in creating a sustainable future. Planning for Higher Education, 31(3), pp. 15-22.
Crawford, D., Hung, M., Drews, P. & Wu, Y.-H., 2012. IMPLEMENTING A UTILITY GEOGRAPHIC INFORMATION SYSTEM, Maryville: Northwest Missouru State University.

87
De Filippis , T., Rocchi, L. & Genesio, L., 2010. A WEBGIS APPLICATION FOR PRECISION VITICULTURE: FROM RESEARCH TO OPERATIVE PRACTICES. s.l., WebMGS 2010, ISPRS Conference, XXXVIII/4-W13., pp. 1-7.
Durrheim, K., 2004. Research Design. Research in practice: Applied methods for the social sciences, Volume 2, pp. 33-59.
El-Rabbany, A., 2002. Introduction to GPS: The Global Positioning System. Norwood: ARTECH HOUSE, INC..
Esri, 2019. Esri. [Online] Available at: https://www.esri.com [Accessed 16 July 2019].
Evangelinos , K. I., Jones , N. & Panoriou, E. M., 2009. Challenges and opportunities for sustainability in regional universities: a case study in Mytilene, Greece. Journal of Cleaner Production, 17(12), pp. 1154-1161.
Fu, P. & Sun, J., 2012. Web GIS: Principles and Applications. s.l.:ESRI.
Geoserver, 2019. Geoserver. [Online] Available at: http://geoserver.org/about/ [Accessed 16 July 2019].
Gopikrishnan, S. et al., 2017. Path Planning Algorithms : A comparative study PATH PLANNING ALGORITHMS : A COMPARATIVE STUDY. November, s.n.
Grise, S., Idolyantes, E. & Zeiler, M., 2012. Water Utilities. New York: ESRI Press.
Huang, G. & Gao, S., 2018. Location-Based Services. In: The Geographic Information Science & Technology Body of Knowledge. s.l.:John P. Wilson.
Ikiara, M., 2006. Municipal solid waste management challenges in Kenya. Urban Settlement, 15(13).
Jackson, D. W., 2011. Standard Bar Codes Beware-Smartphone Users May Prefer QR Codes. Law Libr. J, 103(1), pp. 153-158.
Jang, S. H., 2010. A QR Code-based Indoor Navigation System Using Augmented Reality.
Jeefoo, P., 2015. Real-time Field Survey Using Android-based Interface of Mobile GIS. Issue March.
Kanabar, N., Doshi, U., Jha, S. & Bhargava, A., 2018. Global Positioning System. International Journal of Engineeroing Research & Technology, 6(12), pp. 1-3.
Kim , D. W., Jung , J. W. & Seok, H. T., 2010. The Survey and Analysis of Energy Consumption in University Campuses. Seoul, International Conference on Sustainable Building Asia.

88
Kiprop, H., 2008. Solid waste characterization and recycling potential for a university campus: A case of the Catholic University of East Africa. Great Lakes Journal of Social Studies, 28(1), p. S21–S26.
Kizil, U. & Tisor, L., 2011. Evaluation of RTK-GPS and Total Station for applications in land surveying. Indian Academy of Sciences, 120(2), pp. 215-221.
Klimek, R. & Szwed, P., 2010. Formal Analysis Of Use Case Diagrams. Computer Science, Volume 11, pp. 115-131.
Kluge, J., Kargl, F. & Weber, M., n.d. THE EFFECTS OF THE AJAX TECHNOLOGY ON WEB APPLICATION USABILITY. Volume 289-294.
Kumar, Y. & Mutreja, J., 2013. Developing An Application For M-GIS To Access Geoserver Through Mobile For Importing Shapefile. International Journal of Engineering Research & Technology (IJERT), 2(4), pp. 2690-2699.
Leaflet, 2019. Leaflet. [Online] Available at: http://leafletjs.com/ [Accessed 16 July 2019].
Lee, D.-W.et al., 2012. A Case Study of Electric Power Consumption Characteristics in University Building. Journal of the Korean Solar Energy Society, 32(4), pp. 90-95.
Liao, L., Bao, T. & Ban, J., 2017. The Application of Mobile GIS Based on Wireless Sensor Network in the Forest Environment Real-time Monitoring. s.l., s.n.
Liao, L., Bao, T. & Ban, T., 2016. The Application of Mobile GIS Based on Wireless Sensor Network in the Forest Environment Real-time Monitoring. Beijing, 3rd International Conference on Wireless Communication and Sensor Network.
Liu, X. et al., 2016. Study on Treatment of Campus Domestic Wastewater for Landscape Water Treatment by Hydrolytic Acidification Biological Contact Oxidation Process. CHEMICAL ENGINEERING TRANSACTIONS, Volume 55, pp. 157-162.
Liu, X. & Gong, D., 2011. A Comparative Study of A-star Algorithms for Search and rescue in Perfect Maze. s.l., s.n.
Lwin, K. K. & Murayama, Y., 2011. Web-Based GIS System for Real-Time Field Data. Journal of Geographic Information System Collection Using a Personal Mobile Phone, Volume 3, pp. 382-389.
MacMillan, . J. H. & Schumacher, S., 2001. Research in Education. A Conceptual Introduction. 5 ed. Boston: Longman.
Maguire , D. J., Goodchild, M. F. & Rhind, D., 1991. An overview and definition of GIS, in Geographical Information Systems: Principles and Applications. New York: Wiley & Sons, Inc.

89
McHugh, A. N., Richardson, C. J., Clark, C. & Kramer, R., 2011. An Assessment of Sustainable Water Management at University Campuses, Durham: Department of the Environment Duke University.
Mohammed, W. E., 2014. Free and Open Source GIS: An Overview on he Recent Evolution of Projects, Standards and Communities. s.l., Collage of Architecture & Planning, University of Dammam.
Mule, S. S. & Waykar, Y., 2015. role of use case diagram in software development. International Journal of Management and Economics.
Mulyawan, B., 2011. Campus Network Design And Implementation Using Top Down Approach: A Case Study Tarumanagara University. Jakarta, Proceedings of The 1st International Conference on Information Systems For Business Competitiveness (ICISBC) 2011.
Mushonga, H., Banda, F. S. & Mulolwa, A., 2017. Development of a web based GIS for health facilities mapping , monitoring and reporting : A case study of the Zambian Ministry of health. South African Journal of Geomatics, 6(3), pp. 321-332.
Nagarajan , S. & Gopalan, N. P., 2016. A dynamic context aware role based access control model for wireless network's application case study in mobile GIS. International Journal of Applied Engineering Research, 11(6), pp. 4144-4149.
Neene, V. & Kabemba, M., 2017. Development of a Mobile GIS Property Mapping Application using Mobile Cloud Computing. International Journal of Advanced Computer Science and Applications, 8(10), pp. 57-66.
Nelson, C., 2011. Network Management Policy. [Online] Available at: https://www2.le.ac.uk/offices/ias/resources/policies/ispolicy/strategic-policy/Network%20Management%20Policy%20-ISP-S12-%20V2.0.pdf [Accessed 12 August 2019].
Novandi, R., 2013. Perbandingan Algoritma Dijkstra dan Algoritma Floyd-Warshall dalam Penentuan Lintasan Terpendek ( Single Pair Shortest Path ). IF2251 Strategi Algoritmik, Volume 1, pp. 1-5.
Ogbaji, T. & Kunene, H., 2008. Towards zero waste in emerging countries – An African experience. Journal of Waste Managementt, 2(8), p. 1480–1492.
Okello, N., Banda , F. & Tembo, E., 2017. WebGIS for Water Utility Management at the Copperbelt University. Imperial Journal of Interdisciplinary Research (IJIR), 3(8), pp. 601-606.
Omogunloye, O. G., Qaadri, J. A., Omogunloye, H. B. & Oladiboye, O. E., 2013. Analysis of Mast Management Distribution and Telecommunication Service Using Geospatial Technique. IOSR Journal Of Environmental Science, Toxicology And Food Technology (IOSR-JESTFT), 3(3), pp. 58-75.
Otto, H. & Rolf, A., 2009. Principles of Geographic Information Systems. 4 ed. Enschede: The International Institution for Geo-Information Science and Earth Observation.

90
Pal, S. & Jha, K., 2017. Personal Marketing Framework based on QR Code. 4(8), pp. 65-87.
Persai, P. & Katiyar, S. K., 2015. Telecommunication Uitility Analysis using GIS and GPS Techniques. Journal of Geomatics, 9(2), pp. 203-212.
Pispidikis, I. & Dimopoulou, . E., 2015. Web Development of Spatial Content Management System through the Use of Free and Open-Source Technologies.Case Study in Rural Areas. Journal of Geographic Information System, Volume 7, pp. 527-540.
PostGIS, 2019. PostGIS. [Online] Available at: http://postgis.net/features/ [Accessed 16th July 2019].
PostgreSQL, 2019. PostgreSQL. [Online] Available at: https://www.postgresql.org/about/ [Accessed 16 July 2019].
Pressman , R. S., 2005. Software engineering: a practitioner’s approach. s.l.:Palgrave Macmillan.
Rajeshkumar, A. J., Shashikant , P. & Shashikant, S. A., 2017. Web-GIS based application for utility management system. Journal of Geomatics, 11(1), pp. 1-12.
Ramadiani, R., Mulawarman, U. & Azainil, A., 2018. Floyd-warshall algorithm to determine the shortest path based on android Related content Floyd-warshall algorithm to determine the shortest path based on android. s.l., s.n.
Ruan, K. & Jeong, H., 2012. An Augmented Reality System Using QR Code as Marker in Android Smartphone. s.l., s.n.
Ryu, H., 2010. Status and Prospects of Smartphone Applications, s.l.: s.n.
Sangaiah, A., Han, M. & Zhang, S., 2014. An Investigation of Dijkstra and Floyd Algorithms in National City Traffic Advisory Procedures. International Journal of Computer Science and Mobile Computing, 3(2), pp. 124-138.
Sarkar, N. I. & Byrne , C., 2005. Upgrading to Gigabit Ethernet: The Case of a Large New Zealand Organisation. Auckland, School of Computer and Information Sciences, Auckland University of Technology.
Schulz, M. K., 2013. A case study on the appropriateness of using quick response (QR) codes in libraries and museums. Libr. Inf. Sci. Res., 35(3), pp. 207-215.
Sharma, R., Garg, S., Kaushik, S. & Setiya, H., 2013. Develop A Electricity Utility Network Using GIS. International Journal of Computational Engineering Research, 3(5), pp. 123-129.
Shyr, W. & Chen, C., 2017. Designing a technology‐enhanced flipped learning system to facilitate students' self‐regulation and performance. Journal of Computer Assisted Learning, 34(1).

91
Singh , P. S., Chutia, D. & Sudha, S., 2012. Development of a Web Based GIS Application for Spatial Natural Resources Information System Using Effective Open Source Software and Standards. Journal of Geographic Information System, Volume 4, pp. 261-266.
Singh, P. S. et al., 2015. Dynamic shortest route finder using pgRouting for emergency management. In: Applied Geomatics. s.l.:Springer.
Singh, S., 2016. QR Code Analysis. 6(5), pp. 89-92.
Somers, R. M., 1998. Developing GIS Management Strategies for an Organization. Journal of Housing Research, 9(1), pp. 157-178.
Starovoytova , D. & Namango, S., 2018. Solid Waste Management at a University Campus (Part 3/10): Waste Generators, Current Practices, and Compliance with relevant-law-provisions.. Journal of Environment and Earth Science, 8(6).
Steiniger, S. & Bocher, E., 2008. An Overview on Current Free and Open Source Desktop GIS Developments. International Journal of Geographical Information Science, Volume 1, pp. 1-24.
Tchobanaglous, M., 1993. Municipal solid waste management in Malaysia: practices and challenges. Journal of Waste Management, Volume 29, p. 2902–2906.
Teresa, B. S., Pereira, A. L., Girubaa, G. & Pavithra, M., 2018. AJAX TECHNOLOGY. International Research Journal of Engineering and Technology (IRJET), 5(1), pp. 1088-1090.
Tobi, H. & Kampen, J. k., 2018. Research design: the methodology for interdisciplinary research framework. Quality Quantity, 52(3), pp. 1209-1225.
TurfJS, 2019. Turf JS. [Online] Available at: https://turfjs.org/about [Accessed 16 July 2019].
Tyagi, N., 2014. Web GIS application for customized tourist information system for Eastern U. P., India. Journal of Geomatics, 8(1), pp. 1-6.
Wright, D. J., Goodchild, M. F. & Proctor, J. D., 1997. Densifying the Persistent Ambiguity of GIS as a "Tool" vs "Science". The Annuals of the Association of American Geographers, 87(2), pp. 346-362.
Wu, F. et al., 2016. The Digital Age of Campus Maps on Mobile Devices. Journal of Computer and Communications, Volume 4, pp. 22-30.
Yun, H., Han, D. & Lee, C. C., 2013. UNDERSTANDING THE USE OF LOCATION-BASED SERVICE APPLICATIONS : DO PRIVACY CONCERNS MATTER ?. Journal of Electronic Commerce Research, 14(3), pp. 215-230.
Zerihun, M. E., 2017. Web Based GIS for Tourism Development Using Effective Free and Open Source Software Case Study: Gondor Town and Its Surrounding Area, Ethiopia. Journal of Geographic Information System, pp. 47-58.
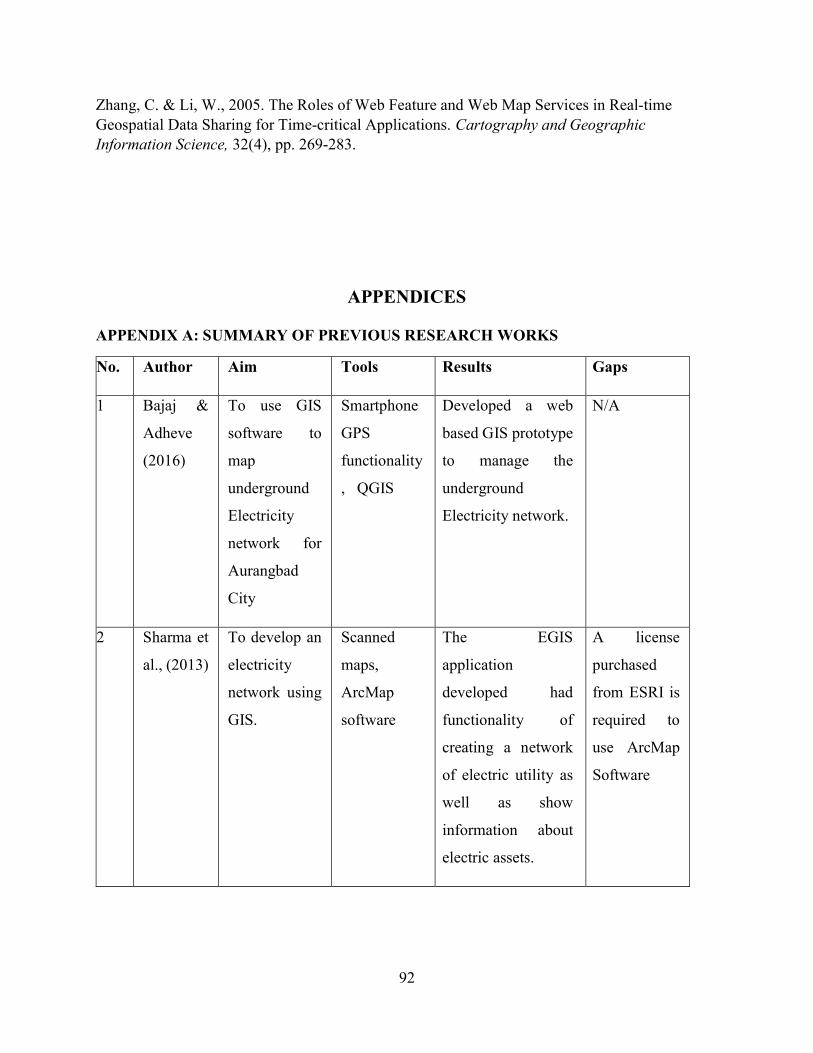
92
Zhang, C. & Li, W., 2005. The Roles of Web Feature and Web Map Services in Real-time Geospatial Data Sharing for Time-critical Applications. Cartography and Geographic Information Science, 32(4), pp. 269-283.
APPENDICES
APPENDIX A: SUMMARY OF PREVIOUS RESEARCH WORKS
No. Author Aim Tools Results Gaps
1 Bajaj &
Adheve
(2016)
To use GIS
software to
map
underground
Electricity
network for
Aurangbad
City
Smartphone
GPS
functionality
, QGIS
Developed a web
based GIS prototype
to manage the
underground
Electricity network.
N/A
2 Sharma et
al., (2013)
To develop an
electricity
network using
GIS.
Scanned
maps,
ArcMap
software
The EGIS
application
developed had
functionality of
creating a network
of electric utility as
well as show
information about
electric assets.
A license
purchased
from ESRI is
required to
use ArcMap
Software

93
3 Okello N.
et al
(2017)
The aim of the
study was to
develop a
WebGIS for
effectively
and efficiently
managing the
water utilities
at the
Copperbelt
University
PostgreSQL
/PostGIS,
QGIS and
Geoserver
The developed a
webGIS application
that could act as a
decision support
tool for the end-
users and decision
makers in the
effective and
efficient
management of the
water utility
networks at CBU.
Electrical and
Telecommun
ication lines
were not
mapped.
4 Crawford
and Hung
(2015)
To implement
a utility GIS
for water,
sewer and
electricity.
Differential
GPS, Aerial
Photographs
, ArcGIS
server
Enterprise
Advance,
Flex
Builder.
Telecommunication
s, electric,
wastewater, water,
buildings etc., were
mapped and
digitized into GIS
layers.
The web
mapping
application
was built
using ESRI's
ArcGIS
Server based
on ArcMap
software
which is a
commercial
software and
therefore
requires a
license

94
5 Khawash
S. et al.,
(2015)
To map the
electrical
distribution
network of
Phuentsholing
town.
Handheld
GPS,
existing
maps,
ArcMap,
DEM
A GIS tool was
developed to
provide digital
information of the
distribution
network.
Mapping was
conducted
using a
Handheld
GPS.
Tolerance of
a handheld
GPS is 10m
radius hence
mapping was
less accurate.
6 Anbazhag
an et al.,
(2013)
To use GPS,
GIS and
remote
sensing
techniques to
map
infrastructure
for Pericarp
University
Earth
Imagery,
QGIS,
Differential
GPS
A land cover map
showing Buildings,
roads, water bodies
and other utility
facilities was
produced. A contour
map of the Perivar
University was also
produced.
N/A

95
7 Abdulrah
man &
Al-
Ramadan
(2013)
To give a
general view
of
geographical
information
system and
spatial
informatics
techniques
and their
possible use in
specific
Electric power
system
problems
Differential
GPS,
ArcMap
Described GIS
application to
determine
transmission line
routing, disaster
management and
locating faults,
management,
Analysis of revenue
patterns.
ArcMap
software is a
commercial
software and
therefore
requires one
to buy a
license.
8 Omugunl
oye et al.,
(2013)
To analyse
Mast
Management
Distribution
and
Telecommuni
cation Service
Using
Geospatial
Technique
Franson
Coordinate
Converter,
Autodesk
3ds Max
2008, ESRI
ArcGIS 9.2
Desktop,
Earth Plus
5.0, Surfer
8.0 and
Autodesk
AutoCAD
2006
The study provided
graphical
representation of
information to
support
telecommunication
providers about
network planning
and management
through the spatial
representation of the
available masts of
telecommunications
providers and the
used
commercial
software i.e.,
ArcMap and
Surfer to
carry GIS
operations.

96
proposed location of
joint masts
9 Persai &
Kativar
(2015)
To analyse
and perform
GIS
techniques to
identify
radiation
affected
zones.
Handheld
GPS,
ArcMap
software
Radiation affected
zones were
identified. Contour
map and route
network analysis
map were produced.
A license
purchased
from ESRI is
required to
use ArcMap
Software
10 Rajeshku
mar et al.,
(2017)
To a WebGIS
application for
utility
management
using open
source
technologies
PostgreSQL
/PostGIS,
Geoserver,
OpenLayers,
GeoExt,
ExtJS
Developed a web
based GIS
application that
could be used to
visualize and
maintain a utilities
such as water,
sewer, electricity,
telecommunication
etc.
The WebGIS
management
system did
not
incorporate
the use of a
mobile phone
application.
11 Zerihun,
M.E.
(2017)
To develop
WebGIS for
tourism
development
using FOSS in
Gondor town,
Ethiopia
Handheld
GPS,
ArcMap,
QGIS,
MYSQL
database
server,
Apache,
A web based GIS
interactive map was
developed to
promote the tourism
industry
Mobile based
GIS
technology
had not been
incorporated
with the
developed
WebGIS
system.

97
Code
Lobster IDE
12 Tyagi N.
(2014)
To create a
Web GIS
based
database for
tourism
industry in
Uttar Pradesh,
India
Handheld
GPS,
ArcMap 9.2,
Autodesk-
Map Guide
An interactive
Tourism
Information System
(TIS) was developed
and was linked to
the internet to
maximize the
accessibility of
reliable information.
N/A
13 Singh
P.S. et al.,
(2012)
Develop a
WebGIS
based
application for
spatial Natural
Information
System
PostgreSQL
/PostGIS,
PHP,
Apache,
UMN
MapServer
the webGIS
application was
developed using
Open source
software
N/A

98
14 De
Filippis T.
et al.,
(2010)
To develop a
webGIS
application for
precision
viticulture for
farmers
MapServer,
PostgreSQL
/PostGIS,
PHP/Ajax
The developed a
webGIS application
that could act as a
decision support
tool for the end-The
developed
application enabled
farmers and
researchers to access
geographical
information without
using commercial
software.
N/A
15 Lwin K.
&
Murayam
a Y.
(2011)
To design a
web based
GIS for real-
time field data
collection
using a
mobile phone
AJAX,
ASP.NET,
VDS
technologies
The developed
mobile application
allowed users to
create, edit and
modify survey items
and attach
multimedia
information.
N/A
16 Wu et al.,
(2016)
To design a
map of
Tuskegee
University
that could be
accessed via
mobile
application for
Android
SDK,
Eclipse
the mobile
application created a
digital campus map
for students and
guests at the
university.
N/A

99
students and
visitors to use
17 Pispidikis
I. &
Dimopoul
ou E.
(2015)
To analyse
technologies
used to
develop a web
based spatial
content
management
system
PostgreSQL
/PostGIS,
Ext JS, PHP,
Geoserver,
Javascript
a web based GIS
was created using
FOSS.
N/A
18 Behncke
K. &
Ehlers M.
(2012)
To develop a
Web portal for
Osnabruck
city in
Germany
MapFish,
MapServer,
PostgreSQL
/PostGIS
The developed
MobileGIS
application was
provided functions
such as navigation,
zooming, routing
etc.
N/A
19 Bhatia T.
S. et al.,
(2018)
To create a
WebGIS
application
using open
source tools
Geoserver,
Leaflet
The WebGIS
application enabled
the end users to
perform
functionalities such
as pan, zoom,
measure, search bar
etc.
N/A

100
20 Liao L. et
al., (2016)
To develop a
MobileGIS
application
based on WSN
to monitor
forest
environment
in real-time.
iOS SDK,
ArcMap,
ZigBee
wireless ad
hoc network
The application
provided
functionalities such
as GPS, webmap
display and editing
of geographical
data.
MobileGIS
application
was based on
commercial
source
ArcMap
software
21 Neene &
Kabemba,
(2017)
To study the
challenges
local
authorities in
Lusaka
province
experience
Leaflet JS,
PostgreSQL
/PostGIS,
Netbeans
IDE
Developed a mobile
GIS for property
mapping application
N/A
22 Singh et
al., (2015)
To Perform
path analysis
to give the
shortest and
alternate path
based on
different
disaster
conditions.
PostgreSQL
/PostGIS,
Mapserver,
Geoserver
Extensively
analyzed the
shortest and
alternate path using
pgRouting taking
into account the
single and multiple
obstructions of road
segments due to
natural disasters.
N/A

101
23 Jang,
(2010)
To develop a
QR Code-
based Indoor
Navigation
System Using
Augmented
Reality
Zebra
Crossing
library, Java
programmin
g language,
Android
SDK
Developed a mobile
Augmented Reality
(AR) indoor
navigation system
which could be used
in defined areas
such as museums or
exhibition centres.
N/A

102
APPENDIX B: ETHICAL CLEARANCE LETTER

103
APPENDIX C: SOFTWARE INSTALLATION
Installing PostgreSQL/PostGIS
Installing PostgreSQL Download and Install PostgreSQL.
Change the Port number to 5433 while installation. Also download the PostGIS extension
using stack builder by checking “Spatial Extension” option during the installation of
PostgreSQL.
Loading Shape files into the PostgreSQL Database: Before importing the shape file to the
database, add PostGIS extension in the database.
Open pgAdmin III, connect to Database Server in Object Explorer, Explore Database then
right click on” Extensions” and click on “New Extension”, select the extension “PostGIS”
from dropdown.
Create Extension PostGIS;
Open PostGIS Shapefile Import/Export Manager and establish a connection by clicking on
view connection details and provide the connection parameters like Username, Password,
Database, Server.
Usually the values will be Host= “localhost” and Port=”5433”.
Browse Shape file (geo spatial data) using
Add File button and click on Import button.

104
Installing Geoserver
Install the Java Development Kit (JDK) downloaded from [11]. JDK is required to run and develop
Java application on the computer system.
• Install the Apache Tomcat Server.
• Install the GeoServer package in Apache Tomcat, download it from [12]. Refer [13] for the
installation process.
• Open any internet browser and type http://localhost:1234/Dashboard/ to open the dashboard of
Geoserver. (1234 is the port and may be changed)
• Login to the GeoServer using the address http://localhost:1234/geoserver/web/ (Default
username is “admin” and password is “geoserver”).
• Add a new Workspace in GeoServer using the link in the left panel. Workspaces: Add new
Workspace and Type the “Workspace Name” in Name and Namespace URI text field and click
“Submit”.
• Add a new PostGIS store in GeoServer using the link in the left panel. Fill the basic store
information and connection parameters.
• Click on the “Publish” tab and select the GIS layer projection system in “Declared SRS” and
then compute the coordinates from “Bounding Boxes” and provide other details like styling (If
required). Now layer can be viewed in the “Layer Preview” option.

105
APPENDIX D: PUBLICATIONS FROM DISSERTATION
Conference Paper
Twataizya Minango, Jackson Phiri, and Faustin S Banda. 2019. “GIS Management Tool for Managing of Underground Electrical and Telecommunication Networks at the University of Zambia.” In PROCEEDINGS OF THE INTERNATIONAL CONFERENCE IN ICT (ICICT2019), Lusaka, 122–126.

106
Journal Article
Awaiting feedback on the journal article submitted to Geo-spatial Information Science for peer
review.
Copyright © 2022 FDOKUMEN