treatment of criminals at mari - Institutional Repository Home
Upload
khangminh22Category
view
0download
0
1
Drivers Of Performance Excellence In Universities In Kenya
Mbote Paul Koigi
A Thesis Submitted to the School of Business Management and Economics
in Partial Fulfilment of the requirement for the Award of
Doctor of Philosophy in Business Administration and Management
(Leadership Option) of Dedan Kimathi University of Technology
January, 2019
ii
DECLARATION
This thesis is my original work and has not been presented for the award of a degree in any
other University.
Signature________________________ Date__________________________
Mbote Paul Koigi
Reg. No. B311-0011/2012
APPROVAL
We confirm this research was undertaken under our supervision as the University
Supervisor(s).
Signature________________________ Date___________________________
Prof. Simmy Mwita Marwa, PhD
School of Business Management and Economics
Dedan Kimathi University of Technology,
Kenya
Signature________________________ Date___________________________
Prof. Matthew M. Theuri, PhD
School of Business Management and Economics
Dedan Kimathi University of Technology,
Kenya
Signature_________________________ Date___________________________
Dr. David Kiragu, PhD
School of Business Management and Economics
Dedan Kimathi University of Technology,
Kenya
iii
DEDICATION
This PhD research is dedicated to my loving wife, Mrs Nancy Njeri and my daughters Clare,
Victoria and Natalia for their support and patience while I was engaged in my studies.
Receive my warm gratitude and God bless you.
iv
ACKNOWLEDGEMENT
I first thank our Almighty God for his deep love and compassion throughout my studies, It is
through his grace that I have managed to come this far.
My appreciation goes to my supervisors Prof. Mwita Marwa, Prof. Matthew Theuri and Dr.
David Kiragu for the invaluable contribution in my studies. I am very grateful for your
continued mentorship, informed comments and assistance during my studies, you were ever
available for consultation and guidance. Thank you so much Prof. Peter Muchiri and Dr
Antony Ngunyi for your continued support, mentorship, great suggestions and advice up to
the end which enhanced my research. I appreciate all the faculty members and fellow
students of Dedan Kimathi University of Technology for their moral support and contribution
during the course of my studies. Many other friends played major role towards the success of
my studies and I in a special way appreciate their contribution.
I would like to thank the 12 universities who were part of this survey especially Deans,
Directors, Chairmen of Departments and Heads of Departments who were my respondent in
from these respective universities. I would not have accomplished this study without your
participation and commitment in provision of the data.
Special thanks to my wife Nancy Njeri, daughters Clare Wangui Koigi, Victoria Wambui
Koigi and Natalia Wanjiku Koigi for your encouragement, support and having to understand
my absence from home over the weekends and late in the evenings as I went through this
journey. To my dear parents Peter Mbote Muchatha and Mary Wangui Mbote, thank you for
your prayers and showing me the importance of education. To other family members, I say
thank you.

v
TABLE OF CONTENTS
DECLARATION...................................................................................................................... ii
DEDICATION.........................................................................................................................iii
ACKNOWLEDGEMENT ...................................................................................................... iv
TABLE OF CONTENTS ........................................................................................................ v
LIST OF TABLES ................................................................................................................... x
LIST OF FIGURES ..............................................................................................................xiii
LIST OF APPENDICES ...................................................................................................... xiv
ABBREVIATION AND ACRONYMS ................................................................................ xv
Abstract ................................................................................................................................. xvii
CHAPTER ONE ...................................................................................................................... 1
INTRODUCTION.................................................................................................................... 1
1.1 Background of Study ................................................................................................... 1
1.1.1 Global Higher Education Sector .......................................................................... 4
1.1.2 Higher Education Institution in Africa ................................................................ 8
1.1.3 Higher Education Sector in Kenya ...................................................................... 9
1.2 Statement of the Problem .......................................................................................... 15
1.3 Purpose of the Study ................................................................................................. 18
1.4 General Research Objective ...................................................................................... 18
1.4.1 Specific Objectives ............................................................................................ 18
1.4.2 Research Questions ............................................................................................ 18
1.5 Scope of the Study..................................................................................................... 19
1.6 Significance of the Study .......................................................................................... 20
1.7 Limitation of the Study ............................................................................................. 21
1.8 Assumption of the Study ........................................................................................... 22
1.9 Definition of Operational Terms ............................................................................... 22
CHAPTER TWO ................................................................................................................... 25
vi
LITERATURE REVIEW ..................................................................................................... 25
2.1 Introduction ............................................................................................................... 25
2.1.1 Concept of Performance Excellence .................................................................. 25
2.1.2 Organizational Excellence Models .................................................................... 31
2.2 Theoretical Review ................................................................................................... 41
2.2.1 Leadership Theories ........................................................................................... 41
2.2.2 System Theory ................................................................................................... 44
2.2.3 Contingency Theory........................................................................................... 47
2.2.4 Resource Based View Theory ............................................................................ 48
2.3 Empirical Literature Review ..................................................................................... 50
2.4.1 Leadership and Performance Excellence ........................................................... 56
2.4.2 People Management and Performance Excellence ............................................ 78
2.4.3 Resources and Performance Excellence ............................................................ 84
2.4.4 Partnership and Collaboration and Performance Excellence ............................. 98
2.4.5 Internationalization and Performance Excellence ........................................... 102
2.4.6 University Policies and Strategies and Performance Excellence ..................... 105
2.4.7 Processes, Product and Services and Performance Excellence ....................... 109
2.4 Conceptual Frame Work ......................................................................................... 116
2.5 Operational framework ........................................................................................... 118
2.6 Research Gaps ......................................................................................................... 120
CHAPTER THREE ............................................................................................................. 121
RESEARCH METHODOLOGY ....................................................................................... 121
Introduction ............................................................................................................. 121
Research Philosophy ............................................................................................... 121
Research Design ...................................................................................................... 122
Sampling Frame ...................................................................................................... 124
Population of the Study ........................................................................................... 124
vii
Sampling Techniques and Sample Size .................................................................. 125
3.6.1 Sampling Techniques ....................................................................................... 126
3.6.2 Sample Size ...................................................................................................... 126
Data Collection and Data Collection Instrument .................................................... 129
Pilot Study ............................................................................................................... 131
3.8.1 Testing of Reliability ....................................................................................... 131
3.8.2 Test for Validity ............................................................................................... 132
Data Analysis and Presentation of Results .............................................................. 133
3.9.1 Kaiser-Meyer-Olkin and Bartlett’s test of Sphericity ...................................... 134
3.9.2 Factor Analysis ................................................................................................ 135
3.9.3 Correlation analysis ......................................................................................... 138
Preliminary Test ...................................................................................................... 138
Ethical Consideration .............................................................................................. 140
CHAPTER FOUR ................................................................................................................ 141
RESEARCH FINDINGS AND DISCUSSION .................................................................. 141
4.1 Introduction ............................................................................................................. 141
4.2 Response Rates ........................................................................................................ 141
4.2.1 Response rate per University ........................................................................... 142
4.2.2 Response rate by Number of Years they have worked in the University ........ 143
4.2.3 Response rate by Number of years worked in their current Institution ........... 143
4.2.4 Response by Level of Academic Qualifications .............................................. 144
4.2.5 Response by Number of years of Experience in Current Position................... 144
4.3 Reliability Analysis of Variables ............................................................................ 145
4.4 Descriptive Analysis of the Study Variables........................................................... 145
4.4.1 Descriptive Analysis for Performance Excellence .......................................... 146
4.4.2 Descriptive Analysis for Leadership ................................................................ 147
4.4.3 Descriptive Analysis on People Management ................................................. 149
viii
4.4.4 Descriptive Analysis for Resources ................................................................. 150
4.4.5 Descriptive Analysis for Partnership and Collaboration ................................. 151
4.4.6 Descriptive Analysis for Internationalization .................................................. 153
4.4.7 Descriptive analysis for Policies and Strategy ................................................. 156
4.4.8 Descriptive Analysis for Process, Product and Services ................................. 157
4.5 Analysis for Drivers of Performance Excellence .................................................... 160
4.5.1 Factor Analysis for Performance Excellence ................................................... 161
4.5.2 Drivers for Leadership ..................................................................................... 163
4.5.3 Drivers for People Management ...................................................................... 167
4.5.4 Drivers for Policy and Strategy........................................................................ 170
4.5.5 Drivers for Resources ...................................................................................... 172
4.5.6 Drivers Partnership and Collaboration............................................................. 176
4.5.7 Drivers for Internationalization ........................................................................ 179
4.5.8 Drivers for Processes, Product and Services .................................................... 182
4.6 Post Factor Analysis Reliability Test ...................................................................... 185
4.7 Test of Regression Assumptions ............................................................................. 186
4.7.1 Test of Normality for Performance Excellence ............................................... 187
4.7.2 Test of Linearity for Study Variables .............................................................. 188
4.7.3 Test of Independence for Independent Variable .............................................. 190
4.7.4 Test of Multicollinearity for Independent Variable ......................................... 190
4.8 Gaps in Drivers of Performance Excellence ........................................................... 191
4.8.1 Bivariate Analysis of Drivers and Performance Excellence ............................ 191
4.8.2 Combined Regression Analysis for all the Independent Variables ................. 207
4.9 Comparison between Drivers for Public and Private Universities .......................... 211
4.10 Revised Framework of Assessing Performance Excellence ................................... 217
ix
CHAPTER FIVE ................................................................................................................. 219
SUMMARY, CONCLUSION AND RECOMMENDATIONS ....................................... 219
5.1 Introduction ............................................................................................................. 219
5.2 Summary of the key findings .................................................................................. 219
5.2.1 Drivers of Performance Excellence ................................................................. 220
5.2.2 Gaps in Drivers of Performance Excellence .................................................... 223
5.2.3 Drivers of Performance Excellence in Public and Private Universities .......... 223
5.2.4 A framework for Assessing Performance Excellence in Kenyan HEIs ........... 225
5.2.5 Recommendations to grow Performance Excellence in Kenya Universities. .. 225
5.3 Research contribution to the knowledge and Implications ..................................... 230
5.4 Conclusion ............................................................................................................... 232
5.5 Recommendation for Further Research................................................................... 234
REFERENCES ..................................................................................................................... 235
APPENDICES ...................................................................................................................... 260
x
LIST OF TABLES
Table 1.1: Recommended full-time staff: student ratio ........................................................... 14
Table 2.1: Parameter Used for Ranking .................................................................................. 27
Table 2.2: Combining Management and Leadership Success ................................................. 57
Table 2.3: Academic Staff Population ..................................................................................... 82
Table 2.4: Student lecturer ratio of the top Universities in the world...................................... 84
Table: 4.1 Response Rate ....................................................................................................... 141
Table: 4.2 Response Rate ....................................................................................................... 142
Table 4.3: Response Rate by Number of years worked in University setting ....................... 143
Table 4.4: Response rate by Number of years worked in the current University .................. 143
Table 4.5: Respondent rate by Level of Academic Qualification .......................................... 144
Table 4.6: Response by No. of Years of Experience in Current position .............................. 144
Table 4.7: Reliability Test..................................................................................................... 145
Table 4.8 Descriptive analysis for Performance Excellence ................................................. 146
Table 4.9 Descriptive Analysis for Partnership and Collaboration ....................................... 152
Table 4.10: Descriptive analysis for Internationalization ..................................................... 154
Table 4.11: Descriptive Analysis for Policies and Strategies ................................................ 156
Table 4.12: Descriptive Analysis for Process, Product and Services .................................... 158
Table 4.13 Factorability Test Results .................................................................................... 160
Table 4.14 Communalities for Performance .......................................................................... 161
Table 4.15: Total Variance Explained for Performance Excellence...................................... 162
Table 4.16: Rotated Component Matrix for Performance Excellence ................................... 163
Table 4.17: Table Communalities for Leadership ................................................................. 164
Table 4.18: Total Variance Explained for Leadership ........................................................... 165
Table 4.19: Component Loading for Rotated Component of Leadership ............................. 166
Table 4.20: Communalities for People Management ............................................................ 167
Table 4.21: Total Variance Explained for People Management ............................................ 168
Table 4.22: Rotated Component Matrix for People Management ....................................... 169
Table 4.23 : Policy and Strategy Communalities................................................................... 170
Table 4.24 Total Variance Explained .................................................................................... 171
Table 4.25: Rotated component Matrix ................................................................................. 172
Table 4.26: Communalities for Resources ............................................................................. 173
Table 4.27: Total Variance Explained for Resources ........................................................... 174
xi
Table 4.28: Rotated component Matrix for Resources ........................................................ 175
Table 4.29: Communalities for Partnership and Collaboration ............................................. 176
Table 4.30: Total Variance Explained for Partnership and Collaboration............................. 177
Table 4.31: Component Matrix for Partnership and Collaboration ....................................... 179
Table 4.32: Communalities for Internationalization .............................................................. 180
Table 4.33: Total Variance Explained for Internationalization ............................................. 180
Table 4.34: Component Matrix for Internationalization ....................................................... 181
Table 4.35: Communalities for Processes, Product and Services .......................................... 182
Table 4.36: Total Variance Explained for Processes, Product and Services ......................... 183
Table 4.37: Rotated Component Matrix for Processes, Product and Services ..................... 185
Table 4.38: Post Factor Analysis Reliability Test ................................................................ 186
Table 4.39 Normality Test results for Performance excellence ............................................. 187
Table 4.40 Correlations Matrix Summary ............................................................................. 189
Table 4.41: Coefficients of Durbin-Watson Test of Independence ....................................... 190
Table 4.42: Multicollinearity Test Results............................................................................ 191
Table 4.43: Model Fitness for Leadership ............................................................................. 192
Table 4.44: ANOVA for Leadership ..................................................................................... 192
Table 4.45: Regression Coefficient for Leadership ............................................................... 193
Table 4.46: Model Fitness for People Management .............................................................. 194
Table 4.47: ANOVA for People Management ...................................................................... 194
Table 4.48: Regression coefficient for People Management ................................................. 195
Table 4.49: Model Fitness for Resources ............................................................................. 196
Table 4.50: ANOVA for Resources ....................................................................................... 196
Table 4.51: Regression Coefficient for Resources ................................................................ 198
Table 4.52: Model fitness for Partnership and Collaboration ................................................ 198
Table 4.53: ANOVA for Partnership and Collaboration ....................................................... 199
Table 4.54: Regression Coefficient for Partnership and Collaboration ................................. 200
Table 4.55: Model Fitness for Internationalization................................................................ 200
Table 4.56 ANOVA for Internationalization ......................................................................... 201
Table 4.57 Regression Coefficient for Internationalization ................................................... 202
Table 4.58: Model Fitness for Policy and Strategy................................................................ 202
Table 4.59 ANOVA for Policy and Strategy ......................................................................... 203
Table 4.60: Regression Coefficient for Policy and Strategy.................................................. 204
Table 4.61: Model fitness for Product, Processes and Services ............................................ 204
xii
Table 4.62 ANOVA for Processes, Product and Services ..................................................... 205
Table 4.63 Regression Coefficient for Product, Processes and Services ............................... 206
Table 4.64 Model Summary for Combined Independent Variables ...................................... 207
Table 4.65 ANOVA for Combined Independent Variables ................................................... 207
Table 4.66 Regression Coefficient of Combined Independent Variables .............................. 208
Table 4.67 Combined P-value............................................................................................... 211
Table 4.68: Model Summary for Driver of Performance in Public Universities ................... 212
Table 4.69 ANOVA for Drivers of Performance for Public Universities ............................. 212
Table 4.70 Regression Coefficients for Drivers of Performance for Public University ........ 213
Table 4.71: Model Summary for Drivers of Performance Private Universities .................... 214
Table 4.72: ANOVA for Drivers of Performance for Private University .............................. 214
Table 4.73: Regression Coefficients for Drivers of performance for Private University ...... 215
Table 4.74: Comparison between Public University and Private University ........................ 215
Table 4.75: Comparison for regression coefficient between Public and Private Universities
........................................................................................................................................ 216
xiii
LIST OF FIGURES
Figure 1.1: SJTU 2015 Ranking by Region; Top 100 ............................................................... 6
Figure 1.2: SJTU 2015 Ranking by Region; Top 400 ............................................................... 6
Figure 1.1: SJTU 2015 Ranking by Region; Top 100 ............................................................... 6
Figure 2.1: Performance measurement framework for Higher Education ............................... 31
Figure 2.2: EFQM fundamental Concepts ............................................................................... 32
Figure 2.3: EFQM Excellence Model. .................................................................................... 34
Figure 2.4: Customized Model in the University context ........................................................ 37
Figure 2.5: Malcolm Baldrige National Quality Award (MBNQA) Framework .................... 38
Figure 2.6: The System View of Organization ........................................................................ 46
Figure 2.7: Characteristic of World Class Universities ........................................................... 51
Figure 2.8: Schematic Drawing of the Study Structure ......................................................... 117
Figure 2.9: Conceptual Framework ....................................................................................... 118
Figure 2.10: Operational Framework for the Study ............................................................... 119
Formula 3.1: Simplified Yamane Formula ............................................................................ 128
Figure 4.1: Scree plot for Performance Scree Plot ................................................................ 162
Figure 4.2 Scree Plot for Leadership ..................................................................................... 165
Figure 4.3 Scree Plot for People Management ...................................................................... 168
Figure 4.4 Scree Plot for Policy and Strategy ........................................................................ 171
Figure 4.5 Scree Plot for Resources ....................................................................................... 174
Figure 4.6: Scree Plot for Partnership and Collaboration ...................................................... 178
Figure 4.7: Scree plot for Internationalization ....................................................................... 181
Figure 4.8: Scree plot Processes, Product and Services ........................................................ 184
Figure 4.9 Normal Q-Q plot for Performance excellence ...................................................... 188
Figure 4.10: The revised framework of assessing Performance Excellence ......................... 218
xiv
LIST OF APPENDICES
Appendix I: Study Questionnaire ................................................................................... 260
Appendix II: Accredited Universities ................................................................................ 268
Appendix III: Sample Size ................................................................................................. 269
Appendix IV: Descriptive Analysis for Leadership .......................................................... 270
Appendix V: Descriptive Analysis on People Management .............................................. 271
Appendix VI: Descriptive Analysis for Resources ........................................................... 272
Appendix VII: University Rankings .................................................................................. 273
Appendix VIII (a): Summary of driver of performance excellence from world class
universities ......................................................................................................................... 274
Appendix VIII (b): Common drivers of performance excellence in HEIs ......................... 280
Appendix IX: letters of Introduction and Authority to Collect Data ................................. 284
xv
ABBREVIATION AND ACRONYMS
ABEF Australian Business Excellence Framework
ARWU Academic ranking of World Universities
BSC Balanced Scorecard
CoDs Chairman of Departments
CUE Commission of University Education
CUE Commission of University Education
EFQM European Foundation Quality Management Model
EQ Emotional and Social Dimension
FTE Full-time equivalent
GDP Gross Domestic Product
GoK Government of Kenya
HEIs Higher Education Institutions
HIV Human Immuno-deficiency Virus
HoDs Head of Departments
I/O Industrial Organizational
ICT Information and Communication Technology
IE Industrial Experience
IK Inherent Knowledge
IQ Intellectual Dimensions
JKUAT Jomo Kenyatta University of Agriculture and Technology
J-WAFS Jameel World Water and food Security Lab
KBE Knowledge Based Economy
KPIs Key Performance Indicators
KU Kenyatta University
LIA Letter of Interim Authority
MBNQA Malcom Baldrige National Quality Award

xvi
MDGs Millennium Development Goals
MIT Massachusetts Institute of Technology
MoEST Ministry of Education Science and Technology
MOOC Massive Open Online Course
MQ Managerial Dimension
NEF Next Einstein Forum
NIST National Institute of Standards and Technology
NUS National University of Singapore
QS Quacquarelli Symonds
SJTU Shanghai Jiao Tong University ranking
SU Stellenbosch University
THE Times Higher Education
UCT University of Cape Town
UK United Kingdom
UoN University of Nairobi
USA United State of America
WCU World Class University
WUN World University Network
xvii
ABSTRACT
Globally, education plays a fundamental role in human capital development in both
developed and developing countries. Consequently, the performance of the higher education
institution worldwide is of great interest to any stable state. However, there have been
growing concerns over the performance of the universities globally. Though it is evidence in
literature that performance excellence of any organization depends on a number of factors;
social factors, environmental and culture among others, drivers of performance excellence in
HEIs in Kenya have not been adequately researched. The general objective of the study was
to explore drivers of performance excellence of universities in Kenya. Specific objective of
the study was to analyse drivers (leadership, people management, resources, partnership and
collaboration, internationalisation, policy and strategy, processes, product and services) of
performance excellence in universities in Kenya, explore the gaps in drivers of performance
excellence, compare the drivers for public and private universities and develop a framework
for assessing performance excellence for universities in Kenya. The study was guided by
positivist philosophy and therefore tested the model of university performance excellence and
employed descriptive design. The design used a survey method using self-administered,
semi-structured questionnaire for data collection. The data was collected through the drop
and pick method. The target population was 40 public and private Universities accredited in
Kenya as at July, 2016. Through purposive sampling a sample of 12 Universities was selected
6 private and 6 public. A sample size of 277 respondents was selected from the 12
universities using Yamane formula and proportionately allocated to the 12 universities. The
unit of measure was Deans, Directors, and chairpersons. Primary data was collected through
the administration of structured questionnaire. Statistical package for Social Sciences (SPSS)
was used to undertake data analysis including; descriptive statistics, factor analysis, bivariate
linear regression and combined regression. Kolmogorov-Smirnov (K-S) test of normality,
Durbin Watson d test for autocorrelation and correlation coefficient (r) test of linearity were
used to assess data for regression assumptions. Model fitness(R-square), F statistics and
regression coefficients were generated. Based on the study findings using the P-value to test
significance, all the variables were found to be independently statistically significant and can
independently explain variation in performance excellence as follows; leadership (70.5%),
people management (36.3%), resources (41.0%), partnership and collaboration (28.3%),
internationalisation (33.0%), policy and strategy (41.5%), processes, product and services
(20.6%). In combined model leadership, people management, resources and
internationalisation were found to be positively statistically significant while partnership and
collaboration, policy and strategy and, processes, product and services were statistically
insignificance. Further, the combined regression results indicate that 81.4% of variation in
performance excellence of universities in Kenya can be jointly explained by the seven
independent variables. In public universities leadership, people management, resources,
policy and strategy and internationalisation were significance while in private universities;
leadership, partnership and collaboration, resources, policy and strategy and processes,
product and services were statistically significance. The findings indicate that 78.6% and
95.1% of variation in performance excellence in public and private universities in Kenya
respectively can be jointly explained by the seven independent variables. Overall variation in
performance excellence can be explained more in private than public universities. This study
contributes to theory by developing a modified framework for drivers of performance
excellence. The study also contributes to knowledge by interrogating drivers of performance
excellence in HEIS. The study also identifies the gaps and recommends to the universities
managers and policy makers not only in Kenya but also globally areas to focus in their effort
to achieve performance excellence.

1
CHAPTER ONE
INTRODUCTION
1.1 Background of Study
Higher Education Institutions (HEIs) play valuable role to the economic development; they are
mandated with impacting and disseminating knowledge and ideas required as resource for the
national development through student education, they are primary source of the most valuable
assets in the knowledge economy (Lester, 2005; Cloete, Bailey & Pillay, 2011). In the Global
arena, these institutions are significantly recognized for their level of contribution to any
country’s gross domestic product (GDP) (Hatakenaka, 2004). According to Bloom, Canning &
Chan (2006), education is globally accepted as a driver of the economic development and
determinant of countries economic position in world economy. HEIs have the mandate of
creating awareness, knowledge and skills required for a sustainable future, they prepare
professionals, leaders, managers and teachers required by the society; they promote democracy
in governance, enhance social mobility, improve quality of life, contribute to entrepreneurial
development and labour generation (Cortese, 2003; Jalaliyoon & Taherdoost, 2012).
During the opening of Association of Commonwealth Universities in 2006, Abdullah Bin
Ahmed Badawi the then Prime Minister of Malysia remarked “I do believe that it is necessary to
stress that for most countries today, human resource development and human capital formation
are either extremely important, absolutely vital, or a matter of life and death. For Malaysia we
think it is a matter of life and death” (Salmi, 2009). This statement reflects high level of
recognition on the significant role played by the universities on human resource capacity
development and formation. According to Salmi, knowledge drives the growth of economy and
global competitiveness. This explains why the university ranking has been a major preoccupation
as everyone recognises the impact that it has as it describe its performance. In this regards, HEIs
not only have great financial and social impact to it surrounding, but they are also powerful
drivers of the economy worldwide. Universities are a source of scientific knowledge required to
develop new products and innovation in high technologies (Greenspan & Rosan, 2006). These
authors further note that universities are the key player in the generation of entrepreneurs, job
2
training and skill development. Higher education is a determinant of the income of a country and
a source of more entrepreneurial society. Many observers as noted by Blooms et al. (2006)
attribute the India’s economic growth to its decade’s effort to expand and provide quality
education to as many citizens as possible.
Universities constituencies including the alumni, stakeholders, community, their employees,
students and the entire nation value these institutions as engines of knowledge, and consequently
key pillars in the economic development. Henard & Leprince-Ringuet (2008) argue that, higher
education sector is experiencing a number of changes: rise in international competition, increase
in demand by the customers such as for value of their money, changes in student body socially
and the geographical diversity, the change in globalization needs and introduction of information
technologies. Universities have to therefore be strategic to fully address the ever changing needs
of its stakeholders. According to Porter (2006), universities have untapped potential in the
regional economic development which ultimately contributes to the nation’s development. Porter
(2006) further notes that, it is upon the leaders to understand the nature of the regional economy
and identify where the universities can contribute. Other than impacting on individual lives and
shaping society, HEIs are powerhouse of economic growth and they are part of the government
focus in developing economy and job creation (Willet, 2014). The contribution of HEIs to the
economic development will however be dependent on how well these institutions perform in
delivering their mandate. A few scholars have tried to understand what world class universities
have that which the ordinary universities may be lacking (Salmi,2009). It is the drivers that
influence the performance excellence of the HEIs that are discussed in this study.
According to McCormack, Propper & Smith (2013) performance of the Universities within any
state or country matters to its economic development. During 2014 commencement Speech,
Harvard University President Drew Faust argued that among the many society’s institutions, the
universities are uniquely accountable to the past and to the future. She pointed out that the
universities owe the world answers, since discovery is part of their mandate through seeking
solution to what seems unsolvable. Universities should engage their faculties and students to
seek answers in addressing the challenges facing the society. She further noted that just the same
3
way universities owe the world answers, they too owe them questions since question are
foundation of progress. Through questions one is able to get answers. Universities produce
knowledge and they owe the world men and women who can discover answers and ask question
and search for future (Harvard University, 2014).
Globally universities are valued as economic drivers, McCormack, Propper & Smith (2013)
observe that the latest universities publications in the United Kingdom (UK) always form a key
feature in the news headlines a clear indicator of the value and impact of universities in driving
research and innovation agenda. Government funding in a number of countries is also based on
University performance metric; which demonstrates the values of university performance by the
Government towards its country’s economic development. According to Gudo, Olel, & Oanda
(2011) though universities have a positive impact to the country’s economy, their performance of
is dependent on a number of factors. Some of these factors include the leadership and
management of the university, the country’s economy and the political environment. Leadership
exist in all settings including academic, religious, social, industrial, family, community or in
political affairs. James and Ogbonna (2013) argue that, the general wellbeing of any organization
or nation is massively determined by leadership status. However, leadership does not work in
isolation; it is also influenced by many other factors. To achieve performance excellence HEIs
need to develop and make use of good leadership and management practices and the application
of excellence models such as EFQM Excellence Model, Balanced Scorecard and Malcom
Baldrige National Quality Award (MBNQA).
There is a constant need to measure performance of HEIs which have to comply with the
Government’s mandates, compete globally for students and researchers, and generate new ideas,
curriculum review and the need to justify their recognition and accreditations (Reuters, 2008).
According to Reuter (2008) despite the changing role of HEIs, measurement of their
performance remains central to fulfilling their responsibilities. Excellent institution of higher
learning should achieve and maintain high level of performance that meet or exceed the
expectation its stakeholders including students, the industry, the community, the employees, the
funding agency and other stake holders. The performance of HEIs has however attracted a global
4
concern from leaders, with scholars trying to understand what drives performance of HEIs.
Majority of the universities and especially in developed countries are characterised by myriad of
challenges including huge financial debts due to inadequate funds, decline in quality of teaching,
inadequate staff, inadequate research output and low quality service to the students (Mbirithi,
2013; Gudo et al., 2011; Nyanga’u, 2014; Kimathi (2014) Okioga, Onsongo & Nyaboga, 2012;
Sifuna, 2010).
The universities world-wide endeavour to be world class universities, however the paradox of
becoming a World Class University as observed by Albatch (2004), is that “everyone wants one,
no one knows what it is, and no one knows how to get one”. Salmi (2011) observes that no
enthusiastic measure existed to quantify the input and processes that lead to superior
achievement or world class university status comprising of producing top graduates, leading-
edge research, contributing to dynamic knowledge and technology transfer. Based on theories,
literature and excellence models it is possible to filter possible drivers comprising the input and
processes leading to a superior performance referred in this study as performance excellence.
This study will be exploring some of these drivers of performance excellence including
leadership, people management, resources, partnership and collaboration, internationalisation,
policy and strategy, processes product and services with a view of understanding how they relate
to performance excellence in universities in Kenya. Some excellence model such as EFQM
model argue that, excellence result are achieved through leadership driving policy and strategy
through people, partnership and resources and processes, product and services (EFQM,2013).
According to Avolio, Walumbwa & Weber (2009) leadership does not depend on the leaders
alone but it also depends on the surrounding environment and accessible resources. The study
measured performance excellence using academic performance: research and education
parameter and management performance: finance and human resource (Wang, 2010).
1.1.1 Global Higher Education Sector
Globally top performing universities are commonly referred as World Class Universities (WCU).
Salmi (2009) observe that the title “World Class University” has been in use as a key phrase by
5
the universities in the last decade aiming at improving on their quality of teaching and learning
and developing capacity to compete in the global arena. Salmi (2009) asserts that, university’s
global standing is increasingly becoming a salient element as it inform potential students seeking
to enroll for studies in the best possible universities globally. According to Altbach & Salmi
(2011), the influential status of the WCU is known through international recognition and not
through self-declaration. Different universities and nations globally have adopted a number of
strategies in an effort of acquiring world-class status and building their international
competitiveness. Though different nations have different cultural, social and economic
backgrounds common strategies can still be recognized which include competitive funding
schemes, internationalization and governance reform (Wang, Cheng & Liu, 2013). Salmi
summarizes WCU as a high concentration of talents for both students and staff, abundant
resources making an excellent learning environment and research, good governance that support
strategic vision, innovation and creativity, flexible governance that give room for decision
making and efficiency in management of the resources.
Similarly, Douglas (2014) describes a WCU as a University that is highly ranked in terms of
research output, a culture of excellence, well equipped with great facilities and well branded
globally. Most of the top leading universities have set strategies for a better future focusing on
excellence. Imperial College of London identified the following as their drivers in its strategy
2015-2020; it underpinning foundations comprising of it core academic discipline in engineering
and medicine which make it a great university, multidisciplinary research, people including staff,
student and alumni relations, Partners to support in dissemination of research and education and
Enablers that help them deliver their strategy which include revenues, processes and use of
technology and acting courageously (Imperial College of London, 2016).
According to Altbach (2004), everyone want to be a WCU, “no one knows what it is and no one
knows how to get one”. Building this class of university has being a global policy both in
developing and developed countries. This trend is linked to the arrival of Knowledge Based
Economy (KBE) where HEIs are recognized as key player of their countries economy. WCUs
are accounted for by their countries to make palpable impact at both local and international level
6
on trade and commerce due to their high capability to produce, disseminate and transfer
knowledge and innovation (Byun et al., 2012). Goodall (2015) observes that, United States based
universities dominate the top 100 universities in the Shanghai Jiao Tong University (SJTU)
global ranking. Though the western universities dominate in the lead, the trend has shown them
going down while those of Asian institutions continue to rise, with universities such as
University of Tokyo and the National University of Singapore ranking in the top 25. The decline
in ranking of Western Universities is attributed to the dwindling funding from the state. This
sentiment is also echoed by the Director of the Centre for International Higher Education at
Boston College, Philip Altbach who points out that funding of the American public universities
has a major effect to their competitiveness (Parr, 2014).
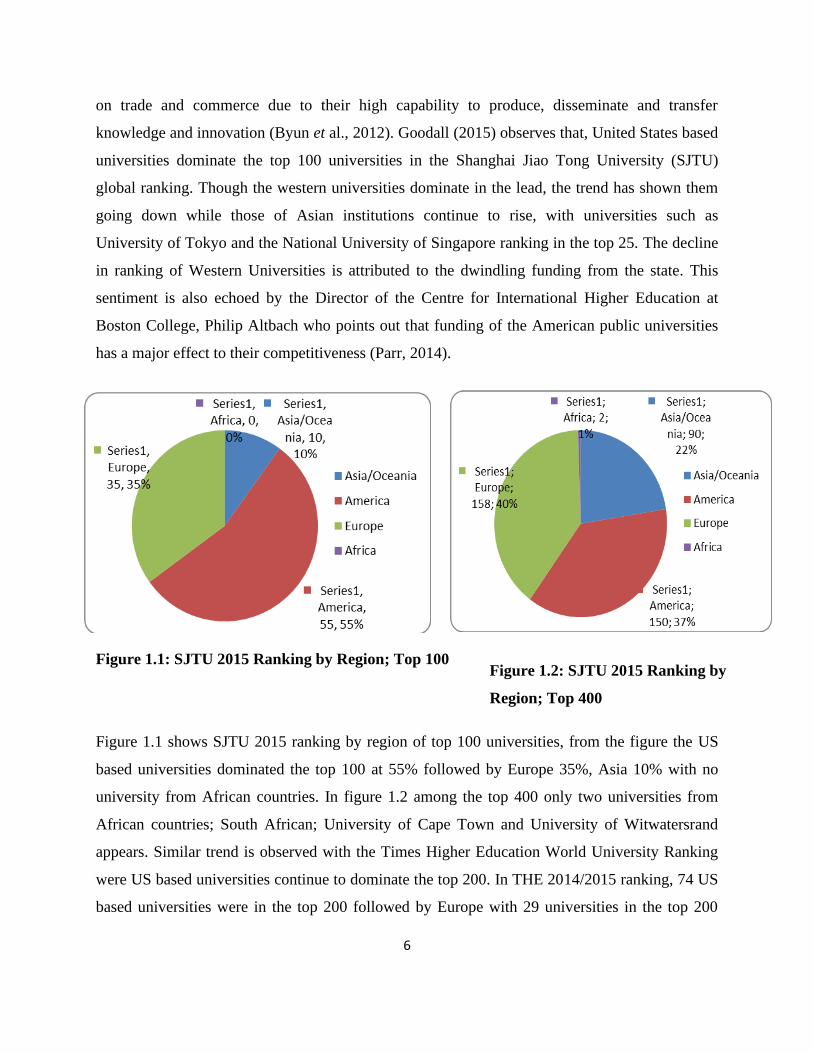
Figure 1.1: SJTU 2015 Ranking by Region; Top 100
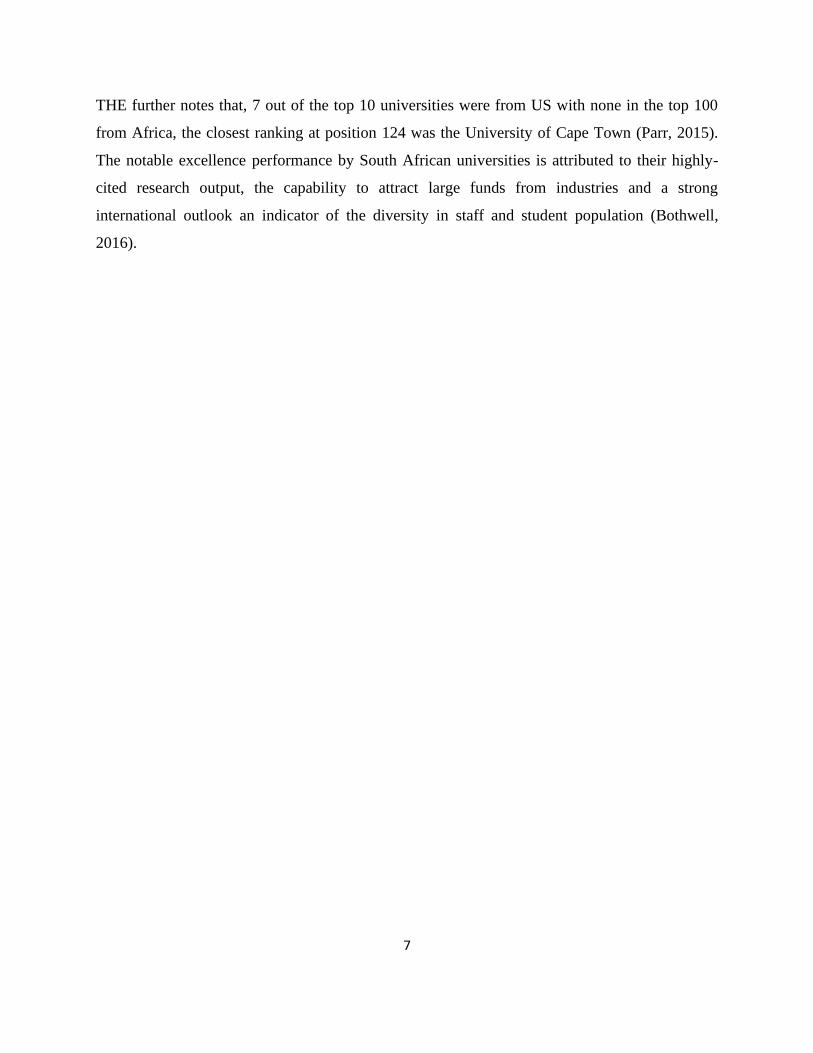
Figure 1.1 shows SJTU 2015 ranking by region of top 100 universities, from the figure the US
based universities dominated the top 100 at 55% followed by Europe 35%, Asia 10% with no
university from African countries. In figure 1.2 among the top 400 only two universities from
African countries; South African; University of Cape Town and University of Witwatersrand
appears. Similar trend is observed with the Times Higher Education World University Ranking
were US based universities continue to dominate the top 200. In THE 2014/2015 ranking, 74 US
based universities were in the top 200 followed by Europe with 29 universities in the top 200
Figure 1.2: SJTU 2015 Ranking by
Region; Top 400
7
THE further notes that, 7 out of the top 10 universities were from US with none in the top 100
from Africa, the closest ranking at position 124 was the University of Cape Town (Parr, 2015).
The notable excellence performance by South African universities is attributed to their highly-
cited research output, the capability to attract large funds from industries and a strong
international outlook an indicator of the diversity in staff and student population (Bothwell,
2016).

8
1.1.2 Higher Education Institution in Africa
According to THE World University Rankings, 2014-2015 only few of the African universities
feature in the global University rankings, further, among the few , South Africa based
universities dominate the lead in Africa, the only three African Universities which made to Top
400 globally include; University of Cape Town, Stellenbosch University and University of
Witwatersrand. The trends is replicated in THE World University Rankings, 2016 the South
Africa’s based University dominated a snap shot ranking of best universities in Africa, with only
Makerere University from Uganda an institution from outside South Africa (Bothwell, 2015 &
Bothwell, 2016). The poor ranking of African Universities is a disquiet that has attracted
attention to the leaders in African countries. A similar observation is shared by Phil Baty, editor
of the THE World University Ranking during the Africa Universities Summit held at the
University of Johannesburg, between 30th and 31st July 2015. He noted that in 2014/2015 ranking
out of the top 30 universities in Africa, twelve of the Universities were from South Africa.
During the Summit, it was observed that Africa Universities should ‘shun Mediocrity’ in order to
reduce the African brain drain. Among the areas pointed out that need to be addressed to attract
back the prominent scholars is good facilities, high academic standards and good welcome back
atmosphere (Havergal, 2015).
Proceedings from Africa Higher Education Summit (2015), ‘Revitalising higher education for
Africa’s future’ indicate Africa having achieved a substantial growth in the higher education
sector which has equally significantly contributed to her economic development. However a
number of challenges are still highlighted that universities in Africa need to continuously focus
on. Some of the areas highlighted are inadequate research capabilities which are fundamental for
them to compete in the global arena. Staff shortage since majority are unable to recruit and retain
staff at senior level and research experience, which is also exacerbated by brain drain and also
few completion rates of postgraduate students which is also attributed to lack of adequate
supervisory staff (Zeleza, 2015)
The low ranking of the African universities is worrying trend and an indicator of poor
performance of these institutions in comparison with others globally. Alemu (2013) refers to the
9
poor African ranking status as astonishing which he attribute to issues of inadequate funding,
management, collaborations and limited resources. He notes that Africa suffered from financial
neglect that occurred between 1980s and 1990s arising from advice by World Bank’s to focus
more on the basic education. According to Alemu (2013) African universities are unstable due to
the escalation in financial austerity as the number of universities expands. Similarly, Yizengaw
(2008) while establishing challenges facing higher education institution and system in Africa and
the effective way of implementing the Africa-US collaboration initiative identified a number of
challenges that need to be addressed for them to contribute effectively to African development
and transformation. Among the challenges that face African universities relate to shortage of
senior faculty staff and research scholars, weak leadership, governance and management
practices resulting to inefficient resource management. The leaders are cited as poor in strategic
planning, undertaking market research, and research management, management of human
resource, performance management, networking and building partnership and planning and
management of finances. Yizengaw also observed that African universities are faced with
declining quality and relevance of education, inadequate research capacity, lack of adequate
funds (financial austerity), inadequate infrastructure and poor physical facilities. This situation
he notes, calls for intervention by all the concerned parties (Yizengaw, 2008).
1.1.3 Higher Education Sector in Kenya
The Kenya Vision 2030 “recognizes the critical role played by Research and Development
(R&D) in accelerating economic development in all the newly industrializing countries of the
world” (Republic of Kenya, 2007). The Vision summarises Kenya’s long-term development
strategy, it details the goals of the economic, social and political pillars. It aims at transforming
Kenya into a “newly industrializing middle income country providing a high quality life to all its
citizens by the year 2030” (Republic of Kenya, 2007). The Vision further emphasis on enhancing
quality and globally competitive education and research as one of the goals envisaged under the
social pillar of the Vision. To realize economic development as enshrined in the Vision, the
country needs to prepare a well-trained and educated workforce who can be champions in
modernization as well as industrialization (Nyangau, 2014). This is based on the fact that
10
performance of the universities has an impact on the economic development it states
(McCormack et al., 2013).
In pursuit of the Vision, and having identified HEIs as one of the critical player in the realization
of the Kenya Vision 2030, the Government increased access to higher education through
upgrading tertiary colleges to University colleges and subsequently to fully fledged universities.
This move saw the universities numbers expand from the seven public universities famously
known as “G7”; University of Nairobi (UoN), Kenyatta University (KU), Jomo Kenyatta
University of Agriculture and Technology (JKUAT), Egerton University, Moi University,
Maseno University and Masinde Muliro University of Science and Technology to 23 public
chartered universities and 10 public university constituent colleges by November, 2015. In total
there were 23 public chartered universities and 10 public university constituent colleges, 17
private chartered universities, 5 private universities constituent, 14 universities operating with a
letter of interim authority and one registered private, giving a total of 70 HEIs as per
Commission for University Education Website, by November, 2015 (CUE,2015).
The expansion of the universities in Kenya has equally come with a number of quantifiable
benefits including increasing access to education and opening up remote towns where these
universities were established. Despite the good intentions through this expansion, Kenya HEIs
are faced with a myriad of challenges that are negatively affecting their performance. Among the
challenges identified by a number of researchers include: inadequate funds, inadequate teaching
and learning resources, decline in quality, large class sizes, poorly equipped libraries and
laboratories, high student to staff ratio, unsatisfactory co-curricular activities, poor governance
and high competition for students, heavy workload, staff turnover, which consequently have a
negative impact on their performance (Mbirithi, 2013; Gudo et al., 2011; Nyanga’u, 2014;
Kimathi (2014) Okioga, Onsongo & Nyaboga, 2012; Sifuna, 2010). Mathooko & Ogutu (2014)
also identify a number of challenges that are environmental and managerial based including high
competition, regulation and government control, high costs, commoditization of higher
education, higher customer demand from customers (students, parent and industry), as some of
the other major challenges affecting higher education in Kenya, observing a need to reviewing

11
the management style and the structure. Similarly, Mbirithi (2013) on a study on management
challenges facing Kenya’s public universities observed that, most of the HEIs in Kenya are
suffering due to inadequate teaching and learning resources including library facilities,
laboratory and lecturer halls, heavy teaching workloads low remunerations and poor working
culture. Due to poor pay the morale of lecturer is at times low and thus wanting in level of their
work ethics.
The increase in the number of universities in Kenya has also resulted in high student to faculty
ratio and especially senior faculty members. The inadequate staffs number especially teaching
staffs has resulted on over reliance on part-time lecturers resulting which results to poor quality
of teaching. Majority of the institution are not in a position to recruit faculty members at senior
level due to financial challenges and in availability of qualified faculty member in some
discipline especially engineering and medicine. There have also been high staff turnover/brain
drains, leading to shortage of staff making the institutions unstable due to lack of continuity of
faculty member and inadequate e-learning teaching infrastructures (Kashorda, 2006). Similarly,
Mutura (2002) argue that most of the universities in Kenya are faced with financial constraints
due to the shrinking funding by the government and especially for the Public Universities due to
change in Government funding policies and the effect of expansion of the universities. The low
income generation due to competition and economy inflation has also affected the cashflow in
the universities. The country’s economic challenges also affect the fees payment capacity by the
customers leaving some of these institutions in huge debts.
Technology is also changing very fast, posing a challenge to the universities since they have to
continuously align to the emerging technology. Though investment in the ICT has some huge
initial costs implication, the benefits attained are immeasurable. Adoption of technology in the
Kenya HEIs have not moved with speed to compete with the emerging trends, Kashorda &
Waema (2014) observed that the government has made major milestone in improving the ICT
infrastructure especially connection of broadband internet through the national fiber optic
infrastructure, he however note there is poor e-readiness of these institutions in a survey
12
conducted in 2013 which he attribute to lack of adequate network infrastructure including
wireless and slow adoption of the e-learning techniques by the faulty members.
In exploring the unique challenges facing Kenya HEIs, Odhiambo (2011) argue that, the many
challenges facing HEIs in Kenya have resulted to decline in quality of higher education, this has
been elevated by the recent expansion, bring with it unhealthy competition, overcrowding, lack
of skilled man power, poor facilities resulting to low academic standards. The low quality has
consequently affected the employability of the graduates as a result of employability skills gaps
(Kalei, 2014). This has also been linked to over reliance on the part-time lecturers resulting to
loss of public interest due to the declining standard (Mbirithi, 2013). Similar sentiment are
shared by Gudo et al (2011) who also attribute the low quality to lecturer shortage, inefficiency
in management, inadequate funding and unsatisfactory service delivery to the students including
sports and other welfare services. Other areas affecting the universities output are inadequate
research funds and research infrastructure making it difficult to undertake specialized research
locally. Poor dissemination of research outcomes as per university mandate, and lack of well
structured policies on commercialization of research and patenting. Many of the faculty members
are not actively engaged in research a core mandate of HEIs, some of the reasons noted by
Chacha (2004) that contribute to inadequate research work are unbalanced workload and part-
timing business and lack of commitment to staff to undertake research.
Poor and inefficient Leadership and Management systems have also been identified as part of the
challenges ailing the HEIs, Mathooko & Ogutu (2014) observes that, the Higher Education
leaders are some of the highly academically qualified personality but they lack the necessary
managerial skills to run these institutions. Some of the areas of concern are in financial and
human resource management. Chacha (2004) observes that the leadership and management
challenges in higher education are as a result of the rapid changes which require those in
leadership and management position to be in tune with the new trends to remain competitive.
The identified challenges could further explain the Kenya’s HEIs poor global academic rankings
while United States of America (USA) and the United Kingdom (UK) based universities

13
dominate in the international academic ranking with South African based universities namely;
University of Cape Town (UCT) and Stellenbosch University (SU) leading in Africa. Though
there have been some criticisms over the rankings, research has also shown the university
ranking is of key interest to potential students, government and the student themselves, global
ranking is highly valued by reputable universities as a tool for enhancing their reputation, attract
talent and resources. According to Marope et al.(2013) in study undertaken on leaders of HEIs in
forty one countries, 82 per cent of the leaders highly recognized university ranking and they
would aspire for their universities to improve on their ranking. According to Webometric
Ranking, 2015 four Kenyan universities appeared in the top 100 in Africa namely University of
Nairobi, Kenyatta University, Moi University and JKUAT at position, 6, 30, 54 and 68
respectively, their global ranking position were 702, 1925, 2507 and 2866 respectively. Though
this is an improvement from the previous years ranking owing to the much effort being put forth
in enhancing the performance of the Kenyan universities towards academic excellence, none of
the Kenyan universities appeared in the top 500 globally (Webometric, 2015). In THE world
university ranking 2015/2016, among the top 10 were 6 US based universities and 3 UK based
universities, while among the top 200 we had 63 US based university and 34 UK based
universities and only one from Africa, University of Capetown at position 120, the only
university in Kenya that appeared for the first time was University of Nairobi in the 601-800
range at position 697. Among the top 15 in Africa, South African university dominated taking 6
positions (Minsky, 2016, April 21, Bothwel, 2016 April 21). Similarly, Wanzala (2015) raises
performance concern of Kenyan universities, he observe that in Qs World University ranking
2015, UON was the only Kenyan university that ranked in top 900 at position 701. He further
observes universities from South Africa dominated the top position in Africa with Cape town at
position 171, this trend recur in other global ranking of universities.
Taking cognizant of the significance role played by HE sector in Kenya a number of initiatives
have been taken in an effort to address some of these challenges. The formation of the
Commission of the University Education (CUE) is one such initiative that the government
implemented. CUE is the predecessor of Commission of Higher Education (CHE) and was
established with an expanded mandate of monitoring and regulating the quality in the University
14
education following the expansion of the university sector in Kenya (CUE, 2015). One of the key
mandate under CUE is the accreditation of the universities, accreditation and approval of
programmes in both public and private universities as well as vetting and approval of
programmes being offered by universities to ensure they meets the required standards. CUE has
also developed University Standards and Guidelines as part of the road map to streamlining
quality. The guidelines have been instrumental in streamlining the HEIs, they provide standards
and guidelines for curriculum development, establishment of physical facilities, open, distance
and E-learning, University libraries, Technical universities and standards for specialized degree
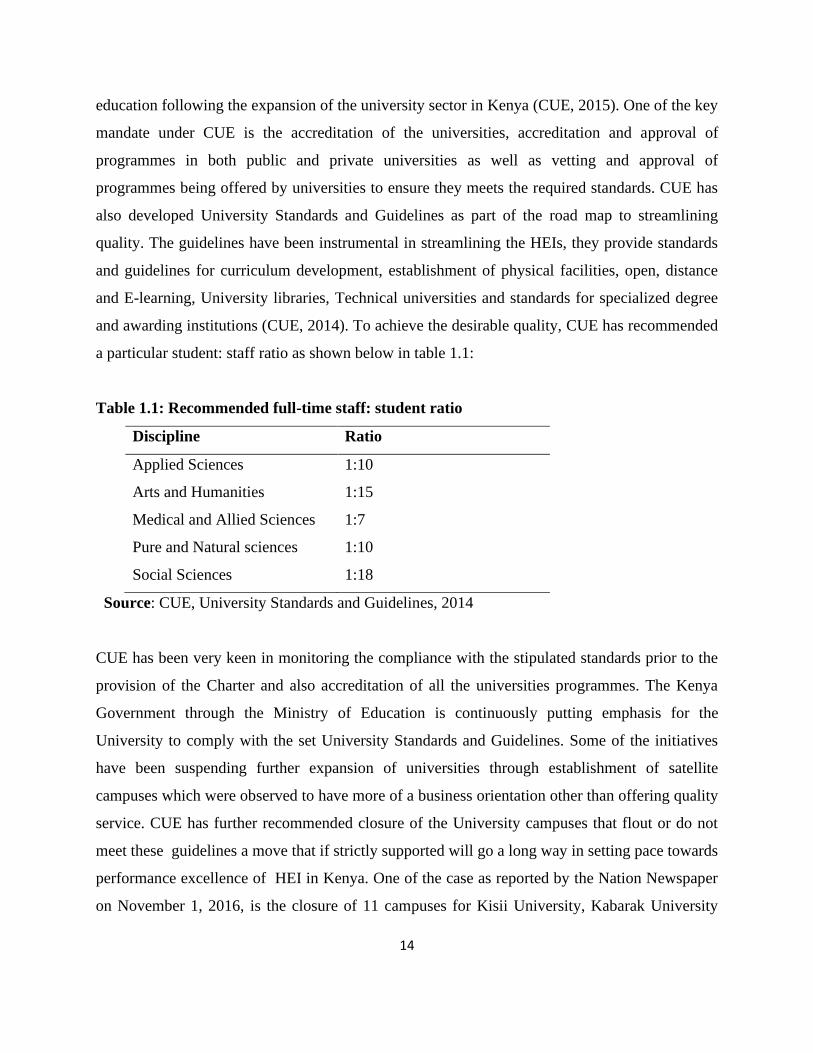
and awarding institutions (CUE, 2014). To achieve the desirable quality, CUE has recommended
a particular student: staff ratio as shown below in table 1.1:
Table 1.1: Recommended full-time staff: student ratio
Discipline Ratio
Applied Sciences 1:10
Arts and Humanities 1:15
Medical and Allied Sciences 1:7
Pure and Natural sciences 1:10
Social Sciences 1:18
Source: CUE, University Standards and Guidelines, 2014
CUE has been very keen in monitoring the compliance with the stipulated standards prior to the
provision of the Charter and also accreditation of all the universities programmes. The Kenya
Government through the Ministry of Education is continuously putting emphasis for the
University to comply with the set University Standards and Guidelines. Some of the initiatives
have been suspending further expansion of universities through establishment of satellite
campuses which were observed to have more of a business orientation other than offering quality
service. CUE has further recommended closure of the University campuses that flout or do not
meet these guidelines a move that if strictly supported will go a long way in setting pace towards
performance excellence of HEI in Kenya. One of the case as reported by the Nation Newspaper
on November 1, 2016, is the closure of 11 campuses for Kisii University, Kabarak University

15
and Laikipia University by CUE for failure to meet the stipulated quality standards (Wanzala,
2016). In a similar initiative the Cabinet Secretary (CS), Ministry of Education, in the month of
December, 2016 to February, 2017 gave a directive for auditing of all the public and private
universities authorised to operate in Kenya (Njagi, 2017). The audit was to cover various key
standards including the admission criteria, student enrolment, student progression, credit transfer,
programme accreditation and approval, examination integrity, certification process, award of the
degree among other areas that related to the academic quality. The audit was followed by a
number of recommendations for each affected university to implement and in addition come up
with comprehensive measures to continuously comply with university set Standards and
Guidelines within a period of Six Months. The initiative was widely applauded as positive move
towards redeeming the image of the Kenyan universities.
Challenges being experienced in Kenya’s HEIs can create an obstacle to the realization of her
dream of transforming the country from a subsistence economy towards knowledge based
economy as articulated in the Vision 2030 (Republic of Kenya, 2007). Nyanga’u (2014) observes
that, many other newly-industrialized countries such as China, Brazil, Taiwan, Singapore and
Korea have gone through similar challenges but eventually managed to record good success.
This has been possible through continuously identifying and focusing on drivers of performance
excellence of HEIs. Similarly, the performance gaps facing Kenya’s high education system can
also be addressed through identifying drivers that are essential to surmount the problem facing
them. Though every university wants to be a world class university despite not knowing what a
world class university is or how to get one (Altbach, 2004), Kenya’s HEIs can still emulate the
models and the success story of the leading world class universities. The challenges facing
Kenya’s expanded HE sector triggers the need to undertake this research to identify critical
drivers that universities and it’s stakeholders can focus on to leverage performance excellence.
1.2 Statement of the Problem
HEIs are important entities in the society, they contribute in human capital development and
formation which is fundamental for both developed and developing countries to realize a
sustainable economic development. HEIs are expected to play a dynamic and lively role in the

16
academic and professional success of a growing economy (Nigavekar, 2011).The Universities
are accountable for the present and future of the society. Acknowledging the critical role played
by the HEIs in education, research and technology transfer, there has been a deliberate effort
worldwide to expand the HEIs. Similarly, HEIs in Kenya has gone through expansion taking
cognizant of the role they plays in realisation of her Vision 2030. The number of public and
private universities, university colleges and Institutions with Letter of Interim Authority
increased from 28 to 70 between the year 2007 and 2016. However, there has been a growing
concern over the performance of the universities in Kenya. The university performance is viewed
from Academic performance and management performance. The academic performance
comprise of research and education related parameter while University management performance
comprise of the human resources management and finance element such as revenue generation
(Wang, 2010). Worldwide, universities want to be a world class University (WCU) however “no
one knows what it is, and no one know how to get one” (Altbach 2004). Many universities
worldwide have failed to achieve the expected performance excellence, which is demonstrated
by the many challenges they are experiencing including; frequent student unrests, financial
constraint, poor academic quality, poor global ranking, high staff turnover, inadequate research
and research dissemination. Among other critical challenges been experienced by HEIs in Africa
include Quality and relevance, poor research and innovations, financial austerity, failure to meet
the increasing demand for the University Access and especially by the government sponsored
students, staff turnover and limited infrastructure and other learning facilities (Yizengaw, 2008).
In Kenya study have been carried in regard to performance of our Universities, this studies have
revealed major challenges facing our universities which affect the quality of graduates, this is
characterised by inadequate learning facilities, high student to lecturer ratio, high work load,
curricular that are not matching market needs, large class sizes, unsatisfactory sporting activities,
(Chacha,2004; Gudo et al., 2011; Mbirithi, 2013 & Nyangau, 2014). According to 2015 CUE
report on status of universities in Kenya 53% (8,693) of teaching staff were master’s holder with
only 34% (5,604) PhD holders majority of whom were from public universities. it was further
noted that among the 34%, those at professor and senior lecturer ranks were only 10% and 13%
respectively. The academic staff to student ratio was 1:98 against the UNESCO recommended
level of 1:30 (Mukhwana, Oure, Kiptoo, Kande, Njue, Too & Some, 2016). Further the report
17
indicate that, universities in Kenya were operating at a decefit of KShs8,992.34million, an
indication that the universities were spending more than resources they were receiving from
various income streams. Operating with insufficient funds will in the long run lead to poor
quality, skewed development of programmes avoiding programmes that are costly to implement
such as STEM, this will finally affect the realization of sustainable development agenda
anchored in the Kenya Vision 2030. Further, Limited resources result into increased incidences
of student riots resulting from unsatisfactory services. High staff turn-over is also experienced
due to limited resources to attract and retain highly qualified academic staff as well as limited
creativity and innovations due to inadequate funding to undertake research and unethical
competition for students (Mukhwana et. al, 2016). According to the report if the situation is not
addressed the universities may not be able to meet their objectives as specified in the university
Act, 2012. Further the expansion of HEIs in Kenya exacerbated the problem faced by
universities in Kenya by creating competition for the same students and consequently reduced
Government funding (Nyangau, 2014).
Performance excellence of institutions is based on leadership, people, resources and partnership,
policy and strategy and processes product and services among others (EFQM,2013). The
performances of universities in Kenya have over the years resulted in low ranking on various
global University rankings. According to Webometric Ranking, 2015 only four Kenyan
universities appeared in the top 100 in Africa namely University of Nairobi, Kenyatta University,
Moi University and JKUAT at position, 6, 30, 54 and 68 respectively, their global ranking
position were 702, 1925, 2507 and 2866 respectively (Webometric, 2015). Similar trend were
observed in 2016 THE world University ranking, it is only the University of Nairobi which
featured in the top 601-800 range and at position 8 in Africa (Bothwell, 2016, April 21). Further,
Wanzala (2015) raises similar concern that in Qs World University ranking 2015, UON was the
only Kenyan university that ranked in top 900 at position 701. He observes that, universities
from South Africa dominated the top position in Africa with Cape Town at position 171.
To realize the Kenya vision 2030 by growing the GDP by 10% the universities are expected to
produce innovative graduate with relevant skills, poor performance will thus derail the effort for

18
attaining the Vision 2030 as well as realisation of African Agenda 2063. This has triggered the
need to interrogate how these institutions will achieve performance excellence under the ever
growing competition and support realisation of a knowledge based economy as enshrined in the
Kenya Vision 2030. Previous research have focused more on challenges facing HEIs raising a
gap on then what drives their performance excellence. This study therefore sought to evaluate the
drivers of performance excellence for universities with a view of understanding the fundamental
drivers, identifying the gaps in Kenya’s universities and recommends strategies for achieving
performance excellence.
1.3 Purpose of the Study
The purpose of the study was to examine the drivers of performance excellence in universities in
Kenya with a view of identifying the key drivers, the gaps and make recommendations for
achieving performance excellence in Kenya HEIs.
1.4 General Research Objective
The general objective of the study was to explore drivers of performance excellence in
universities in Kenya.
1.4.1 Specific Objectives
The specific objectives of the study were,
i. To analyse drivers (Leadership, people management, resources, partnership and
collaboration, internationalisation, policy and strategy, processes, product and services) of
performance excellence in universities in Kenya.
ii. To explore the gaps in drivers of performance excellence in universities in Kenya.
iii. To compare the drivers (Leadership, people management, resources, partnership and
collaboration, internationalisation, policy and strategy, processes, product and services) of
performance excellence between public and private universities
iv. To develop a framework for assessing performance excellence for universities in Kenya.
1.4.2 Research Questions
The research questions for each of the specific objective of the study were,

19
i. Do the drivers (Leadership, people management, resources, partnership and collaboration,
internationalisation, policy and strategy, processes, product and services) relate to
performance excellence in universities in Kenya?
ii. What are the gaps in drivers (Leadership, people management, resources, partnership and
collaboration, internationalisation, policy and strategy, processes, product and services) of
performance excellence in universities in Kenya?
iii. How do the drivers of performance excellence compare between private and public
universities in Kenya?
iv. What would be the framework for assessing performance excellence in universities in
Kenya?
1.5 Scope of the Study
The scope of the study was limited to the public and private universities in Kenya which were
accredited by Commission of University Education (CUE) as at July, 2016. Accredited
universities have the authority to operate autonomously. The study was limited to the following
study variables: Leadership and management, people management, resources, partnership and
collaboration, internationalisation, policy and strategy and processes, product and services. These
variables were arrived at based on existing theories, literature review and reviewing of
performance drivers of eleven leading top universities globally. The study was undertaken in the
Higher Education due to the significant role they play on the economic development of any state
globally. The target population was the 40 accredited universities as at July 2016 (Appendix II).
The accessible population of study comprised of 12 universities accredited by CUE, 6 public and
6 private. The unit of response was also limited to head of department comprising of the Deans,
Directors, and Heads of Departments due to their vast experience on university performance
since they on day to day interact with university management and operation. Following the
massive expansion of the HEIs in Kenya it is expected that there will be an equal impact to the
country’s economic development. The Kenya Vision 2030 envision an economic growth rate of
10% per annum through it three pillars: economic, social and political where education play a
key role. To effectively contribute to the realization of the envisaged economic growth, HEIs in
Kenya have to meet the expected performance excellence in training and research agenda. There
20
has however been a growing concern on the performance of Kenya universities. This study thus
sought to explores the drivers of performance excellence in universities in Kenya.
1.6 Significance of the Study
Kenya has undergone through a major expansion in it higher education sector since 2007, the
growth is expected to equally impact positively to the country’s development through the
development and formation of the required human capital. The universities are expected to play
key role in provision of quality education and promotion of lifelong learning opportunities for all
in line with sustainable development Goals (SDGs), To achieve the expected performance
excellence, the leaders and managers of these HEIs require information and knowledge to
support and guide them to effectively and efficiently run these institutions.
Under the current dynamic and competitive environment in the HEIs arena these research finding
will be important to University Councils, University Management Boards, University Senate, the
regulatory Bodies: the Commission for University Education (CUE), the Ministry of Education
(MoE), University donors and other key university stakeholders. It will provide facts on the
critical drivers for steering universities on path to performance excellence to the university
managers. Higher performance in universities will ultimately result in competent graduates and
quality research and as a result contribute to the realization of the Vision 2030 through
development of competent human capital required to drive a knowledge-based economy. In
addition, the study will contribute to realization of SDGs through ensuring inclusive and quality
education and promoting lifelong learning for all. Quality education is the fourth goals of the 17
global goals that make up the 2030 agenda for sustainable development. Further, this research
will contribute to the African Union Agenda 2063 in ensuring an inclusive growth and
sustainable development through development of human and social capital. The African agenda
2063 is an ambitious vision and action plan intended to drive Africa’s change, development and
transformation for the next 50 years (DeGhetto, Gray & Kiggundu,2016). The agenda 2063
identify education as main vehicle to inter-generational social mobility. This will help shape up
the Africa development and transformation within the next 50 years making it a stable and
21
prosperous and competitive continent. In addition the SDG’S and Africa Agenda 2063 are also
postulated in the “Big four” agenda consequently this research will contribute to the “Big four”
agenda. The results will also be useful in informing the Government and funding agencies in
decision making and policy formulation in matter related to management of HEIs. The study also
contributes to policy development through giving recommendation to the government on
strategies to enhance performance of HEIs.
The research findings contribute to literature on performance excellence in HEIs and how
different drivers contribute to it achievement. There are limited studies in Africa addressing
drivers of performance excellence in HEIs, this study therefore formed a knowledge base that
will also act as a source of reference information to other aspiring researchers and scholars as
well as basis for further research. This research also significantly gives a contribution to
literature and theory through development of a framework for assessing performance excellence
for universities in Kenya.
1.7 Limitation of the Study
The study has made significant contribution to the theory and practice in realizing performance
excellence in HEIs though with some limitations. The study was limited to the 40 public and
private chartered universities as per the CUE (2016). Therefore to generalize the results to the
unchartered universities and university colleges may be limited because they could be
experiencing different form of challenges that hinder their performance compared to the fully
fledged universities. The study respondent was limited to Deans, Directors, CoDs and HoDs
inform of survey questionnaires thus limited to how fairly the respondent were in answering the
survey questions. Deans, Director, Head of Department and chairman of department hold
leadership position, this may limit the generalizing the finding while using a different unit of
measure such as the lecturers or Administrative staff who are their immediate support staff. This
study has however been able to reach to a conclusion despite these limitations.

22
1.8 Assumption of the Study
Despite the success of this study this was not without some assumptions. The main assumptions
of this study was that there exist some key drivers including Leadership, people management,
resources, partnership and collaboration, internationalisation, policy and strategy, processes,
product and services that influence the performance excellence of universities. The study also
assumed excellent Universities globally have key drivers for their performance that they focus on
to achieve performance excellence, and an analysis on what drive their performance would
provide some basis for identifying drivers of performance excellence of universities in Kenya.
Further the study assumed that despite the different social, economic, cultural and environmental
background there exist some common drivers of performance excellence in universities.
1.9 Definition of Operational Terms
Accredited University: An institution as a University by the Commission for University
Education (CUE).
A Constituent College: A constituent college of a University established the University
Act, 2012.
Charter: Charter granted to the University as per the University Act.
Excellence: “Outstanding practice in managing the organisation and achieving
results based on set of fundamental concepts” (Steed 2003)
Higher Education Institutions: Higher education institution is used in this study to refer to the
Universities
Internationalization: “specific policies and initiatives of countries and individual
academic institutions or systems to deal with global trends”
Altbach (2002)
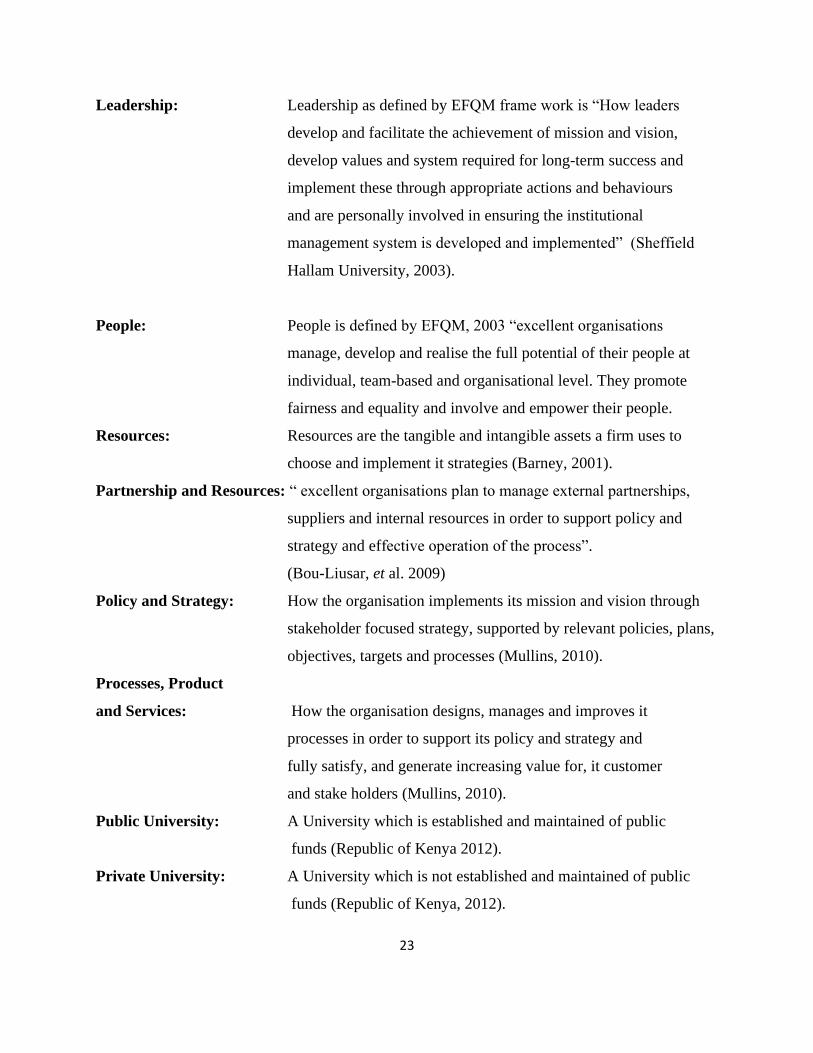
23
Leadership: Leadership as defined by EFQM frame work is “How leaders
develop and facilitate the achievement of mission and vision,
develop values and system required for long-term success and
implement these through appropriate actions and behaviours
and are personally involved in ensuring the institutional
management system is developed and implemented” (Sheffield
Hallam University, 2003).
People: People is defined by EFQM, 2003 “excellent organisations
manage, develop and realise the full potential of their people at
individual, team-based and organisational level. They promote
fairness and equality and involve and empower their people.
Resources: Resources are the tangible and intangible assets a firm uses to
choose and implement it strategies (Barney, 2001).
Partnership and Resources: “ excellent organisations plan to manage external partnerships,
suppliers and internal resources in order to support policy and
strategy and effective operation of the process”.
(Bou-Liusar, et al. 2009)
Policy and Strategy: How the organisation implements its mission and vision through
stakeholder focused strategy, supported by relevant policies, plans,
objectives, targets and processes (Mullins, 2010).
Processes, Product
and Services: How the organisation designs, manages and improves it
processes in order to support its policy and strategy and
fully satisfy, and generate increasing value for, it customer
and stake holders (Mullins, 2010).
Public University: A University which is established and maintained of public
funds (Republic of Kenya 2012).
Private University: A University which is not established and maintained of public
funds (Republic of Kenya, 2012).
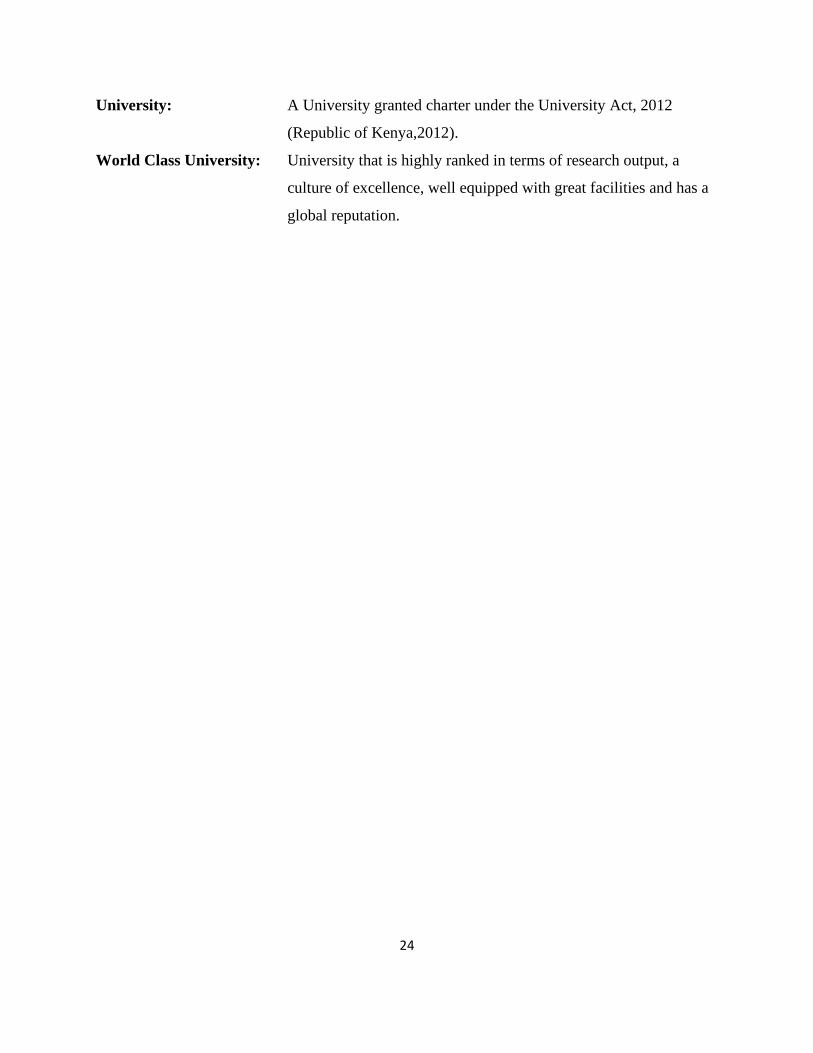
24
University: A University granted charter under the University Act, 2012
(Republic of Kenya,2012).
World Class University: University that is highly ranked in terms of research output, a
culture of excellence, well equipped with great facilities and has a
global reputation.
25
CHAPTER TWO
LITERATURE REVIEW
2.1 Introduction
This chapter provides an overview of other researchers and great scholars on drivers of
excellence performance in HEIs. The chapter review concept of performance excellence in HEIs
and parameters for measuring performance. It also reviews the organisational excellence model;
European Foundation Quality Model (EFQM), Malcolm Baldrige National Quality Award
(MBNQA) and Balance Scorecard (BSC) to understand hey guide performance and quality
management. The chapter goes into reviewing some of the leading universities in the world by
region with an objective of identifying the dominant drivers of their exemplarily performance
excellence with an aim of leveraging on the same to assess the performance of Universities in
Kenya and identifying the gaps. Various theoretical and empirical literatures globally and locally
are reviewed to provide knowledge on the drivers of performance excellence of HEIs. The
chapter also deals with the conceptual framework and operational framework of the study. The
chapter also identifies the knowledge gap that could be emerging from the literature reviewed
and how this gap can be addressed through our study.
2.1.1 Concept of Performance Excellence
Ranking practice in the University date back in 1900 with England publication of “Where We
get our Best Men” , which focused on the most prominent and successful men and where they
studied, the universities would then be ranked on the bases of the number of the distinguished
alumni associated with them. Ranking could be controversial in nature but they have substantial
influence on the long-term development of the HEIs globally. (Marope et al, 2013). Ranking
indicates the university’s areas of strength and weaknesses in comparison with their peers in a
specific area represented by the indicator (Hung, 2011). According to Salmi (2009), HEIs want
to excel, carry out assessment of their strengths and identify areas for improvement, set new
goals and new strategy that can lead to improved performance, however many of them have
remained complacent in their current status, operating the same way they did, this has led to
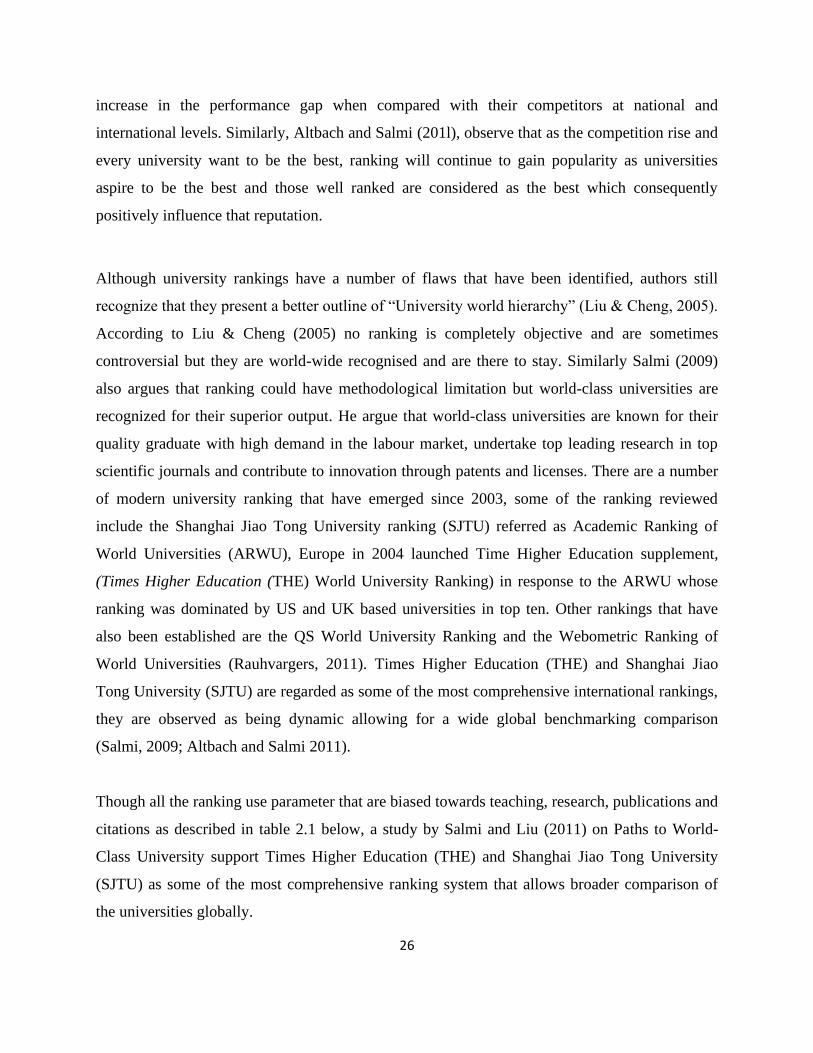
26
increase in the performance gap when compared with their competitors at national and
international levels. Similarly, Altbach and Salmi (201l), observe that as the competition rise and
every university want to be the best, ranking will continue to gain popularity as universities
aspire to be the best and those well ranked are considered as the best which consequently
positively influence that reputation.
Although university rankings have a number of flaws that have been identified, authors still
recognize that they present a better outline of “University world hierarchy” (Liu & Cheng, 2005).
According to Liu & Cheng (2005) no ranking is completely objective and are sometimes
controversial but they are world-wide recognised and are there to stay. Similarly Salmi (2009)
also argues that ranking could have methodological limitation but world-class universities are
recognized for their superior output. He argue that world-class universities are known for their
quality graduate with high demand in the labour market, undertake top leading research in top
scientific journals and contribute to innovation through patents and licenses. There are a number
of modern university ranking that have emerged since 2003, some of the ranking reviewed
include the Shanghai Jiao Tong University ranking (SJTU) referred as Academic Ranking of
World Universities (ARWU), Europe in 2004 launched Time Higher Education supplement,
(Times Higher Education (THE) World University Ranking) in response to the ARWU whose
ranking was dominated by US and UK based universities in top ten. Other rankings that have
also been established are the QS World University Ranking and the Webometric Ranking of
World Universities (Rauhvargers, 2011). Times Higher Education (THE) and Shanghai Jiao
Tong University (SJTU) are regarded as some of the most comprehensive international rankings,
they are observed as being dynamic allowing for a wide global benchmarking comparison
(Salmi, 2009; Altbach and Salmi 2011).
Though all the ranking use parameter that are biased towards teaching, research, publications and
citations as described in table 2.1 below, a study by Salmi and Liu (2011) on Paths to World-
Class University support Times Higher Education (THE) and Shanghai Jiao Tong University
(SJTU) as some of the most comprehensive ranking system that allows broader comparison of
the universities globally.
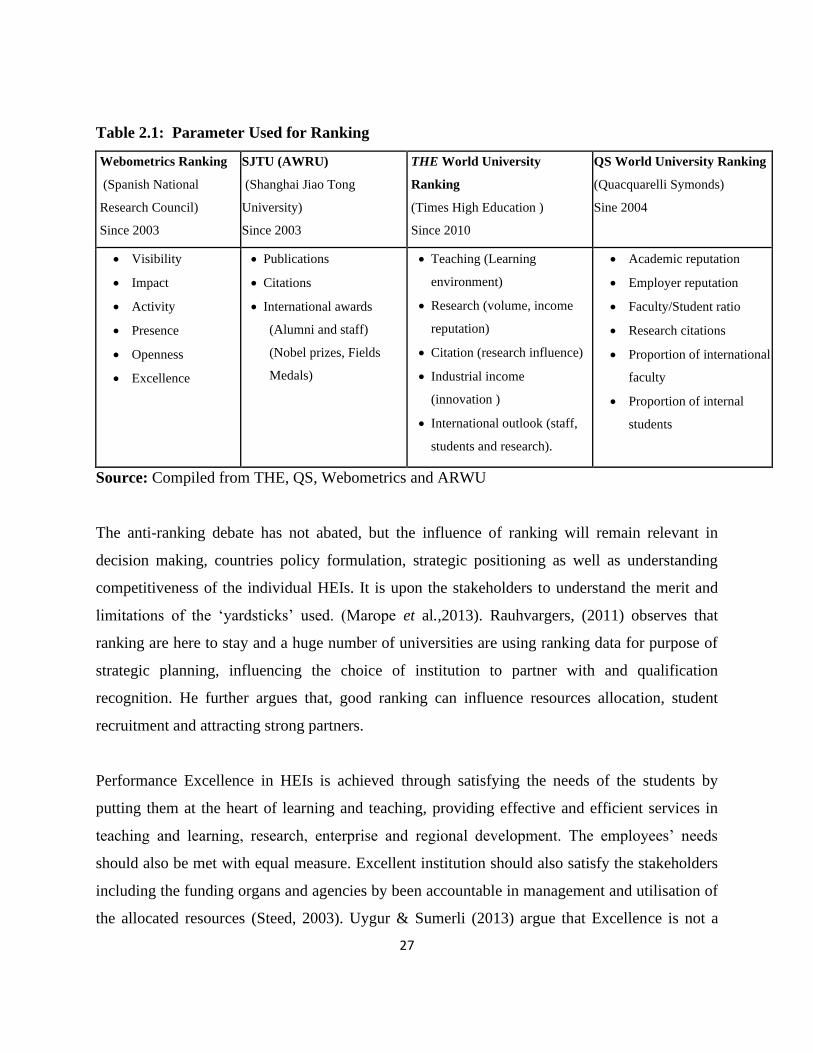
27
Table 2.1: Parameter Used for Ranking
Webometrics Ranking
(Spanish National
Research Council)
Since 2003
SJTU (AWRU)
(Shanghai Jiao Tong
University)
Since 2003
THE World University
Ranking
(Times High Education )
Since 2010
QS World University Ranking
(Quacquarelli Symonds)
Sine 2004
• Visibility
• Impact
• Activity
• Presence
• Openness
• Excellence
• Publications
• Citations
• International awards
(Alumni and staff)
(Nobel prizes, Fields
Medals)
• Teaching (Learning
environment)
• Research (volume, income
reputation)
• Citation (research influence)
• Industrial income
(innovation )
• International outlook (staff,
students and research).
• Academic reputation
• Employer reputation
• Faculty/Student ratio
• Research citations
• Proportion of international
faculty
• Proportion of internal
students
Source: Compiled from THE, QS, Webometrics and ARWU
The anti-ranking debate has not abated, but the influence of ranking will remain relevant in
decision making, countries policy formulation, strategic positioning as well as understanding
competitiveness of the individual HEIs. It is upon the stakeholders to understand the merit and
limitations of the ‘yardsticks’ used. (Marope et al.,2013). Rauhvargers, (2011) observes that
ranking are here to stay and a huge number of universities are using ranking data for purpose of
strategic planning, influencing the choice of institution to partner with and qualification
recognition. He further argues that, good ranking can influence resources allocation, student
recruitment and attracting strong partners.
Performance Excellence in HEIs is achieved through satisfying the needs of the students by
putting them at the heart of learning and teaching, providing effective and efficient services in
teaching and learning, research, enterprise and regional development. The employees’ needs
should also be met with equal measure. Excellent institution should also satisfy the stakeholders
including the funding organs and agencies by been accountable in management and utilisation of
the allocated resources (Steed, 2003). Uygur & Sumerli (2013) argue that Excellence is not a

28
theory and the performance evidence should include financial results, customer satisfaction and
the society results. According to Azma (2010), performance evaluation starts with the
recognition of the organizations Key Performance Indicators (KPIs). In this regard,
understanding of the past performance drives permanent change and continuous improvement.
Jalaliyoon & Taherdoost (2012) argue that, without evaluating the performance based on the key
performance indicators, there will be no permanent change in enhancement of the quality of the
Universities.
Parmenter (2010) describes three types of performance measurement in an organisation; Key
Result Indicators (KRIs), Performance Indicators (PIs) and Key Performance Indicators (KPI).
The KRIs though often mistaken to KPIs informs organisation how they have done in certain
perspectives, giving a representation of whether you are in the right direction. KRIs however
does not inform the organisation what to do to improve on results; they give information for
board but not for the management team who are involved in the day to day management of the
institution affairs. KRIs includes parameter such as customer satisfaction, employee satisfaction,
net and profit before tax. The PIs are between the KRIs and KPIs, they complement KPIs by
informing the organisation what to do while the KPIs tells you what to do to increase
performance dramatically.
Parmenter (2010) further explains that, KPIs “represent a set of measures focusing on those
aspects of organisational performance that are the most critical for current and future success of
the organisation”. The KPIs should be monitored by management on daily basis, he argue that,
KPI cannot be measured on monthly, quarterly or annually noting that, management rarely
recognised there organisation KPIs. Many organisations have failed to achieve their targets due
to failure to understand and identify their KPIs. A good KPI as described by (parmenter, 2010)
has the following characteristics, it is not measured in monetary terms, it is measured on a
frequent basis, CEO and senior management are the one in-charge of action upon it. KPI
understand the measure and collective action required by all staff, the responsibility is tied to an
individual or a team, it has a fundamental impact to almost all the organisation critical success
factors and has positive influence to all the other performance measures. He further observe that,
29
the organisation KPIs, PIs and KRIs should be all linked together and well documented for the
management and also effectively communicated and understood by all staff.
Due to the diverse nature of operation of different organizations, there is no unanimous
definition of organizational performance (Wang, 2010). Pollard et al. (2013) and Wolf (2010)
argue that “What get measured gets done”, measurement of performance ensures that, one
remain focused on the targets by using the same information for decision making to determine
success, failure and areas to improve on the results. Performance and quality of Higher
Education has become a key indicator of the country’s preparedness for it future economic
development (Katsarova, 2015), demonstrating the critical role played by Universities in their
respective countries, however he desired impact to the economic development can only be
realised if there is continuous demonstration and commitment to performance excellence by the
respective HEIs.
Epstein (2004) while evaluating drivers and measure of success in high performance
organization observed that, performance measurement and management control are critical
components in improving organizational performance; they provide a platform through which
the organizations evaluate their achievement against a set of targets. Performance measurement
should not only focus on output and outcome but must include the whole process of University
academic activities all the way from input, process to output. One of the widely accepted
Performance measurement definitions is the process of quantifying the effectiveness and
efficiency of an action (Neely, Gregory & Platts, 1995). Performance measurement is intended
for different purpose based on different objectives of different organization. Leaders and
managers as identified by Behn (2003) measure performance for different purposes including;
evaluating organization performance in comparison with other competitors; it can be done for
control purpose when verifying the level of compliance to some set guidelines or inputs, for
budgeting purpose to established basis for allocating resources, measurement is also undertaken
to motivate people to work harder when the output are compared with target, to promote their
organization through making their performance available to the public or potential customers, to

30
celebrate the accomplishment. Behn (2003) further argue that performance measurement can also
be used for learning purpose from the performance results or to improve performance.
Globally, Universities use a number of parameter to measure performance; some of the
frequently used include patents, research outputs, graduation rates, enrolment growth, faculty
reputation, rankings, research expenditures, faculty salaries among others. One of the dominant
performance measurements in the USA, Japan and Australian Universities is the research output
(Reuters, 2010). Performance measurement in HEIs can be approached from three perspectives;
performance as viewed by the state; employer and society, performance as viewed within the
institution by staff, and performance as viewed by potential students. Wang (2010) classify the
performance of HEIs into two categories as shown in Figure 2.1; Academic consisting of
research and education, then Management comprising of financial and human resource which is
the approach that has been adopted in this study. This study adopted Wang (2010) performance
measurement framework for higher education to assess performance excellence, the dimension
used measured both the academic and managerial performance. The academic performance
focused on the research output by assessing if the publications have been increasing, education
which focused on growth in number of academic programmes and rise in the student population.
The growth in the academic programmes is an indicator of competitiveness and perhaps demand
for more academic programmes. The increase in student population is an academic performance
indicator which demonstrates the competitiveness and popularity of the university and thus
assurance that it is meeting market demand. The management performance was assessed through
finance and human resource, the finance assessed if the revenue surplus has been increasing as
indicator of financial stability, while the human resource assessed the staff turnover which can
indicate the staff satisfaction level.
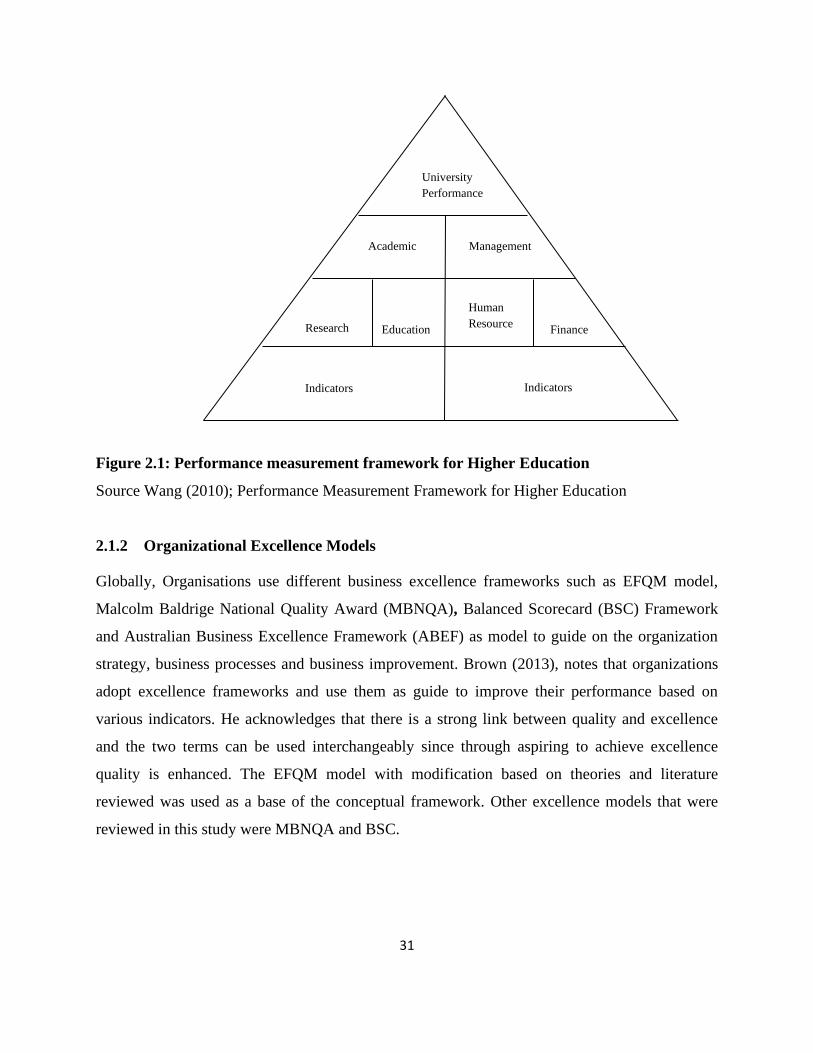
31
Figure 2.1: Performance measurement framework for Higher Education
Source Wang (2010); Performance Measurement Framework for Higher Education
2.1.2 Organizational Excellence Models
Globally, Organisations use different business excellence frameworks such as EFQM model,
Malcolm Baldrige National Quality Award (MBNQA), Balanced Scorecard (BSC) Framework
and Australian Business Excellence Framework (ABEF) as model to guide on the organization
strategy, business processes and business improvement. Brown (2013), notes that organizations
adopt excellence frameworks and use them as guide to improve their performance based on
various indicators. He acknowledges that there is a strong link between quality and excellence
and the two terms can be used interchangeably since through aspiring to achieve excellence
quality is enhanced. The EFQM model with modification based on theories and literature
reviewed was used as a base of the conceptual framework. Other excellence models that were
reviewed in this study were MBNQA and BSC.
University
Performance
Academic Management
Education Finance
Indicators
Human
Resource
Indicators
Research

32
2.1.2.1 EFQM Excellence Model
According to EFQM model, organizational excellence is defined as the overall way of working
that result into stakeholder satisfaction this include; customer , employees, shareholders, partners
and society increasing the probability of long term satisfaction. The 2003 version of the EFQM
model define excellence as “outstanding practice in managing the organization and achieving
results based on asset of fundamental concepts”. The EFQM model is Non-prescriptive model
which takes into account different concepts and is applicable to any organization regardless of
their size, sector or maturity (EFQM, 2013). Organizations achieve sustainable excellence
through having key concepts that forms a common language for the management in their effort
to achieve excellence (Uygur & Sumerli, 2013). The fundamental concepts according to the
EFQM (2013) define the underlying principles that are used as the basis for any organization to
achieve sustainable excellence. The EFQM Model (2013) has eight fundamental concepts of
excellence (fig 2.2) which include: adding value to Customers; creating a sustainable future;
developing organizational capability; harnessing creativity and innovations; leading with vision,
inspiration and integrity; managing with Agility; succeeding through people talents; and
sustainability of outstanding results, these are the organizations key elements that need to be well
managed for the organization to achieve outstanding performance.
Figure 2.2: EFQM fundamental Concepts
Source: EFQM, 2013

33
To achieve and sustain success organisations regardless of their size, structure, age need to
establish a suitable management framework. Organisations globally strive to achieve success,
however not all are able to realize their dream, some don’t make it, other are not able to sustain
it, but a few are able to achieve and sustain success attracting admiration and respect. EFQM
model is one such framework that help organisation to put into practice what can guide them in
achieving sustainable excellence. The model is described as “a practical tool to help organization
establish an appropriate management system by measuring whether they are on the path to
excellence helping them to understand the gaps and stimulating solution”. The model was
originally known as “Business Excellent Model”, It was introduced in 1991 by European
companies to recognize their excellence as a criteria against which the applicant of European
Foundation Award are judged and to recognize organizational excellence in European countries.
The Model is acknowledged in Europe as one of the most robust quality and excellence model by
many of the organisations in Europe. The model has since then been upgraded based on years of
experience and to take into account the current and future organisational challenges. When the
model is applied appropriately it ensures that the management practices used by an organisation
form a coherent system which is continually improved and deliver on the organisation strategy
(EFQM, 2013)
The model has in the last few years been adopted by many non-profit organizations to make their
activities better. To measure the performance most of the European Universities have
implemented the model as a basis for measuring their activities (Arjomandi, Kestell &
Grimshaw, 2009; Bou-Llusar, Escrig-Tena, Roca-Puig, & Beltrán-Martín, 2009). The model has
three integrated component of three parts; the first part is the eight (8) fundamental concepts of
excellence as described in figure 2.1; they underpin the model providing a holistic overview. The
second part and the most recognized part of the model is the EFQM Excellence Model which
comprise of the nine criteria, 9 box model, figure 2.3 comprising of five enabler on the left hand
side which include leadership, people, policy and strategy, partnership and resources and
processes and four results on the right hand side including people results, customer results,
society results and key performance results. The “enablers” cover what the organization does and
the “results” is the organizations performance in relation to its strategies and set targets. The
feedback from the results helps to improve the enablers, similarly a positive change on the
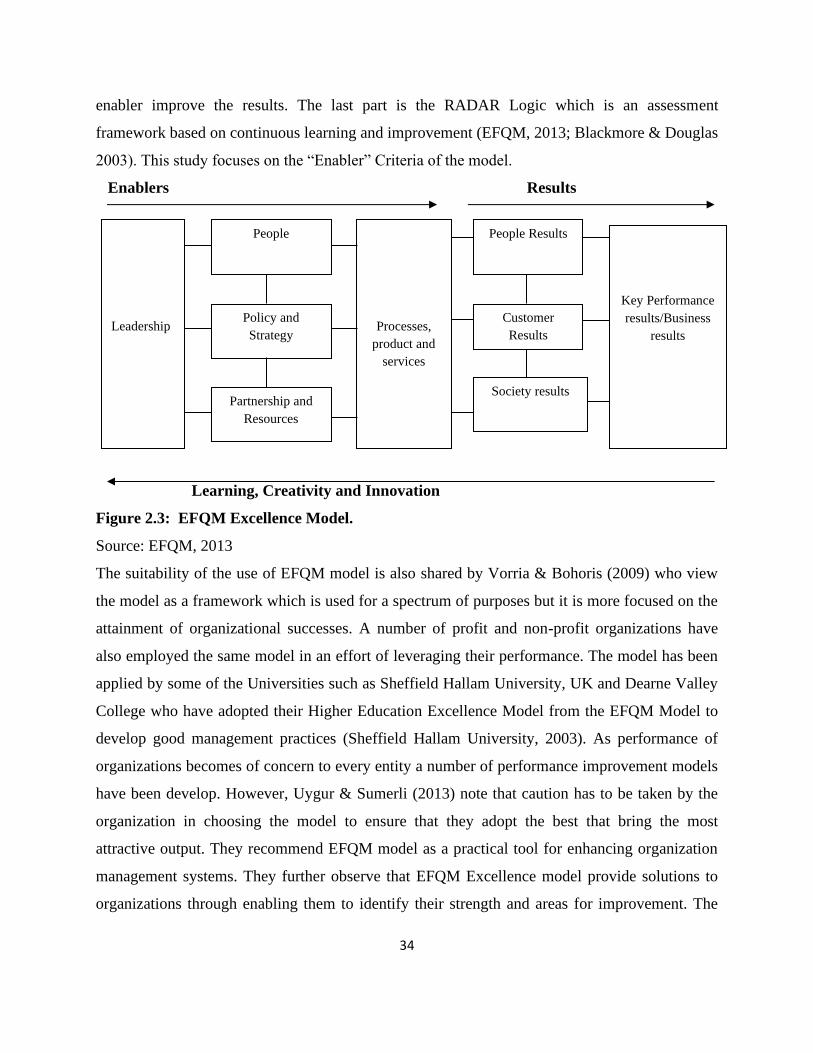
34
enabler improve the results. The last part is the RADAR Logic which is an assessment
framework based on continuous learning and improvement (EFQM, 2013; Blackmore & Douglas
2003). This study focuses on the “Enabler” Criteria of the model.
Enablers Results
Learning, Creativity and Innovation
Figure 2.3: EFQM Excellence Model.
Source: EFQM, 2013
The suitability of the use of EFQM model is also shared by Vorria & Bohoris (2009) who view
the model as a framework which is used for a spectrum of purposes but it is more focused on the
attainment of organizational successes. A number of profit and non-profit organizations have
also employed the same model in an effort of leveraging their performance. The model has been
applied by some of the Universities such as Sheffield Hallam University, UK and Dearne Valley
College who have adopted their Higher Education Excellence Model from the EFQM Model to
develop good management practices (Sheffield Hallam University, 2003). As performance of
organizations becomes of concern to every entity a number of performance improvement models
have been develop. However, Uygur & Sumerli (2013) note that caution has to be taken by the
organization in choosing the model to ensure that they adopt the best that bring the most
attractive output. They recommend EFQM model as a practical tool for enhancing organization
management systems. They further observe that EFQM Excellence model provide solutions to
organizations through enabling them to identify their strength and areas for improvement. The
Leadership
People Results
Processes,
product and
services
People
Policy and
Strategy
Partnership and
Resources
Customer
Results
Society results
Key Performance
results/Business
results
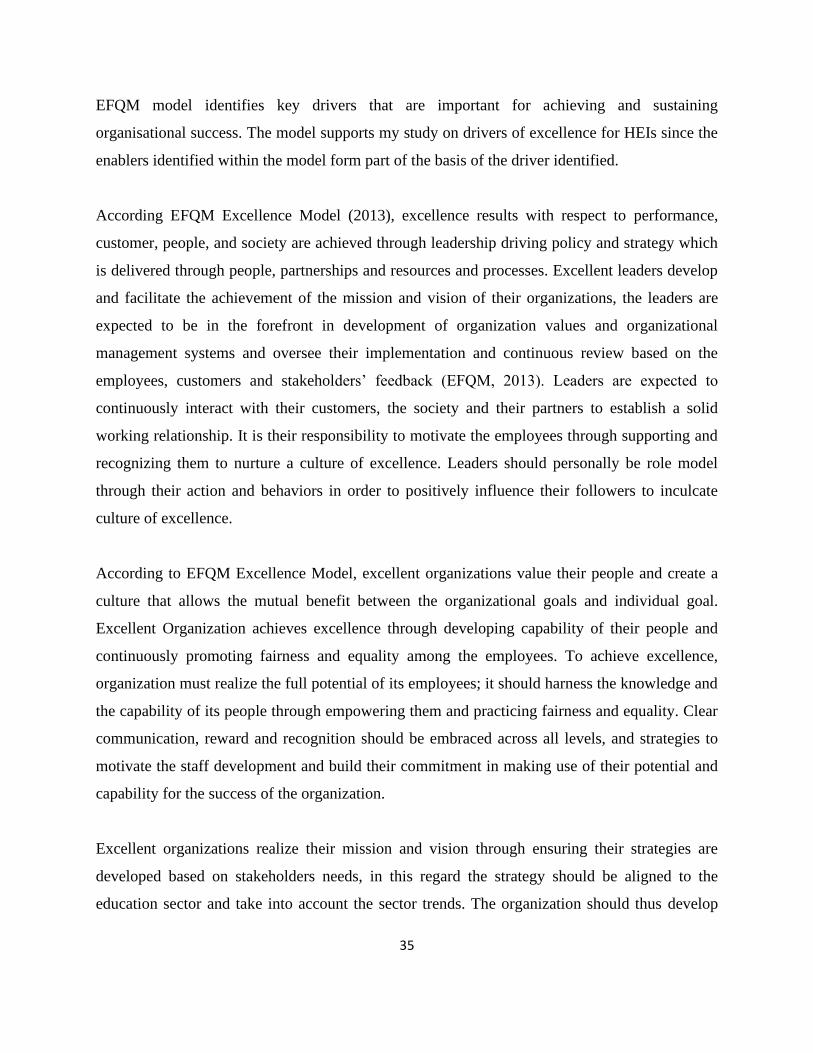
35
EFQM model identifies key drivers that are important for achieving and sustaining
organisational success. The model supports my study on drivers of excellence for HEIs since the
enablers identified within the model form part of the basis of the driver identified.
According EFQM Excellence Model (2013), excellence results with respect to performance,
customer, people, and society are achieved through leadership driving policy and strategy which
is delivered through people, partnerships and resources and processes. Excellent leaders develop
and facilitate the achievement of the mission and vision of their organizations, the leaders are
expected to be in the forefront in development of organization values and organizational
management systems and oversee their implementation and continuous review based on the
employees, customers and stakeholders’ feedback (EFQM, 2013). Leaders are expected to
continuously interact with their customers, the society and their partners to establish a solid
working relationship. It is their responsibility to motivate the employees through supporting and
recognizing them to nurture a culture of excellence. Leaders should personally be role model
through their action and behaviors in order to positively influence their followers to inculcate
culture of excellence.
According to EFQM Excellence Model, excellent organizations value their people and create a
culture that allows the mutual benefit between the organizational goals and individual goal.
Excellent Organization achieves excellence through developing capability of their people and
continuously promoting fairness and equality among the employees. To achieve excellence,
organization must realize the full potential of its employees; it should harness the knowledge and
the capability of its people through empowering them and practicing fairness and equality. Clear
communication, reward and recognition should be embraced across all levels, and strategies to
motivate the staff development and build their commitment in making use of their potential and
capability for the success of the organization.
Excellent organizations realize their mission and vision through ensuring their strategies are
developed based on stakeholders needs, in this regard the strategy should be aligned to the
education sector and take into account the sector trends. The organization should thus develop
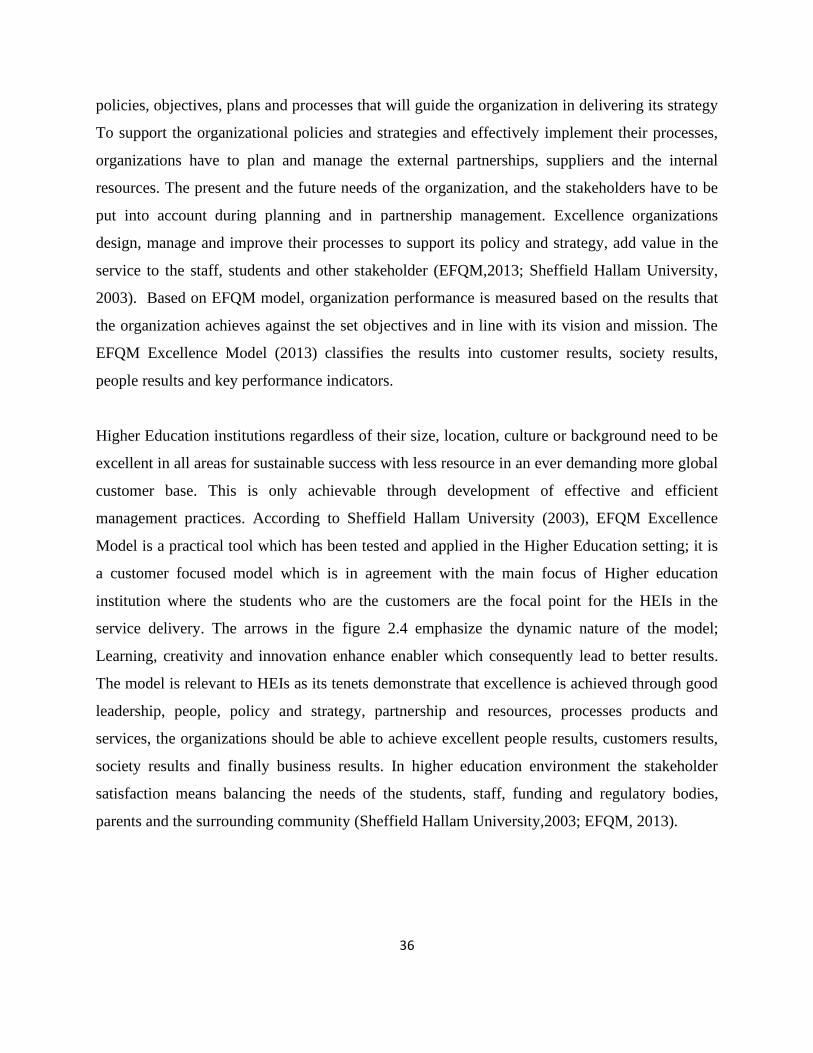
36
policies, objectives, plans and processes that will guide the organization in delivering its strategy
To support the organizational policies and strategies and effectively implement their processes,
organizations have to plan and manage the external partnerships, suppliers and the internal
resources. The present and the future needs of the organization, and the stakeholders have to be
put into account during planning and in partnership management. Excellence organizations
design, manage and improve their processes to support its policy and strategy, add value in the
service to the staff, students and other stakeholder (EFQM,2013; Sheffield Hallam University,
2003). Based on EFQM model, organization performance is measured based on the results that
the organization achieves against the set objectives and in line with its vision and mission. The
EFQM Excellence Model (2013) classifies the results into customer results, society results,
people results and key performance indicators.
Higher Education institutions regardless of their size, location, culture or background need to be
excellent in all areas for sustainable success with less resource in an ever demanding more global
customer base. This is only achievable through development of effective and efficient
management practices. According to Sheffield Hallam University (2003), EFQM Excellence
Model is a practical tool which has been tested and applied in the Higher Education setting; it is
a customer focused model which is in agreement with the main focus of Higher education
institution where the students who are the customers are the focal point for the HEIs in the
service delivery. The arrows in the figure 2.4 emphasize the dynamic nature of the model;
Learning, creativity and innovation enhance enabler which consequently lead to better results.
The model is relevant to HEIs as its tenets demonstrate that excellence is achieved through good
leadership, people, policy and strategy, partnership and resources, processes products and
services, the organizations should be able to achieve excellent people results, customers results,
society results and finally business results. In higher education environment the stakeholder
satisfaction means balancing the needs of the students, staff, funding and regulatory bodies,
parents and the surrounding community (Sheffield Hallam University,2003; EFQM, 2013).
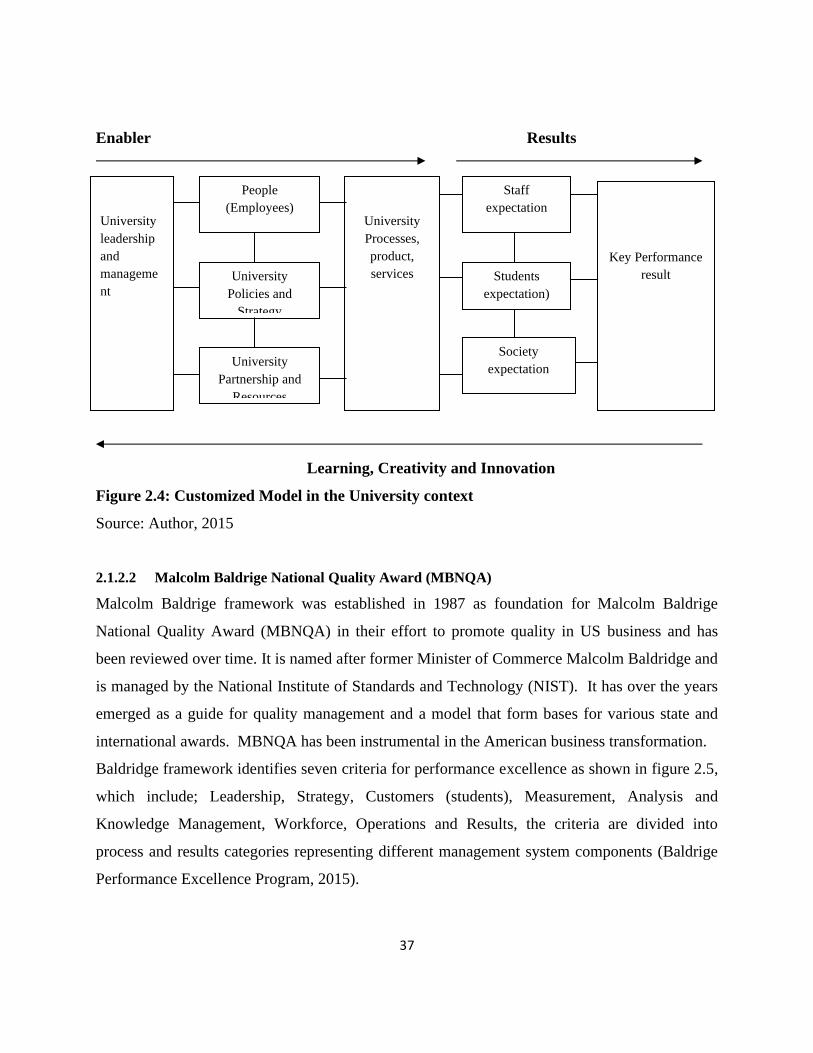
37
Enabler Results
Learning, Creativity and Innovation
Figure 2.4: Customized Model in the University context
Source: Author, 2015
2.1.2.2 Malcolm Baldrige National Quality Award (MBNQA)
Malcolm Baldrige framework was established in 1987 as foundation for Malcolm Baldrige
National Quality Award (MBNQA) in their effort to promote quality in US business and has
been reviewed over time. It is named after former Minister of Commerce Malcolm Baldridge and
is managed by the National Institute of Standards and Technology (NIST). It has over the years
emerged as a guide for quality management and a model that form bases for various state and
international awards. MBNQA has been instrumental in the American business transformation.
Baldridge framework identifies seven criteria for performance excellence as shown in figure 2.5,
which include; Leadership, Strategy, Customers (students), Measurement, Analysis and
Knowledge Management, Workforce, Operations and Results, the criteria are divided into
process and results categories representing different management system components (Baldrige
Performance Excellence Program, 2015).
University
leadership
and
manageme
nt
Staff
expectation
University
Processes,
product,
services
People
(Employees)
University
Policies and
Strategy
University
Partnership and
Resources
Students
expectation)
Society
expectation
Key Performance
result

38
Figure 2.5: Malcolm Baldrige National Quality Award (MBNQA) Framework
Source: Baldrige Performance Excellence Program, 2015
The core values and concepts underpinning the Baldrige Criteria for performance excellence
represent the beliefs and behaviour of an organization that demonstrate excellence performance.
They include: visionary leadership; management by facts; managing for innovation; focus on
success; moral values and transparency; social responsibility; organizational learning and agility;
valuing people which include employees and students and partners; customer-focused excellence
and delivering value and results (Baldrige Performance Excellence Program, 2015).
The MBNQA aims at achieving performance excellence and its criteria are accepted globally as
good standard for performance excellence. The leadership practices within Baldrige criteria have
been validated through years of experience, expert review and research making Baldrige a global
standard for success. The Baldrige criteria are globally adaptable to organization in
manufacturing, businesses, education, health care, and nonprofit organizations as guide to
39
achievement of excellence. The Baldrige Criteria has been validated though various Case studies
of MBNQA winners that it contribute to their sustainable growth and success. According to
Cazzell and Ulmer (2009) the success of implementing excellence framework is highly
dependent on the top high management commitment to the quality of an organization. The model
is applied by many organizations not only for the award but also as a guide in running the
organization (Baldrige Performance Excellence Program, 2015). These model support the study
variables leadership, strategy, people management (workforce), operation which include the
process management with leadership being the driver of all the component within the baldrige
system.
2.1.2.3 Balance Scorecard
The Concept of Balanced Scorecard (BSC) was first introduced in 1992 by Kaplan and Norton; it
defines organisation’s performance and measure whether the organisation is achieving the
desired results. BSC translates the institutions vision and mission into objectives and
performance measures that can be quantified and apprised (Rigby,2015). The BSC added the
non-financial performance measure to traditional financial metric of measurement to allow
manager have a balanced view of organizational performance. The three non-financial metrics
include customer perspective, internal business process perspective, and learning and growth
perspective (Awadallah & Allam, 2015). The BSC has over the years evolved from a tool for
simple performance measurement to a strategic planning and management system not only
providing performance measurements but also helping to identify what should be done and
measured (Kaplan & Norton, 2008). It overcomes the inadequacies of the traditional financial-
based performance measurement tools, providing a holistic performance outlook (Awadallah &
Allam, 2015). Rigby (2015) argues that BSC defines the organisational performance’s and assess
if the management is achieving the expected results, he further notes that it translates the
organisation vision and mission into objectives and measureable performance measures that can
be quantified and accessed.
The BSC is perspective based frame work, viewing organization from four perspective namely;
financial perspective (financial performance such as revenue and cash flow) as measure of the
40
company success which is supplemented with customer perspective (customer satisfaction such
customer loyalty), internal business process perspectives (the efficiency of the process including
quality measures) and learning and growth perspective (knowledge and innovation), can we
continue to improve and create value (Rigby, 2015; Hladchenko,2015). The learning and growth
people are the main resource and are key determinant of success of any knowledge- worker
organization. The scorecard is based on measures beyond the financial performance making it
very useful for adoption by HEIs. The BSC in HEI focuses on personnel development, education
and research, quality improvement based on the stakeholders, this should consequently
contribute to the financial perspective which is very critical (Hladchenko, 2015). Madsen and
Stenheim (2014) observes that those BSC may not be perfect but it has an overall positive effect
on the performance of an organisation, he further note that the concept is still been developed
and it interpretation varies. According to Madsen and Stenheim (2014), BSC assist manager to
focus on strategy, structure and vision, it integrates financial and non-financial based metrics
assisting the manger to focus on the entire business process and assist the manger to monitoring
of the execution of a strategy.
According to Rigby (2015) financial performance will eventually increase if on the other hand
the company’s performance improves. The balanced scorecard is an effective tool for the
strategic management in the HEIs. Awadallah & Allam, 2015 observes that BSC has not clearly
defined relationship with organisational performance, objective and definitions of measures
excludes key stakeholders, lacks the definition of key success factors necessary for identifying
KPIs and the four category limit the view of the organisation.
BSC provide a systematic view on the strategy of HEI, it provides a framework for
implementation and controlling of the strategy and provide a basis for further learning in the
process of strategic management of the HEI according to the scheme “plan-do-check-act”(
Hladchenko,2015). According to BSC principles it translate strategy into operations; aligning
organisation to strategy; integrating strategy into employees’ tasks; making strategy a continuous
process; and mobilizing change through leadership (Kaplan and Norton, 2002). Kaplan (2009)
identifies leadership as the most significant determinant of failure or success of the balanced
41
scorecard. The advantage of adopting BSC is because the four perspectives Financial, customer,
internal process, learning and growth provide an opportunity to develop a balance between
internal processes and external factors which are in the base of the strategy of the HEI
(Hladchenko,2015). According to Hladchenko (2015) perspective of BSC developed by different
universities focused on personnel, education and research, improvement of the qualityas per
internal and external stakeholders, the acquisition of this perspective will contribute to the
funding (finance perspective) which is critical considering the scarcity of resources in
universities. This study assessed the performance of the University from different perspective
including management, academic and financial perspective making BSC very relevant in this
study.
2.2 Theoretical Review
Theory is perspectives based on which people make sense of their world experiences (Stoner et
al., 1995). Sutherland (1976) also defines theory as an ordered set of assertions about a generic
behavior or structure assumed to hold throughout a significantly broad range of instances.
According to Govindarajan & Natarajan (2005) a Theory is a systematic grouping of mutually
dependent concepts and principles that tie together a certain area of knowledge. Performance
excellence is of particular interest in all organizations both profit and non-profit making and in
particular HEIs which was the main focus area of this research. There are a number of theories
and models that contributes to the achievement of performance excellence in organizations. The
theories reviewed underpinning this study includes: leadership theory; transformational
leadership theory, open system theory, contingency theory and resource based Theory.
2.2.1 Leadership Theories
Research has demonstrated that good leaders positively influence their employees and
consequently the organizations performance; this has formed the basis of much research being
undertaken in leadership theory as researchers seek to better understand what are the
characteristic behaviour of the successful leaders. Many scholars and practitioners argue that
leadership bring together organizational effectiveness and people’s performance. Leadership
42
behaviour has been argued and widely believed by many scholars that it can improve leaders’
leadership potential and encourage the employees to improve their performance resulting to
enhanced organisational performance (Jing and Avery, 2008; Lai, 2011). Leadership has been
studied for many years but researchers are still trying to answer what makes an effective leader
and what distinguishes him/her from non-effective leader (Northouse, 2010).
A number of leadership theories have evolved over time, this include: the Great Man Theory;
Trait Theory; Behavioural theory (the Managerial grid theory X and Y); participative leadership,
this include Lewin’s leadership style comprising of autocratic style, democratic and Laissez-
faire; situational leadership, Contingency theory; situational theory, transactional leadership and
transformational leadership (Kouzes & Posner, 2007). According to Lai transformational
leadership as revealed by Meta-analyses is related to more positive outcomes and better
contextual performance and followers output that is above board. This research reviewed the
transformational leadership.
In transformational leadership, the leader exhibit charisma and a shared vision with the
followers, stimulating their performance leading to excellent output. According to Lia (2011),
Transformational leadership theory is associated with higher performance compared to other
style of leadership. Transformational leadership is characterised by four facets: charisma or
idealized influence, inspirational motivation, intellectual stimulation and individualized
consideration (Warrilow, 2012). The idealized influence is characterised by making other feel
good and proud to be associated with him as well as subordinate earning faith in the leader. The
leader achieve results through people, the leader has to ensure that employee are agrees with his
views. Inspirational motivation of transformational leader is about how the leaders communicate
his goals inspiring the followers and helping them find meaning in what they do. It encourages
the team to work for a shared common goal. In this regard the employee through engaged
communication feel involved and been part of the decision. Intellectual stimulation is
characterised by capability of the leader to empower others and make them think of new ways of
doing work and to embrace creativity at work. The leader needs to empower his employee
through provision of resources and mandate to make decisions. Individualised consideration is
43
the extent to which the leader attends to individual needs of the followers through coaching and
mentoring them and appreciating each individual contribution. It empowers the employee giving
them a platform to be innovative (Odumeru & Ifeanyi, 2013; Northouse, 2010).
Transformational leadership as described by Balyer (2012) has the ability to increase the team
players to be fully committed in meeting the organization goal, it views leadership as an
organizational entity and not individual task. Similarly Balyer (2012) describe transformational
leader as a leader who charismatically lead, empower and inspire followers, giving
organizational vision and inculcating trust and confidence to all the team players. According to
Pierce (2008), transformational leadership has been embraced as one way of encouraging
employee’s performance. Many leaders have embraced transformational leadership and modern
management techniques which influence the transformation of organizations. Transformational
leadership brings about change of people and organization towards realization of organization
goals. Through this form of leadership, the leader is able to make all his followers undertake a
participatory role in the organization taking cognizant that the performance, attitude and
behavior of the support staff contribute immensely to the success of the organization.
Northouse ( 2010) describes transformational leadership as leadership of driving change within
an organization through empowering the followers and being role models. He further argues that
transformational leadership is directly related to organization innovation, the employees under
this form of leadership are empowered and are free to generate new ideas. This leadership model,
calls for one to be vision oriented with the ability to plan in advance for the projected growth of
the organization in line with its objectives. The involvement of the support staff through creating
awareness of the organization vision and mission instils commitment in them to endeavour to
work as a team for the intended results. Good communication and relation with the support staff
will be important for them to emotionally attach themselves to the organization.
According to (Bakar &Mahmood, 2014) transformational leaders identify and implement changes
needed for the betterment of the organisation; they motivate and share the organisation vision
with the subordinate staff inspiring them to place the interest of working as a team above the
44
individual interest. With the emerging rapid changes and global competition in the education
landscape, HEIs will only survive and remain successful if they are able to adopt changes and
learn fast, transformational leadership offers this environment since it view organisation as
constantly being reinvented to implement the required changes (Bakar & Mahmood, 2014). He
further observes that a motivated workforce remains dedicated and committed to delivering
organisation goals. A study by Bakar & Mahmood (2014) in Malaysian public HEIs revealed that
transformational leadership significantly and positively influence on performance, meaning
higher level of transformational leadership results in high level of performance. In a study by
Omutoko (2009), he argues that the objectives envisaged in the Millennium Development Goals
(MDGs) blue print can be achieved through having leaders that embrace transformational
leadership.
2.2.2 System Theory
A system as described by Daft, Kendrick & Vershinina (2010) comprises of different closely
related parts that function together to achieve a common goal. Similarly, Olum (2004) describes
a system as a collection of part unified to accomplish a certain goal. A system operates through
using input from external environment and giving back some output to the external environment
(Daft et al.,2010). System theory can be viewed as having five components that interact with one
another; inputs, processes, outputs, outcomes or feedback and the environment. The input in the
system theory refers to resources used to produce goods and services including the materials,
financial, people and technology or information system. The process is the use of production
technology to transform the input to output this include; planning, organizing, motivating and
controlling while the output comprise of the organizational product and services. The feedback
takes into account the results knowledge that informs the selection of the inputs in the next
process to enhance organizational productivity.
Some of the concepts in the system theory that affect the thinking of management include, open
and closed system, entropy, synergy and lastly subsystem interdependencies. Open system needs
to interact with the external environment to thrive and closed system based on classical and
management science perspective; Organizations were viewed as closed systems without any
45
external disturbance with a view of simplifying quantitative analysis. This is however not
feasible, all organizations are open system otherwise ignoring the environment will result into a
failure (Daft, Kendrick & Vershinina, 2010). Open system theory is premised on the fact that the
environment within which the organization operate strongly influences it. The environment may
comprise of many forces including economic, political or social aspect. The environment also
provides an organization with the resources it requires for its operation and survival. In relation
to open system theories, there is a relationship between the organizational survival and its
environment. The environmental influences can be specific or general, specific environment
refers to network of suppliers, government agencies and competitors which business enterprise
inter-acts with while the general environment include the social, economical and political
environment (Daft, Kendrick & Vershinina, 2010; Olum, 2004 & Bastedo, 2004). HEIs can
enhance their environment through widening their network, this can be achieved through
stashing vibrant partnership and collaborations with other universities, industries and
communities. Networking helps the build synergies and collaborate instead of competing.
According to Olum (2004), system theory assists the management to look at the organization
from a broader perspective and in the relationship of various parts that play a key role in the
success of organization. He further argues that system theory has had a significant effect on
management science and has contributed to the understanding of organizations. A system need to
continuously get new input from the environment to survive; this can be actualized through
continuously responding and adjusting to the changes that bring new input on board, the
environment can be engaged through partnership and collaborations that will enable the
institution build synergy for betterment of their performance. According to Mele et al. (2010)
systems theories can effectively contribute to management, marketing and service research. The
leaders and managers need to understand the system and plan for any structural adjustment of the
entire system for it to work efficiently. The sub-system depends on one another and manager
needs to be proactive and adaptive in initiating and implementing adjustment where necessary to
promote performance excellence. Daft, Kendrick & Vershinina (2010), observe that changes in
organization are most often delayed because of the different sub-system that are all
interconnected and they have to work together. They assert that the manager has to be well
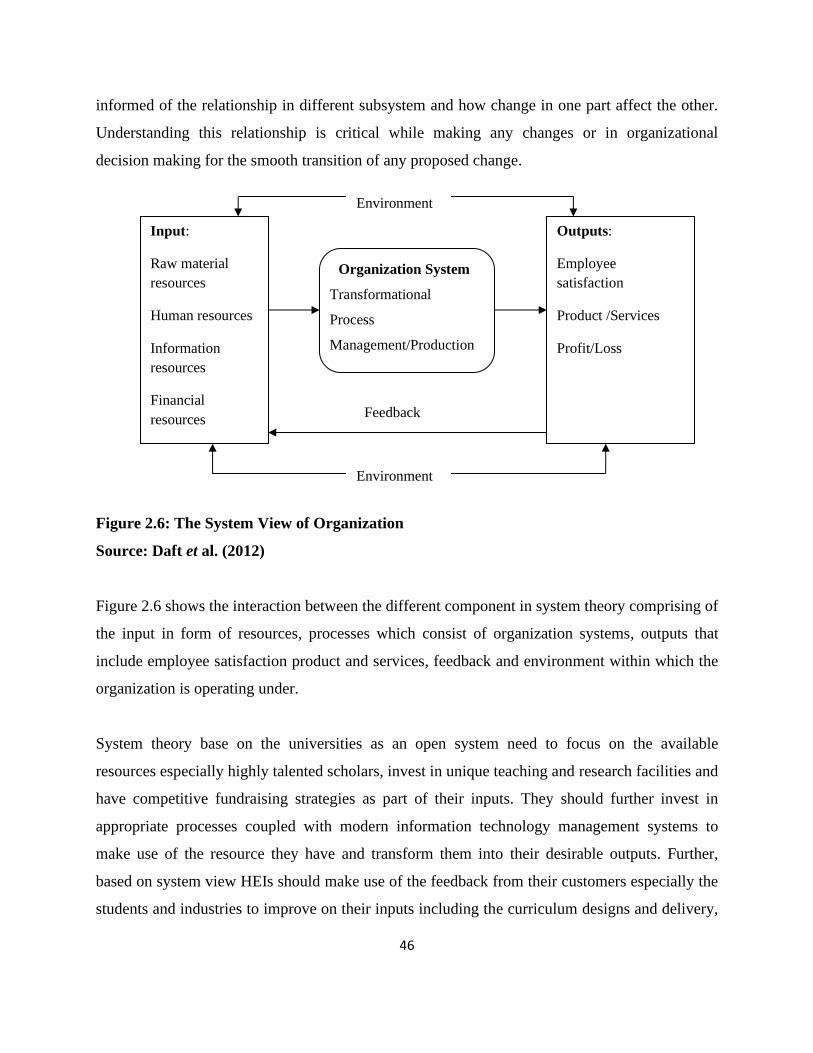
46
informed of the relationship in different subsystem and how change in one part affect the other.
Understanding this relationship is critical while making any changes or in organizational
decision making for the smooth transition of any proposed change.
Figure 2.6: The System View of Organization
Source: Daft et al. (2012)
Figure 2.6 shows the interaction between the different component in system theory comprising of
the input in form of resources, processes which consist of organization systems, outputs that
include employee satisfaction product and services, feedback and environment within which the
organization is operating under.
System theory base on the universities as an open system need to focus on the available
resources especially highly talented scholars, invest in unique teaching and research facilities and
have competitive fundraising strategies as part of their inputs. They should further invest in
appropriate processes coupled with modern information technology management systems to
make use of the resource they have and transform them into their desirable outputs. Further,
based on system view HEIs should make use of the feedback from their customers especially the
students and industries to improve on their inputs including the curriculum designs and delivery,
Input:
Raw material
resources
Human resources
Information
resources
Financial
resources
Organization System
Transformational
Process
Management/Production
Technology
Outputs:
Employee
satisfaction
Product /Services
Profit/Loss
Feedback
Environment
Environment
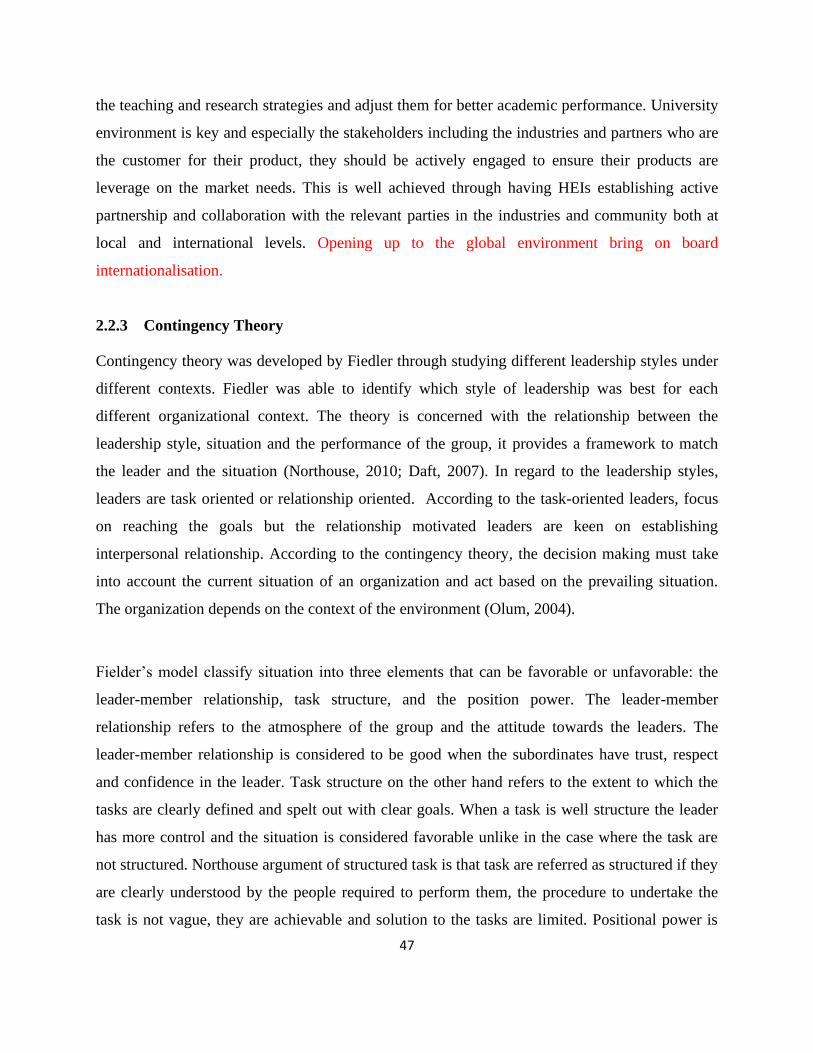
47
the teaching and research strategies and adjust them for better academic performance. University
environment is key and especially the stakeholders including the industries and partners who are
the customer for their product, they should be actively engaged to ensure their products are
leverage on the market needs. This is well achieved through having HEIs establishing active
partnership and collaboration with the relevant parties in the industries and community both at
local and international levels. Opening up to the global environment bring on board
internationalisation.
2.2.3 Contingency Theory
Contingency theory was developed by Fiedler through studying different leadership styles under
different contexts. Fiedler was able to identify which style of leadership was best for each
different organizational context. The theory is concerned with the relationship between the
leadership style, situation and the performance of the group, it provides a framework to match
the leader and the situation (Northouse, 2010; Daft, 2007). In regard to the leadership styles,
leaders are task oriented or relationship oriented. According to the task-oriented leaders, focus
on reaching the goals but the relationship motivated leaders are keen on establishing
interpersonal relationship. According to the contingency theory, the decision making must take
into account the current situation of an organization and act based on the prevailing situation.
The organization depends on the context of the environment (Olum, 2004).
Fielder’s model classify situation into three elements that can be favorable or unfavorable: the
leader-member relationship, task structure, and the position power. The leader-member
relationship refers to the atmosphere of the group and the attitude towards the leaders. The
leader-member relationship is considered to be good when the subordinates have trust, respect
and confidence in the leader. Task structure on the other hand refers to the extent to which the
tasks are clearly defined and spelt out with clear goals. When a task is well structure the leader
has more control and the situation is considered favorable unlike in the case where the task are
not structured. Northouse argument of structured task is that task are referred as structured if they
are clearly understood by the people required to perform them, the procedure to undertake the
task is not vague, they are achievable and solution to the tasks are limited. Positional power is

48
the extent to which the leader has authority over his subordinates. It is the authority to supervise,
evaluate, reward or reprimand the subordinates. Position power includes the legitimate power
one assumes by virtue of taking up a certain position. The situation is favourable if a leader has
authority and it is considered low if he has little or no authority over the employees (Daft,1999;
Northouse, 2010). The contingency theories (Fiedler,1997) contribute to the leadership studies
and more so in HEIs by acknowledging the influence of the context and situation on leaders and
leadership effectiveness.
2.2.4 Resource Based View Theory
Resource based view was initiated in Mid-1980s by Wernerfelt (1984), Rumelt (1984) and
Barney (1986), and has over time become a key approach in achieving sustainable competitive
advantage (Barney, 1991). The resource based theory implies that the organizational resources
are key determinant of its performance which may also contribute to its sustainable competitive
advantage (Barney, 1991). The postulation of RBV is that a firm has varied resource that are
variable, rare, non-imitable and non-substitutable (VRIN criteria) (Barney, 1991). These
variables largely differentiate firms’ performance and their competitive advantage in the
industry. Resources are the tangible and intangible assets a firm uses to choose and implement it
strategies (Barney, 2001). According to Barney (1991), Resource Based (RB) theory looks at
what resource the organization have, their potential and develop strategy that facilitate
achievement of maximum value that is sustainable. David (2009) argues that in achieving
competitive advantage, the organizational internal resources are believed to be more important
than the external resources. He further classifies the organizational internal resources into the
following categories: physical resources including raw materials, plants and equipments,
location, technology; Human resource that comprise of the staff, experience, knowledge, skills,
training and ability; and organizational resources that include the organizational structure,
information systems, its processes, databases, copyrights, patents and trademarks. Barney (1991)
on the other hand described firm resources as all assets, capabilities, organizational processes,
firm attributes, information and knowledge that a firm posses and facilitate it to implement its
strategies.

49
According to resource based theory an organizations acquire a competitive advantage over the
others through acquiring strategic resources that are valuable, rare, and are difficult to copy or
imitate, and cannot be substituted. Strategic resources help the organizations to exploit on their
strengths and opportunities to check on their threats. Organization can achieve success through
investing on resources that are difficult to imitate and cannot be easily duplicated by their
competitors and some of the resources are also protected through patenting, trademark and
copyrighting; in some cases, resources develop over a period of time such as good culture. An
organization with difficult to imitate resource has a better advantage over their competitors.
Resource is non-substitutable if your competitor cannot find another way to get the same gain as
provided by that resource (Ketchen & Short, 2016). Similarly, David (2013) shares the same
view that organization relies on their resources to exploit their opportunities and reduce the effect
of their threats.
The application of resource-based theory takes into account the tangibility of the resource.
Tangible resources are the physical asset that can be touched, seen and quantified, they include
asset such as equipments, money and buildings. The intangible resources include things like the
employees’ skills and knowledge, organizational culture and reputations. The RBV view is
contrast of the Industrial Organizational (I/O) approach to competitive advantage which argues
that external factors are more important than the internal factor. According to Michael Porter, a
proponent of the I/O, industrial forces are the main determinant of the organizational
performance (David, 2013). The intangible resources are strategic resources that organizations
should leverage on to achieve a competitive advantage. RBV was found to be relevant in this
research since university require to leverage on it unique resources including financial, physical
resources and human resources; employees are fundamental intangible resources to the HEIs.
The level of knowledge and masterly of their subject area really matter to the quality of graduate
they produce.
Some of the major weaknesses identified in the RBV theory is that misses out the managerial
implications, it explains that managers have to develop and obtain strategic resource but does
explain how the manager can do it (Kraaijenbrink, Spender, & Groen 2010). Based on the

50
current constantly changing environment, sustained competitive advantage is not achievable as
argued by the RBV It is ignorant of both potential of extra resources and influence of existing
resources (Barney 1991). RBV focused on internal organisation of the firm ignoring the external
factors like the market, the model fails to recognise the customers which may result to not having
demand for its product. HEIs should endeavour to recruit and retain highly talented faculty
members to achieve a competitive advantage over their competitors.
2.3 Empirical Literature Review
In a study undertaken by Salmi (2009) in his research on “the challenges of establishing world-
class universities (WCU)” a tertiary education Coordinator of the World Bank, Salmi identifies
three drivers of superior result which include leading edge research, highly sort graduate and
technology transfer from the world-class universities. Salmi (2009) identifies three drivers of
WCU including high concentration of talents, abundant resources that facilitate a good learning
and research environment, favorable governance that envision the future, support innovation and
flexibility and support autonomy in decision making and resource management as shown in
figure 2.7. He argue that these factors are all common in the Ivy League universities in the US,
Oxford and Cambridge in UK, this is also replicated in the new world class universities such as
National University of Singapore and Tsing Hua University in China, all these universities have
the ability to recruit the highly academically qualified students.
Similarly other scholars have tried to identify what WCUs have that is not possessed by the
regular universities, Altbach, 2004; Khoon et al., 2005; Niland, 2007 identified Highly qualified
faculty, competitive remuneration, adequate facilities to support teaching, research,
administration and student life, Academic freedom, Adequate funding government and Non-
government financial support, autonomous governance structure, International and highly
talented students, excellence research and Quality teaching. This were identified as what drives
the world class universities.
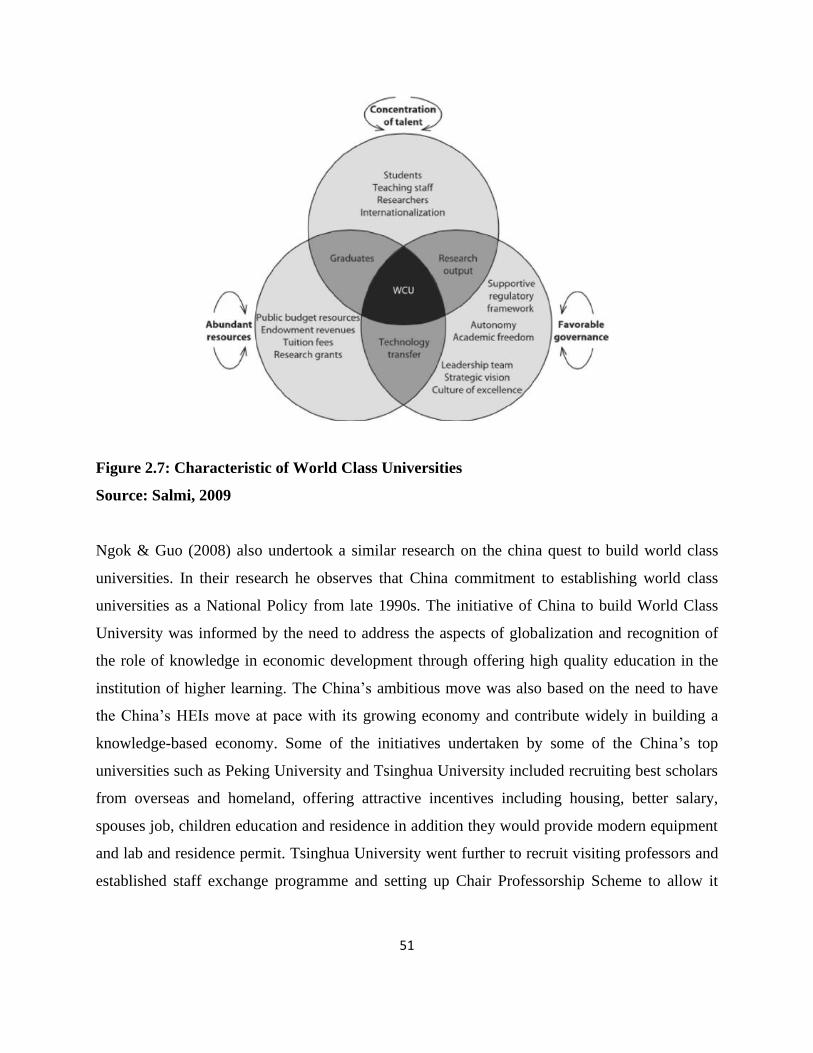
51
Figure 2.7: Characteristic of World Class Universities
Source: Salmi, 2009
Ngok & Guo (2008) also undertook a similar research on the china quest to build world class
universities. In their research he observes that China commitment to establishing world class
universities as a National Policy from late 1990s. The initiative of China to build World Class
University was informed by the need to address the aspects of globalization and recognition of
the role of knowledge in economic development through offering high quality education in the
institution of higher learning. The China’s ambitious move was also based on the need to have
the China’s HEIs move at pace with its growing economy and contribute widely in building a
knowledge-based economy. Some of the initiatives undertaken by some of the China’s top
universities such as Peking University and Tsinghua University included recruiting best scholars
from overseas and homeland, offering attractive incentives including housing, better salary,
spouses job, children education and residence in addition they would provide modern equipment
and lab and residence permit. Tsinghua University went further to recruit visiting professors and
established staff exchange programme and setting up Chair Professorship Scheme to allow it
52
attract some outstanding professors in the world. These initiatives led to for instant Peking
University, China attracting back more than 40% of its staff from overseas.
Chinese top University took a number of initiatives towards becoming world class universities.
Comparing itself with other world class universities in USA and UK such as Oxford University
and Yale, the top University in china observed that they lacked financial stability and long
history. He further note that, even with finances which the University can use to hire highly
talented professors and researchers, acquire the most modern equipment and facilities and
incentivize the researcher to publish in top peer refereed journals, Chinese top universities lacked
the appropriate academic freedom and supportive university governance to set the path in
becoming world-class universities. However, despite all the experienced challenges China
higher education system has been evolving fast. Peking University is ranking among the world
class universities, According to ranking by UK’s Time Higher Education. Marginson (2006)
acknowledge that, building University the status of Oxford or Harvard is factor of time.
The study started by exploring through case of studies what drives the best universities from
different regions globally to take cognizant of the different cultural, economic, political,
geographical and environmental background under which they operate in. The case of studies
reviewed 11 universities (appendix VII) that were ranked best in each continent based on
different 2015/2016 University rankings comprising of Webometric Ranking, THE World
University Ranking, Shanghai Jiao Tong University (SJTU) Academic ranking of World
Universities (ARWU) and QS World University Ranking. Common drivers of performance
excellence were extracted from top universities by region as summarised in appendix VIII (a).
Among the key drivers identified that were common include financial stability characterised by
huge endowment funds established through fundraising campaigns from Alumni, donors,
philanthropies, friends of university and corporations. This is achieved through fundraising
campaigns with specific theme of supporting the university agenda such as “Harvard campaign”
in Harvard University and “MIT for Better world” in MIT. These universities were also found to
have abundant resources to support teaching, research and administration, this evidenced through
having well equipped laboratories with state of the art equipment and best libraries in the world.

53
The universities were also found to have a wide range of active partnership and collaborations
with top companies, other leading universities and other stakeholders worldwide. These
universities also cherished to have a well-established, vibrant and strong network of alumni.
High concentration of talents was also a common characteristic; this is evidenced by their low
staff to students ratio as evidenced in table 2.4, high number of faculty members and researchers
who are PhD holders and professors. Internationalization of the higher education system was also
cutting across all the top universities, this was evidenced by the high percentage of international
students and staffs. The leading universities had also embraced use of technology in teaching and
learning, for example MIT and Harvard are the founder of Massive Open Online Courses
(MOOCs), HarvardX, MIT is also a leader in innovation hub while on the other hand Stanford
StartX is an incubation centre in the University of Stanford which has also contributed heavily in
the development of silicon valley. These universities were also viewed to provide conducive
learning environment and quality service delivery with majority of the student getting financial
support. Holistic campus life campus life was also key element that was demonstrated from most
of the universities, this was evidenced through the high number of clubs and societies.
McCormark et al. (2014) examined the relationship between the management practices and
performance in the UK based universities, the research though showed variation in performance
between research-intensive universities, older universities and newer universities, with better
management being associated with better performance. In contrast to other manufacturing firms,
there was clear evidence of decentralized management system with one department showing
different result of better management than the other. Among the highly rated drivers of
performance is good practice in recruitment, retention and promotion. Incentive matters were
also viewed of importance across all the universities. In conclusion, it came out that despite the
other resources, getting the right staff matters and contributes significantly to performance.
Mukherjee & Wong (2011) has identified a number of lessons that other universities in the
emerging economies can benchmark with NUS as they look forward to becoming world Class
Universities, among them include financing, University management and governance,

54
leadership, strategic planning, autonomy, recruiting of highly talented students and highly
talented staff, internationalization through recruiting and attracting foreign students and staff.
NUS has strategically aligned itself to be a globally competitive University through having
competitive and performance based remuneration, this initiative support the University in
attracting and retaining the best members of the faculty. The competitive salary attract the
diasporas while keeping abreast with global competition. NUS has also made deliberate effort to
increase the level of research funding and provision of relevant research infrastructure, it was the
first Asian University to implement campus wide access to internet and link to international
academic networks. Promotion and giving reduced workload to faculty members with excellent
research record to dedicate more time to research has also been another key strategy of NUS in
promoting research. Other initiative to support its research agenda are through establishment of
research collaboration and research centers. It is located next to the Singapore Science Park
which provides an enabling environment for undertaking research and innovation
A study by Omutoko, (2009) on re-thinking the management of HEIs in Kenya found that there
is an urgent need to re-look at the management of the HEIs for them to remain relevant. Otieno-
Omutoko notes that the HEIs in Kenya are faced with numerous challenges which will require
re-thinking on the management approach to overcome the challenges facing them. His view is
that the HEIs are in crisis due to low quality as result of rapid expansion against limited
resources and they will need to focus on coherent and consistent practices that will enable them
handle these challenges. The study suggest that management by results will be ideal for HEIs
where objectives are set and the resources required to actualize the activities are provided
through negotiation with the relevant authority. The study also emphasises on the use of
corporate knowledge management practices to make informed decisions for continuous success
of the organization performance
According to Mathooko & Ogutu (2014) for the public HEIs to survive in Kenya amidst these
myriad of challenges, they need to come up with sustainable and competitive strategies. He
further recommend that, to make Kenyan public universities remain competitive and leaders in
the East African region, the universities have to develop sustainable strategies, improved

55
governance, training for the leader on management skills and managerial skills, and flexible
governance model that are customer focused recognizing students, parent and industries as
customers, and adoption of corporate management styles. According to Mathooko and Ogutu,
universities should avoid unhealthy competition for students and staff through re-engineering
themselves as centre of excellence in specific area of interest.
In a similar study to address challenges of HEIs in Kenya, Odhiambo (2011) argue that there is
an urgent need for Kenya HEIs to initiate reform and especially developing policies that will
support staff retention and rewards and effective strategies to handle the ongoing expansion.
Marwa (2014) note that, a number of initiatives have been deployed to address these challenges,
he however observe that some of these challenges remain unresolved and others are still
emerging as competition continue to rise that are negatively impacting on the quality of our
education system. Nyangau (2014) identifies quality high education as what would facilitate
training of a well highly skilled workforce that is required by Kenya to be able to compete in the
modern competitive knowledge based economy, this is informed by the evidence and lessons
from other nations that are newly industrialized that higher education plays a crucial role in the
growth and transformation of an economy. Altbach (2004) identify academic freedom and
intellectual excitement atmosphere as key drivers of world class universities, in this regard, he
observes that the academic staff and student are freely able to pursue knowledge regardless of
where it lead and publish the work without fear of external authorities. This research is informed
by the challenges faced by HEIs in Kenya coupled with the fairly low ranking of Kenyan
Universities in the global ranking tables raising the need to explore the drivers that institution
need to focus on that will guide them to draw a road map for achieving performance excellence.
In order for an organization to achieve and remain successful, they need to understand their
challenges, opportunities and threats to be able to make use of opportunities and at the same time
avoid any threats that may obstruct their success (Mathooko & Ogutu, 2014). To enhance global
competitiveness, Government and top universities are focusing on alternative competitive
funding strategies, institutional internationalization and reforming the governance at both
national and organizational levels (Wang et al., 2013). Other scholars such as Salmi (2009) have

56
identified; concentration of talents, availability of resources and governance that envision the
future, support innovation and flexibility and support autonomy in decision making and resource
management. The EFQM model identifies leadership, people, policy and strategy, partnership
and resources, processes, products and services as key “enablers” in achieving desired results
(EFQM, 2013). This study thus seeks to establish the key drivers of performance excellence in
universities in Kenya.
2.4.1 Leadership and Performance Excellence
The terms ‘Leadership’, ’Management’ and ‘Governance’ are commonly used interchangeably
but their meanings are different. Leadership is an art of influencing a team or individual towards
achieving set objective through developing a clear vision and motivating individuals (Spendlove,
2007). Management is concerned with efficiency, effectiveness and quality service delivery to all
stakeholders in the pursuit of the set organizational objectives. On the other hand governance is
concerned with the frame work under which the institution operates, which include the rules and
mechanisms under which different stake holders get involved in the decision making and the
accountability. Leadership and governance in HEIs entails the authority in decision making
regarding policies and other practices within the University. The Vice Chancellor or President
who is the head of the institution and the Chief Accounting Officer has the formal authority to be
in charge of the day- to-day management of the University as vested to him through the
instrument of authority, Charter and Statutes. He/she is responsible of directing and leading the
staff, managing budget and resources and setting the University academic activities in
consultation with the Senate (Republic of Kenya, 2012). Leadership and Management are
identified by Sifuna (2013) as key factors in addressing the myriad of challenges being
experienced by Kenyan HEIs and by extension African universities. He argues that, challenges
facing Kenya such as globalization, infrastructure and underfunding can be addressed through
committed leadership that support autonomy and academic freedom to enhance accountability
and quality service delivery. He attributes the poor performance of Kenyan high education to
lack of innovative organizational and leadership approach that tap into individuals and
stakeholders potential in fulfilling the organizational mandate which are key ingredients.
57
The purpose of Management and Leadership as stated by the Management Standards Centre is to
provide direction through vision development, leadership provision and governance, facilitate
change through change management and innovation, achieve results through realizing the
organizational goals and objectives, meet customer needs by providing quality product and
services, working with people to build partnership and network through effectively using the
provided resources. According to Armstrong (2008) the distinction between management and
leadership is, managers have to be leaders but leader are not necessary managers. He observes
that being a manager of resource is not satisfactory; there is need for one to be a good leader of
people. Management is about result achievement through effectively obtaining, deploying,
utilizing and controlling resources including people, funds, information, and other required
infrastructures on the other hand Leadership is a process of developing a vision for the future,
people motivation to achieve their commitment and engagement.
Black (2015) observes that the current leadership frame work in Higher education does not
accommodate all what leadership literature describes, he recommended that the higher education
leaders requires both leadership and management competencies to effectively address the
challenges been faced by these sector. Muller and Turner (2010) similarly argue that in
management position both leadership and management competences are required for
performance excellence. They further note that a manager or a leader who has weaknesses in one
of the competences or both competences experience numerous challenges in achieving and
sustaining an outstanding performance, the leader therefore need to be a good leader as well as a
good manager as described in table 2.2 below;
Table 2.2: Combining Management and Leadership Success
Leader
Poor Good
Manager
Poor Fail Dysfunctional short-term appearance
of success; long-term failure
Good Sustained but only
moderate success
Sustained and high success
Source: Parry (2004)
58
There is little consensus on the definition of leadership, many scholars have also found
leadership a difficult concept to describe; starting from the time of Aristotle and Plato, leadership
has been a subject of thought and discussion (Alberta, 2012). Leadership is conceptualized as
focus of a group process; where the leader is at the centre of the group activity, for other,
leadership is from trait aspect; this suggest leadership is from special characteristic that leader
possess; other view leadership as behavior or an act that leaders do bring change. Further some
scholars view leadership as power relation between the leader and follower and other theorist
view leadership from the knowledge and skill perspective; the leader in this case has the relevant
skills and knowledge (Northouse, 2010). Despite leadership having a multitude of
conceptualization, four components can be identified as central; leadership is a process,
leadership involves influence, leadership occurs in groups and leadership involves common goal.
Northouse (2010) thus define leadership as a process through which an individual influences a
group in realizing a common goal.
Locke & Allison (2012) observe that, there could be commonalities in leadership in different
realms, but there is also vast difference depending on the organization or the environment one is
operating in. A case in point, integrity is key for any successful leadership or any business
success; on the contrary lack of integrity is a key strength for political success in the present
culture setting, anybody who is aspiring for any political position finds it difficult to win without
compromising his values. Different leaders demonstrate different capabilities and abilities in
accomplishing their mandate as leaders (Yukl, 2010). Warren Bennis and Burt Nanus stated, “A
business short on capital can borrow money, and one with poor location can move, but a
business short on leadership has little chance of survival” (Bennis and Nanus 1985). Leadership
is a significance element in any organizations and it plays a key role in determining the
individual’s interest and commitment in an organization. Odumeru and Ifeanji (2013) argue that
leadership is one of the key factor that significantly contribute to the wellbeing of organisations
and the nations.
59
The outstanding performance of the top leading universities reviewed through the case studies
depict a strong leadership that is vision driven, focused and that lead through role model. The
WCUs manage huge funds which require high level of accountability, this can only be achieves
through upholding good governance and leadership. Good governance and management is
identified as one of lessons other universities aspiring to be world-class can borrow from NUS
(Mukherjee & Wong, 2011). Majority of the leaders of world Class University are in the
forefront in fundraising activities. Goodall (2009) is in concurrence of the influence of good
leadership in driving performance, he argue that high quality university leadership is associated
with better performance.
According to Obiwuru, Okwu, Akpa, & Nwankwere (2011) the leadership styles demonstrated
by a leader is a major determinant of leadership effectiveness, it enhance or retards the
employee’s commitment. Drucker (1993) shares the same opinion that the quality and
performance of a manager decides the success of an organization. The status of the business
today and the future is dependent on the leadership ability to direct the course of the business.
Leadership impact on the success of business is enormous; the leader first and foremost has to
make things happen by being vision-driven and regularly questioning the status quo; they have to
adapt and manage change within the organization. Through setting the vision and goal of the
organization, leaders determine the organizations direction. To achieve the targets and goals,
leaders have to mobilize the relevant and appropriate resources required as well as influence
his/her team towards a common course (Ukpaka, 2009).
Organization performance is linked to leadership effectiveness, as observed by Mirsafaei and
others, they argue that, organizational factors are influenced by leadership and employee job
satisfaction (Mirsafaei et al., 2013). Consequently the employees’ job satisfaction is highly
influenced by leadership since the leader influences the level of motivation of the employees and
their commitment to the organization. Leadership success is not guaranteed by possession of
some specific leadership trait alone, however there is enough evidence that effective leaders
exhibit different certain characteristic that differentiate them from others. Some of the key
leaders trait identified by Locke and Kirkpatrick (1991) which differentiate leaders from non-
60
leaders include drive which take account of achievement, ambition, motivation, energy, initiative
and persistence, leadership motivation, desire to lead but not to seek power; honesty and
integrity; cognitive ability; self confidence and business knowledge. They further observes that,
having the necessary trait by the leader help him to acquire the relevant skills to formulate the
vision for the organization and pursue it.
Good leadership drives the organizations to achieve the excellence needed to propel country’s
economic prowess. For the success of the organization a leader must become involved in
supporting quality and quality cultural development, the leader must make effort in provision of
the relevant resources to the employees, as well as set target and organize activities to reach the
set targets. Leaders of excellent organization shape the future and achieve it, they instil
confidence in their employees, set an example aligned to the organizations values and ethical
approach (Uygur & Sumerli, 2013). There is a growing body of evidence that leadership
regardless of the approach whether trait approach or contingency approach influences the
performance of individual employees in an organization and that of the entire organization
(Hogan et al.,1994). TQM based models such as EFQM and MBNQA also highly recognise the
crucial role played by leadership in improving performance through continuous improvement of
organisation processes (Osseo-Asare, Longbottom & Chourides, 2007). This makes leadership a
key area of focus if organisational excellence was to be focused on.
According to Given (2008) the leadership style used by a leader has a profound effect on the
outcome of the follower as well as that of the organization. Shattock (2013) identified a number
of initiatives to build and sustain excellent universities, including autonomy where he
particularly emphasizes on legal identity, budgetary autonomy, academic freedom which entail
selections of students, selection of staff and deciding what is taught, having a diversified income
base. Another areas identified by Shattock is leadership and collegiality as management tool,
decision making and top down, bottom up communication. Having clear strategy or road map is
key “when you are lost on a highway, a road map is very useful; but when you are lost in swamp
where the topography is constantly changing a road map is of little help, a simple compass
which indicates the general direction to be taken and allows you to use your own ingenuity in
61
overcoming various difficulties is much more useful” (Hayes 1985). Similarly leadership is
meant to provide the team with a strategic direction to achieve the desirable output. Some
research have established challenges in “Academic Leadership”, with Bolden et al. (2012)
recommended hybrid form of leadership style to manage the higher education sector.
In HEIs, the traditional management of the universities is insufficient in driving and creating
institution of excellence, leadership is needed to drive change that is required to drive the
institution of excellence amidst the multidimensional problem that the universities are facing.
Kouzes &Posner (2007) through several surveys recommended a model that work best for most
of the leadership, in their model they described five practices of exemplary leadership including:
Modeling the Way, Inspiring a shared vision, challenging the process, enabling others to act,
and encouraging the heart. EFQM model is viewed to have mechanism to integrate the
leadership in achieving the excellence of an organization (Davies et al., 2001; Da Rosa, Saraiva, &
Diz, 2003). According to EFQM (2013) Leadership influences people, policy and strategy,
partnership and resources consequently people, policy and strategy, partnership and resources
affect processes. People results are influenced by people, society results are influenced by
partnership and resources. Customer results are affected by processes and Society results are
affected by processes. Customer and People results are affected by the Key performance
indicators. In acknowledging the effectiveness of EFQM model, Bou-Llusar et al. (2009) note
that, the best run organizations connect very well with their customers, employees and
communities within which they operate.
Effective leader exhibit certain competencies, traits, behaviours and styles, emotions and
intellect. Dulewicz and Higgs (2005) identify three elements of leadership dimensions including
Intellectual Dimensions (IQ), Emotional and Social Dimension (EQ) and Managerial Dimension
(MQ). According to Dulewicz and Higgs intellectual dimension of a leader is having critical
analysis and judgment ability, being visionary and imaginary and strategic perspective. The
emotional and social dimension entail having self-awareness, emotional resilience, intuitiveness,
interpersonal sensitivity, influence, motivation and conscientiousness. Managerial dimension on
the other hand deal with resource management, communication, delegating / empowering,

62
developing others and achieving (Dulewicz and Higgs, 2005). Similarly, Macfarlane (2013)
identifies four leadership dimension; intellectual dimension, social dimension, managerial
dimension, and moral dimension. The intellectual dimension also known as cognitive dimensions
addresses the cognitive and rational side of a leader, it can be traced back to trait theory of
leadership where intelligence is perceived as a fundamental trait of successful leaders. The
manager needs to be intelligent to be able to develop a vision and strategy to implement the
vision through acquiring, processing and analyzing large amount of information and using it to
make informed decision (Muller & Tuner, 2010). According to Dulewicz and Higgs (2003) the
three intellectual dimensions namely; visionary, critical analysis, and strategic perspective are
very important for leader’s success.
2.4.1.1 Visionary
EFQM model attribute excellence to visionary and inspirational leadership coupled with
constancy of purpose. An excellent leader should create and drive a compelling vision of the
organization he is leading, in this regard he is expected to set the vision, the tone and the
direction for the followers, he should innovatively think about the future of the organization
through demonstrating commitment to the organization, Leader should create a mental image of
the desired future state of the organisation he/she is leading (Locke and Kirkpatrick, 1991).
According to Shelly (2011), “a vision is a leader’s ideological statement of a desired long-term
future for an organization”, it expresses the future that the leader envisages. A vision challenge
people to do their best, Bennis and Nanus argue that one of the key strategy used by leaders was
“Attention through Vision”; the visions the leader convey to the employees give them confidence
that they are capable of achieving what is expected of them (Bennis and Nanus, 1985).
Organization should be led by its Vision, Mission and Values, leaders need develop the
organization vision, mission and values from the onset and ensure they are well understood by all
the stakeholders. He should be in the fore front in ensuring that the organization activities are
oriented to it vision. An effective leader has to be innovative and imaginative in day to learning
of the institution. A successful leader has a vision for the organization,“Where there is no vision,
the people perish, Proverbs 29:18”.
63
The vision and the drive for the employees to achieve it should always be inspired by the leader
allowing the follower work together toward a shared future. According to Otieno-Omutoko
(2009) Universities vision and mission drive and guide their activities, he further observes that
the existing crisis in the universities can be dealt with through having a clear vision and mission
together with the use of data and research to make decisions, appointments and management of
the institutions. The leader is a catalyst and facilitator for the team to work together to achieve a
common vision, shared vision inspire commitment and bring enthusiasm. Kouzes & Posner note
that “Envisioning the Future” and “Enlisting Others” are two key obligations entrenched within
inspiring a shared vision practice and they have to be observed for the organization to realize it
vision. The first move for a leader is to have a clear vision that is aligned to the mandate of the
institution and come up with clear objectives to realize his vision; this will help the organization
to remain focused with a clear transition structure for the future leaders. The leader has to
imagine the possibilities of his employees reflecting on the past, the present and the future
position of the institution; this will entail consultation to agree on what is of common interest
(Kouzes & Posner, 2007).
Visionary thinking is considered to be transformational leadership and an effective leader should
be a visionary thinker. Successful leadership requires long-term thinking with a future projection
on the direction and position the institution should take to achieve its goals. According to
Bryman (2007) leadership involve the development of a vision and describing the frame work
within which one seeks to implement it. A leader need to have a vision to make progress and
consequently set the morale and the momentum to get people involved while taking time to listen
to their views and opinions. Vision is key when implementing any organizational changes, poor
communication of the vision consequently affect any implementation of the organizational
changes.
HEIs are run through boards meeting where key decision affecting the operations and
management of the University are made, it is therefore important for a leader to be decisive and
ensure the decisions arrived at during such deliberations are supported by facts especially on
policy and strategy development and implementation. The ideas generated should be critically

64
analysed to understand their merit and demerit before implementation, this will consequently
assist to mitigate and any risk. According to Dulewicz and Higgs (2005) a leader should have
the ability to undertake critical analysis and judgment by critically probing a fact and making an
informed decision based on the fact and reasonable assumptions. Dulewicz & Higgs, 2005 argue
that a leader should be strategic in his leadership plans by been aware of the wider issues and
their broad implications; the leader should be in a position to balance the short and long-term
considerations and identifies the opportunities and threats in time for the benefit of the
organization. They further notes that, Strategic leader should be in the forefront in formulation
of organization strategy and implementation (Tuner & Muller, 2010).
A visionary leader achieves his vision through influencing the employees to buy to his vision.
According to Dulewicz and Higgs (2005) a leader should be influential, he describes an
influential leader as a leader who persuades his followers to change their opinions using their
position and consequently giving a convincing reason for the change. In the process of
influencing, leaders use their position to make the follower listen to their opinion regarding a
certain matter. Through acting as role model to moral and ethical behavior, the leaders influence
their followers in buying to the organizational goals and achieving the desired results. The leader
should set the moral tone of the organization through role modeling virtues such as discipline,
patience, honesty and accountability. Leaders should use their formal power to influence the
followers to achieve the desired organizational goals. The leader formal position influence the
follower to listen to them and buy into their vision. The ability of the leader to demonstrating self
control and especially in a confrontational situation allow him to gain respect from his
employees and manage to influence them (Muller & Tuner, 2010). “The greatest influence
managers have over their institutions is through making daily choices in what Baldridge and
Okimi (1982) once called ‘Jugular Vein decisions’ which ‘build their institution’s internal
strength and condition to respond favorably to opportunities or threats’ cumulative, every day
decisions can have a lot of more impact on an institution’s destiny than any master plan’
Jenkins (2012) identifies leadership and control as one of the one of the most misunderstood in
HEIs administration aspect. Jenkins argues that many of the leaders spend more time controlling
65
the employees rather than providing leadership. He further note that true leadership entails been
humble, willing to listen, acknowledging others might know more than you know and
acknowledging that one can also be on the wrong or make mistake at some point. Leadership
seeks to serve rather than be served, listening more than speaks and apologizes more than blames
and whispers more than shouts. According to EFQM (2013), Excellent organizations have
leaders who are keen on shaping and realizing the future of the organization, they are able to set
an example by demonstrating and living by organizational values and ethical behavior there by
instilling confidence in the employee. When the employee have confidence in the leader it
becomes easier for the leader to influence them towards a certain desirable direction that will
lead to success of the organization. The description of leadership as an act of influencing a team
towards achieving a common goal fit in well with leadership in university setting due to the
nature of the operation that mostly require team work. The teams in universities comprise of
scholars and researchers who are expert in various discipline. Leading such a team is often
viewed as “herding cats” difficult and pointless McCormack et al. (2013), for leadership to
succeed in such an environment; he has to influence the teams to buy into the vision he has for
the organisation.
The leader should endeavour to enlist others through engaging with employee using the available
consultation forums such as meetings to get to understand what is meaningful to them and align
his goals and dreams with theirs. Great leaders expect a lot from their employee equal to what
they expect from themselves (Locke, 2008). The employee’s interest must be aligned to the
organization vision. To develop a strategic vision for the institution, the leader requires to the
involvement of the employees. The engagement with the employee from beginning makes the
implementation successful since the employees will have bought the idea from the formation
stage. The leader need to be open, have the charisma and speak from the heart to be able to
inspire a shared vision for the employees. Locke notes that feedback on goals progress and the
employee commitment makes the goal setting to be more effective.
66
2.4.1.2 Engaging Communication and Involvement
Successful leadership demand one to be well versed with managerial skills, one of the
dimensions of managerial competences is engaging communication and involvement. Studies
have shown when employee engagement has an impact on organisational performance
(Prasanna,2012). Leaders should promote two-way communications, according to Prasanna
(2012), a clear and consistent communication lead to engaged workforce. Effective
communications provide a smooth connection between the organization strategy and the
employees, the universities need to effectively communicate their strategy to the employees.
Strategic plans are commonly developed at the top level but their effectiveness depend on the
engagement in the entire organization (Brown, 2013). Bennis and Nanus (1985) while
emphasizing the relationship between oral communication and effective leadership argued that “
The management of meaning, mastery of communication, is inseparable from effective
leadership”. According to Hanna (2003) for the University to be more responsive to the
emerging trends, communication within the University will need to change and deviate from the
traditional culture of internal, vertical and formal mode of communication and adopt external,
horizontal and informal. Through communication the leader should engage others and win their
support, it should take care of the interest of it recipient with a clear focus. Though effective
communication the staff can be inspired or feel disheartened, this consequently impact on their
performance and the output of the organization (Higgs and Wren, 2005).
Leaders should be approachable and accessible by the people that they lead, a leader
communication style demonstrate to his followers whether he is approachable and accessible by
the employees, accessibility and approachability creates an enabling environment to engage one
another, share views and idea for the better running of the organization. Communication is key in
people management, a leader need to clearly communicate the organization visions, missions and
strategies to all the employees and stakeholders so that they all share a common goal in the day
to day running of the organization. Through effective communication, a leader opens up a
dialogue which is usually two sided which bring about involvement. Speaking down people
creates barriers and does not promote dialogue which amount to dictatorship leading to decision
been made without a culture of unanimity.
67
The command and control model is no longer favourable, according to Northouse (2010) the
involvement of employee in decision making is rooted in theory “Y”. He observes that if the
employee contributions are valued, the employees remain committed to the organisations goals.
A study by Kuye & Sulaimon (2011) on manufacturing firms in Nigeria revealed that
involvement of employee in decision making has a significance relationship to the firm
performance. Wainaina, Iravo, & Waititu (2014) found that involvement of employee in decision
making has positive influence on organizational commitment. Wainaina et al. (2014) suggest that
the university management and administrator can raise the level of commitment by the
employees through increasing the level of their contribution within the organization. The
employee should be involved in policy development since they are the implementers of the
policies, the university should also actively engage employees in meetings to get their input on
various issues affecting organization (Wainaina et al., 2014). A study by Kipkebut (2010) on
organizational commitment and job satisfaction in Kenyan universities revealed that involvement
of employee in decision making and effective communications makes the employees take
ownership of the university which give them morale in driving the University agenda. The
leaders and manager of the HEIs at all levels should engage the employee through effective
communications and involvement of the employees in decision making to build an engaged
workforce which is interwoven with performance of the universities.
2.4.1.3 Delegation
Delegation is a process through which leaders share and entrust activities and related authority to
other employee in the organizations (Mosley & Pietri, 2011). According to Mosley and Pietri
(2011) there are three key aspects that come with delegation; granting authority which entails
giving power to an individual or a team to take action and make decisions aimed at achieving
organizational goals, an organization cannot function without a system of authority, another
aspect of delegation is assignment of duties and responsibilities through clearly specifying the
duties one is expected to undertake and finally accountability which comes with delegation of
authority. Employees are able to learn through delegation, giving time for the supervisor to
engage in other tasks that cannot be delegated. They observes that leaders fail to delegate due to

68
the attitude of wanting to control. In some cases delegation fails due to lack of trust for other, the
fear that when they delegate they may fail because they don’t find other competent and in some
cases they feel insecure that through delegation the people they delegate may shine with the job
and attract some better recognition than their leader. Weak relationship between manager and
employee was also viewed as a major hindrance of delegation (Mosley & Pietri, 2011).
Mosley and Pietri (2011) however observes that there are genuine cases when the manager are
unable to delegate due to the incompetence nature of the people they should delegate to but also
acknowledge this can still be addressed through training and coaching. Delegation contributes
towards employees’ development since the employees are able to learn through their experience,
it enhances control since the manager is able to emphasize on the results and give feedback.
When leader share their power they are able to concentrate on other big organizational agenda
unlike when they don’t and they end up engrossed in small issues. Likewise for the managers
when they delegate they create more time to focus on planning for the organization. “when a
man realizes he can get others in to help him do something better than he can do it alone, he has
taken big step in life”. Late industrialist Andrew Carnegie (Mosley et al., 2011)
2.4.1.4 Empowerment
Employees need to be empowered to facilitate them to execute their responsibility with authority
and confidence. Garlick (2012) describes empowerment as a “sense that people, groups and
communities can create and take action on their own behalf to meet their physical, spiritual and
psychological needs” to enhance their wellbeing and also increase personal and interpersonal
power. Mosley & Petri (2011) on the other hand describe empowerment as giving the employing
authority to make decision in the areas they are in charge. Similarly, Ghosh (2013) define
empowerment as a process of shifting authority and accountability to other employees at lower
level within the organizational structure. Ghosh further argues that, it is the transfer of power
from the top leaders to their team members. Based on Moley and Petri (2011) definition, Human
beings expect to have power, authority, responsibility and recognition to fully exert their energy
and competencies to achieve excellent performance. Empowerment is one of the items identified
by Development Dimensions International (DDI, 2005) that result in a highly engaged workforce
69
(Prasanna,2012). The leaders and manager should always involve their employees and give
respect to their input, share power with employees through participative decision making, this
will make them feel sense of belonging which increase the level of their engagement to realize
the organisational goals (Prasanna,2012). Through empowerment a leader is able cede some of
the roles to other employees, this make them to focus on other bigger agendas that could be of
more important to the organization.
Through empowerment, the leader fuels good decision making that enables others to contribute
in giving new ideas, the staffs are able to personally make themselves accountable for their
decision. Empowering employees gives staff autonomy and encourages them to solve problems,
become more innovative and creative, they are able to set and develop their vision (Higgs and
Dulewicz, 2005). Further, through empowerment the employees confidently and actively
participate in the running of the organization, they are able to interrogate and challenge the
existing practices and policies ultimately making them better. Empowering employees makes the
employee more responsible and bring about ownership of the organization since more employees
will be knowledgeable and connected to the institution (Mosley & Pietri, 2011). Leaders can
empower employee through coaching and developing them to take up higher responsibilities.
Coaching is as a one to one on job approach used by manager and trainer to assist employee
develop skills and competence (Armstrong, 2008). Mosley & Pietri (2011) on the other hand
refer to coaching as “eyeball to eye ball” type of management. He describe it as a process
through which the manager stay connected with his subordinates, he advises that managers
should walk around like coaches arguing that any interaction between the managers and the
employee is a form of coaching. The employee manager interaction create an opportunity for the
manager to clarify the organizational goals, the priority areas, the expected performance
standards, refresh on the organization core values and give the employee a chance to share their
ideas and get involved in the decision making process. A long the same thinking, Armstrong
(2008) argues that managers achieves results through people and it is their obligation to ensure
that they develop the capacity of the employee to have competitive skills that are required by the
70
organization they lead. He acknowledges that in organizations money matters but people matters
even more and they can be treated as assets with their value increasing as they gain experience.
Though coaching can be done formally or informally, it evolves on a day to day normal
operation. The employees are able to learn when work is delegated to them since one is given a
chance to venture into new challenging areas. Giving individual feedback also contribute
significantly to coaching since it help the individual improve. Mosley & Pietri (2011) identifies
the tutoring, mentoring, counselling and confronting as the coaching functions that individuals or
organizations can apply to achieve the expected output. As a coach the manager help the people
he is managing to learn, provide guidance, and actively involve them in the relevant activities.
Armstrong further note that as a coach the manager should listen to the needs of the employee
and strive to build on their strengths and experience. The manager should believe in the people
that they can succeed and also make a contribution to their success.
Developing others also referred to as coaching or enabling others involve believing other can
take a more challenging tasks, assigning new roles and consequently encouraging them and
supporting them to do so. Employee should be given a chance to develop themselves, develop
their competencies further through training and coaching. Higgs and Dulewicz (2005)
emphasizes that managers should believe others do have potential to undertake task and should
encourage them. They should not fear making others better since they achieve results through
others and their role is to maximize the potential of their employees. The organization should be
aware of the competence it require and regularly undertake the training need assessment to
identify the gaps that could hinder the employee delivering the desired results. Just like the
manager who learns better how to manage when working under a good manager, the same
principle applies to the employees, they also learn through their supervisor (Armstrong, 2008).
Equally the organizations need to prepare for management succession through giving others
opportunities to grow and develop. Most University operate on a model where deans, directors
and chairmen of various department are appointed on termly basis, to mitigate the risk of
unplanned transition by developing other people who are able to take up management position.
“Manager are grown they are neither born or made”.
71
Leaders can also empower their employee through giving them autonomy; autonomy is an
essential element in building employee engagement. The autonomy of University play a
significance role in the performance of the University, a research undertaken by Arslanhan &
Kurtsal (2010) in turkey showed a significance correlation between University autonomy and
University innovation Performance. Bryman (2007) observes that there are some universal
leadership actions that are desirable or undesirable and universities are not exception when it
come to this matter, he however note that there are distinctive features that are unique to HEIs,
some of the significant feature are the autonomy, consultation in decision making and
collegiality. Giving staff autonomy does not mean there are no controls, in a well-run
autonomous organisation the employee receive clear guidance from their supervisors, with clear
instructions and procedures. The academic staff in the universities are a pool of highly qualified
personnel and are an authority in their own areas of specialization or discipline. Granting them
autonomy encourages them to be more creative and innovative as they feel their intellectual
capacity is recognized and they have the freedom to make informed decisions, undertake
research to enrich their profession. These result to intrinsic motivation among the employee.
When employees share the work they also share and own the pride of the success that comes
with accomplishment of such task.
2.4.1.5 Contextual Experience
In study undertaken by Goodall on 100 top University leaders, fifty two of the leaders were from
scientific discipline: Life sciences (26), Engineers (11), Physicists (6), Chemists (5) and
Computer Scientists (4). Thirty-seven were social scientists with, 15 lawyers, 4 educationist, 4
political scientists, 4 sociologists, 4 public and social policy and 6 economist) finally 11 from the
art and humanities. The number of art leaders in the University has been declining since early
1900s. In the University context a good management and leadership is enhanced if the leader
himself is a successful researcher. The core business of a University been research and research
led teaching a leader with inherent knowledge of the core business of the University can drive its
performance (Goodall, 2015). Goodall (2015) observes that, the important of research
Universities to the nations’ economic development is largely undisputed, consequently the
University Leadership and governance is of equal interest, this has triggered the need to establish

72
who the best leader of a top University is. Goodall observes that “the higher the global ranking
of a University the more likely it is that the citations of its president will also be high”. He
further note that majority of the leaders in the University have been in academic and with good
track record and winners of various awards.
Contextual approach is rooted in the contingency theory and according to (Young & Dulewicz,
2006), Leader and organization relationship is potentially very dynamic, and change in context
necessitates change in leaders operations. In this regard different organization strategies may
require change in leadership behavior; the opposite is also true that change in leadership behavior
may require the organization to adopt different strategic approach.
2.4.1.6 Responding to Change
For a successful organization, Leaders have to play a key role in change management. McCarthy
Eastman & Eastman (2010) note that for change to be fast and painless it will require leaders
who are focused, the behavior of leader determine the effectiveness of change. According to
Aquirre (2001), leadership can be described based on change as; coping with change, defining
the change direction and engaging people in the change process. Change is inevitable and indeed
an inherent characteristic of any organization that endeavors to be successful. The digital age has
brought with it many demand for change in the learning and teaching practices; recommendation
has been done on a shift on the leadership the new dynamics in the HEIs. Listening to other,
humility, remaining flexible and accepting when you are wrong will aid one to lead change
(Jenkins, 2012). Adoption and rapidly responding to change will help the universities in
transforming students experience through adoption of new technologies in delivery of lectures,
this consequently lead to equitable outcome of students and enhancement on quality (Child et al.,
2011).
Leadership followed closely by values and communication are the key to successful change
(American Management Association Survey, 1994). According to Gill (2002), effective
leadership of change reflect leadership dimension including: cognitive intelligence, spiritual
intelligence comprising the meaning and worth in peoples life and work, emotional intelligence
and behavioural skills. Gill (2002) further indicate that an integrated model of leadership for
73
change to be successful need to explain element of effective leadership including vision, values,
strategy, empowerment, motivational and inspiration.
Effective leader should be emotionally stable, Emotional intelligence is “the capacity for
recognizing our own feelings and those of others, for motivating ourselves and for managing
emotions effectively in ourselves and others” (Power,2004). Self – awareness is described by the
Dulewicz and Higgs (2005) as the ability to understand “who you are”; the way you feel and the
way others see you. He further note that, Self –awareness is the capacity of been aware of your
emotion or feeling and the capability of been in control of them. In a work environment one
should be in a position to manage their emotions to control their impact. Goleman et al. (2002)
observes that, leaders who have self-awareness are able to control and manage their inner
signals. They are able to recognize their anger and control it before it get to an outburst. They
become conscious of what can result to anger and they are able to put control to it. When a leader
is aware of his or her own feelings, he/she can easily connect with other people feelings which
will help him to be empathetic an act that bring mutual understanding among people.
A person who has emotional resilience is able to perform well consistently under pressure and
different circumstances and adapts behavior appropriately, he is able to balance the needs of the
situation and the task with the involved individual needs and concern. An emotional resilience
leader is able to control his emotion during situation of pressure, this contribute to high
performance since he remains stable. In organization as identified by Dulewicz and Higgs (2005)
dealing with work related pressure, resolution of conflicts, changes and time demand requires an
individual who is emotionally stable. Similarly Goleman (2001) asserts that, an emotional
resilience person is able to remain stable and comfortable even when there is high level of
anxiety in situations of uncertainty. When a leader lacks emotional resilience, he tend to resist
change or is slow in responding to market changes hindering the adoption of new and innovative
ideas.
Interpersonal sensitivity is closely relate with empathy that is often shown when interacting with
others, it refers to taking into consideration the needs and perception of others in decision

74
making or while solving problem or addressing some challenges (Dulewicz and Higgs 2005).
According to research by Witt, Burke, Barrick, & Mount (2002) when a leader lacks
interpersonal sensitivity results in non-ineffectiveness, this is more where roles demand
interaction with others. This is a critical factor and especially while dealing with people, equally
interpersonal Sensitivity is a key leadership practice in HEIs due to the level of autonomy the
scholars possess since each of them can claim some level of expertise in their profession. These
call for one to be conscious of the other people’s views in decision making and recognizing their
stand and opinions.
2.4.1.7 Good Governance
University governance entail the structures, processes and activities involved in planning
University direction and the employees (Fielden, 2008). Goodall (2015) argue that the important
of leadership and governance in HEIs is undisputable. According to Fielden (2008) governments
acknowledges the major role played by the universities in promoting of economic development
and as result more emphasis has been put on the management of universities in effective way.
The growth in the number of public and private institution globally has continued to rise due to
the demand in the knowledge economy and their performance management is getting more
complex forcing many countries to move away from the control model of the University to the
supervisory model which involve monitoring and regulating the universities giving them some
level of autonomy to exercise their academic freedom. Some of the main governance issues in
higher education that are always of interest include who is responsible for the overall
management of the system, the power issue and what power is devolved to the institution, the
central agencies needed, the institution autonomy, institution accountability, required regulation
and reporting and finally how research is managed (Fielden, 2008).
Salmi (2011) identifies favorable University governance as one the characteristic of the world
class universities, this include have supportive regulatory frame work for the universities and
some level of autonomy or academic freedom. According to Altbach (2004) world class
universities have a significant level of self-governance where the University and it community
has control on a number of aspect including admission, degree awards criteria, curriculum,
75
professors appointment and the University academic future orientation. University governance
comprises of legislative frame work, institutions characteristics and how they relate to the whole
system, money allocation and accountability (OCED, 2003). Many countries have embarked on
reforming their universities governance and governance structure with an aim of improving their
performance, in China for instance every ministry had it own University or universities making it
very difficult to govern then.
Governance models in the universities have changed over time in an effort to respond to
challenges been experienced by the HEIs such as under-funding and the increase in student
population (MacGregor,2016). Vice Chancellors are faced with the challenge of offering quality
education under the current condition of growing students population and limited resources that
bring dissatisfaction among the students and staff and the need to make the University
competitive in the international arena (MacGregor,2016). Governance of Kenyan public
universities is guided by the University charter and statutes, the council which is the governing
body appointed by Cabinet Secretary, Ministry of Education Science and Technology, the board
plays an oversight role while the University Management Board overseeing the day to day
running of the University as stipulated in the University Act, 2012 (GoK, 2012).
The governance of higher education unlike in the other sector involves shared responsibility
among the different stake holders involved; in the Kenyan context this include the government,
the CUE, University Council, University Management Board and the senate and its committee.
All the university governing organ play different roles as guided by the Universities Act (CUE,
2014; GoK, 2012; University Act, 2012). The need for autonomy and academic freedom is one
of the governance issue experienced in HEIs, this arise due to Power and responsibilities issues
among the Council, University Management, faculty member, non academic staff, students,
policy makers and University stakeholders. Some of the strategies recommended by (Sifuna,
2013) to embrace good governance and overcome the challenges being experienced by HEIs
include; involvement of stakeholder in decision making be based on mutual benefit should be
embraced, partnership, devolution of power to the operational units including schools/faculties,
departments. As argued by Sifuna all position to be filled in the University should be

76
competitively recruited including the Deans, Directors and Chairmen of Departments HODs, and
other members of staffs and the remunerations based on competence and performance.
2.4.1.8 Leadership in Higher Education Institution (HEIs)
In an environment of high competition in HEIs and quest for excellence leadership is a
fundamental subject for their survival. Leadership concepts and definition may differ from one
person to the other and likewise from one situation to the other. As emphasized by Obiwuru et al.
(2011), Leadership is widely used in all aspect of human endeavour including religion, politics,
academics, business world, social networks and many other day today activities. The demand for
higher education has continued to rapidly globalize and the government entity recognize the
major role the higher education sector play, it is for this reason that the management of these
institutions is of great concern to the states (Fielden, 2008). Mahmood & Bakar (2014) observes
that, the traditional way of managing the universities has been challenged by the new movement
in the society and the emerging knowledge of economy. He further notes that, HEIs are under
pressure to remain competitive and sustaining their growth due to the emerging new technology
and reduced government funding, this will require them to face the challenges innovatively in
order to succeed.
Most of the employees in HEIs especially the faculty members have high academic
qualifications (Masters and above), this situation poses a question of whether the approach to
leadership in HEIs can be the same as in other organisations. McCormack et al.,(2013) noted that
there is a huge deference in management of a firm and management of academic institution, in
his opinion managing academic team is like “herding cats” implying they are difficult to manage
or it is unfeasible to control them. Dearlove (1995 ) observes that professionals prefer to manage
themselves hence disagreeing with the management legitimacy who may not have the reward
and punishment control over them, this calls for appropriate leadership to think through the
university future position. Dearlove (1995) further note that, the professionals are or they are
supposed to be fully engaged in teaching and research activities thus having limited time to think
through the future of the university. This however does not mean they will not continue
challenging those in leadership position and at times making them look like their followers.
77
Leadership in higher education can be assumed not to be the same as leadership in other business
corporate organization. A leader in HEIs is expected to play key role in management of the
quality of the academic programmes and the same time generate revenue yet income generating
has not been perceived as one of the core business of the university in the past. Cohen and
March’s (1974) refer to HEIs as ‘organised anarchies’ due to their complexity.
Higher education sectors worldwide are under pressure to change their way of operation, this is
driven by the demand to operate as business entities unlike in the past where they were governed
on collegiality basis. The stakeholders including the government, students, the business
community and local community have high expectation from the HEIs, to respond to this social,
economic and political concern by the society the HEIs must have leaders who are able to bring
transformation through adopting effective new method of governance (Wisniewski, 1999; Scott,
2003; Davies et al., 2007). Bryman (2007) notes that, other than the head of departments, other
leaders in the departments also plays a key role in influencing the performance of the institution.
According to Lord and Brown (2001), HEIs require leaders, who are ready to face change, create
an innovative environment and lead their constituencies to a successful future. Lord and Brown
(2001) also observed that, a number of dynamic challenges are facing the universities, this
include retaining the top faculty members, the change in technology, the public demand and
sourcing for alternate funds to support the running of the university.
Despite the observed challenges, the universities are expected to remain relevant and
continuously align themselves with the emerging trends and innovative development; to achieve
these they require leadership that is able to face the rapidly changing and increasing demanding
economy. Leadership in higher education unlike in the corporate sector is dominated by the
academician who may have little or no formal training on managerial or leadership styles despite
been expert in the academic arena, the fact that they are also from diverse academic discipline
make it more contrasting to the role they are entrusted with. Since the universities serve global
needs, their leaders are expected to demonstrate vast and diverse knowledge in leadership that
drive the university to remain relevant, accountable and responsive to emerging global trends.
Sifuna (2013) further observes that, the appointment of university leaders including the Vice
78
Chancellors, Deans, Directors, Chairmen of Department is often done on the strength of their
academic potential overlooking their leadership capability and despite the notable shortfall these
leaders do not get the requisite training in areas of management such as people management,
budgeting, strategic planning and development of human resources. The observations by Sifuna
are facts and these are some of the areas HEIs needs to focus on while calling for reform, good
leadership and governance have to be on the top of the list.
2.4.2 People Management and Performance Excellence
“People”, “labor”, “intellectual capital”, “human capital”, “human resources”, “talent” as
widely referred are resources employee possesses which are fundamental to the organization
success (Gabčanová, 2011). The employees are a critical success factor in each and every
organization, Draker (2000) express confidence that employees are one of the most valuable
capitals of any organization since their productivity is used to assess organization performance.
According to Daft et al, (2010) people in an organisation give the base for the organisation
competitive advantage. The human resource management play a key role in finding and
developing organisational people as human resources that influence the organisational success
(Daft et al, 2010). Human Resource Management (HRM) is described by Daft et al. (2010) as
the plans and application of formal systems including attracting and maintaining an effective
employees in an organisation for efficient and effective use of human talent to accomplish the
organisation goals. Mullins (2010) observes that the systems and procedures and organisation
have no meaning without people.
An organization achieves expected outcomes through paying key attention to people
management practices that support empowerment and involvement, process ownership
(autonomy), diversity of skills and specialization and feedback on performance to know their
strength, weaknesses and the areas they need to improve on (Eskildsen, Kristensen, & Juhl,
2000). The University should effectively plan, manage and improve people resources through
formulation of key human resource policies that are all inclusive in decision making, with proper
dialogue and feedback, policies that support competitive remunerations, rewards, recognition and
the welfare of the employees, this propel realization of staff full potential at personal level, as a

79
team and across the University (Sheffield Hallam University, 2003). According to Mullins
(2005), relationship behavior result from the extent to which the leader engage in a two-way
communication between the leader and the follower, providing feedback on their input, giving
them support and motivating them. Organizations cannot depend on individual leaders or a small
team of management; they need to harness the ideas, skills and energy of the employees for the
organizational success to thrive.
The employees are critical success factor in each and every organization; leadership should
establish sound policies and structure to ensure that the employees are well managed.
Universities recruit some of the highly qualified individuals and especially the scholars, this
implies they have some of the well knowledgeable individuals who require to be cautiously
managed to harness their capability and at the same time respect their academic freedom.
According to Bolden, Gosling, O'Brien, Peters, Ryan, Haslam & Winklemann (2012) leadership
in academic my need to focus more on “Colleagueship” to create a culture where the academic
are forward thinkers, empowered and have the energy to pursue their work. When relating with
people a leader should keep in mind the need to be servant to other; having the will to serve
rather than to be served or control, leadership is about helping people realize their full potential,
without exploiting them to make for self-gains. Jenkins (2012) observes that the difference
between leadership and control is one of the most misunderstood aspects of higher education
management, this has unfortunately left most of the University administrators controlling people
rather than leading them.
2.4.2.1 Motivation
Motivation of the employee influence their input in the organization, Kressler (2003) note that,
people have motives that are inspired by some conditions encouraging them to enhance
performance towards a particular activity. Mawoli & Babandako (2011) observe that motivation
is not permanent and must be sustained and continuously activated or aroused. He further notes
that the essence of motivation in an organization is to align the employees’ behavior with the
organization objectives. In this regard the employer is able to influence the employee in working
toward achieving the organizational goals. Research on academic motivation have being carried
80
out worldwide to establish if there is any relationship between the lectures input and motivation.
Past research have proofed motivation influences the performance of academic staff in the area
of research and in the effective teaching (Abdulsalam & Mawoli, 2012). Motivation is an internal
or external force that drives someone to be persistent in pursuing a certain goal (Daft, 1999).
Robbin (2005) also define motivation as the “process that account for an individual’s intensity
and persistence of effort towards attaining a goal”. While trying to understand motivation,
Graham & Weiner (1996) define motivation as the study of why people think and behave as they
do, he give an example of an observation in an education environment where some students will
be keen to finish their assignment while others may end up giving up without completing, he
attribute this kind of different behavior to the varying level of motivation behind each students
to excel in their academics.
Motivation is a major subject matter in management with support from various theories
including the Abraham Maslow’s (1943) Hierarchy of needs theory and Fredrick Herzberg’s
(1987) theories. Motivation is a critical factor for leadership performance and it has significant
effect on both the leaders and the followers’ performance. Daft (1999) acknowledge that
motivation of the employees has an impact on the organisational productivity, he advises that
leaders need to focus on motivating their followers to accomplish the desired organization’s
vision. Lack of motivation from either party end up influencing the whole team to perform
dismally, high employee motivation and high organizational performance and profit are
dependent on one another (Daft,1999; Muller & Tuner, 2010). The theory of transformational
leadership builds on motivational factors to increase commitment and productivity of the
employees. Daft (1999) recommend the use of motivational theories by leaders to achieve
employee satisfaction and consequently positively impact on their results. Similarly, Yukl (
2010) assert that, research carried out in the past shows substantial evidence of transformational
leadership theory been an effective model, it positively contribute to employee satisfaction,
motivation and performance.
Goleman (2001) argue that motivation is driven from our mind set through reminding our mind
the positive feeling associated with accomplishment of a certain task and also inhibit the negative
81
feeling that discourage the achievement. Motivation can be measured in different ways with
some researchers using what motivate people, other to the general moods and its impact on self-
motivation and other on the outcome. Motivation can either be in intrinsic or in extrinsic form.
People react differently to intrinsic and extrinsic motivators. Intrinsic motivation comes from the
impact ones get from the results and the autonomy they have to execute a certain task, they are
individual satisfaction that result from accomplishment of a certain task. On the other hand the
extrinsic motivation are external and are given by other person, this may include rewards such as
pay increment and promotion, recognitions, feedback from stakeholders, customer and peers
(Daft, 1999; Muller & Turner, 2010). According to McCormack et al.(2013) academic are seen
different from workers in other organization since they are expert in different area of
specialization and they have high intrinsic motivation to perform their duties, he however note
that even academics need management and good management results in improved performance
in research and student satisfaction. Further, he observes that incentives including attracting,
promoting, retaining talents are the most important element in performance management.
Laferla (2008) put more emphasis on the benefit of motivation; he observes that motivated
employee view work as a pleasure rather than a difficult and boring responsibility. Research
undertaken on academic motivation based on relationship between the lecturers input and
motivations have shown there exist some correlation between the lecturers motivation and their
performances in research and teaching (Abdulsalam & Mawoli 2012).One of the factors of
transformational leadership is inspirational motivation; effective leaders inspire their followers
through motivating them to be part of the organizational shared vision. The leader continuously
motivate followers through appealing to them emotionally or by use of the symbols to achieve
more than they would achieve at individual interest level (Northouse, 2010). Leaders should be
aware of the different types of motivation that influence on the individuals performance and
focus more on what favour his employee and his organization. Leader of excellent organization
take the responsibility of motivating their employees, giving them support and recognizing the
employees effort for the organization to realize the desired results (EFQM, 2013; Urgur &
Sumerli, 2013).
82
2.4.2.2 Concentration of Talents
Salmi (2011) while analysing 11 universities globally identified the ability to attract, recruit and
retain leading academics as one of the key success factor in building a top research University.
According to Salmi (2011) the East Asian universities such as Shanghai Jiao Tong University
(china) strategically distinguished themselves through recruiting highly qualified faculty
(Chinese or Korean academics) trained from the best universities in North America and or
Europe. The organization should recruit people who have the relevant skills and competencies to
deal with the customers (Sheffield Hallam University, 2003). High concentration of talents has
been the baseline for the Ivy league universities in the US, Cambridge and Oxford and other
upcoming world class universities such as the National University of Singapore (NUS). With
highly knowledgeable faculty members, the University will be able to deliver in terms of quality
teaching and undertaking world leading research. As observed by Salmi, the top universities do
not confine themselves from recruiting students and faculty from their mother country, they
recruit the best globally, this benefit them greatly by bring in new ideas and approach on board
as well as creating an international outlook. Some of the world leading universities such as
Harvard University, University of Oxford and Cambridge have foreign staff capacity of
approximately 30% , 36% and 33% respectively. Universities with competitive salaries and
opportunities for scholarship are able to lure top academic scholars from other countries and
equally attract the best students (Salmi & Albatch 2011). According to Hazelkron (2013),
Governments across the world are in search for talented students especially in science and
technology.
World top universities are also characterised by a low student to faculty ratio, MIT has a student
to faculty ratio of 8:1 which is computed using Full-time Equivalent (FTE) of students and FTE
of the teaching staff, the row ratio enhances close learning interactions and mentorship between
the students and the lecturer’s. The student-faculty ratio of other top World-Class Universities
include Princeton University (6:1) with Caltech having as low as 3:1 (Martinez, 2015). MIT has
over 1021 (56.4%) faculty members who are professors of various ranks distributed as shown in
table 2.3 (MIT Facts, 2015).
Table 2.3: Academic Staff Population
Academic Title Numbers
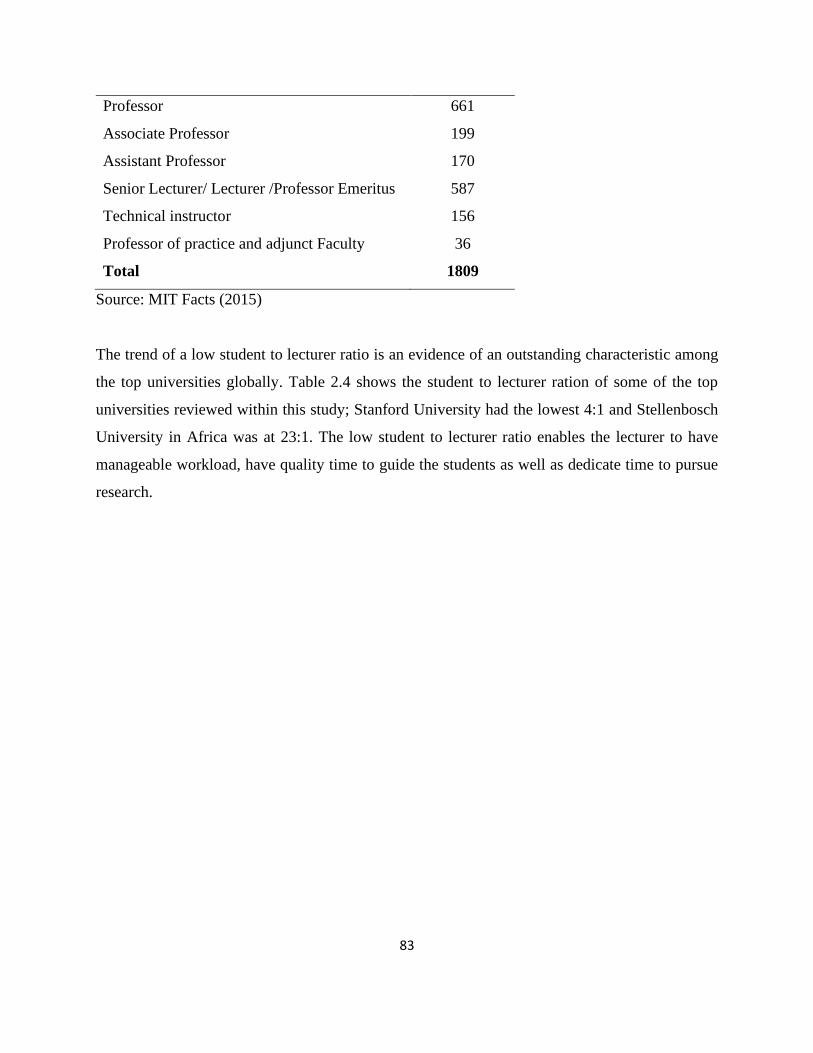
83
Professor 661
Associate Professor 199
Assistant Professor 170
Senior Lecturer/ Lecturer /Professor Emeritus 587
Technical instructor 156
Professor of practice and adjunct Faculty 36
Total 1809
Source: MIT Facts (2015)
The trend of a low student to lecturer ratio is an evidence of an outstanding characteristic among
the top universities globally. Table 2.4 shows the student to lecturer ration of some of the top
universities reviewed within this study; Stanford University had the lowest 4:1 and Stellenbosch
University in Africa was at 23:1. The low student to lecturer ratio enables the lecturer to have
manageable workload, have quality time to guide the students as well as dedicate time to pursue
research.
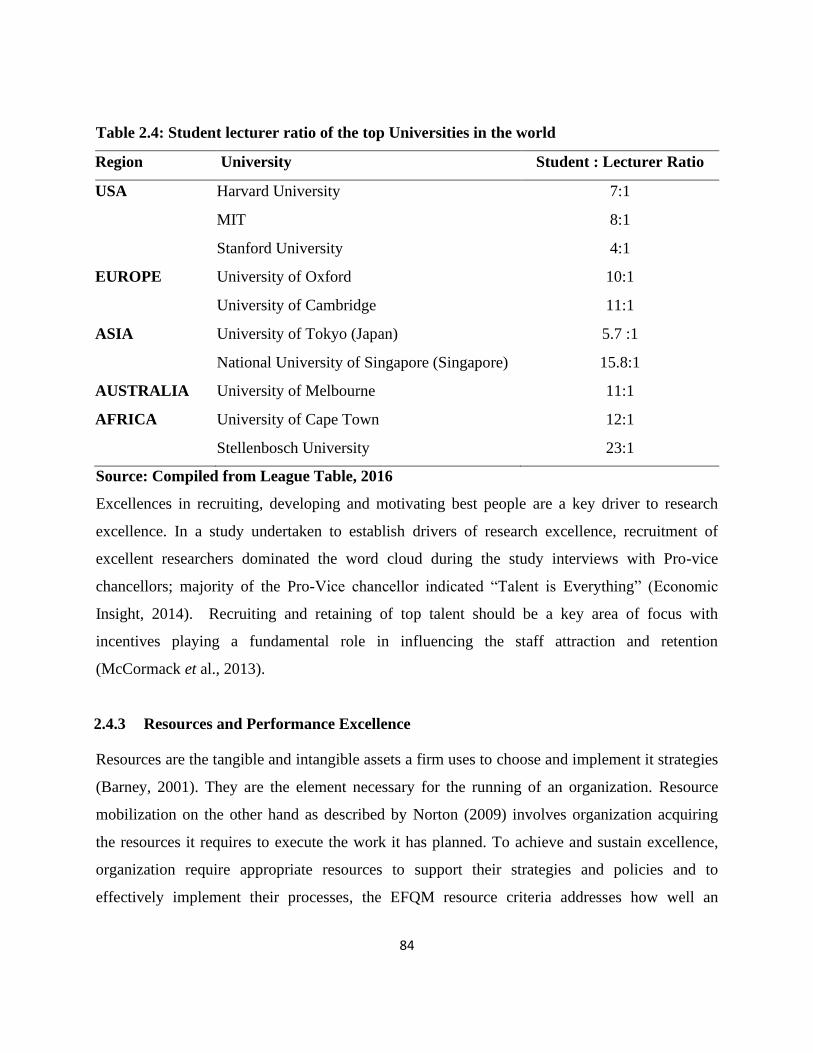
84
Table 2.4: Student lecturer ratio of the top Universities in the world
Region University Student : Lecturer Ratio
USA Harvard University 7:1
MIT 8:1
Stanford University 4:1
EUROPE University of Oxford 10:1
University of Cambridge 11:1
ASIA University of Tokyo (Japan) 5.7 :1
National University of Singapore (Singapore) 15.8:1
AUSTRALIA University of Melbourne 11:1
AFRICA University of Cape Town 12:1
Stellenbosch University 23:1
Source: Compiled from League Table, 2016
Excellences in recruiting, developing and motivating best people are a key driver to research
excellence. In a study undertaken to establish drivers of research excellence, recruitment of
excellent researchers dominated the word cloud during the study interviews with Pro-vice
chancellors; majority of the Pro-Vice chancellor indicated “Talent is Everything” (Economic
Insight, 2014). Recruiting and retaining of top talent should be a key area of focus with
incentives playing a fundamental role in influencing the staff attraction and retention
(McCormack et al., 2013).
2.4.3 Resources and Performance Excellence
Resources are the tangible and intangible assets a firm uses to choose and implement it strategies
(Barney, 2001). They are the element necessary for the running of an organization. Resource
mobilization on the other hand as described by Norton (2009) involves organization acquiring
the resources it requires to execute the work it has planned. To achieve and sustain excellence,
organization require appropriate resources to support their strategies and policies and to
effectively implement their processes, the EFQM resource criteria addresses how well an

85
organization manage it internal resources as well as the external partnership to support its
strategies and processes (EFQM, 2012; EFQM, 2013; Osseo-Asare & Longbottom, 2002).
2.4.3.1 Availability of Resources and Resources Management
An organization mobilizes resources so that they can carry out their vision and mission and for
the sustainability of the organization. Leadership is widely acknowledged through research that it
contribute significantly to the performance of the organization, however Nohria & Khurana
(2010) asserts that the availability of the resources affects the CEOs ability to execute his
mandate and impact on performance. He observes that, CEOs require appropriate resources to
pursue the desired results whenever opportunities arise, besides acquiring the relevant resources
the organization has also to ensure the resources are prudently managed (EFQM, 2013). One
aspect of management for a leader is ensuring resources are prudently managed. Resources
include the organizations assets, equipments, labour which comprise of the employees and
finances. Not only are resources key to the running of the organization but resource management
is key success factor of an organization. Resources Management is the efficient and effective
deployment of an organisation’s resources when they are needed, resources may include
financial, inventory, human skills, production resources or Information technology (IT) ( People,
2008). The leader should plan ahead and do close monitoring and evaluations to keep track of the
progress in line with the action plans. Resources management includes the management of the
employees in manner that yield results for the organization. Dulewicz and Higgs (2005) describe
it as planning ahead, organizing all the resources and effectively and efficiently coordinating
them, this will result in achieving the expected outputs and minimises unproductive effort.
Resources allocation including employees, Money and equipment should be guided by the
organisation goals (Daft et al, 2010). Prudent resource management will involve identifying the
resources that you require
The increase in the number of the universities globally has resulted to dwindling share of funding
from the states government; this has triggered universities to develop diverse strategies for
resource mobilization to be able to meet their goals. Norton & Herbst (2013) observe that, the
86
concept of ‘Big Society ‘envisages that provision by the state will go down and communities will
have to look for other means of solving their needs. Similarly Mitchell & Leachman (2015), note
that the gap between the state funding and the cost of education in HEIs is ever widening forcing
many institutions to take austerity measures to close this gap. Some of the measures being
undertaken by institution as identified by Mitchell & Leachman (2015) to cut cost include;
cutting down on employment, closing campuses, reducing number of courses being offered,
closing labs and limiting offering service such as library. These measures are viewed to have a
negative repercussion to the output including the quality of education due to the limitation of
input (financial resources) as identified in the system theory. The resources available to
individual Universities are continuously becoming scarce as the numbers of Universities grow; to
manage these situation universities like any other organization must optimize the available scarce
resources together with their suppliers who are part of huge cost in their expenditure (Osseo–
Asare, Longbottom & Murphy, 2005). NUS is an example of a university which has rose to
excellence due to its strong Government support with provision of adequate resources as flagship
university (Mukherjee & Wong, 2011).
Salmi (2009) identifies abundant resource as one of characteristics of leading top WCUs, he
notes that running a research-intensive University is a huge cost investment and it is only with
stable financing such a vision can be realized. Abundant resources enable the university to create
a virtuous circle where by the University is able to attract and retain highly talented scholars and
researchers through offering competitive remunerations and good working environment (Salmi,
2009). Adequate financial resources enable the university to offer scholarship to students and
attract the best in the world. Having the best faculty members and researchers and recruiting top
student directly impact on the quality of the graduate the institution produce raising the
institution profile and reputation. The level of funding put the university at strategic position
against their competitors (Salmi, 2011).
Other than the government funding, Salmi (2009) identifies two areas that top US universities
have focused on to have and sustain a sound financial base including; investment on endowments
fund and the success of faculty member in competing for research funding from the government.
87
He observes that, out of the total research fund in the US top research institutions more than two-
thirds of the fund is funded through the public source. The huge Endowment funds give the US
universities some level of autonomy compared to the other countries. Financial stability in HEIs
can be realized through having sound financial base, creation of an Endowment fund and
university having diversified source of income. The trends in the universities to raise more fund
geared towards achieving financial stability has been establishment of the University
Foundations with an aim of undertaking fundraising to seek for more financial resource, this
practice is also noted to be a strong indicator of university internationalization (University of
Macau (UM), 2016). In the US a great percentage of their budget comes from fundraising and
investment rather than from state or tuitions (Karpova, 2006; Kyule et al.,2013). MacGregor
(2016) identifies fundraising through business ventures, fees from marketable programmes,
consultancies and partnership as some other strategies being deployed to address the financial
challenges facing HEIs. Salmi (2009) identify other areas that excellent universities have
diversified source of income generation through use of other strategic resource mobilization
strategies such as Alumni, donations, charities, philanthropy, foundations, research grant or
having an entrepreneurial orientation, this make them to have a sound financial base that with
good leadership and management make the University move up the ranking ladder.
2.4.3.2 Endowment Fund
According to an analysis by Sutton Trust (2014), US top universities have endowments funds in
billion pounds with Harvard and Yale in the lead, the UK University’s endowment apart from
Cambridge University and Oxford University has not recorded significance growth. Cambridge
and Oxford are the only two universities in the UK who would feature in the US top 20 in terms
of the size of the Endowment fund. Endowment fund is “a form of charitable trust that is
retained for the benefit of the institution”. Endowment fund protect the University from any
short-term economic pressure, the fund is invested to increase it value and create another source
of income for the University (Sutton Trust, 2014). According to Sutton Trust, the main
difference between the UK and US higher education is the huge amount of endowment funds
possessed by American Universities giving them great financial stability even during the difficult
88
economic times. This gap has existed for more than ten years with a University like Harvard
having more endowment fund than that of all the UK universities combined.
Harvard University is success story of fundraising; it had the highest endowment fund among the
US based universities valued at $37.6billion as of January 2016 (Lobosco, 2016). President Neil
L. Rudenstine (1991-2001) led the first Harvard University-Wide fundraising campaign and the
largest then fundraising campaign in higher education history, he targeted the alumni and friends
and raised $2.6 billion surpassing his target of $2.1 billion, this was raised from more than
170,000 friends of the University and the alumni. The campaign became a legendary due to it
magnitude and success (Rudenstine, 2001). President Neil L. Rudenstine initiative made Harvard
University to make a momentous step towards what it is today, it enabled it to attract, and recruit
some of the best renowned scholar in the world, increasing its infrastructure and acquiring
cutting-edge teaching and research facilitates. Through the Endowment funds, Harvard
University is able to increase student financial aid; allowing them to sponsor and recruit the best
students across all economic spectrum regardless of their financial background, which has a
direct impact on the quality of the graduate they produce (Rudenstine, 2001).
Harvard President, Drew Faust also launched Harvard campaign in September, 2013 named “The
Harvard Campaign” during an alumni meeting with a theme of sustaining Harvard’s commitment
to leadership under the unsettled HEIs environment and rapidly changing world. The campaign
has since then had huge impact on Harvard community, including the teaching and learning and
infrastructural development (Harvard Campaign on Track, 2014). This fundraising initiative
remains Harvard University key campaign with more than 100,000 donors supporting it (Harvard
campaign has early impact, 2015). In year ending June 30, 2015, Harvard endowment distributed
a third of the University total operating revenue about $1.6 billion (Endowment, n.d). Stanford
University has also been successful in it fundraising campaign through Stanford+Connect
strategy aimed at reaching all the alumni, it endowment fund stood at $22.2 billion as at August,
2015 (Stanford Facts, 2016). MIT has also similar campaign referred as “MIT Campaign for a
Better World” (Smith, 2016). In Europe Oxford University launched “Oxford thinking
campaign” to raise fund to attract world top academic. Similar initiatives have also being on-
89
going at University of Cambridge through campaign referred as “Dear World…yours,
Cambridge” (University of Cambridge, 2016).
Other successful case of fundraising in Africa is the HOPE project of Stellenbosch University,
South Africa (Botman, 2011). The funding challenges in Africa was one item discussed, during
Association of African Universities (AAU), hosted by Stellenbosch in June 2011, where the
leaders discussed the challenges facing higher education, it was observed that the money issue is
one of the main obstacle facing African institutions. To overcome these challenges many of the
leading universities have taken up fundraising as part of their Universities strategic plan. This
has been made successful through establishment of endowment funds and development of
competitive fundraising strategies to diversify the source of revenue, most of this strategies target
raising money from the Alumni, friends of the Universities, gift and donations, Philanthropist,
foundations, scholarship and research grants and contracts (Botman, 2011).
THE World University Ranking indicates US based universities dominating in the top 100,
similar trend are observed in the Shanghai Jiao Tong University Ranking (ARWU) 2014-2015
with US dominating in the top 100, 51 US based universities appeared on the top 100 compared
to 9 universities from the UK, China continued to closely advance with 32 of it universities in the
top 500 (Bothwell, July 9, 2015), the rise in Chinese universities is a clear indication of it
continued expansion of the economy, which is attributed to their financial stability. Similar case
is replicated in Africa where the South African based University lead in Africa. Phil Baty, the
editor of the THE World University Ranking shared the same sentiment during the Africa
Universities Summit held in the University of Johannesburg, between 30th and 31st July 2015, he
observed that in 2014/2015 ranking, out of the top 30 universities in Africa twelve of the
Universities were from South Africa. Baty further observes that though the western Universities
dominate in the lead in THE World ranking, the trend is slowly shifting to Asian based
institutions which have been on the rise, two of the top University that have been rising up fast
are the University of Tokyo and the National University of Singapore, the rise in Chinese
universities is a clear indication of it continued expansion of the economy (Bothwell, July 9,
2015).

90
The decline in the ranking of Western Universities as analyzed by Baty is attributed to the
declining status of state funding, this sentiment is also shared by director of the Centre for
International Higher Education at Boston College, Dr. Philip Altbach who also noted that
funding to the American Public Universities has a major effect to their competiveness (Parr,
2015). This trend has given an indicator of funding issue that is affecting the HEIs with the better
funded Universities ranking better due to their ability to recruit and retain higher calibre scholars
by offering better terms and incentives, which consequently positively influence their output.
The poor ranking of African Universities is a disquiet that has attracted African countries
leaders’ attention.
2.4.3.3 University Donors
HEIs need to identify their potential donors and commit to continuously engage with them in
their developments agenda. Alumni have been identified as some of the prospective donors and
the universities needs to link the alumni office and the advancement office to maximize the
potential of the alumni as potential donors to their institution otherwise they will be philanthropy
and donor for other institutions. The relationship with donor should take into account some level
of mutual benefit a process referred to as ‘donor cultivating cycle’ which entails identifying your
potential donors, cultivating the relationship, soliciting for the support and finally stewardship
through acknowledging, recognizing and also building a continued relationship through giving
feedback on the impact of their contribution (Universities UK, 2014). Jarrel (2013) also note that
donors can also choose a project to fund and get motivated when the project succeeds to share
the success story with their friends. Some of the potential donors identified include the individual
donors consisting of the alumni, philanthropy others are foundations and corporations, the
individual donors are such as alumni are viewed as some of the universities best donors
(Karpova, 2006; European Communities, 2008; Universities UK, 2014). MIT has received huge
donations through the support of well-wishers and alumnus in form of gifts such as the Simon
centre for the social brain was a gift from Simon’s foundations worth $ 26.5 million and Abdul
Latif Jameel World Water and food Security Lab (J-WAFS) meant for research to help combate
world’s food and water supply scarcity for the 21st century established in May, 2014 in MIT was

91
a gift from Mohammed Abdul Latif Jameel’78 who is an alumnus of the MIT (MIT News
Office, 2014 ; Murry, 2013).
UCT values gift and donation from alumni and friends of the University as one of the means of
raising funds to bridge the critical short fall being experienced in the public funding. UCT has
achieved this through setting up of international offices, this include; University of Cape Town,
Regional Office: Canada, UCT Australia Trust, UCT Trust (UK) and UCT and UCT Fund inc
(USA). The International offices is engaged in seeking donors in the U.S. to support funding of
the UCT through providing scholarship to the students, support to UCT programs, support to
specific research projects (University of Cape Town, 2016).
2.4.3.4 Alumni Relation
Alumni may have different meaning depending on different Institution, in some it may only refer
to the graduate of a particular institution while to others it may bring on board other members
associated to the University including retired staff (Case.org, 2015b). Case.org (2015b) observes
that, universities are actively engaging with the alumni associations unlike in the past where
Alumni association almost operated independently and had no active relation with their mother
institution. According to Case.org, the alumni form a better ground for fundraising to various
reasons including; alumni are some of the most loyal supporters of their institution, they are
fundraising prospect and they are very valuable in marketing the institution through their social
networks and in their professional networks. Other key benefit of engaging alumni identified by
Case.org are, Universities can benefit from the alumni skills and experience even after they have
left the institution, they act as role model to other students and can give career guidance based
on real life experience, Alumni also act as University international ambassadors since they carry
with them their institution wherever they are including their social and professional network.
The universities should take advantage of the young alumni and tap into them as potential donors
and also understanding the interest of the young unexploited alumni in donating (Jarrell, 2013).
Jarrell also recommends use of more modern mechanism of donations such as crowd funding to
92
tap into a bigger pool of donors. To engage alumni and have effective communication, the
University has to adopt modern communication technologies such as social media taking into
account this is the platform being used by majority of the youths, the youth are no longer
beneficiary of newsletters and press release from their universities since they are on realtime
engaged to face book, twitter, google, Linkedln and other available social media platform (Doak,
2011). Doak argue that, social medial tools are simply means of communication and the
objective of communication is the institution managing to legitimately engage with the people it
value as important to the institution, he further notes HEIs can smartly invest through building
social network via the social media. Universities are moving fast in responding to change in
method of communicating to their alumni and specifically the younger generation, MIT has
initiated a web portal designated specifically for alumni dubbed “Infinite connection”, as one the
branding initiative to serve it alumni. Virtual tour that include audio, video and graphics, online
campus tours that give a personal University experience (MIT University Business, 2008).
The culture of giving is well established in the US based universities than to their British counter
part with 11% of the US alumni giving to their University compared with only 1% of the alumni
who give back to their universities in the UK (Sutton Trust, 2014). Increasing awareness and
creating a culture of giving has to be continuously advocated for since the fundraising is now
well known globally. Case.org, advocate for maintaining a positive relationship with alumni
which translate to positive reputation of the institution, active communication will keep them
well updated with the current information of the organization. Good relationship between the
alumni and the institution is of mutual benefit, when the institution reputation thrive, the alumni
benefit from the good reputation which enhances the value of their degree. Cultivating a positive
working relationship with alumni will enable respective institutions to use them as prospective
agent for fundraising since they would want to see their University succeed (Case.Org, 2015b).
Megan Bruns, Head of Alumni and Supporter Relations, King’s College London assert that “You
can do Alumni relations without Fundraising but you can’t do fundraising without alumni
relations”. (Universities UK, 2014).
93
2.4.3.5 Philanthropies and Friends of the University
European communities (2008), Identifies Philanthropy or ‘giving’ as one of potential source of
University funding, according to the report Philanthropy is well developed concept in US than
elsewhere. Due to the shrinking Government funding and recognition that excellence demands
the universities to diversify their income generation, the universities are re-discovering the
importance of philanthropy, like wise philanthropists are also realizing they have high impact in
the University research. Christopher Snowden, Vice-Chancellor, University of Surrey and
President observes that, fundraising concept has continued to expand as the universities discover
the role Philanthropy can play and the benefit it bring to students and to the entire University as
the engagement between the University and the donor increase (Universities UK, 2014).
According to Breeze (2013), corporate philanthropy has been identified as one of the untapped
philanthropic potential in the UK and equal effort is being made to tap from them as it is from
individuals, donors trust and foundations. Corporations have are also used as major donors to the
universities either directly or through supporting targeted activities that they wish to be
associated with. This involves establishing relationship with these corporations with an aim of
partnering for mutual benefit. Just like other donor engaging corporate require patient and clear
identification of the objective of the funds as well as matching your needs and that of the donor.
Corporate philanthropy is often by business case where the company will be looking forward to
increasingly selling their brands and increasing their reputation (Breeze, 2013).
Involving business community in University affairs either through inviting them as motivational
speakers is one where corporate can be engaged to be future potential donors. They can also
sponsor event in the campus and the same time get opportunities to market their products. Some
of the manager of the corporate could be members of alumni which give them a strong will to
support their Alma mater. The University should also strive to engage it academic staff in
writing fundable proposals that can attract funding for research, equipment’s and scholarship to
students. Successful fundraising is largely driven by top management involvement and
commitment, leveraging on the Universities unique areas, mission and its history. The university
need to also actively engage with the donors and be consistence since establishment of an
endowment fund takes time as it has been case with Elite universities such as University of
94
Cambridge and Oxford University who established their advancement office as early late 1980 to
mid 90s (Universities UK, 2014)
An African success story is the Stellenbosch University based in South Africa through the Hope
project, Stellenbosch University has managed to re-write the academic funding rule through
fundraising, and it is expected that other African Universities will follow the same (Botman,
2011; Nordling, 2012; Makoni, 2012). To be able to achieve their target, Stellenbosch used
United States models where many top universities relay heavily on fundraising through
philanthropic (Botman, 2011). The success story of the Stellenbosch University in fundraising is
also shared by Nordling who refer to it as a model for other African Universities (Nordling,
2012). According to Botman, former Rector and Vice Chancellor of Stellenbosch University
(2007-2014), the big percentage of the donation was from private donors. Stellenbosch
fundraising campaign was conceived out of necessity when Government funding continued to
dwindle out. The late Prof. Russel Botman former Rector and Vice Chancellor of Stellenbosch
University, argue that philanthropic funding is a potential untapped source of funding for the
universities, he views the private sector and philanthropic funding as one effective mode of
mobilizing resource to sustain high performance within HEIs (Makoni, 2012)
Kenyan universities have since 1990s endeavoured to address the funding challenges, the
initiative then was through introduction of module two students or the self-sponsored student
commonly refered as parallel in a bid to raise extra money for daily operations. The wanting
status of the Universities then was characterized by low morale of the teaching staff, dilapidated
facilities, inadequate teaching facilities such poorly equipped library and laboratory. According
to Prof. Okoth, a lecturer in the department of Linguistics and Languages at the University of
Nairobi the move to introduce the parallel programme which was initiated by the UON has since
revolutionized the HEIs in Kenya, with the UON story inspiring more other universities to
emulate the same to complement the shrinking Government capitation. With the growth in the
number of Universities in Kenya, there has been stiff competition for the module 2 students as
the University find them an easier method of income generation to bridge the underfunding by
the government (Okoth, 2016). Kilonzo (2011) observes that the funding from the Government

95
to the Kenyan universities is not adequate to support their teaching and research agenda. He
further notes that, the universities have being engaging in other means such as establishing
satellite campuses to elicit finances to bridge the gaps.
Researcher who have undertaken similar study have pointed the financial challenges as one of
the challenges facing Kenyan Universities (Mwiria et al., 2007; Kyule, Kangu, Wambua,
Mutinda, & Kamau 2014). The competition has however reduced market share leading to a
number of the universities in financial crisis. This has consequently being affecting the quality
due to the limited resources incapacitating the universities operations. To overcome this and
attain financial stability which is evidently critical for sustaining performance excellence,
universities in Kenya need to re-think and develop more creative and innovative fundraising
strategies. A lot can be borrowed from world class universities majority of which have for a long
time heavily relied on the fundraising, research grants, donations and scholarships.
2.4.3.6 Use of Technology
Information communication technology (ICT) is defined by Kundishora (2014) as technologies
used for collecting, editing and communicating information in various form. According to
Kundishora (2014), ICTs contribute immensely to the countries GDP, resulting in improved
market competitiveness of the countries product and services. He further observes that many
countries in Africa are integrating ICT in early stages of their education system. Similar
observation is made by Kramer, Jenkins & Katz (2007), they observe that, the role of ICT sectors
in economic expansion has come to appreciation in the past 20 years. The adoption and use of
ICT will lead to increase in quality production of goods and services (Kundishora, 2014). This
demonstrates the recognition of the critical role played by the technology at individual level,
business level and at government level (Benat et al., 2014).Technology is changing very fast,
posing a challenge to many organizations as they strive to align to the emerging technology to
remain relevant and competitiveness. Singapore is identified among the top in Asian Tigers
countries that are highly advanced in used of technology with the best innovation environment, it
is one of most knowledge –intensive economies and an ICT generation powerhouse (The global
Information technology Report, 2014). According to Kramer et al. (2007) the ICT sector includes

96
software, hardware, internet connectivity, telephony, content, application and support serves, he
observes ICT been a powerful driver in addressing the interest and needs of the developing
countries and it usage in has continued to grow. Some of the benefit offered by information and
communication technologies include, cost reduction thus improving productivity, efficiency,
transparency and accuracy, cheaper and faster mode of communications and transacting business
and access to knowledge and information (Kramer et al. 2007).
As Universities seek to increase access of education to their customers, Grave (2005) observes
that technology remains a necessary expense to HEIs, with technology they are able to improve
on customer service as well as reduce on cost by reducing lecturer contact hours. Adoption and
rapidly responding to change will help the universities in transforming student experience
through embracing new technologies in delivery of lectures, this consequently lead to equitable
outcome of student and enhance on quality (Child et al., 2011). According to Cheing and Huang
(2005) despite the limited resources universities are still investing in ICT to support teaching,
research and management as a way of cost cutting. The ICT that critical to HEIs include the
internet, the learning and teaching, and management system. Top universities in the world are in
the forefront when it comes to the adoption and use of technology, Harvard University was the
first University to adopt MOOCs. Vogel (2012) while arguing how MIT became the most
important University in the world notes that, Between 2000 and 2006, MIT graduates started
more than 5800 companies, a number that continue to grow since then. One of the selling point
of the MIT is it expertise at transformation students idea into successful businesses. Bill Clinton
once described MIT as having the best technology transfer program in the world. This describes
MIT as HUB for innovation which makes it known world over (Denham, 2015).
In one of MIT gala dinner comprising of sixteen international teams, Its Chancellor Grimson,
acknowledged that the world has gone to Greater Boston to learn about practice of innovation
from MIT which is regarded as key hub for innovation. One of the reasons why the world goes to
Greater Boston is the influence of the MIT as key actor of emerging practice of Innovation
Diplomacy (Murray & Budden, 2014). They reiterate that, MIT is a world class of innovation
hub and global hub for science of innovation and open teaching. This demonstrates the huge
97
impact the MIT has to the society and the economy of the country through giving a chance to its
students to be innovative and entrepreneurial.
Stanford StartX is an incubation set up that offers financial support to students for their accepted
start-ups ideas, with some of it alumni behind some of the best companies in the Silicon Valley
(Thompson, 2013). Stanford has consistently been known as the best innovative University in the
world under the Reuters Top 100 which is attributed to its number of patents that is an indicator
of commitment to commercialization and papers that have huge impact in academic world and
private industry. Stanford alumni are founders of some of the world great companies such as
Hewlett Packard and Google. A study undertaken by the University in 2012 estimated that
Stanford entrepreneurs companies generate $2.7 trillion in annual revenue an equivalent of 10th
largest economy in the world (Ewalt, 2016). Stanford has also been a leader in use and adoption
of technology in teaching and research including the MOOCs in 2013-2014, Stanford received
licenses for more than 655 technologies. In year 2005, it was the first University to launch
iTunes U public site, in year 2013 Stanford engineers build computer using carbon nanotubes
(Stanford University, 2015).
The Government of Kenya as noted by Kashorda & Waema (2013) has improved regulatory
environment to promote the growth of ICT, the government supported the universities through
fiber infrastructure for internet connectivity. According to Kashorda & Waema (2013) even
though the Kenya university community is ready to use ICT for teaching, learning, research and
management and the leadership in the university recognise the critical role played by the ICT to
achieve their goals the level of e-readiness is still low. According to KENET (2008) e-readiness
report on HEIS, Kenya are ready to use ICT for learning, the report also concluded that HEIs in
institutional leaders have not recognised ICT as a strategic priority for transformation of
teaching, learning and research, this was based on the low budget allocated to ICT expenditure,
making them fail to invest in ICT infrastructure. According to the report most of the universities
had not automated their systems and processes including the library. It was also noted that ICT
lacked champions, the ICT strategies have also not been fully implemented and the ICT
strategies were not aligned with the institutional strategies. The access to ICT has a significance
98
influence on student behavioural intention to use (Macharia & Pelser, 2014). To enhance service
delivery, universities need to fully implement ICT strategies in teaching, research and
management, this include the implementation of e-learning platforms, student management
systems and financial management. This will increase the level of efficiency as well as reduce
running costs and consequently enhance university performance.
2.4.4 Partnership and Collaboration and Performance Excellence
Partnership in education development have been described as “mutually beneficial relationships
between two or more institutions, including businesses, industries, universities, non-
governmental organisations (NGOs), school systems and service organisations” (Alpert, 2009).
An effective education partnership is described by Wanni, Hinz & Day (2010) as a dynamic
collaborative process that brings mutual benefit though not necessary equal to the parties
involved in partnership. He further notes that, in an effective partnership the ownership of the
project and their relationship is based on respect, transparency and reciprocity. The parties
understand each other culture and working environment and jointly make decision. Each party
contribute to the partnership and they also have their expectations. Successful partnership also
tends to change and evolve over time. Effective partnership in HEIs are characterised by
improved curricula, increased research publication and the number of research projects (British
Council, 2015).
Incorporation of university-industrial relation collaborations and partnerships into the university
academic programmes is one way through which the universities are responding to change to
maintain a competitive advantage. Tumuti wanderi & Lang’at-Thoruwa (2013) observes that
university collaborations and industrial relation are rapidly becoming a common practise world
over making the Partnership and collaborations part of universities agenda. Partnership is an
important aspect of benchmarking; through partnership organization are able to share their
experiences and improve on their weak areas. The benefit of collaboration cannot be over
emphasized as described once by Alice Gast, president of Imperial College London, she
compared partnership with biology where cross-breeding makes plants more harder, and she
argues that when a person is taken through a different education systems and exposed to different
99
culture he is able to approach life challenges differently. International perspective broaden and
expand once thinking, Alice Gast states “ The future holds great challenges but universities will
meet them by joining forces” (Baty 2014). Bothwell (July 9, 2015) observes that expansion of
research is dependent on the free movement of ideas and people, partnership and collaboration is
one of the platform through which institutions exchange their experience and ideas, Bothwell
(July 9, 2015) attributes the decline in research position for Japan and Russia largely to their
closed stance. Collaboration of the Universities with industries empowers them to become more
competitive globally in the academia, this initiatives also provide an opportunity and more
diversified source of revenue generation as well as enhancing the University ability to meet the
society demand for offering quality and relevant teaching that is enshrined in their curriculum.
A study undertaken in UK and US to determine the areas of interaction of companies and
Universities revealed that UK and US based universities are able to interact with Universities at
various areas including; informal contacts, students recruitments, conferences, publications,
testing and standards, consultation by University staff, joint research, project development,
licensing of University held patents, and internships. According to Perkmann & Salter (2012),
companies are increasingly recognizing that for them to have successful innovation they need to
work with universities due to their diverse source of skills and talents, he further note that the use
of University owned Intellectual property has promoted more innovation in the business
environment. The University on the other hand plays a key role in society through knowledge
transfer, by endeavouring to fulfil this mandate successfully Universities and Industries need to
mutually partner and collaborate with industries and community to extend this knowledge and
skills while the companies take up the role of commercialization.
While undertaking a study on University–Industry Partnership for MIT, Tokyo and Cambridge,
Hatakenaka (2015) observed that the Universities which are widely networked are able to learn
the real problems facing the industries and offer solutions based on experience. These networks
enhance relevance in teaching since the Universities are able to teach based on up–to- date
information and the future of the industry Their interaction with industries expose them to the
current needs of the industries and they train based on such information equipping their
100
graduates with immediate solution of the emerging challenges, such graduate are in high demand
by the industries due to their level of exposure making them comfortably fit in the job market.
Networking plays a fundamental role in research agenda, by noting that it gives the University a
chance to conduct research that will have an immediate application of their discoveries, this is
referred by literature of science as “Pasteur’s Quadrant” in this regard scholars undertake
research and at the same time pursue its applications. Analysis of MIT, Cambridge and Tokyo,
revealed that all the three Universities are well networked but differed in terms the level of
activities, how easily individual academic would partner with industries and have active
relationships depend on University policy on partnership affairs (Hatakenaka (2015). MIT has
more than 700 companies working with academic departments and students, some of these
companies include; Boeing, BMW, Ford, BP, Samsung, Siemens, Shell, Novartis and many
other globally leading companies with 19% of the MIT research funding coming from the
industries ranking first in Industry-financed research and development (MIT Facts, 2015).
similar initiative are observed with University of Tokyo, According to Taylor (2014) the
University has been keen on the globalization and partnership initiatives as key driver of their
success.
One of the critical success factors in handling any challenges facing the current dynamic world is
through partnership; an effort by the India’s Human Resource Ministry to attract top 30
universities globally to start campuses in their country received an expected approach with
majority preferring collaboration than the physical presence. In his response Prof. Leszek
Borysiewicz, Vice-Chancellor of Cambridge University, noted that, though the initiative is an
interesting development that demonstrate the emerging trend towards transnational education the
varsity prefers collaboration over competition. This same sentiment was shared by the MIT
(Sebastian & Khan, 2013). The success of collaboration is affected by the relationship depth;
agreeing on a shared common strategies and aspiration; the committed governance structure from
both parties and the deployment of best talents. Through collaboration the both institution are
able to create hybrid programmes that incorporate the best of each of the institution.
101
One of successful collaboration as observed by Sebastian & Khan (2013) is the joint research
Academy in Mumbai in India of Australia’s Monash University (Monash) and Indian Institute of
Technology Bombay, IITB, the collaboration model aim at sharing talent to address challenges
that are experienced by the two universities. It uniquely focuses on a number of areas including
postgraduate training with a goal of creating a high impact global citizen. Through the
collaboration it is able to use best researchers from both institutions to address some particular
thematic areas, one of the major area is PhD training where student are enrolled and jointly
supervised graduating with a joint degree. University and Industry collaboration should cover the
full spectrum of interaction between the industry and the Universities and not focus on patents
and IP related collaborations (Odhiambo, 2011).
Higher education in Africa rank low as partner for cooperation implying they are not regarded as
viable partners for internal education alliances (Knight, 2008). Creso (2013) however note that
university-industry partnerships are becoming increasing recognised as critical for development
in Africa. The funding and governance issue in Africa has constrained research which then
limits the industry partnership in Africa (Creso, 2013). A study by Tumuti, Wanderi & Lang’at-
Thoruwa (2013) on partnership between Kenyatta University and Equity Bank reveal that the
partnership has been of great benefit to the two parties through reaching the community and
transforming life of many people. The study showed that the bank is able to benefit in selling
their product and on the other hand the students get first hand experiences and are prepared to
handle the challenges. According to Tumuti, Wanderi & Lang’at-Thoruwa (2013), bridging the
space between the academia and the industry through collaborations will help in improving the
standard of living in the society as well as contributing to the national development goals. The
creation, dissemination and exploitation of new knowledge is critical for economic, political and
social development for developing knowledge-based economy like Kenya, partnership play this
critical role. Through partnership the student are kept abreast with the emerging trends in the
market and the industries raising the quality of training in the universities. They acquire hands on
skills and experience which are important once they get to the job market. To attain a middle-
level income economy as envisioned in Vision 2030, university- industrial relation must work
together in developing an innovative human capacity required in a knowledge based economy.

102
2.4.5 Internationalization and Performance Excellence
According to Harari (1992) Internationalisation is the processes through which higher education
become less national and more international oriented. Altbach (2002) describe
internationalization as “specific policies and initiatives of countries and individual academic
institutions or systems to deal with global trends”. Internationalisation has substantially evolved
over time and has become a mainstream agenda in many organisations, until recently
internationalisation was largely reviewed as an American based (Magwa, 2015). The
internationalization of education is usually perceived to have a positive impact to the economic
growth (Magwa, 2015). Mclellan (2008) argue that, HEIs are making use of internationalization
to respond to globalization challenges. Mclellan (2008) points a number of reasons why HEIs
pursue internationalization for various reason including; the international nature of knowledge,
create relation with countries that are strategically placed, association of quality as viewed by
international standard of quality and also the need to prepare student and staff. In an effort to
address global challenges that are similar in HEIs, Internationalization policies, strategies and
practices have been of key focus to enhance competition. Excellent universities have an
international outlook, they are able to recruit excellent staff and highly talented students from
different part of the world. This brings on board diverse cultural background which enrich the
students and staff experience within the University through culture of intellectual empowerment
(Mclellan, 2008).
Horta (2009) while undertaking study on internationalization of the European universities
observed that internationalization agenda in HEIs has gained a lot of relevance and recognition in
the last decade of twentieth century, by both researchers and policy makers. He further urgues
that, internationalization has gained more relevance due to the increasing completion at global
level with the global rankings also building more pressure for the leaders of the University to
compete and collaborate internationally, this has consequently put internationalization of higher
education and higher education institutions as key priority in universities strategic agendas.
Internationalisation of higher education system is one of the strategic approach adopted by
developed European countries as well as emerging Asia and Eastern Europe to meet the

103
challenges of 21st century and to be more competitive globally (Barragan Codina & Leal Lopez,
2013). Barragan Codina & Leal Lopez (2013) observes that it is not enough to have a high
quality education but it important to have education that is relevant to the times, giving students’
opportunity to compete and succeed in the global market.
There are various benefit associated with internationalisation of higher education including
improving the student preparedness for the job market, the internationalisation of the curriculum
by making it recognised internationally, raising the institutional profile globally, strengthen the
quality of research output and creating diversity in student and staff population (Marmolejo,
2012). Similarly, Barragan Codina & Leal Lopez (2013) observes that internationalisation result
to better prepared and trained students who can compete in the global market. Though there are
many benefit associated with internationalisation Marmolejo (2012) identifies limited resources
as one of the obstacle to internationalisation. According to Salmi (2011) the East Asian
universities such as Shanghai Jiao Tong University (china) strategically distinguished themselves
through internationalisation by relying on Chinese or Korean academics trained in some of the
best universities in North America and or Europe.
2.4.5.1 Student and Staff Exchange
University exchange programmes offer academic institutions an opportunity to learn and
benchmark on the best practices from other institutions. Likewise through student exchange,
students are able to learn different culture and get more exposed than their colleagues who may
not have had such an experience. The member of staff who get opportunity to go through the
exchange programmes, bring on board new talents including better teaching practices and model
and are exposed to new research areas. One of the commonality found out by Horta (2009)
among the top ranked University is a common student structure which is dependent on graduate
students population and strong internationalization; he further observes that the
internationalization of the students at graduate level is related to the internationalization of the
academic staff. Top research universities attract more talented student globally with an average
of 24% of student population comprising of the international students. This student population is
however more concentrated at the graduate level, the rationale behind this is to concentrate

104
international population on the levels that support University research activities, this
consequently increase their international reputation (Marginson, 2006).
Taylor (2014) globalization is also at the heart of the Japanese universities with a new policy
initiative to have ‘Super Global Program’ which include foreign-student recruitment and
research linkages. The Japanese Government has also announced the recruitment of foreign
Faculty members to replace the retiring professors. Deliberations are also underway to have
programmes that are fully taught in English, establishing dual-degree programme through
international collaborations and establishing non-Japanese faculty. Japanese Prime Minister
Shinzo Abe in support of Japan Universities opening up to global market remarked that “the
number of foreign students at a University will define its success” (Taylor, 2014), this
demonstrate the value of student exchange to the success of a university. Some of the
opportunities that universities can make use of to leverage on internationalization include use of
technology and engagement of African scholars in diaspora to anchors of programmes in the
home country thus strengthening internationalization agendas (Jowi, 2009).
African universities have equality taken up internationalisation initiatives with the University of
Cape town been the best ranked University as per pilot ranking of the top 15 universities in
Africa for year 2016. In the ranking, University of Cape Town had the highest percentage of the
international students at 18% (Minsky, 2015). Similarly Kwaramba (2012) observes that South
Africa is one of the best countries in Africa in internationalisation of its higher education system.
He asserts that South Africa has become the education hub for Southern Africa due to it
competent and attractive factors. Some of the factors identified by Kwaramba (2012) that has
contributed to south Africa receiving such praiseworthy standing in internationalisation of her
education system include: offer of scholarship for studying abroad, enhancing student mobility
through flexibility in student visa acquisition, increasing the capacity to enrol the international
students, ensuring it offer quality higher education, attractive migration policies where you can
use the work permit to take up part-time studies, students especially post-graduate can are also
allowed to engage in employment in their institution of learning, recognition of international
experience and ensuring the academic qualifications from south Africa Universities are

105
internationally recognised. Stellenbosch University and University of Witwatersrand have the
highest number of the international University in South Africa Kwaramba (2012).
Internationalization has been one of the UCT’s strategic goals via an Afropolitan niche, this has
seen the University expand its network throughout the world and as a result becoming a meeting
place for scholars and students. UCT has continued to be University of choice and especially in
African countries, in 2014 the international student were drawn from 102 countries among which
37 were African countries (UCT Strategic Plan 2010-2014).
In a similar argument Salmi (2009) observes that, HEIs where there is limitation of staff and
students mobility and who depend on their undergraduates students to enrol for post graduate
programmes are at risk of academic in-breeding. This analogy applies when faculty are recruited
from their own graduates a situation that prevent intellectual development. Salmi (2009) asserts
that world-class Universities have students and staff from different diverse background; this
creates diversity and exposure to new ideas and new way of approaching issues. World’s best
Universities recruit huge number of foreign students and also employ a substantial number of
foreign faculty in their quest to get the most highly talented students and faculty. HEIs can
enhance internationalization through international collaborations and partnership in research and
teaching, students mobility, staff mobility for training and capacity development, international
accreditation of curriculum (Salmi, 2009;Mclellan, 2008). A study by Horta (2009) in European
universities reveals that internationalization of student population enhances research capacity;
this is enhanced by recruitment of the most promising students since they are able to attract
highly talented students.
2.4.6 University Policies and Strategies and Performance Excellence
Strategy according to Michael Porter is a competitive position which differentiates one
organization from the other. He views strategy as both a plan and a position which have to be
competitive. Strategy is borrowed from the military and applied in the business world, it is
concerned with how the organization aims to accomplish the objectives (Porter, 1986). A
strategy is defined as plan of action that stipulate the resource allocation and other activities for
dealing with the environment, achieving a competitive advantage and attaining organizational

106
goals” (Daft,1999; Kendrick & Vershinina, 2010). Strategies determine the organizational
success; this is usually based on their competitiveness, effectiveness and how well they are
implemented. Strategies should be formulated in such a way that they give the organization a
distinctive edge over their competitors in meeting the customers’ needs. In strategy formulation
organizations should pay key attention on how they differentiate themselves from the others.
Strategy should be flexible to give room for any adjustment that may demand alignment to the
emerging trends without compromising on their competitiveness, create synergy and deliver
value to its customers. Policy is a position developed in response to a problem or issue of conflict
in line with specific objective. Policy consists of both text and action, it is words and deeds, it is
what is enacted as well as what is intended (Trowler, 2002). They act as guideline to the
management of the organization. Gill (2002) observes that, strategies are means of pursing
organisations vision, mission and values. According to Eden (1993), effective leadership requires
developing, getting commitment to and implementing rational business strategies.
2.4.6.1 Strategy and Policy Formulation
Successful leaders formulate strategies that are competitive and sustainable and geared toward
the organization achieving it vision. Leadership play a key role in formulation of the
organization strategy, they have to be decisive and clearly communicate the organizational
strategies to it employees. In strategy formulation the leader should identify and leverage on
their competencies. Daft, Kendrick & Vershinina suggest that, a good strategy formulation
process should begin with undertaking of a SWOT analysis to identify and understand the
organizational internal strengths and weakness as well as the external opportunities and threats
that might affect its performance. This is done in comparison with other competitors in the
market to develop a competitive strategy (Daft,1999; Kendrick & Vershinina, 2010).
To develop a competitive strategy, Porter (1986) suggests the use of one of the following
strategies; differentiation, cost leadership or focus strategy. Differentiation strategy entails
distinguishing the organizations products and services from the others in the market, this make
the product to be unique as compared to others thus reducing the competition and wining the
107
customer loyalty. Cost leadership strategy on the other hand involves the organization using
more efficient resources to reduce and control the cost of production without compromising on
the quality and to be more efficient than their competitors. Low cost of production can be used to
undercut the competitors’ price for offering the same quality product and still maintain the
targeted profit margin. In the use of focus strategy, the organization narrow down to a specific
market, this can be achieved through the differentiation strategy or the cost leadership strategy.
There are other new trends emerging in strategy formulation and implementation such as the
merger and acquisition, which entail buying off your competitor or merging with them. Strategic
partnerships is also an approach today’s success companies apply through venturing into
collaborations sometimes with their competitors, strategic partnership make it possible for this
companies to enter into new business areas. Another approach applied by organization is the
innovation from within also referred as dynamic capabilities where the focus is to leverage on
the available existing resources to gain competitive advantage. According to Porter in his studies,
any business that fails to adopt any of the three strategic approaches equally makes less profit
compared to those who adopt and use one or a combination of the strategies (Daft, Kendrick &
Vershinina, 2010). Similarly these observations were made in a study referred as “Evergreen
Project” having a clear strategic direction is key determinant of winner and losers (Nohria, Joyce
& Roberson, 2003).
2.4.6.2 Involvement of Stakeholders in strategies and policies formulation
The organizations Policies and strategies should be developed based on current and future needs
and stakeholders expectations. There should be consultation with the employees and customers
and external stakeholders in policy and strategy formulation. The development of the policy
should be informed by relevant information from performance evaluation results, learning,
research or other sources. Having the right information may include understanding social, legal,
political, environmental, economic, demographic, and the competitors to make informed
decisions in the strategy formulation. One of the key issue identified by Eden (1993) on
effectiveness of strategies is the ownership and commitment, he observes that effective strategy
formulation taps the wisdom of the people in an organisation. Tapping the wisdom of the
108
employees can only be achieved through engaging them in the strategy formulation, this create
ownership and the agility by the employee to implement the strategy.
The University should actively engage the employees in the policy formulations, in the
University setting where students are the key customers, their opinions matters while developing
strategies or policies that affect them. Getting their opinion is key because it determine how well
they buy into the idea. Student and staff should not only focus on teaching, research and
learning but they should also play an active role and have interest in the governance of the
institution they serve they be part of institution development to promote a democratic culture
(Bergan, 2003). Students involvement in formulation of policies that touch on them such as
curriculum development, the code of conducts, student governing constitution, bursaries and
policy documents guiding the conduct of student in the University, is considered extremely
variable since they are the recipient, and giving their opinion a chance create ownership in the
whole process. Jagersma and Parsons (2011) point out that, though the focus point in curriculum
development, he has proved through research that student involvement have a positive outcome.
2.4.6.3 Strategies and Policies Communication and Implementation
The organization strategy should take into consideration the market or the sector within which
they operate in order to be competitive compared to their competitors. The organization should
develop strategy, review and update them regularly to remain relevant, competitive and well
aligned to the emerging trends. Policy and strategy should be effectively communicated and
cascaded to the relevant staff and aligned to individual’s plans and targets, effective processes
should also be deployed to implement the strategy and policies (Sheffield Hallam University,
2003; EFQM Model, 2013). The communication of the policies and strategy also determine how
fast the employee adopt and embrace the University plans and strategy. Policy and strategy
communication should be very clear to the followers in regard to what their role and
responsibilities are when it comes to the implementation of the University policies. The leader is
expected to deliver the policy and strategy though people, partnership and resources, and
processes, this therefore requires every stakeholder to clear understand the organization policies
109
and strategies (EFQM, 2013). The rise in Market and heightened competition between public
institutions such as in UK and public versus private institutions as it is the case with countries
such as Hungary, this is increasingly shaping the HEIs. OCED (2015) recommends sounds
policy as one way of improving the education system. Policy development and implementation
should be aligned to the government structures and should take into account Contextual, social,
cultural, political, economic factors (Fazekas and Burns, 2012). Policies to support Education
agenda will be successful if designed around the students and learning, building teachers’
capacity and involve all the other stakeholders; we should also consistently measure the impact
of the policy to ensure we have the appropriate policies in place (OCED, 2015).
It is the responsibility of the leader to align organizational policies and the strategies to the
present and future needs as well as the stakeholders’ expectation. The aspect of the University
been accountable to the present and future is emphasized by Drew Faust, President of Harvard
University during an Alumni Speech, he pointed out that among the many society’s institutions,
Universities are uniquely accountable to the past and to the future, she noted that the Universities
owe the world answers, since discovery is part of what the Universities should do, through
seeking solution to what is a challenge to the world. The University strategies should thus be
designed geared toward addressing this noble concern. If the HEIs are to thrive under the
prevailing competitive environment, they need to develop strategies that are equally competitive.
The strategies should be supported by informed and well-coordinated implementation. The
formulated business strategy can only drive the organization through leader equally having in
place a robust leadership strategy. The business strategy and leadership strategy are closely
linked. To realize organization’s full performance potential the business strategy and leadership
has to work together, with the business strategy setting the direction and leadership strategy
acting as human enabler. The business strategy does not address the strategy implementation but
leadership strategy operationalises the strategy to success, its bridges the gap between the
strategy and successful performance. The leader, has to ensure that the strategy make sense to the
stakeholder involved (Dinwoodie et al., 2014).
2.4.7 Processes, Product and Services and Performance Excellence

110
Processes are referred to us organized set of related activities that work together to transform the
organizational or firms inputs to outputs (products and services) that are of value to their
customers (Daft, 2007). Similarly, Gelinas et al.(2010) defines business process as set of
business events that work together to facilitate the creation and delivery of organizational
product and services. The EFQM model identifies processes, product and services one of the
drivers of performance (EFQM, 2013).
2.4.7.1 Effective Processes
Organization processes contribute significantly to the organizational performance. Daft et al
(2010) observes that organizations need to focus and optimally manage their organizational
processes to improve performance, the processes should take into account the emerging trends in
the supply chain across the different organizational stakeholder that the process is meant to
serve. These calls for continuous business process re-engineering to redesign the processes to
respond to the emerging trend in product and service delivery. According to EFQM Excellence
model (2013) the organizational processes should be analytically designed and continuously
improved to effectively satisfy the need of our customers and stakeholders. The stakeholders and
customer needs should be put into account while designing the product and processes. The leader
is expected to be personally involved in ensuring the organization’s management systems are
developed and continuously improved through development and implementation of robust
internal processes.
The processes should drive the institution policies and strategies in achieving the organizational
goals, they form the link between the agents and the results. Excellent Universities design,
manage and continuously improve processes innovatively in order to support its policy and
strategy to fully generate value for their students, staff and other stakeholder. The programmes
and services are also designed based on the customers’ needs (Sheffield Hallam University,
2003). It will be difficult to deliver good results even with well trained employees and adequate
resources when the processes are not well designed, as cited by (Akyuz, 2005) processes are
important part and significant part of performance enabler and should be clearly defined.
Effective processes will make it possible to have high quality product and services.
111
2.4.7.2 Unique and Quality Products
Having acknowledged that Universities are major drivers of economy through knowledge
transfer the programmes offered by them should be designed based on the market needs. When
setting the university vision, Salmi (2009) advices that University needs to delineate the areas
that the University wish to focus on and be uniquely identified with, he argues that even a world-
class University cannot be excellent in everything giving a case of Harvard University which is
one of the world best ranked University and is not Excellent in everything. According to Sir,
John Daniel, former chancellor of Open University, United Kingdom, Leading-edge research is
commonly picked as one of the key characteristic of World-Class Universities (Altbatch, 2004).
Similarly, Salmi (2009) contends that, World-class Universities are recognized in part for their
superior outputs, in this regard they produce highly demanded graduates who meet the demand
of the labour market, they conduct leading-edge research that are published in the top scientific
journals and they are leading in innovations through patents and licenses producing world
entrepreneurs and turning students ideas into blockbuster businesses.
Robert A. M. Stern, a famous architect while delivering a speech in the inauguration of Spangler
Hall, argued that, universities use branding as differentiation strategy (Drori , Delmestri & Oberg,.,
2013). He further observes that, Competition is the driver of differentiation and with the high
competition among the universities which offer same product, the need to uniquely distinguish
themselves is paramount, branding in this case become a tool for differentiation (Drori et al.,
2013). The academic programme and internal services should be well designed based on the
customer needs, this call for regularly undertaking market research, student surveys to get
feedback on what would be most relevant to the customers. Encourage the student to contribute
in giving feedback on the level of services this should also include complaints to give room for
improvement. To improve on the processes the university should adopt new teaching
methodology, use of technologies such as the MOOCs and the E-learning platform. This will
further facilitate gaining access to the new market. The stakeholders input should be used to
capture and address their expectation in the service delivery (Sheffield Hallam University, 2003).

112
2.4.7.3 Branding and Marketing
The evolving trend of globalization of business has also become inevitable in the HEIs who are
also competing to offer their services in an international arena with a sharp focus of marketing
education to customers globally. Worldwide before competition came on the board as a result of
expansion and increase in the number of HEIs, universities used to operate on the notion that “If
you build it, they will come” (Eccles, 2008), he observe that this has since changed and HEIs
need to consistently communicate their values to their potential internal and external customers.
According to Joseph, Mullen & Spake (2012) on an exploratory study undertaken in united state
University to survey the difference criteria student use while selecting University admission
between private and public, the branding initiative have increasingly become more important due
to the competition and the slow down on US economy resulting in decrease in state funding. He
notes that universities brand themselves to attract potential students and parents; target high
profile scholars; donors; alumni and other potential business leaders. Improving ranking, creating
new image , improving awareness and perceived quality are also other reasons identified by
Bunzel (2007); Paden and Stell, 2006 as cited by Joseph et al., (2012). A number of approaches
are commonly used for branding including quality, convenience, unique programs. Well-
branded University bring along numerous benefit including talented students and increase in
admission numbers; attract and retain better faculty and staff; attract more donors, attract media
attention, and attract more research funds and more strategic partners (Sevier 2007; Moore,
2010). One of the successful branding initiative is University of Marland ‘Fear the Turtle”
which started as athletic slogan, it has since then translated into brand loyalty increasing the
awareness, student admissions as well as attracting more support and funding from stakeholders
(Joseph et al.,2012 & Randall,2009).
A study undertaken by Iqbal, Rasli, & Hassan (2012) established that image of the University is
the key determinant of University selection, the image of the University according to the study
has four factors; quality, prestige, financial incentives and acceptance, with quality being the
strongest factor prestige coming at position two and acceptance and incentives at position three
and four respectively. In Harvard University as observed by Randall (2009) branding and

113
differentiation has overtime being more embraced as a strategy of being competititve, some of
the initiative by Harvard University are application for trademark ownership of the themes
“Managing yourself” and “the world’s thinking’, “Ask what you can do” a remark from
President Kennedy’s 1961 inaugural speech and “Lessons Learned”. The intiatives by Harvard
University which is known globally for it success to invest in branding is an indicator of how
branding effectiveness. Indeed if Harvard is investing in branding, the other HEIs aspiring to be
world class should be doing it more.
Intensive marketing and branding is key with the rise in the level of competition. Branding is
one of the most important institutional strategies that requires a set of frame work to guide it
design and implementation. It is a powerful tool for an institution to remain competitive.
Organization needs to identify opportunities that will allow them to create a competitive brand
culture, once people easily accept brand culture as conventional wisdom and they do not easily
abandon them (Dumitriu, 2012; Holt, 2003; Drori, 2015). Unlike in the past where universities
were viewed as only teaching facilities, they currently offer services like other business models
and are undertaking marketing and branding just as the other industries. HEIs have embraced
globalization of business where education is valued as a service and initiative to market it
worldwide undertaken, this has to be embraced due to the need to stand out in a competitive
market that we are operating on today (Brown, 2013). According to Drori (2015), the change in
the branding of the universities has been an area of key focus in the recent past due to the
globalization culture and professionalization of the University management.
Branding is defined as unique visual representation that captures the essence or character of a
product or an organization”. There are many ways of branding that world class universities have
adopted including different artifact of the University, building architecture, websites, letterhead
graphics, dress code, sports and adverts. The University logo has also being one of the icon that
is simply and stylistically designed to create an instant recognition. Drori (2015) notes that
Universities are redesigning their iconography to modernize them a process being referred to
change from ‘emblem’ which often abstract to ‘logo’ that concern visibility and recognition. In
marketing the University, the internal stakeholders have to buy in the idea before you can move

114
out, Drori (2015) gave an example of National University of Singapore which had to hold
internal workshops to aimed at changing the mindset of staff to live the University Brand.
Recognizable and unique brand are created to establish a marketable feature, which help the
organization to strategically compete over resources; funding and recruiting renowned academics
and researchers and student enrolment.
2.4.7.4 High Quality Service Delivery and Holistic Campus Life
The University should offer a conducive learning atmosphere for the students and incorporate
other co-curricular activities including sports, clubs, recreational activities, societies, and other
activities that allow students to fully exploit their potential while in campus. This enables them to
grow holistically. At NUS there are more than 100 students groups, organizations and societies
and more than 40 sport teams an indication of a vibrant campus student life. The students at NUS
are also actively involved in the community service where they undertake projects and also raise
funds for charity through selling flags during an event referred to as “Rag and Flag” (NUS at a
Glance, 2015/2016). Involving student in co-curricular activities contribute positively to their
academic work, emotional management, a healthy lifestyle and improve their social network (
Esa, Mohamad, Abd Aziz., & Aishah, 2014). According to Esa et al. (2014) co-curricular
activities should develop student holistically, through shaping their personality and producing a
well balance graduates. Similarly a study by Daniyal, Nawaz, Aleem & Hassan (2011) in Islamia
University, Pakistan observed a positive relationship between student involvement in Co-
curricular activities and their performance. When the students are satisfied with their experience
in the campus they serve as the ambassadors to the aspiring students. Education is a service and
it requires been mindful of students expectation since they are the customers, through excellent
customer service to the students, they are able to share their experience with other and they
become the ambassador of the University. Provisions of regular feedback to the student
enquiries, making available the information required are some of the ways of contributing to
quality service deliver (Boyd, 2012).
The university should also establish platform for supporting student innovations and creativity.
Stanford StartX is an incubation set up that offers financial support to students for their accepted
115
start ups ideas, with some of it alumni behind some of the best companies in the Silicon Valley
(Thompson, 2013). Mentoring and coaching through provision of students advisors also
enhances the service delivery to students which consequently impact on the quality of the
graduates making the university to be more competitive and attractive.
2.4.7.5 Customer Feedback
There should be regular surveys to access the level of service delivery to the customers and
partners. Though complaint is negatively regarded, they should be taken like a gift and used to
improve on the services delivery (Barlow & Møller, 2008). It is important to give feedback to
the employees, feedback assist them to work towards improving their performance after they re-
evaluate themselves (Higgs and Dulewicz, 2005). It further provides organization with
information that can help them improve on their product and services assisting the organization
to focus on the customer’s needs. It is important for organizations to change in terms of the way
they handle their customers and customer feedback is one way of communicating with
customers. To develop a customer oriented culture or customer focused culture, organization
have to be open and use complaint as strategic tools to do better (Barlow & Møller, 2008).
Measurement allow organization to identify the areas for improvement, do a comparison against
the internal standards as well as use the measurement for benchmarking, the customer
satisfaction survey feedback provides information for the management processes and a future
warning signal. The organization is able to know if they meet the customer expectation and the
areas to improve on to increase the loyalty of the customers (Feciková, 2004). Feciková observes
that, the leaders should aim at ensuring the customers are satisfied, they should listen and
respond to customers’ needs and expectations, make use of feedback to improve on the product
design, and regularly monitor and the customer satisfaction, and give feedback on the customer
complain and hold regular consultation meeting with the customers for the organizational
success, this can further be enhanced by establishing a centralized information desk. According
to Feciková customer’s satisfaction is achieved by organization focusing on its customers,
having a customer oriented culture, empowering its employees, achieving process ownership by
the employees and establishing partnership between customer and suppliers.

116
2.4 Conceptual Frame Work
A conceptual framework is a concise description of the phenomenon under study by graphical or
visual description of the variable you are investigating (Mugenda, 2008). Young (2009) defines
conceptual framework as a graphical representation of relationship between the independent and
dependent variable. A well-articulated conceptual framework helps the researcher to make
informed findings (Saunders & Lewis, 2012). In this study the performance excellence of
universities in Kenya which was the dependent variable was conceptualized as being driven by
the following independent variables: leadership, people management, resources,
internationalizations, policy and strategy, partnership and collaboration, processes, product and
services.
The study first sort to explore the drivers of performance excellence through exploring driver of
excellence from leading universities globally by region, reviewing existing theories, reviewing
excellence models and empirical literature review. The drivers were analyzed to establish how
they related with performance excellence, explore the gaps in performance drivers, compare
drivers of performance excellence between public and private universities and finally develop a
framework for accessing performance excellence for universities in Kenya. Figure 2.8 shows the
schematic drawing for this study structure while Figure 2.9 shows the conceptualization of the
relationship between the dependent variables and independent variables.

117
Figure 2.8: Schematic Drawing of the Study Structure
People Management
Resources
Policies and
Strategies
Leadership
Internationalization
Partnership and
Collaboration
Processes, product
and Services
Performance
Excellence
Theories,
Excellence
Models
Leading
universities
Empirical
Literature
Gaps
Comparison Public
and Private
Framework
Literature Review
Objective 2
Objective 3
Objective 4
Objective 1
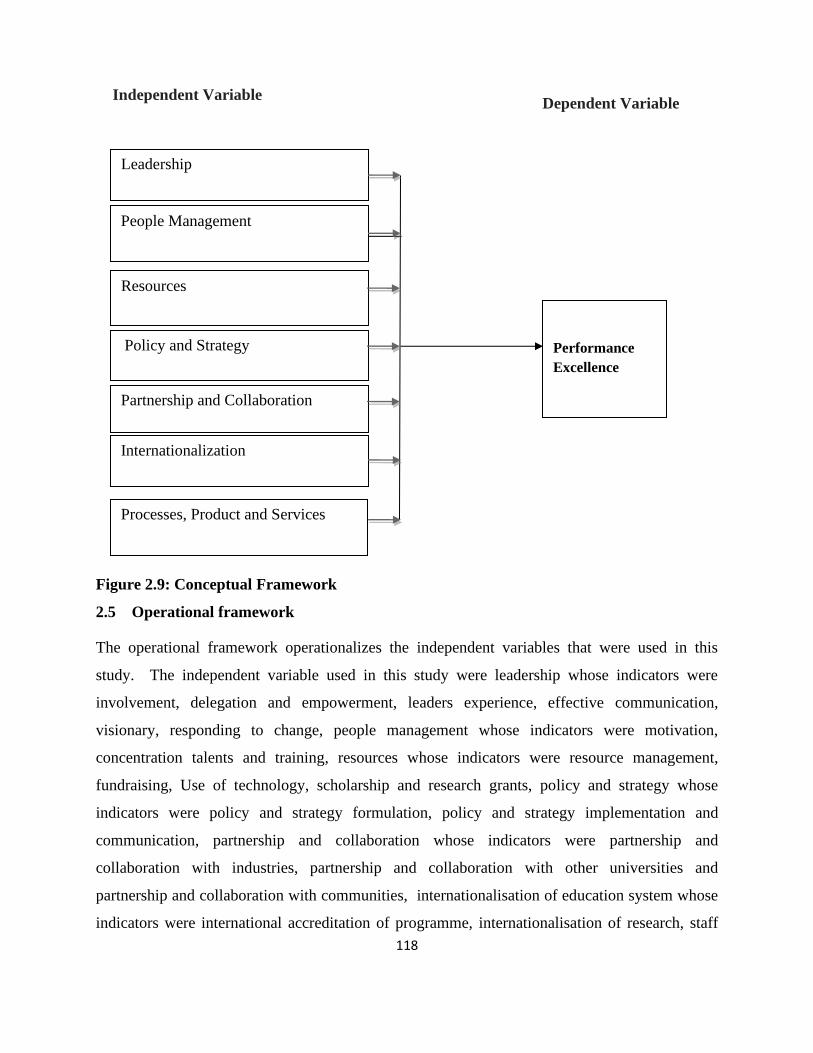
118
Figure 2.9: Conceptual Framework
2.5 Operational framework
The operational framework operationalizes the independent variables that were used in this
study. The independent variable used in this study were leadership whose indicators were
involvement, delegation and empowerment, leaders experience, effective communication,
visionary, responding to change, people management whose indicators were motivation,
concentration talents and training, resources whose indicators were resource management,
fundraising, Use of technology, scholarship and research grants, policy and strategy whose
indicators were policy and strategy formulation, policy and strategy implementation and
communication, partnership and collaboration whose indicators were partnership and
collaboration with industries, partnership and collaboration with other universities and
partnership and collaboration with communities, internationalisation of education system whose
indicators were international accreditation of programme, internationalisation of research, staff
Independent Variable Dependent Variable
People Management
Resources
Policy and Strategy
Performance
Excellence
Leadership
Internationalization
Partnership and Collaboration
Processes, Product and Services

119
exchange and students exchange and processes, product and services whose indicators were
effective processes, quality product, quality service delivery. Figure 2.10 shows the operational
framework used in the study.
Figure 2.10: Operational Framework for the Study
People Management
• Motivation
• Concentration of Talents
• Training
Resources
• Resource Management
• Availability of resources
• Fundraising
• Scholarship and research grant
• Use of Technology
Policy and Strategy
• P&S Formulation
• P&S Implementation
• P&S communication
Performance Excellence
Educational performance
• Research output
o No of publication
•Growth in Programmes
• Growth in students
enrolment
Management performance
• Staff turnover
• Revenue surplus growth
Leadership
•Involvement
•Delegation and Empowerment
•Leaders Experience
•Effective Communication
•Visionary
•Responding to Change
Internationalization
• Internationalization of
programmes
• Internationalization of research
• Student exchange
• Staff exchange
Partnership and Collaboration
• P &C with industries
• P &C with other universities
• P &C with society
Processes, Product and Services
• Effective processes
• Quality product
• Quality service delivery
120
2.6 Research Gaps
Based on the reviewed literature many drivers were identified that could influence the
performance excellence of universities. However, it is important to undertake research to
establish the drivers that are more significant and thus identify the most important ones. This will
act as a tool to guide HEIs in their effort to achieve performance excellence as articulated in
majority of their vision and mission. The key drivers of performance excellence are not well
documented and especially for the developing countries. Majority of the previous research have
focused on the challenges that impede performance excellence rather than what drives
performance excellence (Chacha, 2004; Gudo et al., 2011; Mbirithi, 2013 & Nyangau, 2014).
Management aspects have been identified as some of the major constraints to performance
excellence (Mathooko & Ogutu, 2014; Mange, Onyango & Waweru, 2015). Unlike in many
others studies factor analysis was used in this study to derive the most important factors, this
reduced the number of dimension for performance drivers and retained the items that loaded
highly. In this research, 11 top universities from different regions were reviewed with a view of
identifying what drives performance excellence of best ranked universities in the world. This
enriched the literature review, previous research have not considered the performance drivers of
world top universities.
The literature has shown most of the studies conducted are from developed countries. HEIs play
a significance role in the economic development of both developing and developed countries and
thus their performance is major determinant of the country’s economic destiny. Based on this
there was need to carry out research focused on drivers of performance excellence in the
developing countries. None of the research has been done in Kenya focusing on the interrogating
the drivers of performance excellence in universities in Kenya.
This study sought to address the gaps identified by developing a framework for assessing the
performance excellence of universities informed by information from top ranked universities in
the world, models for performance excellence, existing theories and literature review.
121
CHAPTER THREE
RESEARCH METHODOLOGY
Introduction
This chapter gives a description of the research methodology that was used in this study. It
presents the research philosophy, research design, the study population, the sampling techniques,
the data collection procedures, and the data analysis techniques.
Research Philosophy
A research philosophy is a belief about the way in which data about a phenomenon should be
gathered, analyzed and used. The two main research philosophies are; positivism also referred as
scientific or experimentalist and phenomenology also known as humanistic or interpretivism, this
is also referred to us quantitative and qualitative approaches respectively (Holden & Lynch,
2004; Cooper & Schindler, 2008). In research design the discussion on philosophical
underpinning is very critical since it enable making informed choices on the methodology and
the method to base the research on. The strength of the rationale for the methodology and
method heavily impact on the robustness of the research and it contribution in furthering the
knowledge (Jackson, 2013).
Positivists is premised on believe that reality is stable and can be objectively described,
according to positivist philosophy, knowledge is based on facts and is not subjective. Positivism
is premised on quantitative methods that have good reliability and representatives such as social
surveys, structured questionnaires and official statistics. The researcher in this case tend to
establish relationships between variables, it focuses more on the trends and patterns rather than
the individuals. In positivism the researcher has an objective view of the world and test and
verify their study hypothesis using measurable relationship among variables, he further note that
quantitative research could be experimental, quasi-experimental or descriptive. In positivist the
researcher seek facts through establishing relationship in variables (Swanson & Holton, 2005).
On the other hand interpretivism (phenomenology) is subjective and is based on individual
experience, It focuses on personal knowledge, immediate experience and the interpretation of the
individual (Creswell, 2008).

122
The current study on exploring drivers of performance excellence in public and private
universities in Kenya aimed at establishing the drivers of performance excellence based on
existing theories, excellence model and literature review and reviewing leading universities
globally to establish the dominant drivers for their performance excellence. The study further
analyzed relationships between the drivers and performance excellence in universities in Kenya.
This study was therefore premised on positivistic philosophy since it assessed the relationship of
drivers to performance excellence of universities in Kenya.
Research Design
A research design is a plan and the procedure for undertaking research through drawing decision
from broad assumptions or comprehensive methods of data collection and final analysis. The
plans detail what researcher will undertake starting from questions/hypothesis formulation,
operationalization of study variables and finally the data analysis. Further, research design
ensures that the findings obtained are highly reliable and valid and facilitates answers to the
questions without any difficulties or ambiguity (Cooper & Schindler, 2008; Creswell, 2013).
Several research designs are used in social science, this study on drivers of performance
excellence in universities in Kenya employed cross sectional survey research design. It is one of
the most widely used non-experimental research designs to collect large amount of survey data
from a cross-section of a population (Cooper & Schindler, 2011). A cross-sectional study design
is used when the purpose of study is descriptive. A descriptive study determines and describes
the characteristic of the variable used in the study without manipulating the variable (Sekeran,
2003; Swanson & Holton, 2005). The design used a survey method using self-administered,
semi-structured questionnaire for data collection. A survey research aims at collecting data from
population representative which is then generalized within a random error (Saunders & Lewis,
2012). A survey is ideal for a large population that is geographically spread like in this case the
study where the sample was from different part of the country. A survey design was appropriate
since it allows use of questionnaire to gather both qualitative and quantitative data for the
independent and dependent variables. Surveys assist in establishing whether relationship
between variable at one point in time depending on the available resources represent the targeted
123
population. The survey design enabled the researcher to establish the gaps in the drivers of
excellence in universities in Kenya.
According to Harwell (2011), Qualitative research methods focuses on experience, perspective
and thought of participant rather than numbers, while the quantitative method strive for
objectivity, through use of methods such as surveys or tests to collect data and analyzing it
statistically. Qualitative approach was used in reviewing existing literature on drivers of
performance excellence. These include journals, Websites, reports, books, periodicals, databases
and other relevant source of secondary data. Quantitative approach assumes the researcher will
set aside his experience perception and ensure objectivity in the conduct of the study. It assumes
that there is single “truth” which is independent of human perceptions that exist. Swanson &
Holton (2005) indentifies five step in the process of quantitative research starting with
determining the questions to be answered by the research study, the second, determine the study
participants, third, is identifying the method to answer questions which include identifying the
variables, the fourth step is selection of tool to use to analyze the data and finally the result
interpretation based on the statistical significance.
Mixed method research is based on both the quantitative research and qualitative research, it
mixes the two in the study (Swanson & Holton, 2005). Swanson & Holton further classify the
mixed method into four categories namely; complementary where the result from the two
methods are combined, development, where the results of one method help to inform the other
method, and initiation, in this regard the researcher recast the results to questions and finally
expansion in which the different method are used to broaden the breadth of the enquiry.
According to Johnson et al. (2007) when research is undertaken using more than one research
methods (QUAL/QAN), it enhances the validity of findings as opposed to results from single
research methods. The use of both qualitative and quantitative methods a situation referred to us
triangulation. The use of triangulation in this study helps to build on one another through
bringing on board diverse viewpoint thus supporting the validation of the case (Oslen, 2004).

124
Sampling Frame
Sampling frame represent a list that comprise all the entire population from where the sample
will be drawn from. A sampling frame should be complete, up-to-date and accurate as possible to
ensure it is a representative of the entire population with every case having a chance of been
selected. The frame should not under-represent the entire population and should adhere to
validity and reliability (Saunders et al., 2009). The sampling frame in this study was all the 40
accredited public and private Universities in Kenya as at July, 2016. CUE (2016). Accredited
universities are homogeneous in that they are mandated to operate offering various spectrums of
programmes, with their own Governing council, management board and senate. A homogeneous
population as observed by Kothari (2004) minimizes the sampling error.
Population of the Study
Population is the full set of a case from which a sample is drawn to represent the entire
population (Saunders et al., 2009). Population is composed of two groups the target population
and the accessible population. The study drew population of the study from both public and
private Universities in Kenya. The target population of this study was the 40 chartered public and
private universities in Kenya as per the CUE, 2016 on Universities authorized to operate in
Kenya by July, 2016 (Appendix II). The choice of chartered Universities was because they have
the authority to fully execute the mandate of the Universities in line with the University Act,
2012 and their charter, and they also enjoy some level of autonomy in decision making for
development of their individual institutions. The study targeted officers holding leadership and
management position, this comprised of the Deans, Directors, Chairmen of Departments and
Head of Departments as the Unit of measure. The unit of measure was ideal for the study in
assessing drivers of performance excellence owing to their day to day involvement in the
leadership and management of the University operations, further more as the of head various
academic and administrative divisions and are instrumental in service delivery and decision
making since they are also members of University senate and senate committees.
The target population comprised of 23 public universities and 17 private universities which were
accredited by the CUE as at July, 2016. The validity of the study would be restricted if data was
125
collected from public universities only. In addition to been private and public, the target
population was further clustered based on the number year of operation (age) from the year of
establishment with those in operation for more than 20 year been classified as old Universities
while 20 years and below were classified as young Universities. The oldest public University as
at July 2016 was UoN having been established in 1970 (47 years) and the youngest Kibabii
University in 2011 (5 years). The oldest private University, University of Eastern Africa, Baraton
was established in 1989 (27 years) and the youngest accredited, Adventist University of Africa
established in 2008 (8 years). The age was factored to ensure a fair representation of the
population of study in both public and private Universities. purposive sampling based on the
willingness to participate was used giving a sample of 12 Universities, 6 public and 6 private, in
each category 3 universities were in the category of old universities >20 years and 3 in the
category of the young University < 20years.
Sampling Techniques and Sample Size
Sampling is a process of obtaining information from an entire population by sampling just a part
of the population; it is the selection of a portion of the population on basis of which inference
about the totality is made (Kothari, 2004). There are different methods used in sampling, these
include census, imitation of similar studies, use of published tables and using formulas to
calculate the sample size. Census is best used when the population of study is small, less than
200.It entails using the whole population as the sample. In census the sampling error is
eliminated since the entire population is used in the study. Israel (1992) observe that using a
sample size of a similar study without reviewing the procedure can lead to risk of repeating error
that were in previous studies. Determining sample size using published tables provide the sample
size for a given set of criteria, which include a combination of precision, confidence level, and
variability. A number of formulas are also used to determine sample sizes, for large population
Cochran (1963) formula is used while Yamane (1967) provide a more simplified formula for
calculating the sample sizes which was applied in this research. Yamane (1967) was used in this
research because it more simplified and the population was not very big.
126
3.6.1 Sampling Techniques
Samplings techniques are various methods that assist researcher to reduce the amount of data that
he would need to collect by narrowing down to a specific sub-group rather than the total
population (Saunders et al., 2009). Saunders et al., 2009 further notes that, a sample population is
used to collect data to represent the entire population when it is impossible to survey the entire
population or the time and budget provision cannot allow you to use the entire population.
According to Henry (1990), Sampling gives more accuracy than targeting the entire population
since with a smaller number one can dedicate more time to collect detailed and more precise
information than when you aim at the entire population. Sampling could be probability sampling
or non probability sampling. In this study, data was collected using questionnaire from sample
identified through a two stage sampling technique, stratified sampling and purposive sampling.
Stratified sampling was used through grouping the University into private and public and also
stratifying them in terms of age based on the year of establishment. Purposive Sampling was
used to select University from the group that were in operation for over 20 years and above and
from the group that was below 20 years. These give a good representation of all the chartered
public and private Universities in Kenya who are at different age from the time of their
establishment. According to Miller and Yang (2008) purposive sampling entails deliberately
selecting particular units of the population. Through purposive sampling, the researcher is able to
select specific subjects that provide the most detailed information about the phenomenon being
studied (Kombo and Tromp, 2009). Through purposive sampling 12 universities out of 40
universities accredited in Kenya were identified to be used in the study. The twelve were
identified based on the willingness to participate in the study.
3.6.2 Sample Size
Determination of the appropriate sample size by researchers is a critical step in research because
the research output is influenced by appropriateness of the sample size (Barlett et al., 2001).
Barlett et al. (2001) further argue that in quantitative methods a small group of population is used
to make inference regarding a larger group that would be more costly to study. Cooper and
Schindler (2008) however emphasize on having a fairly good representation of the sample size
noting that a large sample size is better that small one. Similarly, Kothari (2004) recommended a
127
sample size of optimum size as the ideal not too small and not too large. He observes if the
sample size is too small it may not give the desired results, and if too large it may lead to
unnecessary costs. He further note that some sampling error usually arise whenever a sample
study is made which are usually addressed by drawing a sample of adequate size.
The selection of the sample size is influenced by many factors including the purpose of the
study, the size of population, the risk involved if the sample is not adequate, and the acceptable
sampling error. The level of precision, the confidence level or the risk and the degree of
variability in the attribute being measured need to be clearly specified during the sampling to
achieve the appropriate sample size (Israel, 1992). In addition Kothari (2004), also states that
other than the desired precision and confidence level the size of the population variance needs to
be considered with larger variance requiring a large sample size, the parameters of interest also
need to be taken into account. He further observes that the cost involved must be taken into
account while deciding the sample size.
The level of precision also referred to as the sampling error is the range within which the true
value of the population is estimated to be, is based on the reliability specified in the confidence
level, it is commonly expressed as a percentage of the estimate ± and denoted as (d). it is the
range within which the results may vary and still remain acceptable. This research adopted a
level of precision of ±5% which is largely accepted if the prevalence is between 10% and 90%
(Naing et al., 2006, Kothari, 2004 & Israel,1992).
Confidence level or reliability is expected time in percentage that the actual value will fall within
the specified level of precision, it is the likelihood that the answer will be within the given range
(Kothari, 2004). Confidence level is based on ideas encompassed under the central limit theorem
where after repeated sampling the sample obtained is equal to the true population value (Israel,
1992). The research applies a confidence level of 95%, this mean that 95 samples out of 100 will
have a true representation of the population within the specified precision range. Israel (1992)
refers to degree of variability as “the distribution of the attributes in the population”; a
128
population with less variable implying it is more homogeneous requires a small sample than a
population that is heterogeneous (Israel, 1992).
A sample of 12 universities (6 public and 6 private) was selected out of the 40 public and private
chartered Universities as per the CUE (2016) Universities authorized to operate in Kenya was
used in this study. Accredited Universities enjoy autonomous in their operations and
management, this informed the reason for selecting the accredited Universities. The sample was
stratified based on age to obtain representative from different age and purposive sampling was
used to select the 12 universities, this was viewed an acceptable representation of the entire
population taking into account a third sample representation is considered as the minimum
representation of a sample size for statistical analysis (Mugenda,2008; Cooper and
Schinderler,2011). The unit of analysis in each universities were Deans, Directors, Chairpersons
of Department (CODs) and the Heads of Departments a total of 545 from the 12 Universities.
The Deans, Director, CoDs and HoDS were purposively sampled since they are heads and
managers of various units in the University placing them at an informed position in matters of
University operations. They are also members of University Senate and its committees such as
the departmental and faculty/School boards which place them at an informed position to evaluate
the University performance in regard to leadership, resource and resource mobilization; people
management; Partnership and collaboration; policies and strategies; internationalization and level
of service delivery.
Though in literature there are other formulas used for sampling, Cochran’s formula and
Yamane’s formula are the most widely used. The study used Yamane (1967) simplified formula,
formula 3.1 to calculate the sample size
Formula 3.1: Simplified Yamane Formula
𝑛 =𝑁
1 + 𝑁 ∗ (𝑒)2
Where n is the sample size, N is the population size and e the level of precision. The equalization
assumed 95% confidence level and p = 0.5.

129
According to Barlett et al. (2001), 0.05 or 0.01 are the alpha level mostly used in the educational
research studies however an alpha value of 0.05 is acceptable for most of the research. They
further argue that 5% margin of error is acceptable for categorical data, while 3% margin of error
is acceptable for continuous data.
Assuming 95% confidence level and p = 0.5 where N= 545 with ±5% precision then we get the
sample size as follows;
n = 545 = 230.68 ≈ 231
1 + 545 * (0.05)2
The calculated sample size is usually with an assumption that there will be no non-response and
the desired precision will be achieved. To mitigate the non-response, Naing et al (2006)
recommended oversampling by 10% to 20% of the sample size number to accommodate for any
non-response or missing data. Similarly, Israel (1992) says that most of the time researchers add
10% to the sample to accommodate the respondent that the researcher is unable to get, he further
notes that nonresponse is compensated by increasing the sample size by 30%. Taking into
account Naing et al (2006) & Israel (1992) and the pilot study response rate the sample size was
increased with 20% from the desired level of confidence and precision giving a sample size of
277 to compensate the nonresponse. According to Israel (1992) a sample size in the range of
200-500 is appropriate for the various analyses such as multiple regressions analysis, analysis of
covariance or any other detailed analysis, in this regard the sample of 277 was found to be an
adequate sample size to access the drivers of performance excellence in universities in Kenya
under this study. The allocation of the sample to the twelve (12) different Universities was done
proportionately as per appendix III.
Data Collection and Data Collection Instrument
Data collection allows the researcher to collect data at hand while dealing with any real life
problem. Several methods of data collections can be applied depending on the resources
available and time. The method of data collections differs depending on the type of the data to be
collected. There are two types of data; primary and secondary data. Primary data is the data that
is original and is collected afresh while secondary data is the existing data already collected and
analyzed by somebody else (Kothari, 2004).
130
According to Mugenda and Mugenda (2008), questionnaires, interview schedules, observational
forms and standardized tests are the most commonly used instrument in social sciences for data
collection. Primary data were collected through the use of self-administered semi-structured
questionnaire that captured all the variable of the study (Appendix 1) developed by the
researcher. Dawson (2009) describe questionnaire as a list of questions that assist researcher in
gathering the intended information. The use of questionnaire is less costly and reliable even
when population is a large (Kothari, 2006). To gather the primary data the questionnaires were
administered to the Deans/Directors and CoDs/ HoDs who were the main respondent in this
study. The questionnaire had both open - ended and close - ended questions; the closed-ended
questions were on a five point Likert scales ranging from strongly disagree to strongly agree
(Dawson, 2009). Likert questionnaires is the most widely used approach in survey research, in
likert scale the respondent indicate the level of their agreement or disagreement on scale thus
capturing the intensity of their feeling regarding a certain statement (Norman, 2010)
Secondary data is data that is readily available already collected and recorded and can be
gathered from various sources including organization annual reports, books, periodicals,
databases, official statistics ( Zikmund, 2003 & Hox and Boije, 2005). More secondary data on
drivers of performance excellence in universities in Kenya was obtained through explorative case
studies of sampled leading universities globally. This involved data from their websites, annual
reports, review of existing published literature from textbooks, journal articles and any other
form of validated recorded information (Cooper & Schindler, 2011). The basis for identifying the
drivers for performance excellence was informed by the literature review, theories, excellence
models and review of drivers of performance excellence for leading Universities globally and
research from other similar previous studies (Salmi,2009; McCormarck et al. 2013; Wang et al.,
2013; Altbach,2004;Ngok & Guo, 2008). This consequently resulted in identification of the
following drivers; leadership, people management, resource, partnership and collaboration,
policy and strategy, internationalization and processes, product and services.
131
Pilot Study
A pilot test is defined as “A small scale study conducted to test the reliability of a data collection
tool” (Peersman, 2014). According to Cooper & Schindler (2011) a pilot test is usually
undertaken to identify areas of weaknesses in the design and instrumentation and to provide
proxy data for selection of a probability sample. They further note that pilot testing assist the
researcher to adjust his questionnaire based on the pretest respondents. Similarly, Dawson (2009)
notes that a pilot study is undertaken to assist the researcher establish the validity and reliability
of the measurement tool. Based on the sample size, 28 questionnaires which was approximately
10% of 277 were used for pilot testing to test the validity and reliability. DeKUT and CUEA
were used to conduct the pilot test; the Universities were not used during the main study. The
pilot study contributed to the formulation of the final questionnaire through incorporating the
finding and suggestion which was used in the study as well as assurance of the reliability
(Cooper & Schindler, 2011). The piloting enabled the ascertaining the validity and reliability of
the instrument.
3.8.1 Testing of Reliability
Kimberlin & Winterstein (2008) notes that, reliability and validity are critical key indicators of
the quality of any research measuring instrument. Kimberlin & Winterstein emphasize that, for
researcher to minimize error in measuring process the validation of measuring instrument during
the development should be undertaken. Reliability is defined by Joppe (2000) as the degree to
which results are consistent over time and they are an accurate representation of the total
population. We refer to the research instrument as reliable if similar result can be reproduced
using the same methodology (Golafshani, 2003; Kimberlin & Winterstein,2008 ). It is concerned
with consistency of a test, observation, survey and other measuring instrument (Heffner,2004).
As described by classical test theory score obtained by measuring instrument comprise of both
the “true” score that one expect to obtain if the measurement was precise and the “error” that
occur during the measurement.

132
The process of validating the measuring instrument focuses on minimizing the error. The source
of errors can be identified through conducting a pilot test and refining the instrument to minimize
the error (Kimberlin & Winterstein, 2008). There are three types of reliability; Test-retest
reliability or Stability reliability which determine whether measures administered at different
period in time to the same individual deliver the same results. Equivalence reliability which
addresses whether different indicators give the same results using the same instrument and the
representative reliability addresses whether a measure give the same results in different sub-
population.
Cronbach’s alpha was used to test the reliability of the questionnaire in this study, it is a function
of the average inter-correlations of items and the number of items in the scale, the reliability
coefficient ranges from 0.00 to 1.00, the higher the alpha the higher the reliability level
(Kimberlin & Winterstein, 2008). The acceptable alpha as a rule of thumb is 0.70 or above (Hair
et al., 1998). However, the alpha may vary for different studies, with cronbach’s alpha of as low
as 0.50 been considered acceptable (Kipkebut, 2010). During the pilot the alpha for leadership
was 0.940, people management was 0.832, resources was 0.929, partnership and collaboration
was 0.949, internationalization was 0.923, policy and strategy was 0.822, processes, product and
services was 0.853 and performance excellence was 0.667. The result show that the pilot
questionnaires gave a Cronbach’s alpha coefficient ranging from 0.667 to 0.949 implying the
instrument was reliable since it was above 0.5 which is considered acceptable (Kipkebut, 2010).
The questionnaire was refined based on the responses from the pilot before subjecting the tool to
the main study. The revised questionnaire used to collected data is included as appendix 1.
3.8.2 Test for Validity
Validity as described by Joppe (2000), determines whether the research instrument measures
what it is intended to measure and how accurate they are. It is the extent to which an instrument
measures what it is purported to measures (Kimberlin & Winterstein, 2008). The degree to which
the results obtained after the data is analyzed give a full representation of the phenomenon under
study (Mugenda & Mugenda, 2008 ). There are four types of validity; content validity, construct
validity and Criterion related validity; concurrent validity and predictive validity (Kimberlin &
133
Winterstein, 2008; Golafshani, 2003). In this research, two validity test were taken into account
through the pilot test; content validity and construct validity.
The content validity is a measure of extent to which the collected data using particular
instruments provide adequate coverage of areas under study (Kothari, 2004). The study used
content validity to test the accuracy of data collection instrument. Content validity is assessed
through use of experts in the field of the study. The instrument of the study is subjected to this
expert who are able to assess and advice if the instrument represent the concept. Validity
according to Gay (1992), is established through expert judgment, the questionnaire was
developed in close consultation and engagement with the supervisor and expert. A judgmental
procedure of assessing whether a tool is likely to provide contents valid data is to request opinion
of expert to review and give their recommendation on the content (Mugenda, 2008). The content
validity was achieved through subjecting the draft questionnaire to the two Deans and one CoDs
and in close consultation with the supervisors who are all expert in the area of study. This
ensured the questions in the questionnaire are relevant, understandable and address the construct
of the study.
Construct validity is an analysis of the extent to which obtained data from an instrument
meaningfully and accurately reflects or represent a theoretical concept (Mugenda & Mugenda,
2008). In measuring construct validity both the theory and the measuring instruments being used
are taken into account. (Cooper & Schindler, 2008). The construct validity described by
Kimberlin & Winterstein (2008) as a judgment based on other studies evidence using same
measurement, this was ensured through the pilot test.
Data Analysis and Presentation of Results
The data gathered through the questionnaires was verified, cleaned and coded to facilitate it entry
and analysis through the SPSS then analysed using statistical package for social sciences (SPSS
version, 23) which is commonly used due to its capability of analyzing quantitative data. The
qualitative data were analysed using descriptive statistics. Descriptive statistic including the
mean and standard deviation were used to determine the level of agreement or disagreement with
134
the various statements for each variable (Mugenda, 2011). The descriptive data analysis was for
all the variables were presented inform of percentages, frequency tables and graphs. The means
and standard deviation was used to analyse the profile of the respondents and also presented
inform of frequencies and distribution tables.
The reliability was measured using the Cronbach’s Alpha (α), KMO was used to measure
variation between dependent and independent variables. Factor Analysis was further done to
guide in identifying the key factors affecting performance excellence in the Universities. Various
statistical tests were undertaken to establish if there existed any relationship between the
dependent and independent variables. The F-statistics test was also undertaken to test the
significance. The relationship between the various variable was measured through inferential
statistical analysis using Pearson correlation coefficient, bivariate regression analysis and
multiple regression analysis.
Cronbach’s alpha was used to measure reliability, the alpha coefficient ranges between 0 and 1
(Kipkebut, 2010). The cronbach’s alpha for all the variable were all above 0.60 and hence the
questionnaire was considered reliable.
3.9.1 Kaiser-Meyer-Olkin and Bartlett’s test of Sphericity
Kaiser-Meyer-Olkin Measure of Sampling Adequacy (KMO) and Bartlett’s test of Sphericity
were undertaken before the factor analysis to establish if there is any redundancy between the
variables. They were used in this context to measure the appropriateness of factor analysis. KMO
varies between 0 and 1 (0 < KMO < 1) when KMO >0.5, the sample is termed adequate and
factor analysis can be undertaken (Tabachnick & Fidell, 2014). Barlett’s Test of Sphericity was
used to test the null hypothesis that the correlation matrix has an identity matrix to determine
whether to proceed to factor analysis. Taking 95% level of significance α = 0.05, with P-value
(sig) <0.05 the factor analysis is valid. P< α therefore reject the H0 concluding that there may be
significant relationship between the variable. (Tabachnick & Fidell, 2014).
135
3.9.2 Factor Analysis
Factor analysis was used to assist reduce the factors that are not significance and establish the
construct validity which is a technique that is widely known and accepted for data reduction.
Factor analysis is a data reduction method that uses correlations between the data variables, the
assumption in factor analysis is that, there are some underlying factors that explains the
correlations or inter-relationships among observed variables. It is used to identify which
variables in a set forms a coherent subset that are independent of one another. (Chatfield
&Collins, 1992; Tabachnick & Fidell,2014). It re-group the variables into a limited set of
clusters on the basis of a shared variance, thus isolating constructs and concepts. Factor analysis
helps in summarizing data to facilitate interpretation and understanding of relationships and
pattern in an easier way (Yong & Pearce, 2013). It uses mathematical procedures to simply
interrelate measures to identify a specific pattern in a set of variables (Child, 2006). Factor
analysis places variable into meaningful categories, thus helping to reduce the numbers and focus
on the key factors for easier interpretation and saving on time (Yong & Pearce, 2013). There are
two types of factor analysis techniques; Exploratory Factor Analysis (EFA) and Confirmatory
Factor Analysis (CFA). EFA is the first step in building a fresh metric, it involve grouping
together variable that are correlated (Tabachnick & Fidell, 2014 and Yong & Pearce, 2013).
Principal Component Analysis (PCA) is the best practice recommended for exploratory factor
analysis which is usually the default (Costello& Osborne, 2005).
To ensure that the data being subjected to factor analysis is strong, communalities for all the
variables were generated before factor analysis. Tabachnick & Fidell (2014) describes
communality of a variable as the variance accounted for by the factor, it is the sum of the
squared loading for a variable across a factors. “Strong data” in factor analysis means uniformly
high communalities without cross loadings, plus several variables loading strongly on each factor
(Costello & Osborne, 2005). Costello & Osborne (2005) observes that communalities are
considered to be “high” if they are all 0.8 or greater which he however notes is not easy to
achieve in real data. In social sciences Costello & Osborne (2005) observe there is a low to
moderate communalities of 0.40 to 0.70, he further note that if an item has low communality
below 0.4 it suggest they can’t be related to other items or an additional factor should be

136
explored. PCA assumes that all Communalities before extraction are 1, this implies the
proportion of the variance explained by the underlying factor is one, during extraction some of
the factors are dropped resulting to loss of some information, the variance explained by each
factor is what is retained as communality after extraction (Field, 2005).
Principal Component Analysis (PCA) with SPSS was undertaken after the communality.
Principal component analysis is useful while one wishes to reduce the number of variables
without distorting their meaning (Tabachnick & Fidel 2014). Constantin (2014) observes that
PCA is a useful tool for dimension reduction and compression, in PCA the resulted factors are
orthogonal and every factor explains a large part of the variation given by the variables that
satisfy a certain condition he asserts that, through the use of factor analysis the dimensions of
analysis are reduced to a smaller number of factors that are not correlated. PCA using varimax
and orthogonal rotation was applied for factor extraction. The rotation simplifies the factors by
maximizing high correlation between factors and variable and also to minimize the one that are
low. Varimax is one method of rotation which is a variance maximizing procedure, through
varimax rotation the variance of the factor loading is maximized where by those with higher
loading are made higher and those with low loading lower (Tabachnick & Fidel 2014 ). In PCA
the number of component extracted is equal to the number of observed variables in the analysis,
with the first component accounting for the highest amount of variance followed by the second
and finally the last having the least variance.
As rule of Thumb, Tabachnick and Fidell (2014) cite variable with minimum loading of 0.32,
with the greater the loading the better the variable as a measure of the factor. Another rule of
thumb by Hair et al (1998) categorized the loading as ±0.30 as minimum, ±0.40 as important and
±0.50 practically significant. Comrey and Lee (1992) cited by Tabachnick and Fidell (2014) as a
rule of thumb classify factor loading above 0.71 which is 50% overlapping variance are as
excellent, 0.63 (40% overlapping variance are considered to be very good, 0.55 ( 30%
overlapping variance) good, 0.45 ( 20% overlapping variance) fair and 0.32 (10% overlaping
variance) poor, he however observe the loading cut off selection is usually done based on the
researcher preference.. Tabachnick and Fidell (2014) classify a component with a factor loading

137
of 0.32 as good for minimum loading after orthogonal rotation with the higher the load the more
the variable is an independent measure of the factor. A “crossloading” occur when an item loads
on two or more factors, Costello and Osborne (2005) recommended dropping of the crossloading
items if there are other adequate to strong loader (0.5 and above) on each factor.
There are a number of rules of extraction and approaches in determining the number of factors to
be retained after undertaking factor analysis; Kaiser,s (eigenvalue >1 rule) criteria(Kaiser, 1960),
Scree test (Cattell, 1966), parallel analysis and the cumulative percent of variance extracted
(Williams et al., 2010). According to Williams et al., (2010), Kaiser,s (eigenvalue >1 rule)
criteria also known as eigenvalue-one criterion is one of the most popular. According to
eigenvalue-one criterion, only the variable with eigenvalue higher than 1 will be retained in the
model every component explain a certain percent of variance with the 1st component usually
having the greatest eigenvalues (Contantin, 2014). Pett et al, (2003) cited by Williams et al.,
2010 observes that there are no fixed threshold for cumulative percentages with different
suggestion for different disciplines, he note that in natural sciences factors should be stopped
when at least 95% of the variance is explained, however in humanities the variance explained
can be as low as 50-60%.
Field (2005) argue that if the eigenvalue over 1 and the scree plot suggest you retain the same
number of factors then one can proceed with the analysis, he however note that if the two criteria
gives different results communalities should be examined to decide on the method to use. Scree
plot could also be used when eigenvalue condition is not applicable, this is done by re-doing the
analysis while specifying the number of factors to extract. Through the use of the Scree plot the
significant factors are “disposed like a cliff, having a big slope while the trivial factors are
disposed at the base of the cliff” (Constantin, 2010). According to Williams et al, (2010)
multiple extraction techniques which implies using different extraction method is recommended
for factor extraction are recommended for manuscript to be accepted for publication. This study
suppressed factor loading at 0.6, and extracted factor for component with eigenvalue >1,
communality above 0.4 and KMO > 0.5, cronbach’s alpha > 0.6.
138
3.9.3 Correlation analysis
The correlation coefficient statistics ranges from -1 to +1, which is refered as correlation
coefficient (r) which shows the relationship among the independent variables and dependent
variables. The bigger the coefficient,the stronger the correlation between the two variables. A
+ve coefficient shows a positive relationship and as the one variable increases the other increases
while a negative coefficient indicate a negative relationship and as one variable increase the
other decreases. Correlations values that not close to -1 or 1 is an indicator that factors are
sufficiently different measures of separate variables, it is also an indication that variables are not
autocorrelated (Farndale, Hope-Hailey & Killiher, 2010). Absence of autocorrelation allows the
study to utilize all the variables (Farndale et al., 2010).
Preliminary Test
To prevent getting biased results, a number of tests are usually undertaken before the data
analysis to establish it validity this include test for outlier, test of linearity, test for normality, test
for multicollinearity, test of independence, and test of homoscedasticity. According to Ghasemi
& Zahediasl (2012) statistical errors are common within scientific literature; they note that most
of the statistical procedures including regressions, ANOVA, correlation and t tests are based on
the assumption that the population from which the sample is drawn is normally distributed. They
further argue that, researchers stand a chance of drawing accurate and reliable conclusion if the
normality and other assumption are not compromised. In this study the following test were
undertaken: test of Normality, test of linearity, test of independence and test of multicolleneality.
Normality can be assessed using graphical or visual method or statistically through significance
test. The visual method is through the reader visually judging the distribution themselves, this is
done through frequency distribution (histogram), Q-Q (quantile-quantile plot) probability plots
and P-P plot (probability-probability plot), stem-and-leaf and box plot. A second method of
assessing normality is the statistical tests which are supplementary to the graphical assessment
this include; Shapiro-Wilk test, Kolmogorov-Smirnov (K-S) test, W/S test, Lilliefors corrected
K-S test, Cramer-von Mises test, Jarque-Bera test and D’Agostino-Pearson omnibus test. K-S
and Shapiro-Wilk tests can be conducted using SSPSS and they are the most commonly used
139
normality test. According to Ghasemi & Zahediasl (2012) it is preferable that normality be
assessed both visually and through Normality tests. This study used Visual method, Q-Q plot and
statistical test, Kolmogorov-Smirnov (K-S) test to assess the normality (Razali & Wah, 2011,
Ghasemi & Zahediasl, 2012
Linearity test in regression model is used to determine whether or not the relationship between
independent variables and dependent variables is linear. There should be a linear relationship
between independent and dependent variable for good research (Tabachnick & Fidell, 2014).
Linearity was determined through assessing correlation between the variables. The test of
independence was undertaken using Durbin-Watson (d) statistic. Durbin-Watson d statistic tests
the presence of autocorrelation. Durbin-Watson statistics ranges from 0 to 4, with a value near 2
indicating non-autocorrelation and a value near 0 indicating positive autocorrelation and a value
towards 4 indicating negative auto-correlation.
Multicollinearity occur when more than two independent variables are moderately or highly
correlated, when multicollinearity occurs it can have major effect on multiple regression making
the regression coefficient to erratically change whenever there are small changes in the sample
(Cooper and Schindler, 2006 ). According to Adeboye et al.(2014) Multicollinearity is a
problem that arise out of violation of the assumption that explanatory variables are leanearly
independent, they further observe that though multicollinearity is almost presence, the real issue
is determining the degree at which it becomes “harmful”. In this study the presence of
Multicollinearity among the variables was tested using tolerance levels and Variance Inflation
Factor (VIF) statistics of predictor variables. Tolerance level is calculated by regressing
independent variable against the remaining independent variables, high levels of tolerance are
more desirable by researcher since low level of tolerance is an indicator of high level of
multicollinearity. VIF is the reciprocal of the tolerance with researcher preferring lower level of
VIF, higher level of VIF interferes with multiple regressions (Adeboye et al.,2014). As observed
by Hair et al (1998), Lower tolerance values and higher VIF values is and indicator of
multicollinearity.
140
Ethical Consideration
The researcher observed key ethical research principles to protect the reputation of the institution
and the respondent’s rights. Firstly the researcher adhered to the research requirement by seeking
research permit from National Commission for Science, Technology and Innovation (NACOSTI)
as part of the approval of the study and from the Vice Chancellor of the respective Universities
which were involved in this research. Secondly, the principles of research ethic were adhered to
including the privacy of respondents; confidentiality and anonymity by not requiring the
respondent disclose their identity. The researcher also ensured there was voluntary participation
through allowing the respondent to participate at free will. The right to access of information was
also adhered to by making a commitment to provide such information to the institutions which
were interested with the same.
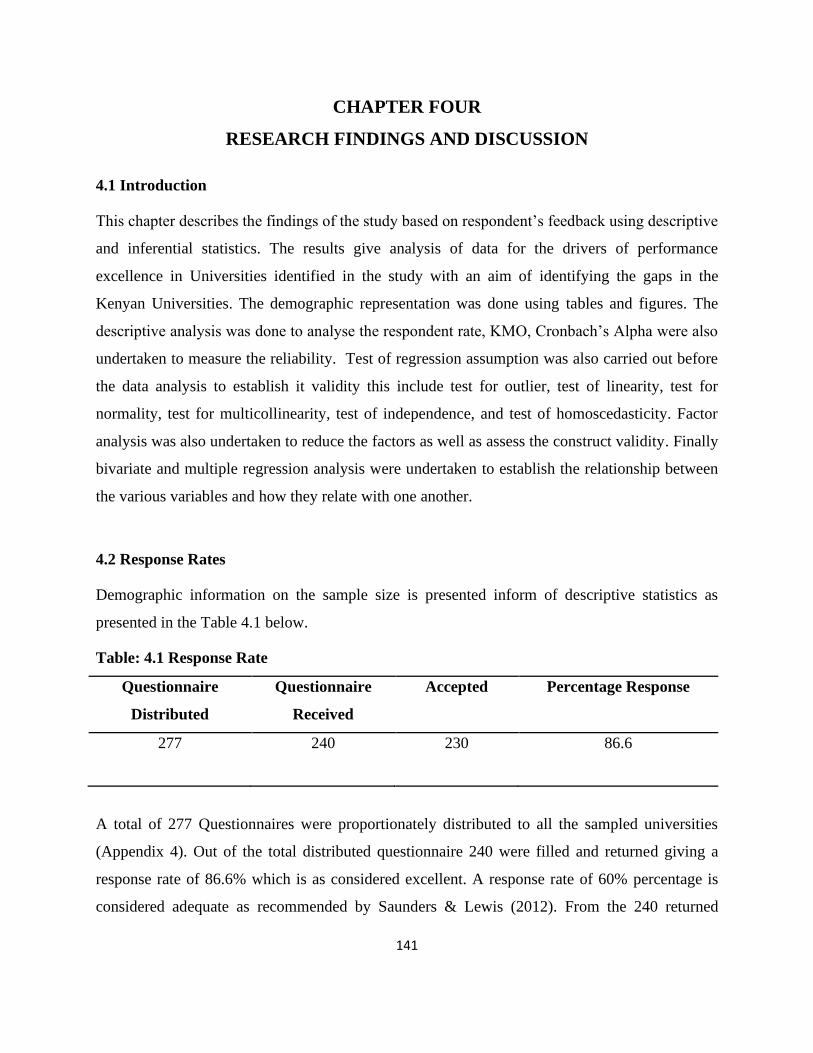
141
CHAPTER FOUR
RESEARCH FINDINGS AND DISCUSSION
4.1 Introduction
This chapter describes the findings of the study based on respondent’s feedback using descriptive
and inferential statistics. The results give analysis of data for the drivers of performance
excellence in Universities identified in the study with an aim of identifying the gaps in the
Kenyan Universities. The demographic representation was done using tables and figures. The
descriptive analysis was done to analyse the respondent rate, KMO, Cronbach’s Alpha were also
undertaken to measure the reliability. Test of regression assumption was also carried out before
the data analysis to establish it validity this include test for outlier, test of linearity, test for
normality, test for multicollinearity, test of independence, and test of homoscedasticity. Factor
analysis was also undertaken to reduce the factors as well as assess the construct validity. Finally
bivariate and multiple regression analysis were undertaken to establish the relationship between
the various variables and how they relate with one another.
4.2 Response Rates
Demographic information on the sample size is presented inform of descriptive statistics as
presented in the Table 4.1 below.
Table: 4.1 Response Rate
Questionnaire
Distributed
Questionnaire
Received
Accepted Percentage Response
277 240 230 86.6
A total of 277 Questionnaires were proportionately distributed to all the sampled universities
(Appendix 4). Out of the total distributed questionnaire 240 were filled and returned giving a
response rate of 86.6% which is as considered excellent. A response rate of 60% percentage is
considered adequate as recommended by Saunders & Lewis (2012). From the 240 returned
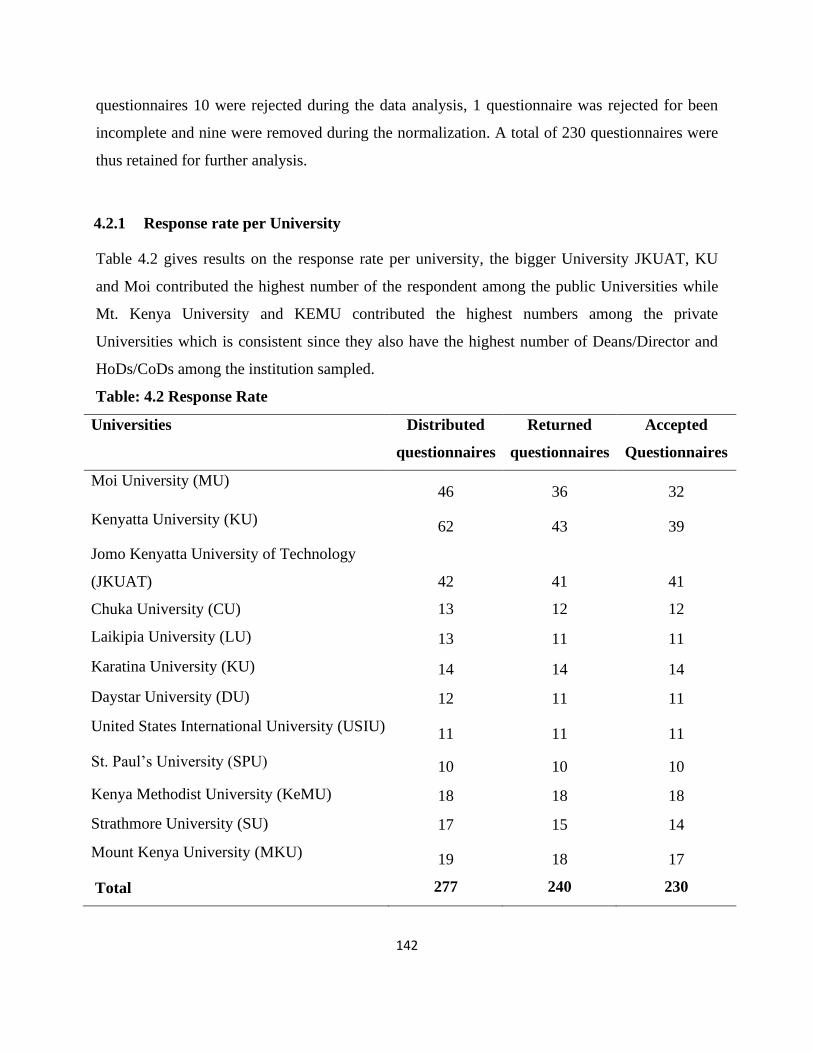
142
questionnaires 10 were rejected during the data analysis, 1 questionnaire was rejected for been
incomplete and nine were removed during the normalization. A total of 230 questionnaires were
thus retained for further analysis.
4.2.1 Response rate per University
Table 4.2 gives results on the response rate per university, the bigger University JKUAT, KU
and Moi contributed the highest number of the respondent among the public Universities while
Mt. Kenya University and KEMU contributed the highest numbers among the private
Universities which is consistent since they also have the highest number of Deans/Director and
HoDs/CoDs among the institution sampled.
Table: 4.2 Response Rate
Universities Distributed
questionnaires
Returned
questionnaires
Accepted
Questionnaires
Moi University (MU) 46 36 32
Kenyatta University (KU) 62 43 39
Jomo Kenyatta University of Technology
(JKUAT) 42 41 41
Chuka University (CU) 13 12 12
Laikipia University (LU) 13 11 11
Karatina University (KU) 14 14 14
Daystar University (DU) 12 11 11
United States International University (USIU) 11 11 11
St. Paul’s University (SPU) 10 10 10
Kenya Methodist University (KeMU) 18 18 18
Strathmore University (SU) 17 15 14
Mount Kenya University (MKU) 19 18 17
Total 277 240 230
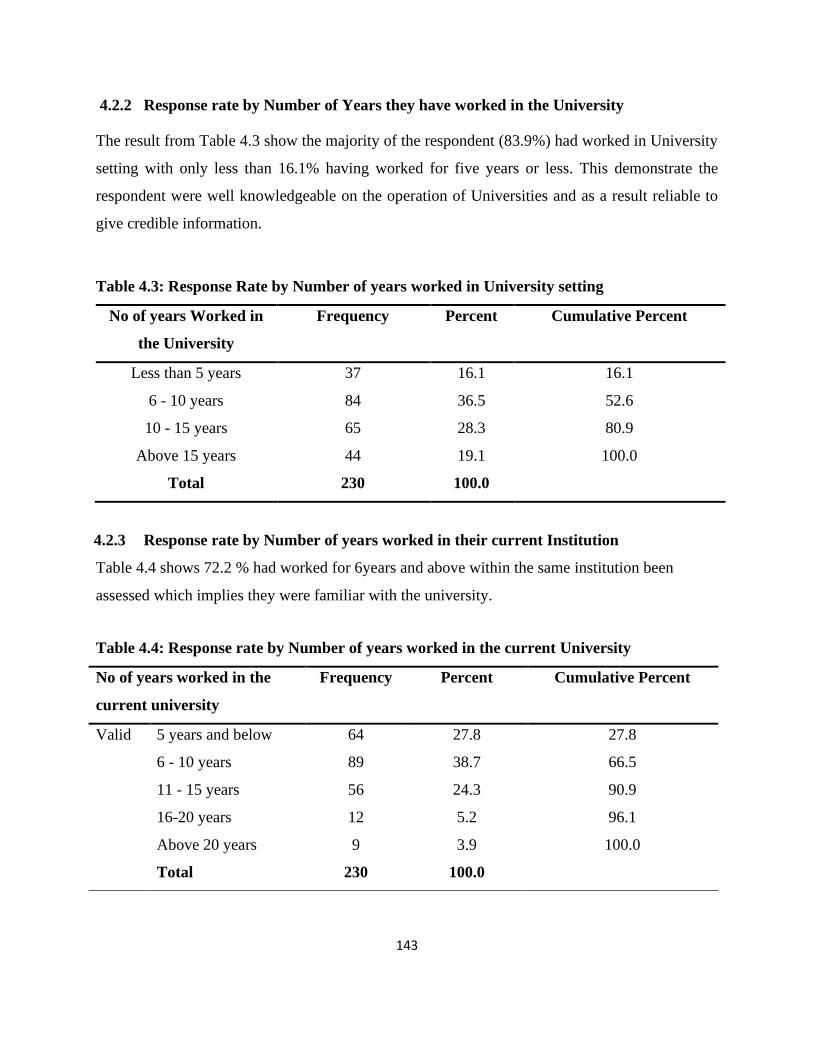
143
4.2.2 Response rate by Number of Years they have worked in the University
The result from Table 4.3 show the majority of the respondent (83.9%) had worked in University
setting with only less than 16.1% having worked for five years or less. This demonstrate the
respondent were well knowledgeable on the operation of Universities and as a result reliable to
give credible information.
Table 4.3: Response Rate by Number of years worked in University setting
No of years Worked in
the University
Frequency Percent Cumulative Percent
Less than 5 years 37 16.1 16.1
6 - 10 years 84 36.5 52.6
10 - 15 years 65 28.3 80.9
Above 15 years 44 19.1 100.0
Total 230 100.0
4.2.3 Response rate by Number of years worked in their current Institution
Table 4.4 shows 72.2 % had worked for 6years and above within the same institution been
assessed which implies they were familiar with the university.
Table 4.4: Response rate by Number of years worked in the current University
No of years worked in the
current university
Frequency Percent Cumulative Percent
Valid 5 years and below 64 27.8 27.8
6 - 10 years 89 38.7 66.5
11 - 15 years 56 24.3 90.9
16-20 years 12 5.2 96.1
Above 20 years 9 3.9 100.0
Total 230 100.0
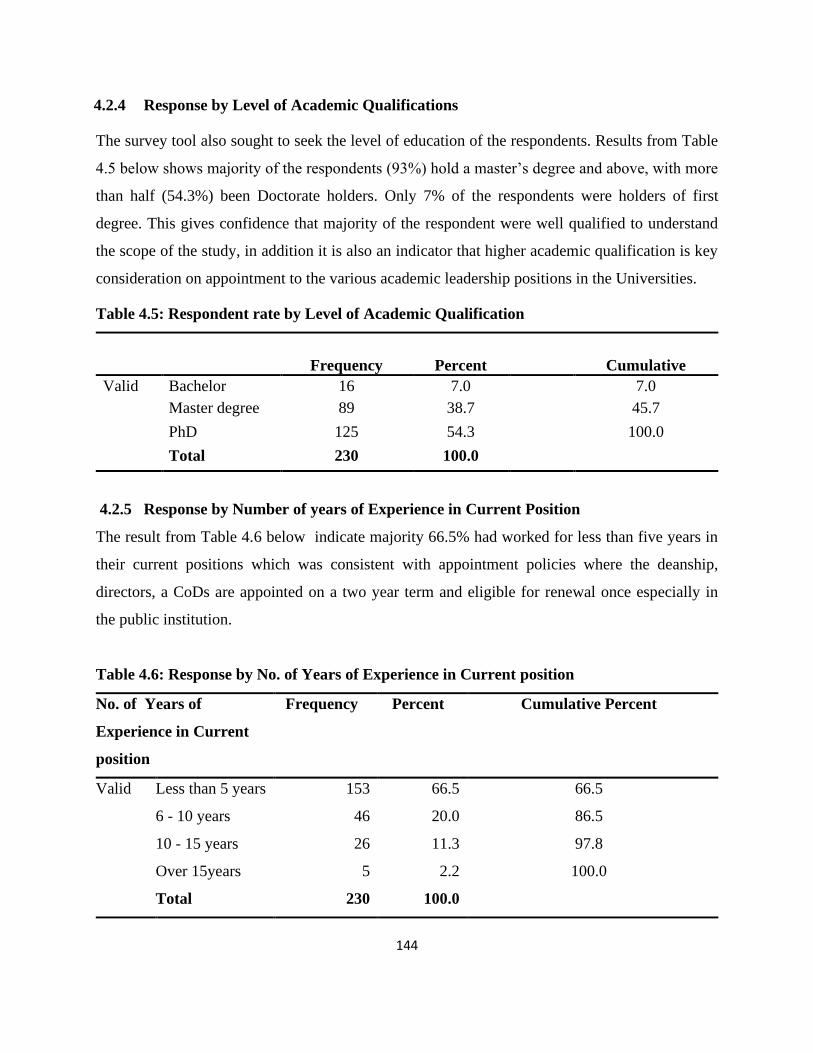
144
4.2.4 Response by Level of Academic Qualifications
The survey tool also sought to seek the level of education of the respondents. Results from Table
4.5 below shows majority of the respondents (93%) hold a master’s degree and above, with more
than half (54.3%) been Doctorate holders. Only 7% of the respondents were holders of first
degree. This gives confidence that majority of the respondent were well qualified to understand
the scope of the study, in addition it is also an indicator that higher academic qualification is key
consideration on appointment to the various academic leadership positions in the Universities.
Table 4.5: Respondent rate by Level of Academic Qualification
Frequency Percent Cumulative
Percent Valid Bachelor 16 7.0 7.0
Master degree 89 38.7 45.7
PhD 125 54.3 100.0
Total 230 100.0
4.2.5 Response by Number of years of Experience in Current Position
The result from Table 4.6 below indicate majority 66.5% had worked for less than five years in
their current positions which was consistent with appointment policies where the deanship,
directors, a CoDs are appointed on a two year term and eligible for renewal once especially in
the public institution.
Table 4.6: Response by No. of Years of Experience in Current position
No. of Years of
Experience in Current
position
Frequency Percent Cumulative Percent
Valid Less than 5 years 153 66.5 66.5
6 - 10 years 46 20.0 86.5
10 - 15 years 26 11.3 97.8
Over 15years 5 2.2 100.0
Total 230 100.0

145
4.3 Reliability Analysis of Variables
Reliability test was undertaken to ensure the instrument for measure can be used with
confidence. When an instrument is reliable it work well under variance conditions and time
giving consistent results (Cooper & Schindler, 2006). The result is presented in Table 4.7.
according to the results the reliability of the variables ranged from 0.721 on performance to as
high as 0.936 in the case of leadership. All the Cronbach’s Alpha are above 0.7, which is quite
acceptable.
Table 4.7: Reliability Test
Variable Variable Type No of Items Cronbach’s Alpha
Leadership
Independent (x1) 21 0.936
People
Management
Independent (x2)
14 0.844
Policy and Strategy
Independent (x3) 7 0.849
Resources Independent (x4) 21 0.824
Partnership and
Collaboration
Independent (x5) 10 0.852
Internationalization Independent (x6) 9 0.888
Processes, Product
and Services
Independent (x7) 14
14
0.905
Performance Dependent (y) 5 0.721
4.4 Descriptive Analysis of the Study Variables
This section gives the descriptive statistics for the study variables on driver of performance in
HEIs. The independent variable were Leadership, people management, policies and strategies,
resources, partnership and collaboration, internationalization and Processes, product and services
and performance excellence as the dependent variable.

146
4.4.1 Descriptive Analysis for Performance Excellence
The responded were asked to indicate to what extent they agreed or disagreed with the
statements in regard to their university Performance excellence using academic and
administrative parameters. The findings from the analysis are as per the Table 4.8.
Table 4.8 Descriptive analysis for Performance Excellence
Statement SA A N D SD Summary
Statistics
% % % % % Mean Std
PF1: The number of publications from
university staff has been increasing for
last seven years
30.4 53.5 14.8 0.9 0.4 1.87 .72
PF2: The number of programmes have
increased in the last seven years
50.0 45.7 3.0 1.3 0.0 1.56 .62
PF3: Student population has been on the
rise for last seven years
56.1 35.7 6.1 1.7 0.4 1.55 .73
PF4: The university revenue surplus has
been on the rise in the last seven years
20.0 30.0 32.6 11.3 6.1 2.53 1.12
PF5: The trend in Staff Turnover has
been on the rise in the last seven year
17.8 37.0 32.2 10.4 2.6 2.43 .99
The study sought to establish the performance of the Universities on academic and management
aspects, the results in Table 4.8 indicate that majority (53.5%) agreed that the number of
publication had increased over the last seven years, 30.4% strongly agreed with the statement,
while 14.8% were neutral, 0.9% disagreed and 0.4% strongly disagreed with the statement. The
results gave a total of 83.9% who strongly agreed or agreed that the University publication have
been increasing for the last seven years. The finding also indicates that 50% of the respondents
strongly agreed that the number of University programmes have been increasing for the last
seven years, 45.7% agreed with the statement; while 3% were neutral, 1.3% disagreed with the
statement. The student population was also viewed to had increased with majority (56.1%) of
the respondents strongly agreed that the students population had been on the rise for the last
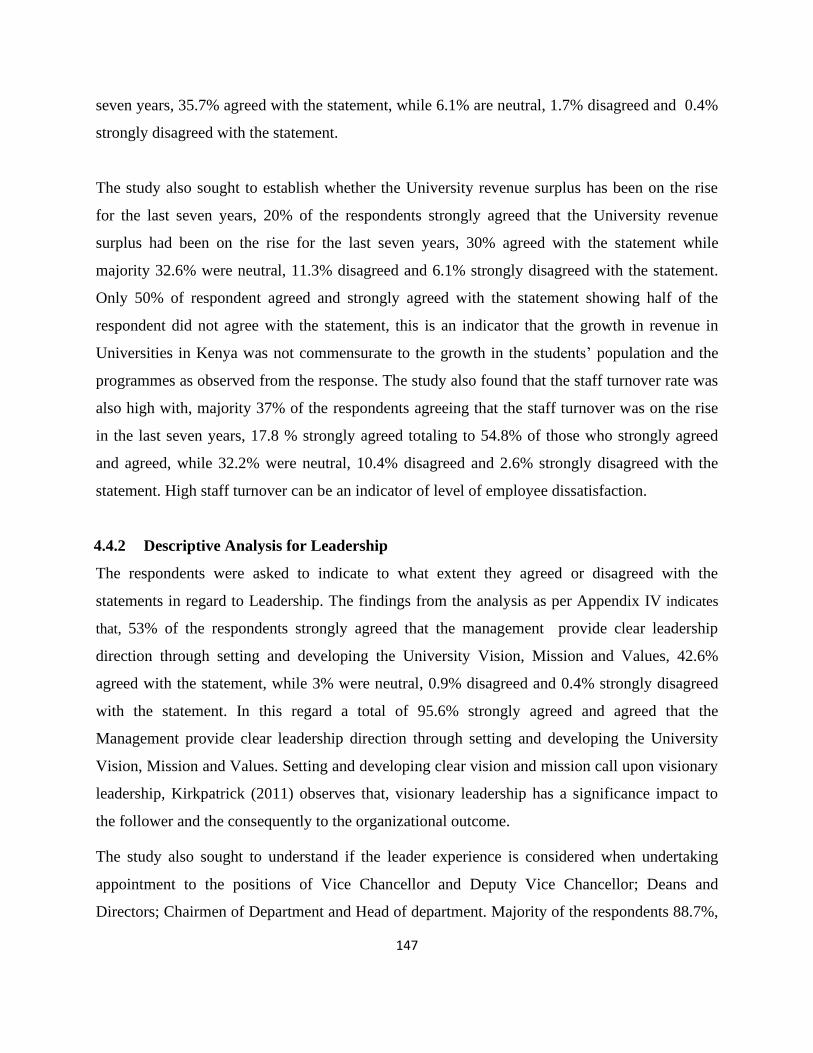
147
seven years, 35.7% agreed with the statement, while 6.1% are neutral, 1.7% disagreed and 0.4%
strongly disagreed with the statement.
The study also sought to establish whether the University revenue surplus has been on the rise
for the last seven years, 20% of the respondents strongly agreed that the University revenue
surplus had been on the rise for the last seven years, 30% agreed with the statement while
majority 32.6% were neutral, 11.3% disagreed and 6.1% strongly disagreed with the statement.
Only 50% of respondent agreed and strongly agreed with the statement showing half of the
respondent did not agree with the statement, this is an indicator that the growth in revenue in
Universities in Kenya was not commensurate to the growth in the students’ population and the
programmes as observed from the response. The study also found that the staff turnover rate was
also high with, majority 37% of the respondents agreeing that the staff turnover was on the rise
in the last seven years, 17.8 % strongly agreed totaling to 54.8% of those who strongly agreed
and agreed, while 32.2% were neutral, 10.4% disagreed and 2.6% strongly disagreed with the
statement. High staff turnover can be an indicator of level of employee dissatisfaction.
4.4.2 Descriptive Analysis for Leadership
The respondents were asked to indicate to what extent they agreed or disagreed with the
statements in regard to Leadership. The findings from the analysis as per Appendix IV indicates
that, 53% of the respondents strongly agreed that the management provide clear leadership
direction through setting and developing the University Vision, Mission and Values, 42.6%
agreed with the statement, while 3% were neutral, 0.9% disagreed and 0.4% strongly disagreed
with the statement. In this regard a total of 95.6% strongly agreed and agreed that the
Management provide clear leadership direction through setting and developing the University
Vision, Mission and Values. Setting and developing clear vision and mission call upon visionary
leadership, Kirkpatrick (2011) observes that, visionary leadership has a significance impact to
the follower and the consequently to the organizational outcome.
The study also sought to understand if the leader experience is considered when undertaking
appointment to the positions of Vice Chancellor and Deputy Vice Chancellor; Deans and
Directors; Chairmen of Department and Head of department. Majority of the respondents 88.7%,
148
85.6% and 80.9% respectively strongly agreed and agreed that experience is taken into
consideration on appointment to these positions. A high percentage of respondent’s (70.8%)
strongly agreed and agreed that the leaders’ at all level act as role model while a total of 29.2%
remained neutral disagreed or strongly disagreed. Majority of the respondents (80.4%) also felt
leaders promote a culture of excellence. In regard to effective communication to staff and
students, most of the respondent (81.8%) and (73%) respectively agree that the leaders
communicates effectively to staff and students. Although majority of the respondent (81.8%)
agreed that supervisors delegate duties to their subordinate only 65.6% agreed that subordinate
are empowered when duties are delegated to them, this could imply that duties are delegated but
there are some limitation when it comes to empowerment. A significant number (65.6%) felt that
the leaders provides required resources to execute the set targets. Majority of the respondent 90%
also agreed that the University abides to the CUE guidelines while only 10% remained neutral,
disagreed and strongly disagreed. A high percent (86.1%) agreed that council monitor university
performance on regular basis while 63.4% agree that faculties have freedom to manage
departmental resources.
Majority of the respondents (70.9%) also strongly agreed and agreed that the supervisor inspires
trust among the employees, while 22.6% are neutral, 4.8% disagreed and 1.7% strongly
disagreed with the statement. 63.9% agreed that coaching and mentoring of subordinate is
encourage in there institution. In involvement of staff and student in decision making 59.6% and
61.3% respectively strongly agreed and agreed that staff and students are involved in decision
making while 40.4% and 38.7% respectively remained neutral, disagreed or strongly disagreed.
The view on the involvement of the staff and students in decision making was fairly the same.
Most respondent, (73%) agreed leaders proactively identify changes that are required by the
University, further a significant percentage (76.9 %) agreed that the leaders are involved in day
to day monitoring of University processes. On average majority of the respondent (75.7%) were
satisfied with the leadership of their respective Universities.
149
4.4.3 Descriptive Analysis on People Management
The respondent were asked to indicate to what extent they agreed or disagreed with the various
statements in regard to people management. The findings from the analysis are as per appendix
V. The finding indicates that, most of the respondent (95.7%) strongly agreed and agreed that
high academic qualification is given a key consideration while recruiting Lecturers, while 3%
were neutral, only 1.3% disagreed with the statement. In this regard majority of the respondent
95.7% agreed that high academic qualification is given key consideration in the recruitment of
lecturers. The results also showed that only 4.3% of the respondents were neutral, disagreed or
strongly disagreed. A high percent, (87.8%) also agreed that their University attract highly
talented faculty members on the basis of merit with only a total of 12.2% of the respondents been
neutral, disagreed or strongly disagreed. A significance number, (66.5%) strongly agreed and
agreed that staff have an opportunity to undergo capacity development training, while 21.7%
were neutral, only 8.7% disagreed and 2.6% strongly disagreed with the statement. In this regard
majority of the respondent 66.5% strongly agreed and agreed that the university offer employee
equal chance to undertake training for capacity building.
The findings also indicated that 12.6% of the respond strongly agreed that the reward and
incentive system are competitive, 39.1% agreed with the statement, while 31.3% are neutral,
only 13% disagreed and 3.9% strongly disagreed with the statement. The results showed slightly
more than half of the respondents (51.7%) agreed that their University have competitive
remuneration and incentive system compared to other universities. The result also shows a
substantive number of respondents (47.7%) of the respondents were neutral, disagreed or
strongly disagreed with the statement. This is an indicator that the employees are not adequately
satisfied with their remunerations and incentives. The results also indicated that 4.8% of the
respond strongly agreed that the employee performance appraisal is linked to the reward system
implying you are compensated based on your performance, 34.9% agreed with the statement,
while 31.8% are neutral, 15.9 % disagreed and 12% strongly disagreed with the statement.
Majority of the respondent (58.2%) were neutral, disagreed and strongly disagreed that employee
performance appraisal system is linked to the reward system. A significant number of the
150
respondents (52.1%) strongly agreed and agreed that the employees are reprimanded for poor
performance. Slightly more than half of the respondents (53.5%) also agreed that the lecturers
have manageable workload to allow them balance between research and teaching. The result
also shows only 45.7% who strongly agreed and agreed that part-time lecturers are paid in time,
majority of the respondent 54.3% were neutral, disagreed or strongly disagreed with the
statement. This could imply that the payment of part-time lecturers is not done in time. A high
percentage of respondents (66.9%) agreed that the employee working environment is conducive
for all employees.
The researcher also sought to assess if employee are given feedback after conducting the
performance evaluation, most of the respondent (60.4%) were satisfied that this is actually done.
Majority of the respondent (74.3%) also indicated that the employee’s tasks are very clear and
well understood to them. The response in people management in both public and private
management was viewed to be relatively good with majority of the respondent (64.7%) agreed.
The survey however shows some level of dissatisfaction with performance appraisal which
majority feels it is not linked with reward system. Similarly slightly less than half of the
respondents were not satisfied with the payment of the part-timers. These results are pointer to
being consistent with Mbirithi (2013) results who undertook study with Dean of schools in
public Universities in Kenya also found out poor remunerations of the teaching staff was one of
the major challenges in the University management as it results to demolition of lecturers.
4.4.4 Descriptive Analysis for Resources
The responded were asked to indicate to what extent they agreed or disagreed with the various
statements in regard to University resources. The findings from the analysis are as per appendix
VI. The results indicates that, 13% of the respondents strongly agree that the University has
adequate staff to student ratio for all programs, 30.4% agree with the statement, while 20.9% are
neutral, 26.5% disagree and 9.1% strongly disagree with the statement. In this regard a total of
43.4% agree that the University has adequate staff to student ratio for all programs. The result
reveals that 57.8% of the respondent were either neutral, disagreed or strongly disagreed that the
University has adequate staff to student ratio. The results also show that 16.1% of the
151
respondents strongly agree that the University has adequate state of art equipment to support
teaching, 38.7% agree with the statement, while 13.5% are neutral, 24.3% disagree and 7.4%
strongly disagree with the statement. This shows that majority, (54.8%) agree that the University
has adequate state of the art equipment to support teachings. The results also show 45.2% were
neutral, disagreed or strongly disagreed with the statement.
When asked whether the University undertakes competitive fundraising initiatives, 10% strongly
agree with the statement, 33.9% agree with the statement, while 32.2% are neutral, 17.4%
disagree and 6.5% strongly disagree with the statement. In this regard a total of 43.9% agree that
the university undertakes competitive fundraising initiatives. The results also show 56.1% were
neutral, disagreed or strongly disagreed with the statement. The finding in Table 4.12 indicates
that, 7.8% of the respondents strongly agree that the is a lot of creativity and innovation in the
management of university resources, 40.9% agree with the statement, while 31.3% are neutral,
14.8% disagree and 4.8% strongly disagree with the statement. In this regard a total of 48.7%
agree that that creativity and innovation dominate the management of university resources. The
results also show 50.9% were neutral, disagreed or strongly disagreed with the statement.
4.4.5 Descriptive Analysis for Partnership and Collaboration
The responded were asked to indicate to what extent they agreed or disagreed with the various
statements in regard to partnership and collaboration. The findings from the analysis are as per
the Table 4.9. The finding in the above table indicates that, 37.8% of the respondents strongly
agreed that the University has established active local collaboration with other Universities,
43.5% agreed with the statement, while 14.3% are neutral, 3.9% disagreed and 0.4% strongly
disagreed with the statement. In this regard a total of 81.3% respondents agreed that the
University has established active local collaboration with other Universities. The study also
reveals that 75.6% strongly agreed and that the University had established active local
collaboration with industries. Further a total of 75.7% respondents strongly agreed and agreed
that the University had established active local collaboration with communities. The results also
show 90% of the respondents strongly agreed and agreed that the University has established
active international partnership and collaboration with other Universities. Through active

152
collaboration the universities are able to build synergies with other universities, industries and
community. This creates a platform for sharing of knowledge and new technologies.
Table 4.9 Descriptive Analysis for Partnership and Collaboration
SA A N D SD Summary
Statistic
% % % % % Mean Std
PC1: The University has established active
local partnership and collaboration with
other Universities
37.8 43.5 14.3 3.9 0.4 1.86 .84
PC2: The University has established active
local partnership and collaboration with
industries
34.3 41.3 18.3 5.2 0.9 1.97 .90
PC3: The University has established active
local partnership and collaboration with
communities
33.5 42.2 19.6 3.5 1.3 1.97 .89
PC4: The University has established active
international partnership and collaboration
with Universities
42.2 47.8 7.4 2.2 0.4 1.71 .73
PC5: The University has established active
international partnership and collaboration
with industries
29.1 36.5 25.2 7.8 1.3 2.16 .98
PC6: University focus more on partnership
and collaborations with other entity other
than competing.
20.0 44.8 26.5 6.5 1.7 2.25 .91
PC7: Partnership and collaboration has
contributed to the branding of the
University.
23.9 46.1 21.7 6.5 1.7 2.16 .92
PC8: University has made remarkable
contribution to the society trough partnership
and collaborations initiatives
22.6 51.7 18.3 5.7 1.7 2.12 .88
PC9: Teaching and research is enhanced
through collaboration and partnerships
18.3 57.8 17.8 5.2 0.9 2.13 .80
PC10: Students are easily attached in
relevant industries for their practical
experience
19.6 59.6 12.6 5.7 2.6 2.12 .88

153
The study also sought to establish if universities have active international partnership and
collaboration with industries most of the respondent (65.6%) strongly agreed and agreed with the
statement. A total of 64.8% of the respondents also strongly agreed and agreed that the
University focus more on partnership and collaboration with other entities other than competing
them. When two competing entities come together they are able to build synergy and achieve
greater results than when they separately pursue their goals. The study also indicates 70% of the
respondents strongly agreed and agreed that the partnership and collaboration has contributed
significantly to branding of the University. The results also showed a total of 74.3% respondents
strongly agreed and agreed that the University has made remarkable contribution to the society
through partnership and collaboration initiatives. According to the study most of the respondents
(76.1%) agreed that teaching and research is enhanced through partnership and collaboration.
The study also sought to understand if the students are easily attached in relevant industries for
practical experience. A total of 79.2% respondents agreed that students are easily attached in
relevant industries for their practical experience. The results also showed only 20.9% of
respondents were neutral, disagreed or strongly disagreed with the statement. Maintaining active
partnership and collaboration with industries creates opportunity for the universities to have their
student easily absorbed for attachments and other industrial experience raising the student
profile.
4.4.6 Descriptive Analysis for Internationalization
The responded were asked to indicate to what extent they agreed or disagreed with the various
statements in regard to internationalization. The findings from the analysis are as per the Table
4.10. The results in the above table indicates that, 29.1% of the respondents strongly agreed that
Internationalization is a key University agenda, 48.3% agreed with the statement, while 16.1%
are neutral, 6.1% disagreed and 0.4% strongly disagreed with the statement. In this regard the
majority total of 77.4% agreed that internationalization is a key University agenda. The results
also show 27.2% were neutral, disagreed or strongly disagreed with the statement. The findings
also indicate that, 23% of the respondents strongly agreed that the University has an active
students exchange programme, 47.4% agreed with the statement, while 20.9% are neutral, 8.5%
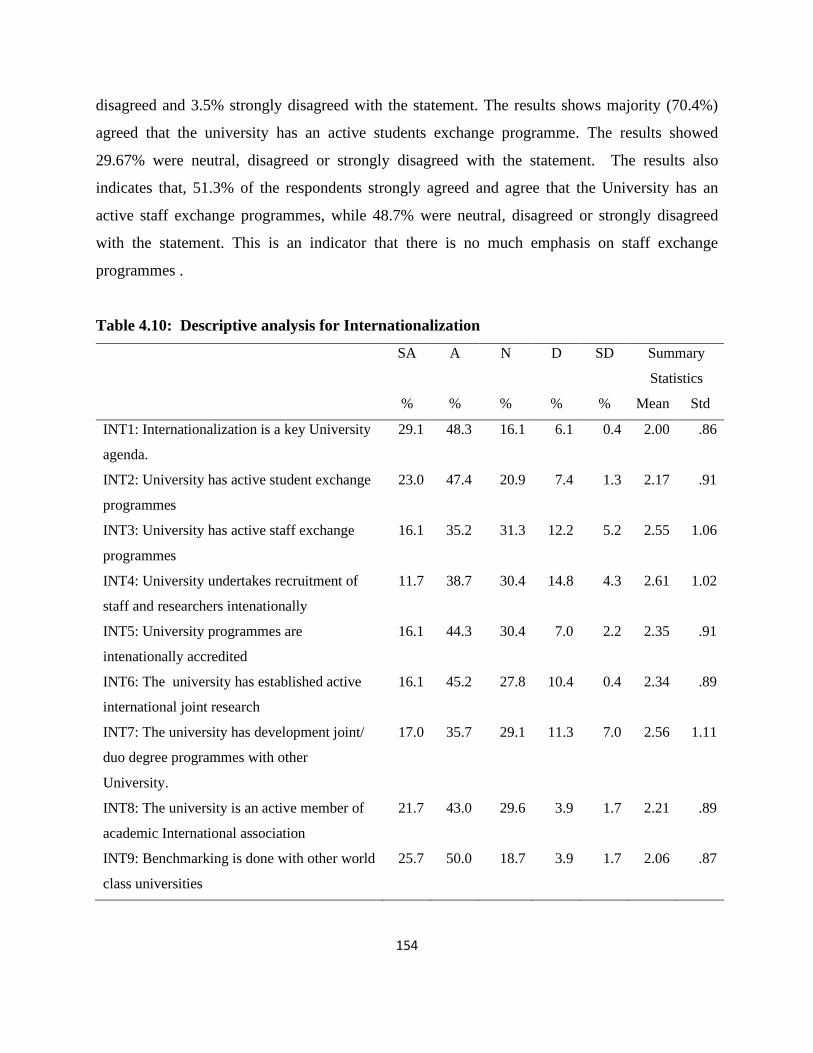
154
disagreed and 3.5% strongly disagreed with the statement. The results shows majority (70.4%)
agreed that the university has an active students exchange programme. The results showed
29.67% were neutral, disagreed or strongly disagreed with the statement. The results also
indicates that, 51.3% of the respondents strongly agreed and agree that the University has an
active staff exchange programmes, while 48.7% were neutral, disagreed or strongly disagreed
with the statement. This is an indicator that there is no much emphasis on staff exchange
programmes .
Table 4.10: Descriptive analysis for Internationalization
SA A N D SD Summary
Statistics
% % % % % Mean Std
INT1: Internationalization is a key University
agenda.
29.1 48.3 16.1 6.1 0.4 2.00 .86
INT2: University has active student exchange
programmes
23.0 47.4 20.9 7.4 1.3 2.17 .91
INT3: University has active staff exchange
programmes
16.1 35.2 31.3 12.2 5.2 2.55 1.06
INT4: University undertakes recruitment of
staff and researchers intenationally
11.7 38.7 30.4 14.8 4.3 2.61 1.02
INT5: University programmes are
intenationally accredited
16.1 44.3 30.4 7.0 2.2 2.35 .91
INT6: The university has established active
international joint research
16.1 45.2 27.8 10.4 0.4 2.34 .89
INT7: The university has development joint/
duo degree programmes with other
University.
17.0 35.7 29.1 11.3 7.0 2.56 1.11
INT8: The university is an active member of
academic International association
21.7 43.0 29.6 3.9 1.7 2.21 .89
INT9: Benchmarking is done with other world
class universities
25.7 50.0 18.7 3.9 1.7 2.06 .87
155
The results showed slightly more than half (51.3%) of the respondent agreed that the university
has an active students exchange programmes while 48.7% were neutral, disagreed or strongly
disagreed with the statement. This is an indicator that the student exchange programme are not
very active. The study sought to establish if the university recruit international staff and
researchers, 11.7% of the respondents strongly agreed that the University take initiative to
recruit international staff and researcher, 38.4 agreed with the statement, while 30.4% are
neutral, 14.8% disagreed and 4.3% strongly disagreed with the statement. The results give a total
of total of 50.4% were neutral, disagreed or strongly disagreed with the statement. This is a
pointer that recruitment of international staff and student for the purpose of enhancing our
programmes and sharing international experience is not highly emphasized, this consequently
denies the local universities the opportunity to learn from their competitors globally. The study
also indicates that, 16.1% of the respondents strongly agreed that the University programmes are
internationally accredited, 44.3% agreed with the statement, while 30.4% are neutral, 7%
disagreed and 2.2% strongly disagreed with the statement. The results showed majority of the
respondent 60.4% agreed that the university programmes are internationally accredited.
Though majority of the responded indicate their programmes are internationally accredited, this
is an area where all the universities should endeavor to achieve for all the programmes to
enhance their recognition globally and make it possible for student exchange. The study finding
also indicates that, 16.1% of the respondents strongly agree that the University joint international
research activities, 45.2% agree with the statement, while 27.8% are neutral, 10.4% disagree and
0.4% strongly disagree with the statement. The results give a total of total of 61.3% who agree
that the university have established active international joint research activities the result also
shows 38.6% were neutral, disagreed or strongly disagreed with the statement. The study also
revealed that, 52.7% of the respondents strongly agree or agree that the University joint degree
programme, while 29.1% are neutral, 11.3% disagree and 7% strongly disagree with the
statement. The results give a total of total of 47.4% who were neutral, disagreed or strongly
disagreed with the statement.

156
The study also sought to know if various university were active member of international
organization, 64.7 of the respondents strongly agreed and agreed with the statement, while
29.6% are neutral, 3.9% disagree and 1.7% strongly disagree with the statement. The finding
also shows that, 25.7% of the respondents strongly agree that the University undertake
benchmarking with other best world class Universities, 50% agree with the statement, while
18.7% are neutral, 3.9% disagree and 1.7% strongly disagree with the statement. Majority
(75.7%) strongly agree or agree that the university undertake benchmarking with other best
world class universities, the results also shows only 24.3% were neutral, disagreed or strongly
disagreed with the statement.
4.4.7 Descriptive analysis for Policies and Strategy
The responded were asked to indicate to what extent they agreed or disagreed with the various
statements in regard to University policies and strategies. The findings from the analysis are as
per the Table 4.11.
Table 4.11: Descriptive Analysis for Policies and Strategies
SA A N D SD Summary
Statistics % % % % % Mean Std
PS1: Policies and strategies are well supported
by appropriate policies, plans and
processes to support institution agenda
32.6 57.0 7.4 2.6 0.4 1.81 .71
PS2: Policies and strategies are aligned to
university vision and mission
42.6 48.7 7.0 1.7 0.0 1.68 .68
PS3: The implementation of strategic plan is
closely monitored by the University
management.
29.1 48.3 17.8 4.8 0.0 1.98 .81
PS4: All stakeholders of the university are
involved in strategy and policy
formulation.
17.8 49.1 22.2 10.0 0.9 2.27 .90
PS5: The policies and strategies are well
communicated to stakeholders.
11.7 55.7 23.5 8.3 0.9 2.31 .82
PS6: The s policies and strategie are formulated
based on available information and data
13.5 62.2 18.3 5.2 0.9 2.18 .76
PS7: The policies and strategies are regularly
monitored and reviewed
15.7 53.9 19.1 9.6 1.3 2.27 .89
157
The descriptive statistics on the policies and strategies as perceived by the respondents is as
described on Table 4.11. The results indicates 32.6% of the respondent strongly agreed that the
University strategies are well supported by appropriate policies, plans and processes to support
institution agenda, 57% agreed with the statement, while 7.4% are neutral, 2.6% disagreed and
0.4% strongly disagreed with the statement. In this regard a total of 89.6% agreed that the
University strategies are well supported by appropriate policies, plans and processes to support
the institutional agenda. The respondents were also asked whether the strategies and policies are
aligned to the University Vision and mission, Majority, (91.3%) agreed with the statement. This
reveals that the university strategies and policies are well aligned to the University mission and
vision. Majority of the respondents (77.4%) also agreed that the implementation of University
strategic plan is closely monitored by the management. A significance number of respondent
(66.9%) agreed that the University involve stakeholders in strategy and policy formulation. The
results also showed 33.1% were neutral, disagreed or strongly disagreed with the statement.
The findings also indicates that, 11.7% of the respondents strongly agreed that the university
policies and strategies are effectively communicated to all stakeholders, 55.7% agreed with the
statement, while 23.5% are neutral, 8.3% disagree and 0.9% strongly disagree with the
statement. In this regard a total of 67.4% agreed that the university policies and strategies are
effectively communicated to all stakeholders. The results also shows 32.6% were neutral,
disagreed or strongly disagreed with the statement. Most of the respondent (75.7%) agreed that
the university policies and strategies are formulated based on available information and data.
These help to ensure the resources and planned activities are aligned to the available resources. A
high percentage (69.6%) agrees that the university policies and strategies are regularly monitored
and reviewed.
4.4.8 Descriptive Analysis for Process, Product and Services
The responded were asked to indicate to what extent they agreed or disagreed with the various
statements in regard to processes, product and services. The findings from the analysis are as per
the Table 4.12.
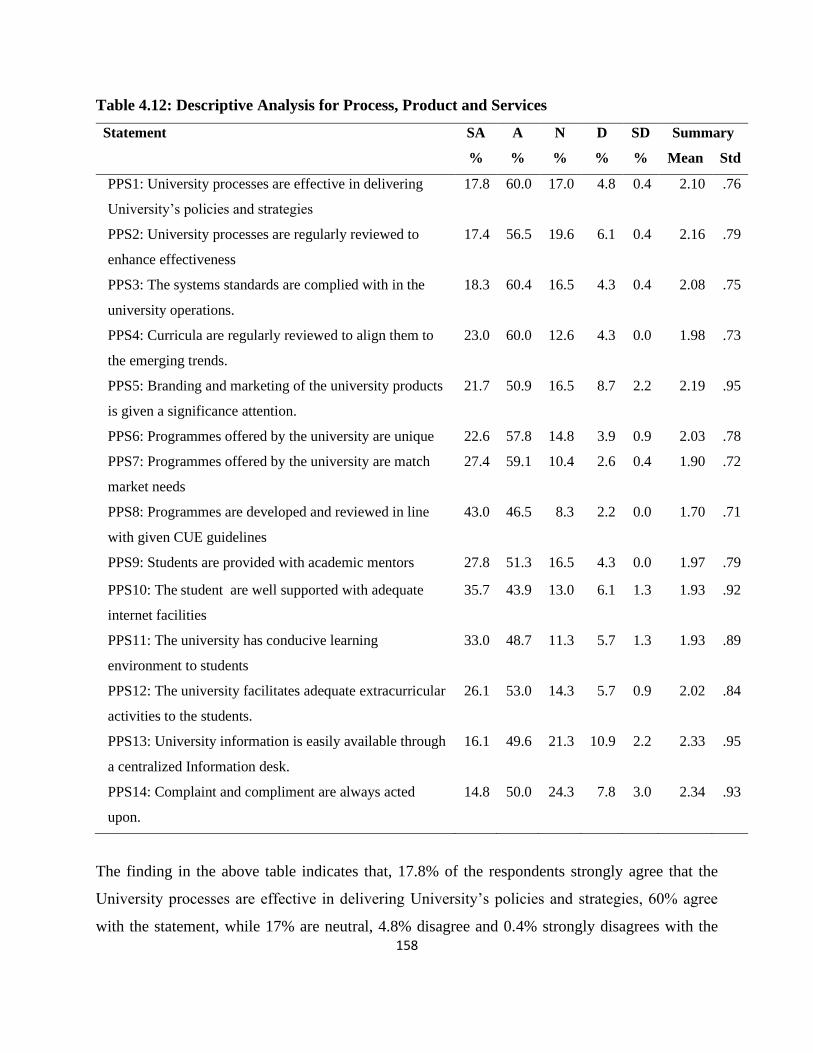
158
Table 4.12: Descriptive Analysis for Process, Product and Services
Statement SA A N D SD Summary
% % % % % Mean Std
PPS1: University processes are effective in delivering
University’s policies and strategies
17.8 60.0 17.0 4.8 0.4 2.10 .76
PPS2: University processes are regularly reviewed to
enhance effectiveness
17.4 56.5 19.6 6.1 0.4 2.16 .79
PPS3: The systems standards are complied with in the
university operations.
18.3 60.4 16.5 4.3 0.4 2.08 .75
PPS4: Curricula are regularly reviewed to align them to
the emerging trends.
23.0 60.0 12.6 4.3 0.0 1.98 .73
PPS5: Branding and marketing of the university products
is given a significance attention.
21.7 50.9 16.5 8.7 2.2 2.19 .95
PPS6: Programmes offered by the university are unique 22.6 57.8 14.8 3.9 0.9 2.03 .78
PPS7: Programmes offered by the university are match
market needs
27.4 59.1 10.4 2.6 0.4 1.90 .72
PPS8: Programmes are developed and reviewed in line
with given CUE guidelines
43.0 46.5 8.3 2.2 0.0 1.70 .71
PPS9: Students are provided with academic mentors 27.8 51.3 16.5 4.3 0.0 1.97 .79
PPS10: The student are well supported with adequate
internet facilities
35.7 43.9 13.0 6.1 1.3 1.93 .92
PPS11: The university has conducive learning
environment to students
33.0 48.7 11.3 5.7 1.3 1.93 .89
PPS12: The university facilitates adequate extracurricular
activities to the students.
26.1 53.0 14.3 5.7 0.9 2.02 .84
PPS13: University information is easily available through
a centralized Information desk.
16.1 49.6 21.3 10.9 2.2 2.33 .95
PPS14: Complaint and compliment are always acted
upon.
14.8 50.0 24.3 7.8 3.0 2.34 .93
The finding in the above table indicates that, 17.8% of the respondents strongly agree that the
University processes are effective in delivering University’s policies and strategies, 60% agree
with the statement, while 17% are neutral, 4.8% disagree and 0.4% strongly disagrees with the
159
statement. In this regard a total of 77.8%strongly agree and agree that University processes are
effective in delivering University’s policies and strategies. The results also show 22.2% were
neutral, disagreed or strongly disagreed with the statement. Most of the respondent (73.9%)
strongly agreed and agreed that University processes are regularly reviewed to enhance
effectiveness. A high percent of respondent (78.7%) strongly agreed and agreed that University
systems standards are complied. Majority of respondent (83%) strongly agreed and agreed that
University curricula are regularly reviewed and aligned to the emerging trends.72.6% agreed that
University branding and marketing of the university is given a significance attention. The results
also indicate that, a high percentage of respondents (80.4%) agreed that programs offered by the
University are unique and match the market needs.
The study also sought to establish if programmes are reviewed in line with the CUE guidelines,
Most of the respondents (89.5%) agreed that programs are developed and reviewed in line with
CUE guidelines. The study also revealed that, a high percentage of respondents (79.3%) agreed
that the University students are provided with academic mentors/advisors. Academic advisors are
very instrumental in enhancing customer experience, they interact with students at a personal
level which help them to identify and address their needs. The result also indicate majority,
(79.6%) agree that the students are well supported with adequate internet facilities. Internet
facilitates the use of technology in service delivery such as access to the e-learning and student
portal, this raises the level of service delivery. The study also sought to establish the status of the
learning environment, 81.7% of the respondents strongly agreed and agreed that the learning
environment is conducive to students. The study also found out that 79.1% of the respondent
strongly agreed and agreed that the University facilitates the extracurricular activities to students.
This is a very significant aspect which is often ignored at the HEIs, extracurricular activities
support the holistic development of the students and enhance the customer experience. Effective
Communication and provision of information is and essential aspect of the service delivery, the
study sought to establish if University information was easily accessible through a centralized
information desk, 65.7% of the respondent strongly agreed and agreed that the information was
easily available. The study also revealed that 64.8% of the respondent strongly agreed and agreed
that the University complaint and compliment are promptly acted upon and feedback given.
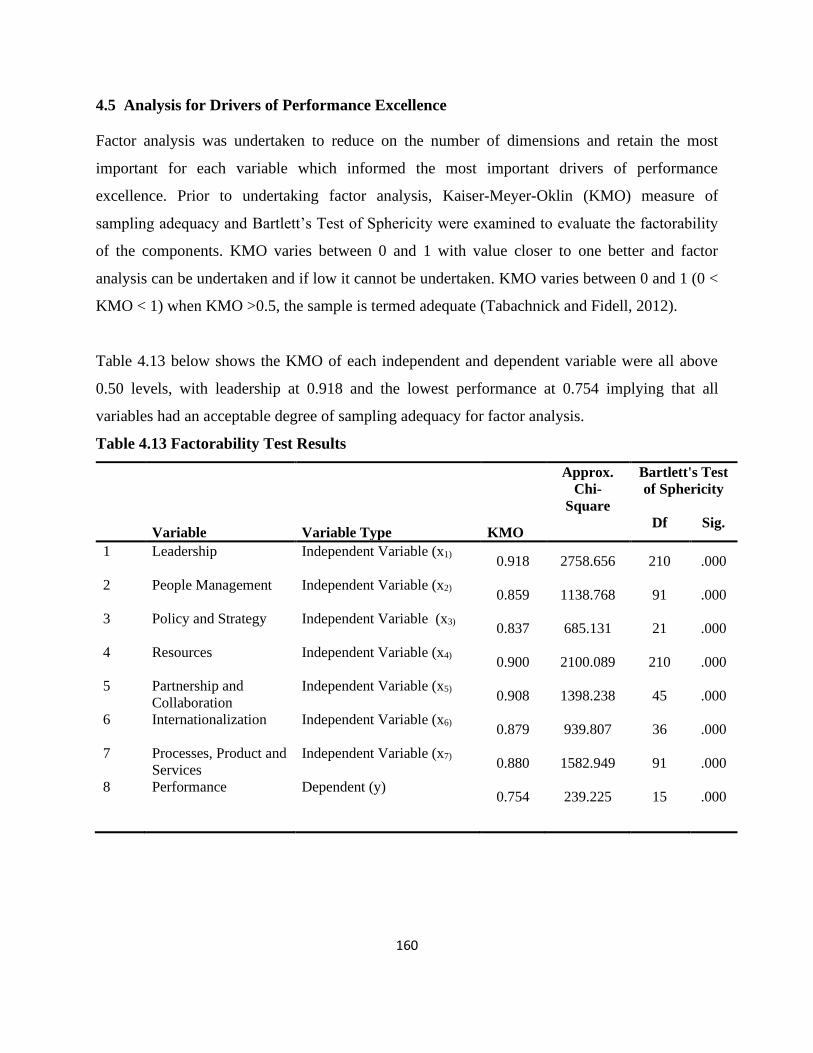
160
4.5 Analysis for Drivers of Performance Excellence
Factor analysis was undertaken to reduce on the number of dimensions and retain the most
important for each variable which informed the most important drivers of performance
excellence. Prior to undertaking factor analysis, Kaiser-Meyer-Oklin (KMO) measure of
sampling adequacy and Bartlett’s Test of Sphericity were examined to evaluate the factorability
of the components. KMO varies between 0 and 1 with value closer to one better and factor
analysis can be undertaken and if low it cannot be undertaken. KMO varies between 0 and 1 (0 <
KMO < 1) when KMO >0.5, the sample is termed adequate (Tabachnick and Fidell, 2012).
Table 4.13 below shows the KMO of each independent and dependent variable were all above
0.50 levels, with leadership at 0.918 and the lowest performance at 0.754 implying that all
variables had an acceptable degree of sampling adequacy for factor analysis.
Table 4.13 Factorability Test Results
Approx.
Chi-
Square
Bartlett's Test
of Sphericity
Variable Variable Type KMO Df Sig.
1 Leadership Independent Variable (x1)
0.918 2758.656 210 .000
2 People Management Independent Variable (x2)
0.859 1138.768 91 .000
3 Policy and Strategy
Independent Variable (x3)
0.837 685.131 21 .000
4 Resources Independent Variable (x4)
0.900 2100.089 210 .000
5 Partnership and
Collaboration
Independent Variable (x5)
0.908 1398.238 45 .000
6 Internationalization
Independent Variable (x6)
0.879 939.807 36 .000
7 Processes, Product and
Services
Independent Variable (x7)
0.880 1582.949 91 .000
8 Performance
Dependent (y)
0.754
239.225
15
.000
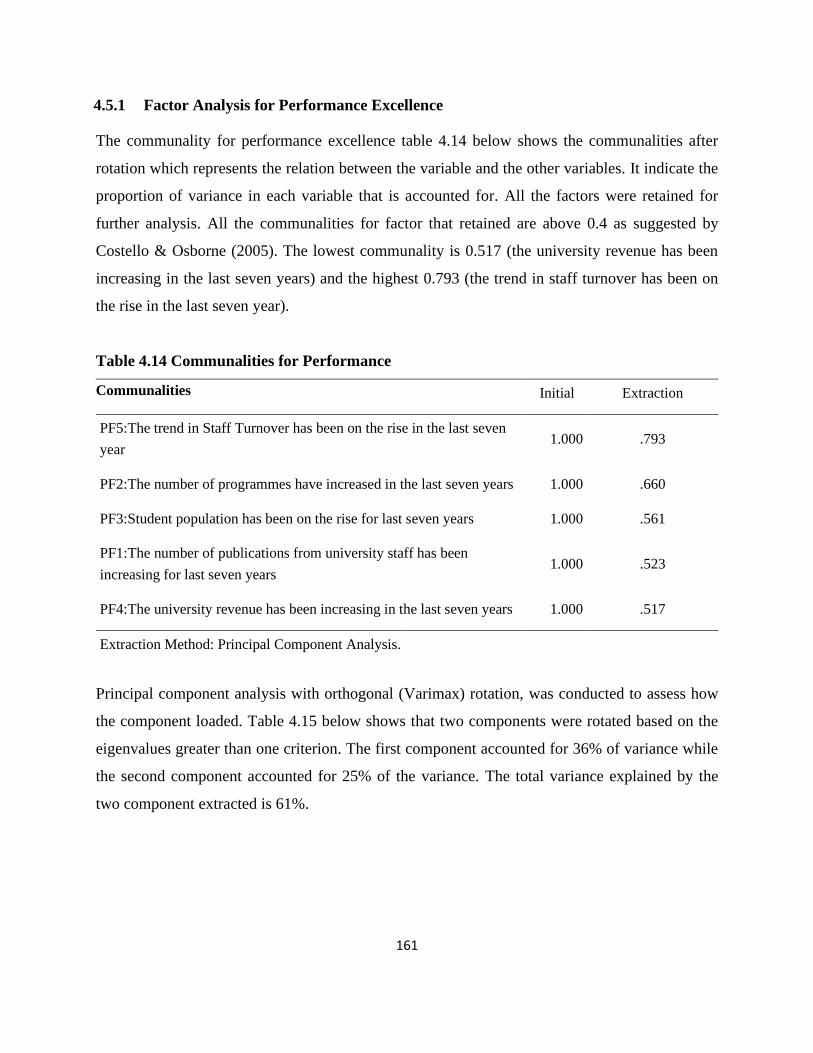
161
4.5.1 Factor Analysis for Performance Excellence
The communality for performance excellence table 4.14 below shows the communalities after
rotation which represents the relation between the variable and the other variables. It indicate the
proportion of variance in each variable that is accounted for. All the factors were retained for
further analysis. All the communalities for factor that retained are above 0.4 as suggested by
Costello & Osborne (2005). The lowest communality is 0.517 (the university revenue has been
increasing in the last seven years) and the highest 0.793 (the trend in staff turnover has been on
the rise in the last seven year).
Table 4.14 Communalities for Performance
Communalities Initial Extraction
PF5:The trend in Staff Turnover has been on the rise in the last seven
year 1.000 .793
PF2:The number of programmes have increased in the last seven years 1.000 .660
PF3:Student population has been on the rise for last seven years 1.000 .561
PF1:The number of publications from university staff has been
increasing for last seven years 1.000 .523
PF4:The university revenue has been increasing in the last seven years 1.000 .517
Extraction Method: Principal Component Analysis.
Principal component analysis with orthogonal (Varimax) rotation, was conducted to assess how
the component loaded. Table 4.15 below shows that two components were rotated based on the
eigenvalues greater than one criterion. The first component accounted for 36% of variance while
the second component accounted for 25% of the variance. The total variance explained by the
two component extracted is 61%.

162
Table 4.15: Total Variance Explained for Performance Excellence
Com
pone
nt
Initial Eigenvalues Extraction Sums of Squared
Loadings
Rotation Sums of Squared
Loadings
Tota
l
% of
Varianc
e
Cum
%
Total % of
Varianc
e
Cum
%
Total % of
Varian
ce
Cum.
%
1 2.040 40.808 40.808 2.040 40.808 40.808 1.817 36.341 36.341
2 1.013 20.251 61.059 1.013 20.251 61.059 1.236 24.718 61.059
3 .741 14.810 75.869
4 .686 13.721 89.590
5 .521 10.410 100.00
Extraction Method: Principal Component Analysis.
In order to physically visualize the components that are important to retain a scree plot was
generated figure 4.1. According to the scree plot two components can be retained since the curve
is leveling off after the first two components. The scree plot thus confirms retaining two
components as observed in the total variance explained with eigenvalues >1.
Figure 4.1: Scree plot for Performance Scree Plot
Table 4.16 shows the rotated component Matrix for performance excellence, it is generated to
show the rotated loading of the component, with loading less than 0.4 suppressed. PF2, PF1, PF3
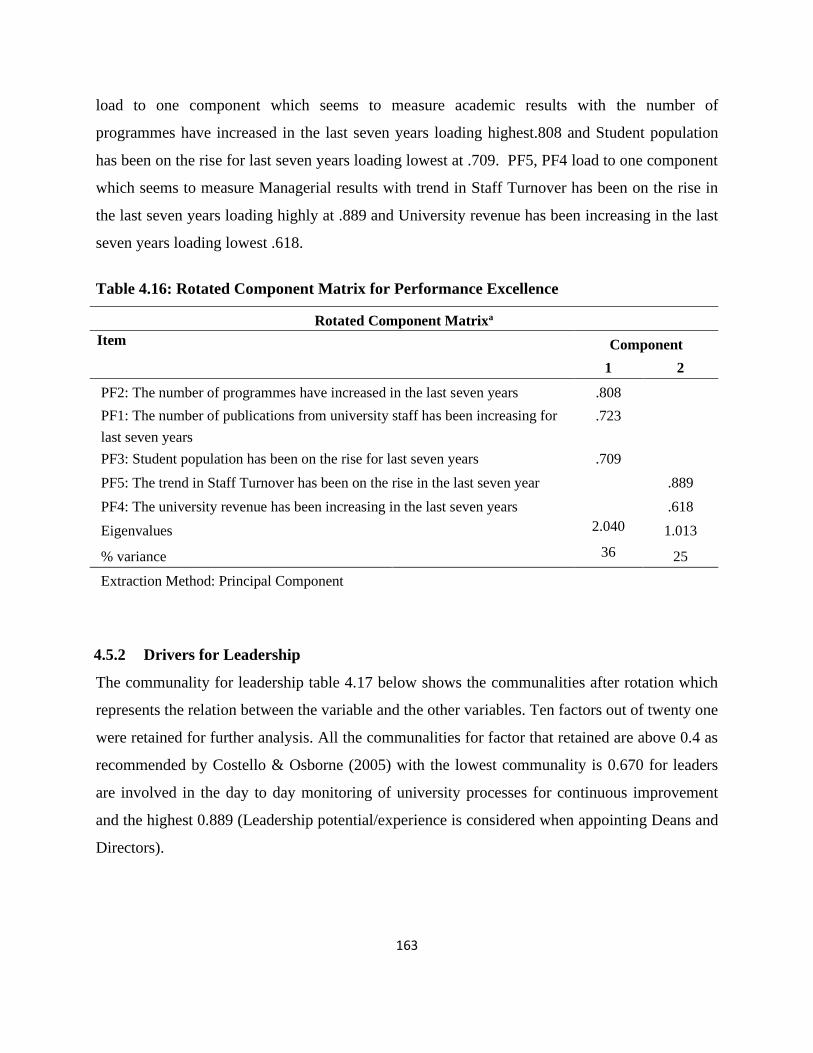
163
load to one component which seems to measure academic results with the number of
programmes have increased in the last seven years loading highest.808 and Student population
has been on the rise for last seven years loading lowest at .709. PF5, PF4 load to one component
which seems to measure Managerial results with trend in Staff Turnover has been on the rise in
the last seven years loading highly at .889 and University revenue has been increasing in the last
seven years loading lowest .618.
Table 4.16: Rotated Component Matrix for Performance Excellence
Rotated Component Matrixa
Item Component
1 2
PF2: The number of programmes have increased in the last seven years .808
PF1: The number of publications from university staff has been increasing for
last seven years
.723
PF3: Student population has been on the rise for last seven years .709
PF5: The trend in Staff Turnover has been on the rise in the last seven year .889
PF4: The university revenue has been increasing in the last seven years .618
Eigenvalues 2.040 1.013
% variance
ance
36 25
Extraction Method: Principal Component
Analysis.
Rotation Method: Varimax with Kaiser
Normalization.a
4.5.2 Drivers for Leadership
The communality for leadership table 4.17 below shows the communalities after rotation which
represents the relation between the variable and the other variables. Ten factors out of twenty one
were retained for further analysis. All the communalities for factor that retained are above 0.4 as
recommended by Costello & Osborne (2005) with the lowest communality is 0.670 for leaders
are involved in the day to day monitoring of university processes for continuous improvement
and the highest 0.889 (Leadership potential/experience is considered when appointing Deans and
Directors).
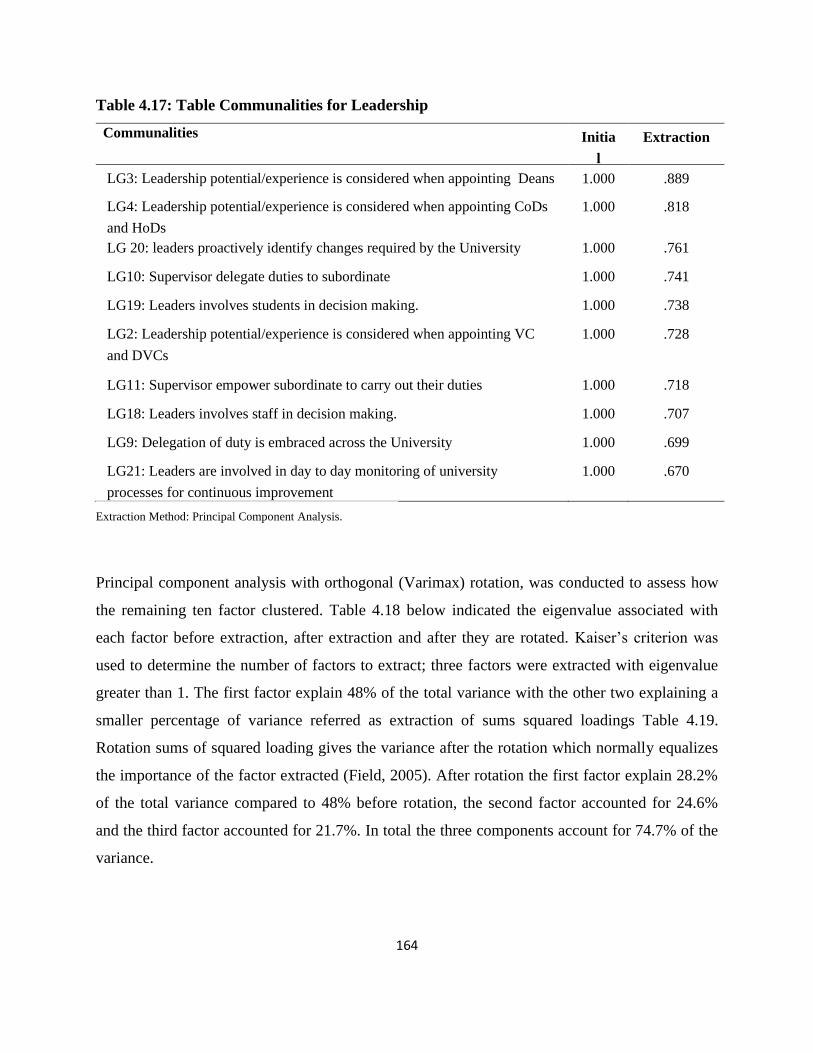
164
Table 4.17: Table Communalities for Leadership
Communalities Initia
l
Extraction
LG3: Leadership potential/experience is considered when appointing Deans
and Directors
1.000 .889
LG4: Leadership potential/experience is considered when appointing CoDs
and HoDs
1.000 .818
LG 20: leaders proactively identify changes required by the University 1.000 .761
LG10: Supervisor delegate duties to subordinate 1.000 .741
LG19: Leaders involves students in decision making. 1.000 .738
LG2: Leadership potential/experience is considered when appointing VC
and DVCs
1.000 .728
LG11: Supervisor empower subordinate to carry out their duties 1.000 .718
LG18: Leaders involves staff in decision making. 1.000 .707
LG9: Delegation of duty is embraced across the University 1.000 .699
LG21: Leaders are involved in day to day monitoring of university
processes for continuous improvement
1.000 .670
Extraction Method: Principal Component Analysis.
Principal component analysis with orthogonal (Varimax) rotation, was conducted to assess how
the remaining ten factor clustered. Table 4.18 below indicated the eigenvalue associated with
each factor before extraction, after extraction and after they are rotated. Kaiser’s criterion was
used to determine the number of factors to extract; three factors were extracted with eigenvalue
greater than 1. The first factor explain 48% of the total variance with the other two explaining a
smaller percentage of variance referred as extraction of sums squared loadings Table 4.19.
Rotation sums of squared loading gives the variance after the rotation which normally equalizes
the importance of the factor extracted (Field, 2005). After rotation the first factor explain 28.2%
of the total variance compared to 48% before rotation, the second factor accounted for 24.6%
and the third factor accounted for 21.7%. In total the three components account for 74.7% of the
variance.
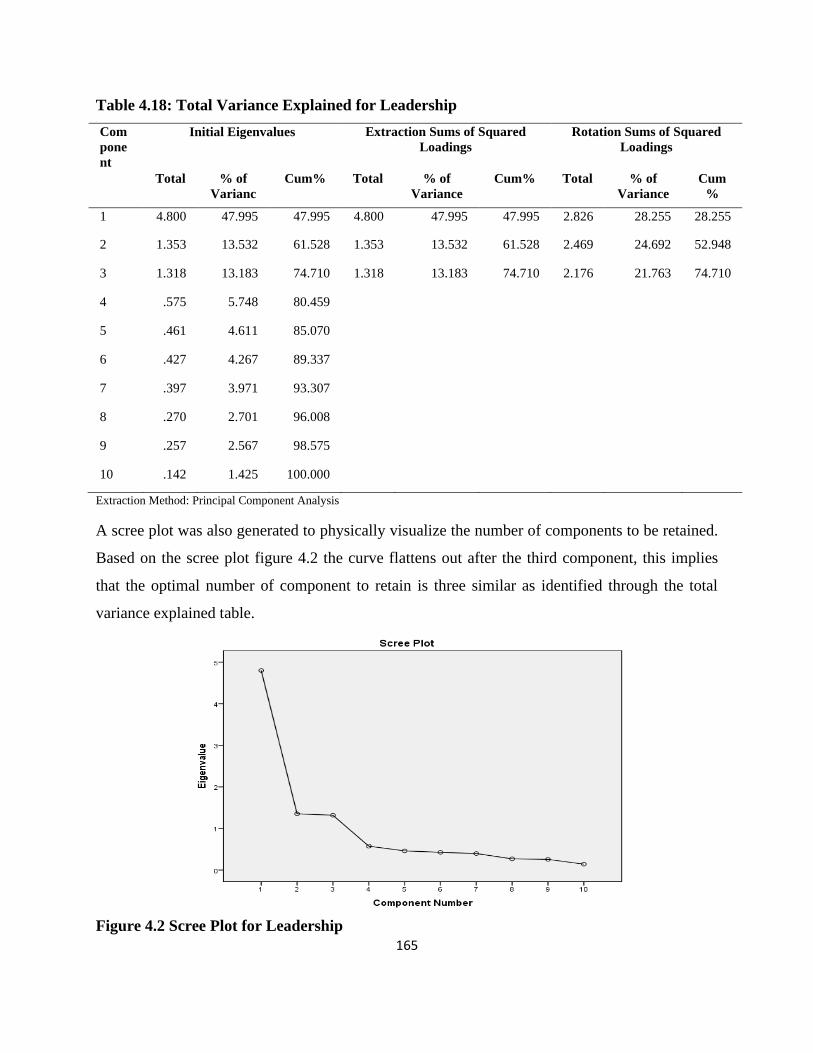
165
Table 4.18: Total Variance Explained for Leadership
Com
pone
nt
Initial Eigenvalues Extraction Sums of Squared
Loadings
Rotation Sums of Squared
Loadings
Total % of
Varianc
e
Cum% Total % of
Variance
Cum% Total % of
Variance
Cum
%
1 4.800 47.995 47.995 4.800 47.995 47.995 2.826 28.255 28.255
2 1.353 13.532 61.528 1.353 13.532 61.528 2.469 24.692 52.948
3 1.318 13.183 74.710 1.318 13.183 74.710 2.176 21.763 74.710
4 .575 5.748 80.459
5 .461 4.611 85.070
6 .427 4.267 89.337
7 .397 3.971 93.307
8 .270 2.701 96.008
9 .257 2.567 98.575
10 .142 1.425 100.000
Extraction Method: Principal Component Analysis
A scree plot was also generated to physically visualize the number of components to be retained.
Based on the scree plot figure 4.2 the curve flattens out after the third component, this implies
that the optimal number of component to retain is three similar as identified through the total
variance explained table.
Figure 4.2 Scree Plot for Leadership

166
Table 4.19 below shows the components loadings after rotation, loading below 0.4 were
surpressed and omitted, (Comrey and Lee (1992) refer loading above 0.63 as very good. Through
the omission of items that were loading low the percentage of variance explained and
communality improved.
Table 4.19: Component Loading for Rotated Component of Leadership
Rotated Component Matrixa Component
1 2 3
LG19: Leaders involves students in decision making. .821
LG 20: leaders proactively identify changes required by the University .817
LG21: Leaders are involved in day to day monitoring of university processes. .794
LG18: Leaders involves staff in decision making. .763
LG3: Leadership potential/experience is considered when appointing Deans and
Directors
.913
LG4: Leadership potential/experience is considered when appointing CoDs and HoDs .833
LG2: Leadership potential/experience is considered when appointing VC and DVC .805
LG10: Supervisor delegate duties to subordinate .832
LG9: Delegation of duty is embraced across the University .793
LG11: Supervisor empower subordinate to carry out their duties .789
Extraction Method: Principal Component Analysis.
Rotation Method: Varimax with Kaiser Normalization.a
a. Rotation converged in 5 iterations.
The results aggregated the component into three clusters with no cross loading, forming a
coherent components with the results loading highly on the first factors. The questions that
loaded highly in factor one are related to leader involvement (L19,L20,L21,L18), leaders
involves student in decision making loading the highest (0.821) and leaders involves staff in
decision making loading the lowest (0.763) the questions that load highly on factor two relate to
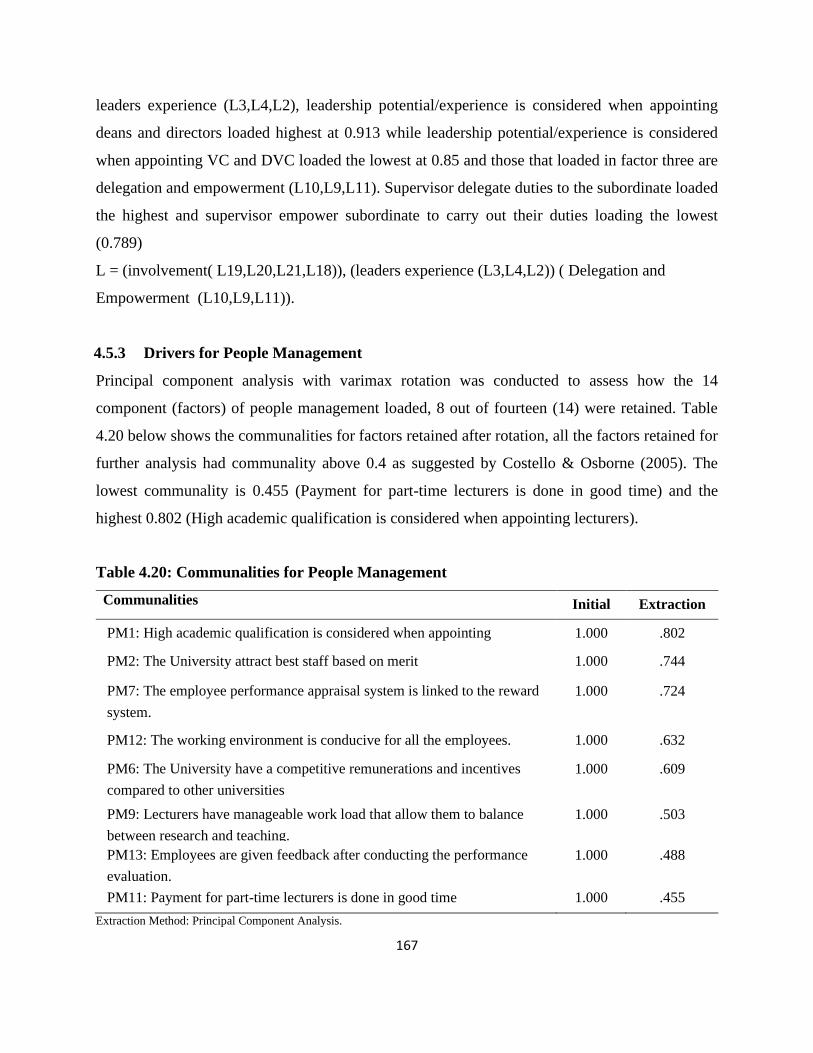
167
leaders experience (L3,L4,L2), leadership potential/experience is considered when appointing
deans and directors loaded highest at 0.913 while leadership potential/experience is considered
when appointing VC and DVC loaded the lowest at 0.85 and those that loaded in factor three are
delegation and empowerment (L10,L9,L11). Supervisor delegate duties to the subordinate loaded
the highest and supervisor empower subordinate to carry out their duties loading the lowest
(0.789)
L = (involvement( L19,L20,L21,L18)), (leaders experience (L3,L4,L2)) ( Delegation and
Empowerment (L10,L9,L11)).
4.5.3 Drivers for People Management
Principal component analysis with varimax rotation was conducted to assess how the 14
component (factors) of people management loaded, 8 out of fourteen (14) were retained. Table
4.20 below shows the communalities for factors retained after rotation, all the factors retained for
further analysis had communality above 0.4 as suggested by Costello & Osborne (2005). The
lowest communality is 0.455 (Payment for part-time lecturers is done in good time) and the
highest 0.802 (High academic qualification is considered when appointing lecturers).
Table 4.20: Communalities for People Management
Communalities Initial Extraction
PM1: High academic qualification is considered when appointing
lecturers.
1.000 .802
PM2: The University attract best staff based on merit 1.000 .744
PM7: The employee performance appraisal system is linked to the reward
system.
1.000 .724
PM12: The working environment is conducive for all the employees. 1.000 .632
PM6: The University have a competitive remunerations and incentives
compared to other universities
1.000 .609
PM9: Lecturers have manageable work load that allow them to balance
between research and teaching.
1.000 .503
PM13: Employees are given feedback after conducting the performance
evaluation.
1.000 .488
PM11: Payment for part-time lecturers is done in good time 1.000 .455
Extraction Method: Principal Component Analysis.

168
Table 4.21 below shows eigenvalue associated with each factor before extraction, after extraction
and after they are rotated. Two components were rotated based on the Kaiser Criterion,
eigenvalues over 1 and the scree plot (figure 4.3). The factor accounted for 62% of the variation,
The first factor after rotation accounted for 40.5% of variance while the second factor accounted
for 21.5% of the variance.
Table 4.21: Total Variance Explained for People Management
Co
mpo
nent
Initial Eigenvalues Extraction Sums of Squared
Loadings
Rotation Sums of Squared
Loadings
Tot
al
% of
Variance
Cum
%
Total % of
Variance
Cum
%
Total % of
Variance
Cum
%
1 3.79
1
47.382 47.382 3.791 47.382 47.382 3.239 40.482 40.482
2 1.16
6
14.577 61.958 1.166 14.577 61.958 1.718 21.476 61.958
3 .802 10.021 71.979
4 .630 7.880 79.859
5 .560 7.005 86.864
6 .410 5.127 91.991
7 .379 4.735 96.726
8 .262 3.274 100.00
0
Extraction Method: Principal Component Analysis.
Figure 4.3 Scree Plot for People Management
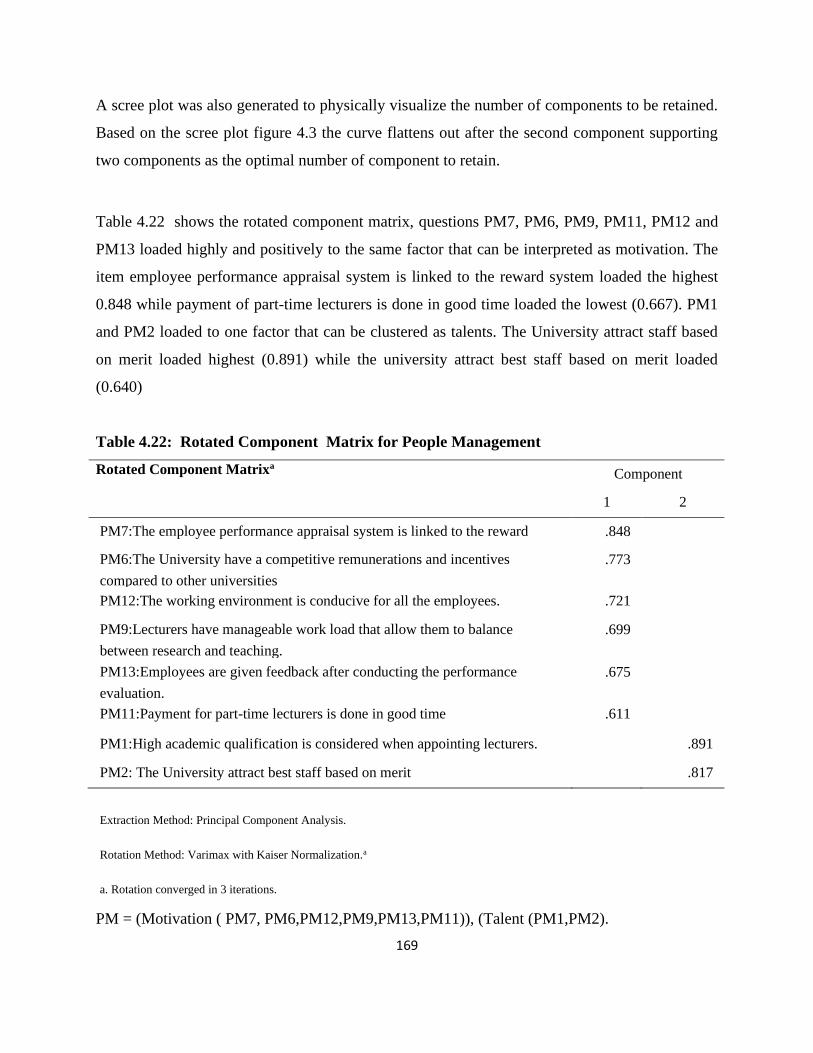
169
A scree plot was also generated to physically visualize the number of components to be retained.
Based on the scree plot figure 4.3 the curve flattens out after the second component supporting
two components as the optimal number of component to retain.
Table 4.22 shows the rotated component matrix, questions PM7, PM6, PM9, PM11, PM12 and
PM13 loaded highly and positively to the same factor that can be interpreted as motivation. The
item employee performance appraisal system is linked to the reward system loaded the highest
0.848 while payment of part-time lecturers is done in good time loaded the lowest (0.667). PM1
and PM2 loaded to one factor that can be clustered as talents. The University attract staff based
on merit loaded highest (0.891) while the university attract best staff based on merit loaded
(0.640)
Table 4.22: Rotated Component Matrix for People Management
Rotated Component Matrixa Component
1 2
PM7:The employee performance appraisal system is linked to the reward
system.
.848
PM6:The University have a competitive remunerations and incentives
compared to other universities
.773
PM12:The working environment is conducive for all the employees. .721
PM9:Lecturers have manageable work load that allow them to balance
between research and teaching.
.699
PM13:Employees are given feedback after conducting the performance
evaluation.
.675
PM11:Payment for part-time lecturers is done in good time .611
PM1:High academic qualification is considered when appointing lecturers. .891
PM2: The University attract best staff based on merit .817
Extraction Method: Principal Component Analysis.
Rotation Method: Varimax with Kaiser Normalization.a
a. Rotation converged in 3 iterations.
PM = (Motivation ( PM7, PM6,PM12,PM9,PM13,PM11)), (Talent (PM1,PM2).

170
4.5.4 Drivers for Policy and Strategy
Principal component analysis with varimax rotation was conducted to assess how the 7 factors of
policy and strategy loaded, 6 out of the 7 were retained. Table 4.23 shows the communalities for
factors retained after rotation, all the factors retained for further analysis had communality above
0.4 with the lowest communality is 0.572 (the policy and strategies are well communicated to
stakeholders) and the highest 0.666 (the strategies and policies are formulated based on available
information).
Table 4.23 : Policy and Strategy Communalities
Communalities
Initial Extraction
PS6:The strategies and policies are formulated based on available
information and data
1.000 .666
PS1: Strategies are well supported by appropriate policies, plans and
processes to support institution agenda
1.000 .594
PS4:All stakeholders of the university are involved in strategy and policy
formulation.
1.000 .582
PS3:The implementation of strategic plan is closely monitored by the
University management.
1.000 .574
PS2: Strategies are aligned to university vision and mission 1.000 .573
PS5:The policy and strategies are well communicated to stakeholders. 1.000 .572
Extraction Method: Principal Component
Analysis.
One component was extracted after undertaking Principal component analysis with varimax
rotation based on the Kaiser criterion, eigenvalues over 1, the scree plot result (figure 4.) also
suggest only one factor should be retained. Suppressing the factor loading at 0.63 one item was
dropped. The remaining component accounted for 59.3% of the variance for the eigenvalue
greater than one as shown in Table 4.24

171
Table 4.24 Total Variance Explained
Total Variance Explained
Compone
nt
Initial Eigenvalues Extraction Sums of Squared Loadings
Total % of
Variance
Cumulative
%
Total % of
Variance
Cumulative
%
1 3.561 59.354 59.354 3.561 59.354 59.354
2 .870 14.494 73.848
3 .507 8.448 82.296
4 .455 7.576 89.872
5 .333 5.551 95.423
6 .275 4.577 100.000
Extraction Method: Principal Component Analysis.
A scree plot was also generated to physically visualize the number of components to be retained.
Based on the scree plot figure 4.4 the curve flattens out after the first component supporting
retaining of one component.
Figure 4.4 Scree Plot for Policy and Strategy

172
Table 4.25: Rotated component Matrix
Component Matrixa Component
1 PS6:The strategies and policies are formulated based on available information and data .816
PS1: Strategies are well supported by appropriate policies, plans and processes to
support institution agenda
.771
PS4:All stakeholders of the university are involved in strategy and policy formulation. .763
PS3:The implementation of strategic plan is closely monitored by the University
management.
.758
PS2: Strategies are aligned to university vision and mission .757
PS5:The policy and strategies are well communicated to stakeholders. .756
Extraction Method: Principal Component Analysis.a
a. 1 components extracted.
All the retained questions PS1, PS2, PS3, PS4, PS4, PS5 and PS6 loaded positively to one
component Policies and Strategies as shown in Table 4.29 above. The strategies and policies are
formulated based on available information and data loaded the highest (0.816) while the policy
and strategies are well communicated to stakeholders loaded the lowest (0.756).
4.5.5 Drivers for Resources
Principal component analysis with varimax rotation was conducted on 21 factors of resources to
assess their loading; factors with low communality below 0.4 were dropped during the rotation.
Thirteen (13) factors were retained for further analysis after rotation. Table 4.26 below displays
the communalities for the retained factors, all the communalities are above 0.4 with the lowest
communality is 0.584 (The University undertake fundraising initiatives through Alumni) and the
highest 0.750 (The University undertake fundraising through research grant).
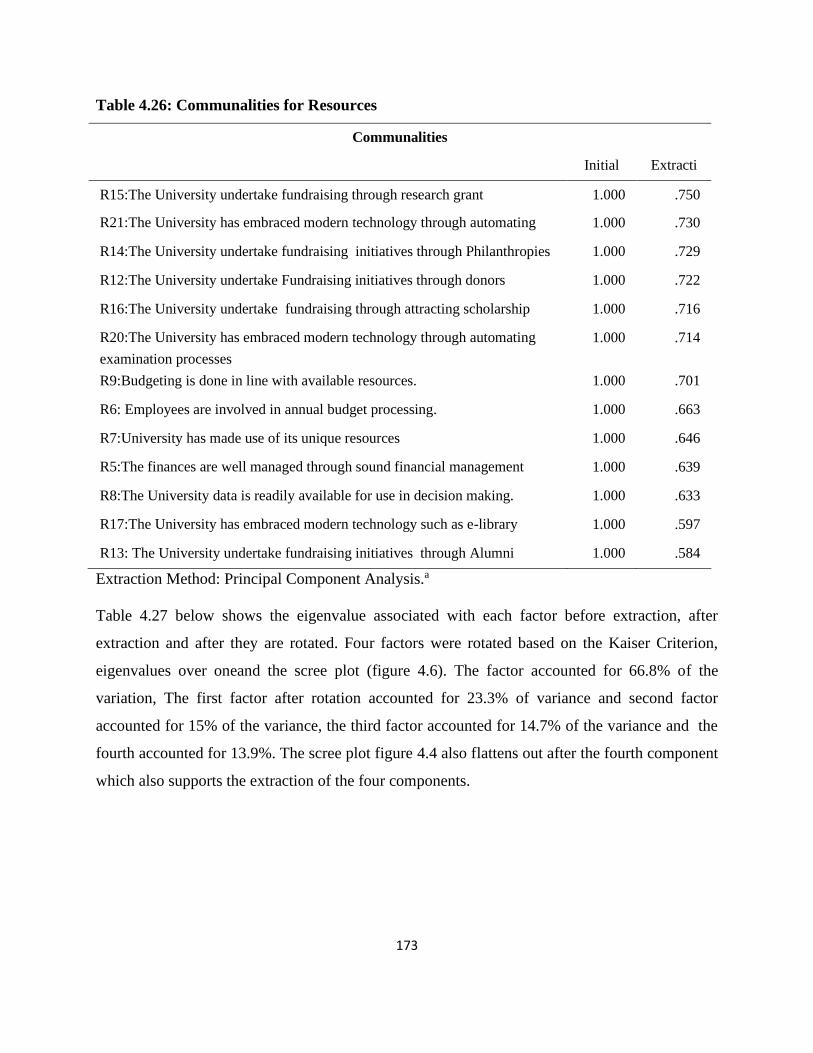
173
Table 4.26: Communalities for Resources
Communalities
Initial Extracti
on R15:The University undertake fundraising through research grant 1.000 .750
R21:The University has embraced modern technology through automating
financial management
1.000 .730
R14:The University undertake fundraising initiatives through Philanthropies 1.000 .729
R12:The University undertake Fundraising initiatives through donors 1.000 .722
R16:The University undertake fundraising through attracting scholarship 1.000 .716
R20:The University has embraced modern technology through automating
examination processes
1.000 .714
R9:Budgeting is done in line with available resources. 1.000 .701
R6: Employees are involved in annual budget processing. 1.000 .663
R7:University has made use of its unique resources 1.000 .646
R5:The finances are well managed through sound financial management
systems.
1.000 .639
R8:The University data is readily available for use in decision making. 1.000 .633
R17:The University has embraced modern technology such as e-library
services
1.000 .597
R13: The University undertake fundraising initiatives through Alumni 1.000 .584
Extraction Method: Principal Component Analysis.a
Table 4.27 below shows the eigenvalue associated with each factor before extraction, after
extraction and after they are rotated. Four factors were rotated based on the Kaiser Criterion,
eigenvalues over oneand the scree plot (figure 4.6). The factor accounted for 66.8% of the
variation, The first factor after rotation accounted for 23.3% of variance and second factor
accounted for 15% of the variance, the third factor accounted for 14.7% of the variance and the
fourth accounted for 13.9%. The scree plot figure 4.4 also flattens out after the fourth component
which also supports the extraction of the four components.
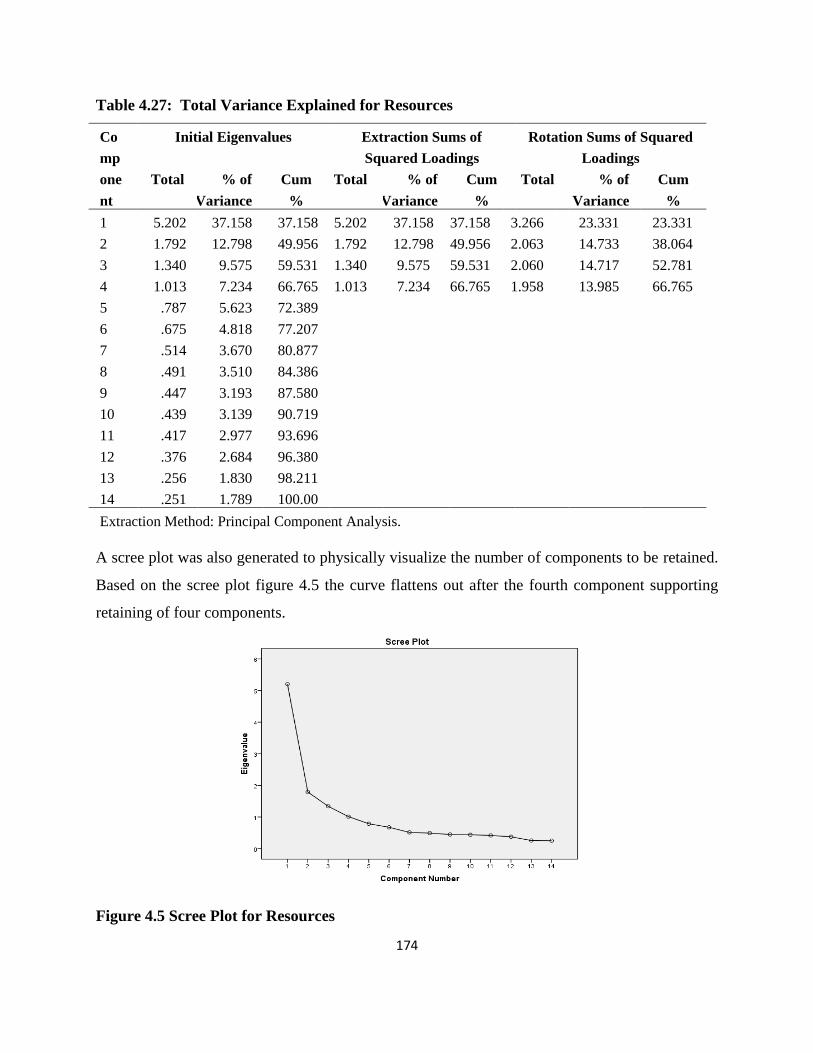
174
Table 4.27: Total Variance Explained for Resources
Co
mp
one
nt
Initial Eigenvalues Extraction Sums of
Squared Loadings
Rotation Sums of Squared
Loadings
Total % of
Variance
Cum
%
Total % of
Variance
Cum
%
Total % of
Variance
Cum
%
1 5.202 37.158 37.158 5.202 37.158 37.158 3.266 23.331 23.331
2 1.792 12.798 49.956 1.792 12.798 49.956 2.063 14.733 38.064
3 1.340 9.575 59.531 1.340 9.575 59.531 2.060 14.717 52.781
4 1.013 7.234 66.765 1.013 7.234 66.765 1.958 13.985 66.765
5 .787 5.623 72.389
6 .675 4.818 77.207
7 .514 3.670 80.877
8 .491 3.510 84.386
9 .447 3.193 87.580
10 .439 3.139 90.719
11 .417 2.977 93.696
12 .376 2.684 96.380
13 .256 1.830 98.211
14 .251 1.789 100.00
Extraction Method: Principal Component Analysis.
A scree plot was also generated to physically visualize the number of components to be retained.
Based on the scree plot figure 4.5 the curve flattens out after the fourth component supporting
retaining of four components.
Figure 4.5 Scree Plot for Resources
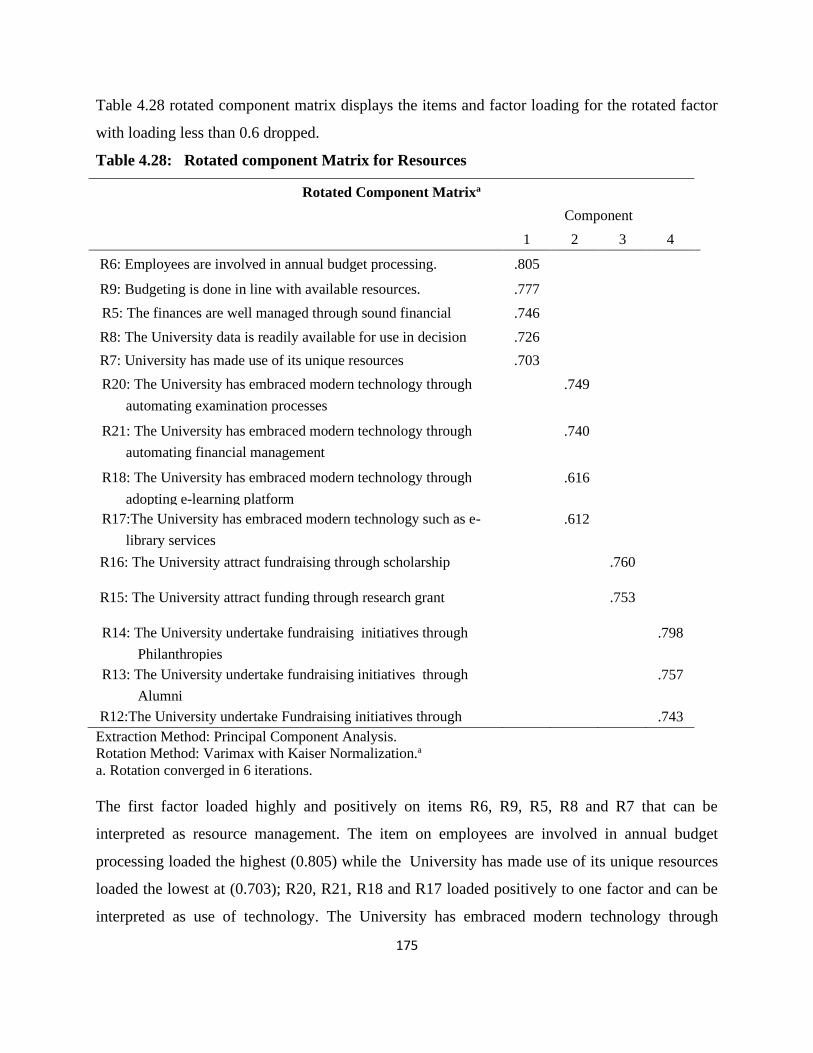
175
Table 4.28 rotated component matrix displays the items and factor loading for the rotated factor
with loading less than 0.6 dropped.
Table 4.28: Rotated component Matrix for Resources
Rotated Component Matrixa
Component
1 2 3 4
R6: Employees are involved in annual budget processing. .805
R9: Budgeting is done in line with available resources. .777
R5: The finances are well managed through sound financial
management systems.
.746
R8: The University data is readily available for use in decision .726
R7: University has made use of its unique resources .703
R20: The University has embraced modern technology through
automating examination processes
.749
R21: The University has embraced modern technology through
automating financial management
.740
R18: The University has embraced modern technology through
adopting e-learning platform
.616
R17:The University has embraced modern technology such as e-
library services
.612
R16: The University attract fundraising through scholarship .760
R15: The University attract funding through research grant .753
R14: The University undertake fundraising initiatives through
Philanthropies
.798
R13: The University undertake fundraising initiatives through
Alumni
.757
R12:The University undertake Fundraising initiatives through
donors
.743
Extraction Method: Principal Component Analysis.
Rotation Method: Varimax with Kaiser Normalization.a
a. Rotation converged in 6 iterations.
The first factor loaded highly and positively on items R6, R9, R5, R8 and R7 that can be
interpreted as resource management. The item on employees are involved in annual budget
processing loaded the highest (0.805) while the University has made use of its unique resources
loaded the lowest at (0.703); R20, R21, R18 and R17 loaded positively to one factor and can be
interpreted as use of technology. The University has embraced modern technology through
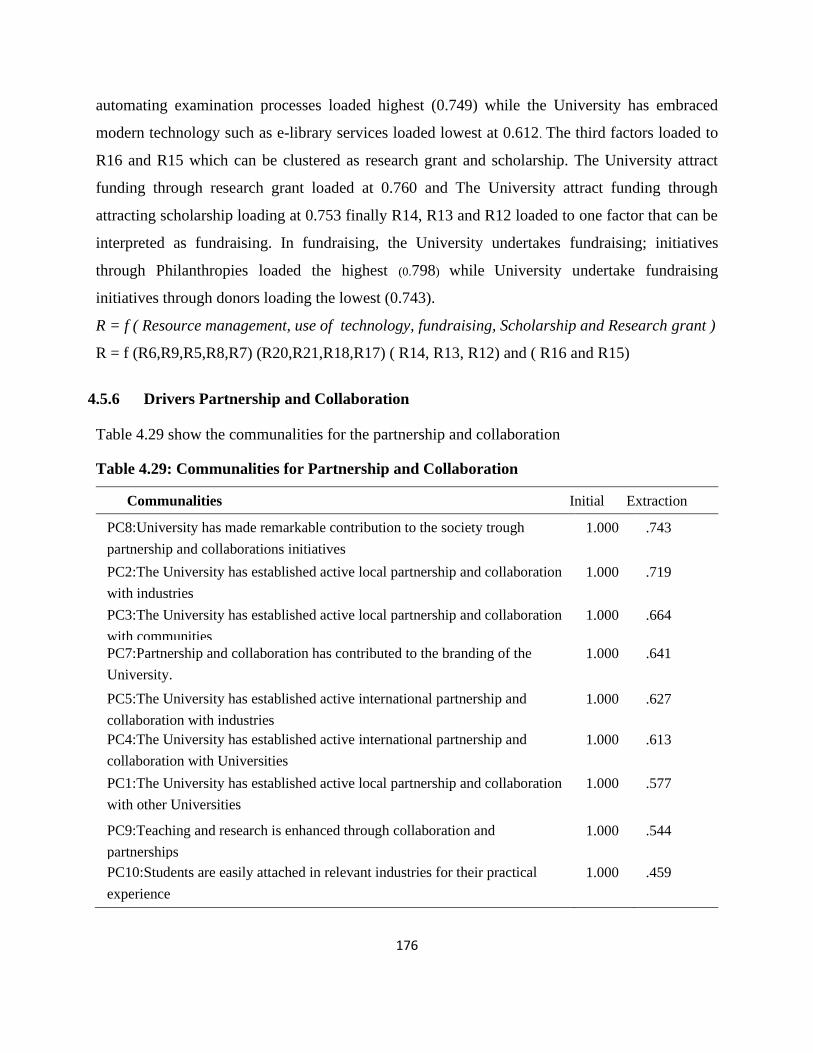
176
automating examination processes loaded highest (0.749) while the University has embraced
modern technology such as e-library services loaded lowest at 0.612. The third factors loaded to
R16 and R15 which can be clustered as research grant and scholarship. The University attract
funding through research grant loaded at 0.760 and The University attract funding through
attracting scholarship loading at 0.753 finally R14, R13 and R12 loaded to one factor that can be
interpreted as fundraising. In fundraising, the University undertakes fundraising; initiatives
through Philanthropies loaded the highest (0.798) while University undertake fundraising
initiatives through donors loading the lowest (0.743).
R = f ( Resource management, use of technology, fundraising, Scholarship and Research grant )
R = f (R6,R9,R5,R8,R7) (R20,R21,R18,R17) ( R14, R13, R12) and ( R16 and R15)
4.5.6 Drivers Partnership and Collaboration
Table 4.29 show the communalities for the partnership and collaboration
Table 4.29: Communalities for Partnership and Collaboration
Communalities Initial Extraction PC8:University has made remarkable contribution to the society trough
partnership and collaborations initiatives
1.000 .743
PC2:The University has established active local partnership and collaboration
with industries
1.000 .719
PC3:The University has established active local partnership and collaboration
with communities
1.000 .664
PC7:Partnership and collaboration has contributed to the branding of the
University.
1.000 .641
PC5:The University has established active international partnership and
collaboration with industries
1.000 .627
PC4:The University has established active international partnership and
collaboration with Universities
1.000 .613
PC1:The University has established active local partnership and collaboration
with other Universities
1.000 .577
PC9:Teaching and research is enhanced through collaboration and
partnerships
1.000 .544
PC10:Students are easily attached in relevant industries for their practical
experience
1.000 .459
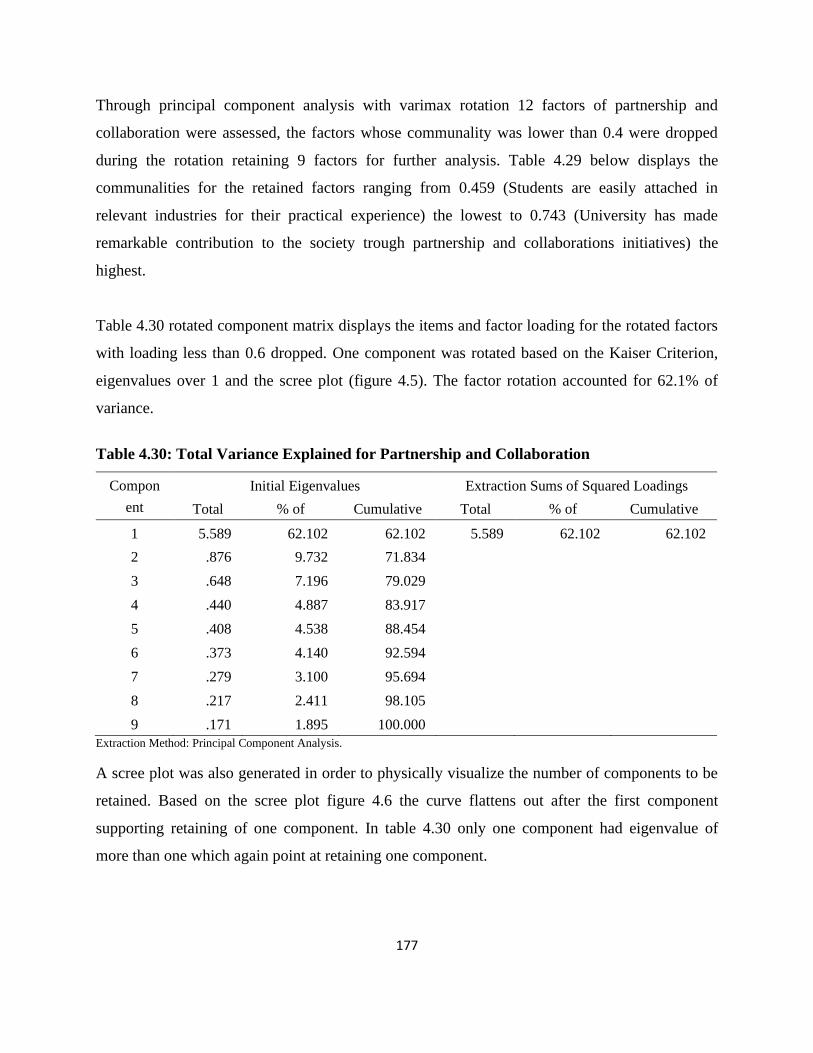
177
Through principal component analysis with varimax rotation 12 factors of partnership and
collaboration were assessed, the factors whose communality was lower than 0.4 were dropped
during the rotation retaining 9 factors for further analysis. Table 4.29 below displays the
communalities for the retained factors ranging from 0.459 (Students are easily attached in
relevant industries for their practical experience) the lowest to 0.743 (University has made
remarkable contribution to the society trough partnership and collaborations initiatives) the
highest.
Table 4.30 rotated component matrix displays the items and factor loading for the rotated factors
with loading less than 0.6 dropped. One component was rotated based on the Kaiser Criterion,
eigenvalues over 1 and the scree plot (figure 4.5). The factor rotation accounted for 62.1% of
variance.
Table 4.30: Total Variance Explained for Partnership and Collaboration
Compon
ent
Initial Eigenvalues Extraction Sums of Squared Loadings
Total % of
Variance
Cumulative
%
Total % of
Variance
Cumulative
% 1 5.589 62.102 62.102 5.589 62.102 62.102
2 .876 9.732 71.834
3 .648 7.196 79.029
4 .440 4.887 83.917
5 .408 4.538 88.454
6 .373 4.140 92.594
7 .279 3.100 95.694
8 .217 2.411 98.105
9 .171 1.895 100.000
Extraction Method: Principal Component Analysis.
A scree plot was also generated in order to physically visualize the number of components to be
retained. Based on the scree plot figure 4.6 the curve flattens out after the first component
supporting retaining of one component. In table 4.30 only one component had eigenvalue of
more than one which again point at retaining one component.

178
Figure 4.6: Scree Plot for Partnership and Collaboration
Table 4.31 below shows the rotated loading of the components; with loading less than 0.60
suppressed to retain loading that are very good and ease interpretation, this reduced the items
from ten to nine. All the retained nine items PC8, PC2, PC3, PC7, PC5, PC4, PC1, PC9 and
PC10 loaded positively to one component Partnership and Collaboration. This implies all the
items explain the same construct, University has made remarkable contribution to the society
through partnership and collaborations initiatives loaded the highest (0.862) while Students are
easily attached in relevant industries for their practical experience loaded the lowest (0.678).
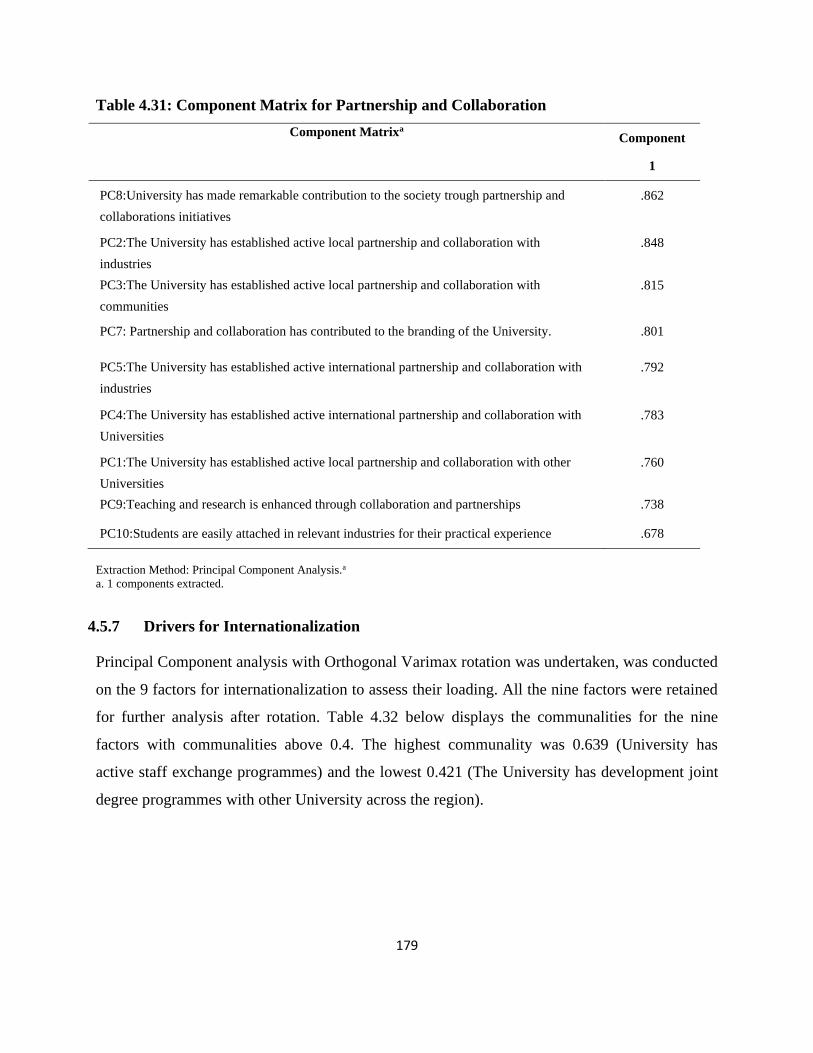
179
Table 4.31: Component Matrix for Partnership and Collaboration
Component Matrixa Component
1
PC8:University has made remarkable contribution to the society trough partnership and
collaborations initiatives
.862
PC2:The University has established active local partnership and collaboration with
industries
.848
PC3:The University has established active local partnership and collaboration with
communities
.815
PC7: Partnership and collaboration has contributed to the branding of the University. .801
PC5:The University has established active international partnership and collaboration with
industries
.792
PC4:The University has established active international partnership and collaboration with
Universities
.783
PC1:The University has established active local partnership and collaboration with other
Universities
.760
PC9:Teaching and research is enhanced through collaboration and partnerships .738
PC10:Students are easily attached in relevant industries for their practical experience .678
Extraction Method: Principal Component Analysis.a a. 1 components extracted.
4.5.7 Drivers for Internationalization
Principal Component analysis with Orthogonal Varimax rotation was undertaken, was conducted
on the 9 factors for internationalization to assess their loading. All the nine factors were retained
for further analysis after rotation. Table 4.32 below displays the communalities for the nine
factors with communalities above 0.4. The highest communality was 0.639 (University has
active staff exchange programmes) and the lowest 0.421 (The University has development joint
degree programmes with other University across the region).

180
Table 4.32: Communalities for Internationalization
Communalities
Initial Extraction
INT3: University has active staff exchange programmes 1.000 .639
INT6: The University has established an active international joint research
activities
1.000 .594
INT8: The University is an active member of academic International associations 1.000 .556
INT4: University undertakes recruitment of staff and researchers intenationally 1.000 .546
INT2: University has active student exchange programmes 1.000 .545
INT9: Benchmarking is done with other world class universities 1.000 .536
INT1: Internationalization is a key University agenda. 1.000 .488
INT5: University programmes are intenationally accredited 1.000 .480
INT7: The University has development joint degree programmes with other
University across the region.
1.000 .421
Table 4.33 shows the total variance explained for internationalization. One component was
rotated based on the Kaiser-Criterion, eigenvalues over 1 and the scree plot (figure 4. 7). The
total variance explained 53% of the variation.
Table 4.33: Total Variance Explained for Internationalization
Total Variance Explained
Compone
nt
Initial Eigenvalues Extraction Sums of Squared Loadings
Total % of
Variance
Cumulative
%
Total % of
Variance
Cumulative
% 1 4.805 53.392 53.392 4.805 53.392 53.392
2 .806 8.954 62.346
3 .742 8.249 70.595
4 .636 7.068 77.663
5 .591 6.570 84.232
6 .495 5.499 89.731
7 .353 3.918 93.649
8 .296 3.286 96.935
9 .276 3.065 100.000
A scree plot figure 4.7.was generated to physically visualize the components that are important
According to the scree plot one component can be retained since the curve flattens after the first
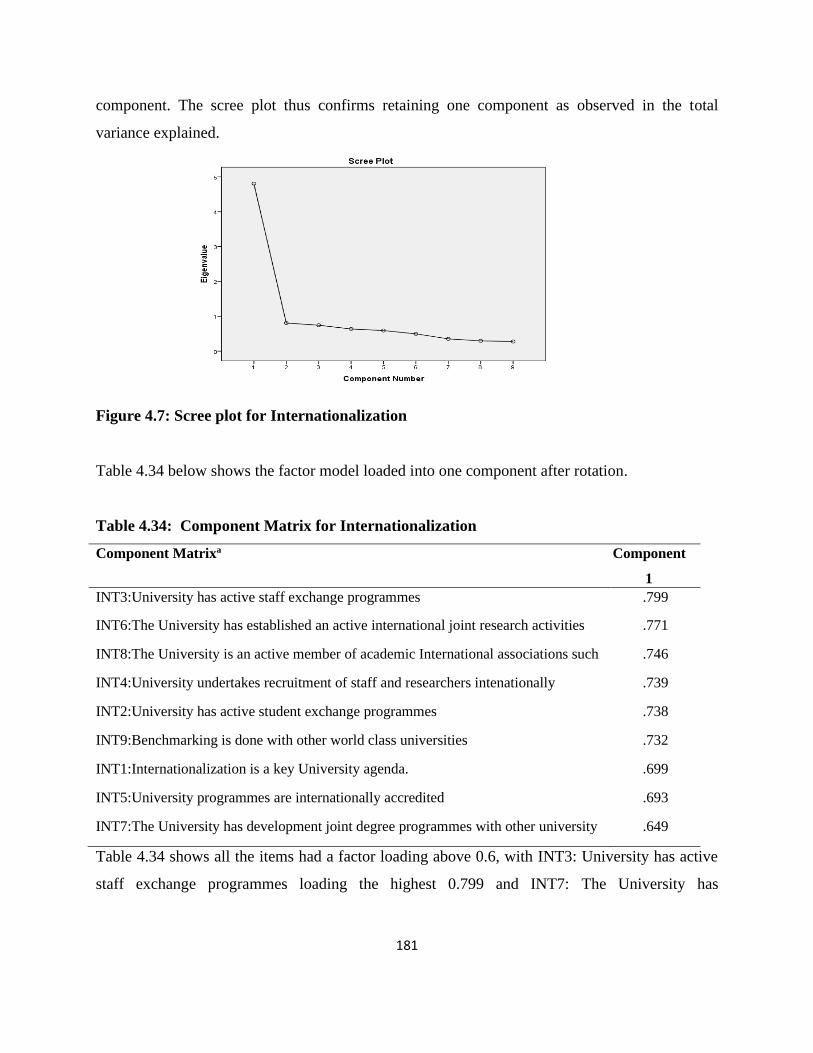
181
component. The scree plot thus confirms retaining one component as observed in the total
variance explained.
Figure 4.7: Scree plot for Internationalization
Table 4.34 below shows the factor model loaded into one component after rotation.
Table 4.34: Component Matrix for Internationalization
Component Matrixa Component
1
INT3:University has active staff exchange programmes .799
INT6:The University has established an active international joint research activities .771
INT8:The University is an active member of academic International associations such
as AAU.
.746
INT4:University undertakes recruitment of staff and researchers intenationally .739
INT2:University has active student exchange programmes .738
INT9:Benchmarking is done with other world class universities .732
INT1:Internationalization is a key University agenda. .699
INT5:University programmes are internationally accredited .693
INT7:The University has development joint degree programmes with other university
across the region.
.649
Table 4.34 shows all the items had a factor loading above 0.6, with INT3: University has active
staff exchange programmes loading the highest 0.799 and INT7: The University has
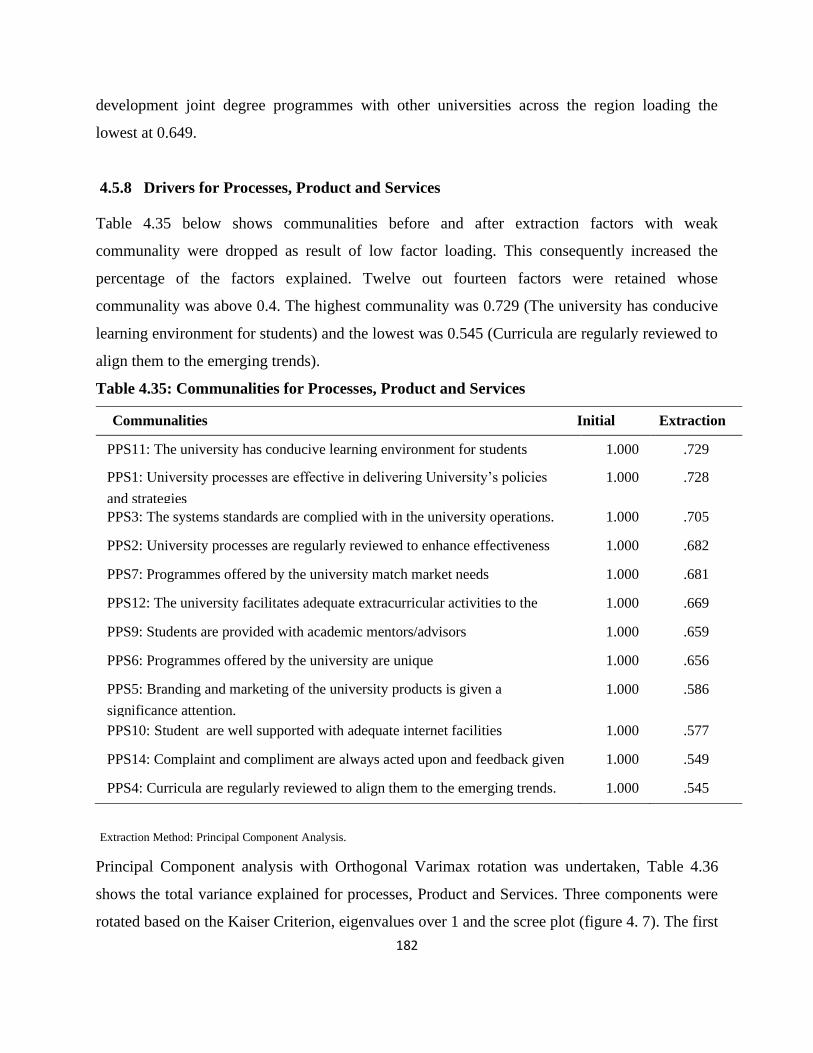
182
development joint degree programmes with other universities across the region loading the
lowest at 0.649.
4.5.8 Drivers for Processes, Product and Services
Table 4.35 below shows communalities before and after extraction factors with weak
communality were dropped as result of low factor loading. This consequently increased the
percentage of the factors explained. Twelve out fourteen factors were retained whose
communality was above 0.4. The highest communality was 0.729 (The university has conducive
learning environment for students) and the lowest was 0.545 (Curricula are regularly reviewed to
align them to the emerging trends).
Table 4.35: Communalities for Processes, Product and Services
Communalities Initial Extraction
PPS11: The university has conducive learning environment for students 1.000 .729
PPS1: University processes are effective in delivering University’s policies
and strategies
1.000 .728
PPS3: The systems standards are complied with in the university operations. 1.000 .705
PPS2: University processes are regularly reviewed to enhance effectiveness 1.000 .682
PPS7: Programmes offered by the university match market needs 1.000 .681
PPS12: The university facilitates adequate extracurricular activities to the
students.
1.000 .669
PPS9: Students are provided with academic mentors/advisors 1.000 .659
PPS6: Programmes offered by the university are unique 1.000 .656
PPS5: Branding and marketing of the university products is given a
significance attention.
1.000 .586
PPS10: Student are well supported with adequate internet facilities 1.000 .577
PPS14: Complaint and compliment are always acted upon and feedback given 1.000 .549
PPS4: Curricula are regularly reviewed to align them to the emerging trends. 1.000 .545
Extraction Method: Principal Component Analysis.
Principal Component analysis with Orthogonal Varimax rotation was undertaken, Table 4.36
shows the total variance explained for processes, Product and Services. Three components were
rotated based on the Kaiser Criterion, eigenvalues over 1 and the scree plot (figure 4. 7). The first
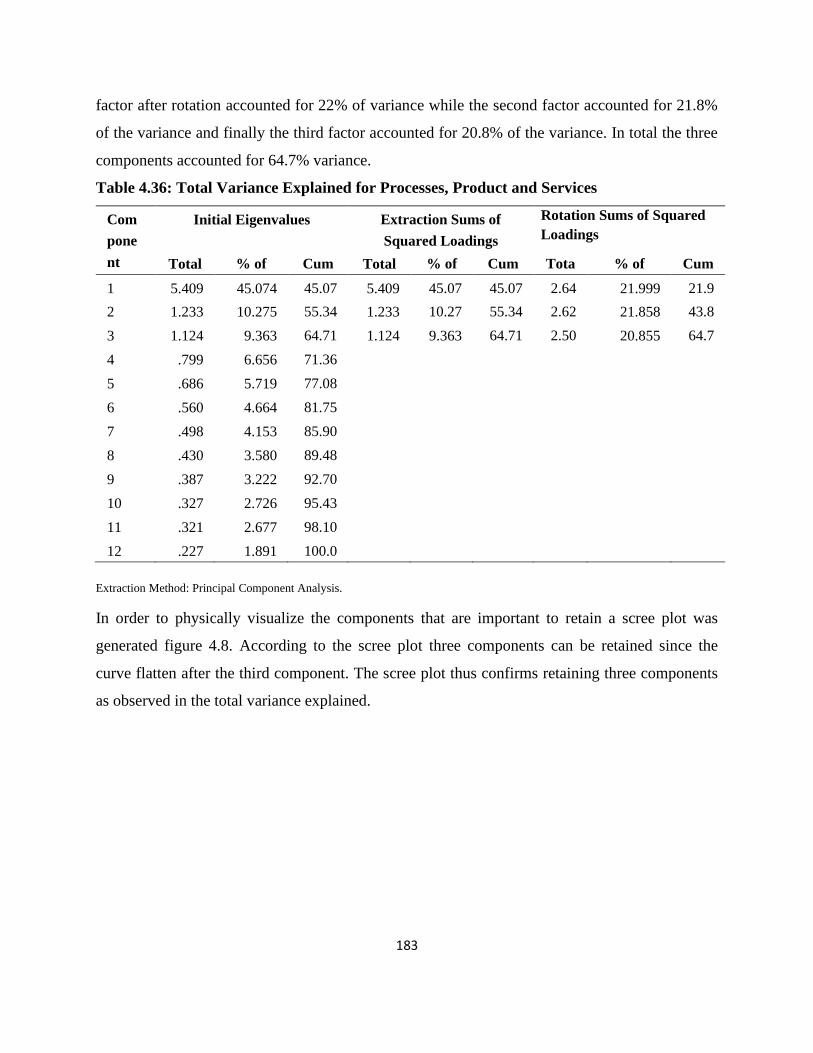
183
factor after rotation accounted for 22% of variance while the second factor accounted for 21.8%
of the variance and finally the third factor accounted for 20.8% of the variance. In total the three
components accounted for 64.7% variance.
Table 4.36: Total Variance Explained for Processes, Product and Services
Com
pone
nt
Initial Eigenvalues Extraction Sums of
Squared Loadings
Rotation Sums of Squared
Loadings
Total % of
Varianc
e
Cum
%
Total % of
Varia
nce
Cum
%
Tota
l
% of
Variance
Cum
% 1 5.409 45.074 45.07
4
5.409 45.07
4
45.07
4
2.64
0
21.999 21.9
99 2 1.233 10.275 55.34
8
1.233 10.27
5
55.34
8
2.62
3
21.858 43.8
57 3 1.124 9.363 64.71
2
1.124 9.363 64.71
2
2.50
3
20.855 64.7
12 4 .799 6.656 71.36
8
5 .686 5.719 77.08
7
6 .560 4.664 81.75
1
7 .498 4.153 85.90
3
8 .430 3.580 89.48
3
9 .387 3.222 92.70
6
10 .327 2.726 95.43
2
11 .321 2.677 98.10
9
12 .227 1.891 100.0
00
Extraction Method: Principal Component Analysis.
In order to physically visualize the components that are important to retain a scree plot was
generated figure 4.8. According to the scree plot three components can be retained since the
curve flatten after the third component. The scree plot thus confirms retaining three components
as observed in the total variance explained.
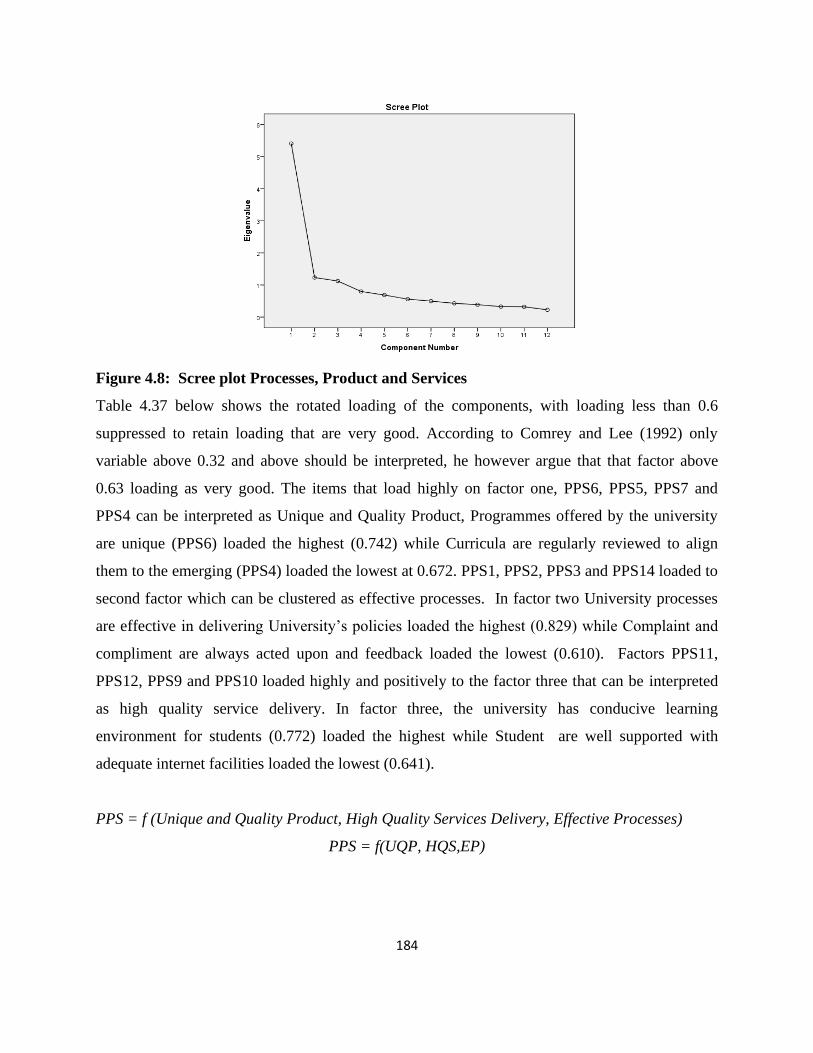
184
Figure 4.8: Scree plot Processes, Product and Services
Table 4.37 below shows the rotated loading of the components, with loading less than 0.6
suppressed to retain loading that are very good. According to Comrey and Lee (1992) only
variable above 0.32 and above should be interpreted, he however argue that that factor above
0.63 loading as very good. The items that load highly on factor one, PPS6, PPS5, PPS7 and
PPS4 can be interpreted as Unique and Quality Product, Programmes offered by the university
are unique (PPS6) loaded the highest (0.742) while Curricula are regularly reviewed to align
them to the emerging (PPS4) loaded the lowest at 0.672. PPS1, PPS2, PPS3 and PPS14 loaded to
second factor which can be clustered as effective processes. In factor two University processes
are effective in delivering University’s policies loaded the highest (0.829) while Complaint and
compliment are always acted upon and feedback loaded the lowest (0.610). Factors PPS11,
PPS12, PPS9 and PPS10 loaded highly and positively to the factor three that can be interpreted
as high quality service delivery. In factor three, the university has conducive learning
environment for students (0.772) loaded the highest while Student are well supported with
adequate internet facilities loaded the lowest (0.641).
PPS = f (Unique and Quality Product, High Quality Services Delivery, Effective Processes)
PPS = f(UQP, HQS,EP)

185
Table 4.37: Rotated Component Matrix for Processes, Product and Services
Rotated Component Matrixa
Component
1 2 3
PPS6:Programmes offered by the university are unique .742
PPS5:Branding and marketing of the university products is given a
significance attention.
.741
PPS7:Programmes offered by the university match market needs .718
PPS4:Curricula are regularly reviewed to align them to the
emerging trends.
.672
PPS1:University processes are effective in delivering University’s
policies and strategies
.829
PPS2:University processes are regularly reviewed to enhance
effectiveness
.766
PPS3:The systems standards are complied with in the university
operations.
.741
PPS14:Complaint and compliment are always acted upon and
feedback given
.610
PPS11:The university has conducive learning environment for
students
.772
PPS9:Students are provided with academic mentors/advisors .746
PPS12:The university facilitates adequate extracurricular activities
to the students.
.740
PPS10:The Student are well supported with adequate internet
facilities
.641
Extraction Method: Principal Component Analysis.
Rotation Method: Varimax with Kaiser Normalization.a
4.6 Post Factor Analysis Reliability Test
Reliability coefficients normally range from 0.00 to 1.00, the higher the coefficient the higher the
reliability. Cronbach’s alpha is the most widely used measure of reliability (Tavakol & Dennick,
2011). Table 4.38 shows the reliabilities for the items after factor analysis were all are above 0.7

186
with partnership and collaboration been as high as 0.922 and the lowest performance at 0.721.
The variables that loaded to only one component had their Cronbach’s higher than those that
loaded to more than one component since they are measuring the same item. Achieving high
coefficient is a confirmation of the stability of measure of the tool developed, its internal
consistency of measurement instrument and reliability of the instrument scores. This also
demonstrate that the tool is valid based on the fact that reliability is closely related to validity
(Kimberlin and Winterstein, 2008 ).
Table 4.38: Post Factor Analysis Reliability Test
Before factor Analysis After factor Analysis
Variable Variable Type Number
of Items
Cronbach’s
Alpha
Number
of Items
Cronbach’s
Alpha
Leadership
Independent (x1) 21 0.936 10 0.879
People
Management
Independent (x2)
14 0.844 8 0.830
Policy and
Strategy
Independent (x3) 7 0.849 6 0.860
Resources Independent (x4) 21 0.824 13 0.760
Partnership and
Collaboration
Independent (x5) 10 0.852 9 0.922
Internationalizatio
n
Independent (x6) 9 0.888 9 0.888
Processes,
Product and
Services
Independent (x7) 14 0.905 11 0876
Performance Dependent (y) 5 0.721 5 0.721
101 72
4.7 Test of Regression Assumptions
To prevent getting biased results, a number of tests are usually undertaken before the data
analysis to establish it validity this include test for outlier, test of linearity, test for normality, test
for multicollinearity, test of independence, and test of homoscedasticity. According to Ghasemi
& Zahediasl (2012) statistical errors are common within scientific literature; they note that most
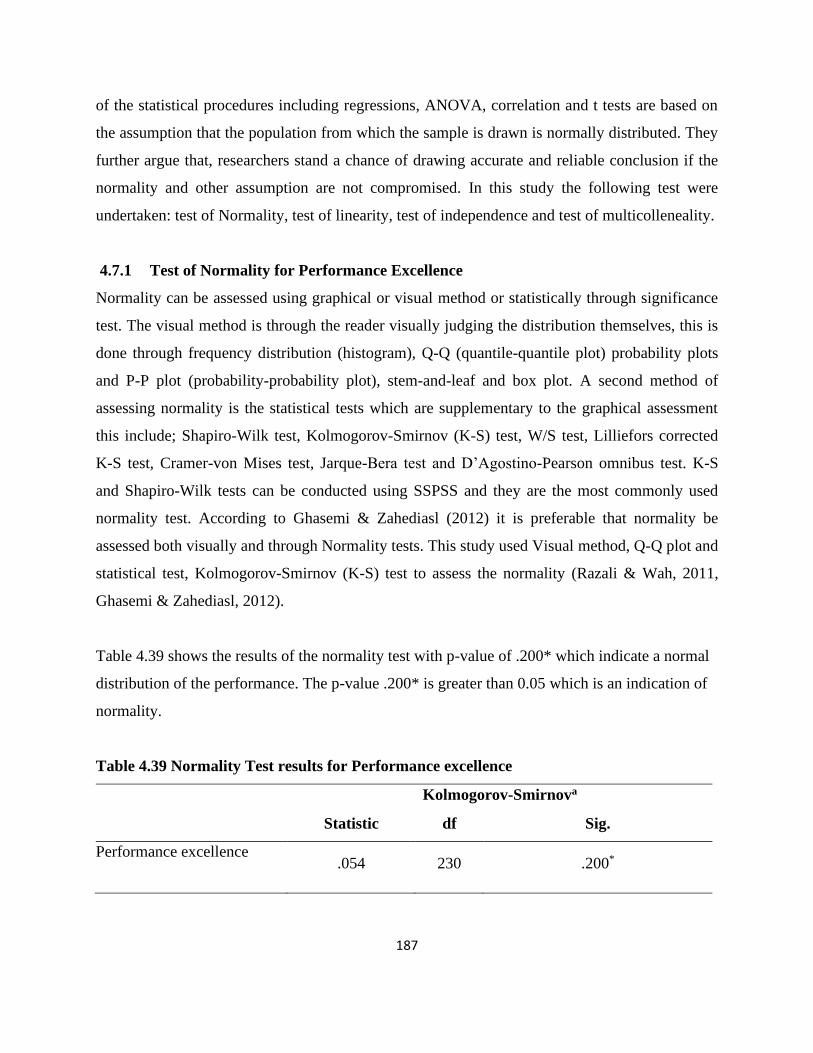
187
of the statistical procedures including regressions, ANOVA, correlation and t tests are based on
the assumption that the population from which the sample is drawn is normally distributed. They
further argue that, researchers stand a chance of drawing accurate and reliable conclusion if the
normality and other assumption are not compromised. In this study the following test were
undertaken: test of Normality, test of linearity, test of independence and test of multicolleneality.
4.7.1 Test of Normality for Performance Excellence
Normality can be assessed using graphical or visual method or statistically through significance
test. The visual method is through the reader visually judging the distribution themselves, this is
done through frequency distribution (histogram), Q-Q (quantile-quantile plot) probability plots
and P-P plot (probability-probability plot), stem-and-leaf and box plot. A second method of
assessing normality is the statistical tests which are supplementary to the graphical assessment
this include; Shapiro-Wilk test, Kolmogorov-Smirnov (K-S) test, W/S test, Lilliefors corrected
K-S test, Cramer-von Mises test, Jarque-Bera test and D’Agostino-Pearson omnibus test. K-S
and Shapiro-Wilk tests can be conducted using SSPSS and they are the most commonly used
normality test. According to Ghasemi & Zahediasl (2012) it is preferable that normality be
assessed both visually and through Normality tests. This study used Visual method, Q-Q plot and
statistical test, Kolmogorov-Smirnov (K-S) test to assess the normality (Razali & Wah, 2011,
Ghasemi & Zahediasl, 2012).
Table 4.39 shows the results of the normality test with p-value of .200* which indicate a normal
distribution of the performance. The p-value .200* is greater than 0.05 which is an indication of
normality.
Table 4.39 Normality Test results for Performance excellence
Kolmogorov-Smirnova
Statistic df Sig.
Performance excellence .054 230 .200*
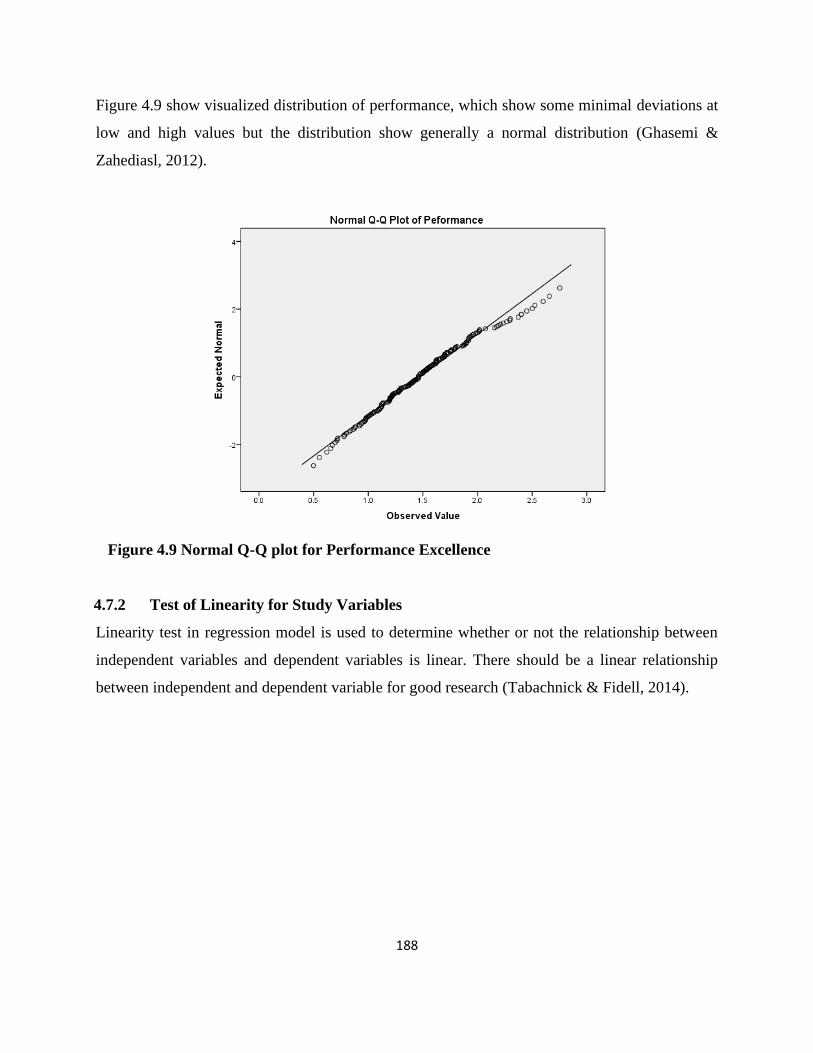
188
Figure 4.9 show visualized distribution of performance, which show some minimal deviations at
low and high values but the distribution show generally a normal distribution (Ghasemi &
Zahediasl, 2012).
Figure 4.9 Normal Q-Q plot for Performance Excellence
4.7.2 Test of Linearity for Study Variables
Linearity test in regression model is used to determine whether or not the relationship between
independent variables and dependent variables is linear. There should be a linear relationship
between independent and dependent variable for good research (Tabachnick & Fidell, 2014).

189
Table 4.40 Correlations Matrix Summary
Correlations
Peformance LMG PM Resources PC INT PS PPS
Peformance Pearson Correlation 1
Sig. (2-tailed)
N 230
LMG Pearson Correlation .840** 1
Sig. (2-tailed) .000
N 230 230
PM Pearson Correlation .603** .450** 1
Sig. (2-tailed) .000 .000
N 230 230 230
Resources Pearson Correlation .640** .498** .603** 1
Sig. (2-tailed) .000 .000 .000
N 230 230 230 230
PC Pearson Correlation .532** .480** .427** .584** 1
Sig. (2-tailed) .000 .000 .000 .000
N 230 230 230 230 230
INT Pearson Correlation .577** .424** .452** .501** .432** 1
Sig. (2-tailed) .000 .000 .000 .000 .000
N 230 230 230 230 230 230
PS Pearson Correlation .644** .707** .532** .519** .481** .458** 1
Sig. (2-tailed) .000 .000 .000 .000 .000 .000
N 230 230 230 230 230 230 230
PPS Pearson Correlation .454** .423** .418** .408** .316** .296** .443** 1
Sig. (2-tailed) .000 .000 .000 .000 .000 .000 .000
N 230 230 230 230 230 230 230 230
**. Correlation is significant at the 0.01 level (2-tailed).
Table 4.40 above shows the summary of all the independent variables, they are all correlated to
the dependent variable performance with a p-value of 0.000. P<0.01 hence there is enough
evidence to suggest the relationship is significant. Leadership had the highest correlation at 84%
while processes, product and services had the lowest 45.4% correlation to performance
excellence of HEIs.

190
4.7.3 Test of Independence for Independent Variable
The test of independence was undertaken using Durbin-Watson (d) statistic. Durbin-Watson d
statistic tests the presence of autocorrelation. Durbin-Watson statistics ranges from 0 to 4, with a
value near 2 indicating non-autocorrelation and a value near 0 indicating positive autocorrelation
and a value towards 4 indicating negative auto-correlation. The result in Table 4.41 shows
Durbin-Watson statistics as follows leadership (1.869), people management (1.936), policy and
strategy (1.978), resources (1.888 internationalization (1.777 ) and processes, product and
services (1.877), this is within the acceptable range of 1.5 to 2.5 for independent observation
(Garson, 2012). The absence of autocorrelation allows the study to utilize all the independent
variables.
Table 4.41: Coefficients of Durbin-Watson Test of Independence
4.7.4 Test of Multicollinearity for Independent Variable
Multicollinearity occur when more than two independent variables are moderately or highly
correlated, when multicollinearity occurs it can have major effect on multiple regression making
the regression coefficient to erratically change whenever there are small changes in the sample
(Cooper and Schindler, 2006 ). According to Adeboye et al.(2014) Multicollinearity is a
problem that arise out of violation of the assumption that explanatory variables are leanearly
independent, they further observe that though multicollinearity is almost presence, the real issue
is determining the degree at which it becomes “harmful”. In this study the presence of
Predictor Durbin-Watson
Leadership 1.869
People Management 1.936
Policy and Strategy 1.978
Resources 1.888
Partnership and Collaboration 1.766
Internationalization 1.777
Process, product and services 1.877

191
Multicollinearity among the variables was tested using tolerance levels and Variance Inflation
Factor (VIF) statistics of predictor variables. Tolerance level is calculated by regressing
independent variable against the remaining independent variables, high levels of tolerance are
more desirable by researcher since low level of tolerance is an indicator of high level of
multicollinearity. VIF is the reciprocal of the tolerance with researcher preferring lower level of
VIF, higher level of VIF interferes with multiple regressions (Adeboye et al.,2014). As observed
by Hair et al (1998), Lower tolerance values and higher VIF values is and indicator of
multicollinearity. The findings in Table 4.42 below shows that VIF for all the 7 variable was
ranging between 1.252 (resources) and 2.127 (policy and strategy). Adeboye et al (2014) indicate
that multicollinearity start to exist when VIF is more than 2.5 and anytime when tolerance levels
get below 0.40, in this study all the VIF were less than 2.5 while the tolerance were all greater
than 0.4.
Table 4.42: Multicollinearity Test Results
Model
Collinearity Statistics
Tolerance VIF
Processes Product and services .481 2.078
People management (PM) .616 1.624
Internationalization (INT) .653 1.532
Policy and strategy (PS) .470 2.127
Leadership (LMG) .680 1.471
Resources (R) .799 1.252
Partnership and Collaborations (PC) .644 1.553
a. Dependent Variable: Performance
4.8 Gaps in Drivers of Performance Excellence
Regression analysis was carried out to determine the correlation between the independent
variable and dependent variables, this was to help in analyzing the variables and establishing the
gaps in the drivers of performance excellence in the Universities.
4.8.1 Bivariate Analysis of Drivers and Performance Excellence
The seven variables, Leadership, resources, policy and strategy, partnership and collaborations,
internationalization and process, product and services were individually entered as the
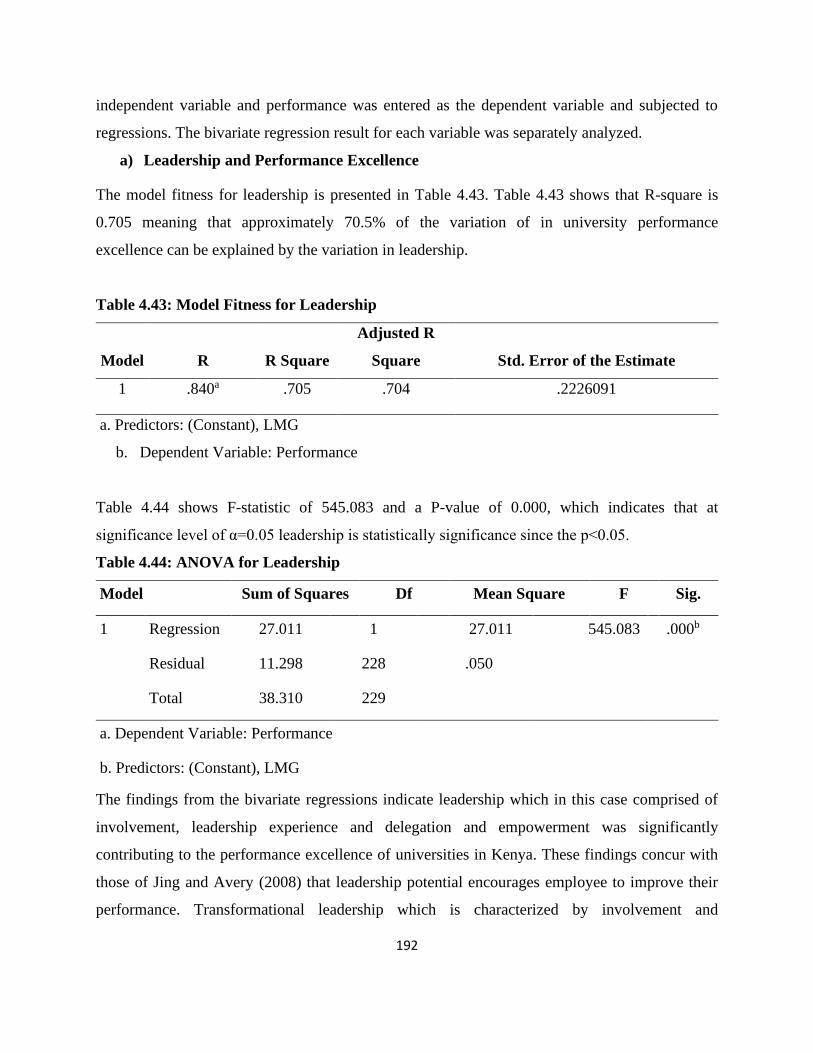
192
independent variable and performance was entered as the dependent variable and subjected to
regressions. The bivariate regression result for each variable was separately analyzed.
a) Leadership and Performance Excellence
The model fitness for leadership is presented in Table 4.43. Table 4.43 shows that R-square is
0.705 meaning that approximately 70.5% of the variation of in university performance
excellence can be explained by the variation in leadership.
Table 4.43: Model Fitness for Leadership
Model R R Square
Adjusted R
Square Std. Error of the Estimate
1 .840a
.705
.704
.2226091
a. Predictors: (Constant), LMG
b. Dependent Variable: Performance
Table 4.44 shows F-statistic of 545.083 and a P-value of 0.000, which indicates that at
significance level of α=0.05 leadership is statistically significance since the p<0.05.
Table 4.44: ANOVA for Leadership
Model Sum of Squares Df Mean Square F Sig.
1 Regression 27.011 1 27.011 545.083 .000b
Residual 11.298 228 .050
Total 38.310 229
a. Dependent Variable: Performance
b. Predictors: (Constant), LMG
The findings from the bivariate regressions indicate leadership which in this case comprised of
involvement, leadership experience and delegation and empowerment was significantly
contributing to the performance excellence of universities in Kenya. These findings concur with
those of Jing and Avery (2008) that leadership potential encourages employee to improve their
performance. Transformational leadership which is characterized by involvement and
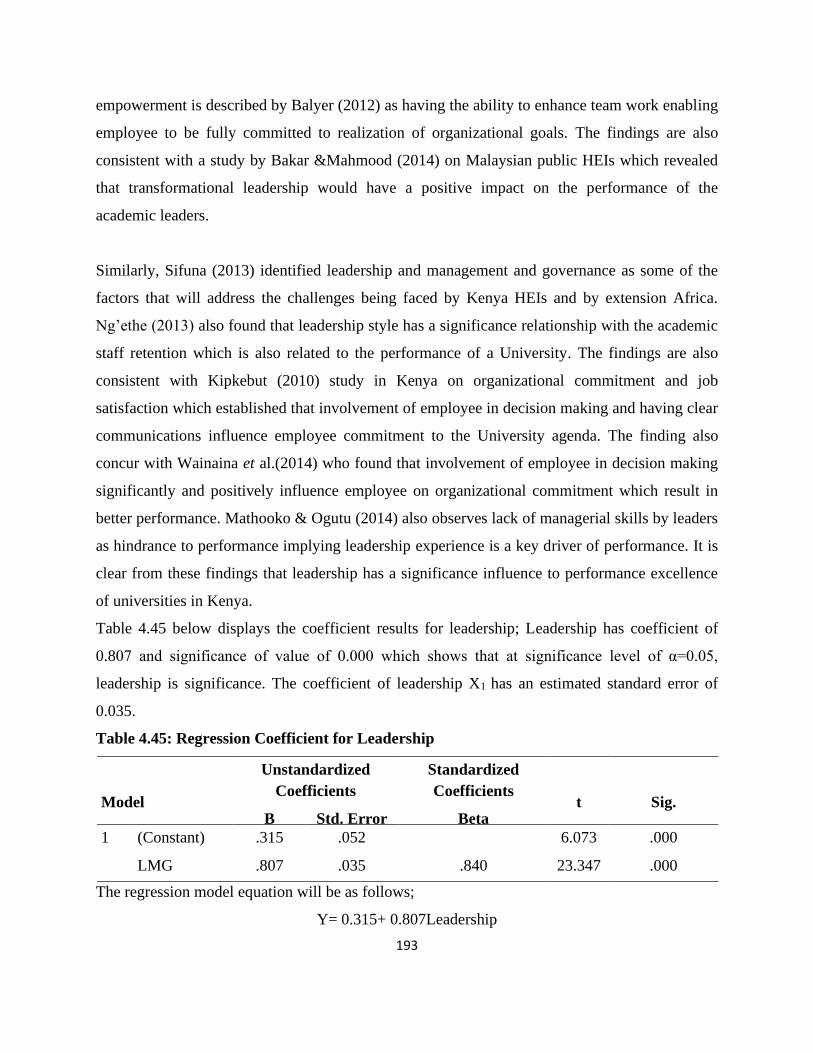
193
empowerment is described by Balyer (2012) as having the ability to enhance team work enabling
employee to be fully committed to realization of organizational goals. The findings are also
consistent with a study by Bakar &Mahmood (2014) on Malaysian public HEIs which revealed
that transformational leadership would have a positive impact on the performance of the
academic leaders.
Similarly, Sifuna (2013) identified leadership and management and governance as some of the
factors that will address the challenges being faced by Kenya HEIs and by extension Africa.
Ng’ethe (2013) also found that leadership style has a significance relationship with the academic
staff retention which is also related to the performance of a University. The findings are also
consistent with Kipkebut (2010) study in Kenya on organizational commitment and job
satisfaction which established that involvement of employee in decision making and having clear
communications influence employee commitment to the University agenda. The finding also
concur with Wainaina et al.(2014) who found that involvement of employee in decision making
significantly and positively influence employee on organizational commitment which result in
better performance. Mathooko & Ogutu (2014) also observes lack of managerial skills by leaders
as hindrance to performance implying leadership experience is a key driver of performance. It is
clear from these findings that leadership has a significance influence to performance excellence
of universities in Kenya.
Table 4.45 below displays the coefficient results for leadership; Leadership has coefficient of
0.807 and significance of value of 0.000 which shows that at significance level of α=0.05,
leadership is significance. The coefficient of leadership X1 has an estimated standard error of
0.035.
Table 4.45: Regression Coefficient for Leadership
Model
Unstandardized
Coefficients
Standardized
Coefficients t Sig.
B Std. Error Beta
1 (Constant) .315 .052 6.073 .000
LMG .807 .035 .840 23.347 .000
The regression model equation will be as follows;
Y= 0.315+ 0.807Leadership
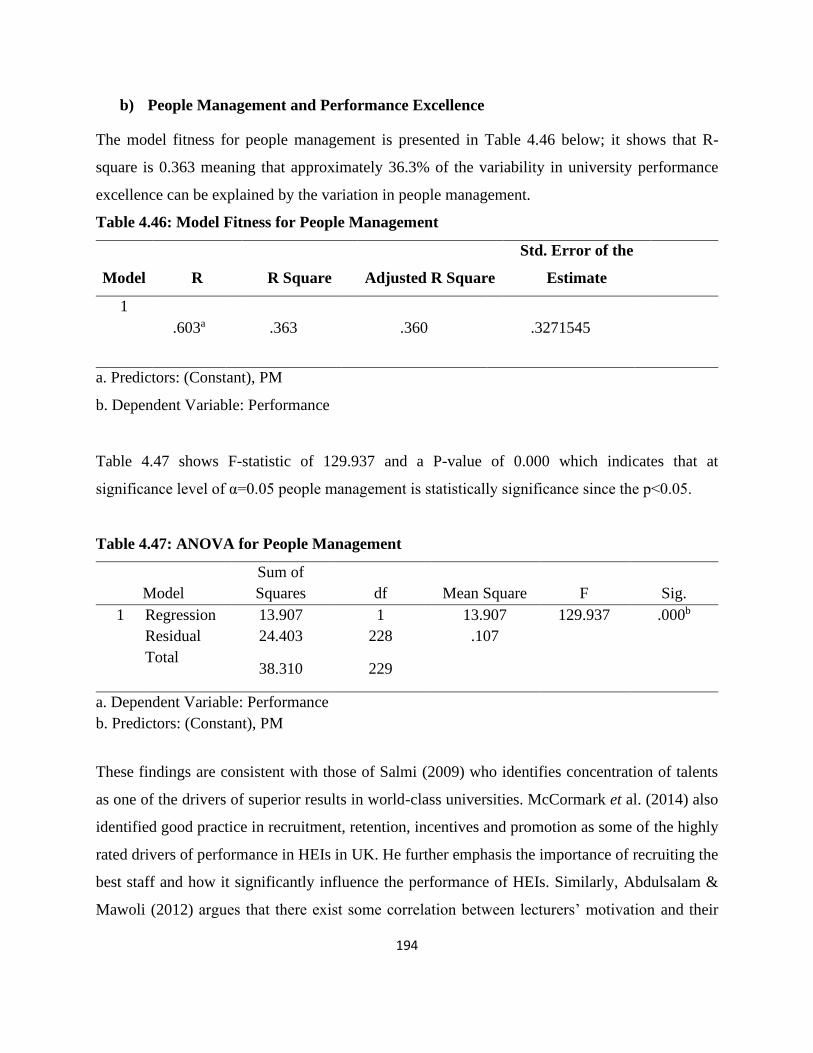
194
b) People Management and Performance Excellence
The model fitness for people management is presented in Table 4.46 below; it shows that R-
square is 0.363 meaning that approximately 36.3% of the variability in university performance
excellence can be explained by the variation in people management.
Table 4.46: Model Fitness for People Management
Model R R Square Adjusted R Square
Std. Error of the
Estimate
1
.603a .363 .360 .3271545
a. Predictors: (Constant), PM
b. Dependent Variable: Performance
Table 4.47 shows F-statistic of 129.937 and a P-value of 0.000 which indicates that at
significance level of α=0.05 people management is statistically significance since the p<0.05.
Table 4.47: ANOVA for People Management
Model
Sum of
Squares df Mean Square F Sig.
1 Regression 13.907 1 13.907 129.937 .000b
Residual 24.403 228 .107
Total 38.310 229
a. Dependent Variable: Performance
b. Predictors: (Constant), PM
These findings are consistent with those of Salmi (2009) who identifies concentration of talents
as one of the drivers of superior results in world-class universities. McCormark et al. (2014) also
identified good practice in recruitment, retention, incentives and promotion as some of the highly
rated drivers of performance in HEIs in UK. He further emphasis the importance of recruiting the
best staff and how it significantly influence the performance of HEIs. Similarly, Abdulsalam &
Mawoli (2012) argues that there exist some correlation between lecturers’ motivation and their

195
performances in research and teaching institution. These findings are intandem with Kipkebut
(2010) who established employee promotion in Kenyan universities influence their commitment
and reduce their intention to leave their institution.
The finding are consistent with the study of Mbirithi (2013) who established heavy teaching
work load as one of the challenges facing Kenya’s public universities and consequently affecting
the quality of education. Heavy teaching workload has a negative effect to the quality of teaching
since the lecturers lack adequate time to prepare for lecture delivery. These study findings
contributes to the literature through highlighting the importance of human resource through
people management in the system theory. The system theory identifies human resource as one of
the component of inputs that facilitates a system to operate to achieve its goals (Daft et al, 2012).
The study findings indicate there is a significance relationship between the people management
(motivation and high talents) and the performance excellence which point out the relevance of
people in an organization. The top world universities reviewed in this study had a common
characteristic of high number of highly qualified faculty members. This was evidenced from
their low student to staff ratios. MIT had 91% of academic staff with doctoral degree and 56.7%
of academic staff were professors with a student to staff ratio of 8:1 (MIT Facts, 2015), while
UCT had 72% of it fulltime academic staff qualified with doctoral degree and a student to staff
ratio of 12:1(University of Capetown,2015).
Table 4.52 shows the regression coefficient for people management. People management has a
coefficient of 0.566. The coefficient of People management has an estimated standard error of
0.050, F-statistic of 129.937 and a P-value of 0.000. The result indicates that at significance
level of α=0.05 people management is statistically significance since the p<0.05.
Table 4.48: Regression coefficient for People Management
Model
Unstandardized
Coefficients
Standardized
Coefficients
t Sig. B Std. Error Beta
1 (Constant) .740 .068 10.896 .000
PM .566 .050 .603 11.399 .000

196
The regression model equation will be as follows;
Y= 0.740+ 0.566 People Management
Based on the regression model analysis the results indicate that people management (motivation
and talents) have a statistically positive significance relationship with universities performance
excellence.
c) Resources and Performance Excellence
The model fitness for resources is presented in Table 4.49. Table 4.49 shows that R-square is
0.410 meaning that approximately 41% of the variability in University performance excellence
can be explained by the variation in resources.
Table 4.49: Model Fitness for Resources
Model R R Square Adjusted R Square Std. Error of the Estimate
1 .640a .410 .407 .3148720
a. Predictors: (Constant), Resources
b. Dependent Variable: Performance
Table 4.50: ANOVA for resources shows F-statistic of 158.406 and a P-value of 0.000. The
result indicates that at significance level of α=0.05 resources is statistically significance since
p<0.05.
Table 4.50: ANOVA for Resources
Model
Sum of
Squares Df Mean Square F Sig.
1 Regression 15.705 1 15.705 158.406 .000b
Residual 22.605 228 .099
Total 38.310 229
a. Dependent Variable: Performance
b. Predictors: (Constant), Resources

197
The findings agree with resource based view theory which infers that organizational resources
are key determinant of its performance (Hoffer and Schendel, 1978).
Avolio et al. (2009) observes that, leadership does not depend on the leadership alone but it also
depends on the surrounding environment and accessible resources. Douglas (2014) refers to
world-class universities as a University that are well equipped with great state of the art facilities.
Altbach 2004; Alden & Lin, 2004; Niland, 2007 also describe a World-Class University as, a
University characterised by well-equipped facilities for teaching and research. These research is
also consistence with Salmi (2009) findings that abundant resource is one of the drivers of
performance excellence, he argue that Ivy League universities in the US as well as Oxford
University and Cambridge University in UK are characterised by abundant resources. Similar
observation is made for the new WCU such as National University of Singapore and Tsing Hua
University in China.
WCU universities have huge endowment funds which they have managed to raise through
fundraising as some of their strategies for resource mobilisation. The funds enhance their
financial sustainability through contributing to the operation costs as well as giving need-based
scholarship to their students. Similarly, David (2013) shares the same view that organization
relies on their resources to exploit their opportunities and reduce the effect of their threats. Well-
funded Universities are likely to attract and retain the best scholars, offer better terms of service
that consequently result to higher quality publication work (Bothwell, July 9, 2015; Bothwell,
2016, April 21).These study findings are also consistence with Mbirithi (2013) observation that,
most of the HEIs in Kenya are suffering due to inadequate teaching and learning resources
including library facilities, laboratory and lecturer halls that affect their performance. The study
is also consistence with Kashorda and Waema, (2014) findings that Kenya HEIs have been slow
in adopting e-learning platform, implying slow adoption and use of technology has being
fettering them to compete with emerging global trends. Technology bring efficiency and raisies
the level of performance.
Table 4.51 below displays the coefficient results for resources; resources has coefficient of 0.505
and significance of value of 0.000 which shows that at significance level of α=0.05, leadership is
significance. The coefficient of resources has an estimated standard error of 0.040.

198
Table 4.51: Regression Coefficient for Resources
Model
Unstandardized Coefficients
Standardized
Coefficients
T Sig. B Std. Error Beta
1 (Constant) .785 .059 13.390 .000
Resources .505 .040 .640 12.586 .000
The regression model equation will be as follows;
Y= 0.785+ 0.505Resources
Based on the multiple regression model analysis the findings indicate that resources (resource
management, fundraising, technology and scholarship and research grant) contribute to
universities performance excellence.
d) Partnership and Collaboration and Performance Excellence
The model fitness for Partnership and collaboration is presented in Table 4.52. Table 4.52 shows
that R-square is 0.283 meaning that approximately 28.3% of the variability in University
performance excellence can be explained by the variation in partnership and collaboration.
Table 4.52: Model fitness for Partnership and Collaboration
Model R R Square Adjusted R Square
Std. Error of the
Estimate
1 .532a .283 .280 .3470634
a. Predictors: (Constant), PC
b. Dependent Variable: Performance
The ANOVA Table 4.53 shows F-statistic of 90.049 and a P-value of 0.000. The result indicates
that at significance level of α=0.05 partnership and collaboration is statistically significance since
the p<0.05.

199
Table 4.53: ANOVA for Partnership and Collaboration
Model Sum of Squares df Mean Square F Sig.
1 Regression 10.847 1 10.847 90.049 .000b
Residual 27.463 228 .120
Total 38.310 229
a. Dependent Variable: Performance
b. Predictors: (Constant), PC
Partnership and collaboration was statistically significance, this implies the better networked a
university is the more it enhances it performance excellence. These findings are consistence with
Hatakenaka (2015), while undertaking a study on University–Industry Partnership for MIT,
Tokyo and Cambridge, he observed that the Universities which are widely networked are able to
learn the real problems facing the industries and offer solutions based on experience. The
findings are consistence with findings upon review of MIT which is one of the world best
University, MIT has more than 700 partnerships and collaborations with some of the biggest
companies such as Boeing, BMW, Ford, Samsung, shell and other world reputable companies.
MIT also collaborates with other leading universities such as Harvard University (MIT Facts,
2015; Harvard University, 2016). A study by Tumuti et al. (2013)on partnership between
Kenyatta University and Equity Bank revealed that, the partnership was beneficial to the
community as well as enhancing the student hands own skills and experience.
Table 4.54 displays the regression coefficient results for partnership and collaboration;
Partnership and collaboration has coefficient of 0.435 and significance of value of 0.000. The
coefficient of partnership and collaboration has an estimated standard error of 0.046.

200
Table 4.54: Regression Coefficient for Partnership and Collaboration
Model
Unstandardized
Coefficients
Standardized
Coefficients
t Sig. B Std. Error Beta
1 (Constant) .898 .065 13.816 .000
PC .435 .046 .532 9.489 .000
The regression model equation will be as follows;
Y= 0.898+ 0.435 Partnership and Collaboration
The regression model indicates a positive and significance relationship with universities
performance excellence.
e) Internationalization and Performance Excellence
The model fitness for internationalization is presented in Table 4.55. Table 4.55 shows that R-
square is 0.330 meaning that approximately 33% of the variability in University performance
excellence can be explained by the variation in Internationalization.
Table 4.55: Model Fitness for Internationalization
Model R R Square Adjusted R Square Std. Error of the Estimate
1 .577a .330 .330 .3348031
a. Predictors: (Constant), INT
c. Dependent Variable: Performance
Table 4.56 shows F-statistic of 113.769 and a P-value of 0.000. The result indicates that at
significance level of α=0.05 internationalization is statistically significance since the p<0.05.
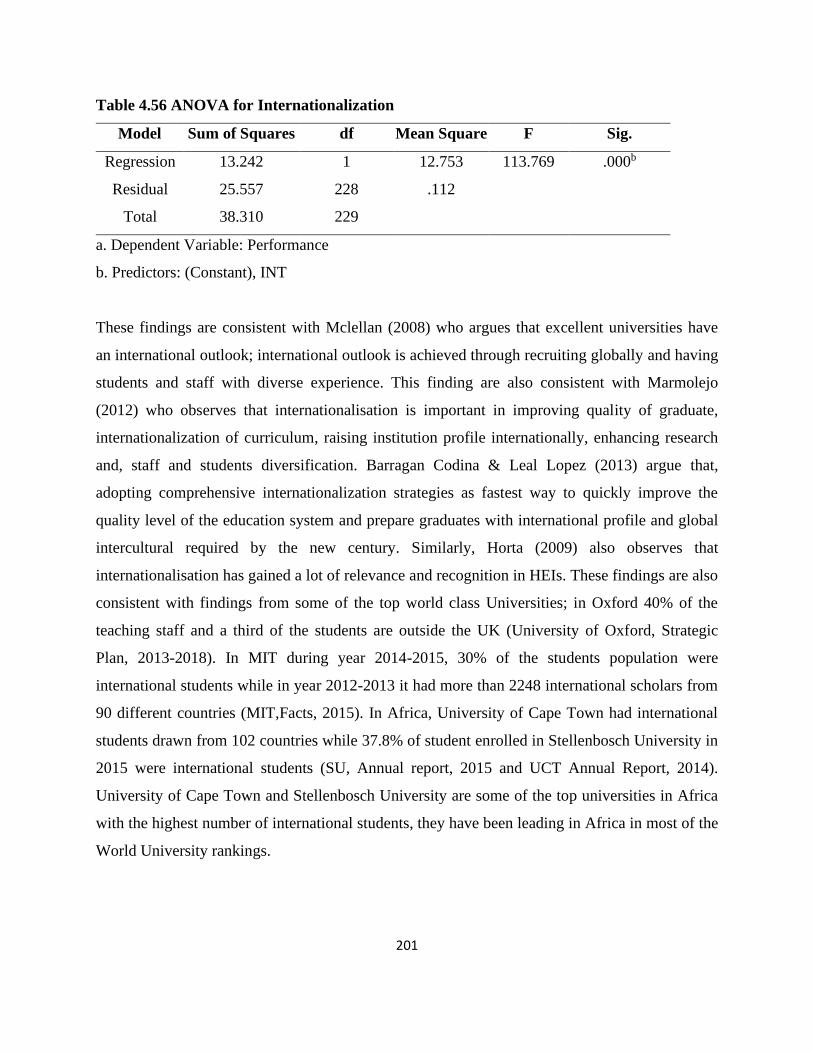
201
Table 4.56 ANOVA for Internationalization
Model Sum of Squares df Mean Square F Sig.
1 Regression 13.242 1 12.753 113.769 .000b
Residual 25.557 228 .112
Total 38.310 229
a. Dependent Variable: Performance
b. Predictors: (Constant), INT
These findings are consistent with Mclellan (2008) who argues that excellent universities have
an international outlook; international outlook is achieved through recruiting globally and having
students and staff with diverse experience. This finding are also consistent with Marmolejo
(2012) who observes that internationalisation is important in improving quality of graduate,
internationalization of curriculum, raising institution profile internationally, enhancing research
and, staff and students diversification. Barragan Codina & Leal Lopez (2013) argue that,
adopting comprehensive internationalization strategies as fastest way to quickly improve the
quality level of the education system and prepare graduates with international profile and global
intercultural required by the new century. Similarly, Horta (2009) also observes that
internationalisation has gained a lot of relevance and recognition in HEIs. These findings are also
consistent with findings from some of the top world class Universities; in Oxford 40% of the
teaching staff and a third of the students are outside the UK (University of Oxford, Strategic
Plan, 2013-2018). In MIT during year 2014-2015, 30% of the students population were
international students while in year 2012-2013 it had more than 2248 international scholars from
90 different countries (MIT,Facts, 2015). In Africa, University of Cape Town had international
students drawn from 102 countries while 37.8% of student enrolled in Stellenbosch University in
2015 were international students (SU, Annual report, 2015 and UCT Annual Report, 2014).
University of Cape Town and Stellenbosch University are some of the top universities in Africa
with the highest number of international students, they have been leading in Africa in most of the
World University rankings.

202
Table 4.57 shows the regression of coefficient for internationalization. Internationalization has a
coefficient of 0.633, an estimated standard error of 0.059, and significance of 0.000.
Table 4.57 Regression Coefficient for Internationalization
Model
Unstandardized
Coefficients
Standardized
Coefficients
t Sig. B Std. Error Beta
1 (Constant) .723 .074 9.797 .000
INT .633 .059 .577 10.666 .000
The regression model equation will be as follows;
Y= 0.723+ 0.633Internationalization
The regression model analysis indicates internationalisation had a positive and significance
relationship with performance excellence.
f) Policy and Strategy and Performance Excellence
The model fitness for policy and strategy is presented in Table 4.58. Table 4.58 shows that R-
square is 0.415 meaning that approximately 41.5% of the variability in university performance
excellence can be explained by the variation in policy and strategy.
Table 4.58: Model Fitness for Policy and Strategy
Model R R Square Adjusted R Square Std. Error of the Estimate
1 .644a .415 .412 .3135458
a. Predictors: (Constant), PS
b. Dependent Variable: Performance

203
The ANOVA Table 4.59 shows F-statistic of 161.682 and a P-value of 0.000. The result
indicates that at significance level of α=0.05 Policy and Strategy is statistically significance since
the p<0.05.
Table 4.59 ANOVA for Policy and Strategy
Model
Sum of
Squares Df Mean Square F Sig.
1 Regression 15.895 1 15.895 161.682 .000b
Residual 22.415 228 .098
Total 38.310 229
a. Dependent Variable: Performance
b. Predictors: (Constant), PS
The result indicates that policy and strategy formulation, communication and implementation
affect the performance of the universities. This includes the involvement of the staff and students
in strategy and policy formulation and implementations and effectively communicating the
university strategies and policies. The findings are consistent with EFQM model that identifies
policy and strategy as one of the drivers of sustainable performance excellence; this involves
developing competitive strategies and reviewing them regularly, communicating and aligning
them to individuals work plans (EFQM, 2013). These findings are also consistent with Yizengaw
(2008) who established poor strategic planning as one of the challenges facing HEIs in Africa,
Strategy implementation involves comprehensive planning. These findings are also consistent
with Jagersma and Parsons (2011) that involvement of students in policy formulation has a
positive outcome. These finding also agrees with observation by Satyendra (2014) that
development of unfavorable and ambiguous policies and strategies will adversely affect the
operations of organization. The findings are also consistent with Kagondu (2015) who established
that Kenya’s HEIs were challenged in development of quality assurance policies and procedures,
this was viewed to adversely affect the quality of HEIs.

204
Table 4.60 displays the coefficient results for policy and strategy. Policy and Strategy has a
coefficient of 0.612 and an estimated standard error of 0.048. The result indicates that at
significance level of α=0.05 policy and strategy is statistically significance since the p<0.05.
Table 4.60: Regression Coefficient for Policy and Strategy
Model
Unstandardized Coefficients
Standardized
Coefficients
t Sig. B Std. Error Beta
1 (Constant) .662 .067 9.863 .000
PS .612 .048 .644 12.715 .000
The regression model equation will be as follows;
Y= 0.662+ 0.612policy and strategy
The regression output indicates that policy and strategy (formulation, communication and
implementation) has a positive influence on the performance excellence of universities.
g) Product, Processes and Services and Performance Excellence
The model fitness for product, processes and Services is presented in Table 4.61. Table 4.61
shows that R-square is 0.206 meaning that approximately 20.6% of the variability in University
performance excellence can be explained by the variation in product, processes and Services
Table 4.61: Model fitness for Product, Processes and Services
Model R R Square Adjusted R Square Std. Error of the Estimate
1 .454a .206 .203 .3651604
a. Predictors: (Constant), PPS
b. Dependent Variable: Performance
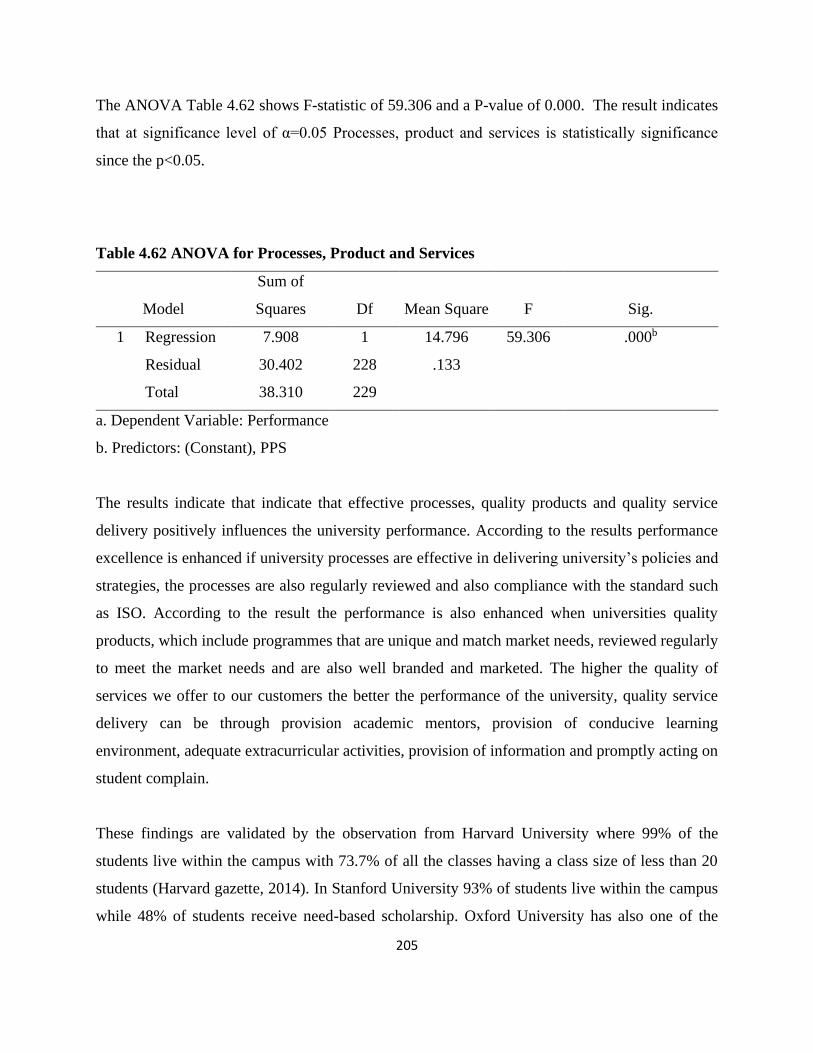
205
The ANOVA Table 4.62 shows F-statistic of 59.306 and a P-value of 0.000. The result indicates
that at significance level of α=0.05 Processes, product and services is statistically significance
since the p<0.05.
Table 4.62 ANOVA for Processes, Product and Services
Model
Sum of
Squares Df Mean Square F Sig.
1 Regression 7.908 1 14.796 59.306 .000b
Residual 30.402 228 .133
Total 38.310 229
a. Dependent Variable: Performance
b. Predictors: (Constant), PPS
The results indicate that indicate that effective processes, quality products and quality service
delivery positively influences the university performance. According to the results performance
excellence is enhanced if university processes are effective in delivering university’s policies and
strategies, the processes are also regularly reviewed and also compliance with the standard such
as ISO. According to the result the performance is also enhanced when universities quality
products, which include programmes that are unique and match market needs, reviewed regularly
to meet the market needs and are also well branded and marketed. The higher the quality of
services we offer to our customers the better the performance of the university, quality service
delivery can be through provision academic mentors, provision of conducive learning
environment, adequate extracurricular activities, provision of information and promptly acting on
student complain.
These findings are validated by the observation from Harvard University where 99% of the
students live within the campus with 73.7% of all the classes having a class size of less than 20
students (Harvard gazette, 2014). In Stanford University 93% of students live within the campus
while 48% of students receive need-based scholarship. Oxford University has also one of the
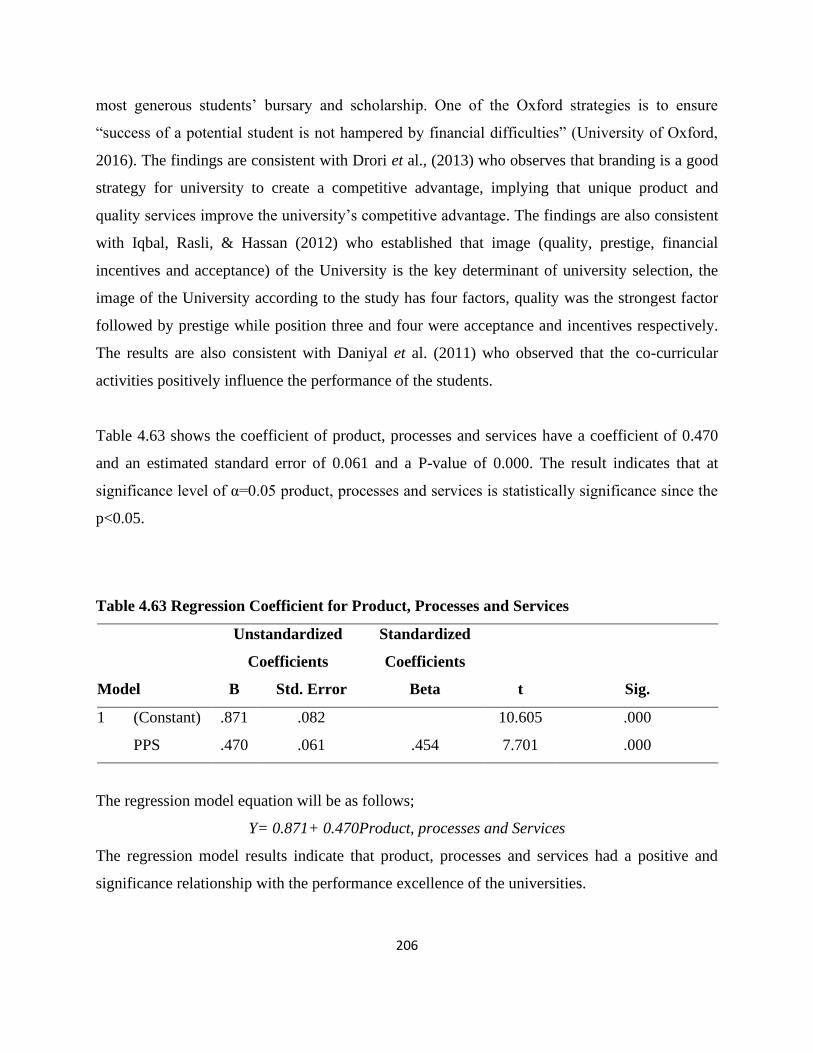
206
most generous students’ bursary and scholarship. One of the Oxford strategies is to ensure
“success of a potential student is not hampered by financial difficulties” (University of Oxford,
2016). The findings are consistent with Drori et al., (2013) who observes that branding is a good
strategy for university to create a competitive advantage, implying that unique product and
quality services improve the university’s competitive advantage. The findings are also consistent
with Iqbal, Rasli, & Hassan (2012) who established that image (quality, prestige, financial
incentives and acceptance) of the University is the key determinant of university selection, the
image of the University according to the study has four factors, quality was the strongest factor
followed by prestige while position three and four were acceptance and incentives respectively.
The results are also consistent with Daniyal et al. (2011) who observed that the co-curricular
activities positively influence the performance of the students.
Table 4.63 shows the coefficient of product, processes and services have a coefficient of 0.470
and an estimated standard error of 0.061 and a P-value of 0.000. The result indicates that at
significance level of α=0.05 product, processes and services is statistically significance since the
p<0.05.
Table 4.63 Regression Coefficient for Product, Processes and Services
Model
Unstandardized
Coefficients
Standardized
Coefficients
t Sig. B Std. Error Beta
1 (Constant) .871 .082 10.605 .000
PPS .470 .061 .454 7.701 .000
The regression model equation will be as follows;
Y= 0.871+ 0.470Product, processes and Services
The regression model results indicate that product, processes and services had a positive and
significance relationship with the performance excellence of the universities.
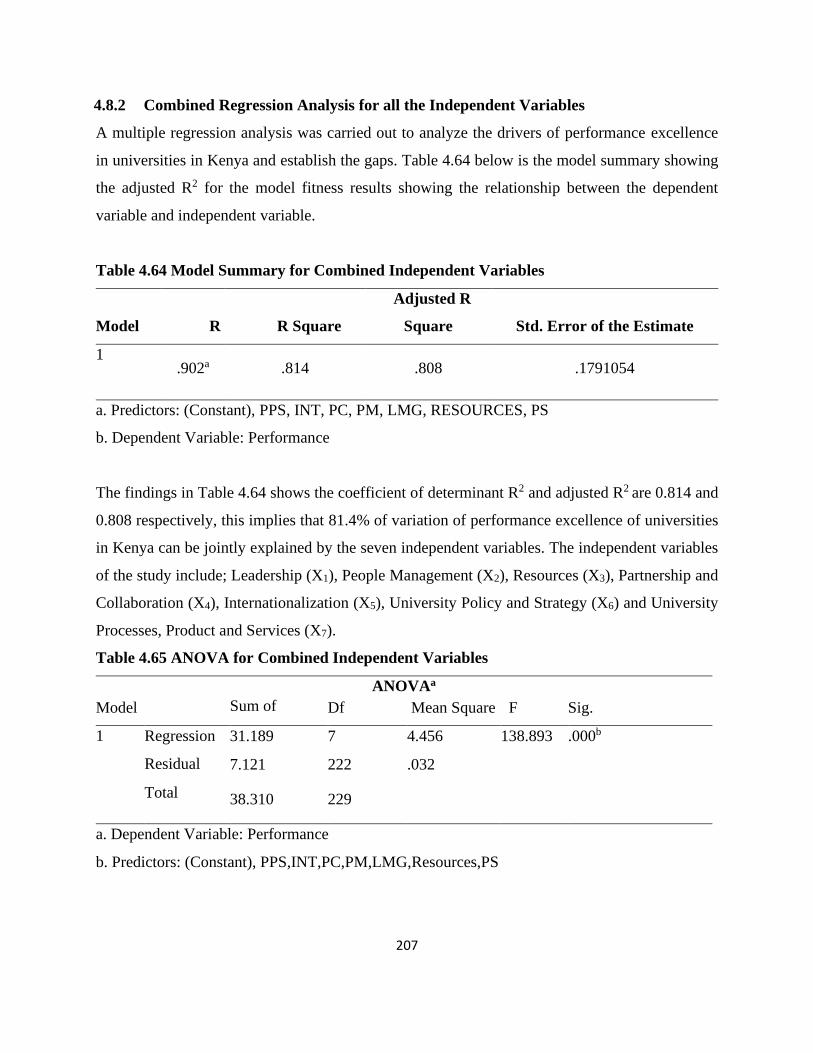
207
4.8.2 Combined Regression Analysis for all the Independent Variables
A multiple regression analysis was carried out to analyze the drivers of performance excellence
in universities in Kenya and establish the gaps. Table 4.64 below is the model summary showing
the adjusted R2 for the model fitness results showing the relationship between the dependent
variable and independent variable.
Table 4.64 Model Summary for Combined Independent Variables
Model R R Square
Adjusted R
Square Std. Error of the Estimate
1
.902a .814 .808 .1791054
a. Predictors: (Constant), PPS, INT, PC, PM, LMG, RESOURCES, PS
b. Dependent Variable: Performance
The findings in Table 4.64 shows the coefficient of determinant R2 and adjusted R2 are 0.814 and
0.808 respectively, this implies that 81.4% of variation of performance excellence of universities
in Kenya can be jointly explained by the seven independent variables. The independent variables
of the study include; Leadership (X1), People Management (X2), Resources (X3), Partnership and
Collaboration (X4), Internationalization (X5), University Policy and Strategy (X6) and University
Processes, Product and Services (X7).
Table 4.65 ANOVA for Combined Independent Variables
ANOVAa
Model Sum of
Squares
Df Mean Square F Sig.
1 Regression 31.189 7 4.456 138.893 .000b
Residual 7.121 222 .032
Total 38.310 229
a. Dependent Variable: Performance
b. Predictors: (Constant), PPS,INT,PC,PM,LMG,Resources,PS

208
The results of the significant test of regression model Table 4.65 has F statistic of 138.893 and p-
value of 0.000 indicates that the model is significant at significant level α=0.05 since p<0.05.
This implies that all the independent variables jointly have a statistically significant influence on
the dependent variable performance excellence of universities. These results are consistent with
studies undertaken by Bryman (2007) who indicated that leadership has an impact on the
academic effectiveness. The study is also consistent with Obiwuru et al, (2011) who also found
out that leadership styles are determinant of leadership effectiveness; the leadership style
demonstrated by a leader enhances or retards the employee’s commitment.
Table 4.66 Regression Coefficient of Combined Independent Variables
Model
Unstandardized
Coefficients
Standardized
Coefficients
t Sig. B Std. Error Beta
1 (Constant) 0.34 .053 .604 .546
LMG .634 .041 .660 15.407 .000
PM .155 .037 .165 4.210 .000
Resources .119 .034 .151 3.561 .000
PC .012 .031 .015 0.404 .687
INT .189 .039 .172 4.856 .000
PS .082 .043 .086 1.930 .055
PPS .028 .035 .027 .788 .432
A Dependent Variable: Performance
Table 4.66 shows the coefficient results for joint multiple regressions; leadership has coefficient
of 0.634 and an estimated standard error of 0.041 and significance of 0.000. Leadership influence
on the performance excellence of universities in Kenya is thus statistically significant at
significance level α=0.05 since p<0.000. People Management has coefficient of 0.155 with an
estimated standard error of 0.037 and significance of 0.000. People management impact on the
performance excellence of universities in Kenya is therefore statistically significance at
significance level α=0.05 since p<0.000. The University resources have a coefficient of 0.119
with an estimated standard error of 0.034 and a significant value of 0.000. The impact of the
University resources to the performance excellence of Universities in Kenya is therefore
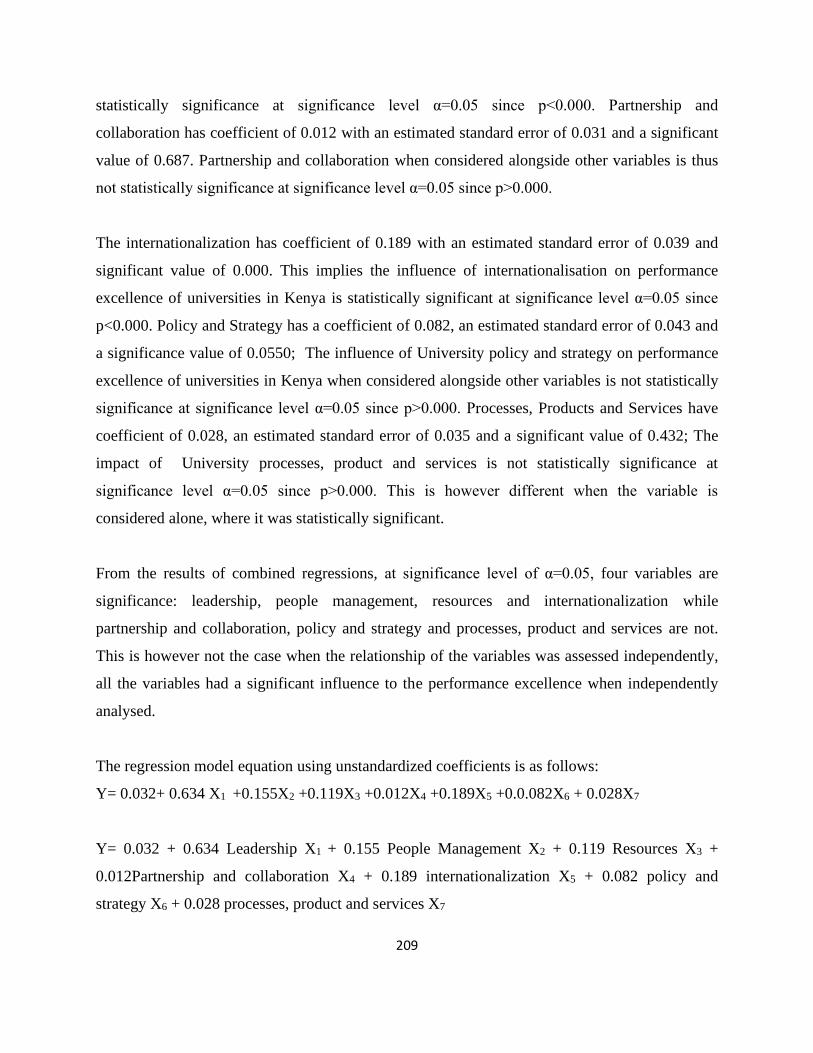
209
statistically significance at significance level α=0.05 since p<0.000. Partnership and
collaboration has coefficient of 0.012 with an estimated standard error of 0.031 and a significant
value of 0.687. Partnership and collaboration when considered alongside other variables is thus
not statistically significance at significance level α=0.05 since p>0.000.
The internationalization has coefficient of 0.189 with an estimated standard error of 0.039 and
significant value of 0.000. This implies the influence of internationalisation on performance
excellence of universities in Kenya is statistically significant at significance level α=0.05 since
p<0.000. Policy and Strategy has a coefficient of 0.082, an estimated standard error of 0.043 and
a significance value of 0.0550; The influence of University policy and strategy on performance
excellence of universities in Kenya when considered alongside other variables is not statistically
significance at significance level α=0.05 since p>0.000. Processes, Products and Services have
coefficient of 0.028, an estimated standard error of 0.035 and a significant value of 0.432; The
impact of University processes, product and services is not statistically significance at
significance level α=0.05 since p>0.000. This is however different when the variable is
considered alone, where it was statistically significant.
From the results of combined regressions, at significance level of α=0.05, four variables are
significance: leadership, people management, resources and internationalization while
partnership and collaboration, policy and strategy and processes, product and services are not.
This is however not the case when the relationship of the variables was assessed independently,
all the variables had a significant influence to the performance excellence when independently
analysed.
The regression model equation using unstandardized coefficients is as follows:
Y= 0.032+ 0.634 X1 +0.155X2 +0.119X3 +0.012X4 +0.189X5 +0.0.082X6 + 0.028X7
Y= 0.032 + 0.634 Leadership X1 + 0.155 People Management X2 + 0.119 Resources X3 +
0.012Partnership and collaboration X4 + 0.189 internationalization X5 + 0.082 policy and
strategy X6 + 0.028 processes, product and services X7
210
The fitted regression model equation:
Y= 0.032+ 0.634 X1 +0.155X2 +0.119X3 +0.189X5
Where; y is the performance excellence
0.032 is the constant
X1 is the leadership index
X2 is people management index
X3 is resources index
X5 is internationalization index
Leadership, people management, resources and internationalization were retained as the drivers
of performance excellence.
Though at individual level all the variables were significance, the overall model shows four of
the variables were significance at 0.05 significance level (p<0.05) as shown in table 4.67.
leadership, people management, resources and internationalization while three were not namely
partnership and collaboration, policy and strategy, process, product and services. In the overall
model, partnership and collaboration, policy and strategy, and process, product and services were
not significance. Literature and knowledge from reviewed top universities shows partnership and
collaboration, policy and strategy, and process, product and services as some of key drivers of
performance excellence, the results thus shows there is a gap that universities in Kenya may need
to address in their effort to realize performance excellence.

211
Table 4.67 Combined P-value
Variable Regression
(p-value)
Leadership .000
People Management .000
Resources .000
Partnership and Collaboration .687
Internationalization .000
Policy and Strategy .055
Process, Product and Services .432
It can be argued that with variables that were significant in the overall model that includes:
leadership, appropriate people management, abundant resources and internationalisation the
other insignificant variables will be indirectly be addressed HEIs needs not to ignore them as
they draw strategies for performance excellence. Partnership and collaborations create a platform
for the universities to broaden their network. As observed by Baty (2014), “The future holds
great challenges but universities will meet them by joining forces”. Through partnership and
collaborations, HEIs are able to create a platform for sharing talents, exchanging ideas and
develop hybrid programmes. The universities should create a culture of collaborating instead of
competing. Policy and strategy based on the literature are important to the success of the
organization (Daft,1999; Kendrick & Vershinina, 2010). Nohria et al., (2003) observes that
having clear strategies determine winner and losers. Effective processes, quality product and
good Customer experience through provision of quality service delivery enhances the
performance excellence and should not be ignored.
4.9 Comparison between Drivers for Public and Private Universities
The study was undertaken in 12 universities, 6 private and 6 public. Public and private
universities in Kenya are governed through the University Act, 2012 and are regulated by same
Commission, CUE, the commission regulates and coordinate all the universities to ensure quality
in all the programmes offered. The management structure however for both public and private
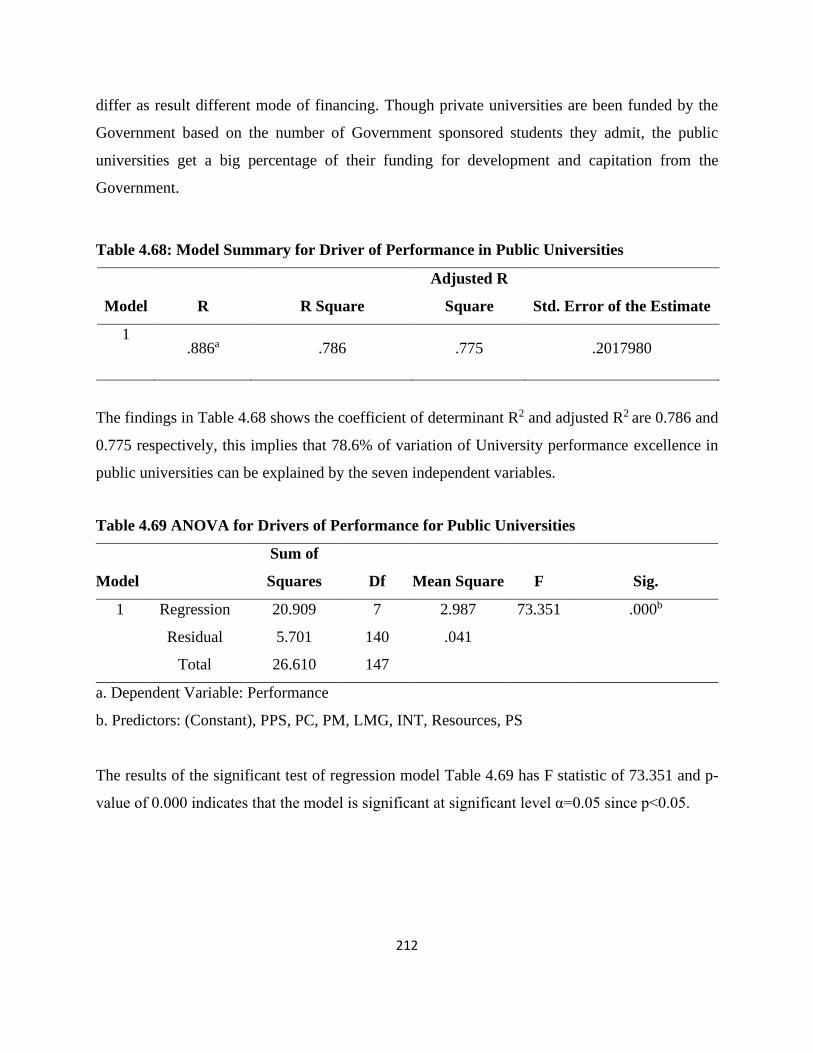
212
differ as result different mode of financing. Though private universities are been funded by the
Government based on the number of Government sponsored students they admit, the public
universities get a big percentage of their funding for development and capitation from the
Government.
Table 4.68: Model Summary for Driver of Performance in Public Universities
Model R R Square
Adjusted R
Square Std. Error of the Estimate
1
.886a .786 .775 .2017980
The findings in Table 4.68 shows the coefficient of determinant R2 and adjusted R2 are 0.786 and
0.775 respectively, this implies that 78.6% of variation of University performance excellence in
public universities can be explained by the seven independent variables.
Table 4.69 ANOVA for Drivers of Performance for Public Universities
Model
Sum of
Squares Df Mean Square F Sig.
1 Regression 20.909 7 2.987 73.351 .000b
Residual 5.701 140 .041
Total 26.610 147
a. Dependent Variable: Performance
b. Predictors: (Constant), PPS, PC, PM, LMG, INT, Resources, PS
The results of the significant test of regression model Table 4.69 has F statistic of 73.351 and p-
value of 0.000 indicates that the model is significant at significant level α=0.05 since p<0.05.
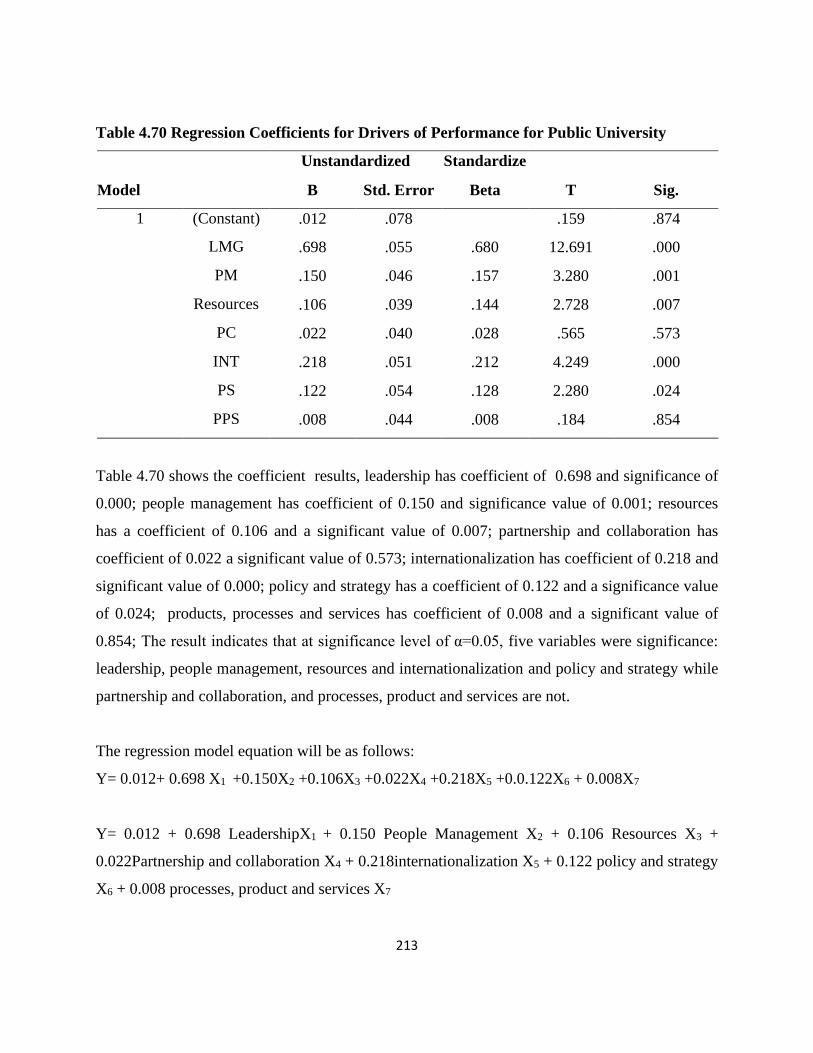
213
Table 4.70 Regression Coefficients for Drivers of Performance for Public University
Model
Unstandardized
Coefficients
Standardize
d
Coefficients
T Sig. B Std. Error Beta
1 (Constant) .012 .078 .159 .874
LMG .698 .055 .680 12.691 .000
PM .150 .046 .157 3.280 .001
Resources .106 .039 .144 2.728 .007
PC .022 .040 .028 .565 .573
INT .218 .051 .212 4.249 .000
PS .122 .054 .128 2.280 .024
PPS .008 .044 .008 .184 .854
Table 4.70 shows the coefficient results, leadership has coefficient of 0.698 and significance of
0.000; people management has coefficient of 0.150 and significance value of 0.001; resources
has a coefficient of 0.106 and a significant value of 0.007; partnership and collaboration has
coefficient of 0.022 a significant value of 0.573; internationalization has coefficient of 0.218 and
significant value of 0.000; policy and strategy has a coefficient of 0.122 and a significance value
of 0.024; products, processes and services has coefficient of 0.008 and a significant value of
0.854; The result indicates that at significance level of α=0.05, five variables were significance:
leadership, people management, resources and internationalization and policy and strategy while
partnership and collaboration, and processes, product and services are not.
The regression model equation will be as follows:
Y= 0.012+ 0.698 X1 +0.150X2 +0.106X3 +0.022X4 +0.218X5 +0.0.122X6 + 0.008X7
Y= 0.012 + 0.698 LeadershipX1 + 0.150 People Management X2 + 0.106 Resources X3 +
0.022Partnership and collaboration X4 + 0.218internationalization X5 + 0.122 policy and strategy
X6 + 0.008 processes, product and services X7
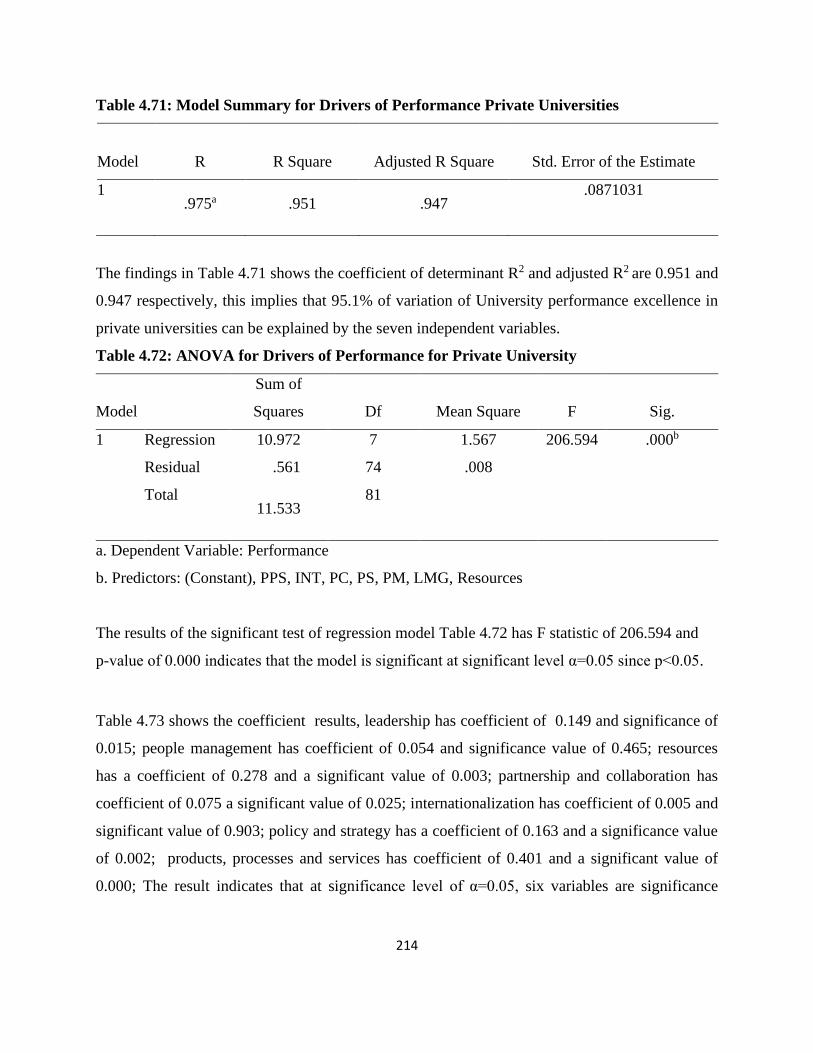
214
Table 4.71: Model Summary for Drivers of Performance Private Universities
Model R R Square Adjusted R Square Std. Error of the Estimate
1 .975a .951 .947
.0871031
The findings in Table 4.71 shows the coefficient of determinant R2 and adjusted R2 are 0.951 and
0.947 respectively, this implies that 95.1% of variation of University performance excellence in
private universities can be explained by the seven independent variables.
Table 4.72: ANOVA for Drivers of Performance for Private University
Model
Sum of
Squares Df Mean Square F Sig.
1 Regression 10.972 7 1.567 206.594 .000b
Residual .561 74 .008
Total 11.533
81
a. Dependent Variable: Performance
b. Predictors: (Constant), PPS, INT, PC, PS, PM, LMG, Resources
The results of the significant test of regression model Table 4.72 has F statistic of 206.594 and
p-value of 0.000 indicates that the model is significant at significant level α=0.05 since p<0.05.
Table 4.73 shows the coefficient results, leadership has coefficient of 0.149 and significance of
0.015; people management has coefficient of 0.054 and significance value of 0.465; resources
has a coefficient of 0.278 and a significant value of 0.003; partnership and collaboration has
coefficient of 0.075 a significant value of 0.025; internationalization has coefficient of 0.005 and
significant value of 0.903; policy and strategy has a coefficient of 0.163 and a significance value
of 0.002; products, processes and services has coefficient of 0.401 and a significant value of
0.000; The result indicates that at significance level of α=0.05, six variables are significance

215
leadership, partnership and collaboration, processes, product and services, resources and policy
and strategy while people management and internationalization are not.
Table 4.73: Regression Coefficients for Drivers of Performance for Private University
Model
Unstandardized
Coefficients
Standardized
Coefficients T Sig. B Std. Error Beta
1 (Constant) .125 .047 2.683 .009
LMG .149 .060 .170 2.488 .015
PM .054 .073 .057 .735 .465
Resources .278 .089 .294 3.129 .003
PC .075 .033 .088 2.281 .025
INT .005 .042 .004 .122 .903
PS .163 .052 .174 3.143 .002
PPS .401 .067 .406 5.965 .000
The regression model equation will be as follows:
Y= 0.125+ 0.149 X1 +0.054X2 +0.278X3 +0.075X4 +0.005X5 +0.163X6 + 0.401X7
Y= 0.125+0.149LeadershipX1+0.054People Management X2 + 0.278 Resources X3
+0.075Partnership and collaboration X4 +0.005internationalization X5 + 0.163 policy and
strategy X6 + 0.401 product, processes and services X7
Table 4.74: Comparison between Public University and Private University
Item Overall Public Private
R .902 .886 .975
R2 .814 .786 .951
Df 7 7 7
F 138.893 73.351 206.594
Significance .000 .000 .000
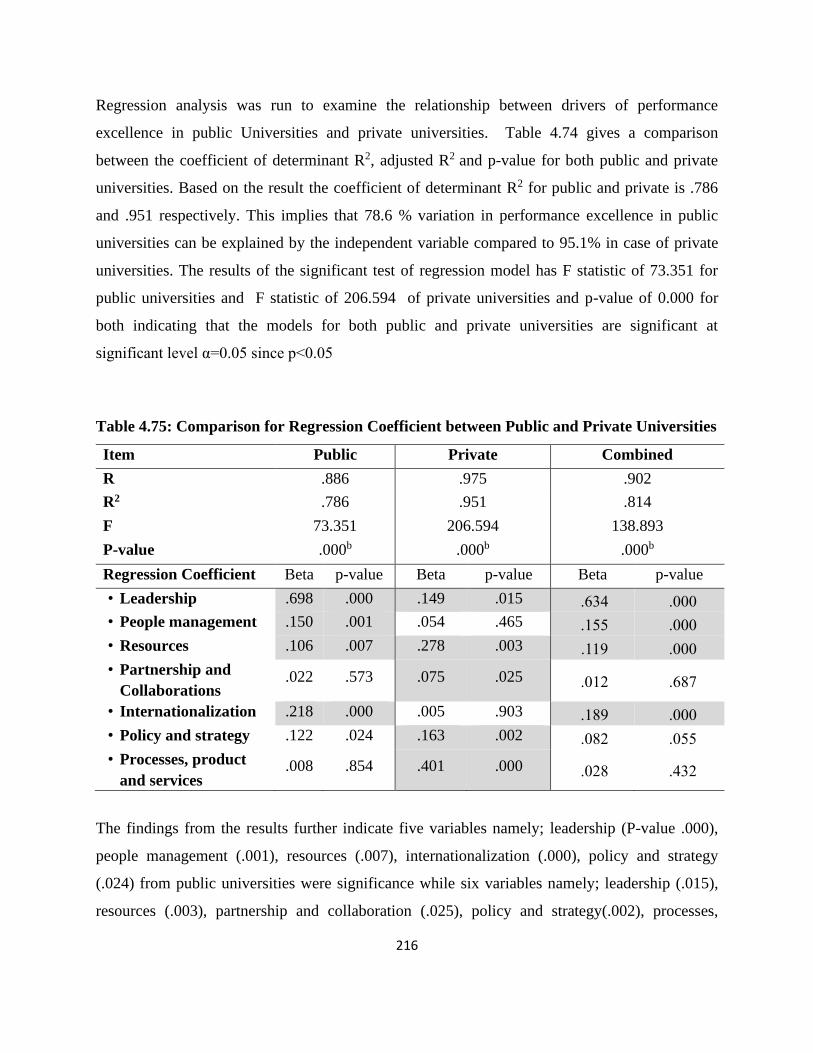
216
Regression analysis was run to examine the relationship between drivers of performance
excellence in public Universities and private universities. Table 4.74 gives a comparison
between the coefficient of determinant R2, adjusted R2 and p-value for both public and private
universities. Based on the result the coefficient of determinant R2 for public and private is .786
and .951 respectively. This implies that 78.6 % variation in performance excellence in public
universities can be explained by the independent variable compared to 95.1% in case of private
universities. The results of the significant test of regression model has F statistic of 73.351 for
public universities and F statistic of 206.594 of private universities and p-value of 0.000 for
both indicating that the models for both public and private universities are significant at
significant level α=0.05 since p<0.05
Table 4.75: Comparison for Regression Coefficient between Public and Private Universities
Item Public Private Combined
R .886 .975 .902
R2 .786 .951 .814
F 73.351 206.594 138.893
P-value .000b .000b .000b
Regression Coefficient Beta p-value Beta p-value Beta p-value
• Leadership .698 .000 .149 .015 .634 .000
• People management .150 .001 .054 .465 .155 .000
• Resources .106 .007 .278 .003 .119 .000
• Partnership and
Collaborations .022 .573 .075 .025 .012 .687
• Internationalization .218 .000 .005 .903 .189 .000
• Policy and strategy .122 .024 .163 .002 .082 .055
• Processes, product
and services .008 .854 .401 .000 .028 .432
The findings from the results further indicate five variables namely; leadership (P-value .000),
people management (.001), resources (.007), internationalization (.000), policy and strategy
(.024) from public universities were significance while six variables namely; leadership (.015),
resources (.003), partnership and collaboration (.025), policy and strategy(.002), processes,
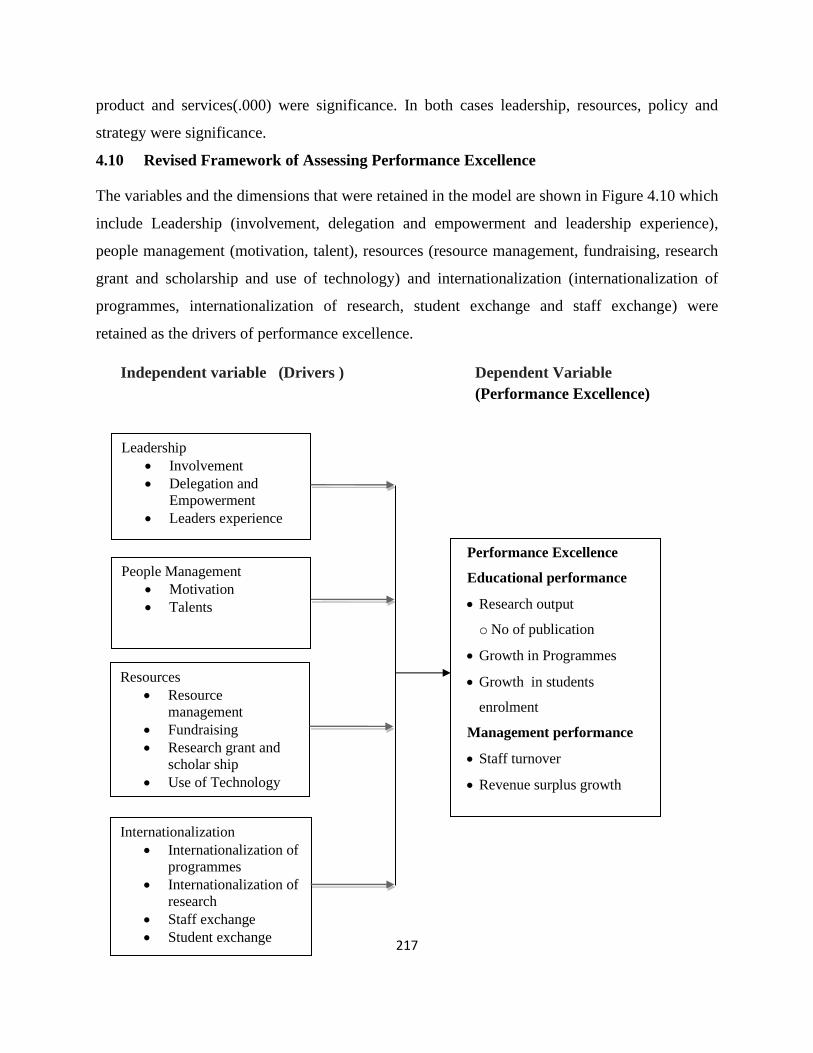
217
product and services(.000) were significance. In both cases leadership, resources, policy and
strategy were significance.
4.10 Revised Framework of Assessing Performance Excellence
The variables and the dimensions that were retained in the model are shown in Figure 4.10 which
include Leadership (involvement, delegation and empowerment and leadership experience),
people management (motivation, talent), resources (resource management, fundraising, research
grant and scholarship and use of technology) and internationalization (internationalization of
programmes, internationalization of research, student exchange and staff exchange) were
retained as the drivers of performance excellence.
Dependent Variable
(Performance Excellence)
Independent variable (Drivers )
Resources
• Resource
management
• Fundraising
• Research grant and
scholar ship
• Use of Technology
People Management
• Motivation
• Talents
Performance Excellence
Educational performance
• Research output
o No of publication
• Growth in Programmes
• Growth in students
enrolment
Management performance
• Staff turnover
• Revenue surplus growth
Leadership
• Involvement
• Delegation and
Empowerment
• Leaders experience
Internationalization
• Internationalization of
programmes
• Internationalization of
research
• Staff exchange
• Student exchange

218
Figure 4.10: The revised framework of Assessing Performance Excellence
The dimensions for the retained variable are few than in the conceptual framework since some
were dropped out during factor analysis due to either weak loading or cross loading and as a
result deemed weak based on the recommended threshold.
219
CHAPTER FIVE
SUMMARY, CONCLUSION AND RECOMMENDATIONS
5.1 Introduction
This chapter presents the summary of the findings of the study on drivers of performance
excellence in universities in Kenya. It further provides the conclusions and recommendation for
enhancing performance excellence in universities and the conclusion of the study. The chapter
also highlights the research contribution to the knowledge and the recommendations for further
studies.
5.2 Summary of the key findings
The study explored drivers of performance excellence in universities in Kenya. The drivers
analyzed include leadership, people management, resources, partnership and collaboration,
policy and strategy, internationalization and, processes, product and services. Performance
excellence in HEIs is a fundamental aspect taking cognizant of the role they play in economic
development. Kenya been a developing country has identified education as one it key drivers of
her Vision 2030 and the Sustainable Development Goals (SDGs). The specific objectives of the
study were, to analyze the drivers of performance excellence in universities in Kenya; to explore
the gaps in drivers of performance excellence in universities in Kenya; compare the drivers of
performance excellence between public and private universities and develop framework for
assessing performance excellence for universities in Kenya.
The study reviewed theories, existing performance excellence model; EFQM Excellence Model,
Balance Scorecard and MBNQA, empirical literature review and 11 leading universities globally
to explore drivers of performance excellence, this informed the development of a conceptual
framework. This was followed by a survey of the universities in Kenya to analyse the
relationship of the drivers with performance excellence, explore the gaps and give
recommendation. The research targeted population comprised of the Deans, Directors, Chairmen
of Department and Head of Departments in both chartered public and private universities
between the month of November, 2016 and March, 2017. Purposive sampling used to select 6
public universities and 6 private universities making a total of 12 universities. A sample of 277

220
respondents was drawn from which 240 responded. The data was collected through questionnaire
and a response rate of 86.6% was achieved. The collected data was analysed through SSPS using
descriptive statistic, factor analysis, correlation analysis and multiple regression analysis.
Factorability test was undertaken to assess fitness for factor analysis, all the variable were
factorable with Kaiser-Meyer-Oklin (KMO) measure of sampling adequacy above 0.7 which was
above the recommend minimum value of 0.5. The Bartlett’s Test of Sphericity p-value was less
than 0.05. In this study factor analysis was undertaken to reduce the number of dimensions for
the variable used in the study, the dimensions were reduced from 101 to 72.
5.2.1 Drivers of Performance Excellence
The first objective of the study was to analyse drivers of performance excellence in universities
in Kenya. Based the literature reviewed and the review of some of leading universities in the
world, a number of drivers were identified that could play key role in influencing performance
excellence of the universities. These include effective leadership, resources, policies and
strategies, partnership and collaboration, internationalisation, effective processes, quality product
(curriculums) and quality services delivery to enhance customer experience. The drivers were
identified guided by the EFQM Model, MBNQA and Balanced Scorecard. To analyse the
drivers, a tool with 101 dimensions was developed informed by literature and experience from
leading universities, this was subjected to a survey in universities Kenya. Factor analysis was
conducted using the survey results, through factor analysis the dimensions were reduced from
101 to 72 dimensions which were subjected to further analysis including the inferential analysis.
Following the analysis, the dimensions were clustered under leadership (Involvement, leader
experience, delegation and empowerment), people management (Motivation & talents),
resources (resource management, use of Technology, Fundraising, Scholarships and Research
Grant), Policy and Strategy (policy and strategy formulation, communication and
implementation), Partnership and Collaborations (partnership and collaboration with industries,
other universities, Society), Internationalisation (International of programme, internationalisation
of research, staff exchange and student exchange), Effective processes, Unique and Quality
Product and High Quality Services delivery.

221
The first independent variable was leadership, based on the analysis results, it was established
that leadership positively and significantly influences performance excellence of universities. In
leadership, Involvement, leaders experience, delegation and empowerment were identified as the
most important dimension. Leaders should involve the stakeholders including staff and students
in decision making; the leaders should delegate duties and at the same time empower their
subordinate through provision of the required resources and authority to undertake their mandate.
Appointment of leaders at all levels including VC, DVCs, Deans, Director and chairpersons
should take into account relevant experience in regard to university management.
People management was the second variable which comprised of motivating employees and
engaging a highly talented workforce. From the results people management has a significance
and positive impact on the performance excellence of universities. Employees motivation is
developed through fair training opportunities; competitive remunerations, recognitions and
rewards system; allocation of reasonable and manageable work load; provision of an enabling
and conducive working environment; provision of feedback upon appraisal have positive impact
towards achieving performance excellence and finally attracting the best on recruitment.
Resource was the third variable that was assessed whether it influences universities performance
excellence. From the results, it was established resources positively and significantly influences
performance excellence in universities. The specific aspects of the resources assessed after factor
analysis include resource management, use of technology, and resource mobilisation through
leveraging from fundraising, scholarship and research grant. Prudent resource management
demands making good use of the available resources and ensuring the University plans are
aligned to the available resources, this ensure there are adequate resources to supports the
implementation of various university agenda. The use of technology enhances the efficiency in
service delivery and creates a platform for openness and accountability. With the dwindling
Government funding, universities need to devise innovative strategies of generating additional
income to supplement the funding from the exchequer, other leading universities globally have
identified fundraising as potential mean of raising revenue, this include fundraising through
alumni, philanthropies, other potential means of raising revenue is through scholarship and
research grant. Given that among the challenges facing HEIs is inadequate resources and finance

222
this unfavourable situation significantly contributes to their low performance as evidenced in
various University ranking.
Partnership and collaboration was the fourth variable that was determined whether it influenced
performance excellence. From the results, it was established partnership and collaborations
significantly and positively influence performance excellence in universities. The areas focused
on were partnership and collaboration with industries, other universities and society. Through
partnership and collaborations HEIs are able to build synergies through leveraging on their
individual strengths. Partnership and collaboration is a form of resource that is actualised through
networking with other institution that can add value to you.
The fifth variable was internationalisation which was determined whether it influences
performance excellence. Based on the results, it was established internationalisation particularly
staff exchange, student exchange and Internationalisation of programme and research contribute
to the performance excellence in universities. Internationalisation of higher education system is a
solution to the challenges emerging from globalisation. Through staff exchange, the faculty
members get more exposed to emerging global trends which enable them to enrich their teaching
and research bringing on-board new ideas. Through student exchange/academic exchange, the
students get exposed to the diverse culture; they are able to broaden their knowledge as well as
understanding of foreign cultures. The broad experience supports the expansion of their
knowledge as well as personal growth making them well prepared to compete in the global
context. The accreditation and recognition of curriculum world-wide promotes not only the
university profile but also enhances the quality of graduates as well as ensuring the trained
graduates are up to date with times. Internationalisation results in better prepared students and of
course a developed country.
The sixth variable was policy and strategy, the study investigated whether policy and strategy
influences performance excellence. The results from the findings indicated that policy and
strategy formulation, communication and implementation has an impact of the performance
excellence of universities. Universities should formulate their policy and strategy through
involvement of all the stakeholders and taking into consideration of the available information or
223
data and available resources. Policy and strategy should be clearly communicated to all
stakeholders and their implementation monitored closely to monitored.
The seventh variable was processes, product and services, the study sort to establish whether
processes, product and services had an influence to the performance excellence. The results from
the findings indicated that Effective processes, unique and quality product and High quality
services delivery influences the performance excellence. Effective processes facilitate smooth
organisation operations which ultimately bring efficiency and create customer satisfaction.
Unique and quality product are attractive to customers and thus makes the university competitive
raising its profile and brand and consequently making a university of choice for to many
potential candidates. High quality service delivery to the customers creates conducive learning
environment for the student which enhances their performance and that of the entire University.
5.2.2 Gaps in Drivers of Performance Excellence
The third objective of the study was to explore the gaps in drivers of performance excellence in
universities in Kenya. Though it was expected that all the variables will be significance
individually and when combined, this was not the case based on the results from combined
regression. The result for combined regression had four variables significance leadership,
resources, people management and internationalisation while three variables were not:
partnership and collaboration, policy and strategy and processes, product and services. The
research thus identified gaps in partnership and collaboration, policy and strategy and processes,
product and services in the universities in Kenya. There should be deliberate effort by
universities in Kenya to address these gaps through deploying innovative strategic approaches
for partnership and collaboration, policy and strategy and effective processes, quality products
and quality service delivery.
5.2.3 Drivers of Performance Excellence in Public and Private Universities
The fourth objective was to compare the drivers of performance excellence between public and
private Universities. The results indicated the influence of the drivers of performance excellence
was more significance in private than it was in public universities. In public leadership, people
management, resources, policy and strategy and internationalisation were significance while
224
partnership and collaboration, processes, product and services were not. In private leadership,
resources policy and strategy, partnership and collaboration, processes, product and services
were significance while people management and internationalisation were not. Further based on
the results, none of the variable was insignificance in both public and private university and
indicator that all the variable were relevant drivers of performance excellence in universities.
Further, the results indicate leadership has more influence in performance excellence in private
institution than in public institution. This may imply there is more emphasis on leadership
performance in private universities than in public universities. Most of the leaders in private
universities are employed on contract terms of engagement which enhances their performance
since the renewal of their contract is performance based.
People management was found to have more influence in public universities than in private
university, while resources though important to both has a higher impact in private universities
than in public universities. From the results partnership and collaboration has little effect on both
the public and private HEIs. Internationalisation for both public and private were established to
have a similar effect on the performance. The results also indicate private universities are keen
on policy and strategy which affect their performance more than that of the public universities.
Processes, product and services as per results were viewed as critical for both public and private
universities.
The difference observed between the public and private Universities could be attributed to the
differences in their management and Governance structures as well as the nature of their funding
models. Private universities unlike the public universities are privately owned with Government
having limited control on their day to day management; however, in both cases, they are
governed and regulated through the same University Act as well as the same regulatory body,
CUE. The funding model for both varies with private having to generate and raise their funding
with little funding support from the government while in public Universities most of their
funding is from the exchequer.

225
5.2.4 A framework for Assessing Performance Excellence in Kenyan HEIs
The fourth objective of the study was to develop a framework for assessing performance
excellence in universities in Kenya. The study focused on Kenya universities to developed a
framework for assessing performance excellence. The framework was developed after
undertaking factor analysis and reducing the number of dimensions and retaining the most
important dimensions for variable. Upon undertaking combined multiple regressions, a model
comprising of four variables leadership, people management, resources and internationalisation
was generated. Partnership and collaboration, policy and strategy and processes, product and
services were left out of the model since they were not significance. Based on the result, it can be
argued that with good leadership, abundant resources, motivated and talented employee and
internationalisation, partnership and collaboration can be part of strategic resources, this is alos
achieved in the process of internationalisation, good leadership also involve good and elaborate
planning which implies having the correct policy and strategy. Effective processes, quality
product and efficiency in service delivery can equally be achieved if we have good leadership,
the right people, and adequate resources
5.2.5 Recommendations to grow Performance Excellence in Kenya Universities.
The fifth objective of the study was to make recommendation to grow performance excellence in
universities in Kenya. Higher education sector in Kenya has achieved major strides towards
enhancing performance excellence. Some of the initiatives include the enactment of University
Act, 2012 that provide guidelines for the establishment, accreditation and governance of the
Universities in Kenya. Other initiatives is the establishment of the Commission of University
Education which is the successor of the Commission for Higher Education (CHE), the
Commission was established with an expanded mandate including the monitoring and regulating
all the University education systems in Kenya and development of the required policies and
standards relevance in the quality of the University Education (Republic of Kenya, 2012).
Taking cognizant of the Government initiatives to improve performance excellence, this study
supported by practice of some of best universities in the world, literature review, existing
theories and excellence models has identified some of the major drivers of performance
excellence. The drivers identified include leadership, people management, policy and strategy,
226
resources, partnership and collaboration, internationalization, product, processes and services.
This research recommends universities to pay key attention to the identified drivers as they strive
to achieve performance excellence. Based on the study findings the following are the
recommendation for drivers of performance excellence:
As observed by Bryman (2007) Leadership in higher education is expected to maintain
autonomy, consultation and to foster collegiality. Gappa et al, 2007 describe collegiality “as a
chance for members of the University to feel that they belong to a mutually respected community
of scholars who value each other’s contributions to the institution and feel concern for their
colleagues’ wellbeing”. The element of collegiality in a University setting can only be achieved
through leadership ensuring the university management structure is all inclusive, in this case all
parties are involved in decision making. This make them feel recognized as stakeholders to the
institution making it possible to implement new decisions and sell new ideas. Bryman (2007)
observes that the challenge with the academic taking up management position is their failure to
take themselves as leaders; in contrary they view themselves as academics, this result in poor
coordination of activities within departments and consequently poor service delivery.
Leadership emerged one of the fundamental drivers of performance excellence, this comprised of
involvement of employee in decision making, leaders experience, delegation and empowerment.
These were identified as the focus areas in leadership to facilitate achievement of performance
excellence in HEIs. It is important for leader to continuously engage the stakeholders who
include the staffs, students and community in decision making process; this will make them to
actively participate in all the leaders initiatives since they feel recognized as stakeholders.
Involvement of the staff and students in decision making, gives the leader an opportunity to
influence the employee and students in buying the institutional goals. This should be done
through effective communication. The appointment to be head of a sections/department should
take into consideration of leaders’ experience, in many cases the head of department are
appointed without the basic managerial skills posing a challenge in the running of the
department. Leaders should embrace a leadership model that encourages shared responsibility.
Shared responsibility encourages team work as well as recognition of the different capability of
227
different individuals, this well demonstrated through transformational leadership. Leaders should
embrace delegation of duties and empowerment of employees, most often the leaders fails to
share and entrust responsibilities to the employee under them or it is done without
empowerment. Delegation of duties gives the supervisor more space and time to engage in other
institutional matters that require his/her direct attention. Delegation offers an opportunity for
coaching and mentoring, through which the other employees are able to learn and take up more
challenging task.
People management had significant influence on performance excellence, this is also supported
by theories, excellence models and previous studies. This research analyzed the employee
motivation and talented work force. The universities should develop a transparent and fair
promotion, reward and incentives systems that are linked to the performance appraisal, feedback
on appraisal should also be provided to give the employee a chance to know their areas of
strength and weaknesses. Laferla (2008) observed that motivated employee view work as a
pleasure rather than a difficult responsibility. Lack of supportive work setting such as
unsupportive supervisors, inadequate resources and working tools and lack of clear job
description, can result in under performance even of the most qualified employee. Ensure
lecturers’ workload is manageable and all the class size are in line with the recommend
guidelines, this will caution them from fatigue and burnout which affect their output. The
working environment should also be conducive with adequate office space, furniture and
required stationaries. The university as a teaching and research institution should consistently
engage highly talented workforce both local and international, having a talented workforce will
translate to quality service delivery to its customer. Payment of part-time lecturers should be
made on time to ensure the lecturers are not demoralized by nonpayment and consequently affect
their service delivery. This can be achieved through proper budgeting where the department are
allocated budget for part-time before they engage the lecturers. They should also ensure they
only run classes that are able to break-even.
Due to the limited number of senior lecturers especially in some competitive discipline such as
engineering and medicine, deliberate effort should be made to recruit globally. This can be
achieved through provision of competitive remunerations and incentives to attract such highly
228
talented scholars and research globally. Establishing partnership with leading universities
globally can be one of the platforms to realize this strategy. The attractive package will all attract
Kenyan scholar in diaspora who will bring back home with them new knowledge and
experience. The universities should also make deliberate effort to develop capacity of their own
staff through sponsoring them for advanced courses and specialized training.
It is evidence in literature that the universities are in serious financial crisis, universities in Kenya
need to make urgent and dedicated efforts to gain financial stability. Depending on the
Government funding and funds generated from student fees may not be tenable and especially
with the current changes in education sector including the admission policy and the higher
competition owing to the many universities competing for the same students. To bridge this gap,
universities have to explore and adopt other competitive fundraising strategies.
Fundraising was identified as one the strength of the top universities with universities such as
Harvard meeting a third of their total operating revenue from the endowment fund. Stellenbosch
University in SA is one of the African Universities that has managed to re-write the academic
funding rule through fundraising, and it is expected that other African Universities will follow
the same (Botman, 2011). This situation calls for Universities to re-engineer their resource
mobilization strategies with a view of tapping on the unexploited areas. Some of the areas that
local Universities could focus on that other world-class universities have over the years excelled
in include, fundraising through Alumni, Donors and Philanthropies, research grants and
scholarship. They should engage their faculty members in writing fundable proposals with an
aim of tapping from local and international scholarships and research grants. Taking cognizant of
the inadequacy of resources facing the universities, sound financial management should be
embraced across all section of the university. The employee should be involved in budgeting
process to accommodate their departmental plans. The budget should be aligned to the available
funds to avoid incurring unnecessary debt.
The universities should make use of technology to bring efficiency in services delivery as well as
reduce cost of operation. This can be realized through automation of key operational processes
such as the student management including biometric system, examination processing, and
229
financial management and e-library services. Making use of technology in teaching and research
such the e-learning platform or other equal credible platforms.
It is clear from the research findings that most of the universities have aligned their policy and
strategy to the university mission and vision however this policies and strategies should be
supported by the appropriate plans and matched with available resources. The strategies should
be competitive and should leverage on university strength. The leaders need to continuously
involve the stakeholders comprising of the staff and student in policy and strategy formulation.
They should also ensure policy and strategies are clearly communicated and reviewed regularly
to adjust to the emerging trends.
The universities should endeavor to build a robust partnership and collaborations with other
institutions, industries and communities. The universities should build synergies through
maintaining active partnership and collaboration with industries, other universities and the
community to broaden their knowledge sharing base. Through active partnership they are able to
understand stakeholder’s needs resulting into better quality product. This also broadens the
network for opportunities for student placement helping to keep them abreast with emerging
trends.
Internationalization is one of the strategies the Government and the top universities are actively
undertaking in response to global competitiveness (Wang et al., 2013). To remain competitive
globally, HEIs have to achieve an international outlook through making internationalization a
key University agenda. Based on the study finding internationalization was found to significantly
influence performance excellence. Internationalization is one of the parameter used in global
University ranking. Universities in Kenya can enhance internationalization through supporting
staff and student mobility, undertaking joint research and development of joint curriculums.
Through staff mobility the universities should engage experienced scholar from other countries
as well as give opportunities to their own lecture to have an experience in other countries. The
universities should also pursue the international accreditation of their programme this will raise
the institutional profile as well as ensure their graduates are recognized worldwide. Student
exchange will also bring diversity preparing student for global market.
230
The University should have effective processes, quality programmes and efficient service
delivery. The processes should be regularly reviewed to ensure they are effective in delivering
university policies and strategies. The university should also adhere to the recommended system
standards in its operations. The University should make its programmes unique and developed
based on the market needs, unique programmes will make the University more competitive and
thus become university of choice. Branding university based on its unique strength and areas of
focus should also be given a key priority. Curriculum should be regularly reviewed to address the
expected market needs, this should be done in consultation with stakeholders. Special emphasis
should be made in provision of quality services, this include provision of conducive and
adequate learning environment, with the relevant learning facilities such as internet, having ideal
class sizes in line with the recommended guidelines. In Harvard University a class size of less
than 20 constitutes 73.7%, 20-49 (15%) and above 50 (11.7%) (Harvard gazette, 2014).
Allocation of students class advisors who serve as their mentors. Provision of timely feedback to
all raised complaints and provision of information through setting up an information desk.
Support of extra-curricular activities for the students, this gives students a holistic Campus life.
5.3 Research contribution to the knowledge and Implications
The performance of HEIs has a significant influence on country economic development.
Consequently, performance of these universities should be in all the Government priority agenda
to guarantee formation of quality graduates and dissemination of quality research. First this study
identifies the key drivers of University performance excellence through reviewing leading
universities in the world, literature review, theories and excellence model. The theories reviewed
in this study include; transformational leadership theory, resource-based view (RBV), system
theory and contingency theory. The three excellence model reviewed include EFQM excellence
model, Malcolm Baldrige National Quality Award (MBNQA) and Balance Scorecard. The study
also reviewed eleven best universities worldwide. The proposed framework for performance
excellence integrates the four theories, the excellence model and the practice from the eleven
best universities. Since individual theories have their own weaknesses the integrated framework
proposed by this research mitigates the individual weakness thus providing a more robust
framework for addressing the issues of performance excellence in universities this is further
buttressed by practices from world top universities. This study has also contributed to the better

231
understanding of attributes for leadership, people management, resources, partnership and
collaboration, internationalisation, policy and strategies, processes, product and services
5.3.1 Policy and Managerial Implications
The finding of the study reveal that to achieve performance excellence in, the Government, the
university managers and stakeholder should focus on the leadership aspects, people management,
resources, partnership and collaborations, internationalisations, effective processes, quality
products and quality services delivery and develop effective policies and strategies to drive
performance excellence. This study thus stands as a guide to all policy makers and managers of
the HEIs on areas of focus to guide the universities in achieving performance excellence. The
research should guide the policy makers on parameters to focus on when making critical
decisions such as appointment of the University CEOs, development of policies and allocation of
resources. Although the processes of appointment well document and universities have been
recruiting some of the most highly qualified their experience and leadership potential should also
be a key consideration, this should also apply to other levels of leaders the deans, Directors,
CoDs, and HoDs. The motivation of the employees including competitive remunerations and
incentives emerged very key in influencing performance, though the Government has been
engaging university council through union for review of salaries, such engagement should
always strive to ensure the remunerations are competitive compared to other universities
globally. Fundraising emerged prominent among the top world universities, to supplement the
funding from government in case of the public universities; flexible policies should be developed
to allow universities engage in fundraising through establishment of endowment funds, the
government should also build network for universities to access external research funds and
scholarship. The Government has also facilitated the connection of fibre to most of the HEIs in
Kenya, however to effectively adopt and use technology, the Government should support
provision of stable and reliable internet at subsidised rates. Though government support
internationalisation through provision of travel visas and student pass the government can
enhance this through coming up with policy that support staff and student mobility by working
with other countries to forge a good working relationships, source for travel grants and funds to
facilitate the mobility. This study will also be important to the CUE as continuously undertake
232
quality assurance of HEIs institution to inform their decision in drawing their assessment tools.
The Ministry of Education will also greatly benefit from this research findings which will inform
it future plans for HEIs and a basis for university performance contracting and evaluation.
Lastly though the effect of massive expansion was not really the focus of the study, literature
shows it has exacerbated on the challenges being faced by the universities in Kenya. In fact as a
result of the expansion the Government had to reduce capitation of other Universities to share
with newly created universities. This has consequently reduced the allocation for each university.
If the University acquire adequate resources, engage highly talented workforce, competitively
remunerate their employees initiatives which are all capital intensive the researcher support the
Government recommendation on freezing of further expansion of universities in Kenya and
maximise on funding the existing universities.
5.4 Conclusion
Most of the studies undertaken have focused on the challenges facing HEIs but few have
addressed these challenges through identifying the drivers of performance excellence in HEIs
especially in developing countries. The study sort to explore drivers of performance excellence
in universities in Kenya and in particular analyse the influence of leadership, people
management, resources, Partnership and collaboration, internationalization, policy and strategy
and processes, product and services to performance excellence. The study was to further explore
the gaps in drivers of performance excellence in universities in Kenya, compare the drivers in
public and private and develop a framework for assessing performance excellence for
universities in Kenya. First through factor analysis the study was able to map out the most
important dimensions of the study variables based on the factor loadings. The dimension for the
drivers were reduced from 101 to 72 and clustered as follows: leadership (involvement, leaders
experience, delegation and empowerment), people management (Motivation and concentration
of talents), resources (Resource management, fundraising, use of technology and scholarship
and research grant), Partnership and collaboration ( local and international Partnership and
collaboration with other universities, with industries and with communities), internationalization
(internationalization of programme, research, staff andstudent exchange) , policy and strategy
(formulation and implementation) and effective processes, quality product and efficient services

233
delivery. Through factor analysis the most critical dimension for each variable were identified
were retained.
Secondly, all the variables independently had a positive influence on the performance excellence
of HEIs which was consistent with previous studies, while in combined model leadership, people
management, resources, internationalization had a significance effect on the performance
excellence while Policy and strategy, partnership and collaboration and product, processes and
services were not significance. However these variables should not be ignored since they were
independently significance and based on the literature review they are also very important.
Thirdly the driver had a higher influence in private universities that in public which could imply
the level of commitment to drive excellence is more emphasizes in private than in public
universities. Leadership and resources were found to be significance in both public and private
universities, this implies they are very critical as drivers of performance of HEIs and special
emphasis should be preferred upon them. Fourth, the study revealed that leadership, people
management, resources and internationalization were significance while combined while Policy
and strategy, partnership and collaboration and product, processes and services were not
significance when combined with other variables but independently they were significance. This
could be an indicator that leadership, people management, resources and internationalization of
university education can form a suitable framework for assessing performance excellence in
universities in Kenya. It can also be argued that with good leadership, people management,
resources and internationalization the aspects of policy and strategy, partnership and
collaboration and processes, product and services can be addressed.
Finally this study on drivers of performance excellence in universities in Kenya contribute
significantly to our country as a developing nation, by providing a guide to the universities and
especially the recently established universities on the key areas of focus to achieve performance
excellence. Performance excellence will result in quality education and research that are bases of
building knowledge based economy; this will position them strategically in the realization of her
Vision 2030. This study is also useful to other developing countries that are also having
challenges in raising the performance level of their HEIs.
234
5.5 Recommendation for Further Research
A similar study should be undertaken with different target group preferably administrative staff
and lecturers and undertake a comparative analysis of their response to compare their perception
on the aspect of leadership, people management, policy and strategy, partnership and
collaboration, and product, processes and services as it is perceived by the Deans, Directors,
Chairman of Department and Head of Department as it was the case in this study.
Most of the organizations have not explicatively managed to identify their KPIs, this research
having identified the drivers of performance excellence in HEIs, we would recommend a further
study to map out the critical KPIs in universities that this drivers will help to achieve. This will
help the universities in evaluating their performance.
The drivers of performance excellence identified were limited to the HEIs in Kenya, future
studies should focus on other organizations in the business world or other government sector to
establish if the same drivers can apply.

235
REFERENCES
Abdulsalam, D., & Mawoli, M. A. (2012), Motivation and job performance of academic staff of
state universities in Nigeria:the case of Ibrahim Badamasi Babangida University, Lapai
Niger State. International Journal of Business and management, 7(14), 142.
Abel, D. (2013, September 21). Harvards looks to raise $ 6.5b by 2018”, Money would go to
Alston Campus, renovating housing.
https://www.bostonglobe.com/metro/2013/09/21/harvard-launches- record-billion-capital-
campaign/IRIICJYhmhyfhQSzCOvIEO/story.html Accessed 28/10/2016.
Adeboye, N., Fagoyinbo, I., & Olatayo, T. (2014). Estimation of the effect of multicollinearity
on the standard error for regression coefficients. IOSR Journal of Mathematics, 10(4),
16-20.
Akyüz, A. (2005). Application of EFQM excellence model to the Sabancı University IC. Twelfth
International Conference Crimea 2005 Libraries and Information Resources in the
Modern World of Science, Culture, Education, and Business.
http://dx.doi.org/10.2139/ssrn.1461403
Alden, J., & Lin, G. (2004). Benchmarking the characteristics of a world-class University:
Developing an international strategy at University level. Leadership Foundation for
Higher Education, Londres.
Alemu, K,.S. (2013). Global University Rankings and African Universities
http://unike.au.dk/fileadmin/www.unike.au.dk/African_universities_and_Global_
Ranking.pdf Accessed 22/11/2016
Altbach, P. G. (2002). Perspectives on international higher education. Change: The Magazine of
Higher Learning, 34(3), 29-31.
Altbach, P. G. (2004). Globalisation and the University: Myths and realities in an unequal
world. Tertiary Education & Management, 10(1), 3-25.
Altbach, P. G. (2004). The costs and benefits of world-class universities. Academe, 90(1), 20-23
Altbach, P. G., & Salmi, J. (Eds.). (2011). The road to academic excellence: The making of
world-class research universities. The World Bank
Alpert, C. L. (2009). Broadening and deepening the impact: A theoretical framework for
partnerships between science museums and STEM research centres. Social
Epistemology, 23(3-4), 267-281.
Arjomandi, M., Kestell, C., & Grimshaw, P. (2009). An EFQM Excellence Model for higher
236
Education quality assessment. In 20th Annual Conference for the Australasian
Association for Engineering Education, 6-9 December 2009: Engineering the Curriculum
(p.1015).Australia.
Armstrong, M. (2008). How to be an even better manager; a complete A-Z of proven techniques
and essential skills, 7th ed. Library of congress. Cataloging-in-Publication Data. ISBN
9780749451639 Assessment & Applications; 5thedition. McGraw-Hill/Irwin. New York
Arslanhan, S., & Kurtsal, Y. (2010). To what South Korea owes success in innovations?
Implications for Turkey. TEPAV Policy Note.
Avolio, B., Walumbwa, F., & Weber, T.,J., (2009) ."Leadership: Current Theories, Research,
and Future Directions". Annual Review of Psychology, 60, 421-449.
Azma, F. (2010). Qualitative indicators for the evaluation of universities performance. Procedia
Social and Behavioral Sciences, 2(2), 5408-5411.
Bakar, S. & Mahmood, R. (2014). Linking Transformational Leadership and Corporate
Entrepreneurship to Performance in the Public Higher Education Institutions in Malaysia.
Advances in Management & Applied Economics, vol.4 no. 3 109-122.
Baldridge, J. V., & Okimi, P. H. (1982). Strategic planning in higher education: New tool-or new
gimmick. AAHE Bulletin, 35(6), 15-18.
Balyer, A. (2012). Transformational Leadership Behaviors of School Principals: A Qualitative
Research Based on Teachers' Perceptions. International Online Journal of Educational
Sciences, 4(3).
Barlow, J., & Møller, C. (2008). A complaint is a gift: recovering customer loyalty when things
go wrong. Berrett-Koehler Publishers.
Barney, J. (1991). Firm resources and sustained competitive advantage. Journal of
management, 17(1), 99-120.
Barney, J.B. (2001). Is the resource-based “View” A useful perspective for strategic management
research? Yes. Academy of management review, Vol 28, No. 1, 41-58.
Barragán Codina, J. N., & Leal López, R. H. (2013). The importance of student mobility,
academic exchange and internationalization of higher education for college students in a
globalized world: The Mexican and Latin American case. Daena: International Journal
of Good Conscience, 8(2), 48-63.
Bastedo, M., N. (2004, April 28). Open System Theory. Entry, The SAGE Encyclopedia of
educational Leadership and administration. University of Chicago.
237
http://www-personal.umich.edu/~bastedo/papers/bastedo.opensystems.pdf [Accessed
18/6/2016]
Behn, R. D. (2003). Why measure performance? Different purposes require different
measures. Public administration review, 63(5), 586-606.
Bennis, W., & Nanus, B. (1985). Leadership: The strategies for taking charge. New York.
Bergan, S. (2003). Student participation in higher education governance.
Blackmore, J., & Douglas, A. (2003). Towards a “better” University: the Use of the EFQM
Model in a UK Higher Education Institution. Asian Journal on Quality, 4(2), 1-15.
Bloom, D. E., Canning, D., & Chan, K. (2006). Higher Education and Economic Development in
Africa (Vol.102). Washington, DC: World Bank .
Bolden, R., Petrov, G., & Gosling, J. (2009). Distributed leadership in higher education: Rhetoric
and reality. Educational Management Administration & Leadership, 37(2), 257-277.
Bolden, R., Gosling, J., O'Brien, A., Peters, K., Ryan, M. K., Haslam, S. A., & Winklemann, K.
(2012). Academic leadership: Changing conceptions, identities and experiences in UK
higher education.
Bothwell, E. (July 9, 2015). The Time Higher Education Supplement: THE (July 9, 2015). South
Africa Dominates in Top Tier of Rankings Pilot, volume/issue No. 2211.
https://www.questia.com/magazine/1P3-3741481841/south-africa-dominates-in- top-
tier-of- rankings-pilot [Accessed 2/6/2016]
Bothwell, E. (April 21, 2016). Best universities in Africa; Times Higher Education World
University Rankings data reveal the top 15 universities in Africa.
https://www.timeshighereducation.com/world-university-rankings/best-universities-in-
africa- 2016 [Accessed 2/6/2016]
Botman, H. R. (2011). Stellenbosch University’s Hope Project as a development campaign for
fundraising and institutional transformation: a vice-chancellor’s view.
http://www.sun.ac.za/english/Documents/Rector/speeches/Advancement.pdf
[Accessed 19/3/2016]
Bou-Llusar, J. C., Escrig-Tena, A. B., Roca-Puig, V., & Beltrán-Martín, I. (2009). An empirical
assessment of the EFQM Excellence Model: Evaluation as a TQM framework relative to
the MBNQA Model. Journal of Operations Management, 27(1), 1-22.
Boyd, R. L. (2012 ) Customer Service in Higher Education: Finding a Middle Ground
https://dus.psu.edu/mentor/2012/06/customer-service-in-higher-education.[Accessed
2/11/2016]
238
British Council (2015). Bridging the Gap: Enabling effective UK-Africa University Partnerships.
London: British Council. http://www.britishcouncil.org/sites/default/files/2.5_bridging-
the-gap.pdf [Accessed 18/6/2016]
Brown, R. (2015). Marketing a Higher Education Institution's Organizational Identity. The
University of Alabama.
Bryman, A., (2007) Effective Leadership in Higher Education: a literature review, Studies
in Higher Education, 32:6, 693-710.
Bunzel, D. L. (2007). Universities Sell their Brands. Journal of Product & Brand Management,
16(2), 152-153.
Cazzell, B., & Ulmer, J. M. (2009). Measuring excellence: A closer look at Malcolm Baldrige
National Quality Award winners in the manufacturing category. Journal of technology
management & innovation, 4(1), 134-142.
Chacha, N. (2004). Reforming Higher Education in Kenya: Challenges, Lessons and
Opportunities. A paper presented at a workshop organized by the parliamentary
committee on education, Science and Technology in Naivasha-Kenya, August 2014.
Chatfield, C., & Collins, A. J. (1992) Introduction to Multivariate Analysis, Chapman & Hall,
London.
Cheung, W., and Huang,W.(2005). Proposing a framework to assess internet usage in University
education: An empirical investigation from a student’s perspective. British Journal of
educational Technology 36, no.2: 237-53
Child, D. (2006). The essentials of factor analysis. (3rd ed) New York, NY: Continuum
International Publishing Group.
Cloete, N., Bailey, T., & Pillay, P. (2011). Universities and economic development in Africa.
African Minds.
Cohen, M. & March J. (1974). Leadership and Ambiguity: The American college president. New
York, McGraw-Hill.
Comrey, A. L., & Lee, H. B. (1992). A First Course in Factor Analysis. 2nd Edition.
Hillsdale, New Jersy: Erlbaum.
Comrey, A. L., & Lee, H. B. (2013). A first course in factor analysis. Psychology Press.
Cooper, D.R, & Schindler,P.(2008). Business research Methods. ( 10th, ed.) New Delhi.
McGraw-Hill company ltd.
239
Cooper, D.R., & Schindler, P.S. (2011). Business research methods, (11th, ed.). New Delhi:
McGraw-Hill Publishing, Co. Ltd.
Cortese, A. (2003) The Critical Role of Higher Education in Creating a Sustainable
Future: Higher education can serve as a model of sustainability by fully integrating all
aspects of campus life.
Costello & Osborne (2005) Exploratory Factor Analysis, Practical Assessment Research &
Evaluation, Vol. 10, No 7 2.
Creso, M. (2013). Perspective of Industry’s Engagement with African Universities. Accra:
African Association of Universities.
Creswell, J. W. (2013). Research design: A qualitative, quantitative, and mixed method
approaches. Sage publications.
CUE. (2014). Universties Standards and Guideline, (June), 1–134.
Da Rosa, M. J. P., Saraiva, P. M., & Diz, H. (2003). Excellence in Portuguese higher education
institutions. Total Quality Management & Business Excellence, 14(2), 189-197.
Daft, R. L. (2007). Understanding the Theory and Design of Organisation. Thomson: South-
Western: Cengage Learning.
Daft, R. L., Kendrick, M. & Vershinina, (2010). Management. Hampshire, South-Western:
Cengage Learning.
Daft, R., & L. (1999). leadership: Theory and Practice. Owen Graduate School of Management
Vanderbilt University.
Davies, J., Hides, M. T. & Casey, S. (2001). “Leadership in Higher Education”, Total Quality
Management, 12:7-8, 1025-1030.
Dawson, C. (2009). Introduction to research methods: A practical guide for anyone undertaking
a research project. London: Newtec.
Dearlove, J. (1995). Governance, leadership and change in universities. UNESCO.
http://unesdoc.unesco.org/images/0010/001009/100939eo.pdf [Accessed 26/8/2015]
DeGhetto, K., Gray, J. R., & Kiggundu, M. N. (2016). The African Union's Agenda 2063:
aspirations, challenges, and opportunities for management research. Africa Journal of
Management, 2(1), 93-116.
240
Denham, J. (2015, May 22). So why is MIT number one in the world university rankings?
Http://www.independent.co.uk/student/news/so-why-is-mit-number-one-in-the-world-
university-rankings- 8806894.html [Accessed 8/10/2016]
Douglass, J. A. (2014). Profiling the Flagship University Model: An Exploratory Proposal for
Changing the Paradigm from Ranking to Relevancy. Research & Occasional Paper Series:
CSHE.5.14. Center for Studies in Higher Education.
Drori, G. S., Delmestri, G., & Oberg, A. (2013). Branding the University: Relational strategy of
identity construction in a competitive field. Trust in higher education institutions, 134-
147.
Drori, G. (2015). Branding universities: Trends and strategies. International Higher Education,
(71), 3-5.
Drucker, P. F. (1993).The Practice of Management. New York, USA: Harper Business.Pp:57-60.
Dulewicz, V., & Higgs, M. (2003). A new approach to assessing leadership dimensions, styles
context. Competency and Emotional Intelligence Quarterly, 11(2), 224-232.
Dumitriu, R. (2012). The Role of Branding in Marketing Strategy, Management & Marketing
Journal, 10(1).
Daniyal, M., Nawaz, T., Aleem, M., & Hassan, A. (2011). The factors affecting the students’
performance: a Case Study of Islamia University of Bahawalpur, Pakistan. African
Journal of Education and Technology, 1(2), 45-51.
Economic Insight (2014, March). Growing the Best and Brightest: The Driver of Research
Excellence.https://assets.publishing.service.gov.uk/government/uploads/system/uploads/
attachment_data/file/298507/Growing_the_Best_and_Brightest._The_Drivers_of_Resear
ch_Excellence.pdf [Accessed 24/5/2016]
Eden, C. (1993) Strategy Development and Implemtation: cognitive mapping for group Support,
in Hendry, J. Johnson, G. and Newton, J. (eds) Strategic Thinking: Leadership
Management of Change, John Wiley, Chichester.
Endowment. (n.d.). http://www.harvard.edu/about-harvard/harvard-glance/endowment
[Accessed 15/4/2016]
Epstein, M. J. (2004). The drivers and measures of success in high performance
organizations. Performance measurement and management control: superior
organizational performance. Studies in managerial and financial accounting, 14.
EFQM. (2013). 2013 EFQM Excellence Model, 980–993.
241
EFQM. (2012). An Overview of the EFQM Excellence Model,
http://doi.org/10.1017/CBO9781107415324.004
EFQM. (2013). An Overview of the EFQM Excellence Model,
http://www.efqm.org/sites/default/files/overview_efqm_2013_v1.pdf
Esa, A., Mohamad, N. H., Abd Aziz, Z., & Aishah, S. (2014). Holistic student development
through co-curricular activities (ccas) in polytechnic: methodological approach.
Eskildsen, J. K. Kristensen, K., & Jorn Juhl, H. J. (2001). The criterion weights of the EFQM
excellence model. International journal of quality & Reliability management, 18(8),
783-795.
Ewalt, D. (2016, Sep 28). Reuters Top 100: The World’s Most Innovative Universities-2016
http://www.reuters.com/article/amers-reuters-ranking-innovative-univers-
idUSL2N1C406D Accessed 24/11/2016
Farndale, E., Hope-Hailey, V., & Kelliher, C. (2011). High commitment performance
management: The roles of justice and trust. Personnel Review, 40(1), 5-23.
Fazekas M. and T. Burns (2012), “Exploring the Complex Interaction between Governance
and Knowledge in Education”, OECD Education Working Papers, No. 67, OECD
Publishing, Paris.
Feciková, I. (2004). An index method for measurement of customer satisfaction. The TQM
Magazine, 16(1), 57–66.
Fielden, J. (2008). Global Trends in University Governance. The World Bank, 70.
Gabčanová, I. (2011). the Employees – the Most Important Asset in the Organizations. Human
Resources Management & Ergonomics, V, 1–12.
Gay, L.R. (1992). Educational Research:Competencies for Analysis and Applications 4th Edition,
NewYork: Macmillan Publishers.
Gelinas, U. J., Sutton, S. G., & Fedorowicz, J. (2010). Business Process and Informaton
Technology. Thomson: South-West.
Ghasemi, A., & Zahediasl, S. (2012). Normality tests for statistical analysis: a guide for non-
statisticians. International journal of endocrinology and metabolism, 10(2), 486.
Given, R. J. (2008). Transformational leadership: The impact on organization and personal
outcomes. Emerging Leadership Journeys; Vol 1 Iss.1,pp. 4-24.

242
Gill, R. (2002). Change management--or change leadership?. Journal of change
management, 3(4), 307-318.
Golafshani, N. (2003). Understanding reliability and validity in qualitative research. The
qualitative report, 8(4), 597-606.
Goleman, D. (2001). An EI-based theory of performance. The emotionally intelligent
workplace: How to select for, measure, and improve emotional intelligence in
individuals, groups, and organizations, 1, 27-44.
Goleman, D., Boyatzis, R., and McKee, A (2002). Primal Leadership: learning to lead with
emptional intelligence, Boston, MA, USA, Havard Business School.
Goodall, A. (2015). The Leaders of the World's Top 100 Universities. International Higher
Education,(42).
Goodall, A. H. (2012). A theory of expert leadership.
http://ftp.iza.org/dp6566.pdf [Accessed 23/7/2015]
Govindarajan, M., &Natarajan, S. (2005). Principles of Management. Asoke K. Ghosh, PHI
Learning Private Limited.
Graham, S., & Weiner, B. (1996). Theories and Principles of Motivation. Handbook of
educational psychology, 4, 63-84.
Grant, R. M. (1991). The resource-based theory of competitive advantage: implications for
strategy formulation. California management review, 33(3), 114-135.
Graves, W. H. (2005). Improving institutional performance through IT-enabled.
innovation. Educause review, 40(6), 78.
Greenspan, A. & Rosan, M. (2006), The Role of Universities Today: Critical Partners in
Economic Development and Global Competitiveness,
Gudo, C. O., Olel, M. A., &Oanda, I. O. (2011). University expansion in Kenya and issues
of quality education: challenges and opportunities. International Journal of Business and
Social Science, 2(20).
Hanna, D. E. (2003). Building a Leadership Vision. EDUCAUSE review v38n4 p24-28, 30-34
Jul-Aug 2003.
Hair, J. F., Black, W. C., Babin, B. J., Anderson, R. E., & Tatham, R. L. (1998). Multivariate
data analysis (Vol. 5, No. 3, pp. 207-219). Upper Saddle River, NJ: Prentice hall.
243
Harari, M. (1992). The internationalization of the curriculum. In C.B. Klasek (Ed) Bridges
to the future: Strategies for internationalising higher education. Carbondale: AIEA,
p. 553.
Harper, S. (2012). The leader coach: A model of multi-style leadership. Journal of
Practical Consulting, 4(1), 22-31.
Harris, A. (2008). Distributed leadership through the looking glass. Journal of educational
administration, 46(2).
Harvard University (2016). “About havard/Harvard at glance”
https://www.harvard.edu/about-harvard/harvard-glance/history [Accessed 18/3/2016]
Harvard University (2014, May 29) President, Prof. Drew Faust 2014 Commencement Speech.
http://www.harvard.edu/president/speech/2014/2014-commencement-speech
[Accessed 15/7/2014]
Harvard Campaign has early impact. (2015, January 28).
http://news.harvard.edu/gazette/story/2015/01/harvard-campaign-has-early-impact/
[Accessed 18/3/2016]
Harvard Campaign on track. (2014, May 29).
http://news.harvard.edu/gazette/story/2014/05/harvard- campaign-on-track/
[Accessed 18/3/2016]
Harvard Gazette (2009, February 5-11)
https://news.harvard.edu/gazette/story/2014/ Accessed [Accessed 15/4/2016]
Harwell, M. R. (2011). Research design in qualitative/quantitative/mixed methods. CONRAD
Clifton F.; SERLIN, Ronald C. The SAGE Handbook for Research in Education:
Pursuing ideas as the keystone of exemplary inquiry.2ª Edition. Thousand Oaks,
CA:SAGE Publications, 147-163.
Hatakenaka, S. (2004). University-industry partnerships in MIT, Cambridge, and Tokyo:
storytelling across boundaries. Routledge.
http://ejournals.bc.edu/ojs/index.php/ihe/article/view/7479/6674 [28/1/2016]
Hatakenaka, S. (2015). University-Industry Partnership Reconsidered: Three lessons
International Higher Education, (39).
https://ejournals.bc.edu/ojs/index.php/ihe/article/viewFile/7479/6674
[Accessed 27/10/2015]
244
Havergal, C. (2015). MENA top 30 Snapshot released as THE MENA Universities
Summit launches. Times Higher Education.
https://www.timeshighereducation.com/news/mena-top-30-snapshot-released-as-the-
mena-universities-summit-launches/2018704.article [28/1/2016].
Hazelkorn, E. (2013). World-class universities or world class systems?: Rankings and higher
education policy choices.
Heffner, C. L. (2004). Research Methods.
Henard, F., & Leprince-Ringuet, S. (2008). The path to quality teaching in higher
education. Paris: OCED Publication.–2008.
Henry, G.T. (1990). Practical Sampling. Newbury Park: CA: Sage
Higgs, M., & Wren, J. (2005). The Leadership of Change: a Study of Change
Leadership within the UK Royal Air Force. Henley Management College.
http://www.raf.mod.uk/pmdair/rafcms/mediafiles/pdf accessed 1/8/2015.
Hladchenko, M. (2015). Balanced Scorecard - a Strategic Management System of the Higher
Education Institution. International Journal of Educational Management, 29(2), 167–
176.
Hogan, R., Curphy, G. J., & Hogan, J. (1994). What we know about leadership: Effectiveness
and personality. American psychologist, 49(6), 493.
Holden, M. T., & Lynch, P. (2004). Choosing the appropriate methodology: understanding
research philosophy. The marketing review, 4(4), 397-409.
Holt, D. B. (2003). Brands and branding. Boston, MA: Harvard Business School.
Horta, H. (2009). Global and national prominent universities: internationalization,
competitiveness and the role of the State. Higher Education, 58(3), 387-405.
Hox, J. J., & Boeije, H. R. (2005). Data collection, primary vs. secondary. Encyclopedia of social
measurement, 1(1), 593-599.
INDUS Techinnovations, (2012), Insights from Successful IP Commercialization
Activities in Academia.
Imperial College London (2016). Strategy 2015-2020.
http://www.imperial.ac.uk/strategy/excellence/ [26/3/2016]
Iqbal, M. J., Rasli, A. B. M., & Hassan, I. (2012). University Branding: A Myth or a
Reality. Pakistan Journal of Commerce & Social Sciences, 6(1).

245
Israel, G. D. (1992). Determining sample size (pp. 1-5). Gainesville: University of Florida
Cooperative Extension Service, Institute of Food and Agriculture Sciences, EDIS.
Jackson, E. (2013) Choosing a Methodology: Philosophical Underpinning, Practitioner Research
in Higher Education Journal, 7(1), October.
Jagersma, J., & Parsons, J. (2011). Empowering Students as Active Participants in Curriculum
Design and Implementation. New Zealand Journal of Teachers’ Work, 8(2), 114-121.
Jenkins, R. (2012). Leadership Versus Control; The Chronicle of Higher Education.
http://chronicle.com/blogs/onhiring/leadership-vs-control/30471 [Accessed 26/8/2015]
Jing, F. F., & Avery, G. C. (2011). Missing links in understanding the relationship between
leadership and organizational performance. International Business & Economics
Research Journal (IBER), 7(5).
Joseph, M., Mullen, E. W., & Spake, D. (2012). University branding: Understanding students’
choice of an educational institution. Journal of Brand Management, 20(1), 1-12.
Jowi, J. O. (2009). Internationalization of higher education in Africa: Developments, emerging
trends, issues and policy implications. Higher Education Policy, 22(3), 263-281.
Kagondu, R. K.(2015). Quality Assurance in Kenya’s Higher Education: Gaps and Opportunities
for Improvement. PhD Dissertation, A PhD thesis presented at Dedan Kimathi
University in 2015.
Kalei, A. M. W. (2014). An Analysis Of Kenya's Bachelor of Commerce Graduates'
Employability Skills and The Job Market Demands. A PhD thesis presented at Dedan
Kimathi University in 2014.
Kaplan, R. S. (2010). Conceptual Foundations of the Balanced Scorecard. Handbooks
of management accounting research, 3, 1253-1269
Kaplan, R. S., & Norton, D. P. (2008). The Execution Premium: Linking Strategy to Operations
for Competitive Advantage. Harvard Business press.
Karpova, B. E. (2006). Case Study : Alumni Relations, Fundraising and Development in US
Universities. IREX University Administration Support program 2006, 1- 28.
Kashorda, M., &Waema, T. (2014).E-Readiness survey of Kenyan Universities (2013)
report. Nairobi: Kenya Education Network.
https://www.kenet.or.ke/sites/default/files/ [Accessed 6/7/2016]
Katsarova, I. (2015). “Higher Education in the EU, Approaches, issues and trends. In-depth

246
analysis”. European parliamentary research service.
http://www.europarl.europa.eu/EPRS/EPRS-IDA-554169-Higher-education-in-the-EU-
FINAL.pdf[Accessed 26/11/2016
Kenya Education Network (KENET). 2009. E-readiness survey of east African universities 2008
https://ereadiness.kenet.or.ke/sites/default/files/E-readiness%20Survey%20of%20East%
20Afrcan% 20Universities%20Report%202009.pdf
Ketchen, D. & Short, J. (2016), Mastering Strategic Management. V.1.0
Kimberlin, C. L., & Winterstein, A. G. (2008). Validity and reliability of measurement
instruments used in research. American Journal of Health-System Pharmacy, 65(23),
2276-2284.
Kimathi, K. J., & Henry, E. E. (2014). An Evaluation of Quality of University Education in
Kenya during this Massification Era. Mediterranean Journal of Social Sciences, 5(5),
345.
Kilonzo, S. M.(2011). Challenges of Autonomy in Higher Institutions of Learning in Kenya:
Diluted Education? ISA
Kipkebut, D. J. (2010). Organizational Commitment and Job satisfaction in Higher Educational
Institutions: The Kenyan Case. PhD Thesis, Middlesex University
Kirkpatick, S. A., & Locke, E. A. (1991). Leadership: do traits matter? The executive, 5(2),48
60.
Knight, J. (2008). “Africa in relation to other world regions.” Chapter in Teferra, D. and Knight,
J. (eds). Higher Education in Africa: The International Dimension. Accra: Association of
African Universities. http://www.africanbookscollective.com/books/higher-education-in-
africa
Khoon, K. A., Shuko, R., Hassan, O., Saleh, Z.,Hamzah,A.,Ismai R. L., (2005). Hallmarrk of a
world-class university. College Student Journal
Kombo, D.K., & Tromp, D.L.A. (2009). Proposal and thesis writing. An Introduction. Nairobi:
Don Bosco Printing Press.
Kothari, C. (2004). Research Methodology: Methods & Techniques. New age International
publishers, New Delhi, India.
Kouzes, J. M. & Posner, B. Z. (2007). The Leadership Challenge (4th ed.). San Francisco,
CA: Jossey-Bass
247
Kramer, W. J., Jenkins, B., & Katz, R. S. (2007). The role of the information and
communications technology sector in expanding economic opportunity. Cambridge, MA:
Kennedy School of Government, Harvard University.
Kraaijenbrink, J., Spender, J. C., & Groen, A. J. (2010). The resource-based view: A review and
assessment of its critiques. Journal of management, 36(1), 349-372.
Kressler, H. W. (2003). Motivate and Reward: Performance Appraisal and Incentive Systems for
Business Success. U.S.A.: Palgrave Macmillan.
Kundishora, S. M. (2014). The Role of Information and Communication Technology ICT) in
Enhancing Local Economic Development and Poverty Reduction. Zimbabwe Academic
and Research Network.
Kuye, L. O., & Sulaimon, A. A. H. (2011). Employee involvement in decision making and firms
performance in the manufacturing sector in Nigeria. Serbian Journal of
management, 6(1), 1-15.
Kwaramba, M. (2012). Internationalisation of Higher Education in Southern Africa with South
Africa as a Major Exporter. Journal of International Education and Leadership, 2(1), n1.
Kyule, A., Kangu, M., K., Wambua, P., W., Mutinda, B., Kamau, S. (2014.). Strategizing on
Cost : Effect of part-time lecturers on University Education in Kenya. Prime Journal of
Social Science (PJSS), Vol. 3 (2). pp. 603-607. ISSN 2315-5051.
Lai, A (2011), "Transformational-Transactional Leadership Theory". AHS Capstone Projects.
Paper 17. http://digitalcommons.olin.edu/ahs_capstone_2011/17 [Accessed 9/7/2016]
Laferla R. (2010). Discover your management style. Sasa Sema Publications. Longhorn Kenya
Ltd.
Lester, R. K. (2005). Universities, Innovation, and the Competitiveness of Local Economies: A
Summary Report from the Local Innovation Systems Project—Phase I. Industrial
Performance Center - Massachesetts Institute of Technology, 33. http://web.mit.edu/lis/
Accessed 5/2/2013
Liu, N.C., Wang, Q., Cheng, Y. (2011). Paths to a World-Class University. Lessons from
practices and experiences. Sense Publishers.
Liu, N. C., & Cheng, Y. (2005). The academic ranking of world universities. Higher education
in Europe, 30(2), 127-136.
Lobosco, k. (2016, January 27). “America’s 10 richest Colleges”
http://money.cnn.com/2016/01/27/pf/college/largest-college-endowments/index.html
Accessed 28/10/2016
248
Locke, E. & Kirkpatrick, S. (1991).The essence of leadership (1st ed). New York: Lexington
books
Locke, E. A., & Allison, J. A. (2012). What Makes Great Business Leaders?. The Oxford
Handbook of Leadership.
Locke, Edwin, A. (1999). The essence of Leadership: the four keys to leading successfully.
Lexington Books.
Lord, R. G., & Brown, D. J. (2001). Leadership, values, and subordinate self- concepts. The
Leadership Quarterly, 12(2), 133-152.
Macharia, K. ,N. & Pelser (2014). Key factors that influence the diffusion and infusion of
information and communication technologies in kenya Higher education, studies in
Higher Education, 39:4, 695- 709.
Macfarlane, B. (2013). Intellectual leadership in higher education: Renewing the role of the
university professor. Routledge.
MacGregor, K. (2016, January), Governance models and leadership quality in Universities. Issue
No397 http://www.Universityworldnews.com/article.php?story=20160122161320466
[Accessed 17/6/2016]
Magwa,W. (2015). Enhancing Africa's renewal through internationalisation of higher education:
a review of management strategies and issues.
Makoni, M. (2012). South African institution proves there is money in philanthropy;
Stellenbosch bags billions from donors.
http://www.researchresearch.com/index.php?option=com_news&template=rr_2co
l&view=article&articleId=1180637 [Accessed 11/2/2016]
Mange, D.M., Onyango, G.A. & Waweru S. N. ( 2015). Management challenges facing Kenya’s
public universities and implications for the Quality of Higher Education. International
conference on “Re-Engineering Education for Sustainable Development” Kenya
University, Kenya.
Marmolejo, F. (2012), “Internationalization of higher education: the good, the bad, and the
unexpected”, Chronicle of Higher Education, October 22, 2012.
Marginson, S. (2006). Dynamics of national and global competition in higher education. Higher
education, 52(1), 1-39.

249
Marope, P. T. M., Wells, P. J., &Hazelkorn, E. (Eds.). (2013). Rankings and accountability in
higher education: uses and misuses. UNESCO.
http://unesdoc.unesco.org/images/0022/002207/220789e.pdf [Accessed 9/2/2016 ]
Martinez. A., A. (2015). To improve student-faculty ratio, UT must hire more faculty for less
http://www.dailytexanonline.com/2015/04/16/to- improve-student-faculty-ratio-ut-
must-hire-more-faculty-for-less [Accessed 14/10/2015]
Marwa, S. M., & Rand, G. (2008). Where are East African Business Schools in the race
towards World class status?. International Journal of Excellence in Education, 2(1),
1-26.
Mathooko, F. M., & Ogutu, M. (2014). Coping strategies adopted by public universities in
Kenya in response to environmental changes. Journal of Management and
Strategy, 5(1), 93.
Mawoli, M. A., & Babandako, A. Y. (2011). An evaluation of staff motivation, dissatisfaction
and job performance in an academic setting. Australian Journal of Business and
Management Research,1(9), 1.
Mbirithi, D. M. (2013). Management Challenges Facing Kenya's Public Universities and
Implications For the Quality Of Education (Doctoral dissertation).
McCormack, J, Propper, C and Smith, S. (2013) Herding cats? Management and University
performance. The Economic Journal, 124 (578). pp. 534-564.
McCarthy, C., Eastman, D., & Garets, D. E. (2010). Change Management Strategies for an
Effective EMR Implementation. Chicago, IL: Himss.
McLellan, C. E. (2008). Internationalization and the pursuit of a developmental settlement: The
case of a South African university (Doctoral dissertation, University of Pretoria).
Minsky, H. P. (2015). Can" it" happen again?: essays on instability and finance.
Routledge.
https://www.amazon.com/Can-Happen-Again-Instability-Routledge/dp/1138641952
[Accessed 9/7/2016]
Minsky, C. (2015, September 30). Best universities in the world revealed: THE world university
ranking 2015/2016
https://www.timeshighereducation.com/student/news/africa-ranking-2016-top-
universities-students
MIT Facts ( 2015). Faculty and staff.
http://web.mit.edu/facts/faculty.html. [Accessed 10/10/2015]
250
MIT (2016). Report of the Treasurer for the year ended June 30, 2015
http://vpf.mit.edu/index.php/site/content/download/183604/410800/file/Trs_Rprt_20
15 web_version_2.pdf [Accessed 10/10/2015]
MIT’s Industrial Partnership Report (2003, March 11). Report of the ad hoc Committee on
Industrial Partnership review.
http://web.mit.edu/chancellor/IndlPartnershipsRpt.pdf [Accessed 10/10/2015].
MIT Report of the Treasurer June 30, (2015)
http://vpf.mit.edu/sites/default/files/downloads/TreasurersReport/MITTreasurersReport20
15.pdf
Mitchell, M., & Leachman, M. (2015, May 13). Years of cuts threaten to put college out of
reach for more students. Center on Budget and Policy Priorities, 13.
https://www.cbpp.org/sites/default/files/atoms/files/5-13-15sfp.pdf[Accessed22/11/2016]
Moore, R.M. (2010) The real U Building Brands that resonate with Students, faculty, staff, and
donors. Washington DC: Council for Advancement and Support of Education (CASE).
Miller, G. J., & Yang, K. (2008). Handbook of research methods in public administration.
Newyork: Auerbach Publications.
Mosley D.,C., Mosley, D.,C.&Pietri, P.,H, (2011). Supervisory management: The
Art of Inspiring, Empowering, Developing People. 8th ed. Library of
congress
Mugenda, A.G. (2008). Social science research. theory and principles. Nairobi: Act press.
Mugenda, A.G. (2011). Social science research; theory and principles. Nairobi: Act press.
Mukherjee, H., & Wong, P. K. (2011). The National University of Singapore and the University
of Malaya: Common roots and different paths. The road to academic excellence: The
making of world-class research universities, 129-163.
Mukhwana, E., Oure, S., Kiptoo, S., Kande, A., Njue, R. Too, J. and Some, D.K. (2016) State of
University Education in Kenya. Commission for University Education. Discussion Paper
04. Nairobi, Kenya.
Mullins, L. J. (2010). Management and Organisational Behaviour, Pearson Education, 9th
Edition.
Muller R. and Turner R. (2010). Project Oriented Leadership
251
Murray, F. & Budden, P (2014). Innovation Diplomacy: World come to Greater Boston to learn
innovation from MIT.
http://real.mit.edu/documents/idiplomacy.pdf [Accessed 24/10/2015]
Murry,F. (2013) Evaluating the role of Science Philanthropy in America Research
Universities; The National Bureau of Economic Research
http://fmurray.scripts.mit.edu/docs/Murray_IPE2012_SciencePhilanthropy_13102
proof.pdf [Accessed 24/10/2015]
Mutula, S.,M (2002) "University education in Kenya: current developments and future outlook",
International Journal of Educational Management, Vol. 16 Iss: 3, pp.109 – 119
http://www.emeraldinsight.com/doi/abs/10.1108/09513540210422219 [Accessed
7/6/2016]
Mwiria, K. Ngethe, N.,Ngome, C.,& Odero D.C. (2007). Public and Private univerisites in
Kenya: New Challenges, Issues and Achievements. Nairobi: East African Education
Publishers.
Naing, L., Winn, T., & Rusli, B. N. (2006). Practical issues in calculating the sample size for
prevalence studies. Archives of orofacial Sciences, 1(1), 9-14.
Neely, A., Gregory, M., & Platts, K. (1995). Performance measurement system design: a
literature review and research agenda. International journal of operations & production
management, 15(4), 80-116.
Ngok, K., & Guo, W. (2008). The quest for world class universities in China: Critical reflections.
Policy Futures in Education, 6(5), 545-557.
Nigavekar, A (2011), Cultivating Leaders of Education Institution; ASCI Journal of management
40 (1): 1-16.
Niland,J.(2007). The challenge of building world-class universities. In J.sadla & N.C. Liu (Eds.)
The world-class university and ranking: Aiming beyond status. Bucharest: UNESCO-
CEPES.
Nohria, N., Joyce, W., & Roberson, B. (2003). What really works (pp. 42-52). Audio-Tech
Business Book Summaries
Nohria , N., & Khurana, R. (2010). Handbook of leadership theory and practice. Harvard
Business Press
Nordling,L. (2012). Africa Analysis: Taking charge of University Fundraising.
http://www.scidev.net/global/communication/analysis-blog/africa-
analysis-taking-charge-of-University-fundraising.html#

252
[Accessed 19/03/2016]
Northouse, Peter, G. (2010). Leadership: Theory and Practice (5th Edition).
Western Michigan University: sage publication ltd.
Norton, M. (2009). The Worldwide Fundraiser’s Handbook: A resource mobilization guide for
NGOs and community organisations, 1–35. NUS. at glance 2015/16 - PDF -
DocPlayer.net docplayer.net/48008372-Nus-glance-at-a-2015-
16.html Nus At A Glance 2013 - Times Higher Education
https://www.timeshighereducation.com/file/1758483/download?token=czImjvIr
Njagi, J. (2017, January 13). “Commission to overhaul higher education through appraisal”. The
Daily Nation Newspaper.
Nyangau, J. Z. (2014). Higher education as an instrument of economic growth in Kenya.
In FIRE: Forum for International Research in Education (Vol. 1, No. 1, p. 3)
Odhiambo, G. O. (2011). Higher education quality in Kenya: a critical reflection of key
challenges. Quality in Higher Education, 17(3), 299-315.
Obiwuru Timothy, C., Okwu, A. T., Akpa, V. O., & Nwankwere, I. A. (2011). Effects of
leadership style on organizational performance: A survey of selected small scale
enterprises in Ikosi-Ketu council development area of Lagos State, Nigeria. Australian
Journal of Business and Management Research, 1(7), 100-111.
Odumeru, J. A., & Ogbonna, I. G. (2013). Transformational vs. transactional leadership theories:
Evidence in literature. International Review of Management and
Business Research, 2(2), 355. OECD (2015), OECD Education Policy Outlook 2015:
Making Reforms Happen, OECD Publishing.
Ogot, B.A. (2002) ‘The Marketing of International Education: Lessons from Australia and
Britain for Africa’, in D.K. Some and B.M. Khaemba (eds.) Internationalization of
Higher Education: The African Experience and Perspective, Eldoret: Moi University
Press, pp. 1–3.
Okioga, C. K., Onsongo, E. N., & Nyaboga, Y. B. (2012). Quality Issues in the Expansion of
University E ducation in Kenya, the Human Resource Challenges and
Opportunities. Chinese Business Review, 11(6).
Okoth (2016, March, 19). “Only money and jobs will fix the mess in our university education”
Local Daily Nation pg 12&13.
Olum, Y. (2004). Modern Management Theories and Practices. Being a paper presented
at the 15th East African Central Banking Course, held on 12th July.

253
Omutoko, O.L. (2009). Re-Thinking The Management Of Higher Education Institutions:
Transformational Leadership: A Conference Paper Presented at The 1st KIM Conference
On Management: A Journal Of the KIM School Of Management. Vol.(1) pp.214-221.
ISSN 2074 – 4730. ISSN 2070-4730
Osseo-Asare, A. E., & Longbottom, D. (2002). The need for education and training in the use
of the EFQM model for quality management in UK higher education institutions.
Quality Assurance in Education, 10(1), 26–36.
Osseo-Asare, A. E., Longbottom, D., & Murphy, W. D. (2005). Leadership best practices for
sustaining quality in UK higher education from the perspective of the EFQM Excellence
Model. Quality Assurance in Education, 13(2), 148-170.
Osseo‐Asare, A. E., Longbottom,D. Chourides, P. (2007) "Managerial leadership for
total quality improvement in UK higher education", The TQM, Magazine,
Vol.19 Issue: 6, pp.541-560, https://doi.org/10.1108/09544780710828403
O’Rourke, N.,and Hatcher, L. (2013). A Step-by-Step Approach to Using the SAS System for
Factor Analysis and Structural Equation Modeling. Second edition. Cary, NC: SAS
Institute Inc.
O'Reilly, C. A., Caldwell, D. F., Chatman, J. A., Lapiz, M., & Self, W. (2010).How leadership
matters: The effects of leaders' alignment on strategy implementation. The Leadership
Quarterly, 21(1),104- 113.
Parr, C. (2015, June 10). World University Rankings 2014-2015 results: Latest results suggest
that underfunded Western institutions outside the elite are struggling.
https://www.timeshighereducation.co.uk/news/world-University-rankings-2014-
2015-results/2016100.article accessed 26/8/2015
Peersman, G. (2014).Overview: Data Collection and Analysis Methods in Impact
Evaluation, Methodological Briefs: Impact Evaluation 10, UNICEF Office of
Research, Florence.
Perkmann, M., & Salter, A. (2012). How to create productive partnerships with universities. MIT
Sloan Management Review, 53(4), 79-88.
People, L. (2008). Resource Management. Edmonton, Alberta: Society of Professional.
Pierce, J. N. & Newstrom, J.W. (2008). Leaders and the Leadership Process: Readings, Self-
assessments and applications 5th ed., Boston, MA:McGraw-Hill.

254
Pillay, P. (2011). Higher education and economic development. Centre for Higher Education
Transformation (CHET), Wynberg
http://chet. org.za/files/uploads/reports/Pillay, 202010.
Porter, M. (1986). Competitive strategy. Havard Business School Press.
Porter, M., E. (September 18, 2006) "Colleges and Universities and Regional Economic
Development: A Strategic Perspective." Aspen Symposium, Forum for the Future of
Higher Education, Boston, MA, September 18, 2006.
http://net.educause.edu/ir/library/pdf/ff0710s.pdf accessed 20/11/2013
Prasanna, T. (2012). International Journal of Management (IJM). Journal Impact Factor, 3(3),
216-227.
Rauhvargers, A (2013). Global University Rankings and their Impact. EUA: European
University Association Rankings 2013. http://www.eua.be/Libraries/publications-
homepage-list/EUA_Global_University_Rankings_and_Their_Impact_
Report_II.pdf?sfvrsn=2 Accessed 22/11/2016
Razali, M, N.,& Wah, Y, B.( 2011). Power Comparisons of Shapiro-Wilk, Kolmogorov
Smirnov, Lilliefors and Anderson-Darling Tests. Journal of Statistical Modeling and
Analytics, Vol.2 No.1, 21-33, 2011.
Republic of Kenya (RoK) (2007). Kenya Vision 2030. A globally competitive and
Prosperous Kenya. Government Printers. Nairobi.
Republic of Kenya (RoK) (2014). University Regulations (2014). Government Printers.
Nairobi.
Reuters, T. ( 2010). Finding Meaningful Performance Measurement for Higher Education.
http://researchanalytics.thomsonreuters.com/m/pdfs/higher-ed-exec accessed 21st June
2014.
Rigby, D.K. (2015). Management Tool 2015; An executive guide. Brain & Company,Inc
Boston)
Rudestine, N., L. (2001). Pointing our Thoughts; Reflections on Harvard and Higher Education
991-2001, President and Fellows of Harvard College.
http://media.www.harvard.edu/content/Neil_L_Rudenstine_Pointing_Our_Thoug
hts.pdf [Accessed 18/3/2016]
Robbins, S.P. (2005). Organizational behavior. Upper Saddle River, NJ: Pearson Prentice hall

255
Salmi, J. (2007). Autonomy from the state vs responsiveness to markets. Higher Education
Policy, 20(3), 223-242.
Salmi, J. (2009). The challenge of establishing world-class universities. World Bank
Publications.
Salmi, J. (2011). The road to academic excellence: Lessons of experience. The road to academic
excellence: The making of world-class research universities, 323-347.
Saunders, M.,& Lewis, P.(2012). Research Methods for Business Studies 6th edition. Pitman
Sarros, C. J. , Cooper B. K. & Santora, J. C. (2008), Building a Climate for Innovation through
Transformational Leadership and Organizational Culture. Journal of Leadership &
Organizational Studies Volume 15 Number 2 November 2008 145-158.
Scott, G. (2003). Effective Change Management in Higher Education, EDUCAUSE Review, vol.
38, no. 6 (November/December 2003): 64–80.
http://net.educause.edu/ir/library/pdf/erm0363.pdf accessed 05/12/2013
Sebastian, E. and Khan, A. (2013). Critical success factors for transnational partnerships;
University World news, 25 October 2013 Issue No:293.
http://www.universityworldnews.com/article.php?[ Accessed 18/3/2016]
Sekeran, U. (2003). Reserch methods for business. Singapore: wiley and sons.
Sevier, R. A. (2007). Advancing the brand. University Business 10(2), 46-51.
Sheffield Hallam University. (2003). EFQM Excellence Model ® Higher Education Version
2003. Higher Education, 2003, 1–44.
Smith, D.,N.(2016, June 21). “MIT Campaign for a Better World”.
https://www.technologyreview.com/s/601554/mit-campaign-for-a-better-world/ Accessed
June 21, 2016
Sifuna, D., N. (2013). Leadership in Kenyan public universities and the challenges of
autonomy and academic freedom: An overview of trends since
independence. JHEA/RESA, 10(1), 121-137.
Sifuna, D. N. (2010). Some reflections on the expansion and quality of higher education in
public universities in Kenya. Research in Post‐Compulsory Education, 15(4), 415-425.
Spendlove, M. (2007). Competencies for effective leadership in higher education. International
Journal of Educational Management, 21(5), 407-417.

256
Spillane, J. P. (2012). Distributed leadership (Vol. 4). John Wiley & Sons
Stanford University (2015). Annual Report 2014.
https://annualreport.stanford.edu/2014/ [ Accessed 5/11/2015]
Stanford University (2015). Stanford Facts_2015
http://facts.stanford.edu/pdf/StanfordFacts_2015.pdf [Accessed 5/11/2015]
Steed, C. (2003). EFQM Excellence Model Higher education Version”, Sheffield Hallam
University, with endorsement from European foundation for quality management
Stevens, J. (1986). Applied Multivariate statistics for the social sciences. Hillsdale, NJ:
Lawrence Erlbaum Associates.
Swanson, R. A., & Holton, E. F. (2005). Research in organizations: Foundations and methods in
inquiry. Berrett-Koehler Publishers.
Stoner James A. F., Freeman R. Edward, and Gilbert, Jr. Daniel R. (2003). Management (New
Delhi: Pr)
Jalaliyoon, N., & Taherdoost, H. ( 2012). Performance Evaluation of Higher education; a
necessity. Procedia-Social and Behavioral Science, 46, 5682-5686.
Tabachnick, B. & Fidell, L. (2012) Using multivariate Analysis. Boston, Pearson Education Inc.
Tavakol, M., & Dennick, R. (2011). Making sense of Cronbach's alpha. International journal of
medical education, 2, 53.Publishing.
Taylor, V.L. (2014). Japanese Universities reach for global status; East Asia Forum,
Economics, Politics and Public Policy in East Asia and Pacific.
http://www.eastasiaforum.org/2014/12/30/japanese-universities-reach-for-global-
status/ [Accessed 23/1/2016]
Thawani, S. (2013). The EFQM 2013 Model Changes; Implications for Organizatios
http://www.exinlibrary.com/Player/eKnowledge/efqm_2013_model_changes_implicati
ons_for_orgzn_1.pdf [Accessed 25/5/2016]
Thompson, N. (2013, September, 11). “Stanford and its Startups” The New Yorker.
https://www.newyorker.com/business/currency/stanford-and-its-start-ups [Accessed
3/5/2016]
The University of Melbourne Voice, Volume 10 Number 9 September 8 – October 13,
(2014). http://voice.unimelb.edu.au/sites/voice.unimelb.edu.au/files/Voice0914.pdf
[Accessed 31/1/2016]
257
Tracy, M. (2016, March 4). 6 ways to encourage autonomy with your employees
https://www.entrepreneur.com/article/254030 [accessed 6/1/2019]
Tumuti, D. W., Wanderi, P. M., & Lang'at-Thoruwa, C. (2013). Benefits of university-industry
partnerships: The case of Kenyatta University and Equity Bank. International Journal of
Business and Social Science, 4(7).
Turner, J. R., & Müller, R. (2010). The project manager's leadership style as a success
factor on projects: A literature review. International Journal of Project
Management 28 (2010) 437–448.
UCT Strategic Plan 2010-2014
http://www.uct.ac.za/downloads/uct.ac.za/about/goals/uct_strategic%20goals.pdf
[Accessed 28/11/2015]
Ukpaka, E. (2009). The Role of Leadership in Business Success.
http://ezinearticles.com/?The-Role-of-Leadership-in-Business- access&id=2459102
[Accessed 26/6/2014]
University of Cambridge. (2016). In Encyclopædia Britannica. Retrieved from
http://www.britan nica.com/topic/University-of-Cambridge [Accessed 30/10/2015]
University of Cape Town (2015). About the University
http://www.uct.ac.za/about/intro/statistics/ [Accessed 26/3/2016]
University of Cape Town (2016)
http://www.uct.ac.za/dad/alumni/offices/uctfund/ [Accessed 26/3/2016]
University of Cape Town (2016). Annual reports 2014
https://www.news.uct.ac.za/publications/uctannualreports/ [Accessed 26/3/2016]
University of Melbourne (2016). “About us”
https://www.unimelb.edu.au/ [Accessed 19/9/2016]
National University of Singapore (2015). National university of Singapore. World University
ranking. https://www.timeshighereducation.com/world-University-rankings/national-
University-of-singapore? ranking-dataset=133819 [Accessed 30/1/2015]
University of Oxford (2016), Annual review (2014-2015)
http://www.ox.ac.uk/about/organisation/annual-review [Accessed 19/9/2016]
University of Oxford (2016), university of Oxford Strategic Plan (2013-2018)
http://www.ox.ac.uk/sites/files/oxford/field/field_document/Strategic%20Plan%202013-
18.pdf [Accessed 19/9/2016].
258
University of Tokyo (2016). Research Cooperation with industries.
http://www.u-tokyo.ac.jp/en/research/research_cooperation.html [Accessed 23/1/2016]
Uygur, A., &Sümerli, S. (2013). EFQM Excellence Model. International Review of Management
and Business Research, 2(4), 980.
Verbeek, M. (2012). A guide to modern econometrics, (4th ed.). Chichester: John Wiley & Sons.
Vice Chancellor Annual Report (2014). University of Cape Town
http://www.uct.ac.za/downloads/uct.ac.za/about/management/vcreport2014.pdf
[Access 30/10/2015]
Vogel, C. (2012). “How MIT Became the Most Important University in the World”.
Boston Magazine. http://www.bostonmagazine.com/2012/10/mit-important-
University-world-harvard/ [Accessed 19/9/2016]
Vorria, E. P., and George A. Bohoris. "Criteria requirements of the European business
excellence model: a suggested approach." The TQM Journal 21.2 (2009): 116-126.
Wainaina, L., Iravo, M., & Waititu, A. (2014). Effect of employee participation in decision
making on the organizational commitment amongst academic staff in the private and
public universities in Kenya. International Journal of Advanced Research in
Management and Social Sciences, 3(12), 131-142
Wang, Q., Cheng, Y., & Liu, N. C. (2013). Building World-Class Universities. In Building
World-Class Universities (pp. 1-10). SensePublishers.
Wanni, N., Hinz, S. and Day, R. (2010). Good Practices in Educational Partnerships Guide –
UK-Africa Higher & Further Education Partnerships. London: The Africa Unit.
Wanzala, O. (2015, September 16). “University of Nairobi only Kenyan institution in global top
900 varsities ranking”. The Daily Nation Newspaper.
Wanzala, O. (2016, November 1). “Government Order closure of 11 campuses”. The Daily
Nation Newspaper.
Wanzala, O. (2017, August 31). “3 universities risk closure warns Chaha”. The Daily Nation
Newspaper.
Webometrics Ranking, (January, 2016). Http://www.webometrics.info
Wernerfelt, B. (1984). A resource‐based view of the firm. Strategic management journal,
5(2), 171-180.
Warrilow. S (2009). Transformational Leadership Theory; The Key Components in Leading

259
changeand managing change.
http://EzineArticles.com/expert/Stephen_Warrilow/361805[Accessed19/9/2016]
Willetts (2014) Contribution of UK universities to national and local economic growth
https://www.gov.uk/government/speeches/contribution-of-uk-universities-to national-
and-local-economic-growth [Accessed 12/12/2015]
Wisniewski, M. A. (1999). Leadership competencies in continuing higher education:
Implications for leadership education. The Journal of Continuing Higher Education,
47(1), 14-23.
Witt, L. A., Burke, L. A., Barrick, M. R., & Mount, M. K. (2002). The interactive effects of
conscientiousness and agreeableness on job performance. Journal of Applied
Psychology, 87(1), 164.
Wolf, E. R. (2010). Europe and the People without History. Univ of California Press.
World University Rankings 2015-2016 - Times Higher Education
https://www.timeshighereducation.com/world-university- rankings/2016/world-
ranking
Yamane, T. (1967). Statistics: An Introductory Analysis, 2nd ed, New York: Harper and Row.
Yizengaw, T. (2008). Challenges of higher education in Africa and lessons of experience for the
Africa-US higher education collaboration initiative. A Synthesis Report, based on
Consultations between March–April 2008.
Young, N. (2009). Understanding the research process and methods. An introduction to research
methods. Las Vegas: Act press.
Young, M., & Dulewicz, V. (2006). Leadership styles, change context and leader performance
in the Royal Navy. Journal of Change Management, 6(4), 383–396.
Yukl, G. (2010). Leadership in Organizations (7th edition).Upper Saddle River, NJ: Pearson
prentice hall.
Zeleza, P. T. (2015). African Higher Education Summit: Revitalizing Higher Education for
Africa’s Future. African Higher Education Summit Framing Paper, 10-12.
http://serve.mg.co.za/content/documents/2015/03/06/african-higher-education-
summit.pdf [Accessed19/9/2016]
Zikmund, W. G.(2003). Business research methods. Thomson South-Western, USA

260
APPENDICES Appendix I: Study Questionnaire
I am Paul Mbote a Ph.D student at Dedan Kimathi University of Technology (DeKUT).
This questionnaire has been developed to facilitate a study for establishing drivers of
performance excellence in public and private Higher Education Institution (HEIs) in Kenya.
As one of the key player in this sector, kindly respond to the following questions as
honestly as possible. Your responses will be treated with utmost confidentiality and will only
be used for the academic purpose of this study.
PART I: Personal and Contextual
Data
Please answer the following questions by a ticking alongside your considered appropriate
answer.
1) How many years have you been working in the University setting ?
[ ] less than 5 years [ ] 6-10 years [ ] 11-15 years [ ] and above15 years.
2) What is your highest level of education?
[ ] Bachelors [ ] Master degree [ ] PhD [ ] Post-Doctorate
3) How long have you been working in your current institution?
[ ] less than 5 years [ ] 6-10 years [ ] 11-15 years [ ]16-20 years
[ ] and above 20 years.
4) What is your current position in the University as per the classification
below? [ ] Deans [ ] Director [ ] CoD [ ] HoD ( Registrar, Finance
Officer, HR Officer, QA, Librarian ). Other
specify____________________
5) How long have you served in your current position?
[ ] Less than 5 years [ ] 6 to10 years [ ] 10 to15 years [ ] over 15 years
6) The type of the University? [ ] Public [ ] Private

261
PART II:
A) LEADERSHIP
Please indicate the level of agreement/disagreement with the following statements as they relate to
your institution in areas of Leadership using a five Likert scale ; 1= Strongly Agree (SA), 2= Agree
(A), 3 = Neutral(N), 4= Disagree(D), 5= Strongly Disagree(SD)
Leadership dimensions 1
SA
2
A
3
N
4
D
5
SD
1 The leaders provide a clear leadership direction through
setting and developing the University vision, mission and
values.
2 The appointment of the underlisted to management position
take into account their leadershipexperience
i) VC and DVCs
ii) Deans and Directors
iii) CoDs and HoDs
3 The leaders at all levels acts as role model for University
values
4 Leaders continuously promote a culture of performance
excellence.
5 Leaders internally communicate effectively on matter
pertaining to students.
6 Leaders internally communicate effectively on matter
pertaining to staff.
7 Delegation of duties is embraced across the University
8 Supervisors delegate duties to the people they supervise.
9 Supervisors empower others to carry out the mandate
delegated
to them.
10 Leaders provide resources to execute set targets.
11 The University abides to the CUE Guidelines in curriculum
development
12 University Council regularly monitor the University
performance
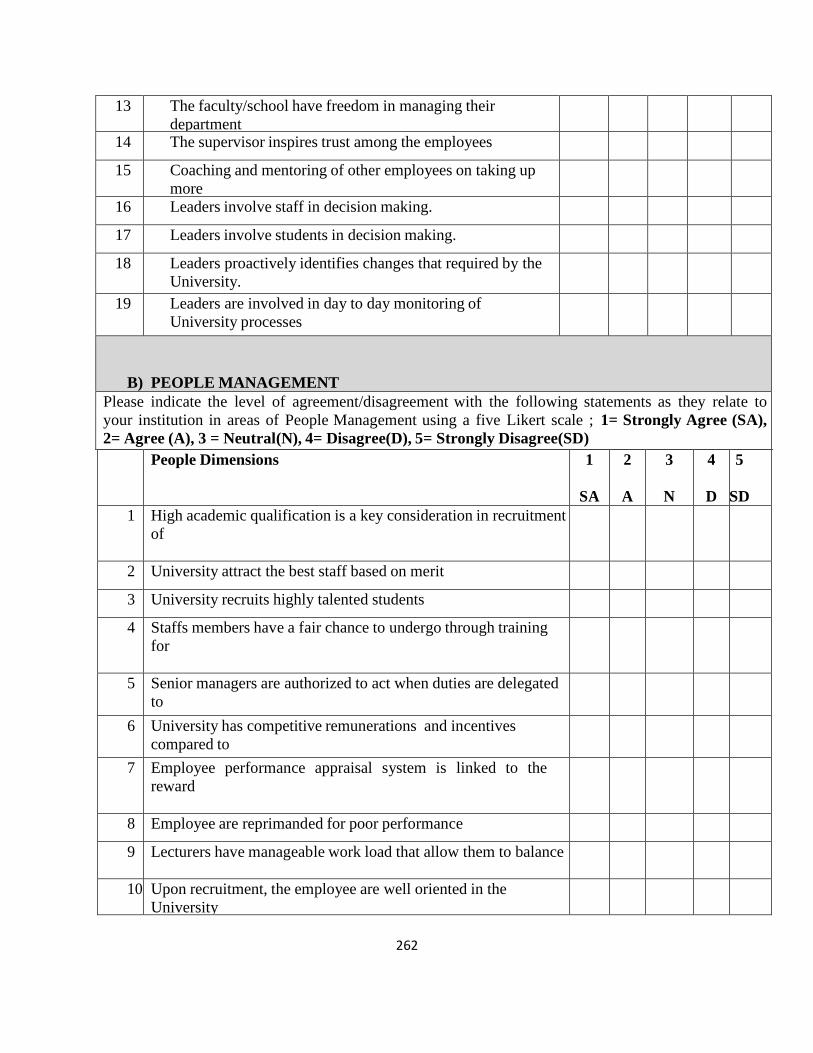
262
13 The faculty/school have freedom in managing their
department
budget.
14 The supervisor inspires trust among the employees
15 Coaching and mentoring of other employees on taking up
more
responsibilities is encouraged within the University.
16 Leaders involve staff in decision making.
17 Leaders involve students in decision making.
18 Leaders proactively identifies changes that required by the
University.
19 Leaders are involved in day to day monitoring of
University processes
B) PEOPLE MANAGEMENT
Please indicate the level of agreement/disagreement with the following statements as they relate to
your institution in areas of People Management using a five Likert scale ; 1= Strongly Agree (SA),
2= Agree (A), 3 = Neutral(N), 4= Disagree(D), 5= Strongly Disagree(SD)
People Dimensions 1
SA
2
A
3
N
4
D
5
SD
1 High academic qualification is a key consideration in recruitment
of
lecturers.
2 University attract the best staff based on merit
3 University recruits highly talented students
4 Staffs members have a fair chance to undergo through training
for
capacity development.
5 Senior managers are authorized to act when duties are delegated
to
them.
6 University has competitive remunerations and incentives
compared to
other universities
7 Employee performance appraisal system is linked to the
reward
system.
8 Employee are reprimanded for poor performance
9 Lecturers have manageable work load that allow them to balance
between research and teaching.
10 Upon recruitment, the employee are well oriented in the
University
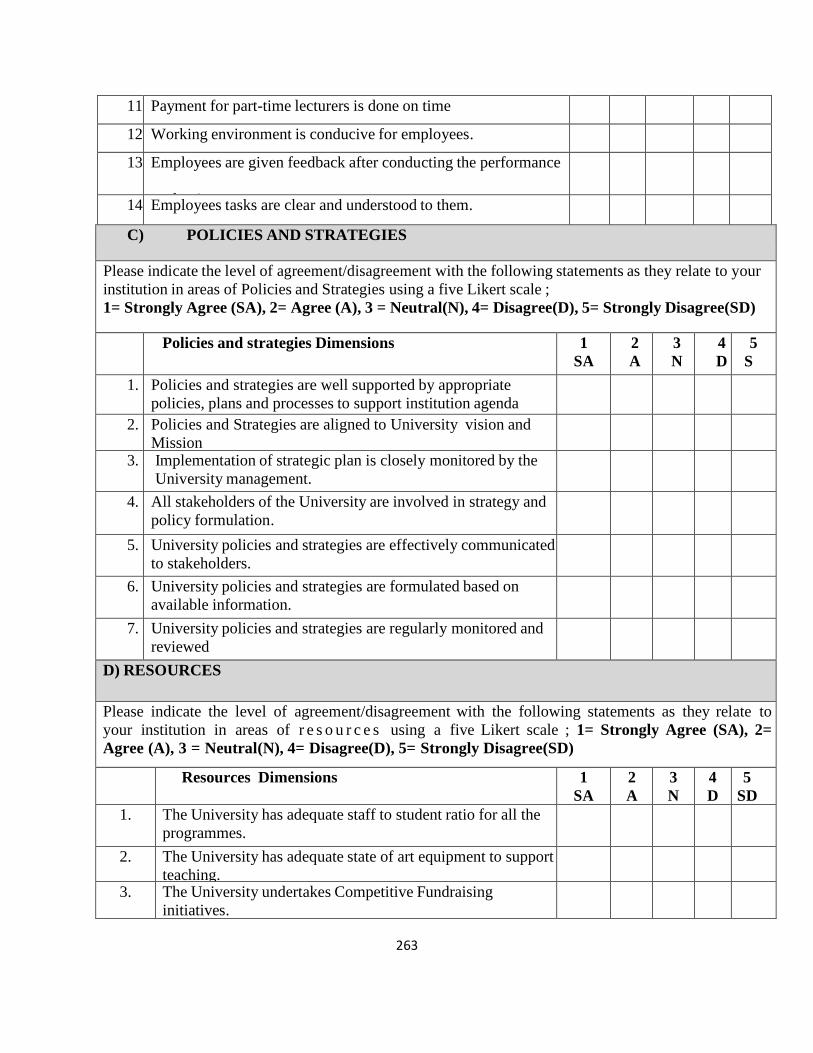
263
11 Payment for part-time lecturers is done on time
12 Working environment is conducive for employees.
13 Employees are given feedback after conducting the performance
evaluation.
14 Employees tasks are clear and understood to them.
C) POLICIES AND STRATEGIES
Please indicate the level of agreement/disagreement with the following statements as they relate to your
institution in areas of Policies and Strategies using a five Likert scale ;
1= Strongly Agree (SA), 2= Agree (A), 3 = Neutral(N), 4= Disagree(D), 5= Strongly Disagree(SD)
Policies and strategies Dimensions 1
SA
2
A
3
N
4
D
5
S
D 1. Policies and strategies are well supported by appropriate
policies, plans and processes to support institution agenda
2. Policies and Strategies are aligned to University vision and
Mission
3. Implementation of strategic plan is closely monitored by the
University management.
4. All stakeholders of the University are involved in strategy and
policy formulation.
5. University policies and strategies are effectively communicated
to stakeholders.
6. University policies and strategies are formulated based on
available information.
7. University policies and strategies are regularly monitored and
reviewed
D) RESOURCES
Please indicate the level of agreement/disagreement with the following statements as they relate to
your institution in areas of r e s o u r c e s using a five Likert scale ; 1= Strongly Agree (SA), 2=
Agree (A), 3 = Neutral(N), 4= Disagree(D), 5= Strongly Disagree(SD)
Resources Dimensions 1
SA
2
A
3
N
4
D
5
SD
1. The University has adequate staff to student ratio for all the
programmes.
2. The University has adequate state of art equipment to support
teaching.
3. The University undertakes Competitive Fundraising
initiatives.
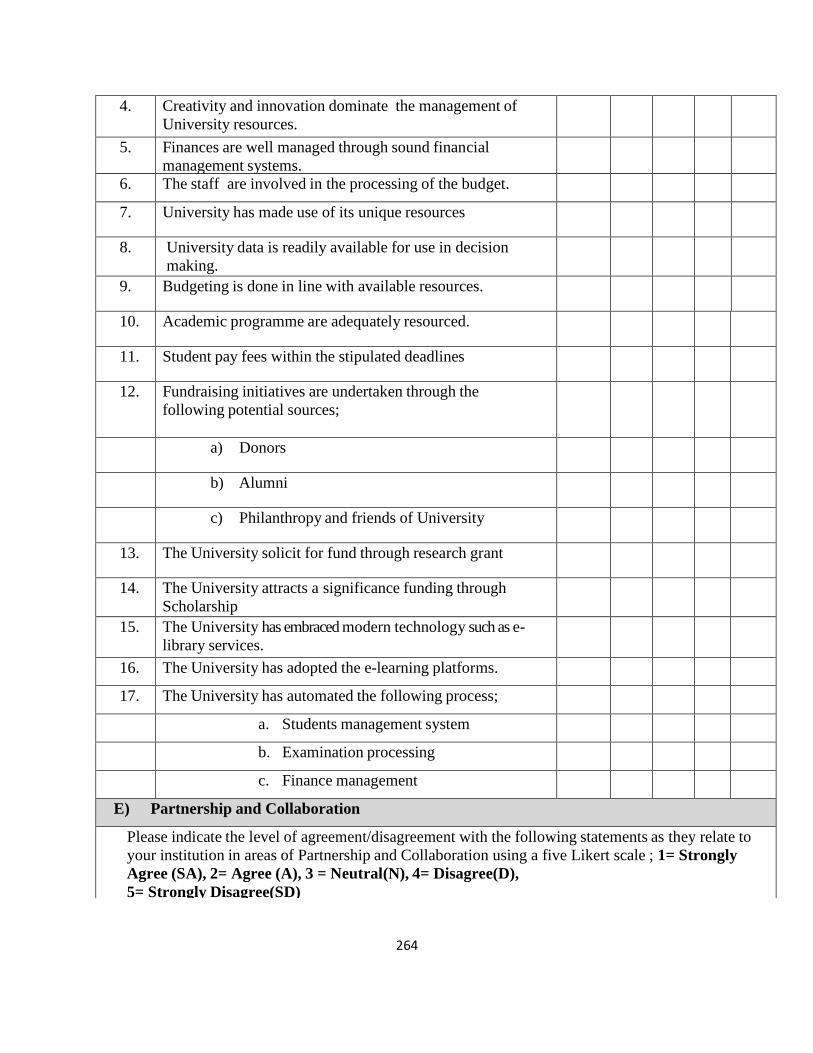
264
4. Creativity and innovation dominate the management of
University resources.
5. Finances are well managed through sound financial
management systems.
6. The staff are involved in the processing of the budget.
7. University has made use of its unique resources
8. University data is readily available for use in decision
making.
9. Budgeting is done in line with available resources.
10. Academic programme are adequately resourced.
11. Student pay fees within the stipulated deadlines
12. Fundraising initiatives are undertaken through the
following potential sources;
a) Donors
b) Alumni
c) Philanthropy and friends of University
13. The University solicit for fund through research grant
14. The University attracts a significance funding through
Scholarship
15. The University has embraced modern technology such as e-
library services.
16. The University has adopted the e-learning platforms.
17. The University has automated the following process;
a. Students management system
b. Examination processing
c. Finance management
E) Partnership and Collaboration
Please indicate the level of agreement/disagreement with the following statements as they relate to
your institution in areas of Partnership and Collaboration using a five Likert scale ; 1= Strongly
Agree (SA), 2= Agree (A), 3 = Neutral(N), 4= Disagree(D),
5= Strongly Disagree(SD)

265
Partnership and Collaboration 1
SA
2
A
3
N
4
D
5
SD
1 The University has established active local collaboration
with;
a) Other Universities
b) Industries
c) Communities
2 The University has established active international
partnership and collaboration with;
a) Other Universities
b) Industries
3 The University focus more on partnership and collaboration
with other entities other than competing with them.
4 Partnership and collaboration has contributed significantly to
the branding of the University.
5 The University has made remarkable contribution to the
society through collaboration and partnership initiatives.
6 Teaching and research is enhanced through collaboration and
partnerships
7 The students are easily attached in relevant industries for their
practical experience.
F) PROCESSES, PRODUCT AND SERVICES
Please indicate the level of agreement/disagreement with the following statements as they relate to
your institution in areas of Processes, Product And Services using a five Likert scale ; 1= Strongly
Agree (SA), 2= Agree (A), 3 = Neutral(N), 4= Disagree(D), 5= Strongly Disagree(SD)
Dimension, Processes, Product and Services 1
SA
2
A
3
N
4
D
5
SD
1 University processes are effective in delivering University’s
policies and strategies
2 Processes are regularly reviewed to enhance effectiveness.
3 The systems standards are complied with in the
University operations.
4 Curricula are regularly reviewed to align them to the
emerging trends.
5 Branding and marketing of the University products is
given a significance attention.

266
6 Programmes offered by the University are unique. and
they match the market needs.
7 Programmes offered by the University match the
market needs.
8 Programmes are developed and reviewed in line with
given CUE guidelines
9 Students are provided with academic mentors/advisors
10 The student are well supported with adequate internet
facilities
11
The learning environment is conducive to students.
12 The University facilitates adequate extracurricular
activities to the students.
13 University information is available through a
centralized Information desk.
14 Complaint and compliment are promptly acted upon
and feedback given.
G) INTERNATIONALIZATION
Please indicate the level of agreement/disagreement with the following statements as they relate to your
institution in areas of Internationalization using a five Likert scale ; 1= Strongly Agree (SA), 2= Agree
(A), 3 = Neutral(N), 4= Disagree(D), 5= Strongly Disagree(SD)
Internationalization Dimensions
1
SA
2
A
3
N
4
D
5
SD
1 Internationalization is a key University agenda.
2 University has an active students exchange programme.
3 University has an active staff exchange programmes
4 University undertakes recruitment of staff and researchers
Internationally.
5 University programmes are internationally accredited
6 The University has established an active international joint
research activities
7 The University has development joint/ duo degree
programmes with other Universities across the region.
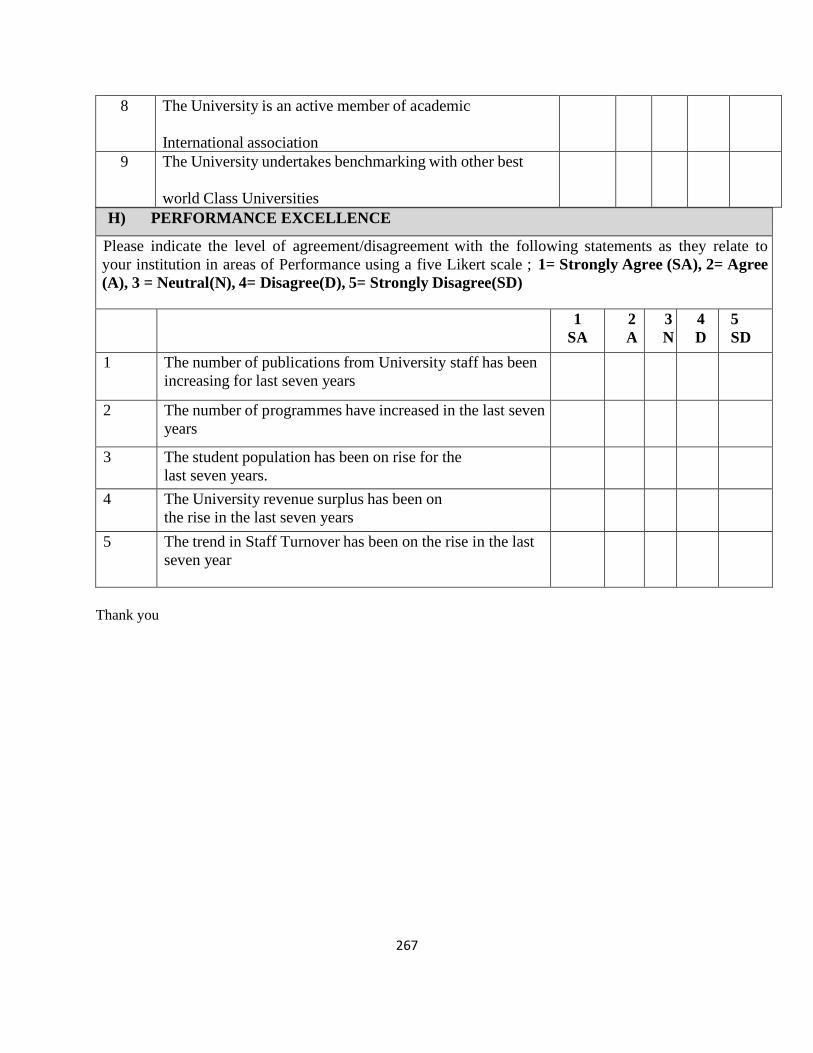
267
8 The University is an active member of academic
International association
9 The University undertakes benchmarking with other best
world Class Universities
H) PERFORMANCE EXCELLENCE
Please indicate the level of agreement/disagreement with the following statements as they relate to
your institution in areas of Performance using a five Likert scale ; 1= Strongly Agree (SA), 2= Agree
(A), 3 = Neutral(N), 4= Disagree(D), 5= Strongly Disagree(SD)
1
SA
2
A
3
N
4
D
5
SD
1 The number of publications from University staff has been
increasing for last seven years
2 The number of programmes have increased in the last seven
years
3 The student population has been on rise for the
last seven years.
4 The University revenue surplus has been on
the rise in the last seven years
5 The trend in Staff Turnover has been on the rise in the last
seven year
Thank you

268
Appendix II: Accredited Universities
Public Chartered Universities
Year of
Establishment
Year of
Awar
dd of
Chart
er
Classification based on
year of operation
1. University of Nairobi (UoN) 1970 2013 >20
2. Moi University (MU)* 1984 2013 >20
3. Kenyatta University (KU)* 1985 2013 >20
4. Egerton University (EU) 1987 2013 >20
5. Jomo Kenyatta University of Agriculture and
Technology (JKUAT)*
(JKUAT)
1994 2013 >20
6. Maseno University (Maseno) 2001 2013 <20
7. Dedan Kimathi University of Technology(DeKUT) 2007 2012 <20
8. Chuka University*
2007 2013 <20
9. Technical University of Kenya 2007 2013 <20
10. Technical University of Mombasa 2007 2013 <20
11. Pwani University 2007 2013 <20
12. Kisii University 2007 2013 <20
13. Masinde Muliro University of Science and
Technology
(MMUST)
2007 2013 <20
14. Maasai Mara University 2008 2013 <20
15. South Eastern Kenya University 2008 2013 <20
16. Meru University of Science and Technology 2008 2013 <20
17. Multimedia University of Kenya 2008 2013 <20
18. Jaramogi Oginga Odinga University of Science and
Technology
2009 2013 <20
19. Laikipia University* 2009 2013 <20
20. University of Kabianga 2009 2013 <20
21. University of Eldoret 2010 2013 <20
22. Karatina University* 2010 2013 <20
23. Kibabii University 2011 2015 <20
Private Chartered Universities
24. University of Eastern Africa, Baraton 1989 1991 >20
25. Catholic University of Eastern Africa (CUEA) 1989 1992 >20
26. Daystar University* 1989 1994 >20
27. Scott Christian University 1989 1997 >20
28. United States International University* 1989 1999 >20
29. St. Paul’s University* 1989 2007 >20
30. Pan Africa Christian University 1989 2008 >20
31. Africa International University 1989 2011 >20
32. Kenya Highlands Evangelical University 1989 2011 >20
33. Africa Nazarene University 1993 2002 >20
34. Kenya Methodist University* 1997 2006 <20
35. Strathmore University 2002 2008 <20
36. Kabarak University 2002 2008 <20
37. Great Lakes University of Kisumu 2006 2012 <20
38. KCA University 2007 2013 <20
39. Mount Kenya University* 2008 2011 <20
40. Adventist University of Africa 2008 2013 <20
Source: http://www.cue.or.ke/ Accesssed 10/6/2016
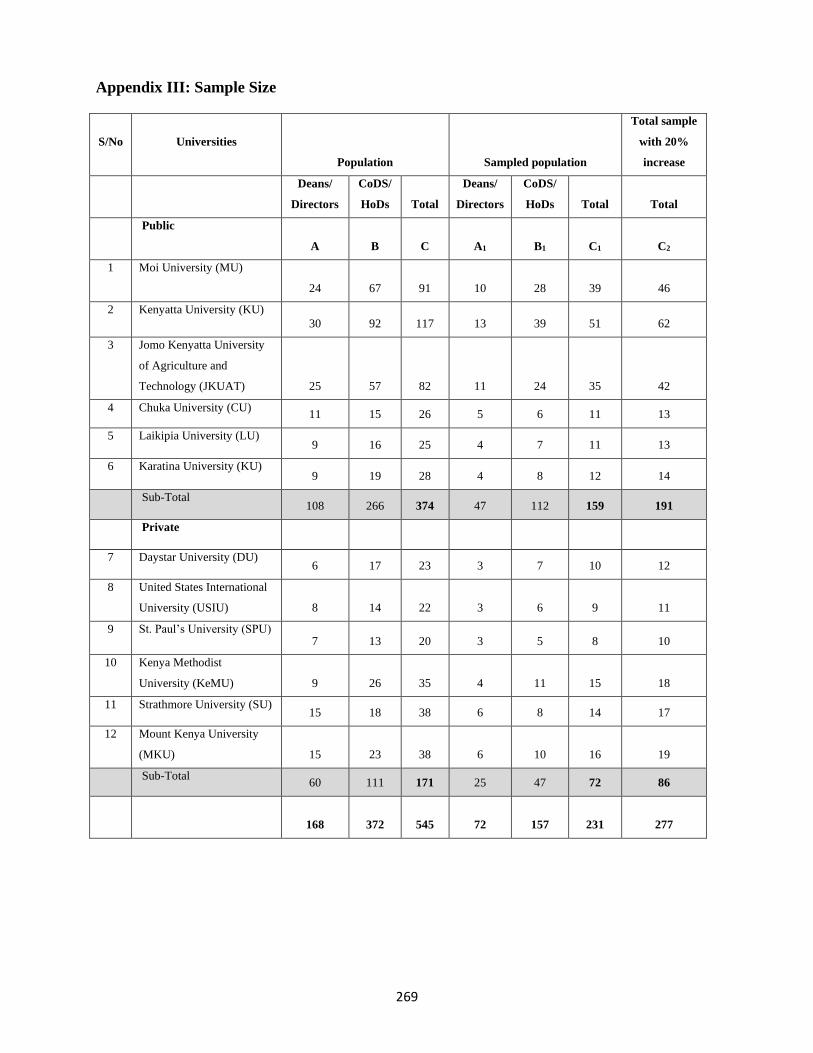
269
Appendix III: Sample Size
S/No
Universities
Population Sampled population
Total sample
with 20%
increase
Deans/
Directors
CoDS/
HoDs Total
Deans/
Directors
CoDS/
HoDs Total
Total
Public
A B C A1 B1 C1
C2
1 Moi University (MU)
24 67 91 10 28 39
46
2 Kenyatta University (KU)
30 92 117 13 39 51 62
3 Jomo Kenyatta University
of Agriculture and
Technology (JKUAT) 25 57 82 11 24 35 42
4 Chuka University (CU) 11 15 26 5 6 11 13
5 Laikipia University (LU) 9 16 25 4 7 11 13
6 Karatina University (KU) 9 19 28 4 8 12 14
Sub-Total
108 266 374 47 112 159 191
Private
7 Daystar University (DU) 6 17 23 3 7 10 12
8 United States International
University (USIU) 8 14 22 3 6 9 11
9 St. Paul’s University (SPU) 7 13 20 3 5 8 10
10 Kenya Methodist
University (KeMU) 9 26 35 4 11 15 18
11 Strathmore University (SU) 15 18 38 6 8 14 17
12 Mount Kenya University
(MKU) 15 23 38 6 10 16 19
Sub-Total 60 111 171 25 47 72 86
168 372 545 72 157 231
277

270
Appendix IV: Descriptive Analysis for Leadership
SA A N D SD Summary
Statistics
% % % % % Mean Std
L1: Leaders provides clear direction through setting and
development of the Vision, Mission and Values.
53.0 42.6 3.0 0.9 0.4 1.53 .65
L2: Leadership experience considered when appointing
VC and DVC
49.6 39.1 8.3 2.2 0.9 1.66 .79
L3: Leadership experience considered when appointing
Deans and Directors
37.4 47.8 9.1 4.3 1.3 1.84 .86
L4: Leadership experience considered when appointing
CoDs and HoDs
36.1 44.8 11.3 7.0 0.9 1.92 .91
L5: Leaders acts as role model 23.0 47.8 17.4 10.4 1.3 2.19 .95
L6: Leaders promote culture of excellence 32.6 47.8 15.7 3.5 0.4 1.91 .81
L7: Leaders communicates effectively to students 27.0 54.8 12.6 5.2 0.4 1.97 .80
L8: Leaders communicates effectively to staffs 20.0 53.0 18.3 7.8 0.9 2.17 .87
L9: Delegation of duties is embraced 17.0 58.7 18.3 5.7 0.4 2.14 .78
L10: Supervisor delegated to subordinate 19.6 62.2 13.5 4.3 0.4 2.04 .74
L11: Supervisor empower subordinate 14.8 50.4 24.3 10.4 0.0 2.30 .85
L12: Leaders provide resources to execute set targets. 17.8 47.8 23.0 8.3 3.0 2.31 .96
L13: University abides to the CUE Guidelines 39.1 50.9 7.0 2.6 0.4 1.74 .74
L14: Council monitors university performance 41.3 44.8 10.9 2.2 0.9 1.77 .80
L15: Faculties have freedom to manage departmental
budget
23.0 40.4 18.3 13.0 5.2 2.37 1.13
L16: Supervisors inspire trust among employees 15.2 55.7 22.6 4.8 1.7 2.22 .82
L17: Coaching and mentoring of subordinate 11.7 52.2 25.2 9.1 1.7 2.37 .87
L18: Leaders involve staff in decision making. 13.5 46.1 24.3 10.0 6.1 2.49 1.04
L19: Leaders involves students in decision making. 9.1 52.2 25.2 10.9 2.6 2.46 .90
L20: Leaders proactively identify change 17.8 55.2 19.6 6.1 1.3 2.18 .84
L21: Leaders are involved in day to day monitoring of
University processes
23.0 53.9 18.7 3.5 0.9 2.05 .80

271
Appendix V: Descriptive Analysis on People Management
SA A N D SD Summary
Statistics
% % % % % Mean Std
PM1: High academic qualification considered
when recruiting lecturers.
65.7 30.0 3.0 1.3 0.0 1.40 .62
PM2: Attraction of best staff based on merit 43.9 43.9 9.6 1.7 0.9 1.72 .78
PM3: Opportunities for staff to undergo
capacity development training
18.7 47.8 21.7 8.7 2.6 2.28 .96
PM4: Senior managers are authorized to act
when duties are delegated
24.3 60.0 12.2 2.6 0.9 1.96 .74
PM5: The university reward system have
competitive remunerations and incentives
compared to other universities
12.6 39.1 31.3 13.0 3.9 2.57 1.00
PM6: Employee performance appraisal system
is linked to the reward system.
4.8 37.0 33.0 15.2 10.0 2.89 1.05
PM7: Employees are reprimanded for poor
performance
9.1 43.0 35.7 9.6 2.6 2.53 .88
PM8: Lecturers have manageable work load
that allow them to balance between research
and teaching.
10.0 43.5 23.5 16.1 7.0 2.67 1.08
PM9: Upon recruitment, the employee are well
oriented in the university
16.1 37.0 23.5 17.0 6.1 2.60 1.13
PM10: Payment for part-time lecturers is
promptly done
16.1 29.6 17.0 15.7 21.7 2.97 1.40
PM11: The working environment is conducive
for all the employees.
16.5 50.4 17.0 11.3 4.8 2.37 1.04
PM12: Employees are given feedback after
conducting the performance evaluation.
12.6 47.8 21.3 13.0 5.2 2.50 1.04
PM13: The employees tasks are very clear and
understood to them.
13.9 60.4 17.0 7.4 1.3 2.22 .82

272
Appendix VI: Descriptive Analysis for Resources
SA A N D SD Summary
% % % % % Mean Std
R1: University has adequate staff to student ratio 13.0 30.4 20.9 26.5 9.1 2.88 1.20
R2: University has adequate state of art equipment 16.1 38.7 13.5 24.3 7.4 2.68 1.21
R3: University undertake competitive fund raising initiative 10.0 33.9 32.2 17.4 6.5 2.77 1.06
R4: There is a lot of creativity and innovation in the management
of university resources.
7.8 40.9 31.3 14.8 4.8 2.68 .98
R5: The finances are well managed through sound financial
management systems.
12.6 44.8 23.5 10.4 8.7 2.58 1.11
R6: Staff are involved in annual budget processing. 9.1 46.5 22.2 14.8 7.4 2.65 1.07
R7: University has made use of its unique resources 9.1 43.0 27.4 13.0 7.4 2.67 1.06
R8: The university data is readily available for use in decision
making.
10.4 47.8 28.3 9.6 3.9 2.49 .94
R9: Budgeting is done in line with available resources. 13.0 55.7 20.9 7.4 3.0 2.32 .90
R10: Academic programme are adequately resourced. 18.3 46.1 19.1 11.3 5.2 2.39 1.07
R11: Student pay fees within the stipulated deadlines 17.4 34.8 29.1 13.9 4.3 2.53 1.07
R12: The university undertake Fundraising through donors 18.3 43.9 27.0 7.0 3.9 2.34 .98
R13:The university undertake fundraising initiatives through
Alumni
12.6 35.7 33.9 12.2 5.2 2.62 1.03
R14: The university undertake fundraising initiatives through
Philanthropies
14.8 39.6 31.3 10.4 3.9 2.49 1.00
R15: The university solicit for fund through research grant 15.7 57.0 17.0 8.7 1.7 2.24 .88
R16: The university has attracted a significance scholarship
funding
11.3 44.8 27.0 15.7 1.3 2.51 .93
R17: The university has embraced modern technology such as e-
library services
32.2 50.4 8.3 6.5 2.6 1.97 .95
R18: The university has adopted e-learning platform 35.2 43.9 12.2 6.5 2.2 1.97 .97
R19: The university has automated the student management
system
33.5 46.1 10.4 7.4 2.2 1.98 .97
R20: The university has automated examination processes 29.6 42.6 14.3 9.1 4.3 2.16 1.08
R21: The University has automated financial management 35.2 44.3 10.9 7.8 1.3 1.95 .95

273
Appendix VII: University Rankings
Sources: Author Compilation from website
http://www.usnews.com/education/best-global-universities/rankings [Accessed 26/5/2015]
http://www.shanghairanking.com/ARWU2015.html [Accessed 26/5/2015]
http://www.topuniversities.com/qs-world-University-rankings [Accessed 26/5/2015]
http://www.webometrics.info/en [Accessed 26/5/2015]
http://www.shanghairanking.com/ [Accessed 26/5/2015]
University and Region Webometric
Ranking
THE World
University
Ranking
Academic Ranking
of World
Universities (SJTU)
QS World
University
Ranking
Year 2015 2015/2016 2015/2016 2015/2016
USA
Harvard University, United
States
1 4 1 2
Massachusetts Institute of
Technology, United States
2 3 3 1
Stanford University, United
States
3 2 2 3
EUROPE
University of Cambridge,
United Kingdom
2 2 1 1
University of Oxford,
United Kingdom
1 1 2 2
ASIA
University of Tokyo 1 1 1 8
National University of
Singapore
7 2 2 1
AUSTRALIA
University of Melbourne 2 1 2 2
Africa
University of Capetown 1 1 1 1
Stellenbosch University 2 3 4 2
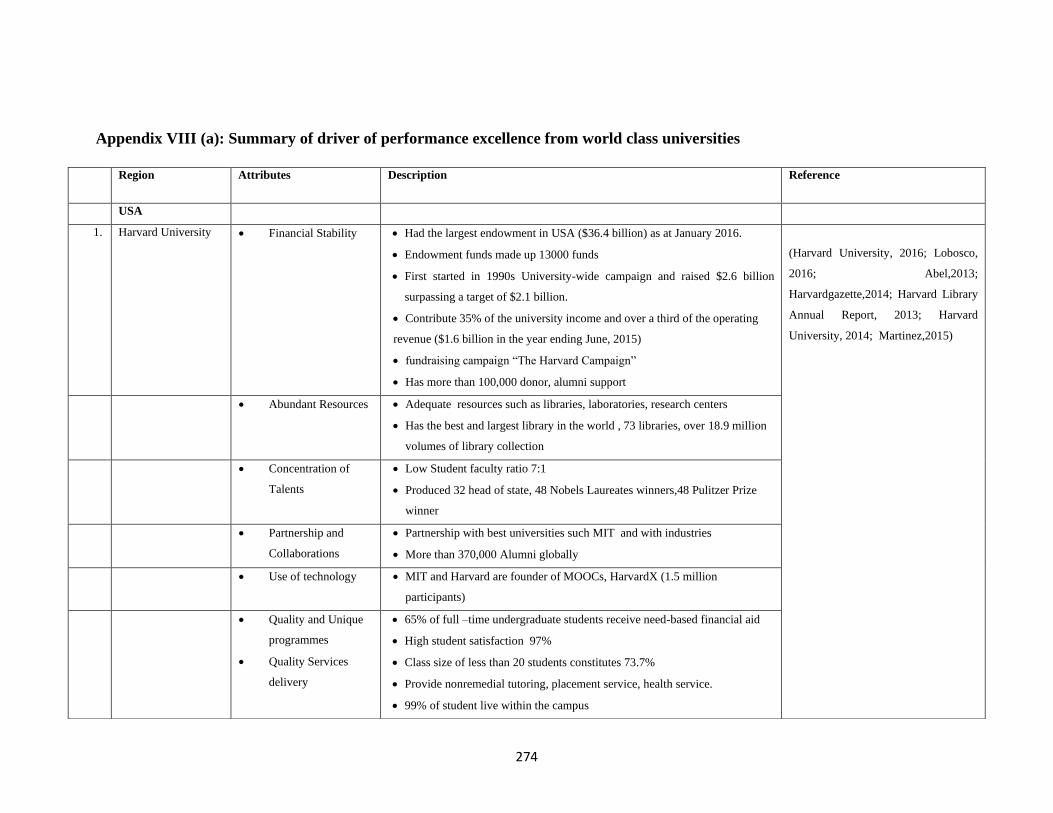
274
Appendix VIII (a): Summary of driver of performance excellence from world class universities
Region Attributes Description Reference
USA
1. Harvard University • Financial Stability • Had the largest endowment in USA ($36.4 billion) as at January 2016.
• Endowment funds made up 13000 funds
• First started in 1990s University-wide campaign and raised $2.6 billion
surpassing a target of $2.1 billion.
• Contribute 35% of the university income and over a third of the operating
revenue ($1.6 billion in the year ending June, 2015)
• fundraising campaign “The Harvard Campaign”
• Has more than 100,000 donor, alumni support
(Harvard University, 2016; Lobosco,
2016; Abel,2013;
Harvardgazette,2014; Harvard Library
Annual Report, 2013; Harvard
University, 2014; Martinez,2015)
• Abundant Resources • Adequate resources such as libraries, laboratories, research centers
• Has the best and largest library in the world , 73 libraries, over 18.9 million
volumes of library collection
• Concentration of
Talents
• Low Student faculty ratio 7:1
• Produced 32 head of state, 48 Nobels Laureates winners,48 Pulitzer Prize
winner
• Partnership and
Collaborations
• Partnership with best universities such MIT and with industries
• More than 370,000 Alumni globally
• Use of technology • MIT and Harvard are founder of MOOCs, HarvardX (1.5 million
participants)
• Quality and Unique
programmes
• Quality Services
delivery
• 65% of full –time undergraduate students receive need-based financial aid
• High student satisfaction 97%
• Class size of less than 20 students constitutes 73.7%
• Provide nonremedial tutoring, placement service, health service.
• 99% of student live within the campus

275
• Branding and
marketing
• Through their website dynamic website
2. MIT • Financial stability
• Endowment fund $13,474.7million in June 2015
• “MIT campaign for a better world”
• Gift from Alumni, Simon center for social brain ($26.5million), institute
for Integrative cancer research ($100million,David H. Koch alumnus)
• 32 % of student receives financial aids and 61% receives need based aids
Murry (2013); Report of the Treasurer
June 30, (2015); MIT Facts (2015)
Smith,2016; MIT’s Industrial
Partnership Report, 2003; Murray &
Budden, 2014; Denham, 2015; Vogel,
2012; Hariharan, Lakshmi &
Koomullil (2012).
Concentration of talents
• Low student to faculty ratio 8:1
• 60% graduate students, used in tutorials
• 85% have own Nobel prizes and various medals
• 1809 teaching staff out of which 1036 are professors
Partnership and
collaboration
Internationalization
Students industrial
experience
• Hosted 2248 Scholars from 90 countries in 2012-2013 FY involved in
teaching and research.
• 30% of student population were international students during 2014-2015
academic year
• Collaboration with industries, more than 700 companies, such as Boeing,
BMW, FORD, BP, Samsung, Siemens, Shell, Novartis.
• Giving expert advice like in the case of the ford (contributed in safety,
energy, power, modeling and vehicle autonomy)
• 19% of the MIT funding coming from the industries
Technology • Referred as innovation hub; MIT Media Lab “MIT Chancellor Grimson,
acknowledge that the world has gone to Greater Boston to learn about
practice of innovation from MIT”
• MITx, MOOCs, Hacker Competitions, lead in Commercialization of IP
• Has the best technology transfer in the world
Entrepreneurship and
Innovation
• Between 2000 and 2006 MIT graduate started more than 5800 companies.
• Commercialization of IP
Policies and strategy • Webpage for all the policies where member can give feedback

276
Quality Service delivery • MIT need blind policy – admission based on merit
• Every undergraduate class is taught by a professor every year.
3. Stanford University Financial Stability
• Stanford endowment stood at $22.2 billion as at August, 2015.
(Stanford+Connects strategy to reach)
• In 2006-2011 it raised $6.23 billion after a five year campaign (Stanford
Challenge) surpasing target of $4.3 billion single college campaign that
broke the record.
• Endowment constituted 21 % of the total revenue for the 2015/2016 FY
• 85% of the student receives financial assistance and 48% receives
scholarship through the need-based policy.
Stanford Annual Report, 2014;
Stanford Facts, 2016; Thompson,
2013; Ewalt, 2016; Stanford Facts,
2015
Concentration of talents • Student to faculty ratio 4:1(2,153 faculty)
• By 2014 had 31 Nobel prizes; 21 Nobel Laureates members, 4 Pulitzer prize
winners
Innovation and Technology • Standford StartX – business incubation, offer financial support for accepted
business ideas.
• 1st university to launch iTunes U public site, MOOCs
• Alumni behind some of the best business in Silicon Valley
• Commercialization of IP
Partnership and
collaborations
• Connection to More than 82,000 alumni and friends
Good leadership • President John L. Hennessy launched a five year fundraising campaign (2006-
2011)
Abundant resources • Well resourced library ; 20 libraries, 9.3 million physical volume, 1.5 million
e-books, 2.5 million audiovisual
Campus life • 93% of students living within the campus, 48% of student received need-
based scholarship
EUROPE
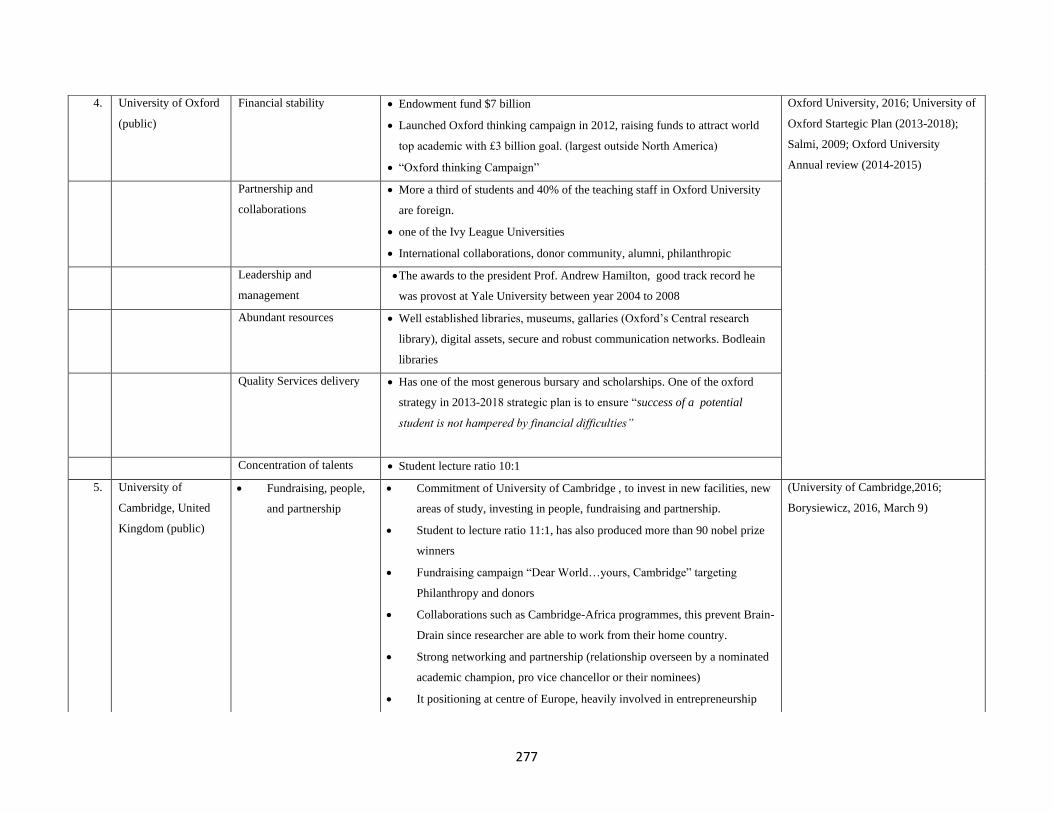
277
4. University of Oxford
(public)
Financial stability
• Endowment fund $7 billion
• Launched Oxford thinking campaign in 2012, raising funds to attract world
top academic with £3 billion goal. (largest outside North America)
• “Oxford thinking Campaign”
Oxford University, 2016; University of
Oxford Startegic Plan (2013-2018);
Salmi, 2009; Oxford University
Annual review (2014-2015)
Partnership and
collaborations
• More a third of students and 40% of the teaching staff in Oxford University
are foreign.
• one of the Ivy League Universities
• International collaborations, donor community, alumni, philanthropic
Leadership and
management
• The awards to the president Prof. Andrew Hamilton, good track record he
was provost at Yale University between year 2004 to 2008
Abundant resources
• Well established libraries, museums, gallaries (Oxford’s Central research
library), digital assets, secure and robust communication networks. Bodleain
libraries
Quality Services delivery • Has one of the most generous bursary and scholarships. One of the oxford
strategy in 2013-2018 strategic plan is to ensure “success of a potential
student is not hampered by financial difficulties”
Concentration of talents • Student lecture ratio 10:1
5. University of
Cambridge, United
Kingdom (public)
• Fundraising, people,
and partnership
• Commitment of University of Cambridge , to invest in new facilities, new
areas of study, investing in people, fundraising and partnership.
• Student to lecture ratio 11:1, has also produced more than 90 nobel prize
winners
• Fundraising campaign “Dear World…yours, Cambridge” targeting
Philanthropy and donors
• Collaborations such as Cambridge-Africa programmes, this prevent Brain-
Drain since researcher are able to work from their home country.
• Strong networking and partnership (relationship overseen by a nominated
academic champion, pro vice chancellor or their nominees)
• It positioning at centre of Europe, heavily involved in entrepreneurship
(University of Cambridge,2016;
Borysiewicz, 2016, March 9)
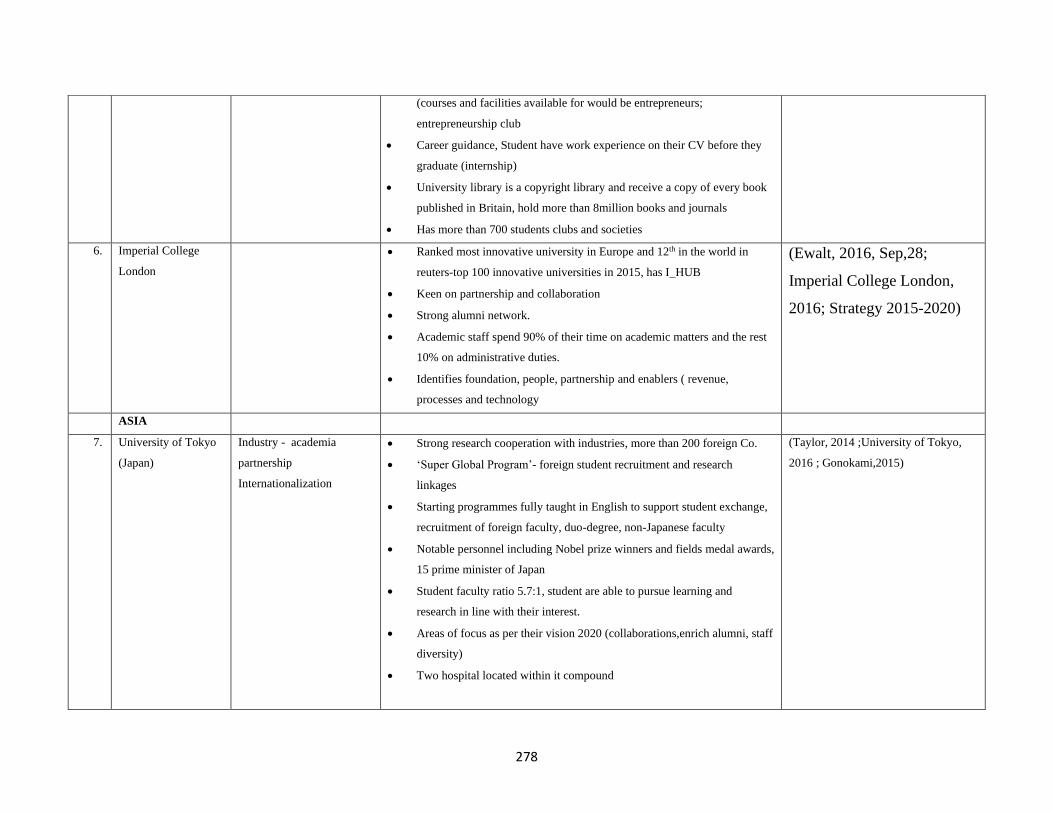
278
(courses and facilities available for would be entrepreneurs;
entrepreneurship club
• Career guidance, Student have work experience on their CV before they
graduate (internship)
• University library is a copyright library and receive a copy of every book
published in Britain, hold more than 8million books and journals
• Has more than 700 students clubs and societies
6. Imperial College
London
• Ranked most innovative university in Europe and 12th in the world in
reuters-top 100 innovative universities in 2015, has I_HUB
• Keen on partnership and collaboration
• Strong alumni network.
• Academic staff spend 90% of their time on academic matters and the rest
10% on administrative duties.
• Identifies foundation, people, partnership and enablers ( revenue,
processes and technology
(Ewalt, 2016, Sep,28;
Imperial College London,
2016; Strategy 2015-2020)
ASIA
7. University of Tokyo
(Japan)
Industry - academia
partnership
Internationalization
• Strong research cooperation with industries, more than 200 foreign Co.
• ‘Super Global Program’- foreign student recruitment and research
linkages
• Starting programmes fully taught in English to support student exchange,
recruitment of foreign faculty, duo-degree, non-Japanese faculty
• Notable personnel including Nobel prize winners and fields medal awards,
15 prime minister of Japan
• Student faculty ratio 5.7:1, student are able to pursue learning and
research in line with their interest.
• Areas of focus as per their vision 2020 (collaborations,enrich alumni, staff
diversity)
• Two hospital located within it compound
(Taylor, 2014 ;University of Tokyo,
2016 ; Gonokami,2015)
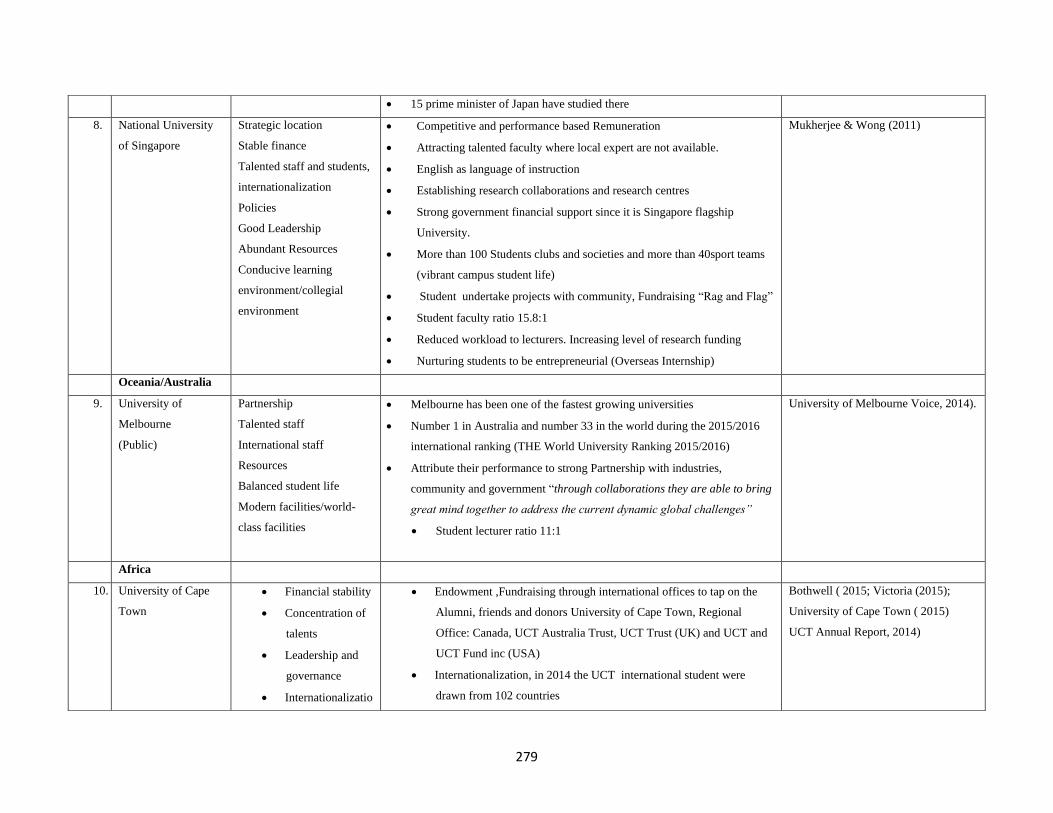
279
• 15 prime minister of Japan have studied there
8. National University
of Singapore
Strategic location
Stable finance
Talented staff and students,
internationalization
Policies
Good Leadership
Abundant Resources
Conducive learning
environment/collegial
environment
• Competitive and performance based Remuneration
• Attracting talented faculty where local expert are not available.
• English as language of instruction
• Establishing research collaborations and research centres
• Strong government financial support since it is Singapore flagship
University.
• More than 100 Students clubs and societies and more than 40sport teams
(vibrant campus student life)
• Student undertake projects with community, Fundraising “Rag and Flag”
• Student faculty ratio 15.8:1
• Reduced workload to lecturers. Increasing level of research funding
• Nurturing students to be entrepreneurial (Overseas Internship)
Mukherjee & Wong (2011)
Oceania/Australia
9. University of
Melbourne
(Public)
Partnership
Talented staff
International staff
Resources
Balanced student life
Modern facilities/world-
class facilities
• Melbourne has been one of the fastest growing universities
• Number 1 in Australia and number 33 in the world during the 2015/2016
international ranking (THE World University Ranking 2015/2016)
• Attribute their performance to strong Partnership with industries,
community and government “through collaborations they are able to bring
great mind together to address the current dynamic global challenges”
• Student lecturer ratio 11:1
University of Melbourne Voice, 2014).
Africa
10. University of Cape
Town
• Financial stability
• Concentration of
talents
• Leadership and
governance
• Internationalizatio
• Endowment ,Fundraising through international offices to tap on the
Alumni, friends and donors University of Cape Town, Regional
Office: Canada, UCT Australia Trust, UCT Trust (UK) and UCT and
UCT Fund inc (USA)
• Internationalization, in 2014 the UCT international student were
drawn from 102 countries
Bothwell ( 2015; Victoria (2015);
University of Cape Town ( 2015)
UCT Annual Report, 2014)
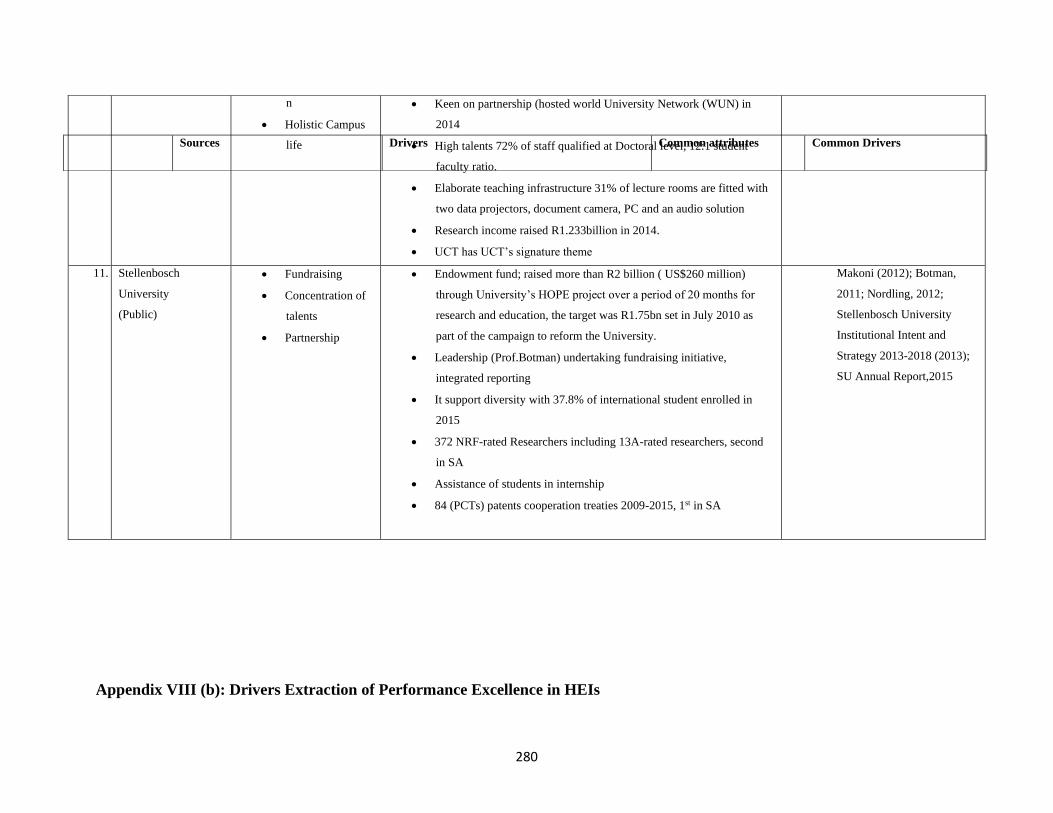
280
Appendix VIII (b): Drivers Extraction of Performance Excellence in HEIs
n
• Holistic Campus
life
• Keen on partnership (hosted world University Network (WUN) in
2014
• High talents 72% of staff qualified at Doctoral level, 12:1 student
faculty ratio.
• Elaborate teaching infrastructure 31% of lecture rooms are fitted with
two data projectors, document camera, PC and an audio solution
• Research income raised R1.233billion in 2014.
• UCT has UCT’s signature theme
11. Stellenbosch
University
(Public)
• Fundraising
• Concentration of
talents
• Partnership
• Endowment fund; raised more than R2 billion ( US$260 million)
through University’s HOPE project over a period of 20 months for
research and education, the target was R1.75bn set in July 2010 as
part of the campaign to reform the University.
• Leadership (Prof.Botman) undertaking fundraising initiative,
integrated reporting
• It support diversity with 37.8% of international student enrolled in
2015
• 372 NRF-rated Researchers including 13A-rated researchers, second
in SA
• Assistance of students in internship
• 84 (PCTs) patents cooperation treaties 2009-2015, 1st in SA
Makoni (2012); Botman,
2011; Nordling, 2012;
Stellenbosch University
Institutional Intent and
Strategy 2013-2018 (2013);
SU Annual Report,2015
Sources Drivers Common attributes Common Drivers
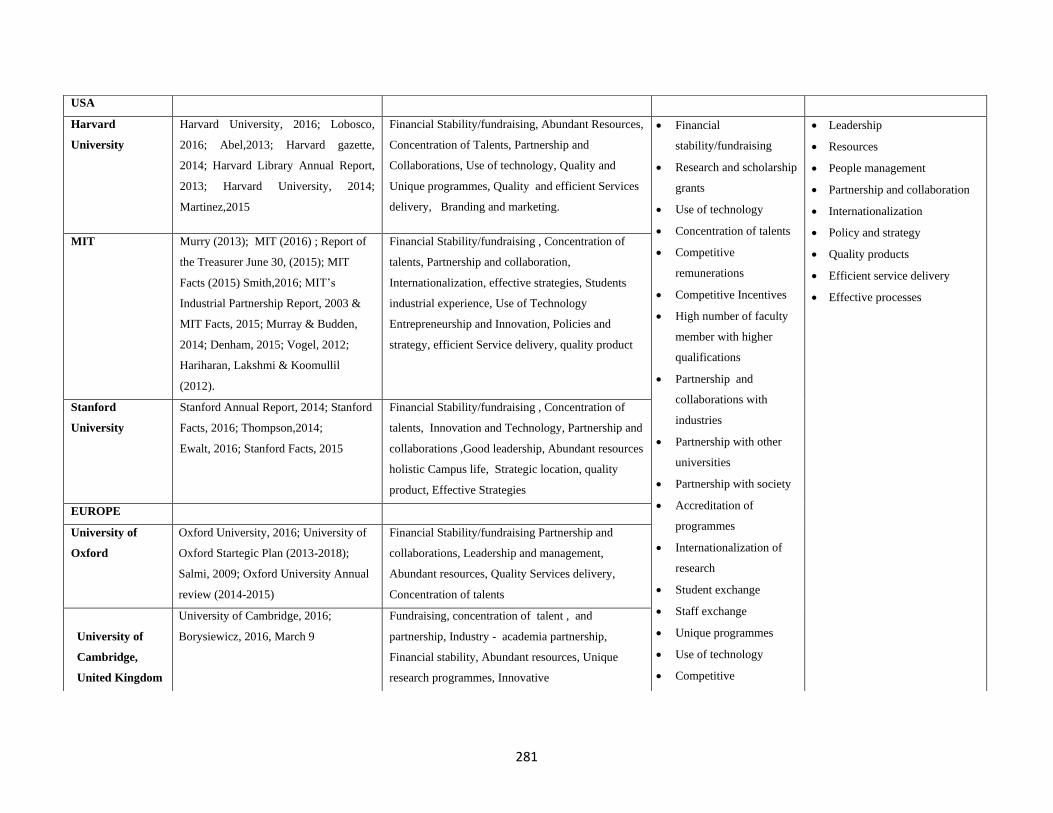
281
USA
Harvard
University
Harvard University, 2016; Lobosco,
2016; Abel,2013; Harvard gazette,
2014; Harvard Library Annual Report,
2013; Harvard University, 2014;
Martinez,2015
Financial Stability/fundraising, Abundant Resources,
Concentration of Talents, Partnership and
Collaborations, Use of technology, Quality and
Unique programmes, Quality and efficient Services
delivery, Branding and marketing.
• Financial
stability/fundraising
• Research and scholarship
grants
• Use of technology
• Concentration of talents
• Competitive
remunerations
• Competitive Incentives
• High number of faculty
member with higher
qualifications
• Partnership and
collaborations with
industries
• Partnership with other
universities
• Partnership with society
• Accreditation of
programmes
• Internationalization of
research
• Student exchange
• Staff exchange
• Unique programmes
• Use of technology
• Competitive
• Leadership
• Resources
• People management
• Partnership and collaboration
• Internationalization
• Policy and strategy
• Quality products
• Efficient service delivery
• Effective processes
MIT Murry (2013); MIT (2016) ; Report of
the Treasurer June 30, (2015); MIT
Facts (2015) Smith,2016; MIT’s
Industrial Partnership Report, 2003 &
MIT Facts, 2015; Murray & Budden,
2014; Denham, 2015; Vogel, 2012;
Hariharan, Lakshmi & Koomullil
(2012).
Financial Stability/fundraising , Concentration of
talents, Partnership and collaboration,
Internationalization, effective strategies, Students
industrial experience, Use of Technology
Entrepreneurship and Innovation, Policies and
strategy, efficient Service delivery, quality product
Stanford
University
Stanford Annual Report, 2014; Stanford
Facts, 2016; Thompson,2014;
Ewalt, 2016; Stanford Facts, 2015
Financial Stability/fundraising , Concentration of
talents, Innovation and Technology, Partnership and
collaborations ,Good leadership, Abundant resources
holistic Campus life, Strategic location, quality
product, Effective Strategies
EUROPE
University of
Oxford
Oxford University, 2016; University of
Oxford Startegic Plan (2013-2018);
Salmi, 2009; Oxford University Annual
review (2014-2015)
Financial Stability/fundraising Partnership and
collaborations, Leadership and management,
Abundant resources, Quality Services delivery,
Concentration of talents
University of
Cambridge,
United Kingdom
University of Cambridge, 2016;
Borysiewicz, 2016, March 9
Fundraising, concentration of talent , and
partnership, Industry - academia partnership,
Financial stability, Abundant resources, Unique
research programmes, Innovative
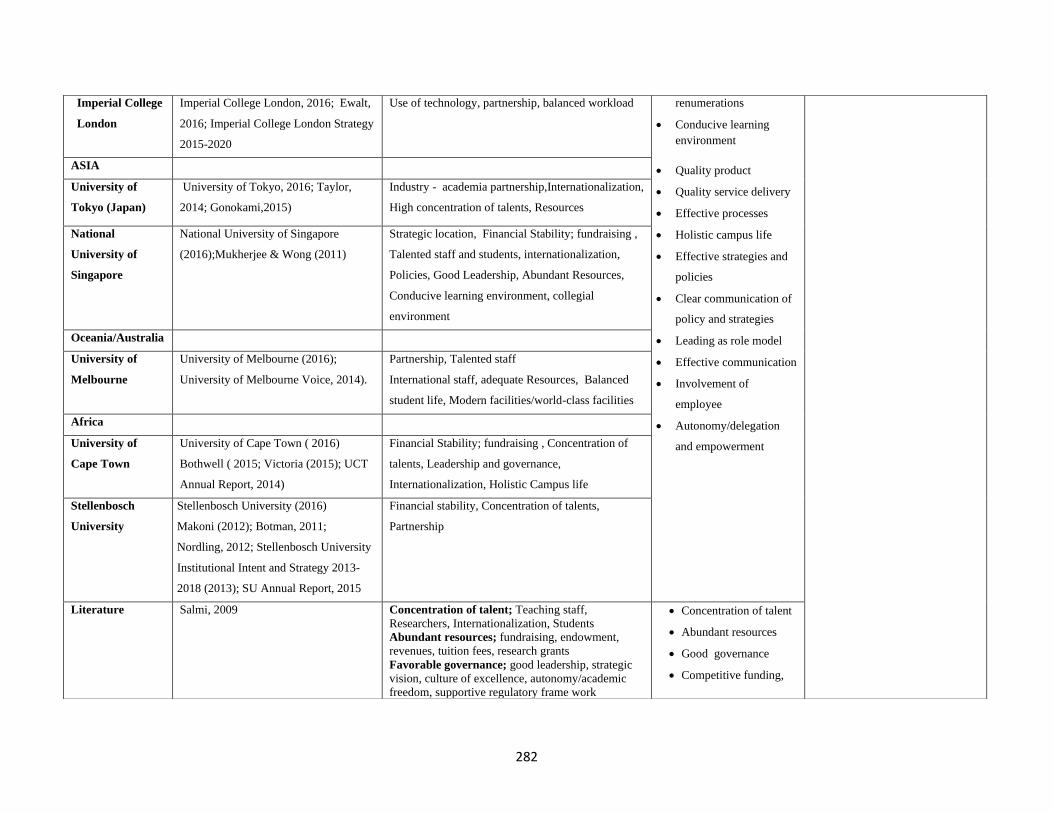
282
Imperial College
London
Imperial College London, 2016; Ewalt,
2016; Imperial College London Strategy
2015-2020
Use of technology, partnership, balanced workload renumerations
• Conducive learning
environment
• Quality product
• Quality service delivery
• Effective processes
• Holistic campus life
• Effective strategies and
policies
• Clear communication of
policy and strategies
• Leading as role model
• Effective communication
• Involvement of
employee
• Autonomy/delegation
and empowerment
ASIA
University of
Tokyo (Japan)
University of Tokyo, 2016; Taylor,
2014; Gonokami,2015)
Industry - academia partnership,Internationalization,
High concentration of talents, Resources
National
University of
Singapore
National University of Singapore
(2016);Mukherjee & Wong (2011)
Strategic location, Financial Stability; fundraising ,
Talented staff and students, internationalization,
Policies, Good Leadership, Abundant Resources,
Conducive learning environment, collegial
environment
Oceania/Australia
University of
Melbourne
University of Melbourne (2016);
University of Melbourne Voice, 2014).
Partnership, Talented staff
International staff, adequate Resources, Balanced
student life, Modern facilities/world-class facilities
Africa
University of
Cape Town
University of Cape Town ( 2016)
Bothwell ( 2015; Victoria (2015); UCT
Annual Report, 2014)
Financial Stability; fundraising , Concentration of
talents, Leadership and governance,
Internationalization, Holistic Campus life
Stellenbosch
University
Stellenbosch University (2016)
Makoni (2012); Botman, 2011;
Nordling, 2012; Stellenbosch University
Institutional Intent and Strategy 2013-
2018 (2013); SU Annual Report, 2015
Financial stability, Concentration of talents,
Partnership
Literature Salmi, 2009 Concentration of talent; Teaching staff,
Researchers, Internationalization, Students
Abundant resources; fundraising, endowment,
revenues, tuition fees, research grants
Favorable governance; good leadership, strategic
vision, culture of excellence, autonomy/academic
freedom, supportive regulatory frame work
• Concentration of talent
• Abundant resources
• Good governance
• Competitive funding,
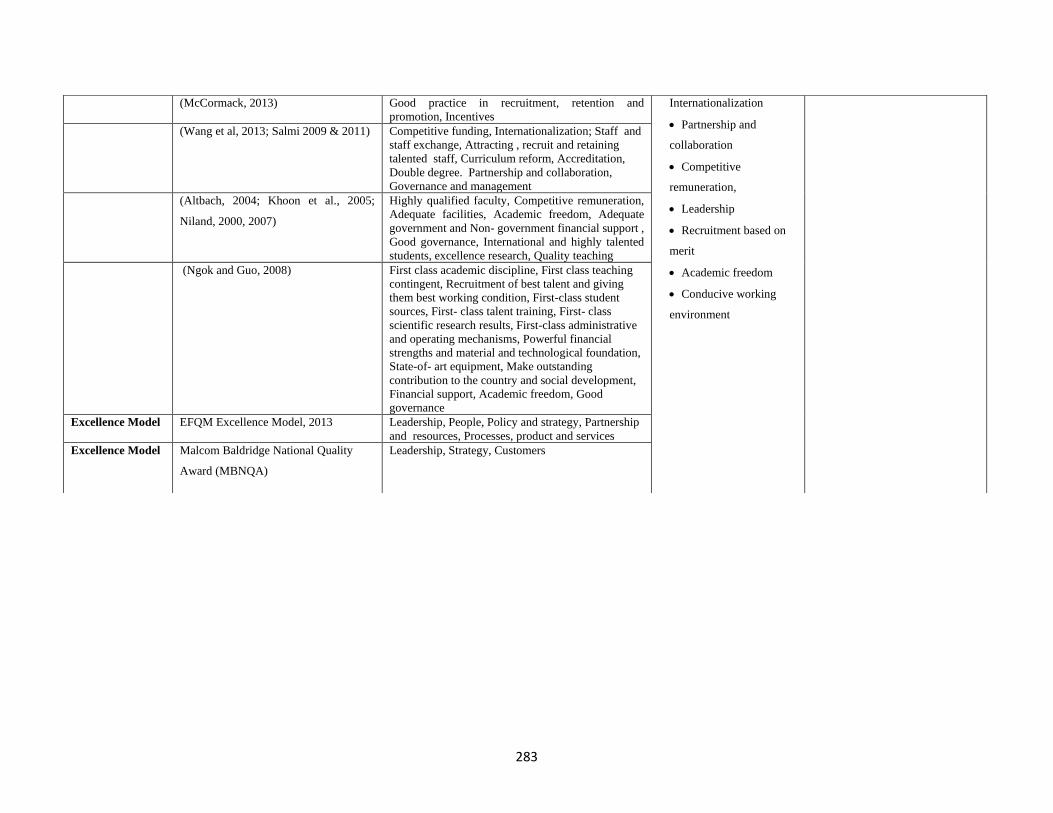
283
(McCormack, 2013) Good practice in recruitment, retention and
promotion, Incentives
Internationalization
• Partnership and
collaboration
• Competitive
remuneration,
• Leadership
• Recruitment based on
merit
• Academic freedom
• Conducive working
environment
(Wang et al, 2013; Salmi 2009 & 2011) Competitive funding, Internationalization; Staff and
staff exchange, Attracting , recruit and retaining
talented staff, Curriculum reform, Accreditation,
Double degree. Partnership and collaboration,
Governance and management
(Altbach, 2004; Khoon et al., 2005;
Niland, 2000, 2007)
Highly qualified faculty, Competitive remuneration,
Adequate facilities, Academic freedom, Adequate
government and Non- government financial support ,
Good governance, International and highly talented
students, excellence research, Quality teaching
(Ngok and Guo, 2008) First class academic discipline, First class teaching
contingent, Recruitment of best talent and giving
them best working condition, First-class student
sources, First- class talent training, First- class
scientific research results, First-class administrative
and operating mechanisms, Powerful financial
strengths and material and technological foundation,
State-of- art equipment, Make outstanding
contribution to the country and social development,
Financial support, Academic freedom, Good
governance
Excellence Model EFQM Excellence Model, 2013 Leadership, People, Policy and strategy, Partnership
and resources, Processes, product and services
Excellence Model Malcom Baldridge National Quality
Award (MBNQA)
Leadership, Strategy, Customers

284
Appendix IX: letters of Introduction and Authority to Collect Data
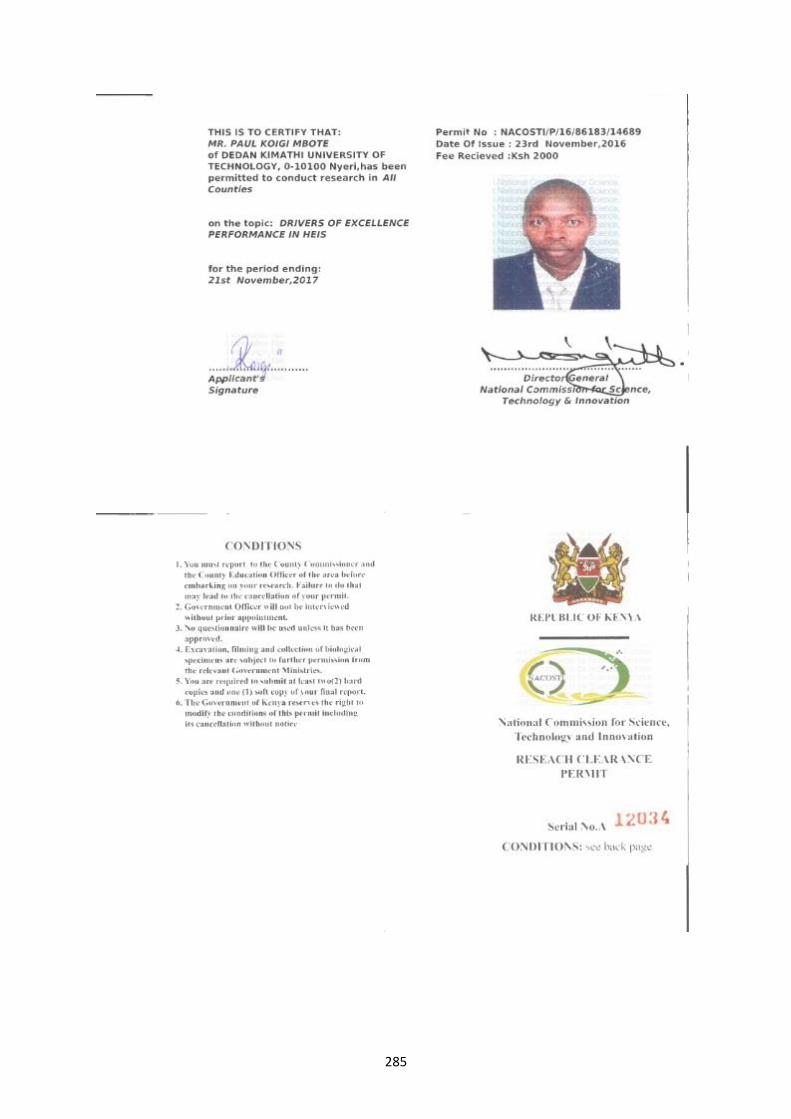
285
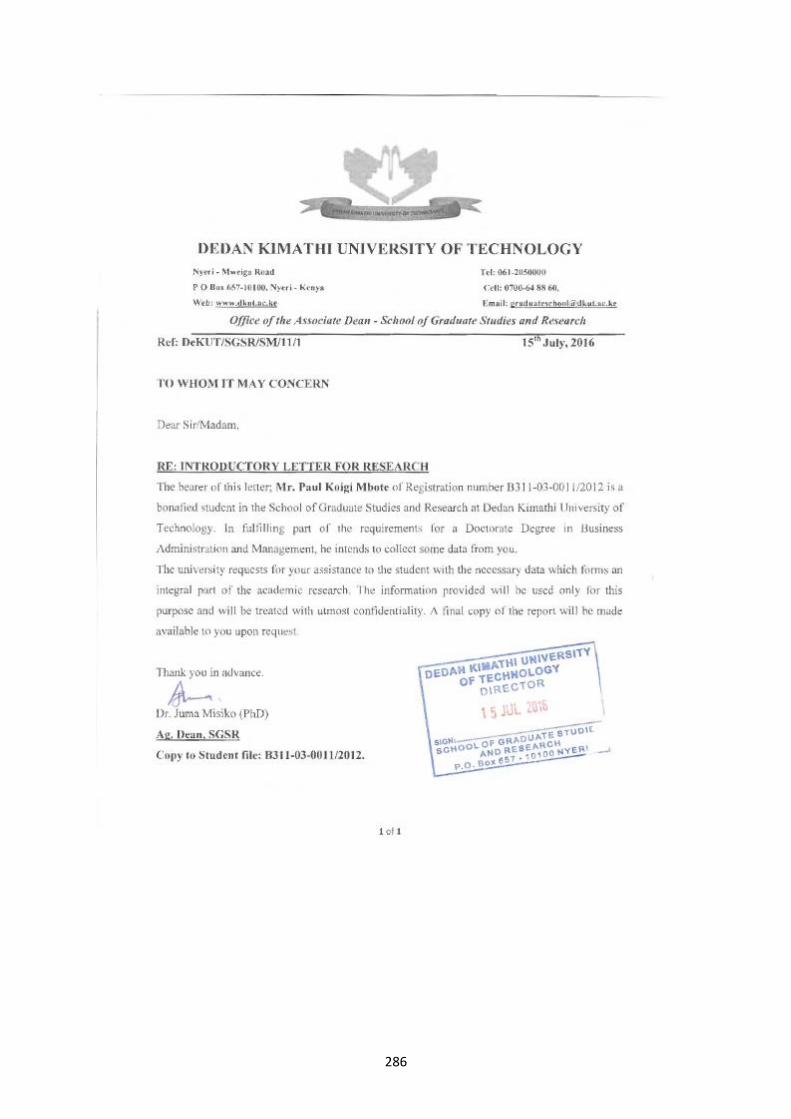
286
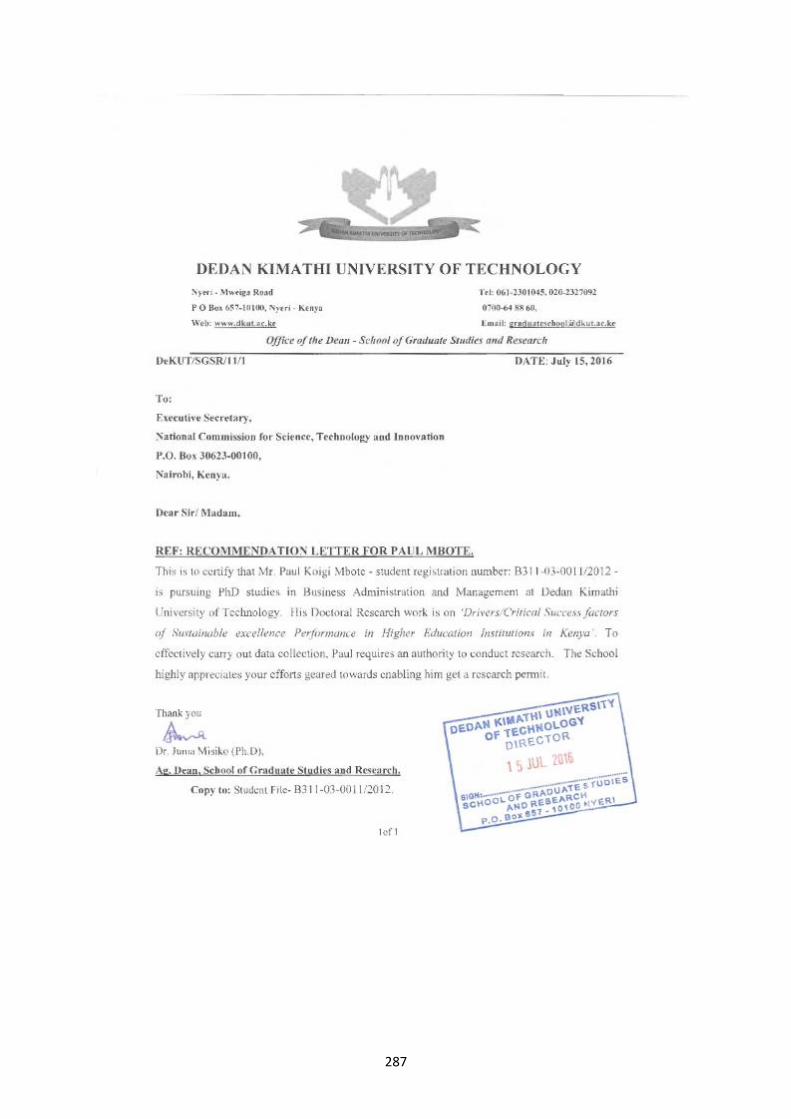
287
288
289
290
291
292
293

294
295
296
297

298
Copyright © 2022 FDOKUMEN