Buss_phd_2013.pdf - Discovery Research Portal
373
University of Dundee DOCTOR OF PHILOSOPHY Ternary combination concretes using GGBS, fly ash & limestone strength, permeation & durability properties Buss, Kirsty Award date: 2012 Link to publication General rights Copyright and moral rights for the publications made accessible in the public portal are retained by the authors and/or other copyright owners and it is a condition of accessing publications that users recognise and abide by the legal requirements associated with these rights. • Users may download and print one copy of any publication from the public portal for the purpose of private study or research. • You may not further distribute the material or use it for any profit-making activity or commercial gain • You may freely distribute the URL identifying the publication in the public portal Take down policy If you believe that this document breaches copyright please contact us providing details, and we will remove access to the work immediately and investigate your claim. Download date: 17. Sep. 2022
-
Upload
khangminh22 -
Category
Documents
-
view
5 -
download
0
Transcript of Buss_phd_2013.pdf - Discovery Research Portal

University of Dundee
DOCTOR OF PHILOSOPHY
Ternary combination concretes using GGBS, fly ash & limestone
strength, permeation & durability properties
Buss, Kirsty
Award date:2012
Link to publication
General rightsCopyright and moral rights for the publications made accessible in the public portal are retained by the authors and/or other copyright ownersand it is a condition of accessing publications that users recognise and abide by the legal requirements associated with these rights.
• Users may download and print one copy of any publication from the public portal for the purpose of private study or research. • You may not further distribute the material or use it for any profit-making activity or commercial gain • You may freely distribute the URL identifying the publication in the public portal
Take down policyIf you believe that this document breaches copyright please contact us providing details, and we will remove access to the work immediatelyand investigate your claim.
Download date: 17. Sep. 2022

DOCTOR OF PHILOSOPHY
Ternary combination concretes usingGGBS, fly ash & limestone
strength, permeation & durability properties
Kirsty Buss
2013
University of Dundee
Conditions for Use and DuplicationCopyright of this work belongs to the author unless otherwise identified in the body of the thesis. It is permittedto use and duplicate this work only for personal and non-commercial research, study or criticism/review. Youmust obtain prior written consent from the author for any other use. Any quotation from this thesis must beacknowledged using the normal academic conventions. It is not permitted to supply the whole or part of thisthesis to any other person or to post the same on any website or other online location without the prior writtenconsent of the author. Contact the Discovery team ([email protected]) with any queries about the useor acknowledgement of this work.

TERNARY COMBINATION CONCRETES USING GGBS,
FLY ASH & LIMESTONE:
STRENGTH, PERMEATION & DURABILITY PROPERTIES
by
KIRSTY BUSS
BSC (HONS), MRES
A thesis presented in application for the
Degree of Doctor of Philosophy
Department of Civil Engineering
University of Dundee
August2012

Ternary Combination Concretes Using GGBS, Fly Ash & Limestone: Strength, Permeation & Durability Properties
Declaration
i
DECLARATION
I hereby declare that I am the author of this thesis and that the work recorded has been
composed by me, and that all references citied have been consulted, and that it has not been
previously used for a higher degree.
Kirsty I Buss

Ternary Combination Concretes Using GGBS, Fly Ash & Limestone: Strength, Permeation & Durability Properties
Certificate
ii
CERTIFICATE
This is to certify that Kirsty I Buss has completed research under my supervision, and that she
has fulfilled the conditions of the relevant Ordinances and Regulations of the University of
Dundee, so that she is qualified to submit this thesis in application for the Degree of Doctor of
Philosophy.
Dr M J McCarthy
Department of Engineering
University of Dundee

Ternary Combination Concretes Using GGBS, Fly Ash & Limestone: Strength, Permeation & Durability Properties
Acknowledgements
iii
ACKNOWLEDGEMENTS
This dissertation would not have been possible without the guidance and the help of
several individuals who in one way or another contributed and extended their valuable
assistance in the preparation and completion of this study. Foremost I wish to take this
opportunity to express my sincere gratitude to Dr Michael McCarthy for his continued support
and guidance throughout this journey. His knowledge and expertise has been an invaluable
asset to my studies.
I extend my thanks to both the academic and technical staff of the School of Civil
Engineering for their continued assistance amongst these specifically I wish to thank Dr Li
Zheng and Dr Judith Halliday for their advice during the early stages of my study and Dr Murray
Newlands for his support and encouragement during the latter. The industrial partners,
namely, Aggregate Industries UK Ltd, Castle Cement Ltd, Cementitious Slag Makers Association,
Imerys, John Doyle Group, Mineral Products Association and Omya UK Ltd are also gratefully
acknowledge for their funding of the project.
Most importantly I wish to express my most sincere gratitude for the support and
patience of family and friends. To the best Aunt and Uncle who have stood in as proud and
supportive parents, together with Angela and Martin. Thanks to Linda and Andrew for their
tireless proof-reading and encouragement. Thanks also to Ann and Lesley, for your patience
and friendship, and Linda for keeping my mind, body and soul intact. Also to the many who
have kept me company and sane along this journey; David, Maziah and Sadi especially.
I wish to dedicate this work to three amazing women. To my mother, who gave me gift
of life and perseverance and to my friend Maureen, whose faith and confidence in my abilities
surpassed all others and whose encouragement kept me on the right path when my own steps
faltered. Finally, and by no means least, to Mandy, my eldest sister whose own strength and
determination is something to be admired and aspired to by all, a true Paralympian.

Ternary Combination Concretes Using GGBS, Fly Ash & Limestone: Strength, Permeation & Durability Properties
Abstract
iv
ABSTRACT
With the pressure on the construction industry to lower CO2 emissions it has become increasingly important to utilise materials that supplement Portland cement (CEM I) in concrete. These include additions such as ground granulated blast-furnace slag (GGBS) and fly ash, which have found greater use due to the benefits they provide to many properties of the material (in addition to environmental impact). While studies have investigated these materials in binary blends with CEM I, little work has examined the effect of combining materials in ternary blend concretes. A wide-ranging study was, therefore, set up to examine this for the range of more commonly available additions. This thesis reports on research carried out to investigate the effects of cement combinations based on CEM I / GGBS with either fly ash or limestone. The experimental programme investigated these materials in both paste and concrete and covered fresh properties, compressive strength, permeation and durability properties (using standard water curing for the latter three) and considered, for the hardened properties, how these may be balanced with environmental cost.
The mixes covered a range of w/c ratios (0.35. 0.50 and 0.65), which was the main basis of comparison,
and combinations of CEM I with GGBS (at levels of 35%, 55% and 75%), and fly ash and LS part-replacing this (at levels of 10 to 20 % and 10 to 35% respectively), after consideration of the relevant standards and related research. The initial phase of the study examined the characteristics of the materials, which indicated that they conformed to appropriate standards and were typical of those used in the application. Studies with cement paste (0.35 and 0.50 w/c ratio) indicated that there were reductions in water demand with the use of addition materials (binary and ternary) compared to CEM I. The setting times of the cement pastes were also affected, generally increasing with GGBS level for the binary mixes, although the effect was influenced by w/c ratio. Whilst fly ash and limestone delayed setting at the higher w/c ratio, the opposite occurred as this reduced, compared to the binary mixes. It was also found that the yield stress increased with GGBS level and further with the addition of ternary materials (particularly limestone) compared to CEM I.
The superplastiser (SP) dosage requirement in concrete was found to decrease with increasing w/c ratio,
and ternary additions reduced this compared to binary and CEM I concrete with the effect most noticeable at low w/c ratio. Early strength development was less than CEM I for binary concretes and differences increased with GGBS level. Improvements with the introduction of fly ash compared to the binary concretes were noted with increasing GGBS levels and w/c ratio. In general, the addition of LS gave reduced early strength for all concretes. Although at the 35% GGBS level binary concretes achieved similar strength to those of CEM I, the others generally gave reductions at all ages to 180 days, with differences increasing with GGBS level. However, with increasing w/c ratio and GGBS level improved strength development of ternary concretes, was noted compared to those of CEM I from 28 days.
Permeation (absorption (initial surface absorption and sorptivity) and permeability (water penetration and
air permeability)) and durability properties (accelerated carbonation and chloride ingress) of the test concrete were also investigated. At 28 days, for low GGBS levels, the binary concretes gave reduced absorption properties compared to CEM I, while the reverse occurred at high level. The effect of the ternary concretes gave further improvements at the lower GGBS levels and with increasing w/c ratio and curing time compared to CEM I. At the higher GGBS level the effect of the ternary additions was less noticeable but, in the case of limestone, improvements were still seen with increasing w/c ratio compared to CEM I. Similar effects were noted for the sorptivity results. The air permeability results gave higher values at 28 days for the binary and ternary concretes compared to CEM I, but significant improvements in the long-term at the lower GGBS level across the range of w/c ratios compared to CEM I concrete. Similar trends were found with water penetration tests. Accelerated carbonation increased with GGBS level for binary concretes compared to CEM I. These differences increased further with the introduction of fly ash and LS, particularly the former. In contrast rapid chloride tests indicated improvements with increasing GGBS levels compared to CEM I and further benefits with the inclusion of fly ash and limestone.
Embodied CO2 (ECO2) was calculated based on published British Cement Association (BCA) values for each
component of the mix and was shown to reduce with increasing w/c ratio and addition level in concrete. For concrete of an equal strength of 40N/mm2 the ECO2 could be almost halved (reduced from 343 kg/m3 for the CEM I to 176 kg/m3) for the ternary concretes at higher GGBS levels. These combination concretes also gave enhanced durability with regard to chloride ingress and at the lower w/c ratio comparable properties to CEM I in the case of carbonation. Overall, the results suggest that there is potential for ternary concretes to be used in the concrete industry given their ability to reduce ECO2, without compromising strength, permeation and durability properties of concrete.

Ternary Combination Concretes Using GGBS, Fly Ash & Limestone: Strength, Permeation & Durability Properties
Contents
v
Contents
DECLARATION .......................................................................................................................... I
CERTIFICATE ............................................................................................................................ II
ACKNOWLEDGEMENTS .............................................................................................................. III
ABSTRACT ............................................................................................................................. IV
CHAPTER ONE: INTRODUCTION .................................................................................................... 1
1.1 Background ................................................................................................................... 1
1.1.1 Impact of Concrete on Modern Society .................................................................. 1
1.1.2 Climate Change ...................................................................................................... 3
1.1.3 Recent Practical Applications of Combination Concretes ...................................... 6
1.2 Aims & Objectives ......................................................................................................... 9
1.3 Scope of the Study ...................................................................................................... 10
1.4 Outline of Thesis ......................................................................................................... 12
CHAPTER TWO: LITERATURE REVIEW........................................................................................... 14
2.1 Introduction ................................................................................................................ 14
2.2 Influence of Different Additions of the Properties of Concrete ................................. 15
2.2.1 GGBS..................................................................................................................... 15
2.2.3 Fly Ash .................................................................................................................. 17
2.2.4 Limestone ............................................................................................................. 20
2.3 Hydration & Reaction Characteristics of Cement & Cement Additions ..................... 21
2.3.1 Portland Cement .................................................................................................. 21
2.3.2 GGBS..................................................................................................................... 24
2.4 Coverage of Cement Additions in BS EN 197-1 and BS EN 206/ BS 8500 ................... 26
2.5 Particle Packing ........................................................................................................... 29
2.6 Binary Blended Concretes and Their Properties ........................................................ 30
2.6.1 Fresh Properties ................................................................................................... 30
2.6.2 Strength Development ......................................................................................... 32
2.6.3 Durability .............................................................................................................. 34
2.7 Ternary Blended Concretes and Their Properties ...................................................... 43
2.7.1 Fresh Properties ................................................................................................... 43
2.7.2 Strength Development ......................................................................................... 44
2.7.3 Durability .............................................................................................................. 49
2.8 Embodied CO2 ............................................................................................................. 57

Ternary Combination Concretes Using GGBS, Fly Ash & Limestone: Strength, Permeation & Durability Properties
Contents
vi
CHAPTER THREE: MATERIALS, MIX PROPORTIONS & TEST PROCEDURES .............................................. 60
3.1 Introduction ................................................................................................................ 60
3.2 Experimental Programme ........................................................................................... 60
3.3 Materials ..................................................................................................................... 61
3.3.1 Portland cement and additions ............................................................................ 61
3.3.2 Aggregates ........................................................................................................... 61
3.3.3 Water ................................................................................................................... 63
3.3.4 Admixture ............................................................................................................. 63
3.4 Material Characterisation ........................................................................................... 63
3.4.1 Physical................................................................................................................. 63
3.4.2 Chemical Properties ............................................................................................. 64
3.4.3 Aggregates ........................................................................................................... 64
3.5 Mix Proportions & Mix Design Procedure .................................................................. 66
3.5.1 Mix Proportions .................................................................................................... 66
3.5.2 Mix Design ............................................................................................................ 68
3.6 Preparations & Preconditioning ................................................................................. 71
3.6.1 Mixing .................................................................................................................. 71
3.6.2 Casting & Curing .................................................................................................. 73
3.7 Fresh Properties of Paste............................................................................................ 73
3.7.1 Standard Consistency ........................................................................................... 73
3.7.2 Particle Packing .................................................................................................... 74
3.7.3 Setting Time ......................................................................................................... 76
3.7.4 Viscometery .......................................................................................................... 76
3.8 Mercury Intrusion Porosimetry .................................................................................. 78
3.9 Compressive Strength................................................................................................. 79
3.10 Permeation & Absorption Properties ......................................................................... 79
3.10.1 Initial Surface Absorption Test (ISAT) ................................................................... 79
3.10.2 Sorptivity .............................................................................................................. 81
3.10.3 Air Permeability .................................................................................................... 83
3.10.4 Water Penetration Under Pressure ...................................................................... 85
3.11 Durability .................................................................................................................... 86
3.11.1 Carbonation ......................................................................................................... 86
3.11.2 Non-steady State Rapid Chloride Migration ........................................................ 86
3.11.3 Rapid Chloride Permeability ................................................................................. 88
3.12 Calculating Embodied CO2 (ECO2) ............................................................................... 91
3.13 Curve Fitting Procedure .............................................................................................. 92
3.14 Summary ..................................................................................................................... 92

Ternary Combination Concretes Using GGBS, Fly Ash & Limestone: Strength, Permeation & Durability Properties
Contents
vii
CHAPTER FOUR: FRESH PROPERTIES & EARLY AGE STRENGTH ........................................................... 93
4.1 Introduction ................................................................................................................ 93
4.2 Fresh Properties ......................................................................................................... 94
4.2.1 Standard Consistency & Packing Density ............................................................. 94
4.2.2 SP Dosage ............................................................................................................. 97
4.2.3 Rheology ............................................................................................................. 101
4.2.4 Setting Time ....................................................................................................... 104
4.3 Early Age Strength (up to 7 days) ............................................................................. 107
4.4 Time to Achieve 10N/mm2 ....................................................................................... 112
4.5 Summary ................................................................................................................... 119
CHAPTER FIVE: COMPRESSIVE STRENGTH ................................................................................... 121
5.1 Introduction .............................................................................................................. 121
5.2 Compressive Strength............................................................................................... 122
5.2.1 35% GGBS Level .................................................................................................. 122
5.2.2 55% GGBS Level .................................................................................................. 123
5.2.3 75% GGBS Level .................................................................................................. 126
5.2.4 Effects of ternary materials ................................................................................ 128
5.4 Cement Additions Efficiency Factor.......................................................................... 130
5.4.1 Binary Cementing Efficiency ............................................................................... 132
5.4.2 Ternary Cementing Efficiency ............................................................................. 134
5.5 Equivalent Strength of 40 N/mm2 ............................................................................ 138
5.6 Strength and Packing Density ................................................................................... 141
5.7 Relationship Between Concrete and the Cement Paste Matrix ............................... 147
5.7.1 Compressive Strength ........................................................................................ 147
5.7.2 Strength-Porosity Relationship .......................................................................... 149
5.9 Summary ................................................................................................................... 154
CHAPTER SIX: ABSORPTION & CAPILLARY RISE ............................................................................ 156
6.1 Introduction .............................................................................................................. 156
6.2 Absorption Tests ....................................................................................................... 158
6.2.1 35% GGBS Level .................................................................................................. 160
6.2.2 55% GGBS Replacement Level ............................................................................ 166
6.2.3 75% GGBS Level .................................................................................................. 171
6.3 Effects of Combined Additions ................................................................................. 176
6.4 Initial Surface Absorption and Cube Strength .......................................................... 184
6.4.1 ISAT-10 for Equivalent Compressive Strength of 40 N/mm2 .............................. 186
6.4.2 Sorptivity at Equivalent Strength of 40 N/mm2.................................................. 188
6.5 Absorption v Porosity ............................................................................................... 188
6.6 Sorptivity of Cement Paste in Relation to Concrete ................................................. 195
6.7 Summary ................................................................................................................... 198

Ternary Combination Concretes Using GGBS, Fly Ash & Limestone: Strength, Permeation & Durability Properties
Contents
viii
CHAPTER SEVEN: AIR PERMEABILITY & WATER PENETRATION......................................................... 200
7.1 Introduction .............................................................................................................. 200
7.2 Intrinsic Air Permeability .......................................................................................... 202
7.2.1 35% GGBS Level .................................................................................................. 202
7.2.2 55% GGBS Level .................................................................................................. 204
7.2.3 75% GGBS Level .................................................................................................. 208
7.3 Relative Air Permeability to CEM I ........................................................................... 210
7.4 Water Penetration Under Pressure .......................................................................... 213
7.4.1 35% GGBS Level .................................................................................................. 213
7.4.2 55% GGBS Level .................................................................................................. 215
7.4.3 75% GGBS Level .................................................................................................. 217
7.5 Relative Depth of Water Penetration to CEM I ........................................................ 219
7.6 Correlation Between Permeation Properties ........................................................... 221
7.7 Permeation v Compressive Strength ....................................................................... 222
7.7.1 Permeation for Equivalent Cube Strength of 40 N/mm2 .................................... 223
7.8 Permeation v Porosity .............................................................................................. 225
CHAPTER EIGHT: CARBONATION & CHLORIDE INGRESS OF CONCRETE ............................................... 232
8.1 Introduction .............................................................................................................. 232
8.2 Carbonation .............................................................................................................. 234
8.3 Carbonation in Relation to Tested Concrete Properties .......................................... 241
8.3.1 Strength .............................................................................................................. 241
8.3.2 Porosity .............................................................................................................. 243
8.3.3 Permeation and Absorption ............................................................................... 245
8.4.1 Rapid Chloride Permeability Tests (ASTMC1202) ............................................... 249
8.4.2 Non-steady State Chloride Migration (NT Build 492) ......................................... 253
8.5 Correlation Between Chloride Tests and other Concrete Properties ....................... 257
8.5.1 RCPT and NordTest ............................................................................................. 257
8.5.2 Chloride Ingress and Porosity ............................................................................. 258
8.5.3 Chloride Ingress in relation to other properties tested ...................................... 259
8.6 Chloride Binding ....................................................................................................... 261
CHAPTER NINE: ENVIRONMENTAL & ECONOMIC IMPLICATIONS OF ADOPTING TERNARY CONCRETES IN
CONSTRUCTION PRACTICE ...................................................................................................... 265
9.1 Introduction .............................................................................................................. 265
9.2 Life Cycle Analysis ..................................................................................................... 266
9.3 Environmental Impact .............................................................................................. 270
9.3.1 Embodied CO2 (ECO2) ......................................................................................... 271
9.4 Environmental Performance .................................................................................... 273
9.4.1 Strength and ECO2 Trade-off .............................................................................. 273

Ternary Combination Concretes Using GGBS, Fly Ash & Limestone: Strength, Permeation & Durability Properties
Contents
ix
9.4.2 Absorption and ECO2 Trade off .......................................................................... 278
9.4.3 Air permeability and ECO2 Trade Off .................................................................. 280
9.5 Durability and ECO2 Trade Off .................................................................................. 282
9.5.1 Carbonation ....................................................................................................... 282
9.5.2 Chloride Ingress .................................................................................................. 284
9.6 Economic Implications for Environmental Concretes .............................................. 284
9.7 Summary ................................................................................................................... 288
CHAPTER TEN: FINAL CONCLUSIONS & RECOMMENDATIONS FOR FURTHER RESEARCH .......................... 289
10.1 Introduction .............................................................................................................. 289
10.2 Overall Conclusions .................................................................................................. 290
10.2.1 Fresh Properties and Early Age Strength ........................................................... 291
10.2.2 Compressive Strength ........................................................................................ 291
10.2.3 Absorption & Capillary Rise ................................................................................ 292
10.2.4 Permeability ....................................................................................................... 293
10.2.5 Durability ............................................................................................................ 294
10.2.6 ECO2 of Concretes Combinations ........................................................................ 294
10.3 Recommendations for Future Research ................................................................... 295
APPENDIX A: (CHAPTER 3) SUPPLEMENTARY INFORMATION ........................................................... 328
A-1:MIX DESIGN ..................................................................................................................... 329
A-1a: CONCRETE MIX DESIGN – 100% CEM I, 0.50 w/c Ratio ........................................... 329
A-1b: CONCRETE MIX DESIGN – 45% CEM I + 45% GGBS + 10% Fly Ash, 0.50 w/c Ratio.. 330
A-2: Sorptivity Calculation Datasheet .................................................................................... 331
A-3: Air Permeability Calculation Datasheet ................................................................... 332
A-4: ECO2 Data ...................................................................................................................... 333
A-4a: 0.35 w/c ratio........................................................................................................... 333
A-4b: 0.5 w/c ratio ............................................................................................................. 334
A-4c: 0.65 w/c ratio ........................................................................................................... 335
A-5: Curve Fitting Procedure ................................................................................................. 336
APPENDIX B: (CHAPTER 4) SUPPLEMENTARY INFORMATION ........................................................... 339
B-1: Viscometry & Setting Time ....................................................................................... 340
B-2: Packing Density, Void ratio and Standard Consistency ............................................ 341
B-3: Strength .................................................................................................................... 342
APPENDIX C: (CHAPTER 5) SUPPLEMENTARY INFORMATION ........................................................... 343
C-1: Compressive Strength............................................................................................... 344
C-2: Cementing Efficiency Relative to CEM I concrete .................................................... 345
C-3: Total Porosity & Critical Pore Size ............................................................................ 346

Ternary Combination Concretes Using GGBS, Fly Ash & Limestone: Strength, Permeation & Durability Properties
Contents
x
APPENDIX D: (CHAPTER 6) SUPPLEMENTARY INFORMATION ........................................................... 347
D-1: ISAT & Sorptivity ....................................................................................................... 348
D-2: Paste Sorptivity ......................................................................................................... 349
APPENDIX E: (CHAPTER 7) SUPPLEMENTARY INFORMATION ........................................................... 350
E-1: Air Permeability ........................................................................................................ 351
E-2: Water Penetration Under Pressure .......................................................................... 352
APPENDIX F: (CHAPTER 8) SUPPLEMENTARY INFORMATION ........................................................... 353
F-1: Carbonation .............................................................................................................. 354
F-2: Chloride Ingress ........................................................................................................ 355

Ternary Combination Concretes Using GGBS, Fly Ash & Limestone: Strength, Permeation & Durability Properties
Contents
xi
LIST OF FIGURES & TABLES
Fig 1.1: Global cement production in 2009 ...................................................................................................................... 4
Fig 1.2: Evolution of cement production from 2000 to 2010........................................................................................... 5
Fig 1.3: Cement production across CEMBUREAU countries, 2010 figures compared to 2009 ........................................ 5
Fig 1.4: Per capita cement consumption across CEMBUREAU countries 2010 (Kg) ........................................................ 6
Fig 1.5: Coal Fired Power Station Products Sold During 2009, (UKQAA, 2010) ................................................................ 8
Table 2.1: The production and utilisation of GGBS globally [Source: Mehta, 1989 in Detweiler et al (1996)] .............. 15
Table 2.2: Typical oxide composition of GGBS [Source: ACI 226 (1987), Civil & Marine, (1993)] .................................. 16
Table 2.3: Oxide composition of GGBS found within literature ..................................................................................... 16
Table 2.4: The global production and utilisation of fly ash [Source: Alonso & Wesche, 1992] ...................................... 18
Fig 2.1: Utilisation in the construction industry and mining in Europe in 2008 ............................................................. 19
Table 2.5: Oxide composition of fly ash found within literature ................................................................................... 19
Fig 2.2: Schematic representation of cement hydration (Neville & Brooks, 2007 p14) ................................................. 24
Table 2.6: The 27 products in the family of common cements from BS EN 197-1 ........................................................ 27
Fig 2.4: a) loosely packed particles; b) denser material ................................................................................................ 30
Fig 2.5: Influence of silica fume on the penetration resistance of concrete .................................................................. 33
Fig 2.6: 28 day strength variation with w/CEM I+GGBS ratio (Source: Babu & Kumar, 2003) ....................................... 33
Fig 2.7: Effects of curing temperature on the time to reach 50% of ultimate strength ................................................. 34
Figure 2.8: Dimensional rage of solids and pores in hydrated cement paste ................................................................ 37
Fig 2.9: Effect of average aggregate size on air permeability index ............................................................................... 38
Table 2.7: Summary of primary transport mechanism for exposure and structure type (CCA, 2009) ........................... 41
Fig 2.10: Variation of chloride concentration with time from Mejia et al, 2003. .......................................................... 42
Fig 2.11: Rate of chloride ingress from McPolin et al, 2005 .......................................................................................... 42
Fig 2.12: Compressive strength development in concrete effect of .............................................................................. 45
Fig 2.13: Development of the compressive strength versus time. ................................................................................ 45
Fig 2.14: Weight change of concentration in 2% H2SO4 solution. .................................................................................. 46
Table 2.8: Mix proportions use by Khatib & Hibbert (2005) .......................................................................................... 47
Fig 2.15: Influences of varying GGBS contents at (a) 0% MK, (b) 10% MK and (c) 20% MK. .......................................... 48
Fig 2.16: Compressive strength versus time for the SCC mixes tested by Nehdi et al ................................................... 48
Fig 2.17: Compressive strength development of binary and ternary mixes containing silica fume and GGBS .............. 49
Table 2.9: Durability index tests obtained from wet cured test specimens, Alexander & Magee, 1999) ..................... 50
Fig 2.18: Absorption factors for pastes exposed to different conditions (Ganjian & Pouya, 2008) ............................... 51
Fig 2.19: Absorption factors for concretes exposed to different conditions (Ganjian & Pouya, 2008) ......................... 51
Fig 2.20: Relationship between the best fit of carbonation depth and the linear exposure time ................................ 53
Fig 2.21: RCPT test results from Becknell & Hale.(Becknell & Hale, 2005) .................................................................... 54
Fig 2.22: Chloride ion penetrability at 28 & 98 days for the mixes tested by Nehdi et al (2004) .................................. 55
Fig 2.23: Bleszynski et al RCPT tests indicating the lower levels of chloride ingress for Slag cements .......................... 56
Fig 2.24: Effect of cementing materials and curing on steady state migration ............................................................. 56
Fig 2.25: Chloride migration in concretes made with 320kg cement/m3, w/c 0.50. (Long, 2005) ................................. 57

Ternary Combination Concretes Using GGBS, Fly Ash & Limestone: Strength, Permeation & Durability Properties
Contents
xii
Fig 3.1: Overview of experimental programme ............................................................................................................. 62
Table 3.1: Summary of Material characterisation results .............................................................................................. 65
Table 3.2: Summary of characteristics of aggregates used during the study ................................................................ 66
Table 3.3: Cement combinations used during the study ............................................................................................... 67
Table 3.4(a): Mix Proportions at 0.35 W/C ratios fixed at 165kg/m3 * .......................................................................... 69
Table 3.4(b): Mix Proportions at 0.5 W/C ratios fixed at 165kg/m3 * ............................................................................ 70
Table 3.4(c): Mix Proportions at 0.65 W/C ratio fixed at 165kg/m3* ............................................................................ 70
Fig 3.2: Vicat plunger for standard consistency test ...................................................................................................... 73
Fig 3.1: Packing density of binary mix of grain. .............................................................................................................. 75
Table 3.6: K values for different packing processes in De Larrard’s CPM. ..................................................................... 76
Fig 3.3: Automated Setting Time Equipment ................................................................................................................. 77
Fig 3.4: Brookfield Viscometer ....................................................................................................................................... 77
Fig 3.5: Mercury Intrusion Porosimeter Equipment ...................................................................................................... 78
Fig 3.6: Schematic diagram showing the ISAT equipment set-up. ................................................................................. 80
Fig 3.7: Schematic of the sorptivity test ........................................................................................................................ 82
Fig 3.8: Sample chart indicating the sorptivity coefficient (y=0.0242) ........................................................................... 82
Fig 3.9: Layout the air permeability apparatus (Dhir et al, 1989) .................................................................................. 84
Fig 3.10: Air permeability testing equipment ................................................................................................................ 84
Fig 3.11: Layout the water penetration under pressure apparatus ............................................................................... 85
Fig 3.12: Schematic diagram of the set-up of the apparatus for NordTest Method.(NT Build 492, 1999) .................... 87
Fig 3.13: NT Build Test specimens ................................................................................................................................. 89
Fig 3.14: The assembly of the test cell for rapid chloride penetration tests. ................................................................. 90
Fig 3.15: The prepared specimens connected to the PROOVE’it™ Microprocessor ...................................................... 90
Fig 3.10: Calculated ECO2 for all mix combinations and w/c ratios ............................................................................... 92
Fig 4.1: Standard consistency of paste mixes ................................................................................................................ 94
Fig 4.2:Calculated packing density of paste mixes ......................................................................................................... 96
Fig 4.3: SP dosage for binary mixes across the range of w/c ratios ............................................................................. 100
Fig 4.4: SP dosage for 35% addition level mixes across the range of w/c ratios .......................................................... 100
Fig 4.5: SP dosage for 55% addition level mixes across the range of w/c ratios .......................................................... 101
Fig 4.6: Calculated yield stress of paste mixes at 0.5 w/c ratio ................................................................................... 102
Fig 4.7: Calculated plastic viscosity of paste mixes at 0.5 w/c ratio............................................................................. 102
Fig 4.8: Packing density and yield stress comparison .................................................................................................. 104
Fig 4.8: Setting time of paste mixes ............................................................................................................................. 105
Fig 4.10: Percentage of early age paste strength compared to 28 days ...................................................................... 108
Fig 4.11: Percentage of early age concrete strength compared to 28days.................................................................. 109
Fig 4.12: 3 day strength against water/CEM I across the range of combinations ........................................................ 111
Table 4.1: Estimated time to achieve 10N/mm2 strength ........................................................................................... 112
Fig 4.13: Early age strength of concrete at 35% level .................................................................................................. 116
Fig 4.14: Early age strength of concrete at 55% level .................................................................................................. 117
Fig 4.15: Early age strength of concrete at 75% level .................................................................................................. 118
Fig 5.1: Compressive strength at 35% addition level ................................................................................................... 124

Ternary Combination Concretes Using GGBS, Fly Ash & Limestone: Strength, Permeation & Durability Properties
Contents
xiii
Fig 5.2: Compressive strength at 55% addition level ................................................................................................... 125
Fig 5.3: Compressive strength at 75% addition level ................................................................................................... 127
Fig 5.4: Binder cementing efficiency for binary levels relative to CEM I ...................................................................... 133
Fig 5.5: Binder cementing efficiency at 35% addition level relative to binary mix ...................................................... 135
Fig 5.6: Binder cementing efficiency at 55% addition level relative to binary mix ...................................................... 136
Fig 5.7: Binder cementing efficiency at 75% addition level relative to binary mix ...................................................... 137
Table 5.1: Water cement ratio for equivalent strength of 40N/mm2 at 28 days ........................................................ 138
Fig 5.8: Equivalent strength of 40N/mm2 at 28 days ................................................................................................... 139
Fig 5.9: Strength and void ratio of 35% addition level mixes ....................................................................................... 143
Fig 5.10: Strength and void ratio of 55% addition level mixes ..................................................................................... 145
Fig 5.11: Strength and void ratio of 75% additions level mixes ................................................................................... 146
Fig 5.12: Comparison of compressive strength of paste and concrete sample ........................................................... 147
Fig 5.13: Compressive strength of concrete against paste samples ........................................................................... 148
Fig 5.14: Influential factors of concrete strength ( Mehta & Monteiro, 2004) ............................................................ 149
Fig 5.15: Diagrammatic representation of the volumetric proportions of the composite materials ........................... 151
Fig 5.16: Cube strength aginast total porosity at the 35% replacement level ............................................................. 152
Fig 5.18: Cube strength aginast total porosity at the 55% replacement level ............................................................. 153
Table 6.1: Pores within the concrete matrix (Mindess et al, 2003) ............................................................................. 157
Table 6.2: Typical ISAT values of well-cured oven dried concrete (Concrete Society,1991) ........................................ 159
Fig 6.1: ISAT-10 indicating absorption across the range of water cement ratios at the 35% addition level. ............... 161
Fig 6.2: Comparison of ISAT-10 and voids ratio across the range of water cement ratios .......................................... 163
Fig 6.3: Sorptivity of 35% GGBS level concretes .......................................................................................................... 165
Fig 6.4: ISAT-10 indicating absorption across the range of water cement ratios at the 55% addition level. ............... 167
Fig 6.5: ISAT-10 against void ratio across the range of water cement ratios at the 55% addition level. ..................... 169
Fig 6.6: Sorptivity of 55% GGBS level concretes .......................................................................................................... 170
Fig 6.7: ISAT-10 indicating absorption across the range of water cement ratios at the 75% addition level. ............... 172
Fig 6.8: Sorptivity of 75% GGBS level concretes across the range of w/c ratios .......................................................... 173
Fig 6.9: ISAT-10 against void ratio across the range of water cement ratios at the 75% addition level. ..................... 175
Fig 6.10: Sorptivity of 55% and 75% GGBS level binaries and fly ash ternary mixes at 0.5 w/c ratio .......................... 176
Table 6.3: ISAT-10 data and relative results as a percentage of CEMI control ............................................................ 177
Table 6.4: Sorptivity data and relative results as a percentage of CEMI control ......................................................... 178
Fig 6.11: Effects of ternary materials at 0.35 w/c ratio. .............................................................................................. 180
Fig 6.12: Effects of ternary materials at 0.5 w/c ratio at 28 days. ............................................................................... 181
Fig 6.13: Effects of ternary materials at 0.65 w/c ratio. .............................................................................................. 183
Fig: 6.14: ISAT v Compressive strength for (a) 28 days and (b) 180 days ..................................................................... 184
Fig 6.15: Sorptivity v Compressive strength for (a) 28 days and (b) 180 days ............................................................. 185
Fig 6.16: Sorptivity v ISAT for (a) 28 days and (b) 180 days ......................................................................................... 186
Fig 6.17: ISAT-10 for equivalent strength 40N/mm2 .................................................................................................... 187
Fig 6.18: Sorptivity for equivalent strength 40N/mm2................................................................................................. 188
Fig 6.19: Pore filling by products of hydration ............................................................................................................. 189
Table 6.5: Total porosity and critical pore size for selected cement paste samples .................................................... 190

Ternary Combination Concretes Using GGBS, Fly Ash & Limestone: Strength, Permeation & Durability Properties
Contents
xiv
Fig 6.20: ISAT-10 against critical pore size at 28 days [(a) and (b)] and 180 days [(c) and (d)] .................................... 191
Fig 6.21: Sorptivity against critical pore size at 28 days [(a) and (b)] and 180 days [(c) and (d)] ................................. 192
Fig 6.22: Sorptivity v Critical PoreDiameter by w/c ratio and test age ........................................................................ 193
Fig 6.23: Sorptivity v Critical pore diameter by mix combination, w/c ratio and test age ........................................... 193
Fig 6.24: Porosity v critical pore diameter by w/c ratio and test age .......................................................................... 194
Fig 6.25: Sorptivity of paste against concrete for selected samples at both w/c ratios .............................................. 196
Table 6.5: Sorptivity of selected paste and concrete with concrete to paste ratio at 28 days .................................... 197
Fig 6.26: Sorptivity ratio for selected mix combinations tested at 28 days ................................................................. 197
Fig 7.1: Intrinsic Air Permeability of 35% GGBS level concretes .................................................................................. 203
Fig 7.2: Intrinsic Air Permeability of 35% GGBS level concretes against void ratio of mixes ....................................... 205
Fig 7.3: Intrinsic Air Permeability of concretes at the 55% GGBS level ........................................................................ 207
Fig 7.4: Intrinsic Air Permeability of 75% GGBS level concretes .................................................................................. 209
Fig 7.5 Intrinsic Air Permeability relative to CEM I ...................................................................................................... 212
Fig 7.6: Water Penetration of 35% GGBS level concretes ............................................................................................ 214
Fig 7.7: Water Penetration of 55% GGBS level concretes ............................................................................................ 216
Fig 7.8: Water Penetration of 75% GGBS level concretes ............................................................................................ 218
Fig 7.9: Relative Depth of Water Penetration to CEM I .............................................................................................. 220
Fig 7.10: Correlation of tested permeability properties by w/c ratio at (a) 28 days and (b) 180 days ........................ 221
Fig 7.11: Air permeation against compressive strength by w/c ratio for (a) 28 days and (b) 180 days ....................... 222
Fig 7.12: Water penetration against compressive strength by w/c ratio for (a) 28 days and (b) 180 days ................. 223
Fig 7.13 Intrinsic Air Permeability for Equivalent Cube Strength of 40 N/mm2 ........................................................... 224
Fig 7.13: Depth of Water Penetration for Equivalent Cube Strength of 40 N/mm2 ..................................................... 225
Fig 7.14: Air permeability against critical pore size at 28 days [(a) and (b)] and 180 days [(c) and (d)] ....................... 226
Fig 7.15: Water penetration against critical pore size at 28 days [(a) and (b)] and 180 days [(c) and (d)] .................. 227
Fig 7.16: Air permeability against critical pore diameter for both w/c ratios at (a) 28 days and (b) 180 days ............ 227
Fig 7.17: Water penetration against critical pore diameter for both w/c ratios at (a) 28 days and (b) 180 days ........ 228
Fig 7.18: Air permeability against total porosity for both w/c ratios at (a) 28 days and (b) 180 days ......................... 229
Fig 7.19: Water penetration against total porosity for both w/c ratios at (a) 28 days and (b) 180 days ..................... 229
Table 8.1: Exposure classes summarised from BS EN 206-1:2000 ............................................................................... 233
Fig 8.1: Carbonation depth at 8 and 20 weeks across the range of w/c ratios. ........................................................... 238
Fig 8.2: Carbonation for limestone ternary mixes at 0.5 water cement ratio.............................................................. 239
Fig 8.3: Carbonation for PFA ternary mixes at 0.5 water cement ratio ....................................................................... 240
Fig 8.4: Level of carbonation (5 weeks) in relation to compressive strength (28 days) at 0.5 w/c ratio...................... 241
Fig 8.5: Level of carbonation for equivalent strength of 40Nm. .................................................................................. 242
Fig 8.7: Level of carbonation (5 weeks) in relation to total porosity (%, vol) at 28 days ............................................ 244
Fig 8.8: Carbonation depth against voids ratio. ........................................................................................................... 245
Fig 8.10: Depth of carbonation (5weeks) against ISAT at 28 day ................................................................................. 246
Table 8.2: Comparison of exposure classes and requirements from BS 8500 and BSEN206 ....................................... 247
Table 8.3: Chloride permeability based on charge passed (ASTM C1202) ................................................................... 249
Fig 8.11: Rapid Chloride Permeability Test (RCPT) results for binary mixes for all water cement ratios .................... 250
Fig 8.12: Rapid Chloride Permeability Test (RCPT) results for 55% replacement level for all water cement ratios .... 251

Ternary Combination Concretes Using GGBS, Fly Ash & Limestone: Strength, Permeation & Durability Properties
Contents
xv
Fig 8.13: Rapid Chloride Permeability Test (RCPT) results at 0.5 water cement ratio ................................................ 252
Table 8.4: Summary of Chloride Ingress Results .......................................................................................................... 256
Fig 8.17: Correlation between RCPT and NordTest ..................................................................................................... 257
Fig 8.18: Critical pore size against NordTest ................................................................................................................ 258
Fig 8.19: Critical pore size against RCPT....................................................................................................................... 258
Fig 8.20: Total porosity against NordTest .................................................................................................................... 259
Fig 8.21: Total porosity against RCPT ........................................................................................................................... 259
Fig 8.22: Correlation between Chloride ingress tests and other tested concrete properties ...................................... 260
Fig 9.1: Lifecycle of concrete ....................................................................................................................................... 266
Fig: 9.2:System boundaries of cement production ...................................................................................................... 268
Fig 9.3: Environmental impact of GGBS ....................................................................................................................... 268
Fig 9.4: Environmental impact of fly ash...................................................................................................................... 269
Table 9.1: Proportional components of 1 tonne of concrete ..................................................................................... 272
Fig 9.2: Calculated ECO2 for all mix combinations and w/c ratios ............................................................................... 273
Figure 9.3: Compressive strength against ECO2 for 35% replacement level mixes at 28 days. ................................... 276
Figure 9.4: Compressive strength against ECO2 for 55% replacement level mixes at 28 days .................................... 276
Figure 9.5: Compressive strength against ECO2 for 75% replacement level mixes at 28 days .................................... 277
Figure 9.6: ECO2 for equivalent strength of 40N/mm2 ................................................................................................ 277
Figure 9.7: ISAT against ECO2 for 35% replacement level mixes at 28 days. ............................................................... 279
Figure 9.8: ISAT against ECO2 for 55% replacement level mixes at 28 days. ............................................................... 279
Figure 9.9: ISAT against ECO2 for 75% replacement level mixes at 28 days. ............................................................... 280
Figure 9.10: Air permeability against ECO2 for 35% replacement level mixes at 28 days ............................................ 281
Figure 9.11: Air permeability against ECO2 for 55% replacement level mixes at 28 days ............................................ 281
Fig 9.12: Carbonation (8 weeks) against ECO2 for 35% GGBS level ............................................................................. 283
Fig 9.13: Carbonation (8 weeks) against ECO2 for 55% GGBS level ............................................................................. 283
Fig 9.14: Chloride ingress (NordTest) against ECO2 at 28 days .................................................................................... 284
Table 9.2: Costings used to calculate total material costs ........................................................................................... 285
Fig 9.15: Total material costs (£/m3) for each mix combination .................................................................................. 286
Fig 9.16: Material costs for equivalent strength of 40N/mm2 ..................................................................................... 286
Table 9.3: Overall performance of concrete for Equivalent cube strength at 28 days of 40N/mm2 ........................... 287

Ternary Combination Concretes Using GGBS, Fly Ash & Limestone: Strength, Permeation & Durability Properties
Chapter 1: Introduction
1
CHAPTER ONE: INTRODUCTION
1.1 Background
Due to growing environmental concerns over resource use and global warming, there is
increasing pressure on the construction industry to reduce the environmental impact of
cement and concrete production. Acquisition of primary aggregates and CO2 emissions from
production are considered unacceptable, yet the growth of infrastructure, cities and society as
a whole has deemed it necessary to supply concrete to achieve these. Ramachandran et al
described concrete as “the largest production of all man-made materials” (2001). Neville noted
that together with steel it is the “most commonly used structural material” (1995). Figures
from CEMBUREAU indicate that 2009 production of cement reached over 3 billion tonnes
globally (CEMBUREAU, 2009). These figures belie the humble beginnings of cement that date
back millennia. Ancient Egyptians, Greeks and Romans all used the material, with the Roman
term “opus caementicium” being the first instance of the use of the word cement by Vetruvius
in his treatise “Ten Books on Architecture” first published in 25BC (Vetruvius, 2008). As a
material it may well have been used continuously, but there are little records of this until the
technical knowledge of its manufacture began to develop in the 18th century. James Parker
patented “Roman cement” in 1796 beginning an influx of developing cements by the likes of
John Smeaton, Louis Vicat, James Frost and Joseph Aspdin in 1824 with Portland cement
(Francis, 1977). However it was the 1840’s that saw the production of modern Portland
cement, thus beginning a growth of concrete use in the construction industry to what has now
become a multi-billion pound global industry which now has far reaching consequences in
terms of the environment, economy and society as a whole.
1.1.1 Impact of Concrete on Modern Society
In a modern society, despite its continued and extensive use, concrete brings pressures
to the industry in an ever growing global market that is encouraged to work towards more
sustainable development. The impact of cement production is threefold affecting the pillars of

Ternary Combination Concretes Using GGBS, Fly Ash & Limestone: Strength, Permeation & Durability Properties
Chapter 1: Introduction
2
sustainable development: environment, economic and social in four fundamental areas which
are summarised in Table 1.1 below.
Table 1.1: Impact of the cement industry (summarised from The Concrete Society, 2009)
Environmental Impact Social Impact Economic Impact
Land use and natural resource
management.
Recreation v Industry Transportation costs
(local v imported)
Waste to landfill Landfill sites Taxes
Working environment Health and safety Costs incurred due to sickness.
Medical bills
Emissions and energy Reduction commitment Energy taxes
Natural resources are used throughout the manufacture of cement and further still for
concrete, with the continued acquisition of aggregates; these can leave obvious scars in the
environment due to quarrying processes. Over time, these can be removed with re-integration
of quarries into the landscape, allowing them to be re-cultivated or returned to nature (The
Concrete Society, 2009). Quarrying can also incur added costs as material requires to be
transported to processing sites. Locally sourced materials can reduce costs and the use of
recycled materials, including crushed concrete and brick, are also encouraged. Not only does
this reduce natural resource use, it reduces material entering the waste stream. This in turn
decreases waste from the construction industry going to landfill, reducing associated taxes.
The reduction in the economic impact of concrete with respect to these can be
twofold, reducing taxes and lowering production and transportation costs, especially if
processing can be done on site. Social impact from industry also occurs with working
environments within construction being hazardous. Furthermore, the cement industry itself
has certain risks with wet cement causing skin burns due to its being caustic, whilst the dry
powder can cause severe respiratory irritation (HSE, 2002). Automated production within
processing plants can reduce this impact but creates additional costs and replaces the
workforce, increasing unemployment. Additional health issues can be associated with heavy
metals present in the clinker and emissions during cement production (HSE, 2002). These will
depend on the composition of the raw materials used but gases and dust rich in volatile heavy

Ternary Combination Concretes Using GGBS, Fly Ash & Limestone: Strength, Permeation & Durability Properties
Chapter 1: Introduction
3
metals are released into the atmosphere during the high temperature calcination process of
the limestone and clay minerals. In European countries this is regulated but in the developing
world it is still very much a concern and lends support to the argument for the use of
alternative materials to Portland cement in concrete construction (McLeod, 2005).
1.1.2 Climate Change
Whilst these issues are important, it is the significant emissions of CO2 that are of the
greatest importance on a global scale. By making improvements in this area, the other impacts
can also be reduced (McLeod, 2005). Damineli et al (2010) reported that 5.0% of anthropogenic
CO2 emissions were caused by cement production in 2003 and this is set to increase twofold by
2050, with the majority occurring in developing countries. Given the quantities shown in Figure
1.1, which illustrates cement production by region and country on a global scale, it is clear that
developing countries such as China, Africa and India are increasing their cement production
compared to those in Europe. This is made all the more evident in Figure 1.2 that shows the
evolution of cement production from 2000 to 2010, production in Africa and Asia has risen
steadily during this timeframe to indicate an increase of 125% and 145%, respectively, on 2000
data. It must be noted that these figures are based on cement production as a whole and it is
not indicated by CEMBUREAU what percentage of these figures are specifically Portland
cement production. Regardless, however, it stresses the fact that this is an international issue
and has given rise, over the past few decades, to policies, strategies and agreements on
reducing CO2 emissions towards encouraging sustainable development. Such policies include
the Kyoto Protocol (1997) and subsequent agreements between governments to reduce their
CO2 emissions that have been transferred down the various levels of governance to local
authorities by way of planning strategies and industry commitments towards more sustainable
development. Across the CEMBUREAU countries production rates have changed. Figure 1.3
indicates the percentage difference in production in each member country when 2010 data is
compared to 2009. Whilst there are percentage changes it is not until the Per Capita
consumption of 2010 is examined in Figure 1.4 that the true production of cement can be
realised.
BCA (2008) indicate that for every tonne of cement produced 930kg of CO2 is emitted,
that is 93% of the manufactured volume. It is widely recognised that this needs to be reduced

Ternary Combination Concretes Using GGBS, Fly Ash & Limestone: Strength, Permeation & Durability Properties
Chapter 1: Introduction
4
and the concrete industry on the whole, is making headway. The ability to reduce the
production of cement, and hence environmental impact, but still meet the demands of industry
by supplying a durable and strong material has led to a great deal of research into the use of
pozzolana, that are capable of providing durable concrete. Both natural pozzolana in the form
of pumice, and artificial pozzolana such as pottery were used by the Romans to great success
(Sisomondo, 2009). The extensive Roman aqueducts used pozzolanic cements and the
monolithic dome of the Pantheon in Rome and the Baths of Caracella remain standing as a
testament to the strength and durability of the materials and the ingenuity of the engineers of
that time (Hill, 1984).
Fig 1.1: Global cement production in 2009

Ternary Combination Concretes Using GGBS, Fly Ash & Limestone: Strength, Permeation & Durability Properties
Chapter 1: Introduction
5
Fig 1.2: Evolution of cement production from 2000 to 2010
Fig 1.3: Cement production across CEMBUREAU countries, 2010 figures compared to 2009

Ternary Combination Concretes Using GGBS, Fly Ash & Limestone: Strength, Permeation & Durability Properties
Chapter 1: Introduction
6
Fig 1.4: Per capita cement consumption across CEMBUREAU countries 2010 (Kg)
Recent developments in concrete construction, particularly BS EN 197, mean that there
is now a greater range of materials (cements and admixtures) and options than have
traditionally been available to engineers to satisfy the needs of the industry as a whole,
including environmental. However, the concrete must continue to meet specific technical
serviceability requirements that relate to both its engineering and durability properties, as well
as achieving all these at a minimum cost. Globally there are differences in terminology for
additional materials such as GGBS and fly ash, in cement. Whilst some may refer to them as
admixtures this can lead to confusion, as this term usually refers to super-plasticisers, retarding
liquids etc., that are added during the mixing process to achieve a certain purpose. Additions
seems to be the most accepted term and henceforth will be used throughout this thesis to
include GGBS, fly ash and limestone that are added to the Portland cement to produce binary
and ternary combination concretes.
1.1.3 Recent Practical Applications of Combination Concretes
On a global scale the use of additions, combined with Portland cement is becoming
more common. A number of structures have been made using GGBS as a binary material. In
New Zealand a 65% GGBS binary mix was used for the Meridian Energy building in Wellington
(www.sustainableconcrete.org.nz, 2010). In the USA, the use of GGBS is state-wide with a
federal building in San Francisco (PCA, 2010), The Helena (PCA, 2010) in New York (using 45%
Kg

Ternary Combination Concretes Using GGBS, Fly Ash & Limestone: Strength, Permeation & Durability Properties
Chapter 1: Introduction
7
GGBS) and a 40% GGBS binary mix being used for a new Eco Office in Atlanta (PCA, 2010). An
elementary school in Hanover, Pennsylvania opened in 2003 (PCA, 2010). The structure utilised
a 60% GGBS binary mix to produce insulating concrete forms. In the UK the use of GGBS as an
addition at a level of 90% with Portland cement has been adopted. Due to its low heat
properties and its low strength gain this was used in the cement grout for the encapsulation
process, in the decommissioning of Sellafield nuclear power plant (Hanson, 2010). Other
examples of GGBS being used as a binary addition include the QE2 Bridge on the M25 at
Dartford and the construction of the Channel Tunnel rail link, both adopting 70% GGBS to
protect steel reinforcement by minimising the ingress of Chloride from de-icing salts (Hanson,
2010). A blend of 50% GGBS was used for sea defences at Blackpool beach for their durability
and environmental benefits (Hanson, 2010).
The use of ternary blended concretes are less widely reported, yet were recognised in
Australia as early as 1966 by Specified Concrete Pty Ltd in Wollongong, NSW (Hinczak & Roper,
1990: Hinczak et al, 1992) and accepted for industrial use in 1967. In more recent years, ternary
mixes have been used for a number of large civil engineering projects. In Honk Kong the Tsa Ma
Bridge, spanning nearly 2200m, utilised GGBS and silica fume, as well as fly ash and silica fume
ternary blends, as they gave lowest chloride penetration values when tested in the laboratory
(Elkem, 2001). Fly ash and silica fume have been used as ternary blends in other high profile
structures including the Burj Dubai (Baker, 2007), the Pacific First Centre, USA (Shah, 1994) and
the Petronas Twin Towers, Malaysia (Rivera-Villarreal, 1997). Construction of the Reliant NFL
Stadium in Houston, Texas, completed in 2002 used a ternary mix of 50% CEM I + 30% GGBS +
20% fly ash.
The adoption of both GGBS and fly ash, with their many noted benefits has increased
globally due to pressures placed on the industry. 1996 figures produced by Detweiler et al
(1996) stated that in the UK production of GGBS was in the region of 4 million tonnes with
100% of it being used by the construction industry, reducing CO2 emissions and waste going to
landfill. Current figures from the Cementitious Slag Makers Association (CSMA) indicate this
quantity has considerably reduced to 1.5 million tonnes (Higgins, 2011) with 100% still being
used in concrete. This decline, undoubtedly due to the recession and lower production rates,
clearly implies a limited supply of a useful material. By creating ternary blended concretes by
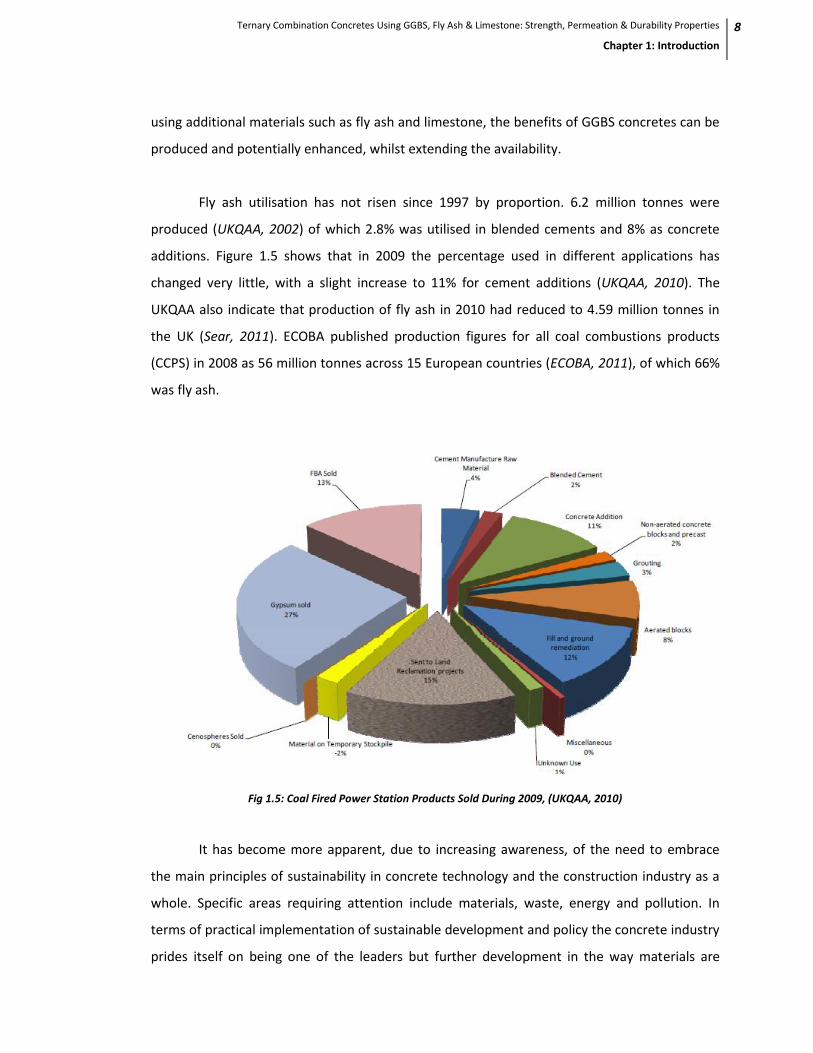
Ternary Combination Concretes Using GGBS, Fly Ash & Limestone: Strength, Permeation & Durability Properties
Chapter 1: Introduction
8
using additional materials such as fly ash and limestone, the benefits of GGBS concretes can be
produced and potentially enhanced, whilst extending the availability.
Fly ash utilisation has not risen since 1997 by proportion. 6.2 million tonnes were
produced (UKQAA, 2002) of which 2.8% was utilised in blended cements and 8% as concrete
additions. Figure 1.5 shows that in 2009 the percentage used in different applications has
changed very little, with a slight increase to 11% for cement additions (UKQAA, 2010). The
UKQAA also indicate that production of fly ash in 2010 had reduced to 4.59 million tonnes in
the UK (Sear, 2011). ECOBA published production figures for all coal combustions products
(CCPS) in 2008 as 56 million tonnes across 15 European countries (ECOBA, 2011), of which 66%
was fly ash.
Fig 1.5: Coal Fired Power Station Products Sold During 2009, (UKQAA, 2010)
It has become more apparent, due to increasing awareness, of the need to embrace
the main principles of sustainability in concrete technology and the construction industry as a
whole. Specific areas requiring attention include materials, waste, energy and pollution. In
terms of practical implementation of sustainable development and policy the concrete industry
prides itself on being one of the leaders but further development in the way materials are

Ternary Combination Concretes Using GGBS, Fly Ash & Limestone: Strength, Permeation & Durability Properties
Chapter 1: Introduction
9
produced and used, including their life-cycle, remains essential for further progress in this area
(Concrete Society, 2009). Therefore, there is a clear need to establish what can be achieved
with the wider range of materials available in order that they can be fully exploited from both
technical and commercial points of view, while at the same time establishing procedures that
promote sustainability.
Combining materials such as GGBS and fly ash with cement not only has the potential
for reducing the environmental impact of cement but reduces water requirements for equal
workability and brings additional benefits such as increasing strength and durability. Progress
has been made in this area with the development of new European cement and concrete
standards (BS EN 197-1, BS EN 206-1 and BS EN 151671-1) which provide a framework for
engineers to appropriately use the materials for a given set of conditions. These are however,
conservative out of necessity and are limited in the extent that they permit the use and
combination of these materials that are arguably being underexploited. Furthermore, while
some work has attempted to examine different cement combinations and they have been used
in a few projects, this has been to a very limited extent. To date, research has investigated
specific properties such as strength, permeation or durability but as yet there has not been a
holistic approach to examining the properties of ternary combinations with regard to the
effects that they may bring to concrete. It is therefore the purpose of this study to investigate
the behaviour of cement combinations and their influences on (i) the physical properties of the
cement paste phase (ii) specific issues associated with concrete performance and (iii) how
these may be balanced with environmental impact. As part of a wide-ranging study the focus of
this research was on the effects of cement combinations based on CEM I/GGBS with fly ash or
limestone replacing GGBS by mass, to give ternary combinations. Blended concretes generally
refer to those whose dry materials are blended prior to mixing. This study uses binary and
ternary materials that are combined together during the mixing process and will be referred to
as combined, or combination, concretes for the purpose of this thesis.
1.2 Aims & Objectives
The aim of the research project was to determine the effects of cement combinations
on the macro- and micro- structural properties of the cement paste phase and their influence
on aspects of concrete performance.

Ternary Combination Concretes Using GGBS, Fly Ash & Limestone: Strength, Permeation & Durability Properties
Chapter 1: Introduction
10
To meet this aim, a series of specific objectives were established as follows:
1. Physically and chemically characterise the range of materials to be used. Thereafter
formulate cement combinations and examine their impact on water demand, SP
dosage and rheology characteristics of cement paste.
2. Determine the fresh and early properties of concrete combinations and the effects of
cement additions on admixture demand.
3. Investigate the impact of cement combinations on the cement paste structure, using
selected methods identified from the literature review.
4. Identify cement combinations giving optimum characteristics with cement paste and
examine their impact on the permeation characteristics including the microstructure
(low, medium and high w/c ratio) in concretes.
5. Test the concretes to determine an optimum combination with respect to aspects of
durability. Specifically examining the concretes in terms of their resistance to both
carbonation and chloride ingress, thus establishing the benefits and limitations of using
combined materials to produce ternary mixes.
6. Examine the cement combination concretes with regard to their influence on ECO2 and
consider balancing sustainability and aspects of concrete performance.
1.3 Scope of the Study
The use of additions has been a well-researched topic for many years and the benefits
of the materials used in this study as binary additions are well established. It is widely
recognised that GGBS and fly ash both increase strength over time, it can also give enhanced
permeation properties. However, it is also known that these materials have slow early strength
development and poor resistance to carbonation, thus restricting their use in some
circumstances. Whilst there is a basic understanding of the effects of these materials
individually in binary concretes, limited knowledge exists as to the effects of combining GGBS
with fly ash or limestone to create ternary concretes.
Combining materials such as these will create different effects within the cement paste
phase that influences the properties, compared to those of binary concretes. With the addition
of fly ash, competition between this and GGBS, for free lime within concrete may influence

Ternary Combination Concretes Using GGBS, Fly Ash & Limestone: Strength, Permeation & Durability Properties
Chapter 1: Introduction
11
strength development and other properties. The inclusion of limestone, considered to be an
inert filler, may improve early strength as a denser microstructure is produced or it may act as a
catalyst for the hydration of GGBS. Bearing this in mind, a number of ternary concretes were
established to examine these effects and their influence on properties such as strength and
durability. Specifically of interest was whether the addition of a ternary material would
improve the early strength development of the concretes tested and also give improved
resistance to carbonation.
Initially a number of standard material characterisation tests, to contribute to the
understanding of how these may affect the properties tested in paste and concretes were
carried out. Tests on cement paste combinations in order to investigate their developing
properties and structure were also made. These included setting times; indicating the effects of
the additional materials on the retardation acceleration of setting paste and also mercury
intrusion porosimetry (MIP) in order to examine the effects of the materials on the porosity
and critical pore diameter with the different materials. It is suggested that water will flow
through the larger capillary pores more easily than the smaller gel pores (Neville, 1995) and the
size of the pores can be affected by the w/c ratio (Mehta & Monteiro, 2006). Both concrete and
paste samples were cured under the same conditions at 20oC (± 1oC) and removed after a
specific number of days (3, 7, 28 days etc) to test strength, permeation and durability
properties.
It was decided early on during the development of the experimental programme to test
all combinations in concrete at 0.35, 0.5 and 0.65 w/c ratios, to cover those typical ranged in
standards and the literature reviewed, with a fixed water content of 165 l/m3, providing a
range of strengths. For the cement paste phase 0.35 and 0.5w/c ratios were tested. The 0.65
w/c ratio was excluded from this due to likely problems with excessive bleeding of water from
the samples and instability.
The range of tests carried out was based on a number of British Standards, American
Society for Testing and Materials (ASTM) methods and tests that had been adopted in the
literature reviewed. As these are well established, this enabled comparison with related
studies, with information on their precision generally known. Fresh properties, plastic density

Ternary Combination Concretes Using GGBS, Fly Ash & Limestone: Strength, Permeation & Durability Properties
Chapter 1: Introduction
12
and slump, were tested as a matter of standard practice during casting of the concrete
samples. For the paste samples standard consistency of the combinations was undertaken in
order to determine their influence on water requirements and allow for calculation of packing
density of each paste combination by using the De Larrad model.
Concretes were tested in order to examine the influence of the ternary materials on
the strength, permeation and durability properties. Permeation tests carried out included initial
surface absorption and sorptivity tests that required no pressure being applied to force the
liquid into the concrete. Air pressure and water penetration under pressure tests were also
carried out. Durability of the concretes was examined by accelerated carbonation and rapid
chloride penetration tests.
It was also in the scope of this study to examine how the ternary concretes can
influence environmental impact. This was carried out by making comparisons of calculated
embodied CO2 (ECO2) for each of the concrete mixes, based per tonne of production, with the
various properties of the concretes measured.
1.4 Outline of Thesis
Whilst this initial chapter has provided an introduction and a basic overview of the
pressures facing the global industry to provide context to the research carried out, subsequent
chapters will cover greater detail of specific elements of the research.
Chapter 2 will essentially consider previous studies of binary and ternary blended
cements and illustrate the current understanding of the properties of the materials used within
the cement combinations of interest. Whilst the benefits of using each material will be
discussed it will be made evident from this chapter the limited number of studies carried out
on ternary mixes combining GGBS with fly ash or limestone.
Chapter 3 provides a detailed account of the materials and sample preparation
together with the test methodology used during the experimental phases for both paste and
concrete, referring to relevant standards and sources where applicable. Subsequent chapters
then review the results from these tests.

Ternary Combination Concretes Using GGBS, Fly Ash & Limestone: Strength, Permeation & Durability Properties
Chapter 1: Introduction
13
Chapter 4 examines the fresh properties of both the cement pastes and the concrete
mixes, looking at the setting time, viscometery and the effects of the materials on
superplasticiser dosage. This chapter also examines the early strength gain of the concrete
mixes.
Chapter 5 examines strength development discussing the effects of each material, up
to 180 days. Data obtained from the strength tests was used to consider binder cementing
efficiency and the required w/c ratio for each combination to attain an equivalent strength of
40 N/mm2 at 28 days is also determined and discussed. This chapter also examines the effects
of void ratio of concrete on the resulting properties.
With the strength of the concretes discussed, Chapter 6 moves on to investigate the
permeation process, covering initial surface absorption and sorptivity. The effects of the
various cement combination concretes on these properties are quantified. The influence of
strength and critical pore size on these properties is also discussed. The air permeability and
water penetration under pressure tests are discussed in Chapter 7.
The results of the accelerated carbonation tests and rapid chloride tests on selected
concrete mixes are discussed in Chapter 8.
Chapter 9 discusses the impact of cement production at greater length whilst
examining the embodied CO2 (ECO2) of all the concretes and their ability to reduce these levels
and associated effects on strength and durability. The basic material costs of concrete
production in an on-site context will also be discussed.
Chapter 10 presents the overall conclusions from this study and summarises the
practical implications of using ternary cement combination concrete in a global construction
industry. It will also make recommendations for future research in this area.

Ternary Combination Concretes Using GGBS, Fly Ash & Limestone: Strength, Permeation & Durability Properties
Chapter 2: Literature Review
14
CHAPTER TWO: LITERATURE REVIEW
2.1 Introduction
Despite a continuing growth in studies of blended cements, the focus of these is mainly
dominated by binary cements, i.e. Portland cement with a single addition, either fly ash or
ground granulated glass blast-furnace slag (GGBS). A comprehensive search of the literature
found that there continues to be little coverage on the effects, and indeed the benefits, of
ternary blended cements. Regardless, however, of this lack of evidence the use of blended
cements is not a new chapter in the history of the cement due to increasing pressures to be
sustainable. Bukki (1986) reports that blended cements were used in Italy as early as 1929.
Many authors have reported on the effects of binary cements and whilst these
materials are becoming more wide and varied with the use of “by product” materials having
increased (Massazzi, 1987) it are the effects of GGBS that are the focus of this study, more
specifically its use within ternary blended cement with either fly ash or limestone. There have
also been limited studies on ternary cements but there is little evidence of comprehensive
studies combining fresh engineering and durability property tests. Given that all aspects of the
service environment must be considered when designing a concrete (Mehta, 1989), this is
needed if these materials are to be included in standards and find wider acceptance (Hendricks,
2005).
This chapter will begin by briefly examining the hydration and reaction characteristics
of the materials together with the influence of the materials used, on the properties of the
concrete in this study, before reviewing their coverage within British and European standards.
A summary of the effects of binary blended cements with Portland cement and GGBS as the
main constituents are also included. Given that ternary cements incorporating fly ash and
limestone as the third cementitious addition is the main focus of this study, these too will be
covered where possible (with the limited studies available).

Ternary Combination Concretes Using GGBS, Fly Ash & Limestone: Strength, Permeation & Durability Properties
Chapter 2: Literature Review
15
2.2 Influence of Different Additions of the Properties of Concrete
2.2.1 GGBS
The first commercial use of slag-lime cement was in Germany in 1865 following the
discovery of its latent hydraulic properties in 1862 by Emil Lang (Bijen 1996). Its use has been
on the rise for over 40 years (Massazzi, 1987) with slag cement being produced in many
European countries (Detweiler et al, 1996). The production and utilisation of GGBS for a
number of countries is reported by Mehta in Detweiler et al (1996) and is summarised in Table
2.1.
Table 2.1: The production and utilisation of GGBS globally [Source: Mehta, 1989 in Detweiler et al (1996)]
Country
Production
(million tonnes)
Utilisation
(million tonnes)
UK 4.0 4.0
USA 13.0 1.0
Canada 2.9 2.0
China 22.0 16.0
France 10.4 1.9
Germany 15.0 2.8
South Africa 1.5 0.6
India 7.8 2.8
Japan 24.0 8.2
Chemically GGBS is a mixture of lime, silica and alumina and is of similar oxide
composition as Portland cement (PC) but in different proportions (Civil & Marine, 1993). These
differences in proportions are shown in Table 2.2 where the figures were adapted from ACI 226
(1987) and include the typical oxide composition for GGBS from Civil & Marine (1993). As with
many materials the oxide composition of GGBS can vary. Table 2.3 summarises the composition
of GGBS found within the literature (these provide an overview from 1992 to 2008 and are
indicative of changes that have occurred).

Ternary Combination Concretes Using GGBS, Fly Ash & Limestone: Strength, Permeation & Durability Properties
Chapter 2: Literature Review
16
Table 2.2: Typical oxide composition of GGBS [Source: ACI 226 (1987), Civil & Marine, (1993)]
Composition (%by Mass)
Oxide ACI, 1987
Civil & Marine,
1993
SiO2 32-40 35
Al2O3 7-17 11
FeO3 0.1-1.5 1
CaO 29-42 41
MgO 8-19 −
SO3 0.7-2.2 −
Table 2.3: Oxide composition of GGBS found within literature
Chemical
composition, (%) Sivasundaram &
Malhotra (1992)
Lane &
Ozyildirim
(1999)
Bleszynski et
al (2002)
Khatib &
Hibbert
(2005)
Sharfuddin
et al (2008)
SiO2 38 37.6 35.28 36 34.1
Al2O3 6.63 3.3 9.71 9 13.2
Fe2O3 0.4 0.4 0.56 1 0.7
CaO 35.7 17.6 40.47 43 41.8
MgO 13.6 11.2 8.76 7 6.3
SO3 − 1.94 3.79 - 2.4
Influences of Fresh Properties
The presence of GGBS in a concrete mix improves workability making the mix cohesive
yet mobile (Day 1999). This is aided by the GGBS, whilst its fineness can be similar to that of PC
it is less dense, which can allow more coarse aggregate to be used reducing the cohesiveness of
the mix thus improving the workability. The cohesiveness is reduced due to the lower water
demand caused by better dispersion of the cement by the smoother GGBS; with Day (1999)
referring to GGBS as having a glassy surface that reduces water demands. Tattersall (1991)
found that the surface texture affects water demand. A higher GGBS content gives further
improvements (Meusel & Rose, 1983) and allows reduced water contents (Stutterheim 1968, in
Detweiler et al, 1996). Roy et al (1982) reported that these effects were less than those found
in fly ash blended cements. The previously discussed slower reactivity is also indicated by an
increase in setting time which is extended with greater GGBS content (Sivasundaran &

Ternary Combination Concretes Using GGBS, Fly Ash & Limestone: Strength, Permeation & Durability Properties
Chapter 2: Literature Review
17
Malhotra 1992). It is suggested that this increase is in the region of 10 to 20 minutes for each
10% addition of GGBS (Hogan & Meusel, 1991).
Previous research has indicated that the early stages of development of compressive
strength of concrete containing a mix of PC and GGBS can be lower than a PC concrete control
depending on how they are proportioned (Wimpenny et al 1989). Mehta (1986) implied that
this is generic of pozzolanic cements as they are slower to develop strength than Portland
cements, more noticeably so in colder climates (Nepper-Christensen, 1979). Chern and Chan
(1989) believe that this can be overcome by varying the proportion of PC and GGBS and whilst
the rate of strength development is lower with higher GGBS levels strength is gained at later
stages and can exceed that of the control PC concrete beyond 28 days (Hogan & Meusel 1981).
Increasing the GGBS level of cement by 30-50% by mass can increase the strength of the
concrete from 7 days (Meusel & Rose, 1983). Elahi et al’s (2010) more recent study found that a
50% GGBS binary mix was comparative to the CEM I control mix at 28 days, at the early age
strengths it was 74% of the CEM I strength at 3 days, increasing to 95% at 7 days. By increasing
the GGBS level to 70% the strength decreases considerably to 74% of the CEM I mix at 28 days.
Elahi et al also test fly ash mixes at 20 and 40% levels. The 20% level gave better strength
results than the 50% GGBS level only at 3 and 7 day testing, at 28 days the strength of the 20%
fly ash mix is considerably less than the 50% GGBS.
2.2.3 Fly Ash
As with GGBS the use of fly ash to form blended cements has been carried out for
many years and brings several benefits to concrete such as workability enhancement, durability
and strength (Detweiler et al, 1996). Fly ash is an industrial by-product derived from the
exhaust gases of coal-fired power stations. Given the global extent of such power stations the
availability of fly ash is extensive and whilst many countries are realising the potential of fly ash
in concrete others are still sending most of it to landfill. Alonso & Wesche (1992) reported on
the global production and utilisation of fly ash in 1992 and this has been summarised in Table
2.4. Since then production in the UK reduced to approximately 6.2 million tonnes (UKQAA,
2002) in 1997 and currently stands at 4.59 million tonnes for 2010 (Sear, 2011). Figure 2.1

Ternary Combination Concretes Using GGBS, Fly Ash & Limestone: Strength, Permeation & Durability Properties
Chapter 2: Literature Review
18
indicates the percentage of use within the construction industry across Europe based on the
most recently available production figures from ECOBA for Europe.
Table 2.4: The global production and utilisation of fly ash [Source: Alonso & Wesche, 1992]
1992
Country
Production
(million
tonnes)
Utilisation
(million
tonnes)
UK 10.4 5.9
USA 38.3 8.0
Canada 3.2 1.1
China 41.0 9.5
France 2.2 1.3
Germany 2.9 2.2
South Africa 10.4 0.6
India 39.0 1.2
Japan 3.3 0.9
Detweiler et al (1996) report that between 1977 and 1996 the use of fly ash in concrete
tripled but significant quantities are still disposed of. This low use of fly ash is mainly due to its
low quality and composition which can make it unsuitable to be blended with cements. Ashes
from some plants in India have high carbon content; ASTM C 618 states that fly ash for
concrete should not exceed 5.0% of carbon. Given that loss of ignition (LOI) tests are stated to
indicate carbon content (Neville, 1995) BS EN 450-1 (2005) is the current standard and specifies
this upper limit in the UK to be 7.0%. These standards, however, include different categories of
fly ash. Category A has an LOI of less than 5% whilst Category B has a range of 2-7% which is
permitted for use within the UK as it lies within the upper limit specified in BS EN 450-1 of 7%.
Category C therefore is not permitted for use in concrete as it has an LOI range of 4-9%. The
chemical composition of fly ash is different to that of both GGBS and Portland cement. Table
2.5 shows a summary of the oxide composition of fly ash found within the literature. For low
lime fly ashes there is a requirement for the combined SiO2, Al2O3 and Fe2O3 to be greater than
70%.

Ternary Combination Concretes Using GGBS, Fly Ash & Limestone: Strength, Permeation & Durability Properties
Chapter 2: Literature Review
19
Fig 2.1: Utilisation in the construction industry and mining in Europe in 2008 – 17.6 million tonne used. (ECOBA, 2011)
Table 2.5: Oxide composition of fly ash found within literature
Chemical
composition, (%) Shehata et
al (1999)
Hasssan et
al (2000)
McCarthy
et al
(2001)
Long et al
(2005)
Eliha et al
(2010)
SiO2 41.96 49.9 41.3 57.6 50.7
Al2O3 19.64 26.5 40.7 30.8 28.8
Fe2O3 20.07 8.1 5 5.8 8.8
CaO 5.57 1.7 2.5 3 2.38
MgO 1.19 1.3 0.5 1.5 1.39
SO3 0.95 0.9 0.2 1.3 2.4
The spherical particles of fly ash can assist in reducing the water requirement resulting
in a more cohesive mix this is further supported by the work of Long et al, (2005). Long et al
(2005) also report on the influence of fly ash on the workability as well as the strength and
durability of the concrete. Hassan et al (2000) studied the strength of a variety of mixes with fly
ash and found that until 28 days the strength of a 30% fly ash blended cements were lower
than the Portland cement control mix, but matched at 28 days before exceeding the strength of

Ternary Combination Concretes Using GGBS, Fly Ash & Limestone: Strength, Permeation & Durability Properties
Chapter 2: Literature Review
20
ordinary Portland cement. This depends on how mixes are proportioned and the water cement
ratio required to achieve certain strengths. Elahi et al (2010) however, found that fly ash binary
mixes were markedly lower in compressive strength than the Portland cement mixes at 28
days. A 20% fly ash binary concrete was 74% of the CEM I control mix while a 40% fly ash binary
concrete had only 58% of the strength of the Portland cement control. There is limited
information on the use of fly ash, combined with GGBS, in ternary cement combination
concretes.
2.2.4 Limestone
It was assumed until the 1980’s that limestone was an inert filler within concrete
(Ramezanianpour et al, 2009). Studies subsequently found that limestone has several effects.
Ramachandran & Zhang (1986) observed that the addition of CaCO3 from limestone accelerates
hydration of Portland cement by providing nucleation sites and this effect on the structure of
the hydrated cement paste can be beneficial. It was also found that limestone becomes
incorporated into the C-S-H phase, affecting the structure of the hydrated cement paste
(Ramachandran, 1984). Within the Portland cement composition 5% limestone is permitted by
European standards (BS EN 197-1, 2000) as a minor addition constituent (MAC) as well as
American publications (ASTM C 150-04) quantities above this level gives Portland limestone
cements containing 6-35% limestone.
Following a study in 1996, Nehdi et al found that the benefits of using fillers such as
limestone is mainly to improve the cost effectiveness of cement (Nehdi et al 1996) yet in a later
study it was shown that the workability and stability of fresh concrete were also improved
(Nehdi et al 1998) with these fitting between the cement grains, reducing the space for water
and thus decreasing water demand and increasing plasticiser efficiency (Gallias, 2000). A study
into the effects of limestone additions by Brookbanks (1989) considered introducing limestone
in the range of 5-28% to a cement blend. It was concluded that the water demand was only
marginally reduced with increasing filler content, with no difference in water demand at the 5%
filler level.

Ternary Combination Concretes Using GGBS, Fly Ash & Limestone: Strength, Permeation & Durability Properties
Chapter 2: Literature Review
21
A greater increase in the limestone content was found to reduce the water demand,
CEM I gave a water demand of 26%, by replacing 35% with limestone the water demand was
reduced to 22.8% (Tsivilis et al, 2002) confirming Vuk et al’s (2001) study that found a 5%
increases in limestone decreased water demand for a standard consistency by 0.5. Both
authors discuss the fineness of limestone as an important factor affecting water demand
stating that higher fineness reduces water demand. The addition of limestone to the cement
mix does not replicate the improvements to compressive strength found with both GGBS and
fly ash. A 10% addition does not show noticeable reductions (Tsivilis et al, 2002 and
Ramezanianpour et al, 2009) when compared to the CEM I mix. However as greater volumes of
limestone are added more significant decreases in strength are seen, as much as 23 N/mm3 at
28 days for 35% limestone level. Again the effects of fineness were seen; finer limestone
increased the strength for each of the test ages. Tsivilis et al, (2002) compare makes of CEM I to
limestone binary mixes with additions of 10, 20 and 35% all material was ground for 38, 42, 52
and 60 minutes thus increasing the fineness of each material.
A number of studies have been carried out on the permeability of limestone cements.
Tsivilis et al (1999) concluded that limestone additions can improve the permeation properties
of concrete with the mean pore size of concrete specifically affecting sorptivity and gas
permeability (Tsivilis et al, 1999). A subsequent study confirmed this and found that water
permeability also improved with limestone content and it was also concluded that a limestone
content of 15% did not affect porosity (Tsivilis et al, 2003). Pipilikaki & Beazi-Katsioti (2009)
studied the porosity and particle size distribution of limestone Portland cements using mercury
intrusion porosity (MIP) and concluded that limestone changes the pore structure, increasing
the capillary pore size from 20nm to 40nm when a 30% limestone level was used, this being the
maximum permitted by BS EN 197-1.
2.3 Hydration & Reaction Characteristics of Cement & Cement Additions
2.3.1 Portland Cement
Due to the importance, and indeed the complexity of hydration of cement and the
reaction of additions, it would be prudent to examine this process separately so as to
understand the basic principles involved.

Ternary Combination Concretes Using GGBS, Fly Ash & Limestone: Strength, Permeation & Durability Properties
Chapter 2: Literature Review
22
Hydration occurs when water is added to cementitious materials and involves a series
of irreversible chemical reactions, during which cement paste sets and hardens (Taylor et al,
2006). It is the mineral compounds, specifically the silicates and aluminates, that react with the
water to form hydrates (Neville & Brooks, 2007). Mehta & Montiero proposed two mechanisms
of hydration. During the early stages through solution hydration occurs involving the
dissolution of anhydrous compounds into their ionic constituents. Hydrates are said to form in
the solution and the reorganisation of these constituents also occurs. When this ionic mobility
becomes restricted topochemical, or solid state, hydration takes place at the surface of the
anhydrous cement, aiding in the hydration of the residual cement particles.
For hydration to occur, however, it is the compounds of the materials that are key.
Tricalcium silicate (C3S) is the most prevalent mineral in Portland cement and contributes to
most of the early strength development with the formation of portlandite and C-S-H gel.
[Eq 2.1]
Dicalcium silicate (C2S) is also present in the cement and its hydration results in the same
products but with the relative amount of Ca(OH)2 being less. Its rate of hydration is slower than
C3S as it is less soluble and whilst its contribution to early strength is minimal, it does contribute
significantly to later strength.
[Eq 2.2]
The aluminates are faster to react than the silicates, despite being lower in content in Portland
cement. C3A is more soluble than C3S, and reacts almost immediately despite being more
complex and involving a number of reactions that need to take place (Taylor et al,
2006).Calcium aluminate hydrates form with an initial, rapid reaction that can release large

Ternary Combination Concretes Using GGBS, Fly Ash & Limestone: Strength, Permeation & Durability Properties
Chapter 2: Literature Review
23
amounts of heat and result in the setting of the cement paste within minutes, referred to as a
flash set (Neville & Brooks, 2007), reducing the workability of the concrete drastically.
[Eq 2.3]
In order to prevent flash setting, however, gypsum (CSH2) is added during the production of
cement. It is also highly soluble and releases calcium and sulfate into the pore solution, a
different reaction occurs when combined with the C3A with the hydration product ettringite
being formed.
[Eq 2.4]
As there is insufficient gypsum to react with all of the C3A, the resulting ettringite reacts with
the remaining C3A to form monosulfoaluminates, particularly if more than 5% C3A is present in
the Portland cement.
[Eq 2.5]
Neville & Brooks (2007) use a simple schematic representation of the hydration process (Figure
2.2), whilst Taylor et al (2006) break the process down into five stages related to the heat
development during hydration. As stated by Way & Lee (2010), hydration is an exothermic
process that is indicative of many chemical reactions. Given that cement is a heterogeneous
mix of compounds, the hydration process itself consists of a number of reactions occurring
simultaneously, albeit at different rates that are made even more complex with the inclusion of
additional materials.

Ternary Combination Concretes Using GGBS, Fly Ash & Limestone: Strength, Permeation & Durability Properties
Chapter 2: Literature Review
24
Fig 2.2: Schematic representation of cement hydration (Neville & Brooks, 2007 p14)
2.3.2 GGBS
In respect of GGBS the reaction or hydration occurs initially due to the presence of lime
[Ca(OH)2] that has been freed by the hydration of Portland cement:
[Eq 2.6]
Gao et al (2005) state that the reaction of GGBS starts at an early age and involves the
consumption of Ca(OH)2. The fineness of GGBS tends to be slightly higher than that of PC and
whilst its performance in concrete as a blend is similar to that of a PC-fly ash cement, the
reaction process differs in that initially these are slow due to the dependency of the breakdown
of glass by hydroxyl ions released during the hydration of PC. Hydration of C3S in PC is delayed
in the first instance, but accelerated during the later ages (Ogawa et al, 1980). Miura & Iwaki
(2000) and Aldea et al (2000) suggest that the reaction of GGBS with Portland cement involves
a two-stage reaction. The first and predominant reaction is with alkali hydroxide, and those
that follow allow for a long-term gain in strength (Hogan & Meusel, 1991). The rate of

Ternary Combination Concretes Using GGBS, Fly Ash & Limestone: Strength, Permeation & Durability Properties
Chapter 2: Literature Review
25
hydration is therefore dependent on its glass content (Tanaka et al 1983) and chemical and
physical properties (Roy & Idorn, 1982).
Li et al (2003) state that the hydration rate of GGBS and fly ash combined is greater
than fly ash alone, indicated by a lack of hydrated fly ash particles at seven days by SEM. Whilst
Swamy & Boukni indicated that GGBS was slower to react, Li et al showed that when
incorporated with fly ash, the rate of hydration increased at an early age (Swamy & Boukni,
2000; Li et al, 2003). A secondary calcium silicates compound is produced when the GGBS
reacts with the Ca(OH)2, this together with the ettringite and remaining Ca(OH)2 act as
nucleation sites, leading to an increase in the hydration rate of fly ash. The GGBS also releases
OH- ions and alkalis into the pore solution, aiding in the break-down of the glass phase of fly
ash, by reacting with the SiO2. The pozzolanic reaction of the fly ash, as with the reaction of
GGBS, reduces the content of Ca(OH)2 but according to Voglis et al (2005), the fly ash may
contribute to the formation of C2AH8 due to the release of Al2O3.
A more recent study by Narmluk & Nawa (2011), states that the inclusion of fly ash has
a diluting effect on the hydration of cement. This is in addition to a physical effect at an early
age and a chemical effect. Hydration only take places in water filled capillaries and a loss
through evaporation can occur if not prevented (Neville & Brooks, 2007). The dilution effect
suggests that the fly ash increases the effective w/c ratio, resulting in enhanced long-term
hydration due to increased water availability within these capillaries. The physical effect of fly
ash discussed by Narmluk & Nawa refers to the retardation related to the condition of the
surface of the fly ash which is referred to in a number of other studies (Ogawa et al, 1980;
Rahhal & Talero, 2004). Interestingly Narmluk & Nawa contradict this and state that there is
also a physical acceleration effect, as its surface provides additional nucleation sites. The
chemical effect of fly ash has already been indicated by the consumption of Ca(OH)2 by this and
GGBS, resulting in a lower concentration, which would aid in the acceleration of the dissolution
of Ca2+.

Ternary Combination Concretes Using GGBS, Fly Ash & Limestone: Strength, Permeation & Durability Properties
Chapter 2: Literature Review
26
2.4 Coverage of Cement Additions in BS EN 197-1 and BS EN 206/ BS 8500
In the mid 1970’s up to 20 different cements were being utilised across the EEC and by
the 1990’s this number had increased to over 50, following an enquiry by the CEN/TC51(the
technical committee responsible for preparing cement standards). The cements being used
were dependent on the source of raw materials, different climate and building techniques
being used across Europe and due to its flexibility similar cements could be applied to different
structures that create differing requirements placed on its performance in specific
environments, for example coastal locations.
Due to the vast number of cements being used it became necessary to ‘separate the
common cements’ from ‘special cements’ that were to be evaluated in accordance with further
British Standards such as the BS EN 196 series. The Committee’s work in evaluating these
cements led to the BS EN 197 series of standards “Cement – Composition, specification and
conformity criteria” that include common cements (Part 1), conformity evaluation (Part 2), low
heat common cements (Part 3) and sulphate-resisting cements (Part 4). This review focuses on
BS EN 197-1.
BS EN 197-1 defines “27 common cements and their constituents” specifying the
composition, requirements and conformity criteria for common cements which also includes
cements with low heat of hydration following an amendment in 2004. The “constituents”
outlined in this standards may fall into two categories; main constituents that will exceed 5% by
mass and minor additional constituents that will not exceed 5% by mass. To clarify, the
materials defined as constituents in BS EN 197-1 are referred to as “additions” by BS EN 206-1.
The former standard defines the proportion of each constituent over a range of six strength
classes, stating that each must meet a number of requirements (in accordance with the BS EN
196 series) including mechanical, physical and chemical, and covers five main cement types
from CEM I (Portland cement) to CEM V (composite cement). Each cement type is notated to
indicate, in addition to cement type, the proportion of cement clinker, a second main
constituent, standard strength class and the rate of early strength gain.

Ternary Combination Concretes Using GGBS, Fly Ash & Limestone: Strength, Permeation & Durability Properties
Chapter 2: Literature Review
27
Table 2.6: The 27 products in the family of common cements from BS EN 197-1

Ternary Combination Concretes Using GGBS, Fly Ash & Limestone: Strength, Permeation & Durability Properties
Chapter 2: Literature Review
28
The five types of cement are summarised in Table 2.6, extracted from BS EN 197-1. In
addition to Portland cement clinker (K) the other main constituents covered by the standard
include GGBS (S), natural and natural calcined pozzolana (P/Q) covering metakaolin, siliceous
and calcareous fly ash (V/W), limestone (L/LL) and silica fume (D). The standard also includes
burnt shale (T). The same materials may also be regarded as “minor additional constituents” if
their mass in cement does not exceed 5%.
As previously stated BS EN 206-1 specifically defines additions in Section 3.1.23 as
“finely divided inorganic material used in concrete in order to improve certain properties or to
achieve special properties” and further refers to two types of addition; Type 1, nearly inert and
Type II, pozzolanic or latent hydraulic. BS EN 206-1 states that both Type I and II additions may
be used in concrete in quantities, as per the initial tests outlined in Annex A of the standard.
The standards are also referred to for calculating water/cement ratio. BS EN 206-1
contains specific references to fly ash and silica fume and permits other procedures if their
suitability can be established. This standard also refers to combinations and defines a
combination as follows:
“Restricted range of Portland cements and additions which, having been
combined in the concrete mixer, count fully towards the cement content and
water/cement ratio in concrete.” (BS 8500 Section 3.1.2)
The restricted range of combinations included in BS EN 197-1, it incorporates CEM I
cements of standard strength class 42.5 or more with fly ash (to BS EN 450-1), GGBS (to BS
6699), limestone (to BS 7979) and fly ash (to BS 3892-1). BS 8200-2 Annex A defines the early
stage and 28 day strength that these combinations must fulfil, as well as outlining the range of
combination proportions that can count towards the cement and water/cement ratio. BS 8500
covers restrictions on the type and proportion of additions for use in designed, designated and
standardised prescribed concretes.

Ternary Combination Concretes Using GGBS, Fly Ash & Limestone: Strength, Permeation & Durability Properties
Chapter 2: Literature Review
29
2.5 Particle Packing
It is considered that particle packing is fundamental for strong durable concrete. The
fineness of additions, GGBS, fly ash etc., are not too dissimilar to PC but appear to allow for
better packing and, when these mixes are properly cured, the result is not only improved
strength but also durability (Nehdi & Rahman, 2004). The cement particles are deflocculated,
dispersed by the smaller particles that then fill the voids creating a denser, and therefore
stronger, material. The packing of the concrete particles, or fines, can be equally important as
the aggregate within the concrete structure (Wong & Kwan, 2008). Studies on the particle
packing of concrete systems date back as far as Feret in 1892 (Dhir et al, 2002). Feret studied
the influence of particle size distribution on the properties of concrete from particle packing
and determined that to obtain high quality concrete there should be suitable distribution of
different size particles to achieve maximum packing (Aiquin et al, 1999). This principle was
more recently studied by Nui et al (2002) who concluded that in order to provide high
performance concrete well packed particles are important in order to produce “a mixture that
has a wide size distribution and low void space between their particles…” that will enhance the
microstructure (Nui et al, 2002).
Studies over the years have resulted in a number of models for calculating voids ratio
or particle packing density. Furnas developed a model in 1929 which progressed over time by
Aim & Goff in 1967, Toufar in 1976 and Dewar in 1992. Dhir et al discuss these models in detail
together with the Stoval & de Larrad model who contributed the linear packing (LPM) and
compressible packing models (CPM). The latter was developed in 1999 by De Larrad and is a
refined version of the previous LPM (Jones et al, 2002).
The use of finer materials within the mix design increases the variety of particle sizes.
Silica fume and metakaolin for example, are able to fill spaces between cement particles
creating a denser packing material as illustrated in Figure 2.4 from Taylor (1990). The best
packing occurs with these finer particles filling exactly the void spaces between larger particles.
The fineness of materials and their effects on packing density have led to a number of
studies into the effects on water demand. Wong & Kwan (2008) concluded that the smaller

Ternary Combination Concretes Using GGBS, Fly Ash & Limestone: Strength, Permeation & Durability Properties
Chapter 2: Literature Review
30
finer particles took the place of water in the pore spaces thus reducing the water demand. This
contradicted Stutzman & Centeno’s earlier study in 1995 who found that the higher surface
areas of the finer particles resulted in greater water demand and ultimately lowered the
strength of the concrete. Such contradictions may be the result of different mixing techniques
and the inclusion of superplasticisers as well as the diversity of particle sizes and shapes within
the cement system. Jones et al (2003) reported that finer fillers significantly affect the packing
in mixes using plasticizers and angular fillers can increase the voids ratio in non-plasticized
mixes.
Fig 2.4: a) loosely packed particles; b) denser material
(Source: Taylor, 1990)
2.6 Binary Blended Concretes and Their Properties
2.6.1 Fresh Properties
Taylor & Smith (1988) refer to workability as the most important term relating to fresh
(plastic) concrete. Workability is defined as the property of concrete that determines its ability
to be placed, compacted and finished. Compaction is important since the consequences of
inadequate compaction can be serious (Taylor & Smith, 1988). The addition of slag within a

Ternary Combination Concretes Using GGBS, Fly Ash & Limestone: Strength, Permeation & Durability Properties
Chapter 2: Literature Review
31
concrete blend will produce a higher workability concrete due to its smoother surface texture
(Tattersall, 1991). On a weight-for-weight basis for a given replacement of GGBS, there is an
increase in powder volume because its specific gravity is lower than that of Portland cement.
A GGBS concrete will demand less water for cohesiveness, flow and compaction
characteristics, to that of a CEM I concrete. This reduction in water content for a constant
workability is influenced by the percentage of GGBS and the total cementitious material
content (Sivasundran & Malhotra, 1992) and reduction of the order of 5% can be expected
according to Tattersall (1991). Whilst Day (1999) confirms Tattersall’s findings that it is the
surface texture of the GGBS that affects the water demand, referring specifically to its glassy
surface Day suggests that the water requirement is only slightly changed. Bijen (1996) stated
that there was no significant difference from CEM I concrete in the workability, pumpability
and compactability of the GGBS concrete.
It was previously shown by Sivasundran & Malhotra (1992) that the setting time
increases with GGBS content, indicative of a slower reactivity, confirming the findings of Fulton
(1974). Brooks et al (2000) stress that the setting characteristics of cement mix is important in
the field of construction in order to schedule the stages of construction on site from the
transportation of concrete to the finishing. These characteristics can aid in the decision of
whether or not to use a retarding admixture or accelerator. The setting time of concrete is
affected by a number of factors including water/binder ratio, initial and curing temperatures
and type of admixtures (Ramachandran et al, 1995).
Whilst there is a general consensus that GGBS retards the setting time there have been
contrasting opinions with regard to the effect of silica fume in binary mixes. Khedr & Abou-Zeid
(1994) and Alshamsi et al (1997) both agree that silica fume does effect the setting time, with
retardation increasing with replacement level. These findings dispute an earlier study by Pistelli
et al in 1984 that indicate that there were negligible effects. The influences of metakaolin were
studied in addition to those of silica fume by Brooks et al (2000) and they concluded that both
retarded setting time. Figure 2.5 shows the settings times recorded for three silica fume
concrete mixes, with increasing silica fume volumes, when compared to Portland cement

Ternary Combination Concretes Using GGBS, Fly Ash & Limestone: Strength, Permeation & Durability Properties
Chapter 2: Literature Review
32
(OPC). There was clear indication that both initial and final setting times were extended as the
level of metakaolin, specifically increased.
2.6.2 Strength Development
Wimpenny et al (1989) recorded that the rate of compressive strength development
during the early stages of a concrete mix incorporating GGBS and cement was lower than that
of the control PC samples. Swamy & Boukini however, suggest that proper mix design of GGBS
concretes can produce comparable results by the third day (Swamy & Boukini, 1990). Whilst
again it is the fineness of the material and the mix proportions used in the mix design that
affect the development of strength of concrete (Kokubu et al, 1989 and Sivasundran &
Malhotra, 1992) other factors are also influential, such as the exposure temperature (Chern &
Chan, 1989), water/binder ratio (Swamy & Boukini, 1990) and curing conditions (Austin et al,
1992).
Chern & Chan (1989) indicate that whilst fineness and exposure temperature are
influential, varying the GGBS level can also affect the rate of strength development. Indeed at
higher GGBS levels, the rate of strength development is lower, agreeing with the findings of
Hogan et al (1981). Hogan et al also noted that the gain in strength at later ages exceeded that
of PC alone, when compared beyond 28 days. Babu & Kumar (2000) studied the efficiency of
GGBS in binary concretes (using similar evaluation methods to that of fly ash and silica fume)
with levels of 10-80%. Data from earlier studies focusing on fly ash and silica fume binaries, as
well as GGBS was collated and compared to give a representation of the cements
manufactured at that time (2000). The study confirmed the strength development of previous
research and indicated that an increase of water/cement ratio decreased strength as shown in
Figure 2.6 (Babu & Kumar, 2000).
Muira & Iwaki’s (2000) study reviewed the effects of curing method on the strength
development of GGBS concrete at levels of 50-80% and three different fineness grades. The
overall strength development followed similar trends to previous studies, but it was found that
heat curing of GGBS improved early age strength without compromising that at later ages. This
was not found in GGBS with a greater specific surface area (Muira & Iwaki, 2000). Rapid
hydration at an early stage caused by heat curing, resulting in a poor microstructure of

Ternary Combination Concretes Using GGBS, Fly Ash & Limestone: Strength, Permeation & Durability Properties
Chapter 2: Literature Review
33
hydrated cement paste in the finer GGBS, limiting reactions at later ages. A similar study tested
BRECEM concretes using both water and air curing techniques for GGBS levels of 40, 50 and
60% (Quillin et al, 2001). A later study in 2006 by Barnett et al concluded that it is the reaction
of GGBS that aids strength development and this is more sensitive to temperature than cement
type (Barnett et al, 2006). The results of Barnett et al’s tests on the effects of curing
temperatures are shown in Figure 2.7. Their findings that higher early age temperatures
enhance the strength development of GGBS concrete confirms those of Roy and Idorn (1982).
Fig 2.5: Influence of silica fume on the penetration resistance of concrete
(Source: Brooks et al, 2000)
Fig 2.6: 28 day strength variation with w/CEM I+GGBS ratio (Source: Babu & Kumar, 2003)

Ternary Combination Concretes Using GGBS, Fly Ash & Limestone: Strength, Permeation & Durability Properties
Chapter 2: Literature Review
34
Fig 2.7: Effects of curing temperature on the time to reach 50% of ultimate strength
(Source: Barnett et al, 2006)
2.6.3 Durability
It is important that concretes perform their intended function with regard to strength
and serviceability (Neville, 1995)Given the diverse use of concrete it is fundamental that it must
be able to withstand any number of factors that can affect its rate of deterioration. Not only
does this include the permeation of fluids, but its rate of carbonation and resistance to chloride
which represents the greatest threat to concrete.
Permeation Properties
In order to understand the behaviour of concrete with regards to deterioration that
may occur it is appropriate to consider the transport processes that may be involved in these
processes. Essentially there are four main transport processes: pressure driven flow; diffusion;
electro-migration; thermal migration.

Ternary Combination Concretes Using GGBS, Fly Ash & Limestone: Strength, Permeation & Durability Properties
Chapter 2: Literature Review
35
Pressure Driven Flow: Pressure driven flow, or permeability, as previously discussed, refers to
the rate at which a liquid flows when pressure is applied. In some circumstances this pressure
may be external, whilst in others it may depend on the absorption process itself that can create
pressure differentials. It is likely that water itself and its ability to permeate concrete cause less
significant damage than when chlorides and sulfates are present.
Diffusion: Diffusion refers to the process in which ions pass through saturated concrete
without the flow of water and are driven by a concentration gradient. When a strong solution is
in contact with a weaker one, they will both tend towards an equal concentration. For example
salt will dissolve and create a uniform concentration throughout the water. This same
mechanism will cause any ions present within the pore water of concrete to diffuse out.
Electro-migration: For electro-migration to take place a voltage difference, or electric field,
needs to be present. This can be caused by the electrical potential of pitting corrosion on
reinforcing steel and not necessarily from leakage from an external direct current power
supply. When applied across concrete negative ions will move towards positive electrodes, e.g.
chloride ions will be carried into the concrete or hydroxyl ions out of it.
Thermal Migration: Within concrete, water or ions will move from hot to cold regions at a rate
dependent on the permeability of the material. This is not evaporation which occurs on the
exposed surface of the concrete. If concrete has been contaminated by de-icing salts the salt
saturated water in these surface pores will migrate rapidly into concrete, when it is heated by
sunlight. Once it has entered concrete and begins to cool it is possible that diffusion will occur.
Capillary suction and osmosis: Though essentially transport processes themselves, these can
reduce or increase the rate of the transport process. The former occurs in the fine capillary
pores with wetting surfaces and is caused by surface tension. Concretes with a finer pore
structure can experience greater capillary suction pressures thus increasing absorption.
Capillary suction can be affected by the density, viscosity and surface tension of the liquid
together with the angle of contact and the size of the capillary pores. The roughness of the
concrete surface can influence the angle of contact so a regular test surface is beneficial. The

Ternary Combination Concretes Using GGBS, Fly Ash & Limestone: Strength, Permeation & Durability Properties
Chapter 2: Literature Review
36
capillary pores may also be lined with absorbed water. Oven drying to a constant weight
removes the internal moisture content but too severe drying can also cause micro-cracking.
Ambient conditions may also influence the rate of absorption so it is important to standardise
the conditioning, temperature of water and test conditions as a whole. Dias (2004) studied the
effects of drying on concrete sorptivity and advised that 3 days at 50oC oven drying would
increase the sensitivity of the sorptivity without reducing its “discriminatory power”
significantly.
Osmosis relies on a semi-permeable membrane through which water can pass but
liquids or gases; etc., dissolved in it may not pass so easily. A weak solution may cause the flow
of water from it to the stronger solution. This mechanism is more significant for drawing in
chlorides and sulfates to the concrete sample.
Concrete is generally regarded as a durable material but due to its versatility for many
situations, it can be vulnerable to attack from a variety of exposures. Kumar and Bhattacharjee
(2003) stated that the durability of concrete is predominantly dependent on its permeation
properties. Both the transport properties and the durability of concrete are affected by the
permeable porosity (Safiuddin & Hearn, 2005). A comparable study of ASTM saturation
techniques by Safiuddin & Hearn concluded that permeable porosity of concrete decreases
with increasing curing age and vacuum saturation is the most effective ASTM saturation
technique (Safiuddin & Hearn, 2005).
The permeation can be classified as low, average or high by determining a permeation
index by a number of tests including the initial surface absorption test (ISAT) (Bungey, 1989), in
accordance with BS 1881-208:1996, or water absorption of drilled cores (Campbell & Roper,
1996). ISAT has been successfully used and is the most common test to assess the durability of
concrete (Kumar and Bhattacharjee, 2002) in respect of the initial surface absorption. The tests
record the ingress of fluids into concrete that is influenced by transportation within the pore
structure (Garboczi, 1990) and these fluids result in chemical and physical changes leading to
the deterioration of the concretes structure. Garboczi (1990) state that the deterioration of the
concrete itself is not considered by the permeation tests just the means by which media travels

Ternary Combination Concretes Using GGBS, Fly Ash & Limestone: Strength, Permeation & Durability Properties
Chapter 2: Literature Review
37
through the structure. The rate of deterioration, and its extent, is largely due to the pore
structure that is indicative of the pore size distribution (Garboczi, 1990) and the transport
mechanism; absorption, diffusion or permeability.
The concrete structure contains cement paste and aggregates that influence the pore
size and distribution during and following hydration. The diversity of pores within the cement
paste alone is indicated in Figure 2.8. In addition to these found in the cement paste pores can
be found elsewhere within the concrete. Aligizaki (2006) divides the pores found in concrete
into five classes;
1. Cement paste matrix pores (including gel pores, capillary pores, hollow-shell pores
and air voids)
2. Pores in aggregates
3. Pores associated with the interface between aggregates and cement paste
4. Water voids such as those created by water bleeding and construction
5. Internal discontinuities in the cement paste such as those caused by humidity and
temperature changes
Figure 2.8: Dimensional rage of solids and pores in hydrated cement paste
(Source: A. M. Neville 1995)

Ternary Combination Concretes Using GGBS, Fly Ash & Limestone: Strength, Permeation & Durability Properties
Chapter 2: Literature Review
38
The volume, size and continuity of pores are influential on the permeation and strength
of concrete (Basheer et al, 2005) with macro pores of sizes larger than 50µm being the most
detrimental to both strength and impermeability (Mehta & Monterio, 1993). Basheer et al
(2005) studied the effects of different sizes, or grades, of coarse aggregate. After obtaining an
average aggregate size from sieve analysis the concrete was cast and air permeability tests
carried out. The results, summarised in Figure 2.9, showed that as the average size of aggregate
increased the air permeability index also increased suggesting that durability could be
improved by lowering the average size of combined fine and coarse aggregates. In addition to
air permeability, Basheer et al (2005) tested salt scaling and carbonation. The results of the
latter also showed that carbonation increased when the aggregate size was increased, believed
to be due to an increase in the porosity and size of the ITZ around the coarse aggregate.
Fig 2.9: Effect of average aggregate size on air permeability index
(Source: Basheer et al, 2005)
Carbonation
Carbonation, the reaction of CO2 with hydrated cement, occurs naturally and
progressively from the outside exposed surface of concrete. CO2 is present in the atmosphere
(in rural areas this can be approximately 0.03% by volume, increasing to 0.3% in cities) and
diffuses through the pore spaces to react with the hydration products within the cement
system. The volume of Ca(OH)2, calcium hydroxide, formed by the hydration of CEM I will affect

Ternary Combination Concretes Using GGBS, Fly Ash & Limestone: Strength, Permeation & Durability Properties
Chapter 2: Literature Review
39
the rate of carbonation as it is the most reactive with CO2 which turns to carbonic acid in the
presence of moisture. The process is shown by the following equation:
[Eq 2.7]
According to Mehta & Monteiro the calcium carbonate precipitated in this reaction is
insoluble and will stop unless free CO2 is present in the water when a further reaction will
occur, producing soluble bicarbonate.
[Eq 2.8]
This reaction itself, is reversible and requires a certain amount of free CO2 (balancing CO2)
which is required to maintain the equilibrium (Mehta & Monteiro, 2006). The rate of hydration,
given the previous discussion, is dependent on the permeability of the concrete, moisture
content, CO2 content and relative humidity. Whilst Neville states that it does not cause
deterioration of the concrete directly it does have fundamental effects on its overall durability
(Neville, 1995). Sisomphon & Franke (2007) found that in the case of carbonation the rate
declines with age using an accelerated carbonation test. Any cracks in concrete will
undoubtedly increase the rate of carbonation (Detweiler et al, 1996) as the exposed surface
area is greater and further increased if the relative humidity of the atmosphere is 50% (Mindess
& Young, 1981).
The process of carbonation affecting binary concretes is more complex. There is a
lower volume of Ca(OH)2 in binary concretes containing GGBS and it is more likely to be
completely carbonated. Once this occurs carbonation will take place within the CSH. As
discussed previously the volume of CSH in binary concretes, GGBS or fly ash, is greater because
of this carbonation will be exacerbated due to the high levels of CaCO3. Sisomphon & Franke
studied GGBS together with Portland cement and fly ash concrete following 3, 7 and 28 day
water curing. The GGBS cement showed increased carbonation compared to the Portland

Ternary Combination Concretes Using GGBS, Fly Ash & Limestone: Strength, Permeation & Durability Properties
Chapter 2: Literature Review
40
cement control, after 7 and 28 days curing and the GGBS was better than the 50% fly ash
addition. This confirms Osborne’s earlier study of carbonation of GGBS concretes in 1986,
which concluded that poorly cured concrete can exhibit very high carbonation with high slag
contents increasing carbonation further (Horiguchi et al, 1994). Chang & Chen (2006) use
varying methods to determine carbonation and evaluate its purpose together with
thermogravimetric analysis (TGA), XRD and pore solution tests. By examining a number of
different methods Chang & Chen determined that there were three distinct regions of fully
carbonated, partially carbonated and non-carbonated zones within the concrete structure
(Chang & Chen, 2006). Only CEM I concrete was tested so the effects of additional material
remain to be examined in this detail.
Chloride
Concretes are used globally in many different environments that can include exposure
to chloride. Whilst chloride does not directly affect the concrete itself, it does cause corrosion
of steel reinforcements if the surrounding concrete is damaged or permeable. This can be
directly through sea water in marine environments or even near to marine sources transported
by wind (Neville, 1995). Whilst concretes used for marine environments are designed
specifically with this in mind, effects of de-icing agents in other environments also represent a
risk.
The method by which chloride ions are transported into concrete is complicated,
involving the previously discussed diffusion; permeation and capillary suction (Kropp & Hilsdorf,
1995). In addition convective flow through the pore system and network of micro-cracks within
the concrete matrix also need to be considered and will depend on the exposure conditions, as
summarised in Table 2.7.
In addition to these transport mechanisms interaction between the chloride ions and
cement occurs by which they can be chemically bound onto pore walls (McCarthy, 1991;
Nokken et al, 2003). It is chloride binding that Glass & Buenfeld state may affect not only the
rate of chloride ingress, but the threshold level (Glass & Buenfeld, 2000). The tricalcium
aluminate (C3A) content of cement is the dominant factor affecting chloride binding, increasing
binding with increasing C3A volume (Glass & Buenfeld, 2000; Papdakis & Tsimas, 2002). The C3A

Ternary Combination Concretes Using GGBS, Fly Ash & Limestone: Strength, Permeation & Durability Properties
Chapter 2: Literature Review
41
reacts to produce calcium chloroaluminate, a compound that contains chloride in a chemically
bound form, often referred to as Freidel’s salts:
[Eq 2.9]
Table 2.7: Summary of primary transport mechanism for exposure and structure type (CCA, 2009)
Exposure Example of structure Primary Transport Mechanism
Submerged Basement exterior walls or transport tunnel
liners below low tide. Liquid containing
structures.
Substructures below tide.
Permeation/Diffusion/
Wicking Action
Diffusion
Tidal Substructures and superstructures in the
tidal zone.
Capillary Absorption
Diffusion
Splash & Spray Superstructures about high tide in the open
sea.
Capillary Absorption
Diffusion
Coastal Land based structures in coastal areas or
superstructures above high tide river
estuary or body of water in coastal areas.
Capillary Absorption
Whilst it is evident that the C3A content of the cement is an affecting factor, Glass &
Buenfeld also state that GGBS can also affect the rate of binding of chlorides, as too does fly
ash (Glass & Buenfeld, 2000), increasing binding capacity at certain hydroxyl concentration
(Glass et al, 1997). The effectiveness of both GGBS and fly ash as binary constituents in chloride
binding is shown in a number of studies.
Sivasundaram & Malhotra (1992) state that GGBS concretes show good resistance to
chloride penetration. Mejia et al (2003) tested a number of binary mixes with different
pozzolanas and GGBS Figure 2.8 shows that GGBS replacement of 70% [OPC1 +S(70%) in Fig
2.10] gave improved chloride concentration compared to the Portland cement control (OPC1)
and binary mixes incorporating fly ash (FA), natural pozzolans (NP) and silica fume (SF) (Mejia
et al, 2003). McPolin et al (2005) showed more clearly an improved rate of chloride ingress in
Figure 2.11 at a 50% GGBS level. These improvements are due to the increased binding of

Ternary Combination Concretes Using GGBS, Fly Ash & Limestone: Strength, Permeation & Durability Properties
Chapter 2: Literature Review
42
chloride due to the additional calcium aluminate hydrates in the reaction and a resulting,
denser matrix (Oh et al, 2002). In addition the GGBS leads to higher volumes of Freidal’s salts
due to higher aluminate levels (Dhir et al, 1996)
Fig 2.10: Variation of chloride concentration with time from Mejia et al, 2003.
Fig 2.11: Rate of chloride ingress from McPolin et al, 2005

Ternary Combination Concretes Using GGBS, Fly Ash & Limestone: Strength, Permeation & Durability Properties
Chapter 2: Literature Review
43
2.7 Ternary Blended Concretes and Their Properties
Due to the limited number of papers on ternary blends, additional materials such as
silica fume and metakaolin have also been briefly covered in this review. This enables detailed
coverage of ternary blended cements that have been studied to date to be made.
2.7.1 Fresh Properties
Unlike binary concrete there is limited information on the fresh properties of ternary
cement concretes, although the fluidity would be expected to change due to the properties of
the additions used. Thomas et al (1999) studied ternary blends incorporating Portland cement,
silica fume and a range of different fly ashes. The study concluded that fly ash compensated for
some of the workability problems usually associated with silica fume when used at high levels.
Li & Zhao (2003) studied the addition of different levels of superplasticisers added to a concrete
of water/binder ratio 0.28 to achieve equal workability. 1.7% by mass of the water/binder ratio
was required for the 100% Portland cement mix, 1.5% for the 40% fly ash binary mix and 2.0%
for the ternary mix incorporating 25% fly ash and 15% GGBS thus indicating that the fluidity is
affected by the additional materials. Elahi et al (2010) included ternary blends of Portland
cement, GGBS and silica fume as well as Portland cement, fly ash and silica fume. A
water/cement ratio of 0.3 was used as per Li & Zhao’s study and the superplasticiser was
adjusted accordingly, again to achieve equal workability. For the GGBS ternary blend this was
2.5% by mass and greater than the fly ash ternary blend (Elahi et al, 2010).
Nehdi et al (2004) studied a ternary blend of CEM I, fly ash and GGBS as well as
quarternary mixes incorporating silica fume and rice husk ash (RHA). All mixes had a constant
water/cement ratio of 0.38. The measured density of the ternary mix equalled the CEM I, whilst
the slump increased by 30mm, by using a viscosity-modifying admixture (VMA) the slump was
reduced from 690 to 615mm when combined with a high range water reducer compared with
the control mix. Nehdi et al (2004) found that the SP dosage for mixes incorporating 50%
replacement of CEM I was lower unless the VMA or the RHA was added.
Ternary Combination Concretes Using GGBS, Fly Ash & Limestone: Strength, Permeation & Durability Properties
Chapter 2: Literature Review
44
2.7.2 Strength Development
Thomas et al (1999) tested both the compressive strength and diffusion of water
through the concrete microstructure and refer to the results as showing “synergistic effects”;
as shown in Figure 2.12. The silica fume in the mixes tested by Thomas et al (1999)
compensated for the relatively low early strength of fly ash concretes. In addition to the fly ash
increasing the long term strength development of silica fume concrete, it also offset the
increased water demand of silica fume and the increased cost. The effects of fly ash and silica
fume ternary blends on chloride diffusivity were also apparent with a very high resistance to
chloride ion penetration.
Shehata & Thomas (2006) carried out further studies following their earlier work,
specifically investigating the suppression of alkali-silica reaction by using ternary blends of silica
fume and fly ash. In this instance, both high and low alkali cements were combined with high
silica and low alkali content silica fume and 3 types of fly ash with low, moderate and high
calcium oxide content. Shehata & Thomas (2006) concluded that silica fume and fly ash
introduced to high alkali CEM I systems were effective in reducing the expansion due to ASR to
levels of <0.04% after 3 years.
Antiohos et al (2007) studied ternary blends based on fly ash systems, with each
combination consisting of PC and 2 types of fly ash. Antiohos et al (2007) found that the
beneficial assets of one fly ash can compensate for the other and blending them therefore
resulted in improvements in mechanical properties when compared to the respective binary
system. It was found the ratio of 50:50 with the two fly ashes were most effective, and as there
was no significant alteration in the nature of the hydration the performance was attributed to
synergistic effects.
Li & Zhao (2003) undertook a comparative study of 3 mixes; PC control (PCC), high
volume fly ash with high strength cement (HFAC) and fly ash with GGBS (GGFAC). Short-term
and long-term performance tests on the compressive strength were carried out and resistance
to sulphuric acid (H2SO4). It was evident that that the GGFAC blend was able to achieve an
adequate early age compressive strength and maintain long-term strength, higher than the PC

Ternary Combination Concretes Using GGBS, Fly Ash & Limestone: Strength, Permeation & Durability Properties
Chapter 2: Literature Review
45
Control (Figure 2.13). It was also clear that the GGFAC blend was superior to both other mixes
against sulphuric acid attack, with a weight change of about 8% after 50 weeks exposure to 2%
H2SO4 solution (Figure 2.14)
Fig 2.12: Compressive strength development in concrete effect of
silica fume and low lime fly ash. (Thomas et al, 1999)
Fig 2.13: Development of the compressive strength versus time.
(Li & Zhao, 2003)

Ternary Combination Concretes Using GGBS, Fly Ash & Limestone: Strength, Permeation & Durability Properties
Chapter 2: Literature Review
46
Fig 2.14: Weight change of concentration in 2% H2SO4 solution.
(Li & Zhao, 2003)
Laldji & Tagnit-Hamou (2006) incorporated alternative supplementary cementitous
material (as they are referred to in America). Glass frit, an engineered material made from
recycled spent pot liners from aluminium production, was blended with PC and silica fume to
produce a ternary blend and fly ash and GGBS were added to produce two quaternary blends.
At an early age the compressive strength of the concrete containing the glass frit was lower
than the control, but at 28 and 91 days there was a marked improvement of between 2 to 10
N/mm2. Khatib & Hibbert (2005) used ternary blends of PC, GGBS and Metakaolin at different
proportions. Metakaolin was incorporated at two levels, 10% and 20% to produce the mix
combinations shown in Table 2.8.
Tests for compressive strength and E-value found that incorporating up to 60% GGBS in
concrete caused both an increase in long-term compressive strength and E-value, shown in
Figure 2.15. Additionally an increase in metakaolin content in concrete up to 20% increased
strength at early ages. This increase in early age strength does not normally occur before 28
days when only GGBS is used (Khatib & Hibbert, 2005).

Ternary Combination Concretes Using GGBS, Fly Ash & Limestone: Strength, Permeation & Durability Properties
Chapter 2: Literature Review
47
Table 2.8: Mix proportions use by Khatib & Hibbert (2005)
PC GGBS MK
100% - -
90% - 10%
60% 30% 10%
40% 50% 10%
20% 70% 10%
80% - 20%
60% 20% 20%
40% 40% 20%
20% 60% 20%
Nehdi et al (2004) found that a ternary blend incorporating 25% GGBS and 25% fly ash
improved the early age compressive strength when compared to the binary fly ash mix and
quarternary mixes with 20% GGBS and 6% RHA or silica fume. The 28 day strength exceeded
the CEM I (100% OPC) mix. Both ternary mixes either with or without VMA (viscosity modifying
admixture) give almost identical results as shown in Figure 2.16 (Nehdi et al 2004).
More recently Elahi et al (2010) studied the mechanical and durability properties of
concrete containing GGBS and silica fume. As is clear in Figure 2.17, (Elahi et al 2010), the
binary mixes containing 50% and 70% GGBS gave lower results than the ternary mix
incorporating silica fume, which at 28 days was the only mix out of the three that exceeded the
CEM I control. Interestingly, neither of the binary mixes exceeds the strength of CEM I at any
age, contradicting the effects of GGBS documented in other studies.

Ternary Combination Concretes Using GGBS, Fly Ash & Limestone: Strength, Permeation & Durability Properties
Chapter 2: Literature Review
48
Fig 2.15: Influences of varying GGBS contents at
(a) 0% MK, (b) 10% MK and (c) 20% MK.
(Khatib & Hibbert, 2005)
Fig 2.16: Compressive strength versus time for the SCC mixes tested by Nehdi et al
(Nehdi et al, 2004)

Ternary Combination Concretes Using GGBS, Fly Ash & Limestone: Strength, Permeation & Durability Properties
Chapter 2: Literature Review
49
Fig 2.17: Compressive strength development of binary and ternary mixes containing silica fume and GGBS
(Elahi et al, 2010)
2.7.3 Durability
As already noted there are limited papers concerned with ternary blend cements.
Those that exist, in the main cover CEM I, fly ash plus an addition other than and GGBS (for
example, metakaolin or silica fume). Those that do cover CEM I and GGBS are more concerned
with durability of these types of concrete, more specifically resistance to chloride attack. The
limited studies using ternary blends incorporating silica fume are reviewed briefly.
Permeability
Alexander & Magee (1999) carried out oxygen permeability index (OPI) and a water
sorptivity test, the results of which are given in Table 2.9. The OPI of the ternary blends ranged
from 9.62 to 10.00 depending on the water/binder ratios, with that of 0.49 producing excellent
performance (Alexander & Magee, 1999). These were out performed by both the control mix
and binary silica fume mixes. The excellent performance of the ternary mixes was repeated also
in water sorptivity tests. The ternary mixes produced lower index values than those of the
control tests.

Ternary Combination Concretes Using GGBS, Fly Ash & Limestone: Strength, Permeation & Durability Properties
Chapter 2: Literature Review
50
Table 2.9: Durability index tests obtained from wet cured test specimens, Alexander & Magee, 1999)
Ganjian & Pouya (2008) used a water absorption test in accordance with RILEM-CPC-
11.2 “Absorption of water by concrete by capillarity” to examine the effects of the Persian Gulf
tidal zone on paste and concrete samples. They compared binary silica fume mixes with a
ternary mix consisting of 40% PC, 10% silica fume and 50% GGBS in three different exposure
conditions - potable water, simulation tank and site tidal zone. The simulation tank used a
synthetic seawater solution with cyclic wetting and drying, the conditions were stated by
Ganjian & Pouya to be harsher and more severe than the normal conditions at the site tidal
zone. The results for both the paste and concrete specimens are summarised in Figures 2.18
and 2.19, respectively. It was concluded from this work that the use of silica fume in the
cement combination for tidal marine structures in the Persian Gulf was detrimental (Ganjian &
Pouya, 2008). The use of GGBS to produce a ternary mix increased the absorption factor in
both the simulated and tidal zone exposures. Again Elahi et al (2010) studied ternary blends
incorporating silica fume with GGBS. With the inclusion of 7.5 % silica fume, the air
permeability, which Elahi et al tested at 44 days, was reduced compared to the binary mix. At

Ternary Combination Concretes Using GGBS, Fly Ash & Limestone: Strength, Permeation & Durability Properties
Chapter 2: Literature Review
51
the later 91 day test the air permeability increased. Elahi et al (2010) suggest this difference to
be a result of micro-structural change and that the influence of tortuosity and interfacial
transition zone is different between air permeability and sorptivity tests as they measure two
different physical characteristics of the pore structure. The sorptivity tests carried out by Elahi
et al (2010) showed a significant decrease at both test ages with the addition of 7.5% silica
fume.
Fig 2.18: Absorption factors for pastes exposed to different conditions (Ganjian & Pouya, 2008)
Fig 2.19: Absorption factors for concretes exposed to different conditions
(Ganjian & Pouya, 2008)

Ternary Combination Concretes Using GGBS, Fly Ash & Limestone: Strength, Permeation & Durability Properties
Chapter 2: Literature Review
52
Carbonation
The process of carbonation was discussed earlier in relation to binary concretes, it
would be further complicated with an additional ternary material. It is possible that a ternary
material may reduce the rate of carbonation by improving the concrete’s resistance to
permeability, or exacerbate it further. Sisomphon & Franke (2009) studied accelerated
carbonation rates of blast-furnace slag concrete (CEM III-B) combined with 50% fly ash and
their results are shown in Figure 2.20 where it is clearly illustrated that the addition of fly ash
with a slag concrete significantly increased the depth of carbonation, leading to the
recommendation of a cover thickness of 35 to 40mm for reinforced concrete made with this
combination. The results of depth of carbonation were estimated based on accelerated
carbonation depths. Sisomphon & Franke (2009) suggested that the high depth of carbonation
is due to lower portlandite content ultimately resulting in a lower level of CO2 binding. The
carbonation occurs with the CSH in the ternary concretes once the Ca(OH)2, which is lower in
volume, is completely carbonated. The consequence of this is the creation of pores greater
than 100nm that aid carbonation further together with the reduced pH of the pore water from
around 13 to 8.3 (Papadakis et al, 1991).
Chloride Ingress
The transportation mechanism of chlorides and the process of binding were discussed
previously, in relation to the ability of GGBS and, indeed, fly ash to ingress the rate of chloride
binding. Chloride tests seem to be one of the most widely covered areas within the literature,
with ternary combinations tending to focus on the effects of silica fume.
Alexander & Magee (1999) used a conductivity method to determine this property
(Table 2.9) and found that ternary blends consisting of PC, GGBS and silica fume achieved
optimum performance at all three water/cement ratios tested, when compared to binary
blended cements. Sharfuddin et al (2008) used a similar test on ternary mixes of PC, GGBS and
silica fume and found that they produced a lower charge when compared to the respective
binary mixes.

Ternary Combination Concretes Using GGBS, Fly Ash & Limestone: Strength, Permeation & Durability Properties
Chapter 2: Literature Review
53
Fig 2.20: Relationship between the best fit of carbonation depth and the linear exposure time (a) 3 day (b) 7 day (c) 28 day curing. (Sisomphon & Franke, 2009)
Hooton & Titherington (2004) examined the effects of two curing techniques, ambient
and accelerated, on chloride resistance of ternary cement concrete using three different
chloride tests including the Rapid Chloride Penetration Test (RCPT), migration and bulk
diffusion. Hooton & Titherington (2004) tested ternary blends consisting of CEM I, GGBS and

Ternary Combination Concretes Using GGBS, Fly Ash & Limestone: Strength, Permeation & Durability Properties
Chapter 2: Literature Review
54
silica fume. These performed well with ‘superior chloride penetration resistance’ (Hooton &
Titherington, 2004). These authors also found that ternary blends had the advantage of being
easier to place and finish. Becknell & Hale (2005), using the RCPT however, found that ternary
blends did not follow ‘expected trends’, their results are shown in Figure 2.21. The charge
passing increased when fly ash was added to the 20% GGBS mixes, but the opposite occurred
when GGBS was added to the 20% fly ash mixes and continued to decrease as the volume of
GGBS increased. Becknell & Hale (2005) suggested that, with the presence of pozzolanic
materials, the ASTM test results can be ‘skewed’ as this presence can change the chemical
composition of the concrete pore solution. Sharfuddin et al (2008) found that the RCPT test
proved to be more sensitive in showing appreciable differences between the mixes. Supporting
Nehdi et al’s study in 2004 that included a ternary mix of 25% GGBS and 25% fly ash, they
found that this particular mix reduced chloride ion penetrability. All of the GGBS (slag) mixes
were improved as shown in Figure 2.22 below.
Fig 2.21: RCPT test results from Becknell & Hale.
(Becknell & Hale, 2005)

Ternary Combination Concretes Using GGBS, Fly Ash & Limestone: Strength, Permeation & Durability Properties
Chapter 2: Literature Review
55
Fig 2.22: Chloride ion penetrability at 28 & 98 days for the mixes tested by Nehdi et al (2004)
Bleszynski et al (2002) carried out work to compare laboratory and field study
conditions. Outdoor exposure sites in Canada were considered ideal due to their heavy traffic
and frequency of de-icing salt application. They were also suitable for freeze-thaw studies due
to the numerous cycles per year. Bleszynski et al (2002) concluded that ternary blends provided
the ‘least penetrable concrete’ during the RCPT as indicated in Fig 2.23. The ternary blend of
5.2% silica fume and 25% GGBS yielded the best results, which were comparable to Hooton &
Titherington’s tests on ternary blends of 8% silica fume and 35% GGBS that gave 175 and 125
coulombs for ambient and accelerated curing respectively. This is further supported by Elahi et
al’s (2010) more recent study, which found that the ternary mixes comprising of 7.5% silica
fume were better for resisting chloride ions (Elahi et al, 2010). Further comparisons between
Hooton & Titherington (see Figure 2.24) and Bleszynski et al (2002) can be drawn from the bulk
diffusion tests that both studies carried out. Again both papers indicate that ternary blends
achieved greater resistance (Bleszynski et al, 2002).

Ternary Combination Concretes Using GGBS, Fly Ash & Limestone: Strength, Permeation & Durability Properties
Chapter 2: Literature Review
56
Fig 2.23: Bleszynski et al RCPT tests indicating the lower levels of chloride ingress for Slag cements
(Bleszynski et al, 2002)
Fig 2.24: Effect of cementing materials and curing on steady state migration
(Hooton & Titherington, 2004)

Ternary Combination Concretes Using GGBS, Fly Ash & Limestone: Strength, Permeation & Durability Properties
Chapter 2: Literature Review
57
Long (2005) used a Rapid Chloride Migration method (RCM) with a seven day test
duration, following pre-conditioning of both 28 and 91 days, ending in a the specimen cylinder
being split longitudinally and sprayed with an indicator solution to determine the depth of
penetration. Results from this test are shown in Figure 2.25. Whilst the results indicate that the
chloride migration coefficient was lower for the ternary mixes they were still not as low as the
binary slag mixes.
Fig 2.25: Chloride migration in concretes made with 320kg cement/m3, w/c 0.50. (Long, 2005)
2.8 Embodied CO2
It cannot be disputed that the current issues surrounding climate change have resulted
in increasing pressure on the industry to a commit to sustainable development. The fact that
the cement industry is a significant contributor in the emission of CO2, as discussed in the
previous chapter, necessitates the consideration of the impact of concrete production from
cradle to grave. Essentially the embodied CO2 of concrete is fast becoming an issue for the
industry, given the importance of this and its effect on the future of sustainable development
life cycle analysis of concrete is becoming a widely discussed issue.
For the concrete industry there are a number of issues to be addressed with regard to
its impact on the environment throughout all stages of its life cycle. Not only are there issues
concerning natural resource use in the raw materials required to produce cement and the

Ternary Combination Concretes Using GGBS, Fly Ash & Limestone: Strength, Permeation & Durability Properties
Chapter 2: Literature Review
58
aggregates needed for the concrete but cement production alone accounts for 5% of global
anthropogenic CO2 emissions (Hendricks, 2005) of this 50% is from the combustion process and
50% from the calcinations process. The production process itself releases 0.5 tonne of CO2 for
every tonne of CaO produced as part of the chemical reaction, whilst approximately 0.43
tonnes is produced by the manufacturing process:
23 COCaOCaCO
[Eq 2.8]
This decomposition of limestone is an essential part of the cement production and
occurs within the kiln which also consumes high levels of energy thus creating CO2 emissions.
2% of global primary energy consumption is used in cement production (WEC, 1995). In spite of
this Hendricks (2005) states that options exist for reducing such an impact. The use of more
energy efficient processes and replacing high with low carbon fuels are considered. In most
countries rotary kilns are used but shaft kilns are more common in developing countries, where
production rates continue to rise, to a greater extent. Regardless of the method it is an energy
intensive process with 1.75 ± 0.1 MJ required for each kilogram of clinker produced (Hendricks,
2005) and the clinker to cement ratio varies from 0.5 to 0.95 for Portland cement thus effecting
the CO2 emissions. Hendricks also suggests, in addition to lower clinker/cement ratios,
alternative cements can be used to reduce environmental impacts. The use of cement
combinations depends very much on current application levels, availability, standards and
legislation.
The total ECO2 for the production of cement alone is in the region of 930kg per tonne
of Portland cement produced in the UK (BCA, 2008). Other studies have reported ECO2 from
80% to 100% (Flower & Sanjayan, 2007), 83% was reported by Hendricks in 2005 based on
Australian figures. For the purposes of this study the ECO2 for each mix combination was
calculated based on the BCA figures that for every tonne of cement produced 930kg of ECO2 is
emitted and that for every tonne of GGBS and fly ash 52 kg and 4kg of ECO2 are emitted
respectively. Flower & Sanjayan (2007) reported the ECO2 of fly ash to be 0.027 t CO2 –e/tonne
effectively 3%, or 3kg per tonne of fly ash produced, so there is little difference between their
study and the BCA figures. However, Flower & Sanjayan stated that the emission factor of
Ternary Combination Concretes Using GGBS, Fly Ash & Limestone: Strength, Permeation & Durability Properties
Chapter 2: Literature Review
59
GGBS is 0.143 t CO2 –e/tonne, 14% or 14kg of GGBS produced. Their study was based on audits
undertaken in Australia where there may be differences in processing.
The emission figures are based purely on the processing of materials subsequent to
their initial production as both GGBS and fly ash are by-products of other industrial processes
that operate independently of the cement industry and would therefore be produced
regardless of their beneficial characteristics as cement additions. Use of these materials in
cement production has the added benefit of reducing waste to landfill in addition to ECO2 per
tonne of concrete produced. In order to calculate more accurately the ECO2 of the mix
combinations other components should also be considered. The ECO2 of cement has already
been discussed and given the amount required to produce 1 tonne of concrete the ECO2 it is
high when compared to that of the sand and aggregates. The production process of sand and
fine aggregates involves hauling, washing and grading requiring equal amounts of diesel and
electricity. Flower & Sanjayan (2007) report on audit findings for one quarry in Australia where
the ECO2 is said to be in the region of 0.0139 t CO2 –e/tonne and includes the subsequent
transportation of the sand to the mixing site.
The production process of coarse or crushed aggregate is generally 30-40% higher in
emissions than that of sand depending on the type of aggregates being used. The process itself
begins with blasting from quarry faces into medium sized rocks before excavating and hauling
to crushing and grading equipment. Flower & Sanjayan report the ECO2 for basalt to be 0.046 t
CO2 –e/tonne. The process also requires on average 22% diesel and 78% electricity, the latter of
which is used extensively for the crushing stage which itself accounts for 75% of the total
process. The Concrete Industry Sustainability Performance Report, published in 2010, indicated
the CO2 emissions per tonne of aggregate produced to be 4kg per tonne, not differing greatly
from Flower & Sanjayan.

Ternary Combination Concretes Using GGBS, Fly Ash & Limestone: Strength, Permeation & Durability Properties
Chapter 3: Materials, Mix Proportions & Test Procedures
60
CHAPTER THREE: MATERIALS, MIX PROPORTIONS &
TEST PROCEDURES
3.1 Introduction
The following chapter outlines the experimental programme and discusses the
materials used and their characteristics, prior to detailing the mix proportioning and test
methods used during this study.
3.2 Experimental Programme
The initial part of the research was concerned with selecting cement combinations
based on BS EN 197-1, industry advice and a literature review. Control mixes of 100% Portland
cement (CEM I) were cast and binary combinations of CEM I and ground granulated blast
furnace slag (GGBS) were used to provide references before incorporating limestone (LS) or fly
ash (FA) to give ternary blend combinations for testing. The beneficial effects of GGBS, with
regard to the development of compressive strength has been studied at length over the past
few decades as summarised in the previous chapter, where a number of studies examined a
range of addition levels from 10 to 80%. The range of addition options is substantial and three
main binary levels of 35, 55 and 75% GGBS were considered.
An additional test level of 90% GGBS was considered initially and a variety of tests
carried out at this level, given that BS EN 197-1 covers cement types incorporating GGBS as a
constituent ranging from 6 to 95%. However, early results were indicative of poor performance
for concrete so focus was placed on the other combinations levels following industry guidance.
The standard also covers the addition of limestone as a binary material up to 35%, hence levels
of 10, 20 and 35% were considered in the ternary mixes.
Fly ash has been used as a binary material for many years and it use has increased
threefold between 1977 and 1996 as reported by Detweiler et al (1996). Binary studies of fly
ash cover similar addition levels to those of GGBS but as a ternary material there is very limited

Ternary Combination Concretes Using GGBS, Fly Ash & Limestone: Strength, Permeation & Durability Properties
Chapter 3: Materials, Mix Proportions & Test Procedures
61
reporting, the replacement values of 10 and 20% are therefore used to allow for comparison of
the results with those of the limestone ternary mixes.
Figure 3.1 provides an overview of the experimental programme including both paste
and concrete phases. The paste study included tests on the fresh properties of the cement
combinations to provide an understanding of the effects of the cement additions in relation to
the standard consistency, setting time, viscosity and developing structure prior to adding
aggregate. Tests on concrete included compressive strength together with permeation and
durability properties of the concrete. ISAT, air permeability and NordTest (chloride migration)
were the main tests carried out with sorptivity, water penetration under pressure and rapid
chloride permeability test (RCPT) providing supplementary results for confirmatory purposes.
3.3 Materials
3.3.1 Portland cement and additions
All materials used in this study were supplied from single sources in dry powder form
and stored in airtight plastic containers to prevent any deterioration. The Portland cement
conforming to BS EN 197-1:2000 was of strength class of 42.5N. The GGBS conformed to both
BS 6699:1992 and BS EN 197-1:2000. The fly ash and the limestone met the requirements of BS
EN 450-1:2005 and BS 7979:2001, respectively. These materials are typical of those used in
concrete construction practice. Physical and chemical characteristics were tested and are
discussed in the following section.
3.3.2 Aggregates
Coarse and fine aggregate were obtained for the concrete mixes all of which
conformed to BS EN 12620:2002. The coarse aggregates used for the concrete casting was
natural gravel of two size grades, 5-10mm and 10-20mm, whilst the fine aggregate was 0-4mm.
The aggregates used were also low in porosity thus reducing additional water needed to be
added during the mixing process by varying the quantity of fine aggregates. Whilst this would
not generally be considered an issue a higher porosity could affect the absorption and
permeability of concrete. The aggregates underwent characterisation tests and the results are
discussed in the following section.

Ternary Combination Concretes Using GGBS, Fly Ash & Limestone: Strength, Permeation & Durability Properties
Chapter 3: Materials, Mix Proportions & Test Procedures
62
Fig 3.1: Overview of experimental programme

Ternary Combination Concretes Using GGBS, Fly Ash & Limestone: Strength, Permeation & Durability Properties
Chapter 3: Materials, Mix Proportions & Test Procedures
63
3.3.3 Water
Potable tap water in accordance with BS EN 1008:2002 was used to cast all paste and
concrete mixes as well as being used for curing and a number of tests on the specimens. The
quality of the water was important as impurities can affect the concrete. Distilled, deionised
water was used to calibrate the ISAT apparatus, in addition to the test itself, and for all test
procedures requiring chloride free water as part of their test procedure, including other water
penetration and absorption tests.
3.3.4 Admixture
A high range water-reducing superplasticiser admixture and conforming to BS EN 934-
2:2001 was used throughout the study to achieve the required consistence of 75mm nominal
slump in concrete mixes at the fixed free water content.
3.4 Material Characterisation
Material characterisation was carried to ensure that all the materials used conformed
to relevant standards and that there were no irregularities within their general characteristics.
These tests were also carried out regularly to ensure continuity of the materials used. This
procedure was specifically important when additional materials were required which, in the
case of the aggregates, was with some frequency. These tests also established the properties of
the individual materials to aid with the interpretation of the results from the tests on strength
and durability.
3.4.1 Physical
A number of tests were carried out to establish the physical properties of the materials.
The particle densities of all materials were tested in accordance with BS 812-2:1995, the results
from these, summarised in Table 3.1, were required for both the Blaine test and the mix
proportioning procedure. The Blaine test determined the fineness, or specific surface, of the
materials and is measured in m2/kg. The results, shown in Table 3.1, are typical of the materials
used.

Ternary Combination Concretes Using GGBS, Fly Ash & Limestone: Strength, Permeation & Durability Properties
Chapter 3: Materials, Mix Proportions & Test Procedures
64
In addition to the Blaine test the particle size distribution of the materials was tested
by “Malvern Mastersizer” equipment and software. By determining the particle size
distribution of the materials the total fines content (particles passing 75µm sieve) was
calculated. The fineness ultimately affects the placeability, workability and, indeed, the water
content of the concrete and is necessary to establish a closed structure within the concrete,
thus improving the strength and durability properties.
Loss on ignition, in accordance with BS EN 196-2, was also carried out on the CEM I,
GGBS and fly ash. This test showed the extent of carbon and hydration of free lime and free
magnesia.
3.4.2 Chemical Properties
In addition to the physical properties both the chemical and mineral properties of the
materials were tested by X-ray fluorescence spectrometry (XRF). Powder specimens were
placed into aluminium sample holders and compressed into pellets before placing into the XRF
machine for testing. The results show typical bulk oxide content for the materials tested and
are summarised in Table 3.1.The bulk oxide content was established to ensure that the cement
conformed to BS EN 197-1, for example that the ratio of CaO to SiO2 was not less than 2 and
that the MgO content did not exceed 5% by mass. By testing the GGBS and fly ash differences
in the content were seen and assisted in the interpretation of the results from the other tests
on the concrete.
3.4.3 Aggregates
In addition to testing the characteristics of the cementitious materials the density and
porosity of the aggregates were also tested. The results are summarised in Table 3.2. The water
absorption of the aggregates showed that all were less than 3% ensuring that the effect on the
porosity and permeation properties of the concrete was minimised. By understanding the
properties of the aggregates better mix proportioning was possible

Ternary Combination Concretes Using GGBS, Fly Ash & Limestone: Strength, Permeation & Durability Properties
Chapter 3: Materials, Mix Proportions & Test Procedures
65
Table 3.1: Summary of Material characterisation results
Property PC GGBS Fly Ash LS
Fineness (m2/kg) 409.5 450 388.5 1550*
Loss on Ignition 0.99 0.87 6.07 42.84
Particle Density 3.14 2.91 2.2 2.63
Initial Setting Time, minutes 114 - - -
Particle size distribution, % passing by mass
125 μ 100 100 100 100
100 μ 99.9 97.3 98.5 100
75 μ 96.1 92.4 93.5 99.5
45 μ 86.5 84 82.2 98.1
25 μ 68.8 71.4 66.5 93.5
10 μ 37.5 44.3 40.8 71.8
5 μ 19.1 30.2 24.1 48.6
2 μ 7.7 12.8 10.9 23.6
1 μ 3.9 7.59 4.6 9.7
0.7 μ 1.8 4.1 1.9 7
0.5 μ 0.2 .9 0.1 0.2
Bulk Oxide Content
CaO 64.63 39.59 2.8 55.31
SiO2 20.04 35.5 43.95 0.43
Al2O3 4.61 12.77 21.73 0.28
Fe2O3 3.81 0.49 8.7 0.04
MgO 2.51 8.35 1.13 0.14
MnO 0.05 0.57 0.05 0.02
TiO2 0.26 0.53 1.23 -
K2O 0.64 0.54 2.31 -
Na2O 0.34 0.18 0.82 0.05
P2O5 0.11 - 0.39 0.01
SO3 3.09 - 1.26 -
C3S 65.58 - - -
C2S 8.32 - - -
C3A 5.77 - - -
C4AF 11.57 - - -
*Nitrogen absorption test

Ternary Combination Concretes Using GGBS, Fly Ash & Limestone: Strength, Permeation & Durability Properties
Chapter 3: Materials, Mix Proportions & Test Procedures
66
Table 3.2: Summary of characteristics of aggregates used during the study
Property Sand Coarse Aggregates
5-10 mm 10-20 mm
Shape, visual - Rounded Rounded
Surface Texture, visual - Rough Smooth
Particle Density 2.599 2.605
Water absorption
(Lab dry to SSD), % 1.05 0.27 1.97
Grading, % passing by mass
37 mm - 100.0 100.0
20 mm - 100.0 91.3
14 mm - 100.0 48.4
10 mm - 86.8 9.0
6.3 mm 100.0 28.3 0.8
5 mm 98.8 11.0 0.5
2.36 mm 85.3 - -
1.18 mm 70.8 - -
0.6 mm 54.6 - -
0.3 mm 31.0 - -
0.15 mm 4.0 - -
0.075 mm 0.9 - -
3.5 Mix Proportions & Mix Design Procedure
3.5.1 Mix Proportions
CEM I was replaced by binary and ternary materials of equal mass to give the cement
combinations for the study as outlined in Table 3.3. The cement was replaced by mass so as to
ascertain the benefits or limitations of reducing the CEM I content to provide concrete with an
overall lower ECO2 without compromising the strength and durability properties of concrete. A
100% CEM I control mix was produced with which the binary and ternary concretes were
compared. The GGBS levels were chosen to give a wide range to the study and represent those

Ternary Combination Concretes Using GGBS, Fly Ash & Limestone: Strength, Permeation & Durability Properties
Chapter 3: Materials, Mix Proportions & Test Procedures
67
more widely used and tested in previous studies and covered by standards, enabling a
comparison of ternary additions. With regards to the limestone, the addition ranged from 10 to
35%, the maximum allowable under BS EN 197-1.
A fixed water content of 165 l/m3 was used for concrete mix designs with
water/cement (w/c) ratios of 0.35, 0.5 and 0.65. Superplasticiser dosage (Glenium 51) was
adjusted for each mix in order to give a nominal slump of 75 ± 25mm in accordance to
consistency class S2 in BS8500. The range of w/c ratios allowed for a broad range of strengths
in BS 8500.
Table 3.3: Cement combinations used during the study
Mix No PC GGBS FA LS
1 100 - - -
2 65 35 - -
3 65 25 10 -
4 65 25 - 10
5 45 55 - -
6 45 45 10 -
7 45 35 20 -
8 45 45 - 10
9 45 35 - 20
10 25 75 - -
11 25 65 10 -
12 25 55 20 -
13 25 65 - 10
14 25 55 - 20
15 25 40 - 35
16 10 90 - -
17 10 70 - 20
18 10 55 - 35

Ternary Combination Concretes Using GGBS, Fly Ash & Limestone: Strength, Permeation & Durability Properties
Chapter 3: Materials, Mix Proportions & Test Procedures
68
Mix proportions were established for all combinations at all water cement ratios; 0.35,
0.5 and 0.65 to give low, medium and high strength concretes, and provided an insight into the
effects of w/c ratio on the combinations. Barnett et al (2006) tested concretes over three
water/binder ratios (0.25, 0.4 and 0.6) corresponding to 28 day target mean strength of 40, 70
and 100 N/mm2. Babu & Kumar (2000) tested a w/b ratio range of 0.23 to 0.83.
3.5.2 Mix Design
The BRE (British Research Establishment) mix design method was used for the purposes of
this study and is a well-established concrete production procedure in the UK. Strength,
workability and durability of concrete are taken into consideration when the following
procedure is followed:
i. Selection of w/c ratio and water content.
ii. Calculation of cement content (water content divided by the w/c ratio).
iii. Calculation of the total aggregate content by estimation of concrete density from
graphs provided in the BRE mix design procedures. This value is subtracted from the
cement and water content giving the total aggregate content.
iv. The proportion of sand is then determined as a percentage of the total aggregate
content. This percentage is determined by establishing the percentage of sand which
passes a 600_m sieve.
v. The course aggregates content is calculated by subtracting the sand content from the
total aggregates content. This is then divided into a ratio of 1:2 to give 4/10mm and
10/20mm coarse aggregate content. This is consistent with the view held by Neville
(1995) who stated that a fine content of between 34% - 36% is generally applicable for
concrete.
vi. Adjustment of the final water content is made to account for aggregate water
absorption. This is necessary as all the normal-weight aggregates are added to the mix
in a “lab dry” state rather than a saturated surface dry state (SSD) on which the BRE
mix proportioning design procedures is based.
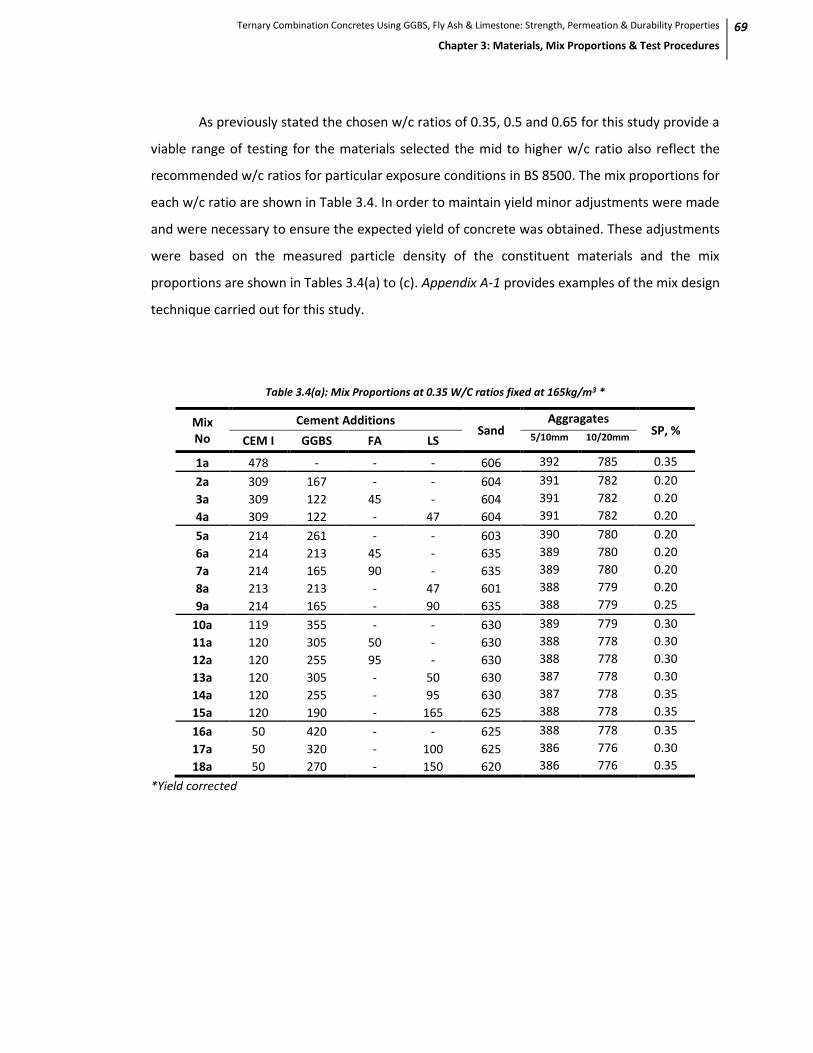
Ternary Combination Concretes Using GGBS, Fly Ash & Limestone: Strength, Permeation & Durability Properties
Chapter 3: Materials, Mix Proportions & Test Procedures
69
As previously stated the chosen w/c ratios of 0.35, 0.5 and 0.65 for this study provide a
viable range of testing for the materials selected the mid to higher w/c ratio also reflect the
recommended w/c ratios for particular exposure conditions in BS 8500. The mix proportions for
each w/c ratio are shown in Table 3.4. In order to maintain yield minor adjustments were made
and were necessary to ensure the expected yield of concrete was obtained. These adjustments
were based on the measured particle density of the constituent materials and the mix
proportions are shown in Tables 3.4(a) to (c). Appendix A-1 provides examples of the mix design
technique carried out for this study.
Table 3.4(a): Mix Proportions at 0.35 W/C ratios fixed at 165kg/m3 *
Mix No
Cement Additions Sand
Aggragates SP, %
CEM I GGBS FA LS 5/10mm 10/20mm
1a 478 - - - 606 392 785 0.35
2a 309 167 - - 604 391 782 0.20
3a 309 122 45 - 604 391 782 0.20
4a 309 122 - 47 604 391 782 0.20
5a 214 261 - - 603 390 780 0.20
6a 214 213 45 - 635 389 780 0.20
7a 214 165 90 - 635 389 780 0.20
8a 213 213 - 47 601 388 779 0.20
9a 214 165 - 90 635 388 779 0.25
10a 119 355 - - 630 389 779 0.30
11a 120 305 50 - 630 388 778 0.30
12a 120 255 95 - 630 388 778 0.30
13a 120 305 - 50 630 387 778 0.30
14a 120 255 - 95 630 387 778 0.35
15a 120 190 - 165 625 388 778 0.35
16a 50 420 - - 625 388 778 0.35
17a 50 320 - 100 625 386 776 0.30
18a 50 270 - 150 620 386 776 0.35
*Yield corrected

Ternary Combination Concretes Using GGBS, Fly Ash & Limestone: Strength, Permeation & Durability Properties
Chapter 3: Materials, Mix Proportions & Test Procedures
70
Table 3.4(b): Mix Proportions at 0.5 W/C ratios fixed at 165kg/m3 *
Mix No
Cement Additions Sand
Aggragates SP, %
CEM I GGBS FA LS 5/10mm 10/20mm
1b 333 - - - 655 417 833 0.12
2b 216 116 - - 651 414 823 0.10
3b 215 80 33 - 651 414 823 0.10
4b 215 80 - 33 651 414 823 0.12
5b 150 182 - - 650 413 826 0.15
6b 150 150 33 - 650 413 826 0.15
7b 150 115 65 - 650 413 826 0.15
8b 150 150 - 33 650 413 826 0.20
9b 150 115 - 60 650 412 825 0.25
10b 83 250 - - 649 413 825 0.20
11b 83 215 33 - 649 413 825 0.20
12b 83 182 70 - 649 413 825 0.20
13b 83 215 - 33 649 411 822 0.20
14b 83 182 - 70 649 411 822 0.25
15b 83 130 - 120 646 411 822 0.25
16b 30 300 - - 648 412 824 0.20
17b 30 230 - 70 646 411 824 0.25
18b 30 180 - 120 646 411 823 0.25
*Yield corrected
Table 3.4(c): Mix Proportions at 0.65 W/C ratio fixed at 165kg/m3*
Mix No
Cement Additions Sand
Aggragates SP, %
CEM I GGBS FA LS 5/10mm 10/20mm
1c 256 - - - 685 430 859 0.05
2c 165 90 - - 683 429 857 0.15
3c 165 65 25 - 683 429 857 0.15
4c 165 65 - 25 683 429 857 0.15
5c 115 140 - - 683 428 857 0.15
6c 115 115 25 - 683 428 857 0.10
7c 115 90 50 - 683 428 857 0.10
8c 115 115 - 25 682 428 854 0.10
9c 115 90 - 50 682 428 854 0.15
10 65 190 - - 682 427 856 0.15
11c 65 165 25 - 682 427 856 0.10
12c 65 140 50 - 682 427 856 0.10
13c 65 165 - 25 680 426 856 0.10
14c 65 140 - 50 680 426 854 0.15
15c 65 100 - 90 680 426 854 0.20
16c 25 230 - 679 426 852 0.20
17c 25 180 - 50 678 426 852 0.20
18c 25 140 - 90 678 426 852 0.25
*Yield corrected

Ternary Combination Concretes Using GGBS, Fly Ash & Limestone: Strength, Permeation & Durability Properties
Chapter 3: Materials, Mix Proportions & Test Procedures
71
3.5.1 Batching and Specimen Casting
A number of test specimens were required to be cast for the experimental programme.
The total number of each specimen cast was required in order to calculate the total volume of
concrete to be cast. Table 3.5 outlines the specimens required for each test and the volume of
each. 10% wastage is added to the total volume and given that the capacity of the pan mixer
used is 0.035 two batches were required to be mixed for each combination.
Table 3.5: Specimens for casting
Specimen Size Test Specimen number required
100mm3 Compressive Strength 2 each@3,7,28,90 & 180 day = 10
Air permeability 2 each@ 28 & 180 day = 4
Carbonation 2 each @ 2, 4, 8,12 & 20 wks = 10
Capillary Rise 2 each @ 28 & 180 day = 4
Total 28
150mm3 Water Penetration
Under Pressure
2 each @ 28 & 180 days = 4
ISAT 2 each @ 28 & 180 days = 4
Total 8
100mm x 300mm cylinder Chloride Ingress 2 each @ 28 & 180 days = 4
Total 4
3.6 Preparations & Preconditioning
3.6.1 Mixing
Cement Paste
The mixing of the cement combination pastes was carried out in accordance with BS
196-3 in order to achieve uniformity in the samples for testing. A quantity of water was
weighed and placed into the mixing bowl of a Hobart mixer. Materials were weighed to a total
of 500g and added to the water carefully to avoid any loss of material or water. The mixer was
run at a low speed for 90 seconds and then stopped for 15 seconds during which time any
paste adhering to the side of the bowl out with the mixing zone can be returned to the mix
using the palette knife. The mixer was then run for a further 90 seconds. The total mixer
running time from “zero” to completion was no more than 3 minutes. The capacity of the mixer
was 5 litres which required that multiple batches were produced for all the test specimens.

Ternary Combination Concretes Using GGBS, Fly Ash & Limestone: Strength, Permeation & Durability Properties
Chapter 3: Materials, Mix Proportions & Test Procedures
72
Concrete
Following BS EN 12390-2:2000 the concrete samples were produced using a horizontal
forced-action pan mixer with a maximum capacity of 0.035m3. Each quantity of concrete
produced was more than 10% required for the sample casting to allow for any wastage and
prior to mixing aggregate was left for up to 24 hours to ensure it was used in a laboratory dry
condition.
Air drying the aggregate allowed for the removal of surface water, or aggregate-free
water that can become part of the total batch water as soon as the mixing process began. The
mixing procedure takes into account the surface dry aggregate and some of the batch water is
absorbed into the aggregates during the initial stages of the process which involved adding half
the required water to the aggregates, after dry mixing for 1 minute, and leaving covered for 8
minutes to allow for water to be absorbed. The cement and additions were then added and
mixed for a further minute prior to adding the superplasticiser and remaining water and mixing
for a further 2 minutes. To ensure complete homogeneity the mixed concrete was then hand
mixed using a trowel.
It was standard practice to carry out both workability and plastic density tests on each
of the mixes within 15 minutes of mixing in accordance with BS EN 12390-2:2000. Slump was
tested to ensure the nominal slump of 75 ± 25mm was achieved and the concrete’s workability
evident. Due to its surface texture GGBS can create higher workability which is not always
evident with the slump test (Tattersall, 1991). The plastic density of concrete was determined
in accordance with the method described in BS EN 12350-6 (BSI, 2009). A cylindrical container
was placed on a vibrating table filled in five equal layers, with each layer vibrated for 15
seconds. The plastic density of the concrete in kg/m3 was determined by dividing the weight of
the compacted concrete by the volume of the container. Both tests were carried out within 15
minutes of mixing and prior to casting within a further 15 minutes.

Ternary Combination Concretes Using GGBS, Fly Ash & Limestone: Strength, Permeation & Durability Properties
Chapter 3: Materials, Mix Proportions & Test Procedures
73
3.6.2 Casting & Curing
The mixed concrete was then placed into prepared moulds and left to cure for an initial
24 hours, covered in damp hessian and plastic sheeting, prior to de-moulding. The de-moulded
specimens were placed in water curing tanks with a controlled temperature of 20oC ±1o until
required for testing. Table 3.5, previously, shows the curing days required for each of the
selected tests, together with the specimen sizes cast.
3.7 Fresh Properties of Paste
3.7.1 Standard Consistency
Standard consistency tests were carried on the paste samples to determine the water
requirements for each combination of materials. In accordance with BS EN 196-3, each
combination sample was prepared. The Vicat was set up with the plunger shown in Figure 3.2,
attached and calibrated by lowering to rest on the base plate and adjusting the pointer to read
zero.
Fig 3.2: Vicat plunger for standard consistency test
The methodology laid out in the standard was followed to determine the standard
consistency and it was often necessary to repeat this test with different water contents until
the results showed a distance of 6mm (±1mm) between the plunger and base-plate. The water
quantity was recorded, together with the mass and volume of each of the tested samples. This

Ternary Combination Concretes Using GGBS, Fly Ash & Limestone: Strength, Permeation & Durability Properties
Chapter 3: Materials, Mix Proportions & Test Procedures
74
test indicated the influence of the different additions on the water demand of the cement
paste and results are expressed in terms of water/cement ratio.
3.7.2 Particle Packing
The De Larrard (1999) Compressible Packing Model (CMP) was used to determine the
particle packing for the constituent materials. According to this model, the packing density is
given in the following implicit equation:
n
i
i
iin
i
i
yKK
11
)11
/
[Eq 3.1]
with:
1
1 1
/a1/11b11i
j
n
ij
jjiijjjiiji
i
i
yy
[Eq 3.2]
where, K is called Compaction index.
Ki is the contribution of class i to the compaction index.
i is called virtual packing density of a monodisperse mix (comparing to ai in
LPM).
i is virtual packing density of a polydisperse mix, when the i fraction is dominant
(comparing to i in LPM).
aij is the loosening effect coefficient, and
bij is the wall effect coefficient (comparing to f(i,j) and g(i,j) in LPM).
This model gives a better prediction of the packing density than the linear packing model (LPM)
and has smoothed curves near the maximum packing point. In the concept of the CPM, the
new introduced parameter K depends only on the packing process. Virtual packing density,
which was determined by the LPM, is the maximum packing density achievable with the given
mixture and refers to the situation of K = 4. Figure 3.1 shows the calculated packing density

Ternary Combination Concretes Using GGBS, Fly Ash & Limestone: Strength, Permeation & Durability Properties
Chapter 3: Materials, Mix Proportions & Test Procedures
75
0 0.2 0.4 0.6 0.8 1
Fine/(fine+coarse)
0.60
0.65
0.70
0.75
0.80
Pac
kin
g d
ensi
ty KK=2.0
K=4.1
K=4.75
K=9.0
K=12.5
K=
0 0.2 0.4 0.6 0.8 1
Fine/(fine+coarse)
0 0.2 0.4 0.6 0.8 1
Fine/(fine+coarse)
0.60
0.65
0.70
0.75
0.80
Pac
kin
g d
ensi
ty
0.60
0.65
0.70
0.75
0.80
Pac
kin
g d
ensi
ty
0.60
0.65
0.70
0.75
0.80
Pac
kin
g d
ensi
ty KK=2.0
K=4.1
K=4.75
K=9.0
K=12.5
K=
changing with the K values with a size ratio of 1/8 after the compressible packing model. Actual
packing densities of the two classes are assumed to be equal to 0.64, and the different curves
stand for low to high K values. (De Larrard, 1999, re-drawn)
Fig 3.1: Packing density of binary mix of grain.
Based on test data, De Larrard got the K values for different packing processes as shown in the
Table 3.2. The new functions to determine the loosening and wall effects are:
50.1
ij
02.1
ij
)/1(1b
)/1(1a
ji
ij
dd
dd
[Eq 3.3]

Ternary Combination Concretes Using GGBS, Fly Ash & Limestone: Strength, Permeation & Durability Properties
Chapter 3: Materials, Mix Proportions & Test Procedures
76
Table 3.6: K values for different packing processes in De Larrard’s CPM.
Dry packing Wet packing
Pouring Sticking
with a rod Vibration
Vibration +
compression 10 kPa
Smooth, thick
paste
4.1 4.5 4.75 9.0 6.7
3.7.3 Setting Time
In accordance with BS EN 196-3 this procedure was undertaken using automatic
calibrated setting time equipment. Setting time tests were carried out on both 0.35 and 0.5
water/cement ratio pastes and the data logged to show the initial and final setting times for
each combination tested. Tests were carried out on these w/c ratios as they would then allow
comparison with the properties tested on concrete. This test would also, ultimately allow for
planning in the placement of concrete on site. Both GGBS and fly ash can extend the initial
setting time as discussed in the previous chapter.
3.7.4 Viscometery
A Brookfield viscometer was used to establish the yield stress and viscosity of the
cement combination pastes. The cement paste was mixed and 70 ml then placed into a 100ml
plastic beaker. The viscometer was placed such that the spindle was in the centre of the beaker
and as it moved up and down stoppers were located to prevent the spindle from leaving the
paste and touching the bottom of the beaker.
As the spindle rotated readings were taken every 30 seconds and 3 times for each
speed to give an average. The results were then plotted and a best fit line drawn through all
corresponding shear stress (torque) and rate of shear values (rotational speed) as shown. The
equation of this line gave the values for plastic viscosity (slope angle) and yield stress (x-axis
intercept). The viscosity of the cement paste will have some influence on the downward
movement, or segregation, of the aggregates within the concrete, with major values mitigating
this.

Ternary Combination Concretes Using GGBS, Fly Ash & Limestone: Strength, Permeation & Durability Properties
Chapter 3: Materials, Mix Proportions & Test Procedures
77
Fig 3.3: Automated Setting Time Equipment
Fig 3.4: Brookfield Viscometer

Ternary Combination Concretes Using GGBS, Fly Ash & Limestone: Strength, Permeation & Durability Properties
Chapter 3: Materials, Mix Proportions & Test Procedures
78
3.8 Mercury Intrusion Porosimetry
An automated mercury intrusion porosimeter (Figure 3.5) was used to measure the
pore size and the porosity of paste samples. Low pressure testing is carried out prior to high
pressure testing and the data produced is combined to give the final result.
Fig 3.5: Mercury Intrusion Porosimeter Equipment
Each specimen is no more than 10mm in diameter and placed into the glass cell which
is loaded into the porosimeter which is capable of measuring 950 micron to 0.0064 micron pore
diameter. The test was only carried out on paste specimens. Indeed, the aggregates in the
concrete specimens would affect the results of the porosity test due to their size with respect
to the sample; it may be possible that a specimen may only consist of aggregate and no cement
paste.
The relationship between the applied pressure and the pore diameter into which the
mercury will intrude is given by the Washburn equation (Hanzick, 2010):
p
yD
cos4
[Eq 3.4]

Ternary Combination Concretes Using GGBS, Fly Ash & Limestone: Strength, Permeation & Durability Properties
Chapter 3: Materials, Mix Proportions & Test Procedures
79
Where p is the applied pressure
D is the pore diameter
Y is the surface tension of the mercury (480 dyne cm-1)
θ is the contact angle between the mercury and the pore
wall, usually taken as 140o.
3.9 Compressive Strength
Compressive strength tests were carried out in accordance with BS EN 12390-3:2002
(Testing hardened concrete – Part 3: Compressive strength of test specimens) and reported to
the nearest 0.5N/mm2. By testing specimens at a variety of ages (3, 7, 28, 90 and 180 days) the
effects of w/c ratios and cement additions on the rate of development of compressive strength
was determined.
3.10 Permeation & Absorption Properties
It is important for concrete to be able to withstand many conditions that may affect the
rate of deterioration adversely. The permeation and absorption of liquids, ions and gases into
the concrete can be detrimental to the steel rebar reinforcement, causing corrosion, within the
concrete structure. It is therefore fundamental to understand the effect additions have on
reducing the rate of permeation and absorption of liquids, ions and gases and this can be
achieved, to some extent, by carrying out the following tests that cover a range of permeability
and absorption properties.
3.10.1 Initial Surface Absorption Test (ISAT)
This is one of the most commonly used tests for assessing the durability of concrete
(Kumar & Bhattacharjee, 2002). It has been used by a number of previous studies including
Bungey, 1989; Garboczi, 1990; Mehta & Monterio, 1993; Basheer et al, 2005. The procedure
laid out in BS 1881: Part 208: 1996 (“Recommendations for the determination of the initial
surface absorption of concrete”) was followed. Tests were carried out at both 28 and 180 days
on two 150mm cubes that were oven dried to a constant mass and the apparatus was set up as
shown in Figure 3.6.

Ternary Combination Concretes Using GGBS, Fly Ash & Limestone: Strength, Permeation & Durability Properties
Chapter 3: Materials, Mix Proportions & Test Procedures
80
The ISAT apparatus was calibrated and the rubber seal was lightly greased and clamped
centrally onto the side surface of the specimen to ensure a watertight seal. Water from the
reservoir, with a 200 ± 20mm head, flowed through the tubing when the tap was opened and
when it first reached the concrete surface a stopwatch was started and then flow stopped 15
seconds prior to 10 minutes having elapsed. The distance the water surface moved along the
capillary tube was recorded and an ISA-t value was obtained by using the following formula:
FxdsmmlvaluetISAT // 2
[Eq 3.5]
Where, d is the distance moved by water (mm) at time, t (mins)
F is the calibration factor for apparatus
The mean ISAT-10, 30 and 60 values were reported to the nearest 0.1×10⁻². The initial
surface absorption is defined as the rate of water flow into concrete per unit area at the stated
interval (10 minutes) from the start of the test at a constant applied head of 200mm at room
temperature.
Fig 3.6: Schematic diagram showing the ISAT equipment set-up.

Ternary Combination Concretes Using GGBS, Fly Ash & Limestone: Strength, Permeation & Durability Properties
Chapter 3: Materials, Mix Proportions & Test Procedures
81
3.10.2 Sorptivity
The sorptivity of the test specimens at ages 28 and 180 days is tested by following the
method outlined in ASTM C1585-04. This test was used selectively for conformity purposes
given its coverage in a number of previous studies and determines the susceptibility of an
unsaturated test sample to the penetration of water by absorption, measuring the sorptivity of
the concrete by means of capillary suction. This test differs from the ISAT in that the total water
flow measured is the sum of capillary and gravity driven flows. Two specimens of 100mm
diameter and 50mm thickness were cut from a 300mm cylinder and then oven dried to
constant mass and cooled to room temperature and the weight recorded. The sides of each
specimen was sealed with wax and then placed onto small supports so that only the lower 2 to
5mm was submerged. The top of the specimens were covered to prevent moisture loss by
evaporation. A schematic of the test set-up is shown in Figure 3.7. At timed intervals (1, 5, 10,
20, 40 and 60 minutes) and, thereafter, every 60 minutes up to 6 hours from the start of the
test, the specimens were weighed (to the nearest 0.1g) and the water level on the specimen
also recorded. The accumulated water absorption is then calculated using the following
equation:
[Eq 3.6]
Where, is water absorption
is the increase in weight by water absorption of the specimen
is the test surface area
is the density of water
From Darcy’s Law it can then be derived that the cumulative water absorption increases with
the square root of time:
[Eq 3.7]

Ternary Combination Concretes Using GGBS, Fly Ash & Limestone: Strength, Permeation & Durability Properties
Chapter 3: Materials, Mix Proportions & Test Procedures
82
Where, is water absorption
is the sorptivity of concrete (mm/sec ½)
is the time (sec ½)
The sorptivity is determined as the slope of against , which can be obtained by a
least square fit of on . This can be ascertained by plotting the data to give a coefficient
form the trend-line equation as shown in the sample chart in Figure 3.8. Appendix A-2 provides
an example of the spread-sheet used to determine the coefficient; this was completed with the
weight at each timed interval for each of the samples tested.
Fig 3.7: Schematic of the sorptivity test
Fig 3.8: Sample chart indicating the sorptivity coefficient (y=0.0242)

Ternary Combination Concretes Using GGBS, Fly Ash & Limestone: Strength, Permeation & Durability Properties
Chapter 3: Materials, Mix Proportions & Test Procedures
83
3.10.3 Air Permeability
No standard exists for this particular test. The method used followed that of the
“University of Dundee Method” as described by Dhir et al (1989). Cubes of 100mm diameter
were cast and then a 54mm diameter core taken and sliced to give two specimens of
approximately 50mm length. These cores were then oven dried and cooled to room
temperature before testing.
The length of each prepared core was measured at three points around the
circumference to obtain an average length prior to lightly greasing the outside surface of the
specimen and placing it into the air permeability apparatus. Figure 3.9 shows a schematic of
the air permeability apparatus.
An oil pressure of 300psi was applied to the circumference of the specimen then a
uniaxial air pressure up to a maximum inlet pressure of 2.76 N/mm2 was applied. Readings are
taken from the outflow meters at pressures 110, 90, 70, 50 and 30 psi. Appendix A-3 shows an
example of the spread-sheet used to calculate the intrinsic permeability (k) which was
determined by using the following formula and reported to the nearest 0.1 m210-17.
2
1
2
1
222
PPA
QLPk
[3.8]
Where Q2 is the outlet volume rate of flow, cc/min
P1 is the inlet pressure, psi
P2 is the outlet pressure (atmospheric)
A is the cross-sectional area of specimen, mm2
L is the average length of specimen, mm
µ is the dynamic viscosity of air

Ternary Combination Concretes Using GGBS, Fly Ash & Limestone: Strength, Permeation & Durability Properties
Chapter 3: Materials, Mix Proportions & Test Procedures
84
Fig 3.9: Layout the air permeability apparatus (Dhir et al, 1989)
Fig 3.10: Air permeability testing equipment

Ternary Combination Concretes Using GGBS, Fly Ash & Limestone: Strength, Permeation & Durability Properties
Chapter 3: Materials, Mix Proportions & Test Procedures
85
3.10.4 Water Penetration Under Pressure
Water penetration is carried out in accordance with BS EN 12390-8. A 150mm cube
specimen was clamped into the testing rig and a pressure of 0.7 MPa for 72 hours applied to
the roughened surface. In this case no preconditioning of the specimen was required; the
specimen was removed from the curing tank at the required test age. A schematic diagram of
the test set-up is shown in Figure 3.11. The specimen was removed after the indicated test time
and split perpendicular to the roughened surface to enable measurement of the water
penetration indicated by darker, damp areas on the rough surface of the concrete sample. This
depth of penetration was recorded in depth by millimetres.
Fig 3.11: Layout the water penetration under pressure apparatus
Ternary Combination Concretes Using GGBS, Fly Ash & Limestone: Strength, Permeation & Durability Properties
Chapter 3: Materials, Mix Proportions & Test Procedures
86
3.11 Durability
As with previous tests, whilst GGBS binary concretes have been tested extensively with
regard to their durability properties, less is known, to date, on the effects ternary additions
have with regards to the ingress of carbon dioxide or chloride. To this end, the following tests
were carried out on the cement combinations in concrete.
3.11.1 Carbonation
The poor resistance of GGBS concretes to carbon dioxide has been widely reported in
the past. However, there is limited understanding as to the effects of ternary additions such as
fly ash and limestone and whether they are detrimental or of benefit to concrete in reducing
carbonation. Carbonation itself is a lengthy process and takes many years to occur.
Furthermore, it does not cause deterioration to concrete directly but affects the durability of
reinforced concrete as its penetration to the steel will cause corrosion. Accelerated
carbonation tests were carried out using the method developed by Dhir et al (1985) on selected
combination concrete mixes. 100mm cube specimens were air dried at 20oC, and 55% relative
humidity for 14 days after 28 days water curing. They were then coated with silane primer and
paraffin wax on 5 faces leaving an open cast side face, before placing in a carbonation tank with
an enriched 4.0% CO2 environment at 20oC and relative humidity of 50% ±5% for 2, 4, 8, 12 and
20 weeks. At the test age they were removed, split and the freshly broken surface treated with
a solution of 2.0% phenolphthalein, 48.0% distilled water and 50.0% ethyl alcohol.
Measurement of the colourless (carbonation zone) were taken at 5 points to give an average
depth of carbonation.
3.11.2 Non-steady State Rapid Chloride Migration
The NordTest method (NT Build 492) determines the chloride migration coefficient
from non-steady state migration. Each specimen consists of a 50mm slice taken from the
central portion of a cast Ø 100mm x 300mm cylinder. After being surface dried, the specimen
was placed in a vacuum for 3 hours at a pressure of 10-50 mbar, prior to being saturated with
limewater for a further hour. The specimens were then placed into the apparatus as shown in
the schematic diagram in Figure 3.12 below.

Ternary Combination Concretes Using GGBS, Fly Ash & Limestone: Strength, Permeation & Durability Properties
Chapter 3: Materials, Mix Proportions & Test Procedures
87
Fig 3.12: Schematic diagram of the set-up of the apparatus for NordTest Method.
(NT Build 492, 1999)
The rubber sleeve was fitted and secured by 2 clamps; silicon sealant was used to
improve their tightness, prior to placing the specimen on the support in the catholyte reservoir.
The sleeve above the specimen was filled with 300ml anolyte solution (0.3 M NaOH) and the
anode then immersed. An external electrical potential of 60V was applied axially across the
specimen, forcing the chloride ions to migrate from outside to inside the specimen.
The chloride penetration depth was then measured by splitting the specimens axially
and spraying a concentration of silver nitrate solution onto the split surfaces as shown in Figure
3.13. The chloride coefficient was the calculated using the following equation, a modification of
Fick’s second law (Tang & Nilsson, 1992):

Ternary Combination Concretes Using GGBS, Fly Ash & Limestone: Strength, Permeation & Durability Properties
Chapter 3: Materials, Mix Proportions & Test Procedures
88
2
)273(0238.0
)2(
)273(0239.0
U
LxTx
tU
LTD d
dappm
[3.9]
Where, appmD is the apparent non-steady state migration coefficient, m2/s x10-12
U is the applied potential, V
L is the specimen thickness, mm
T is the average value of the initial and final temperatures in the anolyte
solution, oC
dx is the penetration depth, m
t is the test duration, sec.
3.11.3 Rapid Chloride Permeability
In addition to the NordTest Method, the ATSM C-1202 method for determining the
rapid chloride permeability of a test specimen was also used. With regard to the literature, this
appeared to be the most commonly used method in other studies and whilst the NordTest is
becoming more widely accepted as a method for testing rapid chloride migration it was
considered beneficial to investigate the concretes using the RCPT. This test has been used by
both Hooton & Titherington (2004) and Becknell & Hale (2005) to evaluate the electrical
conductance of the concrete specimens to provide an indication of their resistance to chloride
ion penetration. The test method requires that each specimen is conditioned by covering it
with distilled de-aerated water and placed in a vacuum desiccator with the vacuum maintained
for 4 hours. The specimen is then soaked for a further 18 hours prior to placing them into the
test cells as shown in the schematic diagram in Figure 3.14.

Ternary Combination Concretes Using GGBS, Fly Ash & Limestone: Strength, Permeation & Durability Properties
Chapter 3: Materials, Mix Proportions & Test Procedures
89
Fig 3.13: NT Build Test specimens
Water was poured into the cell to ensure that it was watertight and then removed and
the cell filled with the test liquids (3.0% NaC1 and 0.3 N NaOH solutions) in the two cell
reservoirs. The level of the liquids has to be 2-3 mm below the filling tubes of the cell parts. The
prepared specimen cells are then linked to the PROOVE’it™ Microprocessor Power Supply unit
as shown in Figure 3.15, and the test run. Each cell is connected only to each channels power
supply binding posts (red jack to red binding post and black jack to black binding post). As with
the NordTest the data was used to calculate a chloride migration coefficient from the
modification of Fick’s second law.

Ternary Combination Concretes Using GGBS, Fly Ash & Limestone: Strength, Permeation & Durability Properties
Chapter 3: Materials, Mix Proportions & Test Procedures
90
Fig 3.14: The assembly of the test cell for rapid chloride penetration tests.
Fig 3.15: The prepared specimens connected to the PROOVE’it™ Microprocessor

Ternary Combination Concretes Using GGBS, Fly Ash & Limestone: Strength, Permeation & Durability Properties
Chapter 3: Materials, Mix Proportions & Test Procedures
91
3.12 Calculating Embodied CO2 (ECO2)
It was previously shown in Chapter 1 that the use of blended cement combinations in
the construction industry is limited to a number of specific case studies. In order for application
levels to change, standards and legislation need to evolve to permit greater use of GGBS, fly
ash and other additions, but this cannot occur without further research into the effects
additions have on the strength and durability of concrete. As part of this, evaluation of the
environmental impact of concrete should also be made. Based on information already covered
in Chapter 2 the ECO2 of each blended combination concrete was calculated for each tonne of
concrete produced follow the formula shown in equation 3.5 which takes into consideration
the estimated ECO2 for each component of the concrete.
004.0003.0032.0004.0052.093.02 AWLSFAGGBSCEMIECO
[3.10]
Where, CEM I = Portland cement
GGBS = Ground glass blast-furnace slag
FA = Fly ash
LS = Limestone
W = Water
A = Aggregates
The ECO2 of all concrete combinations is summarised in Figure 3.16, Appendix A-4
provides the tabulated data. These calculations were then used to assess the ECO2 of the
concrete mixes in relation to the strength, permeation and durability properties in order to
consider the environmental impact of binary and ternary concrete compare to CEM I concrete.

Ternary Combination Concretes Using GGBS, Fly Ash & Limestone: Strength, Permeation & Durability Properties
Chapter 3: Materials, Mix Proportions & Test Procedures
92
Fig 3.10: Calculated ECO2 for all mix combinations and w/c ratios
3.13 Curve Fitting Procedure
Disparities, although being small in nature, were generally observed between individual
measurements. In response to this and in aiding the interoperation of the results to a greater
degree of accuracy, a curve fitting normalisation procedure was applied to the test data in this
research. The steps that were followed and an example is shown in Appendix A-5.
3.14 Summary
This chapter has outlined the experimental programme in detail. Commencing with the
material selection involving physical and chemical characterisation tests allowing for cement
combinations to be formulated based on this information, the literature review and the
advisement of industrial partners.
The test programme was subsequently developed to take into consideration a holistic
approach to assessing the strength, permeation and durability properties of all the concrete
mixes.

Ternary Combination Concretes Using GGBS, Fly Ash & Limestone: Strength, Permeation & Durability Properties
Chapter 4: Fresh Properties & Early Age Strength
93
CHAPTER FOUR: FRESH PROPERTIES & EARLY AGE
STRENGTH
4.1 Introduction
The hydration of cement paste is widely documented in the literature and to cover the
full range of cement combinations and water/cement (w/c) ratios was out with the scope of
this study. However, whilst it is recognised that no comparison can be directly drawn between
concrete and cement paste (Ferraris et al, 2001) the latter can provide useful information of
how materials are likely to behave in the former. A number of previous studies have
concentrated on specific properties such as strength, permeability or durability and examined
the effects of the fineness of cement and additions with regards to these properties to
determine whether they are an advantage or disadvantage to the concrete. This study takes a
more holistic approach and examines all of these beginning with the fresh properties and early
strength development in this chapter.
The physical and chemical characteristics of the test materials were discussed in the
previous chapter and are important in understanding their effects in cement paste, the study of
which was included in order to determine the effects of additions on the reactions occurring,
with regard to the changing state of the material and the development of the micro-structure.
In particular, the standard consistency and packing density, together with the setting
time and yield stress were considered in order to examine the effects of additions on the
cement paste. These properties were indicative of water reduction, retardation and the
workability of the concrete. In addition the SP dosages of the concrete mixes are discussed with
reference to the fines contents of each of the mixes. Early age strengths, up to seven days, are
discussed followed by the estimated time for each combination to reach 10 N/mm2.

Ternary Combination Concretes Using GGBS, Fly Ash & Limestone: Strength, Permeation & Durability Properties
Chapter 4: Fresh Properties & Early Age Strength
94
4.2 Fresh Properties
A number of fresh properties were tested using cement paste including standard
consistency, viscosity (rheology) and setting time. The effects of different additions on each of
these properties are considered individually and together with data concerning the fresh
properties of the concrete including superplasticiser (SP) dosage and slump.
4.2.1 Standard Consistency & Packing Density
The standard consistency was tested using the vicat apparatus, following the
methodology discussed in the previous chapter (3.7.1), for the full range of binary and ternary
mixes and the water demand is shown in Figure 4.1. The CEM I control gave a water demand of
31.8%, whilst this was not the highest; it was greater than the majority of mix combinations
considered. The binary mixes at the lower GGBS level gave water demands of 28.6% (35%) and
30.2% (55%), while the higher GGBS level of 75% gave a slight increase to 30.8%, but was still
lower than the CEM I control. At 90% GGBS a further increase to 32% was obtained. Essentially
as the percentage of GGBS increased so did the water demand until it exceeded that of the
CEM I control mix at the 90% level.
Fig 4.1: Standard consistency of paste mixes

Ternary Combination Concretes Using GGBS, Fly Ash & Limestone: Strength, Permeation & Durability Properties
Chapter 4: Fresh Properties & Early Age Strength
95
It is widely recognised that the water demand of a paste of standard consistency will
increase with the fineness of the cement or additions used (Sivasundaram & Malhotra, 1992:
Ferraris et al, 2000) due to the increase in surface area. However, both GGBS and fly ash have
water reducing properties. Indeed, Ferraris et al (2000) studied the effects of silica fume and
ultra-fine fly ash and found that, whilst the addition of silica fume increased water demand, the
fly ash had water reducing properties. GGBS tested by Lange et al (1997) was found to have
similar effects as too did the studies on limestone cement. Vuk et al (2001) found that an
addition of 5% limestone decreased water demand by an average of 0.5% when compared to
CEM I concretes, later supported by Tsivilis et al (2002) where an increase of limestone content
to 20% reduced water demand from 26% for the CEM I control mix to 23.5%. However, given
the lack of literature for ternary blends little is known about the effects these material have
when combined. In light of the studies of Sivasundaram & Malhotra (1992) and later Ferraris et
al (2000), it is likely that the increase in water demand was due to the higher proportion of
finer materials that create a greater surface area. These studies indicated that a higher volume
of GGBS gives too many particles to adhere to the surface of the CEM I particles but at an
optimum replacement level greater deflocculation occurs and a lower water demand is
required, given the results of the standard consistency tests this appears to be at the 35% and
55% GGBS levels.
For the ternary mixes, a pattern emerged with the water demand increasing with the
addition of fly ash. As the quantity of fly ash increased, 10 or 20% in each ternary mix, so did
the water demand, possibly due to the increased carbon content of the fly ash. In contrast, the
addition of limestone to ternary mixes seemed to reduce the water demand to values similar to
the binary mix at each level. As the limestone doubled to 20%, the water demand decreased
marginally, by 0.2%. By considering Vuk et al (2001), where a 5% increase in limestone
decreased the water demand by 0.5%, the decrease is perhaps expected, though it is not as
significant as its effect is likely to be diluted by those of the GGBS. Given that the limestone is
said to be an inert filler (Ramezanianpour et al, 2009) its filling ability with the CEM I is more
noticeable given the larger particle size of the CEM I compared to that of the GGBS. With a
higher addition of GGBS the limestone has less space between the CEM I which is also being

Ternary Combination Concretes Using GGBS, Fly Ash & Limestone: Strength, Permeation & Durability Properties
Chapter 4: Fresh Properties & Early Age Strength
96
filled by the GGBS. The limestone however, is fine enough to fit in additional spaces between
the GGBS particles but with less efficiency.
Data from the standard consistency tests were used to consider the packing density of
the cement pastes which were calculated using the De Larrad packing model as outlined in the
previous chapter (3.7.2). The literature suggests that shape of material affects both the packing
density and water demand of cement paste and in turn plays a fundamental role in obtaining a
strong durable concrete (Bentz, 1999). The packing density of the binary mixes is shown in
Figure 4.2. The lower replacement level of GGBS (35%) reduced water demand when compared
to CEM I but the packing density increased. The angular shape of the GGBS may be responsible
for these effects due to their ability to pack more densely than the spherical fly ash particles.
The fine particles of the GGBS fill the void spaces between the larger particles and take the
place of water within the pore spaces (Wong & Kwan, 2006).
Fig 4.2:Calculated packing density of paste mixes
As the volume of GGBS increases, the angular shape of the particles enables denser
packing than with the more spherical fly ash particles (Wong & Kwan, 2006). Indeed, as fly ash
is added to create ternary blends at lower levels, the packing density decreases and the water

Ternary Combination Concretes Using GGBS, Fly Ash & Limestone: Strength, Permeation & Durability Properties
Chapter 4: Fresh Properties & Early Age Strength
97
demand rises slightly, possibly as the voids are filled with water and not finer particles as there
are insufficient quantities present to fill the voids. Had the fly ash been added in greater
quantities than GGBS it might be expected that the packing density would increase further as
the spherical shape of the fly ash disperses CEM I allowing the finer GGBS particles to fill the
voids (Jones et al, 2003), but as seen in Figure 4.2 the fly ash gave a slightly lower packing
density when used as a ternary addition compared to the GGBS binary at each level considered.
What also must be taken into consideration is that the packing density is calculated before any
inter-particle activity takes places and the dispersing effect predominantly takes place after
mixing.
Overall it is GGBS that improves the packing density as a binary material. The addition
of ternary material to the mix blend has a detrimental effect reducing the packing density, in
some cases significantly, when compared with the corresponding binary mix. The inclusion of
10% fly ash or limestone reduces particle packing, limestone more so than fly ash as shown in
Figure 4.1, although it is still slightly improved compared to the CEM I control mix at the higher
GGBS level.
4.2.2 SP Dosage
Gallias et al (2000) note that the mineralogical, texture and granular characteristics of
finer mineral additions are not taken into consideration in mix design, leading to an excess of
superplasticiser being used. As discussed previously, finer materials tend to increase water
demand but GGBS and fly ash can decrease this as already demonstrated in both the literature
and results obtained during the study. Erdem & Kirca (2000) state that the higher surface area
created by a binary combination, or, as in this case, ternary additions, increase water demand
to maintain workability. Ferraris et al (2009) and Tsivilis et al (2002) indicate that a decrease in
voids, or an increase in packing density, means less water required to fill the voids. Whilst the
specific effects of additions have been illustrated in Figures 4.2 to 4.4, the overall influence of
the fines content of the combined mix can affect their workability.
Workability can be referred to simplistically in terms of ‘high’, ‘medium’ etc., but this
can lead to many differing interpretations on site (Tattersall, 1991). In this study, the concretes

Ternary Combination Concretes Using GGBS, Fly Ash & Limestone: Strength, Permeation & Durability Properties
Chapter 4: Fresh Properties & Early Age Strength
98
had a fixed water content of 165 l/m2 and equivalent consistence in accordance with BS EN
206-1 of class S2 with a nominal slump of 75± 25mm. Whilst the slump test allows for a batch
to batch check of the general workability for each mix, it may not directly indicate the true
workability of fresh concrete containing GGBS. The improvement in workability of GGBS
concrete was not apparent in the slump test results but when vibration started the mix
compacted satisfactorily in the mould.
The workability of concrete is largely determined by the content of water, or wetness
of the mix process, prior to casting. The particle size distribution of the materials in the mix can
also affect the workability. It can also be affected by the carbon content of certain additions
such as fly ash. Overall, the cement paste combinations showed a standard consistency that
was less than the lower 0.35 w/c ratio used for the concrete test mixes in the main programme.
The differences ranged between 0.24 and 0.33 across the range of mix combinations and at
such low w/c ratios the concrete mixes were unworkable without the addition of
superplasticiser (SP). In order to attain a controlled slump, in accordance with the mixing
procedure, superplasticiser was added. It was based on modified polycarboxylic ether (PCE)
polymers that wrap around the surface of the cement particles during the early stage of the
mix process. The result of this was a flowable concrete with a reduced water demand. With
careful mix proportioning and SP dosage control, all mixes recorded a slump of 75± 10mm. The
slump test is standard practice as too is the measuring of plastic density that was within range
of 2390-2410mm2.
For the binary concretes at low w/c ratio, where the fines content was high, there was
little difference in the required SP dosage with varying GGBS level, that were between 0.33%
and 0.35% of the cement content. As expected, an increase in w/c ratio reduced the SP dosage
demand. At the lower level binary mixes, there was little difference between the CEM I and the
35% GGBS level at the 0.5 w/c ratio. However, a rise in GGBS level gave increases in the SP
dosage, which were also noted at 0.65 w/c ratio. Figure 4.3 shows SP dosage in relation to the
fines content of the mixes across the range of w/c ratios for the binary mixes. The fines content
is calculated from the proportion of cement, additions and sand particles passing a 75µm sieve.
It is evident that the inclusion of GGBS at the lower w/c ratio had a positive effect in reducing

Ternary Combination Concretes Using GGBS, Fly Ash & Limestone: Strength, Permeation & Durability Properties
Chapter 4: Fresh Properties & Early Age Strength
99
the SP dosage. Though the decrease was small it supports the data from the standard
consistency tests, indicating that less water was required for these particular mixes. When
considered with the ternary additions it is clear that the inclusion of fly ash reduced the SP
dosage further for both 0.35 and 0.5 w/c ratios, as shown in Figure 4.4, for the 35% addition
level and Figure 4.5, for the 55% addition level.
This is contrary to the standard consistency test, which indicated a slight increase in
water demand with the addition of fly ash. This suggests that the slight increase in the volume
of water from 29%, to achieve a standard consistence, to 35% for the lower w/c ratio for the
concrete mix, provides more water for the fly ash to react with the CEMI and GGBS to improve
workability as well as better dispersal of the particles to create greater denser packing within
the concrete matrix. The improvement may also be caused by the presence of aggregates, the
only other differing variable between the cement paste and the concrete, however, if this were
the case, it would be expected that this trend would occur throughout the range of concrete
mixes. The 10% limestone addition showed signs of improvement in reducing SP dosage similar
to the effects of fly ash at the lower 0.35 w/c ratio, as shown in Figure 4.4. However, unlike the
fly ash ternary mix this was also reflected in the standard consistency data that gave a
reduction in water demand.
At the 55% level, further improvements are seen in Figure 4.5. Given that the level of
fly ash and limestone remained at 10%, it appeared that it was the volume of GGBS that caused
this improvement. With regard to the ternary mixes an increase to 20% fly ash showed a
further reduction in SP dosage at both 0.35 and 0.5 w/c ratios, although little further
improvement was seen at 0.65 w/c ratio. These improvements, as with the 35% level, were not
noted in the standard consistency data that showed an increase in water demand with fly ash
level, contradicting the SP dosage demand in the concrete mixes. At this w/c ratio, the fines
content is lower and the high proportion of limestone is beneficial in reducing SP dosage, and
therefore water demand at this level. It is also possible however, that the standard consistence
does not indicate the same behaviour as admixture demand.

Ternary Combination Concretes Using GGBS, Fly Ash & Limestone: Strength, Permeation & Durability Properties
Chapter 4: Fresh Properties & Early Age Strength
100
Fig 4.3: SP dosage for binary mixes across the range of w/c ratios
Fig 4.4: SP dosage for 35% addition level mixes across the range of w/c ratios

Ternary Combination Concretes Using GGBS, Fly Ash & Limestone: Strength, Permeation & Durability Properties
Chapter 4: Fresh Properties & Early Age Strength
101
Fig 4.5: SP dosage for 55% addition level mixes across the range of w/c ratios
4.2.3 Rheology
Mindness & Young (1981) indicate that the water content of a mix is the single most
important factor in determining workability. However, whilst an increase in water content can
increase flow and compactability, it also leads to segregation and bleeding. The aim is to
produce a concrete that is cohesive and the careful choice and grading of aggregates is of
fundamental importance. Separation of the larger aggregates in the final mixing process can be
avoided when the aggregates are combined with a cohesive cement paste, indicated by the
viscosity tests. The viscosity of the cement paste would be indicative of the workability of the
concrete as a higher viscosity will mitigate against segregation.
Rheology was measured using a Brookfield viscometer on the various cement
combinations at 0.5w/c ratio. Data obtained from these tests were used to determine both the
plastic viscosity and yield stress of these mixes. It was initially intended to carry out the same
tests at 0.35 w/c ratio but the consistency of the paste did not allow the spindle of the

Ternary Combination Concretes Using GGBS, Fly Ash & Limestone: Strength, Permeation & Durability Properties
Chapter 4: Fresh Properties & Early Age Strength
102
viscometer to move within the paste. The yield stress is shown in Figure 4.6 and the plastic
viscosity in Figure 4.7. The former indicates the stress above which the concrete will become
fluid and begin to flow whilst the latter indicates how easily the concrete will flow once the
yield stress is overcome.
Fig 4.6: Calculated yield stress of paste mixes at 0.5 w/c ratio
Fig 4.7: Calculated plastic viscosity of paste mixes at 0.5 w/c ratio

Ternary Combination Concretes Using GGBS, Fly Ash & Limestone: Strength, Permeation & Durability Properties
Chapter 4: Fresh Properties & Early Age Strength
103
The CEM I control mix was calculated as the highest plastic viscosity at 0.69kgm-1s-1,
whilst its yield stress was 0.21N/mm2, the lowest for these mixes. The binary mix at the 35%
GGBS level gave a decrease in plastic viscosity to 0.44 kgm-1s-1, while the limestone ternary at
this level was only marginally higher at 0.45 kgm-1s-1 whilst its fly ash counterpart was markedly
lower at 0.39 kgm-1s-1. The yield stress at the 35% level was greater than that of the CEM I
control mix, increasing to 0.34N/mm2 for the binary and increasing further for the fly ash and
limestone ternary mixes, with the latter showing the greater increase of 0.4 N/mm2.
At the 55% level the increase in GGBS gave further increases in yield stress to 0.41
N/mm2. The ternary blends at this level followed the same trend as 35% level, increasing the
yield stress. The plastic viscosity for these mixes, however, decreased compared to the lower
level. An increase in GGBS level to 75% gave similar results to those at 55% for the binary
mixes, whilst the yield stress reduced. Though the structure of GGBS can vary depending on the
processing this is likely to be due to the structure of the GGBS particles themselves, whilst they
may appear angular in shape their surface is smooth and may allow them to move more freely.
Figure 4.8 shows the packing density against the yield stress of the tested paste
samples. The packing density is calculated using the previously discussed De Larrad method
based on the 0.5 w/c ratio to ensure that would be more comparative. At the lower to mid-
range addition level, an increase gives no difference in particle packing compared to the CEM I
control mix for the binary mixes and the limestone ternary mixes. However, the yield stress is
increased with the limestone addition increasing it further. The fly ash ternaries at the 35% and
55% replacement level give comparable packing density results to that of the 75% replacement
level mixes for both the binary and the two limestone ternary mixes. Indicating that the fly ash
improves packing density, as previously discussed, but there is no correlation with the yield
stress increasing also.
Overall the results indicate that the addition of finer materials such as GGBS increased
the yield stress of the cement paste. This is further increased with the inclusion of fly ash and
limestone to create ternary blends. Ferraris et al (2001) incorporated Ultra-fine Fly Ash (UFFA)

Ternary Combination Concretes Using GGBS, Fly Ash & Limestone: Strength, Permeation & Durability Properties
Chapter 4: Fresh Properties & Early Age Strength
104
in their study with similar results. It must however be noted that the properties of the
materials differ between Ferraris et al’s study and this one, specifically the fineness.
Fig 4.8: Packing density and yield stress comparison
4.2.4 Setting Time
Setting tests are used to evaluate comparative behaviour (Sleiman et al, 2009) assisting
in characterising how particle cement pastes change state which can be affected by
water/cement ratio and temperature (Eran et al, 1995) and the type of additions used.
Realistically, in a working environment, the hardening of a concrete must not be too soon as to
compromise its workability and becomes an important factor for consideration when
scheduling the phases of construction (Brooks et al, 2000). BS EN 197-1:2000 indicates that the
initial setting time for cement of strength class 42.5 N should be a minimum of 60 minutes, for
higher strength cement this is reduced to 45 minutes. It should, however, be noted that the
rate of setting and hardening is independent of strength gain. It is also a different property with
cement paste to that of hardening in concrete (Neville, 1995).
35% 55%

Ternary Combination Concretes Using GGBS, Fly Ash & Limestone: Strength, Permeation & Durability Properties
Chapter 4: Fresh Properties & Early Age Strength
105
Fig 4.8: Setting time of paste mixes

Ternary Combination Concretes Using GGBS, Fly Ash & Limestone: Strength, Permeation & Durability Properties
Chapter 4: Fresh Properties & Early Age Strength
106
Tests of setting time were carried out on selected paste mixes at both 0.35 and 0.5 w/c
ratios and are shown in Figures 4.8. As expected, all mixes at 0.35 w/c ratio started to set
earlier than at that of 0.5 w/c. In general, the initial setting times were comparable with the PC
control mix starting at 1hr 41mins, with the ternary mixes of the 0.35 w/c ratio mixes setting
within ± 10 minutes at 35% GGBS level. More significant differences were noted at 55% GGBS
where the start time for both the binary mix and that incorporating 10% fly ash exceeded 2hrs.
A similar increase in setting time with GGBS level was also found by Sivasundaram & Malhotra
(1992). The binary at this level (45/55) also took the longest time to reach a final setting time of
over 6 hours. The addition of 10% fly ash reduced the final setting time by just over an hour.
The addition of 10% limestone at this level gave different behaviour. Indeed, its initial setting
time was more comparable with the PC control, binaries and ternaries at the 35% level, taking
about 4 hours to reach final setting.
Hogan & Meusel (1981) reported that GGBS can delay the setting time when compared
to CEM I by 10 to 20 minutes for 10% addition, Yuan et al (1984) state that fly ash has a similar
retarding effect with 20 minutes more likely for 10% addition. The retardation is caused by the
delay in reaction. When the cement comes into contact with water in the first instance the
dissolution of some phases takes place rapidly, the liquid phase is generally controlled by the
calcium, sulfate, sodium and potassium ions in the resulting solution (Yuan et al, 1984).
Differences in the calcium and sulfate content can alter the rate of reaction and thus the
setting time. Fly ash itself has no cementitious properties until it comes into contact with water
in which it chemically reacts with Ca(OH2) to form compounds that are cementitious by nature,
it is activated by high alkali concentration and reacts with Ca to form gel.
With regards to GGBS, it is the CEM I that reacts initially with only a small quantity of
GGBS releasing calcium and aluminium ions into the solution. The quantity of limestone at the
lower replacement level counteracts the retardation effects of the GGBS resulting in reduced
final setting time. Ca(OH)2 is produced by the Portland cement, as a result of hydration, the
addition of GGBS reduces rate of Ca(OH)2 produced as it is consumed by the GGBS. Vuk et al
(2001) discussed the effects of limestone in decreasing setting time and suggests that this is
due to the C3S content in the clinker. Low C3S levels in the clinker were found to shorten the

Ternary Combination Concretes Using GGBS, Fly Ash & Limestone: Strength, Permeation & Durability Properties
Chapter 4: Fresh Properties & Early Age Strength
107
setting of limestone cements by 50 minutes, whilst a higher content decreased it by only 25
minutes (Vuk et al, 2001). At the higher addition level, the volume of GGBS reduces the lime
content. The latest setting time at 0.35 w/c ratio is that of the 75% GGBS binary mix, which did
not begin to set until 2hrs and 50 mins after initial mixing. At 0.5 w/c ratio, the start time for
this binary combination was comparable but the last to complete setting at 8hrs 7mins. The
45/45/10 limestone mix at 0.5 w/c ratio was comparable, to its 0.35 counterpart.
It was expected that the increase in w/c ratio to 0.5 would also increase the initial
setting time. The start time for setting for the other mixes at 0.5 w/c ratio were later, all after
3hrs but given the higher water cement ratio this is not unreasonable. On the whole it would
appear that the addition of GGBS extends setting time with the inclusion of 10% fly ash further
increasing this at the 35%, 55% and 65% levels, more significantly at 0.5 w/c ratio. The inclusion
of 10% limestone at the 35% level reduces the time elapsed between the start and finish of the
setting time test but this was not consistent at the 55% level, where it markedly increased.
4.3 Early Age Strength (up to 7 days)
By comparing the data for early age strength to that of 28 day strength in Figures 4.10
(paste) and 4.11 (concrete) it was seen that for all mix combinations at the lower 0.35 w/c
ratio, the strength recorded at 3 and 7 days was over 50% of the 28 day strength of each mix.
This also occurred for most of the mixes at higher w/c ratio (excluding the 65/25/10 limestone,
25/65/10 fly ash and the 25/40/35 limestone). At 3 day testing the CEM I had already reached
92% of its 28 day strength, due to its quicker reaction, or hydration properties. In comparison,
the paste mixes gave a higher percentage of 28 day strength at 0.35 w/c ratio, by 7 days the
binary and ternary paste mixes had reached over 70% of their 28 day test results. This higher
strength of the cement paste indicates the effects of the ITZ and the aggregate bond. Given
that the strength of concrete is dependent on the strength of the cement matrix and its bond
with the aggregate (Poon et al, 2004), the lower strength is indicative of the weaker phase in
the development of concrete and relies on further strength development over time.

Ternary Combination Concretes Using GGBS, Fly Ash & Limestone: Strength, Permeation & Durability Properties
Chapter 4: Fresh Properties & Early Age Strength
108
Fig 4.10: Percentage of early age paste strength compared to 28 days

Ternary Combination Concretes Using GGBS, Fly Ash & Limestone: Strength, Permeation & Durability Properties
Chapter 4: Fresh Properties & Early Age Strength
109
Fig 4.11: Percentage of early age concrete strength compared to 28days

Ternary Combination Concretes Using GGBS, Fly Ash & Limestone: Strength, Permeation & Durability Properties
Chapter 4: Fresh Properties & Early Age Strength
110
Paste mixes were only tested at 0.35 and 0.5 w/c ratios. At 3 days there is a general
difference range of 20-30% between mixes for both w/c ratios. The greatest difference appears
when 10% limestone or fly ash is added at the higher replacement levels in 55% and 75% GGBS
mixes. The mixes at the lower 35% level and all binary mixes tested, remained within a range of
22% ± 5 of CEM I. With a higher addition level for the ternary mixes (55% and 75%) there was
no improvement in early age strength of the cement paste. Improvements were seen at 7 days
as the strength continued to develop, where the strength of the binary and ternary mixes were
almost comparable with the CEM I.
It is evident that the ternary additions have an effect on the binary mix which becomes
more apparent if the w/CEM I ratio is considered at the early 3 day test age. Figure 4.12 shows
the effect of the fly ash and limestone at each of the binary levels across the w/CEM I ratio
range. At the lower 0.35 w/CEM I, ratio the difference in the strength across the binder ratios,
as the effect of the slow hydration of GGBS becomes increasingly apparent as the volume of
GGBS increases. At the lower GGBS level, where only 10% additions were used, a negative
effect was observed. The additional material slows strength development further. An increase
to the 55% level shows that the 10% fly ash improves early age strength marginally compared
to that of the other ternaries. At the higher replacement level the positive effect of the fly ash
was more evident as was an increase to 20% limestone. The strength effect of the ternary
mixes incorporating 10% fly ash was consistent across the range of w/c ratios. At the higher
w/c ratio 0.5, the effect of the binder ratio was less apparent and the results of the ternaries
were comparable, a similar trend occurred at 0.65 w/c ratio but at a lower strength.

Ternary Combination Concretes Using GGBS, Fly Ash & Limestone: Strength, Permeation & Durability Properties
Chapter 4: Fresh Properties & Early Age Strength
111
Fig 4.12: 3 day strength against water/CEM I across the range of combinations

Ternary Combination Concretes Using GGBS, Fly Ash & Limestone: Strength, Permeation & Durability Properties
Chapter 4: Fresh Properties & Early Age Strength
112
4.4 Time to Achieve 10N/mm2
The importance of achieving 10 N/mm2 refers to the striking of formwork that may
have to take place on site. In some circumstances this may be higher but 10 N/mm2 provides a
ballpark figure for comparison that is indicative of the behaviour of concrete. Depending on the
type of construction striking of formwork can be carried out any time after 12 hours or 4 days
and possibly longer for slabs. The purpose of the formwork is to ensure concrete is not
damaged during the vulnerable early stages and maintains its form until hardened sufficiently.
It was suggested by BS 8110 (1997) that the formwork can be removed on site if the strength of
concrete is equal, or greater than, 10 N/mm2, if this can be predicted efficiently then
construction phases may be better planned. By using a logarithmic scale the time it takes each
mix to achieve 10N/mm2 can be estimated and this is shown in Table 4.1.
Table 4.1: Estimated time to achieve 10N/mm2 strength
Expected time to achieve 10N/mm2 Strength
Days Hours
Combination 0.35 0.50 0.65 0.35 0.50 0.65
100% PC 0.20 0.34 0.74 4.80 8.10 17.70
65%PC + 35%GGBS 0.26 0.57 1.52 6.20 13.70 36.50
65%PC + 25%GGBS + 10%FA 0.32 0.66 3.00 7.60 15.90 72.00
65%PC + 25%GGBS + 10%LS 0.31 0.90 3.00 7.50 21.50 72.00
45%PC + 55% GGBS 0.34 0.97 3.15 8.10 23.20 75.70
45%PC + 45%GGBS + 10%FA 0.32 1.37 3.24 7.80 32.80 77.80
45%PC + 35%GGBS + 20%FA 0.51 1.37 3.00 12.10 32.80 72.00
45%PC + 45%GGBS + 10%LS 0.43 1.52 3.87 10.20 36.50 92.80
45%PC + 35%GGBS + 20%LS 0.40 1.70 4.47 9.60 40.80 107.30
25%PC + 75%GGBS 0.51 2.20 4.92 12.10 52.90 118.00
25%PC + 65%GGBS + 10%FA 0.32 0.90 4.99 7.80 21.50 119.70
25%PC + 55%GGBS + 20%FA 0.41 2.20 5.49 9.90 52.90 131.90
25%PC + 55%GGBS + 20%LS 0.84 3.98 7.94 20.10 95.50 190.60
25%PC + 40%GGBS + 35%LS 0.74 4.58 8.32 17.70 110.00 199.80

Ternary Combination Concretes Using GGBS, Fly Ash & Limestone: Strength, Permeation & Durability Properties
Chapter 4: Fresh Properties & Early Age Strength
113
It must be stressed, however, that these times shown in Table 4.1, are only an estimate
and whilst previous studies have used this method to extrapolate data it may be argued that
this is not a true representation of the development of strength in the early stages. It may well
be that the initial reaction of the GGBS causes a sudden, quicker increase before slowing in the
first few hours. In addition, whilst it is important to ascertain the strength of concrete, in
general, laboratory testing cannot provide a true representation of the environmental effects
that in situ concrete may endure. Such tests do not accurately reflect the strength
development of in situ concrete that is affected by a number of variables such as thickness of
slab, binder content and temperature. The purpose here is to provide a comparison between
the concrete.
Formwork is extensively used, creating further restrictions on the management of
construction projects and BS 8110 (1997) and CIRIA Report 136 (2004) lay out specific
guidelines on the striking of formwork in order to ensure a good sound structure. The
formwork protects the concrete during the early stages from damage and weather elements.
The standard recommends 4 days for the soffit formwork to slabs and 12hrs for vertical
formwork at an ambient temperature of 16oC. Shorter periods are acceptable for slabs and
beams only if their strength is equal to, or greater than 10 N/mm2 in situ, or twice the stress to
which they are being subjected (10 N/mm2 is usually the greater of these) 5N/mm2 is
acceptable for members in compression to protect against frost damage. Should, however, the
slab be less than 250mm in depth and have a length of at least 7.5m shorter periods than 4
days are not allowable. With this is mind it is evident that all mixes for 0.35 and 0.5 w/c ratio
were suitable when the time to 10N/mm2 is assumed to follow a logarithmic scale as is
suggested by Li & Zhao (2002). It must be remembered that this is hypothetical in this instance
and may not necessarily be the case but the test result for 3 days exceeded 10N/mm2 for all
these mixes and therefore definitely conformed to the 4 day restriction. It may be possible that
early strength development of concrete does not follow a logarithmic scale but gives a rapid
growth during the initial 24 hours, further tests would need to be carried out in a separate
study and would be needed to take place to confirm this before a decision is made as to the
best combination for vertical formwork requiring 12 hours to reach 10N/mm2. The British
standard recommendations are irrespective of binder type and a later report produced by

Ternary Combination Concretes Using GGBS, Fly Ash & Limestone: Strength, Permeation & Durability Properties
Chapter 4: Fresh Properties & Early Age Strength
114
CIRIA (CIRIA Report 136, 2004) provides tables for CEM I strength classes 42.5 and 52.5 only
and does not include materials such as GGBS or fly ash. Whilst the former ultimately provides
high strength at a later age it is recognised that incorporating GGBS with CEM I to provide a
binary blended concrete causes slower early age strength development which is clearly
indicated in Figures 4.13 to 4.15. In spite of this, however, a report by the Institution of Civil
Engineers (1994) on “Formwork Setting Times for GGBS Concretes” stated that “where only up
to 50% GGBS is used; the reduction in early age strength development has not presented
problems significant enough to prompt much field investigation.”
It has been well documented in previous studies that the effect of adding GGBS, and
indeed fly ash, whilst contributing to greater long-term strength development of concrete,
depresses early age strength. Despite delayed setting times, allowing for longer periods of
workability and a greater viscosity, requiring less energy for movement allowing for flowable
and easy placement of concrete, GGBS reacts at a slower rate, causing slower early age
strength gain. This can lead to problems with accelerated construction schedules when striking
of formwork at the earliest and safest convenience is important. Early studies assumed that the
early strength development of concretes followed a logarithmic relationship (Gonnermann &
Lerch, 1951; United States Bureau of Reclamation, 1975). It is therefore possible, by using the
early age strength data; to extrapolate the time it takes for each mix to achieve 10 N/mm2. Li &
Zhao (2002) also used a logarithmic scale to illustrate their strength data as described
previously in Chapter 2.
At the 35% GGBS level, the binary mix took longer than the CEM I control across the
range of w/c ratios. The addition of 10% limestone or fly ash, to create ternary mixes, further
increased the time to achieve 10N/mm2. At the 0.35 w/c ratio the results are comparable but at
0.5 w/c ratio, the limestone gave an increase of nearly 6 hrs. At the higher w/c ratio again fly
ash and limestone results were comparable.
An increase in GGBS replacement to 55% also increased the time to achieve 10 N/mm2
by 1.9hrs compared to 35% and 3.3hrs compared to CEM I at the 0.35 w/c ratio. As is the trend
across the range of w/c ratios the time to achieve 10 N/mm2 is increased, on occasion

Ternary Combination Concretes Using GGBS, Fly Ash & Limestone: Strength, Permeation & Durability Properties
Chapter 4: Fresh Properties & Early Age Strength
115
considerably, taking just 8.1hrs at 0.35 w/c ratio to 75.7hrs at the higher 0.65 w/c ratio. The
addition of 10% limestone did not improve the results, increasing the time further across the
range of w/c ratios. At 0.35 w/c ratio however, a slight decrease was recorded when 10% fly
ash was added. This was very slight and practically insignificant, at only 0.3hrs and only seen at
this w/c ratio, for others the time increased for the binary mix, but remained lower than the
10% limestone.
At the 55% level, 20% ternary additions were also tested. Increasing the fly ash to 20%
also increased the time to achieve 10 N/mm2 by 4 hours at the lower w/c ratio. The mid-range
fly ash results were comparable whilst at 0.65 w/c ratio the 20% fly ash had decreased by 6
hours. A decrease was also noted with the increase from 10% to 20% limestone at the lower
w/c ratio; it was however, negligible at less than 45 minutes. An increase in w/c ratio increased
the time to achieve 10 N/mm2 further.
At the 75% level, a 35% limestone ternary was introduced. The initial strength
development of this mix was similar to that of the 10% limestone, whilst the 20% ternary
reacted quicker which seemed to be the case across the three w/c ratios. The 10% fly ash mix
was comparable to the binary mix at the lower 0.35 w/c ratio, an increase to 0.5 w/c ratio
showed a better initial reaction for the 10% fly ash and a further increase to 0.65 w/c ratio
gives comparable results to the CEM I. Greater difference in the reaction was seen at 0.35 w/c
ratio and 0.5, the higher 0.65 w/c ratio has a much slower effect on strength development.
Unless the laboratory testing procedure can replicate the conditions of in situ concrete
differences will remain. One of the easiest variables to control is the temperature during the
curing process and unless this is controlled during curing differences will definitely occur
between cube strengths and in situ concrete, yet this itself is not controllable for in situ
concrete which can cure in temperatures exceeding 20oC and indeed, far below during winter
months. GGBS concretes are more sensitive to temperatures that CEM I concrete in that an
increase in temperature can improve the early age strength gain. An increase in curing
temperature to 40oC can increase this strength gain by a factor of 2 of 4 making GGBS

Ternary Combination Concretes Using GGBS, Fly Ash & Limestone: Strength, Permeation & Durability Properties
Chapter 4: Fresh Properties & Early Age Strength
116
concretes suitable for fast track construction and in many cases heat beds are used to
encourage and accelerate early age strength gain (Barnett et al, 1995).
Fig 4.13: Early age strength of concrete at 35% level

Ternary Combination Concretes Using GGBS, Fly Ash & Limestone: Strength, Permeation & Durability Properties
Chapter 4: Fresh Properties & Early Age Strength
117
Fig 4.14: Early age strength of concrete at 55% level

Ternary Combination Concretes Using GGBS, Fly Ash & Limestone: Strength, Permeation & Durability Properties
Chapter 4: Fresh Properties & Early Age Strength
118
Fig 4.15: Early age strength of concrete at 75% level

Ternary Combination Concretes Using GGBS, Fly Ash & Limestone: Strength, Permeation & Durability Properties
Chapter 4: Fresh Properties & Early Age Strength
119
4.5 Summary
This chapter examined the fresh and early age strength properties of both cement
paste and concrete combinations. From the paste mixes it was seen that water demand was
reduced for the binary mixes, compared to the CEM I. Whilst the addition of fly ash had the
effect of increasing water demand slightly, the limestone ternary mixes reduced it further
compared to their fly ash counterparts. This is supported by earlier work carried out by Vuk et
al (2001) that showed similar effects. The packing density was also improved for the binary
mixes.
A decrease in w/c ratio required an increase in SP dosage, which was not unexpected,
and varying dosages were required with differing cement additions. At the 0.35 w/c ratio a very
slight decrease in fines content, due to the cement additions, resulted in an increase in SP
dosage with increasing GGBS level for the binary mixes. Similar effects occurred at 0.5 and 0.65
w/c ratio but the range of SP dosage was less as this was increased. The addition of ternary
materials had the effect of reducing the SP dosage further across the range of GGBS levels and
this was more noticeable for the 0.65 w/c ratio concretes.
Yield stress, overall, increased with the inclusion of the finer GGBS for the binary mixes.
The inclusion of ternary additions increased the yield stress further with the limestone
producing higher yield stress than their fly ash counterparts across the range of GGBS levels.
The setting times of the tested paste mixes increased with w/c ratio. The setting times
of the binary mixes also increased with rising GGBS levels compared to the CEM I. At the lower
w/c ratio the addition of fly ash and limestone reduced the setting compared to the binary
mixes. However, an increase to 0.5 w/c ratio saw the fly ash ternary mixes increasing the
setting time further. The fly ash had a retarding effect that was exacerbated at high w/c ratio.
It was clear that the fly ash and limestone addition affected the early strength
development of concrete. At the lower w/c ratio for the lower level of GGBS this effect was
negative but with an increase in GGBS level the effects were generally more positive. Increasing
the w/c ratio to 0.5 and 0.65 reduced the effects that were seen at 0.35 w/c ratio.

Ternary Combination Concretes Using GGBS, Fly Ash & Limestone: Strength, Permeation & Durability Properties
Chapter 4: Fresh Properties & Early Age Strength
120
In addition to the early age strength the time to 10 N/mm2 was also discussed. In
relation to the construction process knowledge of this can assist in reducing construction time
by striking formwork at the most appropriate time so as to destroy the surface of the concrete.
The time to 10 N/mm2 was calculated and it was determined that by increasing the GGBS level
the time for concrete to reach 10 N/mm2 extends compared to CEM I concretes. The time was
further increased by rising w/c ratios where less of a difference in the rate of strength
development was seen across the range of mixes. The addition of ternary materials on the
whole had no improvement at the 35% level and negligible improvement at the 55% level. For
the 75% level, however, the initial strength development of the fly ash ternary concretes was
noticeably greater that the binary at the 0.35 w/c ratio.

Ternary Combination Concretes Using GGBS, Fly Ash & Limestone: Strength, Permeation & Durability Properties
Chapter 5: Compressive Strength
121
CHAPTER FIVE: COMPRESSIVE STRENGTH
5.1 Introduction
The strength of concrete is generally attributed to the calcium silicate hydrates (CSH)
produced during the reactions of the cementitious materials with water. With a CEM I/GGBS
binary mix the CEM I initially hydrates when water is added, with only a minor reaction from
GGBS (Ogawa et al, 1980). The GGBS reacts at a later stage with alkali hydroxide and then
calcium hydroxide produced by the CEM I, giving the GGBS binary concretes potential for
longer-term strength development. Both Muira & Iwaki (2000) and Aldea et al (2000) discussed
the two-stage reaction, but a number of factors affect the strength of concrete including, the
w/c ratio, the soundness of the aggregate, and its bond with the cement paste, and the glass
content (Tanaka et al 1983), as well as the chemical and physical properties of the material
(Roy, 1983).
The previous chapter discussed the fresh properties of cement combinations, both in
paste and concrete, before reviewing the early age strength (up to 7 days). It was noted that
the strength development for most mixes reached 50% of the 28 day strength by 7 days. This
chapter continues to examine strength development of concrete, considering behaviour up to
180 days, together with the environmental performance of the concretes with regard to their
embodied CO2.
Data obtained from the strength tests is then used to determine the binder cementing
efficiency. The required w/c ratio for each combination in order to attain an equivalent
strength of 40 N/mm2 is also determined. The widely reported effects of GGBS discussed in the
literature review (Chapter 2) were evident, as seen from the reported data. Indeed, the
inclusion of GGBS decreased water demand and increased long-term strength gain overall for
the binary mixes. As these are extensively covered in previous studies, it is the effects of the fly
ash and limestone additions, creating ternary mixes that are of key interest here.

Ternary Combination Concretes Using GGBS, Fly Ash & Limestone: Strength, Permeation & Durability Properties
Chapter 5: Compressive Strength
122
5.2 Compressive Strength
A 100% CEM I control mix was used to provide a benchmark against which the binary
and ternary mixes could be compared. It is well established that the addition of GGBS to
Portland cement causes a long-term strength gain (Hogan & Meusel, 1981; Roy, 1987). This is
due to the lower lime content of GGBS blended cements causing an initial slow hydration and
the production of more C-S-H as a result of the reaction, resulting in a denser microstructure in
the long-term. When combined with CEM I it is this material that begins to hydrate first,
releasing calcium hydroxides that react with the GGBS, to form C-S-H (ACI, 1994). Whilst there
are similarities in the chemical composition of cement and GGBS it is the higher silica content
and lower calcium content of the GGBS that is generally responsible for the hydration process.
The initial reaction that takes place leaves a coating on the surface of the finer slag particles
delaying both the dissolution of ions and further hydration (Detweiler et al, 1996). Babu and
Kumar (2000) evaluate the efficiency of the GGBS in cement in detail by comparing their
strength to that of Portland cement concretes.
5.2.1 35% GGBS Level
The results in Figure 5.1 show that at 0.35 w/c ratio and 35% GGBS level the ternary
mixes had considerably lower strength than the control mix at early ages. The binary mix at this
level however, had comparable strength to the CEM I control. A similar result was reported by
Swamy & Boukini (1990) who suggested that comparable strength can be produced with
correct mix proportioning. They stated that by using GGBS with a relatively low specific surface
area, concretes can be produced with a compressive strength that is comparable to Portland
cement by 28 days, but this combined with their coarser particle size distribution does not
contribute to early strength. Wan et al (2004) also state that compressive strength can increase
with the surface area of GGBS. By 28 days, the strength of the binary mix began to pass the
CEM I control. Both ternary blends, with the addition of 10% fly ash and limestone (at 0.35 w/c
ratio), gave a significant decrease in strength of almost 20N/mm2, when compared to the
control mix, across the test ages 28 to 180 days. Ramezanianpour et al (2009) tested a number
of mixes containing limestone and found that at a water/binder ratio of 0.37, a 10% limestone
addition gave comparable results to the CEM I control mix at the early test ages, but gave
slightly lower results at 28 days and suggested that this is likely to be due to the precipitate of

Ternary Combination Concretes Using GGBS, Fly Ash & Limestone: Strength, Permeation & Durability Properties
Chapter 5: Compressive Strength
123
calcium carboaluminate hydrates, that may form during hydration, and the acceleration of
hydration due to the effects of calcium carbonate (CaCO3) (Pera et al, 1999).
At 0.5 w/c ratio, the trend of binary mixes was similar to that at lower w/c ratio at 90
and 180 days, with the strength of the binary mix giving similar or increasing strength in
comparison to the CEM I control. In this case, the ternary concretes were closer to those of
both the CEM I control and binary than that of the lower 0.35 w/c ratio.
An increase in w/c ratio to 0.65 had the effect of reducing the compressive strength
results across the range of concretes at this addition level, including the CEM I control. By 28
days, the binary mix gave slight increases and this was greater at later test ages of 90 and 180
days than CEM I. The ternary concretes followed a similar pattern to that of the binary and
showed a marked increase at ages 90 and 180 days and comparable strengths to the CEM I and
binary mix at 28 days. The concrete with 10% fly ash gave the better results at this higher w/c
ratio suggesting that whilst the water to cementitious material volume is higher it is adverse to
the compressive strength of CEM I concrete it is beneficial to the reaction of the additional
material. The materials behaved more efficiently in terms of their reactions at these lower
levels. The overall strength of concrete made with a higher w/c ratio is lower as water not
consumed by the reaction of the materials remains in the pore spaces due to the lack of C-S-H
bonds, however the addition of GGBS and fly ash prolongs the reaction, thus increasing the
production of C-S-H bonds, over time reducing the space filled with excess water.
5.2.2 55% GGBS Level
The results for this GGBS level are shown in Figure 5.2. Unlike at 35% GGBS the binary
(45% PC and 55% GGBS) mix at 0.35 w/c ratio had markedly lower strength than that of the
CEM I control mix at all ages. The addition of 10% fly ash and limestone gave similar behaviour
from 3 to 180 days. Whilst being comparable from 3 to 28 days, these concretes gave
considerably lower strength than those of the binary at 90 and 180 days. When compared to
the corresponding concretes at the 10% level the introduction of 20% fly ash and limestone had
little effect on strength at 0.35 w/c ratio.

Ternary Combination Concretes Using GGBS, Fly Ash & Limestone: Strength, Permeation & Durability Properties
Chapter 5: Compressive Strength
124
Fig 5.1: Compressive strength at 35% addition level

Ternary Combination Concretes Using GGBS, Fly Ash & Limestone: Strength, Permeation & Durability Properties
Chapter 5: Compressive Strength
125
Fig 5.2: Compressive strength at 55% addition level

Ternary Combination Concretes Using GGBS, Fly Ash & Limestone: Strength, Permeation & Durability Properties
Chapter 5: Compressive Strength
126
At 0.5 w/c ratio, the binary mix at this level was significantly lower in strength than the
CEM I control mix up to 28 days. It was not until 90 days that the strength was comparable to
the control mix, and at 180 days a slight increase was noted. The 10% fly ash and limestone
ternary mixes gave similar results to those of the binary, and only slightly lower strength than
the CEM I control mix at the later test ages. When 20% fly ash and limestone were added to the
mix this had a detrimental effect on strength, giving significant reductions at all ages, compared
to both the 10% ternary mixes (which were comparable to the binary) and the CEM I control
mix.
At 0.65 w/c ratio, the binary mix at the earlier test ages was lower than the CEM I
control. By 90 days, the strength had improved and was greater than this by 180 days. At 3 and
7 days, the ternary mixes with 10% fly ash and limestone remained lower than the CEM I
control, but comparable to the binary mix. Whilst the 10% limestone ternary mix remained
lower than the CEM I control mix at 28 days, the 10% fly ash ternary mix had improved with an
increase in strength clearly noted. By 90 days, the 10% limestone mix had caught up with its fly
ash counterpart and both had higher results than the CEM I control and binary concretes. This
continued to 180 days where they gave a significant improvement in compressive strength. The
20% addition of both fly ash and limestone gave no improvement compared to 10% addition.
The 28 day strengths were comparable to those of the binary concretes for 10% limestone and
at 90 and 180 days they were lower. The 20% limestone was lower than the binary but better
than the CEM I at this higher w/c ratio. The 20% fly ash mix remained lower than the 10% fly
ash throughout testing.
5.2.3 75% GGBS Level
At all w/c ratios, the binary mixes remained lower in strength than the CEM I control at
all test ages. Only at 180 days with the 0.65 w/c ratio, did the strength become comparable.
The greatest difference between the two concretes was at the 0.35 w/c ratio.
The 10% ternary blends did not give improvements and indeed were significantly lower
than the binary mixes at 0.35 w/c ratio. This difference was less at 0.5 w/c ratio and at the 0.65
w/c ratio the ternary blend concretes were comparable to the binary mix.

Ternary Combination Concretes Using GGBS, Fly Ash & Limestone: Strength, Permeation & Durability Properties
Chapter 5: Compressive Strength
127
Fig 5.3: Compressive strength at 75% addition level

Ternary Combination Concretes Using GGBS, Fly Ash & Limestone: Strength, Permeation & Durability Properties
Chapter 5: Compressive Strength
128
The 20% addition of limestone and fly ash gave no real difference, remaining
significantly lower in the case of the 20% limestone blend, than the binary. The difference was
less at 0.5 w/c ratio and at 0.65; the 180 day test result concrete indicates that the 20% fly ash
mix was slightly greater than that of the binary concrete.
At this level, 35% limestone addition was introduced to the concrete mixes. The
strength results gave a similar pattern to the other concretes, with greater reductions
compared to the binary and CEM I control noted. The difference between the 20% and the 35%
limestone ternary mixes was greatest at the 0.35 w/c ratio.
5.2.4 Effects of ternary materials
The effects of the GGBS binary concretes were noted, with their slower rate of early
strength development and increase in long term strength clearly shown. The increase in
addition level indicated a diluting effect, as the GGBS volume increased the strength decreased
(Menendez et al, 2003). GGBS, whilst possessing cementitious properties, requires an activator
to hydrate effectively (Heikal et al, 2000). In its simplest terms, when CEM I initially hydrates it
produces alkalis and releases free lime that enables the activation of GGBS. The lower volume
of CEM I, with increasing GGBS content, restricts the availability of free lime and alkalis, thus
limiting the production of C-S-H and strength development (Heikal et al, 2000).
In the case of the fly ash ternary mixes, competition for lime is created between this
and GGBS and is the likely cause for the reduction in compressive strength for the lower w/c
ratio mixes. Both GGBS and fly ash require lime to enable their reaction and the formation of C-
S-H (Heikal et al, 2000). An increase in w/c ratio increased reaction and hence the production
of free lime by the CEM I resulting in reduced competition. A difference is clearer with an
increase in fly ash at the higher replacement levels. The 10% fly ash ternary at the 55% level
seemed of little consequence, the volume of GGBS was sufficient to reduce the effects of
competition from the limited fly ash. An increase to 20% fly ash, however, inhibits strength
development, as it competes for the lime with the GGBS.

Ternary Combination Concretes Using GGBS, Fly Ash & Limestone: Strength, Permeation & Durability Properties
Chapter 5: Compressive Strength
129
It was anticipated that the addition of limestone to create ternary mixes would
improve the initial strength development of GGBS as suggested by Menendez et al (2003),
providing a greater quantity of limestone to assist in the reaction of GGBS. However, at the
lower replacement level, the addition of 10% limestone was of no positive benefit when
compared to the binary. In fact, it had the negative effect of reducing strength, making the mix
comparable with its 10% fly ash counterpart. This contradicted the study of Menendez et al
(2003) who showed that a mix consisting of 55% CEM I + 35% GGBS + 10% limestone had a
higher compressive strength, than a CEM I control at 3 and 7 days for a mix with a w/c ratio of
0.5. Menendez et al (2003) attributed the increase to the acceleration of hydration at an early
age. Whilst it does not have pozzolanic properties, or produce C-S-H, limestone acts as
nucleation sites of calcium hydroxide during early hydration accelerating the hydration of C3S
(Pera et al, 1999). The strength of their mix was shown to be considerably improved compared
to the binary mix, making it comparable, if not slightly improved compared to the CEM I.
Whilst this effect was not seen at the lower replacement level, it may be accountable
for the increase in strength at the 55% level, more clearly seen with an increase in w/c ratio to
0.65, indicating that the reaction of limestone is dependent on the volume of water available
for hydration (Menendez et al, 2003). The 10% limestone ternary mix at this level is comparable
with the binary, and shows a slight improvement at early ages. This is further supported by
Mun et al (2007), although their study was carried out on mortar. They suggest the
improvement, in this instance, is due to limestone reducing the film formation on the surface
of the GGBS particles by producing alkali during early hydration, thus destroying an acid film
formed during initial hydration (Detweiler et al, 1996) and promoting hydration products. The
limestone substitutes sulfate for ettringite promoting the hydration of GGBS (Singh & Garg,
1995).
It is unclear why there are contradictions between Menendez et al’s findings and those
reported in this study. It may be due to differences in the properties of materials used. Tsivilis
et al (1999) suggested that the influence of limestone depends on the C3A content of the
clinker. In Chapter 3, the reported properties of the CEM I used in this study showed a C3A

Ternary Combination Concretes Using GGBS, Fly Ash & Limestone: Strength, Permeation & Durability Properties
Chapter 5: Compressive Strength
130
value of 5.8%, much higher than the 2% reported by Menendez et al. Vuk et al (2001) also
suggest that the C3S content can also affect the limestone. The CEM I used in this study
reported higher C3S than that of Menendez et al, 65.6% and 58% respectively. The fineness
may also be of importance (Pera et al, 1999) as the finer materials can aid the packing and
formation of a denser structure, improving the strength of concrete.
5.4 Cement Additions Efficiency Factor
Past studies have used compressive strength data to determine cementing efficiency.
As early as 1967, Smith discussed the effect of fly ash and assumed it to have a cementing
efficiency, in which a weight of fly ash would be equivalent to a weight of cement, thus
determining an effective water cement ratio using the following formula:
CKFc
w
KFC
wcw s
/1
1/
[Eq 5.1]
Where:
W = weight of free water
C = weight of cement
F = weight of fly ash
w/cs = effective water cement ratio of a concrete with regard to its strength
K = cementing efficiency of an fly ash relative to cement
Smith used a value of 0.25 for K (Smith, 1967). Wong & Razak (2005) refer to Smith’s
work and assumed K to be unique for each type of fly ash used in the study. But whilst 0.25 was
suitable for Smith’s study, a constant K factor does not exist, Papadakis & Tsimas (2002) found
that the K value for fly ash with low calcium to be 0.5 at 28 days.
Babu & Rama Kumar (2000) studied the efficiency of GGBS by using a variation on the
28 day strength to w/c ratio relationship. Smith’s formula was adapted for GGBS by replacing F
with G for GGBS. Babu & Rama Kumar calculated that at 28 days the overall strength efficiency
factor varied from 1.29 to 0.7 for the range of GGBS levels from 10% to 80%.

Ternary Combination Concretes Using GGBS, Fly Ash & Limestone: Strength, Permeation & Durability Properties
Chapter 5: Compressive Strength
131
Whilst these papers followed similar formulae, Byars’ study in 1995 used a simpler
determination of the binder cementing efficiency. By using the following formula, a binder
cementing efficiency was calculated based on the content of cement additions.
c
tfcKc
[Eq 5.2]
Where:
Kc = cementing efficiency
fc(t) = strength at a specific age
c = cement content
All of these previous studies refer to binary mixes and to date no studies have reported
the efficiency of ternary blends. Whilst a binary mix can be related, or compared directly to its
corresponding CEM I, a ternary mix needs to be examined to assess the effects of the third
cementing addition compared to a binary mix. With this is mind Byars’ equation can be
adapted to find the relative binder efficiency for ternary mixes.
cem
bcem
Kc
KcR
b
tbin
Kc
KcR
[Eq 5.3]
Where:
Rcem = efficiency relative to CEM I
Rbin = efficiency relative to the binary mix of a specific addition level
Kccem = cementing efficiency of CEM I
Kcb = cementing efficiency of binary mix
Kct = Cementing efficiency of ternary mix
To this end, the cementing efficiency has been calculated for both binary mixes relative to CEM
I and ternary mixes relative to binary mixes at the specific level, and w/c ratio, and is shown in
Figures 5.4 to 5.7.

Ternary Combination Concretes Using GGBS, Fly Ash & Limestone: Strength, Permeation & Durability Properties
Chapter 5: Compressive Strength
132
5.4.1 Binary Cementing Efficiency
By examining the calculated cementing efficiency, the effects of the additional
materials become more apparent. It is seen from the binary mixes in Figure 5.4 that at the
lower w/c ratio, beyond 28 days the 35% level had become more efficient in strength gain than
55% and 75% levels. An increase to 0.5 w/c ratio shows, that whilst the 35% level is still
efficient beyond 28 days, it is not as obvious and the lower volume of materials to water has
improved the 55% replacement level making it more comparable for the longer-term, 180 days.
Babu & Kumar (2000) reviewed a number of earlier studies and found that for a concrete with
30% of GGBS, the average efficiency at 28 days was 1.02 across a range of w/c ratios from 0.26
to 0.55. Whilst this study had a wider range of w/c ratios (0.35 to 0.65), the relative cementing
efficiency of the 35% replacement level was similar to that reported by Babu & Kumar.
An increase in w/c ratio has a very clear effect on the cementing efficiency at early
ages. This improved markedly at the 55% level and it appears that the increase in w/c ratio
aided the hydration of the CEM I, to produce Ca(OH)2 and activate the GGBS. The rate of
pozzolanic reaction clearly depends on the availability of water and lime; this is further
indicated at the 75% replacement level, which does not match the development of strength for
the other mixes. The diluting effect of the binary materials means that there is insufficient lime
being produced by the limited volume of CEM I, available for reaction. The high w/c ratio did
finally indicate comparable results by 180 days for this mix, compared to the CEM I.
Wong & Razak (2005) state that the reaction of GGBS gives no immediate or obvious
strength enhancement. They also state that the loss in strength is proportional to the GGBS
level, also reflecting a dilution effect and the slow rate of pozzolanic reaction. In addition,
Wong & Razak (2005) claimed that the w/c ratio did not affect efficiency, but it is clear from
this study that there was an effect. However, Wong & Razak’s study covered a limited range of
0.27 to 0.33 w/c ratio. It is therefore clear that greater increases in w/c ratio affects the
cementing efficiency of the mix combinations.

Ternary Combination Concretes Using GGBS, Fly Ash & Limestone: Strength, Permeation & Durability Properties
Chapter 5: Compressive Strength
133
Fig 5.4: Binder cementing efficiency for binary levels relative to CEM I

Ternary Combination Concretes Using GGBS, Fly Ash & Limestone: Strength, Permeation & Durability Properties
Chapter 5: Compressive Strength
134
5.4.2 Ternary Cementing Efficiency
Earlier studies have previously shown cementing efficiencies for binary mixes and these
have been discussed in the context of this study already. It is here that the ternary mixes will be
compared to the binary mixes, as shown in Figures 5.5 to 5.7, to examine the effect of these
additional materials.
At the lower 35% level for the 0.35 w/c ratio, it is clear that the effect of both fly ash
and limestone additions was negative. In general, this was also the case for the 0.5 w/c ratio.
However, the 10% fly ash mix did have an initial effect of increasing cementing efficiency at 3
days. This efficiency increased with w/c ratio and was maintained throughout the 180 day
testing. As discussed earlier, the fly ash is likely to compete with GGBS for lime, and an increase
in w/c ratio causes a higher rate of initial hydration, acting as a nucleation site, of the CEM I,
producing sufficient lime Ca(OH)2 for both additions (Menendez et al, 2003). With regard to the
limestone ternary, it is more likely that, given its ability to fill pore spaces, creating a denser
microstructure, this is the cause of the initial strength, together with the provision of additional
lime for reaction with the GGBS.
An increase to the 55% level indicated improvements in cementing efficiency at earlier
ages for the majority of mixes. The reaction of fly ash at the earlier ages, combined with that of
GGBS, had increased cementing efficiency, but with an increase in time, the competition for
lime increased, as less was being produced by the hydrating CEM I, and the cementing
efficiency decreased, yet remained higher than the binary, or at least comparable, across the
range of w/c ratios. The increase in 20% fly ash increases competition thus reducing the
cementing efficiency. The limestone addition followed a similar trend to the fly ash ternary
mixes. Figure 5.7 shows that an increase in replacement level to 75% reduces the cementing
efficiency for the lower 0.35 w/c ratio. The fly ash ternary mixes were comparable at early ages,
and the 20% fly ash remained comparable through to 180 days. With an increase in w/c ratio,
the early cementing efficiencies were clearly improved up to 28 days for the 10% and 20% fly
ash more significantly for the former at 3 days. This may be due to two factors. The first being
that competition for lime, with the GGBS, may not occur initially as there is sufficient lime being
produced by the hydrating CEM I, hence the sudden drop in cementing efficiency at 7 days,

Ternary Combination Concretes Using GGBS, Fly Ash & Limestone: Strength, Permeation & Durability Properties
Chapter 5: Compressive Strength
135
when hydration of the CEM I begins to slow and therefore the production of lime is reduced.
Secondly, it may also be due to a filler effect similar to that of the limestone, where it is filling
pores within the structure to create a denser microstructure improving strength at this early
age.
Fig 5.5: Binder cementing efficiency at 35% addition level relative to binary mix

Ternary Combination Concretes Using GGBS, Fly Ash & Limestone: Strength, Permeation & Durability Properties
Chapter 5: Compressive Strength
136
Fig 5.6: Binder cementing efficiency at 55% addition level relative to binary mix

Ternary Combination Concretes Using GGBS, Fly Ash & Limestone: Strength, Permeation & Durability Properties
Chapter 5: Compressive Strength
137
Fig 5.7: Binder cementing efficiency at 75% addition level relative to binary mix

Ternary Combination Concretes Using GGBS, Fly Ash & Limestone: Strength, Permeation & Durability Properties
Chapter 5: Compressive Strength
138
5.5 Equivalent Strength of 40 N/mm2
It evident from the results of the binder cementing efficiency that in order for binary or
ternary mixes to reach an equivalent strength at 28 days to that of CEM I, the w/c ratio requires
modification, in accordance with the content and type of additions used for each mix
combination. Papadakis & Tsimas (2002) use the k-value to calculate the possible w/c ratio for
binary mixes, as did Smith (1967) and then Wong & Razak (2005) subsequently. Given that test
results provide data for each mix at 28 days, it is possible to interpolate to an equivalent
strength of 40N/mm2 at 28 days by plotting the strength data for each addition level, to give a
required w/c ratio as shown in Table 5.1. This equivalent strength was chosen, as it is the
specified minimum strength class limit for the majority of exposure classes in BS 85000-1. The
w/c ratio can be assumed to be the point at which the 40N/mm2 strength intersects the
reported data for 28 days plotted across the range of w/c ratios as shown in Figure 5.8.
Table 5.1: Water cement ratio for equivalent strength of 40N/mm2 at 28 days
Combination Water cement ratio
100% PC 0.57
65%PC + 35%GGBS 0.41
65%PC + 25%GGBS + 10%FA 0.53
65%PC + 25%GGBS + 10%LS 0.5
45%PC + 55% GGBS 0.49
45%PC + 45%GGBS + 10%FA 0.56
45%PC + 35%GGBS + 20%FA 0.47
45%PC + 45%GGBS + 10%LS 0.5
45%PC + 35%GGBS + 20%LS 0.46
25%PC + 75%GGBS 0.44
25%PC + 65%GGBS + 10%FA 0.43
25%PC + 55%GGBS + 20%FA 0.42
25%PC + 65%GGBS + 10%LS 0.25
25%PC + 55%GGBS + 20%LS 0.38
25%PC + 40%GGBS + 35%LS 0.28

Ternary Combination Concretes Using GGBS, Fly Ash & Limestone: Strength, Permeation & Durability Properties
Chapter 5: Compressive Strength
139
Fig 5.8: Equivalent strength of 40N/mm2 at 28 days

Ternary Combination Concretes Using GGBS, Fly Ash & Limestone: Strength, Permeation & Durability Properties
Chapter 5: Compressive Strength
140
It was determined that the CEM I required a w/c ratio of 0.58 in order to achieve a
strength of 40 N/mm2 at 28 days. By adding 35% GGBS, the required w/c ratio reduced to 0.43
but rose at 55% level to 0.48 before reducing again at the 75% level to 0.41. The reduction in
w/c ratio with the addition of GGBS was reasonable; however, it might have been expected to
reduce w/c ratio as the GGBS level increased. It is unclear how the slight increase at the 55%
level occurred, although it still remains lower than the CEM I. This may be due to the gradient
of the plotted curve and therefore not truly indicative of the equivalent strength. There is a
difference in strength from 0.35 to 0.5 w/c ratio and it has already been discussed that an
increase in w/c ratio to 0.5 improved the 55% level significantly, compared to that at 0.35 w/c
ratio.
The addition of ternary materials at the 35% level indicated that a w/c ratio of 0.5
would be required to achieve an equivalent strength of 40 N/mm2. A lower w/c ratio would
give a higher strength at this level of addition. At the 55% level, the 10% additions again
showed an increased water demand, whilst the 20% additions indicated a reduction in water
demand to less than the binary. For the 75% level, the inclusion of fly ash as a ternary material
had the effect of increasing the w/c ratio slightly. The 10% and 35% limestone additions did not
give results due to the low recorded strengths across the range of w/c ratios, whilst the 20%
limestone provided a lower water demand from those recorded. This is likely to be due to the
reported results plotted to give a lower gradient of curve as shown in Figure 5.8 (c).
Fly ash, as a binary material when used with CEM I, is reported to reduce the water
demand, in turn allowing a lower w/c ratio, attributed to by the spherical shape of the fly ash
particles (Stuart et al, 1980), but when used as a 10% ternary addition the water demand is
slightly increased at the 35% and 55% levels. The pozzolanic activity of the fly ash is minimal
with the 10% addition. However, a 20% fly addition at the 55% level did indicate an improved
strength gain with a lower w/c ratio required to reach an equivalent strength of 40N/mm2.
Using a lower w/c ratio can result in some offset against strength reduction. In order to match
strength at 28 days with a lower w/c ratio 20% fly ash would be recommended for both the
35% and 55% levels. This is also true of the limestone addition. The limestone generally acts as
a filler between the CEM I and GGBS particles, reducing the space available for water. These

Ternary Combination Concretes Using GGBS, Fly Ash & Limestone: Strength, Permeation & Durability Properties
Chapter 5: Compressive Strength
141
estimations indicate simply the changes to w/c ratio that may be required in order to match
strength and are influenced by reactivity of the materials and packing. In all cases the water
would be fixed at 165ml/m3 and it would mean adjusted the volume of materials to meet the
required w/c ratio.
5.6 Strength and Packing Density
The development of compressive strength is due to the chemical reaction between
cement and water creating bonds between the materials. This hydration process leads to
products forming including C-S-H that fills voids within concrete. The voids vary and may be
caused by spaces that remain after excess water has been removed, and whilst hydration
products fill many of these voids, some remain and are detrimental to the strength of the
concrete. Neville stated that a lower number of voids provide a denser concrete with greater
strength (Neville, 1995). However, on review of the data, this did not necessarily follow. Whilst
the combination of additions reduced the voids ratio overall, not in all cases did the strength
improve.
It was expected that all GGBS levels would increase the w/c ratio to achieve 40 N/mm2
and would result in an increase in voids ratio. The voids ratio, itself, corresponds to the solid
material before any effects of water (hydration or reaction) have taken place and is based on
the theoretical model proposed by De Larrard discussed in Chapter 3 (3.7.2). The excess water
fills spaces where C-S-H bonds have not formed, increasing the void ratio and decreasing the
strength of concrete. The volume of solid material reduces with the increase in w/c ratio and
therefore the packing density may reduce. The use of a vibration plate during the casting
process reduces the formation of voids from entrapped air but there still remains opportunity
for voids to be present if this has not been done effectively, indeed not all air will be removed
effectively. Due to the varying fineness of the materials also, as the volume of GGBS and
ternary additions increased, the voids ratio decreased.
For the 35% addition level, shown in Figure 5.9, as with the other levels, the reduction
in voids ratio with the addition of finer material, compared to the CEM I, is clear. The lower

Ternary Combination Concretes Using GGBS, Fly Ash & Limestone: Strength, Permeation & Durability Properties
Chapter 5: Compressive Strength
142
voids ratio and comparable strength was seen for the binary mix at 28 days, across the range of
w/c ratios, but with the addition of ternary at the lower w/c ratio, despite a reduction in voids
ratio, there was no improvement in strength. An increase to 0.5 w/c ratio did give more
comparable results for both ternary mixes but they did remain more than the binary and CEM I.
At the 0.65 w/c ratio, an increasing voids ratio had the effect of increasing strength of both
ternary mixes, improving it compared to the binary mix. The void ratio is dependent on the
packing of the solids within the matrix and not the formation of the concrete microstructure
itself. However, the reactivity of the materials is important in relation to the developing
structure, as a result of the reaction of GGBS more C-S-H is produced to fill the pore spaces
reducing voids within the concrete and in turn creating a stronger matrix.
By 180 days, (Figure 5.9) the strength has increased due to greater reactivity over the
longer term, but the same trend occurred, as at 28 days for the 0.35 w/c ratio. An improvement
is seen at 0.5 w/c ratio, with the binary mix increasing strength compared to CEM I, whilst the
ternary mixes both remained slightly lower. As previously discussed, an increase in w/c ratio to
0.65 indicated the better improvement at this replacement level allbeit still a lower strength
than the mixes at the other two w/c ratios, it is still higher than the CEM I.
As already discussed, an increase in the GGBS level affects the compressive strength
and this depends on the w/c ratio. At 28 days with 55% replacement the voids ratio is lower for
both the binary and the ternary mixes but no improvement was seen compared to the CEM I
mix at the lower 0.35 w/c ratio, although they are comparable with each other. As seen with
the 35% level, an increase to 0.5 w/c ratio showed little improvement again and a further
increase to 0.65 w/c ratio makes all mixes more comparable, in terms of the strength, with the
CEM I with the exception of the 10% fly ash ternary that was slightly improved. This ternary mix
was clearly the better at this test age across the range of w/c ratios and yet by 180 days the
behaviour changed.

Ternary Combination Concretes Using GGBS, Fly Ash & Limestone: Strength, Permeation & Durability Properties
Chapter 5: Compressive Strength
143
Fig 5.9: Strength and void ratio of 35% addition level mixes
0.35
0.5
0.65
0.35
0.5
0.65

Ternary Combination Concretes Using GGBS, Fly Ash & Limestone: Strength, Permeation & Durability Properties
Chapter 5: Compressive Strength
144
At 0.35 w/c ratio, the binary and ternary mixes were consistently lower than the CEM I
despite their lower voids ratio. An increase to 0.5 w/c ratio at 180 days showed the binary and
both 10% ternary mixes to be comparable if not slightly improved with regards to the strength
of CEM I. The increase to 0.65 w/c ratio had the effect of improving the 10% ternary mixes
beyond both the binary and the CEM I concretes, with the 10% limestone slightly higher than
the fly ash. The 20% additions did little to improve the long-term strength of the concrete. The
longer curing time allowed for further reactivity of the cement paste,with the hydration
products filling some of the cement and water-filled space. Capillary voids are created and in
high w/c ratio concrete these can be a large as 3 to 5µm, thus affecting the overall strength of
concrete adversely. For lower 0.35 w/c ratio, the capillary voids range from 10 to 50nm (Mehta
& Monteiro, 2006).
An increase in addition level to 75%, whilst reducing the voids ratio slightly, gave no
improvement in compressive strength at all w/c ratios at 28 days, as the strength depends on
the reactivity of the powder. The longer curing period to 180 days also gave poor results for the
combination mixes. At 0.65 w/c ratio, the compressive strengh increased with the 20% fly ash
comparable with the CEM I in this instance, as shown in Figure 5.11. It is likely that the fly ash
and the GGBS are both competing for the limited amount of Ca(OH)2 being produced by the
CEM I, given its reduced volume, the increase in w/c ratio may be aiding the reaction of the
combined materials, yet it is widely established that both materials reduce water requirements
to produce a standard consistency as discussed previously, in Chapter 4.

Ternary Combination Concretes Using GGBS, Fly Ash & Limestone: Strength, Permeation & Durability Properties
Chapter 5: Compressive Strength
145
Fig 5.10: Strength and void ratio of 55% addition level mixes
0.65 0.5
0.35
0.65
0.5
0.35

Ternary Combination Concretes Using GGBS, Fly Ash & Limestone: Strength, Permeation & Durability Properties
Chapter 5: Compressive Strength
146
Fig 5.11: Strength and void ratio of 75% additions level mixes
0.65 0.5
0.35
0.65
0.5
0.35

Ternary Combination Concretes Using GGBS, Fly Ash & Limestone: Strength, Permeation & Durability Properties
Chapter 5: Compressive Strength
147
5.7 Relationship Between Concrete and the Cement Paste Matrix
5.7.1 Compressive Strength
Selected cement pastes samples were cast and tested for compressive strength in
order to ascertain the existence of any correlation between them and their concrete
counterparts. The significant difference between the concrete and the cement paste would be
the addition of aggregates creating an interfacial transition zone between them and the
cement paste within the concrete structure. This being the only significant difference one may
expect some correlation and indeed, that does seem to be the case on face value, when
examining the samples collectively as shown in Figure 5.12.
Fig 5.12: Comparison of compressive strength of paste and concrete sample
In general it would appear that the compressive strength of concrete increased with
that of the cement paste samples tested for both w/c ratios and test ages. However, when
viewed independently in Figure 5.13, it is observed that the rate of increase is dependent on
the cement addition and level of replacement. Whilst the trends are similar no assumption can

Ternary Combination Concretes Using GGBS, Fly Ash & Limestone: Strength, Permeation & Durability Properties
Chapter 5: Compressive Strength
148
be made, furthermore, no mathematical model was developed in order to predict the
compressive strength of concrete from that of its cement paste counterpart.
Fig 5.13: Compressive strength of concrete against paste samples

Ternary Combination Concretes Using GGBS, Fly Ash & Limestone: Strength, Permeation & Durability Properties
Chapter 5: Compressive Strength
149
5.7.2 Strength-Porosity Relationship
There are a number of factors influencing the compressive strength of concrete, in
addition to the more obvious loading parameters one must also take into consideration the
internal structure of the concrete including the cement paste matrix and the interfacial
transition zone. Figure 5.14 summarises the influential variables affecting the strength of
concrete. It is clear that porosity is a notable factor affecting the strength of concrete. Kumar &
Bhattacharjee (2003) discuss the well-established Abrams rule that both strength and porosity
depend upon w/c ratio as per the following expression:
[Eq 5.4]
Where w/c is the w/c ratio and k1 and k2 are empirical constants.
Fig 5.14: Influential factors of concrete strength ( Mehta & Monteiro, 2004)

Ternary Combination Concretes Using GGBS, Fly Ash & Limestone: Strength, Permeation & Durability Properties
Chapter 5: Compressive Strength
150
Kearsley & Wainwright discuss a number of variations on Abram’s basic principle, many of
which take into consideration the sir content and degree of hydration (Kearsley & Wainwright,
2002). However, Kumar & Bhattacharjee argue that indirect relationships such as pores present
within the hardened concrete matrix due to poorly compacted materials, the changing pore
system with degree of hydration and chemical changes are generally overlooked (Kumar &
Bhatacharjee, 2003). As Neville & Brooks state, most expressions assume that the fresh cement
is fully compacted thus containing no accidental or entrapped air. They further state that
porosity’s corresponding relationship with strength is independent of whether the capillary
pores within the concrete strength, are full of water or empty. This would depend on the w/c
ratio of the mix design or indeed whether any additional water ingresses during hydration
(Neville & Brooks, 2007). With regards to concrete samples used in this study the mixing
process involved the use of a vibration table to mitigate any effects from inadequate
compaction, all samples were cured in a curing tank for durations of 3, 7, 28, 90 and 180 days
undergoing the same preparations for each test performed to limit variables.
As previously discussed one of the obvious differences between cement paste and
concrete is the aggregate that creates the ITZ. Whilst the porosity of the cement matrix during
hydration is key, a diagrammatic representation based on the proportions by volume of the
constituent materials before and during hydration as per Neville & Brooks (2007) is shown in
Figure 5.15, the w/ ratio governs the porosity of the ITZ hence its relationship with strength. It
is therefore postulated by many that there is an inverse relationship between porosity and the
compressive strength of concrete (Kearsley & Wainwirght, 2002; Kumar & Bhattacharjee, 2003;
Mehta & Monteiro, 2007). This relationship is expressed by the following equation:
[Eq 5.5]
Where S is the strength of the material which has a given porosity p
So is the intrinsic strength at zero porosity
K is constant

Ternary Combination Concretes Using GGBS, Fly Ash & Limestone: Strength, Permeation & Durability Properties
Chapter 5: Compressive Strength
151
Fig 5.15: Diagrammatic representation of the volumetric proportions of the composite materials before hydration (a) and during hydration (b)
Naturally the porosity of concrete is likely to affect other properties with regards to
durability and permeation and these will be discussed in subsequent chapters. The porosity
was determined by Mercury Intrusion Porosimetry (MIP) on selected paste samples at 28 and
90 days. Both the critical pore size and the total effective porosity were determined using this
method but Kumar & Bhattacharjee state that there are a number of factors that need to be
taken into consideration. The extent of the porosity depends on the nature of the pores, the
size of the smallest pores likely to be present and also the maximum intrusion pressure applied.
Whilst this may be apparent it may well mean that gel pores and indeed, closed pores, can
remain non-intruded (Kumar & Bhattacharjee, 2003). The MIP also disregards the true size of
the pore measuring only its entry size, referred to by Diamond as the “ink bottle” effect
(Diamond, 2000).
Figure 5.16 shows the compressive strength against porosity for the 35% replacement
level compared to the CEM I control mix for both the lower and mid-range w/c ratios. It is
evident that for each mix combination, as porosity decreased strength increased over time,
thus concurring with the authors previous discussed. As the w/c ratio increased from 0.35 (a) to
0.5 (b) the porosity is greater and the strength is lower, as would be expected with the excess
(a) (b)

Ternary Combination Concretes Using GGBS, Fly Ash & Limestone: Strength, Permeation & Durability Properties
Chapter 5: Compressive Strength
152
water often being trapped within the concrete matrix forming capillary pores over time. The
higher porosity, measured at 3 days, decreases as the hydration product are formed, the larger
capillary pores become filled with, what Mehta & Monteiro describe as, (microporous?)
hydration products that are characterised by a finer pore network (Mehta & Monteiro, 2007).
Fig 5.16: Cube strength aginast total porosity at the 35% replacement level
The effects of the additional materials is seen at the 35% replacement level as the
binary mix shows both lower porosity and increased strength than the CEM I control mix by 90
days for both w/c ratios. The effect of both ternary additions is clearer for the lower w/c ratio.
Whilst they have improved porosity the strength, though increasing with age, cannot compete
with that of the binary mix. The increase in w/c ratio gave far more comparable results by 90
days clearly indicative of the effects of additional water within the capillary pores with reduced
strength and higher porosity than the lower w/c ratio. The additional material has improved
the porosity compared to the CEM I due to increased hydration products, namely C-S-H gel,
being formed within the capillary pores. From a practical perspective, given that the ternary
combinations are comparable with the CEM I for both strength and porosity by 90 days at the

Ternary Combination Concretes Using GGBS, Fly Ash & Limestone: Strength, Permeation & Durability Properties
Chapter 5: Compressive Strength
153
higher w/c ratio it would make them worthy of greater consideration if they were to also meet
with additional criteria depending of the location and exposure conditions for the structure’s
location.
An increase in replacement level to 55% gives a greater difference in results whilst the
strength-porosity relationship is still seen within the specific, individual combination mixes as
shown in Figure 5.17.
Fig 5.18: Cube strength aginast total porosity at the 55% replacement level
The 10% limestone ternary concrete may be disregarded with pore results, higher
porosity and lower strength for both w/c ratios as its effectiveness as an inert filler are no
longer apparent as they were at the lower replacement levels. At the lower w/c ratio the 10%
fly ash does not give as high strength results by 90 days as the CEM I or the binary concrete, but
its porosity is lower and the strength recorded is still sufficient for consideration in a practical
context. The lower porosity may bring with it additional benefits that may well mean that a
slightly lower strength is worth a trade-off for better permeation and durability; these will be

Ternary Combination Concretes Using GGBS, Fly Ash & Limestone: Strength, Permeation & Durability Properties
Chapter 5: Compressive Strength
154
discussed in subsequent chapters. Certainly, with an increase to 0.5 w/c ratio the 10% fly ash is
comparable with the CEM I and binary concretes.
5.9 Summary
In this chapter the strength properties were discussed in relation to the effects of the
ternary additions. Overall it was seen that an increase in w/c ratio reduced the compressive
strength of the concretes.
As the GGBS levels increased, the strength decreased due to the slower reaction of
GGBS. However, longer-term strength gain was improved for the 35% GGBS level, which
exceeded that of CEM I concrete. For the 55% and 75% levels a lower w/c ratio was necessary
for this effect to have occurred by 180 days.
At the 35% GGBS level the addition of fly ash and limestone was of little benefit to the
concretes, indeed, at the lower w/c ratio a negative effect was seen. With regards to the fly
ash, its inclusion created competition with the GGBS for the free lime being produced by the
hydrating CEM I. The limestone created a diluting effect, reducing the volume of active
materials within the concrete. Increases in w/c ratios improved the ternary concretes relative
to the CEM I, indicating the importance of the greater availability of water within the mix for
the reaction of the ternary materials, but at 0.5 w/c ratio the strength was still lower than the
0.35 w/c ratio mixes.
The addition of ternary materials to the concretes did show an increased rate of early
strength development for the 75% GGBS level at the higher w/c ratios where the early strength
was seen to be higher than the binary concretes.
It was found that in order for all concretes to reach an equivalent strength of 40
N/mm2 by 28 days varying w/c ratios would be required. In general it was found that the lower
w/c ratio would be needed for the binary mixes compared to the CEM I concretes, illustrating
further the different rate of strength development and the effects of w/c ratio.

Ternary Combination Concretes Using GGBS, Fly Ash & Limestone: Strength, Permeation & Durability Properties
Chapter 5: Compressive Strength
155
Further, it was found that when each combination was viewed independently, though
the concrete strength increased with that of the cement paste counterpart, the increase was
dependant on both the additional material and level of replacement. Concurring with previous
studies (Kearsley & Wainwright, 2002; Kumar & Bhatacharjee, 2003; Mehta & Montiero, 2004)
a relationship between strength and porosity was found for the selected samples tested with
the 10% fly ash ternary mix giving comparable results to that of the CEM I by 90 days for both
replacement levels at 0.5 w/c ratio.

Ternary Combination Concretes Using GGBS, Fly Ash & Limestone: Strength, Permeation & Durability Properties
Chapter 6: Absorption & Capillary Rise
156
CHAPTER SIX: ABSORPTION & CAPILLARY RISE
6.1 Introduction
The previous chapter discussed the possible strength-porosity relationship seen in
concrete, introducing the effects of porosity and the pore structure within the concrete matrix.
Whilst strength plays an important role in the overall durability of concrete, the latter is a
function of permeation properties and is dependent therefore, on the ease at which a gas or
liquid can migrate through concrete. It is therefore the microstructure of both the cement
paste and the paste-aggregate interfacial zone that are influential (Garboczi, 1990 and Basheer
et al, 2005), both of which are dynamic and change with time and environmental conditions.
This chapter will examine the absorption characteristics of the test concretes by measuring
initial surface absorption and sorptivity. These indicate the ability of concrete to take in a liquid
and will be examined in relation to additional properties including porosity and compressive
strength.
Within the hydrated cement paste are three main pore types: gel pores, capillary pores
and air voids. Pipilikaki & Beazi-Katsioti (2009) distinguish the types of pores found within the
microstructure. Those greater than 10,000 nm are air voids, or entrained air. Capillary pores
can be one or two orders of magnitude greater than gel pores and represents spaces not filled
by solid components of the hydrated cement paste (Pipilikaki & Beazi-Katsioti, 2009). The size
of capillary pores depends on the distance between un-hydrated cement particles and the
degree of hydration. It is the type and size of the pores within the microstructure of the
concrete that affects transportation processes. Large capillaries, or macro-pores, range in size
from 50 to 10,000 nm and it is these pores that have greatest impact on the transportation
processes. Medium capillaries, or micro-pores, have sizes from 10 to 50 nm and gel pores from
2.5 to 10 nm, the former of which influence permeation. The gel pores are the interlayer spaces
in the C-S-H but do not contribute significantly to the absorption of water due to their small
size, they are generally about 3nm in diameter. Table 6.1, extracted from Mindess et al (2003),

Ternary Combination Concretes Using GGBS, Fly Ash & Limestone: Strength, Permeation & Durability Properties
Chapter 6: Absorption & Capillary Rise
157
classifies pores according to size and form of water within the pore together with the property
that is generally affected.
Table 6.1: Pores within the concrete matrix (Mindess et al, 2003)
Name Diameter Role of Water Affected Properties
Micro-pores
"inter layer” G
el P
ore
s Up to 0.5 nm Structural water
involved in bonding
Shrinkage, creep at all
relative humidity
Micro-pores
0.5nm to 2.5nm Strongly adsorbed
water; no menisci
form
Shrinkage, creep at all
relative humidity
Small (gel)
capillaries
Cap
illar
y p
ore
s
2.5nm to 10nm Strong surface tension
forces generated
Shrinkage between 50%
and 80% relative
humidity
Medium
capillaries
10nm to 50nm Moderate surface
tension forces
generated
Strength, permeability,
shrinkage at high relative
humidity, >80%
Large capillaries 50nm to 10µm Behaves as bulk water Strength, permeability
Entrained air 0.1mm to 1mm N/A Strength
The porosity of concrete is defined by Neville (1995) as the total volume of pores larger
than the gel pores which will include capillary pores, both macro and micro. It is suggested by
Mehta & Monteiro (2006) that a cement paste with a low w/c ratio will have micro-pores,
whilst higher w/c ratios produce capillary pores as large as 3 to 5 µm. Entrapped or entrained
air can both cause air voids, while capillary pores are generally irregular in shape, these are
normally spherical (Mehta & Monteiro, 2006). Due to their size they are also capable of
adversely affecting the strength of concrete. The critical pores size refers to the most
frequently occurring diameter that allows maximum percolation of fluids through cement paste
(Winslow & Diamond, 1970).
Within the microstructure itself, the interfacial zone is said to be the most porous and
weaker and will therefore give the least resistance to any migrating gases or liquids. This zone
can be as much as 33-50% of the total volume of the hardened cement paste (Basheer et al,
2009). In addition to these voids, an interlayer space exists within the C-S-H and whilst Powers
(1958) suggested that it accounts for 28% porosity in the solid C-S-H, Feldman & Beaudoin

Ternary Combination Concretes Using GGBS, Fly Ash & Limestone: Strength, Permeation & Durability Properties
Chapter 6: Absorption & Capillary Rise
158
(1976) stated that this interlayer space can vary from 5 to 25Å, consequently it is too small to
significantly impact the permeation of concrete.
6.2 Absorption Tests
All concrete mixes were tested for both initial surface absorption (ISAT) and capillary
rise. The former is a standard test carried out in accordance with BS 1881: Part 206-1996 and
data from this was supplemented by sorptivity results from the capillary-rise tests. Lea (1998)
stated that absorption by any concrete, regardless of the mix, is a function of the drying
temperature and immersion duration. In order to control these variables standard test
procedures are necessary and hence the methodology outlined in Chapter 3 was adopted. It is
worth noting that the preconditioning of the samples for each test differs. For the ISAT the
concrete samples were oven dried to a constant weight unlike the samples for sorptivity tests
that were unsaturated and air dried, prior to testing.
The initial surface absorption test (ISAT) is probably one of the most widely used tests
(Kumar & Bhattacharjee, 2002 and Bungey, 1989) enabling an assessment of the outer zone of
concrete that offers protection to embedded steel. Whilst cover can be as much as 50mm the
test tends to only cover the first few millimetres. The test measures uniaxial water penetration
characteristics of a dry concrete surface under a low pressure of about 200mm head of water.
The head of water is used as it provides conditions considered worse than the severest weather
exposure created by heavy driving rain (Kumar & Bhattacharjee, 2002). The wetting of concrete
surfaces from rain or splashing occur frequently due to capillary suction, e.g. in highway or
coastal structures, thus making the transport of fluids through the material by this means, a
primary parameter regarding the durability of any concrete. The absorption of water into the
concrete can cause a number of problems. Solutes transported by the water can cause
corrosion of reinforcement and water within the concrete can create freeze-thaw effects
(Neville, 1995).
Whilst it is possible to carryout ISAT in-situ, tests are generally only carried out under
laboratory conditions. The tests for this study were carried out in accordance with BS 1881:

Ternary Combination Concretes Using GGBS, Fly Ash & Limestone: Strength, Permeation & Durability Properties
Chapter 6: Absorption & Capillary Rise
159
Part 206:1996, as discussed in Chapter 3, at both 28 and 180 days. The test is applied to a single
surface which makes it ideal for use as a non-destructive test as well as a laboratory
permeation assessment and is derived from a method developed by Levitt’s (1969)
permeability tests for roofing tiles. The data is obtained by a force that is created as a result of
the water surface tension within the capillary pores. As with all tests, the CEM I control mix
provided a bench mark with which to compare the binary and ternary blends. It is also
expected that the results will be indicative of the physical properties as well as the chemical
effects of the binary and ternary materials such as the reactivity of the limestone and the
delayed hydration of pozzolanic materials. Although the test is also carried at 30 and 60
minutes the calibrated ISAT-10 values are discussed as these adequately represent the
absorption trends observed for all concrete samples across the range of w/c ratios and addition
levels for both 28 and 180 day test ages. The data is discussed in relation to the void ratio and
the w/c ratio in order to determine if a relationship exists and to observe any indication of the
reactivity and physical properties of the materials used. Table 6.2 outlines the typical ISAT
rankings or classifications for well cured concretes as per the Concrete Society (1991). These
values have been indicated on the relevant charts to illustrate where the results lie with
regards to these recommended values. Subsequent sections will look at the combined concrete
mixes in relation to the activity of the ternary materials when they are examined in relation to
the CEM I control mix, compressive strength and critical pore size.
Table 6.2: Typical ISAT values of well-cured oven dried concrete (Concrete Society,1991)
ISAT ml/m2/s
10min 30min 60min
High >0.50 >0.35 >0.20
Average 0.25-0.50 0.17-0.35 0.10-0.20
Low <0.25 <0.17 <0.10
In addition to ISAT, sorptivity tests were carried out to supplement the data. This test
was also performed on selected cement paste samples, the results of which will be discussed in
subsequent sections. Kelham (1988) suggests that sorption force is inversely proportional to

Ternary Combination Concretes Using GGBS, Fly Ash & Limestone: Strength, Permeation & Durability Properties
Chapter 6: Absorption & Capillary Rise
160
the pore diameter, effectively the smaller the pore diameter, then the higher the sorptivity.
With this in mind the porosity of selected combinations will again be examined to test this
theory in respect of the additions used. Matys & Ferraris (1997) state that the sorptivity
coefficient is essential to predict the service life of a concrete structure and thus enable
improvements to its performance. The test itself, according to Dias (2000), is more reflective of
how concrete, in a practical environment, is penetrated by deleterious agents and water as it is
tested in an unsaturated condition as opposed to the oven dried ISAT samples. The samples are
tested under these conditions as the test measures the intake of water by capillary suction and
this can only take place in a partially dry sample, sorption of water will not occur in either a
completely dry sample or in a saturated one. The moisture condition is hard to control and
hence the results can be prone to variability.
6.2.1 35% GGBS Level
At the 35% GGBS level, the binary mixes across the range of w/c ratios were
comparable with the CEM I control mix at 28 and 180 days, as shown in Figure 6.1. The addition
of 10% fly ash increased the ISAT-10 value across all w/c ratios marginally, while the 10%
limestone was comparable with CEM I and slightly higher than the binary, but lower than the
fly ash at 0.35 w/c ratio.
By 180 days the trend was the same but more noticeable, with improvements in all
cases on the 28 day results. This may be due to the fly ash reacting poorly with the lower w/c
ratio this is likely to be due to a higher quantity of cementitious materials resulting in less
efficiency in terms of the actual quantity reacting. The binary concrete gave the lowest
absorption of all mixes at this GGBS level which is comparable to the 10% limestone at the 0.35
w/c ratio. At the lower, 0.35 w/c ratio the sorptivity gave a similar trend as indicated in Figure
6.3, which was more noticeable and this appears to be the case across the range of w/c ratios
in general. At 28 days at both 0.5 and 0.65 w/c ratios, the 10% fly ash ternary mix indicated
higher sorptivity values but lower ISAT values. By 180 days these reduced and were consistent
with the findings of the ISAT at this later test age but the differences for the fly ash concretes
are relatively small.

Ternary Combination Concretes Using GGBS, Fly Ash & Limestone: Strength, Permeation & Durability Properties
Chapter 6: Absorption & Capillary Rise
161
Fig 6.1: ISAT-10 indicating absorption across the range of water cement ratios
at the 35% addition level.
Low
Average
High
Low
Average
High

Ternary Combination Concretes Using GGBS, Fly Ash & Limestone: Strength, Permeation & Durability Properties
Chapter 6: Absorption & Capillary Rise
162
It is unclear why this difference occurred, but it may have been due to the nature of
the tests and possibly the preconditioning. The sorptivity test relies on the absorption of water
through capillary rise and its calculation is determined on the weight of the specimen at given
times. The base of the specimen sat in water to a depth of 3 to 5mm creating a larger area for
absorption, compared to the ISAT test, where a limited area was subjected to a 200mm head of
water. At an early age it may be that due to the slower reaction of both the GGBS and fly ash,
as they compete for the lime hydration had slowed, with the higher w/c ratio more water is
available from the mix filling the voids creating more voids when the specimen is dried.
At 0.5 w/c ratio, the ISAT trend at 28 and 180 days was the same as that of 0.35 w/c
ratio. The CEM I concrete showed higher ISAT-10 values, whereas the binary mix was reduced
and comparable with the 10% limestone ternary mix, with the 10% fly ash mix giving the lowest
ISAT-10. The 0.65 w/c ratio gave the same trend as the 0.5 for both test ages, but with
noticeably higher values.
When compared to the calculated voids ratio in Figure 6.2, the ISAT results show
clearly that the binary and ternary mixes have a lower voids ratio than that of CEM I concretes
across the range of w/c ratios. The fineness of the limestone aids in creating a denser
microstructure as it is suggested that it is an inert filler and contributes little cementitiously
(Menendez et al, 2003). It appears that it is the physical characteristics, as in the fineness, of
the limestone that allows for improved initial surface absorption at the earlier (28 day) test
age. At this time, the pozzolanic materials are likely to have limited contribution. By 180 days,
pozzolanic reactivity has greatly increased, contributed to by the GGBS and the fly ash also to
some extent, and thus the initial surface absorption is further improved.
The lower 0.35 w/c ratio indicate a reduced voids ratio for the binary and ternary
mixes, suggesting a better packing density when compared to the CEM I. Except for the 10% fly
ash which gave slightly higher results, as already discussed, the results are comparable. The
voids ratio for the binary and ternary mixes was lower than CEM I across the range of w/c
ratios, as expected. At 0.5 and 0.65 w/c ratios, the ISAT values of the ternary mixes were
comparable and lower, respectively, than the binary and CEM I concretes. A similar trend

Ternary Combination Concretes Using GGBS, Fly Ash & Limestone: Strength, Permeation & Durability Properties
Chapter 6: Absorption & Capillary Rise
163
occurs at 180 days, but the 10% fly ash had improved to give lower results than its limestone
counterpart. Whereas, the limestone acts as inert filler, the fly ash creates further pozzolanic
reactions within the concrete, despite competition for the free lime with GGBS. Capillary pores
have been reduced by the formation of secondary C-S-H as suggested by Ghrici et al (2007),
thus reducing the ISAT.
Fig 6.2: Comparison of ISAT-10 and voids ratio across the range of water cement ratios
at the 35% addition level.
Low
Average
High
Low
Average
High
0.35
0.5
0.65
0.35
0.5
0.65

Ternary Combination Concretes Using GGBS, Fly Ash & Limestone: Strength, Permeation & Durability Properties
Chapter 6: Absorption & Capillary Rise
164
The ISAT tests were supported by the sorptivity tests, the results of which are shown in
Figure 6.3. The binary mixes appear to give better sorptivity at the earlier 28 day test age but
the later test age of 180 days indicates improvements, with the 10% fly ash at the higher w/c
ratios giving better results. The reaction between the 10% fly ash and water gave reduced
sorptivity, this may indicate that at the lower w/c ratio the fly ash acts more as an inert filler,
hence the better results from the limestone than fly ash due to the limited lime available from
the hydrating CEM I reacting with the GGBS. Although fixed at 165ml/m3 there was more water
in the mix, compared to the volume of materials, allowing for increased hydration products,
thus more lime is available allowing both GGBS and fly ash to react. It was clear from the
results that a 10% limestone addition had no significant effect in reducing the sorptivity further
than achieved with the binary mix when compared to CEM I concrete. This was also noted with
the ISAT results and suggests that for absorption properties, at this GGBS level, the limestone
makes little contribution although its value as an inert filler has been noted (Ramezanianpour
et al, 2009).
Ghrici et al (2007) studied the effects of limestone with CEM I and a natural pozzolana
sourced from the Beni-Saf quarry in western Algeria. As with the results from this study these
authors reported that a reduction in w/c ratio decreased the sorptivity of the mixes (their study
included 0.4 and 0.6 w/c ratio) and this was further reduced over time. The effect of w/c ratio
was further indicated when a 15% limestone binary mix was tested. In this case, the mix was
comparable with the CEM I mix at the 0.6 w/c ratio at 28 days and slightly reduced by 180 days.
The lower w/c ratio had the effect of reducing the sorptivity value significantly although it
remained higher than the natural pozzolana binary and ternary mixes. Indicating that when
used alone, limestone is not as effective as when used with an additional material at higher w/c
ratio. Tsivilis et al (2003) found similar effects and stated that a 15% addition of limestone at a
high w/c ratio had little effect on the sorptivity of concrete.

Ternary Combination Concretes Using GGBS, Fly Ash & Limestone: Strength, Permeation & Durability Properties
Chapter 6: Absorption & Capillary Rise
165
Fig 6.3: Sorptivity of 35% GGBS level concretes

Ternary Combination Concretes Using GGBS, Fly Ash & Limestone: Strength, Permeation & Durability Properties
Chapter 6: Absorption & Capillary Rise
166
6.2.2 55% GGBS Replacement Level
Figure 6.4 shows that for the 55% GGBS level the binary mixes were marginally lower
when compared to the CEM I mix at the 0.35 and 0.5 w/c ratios, with a greater difference
noted at 0.65 w/c ratio. At 28 days, the ternary mixes gave much higher ISAT values than both
the binary and CEM I concretes. The fly ash and limestone additions were comparable at 0.5
w/c ratio, with the fly ash mix showing slightly higher results at 0.35 w/c ratio. For both 0.35
and 0.5 w/c ratios, the 10% fly ash gave lower ISAT values than the 20% fly ash. With an
increase to 0.65 w/c ratio, this reversed with 20% fly ash giving lower values than 10% with the
former comparable with the 10% limestone ternary. Given that the difference in these mixes
was the w/c ratio and the level of aggregates, it may be that the increase in w/c ratio has a
positive effect in improving the reactivity of the fly ash. A greater volume of aggregates would
create greater ITZ which can result in increased porosity so this is not the likely cause.
At the 0.65 w/c ratio, the volume of cementitious materials is lower and the volume of
CEM I hydrating will produce limited lime, available to react with both the GGBS and fly ash,
increasing competition between them compared to the lower addition level. At the lower and
mid range w/c ratio, it would appear that the reaction is slower and competition is higher, and
more water has aided the reaction of the materials having the effect of producing more C-S-H
to fill the pores thus reducing ISAT values for the 20% level replacement. However, whether
this reduction is as a result of the GGBS or the fly ash reaction is unclear, they react differently
but compete for the same hydration product for activation, the free lime.
By 180 days, the ISAT values reduced, due to a greater level of reaction across the
range of w/c ratios and combinations, as expected, but the levels of improvement differ as
shown in Figure 6.4. An increase from 0.35 to 0.5 w/c ratio shows all mixes to be lower than
CEM I, with the 10% fly ash giving a slightly lower ISAT value than the others. With a further
increase to 0.65 w/c ratio, a more noticeable reduction was observed for the binary and
ternary concretes compared to CEM I, indicating further reaction attributed to GGBS. The 20%
fly ash is comparable with the binary mix, but there was little difference between any of these
mixes.
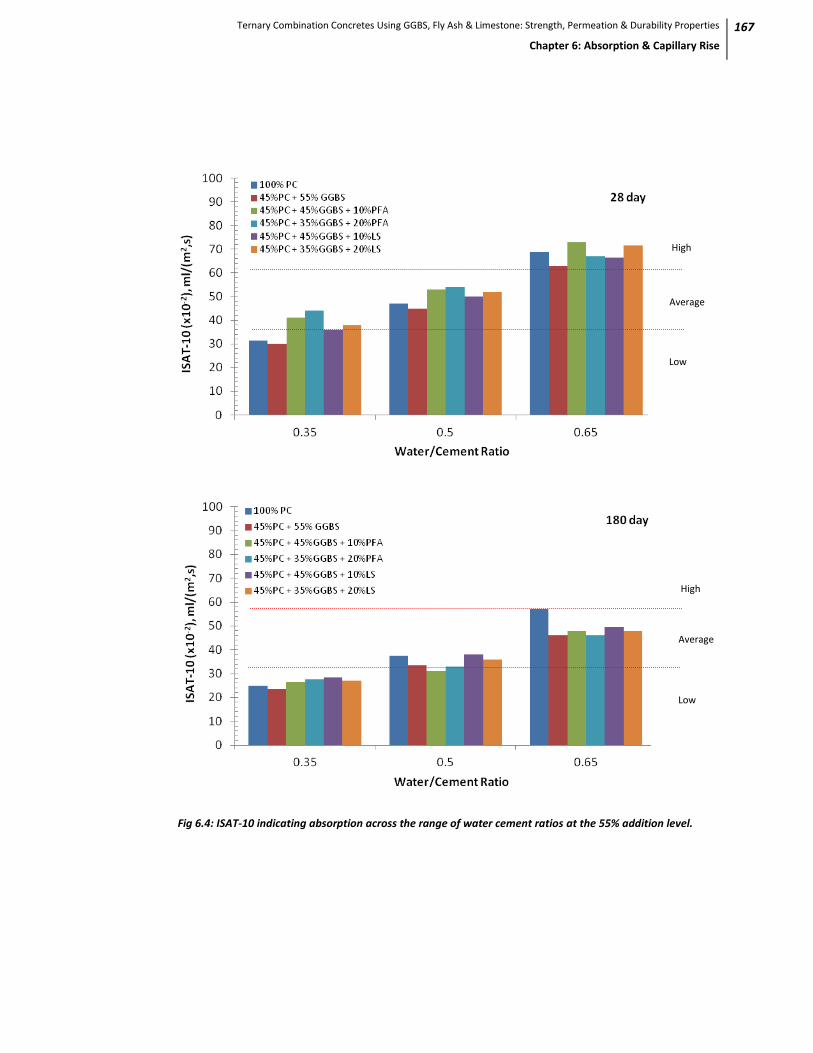
Ternary Combination Concretes Using GGBS, Fly Ash & Limestone: Strength, Permeation & Durability Properties
Chapter 6: Absorption & Capillary Rise
167
Fig 6.4: ISAT-10 indicating absorption across the range of water cement ratios at the 55% addition level.
Low
Average
High
Low
Average
High

Ternary Combination Concretes Using GGBS, Fly Ash & Limestone: Strength, Permeation & Durability Properties
Chapter 6: Absorption & Capillary Rise
168
As seen at the 35% level, the decrease in voids ratio with the additional material does
not necessarily correspond to the ISAT values. Figure 6.5 compares the voids ratio and the ISAT
values at the 55% GGBS level, which indicates that at the lower 0.35 w/c ratio, whilst the binary
mix gave an ISAT value comparable to the CEM I concrete with a lower voids ratio, the ternary
mixes gave increased values, with both 10% and 20% fly ash giving the highest results at this
w/c ratio.
The increase in w/c ratio to 0.5 gave higher ISAT values, as expected with the binary
mix still comparable to CEM I. The ternary mixes were higher but had similar values. A further
increase to 0.65 w/c ratio gave improved ISAT values for the 20% fly ash and 10% limestone
ternary compared with the other ternary mixes. Despite this, the values were still “high” ISAT
values at this test age. A longer curing period of 180 days improved the ISAT values across the
range of mixes and w/c ratios, with the majority falling within the average ranking but it is clear
that the voids ratio does not relate to the ISAT values.
Whilst voids ratio is calculated based on the mix design, it is more appropriate to
consider the actual measured critical pore diameter of the cement paste, and the developed
microstructure. Transport of water through concrete depends on the porosity of the capillaries,
as previously discussed and the connectivity and pore structure also affects the transportation
of water (Ramezanianpour et al, 2009) which are influenced by the w/c ratio and degree of
hydration.
The effect of w/c ratio on the ISAT values was noticeable with regard to the effect of
the additions. It would appear that this can be attributed to the disconnection of pores at the
lower to mid range w/c ratio. With an increase to 0.65 w/c ratio Irassar (2009) states that
capillary disconnection is harder, the capillary pores are more connected allowing water to be
absorbed more readily. By 180 days, with the extended period, the binary and ternary mixes
have produced more C-S-H to fill the voids within the microstructure, thus aiding in the
disconnection of the capillary pores.

Ternary Combination Concretes Using GGBS, Fly Ash & Limestone: Strength, Permeation & Durability Properties
Chapter 6: Absorption & Capillary Rise
169
Fig 6.5: ISAT-10 against void ratio across the range of water cement ratios
at the 55% addition level.
Low
Average
High
Low
Average
High

Ternary Combination Concretes Using GGBS, Fly Ash & Limestone: Strength, Permeation & Durability Properties
Chapter 6: Absorption & Capillary Rise
170
Fig 6.6: Sorptivity of 55% GGBS level concretes

Ternary Combination Concretes Using GGBS, Fly Ash & Limestone: Strength, Permeation & Durability Properties
Chapter 6: Absorption & Capillary Rise
171
6.2.3 75% GGBS Level
Figure 6.7 shows the ISAT results for the 75% GGBS level. At 28 days, the CEM I control
mix gave the lowest value, compared with the binary and ternary mixes, across the range of
w/c ratios. At the 0.65 w/c ratio, the 10% fly ash ternary concrete was comparable with that of
CEM I. The binary mix was higher than CEM I concrete, but gave lower absorption than the
ternary mixes at 0.35 and 0.5 w/c ratios and, at 0.65 w/c ratio, was marginally higher than that
with 10% fly ash (the only ternary concrete that improved compared to the binary mix). When
compared to the ISAT values, the sorptivity tests indicate different behaviour. The higher fly
ash level in the ternary concrete gave improved sorptivity at 28 days, as shown in Figure 6.8.
The 10% fly ash was equal to the binary mix and the 20% fly ash lower, though still higher than
CEM I at the 0.35 w/c ratio. An increase in w/c ratio reduced the sorptivity of both these mixes
considerably compared to their counterparts at the 55% replacement level as shown in Figure
6.10.
By 180 days, the CEM I concrete remained low for both 0.35 and 0.5 w/c ratios, whilst
the 0.35 w/c ratio mixes with 10% limestone ternary mixes gave the lowest ISAT results,
marginally lower than the CEM I. At 0.5 w/c ratio, this ternary blend concrete was much higher,
whilst the 10% fly ash ternary mix was only slightly higher than the CEM I. At 0.65 w/c ratio, the
10% limestone ternary mix again was the lowest and comparable with the binary.
A similar pattern was seen at 180 days for the fly ash concretes but age certainly
improved the effects of the limestone at 0.35 and 0.5 w/c ratios. This may suggest that the
limestone is either acting as an inert filler more effectively in the remaining pores after
hydration (although this is not seen so obviously in other tests), or may not be as inert as
initially believed and contribute to the reactivity of the combined materials (Ramezanianpour
et al, 2009). These concretes are seen to be comparable if not lower than all other mixes. For
the mixes with the 0.65 w/c ratio, the 10% limestone ternary concrete had the lowest
sorptivity, the additional two limestone ternary concretes (20% and 35%) were higher than the
fly ash ternaries but still comparable with the CEM I and binary concretes. The CEM I control
shows little improvement in sorptivity with time (Figure 6.8), so it is evident that additions,

Ternary Combination Concretes Using GGBS, Fly Ash & Limestone: Strength, Permeation & Durability Properties
Chapter 6: Absorption & Capillary Rise
172
such as GGBS, PFA and limestone, are effective after prolonged curing and indeed improve the
porosity of concrete over a period of time.
Fig 6.7: ISAT-10 indicating absorption across the range of water cement ratios
at the 75% addition level.
Low
Average
High
Low
Average
High

Ternary Combination Concretes Using GGBS, Fly Ash & Limestone: Strength, Permeation & Durability Properties
Chapter 6: Absorption & Capillary Rise
173
Fig 6.8: Sorptivity of 75% GGBS level concretes across the range of w/c ratios

Ternary Combination Concretes Using GGBS, Fly Ash & Limestone: Strength, Permeation & Durability Properties
Chapter 6: Absorption & Capillary Rise
174
The effect of increased volumes of limestone increasing sorptivity corresponds with
other studies on its use as a binary material. Ramezanianpour et al (2009) reported that whilst
w/c ratio had the effect of decreasing sorptivity with reducing quantities of limestone,
increasing limestone content gave greater sorptivity as suggested by Tsivilis et al (1999). The
limestone, due its fineness, acts as filler in the pore spaces between the aggregate and cement
paste and pores in the bulk paste and with an increase in addition level the average particle
size reduces, making the limestone less effective as filler as a wall effect is created (Tasdemir,
2003; Guemmadi et al, 2009).
The fly ash relies on the initial hydration of the CEM I to produce free lime to enable
pozzolanic reactions, together with the alkalis. The GGBS requires this same product, in
addition to alkalis to activate the reaction, and thus competes with the fly ash for the lime, as
noted above. Given the significantly reduced sorptivity it may indicate that the fly ash is
reacting with the GGBS in some way due to the lower volume of CEM I producing limited
amounts of lime, which is being used by the higher volume of GGBS. During the hydration of
GGBS alkalis are released progressively with more GGBS, this is likely to be increased and may
account for the reaction of the fly ash as the increased alkalinity of the pore water aids in the
breakdown of the glass material in the fly ash. Whilst the GGBS requires the same breakdown
of glass by the hydroxyl ions released by the CEM I during its hydration, it releases additional
alkalis.
At the higher GGBS level it is clear that at 28 days the volume of additions requires
significantly more time to produce hydration products to fill the capillary pores within the
structure of the concrete. As stated previously, the lower voids ratio for the binary and ternary
mixes is calculated and it should be noted that the extent of reaction at 28 days is not
considered, indeed the calculation assumes the voids ratio of a dry mix and does not consider
the effects of hydration products following the addition of water. By 180 days, the effect of the
fly ash as a pozzolanic material is evident as the initial surface absorption has decreased. Yet
whilst it is generally believed that a low voids ratio, indicating denser packing, impedes the
ingress of water, it is evident in Figure 6.9 that the increase in limestone to 35%, despite giving
a lower calculated void ratio, results in the higher ISAT value by 180 days. This clearly indicates

Ternary Combination Concretes Using GGBS, Fly Ash & Limestone: Strength, Permeation & Durability Properties
Chapter 6: Absorption & Capillary Rise
175
that it is the reactivity of the material that is important and whilst packing is a physical effect,
reactivity is more dominant in relation to concrete structure development.
Fig 6.9: ISAT-10 against void ratio across the range of water cement ratios
at the 75% addition level.
Low
Average
High
Low
Average
High

Ternary Combination Concretes Using GGBS, Fly Ash & Limestone: Strength, Permeation & Durability Properties
Chapter 6: Absorption & Capillary Rise
176
Fig 6.10: Sorptivity of 55% and 75% GGBS level binaries and fly ash ternary mixes at 0.5 w/c ratio
6.3 Effects of Combined Additions
There is little in the literature that discusses the effects of cement combinations in
relation to many of the tests carried out in this study, indicating the need for such a holistic
examination into the properties of additions such as fly ash and limestone as ternary materials.
Comparisons can be drawn with regards to the effects of binary materials as there are
numerous studies reviewing the effects of GGBS, fly ash and limestone in this respect. Table 6.3
indicates the ISAT -10 values of all samples tested across the range of w/c ratios and gives the
relative results as percentages of the CEM I control mix. Table 6.4 provides a similar
comparison for the sorptivity data. Overall, the effect is that ISAT and sorptivity are reduced
generally for the higher w/c ratio across the range of combinations compared to the CEM I
control and this is more noticeable at 180 days. This is likely to be due to the reduction in
cement paste. The cement paste, contained within the concrete matrix, is a network of pores
as previously discussed.

Ternary Combination Concretes Using GGBS, Fly Ash & Limestone: Strength, Permeation & Durability Properties
Chapter 6: Absorption & Capillary Rise
177
Table 6.3: ISAT-10 data and relative results as a percentage of CEMI control
Mix Combination
ISAT-10
x10-2 ml/m2,s % of CEM I
28 180 28 180
0.35 w/c ratio
CEM I
31 25 100 100 65%PC + 35%GGBS
29 21 90 84
65%PC + 25%GGBS + 10%FA 34 30 108 118 65%PC + 25%GGBS + 10%LS 32 23 100 90 45%PC + 55% GGBS
30 24 95 94
45%PC + 45%GGBS + 10%FA 41 27 130 106 45%PC + 35%GGBS + 20%FA 44 28 140 110 45%PC + 45%GGBS + 10%LS 36 29 114 114 45%PC + 35%GGBS + 20%LS 38 27 121 108 25%PC + 75%GGBS
40 31 127 124
25%PC + 65%GGBS + 10%FA 52 33 165 132 25%PC + 55%GGBS + 20%FA 58 34 184 136 25%PC + 65%GGBS + 10%LS 45 24 143 96 25%PC + 55%GGBS + 20%LS 49 35 156 140 25%PC + 40%GGBS + 35%LS 52 37 165 148
0.5 w/c ratio
CEM I
47 38 100 100 65%PC + 35%GGBS
44 31 93 83
65%PC + 25%GGBS + 10%FA 42 30 88 79 65%PC + 25%GGBS + 10%LS 42 32 89 84 45%PC + 55% GGBS
45 34 96 89
45%PC + 45%GGBS + 10%FA 53 31 113 83 45%PC + 35%GGBS + 20%FA 54 33 115 88 45%PC + 45%GGBS + 10%LS 50 38 106 101 45%PC + 35%GGBS + 20%LS 52 36 111 96 25%PC + 75%GGBS
54 40 114 107
25%PC + 65%GGBS + 10%FA 68 39 145 103 25%PC + 55%GGBS + 20%FA 69 42 147 112 25%PC + 65%GGBS + 10%LS 59 49 126 131 25%PC + 55%GGBS + 20%LS 63 45 134 120 25%PC + 40%GGBS + 35%LS 65 50 138 133
0.65 w/c ratio
CEM I
69 57 100 100 65%PC + 35%GGBS
62 46 90 81
65%PC + 25%GGBS + 10%FA 55 44 80 77 65%PC + 25%GGBS + 10%LS 60 45 87 79 45%PC + 55% GGBS
63 46 91 81
45%PC + 45%GGBS + 10%FA 73 48 106 84 45%PC + 35%GGBS + 20%FA 67 46 97 81 45%PC + 45%GGBS + 10%LS 67 50 96 87 45%PC + 35%GGBS + 20%LS 72 48 104 84 25%PC + 75%GGBS
71 52 103 91
25%PC + 65%GGBS + 10%FA 69 61 100 107 25%PC + 55%GGBS + 20%FA 79 67 114 117 25%PC + 65%GGBS + 10%LS 77 53 112 93 25%PC + 55%GGBS + 20%LS 81 57 117 100 25%PC + 40%GGBS + 35%LS 86 69 125 121

Ternary Combination Concretes Using GGBS, Fly Ash & Limestone: Strength, Permeation & Durability Properties
Chapter 6: Absorption & Capillary Rise
178
Table 6.4: Sorptivity data and relative results as a percentage of CEMI control
Mix Combination
Sorptivity
x10-4, mm/√s % of CEM I
28 180 28 180
0.35 w/c ratio
CEM I
195 155 100 100
65%PC + 35%GGBS
180 130 92 84
65%PC + 25%GGBS + 10%FA 210 140 108 90
65%PC + 25%GGBS + 10%LS 185 135 95 87
45%PC + 55% GGBS
185 135 95 87
45%PC + 45%GGBS + 10%FA 245 150 126 97
45%PC + 35%GGBS + 20%FA 225 155 115 100
45%PC + 45%GGBS + 10%LS 190 145 97 94
45%PC + 35%GGBS + 20%LS 210 120 108 77
25%PC + 75%GGBS
220 165 113 106
25%PC + 65%GGBS + 10%FA 220 175 113 113
25%PC + 55%GGBS + 20%FA 210 175 108 113
25%PC + 65%GGBS + 10%LS 215 160 110 103
25%PC + 55%GGBS + 20%LS 230 150 118 97
25%PC + 40%GGBS + 35%LS 260 160 133 103
0.5 w/c ratio
CEM I
270 225 100 100
65%PC + 35%GGBS
245 185 91 82
65%PC + 25%GGBS + 10%FA 270 175 100 78
65%PC + 25%GGBS + 10%LS 255 185 94 82
45%PC + 55% GGBS
255 190 94 84
45%PC + 45%GGBS + 10%FA 310 190 115 84
45%PC + 35%GGBS + 20%FA 285 200 106 89
45%PC + 45%GGBS + 10%LS 260 197 96 88
45%PC + 35%GGBS + 20%LS 275 190 102 84
25%PC + 75%GGBS
320 230 119 102
25%PC + 65%GGBS + 10%FA 275 220 102 98
25%PC + 55%GGBS + 20%FA 260 220 96 98
25%PC + 65%GGBS + 10%LS 290 210 107 93
25%PC + 55%GGBS + 20%LS 310 220 115 98
25%PC + 40%GGBS + 35%LS 320 227 119 101
0.65 w/c ratio
CEM I
380 325 100 100
65%PC + 35%GGBS
330 265 87 82
65%PC + 25%GGBS + 10%FA 340 220 89 68
65%PC + 25%GGBS + 10%LS 335 260 88 80
45%PC + 55% GGBS
350 260 92 80
45%PC + 45%GGBS + 10%FA 390 240 103 74
45%PC + 35%GGBS + 20%FA 360 250 95 77
45%PC + 45%GGBS + 10%LS 340 275 89 85
45%PC + 35%GGBS + 20%LS 355 270 93 83
25%PC + 75%GGBS
450 320 118 98
25%PC + 65%GGBS + 10%FA 350 270 92 83
25%PC + 55%GGBS + 20%FA 320 270 84 83
25%PC + 65%GGBS + 10%LS 315 245 83 75
25%PC + 55%GGBS + 20%LS 395 310 104 95
25%PC + 40%GGBS + 35%LS 400 330 105 102

Ternary Combination Concretes Using GGBS, Fly Ash & Limestone: Strength, Permeation & Durability Properties
Chapter 6: Absorption & Capillary Rise
179
By examining the data in respect of the w/CEMI ratio rather than w/c ratio (“c” being
the combined cementitious materials), it is possible to examine the effects of the fly ash and
limestone when they are added to the GGBS binary mix. The effect may be positive, indicated
below the trend line of the binary mix, or negative, indicated above the line, depending on the
property. The effects of the ternary additions at 28 days for both ISAT and sorptivity across the
range of w/CEMI ratios are shown in Figures 6.11 to 6.13. At the lower w/CEMI ratio, shown in
Figure 6.11, it is clear that the ternary mixes have a negative effect on the ISAT value at 28 days
across the range of addition levels. At the lower 35% addition level, both the ternary concrete
were higher than the binary but remained lower than the ternary concretes for the other two
addition levels (55% and 75%). Contrary to the ISAT values the sorptivity results showed a
positive effect, albeit marginal, for the 10% fly ash.
An increase in w/c ratio to 0.5 gave a more positive result for the lower level of GGBS,
shown in Figure 6.12. The filler effect of the limestone addition was more positive at the lower
35% addition level with the increase in w/c ratio. The fly ash reaction was also positive though
both of them were marginal. The increasing GGBS levels did not benefit from the addition of
the ternary materials. Again the sorptivity values followed a similar trend to that of the lower
w/c with the ternary mixes at the higher addition level, or w/CEMI+GGBS level, clearly showing
a positive effect in reducing sorptivity. This effect was more noticeable with a further increase
in w/c ratio to 0.65, shown in Figure 6.13. With regard to the ISAT values the 10% ternary
additions indicate a positive improvement at the lower replacement level (35%) a marginal
improvement was also seen with the 10% fly ash at the higher 75% replacement level.
It is clear that the ternary additions cause various effects at differing GGBS levels and
w/c ratios. The limestone is generally considered to act as an inert filler as discussed previously
and by Ramezanianpour et al, (2009), other studies are of the opinion that limestone can
actually improve hydration by acting as an acceleration site (Ramachandran & Zhang, 1986).
Given the findings of Nehdi et al (1998) that limestone, acting as filler, can reduce water
demand and increase plasticiser efficiency, this certainly seems to support the results of the
lower w/c ratio mixes containing limestone.

Ternary Combination Concretes Using GGBS, Fly Ash & Limestone: Strength, Permeation & Durability Properties
Chapter 6: Absorption & Capillary Rise
180
Fig 6.11: Effects of ternary materials at 0.35 w/c ratio.
Low
Average
High
35%
GGBS
55%
GGBS
75%
GGBS
35%
GGBS
55%
GGBS
75%
GGBS

Ternary Combination Concretes Using GGBS, Fly Ash & Limestone: Strength, Permeation & Durability Properties
Chapter 6: Absorption & Capillary Rise
181
Fig 6.12: Effects of ternary materials at 0.5 w/c ratio at 28 days.
Low
Average
High
35%
GGBS
55%
GGBS
75%
GGBS
35%
GGBS
55%
GGBS
75%
GGBS
Ternary Combination Concretes Using GGBS, Fly Ash & Limestone: Strength, Permeation & Durability Properties
Chapter 6: Absorption & Capillary Rise
182
Water demand is further discussed by Tsivilis et al (2002). They studied limestone
cements and found those containing 20% limestone to have lower water sorptivity thus
indicating the positive effects of limestone and certainly support the positive effects seen with
this study’s limestone ternary concretes, exhibited at both test ages across the range of w/c
ratios at both 35% and 55% addition levels. At the higher 75% addition level it appears that the
limestone was more detrimental, possibly due to the filler effect and the higher volume of fines
within the materials. The 75% addition level shows high absorption values for all ternary mixes
at 28 days with a w/c ratio of 0.35 and the complete range of mixes at the mid-range and
higher w/c ratios, CEM I and binary mixes included.
The fly ash gives low absorption values with prolonged curing and this is more evident
at the 55% addition level. On the whole, the results of the fly ash concretes are comparable
with the limestone ternary mixes, but given the difference in properties, both physical and
pozzolanic, the reason for the improvements may also differ. The fly ash is slower to react than
the CEM I, which is why prolonged curing to 180 days greatly improves the absorption value of
these ternary mixes. The glass content within the fly ash may also have affected the rate of
pozzolanic reaction, a higher pH of the pore water is necessary to aid the breakdown of this
material to further increase the reaction products. However, the fly ash used for this study was
Type S (conforming to BS EN 450-1 2005) and the glass content would not be that significant in
relation to the reactivity. At the lower 35% replacement level this is not so noticeable but
increases more so as the addition level rises indicating a diluting effect where there is less CEM
I in the mix to aid in the initial reaction of both the GGBS and the fly ash.
Elahi et al (2010) found that a binary mix of 50% GGBS gave better sorptivity results at
a 44 day test age than at 91 days, but by increasing the content to 70% this effect was reversed.
Fly ash was also used as a binary material with 20% addition having no effect at 44 days but
considerably decreasing sorptivity by 91 days. Sorptivity was increased at both test ages when
the fly ash content was doubled to 40% when compared to CEM I. Whilst the test ages differ,
some similarities can be drawn with Elahi et al’s data in general, whereby the 55% binary mix is
improved compared to CEM I as to did the 50% mix of Elahi et al (2010).

Ternary Combination Concretes Using GGBS, Fly Ash & Limestone: Strength, Permeation & Durability Properties
Chapter 6: Absorption & Capillary Rise
183
Fig 6.13: Effects of ternary materials at 0.65 w/c ratio.
Low
Average
High
35%
GGBS
55%
GGBS
75%
GGBS
35%
GGBS
55%
GGBS
75%
GGBS

Ternary Combination Concretes Using GGBS, Fly Ash & Limestone: Strength, Permeation & Durability Properties
Chapter 6: Absorption & Capillary Rise
184
6.4 Initial Surface Absorption and Cube Strength
Given that absorption is dependent on the continuity of the pore system and the
network of pores within the concrete matrix, including those of the cement paste and the
interfacial transition zone, it may be assumed that there would be some correlation between
the data for the absorption tests and that of compressive strength for the tested samples.
However, when plotted against compressive strength (Figure 6.14(a)) there is poor correlation,
indicated by the R2, across the range of w/c ratios at 28 days. At the later test age the mid-
range w/c ratio gives a stronger correlation as shown in Figure 6.14(b). The R2 value, or
coefficient of correlation, is merely indicative of the prediction of future outcomes and is
calculated based on the given results. The range will vary from 0.1 to 1.0 and criteria for
interpretation is arbitrary but based on Buda & Jaynowski (2010) a small correlation is indicated
at 0.1 to 0.3, medium 0.3 to 0.5 and strong 0.5 to 1.0.
Fig: 6.14: ISAT v Compressive strength for (a) 28 days and (b) 180 days
For the sorptivity data the correlation is poor across all w/c ratios at both 28 and 180
day testing, with the results widely scattered (Figure 6.15). Such results would indicate that
(a) (b)

Ternary Combination Concretes Using GGBS, Fly Ash & Limestone: Strength, Permeation & Durability Properties
Chapter 6: Absorption & Capillary Rise
185
there is no direct relationship between absorption and compressive strength and any result is
dependent on the materials used, water content and curing.
Fig 6.15: Sorptivity v Compressive strength for (a) 28 days and (b) 180 days
Similarly when viewed together, Figure 6.16, no correlation is seen between ISAT and
sorptivity clearly indicating that whilst both provide a measure of absorption there must be
inherent differences. Both tests, by their nature, test the absorption characteristics of the
surface zone of concrete and not its core but this is where the similarities end. The
preconditioning of the samples differ, as previously discussed, given that surface absorption is
sensitive to moisture conditions this may be enough to cause differences within the results.
Whilst it is relatively simple to achieve a constant weight by oven drying which will ensure the
removal of moisture, air drying may be less reliable and yet the sorptivity test itself requires the
sample to be only unsaturated with a small amount of moisture required for capillary suction
to occur. In addition sorptivity is a measure of one dimensional capillary absorption as a
fraction of time; depth of water penetration is measured indirectly through weight gain and the
(a) (b)

Ternary Combination Concretes Using GGBS, Fly Ash & Limestone: Strength, Permeation & Durability Properties
Chapter 6: Absorption & Capillary Rise
186
sorptivity is calculated from the slope of the curve of the weight gain against time and
converted into mm/s½. With ISAT the geometry of the opening of the cap, together with its
contact with the concrete creates a two dimensional absorption (CCAA, 2009). The flow of
water in this test is also assumed to be unidirectional.
Fig 6.16: Sorptivity v ISAT for (a) 28 days and (b) 180 days
6.4.1 ISAT-10 for Equivalent Compressive Strength of 40 N/mm2
By interpolating the w/c ratios for equivalent strength of 40 N/mm2 (as discussed in
Chapter 5), it is possible to compare the surface absorption for the cement combinations on
this basis. At the earlier test age (28 days) it is the limestone ternary mixes that gives lower
absorption results, whilst the longer curing time allows the fly ash to react further and provide
better results following 180 days curing. The greater improvement with curing time has
generally been seen with the fly ash mixes, indicating that the prolonged curing time allows
further pozzolanic activity of the materials. The limestone ternary concrete did show some
improvement with time but it is likely that this is more due to the effects of prolonged curing
(a) (b)
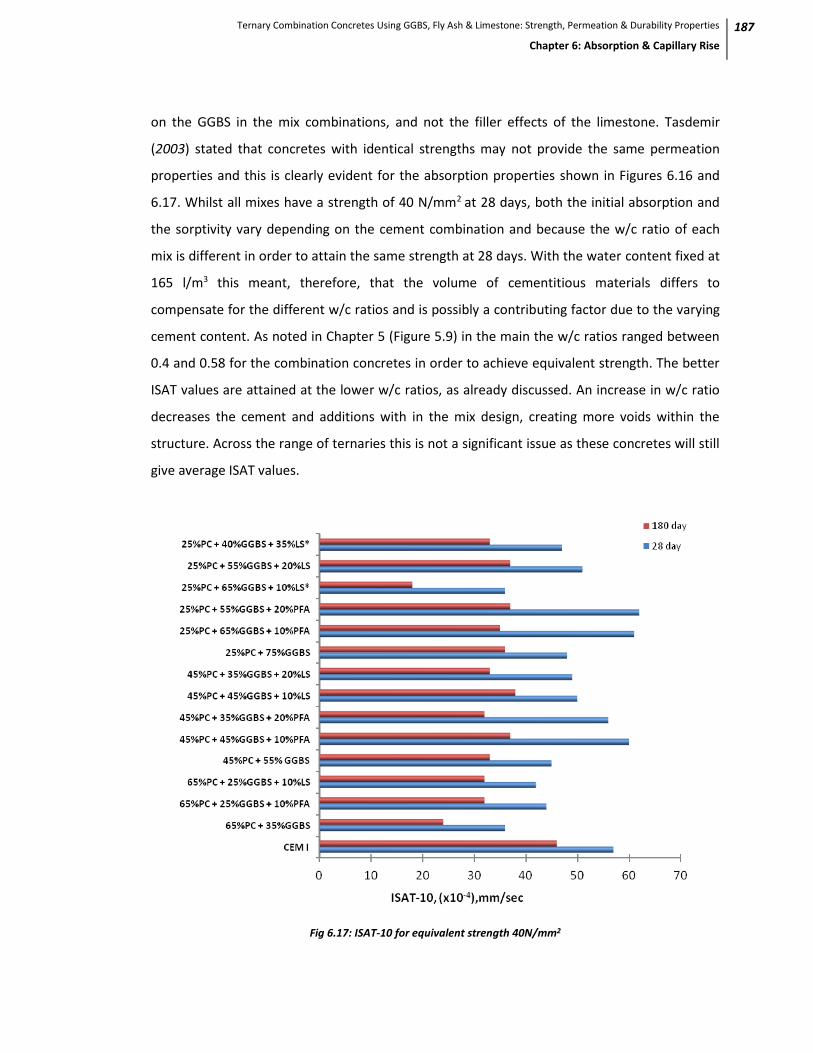
Ternary Combination Concretes Using GGBS, Fly Ash & Limestone: Strength, Permeation & Durability Properties
Chapter 6: Absorption & Capillary Rise
187
on the GGBS in the mix combinations, and not the filler effects of the limestone. Tasdemir
(2003) stated that concretes with identical strengths may not provide the same permeation
properties and this is clearly evident for the absorption properties shown in Figures 6.16 and
6.17. Whilst all mixes have a strength of 40 N/mm2 at 28 days, both the initial absorption and
the sorptivity vary depending on the cement combination and because the w/c ratio of each
mix is different in order to attain the same strength at 28 days. With the water content fixed at
165 l/m3 this meant, therefore, that the volume of cementitious materials differs to
compensate for the different w/c ratios and is possibly a contributing factor due to the varying
cement content. As noted in Chapter 5 (Figure 5.9) in the main the w/c ratios ranged between
0.4 and 0.58 for the combination concretes in order to achieve equivalent strength. The better
ISAT values are attained at the lower w/c ratios, as already discussed. An increase in w/c ratio
decreases the cement and additions with in the mix design, creating more voids within the
structure. Across the range of ternaries this is not a significant issue as these concretes will still
give average ISAT values.
Fig 6.17: ISAT-10 for equivalent strength 40N/mm2

Ternary Combination Concretes Using GGBS, Fly Ash & Limestone: Strength, Permeation & Durability Properties
Chapter 6: Absorption & Capillary Rise
188
6.4.2 Sorptivity at Equivalent Strength of 40 N/mm2
As with the previous ISAT results, the sorptivity data was also compared at an equal 28
day strength of 40 N/mm2. The earlier discussion indicated that the 10% fly ash ternary
concrete at the 35% addition level gave the better sorptivity results for the 0.5 and 0.65 w/c
ratios by 180 days. To achieve equivalent 28 days strength of 40 N/mm2 the w/c ratio would be
required to be 0.53 and whilst at 28 days the sorptivity for this mix was high, by 180 days it was
greatly improved.
Fig 6.18: Sorptivity for equivalent strength 40N/mm2
6.5 Absorption v Porosity
It was previously stated that sorptivity, or sorption force, is inversely proportional to
the diameter of the pores within the structure of concrete, with smaller pores causing higher
sorptivity (Kelham, 1988). With this in mind it would be prudent to examine the porosity in
relation to the absorption data for selected samples. The porosity of the concrete was

Ternary Combination Concretes Using GGBS, Fly Ash & Limestone: Strength, Permeation & Durability Properties
Chapter 6: Absorption & Capillary Rise
189
discussed briefly in the previous chapter with regard to its relationship to compressive
strength; here it will be examined in more detail.
The pore system of concrete is not a constant and will be affected by curing time,
moisture content and exposure conditions. The porosity of cement paste will therefore be
dependent on the w/c ratio and age of the sample due to the effect of both on the gel/space
ratio. As stated by Mills (1986) the actual porosity of the system is a function of the amount of
water introduced at mixing with the hydration process determining the extent of the filling and
also the redistribution of original pore spaces. Figure 6.19 illustrates the effect of the hydration
products in filing pores within the cement paste matrix. Table 6.5 shows both the effective
capillary porosity and the critical pore size, determined by MIP for selected cement pastes at
0.35 and 0.5 w/c ratios. Appendix C details the process of interpolating the results to obtain
this data.
Fig 6.19: Pore filling by products of hydration
(a) Cement grains at time of final set; (b) fully hydrated cement paste (Mills, 1986)
Calcium Hydroxide
crystals precipitate out
of solution
Residual anhydrous
cement
Large pores up to 10µm
Porous cement hydrate with
pores varying in width from
0.5 to 4nm
(a) (b)

Ternary Combination Concretes Using GGBS, Fly Ash & Limestone: Strength, Permeation & Durability Properties
Chapter 6: Absorption & Capillary Rise
190
Table 6.5: Total porosity and critical pore size for selected cement paste samples
Mix Combinations
28 day 180 day
Total Porosity
(%) Critical
Pore (nm)
Total Porosity
(%) Critical
Pore (nm)
0.35 w/c ratio
CEM I 22 51 17.5 40
65%PC + 35%GGBS 20.5 45 15.5 36
65%PC + 25%GGBS + 10%PFA 20 50 16 40
65%PC + 25%GGBS + 10%LS 22 63 17.5 50
45%PC + 55% GGBS 21 55 16 40
45%PC + 45%GGBS + 10%PFA 20.5 65 16.5 45
45%PC + 45%GGBS + 10%LS 22 85 19 65
0.5 w/c ratio
CEM I 24 120 21 100
65%PC + 35%GGBS 23 105 19.5 90
65%PC + 25%GGBS + 10%PFA 23 112 20.5 95
65%PC + 25%GGBS + 10%LS 23.5 120 20 105
45%PC + 55% GGBS 23 130 20.3 100
45%PC + 45%GGBS + 10%PFA 23 145 20.5 105
45%PC + 45%GGBS + 10%LS 24 150 21 125
It is suggested by Pipilikaki & Beazi-Katsioti (2009) that the critical pore size controls
the transmissivity of the material, concurring with Aligizaki’s earlier study (2006), with the
critical pore diameter being that most frequently occurring in the interconnected pores,
allowing maximum percolation of fluids through the cement pores. Pipilikaki & Beazi-Katsioti
found that with a 35% addition of limestone, creating limestone cement, the critical pore size
can double from 20nm to 40nm. This suggests that the filler effect of limestone at lower levels
is not seen with the higher volume, the average particle size will have reduced, due to the
greater volume of limestone creating a dilution effect, compared to the mixes containing less
limestone.
When related to both ISAT and sorptivity values, it can be seen that the larger critical
pore size gave greater absorption values. The 0.35 w/c ratio had lower values, decreasing with
longer curing to 180 days. The higher w/c ratio increased the values as already discussed for
ISAT and sorptivity, but also for the critical pore size. The 35% GGBS level mixes reduced the
critical pore size compared to the CEM I for the 0.35 w/c ratio, an increase in GGBS level to 55%
increased the critical pore size slightly and consequently the ISAT values. The inclusion of fly

Ternary Combination Concretes Using GGBS, Fly Ash & Limestone: Strength, Permeation & Durability Properties
Chapter 6: Absorption & Capillary Rise
191
ash had the effect of increasing the critical pore size compared to the binary at the 0.35 w/c
ratio at both addition levels, with raised ISAT values. At 28 days, the critical pore size of the
limestone ternaries at 35% GGBS level was high whilst the ISAT value was low, prolonged curing
to 180 days gave more related results as seen in Figure 6.20(c).
Fig 6.20: ISAT-10 against critical pore size at 28 days [(a) and (b)] and 180 days [(c) and (d)]
Tsivilis et al (2003) state from their findings that concrete with limestone generally has
a lower porosity and a low mean pore size compared to CEM I. It was, however, clear from the
data presented in Figures 6.20 and 6.21 that this did not apply to the current study. Whilst
there is agreement concerning the increased sorptivity with limestone level; it is possible that
this difference is due more to the process and production of the cement and physical
properties and quality of the limestone used. Tsivilis et al (2003) co-ground limestone, clinker
and gypsum to produce limestone cements. In this study the limestone was added during
mixing and therefore its structure may have been very different to that of Tsivilis et al(2003). It
35% level 55% level
35% level 55% level
35% level 55% level 35% level 55% level

Ternary Combination Concretes Using GGBS, Fly Ash & Limestone: Strength, Permeation & Durability Properties
Chapter 6: Absorption & Capillary Rise
192
is also apparent that when mixed with GGBS to form a ternary concrete the effect of the
limestone reported by Tsivilis et al (2003) was not as obvious as it had been when diluted by
GGBS.
Fig 6.21: Sorptivity against critical pore size at 28 days [(a) and (b)] and 180 days [(c) and (d)]
To examine Kelham’s theory the pore diameter is plotted against the sorptivity both
collectively (Figure 6.22) and for independent addition levels (Figure 6.23). It was clear from
this that that was not an inverse relationship between the porosity and sorptivity but the
opposite. The majority of pores measured at both w/c ratios and at both test ages fell within
the medium and large capillary classification according to Mindess (2003) (refer to Table 6.1)
although the range of their sizes was quite wide, from 36nm to 150nm. All that can be agreed
upon is that both critical pore size and porosity reduce with both w/c ratio and time but this
was not unexpected.
35% level 55% level 35% level 55% level
35% level 55% level
35% level 55% level

Ternary Combination Concretes Using GGBS, Fly Ash & Limestone: Strength, Permeation & Durability Properties
Chapter 6: Absorption & Capillary Rise
193
Fig 6.22: Sorptivity v Critical PoreDiameter by w/c ratio and test age
Fig 6.23: Sorptivity v Critical pore diameter by mix combination, w/c ratio and test age

Ternary Combination Concretes Using GGBS, Fly Ash & Limestone: Strength, Permeation & Durability Properties
Chapter 6: Absorption & Capillary Rise
194
Little correlation also exists between the critical pore diameter and total porosity for
any cement paste other than the 0.35 w/c ratio at 180 days as shown in Figure 6.24. Clearly an
increase in critical pore size is not indicative of an increase in porosity. It would seem that there
are additional factors that need to be taken into consideration that may influence the results of
the MIP tests. Not only is there the obvious difference between the concrete specimens used in
the absorption tests and the cement paste samples used for the MIP in that the former
contains aggregate, but both sample conditions and the rate of pressure can affect the results
as can a maximum intrusion pressure and surface tension of mercury (Kumar & Bhattacharjee,
2004).
Fig 6.24: Porosity v critical pore diameter by w/c ratio and test age
For the test to be successful the mercury has to pass through the narrow pores
connecting the pore network (Cook & Hover, 1999). If the pores are too small or isolated, the
mercury may not intrude although it is possible that the pressure applied during the test can
cause a collapse of the thinner pore walls, breaking through to isolated ones. The size of the

Ternary Combination Concretes Using GGBS, Fly Ash & Limestone: Strength, Permeation & Durability Properties
Chapter 6: Absorption & Capillary Rise
195
pores influencing the results may also differ and, in addition, an “ink bottle” effect can occur
due to the pressure applied to the mercury so that narrow pore openings may widen into larger
pores. Whereas water during the absorption tests has little or no force applied to it. These
pores may not be affected in the same way as with MIP where the pressure applied can force
the mercury into these voids.
6.6 Sorptivity of Cement Paste in Relation to Concrete
Given the lack of relationship between the results it may be concluded that the role of
the ITZ is more far reaching than originally considered, this maybe considered in conjunction
with the porosity of the aggregates within the concrete matrix itself, however, the aggregates
used in this study had low absorption properties. It has already been postulated that the
former is the most porous and indeed weakest, giving the least resistance to liquids or gases.
The aggreagtes themselves were tested and found to be of low porosity, their addition to the
mix would therefore only increase tortuosity and thus reduce sorptivity when compared to that
of cement paste. The sorptivity of selected cement paste samples was tested at 28 days to
allow for comparison between them and their concrete counterparts. When the sorptivity data
for paste and concrete is plotted against each other there appears to be no correlation as
shown in Figure 6.25, with the sorptivity of paste showing a greater range of results.
However, when examining each mix individually by w/c ratio, comparison can be seen.
From the data the sorptivity ratio (Sr) of concrete (Scon) to paste (Spaste) was calculated using the
following formula and the results are given in Table 6.5.
[Eq 6.1]
Comparisons are more clearly observed in Figure 6.26 where the sorptivity ratio of concrete to
cement paste does not differ greatly between w/c ratios, with the 0.35 w/c ratio marginally
increased compared to the 0.5. It can be concluded from this that the effect of adding
aggregates to form the ITZ has similar consequences for both w/c ratios. The continuity of the
pore system may differ between the w/c ratio. The increased volume of cement paste to fixed

Ternary Combination Concretes Using GGBS, Fly Ash & Limestone: Strength, Permeation & Durability Properties
Chapter 6: Absorption & Capillary Rise
196
mix water for the lower w/c ratio will also mean reduced sorptivity due to the reduction in
water content. For the 0.5 w/c ratio the volume of aggregates in the mix has increased (refer
to Table 3.4). This will have the effect of increasing the toruosity, cancelling out the effect of
the lower volume of cement paste and increased mix water. Generally it was seen that the
ratio also reduced slightly with an increasing level of GGBS replacement for the binary mixes.
The 10% addition of fly ash, forming ternary mixes, increases the ratio whilst the addition of
10% limestone reduced the sorptivity ratio with increasing replacement level.
Fig 6.25: Sorptivity of paste against concrete for selected samples at both w/c ratios

Ternary Combination Concretes Using GGBS, Fly Ash & Limestone: Strength, Permeation & Durability Properties
Chapter 6: Absorption & Capillary Rise
197
Table 6.5: Sorptivity of selected paste and concrete with concrete to paste ratio at 28 days
Mix Combination Paste Concrete Sr
0.35 w/c ratio
CEM I 791 195 0.25
65%PC + 35%GGBS 725 180 0.25
65%PC + 25%GGBS + 10%FA 805 210 0.26
65%PC + 25%GGBS + 10%LS 925 185 0.20
45%PC + 55% GGBS 993 185 0.19
45%PC + 45%GGBS + 10%FA 975 245 0.25
45%PC + 45%GGBS + 10%LS 1095 190 0.17
25%PC + 75%GGBS 1250 220 0.18
25%PC + 65%GGBS + 10%FA 1020 220 0.22
25%PC + 65%GGBS + 10%LS 1897 215 0.11
0.5 w/c ratio
CEM I 1103 270 0.24
65%PC + 35%GGBS 1028 245 0.24
65%PC + 25%GGBS + 10%FA 1098 270 0.25
65%PC + 25%GGBS + 10%LS 1315 255 0.19
45%PC + 55% GGBS 1427 255 0.18
45%PC + 45%GGBS + 10%FA 1269 310 0.24
45%PC + 45%GGBS + 10%LS 1521 260 0.17
25%PC + 75%GGBS 1900 320 0.17
25%PC + 65%GGBS + 10%FA 1327 275 0.21
25%PC + 65%GGBS + 10%LS 2547 290 0.11
Fig 6.26: Sorptivity ratio for selected mix combinations tested at 28 days

Ternary Combination Concretes Using GGBS, Fly Ash & Limestone: Strength, Permeation & Durability Properties
Chapter 6: Absorption & Capillary Rise
198
6.7 Summary
In this chapter, the effects of addition materials have been discussed in relation to the
absorption properties of concrete. The importance of concrete being able to limit the
absorption of fluids to which it is exposed during its service life, in order to maintain a durable
concrete.
Overall it was evident that an increase in w/c ratio had the effect of increasing both the
ISAT and sorptivity of the mix combinations. Extended curing to 180 days reduced the ISAT and
sorptivity values as supported by the literature and discussed within this chapter; these results
were as expected.
The binary mixes at the 35% and 55% addition levels gave reduced ISAT and sorptivity
values across the range of w/c ratios, when compared to the CEM I control concrete, which was
further improved by prolonged curing to 180 days. The GGBS produced a denser
microstructure with more pore space filled with C-S-H. The 75% level gave poorer results
overall at 28 days but were improved at the higher w/c ratio.
The addition of fly ash to produce ternary concretes had differing effects across the
range of GGBS levels and w/c ratios. At the 35% replacement level and lower, 0.35, w/c ratio
the fly ash offered no improvement on the binary mix. With 25% GGBS and 10% fly ash
competition occurs between them both for hydroxyl ions being produced by the CEMI/ water
reaction, slowing the reaction of both the GGBS and fly ash and also the production of a denser
microstructure. An increase in w/c ratio at this replacement level improves the rate of reaction
improving absorption values.
An increase in replacement level to 55% gave increased ISAT values for the 10% fly ash
across the range of w/c ratios at 28 days. Prolonged curing improved the absorption of the 10%
fly ash, allowing continued hydration to take place, creating a denser microstructure, making it
more comparable with the binary mixes. The sorptivity followed a similar trend but the
improvement of prolonged curing was more noticeable. Little difference was seen with an
increase to 20% fly ash for ISAT values at the 0.35 and 0.5 w/c ratios, but it was clear that the

Ternary Combination Concretes Using GGBS, Fly Ash & Limestone: Strength, Permeation & Durability Properties
Chapter 6: Absorption & Capillary Rise
199
w/c ratio does have an effect on the reaction of these ternary mixes with improvements seen
with an increase to 0.65 w/c ratio. For the sorptivity tests, the 20% fly ash reduced the value at
28 days compared to the 10% fly ash ternary which is likely to be due to its ability to compete
effectively with GGBS for the lime. However, the prolonged curing shows an increase compared
to the 10% fly ash. The 75% addition, overall, indicated an increase in absorption values for the
fly ash ternary mixes for ISAT. The sorptivity again gave contrary results showing improvements
for both ternary mixes at 28 days and after 180 days curing.
The limestone ternary mixes at the 35% addition level gave comparable results with
the binary mix across the range of w/c ratios and test ages for both ISAT and sorptivity values.
At the 45% addition level an increase to 20% limestone gave better ISAT values following
prolonged curing compared to 10% limestone that was better at the earlier, 28 day, test age,
making it comparable with the binary mix. This was also reflected in the sorptivity results. In
general, with an increase in level to 75%, the 10% limestone was better than both the 20% and
35% limestone additions, which was also reflected by the sorptivity values. By 180 days, at the
0.35 w/c ratio, it is comparable to the CEM I and at 0.65 w/c ratio it is comparable with the
binary mix and improved on the CEM I mix.
The critical pore size was generally shown to increase with absorption indicating a
strong correlation between the two for both 0.35 and 0.5 w/c ratio. It was, however, found
that the limestone ternary mixes had an increased critical pore size which has been previously
reported by Tsivilis et al (1999) that a 10% limestone cement had the ability to reduce the
critical pore size. This indicates the additional effects of processing, quality of material and mix
combination. Further, Kelham’s observation of an inverse relationship between critical pore
diameter and sorptivity was not proven with the opposite effect occurring, in addition no
correlation was observed between the critical pore size and porosity. When compared
together, selected paste samples and their concrete counterparts were used to calculate a
sorptivity ratio, the ratio across both w/c ratios ranged from 0.11 to 0.26 with little difference
between w/c ratios for each individual mix combination examined indicating similar reactions
within the concrete matrix with the addition of aggregates creating an ITZ.

Ternary Combination Concretes Using GGBS, Fly Ash & Limestone: Strength, Permeation & Durability Properties
Chapter 7: A
200
CHAPTER SEVEN: AIR PERMEABILITY & WATER
PENETRATION
7.1 Introduction
In addition to the absorption of concrete discussed in Chapter 6, permeability of
cement combination concretes was measured using air and water as the test fluid. The
permeability of concrete is relevant where it is to be used in a water retaining or similar
structure (Concrete Society, 2008). The transportation of air and water can contribute to the
deterioration of concrete and are related to processes including chloride ingress, carbonation
and freeze/thaw damage. The former two will both be discussed in the following chapter. As a
rule, depending on both the ambient conditions and the thickness of the concrete itself, most
of the capillary water and part of the absorbed water evaporates leaving the pores empty or
unsaturated (Mehta & Montiero, 2004). It is the evaporable water that is free for internal
movement within the concrete matrix. If the hydraulic conductivity, referred to more
commonly as the coefficient of permeability (k), is low then the concretes vulnerability to any
water related destructive phenomena will be limited so long as there is little, or indeed, no
water remaining in the matrix after drying and it is not exposed subsequently to an
environment that may cause re-saturation of the pore system. Permeability is the property of
concrete that governs the rate of flow of a fluid into its porous structure under a pressure
head. It is a global coefficient (k) that is determined by Darcy’s Law:
[Eq 7.1]
Where dq/dt = rate of fluid flow
µ = viscosity of fluid flow
∆H = pressure gradient

Ternary Combination Concretes Using GGBS, Fly Ash & Limestone: Strength, Permeation & Durability Properties
Chapter 7: A
201
A = surface area
L = thickness of solid
Both air permeability and water penetration under pressure tests were carried out in
order to obtain further information about the microstructure and durability properties of the
test concretes. The intrinsic permeability (hence forth simply referred to as permeability) of
gases and water vapour is said by Mehta & Montiero to be lower than that for liquid water,
with tests generally carried out using water that has no dissolved air to avoid any difficulties in
interpreting the results. In the absorption tests, water was applied under a 200mm head (low
pressure to dry concrete) and this was drawn in by capillary suction. In many cases, the smaller
pores do not affect the transport of fluids until pressure is applied, forcing their entry. Again
preconditioning of the test specimens is of importance in relation to these types of
measurements. Indeed, air permeability test specimens needed more preparation, with a core
required to be cut from a 100mm cube sample, compared to the water penetration test, which
was carried out on a 150mm cube specimen that required no preconditioning other than water
curing for until the specified test ages. The specimens were removed from the curing tank and
placed directly in the test rigs at the set test ages (28 and 180 days). The cored samples for air
permeability tests were oven dried to constant weight. In spite of this, it may be possible that
such preconditioning may affect the permeability by the possible creation of gradients of
moisture through the concrete in turn causing micro-structural modifications (Elahi et al, 2010).
However, forced drying in this way is considered to minimise, if not remove this effect
(Ramachandran & Beaudoin, 2001). In addition to the moisture content, other factors may also
affect the permeability of concrete. The ambient conditions at the time of tests have previously
been highlighted in earlier chapters where it was noted that all test conditions were
standardised in order to prevent the effects of temperature on the viscosity and surface
tension of fluids and humidity effects on the flow mechanism.
The driving force and duration of the test may also affect permeability. The air
permeability test itself is quick and non-destructive allowing a number of pressures (as
described in Chapter 3) to be tested on one specimen with relative ease. The method for
carrying out the water penetration test requires the specimen be clamped into the testing rig
for 72 hours and then split. Ramachandran & Beaudoin (2001) suggest that this length of

Ternary Combination Concretes Using GGBS, Fly Ash & Limestone: Strength, Permeation & Durability Properties
Chapter 7: A
202
testing may cause further changes in the permeability. As well as causing further hydration,
impurities in the water may cause silting and a chemical reaction in the concrete. It is also
possible that calcium hydroxide washed onto the bottom surface of the test specimen may
carbonate (due to the atmosphere) forming an impermeable layer. The test methods were
followed stringently in order to avoid any such effects on the permeability of the concrete test
specimens. However, some effects, such as carbonation and hydration are out with any control
and will occur due to the nature of the tests, preconditioning and curing. All combinations
across the range of w/c ratios were tested.
7.2 Intrinsic Air Permeability
Air permeability tests were carried out in accordance with the test method described in
Chapter 3. After oven drying to a constant weight, cored samples measuring 54mm diameter
and 50mm length were placed in the apparatus and tested at a range of pressures, from which
the intrinsic air permeability was determined. As with previous tests, a CEM I control mix was
used to provide a comparison. Figures 7.1, 7.3 and 7.4 show the intrinsic air permeability
results recorded for all combinations across the range of w/c ratios. The intrinsic air
permeability of the binary and ternary mixes are shown relative to that of the CEM I concretes
in Figure 7.5.
7.2.1 35% GGBS Level
At 28 days, the air permeability results off the CEM I and binary concretes were
comparable at 0.35 w/c ratio, as shown in Figure 7.1. This increased with the addition of 10%
fly ash in the ternary concrete, whilst 20% limestone gave comparable results to both CEM I
and binary concretes. An increase in w/c ratio to 0.5, increased the air permeability of the
concretes, which increased further as this was raised to 0.65 w/c ratio. Across this range of w/c
ratios at 28 days, the 10% fly ash ternary also gave progressively higher results, with increasing
w/c ratio. The 10% limestone ternary concrete, however, gave the better results across the
range of mixes at the various w/c ratios, with little difference seen between the 0.35 and 0.5
w/c ratios for this mix. This was significantly lower than the CEM I, binary and 10% fly ash
ternary concretes at the higher w/c ratio. By 180 days, the air permeability was lower across
the range of cement combinations and w/c ratios. The greatest improvements were seen with

Ternary Combination Concretes Using GGBS, Fly Ash & Limestone: Strength, Permeation & Durability Properties
Chapter 7: A
203
the binary and ternary concretes at 0.5 and 0.65 w/c ratios, with the 10% limestone still lowest.
The CEM I concrete did not significantly improve with prolonged curing to 180 days.
Fig 7.1: Intrinsic Air Permeability of 35% GGBS level concretes

Ternary Combination Concretes Using GGBS, Fly Ash & Limestone: Strength, Permeation & Durability Properties
Chapter 7: A
204
At the 35% GGBS level, the effect of limestone, when added to the binary concrete was
evident. The limestone does not show pozzolanic properties and therefore the production of C-
S-H will be limited (Ramezanianpour et al, 2009). It is, therefore, likely that the limestone acts
mainly as an inert filler and by this means contributes to reducing pore space within the
microstructure of concrete, as noted previously. Ramachandran & Zhay (1986) state that the
addition of CaCO3 from limestone acts as nucleation sites, thus accelerating hydration of
cement. An earlier study by Ramachandran (1984) found that limestone becomes incorporated
into the C-S-H phase affecting the structure of hydrated cement paste. These combined effects,
as filler and host of nucleation site, may account for the lower values of the 10% limestone
ternary concrete at this level.
By examining the calculated voids ratio for the test materials, based on the mix design
and material properties, at this GGBS level, shown in Figure 7.2 for air permeability, it is clear
that the lower voids ratio of the limestone ternary may have contributed to the reduction in air
permeability observed. That there is little difference between 28 and 180 day results for the
limestone ternary at the 35% level suggest little limestone reactivity and the limited changes
occurring are due to CEM I and GGBS. A greater reduction is seen with the other ternary
material, fly ash, suggesting that this together with GGBS is more reactive than the limestone
ternary concrete as previously indicated. Due to the properties of the additional materials both
the binary and fly ash ternary concretes were slower to react compared to the CEM I and 10%
limestone concretes.
7.2.2 55% GGBS Level
An increase in GGBS level gave higher intrinsic air permeability compared to the 35%
level, across the range of w/c ratios and mix combinations. The CEM I control mix gave lower
results across the range of w/c ratios, with the 10% limestone ternary mix providing the best
results compared to both the binary and other ternary concretes tested. The highest
permeability at 28 days was noted in the fly ash ternary mixes, which increased further with
w/c ratio. The increase in permeability with increasing w/c ratio was expected for all
combinations and is similar to effects noted by Sanjuan et al (1996) and more recently by Elahi

Ternary Combination Concretes Using GGBS, Fly Ash & Limestone: Strength, Permeation & Durability Properties
Chapter 7: A
205
et al (2010). The increase in binary and fly ash ternary concretes was more noticeable, as
shown in Figure 7.3 (a) at 28 days.
Fig 7.2: Intrinsic Air Permeability of 35% GGBS level concretes against void ratio of mixes

Ternary Combination Concretes Using GGBS, Fly Ash & Limestone: Strength, Permeation & Durability Properties
Chapter 7: A
206
By 180 days, permeability reduced across the range of combinations and w/c ratios but
CEM I remained lowest. The difference between fly ash and other concretes was reduced and
at 0.65 w/c ratio the intrinsic air permeability was lower than that of the binary concrete, yet it
was the 10% limestone ternary concrete mix that proved to be the best of the binary and
ternary concretes at 0.5 and 0.65 w/c ratio. At 0.35 w/c ratio the binary was slightly improved
and marginally lower than the 10% limestone ternary mix.
Whilst the CEM I concrete gave lower results, the effect of the limestone in reducing
the permeability of the combination mixes was again apparent. The 10% limestone addition
was more effective, acting as a filler, than at 20% where there was a diluting effect. That none
of the combination mixes were comparable with those of the CEM I, suggests a diluting effect
of the additional materials. An increase in GGBS level means a reduction in the volume of CEM I
and consequently a diluting effect occurs (Ramezanianpour et al, 2009; Bonavetti et al, 2003)
causing changes in the capillary porosity.
Pipilikaki (2009) studied the effect of limestone additions on the capillary pore size of
concrete and found that an increase from 10% to 30% in a limestone binary altered the pore
structure and doubled the size of the capillary pores. Tsivilis et al (2002) found that up to 15%
limestone improved permeability and porosity, and above this level no effect was seen.
Certainly, with the results shown in Figure 7.3, this is the case with the 10% limestone showing
better results than at 20%, and better than GGBS binary concretes on the whole. It is the CEM I
control mix, however, that was found to be least permeable.
Elahi et al (2010) tested a binary mix at 50% GGBS at 44 and 91 days which showed higher air
permeability indices than the CEM I control mix at both test ages, supporting the results of this
study. A binary of 20% fly ash showed improved air permeability at 44 days testing but
increased at 91 days. This effect was not apparent when fly ash was added to the GGBS binary
in this study, as indicated in Figure 7.3. Whilst as a binary material fly ash may have improved
the air permeability as noted above at least when compared to GGBS binary concretes, it gave
higher permeability as a ternary addition. It would seem that the effects of the fly ash are
balanced by those of the GGBS, which is present in the greater proportions. This is likely to be

Ternary Combination Concretes Using GGBS, Fly Ash & Limestone: Strength, Permeation & Durability Properties
Chapter 7: A
207
caused by competition for the lime produced by CEM I hydration with the GGBS, an increase
from 10% to 20% fly ash may increase the competition thus increasing permeability due to a
lower level of reaction.
Fig 7.3: Intrinsic Air Permeability of concretes at the 55% GGBS level

Ternary Combination Concretes Using GGBS, Fly Ash & Limestone: Strength, Permeation & Durability Properties
Chapter 7: A
208
7.2.3 75% GGBS Level
At this level, with an increase in GGBS content, the intrinsic air permeability increased
further compared to the previous GGBS levels, yet still followed a similar trend to the previous
levels of additions, as shown in Figure 7.4. The difference between CEM I and binary and
ternary concretes was much greater with the CEM I giving the lowest results. At 0.35 w/c ratio,
the binary mix was only slightly lower than the 20% limestone ternary, which was the lowest of
the blended concretes at both 0.5 and 0.65 w/c ratios.
By 180 days, the binary and ternary mixes had decreased air permeability but this was
much higher than CEM I concrete across the range of w/c ratios. The binary mix remained the
lowest of the blended mixes at both 0.35 and 0.5 w/c ratio. At the 0.65 w/c ratio, both fly ash
ternaries and the 20% limestone concrete were slightly lower than binary. The 70% GGBS
binary mix tested by Elahi et al (2010) at 44 days was also much higher than the control mix,
although a considerable improvement was seen in the binary mix by 91 days, due to the
delayed reaction of the GGBS.
It is possible, as discussed by Aligizaki (2005) that permeation is not solely due to the
pores found within the cement paste. Pores can also be found within the aggregates and the
interfacial transition zone (ITZ) between this and the cement paste. The aggregates used in this
study were of low porosity, as discussed in Chapter 3, and likely not to have a significant
influence on the permeability (Dhir et al, 2006). Indeed Mehta & Montiero (204) state that
when aggregate with a low permeability is combined with cement paste of high permeability,
usually due to a high w/c ratio, it is expected to reduce the permeability of the concrete matrix
overall due to increased tortuosity as the aggregate particles intercept the channels of flow
within the cement paste. However, whilst it is stated that this is expected, rarely does it
actually occur, indicating then that other factors are the cause. The microstructure of the ITZ is
the most porous and weakest and may therefore be affected by the pressure applied during
the test. Given the higher 75% level of GGBS, it is possible that this caused the higher
permeability at 28 days and 180 days. The diluting influence of the binary and ternary material
in the cement paste was unable to react and create bonds with the aggregates causing a
weaker and more porous microstructure and large pores within the ITZ. The effects of

Ternary Combination Concretes Using GGBS, Fly Ash & Limestone: Strength, Permeation & Durability Properties
Chapter 7: A
209
aggregates was also discussed by Elahi et al (2010) with regard to coarse aggregate in the mix
affecting the size and volume of the ITZ, as well as the tortuosity of the flow path of the fluid or
gas.
Fig 7.4: Intrinsic Air Permeability of 75% GGBS level concretes
Ternary Combination Concretes Using GGBS, Fly Ash & Limestone: Strength, Permeation & Durability Properties
Chapter 7: A
210
The ITZ between the aggregate and the cement paste is stated by Basheer et al (2005)
as being significantly different from the bulk cement paste with regards to both composition
and density, as well as morphology. More importantly its porosity is higher (Scrivener, 1996;
Basheer et al, 2005) thus having a significant effect on the permeability of concrete. Basheer et
al (2005) found that a lower average size of aggregate within the mix can improve air
permeability; indeed by increasing the fine aggregate content the air permeability decreased.
Basher et al (2005) tested specimen mixes with 10mm and 20mm maximum coarse aggregate
size. The aggregates used for the concrete mixes in this study were also graded into 4/10 and
10/20, as given in BS EN12620.
Humidity and temperature may also affect the cement structure (Aligizaki, 2005) but
given the procedure that was followed for the preconditioning of each specimen it is unlikely
that this would have been a factor in the current study. (A high paste content may cause more
micro-cracking during drying in some cements than others.) Whilst there is little in the way of
previous studies covering the specific ternary mixes considered here, similarities can be seen
with the binary mixes examined in earlier papers. Alexander & Magee (1999) studied binary
mixes of GGBS and silica fume in addition to combining them to produce ternary mixes. Elahi et
al (2010) also studied the air permeability of GGBS and silica fume ternary concretes. Contrary
to Alexander & Magee’s findings, the ternary mixes of 50% GGBS and 7.5% silica fume did show
improved air permeability at 44 days compared to the binary but by 91 days the binary
concrete gave better results as the delayed reaction of the GGBS began to take effect. It is
important to state that the effects of silica fume are significantly different to that of limestone
or fly ash and are not covered in this study.
7.3 Relative Air Permeability to CEM I
By comparing the intrinsic air permeability of the blended mixes with CEM I, it is
possible to see the overall influence of additions and w/c ratios, as well as test age effects on
behaviour (shown in Figure 7.5). It was clear that air permeability increased with GGBS level, as
noted in earlier studies by Elahi et al (2010). The lower 35% GGBS level gave the better result
across the range of w/c ratio, improving with prolonged curing to 180 days, with the 10%
limestone ternary concrete providing the lowest permeability results across the full range of

Ternary Combination Concretes Using GGBS, Fly Ash & Limestone: Strength, Permeation & Durability Properties
Chapter 7: A
211
binary and ternary mixes and w/c ratio, except at the 35% GGBS level and at the lower w/c
ratio.
The other limestone ternary mixes at the higher 55% and 75% GGBS levels gave much
higher results relative to CEM I, increasing with GGBS level and addition percentage and with
age. The air permeability of these mixes did, however, decrease with increasing w/c ratio when
compared to CEM I. Tsivilis et al (1999) found that the mean pore size of a concrete is affected
by limestone with the addition of 10% limestone to the clinker. This suggests a lower
permeability, which also occurred in general across the range of ternary mixes but not when
compared to the CEM I. However, as will be discussed further later, the critical pore size of the
10% limestone ternary cement paste is higher than the other combinations tested at both w/c
ratios. This may suggest that the aggregate, being the only difference between them, has an
effect on the permeation of the concrete notably in the region of the ITZ where the bond
between the cement paste and aggregate is formed and where micro-cracking normally occurs
(Monteiro & Mehta, 2005). Due to its inert properties, the limestone may reduce the bonding
capability of the cement paste as well possibly creating weaker walls within the pore structure
that collapse with the application of pressure. The aggregate itself is of low permeability and
would only affect the area over which flow takes places (Neville, 1995).
The fly ash mixes gave higher results than the limestone and binary mixes at 28 days.
By 180 days, the permeability had decreased with the difference more noticeable with
increasing in w/c ratio. Given the increase in the limestone ternary mixes at 180 days, it is the
fly ash ternary mixes that show a more improved permeability with age and also compared to
their limestone counterparts at the 75% GGBS level.
The effects of fly ash on permeability are well covered within the literature with regards to
their use as a binary addition. Even at these low addition levels, as a ternary material, the
effects are evident with prolonged curing to 180 days given the delay in reaction that occurs.
The effect of moisture content has already been discussed and the preconditioning of the test
specimens should have removed moisture sufficiently to have avoided any influence on air
permeability.

Ternary Combination Concretes Using GGBS, Fly Ash & Limestone: Strength, Permeation & Durability Properties
Chapter 7: A
212
Fig 7.5 Intrinsic Air Permeability relative to CEM I
65% CEM I 45% CEM I
25% CEM I
65% CEM I 45% CEM I
75% CEM I
65% CEM I 45% CEM I
75% CEM I

Ternary Combination Concretes Using GGBS, Fly Ash & Limestone: Strength, Permeation & Durability Properties
Chapter 7: A
213
The aggregate within the concrete may also affect permeability and it is the aggregate
that separates the permeability of a cement paste alone with that of concrete, as already
noted. Types of aggregate may have differing permeability values, low permeability, as those
used in this study, may reduce the effective area over which flow can take place. Unlike with
cement paste the rate of flow in concrete is affected, as stated by Neville (1995), as it has to
circumvent aggregate particles making its effective path longer, thus reducing permeability. As
previously discussed, these aggregate particles are generally surrounded by hydrated cement
paste forming the ITZ so this actual effect is minimal; in fact, in a well compacted concrete it is
the permeability of the ITZ that can have the greater effect on the overall permeability of
concrete (Monteiro & Mehta, 2005).
7.4 Water Penetration Under Pressure
The method involved clamping a 150mm cube test specimen into the testing station for
72 hours and application of pressure up to 500 KPa to a roughened surface, after which the
depth of penetration is determined.
As with all previous tests a CEM I control sample was considered to provide a baseline
with which to compare the binary and ternary blended concretes. At 28 days the lower 0.35
w/c ratio gave a reading of 10mm indicating the depth at which the water had penetrated at
the set pressure over the 72 hour test period. As the w/c ratio increased to 0.5 and 0.65 the
water penetration depth at 28 days increased to 17mm and 28mm respectively. By 180 days,
the depth of penetration of the CEM I control mix had reduced across the range of w/c ratios to
7mm, 12mm and 19mm for 0.35, 0.5 and 0.65 w/c ratio respectively.
7.4.1 35% GGBS Level
It is evident from the data that an increase in w/c ratio increased the depth of water
penetration of concrete as expected, which decreased following a longer curing period of 180
days.
At 28 days, the 35% GGBS binary mix gave the lowest depth of water penetration
across the range of w/c ratios and was equal to the CEM I concrete at 0.5 w/c ratio, as shown in
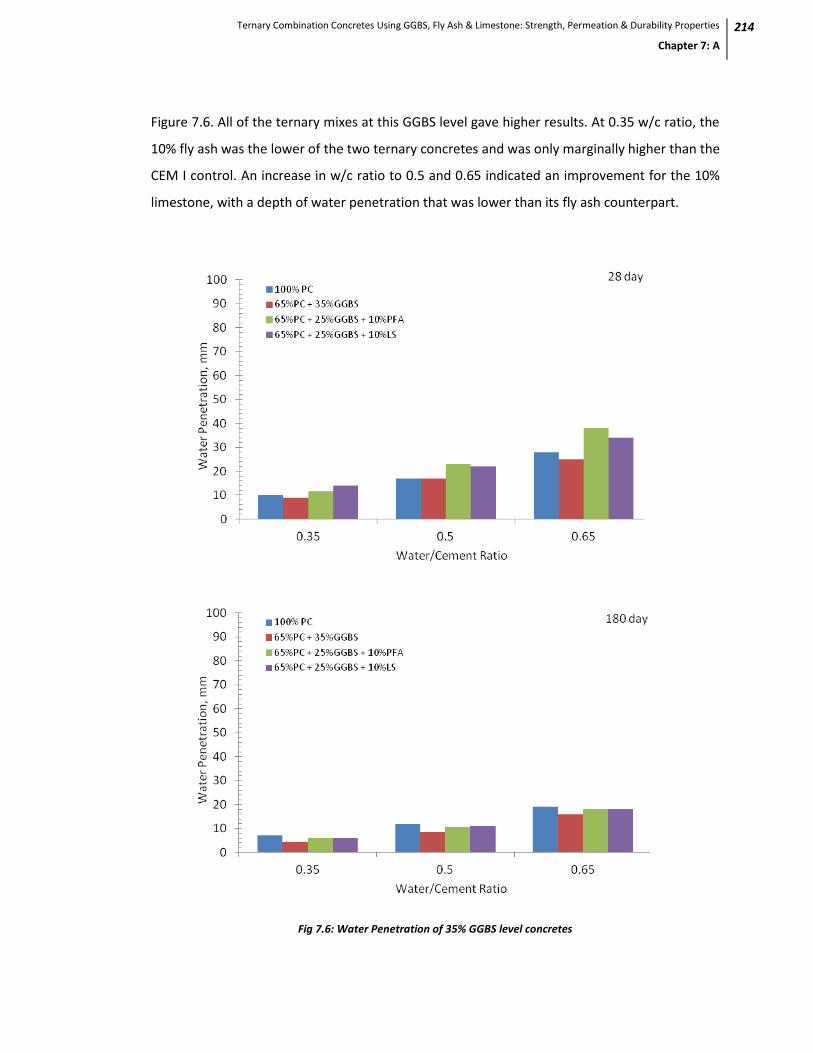
Ternary Combination Concretes Using GGBS, Fly Ash & Limestone: Strength, Permeation & Durability Properties
Chapter 7: A
214
Figure 7.6. All of the ternary mixes at this GGBS level gave higher results. At 0.35 w/c ratio, the
10% fly ash was the lower of the two ternary concretes and was only marginally higher than the
CEM I control. An increase in w/c ratio to 0.5 and 0.65 indicated an improvement for the 10%
limestone, with a depth of water penetration that was lower than its fly ash counterpart.
Fig 7.6: Water Penetration of 35% GGBS level concretes

Ternary Combination Concretes Using GGBS, Fly Ash & Limestone: Strength, Permeation & Durability Properties
Chapter 7: A
215
By 180 days, a noticeable decrease was evident across the range of blended mixes and
w/c ratios, especially with the ternary mixes. The binary mix remained the lowest of the
blended concretes, but the longer curing time improved the effects of the ternary materials.
Their results were more comparable and marginally lower than the CEM I control mix. A study
carried out by Ramezanianpour et al (2009) into the influence of limestone cements found that
in general an addition of up to 10% limestone can lower the depth of water penetration due to
the filler effect. At 28 days this effect was not seen at this 35% level as the depth of water
penetration remained high for both ternary mixes across the range of w/c ratios.
Ramezanianpour et al (2009) discussed the effects of limestone used as a binary addition and
suggested that as a filler it can modify the initial porosity of the concrete but when added as a
ternary to GGBS concretes at this level the effects of the 10% limestone can be negative.
Prolonged curing to 180 days allows for reaction by GGBS, thus increasing the C-S-H gel
formation, filling the pore spaces more efficiently than the CEM I concrete.
7.4.2 55% GGBS Level
An increase in GGBS content showed a marked increase in the depth of water
penetration. At this level, as shown in Figure 7.7, following 28 days curing, it is the CEM I
control mix that gave the lowest depth of water penetration. The binary mix was higher but it is
the ternary concretes that showed the highest increase in depth compared to the 35% addition
level. At 0.35 w/c ratio the 10% and 20% fly ash ternary mixes were better than their limestone
counterparts and equal to them at 0.5 w/c ratio. An increase to 0.65 w/c ratio, although
increasing the depth of penetration in general, gave improved limestone ternary mixes
compared to their fly ash counterparts.
By 180 days, the longer curing time had a significant effect on all mixes, most
noticeably the blended concretes. Given the slower reactivity of GGBS this was expected. Just
as the strength gain improved with prolonged curing, so did the permeability. The binary mix
was the lowest of all mixes across the range of w/c ratios, with the reactivity of GGBS forming a
denser micro-structure as more pore space is filled with C-S-H due to the greater proportion of
silica, and reduced lime.

Ternary Combination Concretes Using GGBS, Fly Ash & Limestone: Strength, Permeation & Durability Properties
Chapter 7: A
216
Fig 7.7: Water Penetration of 55% GGBS level concretes

Ternary Combination Concretes Using GGBS, Fly Ash & Limestone: Strength, Permeation & Durability Properties
Chapter 7: A
217
The ternary mixes more than halved, in some cases, the depth of penetration. Whilst
the ternary mixes still remained higher than the CEM I, the 10% fly ash ternary concrete was
generally comparable with this and its limestone counterpart. At 0.35 and 0.5 w/c ratios, there
was little difference seen between the 20% fly ash and the 10% limestone. The same study
discussed earlier carried out by Ramezanianpour et al (2009) found that a greater addition of
20% limestone increased the depth of water penetration. The depth of the water penetration
increased with w/c ratio as expected. Though the actual test parameters differed, similar
trends were seen for both air permeability and water penetration tests at this GGBS level
although the differences were not as obvious as those discussed earlier and shown in Figure
7.3.
7.4.3 75% GGBS Level
A further increase in GGBS content gave a more significant increase in the depth of
water penetration with the difference between the CEM I control mix and the blended
concretes more noticeable at 28 days, as shown in Figure 7.8. The binary and ternary concretes
almost doubled in depth when compared to the 55% GGBS level. At 0.35 w/c ratio, both fly ash
ternary mixes were lower than their limestone counterparts, but higher than the binary mix. At
0.5 w/c ratio the fly ash and limestone concretes were comparable. The 35% limestone was
marginally higher than the 20% fly ash indicating that the filler effect was almost similar to the
fly ash, which is likely to be competing for the free lime available. This is also seen with an
increased w/c ratio to 0.65.
The 55% GGBS level illustrated improvements by prolonged curing to 180 days that
were again noted at this GGBS level; although in this case all blended concretes were higher
than the CEM I control mix. The 10% fly ash and the 10% limestone mixes were comparable
across the range of w/c ratios, whilst the 20% fly ash was higher than both of these mixes, but
still significantly lower than its limestone counterpart. The effects of the fly ash and limestone
differ fundamentally in that the limestone acts as a filler, filling spaces between the GGBS and
CEM I particles at lower replacement levels, indicated by a decrease in the water penetration,
whilst at higher limestone levels dilution effects occur (Ramezanianpour et al, 2009). It has

Ternary Combination Concretes Using GGBS, Fly Ash & Limestone: Strength, Permeation & Durability Properties
Chapter 7: A
218
been stated previously that the CEM I and GGBS hydrate/react, albeit at different rates, with
the latter prolonged, but the limestone is considered not to have pozzolanic properties
(Sersale, 1992) and the increase in limestone reduces the pozzolanic activity within the
concrete.
Fig 7.8: Water Penetration of 75% GGBS level concretes

Ternary Combination Concretes Using GGBS, Fly Ash & Limestone: Strength, Permeation & Durability Properties
Chapter 7: A
219
The reduced water penetration of the fly ash ternary concretes, compared to those of
limestone is due to its own pozzolanic reaction, despite competition for lime with the GGBS
whose own reaction still occurs (indicated by continuing strength development) with time
increasing C-S-H and therefore reducing pore space. Fraay (1989) attributed the reduction in
capillary porosity of fly ash concretes to the products of the pozzolanic reaction diffusing away
from fly ash particles, on which they form in the early stages, and precipitating within the
capillary pores.
As well as both the dilution and filler effects, Irassar (2009) discussed heterogeneous
nucleation occurring due to limestone particles acting as a nucleation site, increasing the early
hydration of cement resulting in the production of a more disorientated crystallisation of CH.
Heterogeneous nucleation is also discussed by Bonavetti et al in an earlier study (2003) and by
Cyr et al (2006).
7.5 Relative Depth of Water Penetration to CEM I
By calculating the depth of water penetration of the blended concretes relative to the
CEM I control mix, an overview of the results is presented in Figure 7.9; the effects of extended
curing to 180 days is more prominent certainly for the lower 35% GGBS level across all three
w/c ratios, where it is clear that all mixes were lower than the CEM I by 180 days.
It is also evident from Figure 7.10 the previously discussed dilution effect of the
materials, as well as the individual properties of both the ternary additions and their effect
within the mix. At the lower w/c ratio of 0.35, the fly ash was better than the limestone which
improved with increasing w/c ratio. The depth of water penetration was lower at 0.65 w/c ratio
(Figure 7.10 (c)) overall in relation to the CEM I concrete. The improvement of the limestone
mixes with an increase in w/c ratio may be related to an increase in early hydration due to the
previously discussed heterogeneous nucleation.

Ternary Combination Concretes Using GGBS, Fly Ash & Limestone: Strength, Permeation & Durability Properties
Chapter 7: A
220
Fig 7.9: Relative Depth of Water Penetration to CEM I
65% CEM I 45% CEM I 75% CEM I
65% CEM I 45% CEM I 75% CEM I
65% CEM I 45% CEM I 75% CEM I

Ternary Combination Concretes Using GGBS, Fly Ash & Limestone: Strength, Permeation & Durability Properties
Chapter 7: A
221
7.6 Correlation Between Permeation Properties
Having examined air permeability and water penetration individually it was considered
prudent to review them in relation to other properties thus far discussed. In relation to each
other Neville & Brooks (2007) state that there is no unique relationship between two
permeation properties, in respect of any concrete. When examined collectively by w/c ratio in
Figure 7.10 it is seen that, especially for the higher w/c ratio of 0.65, there is a wide
range/scatter of results. Similar patterns are seen for all three w/c ratios, albeit that the
grouping is more condensed for the 0.35 w/c ratio, and whilst the R2 value would indicate a
reasonably strong correlation. However, when examined independently by addition and level
of replacement, this is not necessarily the case.
Fig 7.10: Correlation of tested permeability properties by w/c ratio at (a) 28 days and (b) 180 days
Concretes giving similar permeability results for air can give varying results for water
penetration. For example, increasing fly ash addition from 10% to 20% for the ternary mixes at
both 55% and 75% replacement levels had little impact on the air permeability results, but
increased the depth of penetration. This trend is seen across all three w/c ratios, increasing
with the proportion of mix water to material volume, at both test ages. For the limestone
additions, both permeation properties are increased with higher levels of limestone. By 180

Ternary Combination Concretes Using GGBS, Fly Ash & Limestone: Strength, Permeation & Durability Properties
Chapter 7: A
222
days, with increased levels of hydration, there is a notable grouping for each addition that is far
less apparent at 28 days when hydration is still taking place within the concrete matrix. During
this time it is likely that the pore system is continuously changing due to the cycle of narrowing
and widening of pores as an effect of on-going physical and chemical interactions between the
penetrating media and the minerals within the cement paste itself (Mehta & Montiero, 2004).
The pressure, also associated with the tests may also have an effect on the pore structure.
These effects are, however, unpredictable and merely indicative of the dynamics of the pore
system.
7.7 Permeation v Compressive Strength
Within concrete it is the mix water that is considered to be indirectly responsible for
the permeability of the cement paste. It is also, as discussed in previous chapters, related to
the development of compressive strength. It would therefore be prudent to examine the
compressive strength of the concretes in relation to their permeability properties. Collectively,
and in general, it would appear that an increase in permeability would coincide with a decrease
in compressive strength, as shown in Figures 7.11 and 7.12, for air permeability and water
penetration respectively, the latter of which indicates a relatively strong correlation between
the results for 0.35 and 0.5 w/c ratios, agreeing in part with Chidraprasit et al (2007).
Fig 7.11: Air permeation against compressive strength by w/c ratio for (a) 28 days and (b) 180 days
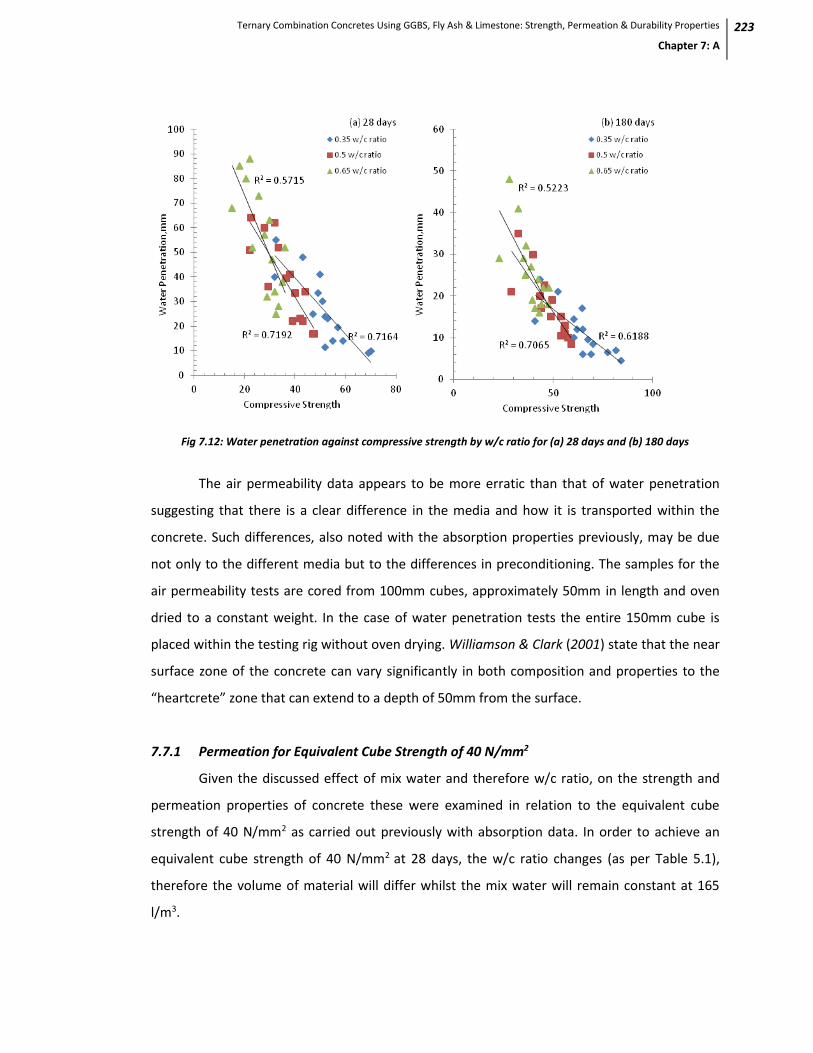
Ternary Combination Concretes Using GGBS, Fly Ash & Limestone: Strength, Permeation & Durability Properties
Chapter 7: A
223
Fig 7.12: Water penetration against compressive strength by w/c ratio for (a) 28 days and (b) 180 days
The air permeability data appears to be more erratic than that of water penetration
suggesting that there is a clear difference in the media and how it is transported within the
concrete. Such differences, also noted with the absorption properties previously, may be due
not only to the different media but to the differences in preconditioning. The samples for the
air permeability tests are cored from 100mm cubes, approximately 50mm in length and oven
dried to a constant weight. In the case of water penetration tests the entire 150mm cube is
placed within the testing rig without oven drying. Williamson & Clark (2001) state that the near
surface zone of the concrete can vary significantly in both composition and properties to the
“heartcrete” zone that can extend to a depth of 50mm from the surface.
7.7.1 Permeation for Equivalent Cube Strength of 40 N/mm2
Given the discussed effect of mix water and therefore w/c ratio, on the strength and
permeation properties of concrete these were examined in relation to the equivalent cube
strength of 40 N/mm2 as carried out previously with absorption data. In order to achieve an
equivalent cube strength of 40 N/mm2 at 28 days, the w/c ratio changes (as per Table 5.1),
therefore the volume of material will differ whilst the mix water will remain constant at 165
l/m3.

Ternary Combination Concretes Using GGBS, Fly Ash & Limestone: Strength, Permeation & Durability Properties
Chapter 7: A
224
From Figure 7.13, showing the intrinsic air permeability for equivalent cube strength, it
is clear from the results that the 10% limestone ternary, at the 35% level, provides lower
permeability values at 28 days for the equivalent cube strength between mixes. This particular
mix requires a w/c ratio of 0.5 corresponding with previously discussed data.
Fig 7.13 Intrinsic Air Permeability for Equivalent Cube Strength of 40 N/mm2
Figure 7.9 discussed earlier provides an overview of the effects of ternary additions,
w/c ratio and longer curing times but these should be viewed in a more practical context
especially if the depth of penetration is to be used as a quantitative assessment of the
concrete. For a concrete to be considered impermeable, the depth of penetration should be
less than 50mm, if the depth is lower than 30mm the concrete is considered to be
impermeable under aggressive attack (Neville, 1995). Figures 7.6 and 7.9 indicate a number of
test specimens that may be considered to be impermeable, or indeed impermeable under
aggressive attack, but they do not take into consideration the strength of each individual
specimen at either test age. In much the same way as Figure 7.13 does, Figure 7.14 illustrates
the expected depth of penetration for each mix combination at the 35% and 55% GGBS level
for equivalent cube strength of 40 N/mm2. It is evident that all of these mixes can be

Ternary Combination Concretes Using GGBS, Fly Ash & Limestone: Strength, Permeation & Durability Properties
Chapter 7: A
225
considered impermeable at 28 days by altering the w/c ratio to achieve equivalent strength and
both ternary concretes at the 35% replacement level may be considered impermeable under
aggressive attack. Given the consequences of poor permeability in resisting the ingress of
attacking media, it would be fair to state that the development of improved permeability
properties at the earliest age possible is greatly advantageous.
Fig 7.13: Depth of Water Penetration for Equivalent Cube Strength of 40 N/mm2
7.8 Permeation v Porosity
Whilst it is possible to gain some understanding of the transportation properties of
concrete itself, it is difficult to determine what Mehta & Monteiro state as a ‘fluid transport
property factor’ due to the effect of changes that are unpredictable in the pore system, notably
the structure of pores, upon penetration of attacking media (Mehta & Monteiro, 2004). It was
stated previously that the mix water is indirectly responsible for the permeability of concrete.
More specifically the hydrated cement paste due to its content determining the total space
followed by the unfilled space after the mix water has been consumed by both the hydration
reactions and evaporation to the environment.

Ternary Combination Concretes Using GGBS, Fly Ash & Limestone: Strength, Permeation & Durability Properties
Chapter 7: A
226
Neville & Brooks (2007) state that the permeability is governed by cement paste and
porosity but this relationship is not as simple as the pore size distribution is a factor. In addition
the pore structure itself is fundamental (Massazza, 1996; Chia & Zhang, 2002). In this respect,
and as per previous chapters, the porosity of selected cement pastes will be considered in
relation to the permeability of their concrete counterparts. Figures 7.14 and 7.15 provide an
overview of the data of the permeation properties tested, together with the critical pore
diameter. This indicates that some similarities can be seen between them and those for the
absorption tests shown in Chapter 6 (refer to Figures 6.13 and 6.14).
When examined in more detail, in order to determine if any correlation exists between
the data, it is clear that the critical pore diameter relates more to water penetration than air
permeability, as shown in Figures 7.16 and 7.17 respectively. In general, water penetration
increases with critical pore diameter across both w/c ratios and test ages. This trend is seen, to
a similar extent, with air permeability at the 0.5 w/c ratio, but the correlation is weak and there
is a more erratic spread of data.
Fig 7.14: Air permeability against critical pore size at 28 days [(a) and (b)] and 180 days [(c) and (d)]

Ternary Combination Concretes Using GGBS, Fly Ash & Limestone: Strength, Permeation & Durability Properties
Chapter 7: A
227
Fig 7.15: Water penetration against critical pore size at 28 days [(a) and (b)] and 180 days [(c) and (d)]
Fig 7.16: Air permeability against critical pore diameter for both w/c ratios at (a) 28 days and (b) 180 days

Ternary Combination Concretes Using GGBS, Fly Ash & Limestone: Strength, Permeation & Durability Properties
Chapter 7: A
228
Fig 7.17: Water penetration against critical pore diameter for both w/c ratios at (a) 28 days and (b) 180 days
The data, when compared with total porosity, gives very poor correlations for both
permeability properties tested as shown in Figures 7.18 and 7.19. A number of mixes gave
similar total porosity results but both water penetration and air permeability readings varied in
spite of this. At 28 days, the data was wide spread but by 180 days, for the water penetration
test, it is evident that hydration and slowed, if not ceased entirely, and the effects of the
additional materials were noted. Whilst generally they reduce the total porosity marginally,
compared to the CEM I control mix, the 10% fly ash ternary at the 55% replacement level gave
higher water penetration results as did the limestone ternary at this level, with slightly higher
porosity also obtained. Pore blocking effects may have occurred with the discontinuity of pores
also happening within the matrix, but this would be noted due to the differences in
permeability results, where it is likely that weaker pores walls within the ITZ will break down
due to the applied pressure.
The mercury intrusion porosimetry tests were carried out on cement paste and not
concrete samples and therefore do not take into consideration the porosity effect of the
aggregates used in the concrete or the ITZ. The effects of the aggregates were discussed
earlier. Elahi et al (2010) noted that varying fine and coarse aggregate could affect permeability
as much the effects of additional material on the microstructure (Elahi et al, 2010). The effect

Ternary Combination Concretes Using GGBS, Fly Ash & Limestone: Strength, Permeation & Durability Properties
Chapter 7: A
229
on the ITZ has also been discussed by Mehta & Monteiro (2006) and Basheer et al (2005). The
actual effects of the fine and coarse aggregates in this instance are supposition and worthy of
greater study in the future, but whilst the ITZ is likely to have some effect a relationship
between the two may be expected
Fig 7.18: Air permeability against total porosity for both w/c ratios at (a) 28 days and (b) 180 days
.
Fig 7.19: Water penetration against total porosity for both w/c ratios at (a) 28 days and (b) 180 days

Ternary Combination Concretes Using GGBS, Fly Ash & Limestone: Strength, Permeation & Durability Properties
Chapter 7: A
230
7.10 Summary
As with the absorption tests discussed in Chapter 6 it was found that permeability
increased with a rise in w/c ratio and GGBS level and decreased with prolonged curing to 180
days.
The binary mixes at the lower 35% GGBS level, across the range of w/c ratio gave lower
air permeability results than at higher addition levels. Though they were slightly higher at 28
days, the delayed and prolonged reaction of GGBS, given the extended curing time, improved
the microstructure due to increased C-S-H in the gel pores reducing permeability (Neville,
1995). This improvement was also seen in the water penetration tests. Unlike the air
permeability values the 55% level also showed improvements with prolonged curing in the
binary concretes, but not at the 75% level.
The addition of fly ash did little to improve the permeability of concrete at the 0.35 and
0.5 w/c ratio. An increase to 0.65 w/c ratio and prolonged curing did improve the fly ash
ternary concretes when compared to binary mixes and, indeed, CEM I concrete at the lower
35% level. Similar trends were indicated in the water penetration results apart from those at
the increased w/c ratio, improvements were seen with time at the lower 35% GGBS level when
compared with the CEM I concrete but it was slightly higher than the binary concrete. An
increase in fly ash content to 20% had the effect of increasing permeability values was possibly
due to increased competition with GGBS for the lime.
The 10% limestone ternary concretes showed encouraging results for air permeability
at the lower 35% level. Across the range of w/c ratio at 28 days, it gave consistently lower
values which improved further with prolonged curing. However, increasing the GGBS level
increased air permeability which was further increased for the 20% limestone ternary concrete
suggesting a diluting effect. This was also noted in the water penetration tests.
Despite Neville & Brooks (2007) implying that no ‘unique’ relationship exists between
air permeability and water penetration a correlation was noted which was likely to be due to
them both being dependent on the w/c ratio. In addition the relationship between compressive
Ternary Combination Concretes Using GGBS, Fly Ash & Limestone: Strength, Permeation & Durability Properties
Chapter 7: A
231
strength and permeability generally showed that strength increased with decreasing
permeability confirming that the pore porous matrix is indeed weaker.
No correlation was found between the permeability properties and the porosity of the
cement paste indicating that the effect of aggregate on permeation properties and that of
additional materials varies; a slight correlation was noted for the water penetration tests at 180
days. It was also noted that a greater relationship existed between water penetration and
critical pore diameter than porosity, or indeed between air permeability and critical pore
diameter.
The depth of water penetration increases with critical pore size. For the binary mixes,
as the replacement level increased the critical pore size increased, slightly but the increase in
air permeability was more pronounced, with an increase in w/c ratio. An increase in ternary
addition had the same effect, however the permeability of fly ash was higher than the
limestone but had a lower critical pore size, whilst the limestone was higher in critical pore size
and lower in air permeability.

Ternary Combination Concretes Using GGBS, Fly Ash & Limestone: Strength, Permeation & Durability Properties
Chapter 8: Durability
232
CHAPTER EIGHT: CARBONATION & CHLORIDE INGRESS
OF CONCRETE
8.1 Introduction
In addition to the strength requirements of concrete relevant to structural and fire
resistance, it is also important to consider durability which has received greater consideration
over the last 20 years or so. Indeed, the final location of a concrete structure needs to be taken
into consideration as this can provide a range of exposure conditions. BS EN 206-1:2000 covers
exposure classes as summarised in Table 8.1 and includes not only attack from carbonation in a
variety of situations (dry, cyclic wet and humid) but also from chlorides. Chlorides may be in the
form of spray, or direct contact with sea water, or from other sources such as those in de-icing
salts. BS EN 206-1:2000 also includes freeze/thaw attack for concretes in moderate and high
saturation situations. This is not covered in this study but shows the extent of environments
that need to be considered.
The absorption and permeability properties and the movement of gases and fluids
through concrete were discussed in earlier chapters. The integrity of the concrete can alter due
to interactions with the constituents and the pore fluid including absorbed chlorides, sulfates
and CO2, which can affect the concrete itself and that reinforced with steel (Basheer et al,
2005). The majority of concretes structures will be reinforced and it is this reinforcing steel that
is the most vulnerable from both carbonation, in the form of gas, and chloride ingress.
Structures in urban environments are more at risk due to high concentrations of CO2 in the
atmosphere (Sisomphon & Franke, 2007). Yoon et al (2007) discussed the continued increase in
CO2 in the atmosphere due to global climate change since the 1970’s.
Fabbri et al (2009) refer to the effects of underground CO2 sequestration on concrete
reservoirs, which given certain temperature and pressure conditions cause CO2 to be in its

Ternary Combination Concretes Using GGBS, Fly Ash & Limestone: Strength, Permeation & Durability Properties
Chapter 8: Durability
233
supercritical form, or fluid state. Yet carbonation alone does not represent a risk to concrete
itself, unless the concrete is reinforced where there is a potential risk to corrosion of the steel
thus threatening the structural integrity of the concrete structure and this is more likely to be
an issue of surface damage. Chloride ingress again threatens the durability of concrete in a
similar way to carbonation, causing corrosion of steel reinforcement which may not necessarily
be due to the surrounding concrete being visibly damaged but also due to the permeability of
concrete. Threats from salt environments can range from extreme exposure with immersion in
sea water, although this tends to be reliant on the presence of oxygen, to that from salt spray
in coastal regions, or from de-icing salts during winter conditions that brings with it additional
issues, e.g. freeze-thaw cycles. Given the importance of the durability of concrete selected
mixes were tested with regard to their resistance to chloride ingress and carbonation.
Table 8.1: Exposure classes summarised from BS EN 206-1:2000
Class Designation Environment
No risk of corrosion or attack
XO Concrete without reinforcement or embedded metal all exposures
except where there is freeze/thaw, abrasion or chemical attack
Corrosion induced by carbonation
XC1 Dry or permanently wet
XC2 Wet, rarely dry
XC3 Moderate humidity
XC4 Cyclic wet and dry
Corrosion induced by chlorides other than from sea water
XD1 Moderate humidity
XD2 Wet, rarely dry
XD3 Cyclic wet and dry
Corrosion induced by chlorides from sea water
XS1 Exposed to airborne salt but not in direct contact with sea water
XS2 Permanently submerged
XS3 Tidal, splash and spray zones
Freeze/thaw attack with or without de-icing agents
XF1 Moderate water saturation, without de-icing agent
XF2 Moderate water saturation, with de-icing agent
XF3 High water saturation, without de-icing agent or sea water
XF4 High water saturation, with de-icing agent or sea water

Ternary Combination Concretes Using GGBS, Fly Ash & Limestone: Strength, Permeation & Durability Properties
Chapter 8: Durability
234
Due to the restricted time available and given that both processes in a natural exposure
take considerable time, accelerated tests were used to establish the resistance of concrete to
carbonation and chloride.
8.2 Carbonation
Accelerated carbonation tests were carried out on selected concretes. Previous studies
(Sisomphon & Franke, 2007; Osbourne,1986) have established the poor resistance to
carbonation of GGBS concretes and thus the aim of the work described in this section was to
establish whether the addition of ternary materials can improve this. Carbonation is the result
of dissolution of CO2 in the concrete pore fluid, reacting with calcium hydroxide and calcium
silica hydrates (CSH) to form calcite. It is the formation of calcium carbonate (CaCO3) by
chemical reaction in the concrete. The creation of CaCO3 requires three equally important
substances: carbon dioxide (CO2), calcium phases (Ca) and water (H2O). CO2 is present in the
atmosphere in varying degrees depending on location (rural or urban), calcium phases (mainly
Ca(OH)2 and CSH) are present in the concrete and water is contained in the pores.
The CO2 diffuses through the pore spaces, where the first reaction occurs with the H2O to form
carbonic acid (H2CO3) which then reacts with the calcium phases.
[Eq 8.1]
[Eq 8.2]
Once the Ca(OH)2 is converted and is missing from the cement paste hydration products in the
form of CSH (CaO∙SiO2∙H2O) will then liberate CaO which will also carbonate:
[Eq 8.3]
The Ca(OH)2 is the most reactive with CO2, turning to carbonic acid in the presence of moisture.
The calcium carbonate (CaCO3) produced during the reaction is insoluble and its production will

Ternary Combination Concretes Using GGBS, Fly Ash & Limestone: Strength, Permeation & Durability Properties
Chapter 8: Durability
235
cease unless free CO2 is present in the water when a further reaction will occur to produce
soluble bicarbonate (Mehta & Monteiro, 2006).
[Eq 8.4]
This reaction is reversible and requires an amount of ‘balancing’ CO2 to maintain equilibrium. It
should, however, not be confused with bi-carbonation which is a separate process that can
occur in concrete with very high w/c ratio due to formation of hydrogen carbonate ions at pH
levels lower than 10. Contrary to normal carbonation, bi-carbonation will result in increased
porosity making the concrete soft and friable. It can be recognised within the microstructure by
the presence of large ‘popcorn’ like calcite crystals as well as the highly porous paste (Concrete
Experts International, 2006).
The pH value will begin to fall once these reactions have taken place, from pH 12.5/13
for normal concrete to around pH 9 for carbonated concrete (Yoon et al, 2007). The
carbonation of the concrete alone is not, essentially, debilitating. However, once the process
has reached the reinforcement and the pH value has dropped below 13 the passive ‘film’ on
the steel reinforcement is compromised and corrosion will ensue. As both Basheer et al and
Papadakis state, the majority of concrete deterioration is due to corrosion of reinforcement
due to carbonation induced depassivation of steel bars (Basheer et al, 1996; Papadakis, 2000).
The rate of carbonation is not a linear function, changing with time and depth. It is a
natural process and in good quality concrete it is very slow with an average penetration depth
of 1mm per year. The speed of the process through concrete is mainly dependent on two
parameters: the permeation and calcium content of the concrete as well as the ambient
atmospheric conditions, which includes the concentration of CO2, relative humidity (RH) and
temperature. With regards to the permeability, the process has a continuing need for CO2 from
the atmosphere, for carbonation to spread fresh CO2 from the surface needs to be supplied
continuously, penetrating deeper into the concrete. Low porosity and permeability will
decrease the rate of CO2 ingress therefore delaying carbonation which generally occurs in the
pores at a relative humidity between 40% and 90%. At a lower RH CO2 cannot dissolve in water,
while if this is higher than 90% it is not able to enter the pore system.

Ternary Combination Concretes Using GGBS, Fly Ash & Limestone: Strength, Permeation & Durability Properties
Chapter 8: Durability
236
Despite having an adverse effect on the degree of concrete alkalinity and its ability to
protect reinforcement the physical effects within concrete are usually positive. Carbonation of
mature concrete densifies its structure, increases strength and reduces permeability, however,
it does increase shrinkage in concrete that is mature, causing additional cracking.
In CEM I concrete it is only the reaction of Ca(OH)2 and CO2 that affects the rate of
carbonation. With blended concretes the process of carbonation is more complex. In concretes
containing GGBS there is a lower level of Ca(OH)2 which is more likely to be completely
carbonated. Once this has happened carbonation will take place with the CSH that is produced
at a greater rate in concrete containing GGBS or fly ash. Higher levels of CaCO3 are produced,
exacerbating carbonation further and consequently pores with a larger diameter than 100nm
are created. It is these pores that aid carbonation.
The test samples were placed in a carbonation tank with an enriched 4% CO2
environment at 20oC and a humidity of 50% ± 5%. The purpose of the accelerated carbonation
test is to reduce the normal period of carbonation from many years to a few weeks (Sisomphon
& Franke, 2007). Osbourne (1986) reported on the importance of the curing regime on
concretes containing GGBS, suggesting that poorly cured concrete can cause high carbonation.
As discussed in Chapter 3, all samples were cured in water at a controlled temperature of 20oC
± 1o for 28 days. The carbonation specimens were then removed and laboratory dried for two
weeks before being coated with wax, leaving one face open. A phenolphthalein 1.0% ethanol
indicator solution was applied to the split and cleaned surface of the concrete. If the surface
turns purple the pH is >8.6, where it remains colourless the pH of the concrete is <8.6
suggesting carbonation. Fully carbonated concrete has a pH of approximately 8.4, a pH of 8.6
may be indicated by a faint pink colour where a strong, immediate colour change will be
indicative of a pH higher than 9 or 10.
The tests were carried out over a period of 20 weeks and the results are reported in
Figure 8.1, which shows a comparison of 8 and 20 week results across the range of w/c ratios. It
was evident, as with previous tests, that an increase in w/c ratio increased the rate of
carbonation. Carbonation also increased with GGBS level at 8 weeks and further with the
ternary additions, which was more noticeable with the fly ash ternary concretes at the later, 20

Ternary Combination Concretes Using GGBS, Fly Ash & Limestone: Strength, Permeation & Durability Properties
Chapter 8: Durability
237
week, test age. The reactions are much slower at the greater GGBS level, leading to reductions
in binding of CO2, due to the dilution of Ca(OH)2 within the mix. At this age (8 weeks) the
amount of calcium hydroxide (CH) within the GGBS concretes is limited compared to that of
CEM I, resulting in the CO2 not becoming fixed near the concrete surface leading to little, or no,
pore blocking formation of calcium carbonate (Khan et al, 2002; Thomas & Matthews, 1992).
Given that it is stored in a dry environment it is unlikely that more CH will form. It is the content
of CH and rate of CO2 penetration that Shi et al state as the two key factors controlling
carbonation (Shi et al, 2009).
The addition of fly ash in ternary concrete increased the rate of carbonation, with
significant increases seen in these concretes by 20 weeks across the range of w/c ratios. Shi et
al also concluded that both fly ash and GGBS decreased carbonation resistance confirming
earlier studies by Kahn et al (2002) and Sisomphon & Franke (2007) who studied longer-term
carbonation effects and determined that a 50% addition of fly ash to a CEM III-B (blast-furnace
slag cement) increased the depth of carbonation compared to CEM III-B concrete. By testing
concretes following 3, 7 and 28 days curing, Sisomphon & Franke also found that increased
curing improved carbonation resistance (Sisomphon & Franke, 2007). At 20 weeks testing, it is
clear that the GGBS binary concretes gave reduced carbonation depth compared to the ternary
concretes, Shi et al (2009)attribute this to the GGBS being generally more active than the fly
ash creating a slightly lower CH content and a denser matrix (Shi et al, 2009).
Given the continued hydration of the GBBS (indicated by the later strength
development of the concretes), it was expected that all samples would show an increase in
carbonation depth with time. In the case of the limestone ternary mixes this occurred rapidly
during the first five weeks after which the initial rates slowed but carbonation depth still
increased as shown in Figure 8.2, which illustrates the rate of carbonation for limestone ternary
concretes as 0.5 w/c ratio over the 20 week test period. The 10% limestone ternary mix at the
55% level appeared to increase at a slightly greater rate. The CEM I concrete gave the best
results for resistance to carbonation over the test period. This may be due to the amount of
Ca(OH)2 present in the concrete; a lower concentration increases carbonation depth, whilst a
higher concentration decreases carbonation (Bier, 1987). The 20% limestone ternary concrete

Ternary Combination Concretes Using GGBS, Fly Ash & Limestone: Strength, Permeation & Durability Properties
Chapter 8: Durability
238
at the 55% addition level gave improved resistance to carbonation depth compared to the
other ternary concretes.
Fig 8.1: Carbonation depth at 8 and 20 weeks across the range of w/c ratios.
(35% LS* recorded depth at 16 weeks)

Ternary Combination Concretes Using GGBS, Fly Ash & Limestone: Strength, Permeation & Durability Properties
Chapter 8: Durability
239
Fig 8.2: Carbonation for limestone ternary mixes at 0.5 water cement ratio
The rate of carbonation for the fly ash ternary mixes in general did not seem to slow
during the first 10 weeks, as shown in Figure 8.3. The increased rate of carbonation, as
discussed previously, due to the addition of fly ash was expected. Sisomphon & Franke (2007)
suggest this to be a result of the lower levels of Ca(OH)2, as indicated by Bier (1987), in the
hardened cement paste caused by silica in the fly ash reacting with Ca(OH)2 from the hydration
of the cement. Sisomphon & Franke (2007) tested CEM III-B concretes together with a CEM III-b
+ 50% fly ash mix following 3, 7 and 28 days curing under water. In line with the results from
this study, the CEM I control mix remained the most resistant to carbonation, compared to
other mixes, both CEM III-B + 50% fly ash and CEM I + 50% fly ash.
The rate of carbonation in both the 45/35/20 limestone and 25/55/20 limestone
ternary mixes appeared to slow after the initial five weeks, but this was not seen in the fly ash
ternary mixes. This supports the findings of Fraay et al (1989) who reported that slag-fly ash
concrete had the poorest performance, which is consistent with the slower hydration and
development of the pore systems. The effects of limestone on carbonation resistance are
contrary to other, earlier reported tests. Where previously it was seen that a 10% addition of

Ternary Combination Concretes Using GGBS, Fly Ash & Limestone: Strength, Permeation & Durability Properties
Chapter 8: Durability
240
limestone was more effective in reducing air permeability or water penetration in Chapter 7,
and an increase to 20% was detrimental, it was evident from Figure 8.1 that 20% limestone,
especially at the 55% GGBS level was of benefit. Despite high initial carbonation during the first
five weeks, the rate slowed significantly from 10 weeks onwards, with a difference of 5-7mm
between the CEM I and ternary mix. This initial increase indicated in the first five weeks may
possibly be due to heterogeneous nucleation with the addition of Ca(CO)3 from the limestone
accelerating the hydration and producing a more disorientated crystallisation of CH affecting
the porosity of concrete, as discussed by Irassar (2009). The amount of CH within the GGBS
cement paste is limited compared to the CEM I as discussed previously. It may also be due to
the dilution effect whereby a volume of 20% inert filler replaced the GGBS content thus
reducing, or delaying, the reaction and hydration of the cement structure further, as there is
less GGBS to consume lime. With regards to these tests specimens further hydration or
reaction is unlikely to have occurred since removal from the curing tank and drying for 2 weeks.
Fig 8.3: Carbonation for PFA ternary mixes at 0.5 water cement ratio

Ternary Combination Concretes Using GGBS, Fly Ash & Limestone: Strength, Permeation & Durability Properties
Chapter 8: Durability
241
8.3 Carbonation in Relation to Tested Concrete Properties
8.3.1 Strength
Strength is considered to be a general indicator of the durability of concretes due to
having similar influencing factors, such as the type of cement and w/c ratio. Shi et al (2009)
state that strength and carbonation are related, together with air permeability and the pore
structure of the concrete matrix (Shi et al, 2009). Given the range of combinations considered it
is appropriate to examine these relationships. Figure 8.4 shows a general relationship between
the depths of carbonation, measured at 5 weeks against compressive strength of concretes at
28 days (the 5 weeks test age is closest to that of the 28 days test of the compressive strength).
Fig 8.4: Level of carbonation (5 weeks) in relation to compressive strength (28 days) at 0.5 w/c ratio.
In general it is seen that carbonation resistance increases with compressive strength. In
addition it is shown in Figure 8.5 how the w/c ratio can also affect the durability of the concrete
in order to achieve an equivalent strength of 40N/mm2. The w/c ratio is altered for each mix
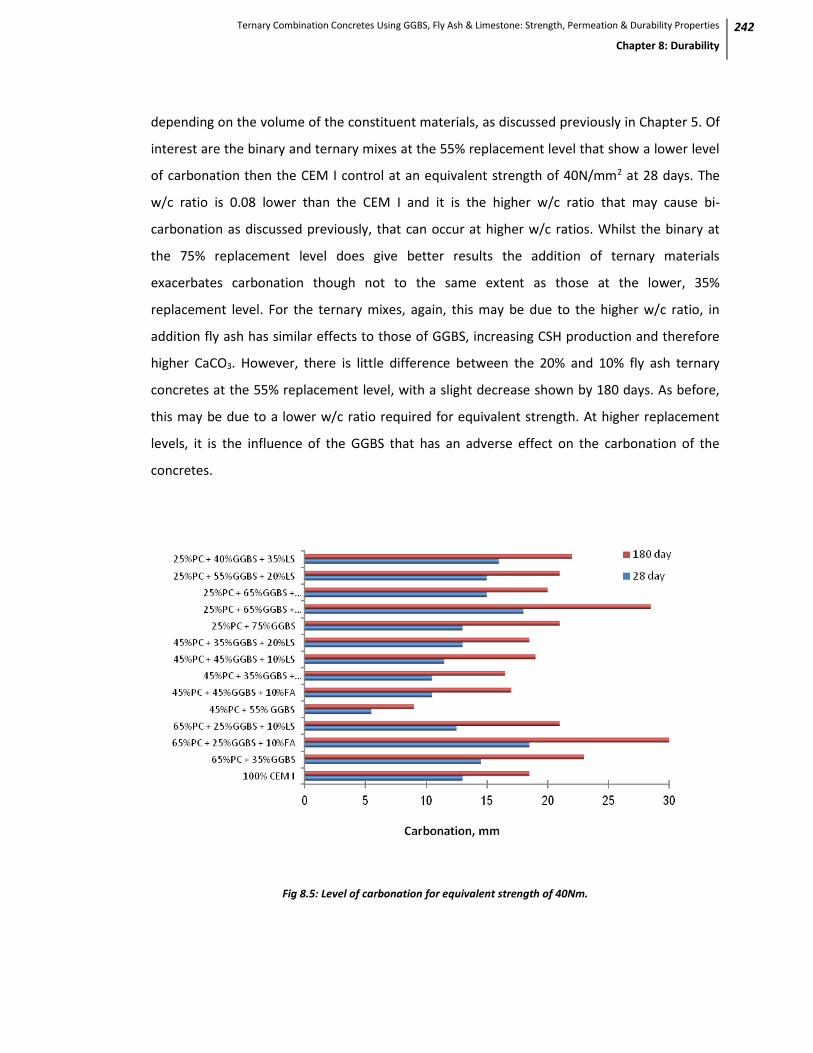
Ternary Combination Concretes Using GGBS, Fly Ash & Limestone: Strength, Permeation & Durability Properties
Chapter 8: Durability
242
depending on the volume of the constituent materials, as discussed previously in Chapter 5. Of
interest are the binary and ternary mixes at the 55% replacement level that show a lower level
of carbonation then the CEM I control at an equivalent strength of 40N/mm2 at 28 days. The
w/c ratio is 0.08 lower than the CEM I and it is the higher w/c ratio that may cause bi-
carbonation as discussed previously, that can occur at higher w/c ratios. Whilst the binary at
the 75% replacement level does give better results the addition of ternary materials
exacerbates carbonation though not to the same extent as those at the lower, 35%
replacement level. For the ternary mixes, again, this may be due to the higher w/c ratio, in
addition fly ash has similar effects to those of GGBS, increasing CSH production and therefore
higher CaCO3. However, there is little difference between the 20% and 10% fly ash ternary
concretes at the 55% replacement level, with a slight decrease shown by 180 days. As before,
this may be due to a lower w/c ratio required for equivalent strength. At higher replacement
levels, it is the influence of the GGBS that has an adverse effect on the carbonation of the
concretes.
Fig 8.5: Level of carbonation for equivalent strength of 40Nm.

Ternary Combination Concretes Using GGBS, Fly Ash & Limestone: Strength, Permeation & Durability Properties
Chapter 8: Durability
243
8.3.2 Porosity
Shi et al (2009) discussed the role of porosity of concrete and its influence on strength. It was
stated that the threshold and mean diameter of the pores, together with their tortuosity is
related to carbonation and air permeability. In this respect, as a rule, both strength and
carbonation are dependent on different pore structure parameters (Shi et al, 2009). With this
in mind, Figure 8.6 shows the depth of carbonation at 5 weeks against the critical pore
diameter for selected cement combinations at 0.35 w/c ratio (Figure 8.6a) 0.5 w/c ratio (Figure
8.6b) at 28 days whilst Figure 8.7 illustrates the total porosity. It is clear that no correlation is
indicated for 0.35 w/c ratio critical pore size and there is no relationship indicated between
porosity and carbonation for the differing materials. Whilst the concretes may have similar
critical pore diameters or total porosity, the level of carbonation can differ. It is clear from this
that it is not only the pore structure that affects the rate of carbonation but the constituent
materials themselves. For the lower w/c ratio, the higher levels of carbonation were obtained
at higher 55% replacement level. For the 0.5 w/c ratio, it is the fly ash ternary blends that give
the greater depth of carbonation, despite having differing critical pore diameter and similar
porosity.
Fig 8.6: Level of carbonation (5 weeks) in relation to critical pore diameter at 28 days for (a) 0.35 w/c
ratio and (b) 0.5 w/c ratio
R2 = 0.275
R2 = 0.509

Ternary Combination Concretes Using GGBS, Fly Ash & Limestone: Strength, Permeation & Durability Properties
Chapter 8: Durability
244
As indicated earlier, both GGBS and fly ash contribute to the increased rate of
carbonation, due to the lower levels of Ca(OH)2 which will completely carbonate (Mehta &
Monteiro, 2006). The high levels of CSH produced by these blends will provide further sites for
carbonation. However, if the depth of carbonation was examined in relation to the voids ratio,
shown in Figure 8.8 a much stronger correlation can be seen but it should be remembered that
the voids ratio is calculated based on the dry mix and does not consider the effects of water
and, hence, hydration.
Fig 8.7: Level of carbonation (5 weeks) in relation to total porosity (%, vol) at 28 days for (a) 0.35 w/c ratio and (b) 0.5 w/c ratio

Ternary Combination Concretes Using GGBS, Fly Ash & Limestone: Strength, Permeation & Durability Properties
Chapter 8: Durability
245
Fig 8.8: Carbonation depth against voids ratio.
8.3.3 Permeation and Absorption
It was noted earlier that there is a relationship between permeability and carbonation
of concrete observed by Shi et al (2009). Given that the rate of carbonation depends on
the permeation of atmospheric CO2 to enter the concrete matrix, this is not unreasonable and
was therefore examined in this current study, as shown in Figure 8.9, where the carbonation
depth at 5 weeks (indicating only the early stage of exposure) is plotted against the intrinsic air
permeability at 28 days for the 0.5 w/c ratio group of mixes. It was clear that a correlation
exists for a given addition, whether binary or ternary, in that an increase in air permeability
increased the depth of carbonation as a general rule. This confirms the relationship between
the two noted by Dhir et al (1989) and later by Ramachandran & Beaudoin (2001). The fly ash
ternary concretes show higher depths of carbonation against air permeability than their
limestone counterparts. Whilst this illustrates further the poor performance of fly ash reported
by Bijen et al (1989), it also indicates that both the depth of carbonation and air permeability
are affected by physical and chemical properties of the cement and additions as is well known
and covered in numerous earlier studies. Figure 8.10 also indicates a correlation with the ISAT
data. From this it may be determined that the transport mechanisms differ the effects of the
materials and their hydration products are similar in both cases, as previously discussed.

Ternary Combination Concretes Using GGBS, Fly Ash & Limestone: Strength, Permeation & Durability Properties
Chapter 8: Durability
246
Fig 8.9: Depth of carbonation (5 weeks) against intrinsic air permeability (28 days)
Fig 8.10: Depth of carbonation (5weeks) against ISAT at 28 day
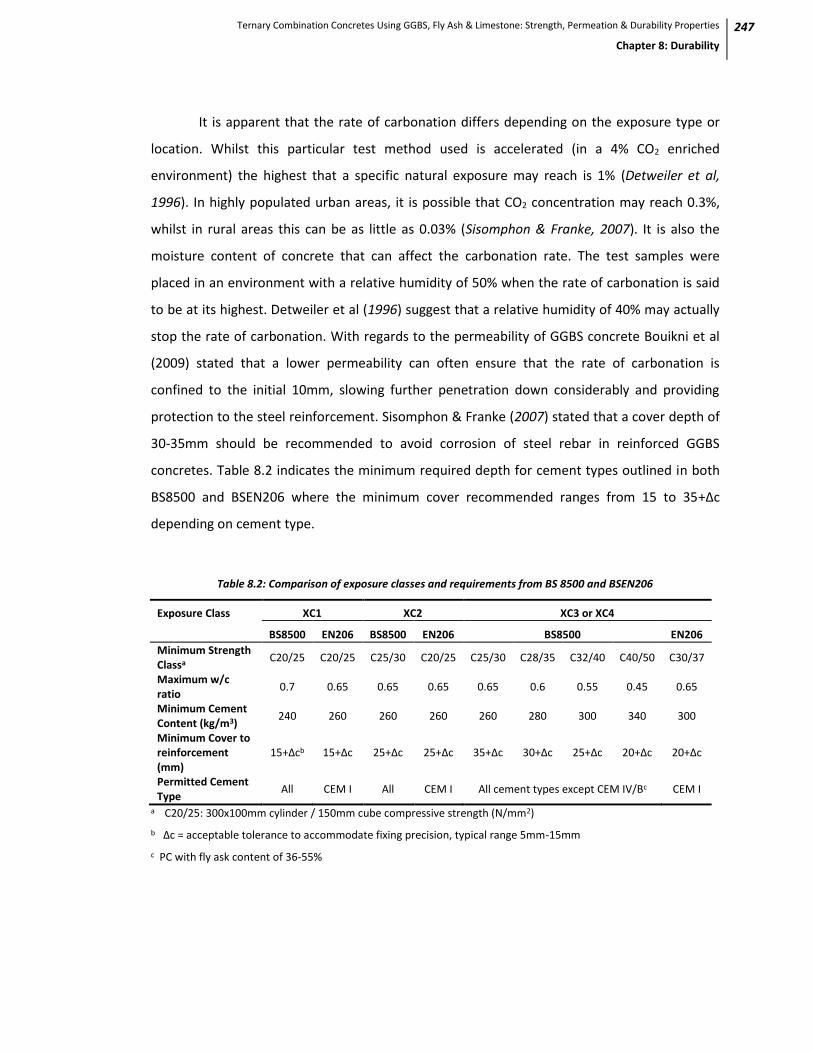
Ternary Combination Concretes Using GGBS, Fly Ash & Limestone: Strength, Permeation & Durability Properties
Chapter 8: Durability
247
It is apparent that the rate of carbonation differs depending on the exposure type or
location. Whilst this particular test method used is accelerated (in a 4% CO2 enriched
environment) the highest that a specific natural exposure may reach is 1% (Detweiler et al,
1996). In highly populated urban areas, it is possible that CO2 concentration may reach 0.3%,
whilst in rural areas this can be as little as 0.03% (Sisomphon & Franke, 2007). It is also the
moisture content of concrete that can affect the carbonation rate. The test samples were
placed in an environment with a relative humidity of 50% when the rate of carbonation is said
to be at its highest. Detweiler et al (1996) suggest that a relative humidity of 40% may actually
stop the rate of carbonation. With regards to the permeability of GGBS concrete Bouikni et al
(2009) stated that a lower permeability can often ensure that the rate of carbonation is
confined to the initial 10mm, slowing further penetration down considerably and providing
protection to the steel reinforcement. Sisomphon & Franke (2007) stated that a cover depth of
30-35mm should be recommended to avoid corrosion of steel rebar in reinforced GGBS
concretes. Table 8.2 indicates the minimum required depth for cement types outlined in both
BS8500 and BSEN206 where the minimum cover recommended ranges from 15 to 35+∆c
depending on cement type.
Table 8.2: Comparison of exposure classes and requirements from BS 8500 and BSEN206
Exposure Class XC1 XC2 XC3 or XC4
BS8500 EN206 BS8500 EN206 BS8500 EN206
Minimum Strength Classa
C20/25 C20/25 C25/30 C20/25 C25/30 C28/35 C32/40 C40/50 C30/37
Maximum w/c ratio
0.7 0.65 0.65 0.65 0.65 0.6 0.55 0.45 0.65
Minimum Cement Content (kg/m3)
240 260 260 260 260 280 300 340 300
Minimum Cover to reinforcement (mm)
15+∆cb 15+∆c 25+∆c 25+∆c 35+∆c 30+∆c 25+∆c 20+∆c 20+∆c
Permitted Cement Type
All CEM I All CEM I All cement types except CEM IV/Bc CEM I
a C20/25: 300x100mm cylinder / 150mm cube compressive strength (N/mm2)
b ∆c = acceptable tolerance to accommodate fixing precision, typical range 5mm-15mm
c PC with fly ask content of 36-55%

Ternary Combination Concretes Using GGBS, Fly Ash & Limestone: Strength, Permeation & Durability Properties
Chapter 8: Durability
248
8.4 Chloride Ingress
Chloride attack can be caused by de-icing salts or sea water. With regards to the latter,
it is important to note that this may not be due to direct contact with sea water but the result
of airborne droplets that can travel up to 2 miles given the right environmental conditions. De-
icing salts, though necessary, can cause more physical damage, by the way of salt scaling, than
chemical, as they are used to treat horizontal surfaces that are prone to freeze-thaw and can
be more damaging due to the types of salts commonly used (NaCl2 and CaCl2) (Neville, 1995).
These effects are not considered here but illustrate additional influences of chloride on
durability. As with carbonation, chloride ingress does not directly affect concrete, but the steel
reinforcement of the structure will corrode should the concrete cover become permeable and
chloride build up in sufficient quantities at this locations. Transportation of chloride ions occurs
through pore solutions of the concrete by a number of mechanisms. Diffusion is the result of a
concentration gradient and can be described by the diffusion coefficient. Migration in an
electric field and water flow will be determined by the ionic mobility. In addition, pressure
gradients may cause water flow and in partially dry concrete, absorption is likely to occur, as
well as wick action. Despite the multi-mechanism phenomena, each process will be affected by
the pore structure and the interaction between ions in the pore solution and the pore walls,
namely chloride binding and membrane effects which will be discussed in more detail later in
this chapter. Additionally pore blocking can occur when entrapped or entrained air voids can
block the pore solution transportation of ions, yet promote gaseous transportation. One of the
benefits of GGBS as a material in cement is its ability to refine the pore structure hopefully
mitigating this effect.
Omar (1993) reported that GGBS and fly ash can reduce the penetration of concrete by
chloride. In order to investigate this further and in relation to this study, chloride tests were
carried out on selected mixes. CEM I control and binary mixes were tested at all water cement
ratios, together with the 10% limestone ternary at the 55% addition level. At the 35% and 75%
GGBS levels, 10% limestone ternary concretes were tested at 0.5 w/c ratio. All tests were
carried out at 28, 90 and 180 days. Two different test methods were used, both outlined in
Chapter 3. The RCPT is becoming more commonly used but comes under criticism, with regards
to the effects of the differing pore solution chemistry and the high voltage (this will be

Ternary Combination Concretes Using GGBS, Fly Ash & Limestone: Strength, Permeation & Durability Properties
Chapter 8: Durability
249
discussed further later in this chapter). The current passed is related to all, not just chloride,
ions in the pore solution and the high voltage applied leads to an increase in temperature
especially in low quality concretes. This can, in turn, lead to a further increase in the charges
passed. With these criticisms in mind the NordTest (NTBuild 492) was used to support the
findings of the ASTM test in this study. The test specimens for both tests are the same size but
the preconditioning for the NordTest differs in that following the initial 3 hours vacuuming at a
pressure of 10-50 mbar, the dessicator basin is filled with saturated calcium hydroxide de-
ionised solution and the vacuum maintained for another hour. The RCPT test required de-
ionised/distilled water to completely cover the specimens. Following the preconditioning
different concentrations of NaCl were required for each test, 3% by mass for the RCPT and 10%
for the NordTest, which measures the chloride penetration depth and a non-steady state
migration coefficient, whilst the RCPT data presented the chloride permeability based on
charges passed. ASTM C1202 provides a classification scheme for interpretation of the data as
given in Table 8.2.
Table 8.3: Chloride permeability based on charge passed (ASTM C1202)
Charge Passed
(Coulombs)
Chloride Permeability Typical of
>4000 High High w/c ratio (>0.6) conventional PCC
2000-4000 Moderate Moderate e/c ratio (0.4-0.5) conventional
PCC
1000-2000 Low Low w/c ratio (<0.4) conventional PCC
100-1000 Very Low Latex-modified concrete or internally-
sealed concrete
<100 Negligible Polymer-impregnated concrete,
Polymer concrete
8.4.1 Rapid Chloride Permeability Tests (ASTMC1202)
As shown in Figure 8.11 at all w/c ratios and ages the binary mixes gave lower values
than the CEM I control. Whilst by 180 days the binary mixes indicate low chloride permeability
at 0.35 and 0.5 w/c ratio, the CEM I control shows moderate chloride permeability as per the
ASTM guidance for these w/c ratios. The increase to 0.65 water cement ratio also gave

Ternary Combination Concretes Using GGBS, Fly Ash & Limestone: Strength, Permeation & Durability Properties
Chapter 8: Durability
250
expected results for the CEM I control mix. The lower level of GGBS replacement (35%) was a
little higher than the other binary mixes, indicating moderate chloride permeability, whilst the
other, higher, GGBS level concretes still indicate low chloride permeability’ even at this high
water/cement ratio.
Fig 8.11: Rapid Chloride Permeability Test (RCPT) results for binary mixes for all water cement ratios
High
Moderate
Very Low
Low
High
Moderate
Very Low
Low
High
Moderate
Very Low
Low

Ternary Combination Concretes Using GGBS, Fly Ash & Limestone: Strength, Permeation & Durability Properties
Chapter 8: Durability
251
Figure 8.12 summarises the data for all binary and limestone ternary concretes at 0.5
w/c ratio that were tested. From the test results it is clear that the CEM I control mix gave high
chloride permeability at 28 days and moderate at 180 days. The binary and ternary mixes
tested indicate moderate chloride permeability at 28 days and low by 180 days across all w/c
ratios tested.
Fig 8.12: Rapid Chloride Permeability Test (RCPT) results for 55% replacement level for all water cement ratios
High
Moderate
Very Low
Low
High
Moderate
Very Low
Low
High
Moderate
Very Low
Low

Ternary Combination Concretes Using GGBS, Fly Ash & Limestone: Strength, Permeation & Durability Properties
Chapter 8: Durability
252
Fig 8.13: Rapid Chloride Permeability Test (RCPT) results at 0.5 water cement ratio
It was suggested earlier that whilst the RCPT test is being more widely used, it has been
criticised for example, by both Hale et al (2002) and Gowripalan & Mohammed (1998). Hale et
al (2002) stress that caution be used when testing concretes with additions. It is suggested that
differing factors can affect the parameters of the test results giving misleading data for three
main reasons. Firstly, Sharfuddin Ahmed et al (2008) imply that it is an index test in which no
steady-state conditions exist and the measurements are taken before this is reached. Secondly
the difference in pore solution chemistry of ternary blended concretes may not allow for a true
representation of chloride permeation, the current passed is related to all ions within the pore
solutions and not just chlorides. Finally, the high voltage used in the test can lead to a
temperature rise, increasing the charge passed. In spite of these, however, and mainly due to
its convenience and duration the RCPT, as stated earlier, is becoming commonly used. Hale et
al (2002) used the RCPT and tested a number of blended cements including fly ash and GGBS
ternary mixes when showed little effect on the chloride ion penetrability at 28 days and 15-20%
reductions compared to other mixes at 90 days.
High
Moderate
Very Low
Low

Ternary Combination Concretes Using GGBS, Fly Ash & Limestone: Strength, Permeation & Durability Properties
Chapter 8: Durability
253
8.4.2 Non-steady State Chloride Migration (NT Build 492)
The NordTest method produced similar trends in the data to the RCPT tests, but in
different terms. Instead of coulombs, the data is expressed as a non-steady-state migration
coefficient (Dnssm, m2/s). Figure 8.14 shows that the CEM I concrete again gave higher results,
increasing with w/c ratio and the binary concretes were similarly grouped, with the coefficient
reducing as the level of GGBS increased and w/c ratio reduced. The inclusion of 10% limestone
at the 55% GGBS level is shown in Figure 8.15 and indicates a more noticeable decrease in
comparison with the RCPT tests (Figure 8.12). The rate of decline with age was greater for the
CEM I control mixes in both sets of tests, but still remained higher than the binary and ternary
concretes. The test carried out at 0.5 water/cement ratio, summarised in Figure 8.16, again
shows similar results to the RCPT test. The 10% limestone ternary concrete at the 55% level
gave the lowest coefficient for the NordTest at 180 days, compared to the RCPT tests which
indicate that the binary mix at this level was only marginally lower, but the 75% GGBS level
binary concrete gave the lowest results for the RCPT, as indicated earlier in Figure 8.13.
It was evident from the data that an increase in addition level had a positive effect in
reducing chloride ingress. It therefore appears that CEM I is the component within the concrete
that has the most negative effect on the durability in this instance. The addition of GGBS to the
CEM I had a combined effect, not only in creating a denser microstructure but reducing the
level of calcium hydroxide (Hooton & Titherington, 2004). A positive dilution effect was seen
throughout the tests. As the volume of addition increased, the resistance to chloride ingress
improved. As with all previously reported tests, the w/c ratio had a noticeable effect on
chloride ingress, though for the combination mixes it remained moderate or low. Interestingly,
the limestone additions had the result of reducing chloride ingress at the earlier test age. This
corroborates Hornain et al’s (1995) findings which attribute this to the filler effect on the
tortuosity of concrete. 10% limestone appeared to be the optimum level as an increase to 20%
showed a rise in chloride penetration, although it still remained lower than the CEM I control
mix. These findings are in line with those of Ghrici et al (2007) whose study found that an
increase in limestone to 15% increased chloride penetration, agreeing with Bonavetti et al’s
earlier study in 2000.

Ternary Combination Concretes Using GGBS, Fly Ash & Limestone: Strength, Permeation & Durability Properties
Chapter 8: Durability
254
Fig 8.14: Non-steady state chloride migration, (NT BUILD-492) results for mixes for all w/c ratios

Ternary Combination Concretes Using GGBS, Fly Ash & Limestone: Strength, Permeation & Durability Properties
Chapter 8: Durability
255
Fig 8.15: Non-steady state chloride migration, (NT BUILD-492) results 55% replacement level

Ternary Combination Concretes Using GGBS, Fly Ash & Limestone: Strength, Permeation & Durability Properties
Chapter 8: Durability
256
Fig 8.16: Non-steady state chloride migration, (NT BUILD-492) results at 0.5 water cement ratio
Table 8.4: Summary of Chloride Ingress Results
Concrete Type W/C Ratio
NON-STEADY STATERAPID CHLORIDE MIGRATION,
NT BUILD-492 RAPID CHLORIDE
PERMEABILITY, ASTM
CHARGE PASSED, COLOUMBS Dnssm, x10-12m2/s
28 90 180 28 90 180
CEM I 100% 0.35 23.95 21.04 15.70 4181 3574 2935
CEM I 100% 0.50 34.12 29.52 23.86 5195 4635 3655
CEM I 100% 0.65 50.07 43.97 37.90 6905 6335 5200
CEM I 65% + GGBS35% 0.35 12.95 11.91 11.12 1800 1185 945
CEM I 65% + GGBS35% 0.50 15.80 14.22 13.23 2465 1775 1500
CEM I 65% + GGBS35% 0.65 21.65 19.00 17.45 3445 2825 2465
CEM I 65% + GGBS25% + LS10% 0.50 8.41 14.29 4.33 2085 1690 1435
CEM I 45% + GGBS55% 0.35 11.60 10.41 9.55 1425 800 525
CEM I 45% + GGBS55% 0.50 14.20 12.68 11.62 2045 1322 1030
CEM I 45% + GGBS55% 0.65 19.10 17.03 15.15 3005 2100 1720
CEM I 45% + GGBS45% + LS10% 0.35 3.81 2.59 1.65 1275 885 680
CEM I 45% + GGBS45% + LS10% 0.50 6.56 4.47 2.99 1878 1474 1205
CEM I 45% + GGBS45% + LS10% 0.65 12.76 9.05 6.99 2685 2015 1655
CEM I 25% + GGBS75% 0.35 10.21 9.22 8.60 1130 650 425
CEM I 25% + GGBS75% 0.50 12.21 10.81 10.02 1665 1140 850
CEM I 25% + GGBS75% 0.65 16.00 14.08 12.96 2555 1870 1550
CEM I 25% + GGBS65% + LS10% 0.50 5.65 3.62 2.32 1605 1195 935
CEM I 25% + GGBS55% + LS20% 0.50 9.65 8.11 7.03 2080 1640 1345

Ternary Combination Concretes Using GGBS, Fly Ash & Limestone: Strength, Permeation & Durability Properties
Chapter 8: Durability
257
8.5 Correlation Between Chloride Tests and other Concrete Properties
8.5.1 RCPT and NordTest
As with previous test data correlation between tests was determined by using
statistical techniques to indicate if selected pairs of data, or variables, relate to each other. An
R2 value is obtained ranging from +1 to -1, showing a positive or negative relationship
respectively. A correlation coefficient of >0.80 shows the existence of a relationship between
two variables in different units (Salkind, 2000).
Both tests were compared against each other and are shown in Figure 8.17. It can be
seen that at the lower test ages there was a strong correlation between both sets of test data
across all 3 w/c ratios. By 180 days, however, the strongest correlation was seen between the
higher 0.65 w/c ratio. At this age, the concrete has matured and little further hydration takes
place within the concrete structure.
Fig 8.17: Correlation between RCPT and NordTest

Ternary Combination Concretes Using GGBS, Fly Ash & Limestone: Strength, Permeation & Durability Properties
Chapter 8: Durability
258
8.5.2 Chloride Ingress and Porosity
As with previous data analysis the chloride results were examined in relation to
porosity and critical pore size. Figures 8.18 to 8.21 illustrate the generally low correlation that
exists between these properties. A better correlation is seen in Figure 8.18 between the critical
pore size and the NordTest for the 0.35 w/c ratio at 180 days. The pore correlation seen
between these properties are indicative of the complicated and multi-mechanism phenomenon
of the transport of chloride ions into concrete.
Fig 8.18: Critical pore size against NordTest
Fig 8.19: Critical pore size against RCPT
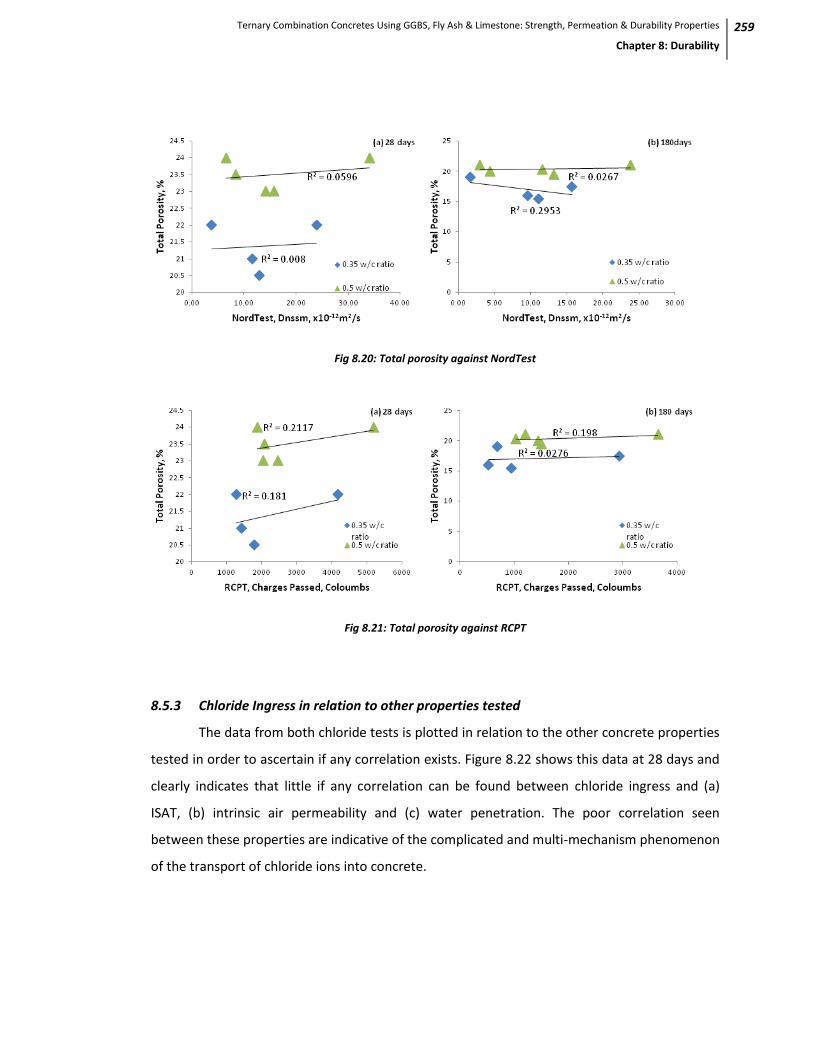
Ternary Combination Concretes Using GGBS, Fly Ash & Limestone: Strength, Permeation & Durability Properties
Chapter 8: Durability
259
Fig 8.20: Total porosity against NordTest
Fig 8.21: Total porosity against RCPT
8.5.3 Chloride Ingress in relation to other properties tested
The data from both chloride tests is plotted in relation to the other concrete properties
tested in order to ascertain if any correlation exists. Figure 8.22 shows this data at 28 days and
clearly indicates that little if any correlation can be found between chloride ingress and (a)
ISAT, (b) intrinsic air permeability and (c) water penetration. The poor correlation seen
between these properties are indicative of the complicated and multi-mechanism phenomenon
of the transport of chloride ions into concrete.

Ternary Combination Concretes Using GGBS, Fly Ash & Limestone: Strength, Permeation & Durability Properties
Chapter 8: Durability
260
Fig 8.22: Correlation between Chloride ingress tests and other tested concrete properties (a) ISAT; (b) Intrinsic air permeability; (c) Water penetration
(a)
(b)
(c)

Ternary Combination Concretes Using GGBS, Fly Ash & Limestone: Strength, Permeation & Durability Properties
Chapter 8: Durability
261
8.6 Chloride Binding
It was alluded to earlier that regardless of the transportation process of chloride, it will
be affected by the pore structure and interaction of ions within the pore solution with the pore
walls by way of chloride binding and membrane effects. The latter involves the production of
ion exchange membranes by the surface charge on the pore walls that is balanced by equal and
opposite charges in the pore solution. Whilst both chloride tests discussed, measured the
transportation of chloride due to the conductivity of concrete, they neglect the chloride
interaction with the solid phase. Papadakis & Tsimas (2002) state that this is an important
process, specifically chloride binding during the reaction process, as it is key to the resistance of
chlorides. This was later confirmed by Glass et al (2008) who stated that chloride binding
capacity is a function of the relationship existing between the total, free and bound chloride in
concrete.
The chloride binding within concrete is dominated by the reaction of C3A to produce
calcium chloroaluminate, generally referred to as Freidel’s salt (3CaO-Al2O3-CaCl2-10H2O). The
Freidel’s salt plays a key role in ‘locking up’ chloride ions within the concrete structure. In this
sense, it may be considered that a high C3A content will therefore affect the chloride binding in
a positive manner.
[Eq 8.5]
However, other reactions need to be taken into consideration. In addition to being
chemically bound, chloride ions can also be physically absorbed by C-S-H gel. Given that GGBS
produces more C-S-H gel during hydration than CEM I, this is likely to contribute to reduction of
chloride ingress. It is therefore evident that both GGBS and fly ash can affect the rate of binding
of chlorides (Glass & Buenfeld, 2000). There is also the possibility that capillary pores formed
during early hydration can be blocked by further hydration products during the curing of the
concrete if there are sufficient hydration products produced as the concrete matures. Pore
blocking is likely given the increased production of CSH by the binary and ternary contents and
the wet conditions of the test.

Ternary Combination Concretes Using GGBS, Fly Ash & Limestone: Strength, Permeation & Durability Properties
Chapter 8: Durability
262
The composition of cement, as already alluded to, is the most influential factor
affecting chloride binding. Whilst the C3A affects the amount of AFm phase, alumina ferric
oxide, monosulfate phase that forms inter alia, when tricalcium aluminate reacts with dissolved
calcium sulfate. In addition to the C3A, C3S and C2S can be correlated with the amount of CSH
formed upon hydration. The presence of alumina (Al2O3) is also a precursor to increasing
chloride binding capacities and with GGBS having almost three times Al2O3 than CEM I (as
shown in Table 3.1, Chapter 3) the increase in chloride binding is predictable. The fly ash also
has an increased Al2O3 content; its effects may be less noticeable given its lower volume by
mass in the mix combination.
Although CEM I had a higher content of both C3A and C4AF, suggesting that it would
result in better chloride binding, the hydration process of CEM I also releases alkalis into the
pore solution that can have the effect of reducing internal chloride binding and increases the
alkalinity of the sulfates (Luo et al, 2003). In contrast, GGBS and fly ash will, due to their low
alkali content, incorporate more alkalis into the reaction process than will be released into the
pore solution (Duchesne & Berube, 1994). In addition, the higher sulfate content of CEM I will
also reduce chloride binding as there is a preferential reaction between C3A and sulfates. Due
to the lower sulfate content of GGBS, the C3A that is available is free to bind with chloride to
produce more Freidel’s salt (Luo et al, 2003).
With regard to the aggregate content of concrete, there is normally very little effect on
the ingress of chloride or chloride binding within the concrete structure. Though Hobbs (1999)
states that a more permeable aggregate will affect this, in this case the aggregates used in this
study were of low absorption and hence not an issue here, nor were the limestone aggregates
that may have resulted in the release of additional chloride ions into the pore solution
(Grattan-Bellew, 1996). With this in mind it is therefore likely that the limestone addition to the
cement matrix may result in the increasing chloride ions. This is discussed by Ghrici et al (2007)
who found that over time limestone concretes will have lower resistivity to chloride ingress
than GGBS or fly ash concretes, but still lower than CEM I concrete. The RCPT indicates a slight
increase in the longer-term results for the limestone ternary concretes, but the increase was
minor. Andrade (1993) suggest this increase is due to the higher level of OH- ions in the pore

Ternary Combination Concretes Using GGBS, Fly Ash & Limestone: Strength, Permeation & Durability Properties
Chapter 8: Durability
263
solution, acting as a supporting electrolyte. Bonavetti et al (2000) also found similar results
when testing limestone binary mixes, so it would appear that as a ternary addition this effect is
minimised by the reaction of GGBS.
8.5 Summary
With the design service life of the majority of concrete structures exceeding 30 years
and given the range of exposure conditions, it is obviously important for concretes to have
adequate structural properties and to be durable. Concretes need to be able to withstand
corrosion and chemical attack and it became evident from the data that cement additions have
a significant effect on the overall durability of concrete.
Depth of carbonation increased with GGBS level and also w/c ratio. Although it also
increased with time, the lower level binary concretes were comparable with the CEM I
concretes at 20 weeks and for all w/c ratios. The increased depth of carbonation was due to the
limited content of calcium hydroxide (CH) resulting in the CO2 not becoming fixed near the
surface of the concrete.
The addition of fly ash did not improve the depth of carbonation, rather it increased it
further with increasing levels of addition, from 10% to 20%, and w/c ratio across the range of
GGBS levels. This was due to the competition created between GGBS and fly ash and also the
limited volume of Ca(OH)2. The limestone concretes also increased the depth of carbonation
over the range of mixes, predominantly due to the diluting effect.
Correlation between carbonation and compressive strength was found with a higher
depth of penetration noted at lower strength. Similarly it was seen that with higher air
permeability increased carbonation occurred and this could be related to critical pore
diameter.
In spite of the poor carbonation results, the chloride tests produced much more
favourable data showing that the inclusion of binary and ternary additions significantly

Ternary Combination Concretes Using GGBS, Fly Ash & Limestone: Strength, Permeation & Durability Properties
Chapter 8: Durability
264
improved the resistance to chloride ingress due to their ability to increase chloride binding and
in turn the production of Freidel’s salts. The was as a result of their overall lower sulfate
content and the fact that as a result of hydration GGBS concretes can produce more C-S-H than
CEM I.

Ternary Combination Concretes Using GGBS, Fly Ash & Limestone: Strength, Permeation & Durability Properties
Chapter 9: Environmental & Economic Implications
265
CHAPTER NINE: ENVIRONMENTAL & ECONOMIC
IMPLICATIONS OF ADOPTING TERNARY CONCRETES IN
CONSTRUCTION PRACTICE
9.1 Introduction
Thus far the tests carried out on the properties of the concrete combinations have
been discussed purely in isolation from an environmental and economic perspective. Whilst
each test is fundamental in discovering the strength and durability of blended cements it would
be prudent to review the data from all tests carried out in a laboratory setting and to try and
understand their value in an industrial context and the implications of using such concretes in
modern society which involves the economics of an ever increasing industry that more recently
has had to review their own impact of the global environment.
It goes without saying that historically cement, or concrete, has played a significant role
in the construction industry for many millennia. Ancient Egyptians, Romans and Greeks have
built fantastic structures, some that remain to this day as a testament not only to these
civilisations’ architectural prowess but to the strength and durability of the material itself.
However, modern society brings contemporary pressures on the concrete industry in a growing
global market. The call for the use of more environmentally, or sustainable, materials is
increasing as external pressure is placed on a global industry and whilst European standards
such as BS EN 197 permits the use of constituent materials, it is limiting their properties and
amounts. The use of additions is also covered in BS EN 206 and BS 8500 but a lack of
understanding is limiting and needs to be addressed before further headway is made into the
greater use of materials such as GGBS and fly ash as no trade off can be afforded between the
strength and durability of concrete and the environment.
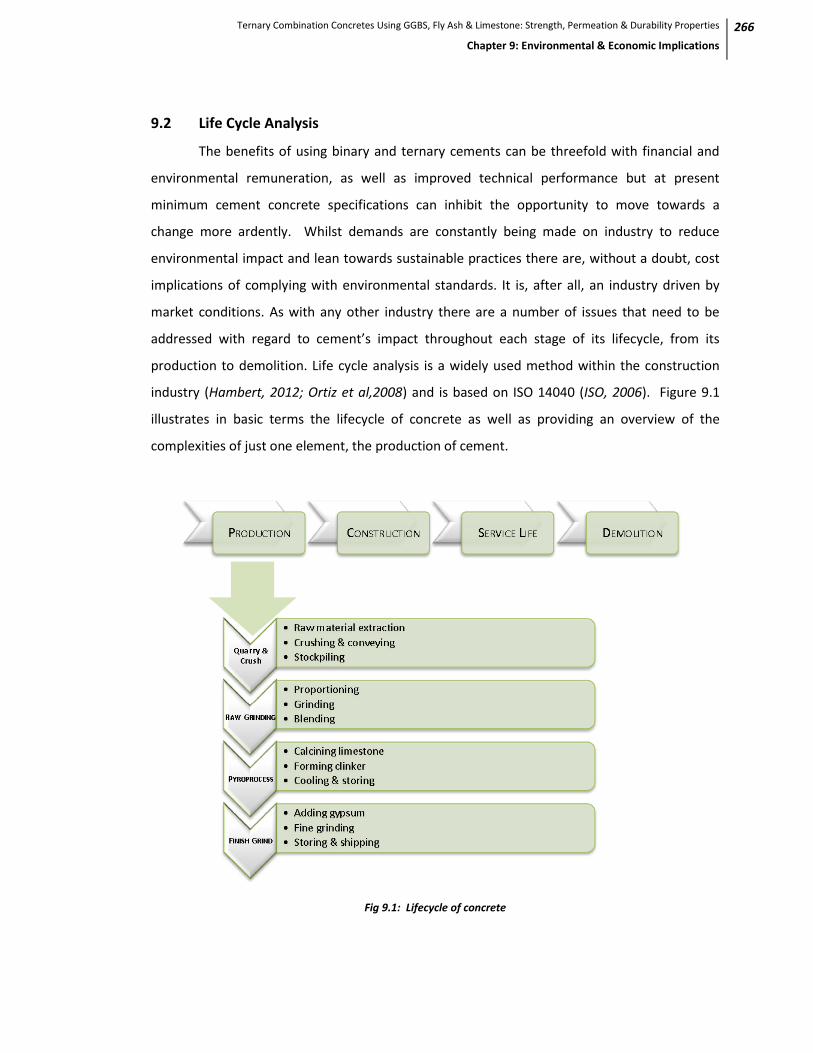
Ternary Combination Concretes Using GGBS, Fly Ash & Limestone: Strength, Permeation & Durability Properties
Chapter 9: Environmental & Economic Implications
266
9.2 Life Cycle Analysis
The benefits of using binary and ternary cements can be threefold with financial and
environmental remuneration, as well as improved technical performance but at present
minimum cement concrete specifications can inhibit the opportunity to move towards a
change more ardently. Whilst demands are constantly being made on industry to reduce
environmental impact and lean towards sustainable practices there are, without a doubt, cost
implications of complying with environmental standards. It is, after all, an industry driven by
market conditions. As with any other industry there are a number of issues that need to be
addressed with regard to cement’s impact throughout each stage of its lifecycle, from its
production to demolition. Life cycle analysis is a widely used method within the construction
industry (Hambert, 2012; Ortiz et al,2008) and is based on ISO 14040 (ISO, 2006). Figure 9.1
illustrates in basic terms the lifecycle of concrete as well as providing an overview of the
complexities of just one element, the production of cement.
Fig 9.1: Lifecycle of concrete

Ternary Combination Concretes Using GGBS, Fly Ash & Limestone: Strength, Permeation & Durability Properties
Chapter 9: Environmental & Economic Implications
267
Vast quantities of materials and energy are required throughout the production,
construction and service life of a building that will be affected by, not only its design but by the
selection of materials that can have beneficial thermal properties to aid reductions in energy
use. Significantly, yet often disregarded, are the cultural and market forces that can affect the
service life of a building that may have to be adaptable and change function several times
throughout its life, requiring renovation and repair, though the later can be abated to some
extent by the use of durable materials. It is evident from Figure 9.1 that there are a number of
influential factors and to examine the complete lifecycle, inputs and outputs from each
element in detail, would be exhaustive and can lead to further complications when considering
the use of additions such as GGBS and fly ash. In order to undertake an accurate analysis it may
be argued that these additions need to be incorporated into a complete system boundary as
illustrated in Figure 9.2, (taken from Hambert, 2012) given that their own production results in
CO2 emissions. This may be disputed if they were to be considered as a waste product but
under EU directives they are to be regarded as by-products due to meeting the following
criteria (EU, 2008):
1. further use of them is certain;
2. they are produced as an integral part of a production process;
3. they can be used directly without any further processing other than normal
industrial practice;
4. further use is lawful.
Previously, no environmental burdens, other than disposal, were placed on waste as it
is unintentionally produced. However, with GGBS and fly ash, meeting these four criteria their
impact now needs to be given more consideration in terms of the allocation of environmental
burdens and the partitioning between both the main product and the by-product (Chen et al,
2010). This can be done by one of two ways; mass ratio allocation and economic ratio
allocation, both can lead to less favourable outcomes and greater environmental impacts when
GGBS is compared to CEM I. Figure 9.3 (from Chen et al, 2010) illustrates this point when a
mass of GGBS (1.11kg) equivalent to the replacement of 1kg of CEM I is compared. The same is
shown for fly ash in Figure 9.4.

Ternary Combination Concretes Using GGBS, Fly Ash & Limestone: Strength, Permeation & Durability Properties
Chapter 9: Environmental & Economic Implications
268
Fig: 9.2: System boundaries of cement production
Fig 9.3: Environmental impact of GGBS

Ternary Combination Concretes Using GGBS, Fly Ash & Limestone: Strength, Permeation & Durability Properties
Chapter 9: Environmental & Economic Implications
269
Fig 9.4: Environmental impact of fly ash
It is evident that there are a number of elements to the production of GGBS that would
also need to be considered when examining the life cycle assessment of cement if a holistic and
all-encompassing approach was to be taken. There still remains some contention as to which
method of allocation is more indicative of the environmental impact of GGBS, and indeed fly
ash, as an addition to cement. Mass ratio allocation clearly results in a negative outcome, on
face value, for both GGBS and fly ash and whilst economic ratio allocation is shown more
favourably, given its advantage in lowering the environmental impact, it is unclear as to
whether the environmental burden has proportioned fairly. Essentially GGBS and fly ash are by-
products of primary industries, as defined by the 2008 Directive, but if they had no positive
value to the cement industry, in that they can potentially enhance the strength and durability
properties of concrete, they would be waste and should, therefore, not be given the same
allocation as the main products. This issue is discussed by Chen et al (2010) who also stated
that economic ratio allocation can fluctuate due to market prices.
Given the uncertainty of both mass ratio and economic ratio allocation a third option
can be considered; that of non-allocation. GGBS and fly ash are regarded as waste and as such
no allocation of environmental burden is proportioned, this method has been adopted by both

Ternary Combination Concretes Using GGBS, Fly Ash & Limestone: Strength, Permeation & Durability Properties
Chapter 9: Environmental & Economic Implications
270
Flower & Sanjayan (2007) and Xing et al (2008). Undeniably this area would benefit from a
separate and extensive study. However, this chapter will focus simply on the embodied ECO2 of
the blended concretes and relate it to the concrete properties tested and attempt to show
possible material cost implications to illustrate the potential for blended concretes industry
wide. Given the current economic climate costs can be influential and a deciding component in
choosing the materials used. Cheaper poorer quality cement may be selected over more
durable if standards were not in place in Europe but the use of additions such as GGBS or fly
ash may be able to bring costs down in both an economic and environmental sense.
9.3 Environmental Impact
As discussed previously and in Chapter 2, there are a number of issues facing the
concrete industry that need to be addressed concerning its environmental impact. With 5% of
global anthropogenic CO2 emissions being caused by the production of cement (Hendricks,
2005) it is not just resource management by way of raw materials and energy that needs to be
considered by industry. The production of cement is in itself, an energy intensive process with
2% of global primary energy consumption used (WEC, 1995), with 1.75± 0.1 MJ needed for each
kg of clinker produced (Taylor, 1992) and can range in ratio with cement depending on the
quality, from 0.5 to 0.95 depending on the type of cement used, the latter for Portland cement.
The CO2 emissions emanate from both the combustion and calcinations process with
0.5 tonne of CO2 emitted for every tonne of CaO produced as part of the following chemical
reaction:
23 COCaOCaCO
[Eq 9.1]
As discussed in Chapter 2, this decomposition of limestone is an essential part of
cement production and occurs within the kiln which, also consumes high levels of energy
creating further CO2 emissions. However, as suggested by Damenili et al (2010) there are
consolidated strategies to reduce CO2 emissions supporting Hendricks earlier views (2005).
Essentially increasing the energy efficiency of kilns or the use of alternative fuels involves

Ternary Combination Concretes Using GGBS, Fly Ash & Limestone: Strength, Permeation & Durability Properties
Chapter 9: Environmental & Economic Implications
271
extensive capital outlay for producers. The substitution of clinker by mineral additions such as
GGBS, to improve the efficiency of cement use and thus formulate more eco efficient based
products is by far a more economically attractive option. The use of blended cements depends
very much on current application levels, availability, standards and legislation in terms of
affecting market conditions. Standards already restrict the quantity of additions used in
blended cements, depending on a number of factors such as strength requirements and
exposure conditions as discussed in Chapter 2 and indicated in Table 2.6, extracted from BS EN
197-1.
9.3.1 Embodied CO2 (ECO2)
The use of binary concretes is increasing with a number of global case studies as
discussed in Chapter 1, such as the QE2 Bridge, Dartford and the Meridian Energy Building,
Wellington New Zealand. The availability of materials such as GGBS is limited and continues to
be stretched due to less manufacturing of pig iron, again another result of recession (Higgins,
2011). Fly ash is in good supply, but it is not limitless and some move towards the use of other,
ternary additions, needs to be encouraged to not only mitigate the shortfalls of GGBS and fly
ash (for example resistance to carbonation) but to reduce the strain on supplies. In order for
application levels to change standards and legislation need to evolve to permit greater use of
these ternary materials but this cannot occur without the continued studies into the effects
they have on the strength and durability of concrete. The tests carried out and discussed
previously will be shown in relation to their calculated ECO2 in light of the growing pressures on
the concrete industry to be more sustainable.
In order to calculate more accurately the ECO2 of the mix combinations other
components must be considered. Typical proportions of the components of concrete are
shown in Table 9.1. The ECO2 of cement has already been discussed and given the amount
required to produce 1 tonne of concrete the ECO2 is high when compared to that of the sand
and aggregates. The production process of sand and fine aggregates involves hauling, washing
and grading requiring equal amounts of diesel and electricity. Flower & Sanjayan (2007) report
on audit findings for one quarry in Australia where the ECO2 is said to be in the region of 0.0139
t CO2 –e/tonne and includes the subsequent transportation of the sand to the mixing site. The

Ternary Combination Concretes Using GGBS, Fly Ash & Limestone: Strength, Permeation & Durability Properties
Chapter 9: Environmental & Economic Implications
272
production process of coarse or crushed aggregate is generally 30-40% higher in emissions than
that of sand depending on the type of aggregate being used. The process itself begins with
blasting from quarry faces into medium sized rocks before excavating and hauling to crushing
and grading equipment. Flower & Sanjayan report the ECO2 for basalt to be 0.046 t CO2 –
e/tonne. The process also requires on average 22% diesel and 78% electricity, the latter of
which is used extensively for the crushing stage which itself accounts for 75% of the total
process. The Concrete Industry Sustainability Performance Report, published in 2010, indicates
the CO2 emissions per tonne of aggregate produced to be 4kg per tonne, not differing greatly
from Flower & Sanjayan. Table 9.1 summarises the proportions, energy use and ECO2 of each
component, where given, making 1 tonne of concrete.
The emission figures are based purely on the processing of materials subsequent to
their initial production as both GGBS and fly ash are by products of other industrial processes
that operate independently of the cement industry and would therefore be produced
regardless of their beneficial characteristics as cement additions. Use of these materials in
cement production has the added benefit of reducing waste to landfill in addition to that of
reducing ECO2 per tonne of concrete produced.
Table 9.1: Proportional components of 1 tonne of concrete
Proportion Energy (kWh/t)* Water (l/t)* ECO2
Cement 12% 1194 45 70-100%
Aggregate 48% 12.7 48 4-6%
Sand 34% 1%
GGBS 238 11 5.2%
Fly ash 9.3 0 0.4%
Limestone 3.2%
Water 6%
*used in production/processing of materials
With the information summarised in Table 9.1 the ECO2 of all concrete combinations
was calculated for each kg/m3 of concrete produced. The data is shown in Appendix A-4 whilst
Figure 9.2 shows an overview of the ECO2 values for each mix across the range of w/c ratios.

Ternary Combination Concretes Using GGBS, Fly Ash & Limestone: Strength, Permeation & Durability Properties
Chapter 9: Environmental & Economic Implications
273
Fig 9.2: Calculated ECO2 for all mix combinations and w/c ratios
9.4 Environmental Performance
9.4.1 Strength and ECO2 Trade-off
In Chapter 4 the early age strength and the estimated time to reach 10N/mm2 was
discussed. Given the delayed strength development properties of the additions it is expected
that CEM I will reach 10N/mm2 earlier, but as shown in Figure 9.2 the ECO2 of the CEM I mix is
higher than the others. However, whilst it is important to ascertain the strength of concrete, in
general laboratory testing cannot provide a true representation of the environmental effects
that in situ concrete may endure; such tests do not accurately reflect the strength development
of in situ concrete that is affected by a number of variables such as thickness of slab, binder
content and temperature.

Ternary Combination Concretes Using GGBS, Fly Ash & Limestone: Strength, Permeation & Durability Properties
Chapter 9: Environmental & Economic Implications
274
Given the extent and diversity of concrete as a building material its strength remains an
important, if not vital, statistic in selecting the right type of concrete for the right construction
project. Formwork is extensively used, creating further restrictions on the management of
these projects. BS 8110 (1997) and subsequently CIRIA Report 136 (2004) lay out guidelines for
the striking of formwork. Four days is recommended for the soffit formwork to slabs and 12hrs
for vertical formwork at an ambient temperature of 16oC. Shorter periods are acceptable for
slabs and beams only if their strength is equal or greater to 10 N/mm2 in situ, or twice the
stress to which they are being subjected (10 N/mm2 is usually the greater of these) 5N/mm2 is
acceptable for members in compression to protect against frost damage. Should, however the
slab be less than 250mm in depth and have a length of at least 7.5m shorter periods are not
allowable. With this is mind it is evident that all mixes for 0.35 and 0.5 w/c ratio were suitable
when the time to 10N/mm2 is assumed to follow a logarithmic scale as is suggested by Li &
Zhao (2002). It must be remembered that this is hypothetical in this instance and the time to
10N/mm2 is assumed based on the early strength development from test data and may not
necessarily be the case. However, regardless of these assumptions, the result for 3 days
exceeded 10N/mm2 for all these mixes and therefore definitely conformed to the 4 day
restriction. It may be possible that early strength development of concrete does not follow a
logarithmic scale but gives a rapid growth during the initial 24 hours, further tests would need
to be carried out in a spate study, which would be needed to take place to confirm this before a
decision is made as to the best combination for vertical formwork requiring 12 hours to reach
10N/mm2.
The British standard recommendations are irrespective of binder type and a later
report produced by CIRIA (CIRIA Report 136, 1995) provides tables for CEM I strength classes
42.5 and 52.5 only without due consideration of additions such as GGBS or fly ash. Whilst the
former ultimately provides high strength at a later age it is recognised that incorporating GGBS
with CEM I to provide a binary blended concrete causes slower early age strength development
which is clearly indicated in Figs 4.8 to 4.10. In spite of this, however, a report by the Institute
of Civil Engineers on “Formwork Setting Times for GGBS Concretes” states that “where only up
to 50% GGBS is used, the reduction in early age strength development has not presented
problems significant enough to prompt much field investigation.”

Ternary Combination Concretes Using GGBS, Fly Ash & Limestone: Strength, Permeation & Durability Properties
Chapter 9: Environmental & Economic Implications
275
Unless the laboratory testing procedure can replicate the conditions of in situ concrete
differences will remain. One of the easiest variables to control is the temperature during the
curing process and unless this is controlled during curing differences will definitely occur
between cube strengths and in situ concrete, yet this in itself is not controllable for in situ
concrete which can cure in temperatures exceeding 20oC and indeed, far below during winter
months. GGBS concretes are more sensitive to temperatures than CEM I concretes in that an
increase in temperature can improve the early age strength gain. An increase in curing
temperature to 40oC can increase this strength gain by a factor of 2 of 4 (LERM, 2001) making
GGBS concretes suitable for fast track construction, and in many cases heat beds are used to
encourage and accelerate early age strength gain (Barnett et al, 1995).
Depending on the structure and its location it is reasonable to require only a medium
strength concrete in certain circumstances, instead of a high strength concrete thus making
both an economical and environmental sound decision. Naturally where necessary high
strength concretes must be used Jaturapitakkul et al (2004) refer the high strength of a
concrete to exceed 41 N/mm2 at 28 days. With this in mind a threshold was established as a
guideline to the strength value of ternary concretes and concretes exceeding this threshold are
considered together with the trade of with ECO2. Medium strength should not be discounted
but by discussing those considered to be of higher strength it highlights the greater versatility
for ternary concretes. The ternary mixes for both 0.35 and 0.5 w/c ratios exceeded the 41
N/mm2 threshold at the 35% replacement level with a markedly lower ECO2 value than the
CEM I as shown in Figure 9.3. At 0.65 this threshold was not reached so these mixes were
subsequently ruled out for further comparison and ECO2 trade off.
At the higher 55% replacement level the ternary mixes at the 0.35 w/c ratio, shown in
Figure 9.4, also exceed the 41 N/mm2 threshold. The ternaries for the 0.5 w/c ratio mix group
fell just short of this requirement at 28 days. As seen in Figure 9.5 the fly ash ternaries at the
75% level also exceeded the 41 N/mm2 threshold at 28 days together with the 20% limestone
mix at 0.35 w/c ratio.

Ternary Combination Concretes Using GGBS, Fly Ash & Limestone: Strength, Permeation & Durability Properties
Chapter 9: Environmental & Economic Implications
276
Figure 9.3: Compressive strength against ECO2 for 35% replacement level mixes at 28 days.
Figure 9.4: Compressive strength against ECO2 for 55% replacement level mixes at 28 days

Ternary Combination Concretes Using GGBS, Fly Ash & Limestone: Strength, Permeation & Durability Properties
Chapter 9: Environmental & Economic Implications
277
Figure 9.5: Compressive strength against ECO2 for 75% replacement level mixes at 28 days
To summarise the strength and ECO2 more effectively Figure 9.6 illustrates the ECO2 for
the mix combinations at the equivalent strength of 40N/mm2 at 28 days where it is clear that
all binary and ternary mixes give a lower ECO2 than the CEM I. Whilst the strength is paramount
to the serviceability of the concrete the other tested properties need to be taken into
consideration in order to optimise a durable concrete.
Figure 9.6: ECO2 for equivalent strength of 40N/mm2

Ternary Combination Concretes Using GGBS, Fly Ash & Limestone: Strength, Permeation & Durability Properties
Chapter 9: Environmental & Economic Implications
278
9.4.2 Absorption and ECO2 Trade off
For a higher strength concrete both ternaries at the 35% level can be considered at
0.35 and 0.5w/c ratio in addition to all ternary mixes at 55% level for 0.35 w/c ratio. At the
higher 75% replacement level both 10% and 20% fly ash ternary mixes together with the 20%
limestone ternary may also be considered. However, it cannot be assumed that a high strength
concrete is also a durable concrete. The initial surface absorption results for 28 days showed
that a concrete with a lower ECO2, whilst having a high strength may not necessarily prove
effective at reducing water absorption by 28 days. Based on BS 1881 an initial absorption of
greater than 0.5 ml/m2 per second (50 x10-2 ml/m2,s) would be considered high whilst less than
0.25 ml/m2 per second is low. Figure 9.7 indicates that at the 35% level the ternary mixes at all
w/c ratios did not show high absorption levels. The 0.35 and 0.5 w/c ratio, all with high
strength, also indicated a lower initial surface absorption than the CEM I control mix, this
combined with their lower ECO2, certainly makes them viable concretes thus far, with regard to
sustainable and economical benefits.
An increase in GGBS level to 55% increased the initial surface absorption of the ternary
concretes. For the higher strength concretes at this level the 0.35 w/c ratio group of ternaries
can only be considered and whilst the initial surface absorption had increased they were lower
than 0.5 ml/m2 per second. The 10% limestone ternary was the lowest at 0.36 ml/m2 per
second, this mix is however, higher than the CEM I control mix but it should not be ruled out as
a viable mix for certain environments. Figure 9.9 shows the initial surface absorption results for
the 75% level against ECO2 for 28 days. The strength for this mix cannot be considered high at
28 days being only 32 N/mm2 but may be considered for medium strength concrete should that
be sufficient for certain circumstances.

Ternary Combination Concretes Using GGBS, Fly Ash & Limestone: Strength, Permeation & Durability Properties
Chapter 9: Environmental & Economic Implications
279
Figure 9.7: ISAT against ECO2 for 35% replacement level mixes at 28 days.
Figure 9.8: ISAT against ECO2 for 55% replacement level mixes at 28 days.

Ternary Combination Concretes Using GGBS, Fly Ash & Limestone: Strength, Permeation & Durability Properties
Chapter 9: Environmental & Economic Implications
280
Figure 9.9: ISAT against ECO2 for 75% replacement level mixes at 28 days.
9.4.3 Air permeability and ECO2 Trade Off
At the lower 35% level the ternary mixes gave good results against the CEM I with 10%
limestone mix providing the better results across the range of w/c ratios as seen in Figure 9.10.
The w/c ratio will alter the ECO2 considerably and it is shown that the lower 0.35 w/c ratio can
give much lower ECO2 values for the binary and ternary mixes than the mid-range, 0.5 w/c
ratio. If a higher w/c ratio is required then the 0.5 w/c ratio showed lower air permeability
results than the CEM I at 0.65 w/c ratio. At this higher w/c ratio the 10% limestone ternary
provides decreased air permeability and ECO2 than the CEM I control.
An increase to the 55% GGBS level gave a marked increase in intrinsic air permeability
as discussed in detail in Chapter 7 and shown in Figure 9.11, therefore possibly ruling these
mixes out as viable options for sustainable concrete design although the lower w/c ratio made
be considered further. The results followed a similar trend for the water penetration under
pressure tests.

Ternary Combination Concretes Using GGBS, Fly Ash & Limestone: Strength, Permeation & Durability Properties
Chapter 9: Environmental & Economic Implications
281
Figure 9.10: Air permeability against ECO2 for 35% replacement level mixes at 28 days
Figure 9.11: Air permeability against ECO2 for 55% replacement level mixes at 28 days

Ternary Combination Concretes Using GGBS, Fly Ash & Limestone: Strength, Permeation & Durability Properties
Chapter 9: Environmental & Economic Implications
282
9.5 Durability and ECO2 Trade Off
9.5.1 Carbonation
Whilst Chapter 8 highlighted the overall poor resistance to carbonation of the binary
and ternary mixes when seen in context with ECO2 and the CEM I concrete some lower
replacement level concretes may still be viable for practical use. The results shown in Figure
9.12, similarly to those shown for air permeability, would suggest the effects of w/c ratio can
contribute to lowering the ECO2. The mix combinations at the lower w/c ratio provide better
resistance to carbonation than the CEM I at 0.5 w/c ratio for significantly lower ECO2. The
binary and 10% limestone ternary mix at this 35% replacement level and 0.5 w/c ratio are
marginally increased than the CEM I concrete while considerably decreasing the ECO2 value. At
the increased 0.65 w/c ratio these mixes can be considered as viable replacements for CEM I
concretes.
An increase in replacement level to 55% shows a clear increase in carbonation, as
discussed in detail in Chapter 8, despite their markedly lower ECO2 as shown in Figure 9.13. The
lower 0.35 w/c ratio mix combinations may be considered but will depend on the required mix
proportioning and w/c ratio demand for the project. There must be careful consideration when
trading resistance to carbonation for ECO2 and other concrete properties should be taken into
consideration as well as the final location placement of the structure.
Chapter 8 discussed the minimum cover recommended by both BS 8500 and BS EN
206. Whilst the latter only refers to CEM I cements BS 8500 considers all cement types.
Exposure class XC1 (refer to Table 8.1 for details) recommends a minimum cover of 15mm
which will restrict the use of a number of the ternary concretes at the higher w/c ratios but
does not exclude those with the lower 0.35 w/c ratio at the 35% addition level that, even by 20
weeks test age show lower depth of carbonation than 10mm, illustrated in Figure 8.1. It was
also shown that the 10% ternary concretes and 20% limestone ternary, at the 55% addition
level and w/c ratio do not exceed 15mm by 20 weeks. For exposure classes XC2, XC3 and XC4 a
greater cover depth is suggested, ranging from 20 to 35mm. At the lower, 0.35 w/c ratio, with
considerably lower ECO2 per kg/m3 compared to CEM I concretes a greater range of addition

Ternary Combination Concretes Using GGBS, Fly Ash & Limestone: Strength, Permeation & Durability Properties
Chapter 9: Environmental & Economic Implications
283
level and materials can be considered. Some are also feasible at the 0.5 w/c ratio, again
depending on the specific exposure class.
Fig 9.12: Carbonation (8 weeks) against ECO2 for 35% GGBS level
Fig 9.13: Carbonation (8 weeks) against ECO2 for 55% GGBS level

Ternary Combination Concretes Using GGBS, Fly Ash & Limestone: Strength, Permeation & Durability Properties
Chapter 9: Environmental & Economic Implications
284
9.5.2 Chloride Ingress
The previous chapter already discussed the increased resistance to chloride ingress
offered by the binary and ternary materials. This combined with the additional properties and
the decreased ECO2 indicates their suitability for use in a practical context. It has been clear
that the 10% limestone ternary has the greater potential if all the properties are to be
considered and again the chloride ingress result are markedly lower, together with the ECO2
when compared to CEM I.
Fig 9.14: Chloride ingress (NordTest) against ECO2 at 28 days
9.6 Economic Implications for Environmental Concretes
It was alluded to earlier in this chapter that the use of cement replacements such as
GGBS and fly ash, are threefold. Improved technical performance has already been discussed at
length and remains the main focus of this thesis and the environmental benefits in the
reduction of ECO2 have already been discussed earlier in this chapter. However, given the
current state of the construction industry with the present recession it would be prudent to
review the basic costs involved in the production of concrete in an “on-site” context.

Ternary Combination Concretes Using GGBS, Fly Ash & Limestone: Strength, Permeation & Durability Properties
Chapter 9: Environmental & Economic Implications
285
The material costs used here are based on an average of figures from a number of
sources and key suppliers to trade, they are used to simply illustrate possible costs and do not
include additional plant costs and actual production costs. As already indicated, to incorporate
these figures would require an extensive study into the whole of life costs of each element of
cement production and the construction industry as a whole. Table 9.2 outlines the costs used
to calculate the material costs per m3 of concrete shown for each mix combination in Figure
9.15. It is important to note that costs will vary depending on project size which can
significantly increase cost savings with volume produced. Market conditions, order quantity,
transportation and repeat business will also have some bearing in a practical context. Marked
differences were observed when sourcing data for these costing and seemed more apparent
with sand and aggregates. The cost per tonne for sand ranged from £13 to £22, and aggregate
£18 to £25 per tonne.
Table 9.2: Costings used to calculate total material costs
Material Cost £ per
kg/m3
CEM I 0.065
GGBS 0.045
Fly Ash 0.02
Limestone 0.076
Sand 0.017
5-10mm Aggregate 0.0215
10-20mm Aggregate 0.021
Water 0.01
It is clear from Figure 9.15 that some modest savings can be made by using
replacement materials in mix combinations. Naturally a difference in w/c ratio will also create
variance on costs with less material overall required for higher w/c ratios, therefore lowering
the costs significantly. Figure 9.16 shows the material costs for the tested mix combinations at
an equivalent strength of 40N/mm2. Here these costs are put into perspective and indicate that
in order to achieve an equivalent strength the varying of the w/c ratio and therefore the
volume of material within the mix design may not always have a positive impact on the overall
cost to produce the concrete with the 35% binary and 10% limestone ternary at the higher,
75% replacement level, clearly not cost effective. The 10% fly ash at the 55% replacement

Ternary Combination Concretes Using GGBS, Fly Ash & Limestone: Strength, Permeation & Durability Properties
Chapter 9: Environmental & Economic Implications
286
shows a significant cost saving but this needs to be taken into consideration with other
properties to ensure both a strong and durable concrete.
Fig 9.15: Total material costs (£/m3) for each mix combination
Fig 9.16: Material costs for equivalent strength of 40N/mm2

Ternary Combination Concretes Using GGBS, Fly Ash & Limestone: Strength, Permeation & Durability Properties
Chapter 9: Environmental & Economic Implications
287
Table 9.3 provides an overview across the range of tests for selected concretes, figures
in green indicate results that are improved on the CEM I control concrete (shown in black
together with data that is equal to it), those in red give poorer results by comparison. By
reviewing the combined data for selected concretes at equivalent 28 days strength of 40N/mm2
it can be seen in Table 9.3 that a number of ternary concretes can compete with CEM I in terms
of both permeation and durability. Together with their lower ECO2 and estimated material
costs they may indeed warrant further consideration across the cement industry. Across the
tested concrete combinations of particular interest are the ternary mixes at the 55% addition
level. The 20% fly ash is indicated as outperforming the CEM I concrete across the range of
tests shown here, including carbonation when considered at both 28 and 180 day test ages.
Table 9.3: Overall performance of concrete for Equivalent cube strength at 28 days of 40N/mm2
Mix Combination
ISAT Sorptivity Air
Permeability Water
Penetration Carbonation
ECO2 Material
Cost £/kg/m3 28
days 180 days
28 days
180 days
28 days
180 days
28 days
180 days
28 days
180 days
CEM I 57 46 320 255 3.55 3.92 23 16 13 18.5 343 39
65%PC + 35%GGBS 36 24 210 155 4.87 2.64 25.8 12.3 14.5 23 322 43
65%PC + 25%GGBS + 10%PFA
44 32 385 180 7.07 4.99 37.8 14.7 18.5 30 268 37
65%PC + 25%GGBS + 10%LS
42 32 260 185 9.03 5.89 41.6 17 12.5 21 277 38
45%PC + 55% GGBS 45 33 250 185 4.01 2.59 19.4 11 5.5 9 221 38
45%PC + 45%GGBS + 10%PFA
60 37 340 210 2.48 2.1 24.7 12.3 10.5 17 198 29
45%PC + 35%GGBS + 20%PFA
56 32 280 185 3.25 2.26 17.2 10.5 10.5 16.5 223 37
45%PC + 45%GGBS + 10%LS
50 38 260 200 3.12 2.2 18.4 10.4 11.5 19 220 37
45%PC + 35%GGBS + 20%LS
49 33 260 170 5.92 4.69 22.5 10.9 13 18.5 229 38
25%PC + 75%GGBS 48 36 280 200 3.92 3.26 19 8.8 13 21 174 38
25%PC + 65%GGBS + 10%PFA
61 35 245 195 3.32 2.58 17.4 8.2 18 28.5 173 38
25%PC + 55%GGBS + 20%PFA
62 37 230 190 8.37 7.14 28.1 13.4 15 20 176 37
25%PC + 55%GGBS + 20%LS
51 37 245 170 6.48 5.83 42 17.9 15 21 189 41

Ternary Combination Concretes Using GGBS, Fly Ash & Limestone: Strength, Permeation & Durability Properties
Chapter 9: Environmental & Economic Implications
288
9.7 Summary
It is evident that there are many practical implications for the use of ternary concretes
in modern society. Initially it is important to consider the strength and durability of any
concrete when placed in situ as it must always meet with specific requirements with regards to
its use and exposure to specific elements that may require it to have good resistance to
chloride or carbonation. Overall the ability to reduce the ECO2 of cement production by over
200kg/tonne in some instances, depending on w/c ratio, cannot be ignored. In this case the
ternary blends for the 35% GGBS level at the 0.35 w/c have certainly proved to be worth
considering as alternative to the 100% CEM I cement mixes reducing ECO2 emissions by around
150 kg/tonne, and the 0.5w/c ratio mixes have also shown to be strong and durable. Additional
ternary mixes within the 55% level, as already discussed, are also worthy of consideration as
they reduce the ECO2 further by over 200 kg/tonne for the 0.35 w/c ratio.
The basic costs implications were also discussed and it was seen that modest saving
could be made by using binary and ternary concrete combinations. Low costs may be more
beneficial but market forces can create long term detrimental supply and demand effects.
Lower costs can increase use, hence demand, in turn increasing use of the raw materials that
are important to the production of concrete. To mitigate it is likely that further environmental
taxes are placed on mineral extraction as well as carbon emissions, this again will lead to
increases in prices being passed along the supply chain.
The economics in supply and demand are a different and, in themselves an exhaustive
issue that do not fall within the remit of this study that is concerned with the practicalities of
concrete as in the strength, permeability and durability of ternary based concretes.

Ternary Combination Concretes Using GGBS, Fly Ash & Limestone: Strength, Permeation & Durability Properties
Chapter 10: Final Conclusion & Recommendations for Further Research
289
CHAPTER TEN:
FINAL CONCLUSIONS & RECOMMENDATIONS FOR
FURTHER RESEARCH
10.1 Introduction
The main aim of this study was to develop an understanding of the effects of fly ash
and limestone as ternary materials when used together with a CEM I and GGBS base mix, thus
enabling the reduction of CO2 emissions from the production of cement as the main
constituent material for concretes. By understanding the effects each addition has on the base
mix, it is possible to determine whether it is beneficial to advocate the use of either fly ash or
limestone to enhance the strength and durability qualities the binary mixes already processed
or what is required to be done to enable their use. In order to gain this knowledge the basic
aims were set out in Chapter 1.
The first phase of the study involved characterising the individual materials used. The
CEM I and additional materials were found to be consistent with those used in previous studies
as discussed in Chapter 2. The GGBS and fly ash were found to be chemically similar to the CEM
I but in differing forms and proportions. They both had a higher silica content than the CEM I
but a lower CaO. These differing proportions had the effect of reducing early strength
development and creating competition between GGBS and fly ash for the free lime from the
hydrating cement. The higher silica content of these materials had the effect of increasing C-S-
H, forming a denser micro-structure within the cement paste.
Initially the cement combinations ranged from 35% to 90% replacement. However,
during the early stage of testing, the 90% level was ruled out, since the setting time was greatly
extended and its strength development was similarly impeded. Focus was then centred on
35%, 55% and 75% replacement levels. Overall, it was found that the increasing addition levels

Ternary Combination Concretes Using GGBS, Fly Ash & Limestone: Strength, Permeation & Durability Properties
Chapter 10: Final Conclusion & Recommendations for Further Research
290
reduced water demand when compared to the CEM I control mix and increased packing
density. As expected, SP dosage increased with decreasing in w/c ratio and with increasing in
addition level, to give a consistence class of S2, at a fixed water content of 165 l/m3 in
accordance with BS EN 206-1. The inclusion of ternary materials had the effect of reducing the
SP dosage. This was more noticeable at the lower w/c ratio of 0.35, where the fines content
was higher at the 35% addition level, and across all w/c ratios at the 55% replacement level.
In order to investigate the impact of cement combinations on the cement paste
structure the porosity of the cement paste samples was investigated with mercury intrusion
porosimetry. It was established that an increase in w/c ratio from 0.35 to 0.5 had the effect of
increasing the critical pore diameter in turn causing higher porosity, which decreased with
prolonged curing. The data was used to make comparisons with the properties of their
concrete counterparts at a later stage. At this point, it was possible to identify certain paste
combinations with optimum characteristics in terms of minimum capillary pore size and
increased packing density. These included those at the 35% GGBS level across the range of w/c
ratios and those at the lower, 0.35 w/c ratio for the 55% GGBS level.
A number of tests were carried out to determine the strength and permeation
characteristics of all the cement combinations, as well as their durability properties. These
tests, outlined in Chapter 3, were discussed in relation to the estimated ECO2 of all the
concretes tested. The overall aim was to determine the benefits and limitations of using
combined materials to produce ternary concretes. Whilst conclusions have been summarised,
together with discussion concerning likely mechanisms of the effects of additional materials, at
the end of each chapter this chapter examines the wider context of the results, highlighting the
optimum concrete combinations. It also underlines the practical implications arising. With
these conclusions made recommendations for future research will be given.
10.2 Overall Conclusions
Previous studies have clearly indicated that there is strong potential for increasing use
of binary concretes within the construction industry. The benefits of GGBS as a binary

Ternary Combination Concretes Using GGBS, Fly Ash & Limestone: Strength, Permeation & Durability Properties
Chapter 10: Final Conclusion & Recommendations for Further Research
291
constituent have already been discussed but its slower strength gain, whilst an issues for early
strength concerns such as the striking of formwork, is most advantageous for the development
long-term strength. The purpose of studying the addition of a ternary material to GGBS base
mixes was to determine if fly ash or limestone could have a positive effect and increase the
earlier strength of the mix as well as improve other aspects such as permeability and durability.
10.2.1 Fresh Properties and Early Age Strength
Overall it was seen from the cement paste mixes that water demand generally
decreased with the addition of GGBS for the binary mixes. The fly ash ternary mixes showed a
slight increase in water demand when compared to the binary mixes, whilst the packing density
was lower. Whilst water demand was comparable to the binary mixes, the packing density was
lower. In addition, the paste mixes tested showed an increase in yield stress with the addition
of GGBS, this increased further still when limestone and fly ash were incorporated.
The setting times of the pastes increased with w/c ratio and level of GGBS, compared
to CEM I. Fly ash, added to the 35% GGBS level at 0.35 w/c ratio, reduced the setting time
compared to the binary mix, whilst all other ternary mixes, across the range of w/c ratios
showed an increase in setting time compared to that of the CEM I. As expected, a decrease in
w/c ratio increased SP dosage requirements. This also increased with the volume of additions,
related to the specific surface area of the mixes.
10.2.2 Compressive Strength
With regard to early age strength development of the concretes, it was expected that
this would slow down by increasing the level of GGBS. At the lower w/c ratio for the 35% GGBS
level, with the inclusion of fly ash and limestone, this effect was exacerbated, but as the level of
GGBS increased and with an increase in w/c ratio, the ternary addition provided better results
making them more comparable with the binary mixes and, in the case of the 75% GGBS level at
the 0.35 w/c ratio, giving improvements compared to this. With this in mind, it was clear that
the binary and ternary concretes would take longer to achieve 10 N/mm2, and this increased
with addition level and w/c ratio. Whilst none of the binary or ternary concretes could match
CEM I it was seen that the inclusion of limestone generally improved the rate of strength gain

Ternary Combination Concretes Using GGBS, Fly Ash & Limestone: Strength, Permeation & Durability Properties
Chapter 10: Final Conclusion & Recommendations for Further Research
292
in the early stages for the 35% level, whilst the 10% fly ash ternary concretes showed greater
improvement at the 55% level, compared to the limestone. However, there was little difference
between these two levels overall.
Despite the indications of early strength gain, more positive effects of GGBS addition
were seen after 28 days. Obviously, increasing w/c ratios reduced the compressive strength of
concretes, as did the increase in GGBS levels. The 35% GGBS binary mix was comparable with
the CEM I by 28 days at all w/c ratios, whilst the other binary concretes were lower. The 55%
level did not exceed the strength of the CEM I concrete until 180 and 90 days for the 0.5 and
0.65 w/c ratios respectively. The 75% level gave comparatively poor strength results across the
test period.
The addition of ternary materials had differing effects with increasing w/c ratio and
GGBS level. At the lower w/c ratio and 35% GGBS level, the effects were negative in that they
reduced the long-term strength development compared to the binary mix. The 10% ternary
concretes were slightly improved with an increase to the 55% GGBS level. At 0.5 w/c ratio, the
10% ternary mixes were more comparable with the binary concrete for both the 35% and 55%
levels, whilst the 20% ternary concretes at the higher level of additions remained lower than
the binary. An increase to 0.65 w/c ratio showed the 10% fly ash ternary concrete improved
compared to both binary and CEM I concrete by 90 days, whilst the 10% limestone remained
comparable with the binary concrete. Again this was noted to a slightly lesser extent at the 55%
level.
It was found that it would be possible for all concretes to achieve an equivalent
strength of 40 N/mm2 by 28 days if the w/c ratio was altered for each mix, with lower w/c
ratios would be required for the binary and ternary concretes compared to the CEM I.
10.2.3 Absorption & Capillary Rise
Again it was seen that an increase in w/c ratio increased both the ISAT and sorptivity
values of the concrete combinations. This was, however, reduced with time. Both the 35% and
55% binary concretes gave reduced absorption values across the range of w/c ratios with the

Ternary Combination Concretes Using GGBS, Fly Ash & Limestone: Strength, Permeation & Durability Properties
Chapter 10: Final Conclusion & Recommendations for Further Research
293
75% level giving poorer results in contrast to the other addition levels and the CEM I. The 35%
level gave better results; the addition of ternary materials gave similar results at the 0.5 and
0.65 w/c ratio. The 10% fly ash ternary concrete at the lower w/c ratio, however, increased the
ISAT value. The ternary concretes were again comparable with the binary and CEM I concretes
for the 55% level at 0.35 w/c ratios with slight improvements seen at the 0.5 and 0.65 w/c
ratios. An increase to the 75% level gave more varied results. The 10% limestone ternary was
slightly lower than the CEM I at 0.35 w/c ratio, whilst the other combinations were higher. The
higher w/c ratios increased the ISAT values, but at 0.65 w/c ratio both the binary and 10%
limestone ternary concretes were lower than CEM I.
The sorptivity results followed the same pattern as the ISAT and both correlated, in
general, with the critical pore diameter which increased with rate of absorption.
10.2.4 Permeability
Similar trends occurred to those in the absorption tests, in that permeability increased
with w/c ratio and GGBS level. At 28 days, the limestone ternary at the 35% level gave better
results across the range of w/c ratios and concretes. Whilst an increase to the 55% level
increased the air permeability across the range of concretes, the 10% limestone remained the
lowest between binary and ternary concretes, but higher than that of CEM I. An increase to
75% GGBS level significantly increased the air permeability of the binary and ternary concretes.
At 180 days, the results followed a similar trend but reduced with the prolonged curing time.
The 10% limestone addition for the 35% level showed an improved air permeability for the 0.5
and 0.65 w/c ratio, whilst the fly ash ternary increased the results at this level. For the water
penetration tests, the fly ash ternary was more comparable with the CEM I concrete.
The depth of water penetration also increased with critical pore size. In general, the
critical pore size increased with the volume of GGBS and again with ternary additions.
However, whilst limestone had a higher critical pore size its permeability was lower than that of
the fly ash.

Ternary Combination Concretes Using GGBS, Fly Ash & Limestone: Strength, Permeation & Durability Properties
Chapter 10: Final Conclusion & Recommendations for Further Research
294
10.2.5 Durability
Poor resistance to carbon dioxide ingress for the GGBS binary concretes was expected
and increased with w/c ratio and GGBS level. However, the purpose of these tests was to
investigate the effects of ternary additions. The binary concretes at 35% and 55% GGBS level
were comparable with the CEM I by 20 weeks across the range of w/c ratios but an addition of
fly ash increased the depth of carbonation significantly as did limestone addition, although to a
lesser extent.
By contrast, the chloride tests gave positive results for the combination concretes in
that they were all significantly lower than the CEM I concrete, across the range of w/c ratios for
all GGBS levels. The results improved further with increasing levels of GGBS as the concretes
capacity to bind chlorides improved. The addition of ternary materials further improved the
results at each GGBS level. In some cases the results of the ternary concretes, were one third of
the binary results for that GGBS level. For example, the binary at the 35% level (0.5 w/c ratio)
measured 13.22 Dnssm, m2/s at 180 days whilst the 10% limestone concrete recorded 4.37 Dnssm,
m2/s.
10.2.6 ECO2 of Concretes Combinations
Across the range of concrete combinations comparisons were made between the ECO2
per tonne of concrete and the properties of the concretes tested. Essentially the ECO2 of the
binary and ternary concretes were comparable with each other as the proportion of ternary
materials was not enough to reduce the ECO2 significantly compared to the binary concrete
given their similar ECO2 values. However, these mixes gave considerably lower ECO2 values
compared to the CEM I concretes. At 0.35 w/c ratio the ECO2 for the CEM I concretes was 515
kg/m3 whilst the binary and ternary concretes gave levels of 380 kg/m3 reducing further with
increasing w/c ratio and cement additions.
The material costs were estimated and it was found that, generally, small savings may
be possible for binary and ternary concretes when compared to CEM I concretes. Equivalent 28
day strength of 40 N/mm2 was estimated across the majority of the tests performed and,

Ternary Combination Concretes Using GGBS, Fly Ash & Limestone: Strength, Permeation & Durability Properties
Chapter 10: Final Conclusion & Recommendations for Further Research
295
combined with the ECO2 and material cost data, provided encouraging results with the 20% fly
ash at the 55% addition level giving consistently more favourable results than the CEM I.
These results alone do not constitute their use within the concrete industry. They
should be viewed in relation to the strength and durability properties of concrete, thus
enabling a more informed decision on the use of an optimum concrete that carefully balances
sustainability with performance. In light of the test results, it was clear that the use of the 35%
range of mixes would be viable across many exposure conditions. They have a comparable
strength with the CEM I concretes by 28 days, exceeding them in the longer-term and very
good resistance to chloride ingress. Due to their improved permeation and slow rate of
penetration of CO2, it is believed that the ingress of carbon dioxide will be limited to the initial
10mm of the concrete surface. Concretes at the 55% level should not be totally precluded but
given consideration for locations where exposure conditions are less aggressive with regards to
possible carbonation.
10.3 Recommendations for Future Research
Given the results from this study it was clear that individual properties of each material
had a different effect on the microstructure of concrete. It would be beneficial to investigate
this further by undertaking a more detailed analysis into the physical and chemical properties
of the materials and how they change at a microscopic level. This can incorporate SEM and
more detailed porosimetry analysis together with pore fluid chemistry to gain a better
understanding of the reactions taking place within the cement paste.
It was found that ternary additions affect the development of strength and durability
properties. Whilst these may not have been in an overall positive way an effect was
nonetheless seen and further investigation into the use of other materials would be beneficial.
Such materials may include silica fume and metakaolin. In addition to ternary blends, there
may well be benefit in adding a fourth material to create quaterternary combinations. Other
areas may be studied such as the quality and fineness of the materials. The interaction of
materials with the aggregates may also be of interest. Varying types of aggregates may be
studied including recycled concrete and marginal aggregates.

Ternary Combination Concretes Using GGBS, Fly Ash & Limestone: Strength, Permeation & Durability Properties
Chapter 10: Final Conclusion & Recommendations for Further Research
296
It was discussed, in Chapter 8, that the negative effect of using GGBS concretes was the
poor resistance to carbonation and how, due to their improved permeation, it was likely that
carbonation could be restricted to the initial 10mm of the concrete surface (Bouikni et al,
2009). This should be investigated further with a range of exposure conditions, including
normal exposure conditions, to investigate this. A wider range of durability tests would be
beneficial and should include freeze/thaw effects and external exposure tests including marine
environments.
There is a strong argument for the use of ternary concretes by the concrete industry.
Indeed, not only do the properties of strength and durability, certainly at the 35% level, allow
it, but the ECO2 values calculated were also positive. However these values are based on basic
calculations and the environmental benefits may be far reaching and warrant a greater depth
of study. It may be of interest to perform a life cycle analysis (LCA) of these concretes in greater
detail in respect of their complete life cycle, including the service-life of a particular structure.
This would include a survey of specific elements such as transportation costs and may be
studied on a national or global scale. This would involve taking a detailed inventory, as defined
by ISO 14040 and 14041, of all the elements of the life-cycle from the production of the
concrete to the demolition of the structure at the end of its service life. Allocation procedures
in relation to the proportioning of environmental burdens between main products and by-
products would also be worthy of further analysis. The impact of raw material extraction,
processing and transportation, for example, would be assessed with regards to impacts
including those on global warming and energy consumption before making a final evaluation.
This would give a greater insight into both the economic and environmental costs and benefits.
These concretes may also have additional beneficial properties that were out with the
scope of this study, such as thermal or acoustic, yet may be of interest to industry given the
pressure it faces to produce more sustainable and environmentally friendly structures.
Concrete may have good thermal inertia but poor acoustic absorption, by studying the effects
of additional materials these properties may differ sufficiently to create a balance between the
two. Such properties may aid in reducing the running costs during the service life a building,

Ternary Combination Concretes Using GGBS, Fly Ash & Limestone: Strength, Permeation & Durability Properties
Chapter 10: Final Conclusion & Recommendations for Further Research
297
such as thermal values that may, in turn, reduce insulating or cooling costs, and should be
investigated further in order to lend support to the use of these concretes in an ever growing
global industry.

Ternary Combination Concretes Using GGBS, Fly Ash & Limestone: Strength, Permeation & Durability Properties
References & Bibliography
298
REFERENCES & BIBLIOGRAPHY
ABDUL RAZAK, H, CHAI H K, WONG H S, (2004), “Near surface characteristics of concrete containing
supplementary cementing materials”, Cement and Concrete Composites 26: 883-889
ABDELKADER, B., K. EL-HADJ, et al. (2010). "Efficiency of granulated blast furnace slag replacement
of cement according to the equivalent binder concept." Cement and Concrete Composites
32(3): 226-231.
AGARWAL S K, (2006), “Pozzolanic activity of various siliceous materials”, Cement & Concrete
Research 36: 1735-1739
AHMED M. S., KAYALI O. & ANDERSON W. (2008), Chloride penetration in binary and ternary
blended cement concretes as measured by two different rapid methods, Cement and Concrete
Composites, Vol. 30, pp. 576–582.
AIQIN W, CHEGZHI Z & NINGSHENG Z, “The theoretic analysis of the influence of the particle size
distribution of cement system on the property of cement”, Cement & Concrete Research 29:
1721-1726
ALDEA, C. M., SHAH, S. P., KARR, A., “Permeability of cracked concrete”, Materials and Structures
32: 370-376
ALEXANDER, M. G. & B. J. MAGEE (1999). "Durability performance of concrete containing
condensed silica fume." Cement and Concrete Research 29(6): 917-922.
ALIGIZAKI K. (2006), Pore structure of cement based materials, testing, interpretation and
requirements. Series: Morden Concrete Technology, V.12, Taylor & Francis, London and New
York
ALVES, M. F., R. A. CREMONINI, et al. (2004). "A comparison of mix proportioning methods for
high-strength concrete." Cement and Concrete Composites 26(6): 613-621.
AMERICAN ASSOCIATION OF STATE HIGHWAY AND TRANSPORTATION OFFICIALS. Washington, D.C., USA
AASHTO T-277 - 07. Electrical Indication of Concrete's Ability to Resist Chloride Ion
Penetration.
AMERICAN CONCRETE INSTITUTE (ACI). Detroit, USA
ACI 201.2R - 08. Guide to durable concrete. ACI Manual of Concrete Practice, 2010,
Part 1.

Ternary Combination Concretes Using GGBS, Fly Ash & Limestone: Strength, Permeation & Durability Properties
References & Bibliography
299
ACI Committee 222R - 01. Protection of metals in concrete against corrosion. ACI
Manual of Concrete Practice, 2010, Part 1.
ACI Committee 318 - 08. Building code requirements for structural concrete. ACI
Manual of Concrete Practice, 2010, Part 3.
ACI Committee 365.1R-00: 2000. Service-life prediction-State-of-the-art report. ACI
Manual of Concrete Practice, 2010, Part 5.
AMERICAN SOCIETY FOR TESTING AND MATERIALS (ASTM). Philadelphia, USA
ASTM C1202 - 07: 2007 (Originally approved in 1991). Standard test method for
electrical indication of concretes ability to resist chloride ion penetration.
ASTM C1556 - 04: 2004 (Originally approved in 2003). Standard test method for
determining the apparent chloride diffusion coefficient of cementitious
mixtures by bulkdiffusion.
ASTM C1585 - 04: 2004. Standard test method for measurement of rate of absorption
of water by hydraulic-cement concretes.
ASTM Standard C 192: 2002. “Standard Practice for Making and Curing Concrete Test
Specimens in the Laboratory”, ASTM International, West Conshohocken, PA,
DOI: 10.1520/C0192_C0192M-07, www.astm.org
ANDRADE, C. (1993). "Calculation of chloride diffusion coefficients in concrete from ionic
migration measurements." Cement and Concrete Research 23(3): 724-742.
ALIGIZAKI, K. K. & P. D. CADY (1999). "Air content and size distribution of air voids in hardened
cement pastes using the section-analysis method." Cement and Concrete Research 29(2): 273-
280.
ALONSO & WESCHE, (1992), “Characterisation of Fly Ash”, Fly Ash in Concrete, Properties and
Performance, Wesche K (ed), RILEM Report 7, E & E FN Spon, New York
ALSHAMSI AM, ALHOSANI KL, YOUSRI KM. Hydrophobic materials, (1997) “Superplasticiser and
microsilica effects on setting of cement paste at various temperatures” Magazine
Concrete Res 49(179):11 l-5.
ALSHAMSI AM, SABOUNI AR, BUSHLAIBI AH. (1993) “Influence of set-retarding superplasticisers
and microsilica on setting times of pastes at various temperatures” Cement Concrete
Research 23:
ANTIOHOS, S. K., V. G. PAPADAKIS, et al. (2007). "Improving the performance of ternary blended
cements by mixing different types of fly ashes." Cement and Concrete Research 37(6): 877-885.
ANTIOHOS, S. K., D. PAPAGEORGIOU, et al. (2007). "Mechanical and durability characteristics of
gypsum-free blended cements incorporating sulphate-rich reject fly ash." Cement and Concrete
Composites 29(7): 550-558.

Ternary Combination Concretes Using GGBS, Fly Ash & Limestone: Strength, Permeation & Durability Properties
References & Bibliography
300
AUSTIN, S. A., P. J. ROBINS, ET al. (1992). "Influence of curing methods on the strength and
permeability of GGBFS concrete in a simulated arid climate." Cement and Concrete Composites
14(3): 157-167.
BABU, K. G., & KUMAR, V. S. (2000). “Efficiency of GGBS in concrete” Cement and Concrete
Research , 30, 1031-1036
BÁGEL, L. (1998). "Strength and pore structure of ternary blended cement mortars containing
blast furnace slag and silica fume." Cement and Concrete Research 28(7): 1011-1022.
BAI, J., S. WILD, et al. (2003). "Chloride ingress and strength loss in concrete with different PC-
PFA-MK binder compositions exposed to synthetic seawater." Cement and Concrete Research
33(3): 353-362.
BAKER, A. P., CORY, H. P., Early Hydration of Limestone-Filled Cements - in "Blended Cements in
Construction, Ed. Swamy, R. N.", 1991, pp 1-15
BAKER W. F., Korista D. S. & Novak L. C. (2007), Burj Dubai: Engineering the world’s tallest
building, The STRUCTURAL Design of Tall and Special Buildings, Vol. 16, pp. 361–375, Published
online 2 November 2007 in Wiley Interscience <http://www.interscience.wiley.com> DOI:
10.1002/tal.418.
BAMFORTH, P. B., (1999), “The water permeability of concrete and its relationship with
strength.” Magazine of Concrete Research 43: 233-241
BAMFORTH, P. B., What PFA Does to Concrete - in "The Use of PFA in Construction, Eds. Dhir, R.
K., Jones, M. R.", 1992
BARNETT , S. J., SOUTSOS, M. N., MILLARD, S. G., BUNGEY, J. H., (2006). "Strength development of
mortars containing ground granulated blast-furnace slag: Effect of curing temperature and
determination of apparent activation energies." Cement and Concrete Research 36(3): 434-440
BASHEER L, BASHEER P AM & LONG AE, (2005) “Influence of coarse aggregate on the permeation,
durability and the microstructure characteristics of ordinary Portland cement concrete.”
Construction and Building Materials 19:682–690
BCA (2008) “Sheet C1 – Embodied CO2 of concrete” <http://www.sustainableconcrete.org.uk>
BECKNELL, N. K., HALE, W. M., “Ternary concrete mixtures containing ground granulated blast
furnace slag and fly ash” in Cement Combinations for Durable Concrete, Eds. Dhir, R. K.,
Harrison, T. A., Newlands, M. D., 2005, pp 133-142
BENTZ, D P., GARBOCZI, E J., ET. AL., (1999), “Effects of Cement Particle Size Distribution on
Performance Properties of Portland Cement-Based Materials.” Cement & Concrete Research 29:
1663-1671

Ternary Combination Concretes Using GGBS, Fly Ash & Limestone: Strength, Permeation & Durability Properties
References & Bibliography
301
BENTZ D P, HANSEN KK, MADSEN H D VALLEE F & GRIESEL E J, (2001) “Drying/hydration in cement
pastes during curing” Materials & Structures 34: 557-565
BHARATKUMAR, B. H., R. NARAYANAN, et al. (2001). "Mix proportioning of high performance
concrete." Cement and Concrete Composites 23(1): 71-80.
BIER, T. A. (1987). “Influence of type of cement and curing on carbonation progress and pore
structure of hydrated cement paste.” Materials Research Society Symp. 85, Pittsburgh, Pa.
BIJEN J. (1996), Blast furnace slag cement for durable marine structures, Stichting Beton Prisma,
the Netherlands
BILIM, C., C. D. ATIS, et al. (2009). "Predicting the compressive strength of ground granulated
blast furnace slag concrete using artificial neural network." Advances in Engineering Software
40(5): 334-340.
BLESZYNSKI R., HOOTON R.D., THOMAS M.D & ROGERS C.A (2002), “Durability of ternary blend
concrete with silica fume and blast furnace slag: laboratory and outdoor exposure site studies,
ACI Materials Journal, 99 (5), 499-508
BOEL, V., DE SCHUTTER, G., (2006), “Porosity of superplasticised cement paste containing
limestone filler.” Advances in Cement Research, 18: 97-102
BONAVETTI, V., DONZA, H., et. al., (2003), “Limestone filler cement in low w/c concrete: A rational
use of energy.” Cement & Concrete Research, 33, 2003, pp 865-871
BONAVETTI, V., H. DONZA, et al. (2000). "Influence of initial curing on the properties of concrete
containing limestone blended cement." Cement and Concrete Research 30(5): 703-708.
BONAVETTI, V. L., V. F. RAHHAL, et al. (2001). "Studies on the carboaluminate formation in
limestone filler-blended cements." Cement and Concrete Research 31(6): 853-859.
BOUIKNI, A., R. N. SWAMY, et al. (2009). "Durability properties of concrete containing 50% and
65% slag." Construction and Building Materials 23(8): 2836-2845.
BOUSOUBAA, N., ZHANG, M. H., et. al., (1998), “Laboratory produced high volume fly ash blended
cements: physical properties and compressive strength of mortars.” Cement & Concrete
Research 28:1555-1569
BOUZOUBAA, N., ZHANG, M. H., et. al., (1999), “Blended fly ash cements - A review” ACI Materials
Journal 96: 641-650
BOUZOUBAA, N, BILODEAU, A., et. al., (2004) “Development of ternary blends for high-
performance concrete.” ACI Materials Journal 101: 19-29

Ternary Combination Concretes Using GGBS, Fly Ash & Limestone: Strength, Permeation & Durability Properties
References & Bibliography
302
BRANDT, A. (1995). Cement based composites: materials, properties and performance. E and
FN SPON
BRANTZ H. L. AND BEAL D. L. (1990), “Development of suitable mixes for Portland cement
concrete containing both fly-ash and granulated blast furnace slag. Concrete for the Nineties”,
International Conference on the Use of Fly Ash, Slag, Silica Fume and other Siliceous Materials in
Concrete. Concrete Institute of Australia, Australia. 3-5 September 1990. pp 21.
BRITISH RESEARCH ESTABLISHMENT (BRE, 1989), Proceedings of a seminar of the BRE/BCA/Cement
Industry Working Party, Building Research Establishment, Garston, November 1989
BRITISH STANDARDS INSTITUTION (BSI). London, UK
BS 12: 1996. Specification for Portland cement.
BS 1881-124: 1988. Testing concrete, Method for analysis of hardened concrete.
BS 1881-125: 1986. Testing concrete, Methods for mixing and sampling fresh concrete
in the laboratory.
BS 1881-208: 1996. Testing concrete, Recommendations for the determination of the
initial surface absorption of concrete.
BS 5328-1:1997. Concrete - Part 1: Guide to specifying concrete.
BS 6699: 1992. Ground granulated blastfurnace slag for use with Portland cement.
BS 7583: 1996. Specification for Portland limestone cement
BS 7979: 2001. Specification for limestone fines for use with Portland cement.
BS 8110: 1985. (Updated 1997) Structural use of concrete - Part 1. Code of practice for
design and construction.
BS 8110: 1985. Structural use of concrete - Part 2. Code of practice for special
Circumstances.
BS 8500-1: 2002. Concrete - Complementary British Standard to BS EN 206-1. Method
of specifying and guidance for the specifier (No longer current but cited in
building regulations).
BS 8500-2: 2002. Concrete - Complementary British Standard to BS EN 206-1.
Specification for constituent materials and concrete (No longer current but
cited in building regulations).
BS 8500-1: 2006. Concrete - Complementary British Standard to BS EN 206-1. Method
of specifying and guidance for the specifier.
BS 8500-2: 2006. Concrete - Complementary British Standard to BS EN 206-1.
Specification for constituent materials and concrete.
BS EN 196-1: 2005. Methods of testing cement. Determination of strength
BS EN 196-2: 2005. Methods of testing cement. Chemical analysis of cement
BS EN 196-3: 2005. Methods of testing cement. Determination of setting time and
soundness
BS EN 197-1: 2000. Cement - Part 1. Composition, specification and conformity criteria
for common cements

Ternary Combination Concretes Using GGBS, Fly Ash & Limestone: Strength, Permeation & Durability Properties
References & Bibliography
303
BS EN 206-1: 2000. Concrete - Part 1: Specification, performance, production and
conformity
BS EN 450-1: 2005. Fly ash for concrete. Definition, specifications and conformity
criteria
BS EN 933-1: 1997. Test for geometrical properties of aggregates. Determination of
particle shape - Sieving method.
BS EN 933-3: 1997. Test for geometrical properties of aggregates. Determination of
particle shape. Flakiness index.
BS EN 933-4: 2001. Test for geometrical properties of aggregates. Determination of
particle shape - Shape index.
BS EN 933-6: 2001. Test for geometrical properties of aggregates. Determination of
particle shape - Flakiness index.
BS EN 934-1: 2008. Admixtures for concrete, mortar and grout. Common requirements.
BS EN 1008: 2002. Mixing water for concrete - Specification for sampling, testing and
assessing the suitability of water, including water recovered from processes in
the concrete industry, as mixing water for concrete.
BS EN 1097-3: 1998. Tests for mechanical and physical properties of aggregates.
Determination of loose bulk density and voids.
BS EN 1097-6: 2000. Tests for mechanical and physical properties of aggregates.
Determination of particle density and water absorption.
BS EN 1990:2002 +A1:2005. Eurocode - Basis of structural design.
BS EN 1992-1-1:2004. Eurocode 2: Design of concrete structures - Part 1-1: General
rules and rules for buildings.
BS EN 12350-2: 2009. Testing fresh concrete - Part 2: Slump test.
BS EN 12350-6: 2009. Testing fresh concrete - Part 6: Density test.
BS EN 12390-1: 2000. Testing hardened concrete - Part 1: Shape, dimensions and other
requirements for specimens and moulds.
BS EN 12390-2: 2000. Testing hardened concrete - Part 2: Making and curing specimens
for strength tests.
BS EN 12390-3: 2002. Testing hardened concrete - Part 3: Compressive strength of test
specimens.
BS EN 12620: 2002. Aggregates for concrete.
BS EN 13055-1: 2002. Lightweight aggregates for concrete, mortar and grout.
BS EN 13263-1 and 2: 2005. Silica fume for concrete.
BS EN 15167-1: 2006. Ground granulated blastfurnace slag for use in concrete, mortar
and grout - definitions, specifications and conformity criteria.
BS ISO 5725-1: 1994. Accuracy (truness and precision) of measurement methods and
results - Part 1. General principles and definitions.
BS ISO 5725-2: 1994. Accuracy (truness and precision) of measurement methods and
results - Part 2. Basic method for the determination of repeatability and
reproducibility of a standard measurement method.

Ternary Combination Concretes Using GGBS, Fly Ash & Limestone: Strength, Permeation & Durability Properties
References & Bibliography
304
BS ISO 5725-4: 1994. Accuracy (truness and precision) of measurement methods and
results - Part 4. Basic methods for the determination of the truness of a
standard measurement method.
CP 110:1972 (revised 1977). Code of practice for the structural use of concrete.
CP 114: 1957. The structural use of reinforced concrete in buildings.
BROOKBANKS P (1989), “Properties of fresh concrete” Proceedings of BRE/BCA seminar,
Performance of limestone filled cements, Garston 4.1-4.15
BROOKS, J. J., M. A. MEGAT JOHARI, et al. (2000). "Effect of admixtures on the setting times of
high-strength concrete." Cement and Concrete Composites 22(4): 293-301.
BUKKI R (1986) “Additives and blended cements from an industrial point of view: A special
report” The International Congress on Cement Chemistry, Rio de Janerio, Brasil, 1986
CAMPBELL A D & & ROPER H (1996), Concrete Structures: Materials, Maintenance and Repair,
Longman Scientific & Technical Co, London
CARÉ, S. (2008). "Effect of temperature on porosity and on chloride diffusion in cement pastes."
Construction and Building Materials 22(7): 1560-1573.
CARRASCO, M. F., G. MENÉNDEZ, et al. (2005). "Strength optimization of "tailor-made cement"
with limestone filler and blast furnace slag." Cement and Concrete Research 35(7): 1324-1331.
CEMBUREAU, (2010) CEMBUREAU, Brussels, accessed 5th July 2011,
<http://www.cembureau.be/sites/default/files/worldproduction2010.pdf>
CEMENT HISTORY, accessed 5th May 2011,
<http://www.understanding-cement.com/hostory.html>
CHANG, C.-F. & J.-W. CHEN (2006). "The experimental investigation of concrete carbonation
depth." Cement and Concrete Research 36(9): 1760-1767.
CHANG, P.-K. (2004). "An approach to optimizing mix design for properties of high-performance
concrete." Cement and Concrete Research 34(4): 623-629.
CHEN, C., G. HABERT, et al. (2010). "Environmental impact of cement production: detail of the
different processes and cement plant variability evaluation." Journal of Cleaner Production
18(5): 478-485.
CHEN C, HABERTA G, BOUZIDIB Y, JULLIEN A, VENTURAC A (2010). “LCA allocation procedure used as an
incitative method for waste recycling: An application to mineral additions in concrete”
Resources, Conservation and Recycling 54 (2010) 1231–1240

Ternary Combination Concretes Using GGBS, Fly Ash & Limestone: Strength, Permeation & Durability Properties
References & Bibliography
305
CHENG, A., R. HUANG, et al. (2005). "Influence of GGBS on durability and corrosion behavior of
reinforced concrete." Materials Chemistry and Physics 93(2-3): 404-411.
CHERN, J.-C. & CHAN, Y.-W., (1989) “Deformations of Concrete Made with Blast-Furnace Slag
Cement and Ordinary Portland Cement,” ACI Materials Journal, 86(4): 872-382.
CHINDAPRASIRT, P., S. HATANAKA, et al. (2008). "Cement paste characteristics and porous concrete
properties." Construction and Building Materials 22(5): 894-901.
CHINDAPRASIRT, P., S. HATANAKA, et al. (2009). "Effects of binder strength and aggregate size on
the compressive strength and void ratio of porous concrete." International Journal of Minerals,
Metallurgy and Materials 16(6): 714-719.
CHINDAPRASIRT, P., C. JATURAPITAKKUL, et al. (2005). "Effect of fly ash fineness on compressive
strength and pore size of blended cement paste." Cement and Concrete Composites 27(4): 425-
428.
CIRIA (2004) “Formwork Striking Times—criteria, prediction and methods of assessment” CIRIA
Report 136
CLAISSE, P A ELSAYAD H I & SHAABAN I G (1999) “Permeability and Pore Volume of Carbonated
Concrete” ACI materials Journal. Vol 96 No.3 May 99 pp.378-381
COOK, R. A. & HOVER, K. C., (1999), “Mercury porosimetry of hardened cement pastes.” Cement
& Concrete Research 29: 933-943
Concrete Experts International, (2006) Carbonation of Concrete http://www.concrete-
experts.com/pages/carb.htm (Accessed 1/05/2012)
CONCRETE SOCIETY (1991), The use of GGBS and PFA in concrete, Technical Report No. 40, ISBN 0
946691 40.1, The Concrete Society
CUI, L. & J. H. CAHYADI (2001). "Permeability & pore structure of OPC paste." Cement and
Concrete Research 31(2): 277-282.
CURRAN M A, (1996). Environmental Life-cycle assessment, McGraw-Hill, London
CYR, M., P. LAWRENCE, ET AL. (2006). "Efficiency of mineral admixtures in mortars: Quantification
of the physical and chemical effects of fine admixtures in relation with compressive strength."
Cement and Concrete Research 36(2): 264-277.
DAMINELI, B. L., F. M. KEMEID, et al. (2010). "Measuring the eco-efficiency of cement use."
Cement and Concrete Composites 32(8): 555-562.
DAMTOFT, J. S., J. LUKASIK, et al. (2008). "Sustainable development and climate change
initiatives." Cement and Concrete Research 38(2): 115-127.

Ternary Combination Concretes Using GGBS, Fly Ash & Limestone: Strength, Permeation & Durability Properties
References & Bibliography
306
DAVIDOVITS J, (2004) Up to 80% reduction of CO2 greenhouse gas emission during cement
manufacture, Geoplayer Institute, <http://www.geoplayer.org/library
DAVIDSON, C. I., C. T. HENDRICKSON, et al. (2010). "Preparing future engineers for challenges of the
21st century: Sustainable engineering." Journal of Cleaner Production 18(7): 698-701.
DAY K W (1999), Concrete mix design, quality control and specification, 2nd Edition, E & FN spon
DE LARRARD, F., SEDRAN, T., (1994), “Optimization of ultra-high-performence Concrete by the use
of a Packing Model” Cement & Concrete Research 24: 997-1009
DEHGHANIAN, CHANGIZ, ARJEMANDI, MOSIEB, (1997) “Influence of Slag Blended Cement Concrete
on Chloride Diffusion Rate” Cement & Concrete Research 27: 937-945
DEMIRBOGA, R. (2007). "Thermal conductivity and compressive strength of concrete
incorporation with mineral admixtures." Building and Environment 42(7): 2467-2471.
DEQUIEDT, A.-S., M. COSTER, et al. "Distances between air-voids in concrete by automatic
methods." Cement and Concrete Composites 23(2-3): 247-254.
DETWEILER R J, BHATTY J I & BHATTACHARJA S (1996). Supplementary Cementing Materials for Use in
Blended Cements, PCA, USA
DEWAR, J. D., Computer Modelling of Concrete Mixtures, 1999
DE WEERDT, K., M. B. HAHA, et al. (2011). "Hydration mechanisms of ternary Portland cements
containing limestone powder and fly ash." Cement and Concrete Research 41(3): 279-291
DHIR R. K., HEWLETT P. C. & CHAN Y. N (1989a), “Near surface characteristics of concrete: intrinsic
permeability”. Magazine of Concrete Research, Vol. 41, pp. 87–97.
DHIR R. K., HEWLETT P. C. & CHAN Y. N. (1989b), “Near surface characteristics of concrete:
prediction of carbonation resistance”. Magazine of Concrete Research, Vol. 41, pp. 122–128.
DHIR, R. K., BYARS, E. A.,(1991) “ PFA Concrete: Near Surface Absorption Properties” Magazine of
Concrete Research 43: 219-232
DHIR, R. K., BYARS, (1993) “PFA concrete: intrinsic permeability” ACI Materials Journal, 90: 571-
580
DHIR, R. K., M. A. K. EL-MOHR, et al. (1996). "Chloride binding in GGBS concrete." Cement and
Concrete Research 26(12): 1767-1773.
DHIR, R. K., HEWLETT, P. C., et. al., (1994),Estimating the Durability of Concrete in Structures,
Concrete,

Ternary Combination Concretes Using GGBS, Fly Ash & Limestone: Strength, Permeation & Durability Properties
References & Bibliography
307
DHIR, R. K., HEWLETT, P. C., et. al., (1995), “A new technique for measuring the air permeability
of near-surface concrete” Magazine of Concrete Research 47: 167-176
DHIR, R. K., P. C. HEWLETT, et al. (1999). "Chemical profiles of cement pastes exposed to a
chloride solution spray." Cement and Concrete Research 29(5): 667-672.
DHIR, R. K., SHAABAN, I. G., et. al.,(1993), Preconditioning in situ concrete for permeation testing
- Part 1: Initial surface absorption”, Magazine of Concrete Research 45: 113-118
DIAMOND, S. (2000). "Mercury porosimetry: An inappropriate method for the measurement of
pore size distributions in cement-based materials." Cement and Concrete Research 30(10):
1517-1525
DIAS, W. P. S., (2004) “Influence of drying on concrete sorptivity” Magazine of Concrete
Research 56:537-543
DOMONE, P. L. (2006). "Self-compacting concrete: An analysis of 11 years of case studies."
Cement and Concrete Composites 28(2): 197-208.
DOUGLAS, E. & G. POUSKOULELI (1991). "Prediction of compressive strength of mortars made with
portland cement - blast-furnace slag - fly ash blends." Cement and Concrete Research 21(4):
523-534.
DUCHESNE, J. & M. A. BÉRUBÉ (1994). "The effectiveness of supplementary cementing materials in
suppressing expansion due to ASR: Another look at the reaction mechanisms part 2: Pore
solution chemistry." Cement and Concrete Research 24(2): 221-230.
ECOBA, 2011, <http://www.ecoba.com/ecobaccpprod.html>
ELAHI, A., P. A. M. BASHEER, et al. (2010). "Mechanical and durability properties of high
performance concretes containing supplementary cementitious materials." Construction and
Building Materials 24(3): 292-299.
ELKEM MATERIALS LTD (1994), Technical Note, March 1994
ELKEM (2001) http://www.materials.elkem.com/dav/b773e7d942.pdf
EREN 0, BROOKS JJ, CELIK T. (1995) “Setting of fly ash and slag-cement concrete as affected by
curing temperature” Cement, Concrete, and Aggregates 17(1):1-7
ERDEM, T. K. & Ö. KIRCA (2008). "Use of binary and ternary blends in high strength concrete."
Construction and Building Materials 22(7): 1477-1483.
ESCALANTE-GARCIA, J. I., SHARP, J. H., (2004) “The microstructure and Mechanical properties of
blended cements hydrated at temperatures” Cement & Concrete Research 31: 695-702

Ternary Combination Concretes Using GGBS, Fly Ash & Limestone: Strength, Permeation & Durability Properties
References & Bibliography
308
ESCALANTE-GARCIA, J. I. & J. H. SHARP (2004). "The chemical composition and microstructure of
hydration products in blended cements." Cement and Concrete Composites 26(8): 967-976.
EUROPEAN UNION. (2008) Directive 2008/98/EC of the European parliament and of the council on
waste and repealing certain directives. Off J Eur Union 2008; L312:3–30.
FABBRI, A., J. CORVISIER, et al. (2009). "Effect of carbonation on the hydro-mechanical properties
of Portland cements." Cement and Concrete Research 39(12): 1156-1163.
FELDMAN, R. F. & J. J. BEAUDOIN (1976). "Microstructure and strength of hydrated cement."
Cement and Concrete Research 6(3): 389-400.
FERRARIS, C. F., K. H. OBLA, et al. (2001). "The influence of mineral admixtures on the rheology of
cement paste and concrete." Cement and Concrete Research 31(2): 245-255.
FLOWER D J M & SANJAYAN J G (2007). “Green house gas emissions due to concrete manufacture.”
Int J LCA, 12 (5): 282-288
FRAAY A.L.A., BIJEN J.M. & DE HAAN Y., (1989) “The reaction of fly ash in concrete: a critical
examination”, Cement & Concrete Research, 19 (2):235-46
FRANCIS A. J., (1977) The Cement Industry 1796-1914: A History, David & Charles, London
FULTON F S, (1974), “The properties of Portland cement containing milled ground granulated
blast furnace slag”, Portland Cement Institute, Johannesburg, South Africa
GALLIAS J L, KARA-ALI R & BIGAS J P, (2000) “The effect of fine material admixtures on water
requirements of cement paste” Cement & Concrete Research, 30: 1543-1549
GANESH BABU, K. & G. SIVA NAGESWARA RAO (1996). "Efficiency of fly ash in concrete with age."
Cement and Concrete Research 26(3): 465-474.
GANESH BABU, K. & V. SREE RAMA KUMAR (2000). "Efficiency of GGBS in concrete." Cement and
Concrete Research 30(7): 1031-1036.
GANJIAN, E. & H. S. POUYA (2009). "The effect of Persian Gulf tidal zone exposure on durability of
mixes containing silica fume and blast furnace slag." Construction and Building Materials 23(2):
644-652.
GAO, J. M., C. X. QIAN, et al. (2005). "ITZ microstructure of concrete containing GGBS." Cement
and Concrete Research 35(7): 1299-1304.
GARBOCZI E J, (1990), “Permeability, diffusivity and microstructural parameters: A critical
review” Cement and Concrete Research 20 (4): 503–514.

Ternary Combination Concretes Using GGBS, Fly Ash & Limestone: Strength, Permeation & Durability Properties
References & Bibliography
309
GARBOCZI, E. J. & D. P. BENTZ (1996). "Modelling of the microstructure and transport properties
of concrete." Construction and Building Materials 10(5): 293-300.
GARCI JUENGER, M. C. & H. M. JENNINGS (2001). "The use of nitrogen adsorption to assess the
microstructure of cement paste." Cement and Concrete Research 31(6): 883-892.
GARTNER, E. (2004). "Industrially interesting approaches to "low-CO2" cements." Cement and
Concrete Research 34(9): 1489-1498.
GESOGLU, M., E. GÜNEYISI, et al. (2009). "Properties of self-compacting concretes made with
binary, ternary, and quaternary cementitious blends of fly ash, blast furnace slag, and silica
fume." Construction and Building Materials 23(5): 1847-1854.
GHRICI, M., S. KENAI, et al. (2007). "Mechanical properties and durability of mortar and concrete
containing natural pozzolana and limestone blended cements." Cement and Concrete
Composites 29(7): 542-549.
GIERGICZNY, Z., M. A. GLINICKI, et al. (2009). "Air void system and frost-salt scaling of concrete
containing slag-blended cement." Construction and Building Materials 23(6): 2451-2456.
GOGGINS, J., T. KEANE, et al. (2010). "The assessment of embodied energy in typical reinforced
concrete building structures in Ireland." Energy and Buildings 42(5): 735-744.
GONEN T & YAZICIOGLU S. (2007), The influence of mineral admixtures on the short and long-term
performance of concrete. Building and Environment, Vol. 42, pp. 3080–3085.
GONNERMAN H F & LERCH W (1951) “Changes in characteristics of Portland cement as exhibited
in laboratory tests over the period 1904 to 1950” ASTM Sp Tech Pub No 127
GOLTERMANN, P., JOHANSEN, V., PALBOL, L., (1997), “Packing of Aggregate: An Alternative Tool to
Determine the Optimal Aggregate Mix” ACI Materials Journal, 94: 435-443
GOWRIPALAN, N. & H. M. MOHAMED (1998). "Chloride-ion induced corrosion of galvanized and
ordinary steel reinforcement in high-performance concrete." Cement and Concrete Research
28(8): 1119-1131.
GRATTAN-BELLEW, P. E. (1996). "Microstructural investigation of deteriorated Portland cement
concretes." Construction and Building Materials 10(1): 3-16.
GUEMMADI, Z., ESCADEILLAS, G., et. al., Influence of limestone fillers on the mechanical
performances of cement pastes - in "Cement Combinations for Durable Concrete, Eds. Dhir, R.
K., Harrison, T. A., Newlands, M. D.", 2005, pp 339-350

Ternary Combination Concretes Using GGBS, Fly Ash & Limestone: Strength, Permeation & Durability Properties
References & Bibliography
310
HALE M., RUSSELL B. & BUSH T., (2002) “An assessment of the rapid chloride ion penetrability
test”, in Proceedings of the International Conference on concrete for extreme conditions,
Scotland, University of Dundee, p 447-56
HALL C., (1977) “Water movement in porous buildings materials: 1. Unsaturated flow theory and
its applications” Build. Environ. 12 (1): 117–125.
HALL C., (1989) “Water sorptivity of mortars and concretes: A review”, Magazine of Concrete
Research, 41(147): 51-61
HABERT G, (2012) “A method for allocation according to the economic behaviour in the EU-ETS
for by-products used in cement industry” Int J Life Cycle Assess DOI 10.1007/s11367-012-0464-1
HANEHARA, S., F. TOMOSAWA, et al. (2001). "Effects of water/powder ratio, mixing ratio of fly ash,
and curing temperature on pozzolanic reaction of fly ash in cement paste." Cement and
Concrete Research 31(1): 31-39.
HANSON (2010), <http://www.heidelbergcement.com/uk/en/hanson>
HANZIC, L., L. KOSEC, et al. (2010). "Capillary absorption in concrete and the Lucas-Washburn
equation." Cement and Concrete Composites 32(1): 84-91.
HANZIC, L., ILIC, R., (2003) “Relationship Between Liquid Sorptivity and Capillarity in Concrete”
Cement & Concrete Research, 33: 1385-1388
HAQUE, M. N. & T. CHULILUNG (1990). "Strength development of slag and ternary blend
concrete." Cement and Concrete Research 20(1): 120-130.
HASSAN, K. E., J. G. CABRERA, et al. (2000). "The effect of mineral admixtures on the properties of
high-performance concrete." Cement and Concrete Composites 22(4): 267-271.
HENDRIKS C A, WORRELL D, DEJAGER A, BLOK K & RIEMER P, (2004). “Emission reduction of
greenhouse gases from the cement industry.” accessed 23rd August 2009,
<http://www.ieagreen.org.uk/prghgt42.htm>
HEIKAL, M., EL-DIDAMONY, H., MORSY, M., (2000) “Limestone-filled pozzolanic cement” Cement &
Concrete Research, 30: 1827-1834
HEWLETT P.C., (1998) Lea’s Chemistry of cement and Concrete: 4th Edition, Edmundsbury Press
Ltd, London
HILL D., (1984) A History of Engineering in Classical & Medieval Times, Routledge, London
HIGGINS, D. D. (2003). "Increased sulfate resistance of ggbs concrete in the presence of
carbonate." Cement and Concrete Composites 25(8): 913-919

Ternary Combination Concretes Using GGBS, Fly Ash & Limestone: Strength, Permeation & Durability Properties
References & Bibliography
311
HIGGINS, D. D. (2007). “GGBS and sustainability”, Proceedings of the Institute of Civil Engineers,
Conctrucion Materials, 160 (3): 99-101
HIGGINS, D. D. (2011) Private communication on 8th August 2011
HINCZAK I. ROPER, H. & SOUTH, W. (1992), “Ternary and quaternary cement systems: some
engineering properties. Fourth CANMET/ACI International Conference on the Use of FlyAsh,
Silica Fume, Slag and Natural Pozzolanas in Concrete”, Supplementary Papers, Istanbul, Turkey,
pp. 33–44.
HINCZAK I. & ROPER H. (1990), “Ternary cements: short and long term properties. Concrete for
the Nineties, International Conference on the Use of Fly-Ash, Slag, Silica Fume and other
Siliceous Materials in Concrete”, Concrete Institute of Australia, Australia, 3-5 September 1990,
pp 1–17.
HOBBS, D. W. (1999). "Aggregate influence on chloride ion diffusion into concrete." Cement and
Concrete Research 29(12): 1995-1998.
HOGAN F J & MEUSEL J W, (1991) “Evaluation for durability and strength development of ground
granulated blast furnace slag” Cement & Concrete Aggregates, 1( 3): 40-52
HOOTON, R. D., Permeability and Pore Structure of Cement Pastes Containing Fly Ash, Slag and
Silica Fume - in ASTM STP 897 "Blended Cements, Ed. Frohnsdorff, G.", 1984, pp 128-143
HOOTON R. D. & TITHERINGTON M. P. (2004), Chloride resistance of high-performance concretes
subjected to accelerated curing, Cement and Concrete Research, Vol. 34, pp. 1561–1567
HORNAIN, H., J. MARCHAND, et al. (1995). "Diffusion of chloride ions in limestone filler blended
cement pastes and mortars." Cement and Concrete Research 25(8): 1667-1678.
HORIGUCHi K, (1994). “The rate of carbonation in concrete made with blended cement, in
Durability of Concrete, ACI SP-145, pp917-31
HSE (2002), Cement, HSE, Caerphilly, accessed 5th May 2011
<http:/www.hse.gov.uk/pubns/cis26.pdf>
HUMPHREYS K, MAHASENAN M (2002),Toward a sustainable concrete industry. Substudy 8, climate
change, World Business Council for Sustainable Development.
HUNTZINGER, D. N. & T. D. EATMON (2009). "A life-cycle assessment of Portland cement
manufacturing: comparing the traditional process with alternative technologies." Journal of
Cleaner Production 17(7): 668-675.
HWANG C & LIN C, (1986), “Strength development of blended blast furnace slag cement
mortars”, ACI SP-91: 1323-1340

Ternary Combination Concretes Using GGBS, Fly Ash & Limestone: Strength, Permeation & Durability Properties
References & Bibliography
312
HWANG C.L., J.J. LIU, L.S. LEE, F.Y. LIN, (1996) “Densified mixture design algorithm and early
properties of high performance concrete”, J. Chin.Inst. Civil Hydrol. Eng. 8 (2): 217 – 229
IGARASHI, S., WATANABE, A., (2005), “Kawamura, M., Evaluation of capillary pore size
characteristics in high-strength concrete at early ages” Cement & Concrete Research, 35: 513-
519
INGRAM K. D. & DAUGHERTY K. E. (1991), A review of limestone additions to Portland cement and
concrete. Cement and Concrete Composites, Vol. 13, pp. 165–170
IRASSAR, E. F. (2009). "Sulfate attack on cementitious materials containing limestone filler -- A
review." Cement and Concrete Research 39(3): 241-254.
ISO (2006) Environmental management—life cycle assessment—principles and framework; ISO
14040. International Standardisation Organisation
JATURAPITAKKUL, C., K. KIATTIKOMOL, et al. (2004). "Use of ground coarse fly ash as a replacement
of condensed silica fume in producing high-strength concrete." Cement and Concrete Research
34(4): 549-555.
JAU, W. C. & D. S. TSAY (1998). "A study of the basic engineering properties of slag cement
concrete and its resistance to seawater corrosion." Cement and Concrete Research 28(10):
1363-1371.
JENNINGS, H. M., THOMAS, J. J., et. al., (2007), “A multi-technique investigation of the
nanoporosity of cement paste” Cement & Concrete Research, 37: 329-336
JI, T., T. LIN, et al. (2006). "A concrete mix proportion design algorithm based on artificial neural
networks." Cement and Concrete Research 36(7): 1399-1408.
JI, TAO, (2005),”Preliminary study on the water permeability and microstructure of concrete
incorporating nano-SiO2”, Cement & Concrete Research, 35: 1943-1947
JOHANSEN, V., ANDERSEN, P. J., Particle Packing and Concrete Properties - in "Materials Science of
Concrete, Vol. 2, Ed. Skalny, J. P.", 1990, pp 111-147
JONES, M. R., MAGEE, B. J., (2002), “A Mix Constituent Proportioning Method for Concrete
Containing Ternary Combinations of Cements” Magazine of Concrete Research, 54: 125-139
JONES, M. R., DHIR, R. K., MAGEE, B. J., (1997), “Concrete Containing Ternary Blended Binders:
Resistance to Chloride Ingress and Carbonation” Cement & Concrete Research, 27: 825-831
JONES, M. R. & A. MCCARTHY (2006). "Heat of hydration in foamed concrete: Effect of mix
constituents and plastic density." Cement and Concrete Research 36(6): 1032-1041.

Ternary Combination Concretes Using GGBS, Fly Ash & Limestone: Strength, Permeation & Durability Properties
References & Bibliography
313
JONES M R, ZHENG L & NEWLANDS M D, (2003), “Estimation of the filler content required to
minimise voids ratio in concrete” Magazine of Concrete Research, 55 (4): 193-202
JONES M R, ZHENG L & NEWLANDS M D, (2002) “Comparison of particle packing models for
proportioning concrete constituents for minimum voids ratio” Materials & Structures,
35(6):301-309
JONS, E. S. & B. OSBAECK (1982). "The effect of cement composition on strength described by a
strength-porosity model." Cement and Concrete Research 12(2): 167-178.
JOSA, A., A. AGUADO, et al. (2007). "Comparative analysis of the life cycle impact assessment of
available cement inventories in the EU." Cement and Concrete Research 37(5): 781-788.
JUENGER, M. C. G., F. WINNEFELD, et al. (2011) "Advances in alternative cementitious binders."
Cement and Concrete Research In Press, Corrected Proof.
JUN-YUAN ET AL.(1984), "Hydration of Fly Ash-Portland Cements", Cement & Concrete research,
14, pp. 505-512
KADRI E H & DUVAL R, (2002). “Effect of ultrafine particles on heart of hydration of cement
mortars.” ACI Materials Journal 99 (2): 138-142
KAUFMANN, J., F. WINNEFELD, et al. (2004). "Effect of the addition of ultrafine cement and short
fiber reinforcement on shrinkage, rheological and mechanical properties of Portland cement
pastes." Cement and Concrete Composites 26(5): 541-549.
KHEDR SA, ABOU-ZEID MN. U, (1994) “Characteristics of silica-fume concrete” J Mater Civil
Eng 6(3):357-75.
KHAN, M. I., C. J. LYNSDALE, et al. (2000). "Porosity and strength of PFA/SF/OPC ternary blended
paste." Cement and Concrete Research 30(8): 1225-1229
KHAN, M. I. & C. J. LYNSDALE (2002). "Strength, permeability, and carbonation of high-
performance concrete." Cement and Concrete Research 32(1): 123-131.
KHATIB, J. M. & J. J. HIBBERT (2005). "Selected engineering properties of concrete incorporating
slag and metakaolin." Construction and Building Materials 19(6): 460-472.
KHAYAT, K. H., AITCIN, P. C., Silica Fume - A Unique Supplementary Cementitious Material - in
"Mineral Admixtures in Cement and Concrete, Ed. Ghosh, S. N.", 1993, pp 227-265
Kokobu M & Nagataki S (1989( Carbonation of concrete with fly ash and corrosion of
reinforcements in 20 years Tests”, Fly Ash, Silica Fume, Slag and Natural Pozzolans in Concrete,
ACI SP-114: 315-329

Ternary Combination Concretes Using GGBS, Fly Ash & Limestone: Strength, Permeation & Durability Properties
References & Bibliography
314
KONSTA-GDOUTOS, M. S. & S. P. SHAH (2003). "Hydration and properties of novel blended
cements based on cement kiln dust and blast furnace slag." Cement and Concrete Research
33(8): 1269-1276.
KORPA, A. & R. TRETTIN (2006). "The influence of different drying methods on cement paste
microstructures as reflected by gas adsorption: Comparison between freeze-drying (F-drying),
D-drying, P-drying and oven-drying methods." Cement and Concrete Research 36(4): 634-649.
KOUROUNIS, S., S. Tsivilis, et al. (2007). "Properties and hydration of blended cements with
steelmaking slag." Cement and Concrete Research 37(6): 815-822.
KOVLER, K. & N. ROUSSEL (2011), "Properties of fresh and hardened concrete." Cement and
Concrete Research In Press, Corrected Proof.
KUMAR R & BHATTACHARJEE ,(2002) “ Correlation between initial surface absorption rate of water
and in-situ strength of concrete” Indian Concrete Journal 76 (4): 231–235
KUMAR, R. & B. BHATTACHARJEE (2003). "Porosity, pore size distribution and in situ strength of
concrete." Cement and Concrete Research 33(1): 155-164.
KUMAR, R. & B. BHATTACHARJEE (2003). "Study on some factors affecting the results in the use of
MIP method in concrete research." Cement and Concrete Research 33(3): 417-424.
KUMAR, R. & B. BHATTACHARJEE (2004). "Assessment of permeation quality of concrete through
mercury intrusion porosimetry." Cement and Concrete Research 34(2): 321-328.
KWAN A K H & MORA C F, (2001). “Effects of various shape parameters on packing of aggregate
particles.” Magazine of Concrete Research, 53 (2): 91-100
LACHEMI, M., K. M. A. HOSSAIN, et al. (2004). "Performance of new viscosity modifying admixtures
in enhancing the rheological properties of cement paste." Cement and Concrete Research 34(2):
185-193.
Laldji S & Tagnit-Hamou A, (2006), “Properties of Ternary and Quaternary Concrete
Incorporating New Alternative Cementitious Material”, ACI Materials Journal, 103 (2): 83-89
LANE D. S. & OZYILDIRIM C. (1999), Preventive measures for alkali-silica reactions (binary and
ternary systems), Cement and Concrete Research, Vol. 29, pp. 1281–1288.
LANGE, F., H. MÖRTEL, et al. (1997). "Dense packing of cement pastes and resulting consequences
on mortar properties." Cement and Concrete Research 27(10): 1481-1488.
LEE, K.-M. & P.-J. PARK (2005). "Estimation of the environmental credit for the recycling of
granulated blast furnace slag based on LCA." Resources, Conservation and Recycling 44(2): 139-
151.

Ternary Combination Concretes Using GGBS, Fly Ash & Limestone: Strength, Permeation & Durability Properties
References & Bibliography
315
LEE, T.-C., W.-J. WANG, ET AL. (2009). "Enhancement in early strengths of slag-cement mortars by
adjusting basicity of the slag prepared from fly-ash of MSWI." Cement and Concrete Research
39(8): 651-658.
LI, D., SHEN, J., et. al., (2000) “Study of properties on fly ash-slag complex cement” Cement &
Concrete Research, 30: 1381-1387
LI, G. & X. ZHAO (2003). "Properties of concrete incorporating fly ash and ground granulated
blast-furnace slag." Cement and Concrete Composites 25(3): 293-299.
LIM, C.-H., Y.-S. YOON, et al. (2004). "Genetic algorithm in mix proportioning of high-
performance concrete." Cement and Concrete Research 34(3): 409-420.
LIVESEY, P. (1991). "Strength characteristics of Portland-limestone cements." Construction and
Building Materials 5(3): 147-150.
LOCKINGTON, D., LEECH, G., et. al., The sorptivity test and predicting resistance to water
absorption in concrete - in "Innovations and Developments in Concrete Materials and
Construction, Eds. Dhir, R. K. et. al.", 2002, pp 315-324
LONG G C, WANG X Y & XIE XJ (2002) “the influences of mineral admixtures on the packing of
properties of fresh pastes”, Journal of Building Materials, 25(7): 1501-1511
LONG, G. CH., XIE, Y. J., JIANG, Z. W., (2005) “Efficiency of fly ash in cementitious materials”
Advances in Cement Research, 17: 113-119
LONG G, WANG X Y, XIAO R & XIE Y, (2005) “The influences of ultra-fine powders on the
compatibility of cement & superplasticiser with very low water/binder ratio”, Advances in
Cement Research,17: 113-119
LOOTENS, D., P. JOUSSET, ET al. (2009). "Yield stress during setting of cement pastes from
penetration tests." Cement and Concrete Research 39(5): 401-408.
LUO, R., Y. CAI, et al. (2003). "Study of chloride binding and diffusion in GGBS concrete." Cement
and Concrete Research 33(1): 1-7.
MAGAROTTO, R., MORATTI, F., ZEMINIAN, N., Characterisation of limestone and fly ash for a rational
use in concrete - in "Cement Combinations for Durable Concrete, Eds. Dhir, R. K., Harrison, T.
A., Newlands, M. D.", 2005, pp 71-80
MATSCHEI, T., B. LOTHENBACH, et al. (2007). "The role of calcium carbonate in cement hydration."
Cement and Concrete Research 37(4): 551-558.
MASSAZZA F, (1987) “The role of additions to cement in the concrete durability”, Cementos, 84,
(4), 359

Ternary Combination Concretes Using GGBS, Fly Ash & Limestone: Strength, Permeation & Durability Properties
References & Bibliography
316
MCCARTHY, M. J., DHIR, R. K., Towards maximising the use of fly ash as a binder, Fuel, 78, 1999,
pp 121-132
MCCARTHY, M. J., P. A. J. TITTLE, et al. (2001). "Mix proportioning and engineering properties of
conditioned PFA concrete." Cement and Concrete Research 31(2): 321-326.
MCLEOD R.S., (2005). “Ordinary Portland Cement: with extraordinary high Co2 emission”
accessed 23rd September 2005, <http://www.newbuilder.co.uk/bffmag>
MCPOLIN, D., P. A. M. BASHEER, et al. (2005). "Obtaining progressive chloride profiles in
cementitious materials." Construction and Building Materials 19(9): 666-673.
MECHLING, J.-M., A. LECOMTE, et al. (2009). "Relation between cement composition and
compressive strength of pure pastes." Cement and Concrete Composites 31(4): 255-262.
MEGAT JOHARI, M. A., J. J. BROOKS, et al. (2011). "Influence of supplementary cementitious
materials on engineering properties of high strength concrete." Construction and Building
Materials 25(5): 2639-2648.
MEGAT JOHARI, M. A., J. J. BROOKS, et al. (2011). "Influence of supplementary cementitious
materials on engineering properties of high strength concrete." Construction and Building
Materials 25(5): 2639-2648.
MEHTA, P K. (1983), Pozzolanic and cementitious by-products as mineral admixtures for
concrete - a critical review. In: Malhotra, V M (Ed). Fly ash, silica fume, slag and other mineral
by-products in concrete. ACI SP-79, Detroit.
MEHTA, P K. (1986), “Effect of fly ash composition on sulfate resistance of concrete” Journal of
the American Concrete Institute, (6): 994-1000
MEHTA, P. K., MONTEIRO, PAULO J. M.,2006, Concrete: Microstructure, Properties and Materials,
McGraw-Hill, London
MEJIA, R., DELVASTO, S., et. al., (2003) “Chloride Diffusion Measured by a Modified Permeability
Test in Normal and Blended Cements” Advances in Cement Research, 15, 2003, pp 113-118
MENADI, B., S. KENAI, et al. (2009). "Strength and durability of concrete incorporating crushed
limestone sand." Construction and Building Materials 23(2): 625-633.
MENENDEZ, G., BONAVETTI, V., IRASSAR, E., (2003) “Strength development of ternary blended
cement with limestone filler and blast-furnace slag” Cement and Concrete Composites, 25: 61-
67

Ternary Combination Concretes Using GGBS, Fly Ash & Limestone: Strength, Permeation & Durability Properties
References & Bibliography
317
MEUSEL J W & ROSE J H, (1983), “ Production of granulated blastfurnace slag at Sparrows Point,
and workability and strength potential of concrete incorporating the slag” Fly Ash, Silica Fume
& Other Mineral By-products in Concrete, ACI SP-79: 867-890
MILLER, E. W. (1993). "Blended cements--Applications and implications." Cement and Concrete
Composites 15(4): 237-245.
MINDESS S., YOUNG F. J. & DARWIN D. (2003), CONCRETE, 2ND ED., PRENTICE-HALL
MIURA T & IWAKI I, (2000) “Strength development of concrete incorporating high levels of
ground granulated blast furnace slag at low temperatures”, ACI Material Journal, 97 (1), 66-70
MOHR, P., HANSEN, W., et. al., (2000) “Transport properties of concrete pavements with
excellent long-term in-service performance” Cement & Concrete Research, 30: 1903-1910
MOHD. ZAIN, M. F., M. NAZRUL ISLAM, et al. (2005). "An expert system for mix design of high
performance concrete." Advances in Engineering Software 36(5): 325-337.
MOON, H. Y., H. S. KIM, et al. (2006). "Relationship between average pore diameter and chloride
diffusivity in various concretes." Construction and Building Materials 20(9): 725-732.
MORANVILLE-REGOURD, M. (2003). Cements Made from Blastfurnace Slag. Lea's Chemistry of
Cement and Concrete (Fourth Edition). Oxford, Butterworth-Heinemann: 637-678.
MOURET, M., E. RINGOT, et al. "Image analysis: a tool for the characterisation of hydration of
cement in concrete - metrological aspects of magnification on measurement." Cement and
Concrete Composites 23(2-3): 201-206.
MUN, K. J., S. Y. SO, et al. (2007). "The effect of slaked lime, anhydrous gypsum and limestone
powder on properties of blast furnace slag cement mortar and concrete." Construction and
Building Materials 21(7): 1576-1582.
MUNDAY J G L, ONG L T & DHIR R K, (1983) “Mix proportioning of concrete with PFA, a critical
review”, in V M Malhotra (Ed) Proceeding, 1st International Conference on the Use of Fly Ash,
Silica Fume and Other Mineral by-products in Concrete, SP-79, ACI, Detroit pp 267-288
NEHDI, M., MINDESS, S., AITCIN, P. C., (1996), “Optimization of High-strength Limestone Filler
Cement Mortars” Cement & Concrete Research, 26: 883-893
NEHDI, M. & S. AL MARTINI (2009). "Estimating time and temperature dependent yield stress of
cement paste using oscillatory rheology and genetic algorithms." Cement and Concrete
Research 39(11): 1007-1016.

Ternary Combination Concretes Using GGBS, Fly Ash & Limestone: Strength, Permeation & Durability Properties
References & Bibliography
318
NEHDI, M. & M. A. RAHMAN (2004). "Estimating rheological properties of cement pastes using
various rheological models for different test geometry, gap and surface friction." Cement and
Concrete Research 34(11): 1993-2007.
NEHDI, M., M. PARDHAN, et al. (2004). "Durability of self-consolidating concrete incorporating
high-volume replacement composite cements." Cement and Concrete Research 34(11): 2103-
2112.
NEHDI M L & SUMMER J, (2002) “Optimization of ternary cementitious mortar blends using
factorial experimental plans” Materials & Structures 35(9): 495-503
Nepper-Christensseen P¸(1979), “Cement” , Aalborg, Denmark
NEVILLE A, (1995) Properties of Concrete: 4th Edition, London, Longman
NILSSON, L. O., (2002), “Long term moisture transport in high performance concrete” Materials
and Structures, 35: 641-649
NIU Q, FENG N, YANG J & ZHENG X, (2002) “Effect of superfine slag powder on cement properties”
Cement Concrete Research¸: 615-621
NORDTEST, (1999), NT Build 492 “ Concrete, Mortar and Cement-Based Repair Materials:
Chloride migration coefficient from no-steady state migration” , NORDTEST, Finland
NUMATA S, KOIDE Y & SHIMOKOYASHI S, (1986) “Properties of ultra-highly pulverised granulated
blast furnace slag – PC blends” ACI Special Publication, SP-91-66: 1341-1360
O’BRIEN K, MENACHE J & O’MOORE L (2009). “Impact of fly ash content and fly ash transportation
distance on embodied greenhouse gas emissions and water consumption in concrete.” Int J
LCA, May 2009
OGAWA, K., H. UCHIKAWA, et al. (1980). "The mechanism of the hydration in the system C3S-
pozzolana." Cement and Concrete Research 10(5): 683-696.
OMAR SAEED BAGHABRA, A.-A. & M. MASLEHUDDIN (1993). "The effect of chloride and sulfate ions
on reinforcement corrosion." Cement and Concrete Research 23(1): 139-146.
ONER, A. & S. AKYUZ (2007). "An experimental study on optimum usage of GGBS for the
compressive strength of concrete." Cement and Concrete Composites 29(6): 505-514.
O'ROURKE, B., C. MCNALLY, et al. (2009). "Development of calcium sulfate-ggbs-Portland cement
binders." Construction and Building Materials 23(1): 340-346.
ORTIZ O, CASTELLS F, SONNEMANN G (2008) Sustainability in the construction industry: a review of
recent developments based on LCA. Constr Build Mater 23:28–39

Ternary Combination Concretes Using GGBS, Fly Ash & Limestone: Strength, Permeation & Durability Properties
References & Bibliography
319
OSBOURNE G.J., (1986) “Carbonation of blastfurnace slag cement concretes, Durability of
Building Materials, 4: 81-96
Ozyildirim C & Halstead W J (1994), Improved concrete quality with combinations of fly ash and
silica fume, ACI Materials Journal, Vol. 91(6): 587–594.
PADE, C. & M. GUIMARAES (2007). "The CO2 uptake of concrete in a 100 year perspective."
Cement and Concrete Research 37(9): 1348-1356.
PAGE, C. L., N. R. SHORT, et al. (1981). "Diffusion of chloride ions in hardened cement pastes."
Cement and Concrete Research 11(3): 395-406.
PANDEY, S. P., A. K. SINGH, et al. (2003). "Studies on high-performance blended/multiblended
cements and their durability characteristics." Cement and Concrete Research 33(9): 1433-1436.
PAPADAKIS V.G., VAYENAS C.G. & FARDIS M.N., (1991) “Physical & chemical characteristics effecting
the durability of concrete”, ACI Materials Journal, 88 (2): 186-96
PAPADAKIS, V. G. (1999). "Effect of fly ash on Portland cement systems: Part I. Low-calcium fly
ash." Cement and Concrete Research 29(11): 1727-1736.
PAPADAKIS, V. G. (2000). "Effect of supplementary cementing materials on concrete resistance
against carbonation and chloride ingress." Cement and Concrete Research 30(2): 291-299.
PAPADAKIS, V. G., S. ANTIOHOS, et al. (2002). "Supplementary cementing materials in concrete:
Part II: A fundamental estimation of the efficiency factor." Cement and Concrete Research
32(10): 1533-1538.
PAPADAKIS, V. G. & S. TSIMAS (2002). "Supplementary cementing materials in concrete: Part I:
efficiency and design." Cement and Concrete Research 32(10): 1525-1532.
PAPAYIANNI, I., G. TSOHOS, et al. (2005). "Influence of superplasticizer type and mix design
parameters on the performance of them in concrete mixtures." Cement and Concrete
Composites 27(2): 217-222.
PARK, S. B., D. S. SEO, et al. (2005). "Studies on the sound absorption characteristics of porous
concrete based on the content of recycled aggregate and target void ratio." Cement and
Concrete Research 35(9): 1846-1854.
PARROTT, L. J., (1994), “Moisture Conditioning and Transport Properties of Concrete Test
Specimens” Materials and Structures, 27: 460-468
PARROTT, L. J.,(1995) “Influence of cement type and curing on the drying and air permeability of
cover concrete” Magazine of Concrete Research, 47: 103-111

Ternary Combination Concretes Using GGBS, Fly Ash & Limestone: Strength, Permeation & Durability Properties
References & Bibliography
320
PARROTT, L. J., (1992) “Variations of water absorption rate and porosity with depth from an
exposed concrete surface: Effects of exposure conditions and cement type” Cement & Concrete
Research, 22: 1077-1088
PÉRA, J., S. HUSSON, et al. (1999). "Influence of finely ground limestone on cement hydration."
Cement and Concrete Composites 21(2): 99-105.
PIPILIKAKI, P. & M. KATSIOTI (2009). "Study of the hydration process of quaternary blended
cements and durability of the produced mortars and concretes." Construction and Building
Materials 23(6): 2246-2250.
PIPILIKAKI, P., M. KATSIOTI, et al. (2009). "Performance of limestone cement mortars in a high
sulfates environment." Construction and Building Materials 23(2): 1042-1049.
PIPILIKAKI, P. & M. BEAZI-KATSIOTI (2009). "The assessment of porosity and pore size distribution
of limestone Portland cement pastes." Construction and Building Materials 23(5): 1966-1970.
PISTILLI MF, WINTERSTEEN R, CECHNER R. (1984) “The uniformity and influence of silica fume
from a U.S. source on the properties of Portland cement concrete”, Cement, Concrete
Aggregates 6(2): 1204.
PLEAU, R., M. PIGEON, et al. "Some findings on the usefulness of image analysis for determining
the characteristics of the air-void system on hardened concrete." Cement and Concrete
Composites 23(2-3): 237-246.
POON, C. S., Z. H. SHUI, et al. (2004). "Effect of microstructure of ITZ on compressive strength of
concrete prepared with recycled aggregates." Construction and Building Materials 18(6): 461-
468.
POON, C. S., Z. H. SHUI, et al. (2004). "Influence of moisture states of natural and recycled
aggregates on the slump and compressive strength of concrete." Cement and Concrete
Research 34(1): 31-36.
POPPE, A., SCHUTTER, G., (2005), “Cement hydration in the presence of high filler contents”
Cement & Concrete Research, 35: 2290-2299
POPOVICS S, (1981) “New formulas for the prediction of the effects of porosity on concrete
strength” ACI Materials Journal, 78 (2): 127-129
POPOVICS S, (1985) “Generalisations of Abram’s Law” ACI Materials Journal, 82 (2): 136-146
POWERS T. C., (1958). “Structure & Physical properties of hardened Portland cement paste” J
American Ceramic Society, 41:1-6

Ternary Combination Concretes Using GGBS, Fly Ash & Limestone: Strength, Permeation & Durability Properties
References & Bibliography
321
POWERS TC, COPELAND LE, MANN HM. (1959) “Capillary continuity or discontinuity in cement
pastes” J Portland Cement Assoc Res Dev Lab 1(2):38-48.
QIAN, J., C. SHI, et al. (2001). "Activation of blended cements containing fly ash." Cement and
Concrete Research 31(8): 1121-1127.
QUILLIN, K., G. OSBORNE, et al. (2001). "Effects of w/c ratio and curing conditions on strength
development in BRECEM concretes." Cement and Concrete Research 31(4): 627-632.
RAHHAL, V. & R. TALERO (2005). "Early hydration of Portland cement with crystalline mineral
additions." Cement and Concrete Research 35(7): 1285-1291.
RAMACHANDRAN, V. S. & J. J. BEAUDOIN (2001). Handbook of Analytical Techniques in Concrete
Science and Technology,. Norwich, NY, William Andrew Publishing
RAMACHANDRAN VS, & MALHOTRA VM. Superplasticisers,1995, In: Ramachandran VS, editor.
Concrete Admixtures Handbook, Noyes Publications
RAMACHANDRAN VS & ZHANG C, (1986), “Cement with calcium carbonate additions” Proceedings
of the 8th International Congress on the Chemistry of Cement, Rio de Janeiro, 11: 178-187
RAMEZANIANPOUR, A.A., KHADEMI, M. AND ASHRAFI, H.R(2005). “Diffusion coefficient of chloride
ions undersimulated conditions. In Cement combinations for durable concrete, Proceedings of
the Internationalconference held at UOD, 5-7 July, (2005), Ed. By, Dhir, R.K., Harrison, T.A. and
Newlands, M.D.
RAMEZANIANPOUR, A. A., E. GHIASVAND, et al. (2009). "Influence of various amounts of limestone
powder on performance of Portland limestone cement concretes." Cement and Concrete
Composites 31(10): 715-720.
RILEM, CPC-11.2, (1994). “Absorption of water by concrete by capillarity” TC14-CPC, 1982,
RILEM technical recommendations for the testing and use of construction materials,
International Union of Testing and Research Laboratories for Materials and Structures, E&FN
Spon; 1994.
RILEM, (1999) “Test for Gas Permeability of Concrete”, Materials and Structures, 32: 174-179
RILEM,(1999), “ Concrete Durability - An Approach Towards Performance Testing” Materials
and Structures, 32: 163-173
RIVERA-VILLARREAL R. (1999), “Concrete superplasticizers admixtures”. Modern Concrete
Materials: Binders, Additions and Admixtures, Ed. R.K. Dhir and T.D. Dyer, Thomas Telford,
London, pp.391-410

Ternary Combination Concretes Using GGBS, Fly Ash & Limestone: Strength, Permeation & Durability Properties
References & Bibliography
322
ROELS, S., ELSEN, J., et. al., (2001) “Characterization of pore structure by combining mercury
porosimetry and micrography” Materials and Structures, 34: 76-82
ROY D M, The effect of blast furnace slag and related materials on the hydration and durability
of concrete, International Symposium on Durability of Concrete, 1992, pp195-208
ROY DM & IDORN G M, (1982) “Hydration, structure and properties of blast furnace slag
cements, mortars and concrete” ACI Journal 79 (6): 444– 457.
SABIR, B. B., WILD, S., O'FARRELL, M., (1998) “A Water Sorptivity Test for Mortar and Concrete”
Materials and Structures, 31: 568-574
SAFIUDDIN, MD., HEARN, N., (2005) “Comparison of ASTM saturation techniques for measuring
the permeable porosity of concrete” Cement & Concrete Research, 35: 1008-1013
SALGUEIRO, W., A. SOMOZA, et al. (2004). "Porosity study on free mineral addition cement paste."
Cement and Concrete Research 34(1): 91-97.
SALKIND, N.J (200), Statistics for people who (think they) hate statistics. Sage Publications, Inc.,
SANJUAN M A & MUNOZ-MARTIALAY R (1996), “Influence of the water/cement ratio on the air
permeability of concrete”, Journal of Materials Science, 31: 2829-2832
SANT, G., C. F. FERRARIS, et al. (2008). "Rheological properties of cement pastes: A discussion of
structure formation and mechanical property development." Cement and Concrete Research
38(11): 1286-1296.
SARIDEMIR, M., I. B. TOPÇU, et al. (2009). "Prediction of long-term effects of GGBFS on
compressive strength of concrete by artificial neural networks and fuzzy logic." Construction
and Building Materials 23(3): 1279-1286.
SCRIVENER, K. L. & K. M. NEMATI (1996). "The percolation of pore space in the cement
paste/aggregate interfacial zone of concrete." Cement and Concrete Research 26(1): 35-40.
SEAR L (2011), UKQAA, Private communication on August 2011
SERSALE K. (1992) “Advances in Portland and blended cement”. In: Proceeding 9th International
congress of the chemistry of cement, New Delhi, India. vol. I;1992. p. 277–9
SHA, W. & G. B. PEREIRA (2001). "Differential scanning calorimetry study of hydrated ground
granulated blast-furnace slag." Cement and Concrete Research 31(2): 327-329.
SHAH S. P. (1994), Trends in the science and technology of concrete, International RILEM
Workshop on Technology Transfer of the New Trends in Concrete, ConTech '94, Barcelona,
November 7-9, 1994.

Ternary Combination Concretes Using GGBS, Fly Ash & Limestone: Strength, Permeation & Durability Properties
References & Bibliography
323
SHARFUDDIN AHMED, M., O. KAYALI, et al. (2008). "Chloride penetration in binary and ternary
blended cement concretes as measured by two different rapid methods." Cement and Concrete
Composites 30(7): 576-582.
SHEHATA, M. H. & M. D. A. THOMAS (2006). "Alkali release characteristics of blended cements."
Cement and Concrete Research 36(6): 1166-1175.
SHI, H.-S., B.-W. XU, et al. (2009). "Influence of mineral admixtures on compressive strength, gas
permeability and carbonation of high performance concrete." Construction and Building
Materials 23(5): 1980-1985.
SINGH, B., A. J. MAJUMDAR, et al. (1999). "Properties of BRECEM: Ten-year results." Cement and
Concrete Research 29(3): 429-433.
SINGH, M. & M. GARG (1995). "Activation of gypsum anhydrite-slag mixtures." Cement and
Concrete Research 25(2): 332-338.
SISOMONDO S., (2009), An introduction to Science and Technology Studies: 2nd Edition, John
Wiley & Sons, London
SISOMPHON, K. & L. FRANKE (2007). "Carbonation rates of concretes containing high volume of
pozzolanic materials." Cement and Concrete Research 37(12): 1647-1653.
SIVASUNDARAM, V., MALHOTRA, V. M.,(1992) “ Properties of Concrete Incorporating Low Quantity
of Cement and High Volumes of Ground Granulated Slag” ACI Materials Journal, 89: 554-563
SLEIMAN, H., A. PERROT, et al. (2010). "A new look at the measurement of cementitious paste
setting by Vicat test." Cement and Concrete Research 40(5): 681-686.
SONG HW & SARASWATHY V. (2006) “Studies on the corrosion resistance of reinforced steel in
concrete with ground granulated blast-furnace slag – an overview” J Hazard Mater 138(2):226–
33
SONG, H.-W. & S.-J. KWON (2007). "Permeability characteristics of carbonated concrete
considering capillary pore structure." Cement and Concrete Research 37(6): 909-915.
STOEVEN P & STROEVEN M, (1999) “Assessment of packing characteristics by computer
simulation, Cement & Concrete Research, 29: 1201-1206
STUTZMAN, P.E., CENTENO, R.L., (1995) "Compositional Analysis of Beneficiated Fly Ashes,"
National Institute of Standards and Technology Internal Report 5598
STUTZMAN, P. (2004). "Scanning electron microscopy imaging of hydraulic cement
microstructure." Cement and Concrete Composites 26(8): 957-966.

Ternary Combination Concretes Using GGBS, Fly Ash & Limestone: Strength, Permeation & Durability Properties
References & Bibliography
324
SU, N., K.-C. HSU, et al. (2001). "A simple mix design method for self-compacting concrete."
Cement and Concrete Research 31(12): 1799-1807.
SU, N. & B. MIAO (2003). "A new method for the mix design of medium strength flowing
concrete with low cement content." Cement and Concrete Composites 25(2): 215-222.
SWAMY R N & BOUKNI A, (1990) “Some engineering properties of slag concrete as influenced by
mix proportioning and curing”, ACI Materials Journal, 87, 210-220
SWAMY, R. N.(Ed) (1991), Blended Cements in Construction, Elsevier Science Publishers LTD
TAN, K., PU, X., (1998) “Strengthening effects of finely ground fly ash, granulated blast furnace
slag, and their combination” Cement & Concrete Research, 28: 1819-1825
TANAKA H (1983) “Property after being heated and re-hydrated of hardened cement paste”,
Cement & Concrete Research, April : 34-40
TANG, L. & NILSSON, L.-O. (1992), “Chloride diffusivity in high strength concrete at different ages”
Nordic Concrete Research, Publication No. 11, pp. 162-171
TANGPAGASIT J, CHEERAROT R, JATURAPITAKKUL C & KIATTIKOMOL K, (2005) “Packing effect &
pozzolanic reaction of fly ash in mortar” Cement & Concrete Research, 35: 1145-1151
TASDEMIR, C, (2003) “Combined effects of mineral admixtures and curing conditions on the
sorptivity coefficient of concrete” Cement & Concrete Research, 33:1637-1642
TATTERSALL G H (1991), Workability and Quality Control of Concrete, E & E F Spon, London
TAYLOR, H.W.F., (1990) Cement chemistry, Academic Press, New York
TEYCHENNE D. C., FRANKLIN R. E. & ERNTROY, H. C. (1997) Design of normal concrete mixes, Second
Edition, amended by B K Marsh, ISBN 1 86081 172 8, Building Research Establishment, 42p.
THE CONCRETE CENTRE (2009), The Concrete Industry Sustainability Performance Report: 1st
Report, The Concrete Centre, Camberley
THOMAS M.D. & MATTHEWS J. D, (1992) “Carbonation of fly ash concrete”, Magazine of Concrete
Research, 44 (160), pp217-228
THOMAS MDA & MATTHEWS JD. (1992), “The permeability of fly ash concrete”. Mater Structures
25(7):388–96
THOMAS M. D. A., SHEHATA M. H., SHASHIPRAKASH S. G., HOPKINS D. S. & CAIL K. (1999), “Use of
ternary cementitious systems containing silica fume and fly ash in concrete” Cement and
Concrete Research, 29: 1207–1214.

Ternary Combination Concretes Using GGBS, Fly Ash & Limestone: Strength, Permeation & Durability Properties
References & Bibliography
325
THOMAS, M. (2011). "The effect of supplementary cementing materials on alkali-silica reaction:
A review." Cement and Concrete Research 41(3): 209-216.
TOPÇU, I. B. & A. R. BOGA (2010). "Effect of ground granulate blast-furnace slag on corrosion
performance of steel embedded in concrete." Materials & Design 31(7): 3358-3365.
TSIVILIS, S., G. BATIS, et al. (2000). "Properties and behaviour of limestone cement concrete and
mortar." Cement and Concrete Research 30(10): 1679-1683
TSIVILIS, S., TSANTILAS, J., et. al., (2003) “The Permeability of Portland Limestone Cement
Concrete” Cement & Concrete Research, 33: 1465-1471
TSIVILIS, S., TSANTILAS, J., et. al.,(2002) Gas and water permeability of limestone cement concrete
with varying limestone content - in "Innovations and Developments in Concrete Materials and
Construction, Eds. Dhir, R. K. et. al.", pp 193-200
TSIVILIS, S., CHANIOTAKIS, E., et. al., (1999) “The effect of clinker and limestone quality on the gas
permeability, water absorption and pore structure of limestone cement concrete” Cement and
Concrete Composites, 21: 139-146
TSIVILIS, S., E. CHANIOTAKIS, et al. (2002) "An analysis of the properties of Portland limestone
cements and concrete." Cement and Concrete Composites 24(3-4): 371-378.
TSIVILIS, S. & G. PARISSAKIS (1995). "A mathematical model for the prediction of cement
strength." Cement and Concrete Research 25(1): 9-14.
UCHIKAWA, H., OKAMURA, T., Binary and Ternary Components Blended Cements - in "Mineral
Admixtures in Cement and Concrete, Ed. Ghosh, S. N.", 1993, pp 1-83
VITRUVIUS M.P., 2008, An Abridgement of the Architecture of Vitruvius, Kindle version, accessed
17th May 2011, www.amazon.com
VOGLIS, N., G. KAKALI, et al. (2005). "Portland-limestone cements. Their properties and hydration
compared to those of other composite cements." Cement and Concrete Composites 27(2): 191-
196.
VUK, T., V. TINTA, et al. (2001). "The effects of limestone addition, clinker type and fineness on
properties of Portland cement." Cement and Concrete Research 31(1): 135-139.
WAINWRIGHT, P. J. & N. REY (2000). "The influence of ground granulated blastfurnace slag (GGBS)
additions and time delay on the bleeding of concrete." Cement and Concrete Composites 22(4):
253-257.
WAN, H., Z. SHUI, et al. (2004). "Analysis of geometric characteristics of GGBS particles and their
influences on cement properties." Cement and Concrete Research 34(1): 133-137.

Ternary Combination Concretes Using GGBS, Fly Ash & Limestone: Strength, Permeation & Durability Properties
References & Bibliography
326
WANG, D. & Z. CHEN (1997). "On predicting compressive strengths of mortars with ternary
blends of cement, ggbfs and fly ash." Cement and Concrete Research 27(4): 487-493.
WANG P Z, TRETTIN R & RUDERT V, (2005) “Effect of fineness & particle size distribution of
granulated blast furnace slag on the hydraulic reactivity in the cement systems” Advances in
Cement Research, 17(10): 161-166
WEC (1995), “Efficient Use of Energy Utilizing High Technology: An Assessment of Energy Use in
Industry and Buildings”, World Energy Council, London
WILD, S., KHATIB, J. M., Jones, A., (1996) “Relative Strength, Pozzolanic Activity and Cement
Hydration in Superplasticised Metakaolin Concrete” Cement & Concrete Research, 26: 1537-
1544
WILLIAMS, D. A., A. W. SAAK, et al. (1999). "The influence of mixing on the rheology of fresh
cement paste." Cement and Concrete Research 29(9): 1491-1496.
WIMPENNY D E, ELLIS C, PEEVES C M & HIGGINS D D, The development of strength and elastic
properties in slag cement concretes under low temperature curing conditions, Proceedings of
the 3rd International Conference on fly ash, silica fume, slag and natural pozzolanas in concrete,
edited by Malhorta VM, Trondheim, Canada, pp 1283-1306
D.N. Winslow, S. Diamond, (1970) “A mercury porosimetry study of the evaluation of porosity
in Portland cement”, J. Mater. 5 (3) 564–585.
WONG, H. S. & H. ABDUL RAZAK (2005). "Efficiency of calcined kaolin and silica fume as cement
replacement material for strength performance." Cement and Concrete Research 35(4): 696-
702
Wong H H & Kwan A K G, (2008), “Packing density of cementitious materials: Part 1 –
Measurement using a wet packing method”, Materials and Structures, 41: 689-701
WORRELL, E., PRICE, L., HENDRICKS, C. & MEIDA, L. O. (2001), Carbon dioxide emissions from the
global cement industry, Annual Review of Energy and Environment, LBNL-49097, Vol. 26, pp.
303–329.
WU, Z. & T. R. NAIK (2002). "Properties of concrete produced from multi=component blended
cements." Cement and Concrete Research 32(12): 1937-1942.
YAHIA, A., TANIMURA, M., SHIMOYAMA, Y., (2005) “Rheological properties of highly flowable mortar
containing limestone filler-effect of powder content and w/c ratio” Cement & Concrete
Research, 35: 532-539
YEAU, K. Y. & E. K. KIM (2005). "An experimental study on corrosion resistance of concrete with
ground granulate blast-furnace slag." Cement and Concrete Research 35(7): 1391-1399.
Ternary Combination Concretes Using GGBS, Fly Ash & Limestone: Strength, Permeation & Durability Properties
References & Bibliography
327
YEH, I. C. (2007). "Computer-aided design for optimum concrete mixtures." Cement and
Concrete Composites 29(3): 193-202.
YOON, I.-S., O. ÇOPUROGLU, et al. (2007). "Effect of global climatic change on carbonation
progress of concrete." Atmospheric Environment 41(34): 7274-7285.
ZHANG, Y. M., W. SUN, et al. (2000). "Hydration of high-volume fly ash cement pastes." Cement
and Concrete Composites 22(6): 445-452.
ZHENG, JIAN JUN, LI, CHUN QING, ZHOU, XIN ZHU, (2005) “Characterization of microstructure of
interfacial transition zone in concrete” ACI Materials Journal, 102: 265-271
ZHENG, J. J., LI, C. Q., ZHOU, X. Z., (2005) “Thickness of interfacial transition zone and cement
content profiles around aggregates” Magazine of Concrete Research, 57: 397-406
ZHENG, LI, “Studies of Void Minimisation of the Solids Phases and Effects on Concrete
Performance”, PhD Thesis, 2001

Ternary Combination Concretes Using GGBS, Fly Ash & Limestone: Strength, Permeation & Durability Properties
Appendix A: Chapter 3 - Supplementary Information
328
APPENDIX A: (CHAPTER 3) SUPPLEMENTARY
INFORMATION
A-1 Mix Design Calculations
A-2 Sorptivity Datasheet
A-3 Air Permeability Coefficient Datasheet
A-4 ECO2 Data
A-5 Curve Fitting Procedure

Ternary Combination Concretes Using GGBS, Fly Ash & Limestone: Strength, Permeation & Durability Properties
Appendix A: Chapter 3 - Supplementary Information
329
A-1:MIX DESIGN
A-1a: CONCRETE MIX DESIGN – 100% CEM I, 0.50 w/c Ratio
MAIN PARAMETERS
W/C ratio = __0.5__ Aggregate type = Uncrushed,
Water content = __165__ kg/m³ 20 mm max size
Nominal slump = ___75___ mm % <600µm (sand) = ___54___ %
CEMENT CONTENT (Clause 5.3 of BRE mix design method)
Cement content = water content / W/C ratio
= __165__ / __0.5__ = _330_ kg/m³ ___330__ kg/m³
TOTAL AGGREGATE CONTENT (Clause 5.4, Figure 5)
For water content = ___165__ kg/m³
Relative density of 2.6 for uncrushed aggregates
gives estimated wet density of concrete = __2395__ kg/m³
Total aggregate content = wet concrete density – cement content – water content
= __2395__ - __330___ - __165___ =__1900__ kg/m³
SAND CONTENT (Clause 5.5, Figure 6)
For 20 mm max aggregate size and 75 nominal slump, with
w/c ratio __0.5__ and __54__ % sand < 600 µm, proportion of sand = ___40___ %
Sand content = total aggregate content × (proportion of sand / 100)
= __1900__ x (__40__ / 100)
= __760__ kg/m³ ___760__ kg/m³
10 + 20 mm AGGREGATE
Coarse aggregate content = Total aggregate content – Sand content
= __1900__ - __760___ __1140__ kg/m³
10 mm AGGREGATE
Combine 10 and 20 mm aggregate in ratio 1:2
10 mm aggregate = Coarse aggregate content / 3
= __1140__ / 3 ___380__ kg/m³
20 mm AGGREGATE
20 mm aggregate = Coarse aggregate content – 10 mm aggregate content
= __1140__ - ___380____760___ kg/m³
After determining the mix proportions using the BRE method, following steps were taken:
Correction for concrete yield, based on the particle densities (at SSD for aggregates) of the mix
constituents, with no allowance made for entrapped air (therefore slight over-yield).
Calculation of batch quantities, with water content increased and aggregate content reduced to
allow for water absorption by the aggregates from laboratory-dry to SSD.
Measurement of plastic density as an approximate check on mix design and batching.

Ternary Combination Concretes Using GGBS, Fly Ash & Limestone: Strength, Permeation & Durability Properties
Appendix A: Chapter 3 - Supplementary Information
330
A-1b: CONCRETE MIX DESIGN – 45% CEM I + 45% GGBS + 10% Fly Ash, 0.50 w/c Ratio
MAIN PARAMETERS
W/C ratio = __0.5__ Aggregate type = Uncrushed,
Water content = __165__ kg/m³ 20 mm max size
Nominal slump = ___75___ mm % <600µm (sand) = ___54___ %
CEMENT CONTENT (Clause 5.3 of BRE mix design method)
Cement content = water content / W/C ratio
= __165__ / __0.5__= _330_ kg/m³ ___330__ kg/m³
CEM I content = __330__ × _0.45__= 148.5 kg/m³ ___149__ kg/m³
GGBS content = __330__ × _0.45__= 148.5 kg/m³ ___148__ kg/m³
Fly Ash content = __330__ × _0.10__= __33_ kg/m³ ____33__ kg/m³
TOTAL AGGREGATE CONTENT (Clause 5.4, Figure 5)
For water content = ___165__ kg/m³
Relative density of 2.6 for uncrushed aggregates
gives estimated wet density of concrete = __2395__ kg/m³
Total aggregate content = wet concrete density – cement content – water content
= __2395__ - __330___ - __165___= __1900__ kg/m³
SAND CONTENT (Clause 5.5, Figure 6)
For 20 mm max aggregate size and 75 nominal slump, with
w/c ratio __0.5__ and __54__ % sand < 600 µm, proportion of sand =___40___ %
Sand content = total aggregate content × (proportion of sand / 100)
= __1900__ x (__40__ / 100)
= __760__ kg/m³ ___760__ kg/m³
10 + 20 mm AGGREGATE
Coarse aggregate content = Total aggregate content – Sand content
= __1900__ - __760___ __1140__ kg/m³
10 mm AGGREGATE
Combine 10 and 20 mm aggregate in ratio 1:2
10 mm aggregate = Coarse aggregate content / 3
= __1140__ / 3 ___380__ kg/m³
20 mm AGGREGATE
20 mm aggregate = Coarse aggregate content – 10 mm aggregate content
= __1140__ - ___380__ __760___ kg/m³
After determining the mix proportions using the BRE method, following steps were taken:
Correction for concrete yield, based on the particle densities (at SSD for aggregates) of the mix constituents, with no allowance made for entrapped air (therefore slight over-yield).
Calculation of batch quantities, with water content increased and aggregate content reduced to allow for water absorption by the aggregates from laboratory-dry to SSD.
Measurement of plastic density as an approximate check on mix design and batching.

Ternary Combination Concretes Using GGBS, Fly Ash & Limestone: Strength, Permeation & Durability Properties
Appendix A: Chapter 3 - Supplementary Information
331
A-2: Sorptivity Calculation Datasheet

Ternary Combination Concretes Using GGBS, Fly Ash & Limestone: Strength, Permeation & Durability Properties
Appendix A: Chapter 3 - Supplementary Information
332
A-3: Air Permeability Calculation Datasheet

Ternary Combination Concretes Using GGBS, Fly Ash & Limestone: Strength, Permeation & Durability Properties
Appendix A: Chapter 3 - Supplementary Information
333
A-4: ECO2 Data
A-4a: 0.35 w/c ratio

Ternary Combination Concretes Using GGBS, Fly Ash & Limestone: Strength, Permeation & Durability Properties
Appendix A: Chapter 3 - Supplementary Information
334
A-4b: 0.5 w/c ratio

Ternary Combination Concretes Using GGBS, Fly Ash & Limestone: Strength, Permeation & Durability Properties
Appendix A: Chapter 3 - Supplementary Information
335
A-4c: 0.65 w/c ratio

Ternary Combination Concretes Using GGBS, Fly Ash & Limestone: Strength, Permeation & Durability Properties
Appendix A: Chapter 3 - Supplementary Information
336
A-5: Curve Fitting Procedure
STEP 1
Plot the strength compressive strengths against w/c ratio, test age and cement combination
content. As there were two measurements taken at each test age two data points are available.
Thereafter based on the raw data the line of best fit was drawn to the data points. These are
drawing so that smooth parallel curves are obtained and ideally these lines should pass through
the centre of the original data points. Although this was possible to a certain extent, there were
instances where this was not achieved for all the data sets when maintaining a smooth curve. It
was however generally possible for the data points to pass through or between the highest and
lowest data points. Where this was not possible the lines were drawing as close as possible to
these original data points. Figure A.1 demonstrates the first stage in the curve fitting procedure
where strength is plotted against w/c ratio.
Fig A.1: Compressive strength normalisation
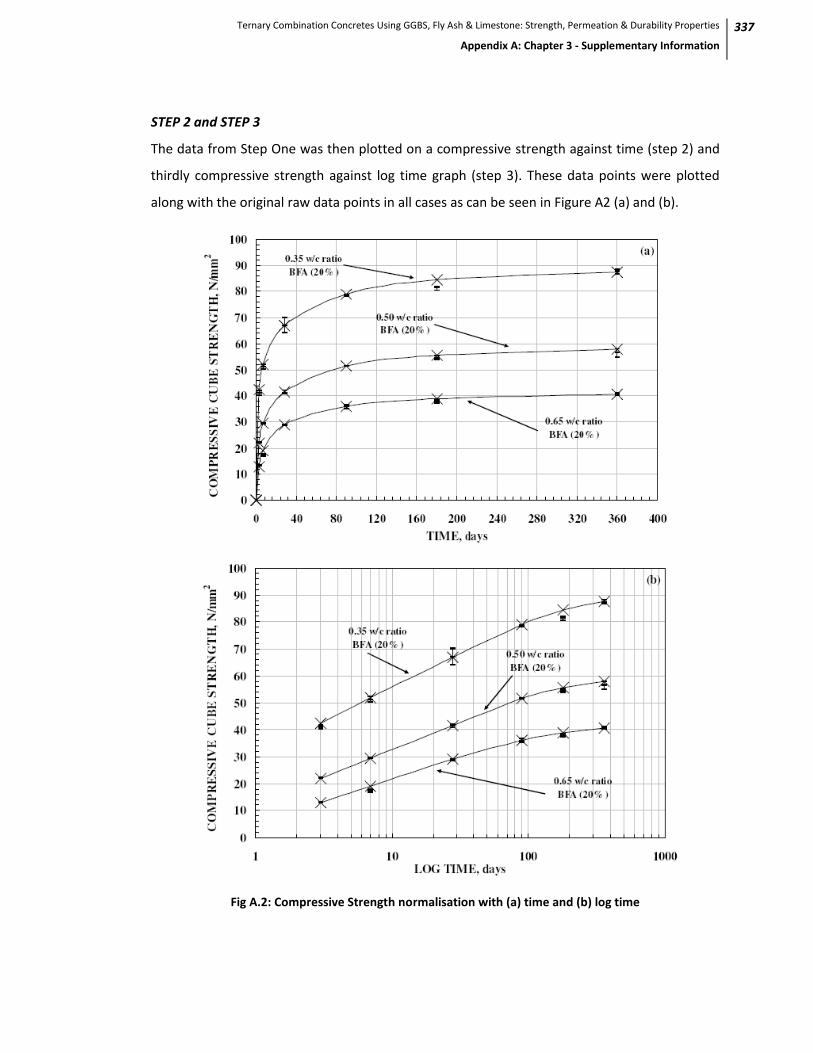
Ternary Combination Concretes Using GGBS, Fly Ash & Limestone: Strength, Permeation & Durability Properties
Appendix A: Chapter 3 - Supplementary Information
337
STEP 2 and STEP 3
The data from Step One was then plotted on a compressive strength against time (step 2) and
thirdly compressive strength against log time graph (step 3). These data points were plotted
along with the original raw data points in all cases as can be seen in Figure A2 (a) and (b).
Fig A.2: Compressive Strength normalisation with (a) time and (b) log time

Ternary Combination Concretes Using GGBS, Fly Ash & Limestone: Strength, Permeation & Durability Properties
Appendix A: Chapter 3 - Supplementary Information
338
STEP 4
As the outcome of Steps One, Two and Three was to obtain smooth curves representative of
the raw test data an iterative procedure was followed. This was necessary to ensure that the
final data obtained was representative of the original test data and as such required the
procedure to be undertaken a number of times.
STEP 5
Thereafter with respect to the data obtained from the remaining test methods this strength
data was applied in facilitating a fifth step in the curve fitting procedure. Although no graph is
presented in this demonstration it can be seen from Table B.9 that this was undertaken for five
of the data sets in total.

Ternary Combination Concretes Using GGBS, Fly Ash & Limestone: Strength, Permeation & Durability Properties
Appendix B – Chapter 4 Supplementary Information
339
APPENDIX B: (CHAPTER 4) SUPPLEMENTARY
INFORMATION
B-1 Viscometry & Setting Time
B-2 Packing Density, Void ratio and Standard Consistency
B-3 Strength

Ternary Combination Concretes Using GGBS, Fly Ash & Limestone: Strength, Permeation & Durability Properties
Appendix B – Chapter 4 Supplementary Information
340
B-1: Viscometry & Setting Time
Viscometry
Mix Combination Plastic
Viscosity (kgm-1s-1)
Yield Stress
(N/mm2)
CEM I
0.687 0.21
65%PC + 35%GGBS
0.437 0.34
65%PC + 25%GGBS + 10%FA 0.388 0.37
65%PC + 25%GGBS + 10%LS 0.445 0.4
45%PC + 55% GGBS
0.309 0.41
45%PC + 45%GGBS + 10%FA 0.351 0.48
45%PC + 45%GGBS + 10%LS 0.351 0.5
25%PC + 75%GGBS
0.318 0.33
25%PC + 65%GGBS + 10%FA 0.287 0.4
25%PC + 55%GGBS + 20%FA 0.365 0.5
25%PC + 65%GGBS + 10%LS 0.276 0.45
25%PC + 55%GGBS + 20%LS 0.386 0.52
Setting Time
Mix Combination Start Finish
0.35 w/c ratio
CEM I 01:41:48 02:34:44
65%PC + 35%GGBS 01:42:15 03:37:21
65%PC + 25%GGBS + 10%FA 01:52:18 02:38:17
65%PC + 25%GGBS + 10%LS 01:50:53 02:31:00
45%PC + 55% GGBS 02:02:03 04:13:58
45%PC + 45%GGBS + 10%FA 02:08:39 03:10:12
45%PC + 45%GGBS + 10%LS 01:52:02 02:53:16
25%PC + 75%GGBS 02:50:09 03:41:00
25%PC + 65%GGBS + 10%FA 01:59:01 03:23:00
0.5 w/c ratio
CEM I 03:53:47 05:13:34
65%PC + 35%GGBS 03:40:55 06:30:04
65%PC + 25%GGBS + 10%FA 02:56:01 07:27:35
65%PC + 25%GGBS + 10%LS 03:19:24 04:11:12
45%PC + 55% GGBS 03:55:46 04:56:42
45%PC + 45%GGBS + 10%FA 03:48:41 06:00:38
45%PC + 45%GGBS + 10%LS 01:51:49 06:28:47
25%PC + 75%GGBS 02:43:32 08:07:08
25%PC + 65%GGBS + 10%FA 00:56:04 05:49:45

Ternary Combination Concretes Using GGBS, Fly Ash & Limestone: Strength, Permeation & Durability Properties
Appendix B – Chapter 4 Supplementary Information
341
B-2: Packing Density, Void ratio and Standard Consistency
Mix Combination Packing Denisty
Void Ratio % water
CEM I 53.33 0.53 31.8
65%PC + 35%GGBS 60.21 0.60 28.6
65%PC + 25%GGBS + 10%FA 55.62 0.56 29.6
65%PC + 25%GGBS + 10%LS 54.44 0.54 28.4
45%PC + 55% GGBS 61.66 0.62 30.2
45%PC + 45%GGBS + 10%FA 57.96 0.58 31.2
45%PC + 35%GGBS + 20%FA 51.80 0.52 31.6
45%PC + 45%GGBS + 10%LS 57.11 0.57 30.2
45%PC + 35%GGBS + 20%LS 51.47 0.51 30
25%PC + 75%GGBS 66.39 0.66 30.8
25%PC + 65%GGBS + 10%FA 57.65 0.58 31.6
25%PC + 55%GGBS + 20%FA 52.05 0.52 31.4
25%PC + 65%GGBS + 10%LS 61.09 0.61 30.8
25%PC + 55%GGBS + 20%LS 56.89 0.57 30.6
25%PC + 40%GGBS + 35%LS 48.31 0.48 30.8

Ternary Combination Concretes Using GGBS, Fly Ash & Limestone: Strength, Permeation & Durability Properties
Appendix B – Chapter 4 Supplementary Information
342
B-3: Strength
Mix Combination Compressive Strength (N/mm2) test age
3 7 28 90 120
0.35 w/c ratio
CEM I
44 47 48 56 60
65%PC + 35%GGBS
28 35 41 50 55
65%PC + 25%GGBS + 10%FA 31 34 39 48 53.5
65%PC + 25%GGBS + 10%LS 34 37 43 55 59.5
45%PC + 55% GGBS
32 36 42 56 64.5
45%PC + 45%GGBS + 10%FA 31 37 41 50 53.5
45%PC + 45%GGBS + 10%LS 31 34 37 48 53
25%PC + 75%GGBS
27 30 35 44 48.5
25%PC + 65%GGBS + 10%FA 25 33 36 48 52
25%PC + 65%GGBS + 10%LS 27 34 37 46 50.5
0.5 w/c ratio
CEM I
18 20 23 30 34
65%PC + 35%GGBS
10 20 25 36 43
65%PC + 25%GGBS + 10%FA 11 17 21 29 34
65%PC + 25%GGBS + 10%LS 12 17 22 34 38
45%PC + 55% GGBS
9 13 17 34 39.5
45%PC + 45%GGBS + 10%FA 8 14 19 27 31
45%PC + 45%GGBS + 10%LS 6 13 18 28 34
25%PC + 75%GGBS
9 11 15 24 28.5
25%PC + 65%GGBS + 10%FA 5 13 17 28 33
25%PC + 65%GGBS + 10%LS 6 13 16 26 29.5

Ternary Combination Concretes Using GGBS, Fly Ash & Limestone: Strength, Permeation & Durability Properties
Appendix C: Chapter 5 - Supplementary Information
343
APPENDIX C: (CHAPTER 5) SUPPLEMENTARY
INFORMATION
C-1 Compressive Strength
C-2 Cementing Efficiency Relative to CEM I concrete
C-3 Total Porosity & Critical Pore Size

Ternary Combination Concretes Using GGBS, Fly Ash & Limestone: Strength, Permeation & Durability Properties
Appendix C: Chapter 5 - Supplementary Information
344
C-1: Compressive Strength
Mix Combination Compressive Strength (N/mm2) test age
3 7 28 90 180
0.35 w/c ratio
CEM I
50 60 70 78 82 65%PC + 35%GGBS
36 50 69 79 84
65%PC + 25%GGBS + 10%FA 30 35 52 60 65 65%PC + 25%GGBS + 10%LS 25 37 55 64 69 45%PC + 55% GGBS
28 40 59 73 78
45%PC + 45%GGBS + 10%FA 29 41 57 64 70 45%PC + 35%GGBS + 20%FA 21 32 52 58 61 45%PC + 45%GGBS + 10%LS 24 37 53 63 68 45%PC + 35%GGBS + 20%LS 26 37 51 58 62 25%PC + 75%GGBS
21 31 47 59 65
25%PC + 65%GGBS + 10%FA 29 35 49 56 61 25%PC + 55%GGBS + 20%FA 24 37 50 58 65 25%PC + 65%GGBS + 10%LS 17 23 32 36 41 25%PC + 55%GGBS + 20%LS 26 33 43 49 53 25%PC + 40%GGBS + 35%LS 17 23 33 38 44
0.5 w/c ratio
CEM I
28 38 48 53 56 65%PC + 35%GGBS
20 31 47 55 59
65%PC + 25%GGBS + 10%FA 18 27 42 51 54 65%PC + 25%GGBS + 10%LS 16 27 43 52 56 45%PC + 55% GGBS
16 25 39 51 58
45%PC + 45%GGBS + 10%FA 13 25 44 50 56 45%PC + 35%GGBS + 20%FA 13 23 38 47 49 45%PC + 45%GGBS + 10%LS 13 26 40 50 54 45%PC + 35%GGBS + 20%LS 12 23 37 45 50 25%PC + 75%GGBS
11 19 30 38 44
25%PC + 65%GGBS + 10%FA 16 21 34 40 44 25%PC + 55%GGBS + 20%FA 11 19 32 39 46 25%PC + 65%GGBS + 10%LS 10 15 22 25 29 25%PC + 55%GGBS + 20%LS 11 18 28 36 40 25%PC + 40%GGBS + 35%LS 7 13 23 29 33
0.65 w/c ratio
CEM I
15 23 34 38 40 65%PC + 35%GGBS
13 21 33 40 43
65%PC + 25%GGBS + 10%FA 10 19 35 42 48 65%PC + 25%GGBS + 10%LS 10 19 32 40 44 45%PC + 55% GGBS
10 19 29 38 41
45%PC + 45%GGBS + 10%FA 9 20 36 42 48 45%PC + 35%GGBS + 20%FA 11 17 30 39 43 45%PC + 45%GGBS + 10%LS 7 18 31 40 45 45%PC + 35%GGBS + 20%LS 6 15 28 35 39 25%PC + 75%GGBS
6 13 23 31 36
25%PC + 65%GGBS + 10%FA 7 12 26 31 35 25%PC + 55%GGBS + 20%FA 5 12 22 30 37 25%PC + 65%GGBS + 10%LS 3 9 15 19 23 25%PC + 55%GGBS + 20%LS 4 11 21 28 33 25%PC + 40%GGBS + 35%LS 4 9 18 25 28

Ternary Combination Concretes Using GGBS, Fly Ash & Limestone: Strength, Permeation & Durability Properties
Appendix C: Chapter 5 - Supplementary Information
345
C-2: Cementing Efficiency Relative to CEM I concrete
Mix Combination Cement efficiency relative to CEM I (1.0)
3 7 28 90 180
0.35 w/c ratio
65%PC + 35%GGBS
0.73 0.96 1.01 1.04 1.06 65%PC + 25%GGBS + 10%FA 0.60 0.66 0.77 0.80 0.82 65%PC + 25%GGBS + 10%LS 0.49 0.71 0.77 0.79 0.84 45%PC + 55% GGBS
0.57 0.77 0.77 0.80 0.85
45%PC + 45%GGBS + 10%FA 0.59 0.79 0.83 0.84 0.89 45%PC + 35%GGBS + 20%FA 0.42 0.60 0.73 0.76 0.76 45%PC + 45%GGBS + 10%LS 0.47 0.71 0.82 0.84 0.87 45%PC + 35%GGBS + 20%LS 0.53 0.71 0.74 0.77 0.81 25%PC + 75%GGBS
0.42 0.58 0.69 0.79 0.85
25%PC + 65%GGBS + 10%FA 0.59 0.67 0.72 0.72 0.76 25%PC + 55%GGBS + 20%FA 0.48 0.71 0.72 0.77 0.82 25%PC + 65%GGBS + 10%LS 0.34 0.44 0.47 0.47 0.52 25%PC + 55%GGBS + 20%LS 0.52 0.63 0.63 0.64 0.66 25%PC + 40%GGBS + 35%LS 0.34 0.44 0.48 0.48 0.52
0.5 w/c ratio
65%PC + 35%GGBS
0.08 0.10 1.00 1.02 1.03 65%PC + 25%GGBS + 10%FA 0.07 0.08 0.93 0.92 0.95 65%PC + 25%GGBS + 10%LS 0.06 0.08 0.89 0.87 0.89 45%PC + 55% GGBS
0.06 0.08 0.93 0.92 0.98
45%PC + 45%GGBS + 10%FA 0.05 0.08 0.98 0.92 0.98 45%PC + 35%GGBS + 20%FA 0.05 0.07 0.85 0.81 0.86 45%PC + 45%GGBS + 10%LS 0.05 0.08 1.00 0.94 0.96 45%PC + 35%GGBS + 20%LS 0.05 0.07 0.82 0.76 0.86 25%PC + 75%GGBS
0.04 0.06 0.67 0.78 0.86
25%PC + 65%GGBS + 10%FA 0.06 0.06 0.74 0.72 0.75 25%PC + 55%GGBS + 20%FA 0.04 0.06 0.69 0.72 0.81 25%PC + 65%GGBS + 10%LS 0.04 0.05 0.49 0.46 0.51 25%PC + 55%GGBS + 20%LS 0.04 0.06 0.63 0.66 0.72 25%PC + 40%GGBS + 35%LS
0.03 0.04 0.50 0.54 0.58
0.65 w/c ratio
65%PC + 35%GGBS
1.82 1.40 1.06 1.17 1.16 65%PC + 25%GGBS + 10%FA 1.45 1.23 1.20 1.20 1.21 65%PC + 25%GGBS + 10%LS 1.45 1.26 1.10 1.14 1.16 45%PC + 55% GGBS
1.45 1.23 1.20 1.26 1.29
45%PC + 45%GGBS + 10%FA 1.31 1.33 1.24 1.20 1.23 45%PC + 35%GGBS + 20%FA 1.53 1.13 1.06 1.12 1.05 45%PC + 45%GGBS + 10%LS 1.02 1.20 1.27 1.23 1.26 45%PC + 35%GGBS + 20%LS 0.87 0.96 0.96 0.89 1.00 25%PC + 75%GGBS
0.87 0.83 0.68 0.89 0.98
25%PC + 65%GGBS + 10%FA 1.02 0.80 0.86 0.86 0.90 25%PC + 55%GGBS + 20%FA 0.73 0.80 0.68 0.83 0.98 25%PC + 65%GGBS + 10%LS 0.44 0.60 0.52 0.54 0.59 25%PC + 55%GGBS + 20%LS 0.58 0.73 0.70 0.79 0.84 25%PC + 40%GGBS + 35%LS 0.51 0.60 0.65 0.70 0.73

Ternary Combination Concretes Using GGBS, Fly Ash & Limestone: Strength, Permeation & Durability Properties
Appendix C: Chapter 5 - Supplementary Information
346
C-3: Total Porosity & Critical Pore Size
Mix Combination Total Porosity(%)
3 7 28 180
0.35 w/c ratio
CEM I
25 24 22 17.2 65%PC + 35%GGBS
29 25 20.5 15.5 65%PC + 25%GGBS + 10%FA 31 27 20 14 65%PC + 25%GGBS + 10%LS 32 27 20.5 17.5 45%PC + 55% GGBS
32 26 21 15 45%PC + 45%GGBS + 10%FA 29 25 20.5 15
45%PC + 45%GGBS + 10%LS 27 24 22 19 0.5 w/c ratio
CEM I
31 28 24 21 65%PC + 35%GGBS
30 27 23 19.5
65%PC + 25%GGBS + 10%FA 33 28 23 20.5 65%PC + 25%GGBS + 10%LS 34 28 23.5 20 45%PC + 55% GGBS
35 28 23.5 20.3 45%PC + 45%GGBS + 10%FA 30 27 23.5 20.5 45%PC + 45%GGBS + 10%LS 29 25 23 21
Mix Combination Critical Pore Size (µm)
3 7 28 180
0.35 w/c ratio
CEM I
0.27 0.17 0.1 0.09 65%PC + 35%GGBS
0.17 0.13 0.09 0.06
65%PC + 25%GGBS + 10%FA 0.23 0.19 0.1 0.07 65%PC + 25%GGBS + 10%LS 0.19 0.16 0.07 0.06 45%PC + 55% GGBS
0.3 0.24 0.19 0.14
45%PC + 45%GGBS + 10%FA 0.27 0.2 0.17 0.11 45%PC + 45%GGBS + 10%LS 0.23 0.19 0.16 0.11
0.5 w/c ratio
CEM I
0.4 0.2 0.17 0.13 65%PC + 35%GGBS
0.21 0.2 0.14 0.11
65%PC + 25%GGBS + 10%FA 0.37 0.33 0.16 0.12 65%PC + 25%GGBS + 10%LS 0.23 0.19 0.11 0.1 45%PC + 55% GGBS
0.56 0.37 0.29 0.24
45%PC + 45%GGBS + 10%FA 0.31 0.29 0.23 0.19 45%PC + 45%GGBS + 10%LS 0.27 0.24 0.21 0.13

Ternary Combination Concretes Using GGBS, Fly Ash & Limestone: Strength, Permeation & Durability Properties
Appendix D: Chapter 6 - Supplementary Information
347
APPENDIX D: (CHAPTER 6) SUPPLEMENTARY
INFORMATION
D-1 ISAT & Sorptivity
D-2 Paste Sorptivity

Ternary Combination Concretes Using GGBS, Fly Ash & Limestone: Strength, Permeation & Durability Properties
Appendix D: Chapter 6 - Supplementary Information
348
D-1: ISAT & Sorptivity
Mix Combination
ISAT-10 Sorptivity
x10-2 ml/m2,s x10-4,mm/√s
28 180 28 180
0.35 w/c ratio
CEM I
31 25 195 155 65%PC + 35%GGBS
29 21 180 130
65%PC + 25%GGBS + 10%FA 34 30 210 140 65%PC + 25%GGBS + 10%LS 32 23 185 135 45%PC + 55% GGBS
30 24 185 135
45%PC + 45%GGBS + 10%FA 41 27 245 150 45%PC + 35%GGBS + 20%FA 44 28 225 155 45%PC + 45%GGBS + 10%LS 36 29 190 145 45%PC + 35%GGBS + 20%LS 38 27 210 120 25%PC + 75%GGBS
40 31 220 165
25%PC + 65%GGBS + 10%FA 52 33 220 175 25%PC + 55%GGBS + 20%FA 58 34 210 175 25%PC + 65%GGBS + 10%LS 45 24 215 160 25%PC + 55%GGBS + 20%LS 49 35 230 150 25%PC + 40%GGBS + 35%LS 52 37 260 160
0.5 w/c ratio
CEM I
47 38 270 225 65%PC + 35%GGBS
44 31 245 185
65%PC + 25%GGBS + 10%FA 42 30 270 175 65%PC + 25%GGBS + 10%LS 42 32 255 185 45%PC + 55% GGBS
45 34 255 190
45%PC + 45%GGBS + 10%FA 53 31 310 190 45%PC + 35%GGBS + 20%FA 54 33 285 200 45%PC + 45%GGBS + 10%LS 50 38 260 197 45%PC + 35%GGBS + 20%LS 52 36 275 190 25%PC + 75%GGBS
54 40 320 230
25%PC + 65%GGBS + 10%FA 68 39 275 220 25%PC + 55%GGBS + 20%FA 69 42 260 220 25%PC + 65%GGBS + 10%LS 59 49 290 210 25%PC + 55%GGBS + 20%LS 63 45 310 220 25%PC + 40%GGBS + 35%LS 65 50 320 227
0.65 w/c ratio
CEM I
69 57 380 325 65%PC + 35%GGBS
62 46 330 265
65%PC + 25%GGBS + 10%FA 55 44 340 220 65%PC + 25%GGBS + 10%LS 60 45 335 260 45%PC + 55% GGBS
63 46 350 260
45%PC + 45%GGBS + 10%FA 73 48 390 240 45%PC + 35%GGBS + 20%FA 67 46 360 250 45%PC + 45%GGBS + 10%LS 67 50 340 275 45%PC + 35%GGBS + 20%LS 72 48 355 270 25%PC + 75%GGBS
71 52 450 320
25%PC + 65%GGBS + 10%FA 69 61 350 270 25%PC + 55%GGBS + 20%FA 79 67 320 270 25%PC + 65%GGBS + 10%LS 77 53 315 245 25%PC + 55%GGBS + 20%LS 81 57 395 310 25%PC + 40%GGBS + 35%LS 86 69 400 330

Ternary Combination Concretes Using GGBS, Fly Ash & Limestone: Strength, Permeation & Durability Properties
Appendix D: Chapter 6 - Supplementary Information
349
D-2: Paste Sorptivity
Mix Combinations Sorptivity
x10-4,mm/√s
0.35 w/c ratio
CEM I 791 65%PC + 35%GGBS 725 65%PC + 25%GGBS + 10%PFA 805 65%PC + 25%GGBS + 10%LS 925 45%PC + 55% GGBS 993 45%PC + 45%GGBS + 10%PFA 975 45%PC + 45%GGBS + 10%LS 1095 25%PC + 75%GGBS 1250 25%PC + 65%GGBS + 10%FA 1020 25%PC + 65%GGBS + 10%LS 1897
0.5 w/c ratio
CEM I 1103
65%PC + 35%GGBS 1028 65%PC + 25%GGBS + 10%PFA 1098
65%PC + 25%GGBS + 10%LS 1315
45%PC + 55% GGBS 1427
45%PC + 45%GGBS + 10%PFA 1269 45%PC + 45%GGBS + 10%LS 1521 25%PC + 75%GGBS 1900 25%PC + 65%GGBS + 10%FA 1327 25%PC + 65%GGBS + 10%LS 2547

Ternary Combination Concretes Using GGBS, Fly Ash & Limestone: Strength, Permeation & Durability Properties
Appendix E: Chapter 7 - Supplementary Information
350
APPENDIX E: (CHAPTER 7) SUPPLEMENTARY
INFORMATION
E-1 Air Permeability
E-2 Water Penetration Under Pressure

Ternary Combination Concretes Using GGBS, Fly Ash & Limestone: Strength, Permeation & Durability Properties
Appendix E: Chapter 7 - Supplementary Information
351
E-1: Air Permeability
Mix Combination
Air Permeability
(x10-17),m2
28 180
0.35 w/c ratio
CEM I
1.7 1.4
65%PC + 35%GGBS
1.8 1
65%PC + 25%GGBS + 10%FA 2.4 1.4
65%PC + 25%GGBS + 10%LS 1.7 1.4
45%PC + 55% GGBS
3.1 2.5
45%PC + 45%GGBS + 10%FA 3.9 3
45%PC + 35%GGBS + 20%FA 4.3 3.4
45%PC + 45%GGBS + 10%LS 2.5 2.8
45%PC + 35%GGBS + 20%LS 3.5 3.3
25%PC + 75%GGBS
7.1 6.1
25%PC + 65%GGBS + 10%FA 8.6 6.6
25%PC + 55%GGBS + 20%FA 9.2 7.2
25%PC + 55%GGBS + 20%LS 7.7 6.9
25%PC + 40%GGBS + 35%LS 9 7.7
0.5 w/c ratio
CEM I
2.5 2.2
65%PC + 35%GGBS
3 2
65%PC + 25%GGBS + 10%FA 4.1 2.4
65%PC + 25%GGBS + 10%LS 2 1.7
45%PC + 55% GGBS
5.7 4.5
45%PC + 45%GGBS + 10%FA 7.2 4.8
45%PC + 35%GGBS + 20%FA 7.8 5.1
45%PC + 45%GGBS + 10%LS 4 3.9
45%PC + 35%GGBS + 20%LS 5 4.9
25%PC + 75%GGBS
11.9 10
25%PC + 65%GGBS + 10%FA 14 10.3
25%PC + 55%GGBS + 20%FA 14.7 10.9
25%PC + 55%GGBS + 20%LS 10.9 10.7
25%PC + 40%GGBS + 35%LS 12.6 11.1
0.65 w/c ratio
CEM I
4.7 3.9
65%PC + 35%GGBS
5.8 3.8
65%PC + 25%GGBS + 10%FA 7.2 3.6
65%PC + 25%GGBS + 10%LS 3.4 2.9
45%PC + 55% GGBS
9.7 7.6
45%PC + 45%GGBS + 10%FA 11.6 7.3
45%PC + 35%GGBS + 20%FA 12.2 8.1
45%PC + 45%GGBS + 10%LS 6.6 6.1
45%PC + 35%GGBS + 20%LS 8.1 7.3
25%PC + 75%GGBS
19 15
25%PC + 65%GGBS + 10%FA 21.9 14.6
25%PC + 55%GGBS + 20%FA 21.9 14.6
25%PC + 55%GGBS + 20%LS 15.5 14.6
25%PC + 40%GGBS + 35%LS 18.3 15.4

Ternary Combination Concretes Using GGBS, Fly Ash & Limestone: Strength, Permeation & Durability Properties
Appendix E: Chapter 7 - Supplementary Information
352
E-2: Water Penetration Under Pressure
Mix Combination
Water Penetration
mm
28 180
0.35 w/c ratio
CEM I
10 7
65%PC + 35%GGBS
9 5
65%PC + 25%GGBS + 10%FA 12 6
65%PC + 25%GGBS + 10%LS 14 6
45%PC + 55% GGBS
14 7
45%PC + 45%GGBS + 10%FA 20 9
45%PC + 35%GGBS + 20%FA 24 10
45%PC + 45%GGBS + 10%LS 23 10
45%PC + 35%GGBS + 20%LS 30 12
25%PC + 75%GGBS
25 12
25%PC + 65%GGBS + 10%FA 34 15
25%PC + 55%GGBS + 20%FA 41 17
25%PC + 65%GGBS + 10%LS 40 14
25%PC + 55%GGBS + 20%LS 48 21
25%PC + 40%GGBS + 35%LS 55 24
0.5 w/c ratio
CEM I
10 10
65%PC + 35%GGBS
9 9
65%PC + 25%GGBS + 10%FA 12 12
65%PC + 25%GGBS + 10%LS 14 14
45%PC + 55% GGBS
14 14
45%PC + 45%GGBS + 10%FA 20 20
45%PC + 35%GGBS + 20%FA 24 24
45%PC + 45%GGBS + 10%LS 23 23
45%PC + 35%GGBS + 20%LS 30 30
25%PC + 75%GGBS
25 25
25%PC + 65%GGBS + 10%FA 34 34
25%PC + 55%GGBS + 20%FA 41 41
25%PC + 65%GGBS + 10%LS 40 40
25%PC + 55%GGBS + 20%LS 48 48
25%PC + 40%GGBS + 35%LS 55 55
0.65 w/c ratio
CEM I
28 19
65%PC + 35%GGBS
25 16
65%PC + 25%GGBS + 10%FA 38 18
65%PC + 25%GGBS + 10%LS 34 18
45%PC + 55% GGBS
32 17
45%PC + 45%GGBS + 10%FA 52 22
45%PC + 35%GGBS + 20%FA 63 24
45%PC + 45%GGBS + 10%LS 47 22
45%PC + 35%GGBS + 20%LS 57 27
25%PC + 75%GGBS
52 25
25%PC + 65%GGBS + 10%FA 73 29
25%PC + 55%GGBS + 20%FA 88 32
25%PC + 65%GGBS + 10%LS 68 29
25%PC + 55%GGBS + 20%LS 80 41 25%PC + 40%GGBS + 35%LS 85 48

Ternary Combination Concretes Using GGBS, Fly Ash & Limestone: Strength, Permeation & Durability Properties
Appendix E: Chapter 7 - Supplementary Information
353
APPENDIX F: (CHAPTER 8) SUPPLEMENTARY
INFORMATION
F-1 Carbonation
F-2 Chloride Ingress

Ternary Combination Concretes Using GGBS, Fly Ash & Limestone: Strength, Permeation & Durability Properties
Appendix E: Chapter 7 - Supplementary Information
354
F-1: Carbonation
Mix Combination Depth of Carbonation, mm
0.35 0.5 0.65
5wks 20wks 5wks 20wks 5wks 20wks
CEM I 2 5 5 10 13 19
65%PC + 35%GGBS 4 6 7 11 12.5 18
65%PC + 25%GGBS + 10%FA 5 9 11 18 19 30
65%PC + 25%GGBS + 10%LS 4 8 8 13 14 22
45%PC + 55% GGBS 5 5.8 8 13 14.5 21
45%PC + 45%GGBS + 10%FA 6 12.5 13 22 22 34
45%PC + 35%GGBS + 20%PFA 9 16 16 26 25 38
45%PC + 45%GGBS + 10%LS 7 9 10 18 17 29
45%PC + 35%GGBS + 20%LS 8 10.5 13 19.5 19 32
25%PC + 75%GGBS 8 11 12 16 19 24
25%PC + 65%GGBS + 10%PFA 10 20 18 30 29 42
25%PC + 65%GGBS + 20%PFA 12.5 25 22 36 34 50
25%PC + 55%GGBS + 20%LS 13.5 18 18 26 29 42
25%PC + 40%GGBS + 35%LS 18.5 26 24 36 35 50

Ternary Combination Concretes Using GGBS, Fly Ash & Limestone: Strength, Permeation & Durability Properties
Appendix E: Chapter 7 - Supplementary Information
355
F-2: Chloride Ingress
Nix Combination W/C Ratio
NON-STEADY STATERAPID CHLORIDE MIGRATION,
NT BUILD-492
RAPID CHLORIDE PERMEABILITY, ASTM
CHARGE PASSED, COLOUMBS Dnssm, x10-12m2/s
28 90 180 28 90 180
CEM I 0.35 23.95 21.04 15.70 4181 3574 2935
CEM I 0.50 34.12 29.52 23.86 5195 4635 3655
CEM I 0.65 50.07 43.97 37.90 6905 6335 5200
65%PC + 35%GGBS 0.35 12.95 11.91 11.12 1800 1185 945
65%PC + 35%GGBS 0.50 15.80 14.22 13.23 2465 1775 1500
65%PC + 35%GGBS 0.65 21.65 19.00 17.45 3445 2825 2465
65%PC + 25%GGBS + 10%LS 0.50 8.41 4.29 4.33 2085 1690 1435
45%PC + 55% GGBS 0.35 11.60 10.41 9.55 1425 800 525
45%PC + 55% GGBS 0.50 14.20 12.68 11.62 2045 1322 1030
45%PC + 55% GGBS 0.65 19.10 17.03 15.15 3005 2100 1720
45%PC + 45%GGBS + 10%LS 0.35 3.81 2.59 1.65 1275 885 680
45%PC + 45%GGBS + 10%LS 0.50 6.56 4.47 2.99 1878 1474 1205
45%PC + 45%GGBS + 10%LS 0.65 12.76 9.05 6.99 2685 2015 1655
25%PC + 75%GGBS 0.35 10.21 9.22 8.60 1130 650 425
25%PC + 75%GGBS 0.50 12.21 10.81 10.02 1665 1140 850
25%PC + 75%GGBS 0.65 16.00 14.08 12.96 2555 1870 1550
25%PC + 40%GGBS + 35%LS 0.50 5.65 3.62 2.32 1605 1195 935
25%PC + 40%GGBS + 35%LS 0.50 9.65 8.11 7.03 2080 1640 1345