Business Services in European Industry : Growth, Employment ...
512
Luis Rubalcaba-Bermejo ft λ* é. % vim Growth, Employment and Competitiveness EUROPEAN COMMISSION
-
Upload
khangminh22 -
Category
Documents
-
view
0 -
download
0
Transcript of Business Services in European Industry : Growth, Employment ...

Luis Rubalcaba-Bermejo
ft
λ*
é.
%
vim
Growth, Employment
and Competitiveness
EUROPEAN COMMISSION


Business Services in European Industry:
Growth, Employment and Competitiveness
Luis Rubalcaba-Bermejo
European Commission, DGIII-Industry
To Fuencisla and Gloria
Business Services in European Industry: Growth, Employment and Competitiveness.
Luis Rubalcaba-Bermejo
Key words:
Business Services, Industry, Services, Europe, European Union
Growth, Employment, Competitiveness
Internationalisation, Quality, Markets, Innovation, Productivity, Location, SMEs
Industrial Policy.
Supported by Directorate General III Industry, European Commission.
200 Rue de la Loi. Β1049 Brussels. Acting Director General: Mr. Magnus Lemmel
This publication has been made under the responsibility of Mr. Ole Guldberg, Adviser to
Directorate A, DGIII.
The author, Luis RubalcabaBermejo, is Titular Professor of Economics at the University of
Alcalá and Secretary General of the Service Activities Research Laboratory (Servilab), founded by
the University of Alcalá and the Chamber of Commerce of Madrid.
Address: Plaza de la Victoria 1, 28802 Alcalá de Henares, Madrid, Spain.
Fax.: (34) 91 8 89 86 46. Email: [email protected]
The contents of this publication do not necessarily reflect the opinion of the European
Commission; the views expressed are those of the author.
©European Communities, Brussels, Luxembourg, 1999
Office for Official Publications of the European Communities,
2 rue Mercier, L2985 Luxembourg
ISBN: 9282866971
Catalogue Number: CO2098042ENC
All right reserved for this edition. No part of this publication may be reproduced, stored in
retrieval system, or transmitted in any form or by any means, electronic, mechanical,
photocopying, recording or otherwise, without the prior permission of the publisher.
Business Services in European Industry lij
Contents
Preface ν
Introduction 1
Chapter 1. What are business services? 11
1.1. A part of the new service economy 13 1.2. A heterogeneous sector with a common nature 25 1.3. A young but already important sector 41 1.4 Conclusions 56
Chapter 2. Employment in European business services 59
2.1. Employment in business services 63 2.2 Business service employment growth in Europe 72 2.3. Employment types in European business services:
a growing flexible employment? 82 2.4 Conclusions 97
Chapter 3. Explanatory factors for business services 101
3.1 A multiplicity of explanatory factors 104 3.2. Key economic and innovation functions 133 3.3. The integration of business services in the economy:
input-output analysis 143 3.4 Business services and the business cycle 163 3.5 Conclusions 178
Annex 186
Chapter 4. Business service quality. How to deal with it. 187
4.1 Concept and measurement of quality 189 4.2 Quality as a key competitive factor 217 4.3 The role ofinformation in business service quality 224 4.4 Conclusions 231
iv Business Services in European Industry
Chapter 5. Competitive strategies in business services. 233
5.1. Business services effectiveness 237 5.2 To make or to buy 240 5.3. Marketing of business services 260 5.4 Management of business service 271 5.5 Conclusions 281
Chapter 6. Business service internationalisation 287
6.1. Internationalisation trough nationalisation 290 6.2 Principles and barriers in the Single Market of business services 309 6.3 Removal of barriers in business service markets 324 6.4 Conclusions 331
Chapter 7. Productivity in business services 335
7.1 Importance of productivity in the service sector 339 7.2 Problems of measuring productivity 342 7.3 The productivity of business services in Europe 347 7.4 Conclusions 362
Annexes 366
Chapter 8. The location of business services in Europe 379
8.1 Dynamics of the location 385 8.2 The location of business services in Europe 392 8.3 The level of economic income as a factor of concentration 394 8.4 Productivity as a factor of concentration 401 8.5 Conclusions 412
Annexes 416
Chapter 9. The business service markets 423
9.1. The concentration of business services 426 9.2 The interrelations between business services 441 9.3 Conclusions 449
Chapter 10. Towards a business service policy in Europe 451
10.1 Factors that justify a business service policy 454 10.2 Objectives and instruments of a business service policy 462 10.3 Working framework for a business service policy 467 10.4 Co-ordination of policies and concrete suggestions 490 10.5 Conclusions 494
Business Services in European Industry
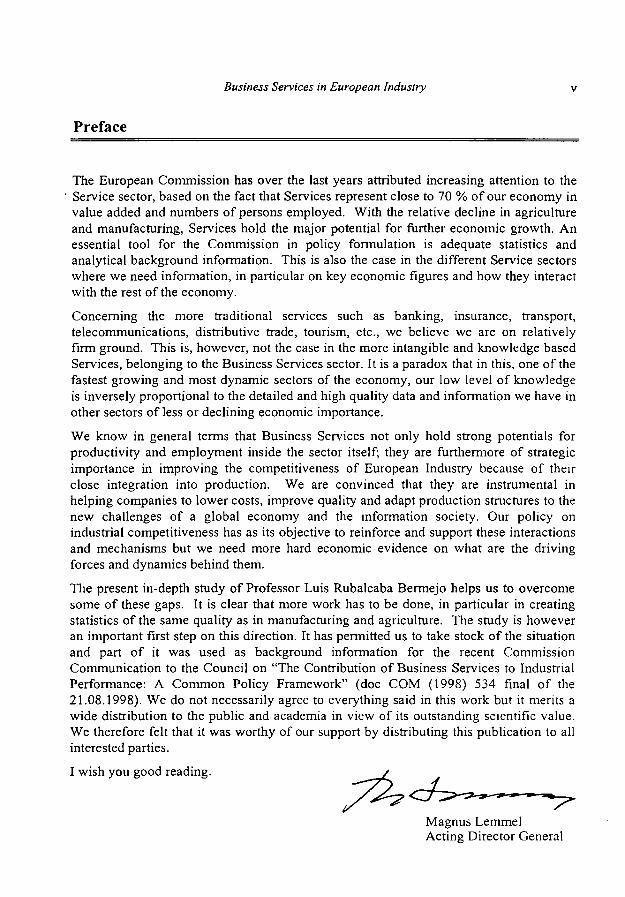
Preface
The European Commission has over the last years attributed increasing attention to the Service sector, based on the fact that Services represent close to 70 % of our economy in value added and numbers of persons employed. With the relative decline in agriculture and manufacturing, Services hold the major potential for further economic growth. An essential tool for the Commission in policy formulation is adequate statistics and analytical background information. This is also the case in the different Service sectors where we need information, in particular on key economic figures and how they interact with the rest of the economy.
Concerning the more traditional services such as banking, insurance, transport, telecommunications, distributive trade, tourism, etc., we believe we are on relatively firm ground. This is, however, not the case in the more intangible and knowledge based Services, belonging to the Business Services sector. It is a paradox that in this, one of the fastest growing and most dynamic sectors of the economy, our low level of knowledge is inversely proportional to the detailed and high quality data and information we have in other sectors of less or declining economic importance.
We know in general terms that Business Services not only hold strong potentials for productivity and employment inside the sector itself; they are furthermore of strategic importance in improving the competitiveness of European Industry because of their close integration into production. We are convinced that they are instrumental in helping companies to lower costs, improve quality and adapt production structures to the new challenges of a global economy and the information society. Our policy on industrial competitiveness has as its objective to reinforce and support these interactions and mechanisms but we need more hard economic evidence on what are the driving forces and dynamics behind them.
The present in-depth study of Professor Luis Rubalcaba Bermejo helps us to overcome some of these gaps. It is clear that more work has to be done, in particular in creating statistics of the same quality as in manufacturing and agriculture. The study is however an important first step on this direction. It has permitted us to take stock of the situation and part of it was used as background information for the recent Commission Communication to the Council on "The Contribution of Business Services to Industrial Performance: A Common Policy Framework" (doc COM (1998) 534 final of the 21.08.1998). We do not necessarily agree to everything said in this work but it merits a wide distribution to the public and academia in view of its outstanding scientific value. We therefore felt that it was worthy of our support by distributing this publication to all interested parties.
I wish you good reading.
<7>^ Magnus Lemmel Acting Director General

vi Business Services in European Industry
Introduction
"Effective exploitation by the European Union of the new factors determining industrial competitiveness calls for action of knowledge, human resources and the quality of products and services, encouragement for innovation to improve the response to market trends and adjustment of organisation and structures."
An industrial competitiveness policy for the European Union (European Commission, 1994, p. 26)
"The Business Service sector is the major economic sector with the highest growth rates in value added and employment over the last years. Their importance for the competitiveness of European enterprises and economic growth merits stronger political attention."
The contribution of business services to industrial performance: a common policy framework (European
Commission, 1998, p. 19)

Business Services in European Industry
Introduction
Introduction
Why business services?
Why looking at business services today? Do they merit an in-depth study like the one presented here? Do they really represent essential activities for economic growth? What are business services in reality? Undoubtedly, a few years ago an in-depth study of a "small" economic sector that would seem to originate simply from the externalisation of tertiary activities developed within manufacturing would have been considered somewhat excessive. Someone would have added that the traditional manufacturing industry is the only motor driving the economy, around which a group of' tertiary activities revolve, conceived in the consumer society and developed through relatively low productivity.
From its beginnings, economic thought has not paid services the attention that they merit, manifested by the important role they have played in the economy. The classical school of thought considered them to be "unproductive". As Adam Smith himself (1776) stated, they are activities that "seldom leave any trace of their value" and, therefore, "do not produce any value". This point of view has had a decisive influence on much of the economic doctrine that has prevailed up to the present day. As a corollary, economists, statisticians and politicians have focused on agriculture and manufacturing because they consider them to be the only two sectors that produce the wealth of nations. Economic thought, with notable exceptions, has marginalised issues relating to services, statistics have failed to measure them rigorously and the politicians have devoted their interest and funds to agricultural and manufacturing policies.
This situation has always contrasted with the reality of services. The tertiary sector soon began to supersede in relative importance the primary and secondary sectors. On average, in the most advanced countries in 1870, services represented over 25% of the current product generated. In 1960, it rose to 45%. In 1995, percentages leapt to around 65%-70%. This progression has finally imposed the need for a different approach. The role denied to services during the manufacturing revolution and throughout the nineteenth century could not remain hidden in the years of postmodernity, albeit merely due to the quantitative importance of the figures. The so-called "marginal" branches of economics ended up providing more employment and value added than the "main" ones.
Given the lack of interest in services passed down through history, it is not surprising that the first approaches on services have been somewhat vague. It is worth mentioning two schools that have exerted a considerable influence. First, the position that wanted to transform services into the expression of a new economic "paradise". Second, the "manufacturing" approach, through which researchers have tried to understand services
4 Business Services in European Industry
by transposing the thought and action criteria from the agricultural or manufacturing world to services.
Among the various trends, the lack of understanding of the problems of the service sector has hindered the consolidation of mature thinking, of reliable statistics and of an adequate industrial policy. However, from the end of the seventies (with exception of a few notable precursors) and especially from the mid-eighties, the distance between the real economy and the thinking associated with it has been reduced significantly. First, this is because of the increased number of studies and research on services. Second, because the new economic changes showed the inadequacy of extrapolating for all services the results derived from the study of the end services to the consumer. Third and most importantly, because they have gradually adopted more realistic approaches, from within the sector itself and dispensing with the "post-industrial" connotations that overlooked the close relationships between economic sectors.
The most recent advances of the service economy have centred on the compression of the relationship between services and industry, manufacturing in particular, studying the complementarity between both economies at the same time as distinguishing the specific nature of the services. This new vision places business services in a privileged position in research. They have been considered the most significant representative of the integration between goods and services as well as the most active sector of the new economic structure. This is justified by two basic facts: on the one hand, business services have enjoyed the highest growth in employment and value added of any major sector in the last 20 years; on the other, business services exemplify the industrial-service relationship within a profound economic transformation dynamic.
In fact, as mentioned above, the analytical neglect that the service economy has suffered until recently contrasts with its importance in contemporary society. Services represent nearly 70% of employment and value added in the most advanced economies. Business services have emerged strongly within this in the last three decades, especially in the eighties and nineties, making its own mark in the world of economic thought and of policy making aimed at improving the industrial production systems.
Until a few years ago it was supposed that business services represented up to 5% of employment and 6% of value added. A report by the European Commission (1990) recognised the immense and growing importance of business services in business competitiveness even if the sector showed a modest volume: five and a half million workers produced 255 billion ECU's. The improvement made to the statistical system in this decade allows us to demonstrate how these estimates must have been undervalued. Nowadays, a similar definition of business services (advanced value added services, routine business services and real estate activities) represents around 8.5% of employment and 15.3% of value added in Europe (EUR-15) according to estimates based on statistics from the National Accounting compiled by the OECD, which means approximately 12 million workers and over 850,000 million ECU's of value added (in ECU's from 1990). Moreover, it is estimated that the sector is organised into more than
Introduction 5
two million companies, representing nearly 13% of the total of European firms (EUR-15).
Despite the methodological difficulties of compiling statistics in a relatively new sector . and although the notable differences according to the country being analysed must be
taken into account, it is true that the sector represents percentages of employment and value added above those in other traditional sectors that have received more attention such as banking, insurance, transport or communication (more details on statistics are provided in chapter 1).
If the figures regarding the sector are already significant in themselves, specialists in services agree that the qualitative importance outstrips the quantitative importance. The services provided by offices, agencies, consulting firms and companies in the sector facilitate changes to the production systems, they stimulate improvements to product quality, reinforce strategic and commercial areas of companies, and contribute to the industrial competitiveness of the countries and regions using them.
The reasons put forward to justify growth in business services are many and varied and include arguments based on supply and demand, organisation, regulations, macro and microeconomics. The following serve as examples: the need for more flexible production systems, the advantages in specialisation produced by externalisation, the need to incorporate innovative processes, the advent of new communication and information technologies, the integration of goods and services, the internationalisation of the markets, the state regulations and the changes to the job markets, etc. It is not possible to explain all these factors here, but the most important ones are referred to in different chapters of the book. The progress made by the recent material on business services allows us to better understand its raison d' être as a result of new economic dynamics.
The framework of policy making emerges from the current evidence on the interrelation between business services and the contemporary dynamics of economic change. It is no coincidence that the need to incorporate advanced services in companies has been implicitly or explicitly formulated by some of the main European Commission (EC) reports related to industrial policies (Report on Industrial Competitiveness Policy, 1994; Competitiveness of European Industry, 1997), and employment (White Paper, 1993; A Confidence Pact on Employment, 1996) among other reports. The recent important European Commission Communication on Business Services (1998) strongly confirms the role of business services in the European industry and related policies. There is a growing perception that the best way to help companies is to facilitate access to specialised services that serve to lower costs, increase quality and adapt production structures to the new challenges of a global economy dominated by the presence of new information and communication technologies. The demands of immaterial investment and innovation essentially require the open competition of these services that, thanks to their specialisation, secure an efficient and wide response.
6 Business Services in European Industry
For this reason it is equally not surprising that industrial and regional policy has often been directed towards obtaining access to or the provision of these services for those market segments to which the benefits of them do not reach, basically SMEs and outer regions. The new regional and industrial policy has incorporated business services, defining itself as a business service that must secure advantages for its beneficiaries.
As a consequence, the justification of an industrial policy for business services springs from three challenges that are not always compatible: 1, to respond to the new competitive environment helping the most innovative companies with the ability to succeed to do so; 2, to promote, by liberalising, competition in the markets, making the relevant economic options more transparent; and, 3, to obtain access for the companies that due to their size or location can not benefit from the advantages of cost and quality of advanced services. These basic reasons justify the study of business services and the growing interest by economic and political agents, in line with what is suggested by the EU Communication on Business Services (1998).
Aims and method
The aim of this book is to analyse rigorously and systematically the economy of business services in Europe. From a number of standpoints, the ten chapters of the book deal with different interests that the agents related to these activities might have. This book is dedicated to suppliers and client companies, professional associations and public institutions, policy-makers and managers of service centres, students and researchers, in the hope that they all might find aspects that interest them.
The first block of three chapters is dedicated to all interested readers. The first chapter introduces business services: what they are, where they come from, how they are defined and classified, what they produce and how they have grown in recent years. This chapter aims to identify the subject to be studied and to introduce the main available statistics. The second chapter centres on employment, in order to verify to what extent these new services can be considered to underlie employment and be an object of policy making. At the same time, the features of employment in business services are examined. The third chapter focuses on the main explanatory factors of business services from two perspectives: the causes that justify their existence, and the functions they perform in the economic system. Specific elements include input-output analysis to evaluate the integration of the sector with other industrial sectors and a study of the relationship between business services and the economic cycle, in order to evaluate the strength of the structural component in the growth of the sector in contrast to temporal components.
The second area is basically dedicated to companies, suppliers and clients that are producing business services, as well as those interested in policy making. The fourth chapter refers to the quality of business services as a factor of competitiveness. The measurement problems are examined as well as the role that information and
Introduction 7
expectations play. The fifth chapter goes into depth on the three competitive strategies that aid effective provision of business services. The first affects demand above all, as the option between buying or doing as a mechanism to improve competitiveness is presented. The second affects supply and demand, as it reviews some relevant concepts
. of the marketing of services. The third puts forward some reflections on the supply of services and management. The sixth chapter deals with the internationalisation of business services: its form, factors, advantages and the obstacles hindering it. In this context the barriers that still exist in the European business service markets are analysed, as well as the course of action followed by the States in order to diminish their effects and remove any barriers that can be eliminated.
The third area is dedicated to a general readership again, especially to those interested in the international organisation of business service markets and their characteristics. The seventh chapter begins with the issue of productivity. Indicating the difficulties that exist in measuring it, several complementary measurements are analysed that stress the importance of this issue in order to improve the competitiveness of suppliers. The eighth chapter tackles the problem of the location of business services and the degree of concentration in European countries, which explains the reasons behind the disparities found in Europe. The ninth chapter explains the organisation of the markets in large and small companies and the existing interrelation and synergies between different activities.
The book ends with a tenth chapter dedicated fundamentally to the policy-makers, as it analyses the different actions that a policy on business services might include. Departing from the reasons that justify it and the actions already being implemented, the policy framework for an industrial policy for business services is presented. A selection of possible immediate initiatives as final suggestions closes the book.
In all the chapters the book has tried to use several methodological criteria: 1) scientific rigour in the use of the material consulted, in dealing with the statistical data and in the proposition of concepts and original conclusions on each subject; 2), a systematic approach to the important questions affecting business services in the European Union from the main possible perspectives; 3), clarity, by embellishing the text with many graphs, diagrams and tables that can better illustrate the ideas and present the diverse subjects in a precise and concise manner. This last criterion means that all the technical references concerning the treatment of data and statistical procedures have simply been excluded or included in appendices.
Naturally, by attempting to fulfil these methodological criteria I could not avoid the risk of meeting new or complex issues, statistics with abundant restrictions as regards quantity and quality, or over-ambitious subjects for the space available. Despite all these limitations, we believe that the book tries to provide the following:
A European outlook on the most dynamic sector in modern economies A book that includes all existing statistics produced at European level
Business Services in European Industry
An academic survey covering many of the existing literature and empirical works Research carried out on the relationship between business services and economic growth A discussion piece about the reasons for business services and why they create employment An attempt to explain why business services improve industrial competitiveness A work providing useful elements to improve the quality of business services A potential source of suggestions for applying competitive strategies to business services A guide with helpful ideas to understand business service internationalisation, productivity, location and markets. An attempt to raise discussion about which company and governmental policies are more suitable for business services in order to improve industrial competitiveness and economic growth.
Acknowledgements
To conclude, I would like to acknowledge all the people who have helped me during this long time research. First of all, I thank Ole Guldberg (DGIII) for promoting this book and for his many invaluable suggestions and fruitful comments. His firm interest and the DGIII support have made the publication of this study possible. Second, I have a debt to Professor Juan R. Cuadrado-Roura (University of Alcalá, Madrid), for his priceless thoughts and the decisive support he has given from the University of Alcalá and the Service Industries Research Laboratory (Servilab, Madrid). I am also very grateful for the experience I have gained on statistics in services working with Marco Lancetti, Augustijn van Haasteren, Alfred Förh, Jean Louis Mercy, Klaus Wurm, Evangelos Pongas, August Goëtzfried, and Volker Stabernak in the "Distributive Trades and Services" unit of Eurostat (Luxembourg).
As regards specific issues, I am grateful for the expertise, support or valuable comments from the following professors of Economics, Geography or Statistics: Clemente Del Rio, Tomás Mancha, Ma Luisa Peinado Carlos Iglesias and Elena Mañas (University of Alcalá, Madrid), Arturo González-Romero (Ministry of Industry, Madrid), M" Pilar Martin-Guzman (INE, Madrid), Juan Velarde-Fuertes (Universidad Complutense. Madrid), Antonio Martinez-Serrano (University of Valencia, Valencia), Lanfranco Senn (Universidad Bocconi, Milan), Maite Barea (Universidad Autònoma), Cecilio Mar Molinero (University of Southampton, Southampton), Eduardo Vilela (Argentaria, Madrid), Peter Wood (University College London, London), Peter Daniels, (University of Birmingham, Birmingham), Patrick N. O'Farrell (Heriot-Watt University, Edinburgh), Joël Bonamy (CEDES-CNRS, Lyon), Marie Christine Monnoyer (RESER-University of Bordeaux), Frank Moulaert (IFRESI, Lille), Flavia Martinelli (Nápoles), Simone Stranback (University of Stuttgart), Joao Ferrão (GEOIDEA, Lisbon) and Sven Illeris (Roskilde University, Denmark).

Introduction
I would also like to thank the assistance of the following research assistants at Servilab
who have participated in parts of the research: Elisabeth Villagómez (University of
Granada, Granada), Mercedes Domínguez (Shell, Spain), Alvaro Ortiz, Paloma
. Rubalcaba, Carlos Alegre and Nathalie Roberts (Servilab). Miguel Jiménez, Clare
Nimmo, and Esme Prentice who have translated the Spanish text into English, at times
an arduous task, and I am grateful for their efforts and any errors in the text are my
responsibility alone. Finally I thank my wife, Fuencisla, my daughter, Gloria, and family
and friends, for their encouragement and company that has sustained me during my
intensive periods of research.
Luis Rubalcaba-Bermejo
References
European Commission (1990) The situation and role of business services in the European
Community. European Commission, Brussels.
European Commission (1993) Growth, competitiveness, employment. The challenges and
ways forward into the 21st Century. While Paper. European Commission, Brussels.
European Commission (1994) An industrial competitiveness policy for the European Union.
European Commission, Brussels.
European Commission (1996) Λ confidence pact on Employment. European Commission,
Brussels.
European Commission (1997) The competitiveness of the European Industry. European
Commission, Brussels.
European Commission (1998a) The contribution of business services to industrial
performance: a common policy framework. Communication from the Commission to the
Council. European Commission, Brussels.
European Commission (1998b) Commission Report to the Industrial Council: Industrial
Competitiveness and Business Services, (doc SEC(98)735 of 24-04-1998)
Smith, A. (1776) The Wealth of Nations. Spanish 1979 version of the Fondo de Cultura
Econòmica.

10 Business Services in European Industry

Chapter 1
What are Business Services?
"But in fact economic thinking is very hazy, not just about why this process of tertiarization should be expected to take place, but indeed on the more fundamental question of what exactly services
Jonathan I. Gershuny (1987). "The future of Service Employment ", page 105.
In Giarini, Orio (Ed.) The Emerging Service Economy. Pergamon Press.

12 Business Services in European Industry
What are Business Services? 13
Chapter 1 What are business services?
Introduction
This first chapter presents the fundamental features of business services, their analytical framework and the existing data on their size and development in recent years. They are presented from three different points of view: the context in which business services emerge, their defining characteristics and data quantifying their volume and growth. The first point of view aims to show the service society as a natural environment in which new tertiary activities, and, in particular, those linking goods and services within a so-called 'servindustrial society' are emphasised. The second perspective defines and conceptualises briefly business services, for both theoretical-conceptual and statistical purposes. Finally, the third aspect presents the main existing data on the sector at a European level, regarding volume and growth. In the exposition of available statistics the quantitative importance of business services in the most advanced economies is noted.
1.1 A part of the new "servindustrial" economy
Business services can be understood within their natural context: the emergence, expansion and subsequent consolidation of a "servindustrial" economy, integrating goods and services. Companies have needed new services in order to be able to improve their productive capacity and quality, and this has been due to the omnipresence of services in economic life creating gradually an economic culture that favours their appearance. In one way, the spectacular growth of business services in recent years is the most representative factor of the "servindustrial" economy. Manufacturing industry and agriculture are linked to and not separate from the service sector and their economic importance and growth are interrelated. The goods economy needs the service economy more than ever, in the same way that the latter has sprung from the former. Business services are, without doubt, the most characteristic example of the benefits of the interrelation between goods and services.
1.1.1 A service economy
The consolidation of the service economy is one of the most evident factors in developed societies. The most advanced nations, also known as the industrialised nations, today are paradoxically nations based on services. As time goes by, and especially during the second half of this century, agriculture and the manufacturing industry have progressively lost importance in the composition of employment and value added. Economic development and growth have coincided with the so-called
14 Business Services in European Industry
process of'tertiarization' of economies.
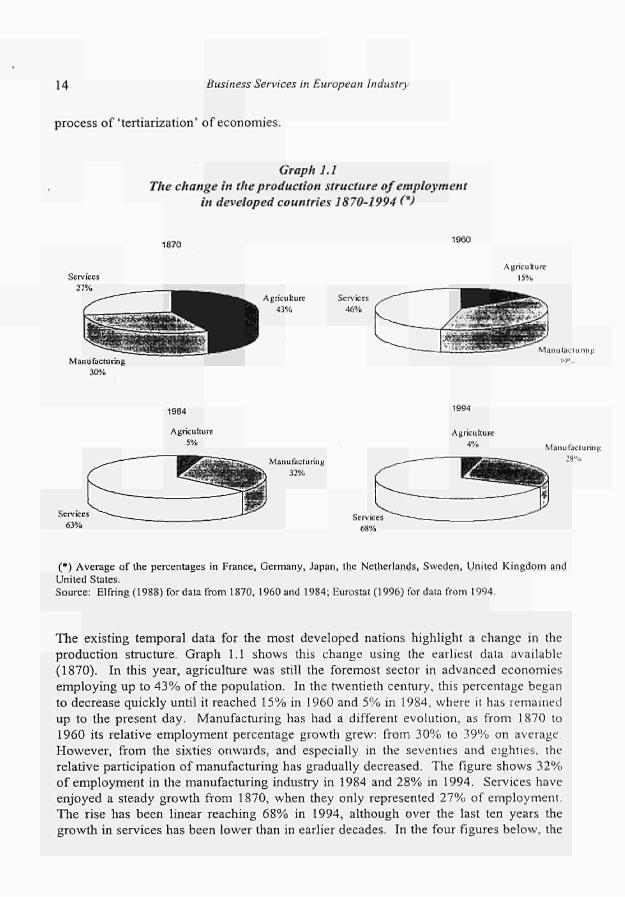
Graph 1.1
The change in the production structure of employment
in developed countries 1870-1994 (*)
1870 1960
Services
27%
¿5>—ü "■-' ̂ UJjWwBlAi»^
Manufacturing
30%
B ^ ^ ^ . Agriculture
I k 43% Services
46%
— ^ ^ _ / ■ r ç w w S
^ ^ ^ ^ £ Ü Ü
Agriculture
15%
Ö B * ^ M ιιιιιηΚΓΙυπημ
14"..
1984
Service:
6 3 %
Agriculture
5%
v^— _ _ ^ ^ 2 ^ _ ™
Manufacturing
32%
68%
Agriculture
4% Manufacturing
28%
*H#
(*) Average of the percentages in France, Germany, Japan, the Netherlands, Sweden, United Kingdom and United States. Source: Elfring (l 988) for data from 1870, 1960 and 1984; Eurostat (1996) for data from 1994.
The existing temporal data for the most developed nations highlight a change in the
production structure. Graph 1.1 shows this change using the earliest data available
(1870). In this year, agriculture was still the foremost sector in advanced economies
employing up to 43% of the population. In the twentieth century, this percentage began
to decrease quickly until it reached 15% in 1960 and 5% in 1984, where it has remained
up to the present day. Manufacturing has had a different evolution, as from 1870 to
1960 its relative employment percentage growth grew: from 30% to 39% on average
However, from the sixties onwards, and especially in the seventies and eighties, the
relative participation of manufacturing has gradually decreased. The figure shows 32%
of employment in the manufacturing industry in 1984 and 28% in 1994. Services have
enjoyed a steady growth from 1870, when they only represented 27% of employment.
The rise has been linear reaching 68% in 1994, although over the last ten years the
growth in services has been lower than in earlier decades. In the four figures below, the
What are Business Services? 15
fact that the manufacturing industry dips to a lower percentage than in 1870 stands out. In one sense, services have gained jobs at the cost of agriculture, whilst manufacturing returns to the area of 30%, far from the level of 40% reached in the 60s.
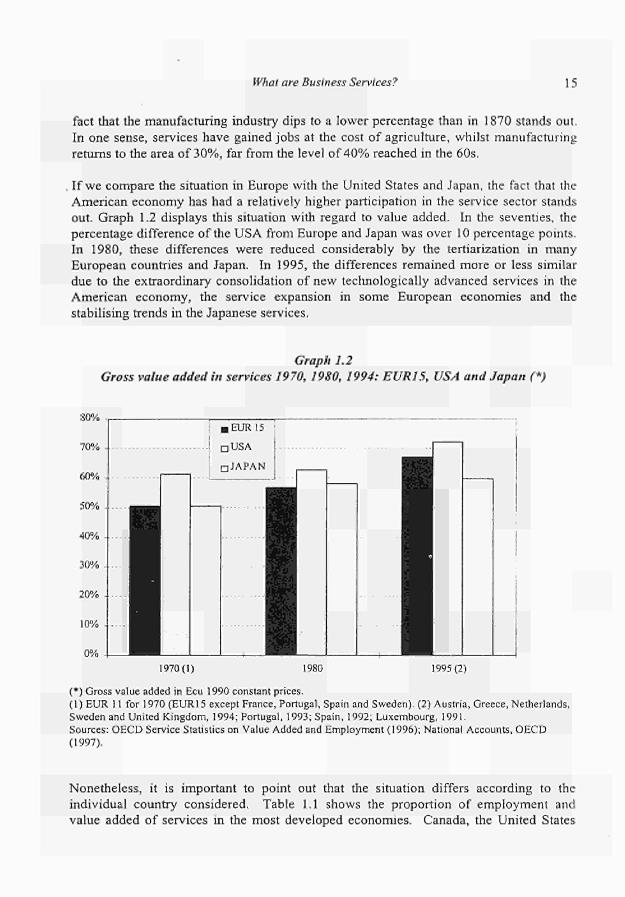
, If we compare the situation in Europe with the United States and Japan, the fact that the American economy has had a relatively higher participation in the service sector stands out. Graph 1.2 displays this situation with regard to value added. In the seventies, the percentage difference of the USA from Europe and Japan was over 10 percentage points. In 1980, these differences were reduced considerably by the tertiarization in many European countries and Japan. In 1995, the differences remained more or less similar due to the extraordinary consolidation of new technologically advanced services in the American economy, the service expansion in some European economies and the stabilising trends in the Japanese services.
Graph 1.2 Gross value added in services 1970,1980, 1994: EURI5, USA and Japan (*)
1970(1) 1980 1995(2)
(*) Gross value added in Ecu 1990 constant prices. (1) EUR 11 for 1970 (EUR15 except France, Portugal, Spain and Sweden). (2) Austria, Greece, Netherlands, Sweden and United Kingdom, 1994; Portugal, 1993; Spain, 1992; Luxembourg, 1991. Sources: OECD Service Statistics on Value Added and Employment (1996); National Accounts, OECD (1997).
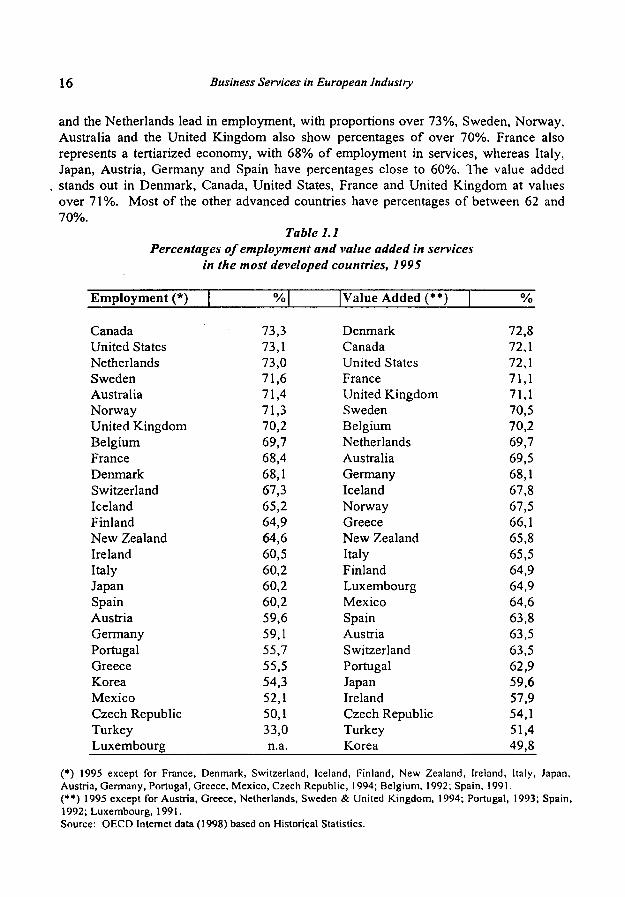
Nonetheless, it is important to point out that the situation differs according to the individual country considered. Table 1.1 shows the proportion of employment and value added of services in the most developed economies. Canada, the United States
16 Business Services in European Industry
and the Netherlands lead in employment, with proportions over 73%, Sweden, Norway, Australia and the United Kingdom also show percentages of over 70%. France also represents a tertiarized economy, with 68% of employment in services, whereas Italy, Japan, Austria, Germany and Spain have percentages close to 60%. The value added stands out in Denmark, Canada, United States, France and United Kingdom at values over 71%. Most of the other advanced countries have percentages of between 62 and 70%.
Table 1.1 Percentages of employment and value added in services
in the most developed countries, 1995
Employment (*)
Canada United States Netherlands Sweden Australia Norway United Kingdom Belgium France Denmark Switzerland Iceland Finland New Zealand Ireland Italy Japan Spain Austria Germany Portugal Greece Korea Mexico Czech Republic Turkey Luxembourg
%
73,3 73,1 73,0 71,6 71,4 71,3 70,2 69,7 68,4 68,1 67,3 65,2 64,9 64,6 60,5 60,2 60,2 60,2 59,6 59,1 55,7 55,5 54,3 52,1 50,1 33,0 n.a.
Value Added (**)
Denmark Canada United States France United Kingdom Sweden Belgium Netherlands Australia Germany Iceland Norway Greece New Zealand Italy Finland Luxembourg Mexico Spain Austria Switzerland Portugal Japan Ireland Czech Republic Turkey Korea
%
72,8 72,1 72,1 71,1 71,1 70,5 70,2 69,7 69,5 68,1 67,8 67,5 66,1 65,8 65,5 64,9 64,9 64,6 63,8 63,5 63,5 62,9 59,6 57,9 54,1 51,4 49,8
(*) 1995 except for France, Denmark, Switzerland, Iceland, Finland, New Zealand, Ireland, Italy, Japan, Austria, Germany, Portugal, Greece, Mexico, Czech Republic, 1994; Belgium, 1992; Spain, 1991. (**) 1995 except for Austria, Greece, Netherlands, Sweden & United Kingdom, 1994; Portugal, 1993; Spain, 1992; Luxembourg, 1991. Source: OECD Internet data (1998) based on Historical Statistics.
What are Business Services? ] 1
If we analyse the table as a whole, it emerges that there are clearly countries, which are advanced as regards services: United States, Canada and the United Kingdom. The least advanced countries in services include areas of relatively low economic development
, such as Ireland, Portugal or Greece. However, from table 1.1 we cannot deduct whether a clear relationship exists between services and economic development. In continental Europe important differences can be appreciated. Germany, like Japan, standing a very high economic development, displays relatively low percentages in the use of services. Relatively low service rates are in Italy or Spain too. On the other hand, France or the Benelux countries have very high percentages.
In particular, the percentage differences in Germany and Japan challenge simplistic interpretations that link growth of income with a service economy'. Although in general terms this is true, at an individual and detailed level it is worth pausing to reflect on why Germany and Japan, two of the most advanced countries in the world, figure amongst the countries which have the lowest participation in services of the most advanced nations. In contrast, the United States leads the process of tertiarization.
These differences have been studied by Cuadrado and Del Rio (1989) in their analysis of the development of the structural change in the OECD countries. This study confirms the general thesis that industry developed differently in two recent periods. In the first period (1960-73), the industrialisation process prevailed although the most advanced countries had already embarked on a certain recession in this sector. In the second period, from 1973 onwards, there was a process of de-industrialisation that coexisted with a process of re-industrialisation in the countries with the highest income per capita. There are exceptions to the general tertiarization process, due to differences in the processes of integration between manufacturing and services and to different national peculiarities. It can be concluded that there are factors that explain the disparities found, such as: the different importance attributed to social services in some countries (e.g.: strong in Scandinavian countries), the different behaviour of families and companies (Japan) or the organisational characteristics of manufacturing (Germany).
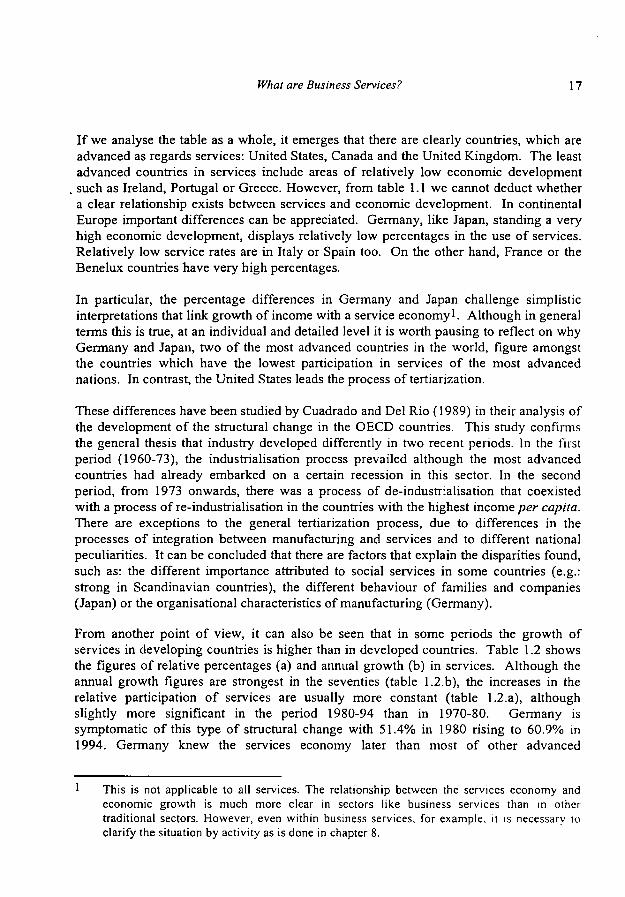
From another point of view, it can also be seen that in some periods the growth of services in developing countries is higher than in developed countries. Table 1.2 shows the figures of relative percentages (a) and annual growth (b) in services. Although the annual growth figures are strongest in the seventies (table 1.2.b), the increases in the relative participation of services are usually more constant (table 1.2.a), although slightly more significant in the period 1980-94 than in 1970-80. Germany is symptomatic of this type of structural change with 51.4% in 1980 rising to 60.9% in 1994. Germany knew the services economy later than most of other advanced
This is not applicable to all services. The relationship between the services economy and economic growth is much more clear in sectors like business services than in other traditional sectors. However, even within business services, for example, it is necessary to clarify the situation by activity as is done in chapter 8.
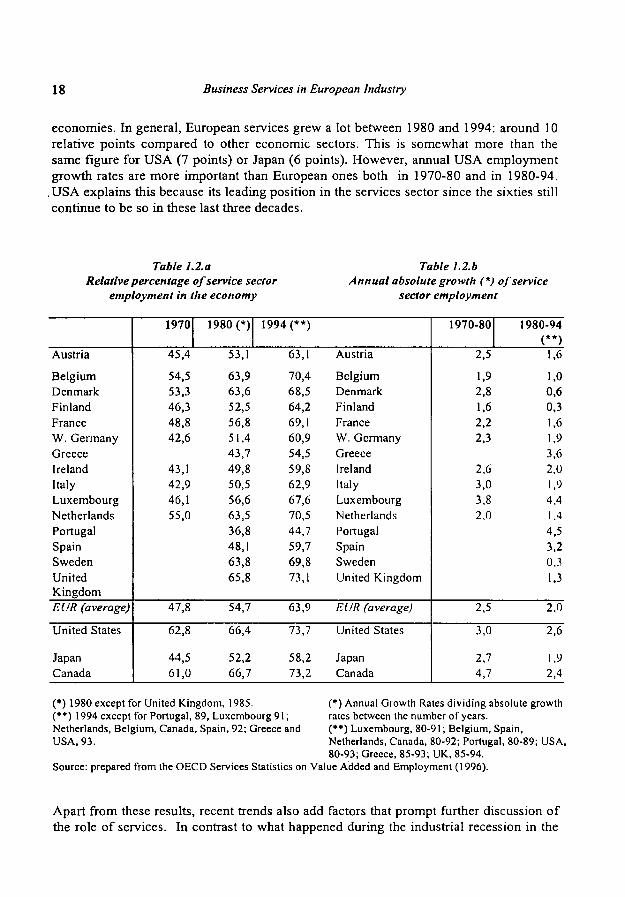
18 Business Services in European Industry
economies. In general, European services grew a lot between 1980 and 1994: around 10 relative points compared to other economic sectors. This is somewhat more than the same figure for USA (7 points) or Japan (6 points). However, annual USA employment growth rates are more important than European ones both in 1970-80 and in 1980-94.
.USA explains this because its leading position in the services sector since the sixties still continue to be so in these last three decades.
Table 1.2.a Relative percentage of service sector
employment in the economy
Table 1.2.b Annual absolute growth (*) of service
sector employment
Austria
Belgium Denmark Finland France W. Germany Greece Ireland Italy Luxembourg Netherlands Portugal Spain Sweden United Kingdom EUR (average)
United States
Japan Canada
1970
45,4
54,5 53,3 46,3 48,8 42,6
43,1 42,9 46,1 55,0
47,8
62,8
44,5 61,0
1980 (*)
53,1
63,9 63,6 52,5 56,8 51,4 43,7 49,8 50,5 56,6 63,5 36,8 48,1 63,8 65,8
54,7
66,4
52,2 66,7
1994 (**)
63,1
70,4 68,5 64,2 69,1 60,9 54,5 59,8 62,9 67,6 70,5 44,7 59,7 69,8 73,1
63,9
73,7
58,2 73,2
Austria
Belgium Denmark Finland France W. Germany Greece Ireland Italy Luxembourg Netherlands Portugal Spain Sweden United Kingdom
EUR (average)
United States
Japan Canada
1970-80
2.5
1,9 2,8 1,6 2,2 2,3
2,6 3,0 3,8 2,0
2,5
3,0
2,7 4,7
1980-94 (**)
1.6
1,0 0,6 0.3 1.6 1,9 3.6 2,0 1,9 4,4 1.4 4,5 3,2 0,3 1,3
2,0
2,6
1,9 2,4
(*) 1980 except for United Kingdom, 1985. (**) 1994 except for Portugal, 89, Luxembourg 91 ; Netherlands, Belgium, Canada, Spain, 92; Greece and USA, 93.
(*) Annual Growth Rates dividing absolute growth rates between the number of years. (**) Luxembourg, 80-91; Belgium, Spain, Netherlands, Canada, 80-92; Portugal, 80-89; USA, 80-93; Greece, 85-93; UK, 85-94.
Source: prepared from the OECD Services Statistics on Value Added and Employment (1996).
Apart from these results, recent trends also add factors that prompt further discussion of the role of services. In contrast to what happened during the industrial recession in the
What are Business Services? 19
seventies and the early eighties, during the recession in the nineties, services, in general, have not created jobs nor absorbing job losses from manufacturing. For example, in Spain (González Moreno and Rubalcaba, 1993), the traditional sources of the creation of employment, the public sector and tourism, did not serve to counteract the drop in other
. sectors. There has even been an important reduction in jobs in the public sector and tourism. Budgetary restrictions have made the creation of public employment more difficult and business services, very active in the creation of employment, is still a small sector unable to compensate cyclical movements in other sectors with negative trends. The latest developments indicate that services have begun to enter the cyclical wave of the economy, hence reducing the role that has characterised them as the great compensating factor in economic instability (Cuadrado and Raymond, 1991; The Economist, 1996). The latest studies carried out on the hypothesis of structural change point to a fragmented study of the branches of the sectors and a consideration of the growing processes of integration between manufacturing and services. The interest in business services as new elements within the framework of integration between manufacturing and services springs from here.
1.1.2 Services within industry
Creating a break from the manufacturing economy does not produce the consolidation of the service economy. All recent research shows that the type of economy being developed is one in which services and manufacturing are integrated. Excluding manufacturing does not produce consolidation of services; it presupposes the existence of a manufacturing base. Services impose themselves wherever there is a strong industrial economy and develop as a consequence of this. They do not represent an exclusive alternative.
The type of economy we are heading towards has been called a 'meta-industrial' or 'servindustrial' economy (Ruyssen, 1987; European Commission, 1987). The first appellation describes the move away from traditional manufacturing to a new type of industry, beyond the traditional notion of industry. The second appellation implies an integration of goods and services, industrial activities and service activities. In either case the two terms place special emphasis on the new type of economy, an offshoot of the previous one that does not involve the much defended or much reviled 'post-industrial' society. There are a series of features that define this type of society in which goods and services are integrated:
1. Diffusion of sectorial boundaries. The traditional sectorial boundaries, established by criteria such as the main activity of the company, begin to break down. Activities lead to the production of goods or services that are progressively more varied. Increasingly, the production of industrial goods implies the use of services that represent secondary activities (see, for example, the work of Bailly and Maillât, 1988), in a way companies generate different products, goods and services, at the same time. The presence of compounds of goods-services makes it difficult to
20 Business Services in European Industry
catalogue the real activity of the company. To know what a company produces, it is necessary to have recourse to a functional approach, as we shall see below. At the same time, the heterogeneity within services means that the boundaries that divide the different activities are frequently diffused.
2. Changes in production processes. Production methods are being modified at the same pace as business services and consumer services grow. The need to introduce compounds of goods and services induces flexibility in production structures, permitting much more functional and horizontal production and replacing the old hierarchical or pyramid organisations. The service society imposes itself on the former rigidity of manufacturing supply in which services did not represent what they do currently (Giarini, 1987, and Stahel, 1993).
3. Generalisation of new applied technologies. The changes in production systems are closely linked to the generalisation of the application of new technology and, more specifically, the incorporation of information technology. Companies and individuals incorporate new technologies in a generalised way into their daily activity, which was inconceivable in other times, as technology was limited to very specific activities. The extension of the use of technologies has enabled, amongst other things, the production processes to be made more flexible and compounds of goods-services to be created. The incorporation of technology in services has opened up new possibilities in the different existing scenarios (Gershuny and Miles, 1983; Rada, 1987; Faulhaber et alt., 1986, Freeman and Soete, 1987).
4. Internationalisation and the complexity of the markets. The changes in production and new technologies have brought the geographical locations in which to do business much closer. The markets are much nearer, although, at the same time, they are more complex. The need to penetrate new markets, now accessible, includes the need for information and services that facilitate the connection of different places. The internationalisation of capital has also contributed to the new service society (Marshall, 1988). Services and internationalisation have increasingly close links between them (Daniels, 1993; Aharoni, 1993).
5. The decisive contribution of human work in production. If a worker generally occupied a post next to a machine and this work was an easily replaceable factor in the manufacturing industry economy, human work is much more relevant nowadays and much less subordinated to physical capital (Martini and Vairetti, 1989).
A useful summary of the main differences between the manufacturing society and the new service-oriented society can be found in Illeris (1991), Ruyssen (1987) or Ochel and Wegner (1987). Reorganising and broadening the factors highlighted by these authors, table 1.3 summarises the main characteristics of the two different societies. In this way, the different trends can be identified in the new servindustrial society, including the integrating trends in the service society.
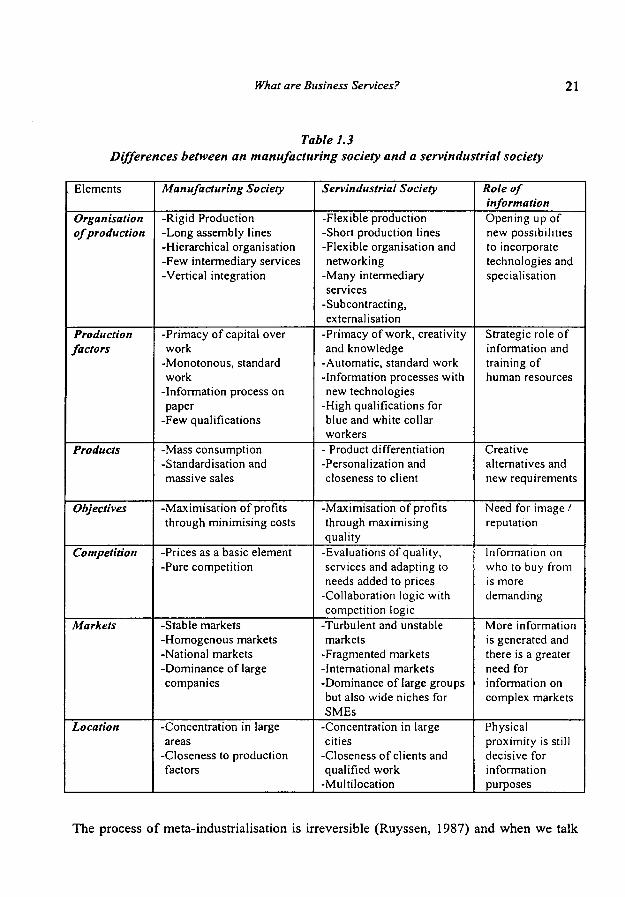
What are Business Services? 21
Table 1.3 Differences between an manufacturing society and a servindustrial society
. Elements
Organisation of production
Production factors
Products
Objectives
Competition
Markets
Location
Manufacturing Society
-Rigid Production -Long assembly lines -Hierarchical organisation -Few intermediary services -Vertical integration
-Primacy of capital over work
-Monotonous, standard work
-Information process on paper
-Few qualifications
-Mass consumption -Standardisation and massive sales
-Maximisation of profits through minimising costs
-Prices as a basic element -Pure competition
-Stable markets -Homogenous markets -National markets -Dominance of large companies
-Concentration in large areas
-Closeness to production factors
Servindustrial Society
-Flexible production -Short production lines -Flexible organisation and networking
-Many intermediary services
-Subcontracting, externalisation
-Primacy of work, creativity and knowledge
-Automatic, standard work -Information processes with new technologies
-High qualifications for blue and white collar workers
- Product differentiation -Personalization and closeness to client
-Maximisation of profits through maximising quality
-Evaluations of quality, services and adapting to needs added to prices
-Collaboration logic with competition logic
-Turbulent and unstable markets
-Fragmented markets -International markets -Dominance of large groups but also wide niches for SMEs
-Concentration in large cities
-Closeness of clients and qualified work
-Multilocation
Role of information Opening up of new possibilities to incorporate technologies and specialisation
Strategic role of information and training of human resources
Creative alternatives and new requirements
Need for image / reputation
Information on who to buy from is more demanding
More information is generated and there is a greater need for information on complex markets
Physical proximity is still decisive for information purposes
The process of meta-industrialisation is irreversible (Ruyssen, 1987) and when we talk
22 Business Services in European Industry
about a metaindustrial society we refer to a society in transition that goes from industrial parameters towards new service parameters. But the transition does not consist of a progressive elimination of old parameters, but rather of a gradual imposition of new ones, which act complementarily with the old traditional industrial schemes.
In the transition from manufacturing society to "servindustrial" society information plays a strategic role. In contrast to the traditional organisation of production, greater flexibility is obtained through the incorporation of new technologies and specialisation. Both processes permit the preparation of information on production processes that is easy to produce, store, transmit, exchange, subcontract and control. The break away from the classical, rigid structure of companies makes way for a much more horizontal division of work, with greater opportunities for specialisation, incorporation of services and external contracting.
From the point of view of production factors, the "servindustrial" society privileges work above capital, as the success of any business depends increasingly on information and training of the human factor. The most standardised jobs have been automated with the help of technology, but the central and strategic jobs have increased in quantity and quality. The high qualifications needed in many areas of the labour market contribute to this process, in both 'white collar' and 'blue collar' jobs.
The products of the new metaindustrial society combine standardised manufacturing goods with much more personalised goods from the service society. In general, the culture of mass consumption has weakened; hence, production is differentiated to a greater degree. The existing levels of information require this personalization and differentiation.
Companies maximise profits using dual reasoning: minimisation of costs and maximisation of quality. The latter is characteristic of the "servindustrial" society, in which quality control becomes an indispensable service. Flows of information that agents possess require the transmission of messages about quality, the services incorporated and the capacity to adapt to the needs of the client, as well as about price. Increasingly demanding markets require special attention to image and reputation. Competition in the "servindustrial" society affects several areas: prices, quality, services, image, reputation, etc. Competition in these areas sends out signals to markets, which make an overall evaluation on the different aspects involved. The need to strengthen many of these signals has lead companies to seek collaboration between one another, instead of the traditional pure competition of one set against the other.
The opening up of the markets by new information technologies, communication and transport has made them much more complex and much more international. The appearance of new needs for information on new markets requires business behaviour in an environment in which there is never enough information to meet supply needs. Markets, now global, have not only become more homogenous, but paradoxically more fragmented. The difference lies in that, if before fragmentation coincided with national
What are Business Services? 23
frontiers, today it coincides with the type of clients, tastes, lack of information and socio-cultural elements. In the service markets there are large industrial groups alongside many small and medium-sized companies, which occupy niche markets protected from strong competition.
From the point of view of location, services have helped to concentrate economic activity according to the logic of the different activities. However, the dual trend towards a fundamentally urban concentration and a multilocation made possible because of new technologies and the functional division of companies has dominated. New information technologies have made production in multiple locations possible, but they have not reduced the need for information through a physical meeting and proximity of supplier and client.
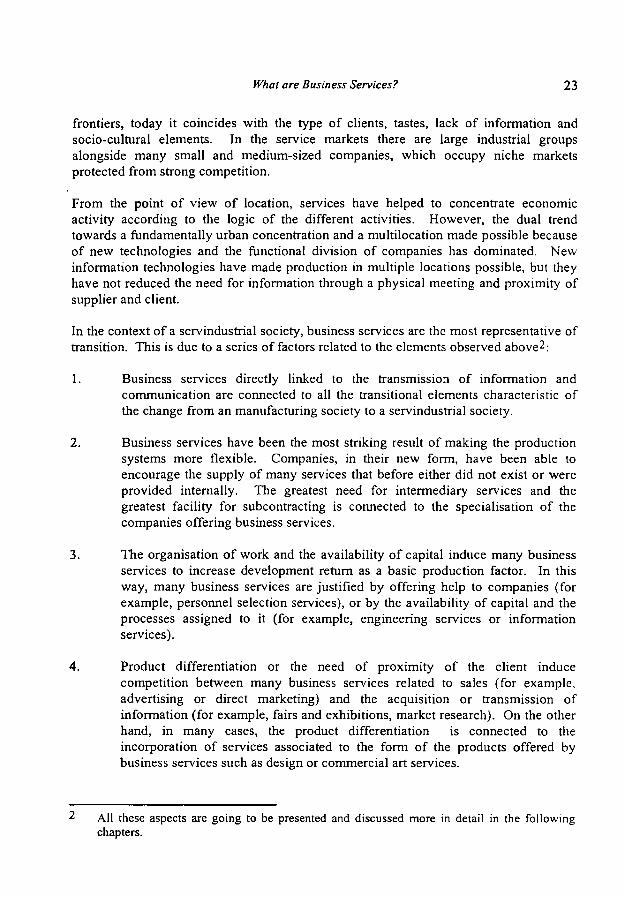
In the context of a servindustrial society, business services are the most representative of transition. This is due to a series of factors related to the elements observed above2:
1. Business services directly linked to the transmission of information and communication are connected to all the transitional elements characteristic of the change from an manufacturing society to a servindustrial society.
2. Business services have been the most striking result of making the production systems more flexible. Companies, in their new form, have been able to encourage the supply of many services that before either did not exist or were provided internally. The greatest need for intermediary services and the greatest facility for subcontracting is connected to the specialisation of the companies offering business services.
3. The organisation of work and the availability of capital induce many business services to increase development return as a basic production factor. In this way, many business services are justified by offering help to companies (for example, personnel selection services), or by the availability of capital and the processes assigned to it (for example, engineering services or information services).
4. Product differentiation or the need of proximity of the client induce competition between many business services related to sales (for example, advertising or direct marketing) and the acquisition or transmission of information (for example, fairs and exhibitions, market research). On the other hand, in many cases, the product differentiation is connected to the incorporation of services associated to the form of the products offered by business services such as design or commercial art services.
All these aspects are going to be presented and discussed more in detail in the following chapters.
24 Business Services in European Industry
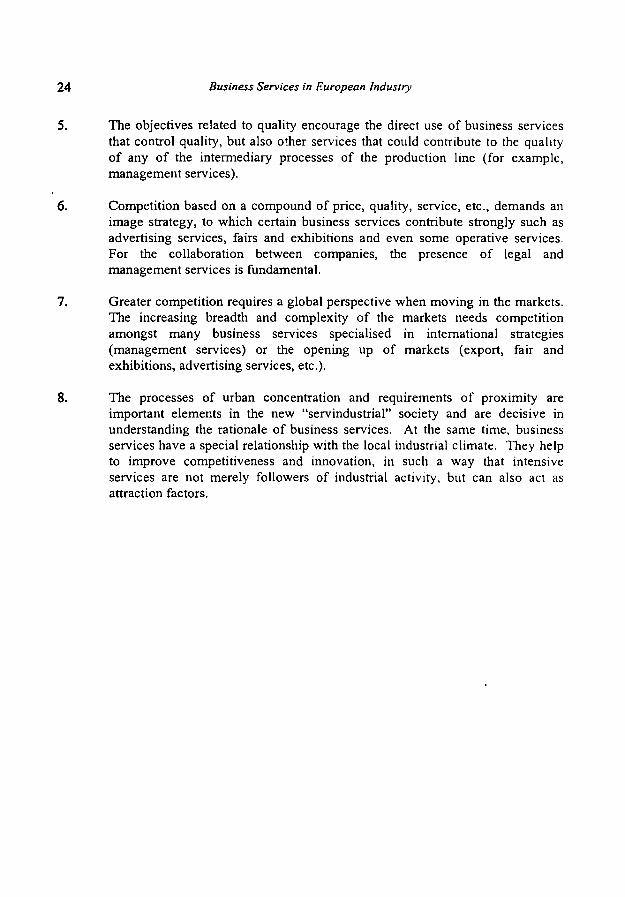
5. The objectives related to quality encourage the direct use of business services that control quality, but also other services that could contribute to the quality of any of the intermediary processes of the production line (for example, management services).
6. Competition based on a compound of price, quality, service, etc., demands an image strategy, to which certain business services contribute strongly such as advertising services, fairs and exhibitions and even some operative services. For the collaboration between companies, the presence of legal and management services is fundamental.
7. Greater competition requires a global perspective when moving in the markets. The increasing breadth and complexity of the markets needs competition amongst many business services specialised in international strategies (management services) or the opening up of markets (export, fair and exhibitions, advertising services, etc.).
8. The processes of urban concentration and requirements of proximity are important elements in the new "servindustrial" society and are decisive in understanding the rationale of business services. At the same time, business services have a special relationship with the local industrial climate. They help to improve competitiveness and innovation, in such a way that intensive services are not merely followers of industrial activity, but can also act as attraction factors.
What are Business Services? 25
1.2. A heterogeneous sector with a common nature.
On the surface, business services represent a varied and heterogeneous group of activities that seem to have little in common. They range from sophisticated and intensive services such as management consulting or technological services, to industrial cleaning or security services. They include very traditional professions such as lawyers or accountants, alongside new specializations such as telematic engineering or specialists in personnel recruitment. There are also age-old activities such as fairs and exhibitions and new activities like temporary work agencies or management consulting services. The heterogeneity of the sector has been the cause of its richness, as it covers many of the new economic activities. But equally it has caused its own marginality, by defining itself negatively, as comprising those activities that are not included anywhere else. This section shows briefly the origin of this negativity and it is at the same time suggesting what business services have in common.
1.2.1 Definition of the service
Traditionally, the service sector has been defined within residual categories. Services do not represent what either agriculture, or manufacturing do; they are part of the tertiary sector, as opposed to the primary or secondary ones. The object of study (data) and the subject (thinkers) have frequently employed residual categories in an attempt to apply the same interpretative categories to services as to goods. The consequences of this phenomenon have been far-reaching and the most extreme view is the one held by those who still think, along with some of the great classical economists, that services are unproductive activities.
An important attempt to classify services from a positive point of view consisted of the enumeration of their distinguishing characteristics: immaterial, transitory, unpredictable, etc. However, most of these qualities retain the negativity that defines services not by what they are but by what they are not (not material, not durable, not storable, not transportable, not accumulative, etc.). In recent years, there have been abundant criticisms of these negative definitions of services (see, for example, O'Farrell and Hitchens, 1989).
A pioneering step towards a positive approach can be found in the well-known article 'On goods and services' written by Hill (1977). He put forward the first positive difference between goods and services. Goods are physical objects that are appropriated and therefore are transferable between economic units. However, a service provided by an economic unit, represents a change to the condition of a person or goods belonging to other economic unit. The service is defined as a result.
In recent years, several positive interpretations of what services are have been developed, connected to interactive aspects and to demand, rather than merely to elements of supply. This has been particularly applied to business services (Martini 1990, 1992; Sharpe and Wemerheim, 1996; Rubalcaba 1997; Gadrey and Gallouj,
26 Business Services in European Industry
1998). Although this is not the place to discuss them in detail, the accepted approaches stress elements such as changes or utilities produced and interactive aspects of the service and related agents.
1.2.2 Definition of business services
In principle, business services can be identified according to the classical categories on types of goods^: 1) search goods, based on the selection of products, quality and diversification through attributes such as colour, style, consistence, smell, etc., whose quality can be evaluated before consumption; 2) experience goods, based on information on opportunity, taste, durability, etc. and whose quality cannot be evaluated until after consumption, and 3) credence goods where the quality can not be evaluated even after consumption. Services in general belong to the last two categories (Sapir, 1993), and most business services (market research and consulting for example) can be considered as belonging to the group of credence goods (O'Farrell and Hitchens, 1990). The role of credence in business services emphasises the relational aspect of their services. The former concept of simultaneity of production and consumption leads, in a positive way. to the current concept of interaction as the main characteristic of the service co-production.
Within the definitions of services, business services are traditionally defined as a subgroup. The criterion for definition is the clientele to which the services are directed. They are not services for collective or individual consumers, but for productive organisation, namely companies. The function that the group of services plays for the contracting company and the place they occupy in the normal production line of the company can be presented within this 'a priori' definition.
Business services can be defined in the following way: they are real activities (not financial) that influence first the competitiveness of companies (they are not incompatible with the service provision to consumers) through their use as intermediary inputs in the value chain, and via quality and innovation gains resulting from the interaction between supplier and client and service. This definition aims to have the following characteristics: -to be a positive definition, contrary to the traditional negative definitions based on what services are not rather on what they are; -introduce the function of the service in its own definition, as a way to link the tertiary nature to a competitive aim (business services are interesting because of the effects they produce); -insert the activity of the sector in the intermediary inputs of clients and the final outputs that incorporate gains (not always necessarily positive) in quality and innovation, even if they are only basic; and, finally, highlight the interactive aspect of the service, always co-produced interactively between two or more parties.
The origins of these categories are found in Nelson (1970) and Darby and Kami (1973), quoted in Tiróle (1988).
What are Business Services? 27
1.2.3 The dual nature of business services
What emerges from the debate on the definitions of business services is the need to get to the bottom of the nature of business services in order to distinguish them from goods
, and to be able to understand better their internal dynamics and make the ontology that defines their rationale and behaviour explicit. To this purpose, this subsection puts forwards the hypothesis that what defines the nature of the service is an 'existential' duality. This hypothesis can be defined as follows: the business service oscillates between becoming a service and becoming goods. The formulation of this hypothesis is not strange in the context of the growing integration of goods and services. All goods imply a service, entail a service, and all services imply goods, materialisation or some kind of physical concretiza tion. Probably, there are many goods, which behave more like services than goods, and services, which behave more like goods than services. Knowing the point at which a type of product, compound of goods-service, proceeds as goods or service can have extremely important consequences to establish a study of growth, the interrelations with other activities and the markets. The same effects of business services in competition with companies will depend on the implicit or explicit knowledge of the intrinsic elements of their nature. The hypothesis of the duality between goods-service of business services is manifested in the following tensions:
1.2.3.1 Tension between repetition and personalization
Companies offering business services try to supply the most standardised products possible in order to be able to repeat the service. The repetition of the same service for different clients represents a saving in terms of labour costs, making the most of scale economies, more opportunities for specialisation and reinforcing brand image. On the other hand, client companies seek a personalized service. This is because one personalized service adjusts to the real needs of the company, makes utility more effective and places the company in a position of relative advantage with the rest of the companies. In some cases, the fact that the supplier itself does not offer services to competitors is a requisite imposed by demand. This occurs in the advertising sector; for example, where the big agencies aim to have a client in each sector as they cannot have several clients who compete against one another. The same could be said of some consulting services. In short, all business services fluctuate between interest in repetition in supply and interest in personalized demand.
Obviously, this does not mean that supply does not obtain benefits from personalization, nor demand from repetition. When supply is personalized it manages to get hold of certain niche markets, by creating a high level of client loyalty. This happens in many small and medium-sized companies of the sector that use personalization as a resource in the competition with large service companies which are very standardised and have a strong brand image. Demand also benefits when it receives repeated services. On the one hand, it benefits from the type of service that it has experienced previously, and, therefore, there are greater guarantees that it will work than if it is done from the beginning again. On the other hand, a repeated service is often associated with large
28 Business Services in European Industry
companies that have a very strong brand name, a guarantee of the reliability of the service. In some cases, clients buy a brand image, a name and not a service. This, on occasions, means that the service can be of poorer quality, as the name can justify actions of doubtful cost effectiveness in the medium and long term.
As a result of all this, a trend towards closed products (similar to goods, standardised, with a very predetermined result) is crossed with trends towards open products (actions of personalized services, subject to permanent changes). This tension reflects the dynamic of the service that characterises a compound of goods and services.
1.2.3.2 Tension between the bipolar and the multipolar
There is a linear relationship between two poles within the production of goods: the seller and the buyer. This relationship is fairly interactive at the point of production and the response of consumers on the satisfaction produced by the goods. However, it is a unilateral relationship at the point of buying goods. In contrast, services have a permanently dynamic and interactive action throughout production. This is the 'servuction' indicated by Barcet (1987), quoted in De Bandt and Gadrey, 1994). The difference between goods and a service does not lie in the material nature of the product but in the different way it relates with the material. In goods, form is manifested as a finite whole; in services a movement implying a risk is generated, in other words not all the effects are known. In a service, correction generates a new service. A service is an act, not an object.
This characterisation of the nature of a service entails the shift from one bipolar linear model to a multipolar radial model. The most basic scheme of the service, within a linear relationship, is constituted by the consideration that the service introduces itself in the value chain of a company in the same way as any other intermediary input. The production of services such as consulting, advertising or legal advice tends to increase the value of the final product with the appropriate consequences for price and quality and on the final margin of the company (Porter, 1990). In this simple relationship, the client will have to look for a function that other goods can supply in the provision of the service. The client tries to use intermediary services at the lowest possible cost in order to obtain a predetermined performance.
As Gadrey (1994) shows, the first industrialisation of the service was produced in the sixties-seventies, by seeking scale economies rather than a passive and little fragmented clientele. In the eighties scope economies took their place, multiplying the number of services offered and being introduced in a less mechanical and passive way into client companies. The commercial functions and marketing are highly developed, within the growing fragmentation. The nineties are directed towards obtaining services with a high value added as a priority, automating the simple parts of the service and dealing with the problems of uncertainty with much more complex and individual solutions.
This development in services coincides with the strengthening of the multipolar
What are Business Services? 29
organisation of the service between agents, products and environments. The co-productions of business services normally involve several agents on the demand side and on the supply side, carrying out several products and subproducts, in changing environments, in which flexibility and adaptation of co-production is necessary at all
. times. This trend to the multipolar organisation of the service does not eliminate the trend to produce the service within a bipolar linear relationship between supply and demand, and in which objectives, tools, stages and results are easily planned, controlled and evaluated as they are in a goods economy. In this way, the linear models of service interaction between supplier and client tend to be complex and to multiply the number of phases or stages in the production process4.
1.2.3.3 Tension between simplicity and complexity
Although there are some very transitory and simple ones, such as the buying and selling of advertising space, business services usually involve a degree of complexity and durability. In these services, above all in the knowledge intensive ones, co-production implies the establishing of a series of relationships and interrelations between goods, services and, especially, work. Even in standardised business services multiple relationships are created, such as in industrial cleaning. A routine service like this one implies a co-definition of the service: setting up a suitable contracting system, making the cleaning materials available, selecting what is to be cleaned, co-ordinating the work with that of other services such as security, dealing with residuals, administration and management, etc. Much greater complexity can be found in knowledge intensive services like consulting, information, etc.
The growing complexity of the relationships of the service introduces the idea of covalence as indicated by Barcet (1991, page 64): 'this notion is used in chemistry to point out the connections which are made between atoms (or between ions) in order to obtain a combination or a chain whose value is determined by the different elements, knowing that, independent of their nature, each one has an essential place'. From this idea, Barcet deduces first the fact that a service is obtained through a combination of different acts; and second, and more crucially, the fact that 'the flow of money which circulates is not necessarily and strictly determined by the instantaneous activity flow' (page 65). There is a moment when the flow of money coincides with the flow of activity, but, later, the activity falls into a dynamic to which the flow of money does not adjust, at least not instantly. This leads to conclusions on risk, stability and competition in the service systems.
Another fundamental aspect of the idea of covalence is the fact that the service changes in nature faced with a change in one of its areas. The interaction between agents defines a system of relationships that changes in nature with the incorporation of new elements in the system. This is a natural consequence of the concept of covalence: supply and
O'Farrell and Moffat (1991) proposed a theoretical model with several interactive phases for a linear pattern.
30 Business Services in European Industry
demand constitute a double-linked service within an environment or system from which co-production emerges and whose nature changes faced with the introduction of any new element.
These systems are configured as internal objective factors in the relationship (contract), internal subjective factors in the relationship (conditions and development of service provision and development of expectations) as well as by factors outside the relationship (economic conditions, development of alternative experiences in the provision of similar services, etc.). A change in any of the elements of the system can lead to a partial or absolute variation in the relationship, that is never as it was before, as a change to one element induces change in the other elements to the extent that one could talk about a variation in nature.
A company which has contracted a specific design service with a supplier within a framework system of relationships (contract, economic environment, fluidity of the relationship between those who co-produce the service etc.) sees the nature of this service altered. For example, innovation by a competitor can shoot down the design provided by the supplier and therefore the new situation requires a radical change to the conception of the design. Contracts, relationships and the vision of the environment change. In a situation like this, the type of service and relationships of the system offered by alternative companies to the supplier originally contracted are particularly relevant, the latter could be replaced if a substantial change does not occur in the way it carries out its co-productive relationship.
1.2.3.4 Tension between security and risk5
Risk perception, fruit of the co-productive and covalent character of services, differs from the case of goods. When goods are purchased the risk inherent in the quality of the product is reduced by the existence of guarantees, endorsements, standards, repair services and insurance. In some businesses, a simple statement from the client on the defects perceived in the goods bought is enough to change the goods or return the money. In services the process is not the same. First, the risk connected to purchasing the service does not have as many mechanisms for risk reduction. A service cannot be returned, as it is an act that is consumed during the production, and not an object open to sell and return. On the other hand, services have a process of endorsements, standards and accreditation that goes much further than the current process for goods.
Services entail, in fact, a risk implicit in their nature: the uncertainty associated with a co-productive action whose objectives and tools can vary faced with any external change. Goods are repaired and you return to the previous situation. In most cases a service cannot be repaired. Repair implies a new service, based on a different philosophy. Its nature changes. Market research is not repairable in the strict sense of the word. If it has been wrong and the results are incorrect, a new study, taking into
Chapters four and five develop this point in depth.
What are Business Services? 3 1
account other factors previously excluded, can be undertaken. In this way it can meet the previous demands more precisely. The new study will vary in some ways or in nature: workers, interlocutors, interviewees, methodology, etc. The simple factor of time is already a factor of change in many services. Of course, the consequence of this
. risky nature of many services can be serious for both customers and providers.
The growing complexity of service relationships implies the vulnerability of the systems of co-production. The cluster of multipolar relationships that emerges causes the interdependence of some elements with others to increase and it augments the risk of a fault in the whole system. The vulnerability of the complex systems described by Giarini (1987; and Stahel, 1993) reflects how certain risks stand out in the service economy. This is why the co-production of services has internally tendencies for simplification and bipolarization, such as the mechanism to reduce risks and make complex service relationships more similar to the mechanical relationships of goods. There is, therefore, a trend to produce secure service products controlling the risky nature of services, even if this control will never be fully possible.
1.2.3.5 Tension between possession and participation
The consumption of goods is basically unilateral in nature if we consider the consumer opposite to the product that is observed, compared and selected according to rational capacity. The potential development of these goods is already determined a priori: the value of use depends on the duration of time and the evaluation of the results of the goods (such as in the purchase of a car that can work out well or badly) showing that the potential development of the goods was already contained at the time of purchase (the car was good or bad).
The consumption of a service obligatorily has an interlocutor, which prevents the same reasoning being applied to services as to the consumption of goods. In this case, it is important to create a fruitful relationship that can not be pre-established. The potential development of this relationship unfolds over time, it is not fixed at the time of purchase or contracting but it is verified according to the intelligence the two parties apply in co-production. In this sense, services are more ephemeral in nature, as they change faced with a new phenomenon (as was deduced above regarding covalence), whereas goods, by nature, do not change unless a radical transformation or dilapidation of the goods is carried out consciously after purchase.6
The human reason applied to the service alters its nature: the service is the fruit of a combination of rational faculties. The reason applied to the goods can, at most, maximise the utility produced, but it cannot alter its nature. Services are configured
The use of goods for a different end than the one initially established does not change the nature of the goods, only the use. A bier bottle's nature is always linked to something people can drink, even if a foolish man use it to water his flowers and green. However, a gardener can change the nature of his service if our strange man request him to spy his neighbours.
32 Business Services in European Industry
with a meaning that depends on the intentions, agreements and potential of the participating agents. On the other hand, goods are configured with a meaning, which is only altered when the service is applied. For example, the consumption of petrol is an act that contains the meaning of the goods in question, the nature of petrol cannot be altered although it may be used for purposes other than the original ones set down (e.g.: incendiary use). In contrast, the discovery that petrol can be used in manufacturing and cars was possible thanks to human rationality applied to the task of observing and researching (in other words, a service). A provision of services made by a consultancy firm can consist in different services according to the situation, circumstances and human elements. The client and the provider can agree in a different kind of report, with different objectives, perspective or methodologies, all these changes during the same service production. The substance of services can change during the production.
Services not only change in nature over time, but also serve to change the nature of goods. However, the opposite is not true: goods alone cannot alter the nature of a service without the existence of another service. Advertising, design or consulting are altered by the incorporation of new information and communication technologies, but this alteration is only possible through the redefinition of the system of co-production that the agents determine. Goods provoke, but do not determine, an alteration in the nature of services.
In short, services unfold a hidden potential at the point of the first co-productive act, whereas in goods a predetermined potential is unfolded. In a certain sense, it is a service that makes goods unfold their potential, but always connected to the material object of the action. In a business service, there is no need for a connection with a physical object, instead there is one with an initial act, after which new acts laden with elements that cannot be predetermined and are hard to control follow. You possess goods; you never totally possess a free service. Domestic service only has a predetermined performance, in accordance with the wishes and orders of the master, in a slave society. In a free service, the will of both parties and mutual understanding are fundamental requisites for attaining the satisfaction of both parties in the service. And even still, the satisfaction will never be full, as what remains hidden in the potential of the service always supersedes what is revealed while it becomes an act.
In this way, the expectations of the possibility of continued growth in a service are much greater than in the possession of goods. Goods are possessed, and possession leads from the human condition to the economic law of decreasing marginal utility. The more you have, less additional satisfaction is gained. In services it is not applied in a similar way, because the service provision lead to another service provision, with a new set of expectations and relative levels of satisfaction. For this reason, goods and advertising of goods increasingly try to offer a different service; they attempt to change the apparent nature, although the real nature is the same. An attempt is made to stimulate the attraction of the new, although the objective can be to sell the same old product; to stimulate, via the recourse to new goods, the provision of a service. In this way, many industrial manufacturers are like traditional large services in which an attempt is made to
What are Business Services? 33
stimulate this attraction: banking, transport, retail, and tourism.
In contrast, business services wage much more local battles, from barricade to barricade, from need to need, from service to service. It is a battle in which the decisive arms are
. not directed against the decreasing marginal utility and the possible innovations (clearly identified) of other services. Instead, they are employed against markets fragmented by different economic activities, different levels of expectation, the degree of uncertainty in the markets, reputation, loyalty, tradition and, in general, all the problems related with the lack of information. In business services, the markets reflect the behaviour of a service much more than in traditional services, where there are more similarities with the large manufacturing industries (proof of this is the growing concentration of traditional services). In business services, the consequences of continuous potential (not predetermined at the start) and the participation (as a feature superior to possession) come to condition all aspects of the dynamics and markets.
1.2.3.6 A sym m et rie al nature
Bearing in mind that the characteristics of business services will be studied in the following chapters, the subject of the present point and the hypothesis on the duality of business services (becoming goods and becoming services) is summarised here. The first tension indicated how a service tends to be personalized due to the interests of demand fundamentally and to be repeated in the basic interests of supply. The second tension showed the shift from linear bipolar relationships to multipolar and radial relationships. The third was produced in simple systems of co-production similar to those of goods and complex co-production systems characteristic of covalent systems. The fourth comes from the tension between the security that characterises goods and risk and vulnerability implicit in many business services. Finally, a last tension occurred between the continuous unfolding of the potential of a service and the prior revelation that characterises goods, associated with the difference between possession and participation, two different modes of applying economic reasoning and logic.
All these arguments confirm the existence of a duality in the nature of business services: they become more services and become more goods at the same time; and they do not escape the composition goods-service that characterises all contemporary economic processes. However, this duality is manifested in a series of tensions that do not give an unbiased result. The trend to show the service as a service becoming a service dominates clearly over any other typical manifestation of goods. The trend to personalize prevails over standardisation, multipolarity supersedes bipolarity, complexity grows at the cost of the simplicity, risk is increased hence reducing secure and predetermined production, the hidden element in business services is greater than what is revealed, participation is greater than possession. At least in the case of business services, it can be said that there is an asymmetrical duality: becoming a service predominates over becoming goods in all its ontological dimensions. Business services are more service-oriented services than good-oriented services.

34 Business Services in European Industry
These results lead to some interesting policy implications. If business services are characterised by strong interactive processes and are not mainly characterised by associated products, then policies should be addressed to those agents who interact, more than to the products which are delivered. Policies should address to stimulate the fair markets of business services, and the basic educational and employment sources. R&D strategies, for example, should address first to process innovation, and second to product innovation. Quality policies should be addressed more to guarantee the quality of providers than to guarantee the quality of products. The provision of public services should take into account the agents, needs and possibilities of interaction between public and private... However, all these points will be reconsidered in further chapters.
1.2.4 Statistical classifications and related problems
Logically, the conceptual depth of what business services are cannot be expressed completely in definitions and statistical classifications. In order to obtain statistical operating capacity with the theoretical definition and to identify the services most closely related with quality and innovation, certain traditional business services are excluded with a large clientele of consumers, and which do not aim to seek deliberately quality and innovation for the company, but are the result of the consolidation of very global activities which are generated by socio-economic operating capacity. They are transport services, retail, banking and insurance, tourism, etc., that, together with business services, constitute the so-called group of producer services. Business services are part of producer services. The position of business services within the different economic activities is shown in figure 1.1. The dash line shows the interrelation among all economic branches.
It is worth adding that this clear distinction between economic activities is not so clear if we consider several elements: the dissolution of boundaries, the intersection of clients in companies and final consumers, the existence of multiple secondary activities, etc. In a strict sense, jobs classified within the service industries can be considered to be manufacturing jobs, and many jobs in manufacturing industries are service ones. The definitions presented tend to centre the discussion on the type of action and product, rather than the type of employment that the action or product involves.
The attempts to classify services have been many and varied. Amongst the best known, are Browning and Singelmann's traditional classification of 1978 (distribution services, producer services, social services and personal services), Nasbaumer's functional classification in 1984 (marketable services, services performed in situ, durable services and non-durable services), Ochel and Wegner's one from 1987 (permanent and temporary services, reversible and irreversible services, private and collective provision of services, non-marketable and marketable services) or those of international organisations (see González Moreno, 1990) for example. In fact, most researchers on the subject have ended up by proposing their own classification, or by adhering, with reservations, to some of the main classifications used.
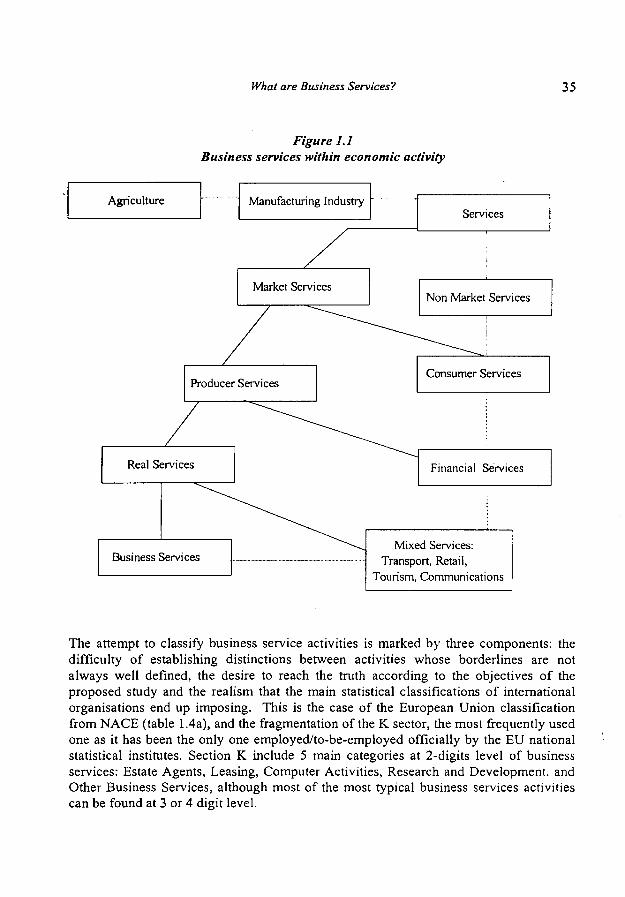
What are Business Services? 35
Figure 1.1 Business services within economic activity
Agriculture Manufacturing Industry Services
Market Services Non Market Services
Producer Services Consumer Services
Real Services Financial Services
Business Services Mixed Services:
Transport, Retail, Tourism, Communications
The attempt to classify business service activities is marked by three components: the difficulty of establishing distinctions between activities whose borderlines are not always well defined, the desire to reach the truth according to the objectives of the proposed study and the realism that the main statistical classifications of international organisations end up imposing. This is the case of the European Union classification from NACE (table 1.4a), and the fragmentation of the K sector, the most frequently used one as it has been the only one employed/to-be-employed officially by the EU national statistical institutes. Section K include 5 main categories at 2-digits level of business services: Estate Agents, Leasing, Computer Activities, Research and Development, and Other Business Services, although most of the most typical business services activities can be found at 3 or 4 digit level.
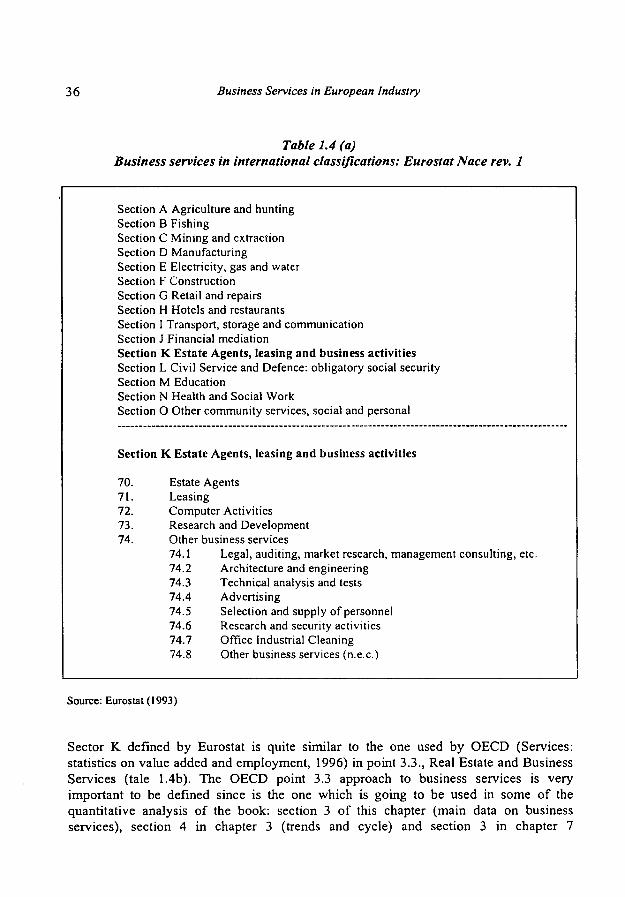
36 Business Services in European Industry
Table 1.4 (a) Business services in international classifications: Eurostat Nace rev. 1
Section A Agriculture and hunting Section Β Fishing Section C Mining and extraction Section D Manufacturing Section E Electricity, gas and water Section F Construction Section G Retail and repairs Section H Hotels and restaurants Section I Transport, storage and communication Section J Financial mediation Section Κ Estate Agents, leasing and business activities Section L Civil Service and Defence: obligatory social security Section M Education Section Ν Health and Social Work Section O Other community services, social and personal
Section Κ Estate Agents, leasing and business activities
70. Estate Agents 71. Leasing 72. Computer Activities 73. Research and Development 74. Other business services
74.1 Legal, auditing, market research, management consulting, etc. 74.2 Architecture and engineering 74.3 Technical analysis and tests 74.4 Advertising 74.5 Selection and supply of personnel 74.6 Research and security activities 74.7 Office Industrial Cleaning 74.8 Other business services (n.e.c.)
Source: Eurostat (1993)
Sector Κ defined by Eurostat is quite similar to the one used by OECD (Services: statistics on value added and employment, 1996) in point 3.3., Real Estate and Business Services (tale 1.4b). The OECD point 3.3 approach to business services is very important to be defined since is the one which is going to be used in some of the quantitative analysis of the book: section 3 of this chapter (main data on business services), section 4 in chapter 3 (trends and cycle) and section 3 in chapter 7

What are Business Services? 37
(productivity). There are four main similarities between the Eurostat and OECD classifications: - both included most business services in items K (Nace 70-74) and 3.3. respectively; - Real Estate is considered as the first specific category, due to its different characteristics; - there are common specific items for advertising and technical services; the categories "other business services" are still very wide, including important activities not included elsewhere. On the other hand, differences are also wide. Computer services are not located in the same way. Legal, accounting, management consulting, etc., are too aggregated in the Nace classification while the OECD classification allows a better coverage. Personnel services and operative services (cleaning and security), highly sensitive from the employment point of view are quite well covered from the Eurostat point of view, while current OECD classification miss them. Finally, the treatment of major items like real estate, renting and leasing, or research and development, is not the same for the two classifications concerned.
Table 1.4 (b) Business services in international classifications: OECD service statistics
1. Wholesale and Retail Trade, Restaurants and hotels 2. Transport, Storage and Communications 3. Finance, Insurance, Real Estate and Business services
3.1 Financial Institutions 3.2 Insurance 3.3 Real Estate and Business Services 3.4 Auxiliary financial and insurance services
4. Community, Social and Personal Services 5. Producers of Government Services 6. Other Producers
3.3 Real Estate and Business Services 3.3.1 Real Estate except dwellings 3.3.2 Dwellings 3.3.3 Business Services
3.3.3.1 Services to enterprises 3.3.3.2 Legal Services 3.3.3.3 Accounting, auditing, and bookkeeping services 3.3.3.4 Engineering, architectural and technical services 3.3.3.5 Duplicating and typewriting services, etc. 3.3.3.6 Miscellaneous professional services 3.3.3.7 Advertising services 3.3.3.8 Renting of movables 3.3.3.9 Other business services
Source: Services Statistics on Value Added and Employment, OECD (1996).
38 Business Services in European Industry
From a practical point of view both Eurostat and OECD classification face similar problems. Once the classification is adopted, many "holes" are found due to the lack of data for many indicators and the lack of comparability between the member countries. This affects the OECD data to a large extent, since statistical systems are very different in countries like USA, Germany, Japan or France. The European Union is becoming a more harmonised area nowadays, and it will be more so in the future, once the Nace rev. 1 will be more consolidated, and the Regulation of Structural Business Statistics implemented, but there are still important obstacles to provide comparable data on business services (see more in Rubalcaba 1996; and Antón, 1997).
Another practical problem is the different relative weight of some activities and the relative consideration of many as business services. For example, some studies on business services include only advanced business services, like computer services, marketing services or engineering services; they exclude others which are very important from the employment point of view (personnel, cleaning, security). Some others studies exclude real estate, renting, research and development, etc., because the specific characteristics of these activities. In general, some of the items included under the Eurostat section K (70-74) and OECD service sector 3.3 can be criticised as not belonging to business services, depending on the researchers' own interest. However, almost all activities in section K and group 3.3 keep a certain common basic characteristic: they all require a certain type of interaction between supply and demand, even if the service is very standardised and operative; they can all be considered as intermediate inputs or investments for enterprises, even if some of them have a large part of final consumers as clients; they all can affect the enterprises competitiveness, through gains on quality, reduction of costs, or both.
In addition, there are current pragmatical problems, which avoid excluding some "outlier" activities, due to the lack of desegregated data. The most important case here is the real estate and renting related activities. They cannot currently be excluded in macroeconomic analysis on business services based on national accounts, even if they should be treated in a separate way; the current statistical system does not allow the isolation of these activities for a sufficient number of countries. The same applies to operational services. Of course, the inclusion of real estate and operational services has to be taken into account since the first is very relevant in terms of value added (40-50% of total OECD 3.3; not significant in terms of employment) and the second in terms of employment (20-30% of the total OECD 3.3; not significant in terms of value added). Due to the definable similarities of all these activities like business services and the existing difficulties to isolate them, the macroanalysis used in section 3 of this chapter and sections 4 and 3 of chapters 3 and 7 respectively will be partly based on the OECD 3.3. item, which is the best one to show some comparable data between European countries and the USA, to underline some time trends and to explore all issues related to value added and employment data of the business service sector as such, allowing comparison with other economic sectors.
What are Business Services? 39
Looking into the source of the problems related to classifications, it is possible to realise that these have been much greater for business services than for services as a whole and for some traditional services like banking, trade, transport or tourism. The newness of the sector, the continuing appearance of new activities, the proximity of one activity to another, the lack of interest shown by statisticians have provided a multiplicity of classifications and a lack, even today, of criteria for the study of business services.
In general, the group of official classifications suffers from the problem of residuality, among others (see Rubalcaba 1996). Then, the product classifications have the added difficulty of defining the products that exist in business services, which is a thorny question. The classifications by activity have a serious drawback, considering that a lawyer in a manufacturing company belongs to manufacturing whereas a worker who carries out a manual task in a design company belongs to services. As O'Farrell and Hitchens (1990, pagel65) observe: 'part of the confusion arises from the practice of defining services by listing industries rather than trying to articulate the essence of service activity that all such industries share'.
Private classifications have followed more functional criteria than official ones, in both senses of the word. On the one hand, through accommodating with greater flexibility to the activities shown in the economy. On the other hand, through classifying business services according to the function they develop (and, therefore, their nature) in the development of the producer activity of the company. The classification proposed by the FAST programme (European Commission, 1989) synthesises this type of approach. The idea is to identify the functions that justify the use of business services for a company, and, from there, to associate the different services involved. The main functions indicated were Administration, Human Resources, Production and Leasing, Research, Information and Communication, Sales and Markets and Operational. Although since then many studies maintain most of these functions, it is true that some of them are gradually being considered separately, as in the case of leasing, R+D, operational services with low value added. In fact, many similar functional classifications are used now, but they differ in their internal composition; they become 'functional' for the objectives of the study. In our case, for the treatment of data that follows, we have chosen a very similar approach to the FAST programme, although there are differences. The most important of these is the separation of the functions of information and market, concerning marketing and communication. The first highlights the character of the interactive knowledge of the market, whereas the second highlights the transmitting aspect of image and information aimed at sales.
This type of functional classification aims to define a service from the existing interrelations between demand, supplier and service within the co-production carried out in a transitive way. As a consequence of this approach, classifications have also been developed not only by functions, in a strict sense, but by modes in which co-production is carried out (consulting, organisational, operational and control intervention), by relationship levels, by type of work or occupation or by type of qualification required by
40 Business Services in European Industry
the action7
Other classifications of business services have followed different criteria. There are classifications according to the service, establishing services the use of which is obligatory (through functional necessity), compulsory (through legal necessity), or knowledge intensiveness (linked to new technologies or strategic areas). This ordering is useful for an analysis of the behaviour of many business services. The classification according to the place of supply is also important. A distinction is made between internally linked services, produced within the company, and externally linked services, produced outside. Finally, the classifications according to the market are accompanied by classifications according to the type of product or expertise supplied. All these new approach classifications are useful for new studies on business services but are very difficult, more often than not impossible, to be implemented in the traditional statistical systems.
Continuing the reasoning exposed before, the existing information on business services suffers from problems of marginality, stemming from the industrialist approaches dominating traditional statistics and the classical conception of economists who consider services as secondary activities to economic growth. This is why service activities have always been included in residual groups: what is not agriculture, what is not manufacturing, etc. In this way, business services have been considered as a kind of dumping ground where the heterogeneous activities not represented in other sectors are included. This situation has made the business service sector, even though it is one of the most dynamic in advanced economies, one of the worst covered by existing statistics. Most of the official figures only consider one single group of business services at best. Only recently the new NACE is managing to consider new additional groups when we go down to three digits. In any case, even within the new NACE, business services are barely and badly represented in some important groups (Martini, 1990; Rubalcaba, 1996; and Antón, 1997). Important activities such as management consulting, auditing or fairs and exhibitions, by being placed on the common dumping ground, together with very different activities, will not receive individual treatment even in the new NACE rev.l. They will remain at aggregated level. The problems of official statistics in the sector grow because of the lack of harmonisation between criteria used by the different countries or in regions. The activities covered are not always the same. The methodology employed also does not permit a satisfactory level of comparison to be ensured. For these reasons it is appropriate to use private sources of information to complement the official ones, as, despite limitations on their representative nature, they give information on activities not recognised by official statistics.
A good summary of the classifications that emerge in a functional related approach can be found in Martini, 1990, Rubalcaba 1996 and Rubalcaba and Antón, 1997. The implications of this approach to the current statistical information systems and the NACE rev I classification are also considered in these works.
What are Business Services? 41
1.3. A young but already important sector
The recent advances in aspects associated with the nature of the sector and its functions in the economy have revealed the importance of the sector and the need for it to be taken into account by academics, statisticians and politicians. This section is dedicated to the main quantitative data on the sector in Europe, allowing a better justification for further related-actions. The data available at present shows how underestimated the sector was a few years ago. The sector (section K) was attributed to represent a 5-6% of the total economy, while current better estimates substantially increase this figure.
1.3.1 Sources of Statistical Information
This third section presents the results of macroeconomic analysis of the two most representative sources at a European level at the present time that allow a comparison to be made between the majority of European countries: National Accounts, Other official sources and the Panorama of the EU Industry. In all cases this section tries to use as much updated data as possible through the use of files and CD-ROM data bases provided in 1998.
National accounts are together with the input-output tables (only available in comparative terms in a restricted group of countries), the main source used in sectorial studies. There are two main national accounts sources: Eurostat and OECD.
a) Eurostat national accounts. The data currently available at a European Community level (Eurostat, 1996) only permits the use of the group "other market services" within the group of "market services" as a more reliable approach to business services. This comes from a classifications system previous to the Nace rev. 1, section K and Nace 70-74 activities. This "other market services" includes private full consumer services which does not allow us to make a reasonable identification of business services as such.
b) National accounts compiled by the OECD (1996) do contain specific information on Real Estate and Business Service (group 3.3.) and, therefore they will be used very extensively here since they are probably the most current representative expression of the business service sector as such, allowing comparisons between sectors, countries and growth rates. Of course, a further breakdown would be more suitable to measure the different types of business services (for example three different groups: real estate and renting; advanced business services; and operational business services); but this disaggregation level is still not covered enough by national statistical institutes.
42 Business Services in European Industry
Other officiai data. Other Eurostat data are suitable for approaching business services like business statistics, SME reports, international trade statistics, and others, which are going to be used as much as possible throughout the book. The implementation of Nace rev. 1 is making business services a much better covered group of activities, but the current situation is still far from the required one for analytical purposes.
The private data from professional associations, contained in Panorama of the EU Industry (European Commission, 1993, 1994, 1995 and 1997) permits a fragmented study by specific activities, despite many quantitative and qualitative problems in the statistics. Information for around 25 business services activities does exist, although data must be taken with caution because the lack of coverage and quality vary a lot depending on the activity considered.
1.3.2 The volume of business services
According to estimates drawn up by using the best data available from the OECD and Eurostat, in 1994 business services employed over 11.8 million people in the European Union (EUR-15), who worked in over two million companies and generated around 900 billion Ecus per annum (gross value added)*5 It is important to underline that in this year it represented 8.6% of the total employment in Eur-7 (Western Germany, France, Netherlands, Finland, Sweden and Denmark), a similar weight to banking and insurance, transport and communications all together (graph 1.3a).
The data on value added are even more striking (graph 1.3b), as the high relative productivity of some activities like real estate places the participation percentage at 16.2% of the value added generated in EUR6 (a combination of Germany, France, United Kingdom, Spain and Austria), above the percentages for retail and hotel and catering industry (14.0%) and government services (13.1%). The agriculture and manufacturing industry group generated 34.5% of value added in 1994. In the United States the business services and real estate figures are even higher: 10.4% of employment, and 19.2% of value added, representing exactly two thirds of all American agriculture and manufacturing industry.
Exactly, 11,635,000 jobs and 864 billion Ecus, with the estimates for EUR 15 based on the Services Statistics on Value Added and Employment in the OECD (1996) for EUR7 and EUR6 respectively, and 2,690,130 companies with estimates from the Enterprises in Europe (Eurostat, 1996). In all cases estimates are done for Real Estate and Business Services; Eurostat section K and OECD group 3.3. According to other types of estimates and statistical sources, jobs vary between 9.5 million and 14 million, whilst value added varies between 700 and 1200 billion Ecus.
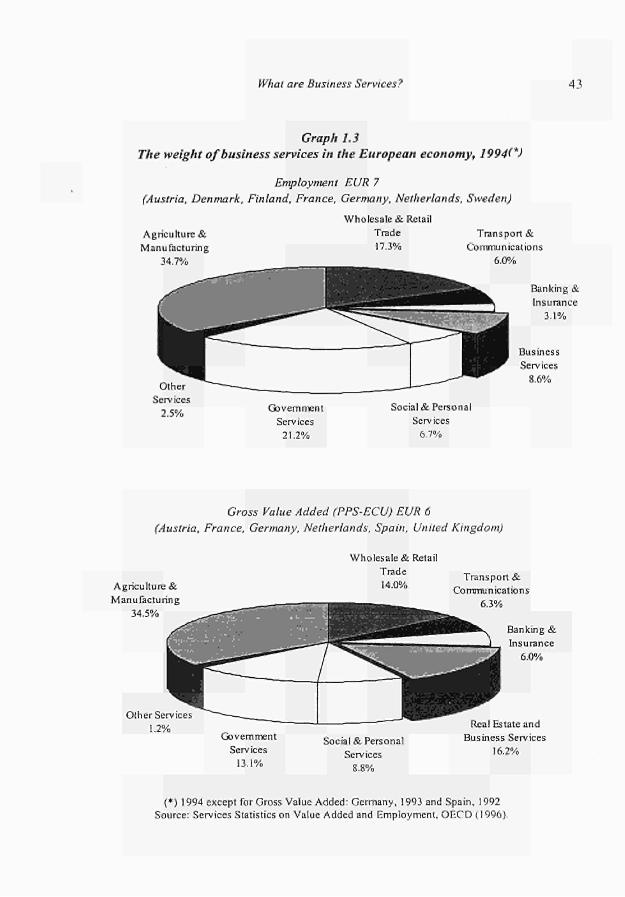
What are Business Services? 43
Graph 1.3 The weight of business services in the European economy, 1994(*)
Employment EUR 7 (Austria, Denmark, Finland, France, Germany, Netherlands, Sweden)
Agriculture & Manufacturing
34.7%
Wholesale & Retail Trade 17.3%
Transport & Communications
6.0%
Government Services
21.2%
Social & Personal Serv ices
6.7%
Banking & Insurance
3.1%
Gross Value Added (PPS-ECU) EUR 6 (Austria, France, Germany, Netherlands, Spain, United Kingdom)
Agriculture & Manufacturing
34.5%
Wholesale & Retail Trade 14.0%
Other Services 1.2%
Government Serv ices
13.1%
Social & Personal Services
8.8%
Transport & Communications
6.3%
Banking & Insurance
6.0%
Real Estate and Business Services
16.2%
(*) 1994 except for Gross Value Added: Germany, 1993 and Spain, 1992 Source: Services Statistics on Value Added and Employment, OECD (1996)

44 Business Services in European Industry
Table 1.5 Employment, gross value added and firms in business services (*)
Austria Belgium Denmark Finland France Germany (West) Greece
Ireland Italy Luxembourg Netherlands Portugal Spain Sweden United Kingdom EUR (average) EUR 7-6 (total) EUR 8 (average) (":' EUR 15 (total) "*> United States " " EUR 15 (Manufacture EUR 15 (services) EUR 15 (total branche
Number of Firms 1995
35 484 110 024 90 742 31 255
427 074 642 339
19301
11 773 378 099
3 440 88 326 23 957
361 425 107 205 359 686
2 690 130
g +Agriculture)
5)
Employment (*)
1994
151 191 m
156 125
1.811 2.805 "*
496
601 <6' 266
2 013 '8 |
-5 8 1 0 ' "
-11 635 12 055 48 069 88 707
136 776
Business Services in Total
Employment
4.5% 5.1% "> 6.3% 6.5% 8.2% 9.8% '2'
9.3%
5 .1%"" 6.6% 9.3% ' " 7.1% 8.6% ' " 7.6% 8.5%
10.4% 35.1% 64.9%
100.0%
Gross Value Added (**)
1994
20
18 11
202 220
4 131
41 "" 3 ,5.
4 8 ' 7 |
29 146
-676 '""
-864
1 038 2 098 3716 5814
Business Services in Total Value Added
11.8%
16.6% 15.6% 18.0% 14.2% 8.2%
1 6.4% 5.7%
10.7% 17.5% 19.5% 14.0% 15.8% 16.2% 15.3% 19.2% 36.1% 63.9%
100.0%
(*) Thousand of workers (**) Gross Value Added in ECU current and market prices except for Denmark, Greece and United Kingdom (factor cost) and Finland and Sweden (basic values) (1) Belgium, 1992 estimating from Eurostat data, National Accounts. (2) Germany data on business services are in the item "other business services" including auxiliary financial services and some personal services. (3) Greece, 1993 data is estimated from OECD and Eurostat National Accounts. (4) Netherlands, 1992. (5) Portugal, 1989 (6). Employment in Spain from EPA, Labour Force Survey, Boletín Mensual de Estadísticas, INE. (7) Spain, 1992. (8) Employment data for UK are estimates from OECD and Eurostat national accounts based on number of employees. (9) Employment EUR 7 is the sum of Austria, Denmark, Finland, France, Germany, Netherlands, and Sweden (10) Value Added EUR 6 is the sum at current prices of Austria, France, Germany, Spain, Netherlands y United Kingdom. (11) EUR 8 is the sum of EUR 7 plus UK. (12) Estimates from the author based on different Eurostat and OECD reports. (13) United States 1993 Sources: OECD (1996) Services statistics on value added and employment (Value Added and Employment data) and Eurostat (1997) Market Services, Statistics in Focus 1997/4 (Number of Firms data)
What are Business Services? 45
Of course, these figures must be weighted by the relative importance of each business service activity. Some rough estimates at this aggregated national accounts level can evaluate the internal composition of business services as follows. Value added: real estate related-activities, 40-50% (real estate, renting and dwellings); advanced business
, services, 35-45% (computer, technical, marketing, management consultancy, some personnel services); operational business services, 1-5% (industrial cleaning, and security services mainly); other business services, 5-10% (legal and accountancy services, some personnel services, fairs and exhibitions, etc.). Employment: real estate and renting related activities, 5-15%; advanced business services, 35-45%; operational business services, 25-30%; other business services, 20-25%. This means that the high relative productivity levels of business services are strongly conditioned by the relative productivity levels of real estate (extremely high) and advanced business services (high). Operational business services and other business services are very personnel-intensive services having a low relative productivity (these productivity facts will be further analysed in chapter 7)
The data included in Table 1.5 gives an idea of the relative importance of business services across Europe. Employment, as described earlier, reaches figures more than 9% of total employment for some key European countries like Germany, United Kingdom or the Netherlands, pushing the average to 8.5%. On average, this share of labour force generates around 15.6% of Value Added. However, there are important differences between the countries. For example, the United Kingdom produces value added close to 20% on business services while Portugal less than 6%. In terms of units (or number of enterprises) the relative importance of business services is even higher, with percentages around 15-20% of the total national enterprises for some countries (Denmark, Netherlands, United Kingdom and Luxembourg).
To present the different activities embraced in business services it is necessary to use the private data of the Panorama of the EU Industry, and after being purified as far as possible, it is shown in table 1.6. In the table, the activities are classified by functions carried out in companies. The data of the table indicates that nearly 900,000 companies in the sector generate 575 billion Ecus employing over 9 million workers, figures which are slightly lower than those produced by the National Accounting of the OECD. The figures are totally coherent when the coverage of data tends to be lower than the total^, albeit there being problems of double entry accounting and overestimates. The differences between one source and another lie in the methodologies, activities included and statistical references used.
The data are based on samples obtained from companies that belong to professional associations, in which coverage is nearly always less than 100%.
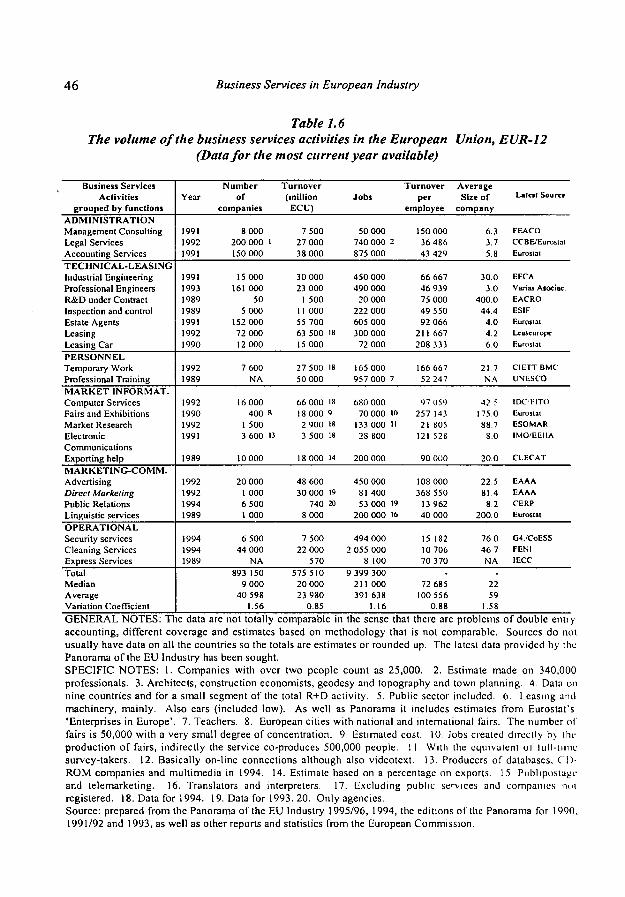
46 Business Services in European Industry
Table 1.6 The volume of the business services activities in the European Union, EUR-12
(Data for the most current year available)
Business Services Activities
grouped by functions ADMINISTRATION Management Consulting Legal Services Accounting Services TECHNICAL-LEASING Industrial Engineering Professional Engineers R&D under Contract Inspection and control Estate Agents Leasing Leasing Car PERSONNEL Temporary Work Professional Training MARKET INFORMAT. Computer Services Fairs and Exhibitions Market Research Electronic Communications Exporting help MARKETING-COMM. Advertising Direct Marketing Public Relations Linguistic services OPERATIONAL Security services Cleaning Services Express Services Total Median Average Variation Coefficient
Year
1991 1992 1991
1991 1993 1989 1989 1991 1992 1990
1992 1989
1992 1990 1992 1991
1989
1992 1992 1994 1989
1994 1994 1989
Number of
companies
8 000 200 000 1 150 000
15 000 161 000
50 5 000
152 000 72 000 12 000
7 600 NA
16 000 400 8
1 500 3 600 13
10 000
20 000 1 000 6 500 1 000
6 500 44 000
NA 893 150
9 000 40 598
1.56
Turnover (million
ECU)
7 500 27 000 38 000
30 000 23 000
1 500 11 000 55 700 63 500 15 000
27 500 50 000
66 000 18 000 2 900 3 500
18 000
48 600 30 000
740 8 000
7 500 22 000
570 575 510
20 000 23 980
0.85
18
18
18 9 18 18
14
19 20
Jobs
50 000 740 000 2 875 000
450 000 490 000
20 000 222 000 605 000 300 000
72 000
165 000 957 000 7
680 000 70 000 10
133 000 II 28 800
200 000
450 000 81 400 53 000 19
200 000 16
494 000 2 055 000
8 100 9 399 300
211 000 391 638
1.16
Turnover per
employee
150 000 36 486 4 3 A2')
66 667 46 939 75 000 49 550 92 066
211 667 208 333
166 667 52 247
97 059 257 143
21 805 121 528
90 000
108 000 368 550
13 962 40 000
15 182 10 706 70 370
-72 685
100 556 0.88
Average Size οΓ
company
6.3 3.7 5.8
30.0 3.0
400.0 44.4
4.0 4.2 6.0
21.7 Ν A
42 5 175.0 88.7
8.0
20.0
22.5 81.4
8.2 200 0
76 0 46 7 NA
-22 59
1.58
Latest Sourer
FEACO CCBE/Eurostat Eurostat
EFCA Varias Asociac EACRO ESIF Eurostat Lcascuropc Eurostat
Cl ETT BMC UNESCO
IDC'F.ITO Eurostat ESOMAR IMO/EEIIA
CLECAT
EAAA EAAA CERP Eurostat
04,/CoESS FENI 1ECC
GENERAL NOTES: The data are not totally comparable in the sense that there are problems of double entry accounting, different coverage and estimates based on methodology that is not comparable. Sources do not usually have data on all the countries so the totals are estimates or rounded up. The latest data provided by the Panorama of the EU Industry has been sought. SPECIFIC NOTES: 1. Companies with over two people count as 25,000. 2. Estimate made on 340,000 professionals. 3. Architects, construction economists, geodesy and topography and town planning. 4 Data on nine countries and for a small segment of the total R+D activity. 5. Public sector included. 6. Leasing and machinery, mainly. Also cars (included low). As well as Panorama it includes estimates from Eurostat's 'Enterprises in Europe'. 7. Teachers. 8. European cities with national and international fairs. The number of fairs is 50,000 with a very small degree of concentration. 9. Estimated cost. 10. Jobs created directly by the production of fairs, indirectly the service co-produces 500,000 people. I I. With the equivalent ol lull-time survey-takers. 12. Basically on-line connections although also videotext. 13. Producers of databases, CD-ROM companies and multimedia in 1994. 14. Estimate based on a percentage on exports 15 Publipostage and telemarketing. 16. Translators and interpreters. 17. Excluding public services and companies nol registered. 18. Data for 1994. 19. Data for 1993. 20. Only agencies. Source: prepared from the Panorama of the EU Industry 1995/96, 1994, the editions of the Panorama for 1990. 1991/92 and 1993, as well as other reports and statistics from the European Commission.
What are Business Services? 47
The activities that contribute the most within business services vary according to the criteria used. Taking the number of companies as a reference point, the activities with an administrative function are the most fragmented, followed by technical ones. Legal
, services, accounting, professional engineers and estate agents are activities with over one hundred thousand companies, many of them composed of individuals or with two or three employees. These activities represent 70% of the companies of the sector. The information and market activities are the least fragmented with an average of 5,700 companies. Some of the large traditional services are a little above the average of 9,000 companies; advertising (20,000), computer services (16,000) and engineering (15,000).
Some of the large service professions stand out in the volume of business (computers, advertising, accounting, engineering) which generate between 30 and 50 billion Ecus each one representing respectively between 6 and 10% of the total of business services. The leaders are, however, the 'atypical' activities of leasing (63,500 million Ecus) and estate agents (55, 700 million Ecus). The smallest include electronic communication, message services and public relations. If we look at employment in the sector, there is a clear leader, namely industrial cleaning services: employing over two million people, 21.5% in total. Professional training, accounting, legal services, computer services and estate agents follow. The median number of employees is 211,000.
The big differences between the size of the different activities reflected in the high variation coefficient, show different structures and modes of working. The average size of business services is between 10 and 14 employees per company, with notable differences. The information and market activities usually require bigger companies, between 40 and 80 employees: market research, commercial fairs, computer services, and electronic communication. Excluding engineering consultancy (30 people) and inspection and control (44 people), technical-function-services and leasing have the smallest companies together with administration and management. Most of these activities do not supersede the average size of 6 employees per company.
The apparent gross labour productivity (turnover per employee) is very different10. The median is around 73,000 Ecus of turnover per employee and the mean being 100,000 Ecus. Those with the greatest 'productivity' are activities connected with direct marketing (over 300,000 Ecus per employee), commercial fairs (260,000), and total leasing and cars (nearly 200,000 Ecus per employee). Security services, management consulting, temporary work and electronic communication also have an apparently very high productivity. At the other end, there are services with very low turnover per employee: language services (40,000), legal services (27,000), public relations (11,000) and industrial cleaning services (10,900). These differences in apparent labour gross productivity seem to favour activities, which have the chance to carry out scale economies and to increase in size. However, these results do not include other elements such as the valuation of profits and margins in each activity. The margin and profits of
'0 More reference on productivity and its methodological framework are given in chapter 7.
48 Business Services in European Industry
legal services (with relatively low productivity) are clearly higher than advertising executives (leader in gross productivity). Lawyers have a margin of 50-70%, whereas advertising face a relatively rigid 15% and market research companies have a margin of 3-5%. The fact that they have a greater turnover per employee does not mean there is a greater end profit per employee.
In conclusion, two ideas can be deduced from this table: 1) most business services activities have a highly significant turnover and employment level; and 2) the homogeneity of the activities of business services is found more in the type of action the production of the service entails than in the overall data that each activity offers. The reigning heterogeneity of the data on volume is manifested in all the variables (the variation coefficients have much higher values and there are large differences between means and averages). The disparity affects, above all, the average size of companies. the number of companies and the employment generated in each activity. Within this diversity, there is the common feature of important fragmentation as regards the number of companies referred to, and the number of employees per company which is generally very small.
1.3.3 The growth of business services in the economy
The important current volume of business services comes from a sequence of years in which business services, due to high growth rates, can be considered the most dynamic sector in European economies. This section explain this statement through the relative growth (with respect to other economic sectors) and absolute growth (annual growth rates). Data from OECD Group 3.3. will be used again.
1.3.3.1 Relative Growth
The employment and value added figures are achieved following very considerable growth in the seventies, consolidated in the eighties. The value added of the sector shifts from representing an average 9.7% in 1980 to 14.9% in 1994 (EUR-10), and from 15.5% to 19.2% in the USA in 1994, as can be seen in table 1.7, This means growth of relative weight of nearly five points for Europe and nearly four for the United States. In employment, Europe and the United States experience relative business service growth of nearly four points between 1980 and 1994. The data for individual countries show reasonable figures, even if different statistical methodologies can disturb the desired comparability of the data (see OECD, 1996 for details). The major business services countries, after United States, are United Kingdom, Germany, France, Netherlands...; the leaders of the sector. Spain and Greece are far away from these leaders.
These gains in business service importance in the economy as a whole are higher than in other sectors. Graph 1.4 conveys the distribution of economic branches in 1970, 1980, 1990 and 1994 in the relative participation in the total employment. The first observation comes from considering the strong reduction of manufacturing and
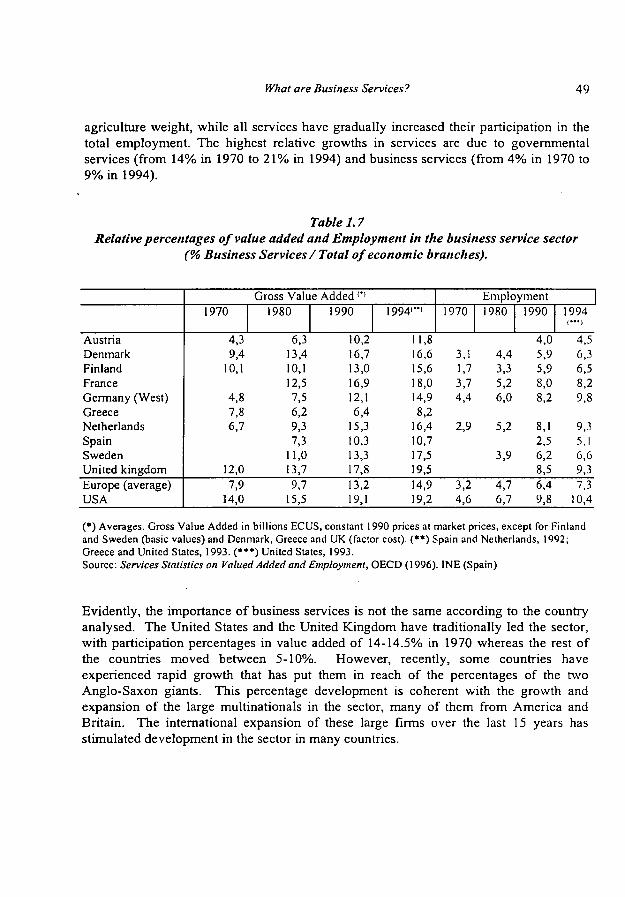
What are Business Services? 49
agriculture weight, while all services have gradually increased their participation in the total employment. The highest relative growths in services are due to governmental services (from 14% in 1970 to 21% in 1994) and business services (from 4% in 1970 to 9% in 1994).
Table 1.7 Relative percentages of value added and Employment in the business service sector
(% Business Services / Total of economic branches).
Austria Denmark Finland France Germany (West) Greece Netherlands Spain Sweden United kingdom Europe (average) USA
Gross Value Added ('> 1970
4,3 9,4
10,1
4,8 7,8 6,7
12,0 7,9
14,0
1980
6,3 13,4 10,1 12,5 7,5 6,2 9,3 7,3
11,0 13,7 9,7
15,5
1990
10,2 16,7 13,0 16,9 12,1 6,4
15,3 10,3 13,3 17,8 13,2 19,1
19941-1
11,8 16,6 15,6 18,0 14,9 8,2
16,4 10,7 17,5 19,5 14,9 19,2
Employment 1970
3,1 1,7 3,7 4,4
2,9
3,2 4,6
1980
4,4 3,3 5,2 6,0
5,2
3,9
4,7 6,7
1990
4,0 5,9 5,9 8,0 8,2
8,1 2,5 6,2 8,5 6,4 9,8
1994
4,5 6,3 6,5 8,2 9,8
9,3 5,1 6,6 9,3 7,3
10,4
(*) Averages. Gross Value Added in billions ECUS, constant 1990 prices at market prices, except for Finland and Sweden (basic values) and Denmark, Greece and UK (factor cost). (**) Spain and Netherlands, 1992; Greece and United States, 1993. (***) United States, 1993. Source: Services Statistics on Valued Added and Employment, OECD (1996). INE (Spain)
Evidently, the importance of business services is not the same according to the country analysed. The United States and the United Kingdom have traditionally led the sector, with participation percentages in value added of 14-14.5% in 1970 whereas the rest of the countries moved between 5-10%. However, recently, some countries have experienced rapid growth that has put them in reach of the percentages of the two Anglo-Saxon giants. This percentage development is coherent with the growth and expansion of the large multinationals in the sector, many of them from America and Britain. The international expansion of these large firms over the last 15 years has stimulated development in the sector in many countries.
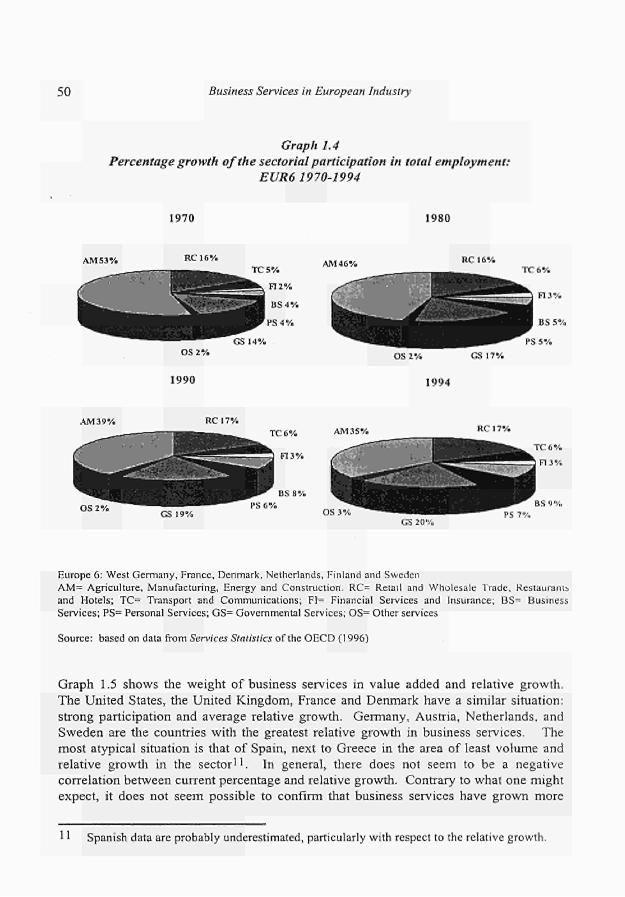
50 Business Services in European Industry
Graph 1.4 Percentage growth of the sectorial participation in total employment:
EUR61970-1994
1970 1980
RC16 · / .
OS 2%
1990
AM 39 V. RC17%
OS 2% GS 19%
BS 8% PS 6%
AM 35%
OS 3% GS 20%
R C 1 7 %
BS 9 %
Europe 6: West Germany, France, Denmark, Netherlands, Finland and Sweden AM= Agriculture, Manufacturing, Energy and Construction. RC= Retail and Wholesale Trade, Restaurane and Hotels; TC= Transport and Communications; FI= Financial Services and Insurance; BS= Business Services; PS= Personal Services; GS= Governmental Services; OS= Other services
Source: based on data from Services Statistics of the OECD (1996)
Graph 1.5 shows the weight of business services in value added and relative growth. The United States, the United Kingdom, France and Denmark have a similar situation: strong participation and average relative growth. Germany, Austria, Netherlands, and Sweden are the countries with the greatest relative growth in business services. The most atypical situation is that of Spain, next to Greece in the area of least volume and relative growth in the sector' ' . In general, there does not seem to be a negative correlation between current percentage and relative growth. Contrary to what one might expect, it does not seem possible to confirm that business services have grown more
1 ' Spanish data are probably underestimated, particularly with respect to the relative growth.
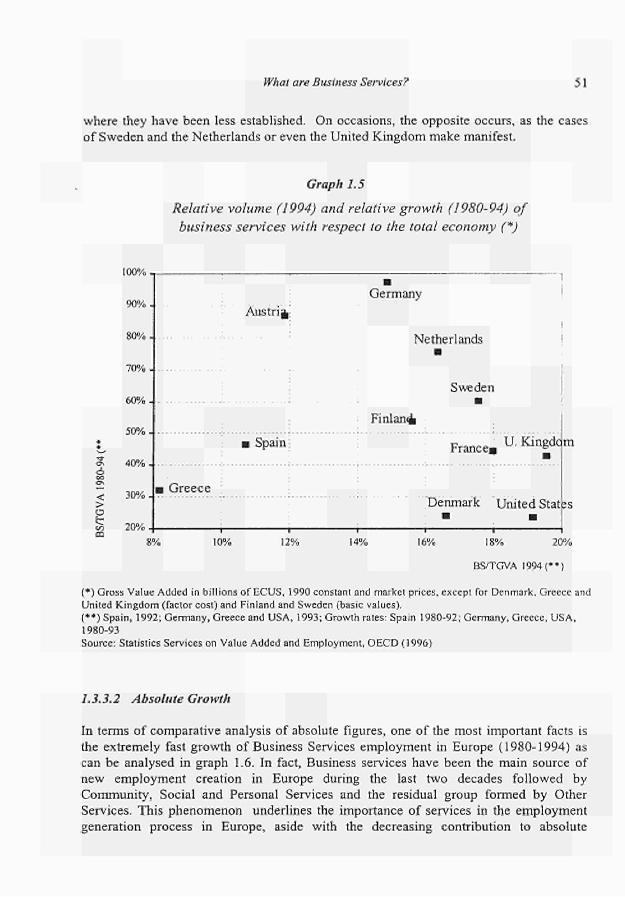
What are Business Services? 51
where they have been less established. On occasions, the opposite occurs, as the cases of Sweden and the Netherlands or even the United Kingdom make manifest.
Graph 1.5
Relative volume (1994) and relative growth (1980-94) of business services with respect to the total economy (*)
< > o tr
100%
90%
80%
7 0 % .
6 0 % .
50%
40%
30%
20%
Austri J Germany
Netherlands
Sweden
Finland
Spain i
Greece
France. U. Kingdo
Denmark United Stat
8% 10% 12% — ι — 14%
—ι— 16%
m
18% 20%
BS/TGVA 1994 (**)
(*) Gross Value Added in billions of ECUS, 1990 constant and market prices, except for Denmark, Greece and United Kingdom (factor cost) and Finland and Sweden (basic values). (**) Spain, 1992; Germany, Greece and USA, 1993; Growth rates: Spain 1980-92; Germany, Greece, USA, 1980-93 Source: Statistics Services on Value Added and Employment, OECD (1996)
1.3.3.2 Absolute Growth
In terms of comparative analysis of absolute figures, one of the most important facts is the extremely fast growth of Business Services employment in Europe (1980-1994) as can be analysed in graph 1.6. In fact, Business services have been the main source of new employment creation in Europe during the last two decades followed by Community, Social and Personal Services and the residual group formed by Other Services. This phenomenon underlines the importance of services in the employment generation process in Europe, aside with the decreasing contribution to absolute
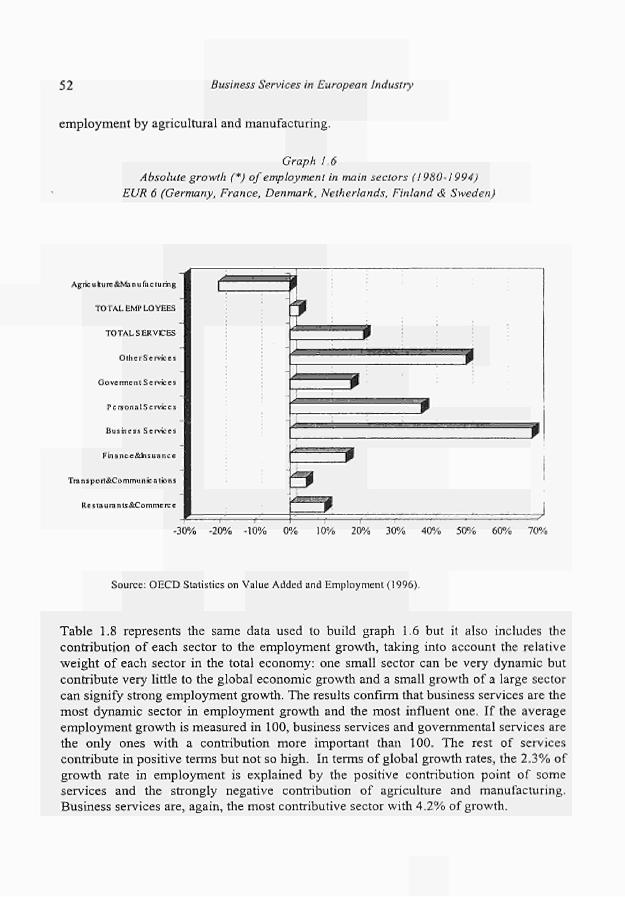
52 Business Services in European Industry
employment by agricultural and manufacturing.
Graph 1.6 Absolute growth (*) of employment in main sectors (1980-1994)
EUR 6 (Germany, France, Denmark, Netherlands, Finland & Sweden)
Ag rie ulturc&Man ufa c turing
TO TAL EMPLOYEES
TO TAL S ER VEES
Other Services
Gove rme nt S c rvic c s
PereonalServices
Business Services
Finance&kisuancc
Transpon&Communications
Re s ta uni n ts &Comme ve e
-F -30% -20% -10% 0% 10% 20% 30% 40% 50% 60% 70%
Source: OECD Statistics on Value Added and Employment (1996).
Table 1.8 represents the same data used to build graph 1.6 but it also includes the contribution of each sector to the employment growth, taking into account the relative weight of each sector in the total economy: one small sector can be very dynamic but contribute very little to the global economic growth and a small growth of a large sector can signify strong employment growth. The results confirm that business services are the most dynamic sector in employment growth and the most influent one. If the average employment growth is measured in 100, business services and governmental services are the only ones with a contribution more important than 100. The rest of services contribute in positive terms but not so high. In terms of global growth rates, the 2.3% of growth rate in employment is explained by the positive contribution point of some services and the strongly negative contribution of agriculture and manufacturing. Business services are, again, the most contributive sector with 4.2% of growth.
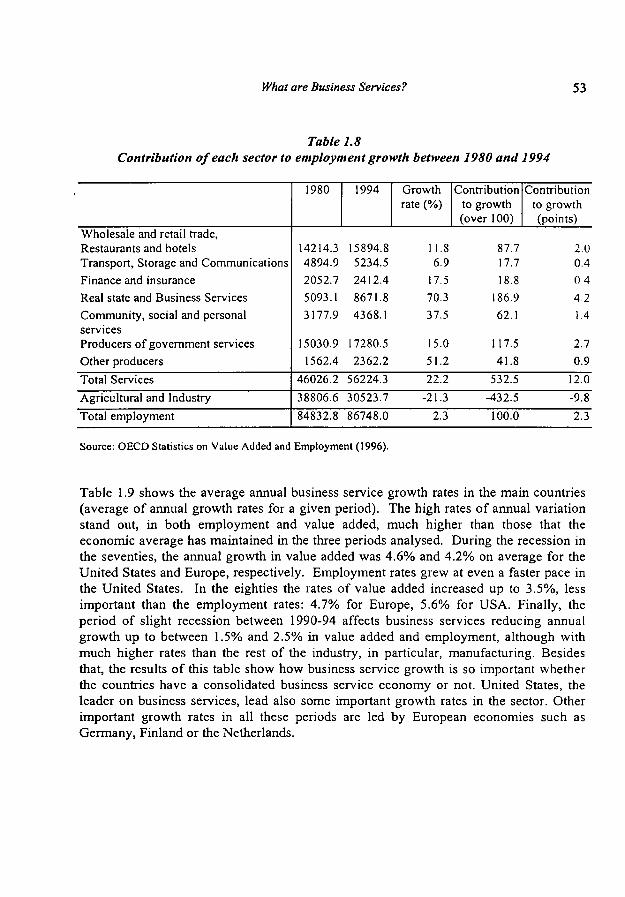
What are Business Services? 53
Table 1.8 Contribution of each sector to employment growth between 1980 and 1994
Wholesale and retail trade, Restaurants and hotels Transport, Storage and Communications Finance and insurance Real state and Business Services Community, social and personal services Producers of government services Other producers Total Services Agricultural and Industry Total employment
1980
14214.3 4894.9 2052.7 5093.1 3177.9
15030.9 1562.4
46026.2 38806.6 84832.8
1994
15894.8 5234.5 2412.4 8671.8 4368.1
17280.5 2362.2
56224.3 30523.7 86748.0
Growth rate (%)
11.8 6.9
17.5 70.3 37.5
15.0 51.2 22.2
-21.3 2.3
Contribution to growth (over 100)
87.7 17.7 18.8
186.9 62.1
117.5 41.8
532.5 -432.5 100.0
Contribution to growth (points)
2.0 0.4 0 4 4.2 1.4
2.7 0.9
12.0 -9.8 2.3
Source: OECD Statistics on Value Added and Employment (1996).
Table 1.9 shows the average annual business service growth rates in the main countries (average of annual growth rates for a given period). The high rates of annual variation stand out, in both employment and value added, much higher than those that the economic average has maintained in the three periods analysed. During the recession in the seventies, the annual growth in value added was 4.6% and 4.2% on average for the United States and Europe, respectively. Employment rates grew at even a faster pace in the United States. In the eighties the rates of value added increased up to 3.5%, less important than the employment rates: 4.7% for Europe, 5.6% for USA. Finally, the period of slight recession between 1990-94 affects business services reducing annual growth up to between 1.5% and 2.5% in value added and employment, although with much higher rates than the rest of the industry, in particular, manufacturing. Besides that, the results of this table show how business service growth is so important whether the countries have a consolidated business service economy or not. United States, the leader on business services, lead also some important growth rates in the sector. Other important growth rates in all these periods are led by European economies such as Germany, Finland or the Netherlands.
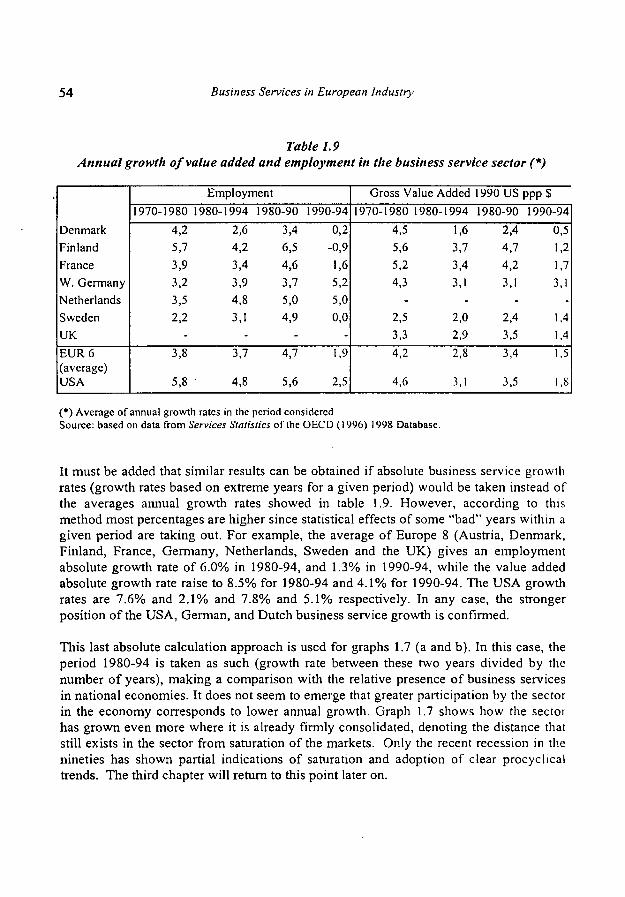
54 Business Services in European Industry
Table 1.9 Annual growth of value added and employment in the business service sector (*)
Denmark Finland France W. Germany Netherlands Sweden UK EUR 6 (average) USA
Employment 1970-1980
4,2 5,7 3,9 3,2 3,5 2,2
-3,8
5,8
1980-1994 1980-90 2,6 3,4 4,2 6,5 3,4 4,6 3,9 3,7 4,8 5,0 3,1 4,9
-3,7 4,7
4,8 5,6
1990-94 0,2
-0,9 1,6 5,2 5,0 0,0
-1,9
2,5
Gross Value Added 1990 US ppp S 1970-1980 1980-1994 1980-90 1990-94
4,5 1,6 2,4 0,5 5,6 3,7 4,7 1,2 5,2 3,4 4,2 1,7 4,3 3,1 3,1 3,1
-2,5 2,0 2,4 1,4 3,3 2,9 3,5 1,4 4,2 2,8 3,4 1,5
4,6 3,1 3,5 1,8
(*) Average of annual growth rates in the period considered Source: based ondata from Services Statistics of the OECD (1996) 1998 Database
It must be added that similar results can be obtained if absolute business service growth rates (growth rates based on extreme years for a given period) would be taken instead of the averages annual growth rates showed in table 1.9. However, according to this method most percentages are higher since statistical effects of some "bad" years within a given period are taking out. For example, the average of Europe 8 (Austria, Denmark, Finland, France, Germany, Netherlands, Sweden and the UK) gives an employment absolute growth rate of 6.0% in 1980-94, and 1.3% in 1990-94, while the value added absolute growth rate raise to 8.5% for 1980-94 and 4.1% for 1990-94. The USA growth rates are 7.6% and 2.1% and 7.8% and 5.1% respectively. In any case, the stronger position of the USA, German, and Dutch business service growth is confirmed.
This last absolute calculation approach is used for graphs 1.7 (a and b). In this case, the period 1980-94 is taken as such (growth rate between these two years divided by the number of years), making a comparison with the relative presence of business services in national economies. It does not seem to emerge that greater participation by the sector in the economy corresponds to lower annual growth. Graph 1.7 shows how the sector has grown even more where it is already firmly consolidated, denoting the distance that still exists in the sector from samration of the markets. Only the recent recession in the nineties has shown partial indications of saturation and adoption of clear procyclical trends. The third chapter will return to this point later on.
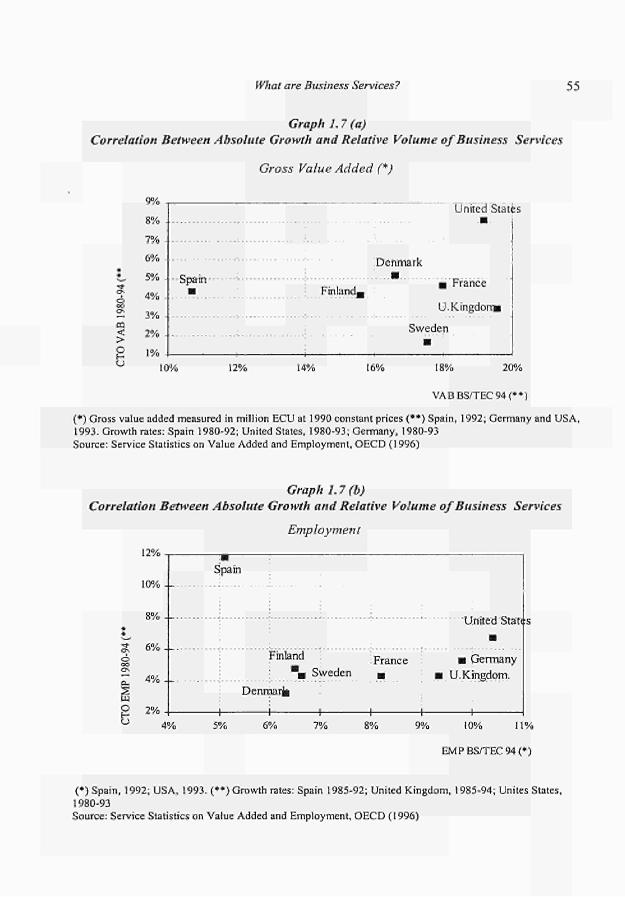
What are Business Services? 55
Graph 1.7 (a)
Correlation Between Absolute Growth and Relative Volume of Business Services
Gross Value Added (*)
m < > Ρ
9%
8%
7%
6%
5%
4%
3%
2%
1%
Spain
10% 12%
Finland,
United States
Denmark
a France
U. Kingdom«
Sweden
14% 16% 18% 20%
VABBS/TEC94(**)
(*) Gross value added measured in million ECU at 1990 constant prices (**) Spain, 1992; Germany and USA,
1993. Growth rates: Spain 198092; United States, 198093; Germany, 198093
Source: Service Statistics on Value Added and Employment, OECD (1996)
Graph 1.7 (b)
Correlation Between Absolute Growth and Relative Volume of Business Services
12%
10%--
8%
6%
4%
2%
Employment
Spain
Finland : France Sweden
DenmanJÉ
United States
■+■
■ Germany
U.Kingdom.
1
4% 5% 6% 7% 8% 9% 10% 11%
EMPBS/TEC94(*)
(*) Spain, 1992; USA, 1993. (**) Growth rates: Spain 198592; United Kingdom, 198594; Unites States,
198093
Source: Service Statistics on Value Added and Employment, OECD (1996)
56 Business Services in European Industry
1.4 Conclusions
This first chapter has shown the fundamental features of business services from three points of view: contextaal (servindustrial economy), conceptual (definitions and classifications) and quantitative (main data on volume and growth). Representing the most characteristic element of the new integration between goods and services, the emergence of business services as a key part of the new economic trends has been discussed. The concourse of business services is required with the shift from a traditional manufacturing industry society to a new servindustrial information society. Many new services emerge as a response to the new challenges created by the availability of new structures, production factors, products and markets.
Business services are many and heterogeneous, but they share common features that define them in a positive way, without the need to have recourse to residual and marginal categories. The effects they produce in the companies, with a view to improvements in competitiveness and innovative capacity constitute one of the basic elements in the definition of business services. Other basic elements come from the co-productive character of the services, which is introduced in the peculiar nature and ontology of the business service. Within the inevitable ambivalence of becoming standardised goods or becoming personalised services, business services direct a type of economy where the service, and everything born from it, reaches its full height. In this way, business services are developed actively within an ontological asymmetry that shape the most dynamic changes in current economies. Personalized services, multipolar and 'covalent' relationships, risk aversion and uncertainty, or the participation logic in the destination of the service, are some of the categories that make the economy and the internal order of business services explicit. Multilateral or bilateral interactive processes must be taken into account when any business service policy wants to be formulated. Most business services cannot be considered as goods-oriented activities in the same way as other manufacturing or services sectors do.
The last section of the chapter shows business services through the main statistics on employment and value added. The figures from the OECD permit the extraction of participation percentages of business services (and real estate) and the growth, on occasions, higher than that cited. Over 8.5% of employment and nearly 15.5% of value added say a great deal about business services: a sector that represents more economic importance than other services which traditionally have been afforded much more attention by researchers, such as transport, banking and insurance or telecommunications. The growth figures also stand out in comparison with other sectors; there is no other sector with comparable rates of relative and absolute growth. Moreover, the sector does not show generalised symptoms of possible saturation, as there is no clear correlation between the newness of the markets (low participation of business services in the economy) and growth in the sector. Even some data indicates that the contrary can also happen. Although later chapters will return to this point, the main data seems to indicate that business services have a very considerable potential for growth. This makes them a key reference for enterprise and industrial policies.
What are Business Services? 57
References
Aharoni, Y. (Ed.) (1993) Coalitions and competition: the globalization of professional
business services. Routledge, London and New York.
Bailly, Α.; Maillât, D. (1988) Le secteur tertiaire en question, 2a edición. Economica, Paris.
Bailly, Α.; Maillât, D. (1990) "Actividades de servicios y sistema de producción". Papeles de
Economia Española, 42:4051.
Barcet, Α. (1987) La montée des services, vers une économie de la servuction. Tesis doctoral.
Universidad Lumière Lyon II, 1987. Referencia tomada de De Bandt and Gadrey (1994).
Barcet, A. (1991) "Production and service supply structure: temporality and complementarity
relations" in Daniels, P., Moulaert, F. (Eds.), The changing geography of advanced producer
servicies. Belhaven Press, London and New York.
Browning, H.L.; Singelmann, J. (1978) The emergence of a service society. Springfield, VA.
National Technical Information Service.
Cuadrado Roura, J.R.; Del Río Gómez, C. (1989) "Structural change and evolution of the
service sector in the OECD". 77ie Service Industries Journal, 9 (No 3): 439468.
Cuadrado Roura, J.R.; Raymond, J.L. (1991) "Consideraciones en torno al crecimiento de los
servicios". Economistas, 47: 298302.
Daniels, P.W. (1993) Service industries in the world economy. Blackwell, Oxford.
Darby, M.; Kami, E. (1973) "Free competition and the optimal amount of fraud". Journal of
Law and Economics, 16: 6788..
De Bandt, J.; Gadrey, J. (Eds.) (1994) Relations de service et marchés de services. CNRS,
Paris.
Elfring, T. (1988) Service sector employment in advanced economies. Gower, Aldershot.
European Commission (1987) LEurope des services: un virage à réussir. Programme FAST
II. Résultats et recommandations, vol 3. European Commission, Brussels.
European Commission (1989) The efficiency of business services used by manufacturing
industries. MRB Study. European Commission, Brussels and Luxembourg.
European Commission (1992) Panorama de l'industrie communautaire 19911992. European
Commission, European Commission.
European Commission (1993) Panorama de l'industrie communautaire 1993. European
Commission, Luxembourg.
European Commission (1994) Panorama of the EU Industry 1994. European Commission,
Luxembourg.
European Commission (1995) Panorama of the EU Industry 199596. European Commission,
Luxembourg.
European Commission (1997) Panorama of the EU Industry 1997. European Commission,
Luxembourg.
Eurostat (1993) NACE Rev. 1. Council Regulation. Eurostat, Luxembourg.
Eurostat (1996). National Accounts. Eurostat, Luxembourg.
Faulhaber, G.R. el alt. (1986) The impact of information technology on the service sector.
Ballinger, Washington DC.
Freeman, C ; Soete, L. (Eds.) (1987) Technical change and full employment. Basic Blackwell,
Oxford.
Gadrey, J. (1994) "Les relations de service dans le secteur marchand" in De Bandt, J., Gadrey,
J (Eds), Relations de service, marchés de servicies. CNRS Editions, Paris.
Gadrey, J.; Gallouj, F. (1998) The providercustomer interface in Business and Professional
Services. The Services Industries Journal. Volume 18, number 2: 215.
Gershuny, J; Miles, I. (1983) 77ie new service economy, the transformation of employment in
5 8 Business Services in European Industry
industrial societies. Francis Printer, London. Giarini, O. (Ed.) (1987) 77ie emerging service economy. Pergamon Press, Oxford. Giarini, O; Stahel, W.R. (1993) 77ie limits to certainty facing risks in the new service economy, 2nd revised edition. Kluwer Academic Publishers, Dordrecht, Boston and London. González Moreno, M. (1990) "Los servicios: concepto, clasificación y problemas de medición". Información Comercial Española, Nov.: 155-171. González Moreno, M.; Rubalcaba, L. (1993) "Employment in the Spanish services industries; trends and behaviours". 3" Forum Reser: Services, labour market and small firms. 23-25 September. RESER, Siracusa. Hill, T.D. ( 1977) "On goods and services". 77ie Review of Income and Wealth. 4. Uteris, S. (1991) "Location of services in a service society" in Daniels, P., Moulaert, F. (Eds.), The changing geography of advanced producer services. Belhaven Press, London. Marshall, J.N. (Ed.) (1988) Services and uneven development. Oxford University Press, Oxford. Martini, M. (1990) Implicazioni statistiche dell'analisi dei servizi resi alle imprese Criteri di identificazione e classificazioni. Internal Document of Eurostat, Luxembourg. Martini, M. (1992) L'offerta di servizi innovali per le imprese nell'area metropolitana milanese. Collana Europa. SIPI. Martini, M.; Vairetti, U. (1989) Terziario Avanzato. Prospettive e modelli dell 'impresa futura Il Sole 24 Ore, Milán. Nelson, P. (1970) "Information and consumer behaviour". Journal of Political Economy, 78: 311-329. Ochel, W.; Wegner, M. (1987) Service Economies in Europe: Opportunities for Growth. Printer Pub. & Wesriew Press, London.
- OECD (1996). Service Statistics on Value Added and Employment. OECD. Paris. O'Farrell, P.N.; Hitchens, D.M.W.N. (1989) "Producer services and regional development: Key conceptual issues of taxonomy and quality treasurement". Regional Studies 24, No 2. O'Farrell, P.N.; Hitchens, D.M.W.N. (1990) "Producer services and Regional Development: key conceptual issues of taxonomy and quality measurement". Regional studies, 22. O'Farrell, P.N.; Moffat, L.A.R. (1991) "An interaction model of the production and consumption of a business service". British Journal of Management, 2: 205-221. Porter, M. (1990) The competitive advantage of nations. Macmillan, London. Rada, J.F. (1987) "Information technology and services" in Giarini, O. (Ed.), The emerging service economy. Pergamon Press, Oxford. Rubalcaba Bermejo, L. (1996) Business Services and New Statistical Developments. Final Report. Eurostat, Luxembourg. Rubalcaba Bermejo, L. (1997) Los Servicios a Empresas en Europa: Crecimiento y Asimetrías. Tesis doctoral, Universidad de Alcalá, Madrid. Rubalcaba Bermejo; Antón López, J. (1997) Methodological manual on business services statistics (draft version). Eurostat, Luxembourg. Ruyssen, O. (1987) "The new deal in services: A challenge for Europe" in Akehurst, C , Gadrey, J. (Eds.) The economics of services. Frank Cass, London. Sapir, A. (1993) "The structure of services in Europe: a conceptual framework" European Economy, 3: 83-98. Sharpe, C ; Wernerheim, M. (1996) "The emperor's new clothes: a critical evaluation of the producer services concept". 43rd North American Meeting of the Regional Science Association, Washington D.C., 14-16 November, 1996. The Economist (1996) "The ups and downs of services". The Economist, July 6ln 1996. Tiróle, J. (1988) The theory of industrial organisation. MIT Press, Cambridge, Mass.

Chapter 2
Employment in European Business Services
"A dynamic and thriving Business Services sector is important as a creator of employment in its own right. However, its main importance lies in its indirect job-creation potential by its added value input into Industry, which generates more economic activity which in tum creates new employment opportunities".
77ie Contribution of Business Services to Industrial Performance. A Common Policy Framework
(European Commission, 1998, page 10)

60 Business Services in European Industry
Employment in European Business Services 61
Chapter 2 0) Employment in European Business Services
Introduction
The importance of business services in modem economies is increasingly linked to employment. The impact of business services on industrial competitiveness prompt an examination of the productive elements that cause these positive effects. It is clear that human labour is the key success factor in creating dynamic and productive business services. Moreover, business services are now regarded as a new source of employment. Taking into account the extremely high unemployment rates prevalent in a number of European economies, it becomes evident that all potential sources of employment need to be supported by economic and social policies. Business services, in fact, create many jobs. The high growth rates shown in the first chapter highlighted the sector's capacity to generate employment, during periods of economic expansion and recessions (although in this last instance there are some exceptions). In the light of this, attention is drawn to the average annual growth rate in employment during the 1980-94 period, which ranges from 3.7% (EUR6; Denmark, Finland, France, Germany, Netherlands and Sweden) to 4.8% (USA).
Unfortunately, it is not possible to measure how the performance of the business service sector reinforces firms' industrial capacity and, therefore, the industrial potential for further growth in employment. Business services encourage their clients to create jobs due to the gains they enjoy in terms of process and product innovation, corporate reorganisation, market strategy and labour upskilling. Although, initially, business services tend to apparently reduce some in-house personnel because of the use of externalisation processes2. In the early stages, business services are more closely related to industrial competitiveness than to industrial employment. However, nowadays, the latter is contingent on the former: competitiveness leads to employment. Competitiveness alone generates stable and long-term employment in a global economy. The DGIII report on "The Competitiveness of European Industry" even considers employment to be one side of the competitiveness issue, with productivity the other (European Commission, 1997a).
The author thanks the assistance of Elisabeth Villagómez in this chapter. 2 Only in some cases as it will be studied in following chapters. And employment
increases in business service firms is usually much more important then the employment reductions in in-house services.

62 Business Services in European Industry
Business services represent a potential source of employment, but they are also a potential source of new employment. In employment linked to business services there is a greater possibility of developing a new type of employment which allows for a higher degree of flexibility and is better adapted to a changing economic world. For instance, part-time work, teleworking, networking, etc., already have a strong foothold in many business services. This creates new opportunities for qualified workers and for specific groups such as young people who need to acquire a skill, women seeking part-time work and minority groups who have to overcome transport problems.
This chapter focuses on an analysis of the potential new types of employment created by business services. In the first section the ideas mentioned above and several theoretical considerations are explored, then in the second we examine business services' capacity to create employment. The third section describes the employment types in business services, including part-time work, self-employment, educational levels or training. Finally, the conclusion summarises the main results.
Employment in European Business Services 63
2.1. Employment in business services
2.1.1 Business services as a source of employment growth
Governments throughout Europe today place great emphasis on employment growth, new sources of employment and the impact on the occupational and industrial structure of employment. The White Paper on 'Growth, Competitiveness and Employment' (European Commission, 1993) argues that technology is chiefly responsible for the changes in the scenario of the EU economy. Technology covers two distinct areas. One area refers to the pace of technological advances and the impact on jobs and competitiveness. The other involves the non-material aspects of the economy, externalisation of productive activities, predominance of services, and the control and circulation of information. We will consider both the negative and positive aspects of these changes influencing employment. As several researchers have observed, technological advances do not necessarily translate into job losses as new opportunities arise, especially when individuals and firms, respectively, are equipped with the appropriate skills and capacity to adapt to these technological advances (Ochel and Wegner, 1987; Giarini and Liedtke, 1994; OECD, 1996).
Furthermore, the growing share of higher level occupations in most advanced economies (European Commission, 1996; Franklin, 1995; Kutscher, 1995; Garrido and Toharia, 1991) suggests a demand for individuals with the corresponding skills. All EU governments have placed the need to tailor educational systems or enhance in-house training policies at the top of their agenda. The business service sector is far from being immune to these issues and, judging from its development over the last few decades, the aforementioned changes have had and will continue to have an extensive impact on the sector. Business services embrace activities that require very different skill levels (high qualified versus low qualified staff) hence they are not influenced in equal measure by technological changes, but they are affected by externalisation or the control of circulation of information (advanced versus routine services). Some activities will require the acquisition of new or expert skills due to technological changes whilst others (such as cleaning and security) will continue to be contracted out by firms and do not demand a relative high skill level from the workers. However, in both cases, business services lead some of the new trends in the labour market affecting new employment: greater flexibility, part-time jobs, teleworking, highly-specialised SMEs among others. Business services have a direct influence because of the type of jobs created in this new sector, and an indirect one because of the employment changes promoted by manufacturing and services clients.
It can be argued that the growth of service employment is the most distinctive characteristic in most advanced economies. The projected rise in occupations in the United States indicates an increase in highly qualified occupations and the service industry (mainly in business services, health, personal and professional services). Graph 2.1 depicts this projected rise in service industries in millions. In the business service
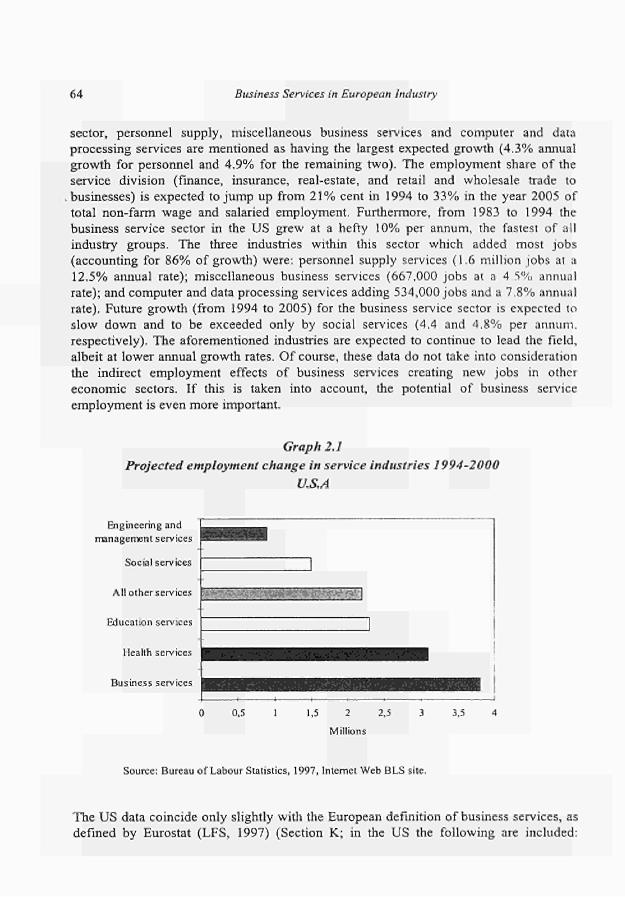
64 Business Services in European Industry
sector, personnel supply, miscellaneous business services and computer and data processing services are mentioned as having the largest expected growth (4.3% annual growth for personnel and 4.9% for the remaining two). The employment share of the service division (finance, insurance, real-estate, and retail and wholesale trade to
.businesses) is expected to jump up from 21% cent in 1994 to 33% in the year 2005 of total non-farm wage and salaried employment. Furthermore, from 1983 to 1994 the business service sector in the US grew at a hefty 10% per annum, the fastest of all industry groups. The three industries within this sector which added most jobs (accounting for 86% of growth) were: personnel supply services (1.6 million jobs at a 12.5% annual rate); miscellaneous business services (667,000 jobs at a 4,5% annual rate); and computer and data processing services adding 534,000 jobs and a 7.8% annual rate). Future growth (from 1994 to 2005) for the business service sector is expected to slow down and to be exceeded only by social services (4.4 and 4.8% per annum, respectively). The aforementioned industries are expected to continue to lead the field, albeit at lower annual growth rates. Of course, these data do not take into consideration the indirect employment effects of business services creating new jobs in other economic sectors. If this is taken into account, the potential of business service employment is even more important.
Graph 2.1 Projected employment change in service industries 1994-2000
U.S.A
Engineering and management services
Social services
All other serv ices
Education services
Health services
Business services
0,5 1,5 2 2,5 3
Millions
3,5
Source: Bureau of Labour Statistics, 1997, Internet Web BLS site.
The US data coincide only slightly with the European definition of business services, as defined by Eurostat (LFS, 1997) (Section K; in the US the following are included:
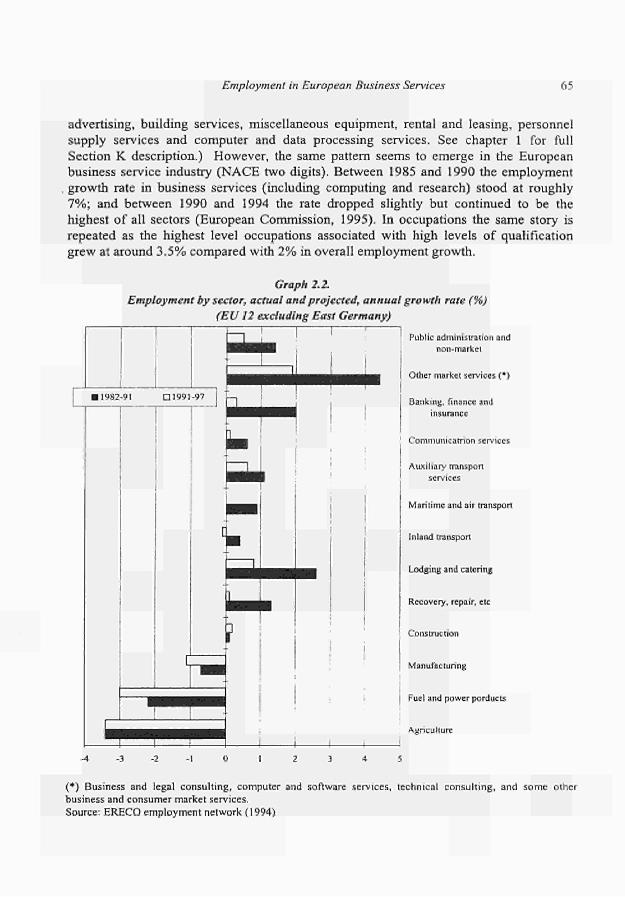
Employment in European Business Services 65
advertising, building services, miscellaneous equipment, rental and leasing, personnel supply services and computer and data processing services. See chapter 1 for full Section K description.) However, the same pattern seems to emerge in the European business service industry (NACE two digits). Between 1985 and 1990 the employment growth rate in business services (including computing and research) stood at roughly 7%; and between 1990 and 1994 the rate dropped slightly but continued to be the highest of all sectors (European Commission, 1995). In occupations the same story is repeated as the highest level occupations associated with high levels of qualification grew at around 3.5% compared with 2% in overall employment growth.
Graph 2.2. Employment by sector, actual and projected, annual growth rate (%)
(EU 12 excluding East Germany) Public administration and
non-market
Other market services ( · )
Banking, finance and insurance
Conimunicarrion services
Auxiliary transport services
Maritime and air transport
Inland transport
Lodging and catering
Recovery, repair, etc
Construction
Manufacturing
Fuel and power porducts
Agriculture
(*) Business and legal consul t ing, computer and software services, technical consul t ing, and some other business and consumer market services. Source: E R E C O employment network (1994)
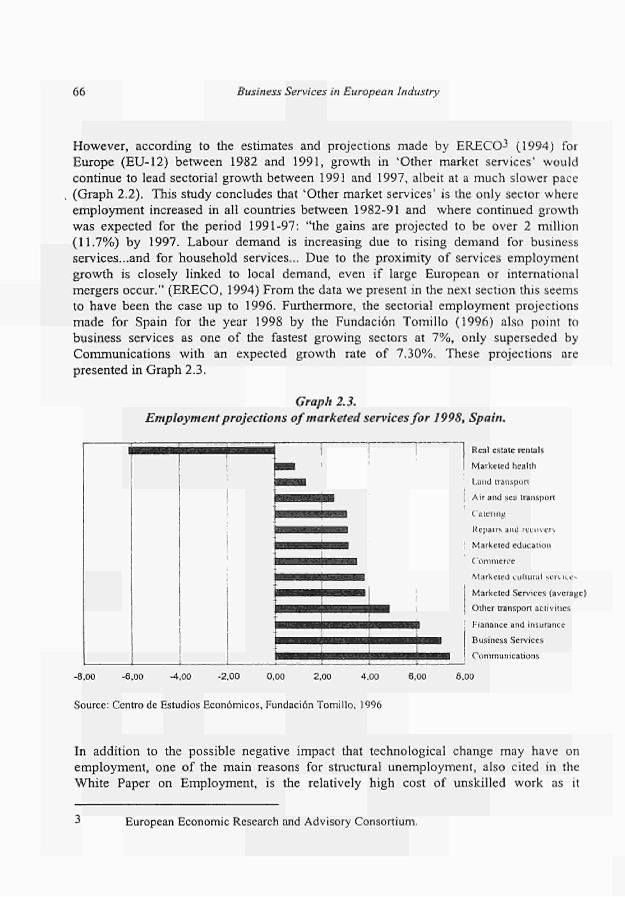
66 Business Services in European Industry
However, according to the estimates and projections made by ERECO3 (1994) for Europe (EU-12) between 1982 and 1991, growth in Other market services' would continue to lead sectorial growth between 1991 and 1997, albeit at a much slower pace (Graph 2.2). This study concludes that 'Other market services' is the only sector where employment increased in all countries between 1982-91 and where continued growth was expected for the period 1991-97: "the gains are projected to be over 2 million (11.7%) by 1997. Labour demand is increasing due to rising demand for business services...and for household services... Due to the proximity of services employment growth is closely linked to local demand, even if large European or international mergers occur." (ERECO, 1994) From the data we present in the next section this seems to have been the case up to 1996. Furthermore, the sectorial employment projections made for Spain for the year 1998 by the Fundación Tomillo (1996) also point to business services as one of the fastest growing sectors at 7%, only superseded by Communications with an expected growth rate of 7.30%. These projections are presented in Graph 2.3.
Graph 2.3. Employment projections of marketed services for 1998, Spain.
-8,00 -6,00 -4,00 -2,00 0,00 2,00 4,00
Source: Centro de Estudios Económicos, Fundación Tomillo, 1996
6,00
Real estate rentals
Marketed health
Laud transport
Air and sea transport
Catering
Repairs and recovery
Marketed education
Commerce
Marketed cultural services
Marketed Services (average) Other transport activities
Fianance and insurance
Business Services
Communications
8.00
In addition to the possible negative impact that technological change may have on employment, one of the main reasons for structural unemployment, also cited in the White Paper on Employment, is the relatively high cost of unskilled work as it
European Economic Research and Advisory Consortium.

Employment in European Business Services 67
encourages rationalisation of investment and curbs employment creation in services or induces underground economic activity. One of the main priorities of employment promotion cited in the White Paper on Employment is, therefore, to tackle this problem. The excessive social security costs associated with this type of unskilled work (which has the largest percentage of long-term unemployed) must be replaced by active policies which aim to raise the skill level of this segment of the working population. Services must be targeted as the sector suffers from an excessive polarisation of workers in terms of skills. Active labour policies being implemented in the EU regarding education and training with the aim of increasing different groups' ability to enter employment must continue to seek valid investment in human resources throughout Europe, as the mobility of workers with the appropriate skills can be considered an important factor of labour market flexibility. Furthermore, a lower skill level reflected in lower level occupations may be over-represented by minorities (racial, sexual and of age) or concentrated in specific regions failing the implementation of effective policies against discrimination and the deterioration of inner cities. Given the expected continued growth in services, these policies should endeavour to provide equal opportunities in labour markets.
The emphasis placed on the workings of the market as a force moving toward decentralisation, coupled with technological advances, leads to an authentic information society according to the White Paper on Employment (European Commission, 1993) and other EC documents, such as "Building the European information society for us all" published by DGV (European Commission 1997b). The service sector seems almost naturally placed to be the greatest beneficiary of the current investments in telecommunications infrastructure and those which are planned in the EU in order to enhance information technologies. This argument is supported by the qualitative use of information technology in most of these activities, especially in those with a concentration of highly qualified personnel.
It is also important to note that according to the Policy on Industrial Competitiveness of the EU (Bulletin of the EU, Supplement 3/94) there are four priority initiatives to which a policy for increased competitiveness in the EU adapting to technological change should respond: promotion of immaterial investments, development of industrial cooperation, establishing fair competition within the EU and in other international forums, and, modernisation of the role of the public sector. In all of these areas business services stands to benefit greatly, for example, through: the increase of highly qualified personnel and emphasis on product quality; better access of SMEs to technological and research developments; better access to markets under fair but competitive conditions for all firms; and a better institutional framework with deregulated and simplified administrative requirements for firms.
Other reports issued by international associations, such as the Club of Rome, also highlight the significance of information technology in the transformation of the workplace and the significant role played by the service sector, as new management
68 Business Services in European Industry
organisation and services needed in their own right and in relation to a more flexible production of goods emerge (Giarini and Liedtke, 1994).
As we will explore in chapter 10, employment-related policies can be applied together with business services policies. Implementation of the conclusions of the Luxembourg Employment Summit in 1997 and the Pact on Employment (1997c) could benefit considerably from a policy addressing some of the current employment instruments (Training policies, Structural Funds, Risk Capital, etc.) to business services.
2.1.2 Characteristics of employment in business services
It is interesting to note that most standard labour economic textbooks fail to mention the huge increase in service sector employment. The growth of the sector (and its activities), the debate about demand for services (income elasticities), and their specific relation to technology and consumption (i.e. problems of measuring productivity in services) are amongst the most widely cited problems of the sector with regard to employment. Some characteristics of services may not make any difference in the basic outcomes determining supply and demand in any other sector or market. But the attributes of workers and the work processes for services do alter the gender, age and occupational structure of employment as a whole. As Browning and Singleman (1975) observe, growth in employment for services is mainly due to individuals, who have not participated previously in the labour force, whose first job was in services (women and young people). This is not to say that there are not typically male-dominated industries within services (such as transport) or occupations almost exclusively related to services (doctors or university professors). However, the insertion of different population groups in services, and especially in a high employment growth sector such as business services, is important if some of these groups have been hit hard by unemployment, poor working conditions, or by discrimination in employment. Lastly, the type of employment generated by the sector or, on the supply side, demanded by workers, completes the profile of workers employed in services.
Moreover, a more interdisciplinary approach might be warranted as service employmeni structure suggests younger, female and better qualified labour force than for other sectors. The impact that this structure has on society as a whole, on the economy in particular and specifically on the labour market has, as in other important historical changes, specific and unique implications: increasing numbers of university students (increasing the human capital of a country or region); changes in fertility; changes in the demand for other services substituting the traditional roles for women at home; etc. In our case, variables such as self-employment and part-time work also underlie the changes in the labour market that employment growth in services has brought about, although these employment modes are not exclusive to services themselves and are a response to business opportunities and use of labour by employers.
Employment in European Business Services 69
However, the nature and development of many business services provide strong evidence of the new employment trends adopted in the newest activities. Links with IT technologies, for example, allow for the subcontracting of high-skilled services by using teleworking and part-time services produced remotely from the local client's site. High-quality services can be obtained by using flexible production modes and, thus, flexible employment is obtained. Temporary contracts for independent experts are typical of the way in which service provision is adapted to cyclical needs. Moreover, clients can split the business service product and buy only what they require. They can draw up a contract by price, personnel, hours, or reports, according to their needs. Flexible needs, flexible production and flexible employment are all coherent in the current complex and uncertain economic environment.
The polarisation of occupations, bearing in mind their educational content or skill level, is a feature of employment growth in the service sector that seems to engage the interest of all researchers in the field. As we have already mentioned in the introduction to this chapter, the trend in the US and other OECD countries^ is for high-level occupations to rise in relation to other occupational categories. As Noyelle observes with regard to the application of new technologies and the so-called deskilling of jobs (1987, page 106) "it is important to point (1) to the links between the transformation of skills and the professionalisation of the labour force and (2) to the fact that this trend toward professionalisation extends far beyond jobs at the top of the occupational structure and reaches deep into middle-level occupational ranks". The lower-level occupations, however, seem to be, at least for now, outside the range of possibilities for applying technological advances and the consequent demand for workers with higher education and skills. The gender and age composition, and in some cases the racial shares, of the higher and lower-level occupations are very important in relation to policies geared towards decreasing discrimination and renewing inner-cities. In both of these cases raising education levels stands out as the main instrument to enhance high quality employment growth: "...the restructuring of employment systems by firms has been determined, in large part, by changes taking place in the structuring of the labour supply...In the new service economy quality of labour becomes a major concern; employers are organising employment systems around the very notion that external labour pools have become qualitatively stratified" (Noyelle, 1987, pagel 17).
In addition to the issues outlined above, there are difficulties in analysing services using the classifications for occupations and activities as they appear in official statistics. Not content with the above nor with general classifications made by economists in other fields (such as development), researchers seem to embark upon a myriad of classifications, circumscribed by considerations of data availability, making it almost
A study of occupational change in Spain by Garrido and Toharia (1991) also shows that higher-level occupations have gained important relative shares of employment in the past 10 years. Also, the 1995 European Employment report shows (EU, 1995) that this has been the trend throughout Europe (see Graphs 50 and 5 I ).
70 Business Services in European Industry
impossible to compare studies at an empirical level. It must be noted, however, that in fact official statistics suffer from the excessive aggregation of activities and that the occasional changes make it very difficult to carry out an analysis over certain periods of time. The fact that service activities are classified as the remnants of all other activities must change in order to have better data with which to carry out more accurate analysis. Furthermore, as a consequence of the upskilling, the skill dimension seems to be gaining importance and the latest occupational classifications are beginning to take this into account, making it possible to improve the information basis for the changes in qualification requirements (Ochel y Wegner, 1987). In Europe it appears that this problem still remains to be solved (ERECO, 1994).
The main theoretical aspects presented in this section lead us to describe the three primary areas of our analysis and its interpretation in the next two sections. Section 2.2 concentrates on employment growth, providing more references and data on the real and potential growth of business services (this is complementary to the information advanced in chapter 1). Section 2.3 focuses on the empirical testing of the characteristics of new employment in business services. These considerations, however, may not be directly applicable to all the activities within business services. Employment in consulting is very different from employment in cleaning services. Unfortunately, there is no detailed data available in the Eurostat statistics (Labour Force Survey, 1997). But, anyway, in the case of most business services there does not seem to be, at first sight, important differences amongst the overall aspects mentioned. All the activities have common features which can be identified in part in employment trends. The main hypotheses to be tested are as follows:
1. First, the structural importance of business services should be confirmed by the growth of employment (section 2.2 refers to this point).
2. Second, the type of employment generated by the sector should contain characteristics of new flexible employment trends (section 2.3). Given the low entry barriers in the sector it is expected that a large share of employment in the sector will consist of self-employment. In the case of part-time employment, business sector activities (whether it be consulting or cleaning) allow for an easier division by hours of work so that a larger share of part-time work is also expected.5
Of course, self-employment and part-time work are taken as proxy variables to flexible employment characteristics and their dynamics can be completely different. In fact, as the analysis shows below, self-employment figures may be more closely related to other non-flexibility variables, while part-time work may be better flexibility indicators. In any case, measuring flexibility in business service markets requires specific studies that cover different business service sub-sectors statistics.

Employment in European Business Services 71
3. Third, it is worth analysing to what extent the data show increasing job qualifications in business service employment. The polarisation of qualifications (high qualifications versus low qualifications) related to the activities themselves (consulting and cleaning, for example) may be distorting the educational attainment shares in the sector, but this can be reflected in the data. There may also be important differences according to the country studied. The individual traits of the labour force such as gender and age will also be important in identifying the groups most likely to continue to benefit from or to be left out of the development of business service employment.
4. Finally, business services could be regarded as a training-oriented sector, since it frequently employs highly qualified people with high training demands, and because it is a new sector operating with the fastest changing economic processes that require training to order to improve quality, technology-orientation and global business understanding. Productivity and labour inputs in services also play an important part in explaining possibilities for employment growth. Once more, it seems that investment and technological innovation can not be blamed for rises in unemployment inasmuch as they lead to increases in productivity. However, this was not the case in Spain where productivity increased through a drop in employment between 1976 and 1995. Productivity will be reviewed in Chapter 7, and here we only concentrate on the hypothesis mentioned above.
72 Business Services in European Industry
2.2 Business service employment growth in Europe
This section aims to present a thorough assessment of business service employment in Europe. Due to the data restrictions detailed below, we give a general and aggregate view of the development of the sector in the last four years (1993-1996), according to the Labour Force Survey (Eurostat, LFS 1997). Data on employment based on National Accounts Statistics were presented in the previous chapter 1.
2.2.1 Data description
The data used in the following analysis come from the Eurostat (1997) Labour Force Survey, including data from 1993 to 1996. The sector used here is Section K which includes business services and cannot be disaggregated further (no subdivisions in activities). Section K includes NACE 701 to NACE 748 encompassing real estate activities which are not always considered to be business services (NACE 741 to 748). It is worth noting that the Eurostat database (LFS, 1997) offers information only about the structure of employment, thus making it difficult to carry out a more far-reaching analysis of some of the variables of interest, such as employment levels and growth. However, this is the only comparable database available which provides detailed information on employment aspects throughout the EU.
There are also differences in the methodologies and possible distortion in both the National Accounts (chapter 1) and Labour Force Survey data in measuring services in general. The first of these poses a number of problems which may lead to underestimating of the employment level in the sector. First, the classifications of activities used in the National Accounts are aggregated. It includes the primary activities and omits secondary ones. LFS data (1997), on the other hand, may also underestimate this level as it is a household survey and given the high number of women and self-employed people in the sector, the chances of finding the interviewees at home during the business hours kept by the interviewers may be a factor, among others, influencing this distortion.
2.2.2 Employment changes according to the Labour Force Survey during 1993-1996
Although data from the Labour Force Survey are not as reliable as those from the National Accounts, they are very recent (1993-96) and cover a large number of countries. In Graphs 2.4 and 2.5 the development of the employment share of business services in each country can be observed. The variety of levels and trends stands out immediately. All the countries reach above the 5% mark by the end of the period. The countries with the highest shares are the Netherlands and France. The sector shows steady gains in Belgium (after a slight fall between 1994 and 1995), Spain, Greece, Ireland, Italy, and Portugal. Luxembourg and Denmark display rather erratic behaviour. Unfortunately, our assessment of Germany here is limited due to the lack of available data.
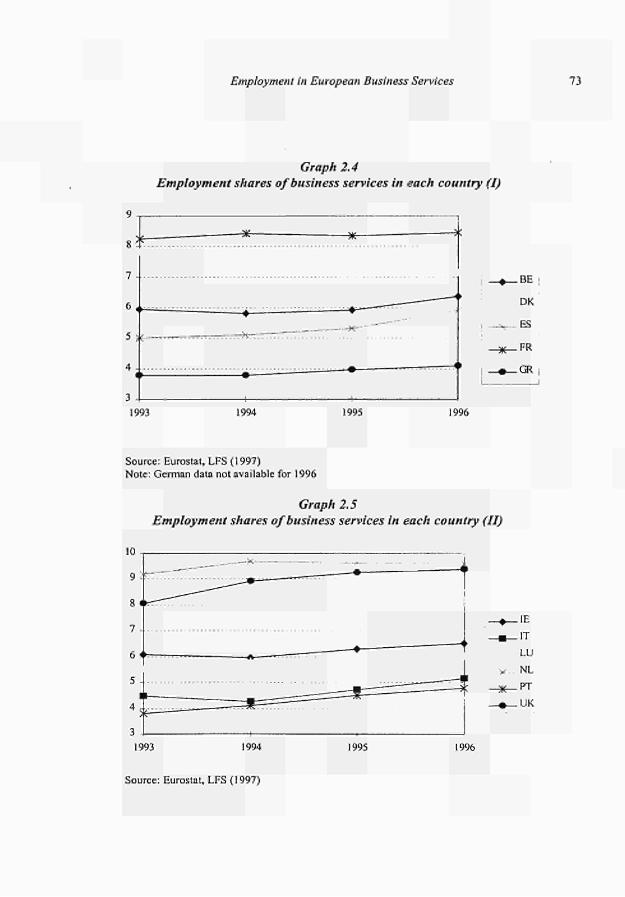
Employment in European Business Services 73
Graph 2.4 Employment shares of business services in each country (I)
1993 1994 1995 1996
Source: Eurostat, LFS (1997) Note: German data not available for 1996
Graph 2.5 Employment shares of business services in each country (II)
- φ _ Ι Ε m IT
LU -y NL y PT m UK
1993 1994 1995 1996
Source: Eurostat, LFS (1997)
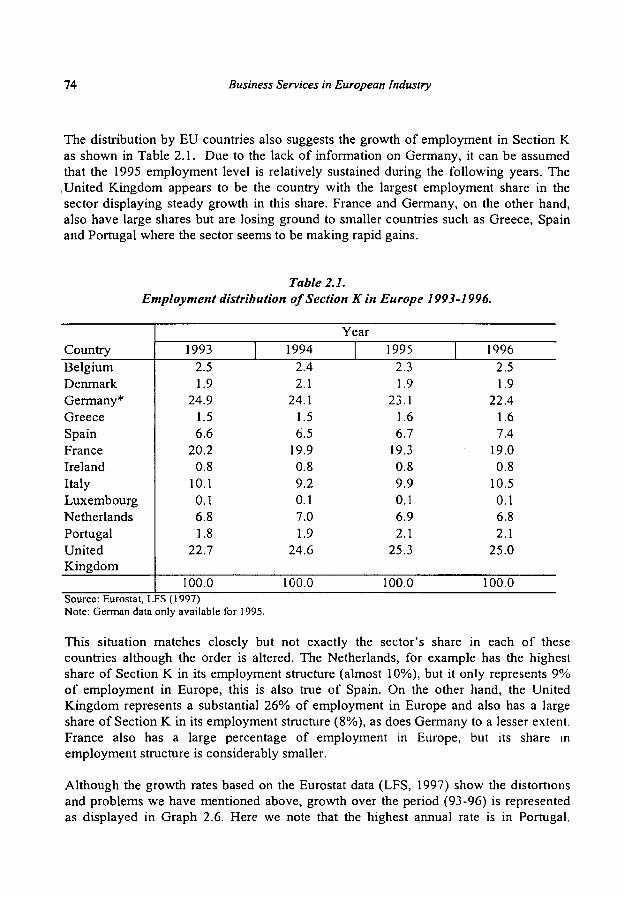
74 Business Services in European Industry
The distribution by EU countries also suggests the growth of employment in Section K as shown in Table 2.1. Due to the lack of information on Germany, it can be assumed that the 1995 employment level is relatively sustained during the following years. The
.United Kingdom appears to be the country with the largest employment share in the sector displaying steady growth in this share. France and Germany, on the other hand, also have large shares but are losing ground to smaller countries such as Greece, Spain and Portugal where the sector seems to be making rapid gains.
Table 2.1. Employment distribution of Section K in Europe 1993-1996.
Country Belgium Denmark Germany* Greece Spain France Ireland Italy Luxembourg Netherlands Portugal United Kingdom
Year 1993
2.5 1.9
24.9 1.5 6.6
20.2 0.8
10.1 0.1 6.8 1.8
22.7
100.0
1994 2.4 2.1
24.1 1.5 6.5
19.9 0.8 9.2 0.1 7.0 1.9
24.6
100.0
1995 2.3 1.9
23.1 1.6 6.7
19.3 0.8 9.9 0.1 6.9 2.1
25.3
100.0
1996 2.5 1.9
22.4 1.6 7.4
19.0 0.8
10.5 0.1 6.8 2.1
25.0
100.0 Source: Eurostat, LFS (1997) Note: German data only available for 1995.
This situation matches closely but not exactly the sector's share in each of these countries although the order is altered. The Netherlands, for example has the highest share of Section K in its employment structure (almost 10%), but it only represents 9% of employment in Europe, this is also true of Spain. On the other hand, the United Kingdom represents a substantial 26% of employment in Europe and also has a large share of Section K in its employment structure (8%), as does Germany to a lesser extent. France also has a large percentage of employment in Europe, but its share in employment structure is considerably smaller.
Although the growth rates based on the Eurostat data (LFS, 1997) show the distortions and problems we have mentioned above, growth over the period (93-96) is represented as displayed in Graph 2.6. Here we note that the highest annual rate is in Portugal,
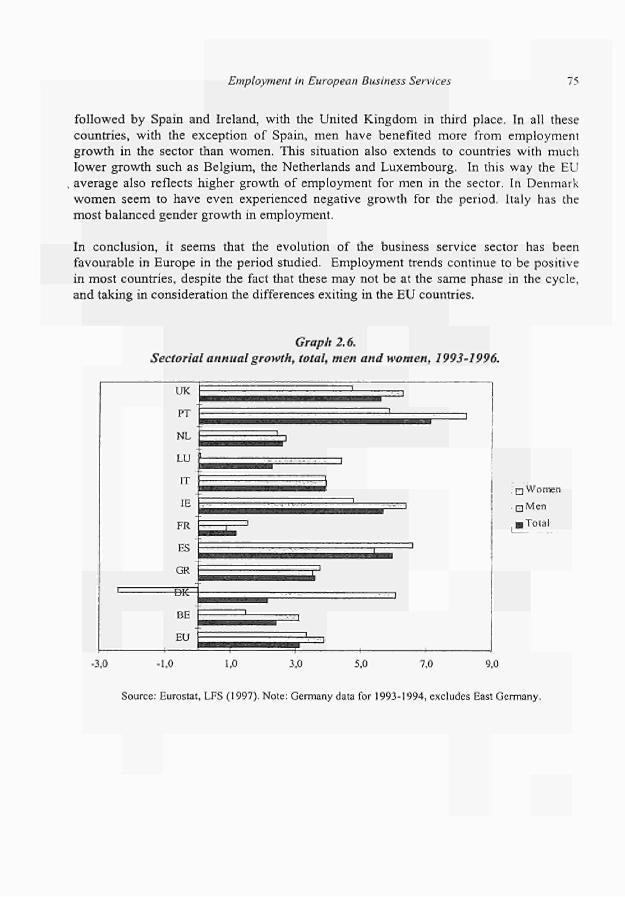
Employment in European Business Services 75
followed by Spain and Ireland, with the United Kingdom in third place. In all these
countries, with the exception of Spain, men have benefited more from employment
growth in the sector than women. This situation also extends to countries with much
lower growth such as Belgium, the Netherlands and Luxembourg. In this way the EU
average also reflects higher growth of employment for men in the sector. In Denmark
women seem to have even experienced negative growth for the period. Italy has the
most balanced gender growth in employment.
In conclusion, it seems that the evolution of the business service sector has been
favourable in Europe in the period studied. Employment trends continue to be positive
in most countries, despite the fact that these may not be at the same phase in the cycle,
and taking in consideration the differences exiting in the EU countries.
Graph 2.6.
Sectorial annual growth, total, men and women, 1993-1996.
-3,0
UK
PT
NL
LU
IT
IE
FR
ES
GR
-BKr
BE
EU
□ Women
□ Men
■ Total
-1,0 1,0 3,0 5,0 7,0 9,0
Source: Eurostat, LFS (1997). Note: Germany data for 1993-1994, excludes East Germany.
76 Business Services in European Industry'
2.2.3. Origin and potential growth of employment in business services
After showing above the highest growth employment rates in European business services for all periods, from the seventies through to the nineties, it is necessary to evaluate whether business services will continue to be a potential source of employment growth. In order to do so, it is useful to explore the origins of business services from a historical perspective. Business services have created employment not because they are completely new, but because they promote new and more efficient forms of specialised employment stemming from sometimes very old and core activities.
One of the oldest business services activities is fairs and exhibitions, which began at the commercial traffic cross-roads in early Mediterranean antiquity and soon became an efficient instrument of trade and integration in the Middle Ages and thereafter. Nowadays, modern specialised trade fairs are replacing traditional general fairs, but they reinforce the traditional role in economic trade and integration. At the same time, some contemporary exhibition functions such as business communication, market knowledge, or transmission of quick feed-back information are becoming part of specific training and specialisation (see Rubalcaba, 1994). In fact, large companies consider the idea of employing exhibition professionals in their marketing departments or, even, of creating exhibition departments. A number of companies subcontract exhibition services and the exhibitions themselves are organised in an increasingly professional way by real exhibition experts.
Other business services can also offer similar examples of the transition from old activities to new ones by exploiting further specialisation, expertise and skills. The professionalisation of activities developed by lawyers, accountants, engineers, interpreters, retailers, make up the core set of current business services professions and enterprises. Thus, specialisation grows in the new world order encouraged by the growth of engineering companies in the eighteenth century, accounting and auditing firms in the nineteenth century or management consulting firms in the twentieth century. At the beginning of the century a significant part of modem business services were already in existence. The period between the wars was critical as the traditional centralised and vertical "U" company structure was transformed into a more flexible and functional "M" structure: work became specialised in departments, making the specialisation of service activities possible (Williamson, 1975, Ochel and Wegner, 1987). In addition, some business services rose whilst manual work fell and "business expertise" was diversified (Wood 1991) within organisations in the early twentieth century. However, the real growth of business service firms took place after the Second World War, as maintained in the Panorama of the EU Industry for activities such as engineering, market research, security services or public relations (European Commission, 1994). Between 1960 and 1975 a major increase in business service use occurred in the main American and European corporations (Williamsom, 1981; Petit, 1986; Ochel and Wegner, 1987). The eighties saw uneven and generalised growth of business services in modem economies. In this period the organisational changes within firms coincide with radical changes in the markets requiring increased competitiveness. Although part of the business service
Employment in European Business Services 77
growth can be attributed to increases in income, it is mainly due to real organisational and structural changes (for the USA economy the income-effect on growth has been estimated at between 30% (Beyers, 1989) and 40% (Tschetter, 1987)).
Each activity adds its own element to the overall processes illustrating the function of business services in historical terms. The main features associated with each activity are as follows:^
Management consulting services are created as a consequence of the growing need for internal administration in the business unit, and because of adaptation of technological developments. Legal services develop in parallel to civil, trade and social disputes and to the laws regulating production directly or indirectly. Accountancy and auditing services multiply because of the operational complexity of the firm, and the accounting system; the difficulties of ascertaining the real value of the company are helped by auditing. Engineering services emerge in association with construction projects. Leasing services are initially proposed by large corporations to meet the needs of their staff and clients. Temporary work services fill most of the gaps left by temporary leave, in order to meet continuous needs; flexibility in the labour market accompanies their expansion. Computer services are the most representative of technological advances and have countless different applications. Fair and exhibitions recover their age-old role of integrating and passing on knowledge in the markets. Market research investigates the markets, which are increasingly transparent and more interdependent. Electronic communications make use of the new technologies to transmit the main element of the economy, namely information. Support for export represents an extension of government interest to the private sector by introducing products abroad within the framework of trade policies. The consumer society stimulates the functions of advertising and marketing directly. The role of image consulting is reflected in the public relations sector. The internationalisation of the markets stimulates the need to contract language services. The need to work in an agreeable, clean and safe environment justifies contracting cleaning and security services. Time pressures stimulate the growth of courier services which enable the quick transmission of original documents.
Only the most relevant elements are highlighted. A specific study of the factors, which in each case justify the origin and functions of a sector, would require analysis beyond the scope of this book.

78 Business Services in European Industry
One characteristic of the structural growth of business services in recent years has been the huge number of new activities it has created. At least 50 business service activities can be identified in total and many of them have been created very recently. Figure 2.1 depicts over 50 business services activities according to two co-ordinates: the period when specific activities expand in a generalised way and the type of economic function on which this expansion is based. The 'mother' activities or the activities from which new activities emerge are marked in bold.
Many activities have emerged from "mother" activities or from historical tradition, originating in previous centuries or the early part of this century. Each economic function usually has a mother activity, from which new activities develop. This is the case of advertising, from which direct marketing or the application of technologies to commercial design have emerged. The same could be said of personnel services, which through successive specialisations, has spawned outplacement, head-hunting and motivation services. Nevertheless, strict linear relationships can not be traced between mother activities and those that follow them within the same function because, as the figure indicates, most activities are located in poorly defined spaces between at least two functions. The emergence of activities fits within the framework of an individual dynamic which will be studied in each case.
The internal dynamism of the business service sector and the successive specialisations which are perceived in some cases are strong indicators of the appearance of new activities in future years. The activities currently showing the highest growth are those in which the initial product phases are beginning. There is greater stagnation in the more traditional activities facing more advanced phases. Traditional activities constitute the bulk of the business service economy (management, engineering, computer programmers, advertising, transport, commercial distribution), only computer services maintains growth characteristic of a new activity. It is worth noting, however, that some traditional activities are able to redirect themselves towards new services, allowing them to maintain high growth rates, above all in periods of expansion. This is the case of auditing, when directed towards consulting services, or engineering when it is directed towards environmental services. An extreme example of continuous adaptation is provided by management consulting, which operates in accordance with the adoption of specific management products. While important reengineering processes are still taking place, outsourcing techniques are enjoying a significant boom and some large consulting firms are starting to set up new services such as knowledge management.
This capacity to adapt to new services coincides with the growth of brand new activities that are commencing their life cycle. They are expected to grow at rates estimated at 25-35% per annum (although the exact figure is not known due to the lack of information available). However, in some instances, brand new activities may represent ideas with no long-term future, or temporary bubbles. In this sense, we have to recognise that certain business services may simply represent a temporary expression of development rather than being a contributing factor to development.
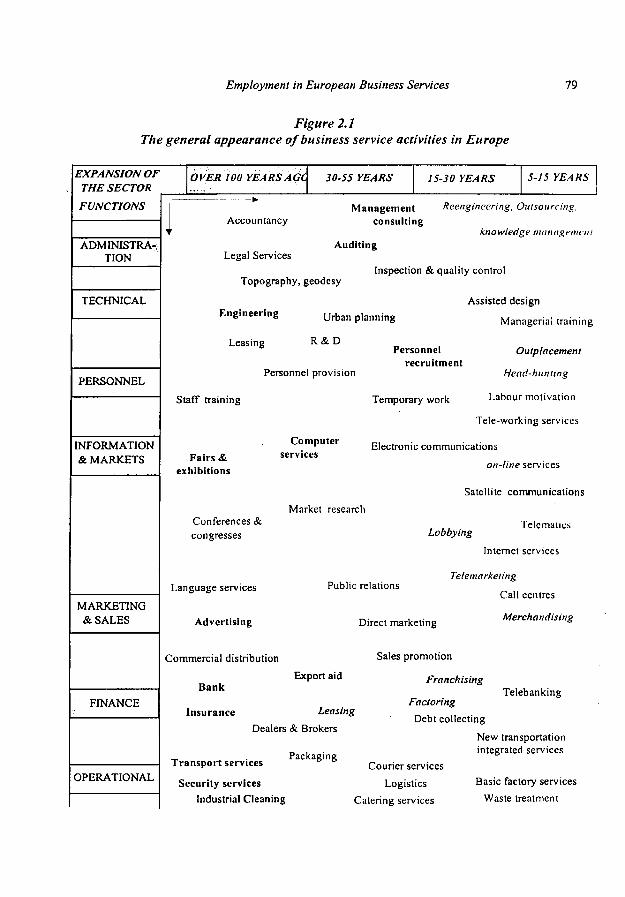
Employment in European Business Services 79
Figure 2.1 The general appearance of business service activities in Europe
EXPANSION OF THE SECTOR
FUNCTIONS
ADMINISTRATION
TECHNICAL
PERSONNEL
INFORMATION & MARKETS
MARKETING & SALES
FINANCE
OPERATIONAL
OVER 100 YEARSAGC 30-55 YEARS 15-30 YEARS 5-15 YEARS
Management Reengineering. Outsourcing. Accountancy consulting
knowledge management Auditing
Legal Services
Topography, geodesy Inspection & quality control
Engineering
Leasing
Personnel provision
Urban planning
R & D
Assisted design
Managerial training
Personnel recruitment
Staff training
Fairs & exhibitions
Conferences & congresses
Language services
Advertising
Commercial distribution
Bank
Insurance
Outplacement
Heari-hunling
Temporary work Labour motivation
Tele-working services
Electronic communications rvices
on-line services
Satellite communications
Market research
Lobbying telematics
Internet services
Public relations
Direct marketing
Telemarketing
Call centres
Merchandising
Export aid
Leasing
Dealers & Brokers
Sales promotion
Franchising
Factoring Telebanking
Transport services
Security services Industrial Cleaning
Packaging
Debt collecting New transportation integrated services
Courier services Logistics Basic factory services
Catering services Waste treatment

80 Business Services in European Industry
The future of the new activities of business services will reveal itself in a few years' time. What is clear already is the positive evolution of some activities that appeared in
.the early nineties. For example, Franchising is experiencing a spectacular boom throughout Europe (European Commission, 1994). Head-hunting agencies have already consolidated their position, albeit a questionable one. Outplacement agencies provided work, before the recession of the nineties, for 33% of people made redundant due to take-overs or mergers, 18% of people who suffered redundancy due to staff cutbacks, and 22% of people who simply did not get on well with the company7. Employee motivation agencies have seen a tentative but justified growth, as motivation problems often can not be solved within the company itself (Benmett, 1989). Call centres now exist in many countries, as well as teleworking services and centres help to enterprises and teleworkers to work together. Internet services are also growing in importance since a major part of the commerce is expected to be made using the Net, and new communication opportunities are opening.
It is worth noting that many new business service activities are developing thanks to four key factors: internationalisation (e.g. franchising), new technologies (e.g. marketing techniques, electronic communications, internet services and call centres), companies' desire to concentrate in core activities (e.g. outsourcing activities), and the importance of the human factor. This last factor is inscribed with the need to optimise the use of the work factor, by exploiting its resources (placement, training, teleworking and motivation), ensuring continuity (temporary work), avoiding disinvestments (outplacement) or supporting the best-qualified segments (head-hunting). These new work services help to strengthen the "human capital", by incorporating the valuations of income and costs formulated by Becker (1964) in the new structure of the labour markets and the opportunities offered by the appearance of "external" agents, who act as intermediaries between the worker and the company. There are also services linked to the accumulation, transmission and exploitation of knowledge as the guiding principle of the company. Knowledge and information are the most innovative watchwords in the business service economy.
The main potential sources of employment in business services spring from these key factors, although the number of explanatory factors for business services is much greater, as we will explain in chapter 3. Today this activity creates the majority of work and will probably cause the greatest number of jobs in the future. New jobs are also appearing linked to the professionalisation of many traditional activities, as well as new business opportunities and even the management of services themselves, as occurs in the case of outsourcing with advanced management consulting.
The success of outplacement depends on outplacement occurring within a period of 3 or 6 months. The data available show that a move to a better job can occur in 70% of cases.

Employment in European Business Services 81
Although part of the potential growth of business services can be linked to the emergence of new opportunities, new activities and new jobs, another arguably more important part appears to be connected to specific factors, some of which are studied in depth in other sections. It is worth enumerating a number of them here:
dynamics of the new activity, with high growth in employment capacity during periods of expansion and recession existing barriers to European growth in contrast to the more extensive presence of business services in the US economy increasing interrelation between business services and manufacturing increasing links with constantly changing IT technologies uneven balance of major outsourcing trends and some re-internalisation processes still high but decreasing productivity levels global integration requiring more quality, strategies, and markets more flexibility and qualifications required in employment needs
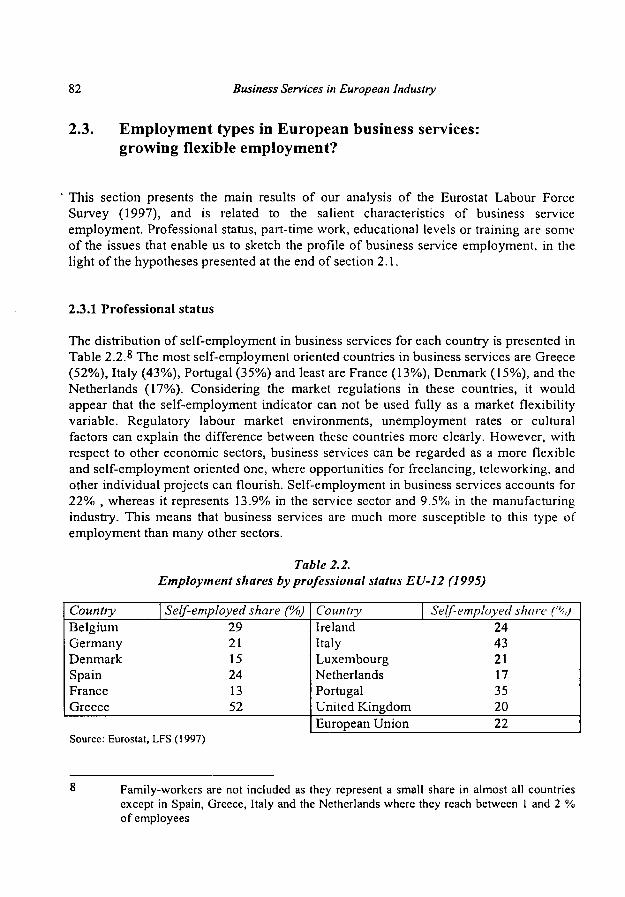
82 Business Services in European Industry
2.3. Employment types in European business services: growing flexible employment?
This section presents the main results of our analysis of the Eurostat Labour Force Survey (1997), and is related to the salient characteristics of business service employment. Professional status, part-time work, educational levels or training are some of the issues that enable us to sketch the profile of business service employment, in the light of the hypotheses presented at the end of section 2.1.
2.3.1 Professional status
The distribution of self-employment in business services for each country is presented in Table 2.2.8 Th e most self-employment oriented countries in business services are Greece (52%), Italy (43%), Portugal (35%) and least are France (13%), Denmark (15%), and the Netherlands (17%). Considering the market regulations in these countries, it would appear that the self-employment indicator can not be used fully as a market flexibility variable. Regulatory labour market environments, unemployment rates or cultural factors can explain the difference between these countries more clearly. However, with respect to other economic sectors, business services can be regarded as a more flexible and self-employment oriented one, where opportunities for freelancing, teleworking, and other individual projects can flourish. Self-employment in business services accounts for 22% , whereas it represents 13.9% in the service sector and 9.5% in the manufacturing industry. This means that business services are much more susceptible to this type of employment than many other sectors.
Table 2.2. Employment shares by professional status EU-12 (1995)
Country Belgium Germany Denmark Spain France Greece
Self-employed share (%) 29 21 15 24 13 52
Country Ireland Italy Luxembourg Netherlands Portugal United Kingdom European Union
Self-employed share 24 43 21 17 35 20 22
(%)
Source: Eurostat, LFS (1997)
Family-workers are not included as they represent a small share in almost all countries except in Spain, Greece, Italy and the Netherlands where they reach between 1 and 2 % of employees
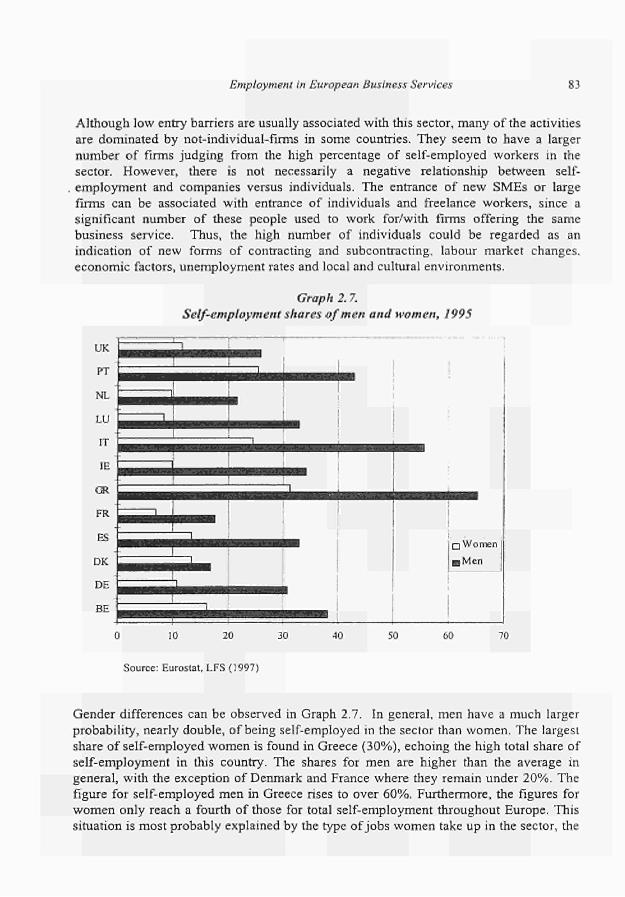
Employment in European Business Services 83
Although low entry barriers are usually associated with this sector, many of the activities
are dominated by notindividualfirms in some countries. They seem to have a larger
number of firms judging from the high percentage of selfemployed workers in the
sector. However, there is not necessarily a negative relationship between self
employment and companies versus individuals. The entrance of new SMEs or large
firms can be associated with entrance of individuals and freelance workers, since a
significant number of these people used to work for/with firms offering the same
business service. Thus, the high number of individuals could be regarded as an
indication of new forms of contracting and subcontracting, labour market changes,
economic factors, unemployment rates and local and cultural environments.
Graph 2.7.
Selfemployment shares of men and women, 1995
UK
PT
NL
LU
IT
IE
GR
KK
FS
DK
l)h
BF
h
^ ^ ^ ^ ^ ^ ^ ^ ^ ^ ^
!
T ^ ^ ^ ^ ^
■
1
j
:
L. „ .
■ Men
Ì
I
10 20 30 40 50 60 70
Source: Eurostat, LFS (1997)
Gender differences can be observed in Graph 2.7. In general, men have a much larger
probability, nearly double, of being selfemployed in the sector than women. The largest
share of selfemployed women is found in Greece (30%), echoing the high total share of
selfemployment in this country. The shares for men are higher than the average in
general, with the exception of Denmark and France where they remain under 20%. The
figure for selfemployed men in Greece rises to over 60%. Furthermore, the figures for
women only reach a fourth of those for total selfemployment throughout Europe. This
situation is most probably explained by the type of jobs women take up in the sector, the
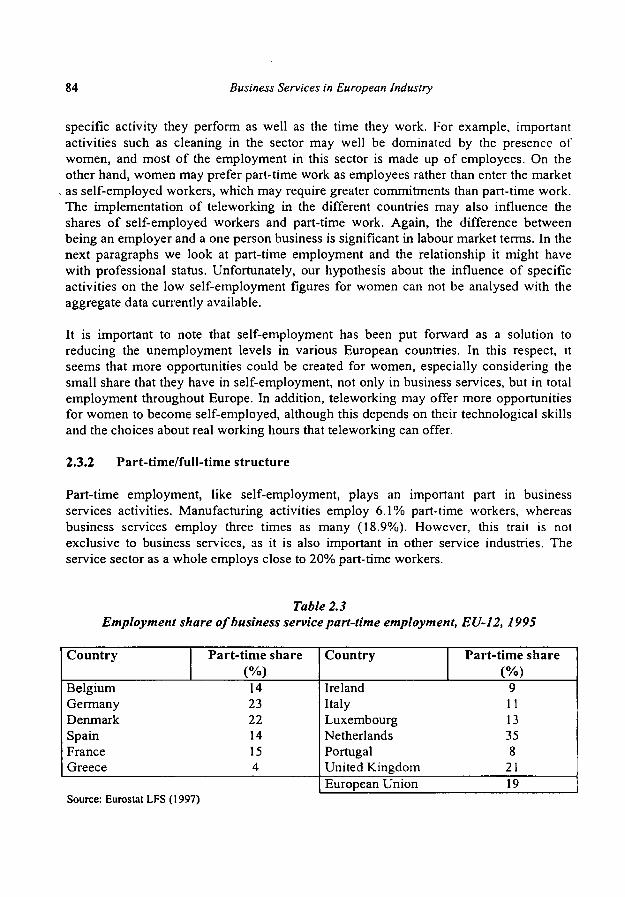
84 Business Services in European Industry
specific activity they perform as well as the time they work. For example, important activities such as cleaning in the sector may well be dominated by the presence of women, and most of the employment in this sector is made up of employees. On the other hand, women may prefer part-time work as employees rather than enter the market as self-employed workers, which may require greater commitments than part-time work. The implementation of teleworking in the different countries may also influence the shares of self-employed workers and part-time work. Again, the difference between being an employer and a one person business is significant in labour market terms. In the next paragraphs we look at part-time employment and the relationship it might have with professional status. Unfortunately, our hypothesis about the influence of specific activities on the low self-employment figures for women can not be analysed with the aggregate data currently available.
It is important to note that self-employment has been put forward as a solution to reducing the unemployment levels in various European countries. In this respect, it seems that more opportunities could be created for women, especially considering the small share that they have in self-employment, not only in business services, but in total employment throughout Europe. In addition, teleworking may offer more opportunities for women to become self-employed, although this depends on their technological skills and the choices about real working hours that teleworking can offer.
2.3.2 Part-time/full-time structure
Part-time employment, like self-employment, plays an important part in business services activities. Manufacturing activities employ 6.1% part-time workers, whereas business services employ three times as many (18.9%). However, this trait is not exclusive to business services, as it is also important in other service industries. The service sector as a whole employs close to 20% part-time workers.
Table 2.3 Employment share of business service part-time employment, EU-12, 1995
Country
Belgium Germany Denmark Spain France Greece
Part-time share (%) 14 23 22 14 15 4
Country
Ireland Italy Luxembourg Netherlands Portugal United Kingdom European Union
Part-time share (%)
9 11 13 35 8
21 19
Source: Eurostat LFS (1997)
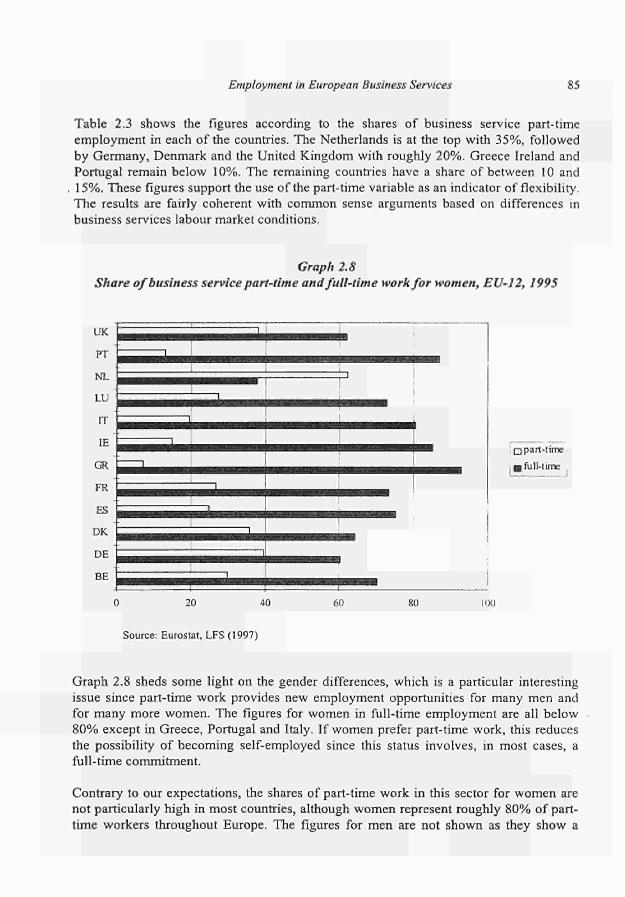
Employment in European Business Services 85
Table 2.3 shows the figures according to the shares of business service part-time
employment in each of the countries. The Netherlands is at the top with 35%, followed
by Germany, Denmark and the United Kingdom with roughly 20%. Greece Ireland and
Portugal remain below 10%. The remaining countries have a share of between 10 and
15%. These figures support the use of the part-time variable as an indicator of flexibility.
The results are fairly coherent with common sense arguments based on differences in
business services labour market conditions.
Graph 2.8
Share of business service part-time and full-time work for women, EU-12,1995
UK
PI
NL
I I I
IT
IP,
(fR
FK
KS
l)K
OF
RF
^^^^^^^ ■
1
^ ^
^ ^ ^ ^ ^ ^ ^
^ ^ ^ ^
^ ^ ^ 1 i
-
1
j □part-time
ι Β full-time
20 40 60 80 I OU
Source: Eurostat, LFS (1997)
Graph 2.8 sheds some light on the gender differences, which is a particular interesting
issue since part-time work provides new employment opportunities for many men and
for many more women. The figures for women in full-time employment are all below
80% except in Greece, Portugal and Italy. If women prefer part-time work, this reduces
the possibility of becoming self-employed since this status involves, in most cases, a
full-time commitment.
Contrary to our expectations, the shares of part-time work in this sector for women are
not particularly high in most countries, although women represent roughly 80% of part-
time workers throughout Europe. The figures for men are not shown as they show a

86 Business Services in European Industry
homogenous profile in all countries with shares under 20% in all countries for part-time employment. The Netherlands and Denmark have the highest share at around 15% and all the others are below 10%. The profile for women, on the other hand, suggests more variety throughout countries. The Netherlands is particularly striking as it has over 60% of women in part-time employment in the sector. In the United Kingdom, Denmark, and Germany the share reaches 30% or over. Greece has the smallest share at 7%. The share in the remaining countries oscillates between 10 and 25%.
These relatively low percentages can be explained by several factors such as labour market laws or different prevailing fixed costs per worker. Another explanation is that work can be broken down into smaller shifts depending on the capital intensity of the different firms (productivity) and, of course, of different economic activities (Owen, 1978; Montgomery, 1988) and not directly on the nature of the jobs themselves. "Part-timers are ... more attractive in industries where demand varies predictably over the working week" or season (Montgomery, 1988). These include industries like catering and retailing, which appear in the Eurostat data (LFS, 1997). Business services are fairly unpredictable activities, which can affect part-time employment for women.
Graph 2.9 suggests a negative relationship between the share of women in part-time work and the share in self-employment in the EU-12 countries. The countries where it is more likely for women to be self-employed also have low shares of women in part-time work for the sector. The same relationship does not exist for men, as the shares are totally independent. However, this negative relationship is repeated for the total employment figures for women throughout all sectors^. At an individual level, it is highly likely that those in self-employment will, in general, work full-time to attend to their businesses. At an aggregate level, however, this relationship is not necessarily reflected as part-time work and self-employment respond to different determinants. This means that other explanations for this apparent relationship have to be found. One such explanation might be that in the countries with a high share of women in self-employment, the situation reflects the difficult market conditions for women who wish to enter as employees, so they enter the market as self-employed, or that in fact conditions for entering the market as self-employed are indeed easier (based on government policies, for example). In Greece this also extends to men. Conversely, abundant part-time work may be acting as a deterrent for women to set up businesses on their own under the assumption that they prefer part-time work; or that market conditions are more difficult for women to be self-employed, for example, finding commercial financial support, although, we repeat, this sector has lower entry barriers in general. It is interesting to note that the Netherlands is the only country in which part-time work is higher than full-time work for self-employed women not only in this sector,
The simple correlation coefficient for this relationship in the sector is -0.62 and the R2 coefficient is 0.39. For total employment of women these figures are -0.65 and 0.42 respectively.
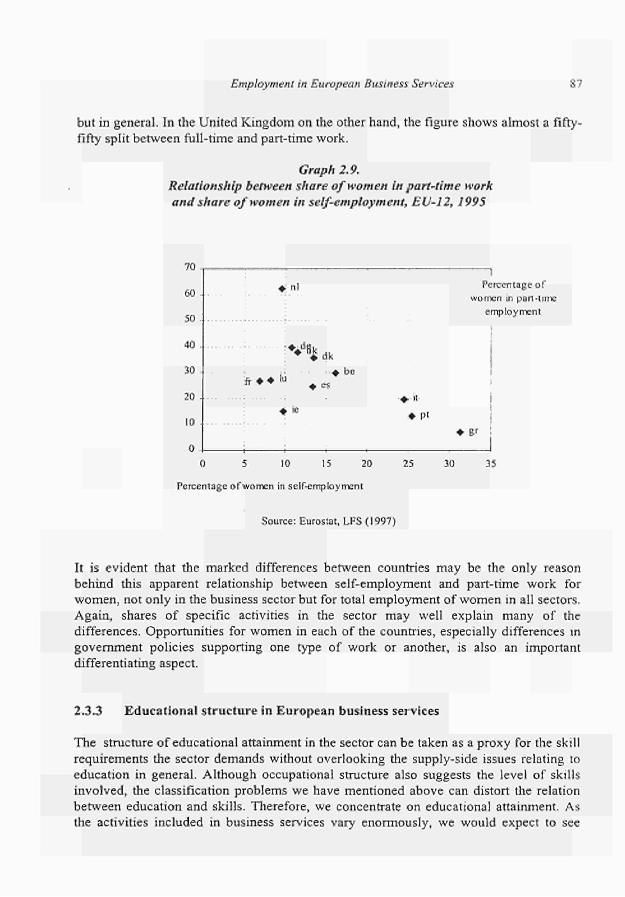
Employment in European Business Services 87
but in general. In the United Kingdom on the other hand, the figure shows almost a fifty
fifty split between fulltime and parttime work.
Graph 2.9.
Relationship between share of women in part-time work
and share of women in self-employment, EU12, 1995
70
60
50
40
30
20
10
;VBk ♦ dk
ft ♦ ♦ lu
+ be
♦ es
♦ le
- — I
Percentage of
women in part-time
employment
♦-it-
♦ P'
Ο 5 10 15 20
Percentage of women in selfemployment
25 30 35
Source: Eurostat, LFS (1997)
It is evident that the marked differences between countries may be the only reason
behind this apparent relationship between selfemployment and parttime work for
women, not only in the business sector but for total employment of women in all sectors.
Again, shares of specific activities in the sector may well explain many of the
differences. Opportunities for women in each of the countries, especially differences in
government policies supporting one type of work or another, is also an important
differentiating aspect.
2.3.3 Educational structure in European business services
The structure of educational attainment in the sector can be taken as a proxy for the skill
requirements the sector demands without overlooking the supplyside issues relating to
education in general. Although occupational structure also suggests the level of skills
involved, the classification problems we have mentioned above can distort the relation
between education and skills. Therefore, we concentrate on educational attainment. As
the activities included in business services vary enormously, we would expect to see
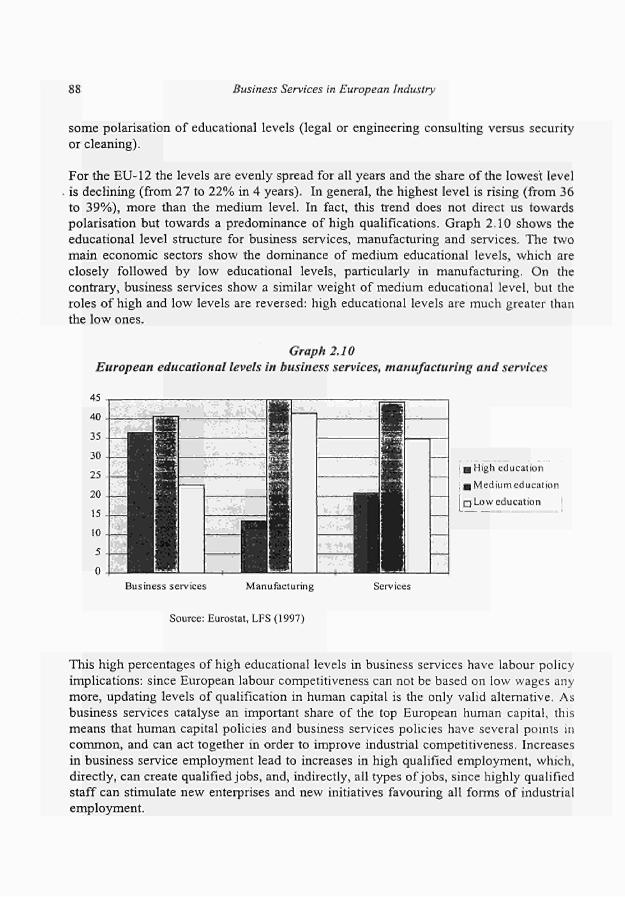
88 Business Services in European Industry
some polarisation of educational levels (legal or engineering consulting versus security
or cleaning).
For the EU-12 the levels are evenly spread for all years and the share of the lowest level
is declining (from 27 to 22% in 4 years). In general, the highest level is rising (from 36
to 39%), more than the medium level. In fact, this trend does not direct us towards
polarisation but towards a predominance of high qualifications. Graph 2.10 shows the
educational level structure for business services, manufacturing and services. The two
main economic sectors show the dominance of medium educational levels, which are
closely followed by low educational levels, particularly in manufacturing. On the
contrary, business services show a similar weight of medium educational level, but the
roles of high and low levels are reversed: high educational levels are much greater than
the low ones.
Graph 2.10
European educational levels in business services, manufacturing and services
i ■ High education
; a Medium education
□ Low education
Business services Manufacturing Services
Source: Eurostat, LFS (1997)
This high percentages of high educational levels in business services have labour policy
implications: since European labour competitiveness can not be based on low wages any
more, updating levels of qualification in human capital is the only valid alternative. As
business services catalyse an important share of the top European human capital, this
means that human capital policies and business services policies have several points in
common, and can act together in order to improve industrial competitiveness. Increases
in business service employment lead to increases in high qualified employment, which,
directly, can create qualified jobs, and, indirectly, all types of jobs, since highly qualified
staff can stimulate new enterprises and new initiatives favouring all forms of industrial
employment.
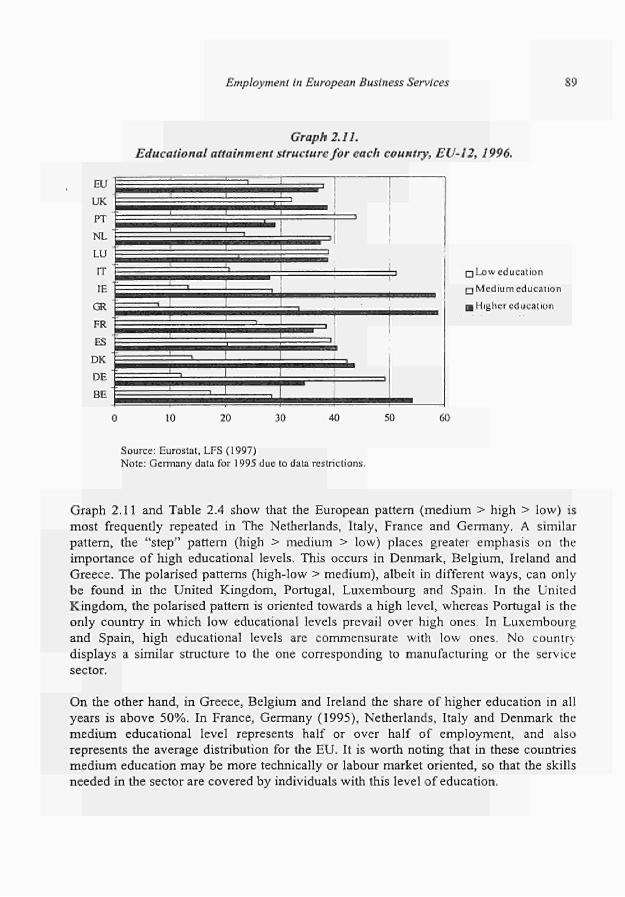
Employment in European Business Services 89
Graph 2.11.
Educational attainment structure for each country, EU12, 1996.
EU
UK
PT
NL
LU
IT
IK
(ÍK
FR
ES
DK
DE
Bb
^ ^ 1 ^
ι 1 1
1
1
1
— 1 '
1
1
1 1
■ ι — ι r
1 1
□ Low education
□ Medium education
Β Higher education
10 20 30 40 50 60
Source: Eurostat, LFS (1997)
Note: Germany data for 1995 due to data restrictions.
Graph 2.11 and Table 2.4 show that the European pattern (medium > high > low) is
most frequently repeated in The Netherlands, Italy, France and Germany. A similar
pattern, the "step" partem (high > medium > low) places greater emphasis on the
importance of high educational levels. This occurs in Denmark, Belgium, Ireland and
Greece. The polarised patterns (highlow > medium), albeit in different ways, can only
be found in the United Kingdom, Portugal, Luxembourg and Spain. In the United
Kingdom, the polarised partem is oriented towards a high level, whereas Portugal is the
only country in which low educational levels prevail over high ones. In Luxembourg
and Spain, high educational levels are commensurate with low ones. No country
displays a similar structure to the one corresponding to manufacturing or the service
sector.
On the other hand, in Greece, Belgium and Ireland the share of higher education in all
years is above 50%. In France, Germany (1995), Netherlands, Italy and Denmark the
medium educational level represents half or over half of employment, and also
represents the average distribution for the EU. It is worth noting that in these countries
medium education may be more technically or labour market oriented, so that the skills
needed in the sector are covered by individuals with this level of education.

90 Business Services in European Industry
Table 2.4. Education and polarisation in European Business services, 1996
Educational disparities
Unpolarised patterns (leadership of medium educational levels)
Polarised patterns (low presence of medium educational levels)
high > low
low > high
low = high
- European business service pattern (medium > high > low): European Union, The Netherlands, Italy, France, Germany
- "Step"pattern (high > medium > low): Ireland, Greece, Denmark, Belgium
- Manufacturing or services pattern (medium > low > high): None
- Polarised high-oriented pattern (high > low > medium): United Kingdom
- Polarised low-oriented pattern (low > high > medium). Portugal
- Polarised pattern (high = low > medium): Luxembourg, Spain
Source: Eurostat, LFS (1997), Graph 2.11
The differences between official qualifications in the different countries may not give a true idea of the degree of professionalisation over time that employment in this sector should intuitively reflect. Looking at the evolution of educational attainment, and quoting the ERECO study, "one is observing a cohort effect. The data reveal not so much individuals increasing their levels of educational attainment over time, but the entry of new cohorts into employment with a higher (or lower) level of educational attainment than the previous cohort. A priori, it is in those countries with relatively less developed education systems that there is greatest scope for an increase in the educational attainment of the workforce" (ERECO,1994, pp.696-697). This could be the case in Greece, Spain and Portugal. It remains to be seen if these countries will continue to increase their share of high education employment in the sector. It is interesting to note that Greece shows the highest percentage of self-employment in the sector matching its high share of high educational attainment (50% in both cases). Belgium and Ireland also have important shares of high educational attainment but their shares of self-employed are maintained within the average (30 and 2 5 % respectively). The ' s tep ' distribution with the lowest share of employment for the lowest qualified followed by medium education and the highest share of employment for the highest level education is common only to Belgium, Denmark, Greece, and Ireland.
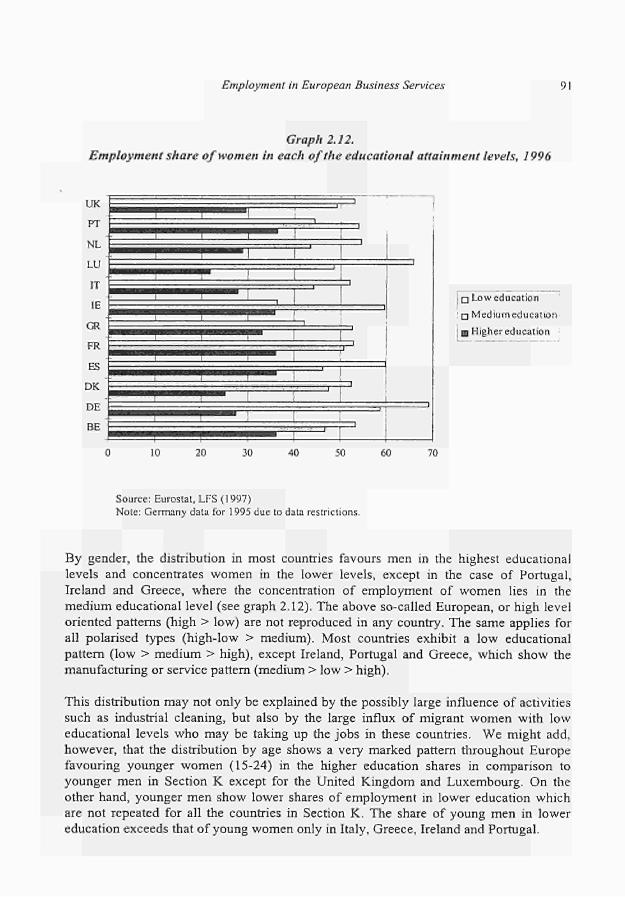
Employment in European Business Services 91
Graph 2.12.
Employment share of women in each of the educational attainment levels, 1996
UK
PT
NL
LU
IT
IE
GR
FR
F.S
DK
DF.
BE
: , : : ^
: I
1
, , _ ,—,.
1
1 , , 1
1
1
■ 1
—1
! 1
1
1
□ Low education
■ □ Mediumeducation
¡■Highereducation !
10 20 30 40 50 60 70
Source: Eurostat, LFS (1997) Note: Germany data for 1995 due to data restrictions.
By gender, the distribution in most countries favours men in the highest educational
levels and concentrates women in the lower levels, except in the case of Portugal,
Ireland and Greece, where the concentration of employment of women lies in the
medium educational level (see graph 2.12). The above socalled European, or high level
oriented patterns (high > low) are not reproduced in any country. The same applies for
all polarised types (highlow > medium). Most countries exhibit a low educational
pattern (low > medium > high), except Ireland, Portugal and Greece, which show the
manufacturing or service pattern (medium > low > high).
This distribution may not only be explained by the possibly large influence of activities
such as industrial cleaning, but also by the large influx of migrant women with low
educational levels who may be taking up the jobs in these countries. We might add,
however, that the distribution by age shows a very marked pattern throughout Europe
favouring younger women (1524) in the higher education shares in comparison to
younger men in Section Κ except for the United Kingdom and Luxembourg. On the
other hand, younger men show lower shares of employment in lower education which
are not repeated for all the countries in Section K. The share of young men in lower
education exceeds that of young women only in Italy, Greece, Ireland and Portugal.
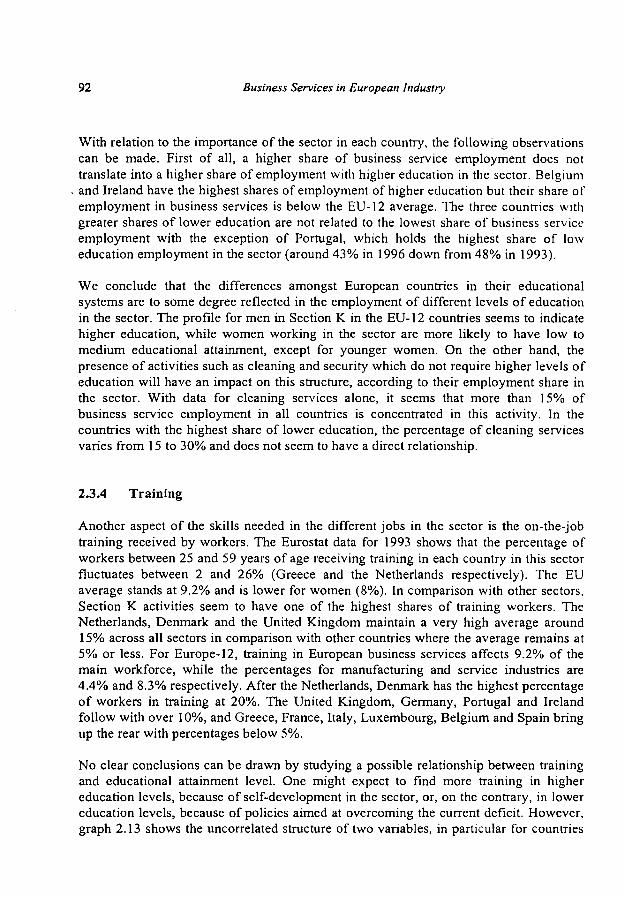
92 Business Services in European Industry
With relation to the importance of the sector in each country, the following observations can be made. First of all, a higher share of business service employment does not translate into a higher share of employment with higher education in the sector. Belgium and Ireland have the highest shares of employment of higher education but their share of employment in business services is below the EU-12 average. The three countries with greater shares of lower education are not related to the lowest share of business service employment with the exception of Portugal, which holds the highest share of low education employment in the sector (around 43% in 1996 down from 48% in 1993).
We conclude that the differences amongst European countries in their educational systems are to some degree reflected in the employment of different levels of education in the sector. The profile for men in Section K in the EU-12 countries seems to indicate higher education, while women working in the sector are more likely to have low to medium educational attainment, except for younger women. On the other hand, the presence of activities such as cleaning and security which do not require higher levels of education will have an impact on this structure, according to their employment share in the sector. With data for cleaning services alone, it seems that more than 15% of business service employment in all countries is concentrated in this activity. In the countries with the highest share of lower education, the percentage of cleaning services varies from 15 to 30% and does not seem to have a direct relationship.
2.3.4 Training
Another aspect of the skills needed in the different jobs in the sector is the on-the-job training received by workers. The Eurostat data for 1993 shows that the percentage of workers between 25 and 59 years of age receiving training in each country in this sector fluctuates between 2 and 26% (Greece and the Netherlands respectively). The EU average stands at 9.2% and is lower for women (8%). In comparison with other sectors, Section K activities seem to have one of the highest shares of training workers. The Netherlands, Denmark and the United Kingdom maintain a very high average around 15% across all sectors in comparison with other countries where the average remains at 5% or less. For Europe-12, training in European business services affects 9.2% of the main workforce, while the percentages for manufacturing and service industries are 4.4% and 8.3% respectively. After the Netherlands, Denmark has the highest percentage of workers in training at 20%. The United Kingdom, Germany, Portugal and Ireland follow with over 10%, and Greece, France, Italy, Luxembourg, Belgium and Spain bring up the rear with percentages below 5%.
No clear conclusions can be drawn by studying a possible relationship between training and educational attainment level. One might expect to find more training in higher education levels, because of self-development in the sector, or, on the contrary, in lower education levels, because of policies aimed at overcoming the current deficit. However, graph 2.13 shows the uncorrelated structure of two variables, in particular for countries

Employment in European Business Services 93
with low training. This does not mean that workers with low qualifications do not need training, rather that training is very important in countries which already enjoy a high educational level.
Graph 2.13 Relationship between training and higher education in the EUR-12
25,0
20,0
15,0 . .
10,0 ..
Persons aged 2 to 59 years in full-time employment receiving training (%)
.Higher education (%)
Source: Eurostat, LFS (1997)
The need for educational policies to address business services and business services to address educational policies is abundantly clear. These policies would not only serve to improve the current educational and training levels, but to maximise the positive effects of business services in industrial competitiveness.
2.3.5 Age and gender structure
This section focuses on the age and gender structure although this last dimension has been incorporated into the analysis of both the structure of employment and educational attainment in the previous sections. The age and gender structure at particular points in time could be taken as a reflection of the preferences that employers manifest for a particular group of the population in their retention and recruitment policies. Over time and under different economic scenarios, in theory, one could interpret the changes in employment of one particular age and gender group as the reflection of the way in which employers have adjusted their workforce. The underlying population and activity rate changes should be stressed which, of course, also influence the age and gender structure.
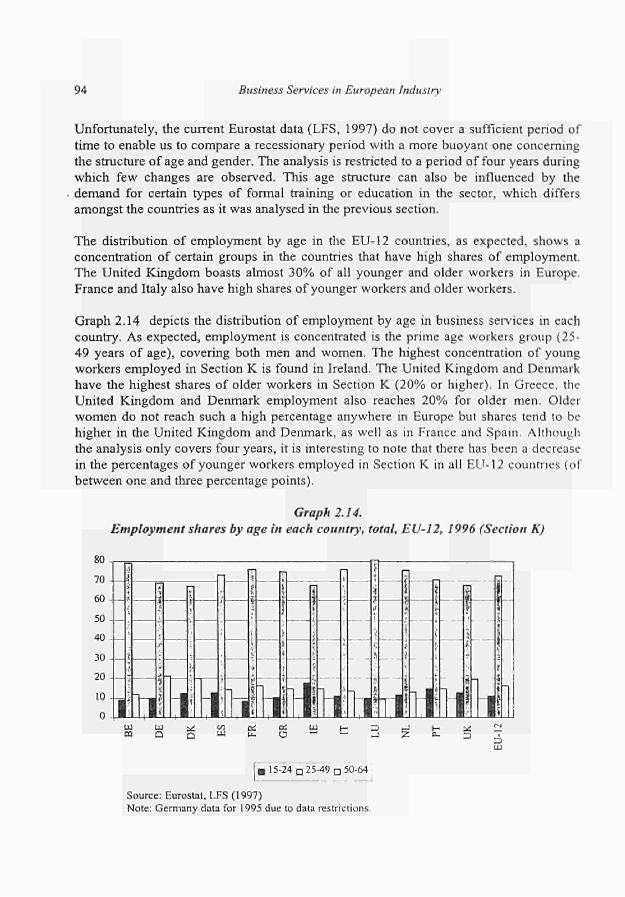
94 Business Services in European Industry
Unfortunately, the current Eurostat data (LFS, 1997) do not cover a sufficient period of
time to enable us to compare a recessionary period with a more buoyant one concerning
the structure of age and gender. The analysis is restricted to a period of four years during
which few changes are observed. This age structure can also be influenced by the
demand for certain types of formal training or education in the sector, which differs
amongst the countries as it was analysed in the previous section.
The distribution of employment by age in the EU12 countries, as expected, shows a
concentration of certain groups in the countries that have high shares of employment.
The United Kingdom boasts almost 30% of all younger and older workers in Europe.
France and Italy also have high shares of younger workers and older workers.
Graph 2.14 depicts the distribution of employment by age in business services in each
country. As expected, employment is concentrated is the prime age workers group (25
49 years of age), covering both men and women. The highest concentration of young
workers employed in Section K is found in Ireland. The United Kingdom and Denmark
have the highest shares of older workers in Section K (20% or higher). In Greece, the
United Kingdom and Denmark employment also reaches 20% for older men. Older
women do not reach such a high percentage anywhere in Europe but shares tend to be
higher in the United Kingdom and Denmark, as well as in France and Spain. Although
the analysis only covers four years, it is interesting to note that there has been a decrease
in the percentages of younger workers employed in Section K in all EU12 countries (of
between one and three percentage points).
Graph 2.14.
Employment shares by age in each country, total, EU12, 1996 (Section K)
80
70
60
50
40
30
20
10
ï
i' ï ? — ï -■ ι
{ \
i *"
i : 4 j * -
1 - t
1 1 £ i
1 1.1,., »I 1
I
; M 1 1 . HI
•
— ι
I
: 1
—
ι
Ί
1
—
-
'HI I 1.1
_
ι i
1
hi'
•
_
11
f )
j
■it
i i
f
M tu ω s¿ m Q Q UJ
oí ci tu u. O — i i 2
UJ
! 15-24 D 25-49 π 50-64
Source: Eurostat, LFS (1997)
Note: Germany data for 1995 due to data restrictions.
Employment in European Business Services 95
As mentioned above, this decrease could be due to demographic and activity rate factors (which are both decreasing for younger workers (EU, 1996)) and also to the hiring practices and preferences of employers. Given the high unemployment rates for young
. people, it seems all three factors have played an important role in the decline for this period. In addition, the educational requirements in each country for the jobs available in the sector may also be checking the employment of young people in the sector, which has enjoyed the highest employment growth in the last few years. Indeed older workers have gained one percentage point for the same period, although in some countries there have been losses (especially in Luxembourg, two percentage points; and to a much lesser degree in Belgium, Denmark, Italy and the Netherlands). Ireland and Portugal present the highest gains for older workers (two and three percentage points respectively). Once more, demographic and activity rate factors play an important role, as do retention practices used by firms. The ageing of the workforce in European society is undeniable and this process seems to be affecting the gains by older workers in the sector. On the other hand, the practice of early retirement to adjust the workforce does not seem to have affected Section K between 1993 and 1996 in most countries.
2.3.6 Hours worked
Another important aspect of employment is the distribution of hours worked in the sector. Although this variable is very closely linked to productivity, which we will be dealt with in detail in chapter 7, a brief description of European distribution follows. This distribution can be taken as an index of the flexibility of the sector in each country and, or alternatively, as representing the differences in labour legislation and collective bargaining in the countries which reflect this flexibility. Although throughout the EU there is a concentration of hours in the 36 to 40 hours per week group (65%) there are important differences amongst countries. In Section K the United Kingdom emerges as the country with the most even structure of hours worked (and in general), the countries with the highest concentration of 40 hours per week in the sector are: Greece, Spain, Italy, Luxembourg and the Netherlands. In the Netherlands it is interesting to note that the same concentration is found for women since this country holds the highest share of women working part-time. In Belgium, Denmark, Ireland, France, and Germany most employees work around 36 to 39 hours per week. Finally, in Portugal, there is an emphasis on roughly 40 hours, but with a much lower percentage than in other countries (only 48%).The distribution by gender changes, as expected, for a concentration on lower hours for women: 50% from 1 to 39 hours worked per week throughout the EU. However, in Spain, and in the other countries where 40 hours per week has the highest share, there is also a strong concentration of women in this number of hours. Again, the case of the Netherlands is interesting as it has the highest share of women in part-time work.
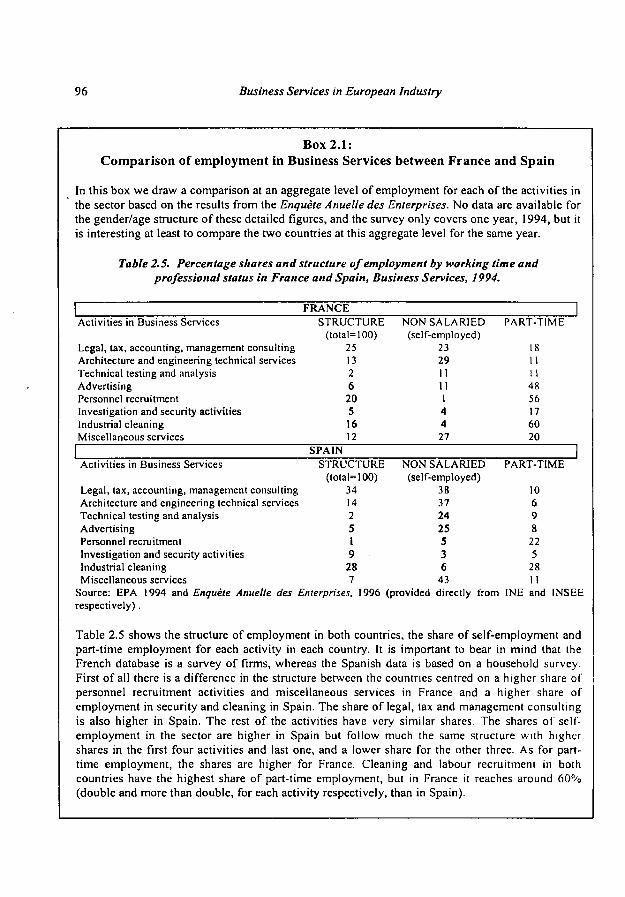
96 Business Services in European Industry
Box 2.1: Comparison of employment in Business Services between France and Spain
In this box we draw a comparison at an aggregate level of employment for each of the activities in the sector based on the results from the Enquête Anuelle des Enterprises. No data are available for the gender/age structure of these detailed figures, and the survey only covers one year, 1994, but it is interesting at least to compare the two countries at this aggregate level for the same year.
Table 2.5. Percentage shares and structure of employment by working time and professional status in France and Spain, Business Services, 1994.
1 FRANCE | Activities in Business Services STRUCTURE NON SALARIED PART-TIME
(total=100) (self-employed) Legal, tax, accounting, management consulting 25 23 18 Architecture and engineering technical services 13 29 11 Technical testing and analysis 2 11 II Advertising 6 11 48 Personnel recruitment 20 1 56 Investigation and security activities 5 4 17 Industrial cleaning 16 4 60 Miscellaneous services 12 27 20
SPAIN | Activities in Business Services STRUCTURE NON SALARIED PART-TIME
(total=100) (self-employed) Legal, tax, accounting, management consulting 34 38 10 Architecture and engineering technical services 14 37 6 Technical testing and analysis 2 24 9 Advertising 5 25 8 Personnel recruitment 1 5 22 Investigation and security activities 9 3 5 Industrial cleaning 28 6 28 Miscellaneous services 7 43 II
Source: EPA 1994 and Enquête Anuelle des Enterprises, 1996 (provided directly from INE and INSEE respectively).
Table 2.5 shows the structure of employment in both countries, the share of self-employment and part-time employment for each activity in each country. It is important to bear in mind that the French database is a survey of firms, whereas the Spanish data is based on a household survey. First of all there is a difference in the structure between the countries centred on a higher share of personnel recruitment activities and miscellaneous services in France and a higher share of employment in security and cleaning in Spain. The share of legal, tax and management consulting is also higher in Spain. The rest of the activities have very similar shares. The shares of self-employment in the sector are higher in Spain but follow much the same structure with higher shares in the first four activities and last one, and a lower share for the other three. As for part-time employment, the shares are higher for France. Cleaning and labour recruitment in both countries have the highest share of part-time employment, but in France it reaches around 60% (double and more than double, for each activity respectively, than in Spain).
Employment in European Business Services 97
2.4 Conclusions and policy implications
The analysis of employment in business services for the EU-12 countries enables us to • confirm three main ideas. First, that employment in the sector continues to grow, and it
has a considerable potential for further growth. Estimates for Europe and US place business services at the head of employment growth, in the past and in future potential trends; only the communications sector has similar rates in some countries like Spain. The annual employment growth rates have always been higher than the economic average and business services represent the only activity gaining a substantial share in the relative weight of the European economy over the last two decades. An analysis of the different business services activities reveals the origin and sources of job creation in business services. More than 70 activities can be identified according to 7 main business functions: administration, technical, personnel, markets and information, marketing and sales, finance (auxiliary services too), and operational. New potential employment sources are linked to personnel, markets and information-related functions.
Second, we can confirm that the type of employment opportunities, business services create, depends heavily on the country concerned. There is some evidence for considering the sector to be flexible and to be oriented towards a high educational level. Self-employment rates are similar to those of other services, but part-time rates are much higher than those existing in manufacturing or other services. Important differences between the countries do exist depending on labour market conditions and cultural factors, specially for self-employment figures. Part-time work is a better indicator of flexibility. The modes of employment also reveal important differences between men and women although employment distribution in the sector by gender can be regarded as even, or tending towards an equal share of men and women over time. Self-employment in the sector seems to be focused on men. On the other hand, part-time employment is. as expected, covered mostly by women. It is certainly clear that business services require flexible labour markets for their growth. Rigid labour markets in Europe may be one of the main reasons explaining why business services are more developed in USA than in Europe. Policies aimed at making labour markets more flexible can coincide with policies favouring business service employment. At the same time, certain policies allowing special fiscal treatment for certain flexible contracts such as part-time, teleworking, etc., can also boost employment in business services.
Third, educational attainment for the sector also varies amongst countries and this variation can be explained by the difference in educational systems in each country. The polarisation hypothesis is invalidated as most countries do not have a polarised pattern. The high-educational-level structure prevails especially if it is compared to the low-educational-level orientation of manufacturing and services. The importance of activities such as cleaning or security, which employ higher proportions of lower qualified workers, may be distorting the total educational attainment structure in all countries. Training data reveal the importance of training in business services, although differences among the countries studied are significant. There is no correlation between educational
98 Business Services in European Industry
levels and business services training. Market trends often provide more training in the countries where the workforce has the highest qualifications. This also leads us to consider business services policies aimed at raising qualification and skill levels. As the sector is highly sensitive to high skill levels, actions taken in order to improve training and educational levels can prevail over potential employment levels.
In conclusion, despite country-to-country differences in the type of employment and profile of the workers, business services can be regarded as one of the most important potential sources of employment. This assertion is based on the empirical evidence of past and recent trends in the type of new jobs created and the capacity of new dynamic activities to emerge. The important policy implications deducted from this will be developed further in chapter 10.
References Becker, G. (1964) Human Capital. Columbia University Press, New York. Benmett, M. (1989) "Management services: Playing the game". Marketing vol 9. Beyers, W.B. (1989) The producer services and economic development in the United States: the last decade. US Department of Commerce. Economic Development Administration. Technical Assistance and Research Division. US Department of Commerce, Washington. Browning and Singleman, H.I and Singleman, J. (1975) The Emergence of a Service Society: Demographic and Sociological Aspects of the Sectoral Transformation of the Labor Force in the U.S.A., report prepared for the Manpower Administration, U.S. Department of Labor. Centro de Estudios Económicos Fundación Tomillo (1996) El empleo en España y Europa, un análisis comparado por sectores, Fundación Argentaría and VISOR. ERECO (1994) Medium-term forecasts of employment by EC districts and sectors of industry (Module 4: Regional forecasts European report), by Saxon Brettell, Cambridge. European Commission (1993) White Paper on Growth, Competitiveness and Employment. European Commission, Brussels. European Commission (1994): Panorama de l'industrie communautaire 1994 European Commission, Luxembourg. European Commission (1995) Employment in Europe, DG-V, Brussels. European Commission (1996) Employment in Europe, DG-V, Brussels. European Commission (1997a) 77ie competitiveness of the European industry. European Commission, Brussels. European Commission (1997b) Building the European information society for us all. Employment & Social Affairs, European Commission, Brussels. European Commission (1997c) Extraordinary European Council on Employment, Luxembourg, 20-21 November 1997: presidency conclusions, European Council, Brussels. European Commission (1998) The Contribution of Business Services to Industrial Performance. A Common Policy Framework. Communication to the Council. European Commission, Brussels. Eurostat (1997) Labour force Survey. Data provided by Eurostat by special request. Luxembourg. Franklin, J.C. (1995) Employment Outlook: 1994-2005. Industry output and employment projections to 2005, Monthly Labor Review, November.
Employment in European Business Services 99
Garrido, L and Toharia, L (1991) 'Cambio ocupacional y necesidades de formación en España, 1985-1995', Economia Industrial, ene-feb, pp 159-179. Kutscher, R.E. (1995) Employment Outlook: 1994-2005. Summary of BLS projections to 2005, Monthly Labor Review, November. Montgomery, M (1988) "Determinants of Employer Demand for Part-time Workers", The Review of Economics and Statistics, Harvard University, Westview Press, Vol. 70, No. I. Noyelle, T. (1987) Beyond Industrial Dualism, Westview Press, Boulder, Colorado, U.S. Noyelle, T. (1996) Skills, Wages and Productivity in the Service Sector, Westview Press, Boulder, Colorado, U.S. Ochel, W; Wegner, M. (1987) Service economy in Europe: opportunities for growth. Westview Press, London. OECD (1996) Technology, productivity and job creation. Vol. 1. Highlights. The OECD Jobs Strategy. OECD. Owen J.D. (1978) Working Hours, Lexington, MA, D.C. Heath. Petit, P. (1986) Slow growth and the service economy. Francis Printer, London. Rubalcaba Bermejo, L. (1994) Fairs and Exhibitions in the European Economy. Eurostat. Luxembourg. Tschetter, J. (1987) "Producer services industries: why are they growing so rapidly?". Monthly Labour Review, 110 December: 31-40. Williamson, O.E. (1975) Markets and hierarchies. The Free Press. Macmillan Publications CO., New York. Williamson, O.E. (1981) "The modern corporation: origins, evolution, attributes". Journal of Economic Literature, vol 19; no. 4. Wood, P.A. (1991a) "Conceptualising the role of services in economic change". Area 23, 66-72. Wood, P.A. (1991b) "Flexible accumulation and the rise of business services". Transactions Institute of British Geographers, N.S. 16, 160-172.

100 Business Services in European Industry
Chapter 3
Explanatory Factors of Business Services
"It appears safe to postulate that the growth of producer services is an inevitable concomitant of aggregate economic growth. The variegated pattern in producer services employment in regions exhibiting differentials in growth rates... also tend to support this hypothesis" (page 118)
"Producer services are seen to play a critical role in economic development as a catalytic agent and, in some instances, as an initiating factors" (page 128)
Harry I. Greenfield (1966) Manpower and the Growth of Producer Services

102 Business Services in European Industry
Explanatory Factors of Business Services 10Ì
Chapter 3 Explanatory factors of business services
Introduction
Chapter 1 established the fundamental link between business services and the new trends imposed by present-day servindustrial society. It showed that services cannot be considered as an alternative to manufacturing; on the contrary, their growth is clearly related to changes in manufacturing companies. The emergence of business services is not only connected to the growing role of services in the goods economy but also to the aggregate causes associated with the deep transformations in production systems, which makes them particularly interesting in the context of the complementary relationship between goods and services.
This chapter illustrates how business services may be considered as a growth factor. It will examine why they emerge, the functions they perform in the economy and the integration of business services with other economic sectors. It is necessary to make the point that simply linking the sector with secondary factors of economic growth understates its importance in present-day economies as this reduces it to an indication of specific organisational changes.
This chapter has the following structure: it starts with a discussion of some theoretical aspects of the change in production systems along with the causes of the emergence of business services. Next, the functions which the sector performs in the economy are described with particular emphasis on the role of the services in industrial innovation and competitiveness. This is followed by a detailed analysis of the European input-output tables with the aim of ascertaining to what extent the integration of the sector with the other industrial sectors is relevant; if this has turned out to be a growing trend or not during this period; and if the industrialisation processes of business services are comparable to those of their integration. Finally, it will be considered how the central role played by business services in the economy could be enhanced by tracing its evolution with respect to the recent economic cycle.
104 Business Services in European Industry
3.1. A multiplicity of explanatory causes
This section outlines the underlying causes of the emergence of business services. These causes are very diverse, ranging from growing flexibility in production or new product definitions to market integration or the role of the State. They can be summarised in three groups:
1. Causes linked to changes in production systems: flexibility of production processes; externalisation of services; integration of goods and services
2. Causes linked to changes in production factors: new information and communication technologies; human capital and qualification; new availability of raw materials
3. Causes linked to changes in the markets: income growth; internationalisation; innovation in processes and products; State-related factors and regulations; enterprise traits; the predominance of quality
We will examine the different causes, paying special attention to flexibility in processes, goods-services integration, new technologies and omitting the causes dealt with in other chapters, such as employment market (chapter 2), quality (chapter 4), outsourcing (chapter 5), internationalisation (chapter 6), productivity (chapter 7), location problems (chapter 8), or the role of public policies (chapter 10).
3.1.1. Flexibility of production processes
Flexible production systems constitute one the most significant elements of change to production processes and, to a certain extent, act as the base on which the remainder of the elements are formed, for instance, the introduction of new information and communication technologies, the integration of goods and services, etc. Increasing flexibility represents the main element of a so-called new production 'paradigm'.1
Although flexible systems have existed since the industrial revolution (Gertler, 1988), one cannot fail to recognise that the foundations of a completely new work environment are being established (Giarini & Stahel, 1993). The appearance of this flexible production environment will boost the economy of business services through the profits reaped from the fruits of specialisation and organisational changes.
The origin and concept of flexible production
The theories of Taylor (1911) and Fayol (1916) based on efficient work organisation with respect to its formal and hierarchical aspects have been superseded.2 The transition
For example, Harvey (1989) examines in detail the impact of the technological, institutional, social and regulatory changes of the past twenty years, acknowledging that the flexible production system is an improvement on the Fordist phase. See, for example, George ( 1974).

Explanatory Factors of Business Services 105
from theory X to theory Y meant reconsidering the positive steps that needed to be taken
in order to create a good working atmosphere, although this was always subordinate to
the principles of 'authority' and 'integration'. Later, Simon's principle of limited
rationality (1945) introduced the idea of limits to human and rational behaviour, de
, stabilising agents of the "homo economicus", a concept which had been imposed by
classical schools. The Simon's theory of the organisation and its limits of rationality
represented a partial solution, although not an substantial improvement. In this sense,
the new concepts of programming, communication, excellence, the Ζ theory, re
engineering, etc. are related to an epistemological change in the organisation of labour
and business. The issue of information and metainformation produces the aggregate
modifications directed towards an increasingly flexible production system. Meanwhile,
this system is gradually demonstrating the limits of traditional Fordist accumulation.
It is not easy to define exactly what a flexible production system is. Definitions tend to
be restricted to economic, technological, spatial or sociological aspects. There are
industrialist definitions (Ferré Masip, 1988) or definitions covering up to seven different
methods of flexibility (Sayer, 1989). Gertler (1988) classifies the types of flexibility
into four groups: 1. Flexible machinery. Reprogramming and new functions.
Machinery is no longer considered as "fixed" capital. 2. Flexible production systems in
manufacturing. Integration of phases such as design, production and distribution. 'Just
intime ' production systems. 3 Flexible specialisation and integration. Company ability
to respond to fluctuation in market demand and to adopt new products. The concepts of
flexible specialisation (Piore & Sabel, 1984) and flexible integration (Cooke, 1988;
Valery, 1987) have made the term 'flexibility' the new name of the game in industrial
production. 4. Flexible accumulation. This is a term with multiple meanings. For
some, it means that "flexible accumulation revolves around new technologies, products
and services; and a dual labour market in which a high waged, skillflexible core was
opposed to a lowwaged, timeflexible periphery" (Jessop et al., 1987, page 106). For
others, it is related to "entirely new sectors of production; new methods of providing
business and financial services; new markets; and, above all, greatly intensified rates of
commercial, technological and organisational innovation" (Harvey, 1988, page 8). A
new system of flexible accumulation has appeared due to confrontation with a 'Fordist'
production system. This new system has appeared in order to deal with the crises in
productivity, international competition, market saturation and the inflexibility of fixed
and human capital (Aglietta, 1979; Lipietz, 1986).
It is possible to give a definition based on labour, the production element par excellence,
rather than on elements of the value chain or company organisation. From this
perspective, flexibility may be understood as changes in production, technology,
organisation and working processes with a tendency towards diversity or
decentralisation of labour in economic and business expansion. According to this
definition, trends in the labour market are the best basis for comparison in order to
understand the degree of flexibility of an economy. The two marked trends are
industrial training and hiring processes. In this way, for example, specialised training,
while widespread and multifaceted, guarantees the possibility of making technological

106 Business Services in European Industry
and organisational flexibility a reality. Equally, new hiring practices reflect trends in flexibility. If we place at one side the hotly-debated arguments about quality and social convenience of these trends, part-time contracts, temporary employment (direct or indirect) or tele-working signal clearly a society in which the individual must get used to changing jobs frequently (either within a company or from company to company) and, most importantly, to be trained for this switch.
The newest example of these trends is arguably the 'tele-working' boom, in other words distance working or working from home. This type of employment is considered by the European Community as a potential way to increase employment (Johnston, 1994) Its incentives are supported by assessing the benefits it has for those on both the supply side and the demand side of flexible employment: companies can save costs, especially office costs, and gain access to new and specialised segments of human capital; employees acquire flexibility in time-allocation, benefiting from a better quality of life; society sees improvement in environmental problems and congestion, gaining a better allocation of taxes and public expenditure. However, this type of worker does not even constitute 5% of the work force.3 The reason is linked to real or perceived problmes of labour market an social security regulation.
These outward trends are the expression of a wider change oriented towards work groups within companies practising self-management. The managers consider themselves to be co-ordinators rather than bosses and they concentrate their efforts on management tasks regarding the most global and conceptual aspects. As Olea (1987) points out, these trends are compatible with the reduction of middle-management which can be observed quite frequently .4
Flexible restructuring of economic organisation traditionally stems from technological change and changes in the accumulation of capital, which, in tum, are related to standardisation rates and the product life-cycle.5 Despite this, from the point of view of business services, the increase and reorganisation of expertise is more and more
It constitutes 4.8% in the USA of the work force and 4.6% in the UK. Olea (1987), based on the work of Naisbiyy and Aburdene (1986), assesses the reduction of middle-management: 15% in the USA; between 30% to 50% in German small and medium-sized businesses; and 30% in large German corporations.
It may seem that systems of flexible production are related to the degree of standardisation of a product as well as its life cycle (Ferré Masip, 1988); less standardisation and longer duration of the cycle leads to better implementation of flexible systems. This reasoning, however, is not particularly applicable in the case of business services, as many of them, although they are not very standardised, have products with a short life cycle. In services, a certain independence may exist between flexible systems and cycle duration. One may find an inverse relation to the one established in manufacturing. It is the brief nature of many services and the high variability of demand which recommend a very flexible production.

Explanatory Factors of Business Services 107
important (Wood, 1991). In these processes, resorting to work supplied by specialised services is justified as is the contribution they make to the economy.
Consequences of flexible production
The chief consequence of implementing a flexible production system is the reduction of fixed costs and costs of in-house co-ordination and management. Quality can also be improved by hiring the highest qualified experts available on the market. Moreover, the competitiveness of services carried out in-house will almost always be lower than in specialised external markets. The reason for this is that the specialised external market compete against one another, whilst the in-house services only occasionally compete with external services. Besides, flexible systems not only take advantage of external specialisation, but also transfer knowledge, in terms of production as well as the aggregate supply and demand of the market, to the company, thus reinforcing the competitiveness of in-house resources through the acquisition of a better understanding of the reality in which they operate.
Capital flexibility reduces the fixed costs associated with production, which leaves more leeway to practice scale economies and opens up new opportunities for SMEs to emerge.6 At the same time, the increase in job flexibility is anticipated to generate gains in productivity of around 30%. According to Gertler (1988), flexible specialisation basically requires two things: firstly, using the same worker for a wide variety of tasks, and secondly, the firm's capacity to adjust production by making better use of overtime, part-time work and temporary workers (Atkinson, 1985). Flexibility, therefore, affects those sectors which are more labour-intensive, such as services above all (Christopherson, 1989).
The new flexible system favours services' production diversification and the drive for internal expansion carried out mainly by small and medium-sized enterprises. In this flexible system, SMEs gain access to markets more easily and at the same time, have greater opportunities to set up a 'network'7 which give a powerful boost to their efficiency, at least within business services.8 Without the ability to form a flexible network system, many small businesses in the sector would be unable to offer a wide range of services at a competitive price. In addition to the advantages obtained by networks, small and medium-sized businesses benefit from the diminishing barriers to entry and exit which flexible systems produce.
One of the most important reasons behind the strengthening of flexible systems has been the desire to obtain greater profits through reducing authority and rigidity in the labour
6 See, for example, Piore and Sabel (1984).
See Mayère and Monnoyer (1992) on the concept of networks applied to services or refer to later chapters, principally Chapter 6.
8 See for example, Bryson, Keeble and Wood ( 1992).

108 Business Services in European Industry
force. However, flexible systems mean a change in the relationship between capital and labour, or at least this can be demonstrated in services. Labour goes from being exploited to contributing its built-in 'expertise'. The old Marxist capital/labour scheme is modified substantially when referring to a services economy, since the patterns and nature that establish power relationships change.
The indisputable 'worsening' of certain conditions and diminishing strength of the 'working class' (greater uncertainly, lower salaries, less ability to apply pressure and trade union participation) can be seen to be set off by wider improvements in labour markets: more hired employment due to lower hiring costs; an improvement in the general well-being of the working class in conditions of great labour demand price elasticity9; improvements in the workers' standard of living (free time, flexible timetables, autonomy); the possibility of a 'fourth column' of work carried out by retired peopleÍ0; a reduction of unemployment rates in the sectors that tend to be marginalised (women with family responsibilities, elderly people unable to work, physically-disabled persons, students, and people who live far from the business centres which could employ them, etc.). The idea of flexible part-time work is gaining support among economists and governing politicians.
Lastly, flexibility is associated with two other concepts'1: vertical de-integration of business structure and agglomeration. As Coffey and Bailly (1991, page 97) pointed out, "the hallmark of flexible production is vertical de-integration" also linked to "decentralisation of production". Vertical de-integration stimulates agglomeration and agglomeration stimulates vertical de-integration (Scott, 1988) Internal scale economies are generally replaced by external scale economies. Storper & Christopherson (1987) debate whether flexible specialisation has led decentralisation processes in production in non-metropolitan areas, which could help to explain the resurgence of urban growth in the eighties.
The limits of flexibility
Flexibility faces various limitations. In the first place, its implementation is still relatively scant due to socio-economic, institutional and political factors. Flexible production systems have been established to a very limited extent, especially if one considers the use of flexible work (part-time, temporary, distance). These systems tend to coexist with the old Fordist systems,12 as it is difficult to change completely over to
9 In the basic models of economic theory, such as the New classical synthesis presented by Samuelson and Nordhaus (1993).
'0 This idea, put forward by Giarini and Stahel (1993), proposes utilising the potential of retired workers under the flexible conditions in which they can work profitably. This would allow the workers to finance their own pensions at the same time.
' 1 See, for example, in O'Farrell, Moffat and Hitchens (1993).
'2 As summarized in Schoenberger (1987) and Gertler (1988)
Explanatory Factors of Business Services 109
them in many manufacturing industries. However, this is not true in services, where this coexistence is not as widespread.
In the second place, as Gertler (1988) argues, flexible technology is not easily adaptable . as it produces adaptation costs and may involve serious risks. The introduction of flexible technology requires changes in job organisation and the decision-making structure. In some cases, establishing flexible technological systems may cause greater costs and inflexibility than were previously present; the result depends on political and social choices made during the establishment period. Supervision and evaluation costs of subcontracted work are important and not always easily anticipated. Users become technologically dependent on their providers and subcontractors. Market strength and the possibility of establishing barriers to entry are also lost, which is good for obtaining fair markets but bad for companies holding significant market monopolistic power.
It can be inferred from the factors shown above that flexible management systems are not in themselves the panacea. Given the narrowest definition of these systems, a survey showed that flexible systems produce an average of 93 products, with 248 units per product, in Japan. In the United States only 10 products are produced, which have an average of 1727 units. These data'3 show the rigidity with which American users employ their flexible systems. The key to success, therefore, lies in exploiting staff creativity and ability rather than in the flexibility of production systems and process.
Within the services, one must also consider the problems with flexibility when an overabundance of situations exist combining a great variety of products with services in a multiple-location environment (Eiglier & Langeard, 1989). In these situations of multiple services and multiple locations, growth may be slow or even negative. For this reason, it is necessary to seek the most appropriate combinations of adaptation and differentiation in brand criteria (one-of-a-kind, or varied for the company's situation). There are cases in which it is necessary to reduce both the network and the opportunity of having a varied supply. This does not necessarily mean relinquishing the exploitation of the company's potential flexibility, but, in a certain sense, 'moving' it, making it more dynamic, reorganising it to meet the demands of the market^.
Table 3.1 gives a detailed summary of the advantages of flexible production over vertical production. The disadvantages of both methods are implicit, as the advantages of one method represent disadvantages for the other. This means that the advantages of vertical production placed into the negative summarise the limits of flexibility.
>3 Taken from Jaikumar (1986) in Gertler (1988)
'4 in this sense, flexibility is linked to the end of mass culture about which certain doubts are verified (Sayer, 1989; Perry, 1992).
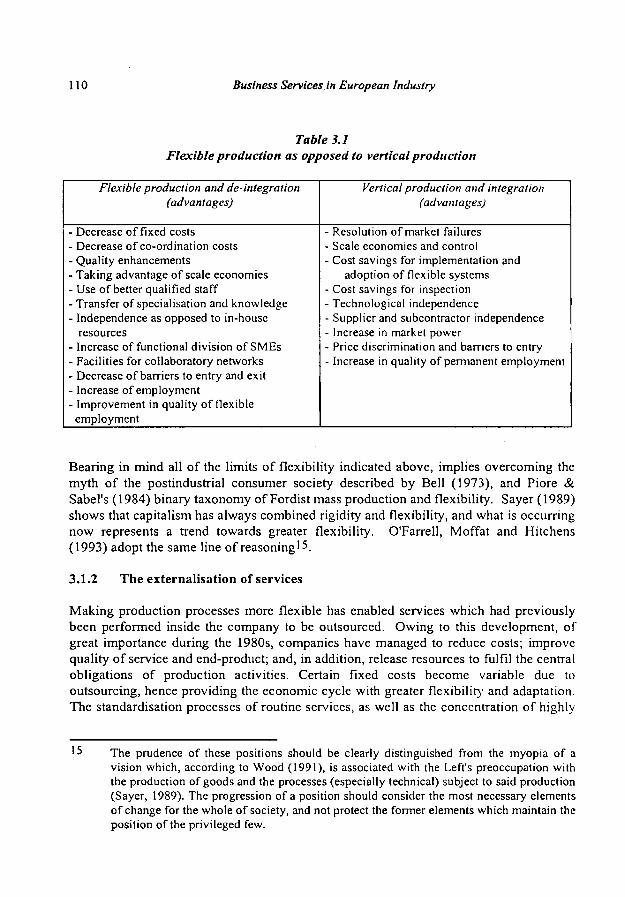
110 Business Services in European Industry
Table 3.1 Flexible production as opposed to vertical production
Flexible production and de-integration (advantages)
- Decrease of fixed costs - Decrease of co-ordination costs - Quality enhancements - Taking advantage of scale economies - Use of better qualified staff - Transfer of specialisation and knowledge - Independence as opposed to in-house
resources - Increase of functional division of SMEs - Facilities for collaboratory networks - Decrease of barriers to entry and exit - Increase of employment - Improvement in quality of flexible
employment
Vertical production and integration (advantages)
- Resolution of market failures - Scale economies and control - Cost savings for implementation and
adoption of flexible systems - Cost savings for inspection - Technological independence - Supplier and subcontractor independence - Increase in market power - Price discrimination and barriers to entry - Increase in quality of permanent employment
Bearing in mind all of the limits of flexibility indicated above, implies overcoming the myth of the postindustrial consumer society described by Bell (1973), and Piore & Sabel's (1984) binary taxonomy of Fordist mass production and flexibility. Sayer (1989) shows that capitalism has always combined rigidity and flexibility, and what is occurring now represents a trend towards greater flexibility. O'Farrell, Moffat and Hitchens (1993) adopt the same line of reasoning's.
3.1.2 The externalisation of services
Making production processes more flexible has enabled services which had previously been performed inside the company to be outsourced. Owing to this development, of great importance during the 1980s, companies have managed to reduce costs; improve quality of service and end-product; and, in addition, release resources to fulfil the central obligations of production activities. Certain fixed costs become variable due to outsourcing, hence providing the economic cycle with greater flexibility and adaptation. The standardisation processes of routine services, as well as the concentration of highly
15 The prudence of these positions should be clearly distinguished from the myopia of a vision which, according to Wood (1991), is associated with the Left's preoccupation with the production of goods and the processes (especially technical) subject to said production (Sayer, 1989). The progression of a position should consider the most necessary elements of change for the whole of society, and not protect the former elements which maintain the position of the privileged few.
Explanatory Factors of Business Services 1 1 1
qualified personnel in advanced services, has made external hiring lead to an improvement in the quality of the services rendered. This result is produced by taking advantage of the 'expertise' and specialisation offered by external workers. The main causes of externalisation are linked to the transaction cost theory, imperfect information, quality requirements, or flexible organisation, among others, which will all be discussed in chapter 5.
3.1.3. The integration between services and goods
For a long time, services have been considered to be an alternative to goods; first they were the negative alternative, then positive. Classical and New Classical positions only acknowledged the material nature of wealth, and as a consequence, services could not be considered to be generators of wealth. For many centuries, services represented the negative alternative to the profitable value of manufacturing work. This point is illustrated by considering the social regard for domestic help in the eighteenth century which was similar to that of the slave Greek and Roman civilisations: neither of them were really beneficial to social and economic well-being. In the same way, positive regard for services would be bom of private rivalries with manufactured goods, from Petty's famous quotation (1683): "there is more to be gained using manufactured goods than agriculture; and still more through commerce than through manufactured goods"16, through to the Rostowian theories of Bell (1973).
Alternative definitions of goods and services have been formulated by a series of authors (Greenfield, 1966; Fuchs, 1968; Gershuny, 1978; Stanback, 1979; Ginzberg & Votja, 1981). If one departs from these definitions, the age-old antagonism which has linked the two sectors would be invalidated. The study of services would fall within the framework of the manufacturing base, with the emphasis on phenomena like the complementary nature of goods and services; the importance of services for production; and the industrialisation of the tertiary sector. The servindustrial (or meta-industrial) society referred to in chapter 1 would be proclaimed, supported by the growing non-material investments that shape a meta-industrial company. ' 7
Integration from the hypothesis of structural change
The historical evolution which culminated in the definition of the meta-industrial society is linked to the study of the processes of structural change (Cuadrado & Del Rio, 1989). These authors demonstrated how, in the face of income growth, services and
16 Quoted from Petty (1683).
'7 This new type of company is defined by the Fast programme as having seven characteristics (European Commission, 1987): a new combination of profitable factors, a technological and engineering production base, complex systems of programming and management (orgware), integration of goods and services into packages, organisational networks, spatial concentration of activities with a high value added, and less rigid social relationships.
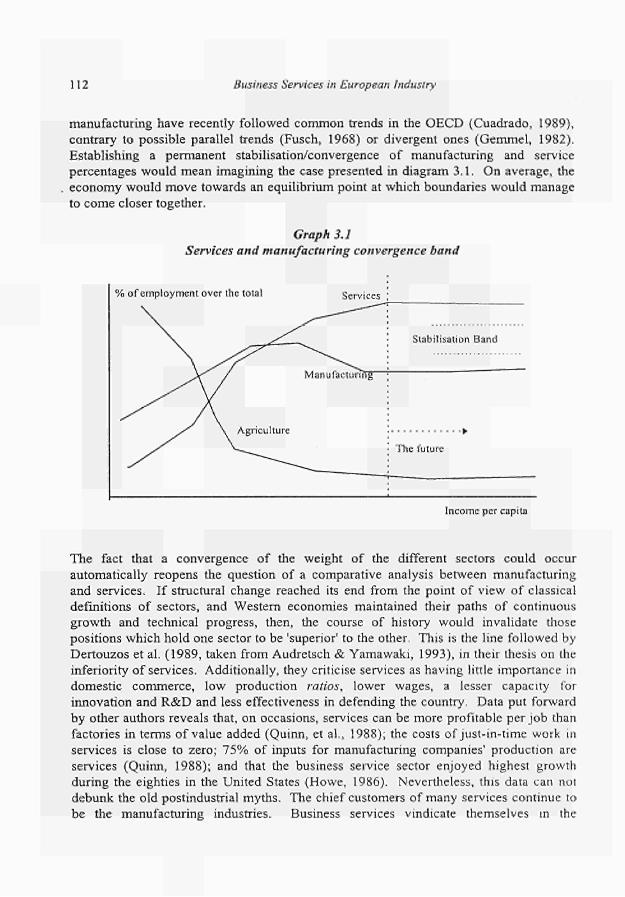
112 Business Services in European Industry
manufacturing have recently followed common trends in the OECD (Cuadrado, 1989), contrary to possible parallel trends (Fusch, 1968) or divergent ones (Gemmel, 1982). Establishing a permanent stabilisation/convergence of manufacturing and service percentages would mean imagining the case presented in diagram 3.1. On average, the economy would move towards an equilibrium point at which boundaries would manage to come closer together.
Graph 3.1 Services and manufacturing convergence band
% of employment over the total Services
\r / Manutacturirig
yr \ Agriculture
Stabilisation Band
►
The future
Income per capita
The fact that a convergence of the weight of the different sectors could occur automatically reopens the question of a comparative analysis between manufacturing and services. If structural change reached its end from the point of view of classical definitions of sectors, and Western economies maintained their paths of continuous growth and technical progress, then, the course of history would invalidate those positions which hold one sector to be 'superior' to the other. This is the line followed by Dertouzos et al. (1989, taken from Audretsch & Yamawaki, 1993), in their thesis on the inferiority of services. Additionally, they criticise services as having little importance in domestic commerce, low production ratios, lower wages, a lesser capacity for innovation and R&D and less effectiveness in defending the country. Data put forward by other authors reveals that, on occasions, services can be more profitable per job than factories in terms of value added (Quinn, et al., 1988); the costs of just-in-time work in services is close to zero; 75% of inputs for manufacturing companies' production are services (Quinn, 1988); and that the business service sector enjoyed highest growth during the eighties in the United States (Howe, 1986). Nevertheless, this data can not debunk the old postindustrial myths. The chief customers of many services continue to be the manufacturing industries. Business services vindicate themselves in the
Explanatory Factors of Business Services 1 I 3
expansion of physical products. 'Pure' service politics may fail if they do not fit into a political vision of the aggregate ' s .
Microeconomic convergence of goods and services
The macroeconomic 'convergence' of goods and services can only be understood when starting from convergence at the microeconomic level, that is, from a growing overlap between what goods and services are. If manufacturing and services are not independent of each other it is because of the goods-services continuum and the uniqueness of each product which accompanies every combination of goods and services, material or non-material^ . As Wood (1991, page 165) states: "all goods and service production involves increasingly complex combinations of material and service inputs. Many modem goods are highly "customised", or service intensive, while some services depend heavily on material goods". From the new goods-services relationship 'the tertiariasation of manufacturing' and 'the industrialisation of the tertiary' are derived, which are processes that have already been reinforced.
Business services justify their existence based on this type of integration at the microeconomic level, as, by definition, they are intermediate services that are incorporated into manufacturing processes and end-goods and services. Creation, design, production, or sales are phases in which services are making themselves increasingly necessary as product life-cycles are shortened.20 Manufacturing companies tend to integrate more services linked to production and distribution in order to adapt better to their clientele.2'
One of the results of the integration process of goods and services has been the difficulty which has arisen in establishing a division between the two22. Integration is not simply a juxtaposition, it represents a complete transformation. It is not so much that services and goods mix together and are interchanged with greater frequency and ease than in earlier times. The true 'revolution' which the integration of goods and services represents is caused by the original transformation of goods into services and services into goods. In a new way, the goods become a service, while the service is converted into goods. From one viewpoint this transformation is not new: all goods are at the same time services due to the service-use with which they provide those who enjoy them; all services are in themselves goods, in other words, something good enjoyed by those who receive these services. Therefore, there exists a certain level at which, by definition, goods and services coincide. The 'revolutionary' novelty today consists of the
18 See Marcos & Palomero ( 1990) and Cohen & Zysman ( 1987)
' 9 Refer to Bailly & Maillât (1988) and Enderwick ( 1989) 2 0 See, for example, Coffey & Bailly ( 1990) or De Jong ( 1992). 2 1 See, for example, Ochel & Wegner (1987) and Cuadrado & González (1988). 2 2 See, for example, Marshall (1988a).
114 Business Services in European Industry
'original' multiplicity of factors which maintain goods-service equality and which alter the relationship between value and price.
The price of a good is the result of an assessment of the services employed for its production and its consumption. For example, the selling price of automobiles (at the price which companies are willing to produce the quantity where marginal cost equals marginal revenue) takes into account the cost of the services which are introduced into the value chain. In the same way, the purchase price (the consumers are willing to pay for a determined quantity, maintaining the equality of marginal benefits) incorporates the appraisal that the users make of the related services. This is to say, business services (management, advertising, etc.) affect the price of automobiles as much as repair or finance services. On the other hand, the price of a service is becoming increasingly determined by the integration of goods in its production and consumption. In this way, a service such as security incorporates the price of the computers and instruments necessary to render the service, as well as the prices of certain goods may have for consumers: emblems, uniforms, monitoring equipment, etc. Such prices may be valued highly in terms of the opportunity cost.
Conceptually, the aggregate factors which explain the new relationship between goods and services could be outlined by formulating two hypotheses: the conceptual symmetry between the transformation of goods into services and the transformation of services into goods; and the factual asymmetry between the weight of one transformation or the other.
The transformation of goods into services
It is possible to identify five ways in which goods are transformed into services. These correspond to the following five types of services incorporated in goods:
1. Production services. These are the services used in to order to obtain, produce and distribute goods. They are added to the value chain of the goods, affecting its value added. 'Pure' physical goods can have a high selling price thanks to the services incorporated into the production process. In many cases, services for the production of goods may surpass the value added obtained in the 'material' chain starting from raw materials.
2. Operational services. These are services produced by goods independent of their use and enjoyment. The function of the goods is carried out through the service which the former provides.
3. Functional services. These give a functional use to the goods. All goods have a functional use, this is intrinsically a service.
4. Accompanying services. These accompany the attainment, enjoyment and maintenance of goods and, on occasions, also their elimination.
5. Differentiating services. The peculiarities good + service composition provide an additional service for the user allowing him/her to differentiate him/herself from the rest of the consumers. This uniqueness may be real or imagined and the fragmentation of mass consumption acts as its greatest protector.
Explanatory Factors of Business Services I 1 5
These five types of services associated with goods act as a group and determine the depth of the transformation of goods into services. We will take television sets as an example in order to explain this point. The business services used for their design,
. production management, advertising and sale, among other things, are production services incorporated in the end price and formulated in the supply function of the producer. In television sets, the service of offering various images and sounds is an operational service, comparable to the freezing service provided by a refrigerator or the alimentation service an agricultural product gives. In functional services the use and enjoyment of the consumer now has an influence. From one standpoint, the TV set becomes an instrumental good-service between operational services (uses provided by the good) and functional services (uses received by the consumer). The services that accompany television are wide-ranging and cover anything from delivery service to maintenance services. The differentiating service consists of the uniqueness the user imagines he/she is given by owning a television with certain characteristics, which are combinations of goods and services. The arrival of interactive television, tele-shopping, cable television or the encoding of channels are the result of technologies and strategies applied to the integration of services into the television, thus producing its successive and uninterrupted transformation into a service.
The transformation of services into goods
We can suppose that symmetry exists between the former transformation of goods into services and the transformation of services into goods. Five different types can be distinguished:
1. Production goods. These serve the ex ante production of a service. They include, for example, goods used for staff training or transmission of knowledge.
2. Operational goods. Those used in the co-production processes, from work materials to conclusive results shown on paper: computing systems, communications systems, etc.
3. Functional goods. These, material or not, provide a service to the user and to the provider in equal part.
4. Accompanying goods. These goods accompany the ex post enjoyment of the service. 5. Differentiating goods. This is the perception of uniqueness which customers and
providers have of the service produced and offered by various goods.
Comparing this classification of goods associated with services to the previous one of services associated with goods, important differences emerge. Computing services serve as a useful example here 2 3 . The value of computer help services is closely related to
23 Important nuances exist in this classification which make the different categories more vague and indefinite with regard to the previous classification of services. Goods into which services are incorporated can always be material goods. This is not necessarily the case for goods which are incorporated into services. Knowledge could be considered as
116 Business Services in European Industry
the composition of the goods and services they entail24. Computers, books and knowledge which help in the training of the supply-side may be considered to be production goods. The knowledge stored, as well as materials, diskettes and software applied in co-production (independent of the relative use which the customer makes of them) would constitute operational goods. The application of software, knowledge acquired and the enjoyment of goods which have been 'repaired' or 'brought up to date' would represent functional goods tied to the utility of the service. The accompanying goods would comprise the systems of self-correction and self-maintenance installed in the computer, as well as the goods and knowledge which allow one to extend, even after implementation, the enjoyment of the service. Differentiating goods would single out distinctive or characteristic features of the service, regardless of whether they are perceived or real.
Although it is possible to conceptualise in a balanced way the two-way transformation between goods and services, certain irregularities exist which tip the weight of services over that of goods. First, it is an objective fact that the value added by services in the production and distribution of goods is much greater than the value added of goods in the co-production of services. Second, the enjoyment of goods associated with services proves more obvious than the contrary. A service can increase its value and utility without having to fall back on any good, something which in the opposite case is less and less true. Third, only in the case of considering knowledge as the main good associated with the co-production of services, is it possible to establish complete equivalencies between the two transformations. Fourth, the interaction shown by innovative co-production of combined goods-services is much more intense and overriding in the services produced and pooled than in the goods produced and pooled. In conclusion, the transformation of goods into services seems to be more relevant than the contrary. On a microeconomic level, this fact explains the reason for the emergence of many advanced business services.
3.1.4. The impact of new information and communication technologies
New information technologies have a growing impact on Western economies. They are considered to be the greatest exponent of the new production system, far from the Fordist organisation of other eras. Technology, which in the first place facilitated standardised mass-production and scale economies, today appears to break old production parameters in order to make it possible for a flexible, personalised production based on economies that are not necessarily of scale to operate.
the good par excellence. Goods are also non-quantifiable benefits. Accompanying goods should be understood as ex post goods as, otherwise, they would be material functional goods. Functional goods also have an effect on the seller's profits.
24 As many articles published on computing have demonstrated for a number of years. See, for example, Ditler (1986).

Explanatory Factors of Business Services 117
Technology is the key element that stimulates the economy. All the schools of economic thought (Classical, New Classical, Keynesian, or Structuralist), albeit from different perspectives, acknowledge this to be true (Freeman & Soete, 1987). Nonetheless, this unanimity does not mean that the economy has taken all its
. implications into consideration from the beginning. Thus, for example, until a relatively short time ago, no one had contradicted the classical estimates, assuring full employment in growth models, when technological changes and the possibility of substitution between employment and capital are considered (Cooper & Clark, 1982).
Although the technological question will not be dealt with in-depth here, it is pertinent to remember one thing: the fact that the huge technological progress of the past 20 years, the consolidation of the service economy and the emergence of advanced services have occurred at the same time. Clearly, this simple reasoning does not provide an answer to all the questions, but it does indicate that the processes of substitution have not halted the growth of services, indeed, conversely, they may have contributed to their expansion. Often, services are considered to be a refuge from the processes of manufacturing substitution. Nevertheless, verification or a critical discussion of this thesis would require a sector-by-sector study. In this way, one finds examples and counter-examples, which could be set against each other or juxtaposed according to the economic activity or location. Banks, for example, have automated many of their services and made savings on staffing costs. However, at the same time, the greater complexity of financial markets, together with increased competition, have led many sections of the financial sector to expand, often with the aim of getting closer to the customer and hence they have to invest in staff. This example can be adapted to other services where shifting interaction requires a proximity based on the worker rather than on capital.
Business services present the clearest case of symbiosis between capital and employment. The most advanced are often defined as information technology services. Their raison d'être is, then, linked to technology, or rather, to the information transmitted via the technology. The evolution of civilisation in our time has increased economic requirements and necessities. This is not a matter of simply managing the scarcity of certain given resources, but of modifying the concept of scarcity itself and of creating new, previously unheard-of resources. Information and its transmission constitute the essential part of this complete transformation. On the one hand, it channels the requirements of the different demands towards the different supplies and vice versa. On the other, information reorganises supply and demand from the inside, and the markets in which products are produced and consumed. In conclusion, it predisposes, explains, and corrects the product assessment performed by agents. Information, nowadays, fixes the price system and its opportunity with respect to quantity and quality.
Information, in the broadest sense of the word, can take up almost half of a country's economy and many argue that the US economic expansion of the 1990s has been fuelled by the strong growth of the information technology industry (Mandel, 1997). In the
118 Business Services in European Industry
United States, the information-based economy occupies 34% of the GNP, after having reached 30% in 195825, depending on the definition used, this percentage could reach up to 46% today. The business cycle could be led now by high-tech trends while it used to be headed by housing and automobiles. In a prevailing information economy, the services related to obtaining, manipulating or transmitting information tend to multiply, supported by a market that is practically unlimited in structural possibilities (not cyclical), even if the next high-tech slowdown could drag down the economy and the stock markets as stated by Mandel in Business Week.
Technology changes the economy just as the economy changes technology. Technical progress is at the same time the cause and effect of economic growth. Freeman and Soete (1987) distinguished ten principal characteristics of the 'techno-economic paradigm': 1. Continuous technological change in IT industries ('information technologies') themselves. Continuous integration of electronic circuits, reduction of their cost, and growth of optical and communication technologies. 2. Greater flexibility and speed in changes of model and design. Breaking with the old paradigm of standardised, homogeneous and reproduced products to permit more changes and give greater opportunities to SMEs. A new symbiosis of large companies surrounded by a penumbra of specialised satellite firms. Market niches. 3. Reduction of electromechanical components because of redesign of products and processes, which means a reduction of employment in traditional sectors which in tarn is created in new sectors. 4. Better and faster rates of product and process change, along with more intense technological competition. The demand for new education and uses for business services. 5. Speed, guarantees, and low costs of communicating and storing large quantities of information related to economic and financial operations. 6. Integration of design, manufacture and production, sales, administration and services. The trend towards integrated information systems. 7. Improvement in the quality of products, processes and services. 8. The linking of networks of component and material suppliers to companies. 9. The greater integration of goods and services which imply interdependence. 10. Greater international integration in manufacturing, services and markets as a result of the more rapid transmission of information and improved information flows.
The overall consequences of information and communication technologies have been systematised and can be found in the IFO Institute chart (table 3.2).2(>
25 According to the phrase: 'all of the resources consumed in producing, processing and distributing information in goods and services'. US Department of Commerce, 1977, cited in Rada (1987).
2o For a detailed explanation of the chart see Ochel & Wegner (1987), and Cuadrado Roura (1989)
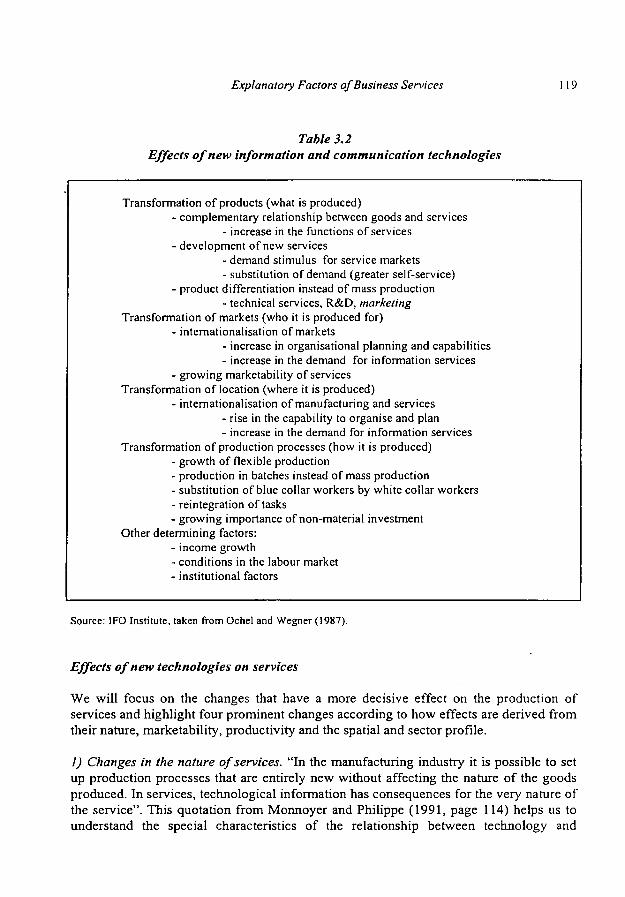
Explanatory Factors of Business Services
Table 3.2 Effects of new information and communication technologies
Transformation of products (what is produced) - complementary relationship between goods and services
- increase in the functions of services - development of new services
- demand stimulus for service markets - substitution of demand (greater self-service)
- product differentiation instead of mass production - technical services, R&D, marketing
Transformation of markets (who it is produced for) - internationalisation of markets
- increase in organisational planning and capabilities - increase in the demand for information services
- growing marketability of services Transformation of location (where it is produced)
- internationalisation of manufacturing and services - rise in the capability to organise and plan - increase in the demand for information services
Transformation of production processes (how it is produced) - growth of flexible production - production in batches instead of mass production - substitution of blue collar workers by white collar workers - reintegration of tasks - growing importance of non-material investment
Other determining factors: - income growth - conditions in the labour market - institutional factors
Source: IFO Institute, taken from Ochel and Wegner (1987).
Effects of new technologies on services
We will focus on the changes that have a more decisive effect on the production of services and highlight four prominent changes according to how effects are derived from their nature, marketability, productivity and the spatial and sector profile.
1) Changes in the nature of services. "In the manufacturing industry it is possible to set up production processes that are entirely new without affecting the nature of the goods produced. In services, technological information has consequences for the very nature of the service". This quotation from Monnoyer and Philippe (1991, page 114) helps us to understand the special characteristics of the relationship between technology and

120 Business Services in European Industry
services. Technologies modify transitive interaction, contributing in this way to the following factors: fragmentation of service (enabling the same service to both produce and sell at different stages); standardisation of certain elements of services with which scale economies are obtained; integration of mobile variables into work approaches; modification of the perception of distance (accelerating the transportation, analysis and processing of information, and facilitating collaboration); encouragement of active participation on the part of the customer. Within these changes in nature, technologies give rise to innovation which, according to Howells and Green (1988), may be of three types: 1) in generation and production; 2) in distribution and sales; and 3) in what is called 'disembodied progress', referring to non-localised aspects of production such as organisational aspects.27
2) Greater marketability of services. Almost by definition, information technology enables services to be more marketable, especially those which are more limited by geographic or time restrictions (Soete, 1987). In the same way that the printing press produced a revolution in the access to science, new technologies allow us to possess a new type of knowledge. On the one hand, they allow for digitalisation and extensive and intensive use of information. On the other, they behave interactively: communication technologies transmit the needs of information technologies and vice versa. The effect of these two elements (more information and a greater need for it) is a more efficient way of allocating scant resources through enhanced market transparency.
The process by means of which technology conforms to the reverted life-cycles studied by Baumöl (1985, 1986), has some importance in the context of this greater marketability of services. These cycles initially make technological change more effective than sales and promotion, thus having repercussions later on quality and finally, on new developments. As new developments in a service are perceived at the end of the process, and not at the beginning, as is the case in manufacturing, greater anticipation of final change produced by technologies boosts marketability.
3) Changes in the productivity of sectors. New technologies increase productivity in those industries aided by them. This basic affirmation of the economic world is perfectly applicable to services, in which many processes can increase efficiency by substituting capital for work. This effective substitution of activities is still far below its potential, if one considers the attainment, processing, storage and recovery of information, as well as drawing up and optimising of tasks and systems28.
27 This last type should not be translated as 'disembodied or depersonalised progress', since it is precisely in the more personal aspects (individually and as a team) of service where greater innovation is produced.
28 This idea can be found in the comprehensive study by Rada (1987) on the effects of new technologies on services.

Explanatory Factors of Business Services I 2 I
The process by means of which technology improves productivity in services should not be understood in a linear fashion, in short, static, but in a cyclical and dynamic context (Baumöl, 1986). On the one hand, one must consider the evolution of the economy in the medium and long-term keeping an eye on convergent or explosive tracks. On the
. other, one should bear in mind the cyclical condition that connects technology, information services and productivity. In this relationship Baumöl illustrates how technological innovation in the field of information stimulates its own production by way of gains in productivity. These gains would be reflected in the relative price of information services, which would have to decrease their final output. Finally, a decrease in productivity would lead to an inverse process, which would end in a rise in the use and contracting of these services. This helps us to understand the cyclical movements of markets, in which many elements other than prices and productivity intervene.
In the three-way relationship between productivity, technology and services there are two factors specific to these last two (Barras, 1985): 1) technological innovation has a direct effect on quality which is at least as significant as the effect it has on productivity and cost reduction; 2) the influence of 'non-quantifiable' variables makes the measurement and evaluation of productivity much more complex, going so far as to call it into question as a measure of the effectiveness of services. In these two senses, the advantages for production of incorporating new technologies are only a reflection of the aggregate of favoured elements. For example, large services companies give priority to obtaining technical innovations over competing through prices. These innovations make possible scale economies, but, above all, improve the quality and introduction of new services.
4) Blurring of sector and spatial borders. Information technology enhances the attainment of scale economies, as well as the scope of many services' activities. Better knowledge and handling of markets spurs on greater collaboration between various sectors, as much as an invasion of adjacent territories. The aggregate development of products made up of goods and services and using the advantages of information technology in joint-ventures between manufacturing and services exemplify the first case. This collaboration does not imply innovation equality on the part of those sectors involved. One of them can 'contribute more' than the other without its source being a determining factor. As a matter of fact, services obtain competitive advantages over goods and vice versa. Goods and services have a certain innovative independence even if both are complementary. We can find examples among the many business services that tend to traverse unknown terrain in the search of new markets (especially consulting, advertising and information services sectors) through their own innovations, on which individual competitive advantages are based.
In the same way that the borders of sectors become blurred, new technologies transform the space in which services can operate. Limits are no longer geographic, instead they are formed by economic, social or institutional segmentation of markets. This explains why, in spite of the breaking down of distance barriers caused by new technologies,
122 Business Services in European Industry
services tend to be concentrated within large centres of activity. The cost savings implied by locating outside these big centres, are set off by gains in urban demand caused by the nearness of companies, public institutions and qualified labour (see chapter 8). Organisational and structural factors redefine spatial perimeters as described in Howells (1988) or Monnoyer and Philippe (1991). Hence, new technologies are not a substitute for face-to-face meetings, but, in a sense, they nourish them. On a global level, this formulation is also valid when considering the internationalisation of services.
The dynamics of change in geographic and sector definitions are also related to barriers to entry. When the costs of searching for information for consumers and producers are reduced, costs of gaining market control fall, causing an inrush of new companies into new markets. These companies use the same channels created previously. For this reason their strength must rest on the uniqueness and quality of their products rather than on cost-benefit analyses derived from the use of technology.
New technologies and business services
A dual relation is produced between business services and technology. On the one hand, many business services emerge as a result of technological progress. The clearest example is, arguably, provided by IT services. Computers have progressively become cheaper, while they offer greater possibilities for a broad set of demands. The acquisition of a computing service is associated with the purchase of a computer, in the same way as an insurance policy is associated with an automobile. Without modem technology, many business services would not have emerged as they have. On the other hand, apart from being a consequence of the integration of technology, business services also encourage the integration and exploitation of this technology:
Firstly, business services themselves purchase technology as a way of implementing and improving the rendering of their services. Engineering, design or computing services promote technological development orientating it towards the industrial sector. The use of new information and communication technologies requires users to have a level of technological integration when dealing with the co-production of the service, when dealing with the implementation of solutions or when an internal future cover of the service is desired.
Secondly, business services not only relate themselves to technological integration, but also their rational use. These services are necessary before, during and after the use of a new technology. Businesses need technology to innovate in their production processes and to be competitive. This need conditions the recourse to services that prepare and train the personnel in charge of using this technology, the personnel that sets up and designs the technological systems, the personnel that is in charge of its maintenance and repair, and the personnel that works on future improvements, services and perfection.
Explanatory Factors of Business Services 123
In this way, there is a virtuous cycle between business services and the industry as a whole with respect to new IT. The more business services the industry uses, the more IT benefits. And the more IT created, the greater possibilities of relationships are between business services and the whole industrial system. Moreover, the use of new technology in business services themselves has increased the business services' productivity, therefore stimulating additional causes for long-term growth.
3.1.5 Human capital and qualification
All business services are human-capital-intensive services. Some services require highly-qualified staff like management consulting, others employ low-qualified workers, for instance cleaning services. In any case, business services are produced by the labour factor engaged in an interactive process with the client. It has been widely recognised that growth in business services has been linked to the accumulation of expertise and specialisation processes (for example Stanback, 1979; et. al, 1981; Wood, 1991). This reason can even be more important than transaction costs when externalisation processes take place (see O'Farrel, Moffat and Hitchens, 1993; Beyers and Lindahl, 1994). The critical role played by human labour is confirmed in the following statement (Martini and Vairetti, 1989, page 76): "The decisive factor of growth in advanced services companies is not the adoption of new technologies, nor organisational complexity, nor the high level of professionalism; factors which are frequently present, but not exclusive nor determining. Rather, one must look for the decisive factor in the ability of dialogue, in the ability to create an organisation around a culture". As human capital lies at the core of an organisation a better understanding of this issue, relative to the labour market and employment generated by the sector is essential.
The growth of flexible, qualified and, in a sense, multifaceted workers, explains the reason for the rise of advanced services built on the accumulation of 'expertise'. However, employment is also a crucial matter in 'low-skills services', although the reasons for this differ from those involved in the more advanced, and high-qualifications services. In addition to these effects, some business services have grown because of the need for personnel recmitment, training, outplacement, temporary work, etc., in manufacturing and service companies. The need for specialisation in human resources also explains part of the business service growth.
3.1.6 New organisation of raw materials
If the changes in employment and capital production factors have created a favourable atmosphere for the expansion of business services, the land factor and raw materials have been driving forces in some services. Not so much because there is new availability of land, energy sources or raw materials, but because the raw materials of advanced services are more closely connected to information than to material goods. Moreover, they are concentrated in a few areas where they take advantage of the famous agglomeration economies. However, we will return to this point in chapter 8.
124 Business Services in European Industry
3.1.7 Economie income growth
The growth of European economies has also been a factor which, in itself, has led to the expansion of business services, not only in quantitative terms (due to increases in wealth and income in these economies), but also qualitative (due to changes in the markets). Two factors contribute to the latter. On the one hand, the economies have evolved through the internationalisation of markets and companies. This has required the participation of many business services related to the internationalisation of companies and their products (fairs and exhibitions, consulting, market research, etc.). On the other hand, while the market has been widening, the need to be close to the customer has increased, due to the segmentation created by diversity of tastes, needs, etc. Thus, many business services appear as instruments to facilitate customer relations, knowledge of their needs and continuous improvement of the company's image and reputation. In this sense, the increase in uncertainty in markets is another factor encouraging the use of services. More information combats and, paradoxically, accelerates uncertainty. In both cases business services are needed.
3.1.8 Internationalisation of markets
The growing competition in markets, as well as in the processes of integration and internationalisation, requires companies to get ahead competitively using technological as well as organisational innovations. This factor is of special importance for small and medium-sized businesses that do not have the ability to develop innovative processes on their own and, for this reason, must do so by outsourcing. Business services perform the role of stimulating, watching over and facilitating innovation in a world where innovation is characterised by the great speed and proliferation of its effects (Martini and Vairetti, 1989). The competitive pressures of international markets have changed the relationship between companies, proving the necessity of modernisation and emphasising the interaction between them. In this sense, internationalisation explains part of the increase in demand for services (Cuadrado and González, 1988; Illeris, 1989; Coffey and Bailly, 1991; Howells, 1988). A number of authors point out how the growth of business services has been linked to liberalisation of international commerce. François (1990) explains the great expansion in the sector after the Second World War by referring to this factor. He analyses how the process of internationalisation increases the size of companies; facilitates the division of labour, obtaining scale economies and specialisation; and finally, creates the need for incorporating business services into production.
Some business services are closely linked to internationalisation processes. Fairs and exhibitions are a prime example of this association, and they have become a powerful instrument with which both enterprises and cities compete (Cuadrado and Rubalcaba, 1998). The activities of management consulting or market research are also central to an analysis of the best international strategies and an evaluation of potential markets. In
Explanatory Factors of Business Services 125
addition, some other business services, for instance linguistic services, some legal services or public relations, are explained by the existence of international barriers.
Besides, the internationalisation of business services activities, has led to further rises in , business service growth rates. The international expansion of professional activities and multinational companies has influenced businesses, spreading the use of some services that could not be provided before in the context of narrow markets.
3.1.9 Innovation in processes and products
Innovation has always ruled technical and economic progress, and laid the foundations of the productive capability of countries. There are three aspects regarding innovation: invention itself, imitation and commercial exploitation, and the workforce capable of generating a multiplying effect on innovation. The concept of innovation itself is changing as time passes. For example, invention in itself is not a guarantee of success when imitation may be more profitable or when the workforce does not have an adequate level of education2^. As a matter of fact, it seems to be proven that "the strategy of imitation is as or more important than pure innovation and can be more fruitful" (Ruiz, 1988, page 77). For this reason, as imitation and education levels are not controllable by companies, the effectiveness of invention tends to depend on the interrelation with the user. This interrelation brings about the development of even unforeseeable areas of invention, but, above all, guarantees the usefulness of innovation and of the investment it usually brings with it.
This fact is particularly valid within business services where it has been asserted that those who render services are those who take responsibility for R&D of the "package" products that integrate goods and services (European Commission, 1987). Innovation processes in services clearly show that the field for innovation no longer has the linear nature of the old manufacturing scheme directed at the consumer and which sprung from the innovative producer/centre. Since the industrial revolution, it has been transforming itself until it has reached a new system which is distinctive due to the intense interaction among agents.
Figure 3.1 illustrates the basic changes in innovation methods.30 For example, technology, in the classical restricted sense, appears to gain importance, whilst remaining instrumental. It is more dominant, but not absolutely necessary, as it is not an essential step in all innovation processes. Innovation can be generated by many other factors within the interactive relationships maintained by consumers and producers (process innovation), and the combinations of goods and services from different assessments and choices (product innovation). At the same time, these innovative
29 See the article on this subject published in The Economist ( 1992).
30 For reasons of space, all of the aspects involved could not be covered. For example, the theory of innovation in services proposed by Barras was omitted (1986).
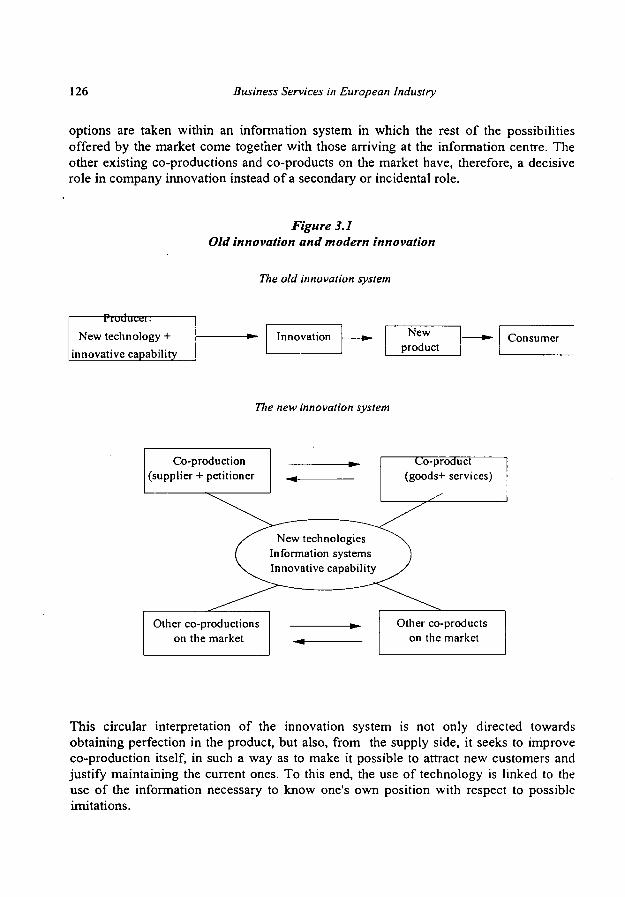
126 Business Services in European Industry
options are taken within an information system in which the rest of the possibilities offered by the market come together with those arriving at the information centre. The other existing co-productions and co-products on the market have, therefore, a decisive role in company innovation instead of a secondary or incidental role.
Figure 3.1 Old innovation and modern innovation
The old innovation system
Producer: New technology +
innovative capability Innovation New
product — - Consumer
77ie new innovation system
Co-production (supplier + petitioner
Uo-product (goods+ services)
Other co-productions on the market
Other co-products on the market
This circular interpretation of the innovation system is not only directed towards obtaining perfection in the product, but also, from the supply side, it seeks to improve co-production itself, in such a way as to make it possible to attract new customers and justify maintaining the current ones. To this end, the use of technology is linked to the use of the information necessary to know one's own position with respect to possible imitations.
Explanatory Factors of Business Services 127
This new perspective makes innovation a much subtler, less pre-defined, more complex issue. It does not guarantee the profitability of innovation. The new arrangement emphasises much more the problems of imitation and the lack of labour's capabilities. For this reason, companies should innovate and imitate, receive trained personnel and
, train personnel. Innovation is, therefore, an increasingly complex process, the objective of which is to improve interactive co-production of products that are not necessarily predefined, but are gradually integrating goods and services. On occasions, attaching a simple service to manufacturing goods can tum out to be a radically innovative phenomenon, where the guarantee in dealing with imitators rests in brand image, in the abilities present in the suppliers and in the amount of incomplete information in the market31.
Finally, it can be deducted that the strength of the innovative integration between goods and services depends on a variety of factors: the existing degree of integration between goods and services related to economic development in the different countries; the competitive environment and the tendency to improve one's competitive position with partner services32; the growing trend towards outsourcing, which has increased by 54% in the last five years of the 1980s33; the need supply has, not for subcontractors, but for partners capable of helping to improve efficiency3^ greater refinement and fragmentation of consumer society; the production of standardised goods to outlying areas and abroad; the relationship between the technical and technological sides in production, distribution and consumption; and lastly, the early stages of the evolution of products and markets35.
3.1.10 Factors linked to State and economic regulation
The role of the State in business service growth is twofold: direct or indirect legal regulatory intervention, and business services promotion mainly through regional and SME policies. Starting with legal measures, some regulations justify the use of advanced compulsory services like auditing. Others create business for business services companies, such as privatisation processes (management consulting), public engineering works (technical services) or the need to produce according to some international standards (quality control services). There are also political regulations affecting specific sectors, like the heavily regulated temporary work, controls in advertising services, stringent requirements for security services firms, etc. Most of these interventions are performed within national boundaries, whereas few actions until now have been undertaken at EU level. More details can be found in chapters 6 and 10.
31 These aspects will be analysed in depth in the following chapter.
32 See, for example, Ruyssen (1990)
33 Data from the Peat Marwick (1988) report on business services in Europe.
34 An element described in detail by Bailly & Maillât (1990).
35 See Porter ( 1990) for discussion of this issue.
128 Business Services in European Industry
It is necessary to observe, also, that there are re-regulatory or de-regulatory processes affecting business services, for instance, recent steps taken by the National Competition Courts, or by the EU eliminating certain corporate regulations and professional protectionism, with the aim of introducing greater competition in supply. This, undoubtedly, could make the business service markets more dynamic. Anyway, direct State legal regulation affecting business services has little importance in comparison to the promotion one. In fact, some or even many business service markets are quite open so professionals do not consider themselves significantly affected by legal restrictions. Promotion of business services used to take place chiefly at a regional level. Actions addressed to promote technological or scientific parks, business services centres, incubators, etc., benefit the business services used in those regions, although supply falls short of the business services needs of all enterprises. Some national business services related actions are also important, normally included in SME or R&D policies. We will return to these points in the closing chapters of this book.
3.1.11 Company attributes
The size and attributes of companies also influence their use of intermediate services. Large companies, product of an accumulation of capital, have been able to create social divisions of work, as well as specialisation and multiple-product and multiple-location strategies. These have been linked to the use of business services (Martinelli, 1991a). "The growth, diversification and multinational tendencies of companies increase their need for functional services to ran, supervise and advise the aggregate of divisions of operations" (Cuadrado and González, 1988, page 34). For their part, small companies have made less use of advanced services, essentially taking advantage of those needed for the day-to-day maintenance of activities. Furthermore, SMEs have tended to subcontract out those services which large companies provide in-house. In this way, they have achieved levels of efficiency which it would not have been possible to attain in any other way (Martini, 1989).
Several empirical works have focused on the study of the varied attributes (size, sector, innovative nature, etc.) of companies as contrasted with their use of intermediary services. We will briefly review the studies carried out in Spain (Mañas, 1992), the United Kingdom (O'Farrell, Moffat and Hitchens, 1993), Italy (Martinelli, 1991b; Senn, 1991b; Bramanti, 1989) Illeris' study (1989), beginning with a summary of studies in Europe.
The majority of empirical studies of business services include the relationship between size and use. According to O'Farrell et al., large companies use more services, in other words, those with a marketing department carry out the largest amount of exports. Likewise, in the opinion of Illeris, large companies carry out more services than small ones. According to Mañas, the variable of size has the biggest influence on the rate of use of services, greater than activity and location. Additionally, it exerts influence in such a way that large companies create more demand than SMEs. However, the impact

Explanatory Factors of Business Services 129
of size is low in mandatory services or services related to regulations or administrative obstacles.
The nature of the company has an influence on its use of business services. Thus, Illeris , shows that independent central offices tend to make use of services to the same extent as
the subsidiaries of large companies. However, there are exceptions in less developed regions (Martinelli). The small companies of the Italian Mezzogiorno use fewer services than the subsidiaries of corporate structures. These subsidiaries also exhibit a more diverse and advanced use of services as they import 50% of them from outside the region.
By sector, some services are more utilised than others: accounting, banking, advertising and insurance services are more widely used than market research, computing and design (Illeris). Nevertheless, if one makes comparisons according to user industry, substantial differences do not emerge (O'Farrell et al; Mañas).
The more developed countries make greater use of services than less developed countries like Spain and Italy. The use of advanced business services is very low in the latter (Mañas; Bramanti). In the case of Spain, the location variable exerts the least influence. In addition, it is noteworthy that companies situated in large industrial areas make more use of advanced business services in comparison to those located outside of these areas.
The use of services is not a static element, but a dynamic one. A study carried out by Senn (1991a) demonstrates how the use of services is related to the life span of a company. In the first stage, use is made of'set-up' services, such as secretarial, financial consulting, legal, insurance and human resources. During the growth stage, services involving knowledge and management of the market are procured. These include advertising, legal services, public relations, export services, fairs and financial services. In times of crisis, management and technological consulting services are needed above all others.
3.1.12 The predominance of quality
The last important reason that can explain the appearance and consolidation of business services is the predominance of quality over quantity or, in other words, the need for the former in order to obtain the latter in a stable and lasting way. Quality is the ultimate aim of the integration of many intermediary services into the productive process. This involves not only competition of services where the aim is to maximise quality, such as quality control, but also other services aimed at enhancing the image associated with the company. A computing service or management consultants, contribute towards raising the quality level of the products of the company that uses them. Quality is obviously connected to previous aspects, especially human capital, technological processes and market competition. Given its importance, the next chapter is dedicated exclusively to this matter.

130 Business Services in European Industry
3.1.13 The multiplicity of explanatory factors
Table 3.3 displays some examples of business service activities that are closely related to each of the factors linked to the origin of business services, as described above. It is understood that many business services justify their existence by using all the mentioned factors and only the most relevant to each activity are shown below.
Table 3.3 Business service activities classified by main cause of existence
1.
2.
3.
4.
5.
6.
7.
8.
9.
10.
11.
12.
Explanatory factors
Flexible productive process
Externalisation
Goods-services integration
Integration of new ICT
Human capital
Raw materials availability
Market growth and changes
Globalization
Innovation
State and regulation
Business characteristics
Quality predominance
Business service activities (some examples)
Management, computing , personnel, electronic and internet services Strategic services, operational (all activities are affected by externalisation processes) Engineering, computing, fairs and exhibitions, advertising Engineering, computing services, quality control, electronic communication Personnel services, professional training, management services, linguistics, public relations Renting and real state, information related-services, personnel services Management services, marketing, publicity, electronic communications Fairs and exhibitions, management consultancy, marketing, linguistics, public relations, export aid R&D, management, quality control, design, engineering services, fairs and exhibitions Legal services, accounting, quality control, temporary work, security services Depends on the activity and the type of business, economic sector, enterprise size, location, etc. Quality control, design, engineering, computer services, management consultancy, training
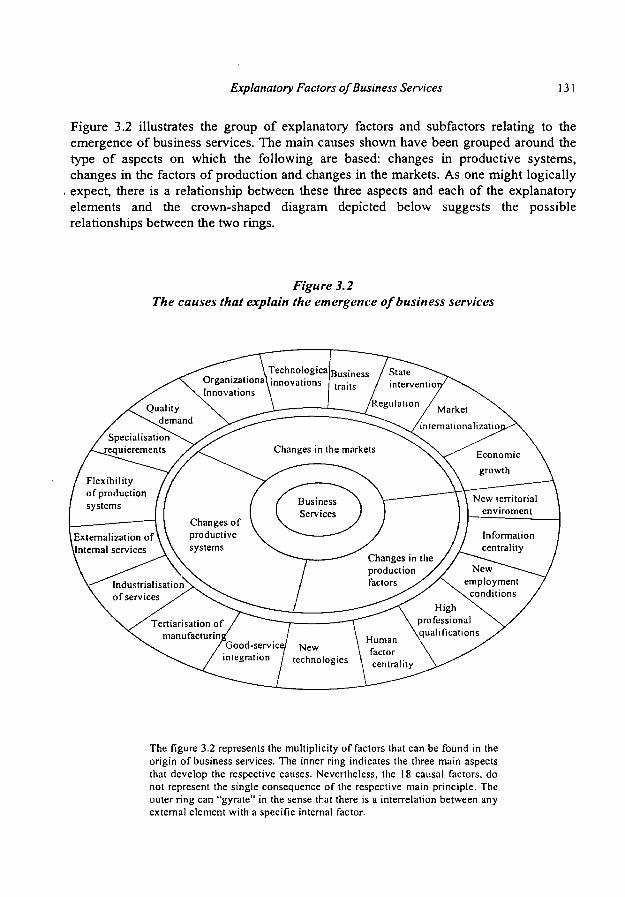
Explanatory Factors of Business Services 131
Figure 3.2 illustrates the group of explanatory factors and subfactors relating to the emergence of business services. The main causes shown have been grouped around the type of aspects on which the following are based: changes in productive systems, changes in the factors of production and changes in the markets. As one might logically expect, there is a relationship between these three aspects and each of the explanatory elements and the crown-shaped diagram depicted below suggests the possible relationships between the two rings.
Figure 3.2 The causes that explain the emergence of business services
The figure 3.2 represents the multiplicity of factors that can be found in the origin of business services. The inner ring indicates the three main aspects that develop the respective causes. Nevertheless, the 18 causal factors, do not represent the single consequence of the respective main principle. The outer ring can "gyrate" in the sense that there is a interrelation between any external element with a specific internal factor.
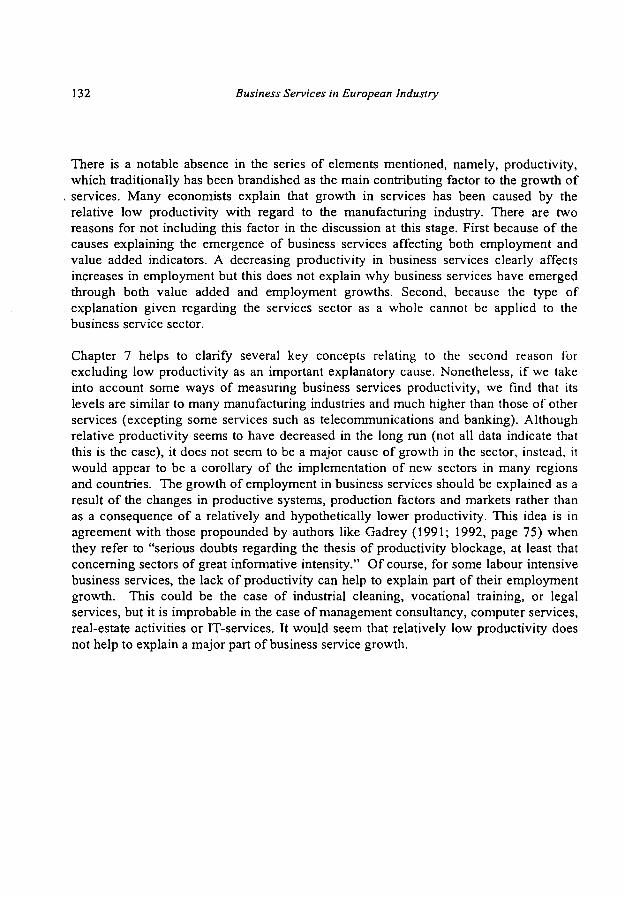
132 Business Services in European Industry
There is a notable absence in the series of elements mentioned, namely, productivity, which traditionally has been brandished as the main contributing factor to the growth of services. Many economists explain that growth in services has been caused by the relative low productivity with regard to the manufacturing industry. There are two reasons for not including this factor in the discussion at this stage. First because of the causes explaining the emergence of business services affecting both employment and value added indicators. A decreasing productivity in business services clearly affects increases in employment but this does not explain why business services have emerged through both value added and employment growths. Second, because the type of explanation given regarding the services sector as a whole cannot be applied to the business service sector.
Chapter 7 helps to clarify several key concepts relating to the second reason for excluding low productivity as an important explanatory cause. Nonetheless, if we take into account some ways of measuring business services productivity, we find that its levels are similar to many manufacturing industries and much higher than those of other services (excepting some services such as telecommunications and banking). Although relative productivity seems to have decreased in the long ran (not all data indicate that this is the case), it does not seem to be a major cause of growth in the sector, instead, it would appear to be a corollary of the implementation of new sectors in many regions and countries. The growth of employment in business services should be explained as a result of the changes in productive systems, production factors and markets rather than as a consequence of a relatively and hypothetically lower productivity. This idea is in agreement with those propounded by authors like Gadrey (1991; 1992, page 75) when they refer to "serious doubts regarding the thesis of productivity blockage, at least that concerning sectors of great informative intensity." Of course, for some labour intensive business services, the lack of productivity can help to explain part of their employment growth. This could be the case of industrial cleaning, vocational training, or legal services, but it is improbable in the case of management consultancy, computer services, real-estate activities or IT-services. It would seem that relatively low productivity does not help to explain a major part of business service growth.
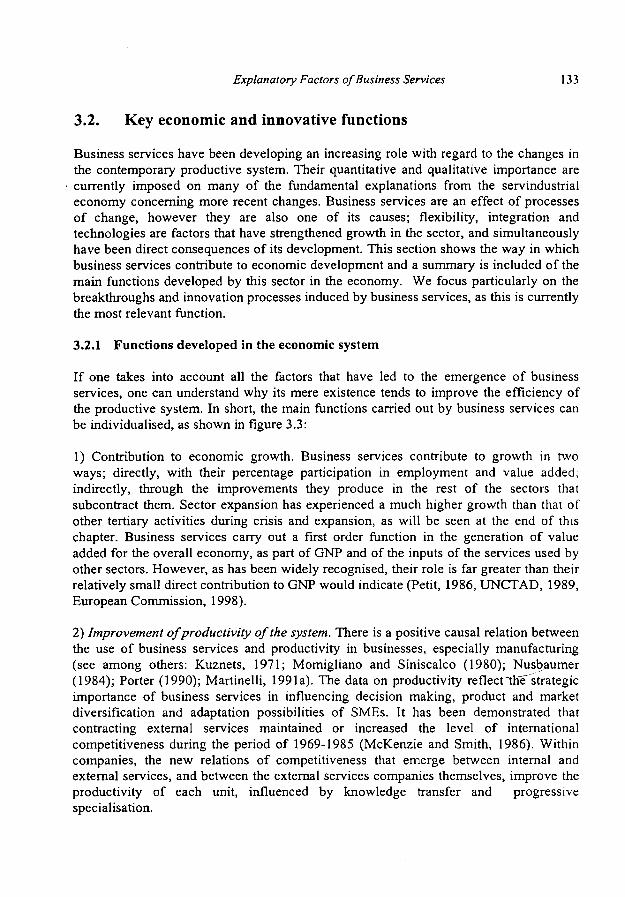
Explanatory Factors of Business Services I 33
3.2. Key economic and innovative functions
Business services have been developing an increasing role with regard to the changes in the contemporary productive system. Their quantitative and qualitative importance are currently imposed on many of the fundamental explanations from the servindustrial economy concerning more recent changes. Business services are an effect of processes of change, however they are also one of its causes; flexibility, integration and technologies are factors that have strengthened growth in the sector, and simultaneously have been direct consequences of its development. This section shows the way in which business services contribute to economic development and a summary is included of the main functions developed by this sector in the economy. We focus particularly on the breakthroughs and innovation processes induced by business services, as this is currently the most relevant function.
3.2.1 Functions developed in the economic system
If one takes into account all the factors that have led to the emergence of business services, one can understand why its mere existence tends to improve the efficiency of the productive system. In short, the main functions carried out by business services can be individualised, as shown in figure 3.3:
1) Contribution to economic growth. Business services contribute to growth in two ways; directly, with their percentage participation in employment and value added; indirectly, through the improvements they produce in the rest of the sectors that subcontract them. Sector expansion has experienced a much higher growth than that of other tertiary activities during crisis and expansion, as will be seen at the end of this chapter. Business services carry out a first order function in the generation of value added for the overall economy, as part of GNP and of the inputs of the services used by other sectors. However, as has been widely recognised, their role is far greater than their relatively small direct contribution to GNP would indicate (Petit, 1986, UNCTAD, 1989, European Commission, 1998).
2) Improvement of productivity of the system. There is a positive causal relation between the use of business services and productivity in businesses, especially manufacturing (see among others: Kuznets, 1971; Momigliano and Siniscalco (1980); Nusbaumer (1984); Porter (1990); Martinelli, 1991a). The data on productivity reflect thTstrategic importance of business services in influencing decision making, product and market diversification and adaptation possibilities of SMEs. It has been demonstrated that contracting external services maintained or increased the level of international competitiveness during the period of 1969-1985 (McKenzie and Smith, 1986). Within companies, the new relations of competitiveness that emerge between internal and external services, and between the external services companies themselves, improve the productivity of each unit, influenced by knowledge transfer and progressive specialisation.
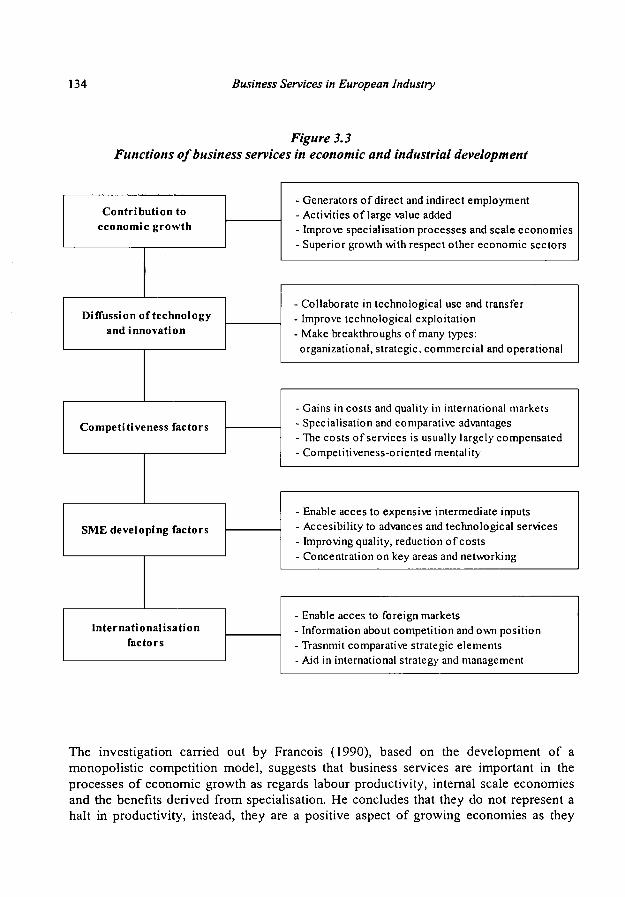
134 Business Services in European Industry
Figure 3.3 Functions of business services in economie and industrial development
Contribution to economie growth
DiiTussion of technology and innovation
Competitiveness factors
SME developing factors
Internationalisation factors
- Generators of direct and indirect employment - Activities of large value added - Improve specialisation processes and scale economies - Superior growth with respect other economic sectors
- Collaborate in technological use and transfer - Improve technological exploitation - Make breakthroughs of many types: organizational, strategic, commercial and operational
Gains in costs and quality in international markets Specialisation and comparative advantages The costs of services is usually largely compensated Competitiveness-oriented mentality
Enable acces to expensive intermediate inputs Accesibility to advances and technological services Improving quality, reduction of costs Concentration on key areas and networking
Enable acces to foreign markets Information about competition and own position
• Trasnmit comparative strategic elements Aid in international strategy and management
The investigation carried out by Francois (1990), based on the development of a monopolistic competition model, suggests that business services are important in the processes of economic growth as regards labour productivity, internal scale economies and the benefits derived from specialisation. He concludes that they do not represent a halt in productivity, instead, they are a positive aspect of growing economies as they
Explanatory Factors of Business Services 135
facilitate a greater division of labour within unified operations and those associated with productivity changes.
3) Diffusion of technology and innovation: competitiveness factors. Business services . aid the integration and exploitation of the new technologies applied to production, information and communication. At the same time, they encourage technological innovation as well as organisational and strategic breakthroughs. Given that business services have a high innovative content, they should be considered as basic agents for innovation. Not only for the contribution of the important breakthroughs that have taken place using R&D services, but also for the small innovations that affect day-to-day running of companies which improve and make use of new opportunities. Business services act as an "input-innovator" for everyday dynamics of companies and, therefore, under normal conditions, performance of companies and the economy improves. This does not imply that this relation is immediate. As Marshall (1988b) points out, in a study on the manufacturing sector in the UK region of the "West Midlands", the business services themselves do not guarantee good results: the quality of input of the service for manufactured goods has an important impact on the results of the company, but there is no reason to assume that an increase in the prominence of services for production in a regional and national economy will simply be favourable in manufactured goods. "Evidence suggests that a strong manufacturing sector is a prerequisite for employment growth in producer services" (page 3). Not every business service is an innovative one nor does it always comply with the overall functions described. When markets are very narrow, business services advantages can be reduced.
Nevertheless, business services are, in general, factors of competitiveness that generate gains in quality, the critical factor in the new dynamic international and competitive environment. The diverse specialisations and the fact that the usage costs of these services are usually set off by the benefits they produce both contribute to the quality of service.
4) Integration of the productive system. Business services carry out the function of integrating the various differentiated and specialised parts of the productive system (Stanback et alt., 1981), " they facilitate the adaptation to the changing conditions and the complex elements of the global economy" (Goe, 1990). The importance of this function is further emphasised when considering the observation made about the importance of the use of business services, generated by integration in other services (banking, transport, commerce, etc.), besides integration in manufacturing industry (Wood, 1986; Goe, 1990). According to the latter observation, business services facilitate dynamic change, therefore, in the majority and the presumably most static activities of the economy: services. Business services have a growing relation to services. Business services not only incorporate economic activities among themselves and other services but also among all industrial markets. The information transfer generated by business services brings together agriculture, manufacturing and service market segments, which would otherwise remain out of contact.
136 Business Services in European Industry
5) Growth factor of SMEs. Business services enable SMEs to benefit from a specialisation in traditional and advanced services that would not, otherwise, be possible; they benefit from the technological and innovative advantages that the services transmit. These services play an important role in the establishment of the aforementioned SMEs and in their development and expansion, which enables them to operate with an overall vision of the market, reduce costs and obtain quality of service. The evolution of subcontracting business services has particularly benefited SMEs as they have been able to opt for the advantages of the functional division of labour that were previously reserved for large enterprises.
6) Development factors. Beyond their functions in economic growth, business services contribute to economic development as defined by Hirschman (1958, page 17): "Development does not depend so much on knowing how to find the optimal combinations of resources and given productive factors, as how to raise the hidden, disperse or misused resources for development projects." Many advanced services are not dedicated to making the already existing aspects grow, instead, their direct and indirect object is the discovery or rediscovery of elements that have not been taken advantage of or are hidden.
7) Internationalisation factors. Some business services facilitate access to foreign markets and provide information about the international competitive environment. Business services help management and decision making in the international structure. On the one hand, they improve the circuits that generate employment in the highest levels of the educational and professional system. The role of advanced services and the introduction of new technologies reinforce the need for thorough preparation in order to obtain a position in the productive system. On the other hand, from the point of view of space, the distinct duality is consolidated, by Marshall (1988a), amongst others, between post-industrial spaces and de-industrialised spaces. The former corresponds to urban areas that live from the increase in services. The latter corresponds to specific industrial peripheries that are struggling to avoid the recession. Business services, in their duality of services and industry, have the capacity to improve the situation in both areas, therefore, their presence is considered to be essential in many countries and regions.
All these positive functions, make business services a key policy instrument for improving the economic welfare and the industrial competitiveness. The contribution of business services to the economic growth, use of technology, industrial competitiveness, SME development and internationalisation, can be helped by implementing the right policies addressing all these factors. These implications will be considered further on.
Explanatory Factors of Business Services 137
3.2.2. Business services, innovation and industrial competitiveness
Emphasis can be placed on one of the functions carried out by business services in the economy, this function is provoking an initial incursion of the sector in some areas of industrial policy. We refer to innovation and competitiveness. The possibility that business services are having a direct effect on industrial competitiveness is starting to focus the attention of industrial policy-makers on the sector. The strategic role that business services have in industry is associated with their innovative character. This function can be understood by using the analysis of the five types of innovation stimulated by business services: technological, organisational, strategic, commercial and operational, (see table 3.4).
3.2.2.1 Services related to technological innovation
The integration of technology and its better use represent the first result of the innovation brought about by business services. The last section presented a double relation between business services and technology: many business services emerge as a consequence of technological progress (IT services); and business services encourage the integration and exploitation of this technology (Engineering, design or computing services).
The services that are more closely related to technological innovation are computing services. Nevertheless, the services of electronic communication, engineering, computer-assisted design and specific telecommunications services can be considered to be of a similar or even greater importance. These services aid the proper and effective use of technological innovation: proper, as a large proportion of technology normally remains out of enterprise's reach because they do not understand its possible utility, given that they do not have services that show or demonstrate this utility; and effective, because if the services linked to new technologies did not exist, these would remain underased.
Technology is also related to other types of services such as those of quality control. Quality control processes, increasingly necessary for the competitiveness of economies, require the use of an adequate technology for each productive sector and a service that carries out the control. This control service tends to be, both internal (internal inspection) and external (external inspection). Product and process quality are essential requirements nowadays in order to compete. Its control and improvement constitute an innovative factor of primary importance.
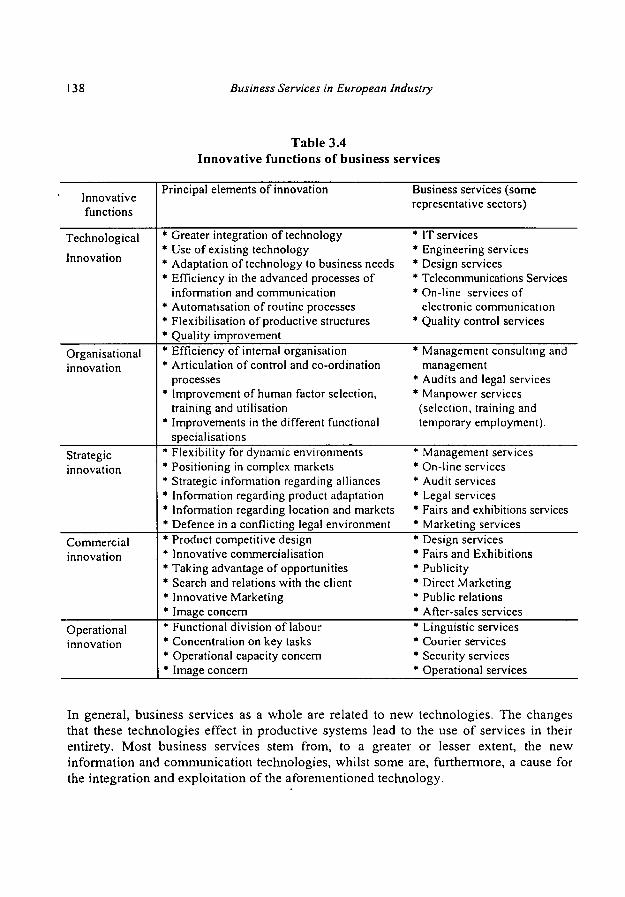
138 Business Services in European Industry
Table 3.4 Innovative functions of business services
Innovative functions
Technological
Innovation
Organisational innovation
Strategic innovation
Commercial innovation
Operational innovation
Principal elements of innovation
* Greater integration of technology * Use of existing technology * Adaptation of technology to business needs * Efficiency in the advanced processes of
information and communication * Automatisation of routine processes * Flexibilisation of productive structures * Quality improvement * Efficiency of internal organisation * Articulation of control and co-ordination
processes * Improvement of human factor selection,
training and utilisation * Improvements in the different functional
specialisations * Flexibility for dynamic environments * Positioning in complex markets * Strategic information regarding alliances * Information regarding product adaptation * Information regarding location and markets * Defence in a conflicting legal environment * Product competitive design * Innovative commercialisation * Taking advantage of opportunities * Search and relations with the client * Innovative Marketing * Image concern * Functional division of labour * Concentration on key tasks * Operational capacity concern * Image concern
Business services (some representative sectors)
* IT services * Engineering services * Design services * Telecommunications Services * On-line services of
electronic communication * Quality control services
* Management consulting and management
* Audits and legal services * Manpower services
(selection, training and temporary employment).
* Management services * On-line services * Audit services * Legal services * Fairs and exhibitions services * Marketing services * Design services * Fairs and Exhibitions * Publicity * Direct Marketing * Public relations * After-sales services * Linguistic services * Courier services * Security services * Operational services
In general, business services as a whole are related to new technologies. The changes that these technologies effect in productive systems lead to the use of services in their entirety. Most business services stem from, to a greater or lesser extent, the new information and communication technologies, whilst some are, furthermore, a cause for the integration and exploitation of the aforementioned technology.
Explanatory Factors of Business Services 139
3.2.2.2 Services related to organisational innovation
The need to come to terms with an increasingly complex environment creates an additional difficulty in business organisation. New technologies and the need for specialisation have led to the availability of more flexible and horizontal structures that entail a new business organisation. The process of monitoring and controlling work can no longer be strictly hierarchical and the task of co-ordination between the functional areas becomes very relevant.
In this context, certain business services contribute to the creation of innovations in the organisational structure of companies, helping to overcome situations of internal blockage or encouraging more competitive new structures. The first business service to behave like this is management consulting. This activity has expanded significantly during the last twenty years, and it is now standard practice for large enterprises to employ management consultants on a regular basis; not simply when restructuring is needed, as happened previously. Organisational innovations are required to an increasing extent in an attempt to maximise limited resources. This helps to explain the strong development of management consultancy during the last two decades within the context of growing complexity and uncertainty. As formulated by The Economist (1997) in its excellent survey on management consultancy (page 4): "complexity creates confusion; uncertainty creates fear; and both create a booming demand for outside advice". And one of the reasons cited to demonstrate how the boom has been fuelled is the competition for ideas and talent: "Bosses are becoming increasingly convinced that ideas are the best source of competitive advantage. Consultancies employ a high proportion of the brightest young business minds, and devote large resources to developing ideas, based on their privileged access to companies in different countries and industries".36
Management consulting services, even though they are the most prominent in this organisational innovation function, are not the only services to come under this heading. Audit services and legal services carry out functions that often implicitly include organisational guidance. Nowadays, as the principal factor of industrial competitiveness is human capital, the services related to human capital have become an increasingly decisive source of innovation in businesses. Training of personnel and selection services,
36 Other reasons pointed out in The Economist report are: the impact of big economic changes such as globalisation and deregulation; the fashion for re-engineering and downsizing, which persuaded bosses to bring in consultants to re-engineer their "core processes" and take the blame for the inevitable sackings; the new credo that companies should "stick to the knitting" meaning they should hand over everything but their core businesses to external specialists; information technology and, the convergence of technologies such as computers and telephones. Of course, the survey also debates the factors limiting management consultancy growth and as summarized in its final statement: "it needs to become less secretive and more ethical -just like other professions".
140 Business Services in European Industry
as well as temporary contracts, represent an organisational innovation, as the primary resource of the company can be managed efficiently and, in this case, enables a greater degree of flexibility concerning contracts and an improved employment adaptation to the cyclical needs of the enterprise.
To a certain extent, every business service, albeit the most standardised and remote from the management of the enterprise, implies in itself a stimulus of organisational innovation. The need for all services to specialise sends a restructuring message to the organisation, permitting the development of this specialisation. In fact, business services lie at the centre of the phenomenon of externalisation, which is in itself, of course, an innovative phenomenon.
3.2.2.3 Services related to strategic innovation
The burgeoning interrelation of markets, the opening up of new opportunities and the internationalisation of economies are the reasons behind the need for companies to pay particular attention to the strategic aspects of business activity. The increasingly competitive environment requires a greater understanding of the company's position in the market, competition and purchasing options, mergers, take-overs, joint-ventures or collaborations with other companies. Further to alliance policy, competition imposes the need for a solid understanding of customers, market segments to be exploited and the strategic location of head offices and dependent offices.
In all these aspects, the innovative nature of business services plays a decisive role. Many services obtain information from the markets, which is then transmitted and sold to their clients. Moreover, they incorporate, on the whole, advice regarding the utility of this information to help with the decision- making processes in the enterprise. There are two types of services related to strategic innovation:
Services that transmit information outside advisory services. These include electronic communication and some computing on-line services, multimedia and accounting, auditing and legal services (although some usually give advice as well) Services that transmit both information and advice. These embrace fair and exhibition services (that constitute in themselves an advisory service for enterprises regarding their position, competition and consumer needs), market research services, legal and auditing services. Management consulting also falls in this category, as it directly influences the group of factors related to company strategy and also provides advice for decision making.
3.2.2.4 Services related to commercial innovation
Innovation in productive processes also concerns product design and commercialisation and related activities: design, sale of the company's image, relationship with customers, after-sales services, etc. Everything that is related to effective product presentation and

Explanatory Factors of Business Services 141
distribution requires a certain level of innovation and opportunity in production, both of which are business services traits.
Design services enhance the attractiveness of the sale. Publicity services are directly . responsible for innovation in the area of brand image and product presentation. Direct marketing and sales promotion contribute to the search for clients and break new ground in the methods they employ in order to draw attention to the products on sale. An innovative marketing environment is provided by fairs and exhibitions. Public relations services also exert considerable influence in the presentation of the company to its current or potential clients. Lastly, after-sales services handle the relationship with clients, in pursuit of loyalty and prestige in markets.
3.2.2.5 Services related to operational innovation
Business services also contribute to so-called operational innovation, as the operational services allow the enterprise to concentrate its efforts on central functions. With the promotion of the functional division of labour within the enterprise, the responsibility of these non-core services are delegated to other external companies, thus improving the efficiency of the productive chain. The hiring of external operational services constitutes an innovation in the way the more routine or standardised services are organised.
Traditional operational services chiefly refer to security and industrial cleaning. Services related to information transmission such as courier services or linguistic services also aid operational innovation. More recently, services related to the environment can be considered as a possibility for improving the operative field of the company. In general, all these services tend to boost the smooth running of enterprises, reinforcing their image to the outside world and confidence in their efficiency.
3.2.2.6 Prices, quality and competitiveness of business services
Thus far we have examined the technology, quality and innovation provided by business services and how, as a result of their interactions, business services contribute to the competitiveness of industry. Our focus shifts now to the problem of business service prices. Occasionally, the cost of the service may seem disproportionate to the benefits derived from it. This situation depends on two closely interrelated circumstances: the scope of markets and the salaries of the professionals in the sector.
When the number of companies that operate in a market is very small, the possibilities of charging a high price rise. In this way, the quality/price relation is impaired. On the contrary, when markets are extended, then the quality/price relation tends to edge up. This refers us to the problem of two types of narrow markets of business services: small enterprises and non-central areas. Taking the benefits provided by business services for a medium-sized enterprise located in a large town as a benchmark, one finds that the two market segments mentioned do not respond as efficiently as one might expect.
142 Business Services in European Industry
The principal problem in non-central areas is that local services might be insufficient; they may not be adequately prepared and informed and may have an excessively local opinion regarding markets. For small enterprises, direct hiring of service suppliers in a large town is not easy, as the reference price that the large companies charge in their central markets is usually very high for advanced services (for example: management consulting), and the standardised services charge supplements for displacement (for example: security services).
This double-edged problem is linked to the location of services (see chapter 8) and the qualification of the labour market (see chapter 2). Business services tend to be concentrated in large urban areas and agglutinate the best professionals in the sector. As business services often demand personal treatment and physical proximity, the use of business services is limited by a specific geographic area, despite the growing processes of internationalisation. Access to certain geographic space and to certain high performance business services firms implies a cost that many companies cannot afford. In contrast, findings show that many enterprises suffer from a lack of information which is reflected in the fact that they do not always hire the right supplier for the type of service needed.
It is necessary to point out the net advantages of business services in their function of developing competitiveness. The research that has been carried out suggests that, despite the persistence of access difficulties to some services and the lack of information in markets, the use of business services usually offsets its cost, due to the aforementioned factors of innovation and quality and to the direct reduction induced by external hiring of business services. Given the cost of hiring business services, the repercussion of this cost on the price is usually set off by gains in efficiency. Even if the cost of business services tends to edge up, and the short-term price increases as well, the use of business services will improve the cost structure and will reduce the cost in the medium and long term. Therefore, the use of business services can imply (in many cases in the medium and long term) an important reduction in costs. This is another advantage of many business services, together with those offered by innovation, namely, improvements to product quality and the differentiation of image, brand or products.37
In conclusion, the direct cost (price) and indirect cost (information search, problems in the markets) of business services are set off by gains in competitiveness caused by the reduction of direct costs (costs of internal personnel), change of cost structure (from fixed to variable), and gains in quality and efficiency via innovation. The spectacular growth of the sector sustained since the sixties, and the consolidation of this growth in the more advanced economies prove that business services are conclusive in improving the competitiveness of the European industry.
37 All these elements related to the market and prices will be developed further in chapters 8 (location) and, above all, 9 (markets).
Explanatory Factors of Business Services 143
3.3. The integration of business services in the economy: input-output analysis
A detailed study can be made of the role of business services in economic development by following the processes of integration between manufacturing and services using input-output tables. The information presented and the analyses in the previous sections of this chapter placed business services in a decisive position in the transformation of new production systems, flexibility of the organisation, integration between goods and services and in the impact of new ICT technologies, among others. All the causes of business service growth considered support the central hypothesis that business services do not only represent an expression of development but are also a factor of this development. The interrelations between manufacturing and services and, more particularly, between business services and the rest of the economic sectors can be considered in this light.
First, we shift the focus onto the main conclusions drawn from the studies on integration between goods and services based on input-output methodology, with reference to leading authors in this field, as well as the methodological problems encountered. Second, we examine the extent of the integration of business services with manufacturing industries, taking Spain as an example and comparing business services to other service sectors. Then, a more detailed analysis will be made of the different manufacturing sectors and their interrelations with business services. In the following case, we will analyse the structure of inputs and outputs of business services using the European Input-Output Tables (IOT) that can be considered to be comparable and are elaborated by the OECD (1996b).
Analysis of the IOT tables in this chapter is subject to a number of limitations. For a start, only simple indicators are used (technical coefficients, inverse matrix and variation percentages), hence phenomena that require other indicators or matrix applications are not covered. We are restricted to simple indicators as they adjust with sufficient solvency to the proposed objective of corroborating the integration of business services in the economy. Moreover, if we were to go beyond the aforementioned formula it would clearly imply exceeding the scope of this book. Besides, the data offered by the IOT tables present problems specific to business services, which ushers in a note of caution as regards the conclusions (see box 3.1).
Within the existing limits, an attempt will be made to identify the relations between the business service sector and the rest of the economy, embracing manufacturing activities and other service activities. We begin with an examination of the manufacturing/business services flow from the point of view of the participation of goods and services in the production of business services. Then the structure of resources of the sector will be analysed. A detailed study follows of the integration of business services in other industrial sectors (business services/industrial flow). In this
144 Business Services in European Industry
way, we seek further corroboration of the hypothesis regarding the contribution of this sector to economic development.
Box 3.1 Methodological problems in input-output tables on business services
The main limitations of the use of the input-output tables (IOT) for business services can be summarised as follows:
Firstly, an IOT breakdown of the business service sector does not exist that could offer information about the multiple and heterogeneous activities it embraces. Secondly, it is not possible to make a comparison of the IOT from different European countries. The European IOTs have not yet been published jointly and the existing comparative references never go as far as the division of business services of interest to us. Even when this division suggests a degree of comparability, the study of classifications and methodologies warns against any attempt to study the sector using this traditional method. Only the Eurostat tables published for 1985 or the OECD one used in this section meet the minimum requirements for comparability, but this remains insufficient. Thirdly, the time series of IOTs has not used the same classification and methodology. Thus the guarantee of time comparability of business services has been reduced over the last few years. In addition to these problems, we find abundant distortions occurring as a result of the defective business services registers for enterprises in many counties. Finally, it is necessary to refer to the difficulties in measuring these activities using traditional methodology. Many of these problems have already been put forward by Postner (1982) in his article on the problems of identifying and measuring producer services in the IOT tables. The basic problem is associated with two factors. On the one hand, the establishment statistic unit is not sufficiently homogeneous nor does it have available accounting data about all the activities of the services carried out or subcontracted. The services are normally purchased from the enterprise rather than the establishment. As a result, the estimates underlying the data of the tables on business services are based on very little information, which injects a subjective dimension into the tables. On the other hand, Postner points to additional problems related to obtaining of data for multiestablishment business groups, the relations between central offices and subsidiaries, international trade of services for production and intercompany transactions and, finally, problems in price assessment. In addition, secondary activities and in-house business services are very difficult to cover using IOT methodology.
The conclusion that can be drawn from all these problems is that the data referring to the manufacturing industry is much more complete and reliable than the data on services and particularly, business services. It is important to note the difficulty of collecting data for many secondary activities in business services and, in particular, separating them into the disaggregated classifications required, but overall these activities may become more important than the primary ones.
Explanatory Factors of Business Services 145
3.3.1 The input-output analysis and integration of business services
We have established that the complementary nature of goods and services can be understood within the processes of tertiarisation of industry and industrialisation of the tertiary sector: the former corresponds to the transformation of the commodity into a service, while the second represents the transformation of the service into a commodity. As far as services are concerned, the immaterial component and personalisation in industry increase simultaneously with the material component and standardization, This dual process means that the traditional schemes of tertiarisation or de-industrialisation are overridden.
An empirical verification method has been developed over the past decades, using input-output tables and the elaboration of new methodologies to study intersectorial relations, in order to test new "integrating" theories. Several authors have contributed to this process. For example, Carter and Brody (1970) concentrate on the American economy, Momigliano and Siniscalco (1982) and Pellegrini (1988) on Italy, Barò (1990) and Del Rio (1992) on Spain and Fontaine (1988) on France.
It is interesting to note that all these studies refer to services/manufacturing relations and not to business services in particular. We will explore the general relations of structural change, starting with the intermediary services incorporated into production processes. In this sense, the tertiary activities are usually considered, in general, as business services, however, according to the Nace code, business services only constitute a part of these flows.3 8
The aforementioned research39 and similar studies help to explain the importance of technological advance in the goods/service relation, existence of costs and quality factors underpinning externalisation, and, in general, the growing integration between manufacturing activities and service activities. Within these relations, a more immediate explanation about growth of the services can be found. In order to investigate this further, the different interrelations that exist in the economy need to be identified. Two principal flows are studied: the manufacturing/services flow, related to industrial goods
38 Much IOT research analyses services used by Industry as intermediate inputs and calls these flows business services. In the empirical part of this IOT section we focus on flows generated by the business service sector, excluding, for example, inputs from transport to manufacturing. Unfortunately, we can not cover the in-house business services flow produced within manufacturing or service companies nor the flows generated by companies producing business services as secondary activities. The methodology used in IOT sidesteps these concepts, so we are obliged to use the narrowest field of business services. Therefore, business services in IOT, as in most statistics, are clearly underestimated as an integrating activity.
39 There has been extensive methodological and statistical progress in this field. The authors mentioned here represent some examples of pioneering work and more sophisticated analysis.
146 Business Services in European Industry
utilised in the production of services (useful in study often called "industrialisation processes of services"), and the services/manufacturing flow, that, in tum, indicates the services utilised in the production of manufactured goods. This second flow, which is more relevant to understanding the relation of services with the manufacturing sector, can be analysed in two ways: by considering the manufacturing sectors, observing in their columns the inputs of the services utilised in production; or, the service sectors themselves, observing in their files the destination of outputs. In the first instance, we refer to tertiarisation, whereas in the second we refer to integration.
There follows a brief description of the contributions of a number of the prominent authors mentioned above. We begin with Siniscalco (1988) who analyses the percentages of intermediary services within the manufacturing industry, observing how these percentages have doubled in the following countries during the period 1959-1980: they jump up from 6% to 17% in Italy, 8% to 16% in France, 11% to 16% in Germany, and from 10% to 22% in the United Kingdom.
Pellegrini (1988) performs an in-depth study of the methodology of the input-output analysis in order to understand the manufacturing-services relations propounded by previous authors and, in particular, Momigliano and Siniscalco (1982). The conclusions he reaches show "how, in the interior of a relevant mobility in the production structure and processes, the manufacturing/services relations are modified either by the effect of an increasing specialisation of all of the productive sectors, or by the characterisation of the processes of de-verticalisation focused on the acquisition of external sectors" (page 431).
In the study carried out by Fontaine (1988) discussion centres on the importance of business services within the set of manufacturing/services interrelations. Moreover, it assesses its relevance within the context of considerable growth, which promotes the business service sector to the level of consumer services. Fontaine also stresses that business services are not the result of a simple process of externalisation, instead they represent a growing need for services in enterprises.
In the case of Spain, Del Rio's study (1992), following the ground-breaking work by Barò (1990), is particularly interesting for the 1980-85 period. Del Rio employs the complex methodologies developed by the Italian authors and his findings are essentially the same. He highlights the importance of the process of tertiarisation of industry, which increases the participation of services in many manufacturing sectors. This activity reflects both the direct and indirect contribution through multiplying effects. The results also confirm that there is a process of integration of services within the Spanish productive system. This integration manifests itself in line with the processes of modernisation and specialisation of the economies. However, not all services contribute to this process of integration to the same degree nor at the same time. Industrialisation of services has also been a prominent and growing feature of nearly all the services sectors, including business services.
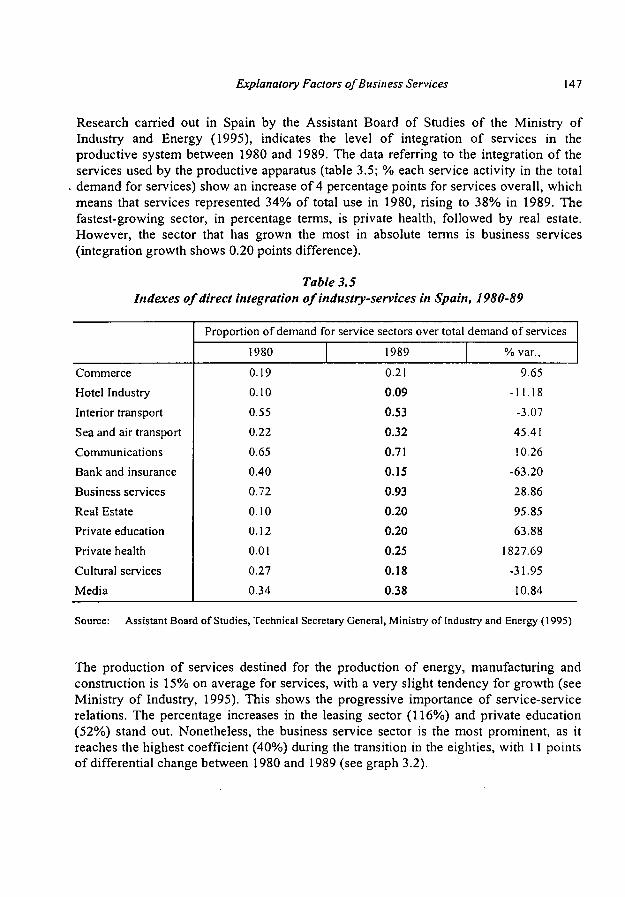
Explanatory Factors of Business Services 147
Research carried out in Spain by the Assistant Board of Studies of the Ministry of Industry and Energy (1995), indicates the level of integration of services in the productive system between 1980 and 1989. The data referring to the integration of the services used by the productive apparatus (table 3.5; % each service activity in the total demand for services) show an increase of 4 percentage points for services overall, which means that services represented 34% of total use in 1980, rising to 38% in 1989. The fastest-growing sector, in percentage terms, is private health, followed by real estate. However, the sector that has grown the most in absolute terms is business services (integration growth shows 0.20 points difference).
Table 3.5 Indexes of direct integration of industry-services in Spain, 1980-89
Commerce Hotel Industry
Interior transport
Sea and air transport
Communications
Bank and insurance
Business services
Real Estate
Private education
Private health
Cultural services
Media
Proportion of demand for service sectors over total demand of services
1980
0.19
0.10
0.55 0.22
0.65 0.40
0.72
0.10 0.12
0.01
0.27
0.34
1989
0.21
0.09
0.53
0.32
0.71
0.15
0.93
0.20 0.20
0.25
0.18
0.38
% var..
9.65
-1 1.18 -3.07
45.41
10.26
-63.20
28.86
95.85 63.88
1827.69
-31.95
10.84
Source: Assistant Board of Studies, Technical Secretary General, Ministry of Industry and Energy (1995)
The production of services destined for the production of energy, manufacturing and construction is 15% on average for services, with a very slight tendency for growth (see Ministry of Industry, 1995). This shows the progressive importance of service-service relations. The percentage increases in the leasing sector (116%) and private education (52%) stand out. Nonetheless, the business service sector is the most prominent, as it reaches the highest coefficient (40%) during the transition in the eighties, with 11 points of differential change between 1980 and 1989 (see graph 3.2).
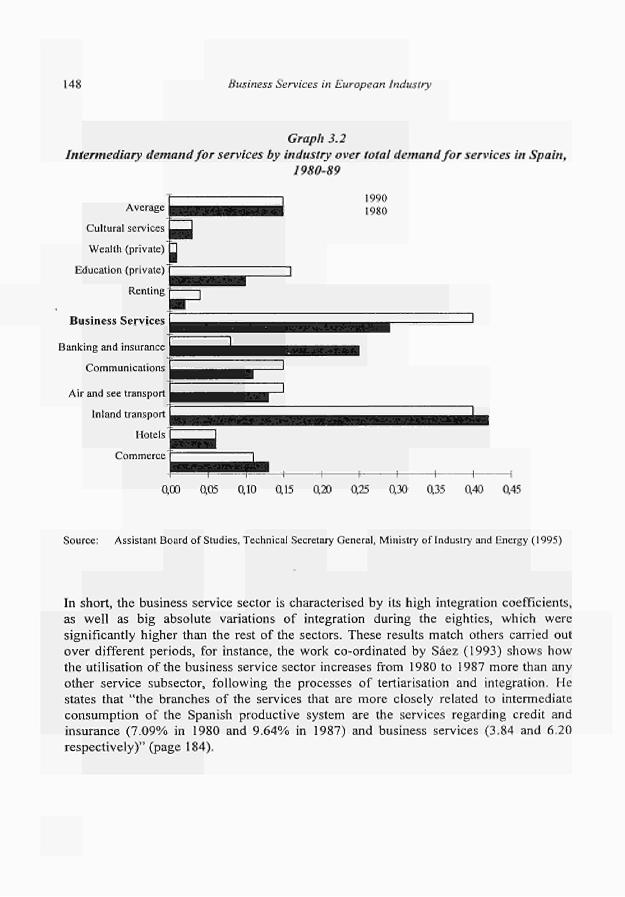
148 Business Services in European Industry
Graph 3.2 Intermediary demand for services by industry over total demand for services in Spain,
1980-89
Average
Cultural services
Wealth (private)
Education (private)
Renting
Business Services
Banking and insurance
Communications
Air and see transport
Inland transport
Hotels
Commerce
1990 1980
0,00 005 αίΟ 0,15 0,20 0,25
Source: Assistant Board of Studies, Technical Secretary General, Ministry of Industry and Energy (1995)
In short, the business service sector is characterised by its high integration coefficients, as well as big absolute variations of integration during the eighties, which were significantly higher than the rest of the sectors. These results match others carried out over different periods, for instance, the work co-ordinated by Sáez (1993) shows how the utilisation of the business service sector increases from 1980 to 1987 more than any other service subsector, following the processes of tertiarisation and integration. He states that "the branches of the services that are more closely related to intermediate consumption of the Spanish productive system are the services regarding credit and insurance (7.09% in 1980 and 9.64% in 1987) and business services (3.84 and 6.20 respectively)" (page 184).
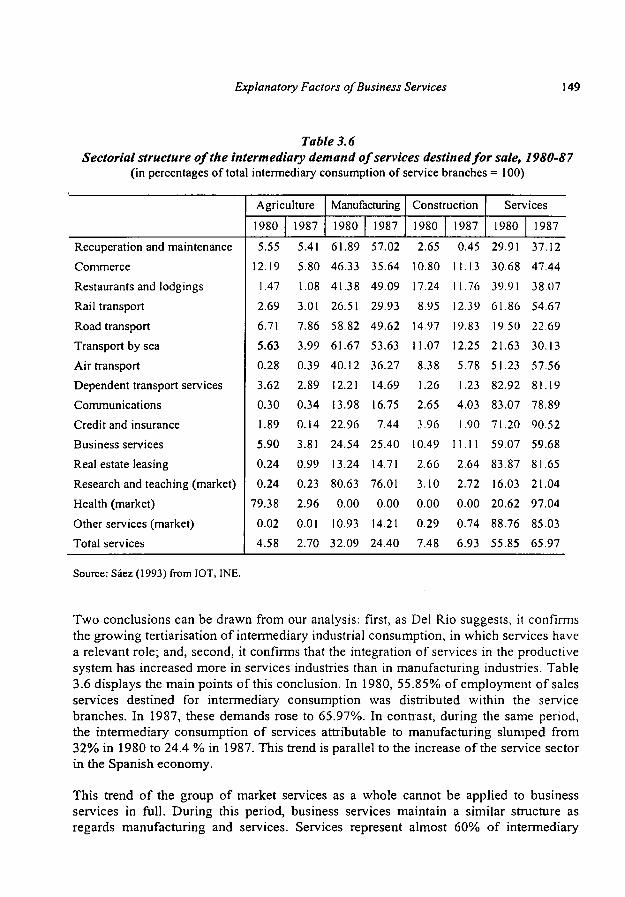
Explanatory Factors of Business Services 149
Table 3.6 Sectorial structure of the intermediary demand of services destined for sale, 1980-87
(in percentages of total intermediary consumption of service branches = 100)
Recuperation and maintenance
Commerce
Restaurants and lodgings
Rail transport
Road transport
Transport by sea
Air transport Dependent transport services
Communications
Credit and insurance
Business services
Real estate leasing Research and teaching (market)
Health (market)
Other services (market)
Total services
Agriculture
1980
5.55
12.19 1.47
2.69 6.71
5.63
0.28 3.62
0.30
1.89 5.90
0.24
0.24
79.38
0.02
4.58
1987
5.41
5.80
1.08 3.01
7.86
3.99
0.39
2.89 0.34 0.14
3.81
0.99
0.23
2.96
0.01
2.70
Manufacturing
1980
61.89
46.33
41.38
26.51
58.82 61.67
40.12
12.21
13.98 22.96
24.54
13.24
80.63
0.00
10.93
32.09
1987
57.02
35.64
49.09
29.93
49.62
53.63
36.27
14.69 16.75 7.44
25.40
14.71
76.01
0.00
14.21
24.40
Construction
1980
2.65
10.80
17.24
8.95 14.97
11.07
8.38 1.26
2.65 3.96
10.49
2.66
3.10
0.00
0.29
7.48
1987
0.45
11.13 1 1.76
12.39
19.83
12.25
5.78
1.23 4.03 1.90
11.11
2.64
2.72
0.00
0.74
6.93
Services
1980
29.91 30.68
39.91
61.86
19.50
21.63
51.23 82.92
83.07 71.20
59.07
83.87
16.03 20.62
88.76
55.85
1987
37.12 47.44
38.07
54.67
22.69
30.13 57.56
81.19 78.89
90.52 59.68
81.65 21.04
97.04
85.03 65.97
Source: Sáez (1993) from IOT, INE.
Two conclusions can be drawn from our analysis: first, as Del Rio suggests, it confirms the growing tertiarisation of intermediary industrial consumption, in which services have a relevant role; and, second, it confirms that the integration of services in the productive system has increased more in services industries than in manufacturing industries. Table 3.6 displays the main points of this conclusion. In 1980, 55.85% of employment of sales services destined for intermediary consumption was distributed within the service branches. In 1987, these demands rose to 65.97%. In contrast, during the same period, the intermediary consumption of services attributable to manufacturing slumped from 32% in 1980 to 24.4 % in 1987. This trend is parallel to the increase of the service sector in the Spanish economy.
This trend of the group of market services as a whole cannot be applied to business services in full. During this period, business services maintain a similar structure as regards manufacturing and services. Services represent almost 60% of intermediary
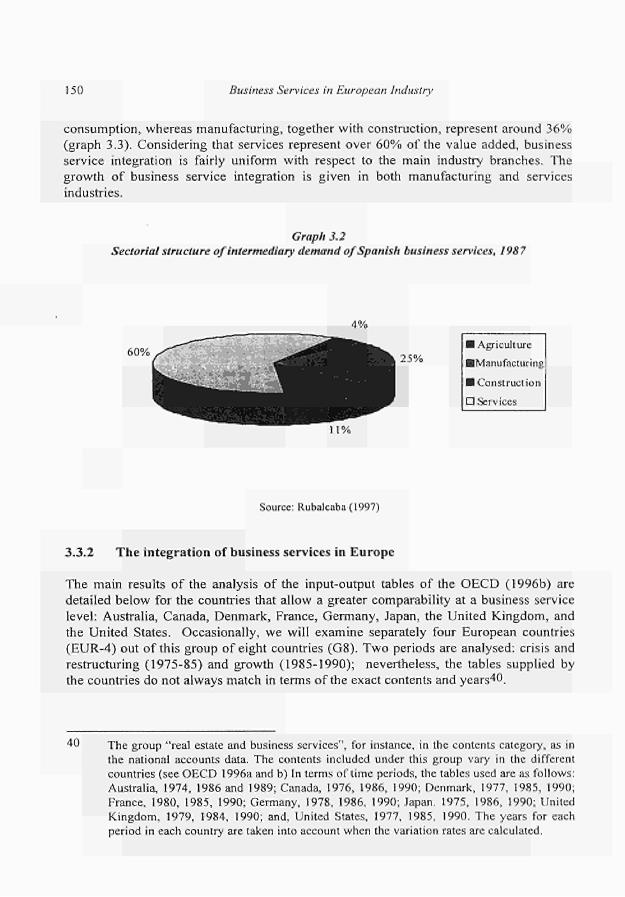
150 Business Services in European Industry
consumption, whereas manufacturing, together with construction, represent around 36%
(graph 3.3). Considering that services represent over 60% of the value added, business
service integration is fairly uniform with respect to the main industry branches. The
growth of business service integration is given in both manufacturing and services
industries.
Graph 3.2 Sectorial structure of intermediary demand of Spanish business services, 1987
4%
Agriculture 60%
25% ■ Manufacturing
■ Construction
D Services
11%
Source: Rubalcaba (1997)
3.3.2 The integration of business services in Europe
The main results of the analysis of the input-output tables of the OECD (1996b) are
detailed below for the countries that allow a greater comparability at a business service
level: Australia, Canada, Denmark, France, Germany, Japan, the United Kingdom, and
the United States. Occasionally, we will examine separately four European countries
(EUR-4) out of this group of eight countries (G8). Two periods are analysed: crisis and
restructuring (1975-85) and growth (1985-1990); nevertheless, the tables supplied by
the countries do not always match in terms of the exact contents and years40.
40 The group "real estate and business services", for instance, in the contents category, as in the national accounts data. The contents included under this group vary in the different countries (see OECD 1996a and b) In terms of time periods, the tables used are as follows: Australia, 1974, 1986 and 1989; Canada, 1976, 1986, 1990; Denmark, 1977, 1985, 1990; France, 1980, 1985, 1990; Germany, 1978, 1986, 1990; Japan. 1975, 1986, 1990; United Kingdom, 1979, 1984, 1990; and, United States, 1977, 1985, 1990. The years for each period in each country are taken into account when the variation rates are calculated.
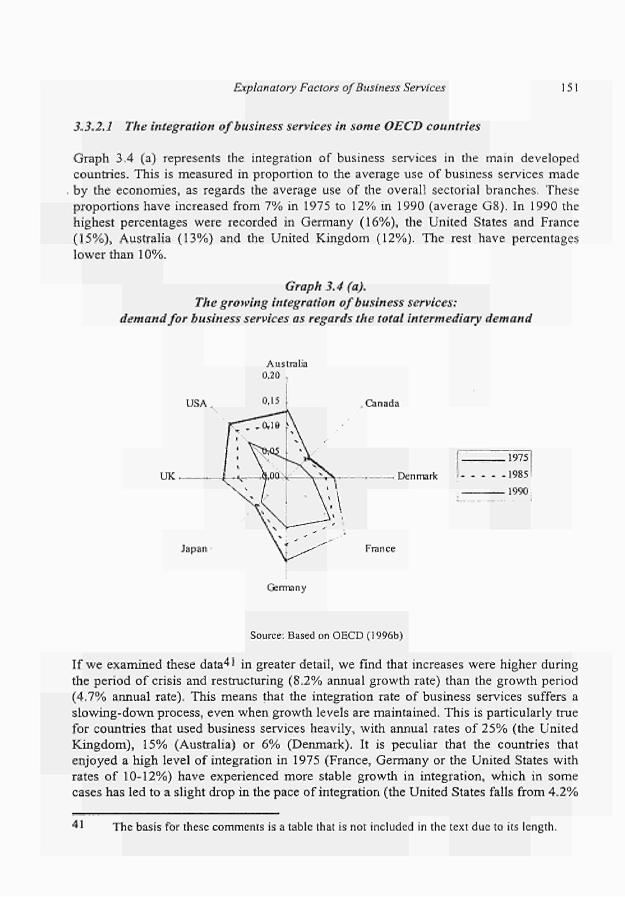
Explanatory Factors of Business Services 151
3.3.2.1 The integration of business services in some OECD countries
Graph 3.4 (a) represents the integration of business services in the main developed countries. This is measured in proportion to the average use of business services made by the economies, as regards the average use of the overall sectorial branches. These proportions have increased from 7% in 1975 to 12% in 1990 (average G8). In 1990 the highest percentages were recorded in Germany (16%), the United States and France (15%), Australia (13%) and the United Kingdom (12%). The rest have percentages lower than 10%.
Graph 3.4 (a). The growing integration of business services:
demand for business services as regards the total intermediary demand
Australia 0,20
Canada
UK. Denmark
.1975
.1985 1990
France
Germany
Source: Based on OECD (1996b)
If we examined these dataci in greater detail, we find that increases were higher during the period of crisis and restructuring (8.2% annual growth rate) than the growth period (4.7% annual rate). This means that the integration rate of business services suffers a slowing-down process, even when growth levels are maintained. This is particularly true for countries that used business services heavily, with annual rates of 25% (the United Kingdom), 15% (Australia) or 6% (Denmark). It is peculiar that the countries that enjoyed a high level of integration in 1975 (France, Germany or the United States with rates of 10-12%) have experienced more stable growth in integration, which in some cases has led to a slight drop in the pace of integration (the United States falls from 4.2%
41 The basis for these comments is a table that is not included in the text due to its length.
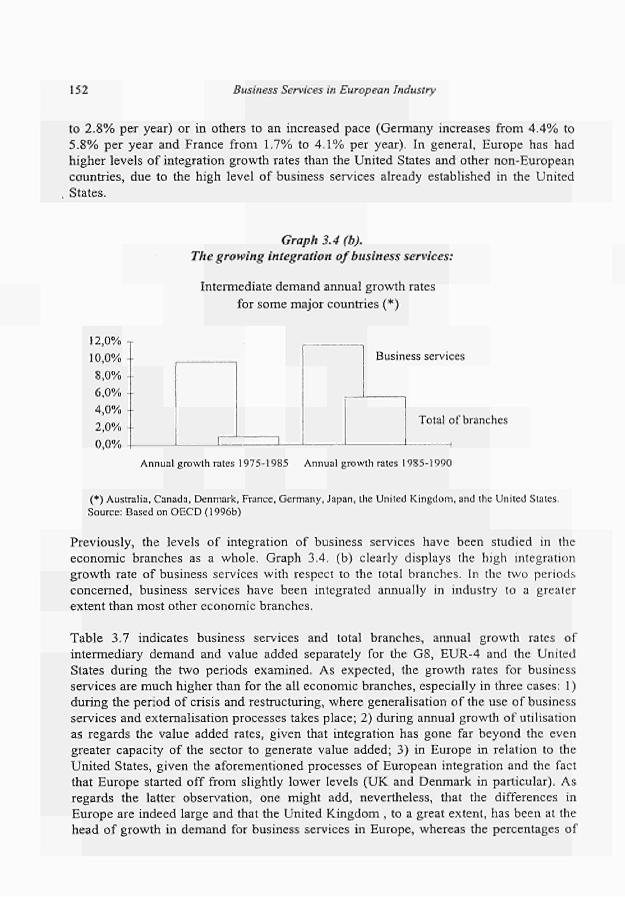
152 Business Services in European Industry
to 2.8% per year) or in others to an increased pace (Germany increases from 4.4% to 5.8% per year and France from 1.7% to 4.1% per year). In general, Europe has had higher levels of integration growth rates than the United States and other non-European countries, due to the high level of business services already established in the United States.
Graph 3.4 (b). The growing integration of business services:
12,0% 10,0% 8,0% 6,0% -4,0% 2,0% 4 0,0%
Intermediate demand annual growth rates for some major countries (*)
Business services
Total of branches
Annual growth rates 1975-1985 Annual growth rates 1985-1990
(*) Australia, Canada, Denmark, France, Germany, Japan, the United Kingdom, and the United States. Source: Based on OECD (1996b)
Previously, the levels of integration of business services have been studied in the economic branches as a whole. Graph 3.4. (b) clearly displays the high integration growth rate of business services with respect to the total branches. In the two periods concerned, business services have been integrated annually in industry to a greater extent than most other economic branches.
Table 3.7 indicates business services and total branches, annual growth rates of intermediary demand and value added separately for the G8, EUR-4 and the United States during the two periods examined. As expected, the growth rates for business services are much higher than for the all economic branches, especially in three cases: 1) during the period of crisis and restructuring, where generalisation of the use of business services and externalisation processes takes place; 2) during annual growth of utilisation as regards the value added rates, given that integration has gone far beyond the even greater capacity of the sector to generate value added; 3) in Europe in relation to the United States, given the aforementioned processes of European integration and the fact that Europe started off from slightly lower levels (UK and Denmark in particular). As regards the latter observation, one might add, nevertheless, that the differences in Europe are indeed large and that the United Kingdom , to a great extent, has been at the head of growth in demand for business services in Europe, whereas the percentages of
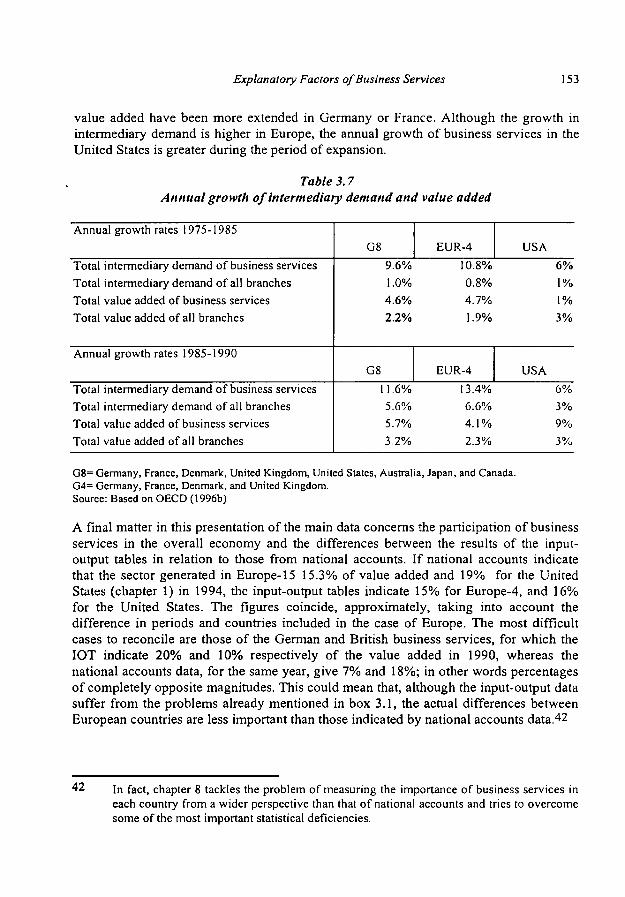
Explanatory Factors of Business Services 153
value added have been more extended in Germany or France. Although the growth in intermediary demand is higher in Europe, the annual growth of business services in the United States is greater during the period of expansion.
Table 3.7 Annual growth of intermediary demand and value added
Annual growth rates 1975-1985
Total intermediary demand of business services Total intermediary demand of all branches Total value added of business services Total value added of all branches
Annual growth rates 1985-1990
Total intermediary demand of business services Total intermediary demand of all branches Total value added of business services Total value added of all branches
G8 9.6% 1.0% 4.6% 2.2%
G8 11.6% 5.6% 5.7% 3.2%
EUR-4 10.8% 0.8% 4.7% 1.9%
EUR-4 13.4% 6.6% 4.1% 2.3%
USA
USA
6% 1% 1% 3%
6% 3% 9% 3%
G8= Germany, France, Denmark, United Kingdom, United States, Australia, Japan, and Canada. G4= Germany, France, Denmark, and United Kingdom. Source: Based on OECD (1996b)
A final matter in this presentation of the main data concerns the participation of business services in the overall economy and the differences between the results of the input-output tables in relation to those from national accounts. If national accounts indicate that the sector generated in Europe-15 15.3% of value added and 19% for the United States (chapter 1) in 1994, the input-output tables indicate 15% for Europe-4, and 16% for the United States. The figures coincide, approximately, taking into account the difference in periods and countries included in the case of Europe. The most difficult cases to reconcile are those of the German and British business services, for which the IOT indicate 20% and 10% respectively of the value added in 1990, whereas the national accounts data, for the same year, give 7% and 18%; in other words percentages of completely opposite magnitudes. This could mean that, although the input-output data suffer from the problems already mentioned in box 3.1, the actual differences between European countries are less important than those indicated by national accounts data.42
42 in fact, chapter 8 tackles the problem of measuring the importance of business services in each country from a wider perspective than that of national accounts and tries to overcome some of the most important statistical deficiencies.
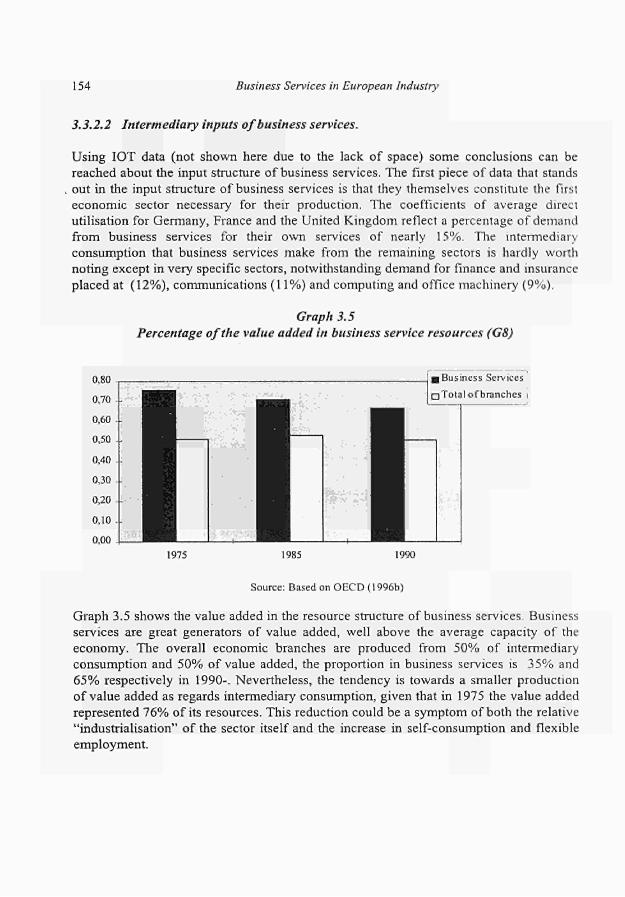
154 Business Services in European Industry
3.3.2.2 Intermediary inputs of business services.
Using IOT data (not shown here due to the lack of space) some conclusions can be reached about the input structure of business services. The first piece of data that stands out in the input structure of business services is that they themselves constitute the first economic sector necessary for their production. The coefficients of average direct utilisation for Germany, France and the United Kingdom reflect a percentage of demand from business services for their own services of nearly 15%. The intermediary consumption that business services make from the remaining sectors is hardly worth noting except in very specific sectors, notwithstanding demand for finance and insurance placed at (12%), communications (11%) and computing and office machinery (9%).
Graph 3.5 Percentage of the value added in business service resources (G8)
1975 1985 1990
Source: Based on OECD (1996b)
Graph 3.5 shows the value added in the resource structure of business services. Business services are great generators of value added, well above the average capacity of the economy. The overall economic branches are produced from 50% of intermediary consumption and 50% of value added, the proportion in business services is 3 5 % and 6 5 % respectively in 1990-. Nevertheless, the tendency is towards a smaller production of value added as regards intermediary consumption, given that in 1975 the value added represented 7 6 % of its resources. This reduction could be a symptom of both the relative "industrialisation" of the sector itself and the increase in self-consumption and flexible employment.
Explanatory Factors of Business Services 155
3.3.2.3 Output of business services: customer sectors
Graph 3.6 shows the principal economic sectors and the average use of business services by the remainder of the sectors in Germany, Denmark, France and the United Kingdom. The rate of usage has been divided into three large groups according to the levels of utilisation made by business services in 1990. Three groups can be identified:
1. Sectors with a high rate of use of business services, or those sectors thai subcontract more than 7% of their total output to business services. This group is mainly made up of other service sectors. To be more precise, the sectors in which the highest demand for business services is found include the business service sector itself (12%) and, above all, the finance and insurance sector (15.6%). Consulting, advertising, market research, operations, and auxiliary financial business services are, among others, the main business services providers of the finance sector. Other services such as wholesale trade (8.5%) and transport companies are also prominent. Moreover, the construction sector (11%) has positioned itself as the sector with the highest demand from the manufacturing branches, chiefly due to the use which it makes of architecture and engineering services as well as building . The stationery and computer sector (9.8%) also figures as a regular customer.
2. A heterogeneous group is formed by the sectors whose demand for business services reaches an average level. On one hand, parts of the service sector such as restaurants and hotels (7.3%), as well as transport and storage (5.6%) and personal, social and community services (5.1%). On the other hand, sectors requiring a high level of technical qualifications such as aircraft, shipbuilding and repair, medicine, and the manufacture of radio and television components. These are mainly linked to the more technical and specialised consulting services such as engineering, research and development and others.
3. The group of sectors that makes the least use of business services comprises the more traditional manufacturing sectors and those related to agriculture, in addition to mining and metal products. However, some service sectors such as communications (3.3%) can also be found.
Analysis of the temporal evolution of the integration of business services discloses a number of interesting points. As it can be observed in graph 3.6, the demand for business services has increased in almost every sector. This fact confirms its strong expansion and interrelation with other sectors. Spectacular growth is registered in sectors such as paper and printing, non-electrical machinery, finance, construction and business services, although the average of all of the sectors is high enough (9.6% annually between 1975-1985 and 11.6% annually between 1985-1990) to illustrate the
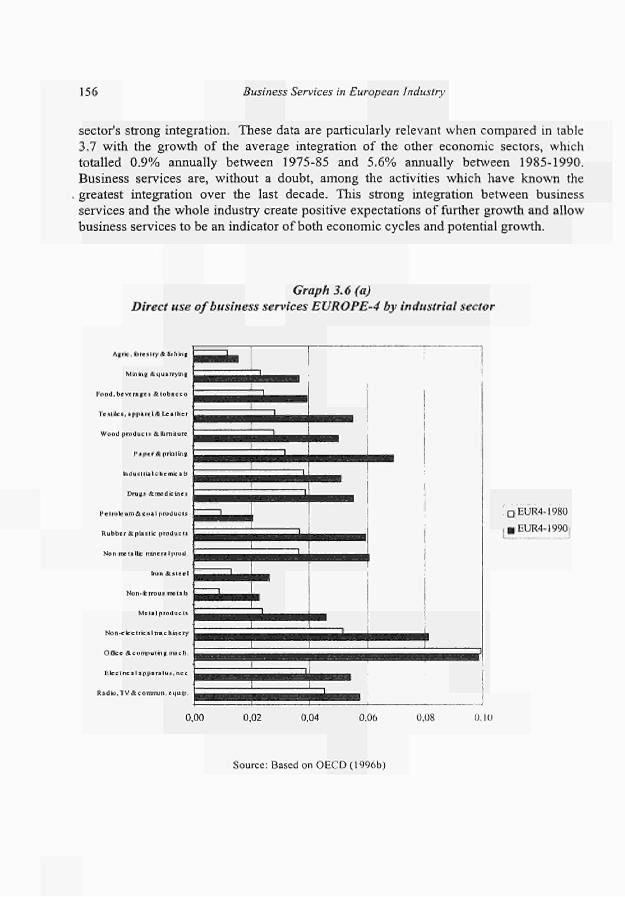
156 Business Services in European Industry
sector's strong integration. These data are particularly relevant when compared in table
3.7 with the growth of the average integration of the other economic sectors, which
totalled 0.9% annually between 197585 and 5.6% annually between 19851990.
Business services are, without a doubt, among the activities which have known the
greatest integration over the last decade. This strong integration between business
services and the whole industry create positive expectations of further growth and allow
business services to be an indicator of both economic cycles and potential growth.
Graph 3.6 (a)
Direct use of business services EUROPE4 by industrial sector
Agrie, b res i ry&f i ih ing
Mining & quarrying
Food ,beve r i ge t & l o b i c c o
Textiles, appa re I & Let t r ic i
Wood p r o d u c i i & Burniture
P i p e r Aprinting
h d u s l r u l c h c r r u c a Is
Drugs £ medic mes
Ρ c Iro le um & c ο ι I p roduc ts
Rubber Aplas t ic p roduc ts
Non metallic minera I prod.
Iron Λ: isle« I
Nonferrous metals
Metal products
None k c inc i l na c h tn e ry
Office & computing mach
Electr ical a p p a r a t u s . n e e
Ra diu, TV & commun, equip .
ι ™ *
I
I
r w T w ,
lii ■ Γ
ι
I ι
□ EUR41980
iBEUR41990|
0,00 0,02 0,04 0,06 0,08 0.10
Source: Based on OECD (1996b)
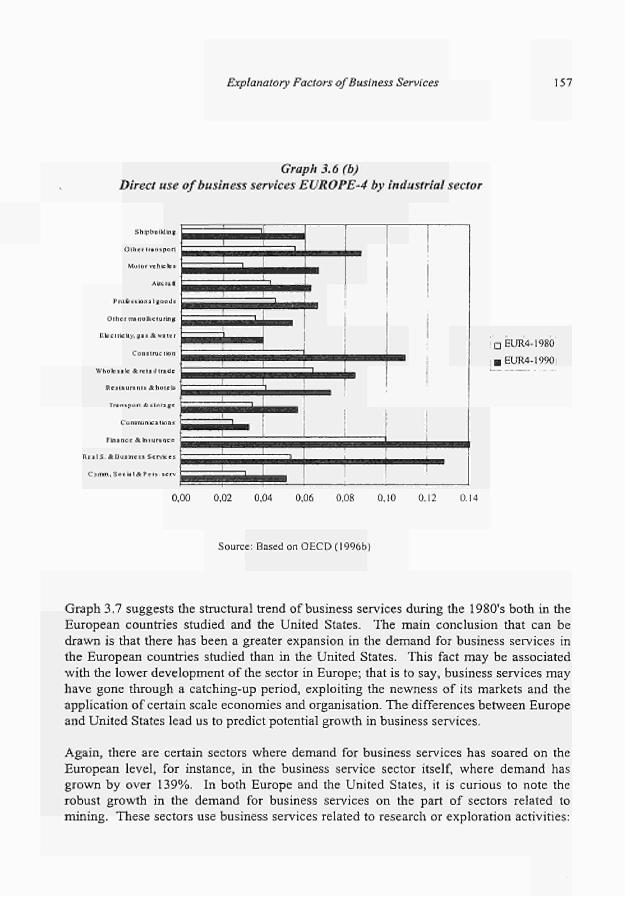
Explanatory Factors of Business Services 157
Graph 3.6(b)
Direct use of business services EUROPE-4 by industrial sector
Shipbuilding
Other transpon
Motor vehicles
Aire ral
Professional goods
Other manufacturing
Electricity, gas & water
Construction
Wholesale ¿retailtrade
Restaurants & lunets
Transport Asloragc
Communie a lion s
Finance Λ Insurance
RealS. AOus ine ss Services
C i u m , SocialAPcrs.serv
DEUR41980
;BEUR41990l
0,00 0,02 0,04 0,06 0,08 0,10 0.12 0.14
Source: Based on OECD (1996b)
Graph 3.7 suggests the structural trend of business services during the 1980's both in the
European countries studied and the United States. The main conclusion that can be
drawn is that there has been a greater expansion in the demand for business services in
the European countries studied than in the United States. This fact may be associated
with the lower development of the sector in Europe; that is to say, business services may
have gone through a catchingup period, exploiting the newness of its markets and the
application of certain scale economies and organisation. The differences between Europe
and United States lead us to predict potential growth in business services.
Again, there are certain sectors where demand for business services has soared on the
European level, for instance, in the business service sector itself, where demand has
grown by over 139%. In both Europe and the United States, it is curious to note the
robust growth in the demand for business services on the part of sectors related to
mining. These sectors use business services related to research or exploration activities:
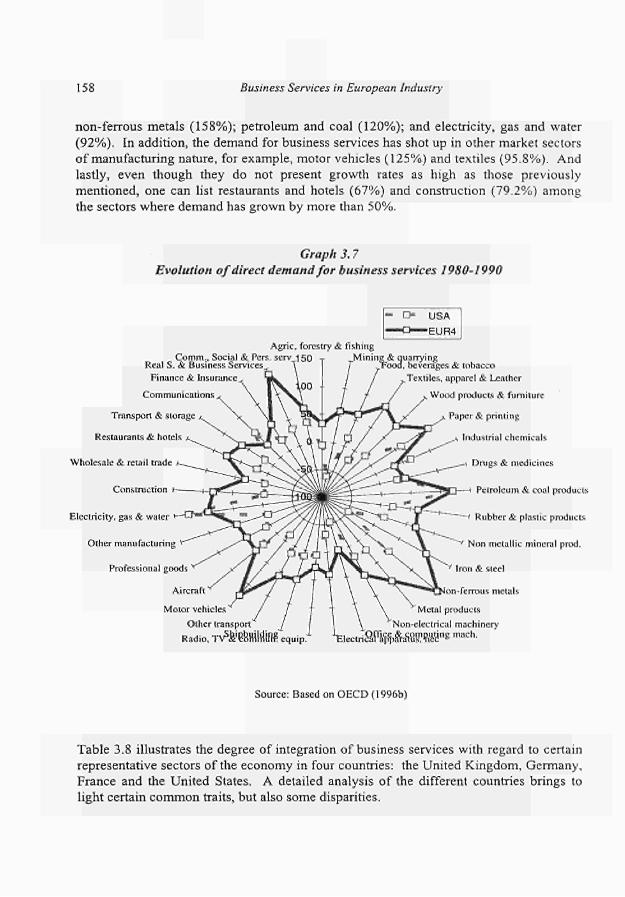
158 Business Services in European Industry
nonferrous metals (158%); petroleum and coal (120%); and electricity, gas and water
(92%). In addition, the demand for business services has shot up in other market sectors
of manufacturing nature, for example, motor vehicles (125%) and textiles (95.8%). And
lastly, even though they do not present growth rates as high as those previously
mentioned, one can list restaurants and hotels (67%) and construction (79.2%) among
the sectors where demand has grown by more than 50%.
Graph 3.7
Evolution of direct demand for business services 19801990
■ O USA
— O — E U R 4
Comm., Social & Pers. serv 150 Real S. & Business Services
Agrie, forestry & fishing
Mining & quarrying
Finance & Insurance
Communications
Transport & storage
Restaurants & hotels
Wholesale & retail trade
Construction
Electricity, gas & water
Other manufacturing
Professional goods
Aircraft
Motor vehicles
Other transport
Radio, Τλ^βΑυΗ?
beverages & tobacco
Textiles, apparel & Leather
Wood products & furniture
Paper & printing
Industrial chemicals
Dmgs & medicines
Petroleum & coal products
Rubber & plastic products
Non metallic mineral prod.
Iron & steel
onferrous metals
equip
Metal products
Nonelectrical machinery
lectríâflíípáráaSJIn^e mach·
Source: Based on OECD (1996b)
Table 3.8 illustrates the degree of integration of business services with regard to certain
representative sectors of the economy in four countries: the United Kingdom, Germany,
France and the United States. A detailed analysis of the different countries brings to
light certain common traits, but also some disparities.
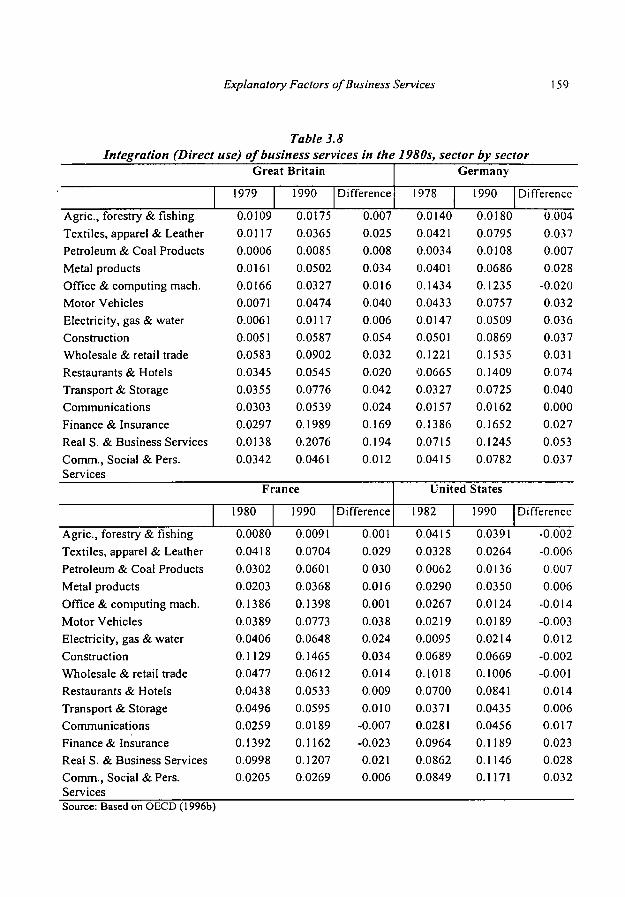
Explanatory Factors of Business Services 159
Integration (Direct Table 3.8
use) of business services in the 1980s, sector by sector Great Britain
Agrie, forestry & fishing Textiles, apparel & Leather Petroleum & Coal Products Metal products Office & computing mach. Motor Vehicles Electricity, gas & water Construction Wholesale & retail trade Restaurants & Hotels Transport & Storage Communications Finance & Insurance Real S. & Business Services Comm., Social & Pers. Services
1979
0.0109 0.0117 0.0006 0.0161 0.0166 0.0071 0.0061 0.0051 0.0583 0.0345 0.0355 0.0303 0.0297 0.0138 0.0342
1990
0.0175 0.0365 0.0085 0.0502 0.0327 0.0474 0.0117 0.0587 0.0902 0.0545 0.0776 0.0539 0.1989 0.2076 0.0461
Difference
0.007 0.025 0.008 0.034 0.016 0.040 0.006 0.054 0.032 0.020 0.042 0.024 0.169 0.194 0.012
France
Agrie, forestry & fishing Textiles, apparel & Leather Petroleum & Coal Products Metal products Office & computing mach. Motor Vehicles Electricity, gas & water Construction Wholesale & retail trade Restaurants & Hotels Transport & Storage Communications Finance & Insurance Real S. & Business Services Comm., Social & Pers. Services
1980
0.0080 0.0418 0.0302 0.0203 0.1386 0.0389 0.0406 0.1129 0.0477 0.0438 0.0496 0.0259 0.1392 0.0998 0.0205
1990
0.0091 0.0704 0.0601 0.0368 0.1398 0.0773 0.0648 0.1465 0.0612 0.0533 0.0595 0.0189 0.1162 0.1207 0.0269
Difference
0.001 0.029 0.030 0.016 0.001 0.038 0.024 0.034 0.014 0.009 0.010
-0.007 -0.023 0.021 0.006
Germany
1978
0.0140 0.0421 0.0034 0.0401 0.1434 0.0433 0.0147 0.0501 0.1221 0.0665 0.0327 0.0157 0.1386 0.0715 0.0415
1990
0.0180 0.0795 0.0108 0.0686 0.1235 0.0757 0.0509 0.0869 0.1535 0.1409 0.0725 0.0162 0.1652 0.1245 0.0782
Difference
0.004 0.037 0.007 0.028
-0.020 0.032 0.036 0.037 0.031 0.074 0.040 0.000 0.027 0.053 0.037
United States
1982
0.0415 0.0328 0.0062 0.0290 0.0267 0.0219 0.0095 0.0689 0.1018 0.0700 0.0371 0.0281 0.0964 0.0862 0.0849
1990
0.0391 0.0264 0.0136 0.0350 0.0124 0.0189 0.0214 0.0669 0.1006 0.0841 0.0435 0.0456 0.1189 0.1146 0.1171
Difference
-0.002 -0.006 0.007 0.006
-0.014 -0.003 0.012
-0.002 -0.001 0.014 0.006 0.017 0.023 0.028 0.032
Source: Based on OECD (1996b)
160 Business Services in European Industry
In the United Kingdom the degree of integration of business services in the wholesale trade sector stands out. However, it is also particularly marked in the finance and insurance sectors, as well as in business services themselves, which have an average demand level of around 20%. This level is appreciably higher than in the other countries analysed. In terms of change, these last two sectors are also those which made the greatest use of business services, over other countries that started from a higher level. In general, the chief demand for this sector can be found in the service sector and its integration with the manufacturing sector is less than in other countries.
Germany offers a different structure from the British one. Finance, insurance and business services themselves figure among the main sectors of demand. However, the use made by wholesalers, restaurants and hotels reaches levels similar to and even higher than those of the three sectors mentioned above. Unlike the case of Britain, Germany's business services are notably amalgamated with the manufacturing industry, this is comparable to the case of France. Demand in administration and IT equipment sectors is outstanding, although it has lessened in relation to the first period. The construction sector, in contrast, has followed the opposite trend.
Of the four countries, France displays a lower degree of integration with the service sectors, but it manifests the strongest ties to manufacturers. As in the other countries, demand on the part of business services reaches relatively high levels. Nevertheless, demand in the rest of the service sector is below 5% and in some (communications, finance and insurance) integration has even fallen. On the other hand, demand in some manufacturing sectors such as construction, offices and computing equipment is actually greater than in services.
The case of the United States is similar to Germany in its high degree of integration with the service sector, and similar to the United Kingdom in its relatively low integration with the manufacturing sector. Except in transport and communications the average demand for business services by the remainder of the services is around or greater than 10%. Nevertheless, average demand levels in the manufacturing sector are less than 4% excepting construction, whose levels decreased during the 1980s. This predominance of the USA business services with services with respect to manufacturing can be explained by the fact that American services employ more than 70% of employment and value added.
In conclusion, it can be confirmed that the integration of business services is important in all of the countries both within its own sector and other industrial sectors. Although integration with the manufacturing sector is considerable, it is even more significant in other service sectors. This result, and the one confirming the extensive use of business services by business services themselves, is coherent with other input-output studies like the one carried out in The Netherlands (Manshanden et alt., 1997).
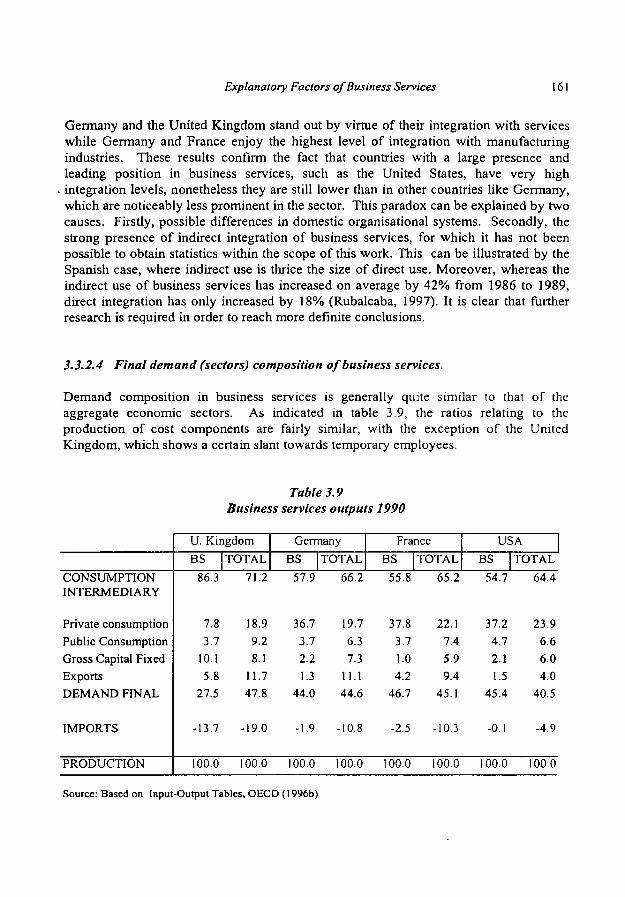
Explanatory Factors of Business Services 161
Germany and the United Kingdom stand out by virtue of their integration with services while Germany and France enjoy the highest level of integration with manufacturing industries. These results confirm the fact that countries with a large presence and leading position in business services, such as the United States, have very high integration levels, nonetheless they are still lower than in other countries like Germany, which are noticeably less prominent in the sector. This paradox can be explained by two causes. Firstly, possible differences in domestic organisational systems. Secondly, the strong presence of indirect integration of business services, for which it has not been possible to obtain statistics within the scope of this work. This can be illustrated by the Spanish case, where indirect use is thrice the size of direct use. Moreover, whereas the indirect use of business services has increased on average by 42% from 1986 to 1989, direct integration has only increased by 18% (Rubalcaba, 1997). It is clear that further research is required in order to reach more definite conclusions.
3.3.2.4 Final demand (sectors) composition of business services.
Demand composition in business services is generally quite similar to that of the aggregate economic sectors. As indicated in table 3.9, the ratios relating to the production of cost components are fairly similar, with the exception of the United Kingdom, which shows a certain slant towards temporary employees.
Table 3.9 Business services outputs 1990
CONSUMPTION INTERMEDIARY
Private consumption Public Consumption Gross Capital Fixed Exports DEMAND FINAL
IMPORTS
PRODUCTION
U. Kingdom BS
86.3
7.8 3.7
10.1 5.8
27.5
-13.7
100.0
TOTAL 71.2
18.9 9.2 8.1
11.7 47.8
-19.0
100.0
Germany BS TOTAL
57.9 66.2
36.7 19.7 3.7 6.3 2.2 7.3 1.3 11.1
44.0 44.6
-1.9 -10.8
100.0 100.0
France BS TOTAL
55.8 65.2
37.8 22.1 3.7 7.4 1.0 5.9 4.2 9.4
46.7 45.1
-2.5 -10.3
100.0 100.0
USA BS TOTAL
54.7 64.4
37.2 23.9 4.7 6.6 2.1 6.0 1.5 4.0
45.4 40.5
-0.1 -4.9
100.0 100.0
Source: Based on Input-Output Tables, OECD (1996b)

162 Business Services in European Industry
In the cases of Germany, France and The United States the share of intermediate consumption of business services is generally smaller than that of the aggregate sectors (around ten percentage points). The opposite is true in the United Kingdom, where intermediate consumption of business services is comparatively much higher than in the rest of the economy. This signals the high degree of integration of British business services. Consequently, the percentage of final demand for business services is similar to that of the aggregate sectors, except in the case of the United Kingdom. The highest section of final demand is private consumption. This is due to the dual nature of consumer services of many business services. The United Kingdom also stands out here because of the importance of its fixed capital consumption.
Explanatory Factors of Business Services 163
3.4 Business services and the business cycle
After exploring the underlying causes that substantiate the growth of business services and its functions in the economy, the degree to which the sector has been integrated in Western economies is confirmed. The solid position of business services in the European economies can also be approached by analysing the economic cycle. As growth in the seventies and the eighties has followed textbook predictions to the letter, we must now ask how performance has been affected during the recent crisis of the 1990s. We can test the robustaess of business services by checking whether growth-rates for the sector are consistently higher than those of the rest of the economy, even during periods of recession. Their structural growth should rise above the cyclical oscillations to which some cyclical and dispensable sectors are subject.
The growth of business services during the eighties is obviously related to demand. It is evident that the current rise in spending has facilitated expansion of the use of business services in all of the countries. The late 1980s saw a greater need for intermediary services emerge due to the following factors:
1 The need for information in markets. The Single Market and internationalisation processes in the market stimulated the consultation of advanced services either to facilitate access to markets or to arm oneself against the pressures of the competition. Consulting, market research, fairs and exhibitions, public relations and export assistance, in particular, register high levels of growth. At the same time, standardised services are subcontracted in order to concentrate harder on future changing processes.
2 Concentrating on and attending to new business groups. In the 1980s two phenomena were commonplace: the first includes purchases, mergers, acquisitions and joint-ventures and the second involves the establishment and acceptance of the logic of collabora tory networks among companies. The growing concentration of the market created a climate of competition and short-term instability, while at the same time the complexity of the internal organisation of the new groups increased. Advanced services were once again utilised in order to carry out decision-making processes (management consulting, legal services, accounting and auditing, market research, public relations) or work in the new groups (e.g. language services, courier services, advertising).
3 Consolidation and development. Once the new manufacturing landscape had undergone an important change, this new position had to be consolidated urgently. From this overriding need arose the large-scale search for the consumer (advertising, direct marketing, fairs, market research); improvement of production processes (staff training, engineering, design, R&D, inspection and control); and the facilities and ways of doing things that enhance a company's image and boost the quality of central services while reducing costs (leasing, security, industrial cleaning, temporary help).
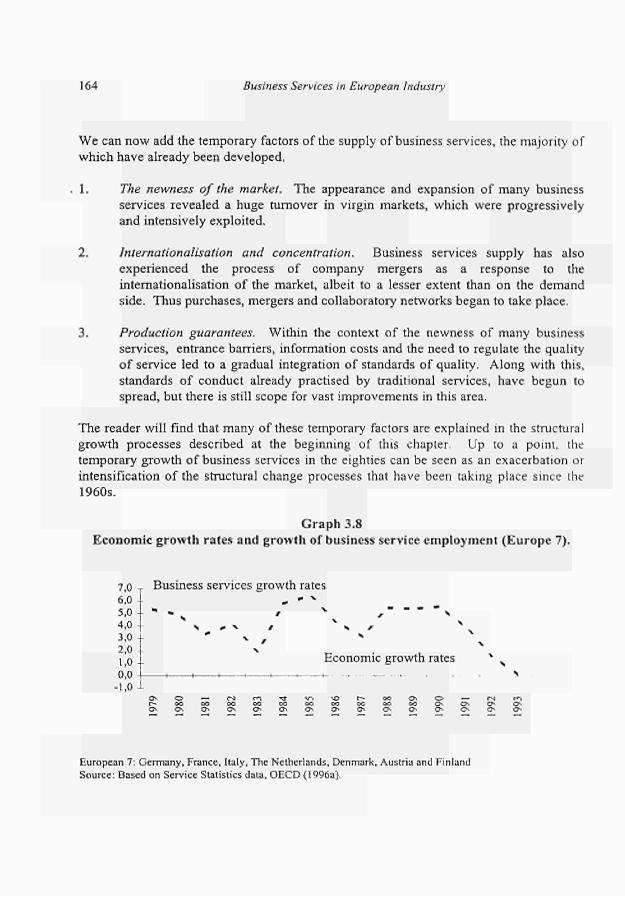
164 Business Services in European Industry
We can now add the temporary factors of the supply of business services, the majority of
which have already been developed.
1. The newness of the market. The appearance and expansion of many business
services revealed a huge turnover in virgin markets, which were progressively
and intensively exploited.
2. Internationalisation and concentration. Business services supply has also
experienced the process of company mergers as a response to the
internationalisation of the market, albeit to a lesser extent than on the demand
side. Thus purchases, mergers and collaboratory networks began to take place.
3. Production guarantees. Within the context of the newness of many business
services, entrance barriers, information costs and the need to regulate the quality
of service led to a gradual integration of standards of quality. Along with this,
standards of conduct already practised by traditional services, have begun to
spread, but there is still scope for vast improvements in this area.
The reader will find that many of these temporary factors are explained in the structural
growth processes described at the beginning of this chapter. Up to a point, the
temporary growth of business services in the eighties can be seen as an exacerbation or
intensification of the structural change processes that have been taking place since the
1960s.
Graph 3.8
Economic growth rates and growth of business service employment (Europe 7).
7,0 -
6,0
5,0 -
4,0 -
3,0 -
2,0 -
1,0 -
0 0
■1,0 -
. Business services growth
«
Os r~ Os
S »i A. i
o — o i m r t oo oo oo oo oo ON ON ON ON ON
rates » ·ν
OO Os
, 's
Economie growth rates Λ
\ 0 t > OO ON O — fN OO OO OO OO ON ON ON ON ON ON ON ON ON ON
s
ON
cr
European 7: Germany, France, Italy, The Netherlands, Denmark, Austria and Finland Source: Based on Service Statistics data, OECD (1996a).

Explanatory Factors of Busin ess Services 16 5
If it is possible to identify a temporary element in the expansion of the 1980s, in the nineties it should be possible to isolate an element of decrease, reflecting the crisis between 1990-1993. Graph 3.8 plots the most recent time progression available based on OECD data (1996a). According to the graph, employment growth in business
, services exceeded value added growth of the overall economy, particularly during the eighties expansion phases. This economic growth contributed to the sector's capacity for creating employment. During the recent economic recession there were job losses, but at a slower rate than the economic decline, which suggests that business services behave quite pro-cyclical in expansion phases but not so pro-cyclical in recession phases.
In the next two sections we will take two steps in order to identify more closely the relationship between business services and the economic cycle. First, a macroeconomic approach will be used to separate cyclical short-term growth from the structural long-term one. Starting with the theories applied to the relationship between services and cycle, a Hodrick-Prescott filter will be used for some countries with available data (OECD, 1996a, group 3.3) to verify which component is more important in business service growth. Second, some business services activities and several significant countries will be analysed in detail, using private data from the Panorama of the EU Industry.
3.4.1 A macroeconomic distinction between short-term and long-term growth
The growing concentration of employment in services has been considered as a stabilising factor against economic fluctuations, at least in the comparisons drawn on economic cycles, before and after the Second World War (Zarnowitz and Moore, 1986). Traditionally, services have been considered to be less sensitive to cyclical fluctuations than agriculture and manufacturing.
There are numerous factors underlying the stabilising part services play. The reasons for the tempering, or even anti-cyclical behaviour of some of the tertiary activities have been analysed and summarised by many authors (Elfring, 1988; Cuadrado and del Rio, 1993; Lee, 1996; Filardo, 1997; Petersen and Strongin, 1996). Demand factors, like the composition of the demand itself (i.e. a higher intensity in the formation of capital, the most volatile component of the GDP, will give rise to wider fluctuations), the sector's relationship with the rest of the activities (a high degree of integration with the industry will lead to a higher volatility) and the product characteristics (a high stock capacity normally produces higher variations) play an important role. Job market characteristics (lower or higher rates of temporality in the sector), and the qualification of the workers (higher qualifications produce a high degree of labour hoarding and less fluctuations) also have an influence on the fluctuation rate of the sector. Other factors that can be underlined are the lower or higher exposure to international competition, the degree of inflexibility of the sector and the part played by the Public Administration. This last factor has been important in the countries where the Welfare State is well established, and has been used, on many occasions, as the stabilising element for social, economic and political instability. However, the anti-cyclical part played by the State seems to
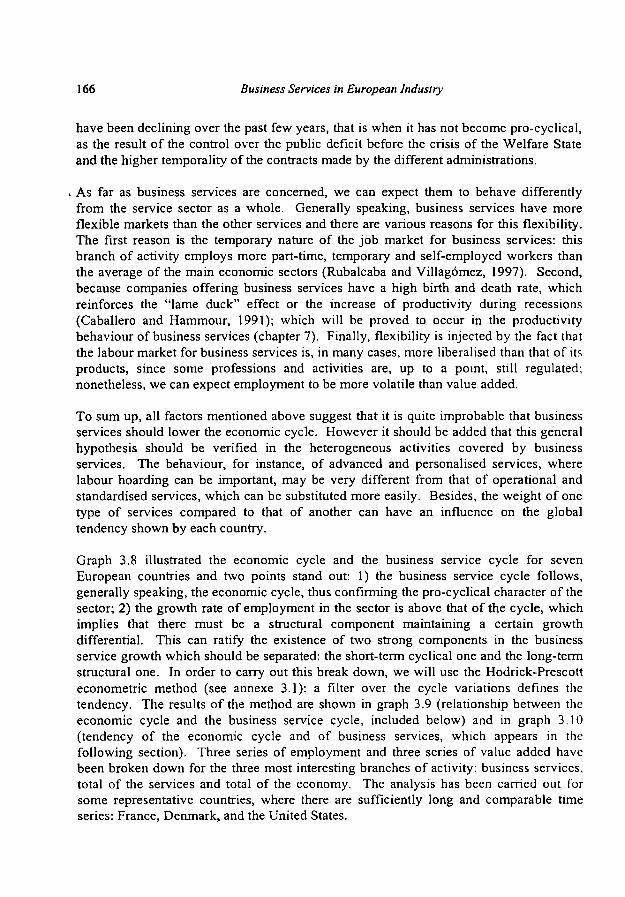
166 Business Services in European Industry
have been declining over the past few years, that is when it has not become pro-cyclical, as the result of the control over the public deficit before the crisis of the Welfare State and the higher temporality of the contracts made by the different administrations.
As far as business services are concerned, we can expect them to behave differently from the service sector as a whole. Generally speaking, business services have more flexible markets than the other services and there are various reasons for this flexibility. The first reason is the temporary nature of the job market for business services: this branch of activity employs more part-time, temporary and self-employed workers than the average of the main economic sectors (Rubalcaba and Villagómez, 1997). Second, because companies offering business services have a high birth and death rate, which reinforces the "lame duck" effect or the increase of productivity during recessions (Caballero and Hammour, 1991); which will be proved to occur in the productivity behaviour of business services (chapter 7). Finally, flexibility is injected by the fact that the labour market for business services is, in many cases, more liberalised than that of its products, since some professions and activities are, up to a point, still regulated; nonetheless, we can expect employment to be more volatile than value added.
To sum up, all factors mentioned above suggest that it is quite improbable that business services should lower the economic cycle. However it should be added that this general hypothesis should be verified in the heterogeneous activities covered by business services. The behaviour, for instance, of advanced and personalised services, where labour hoarding can be important, may be very different from that of operational and standardised services, which can be substituted more easily. Besides, the weight of one type of services compared to that of another can have an influence on the global tendency shown by each country.
Graph 3.8 illustrated the economic cycle and the business service cycle for seven European countries and two points stand out: 1) the business service cycle follows, generally speaking, the economic cycle, thus confirming the pro-cyclical character of the sector; 2) the growth rate of employment in the sector is above that of the cycle, which implies that there must be a structural component maintaining a certain growth differential. This can ratify the existence of two strong components in the business service growth which should be separated: the short-term cyclical one and the long-term structural one. In order to carry out this break down, we will use the Hodrick-Prescott econometric method (see annexe 3.1): a filter over the cycle variations defines the tendency. The results of the method are shown in graph 3.9 (relationship between the economic cycle and the business service cycle, included below) and in graph 3.10 (tendency of the economic cycle and of business services, which appears in the following section). Three series of employment and three series of value added have been broken down for the three most interesting branches of activity: business services, total of the services and total of the economy. The analysis has been carried out for some representative countries, where there are sufficiently long and comparable time series: France, Denmark, and the United States.
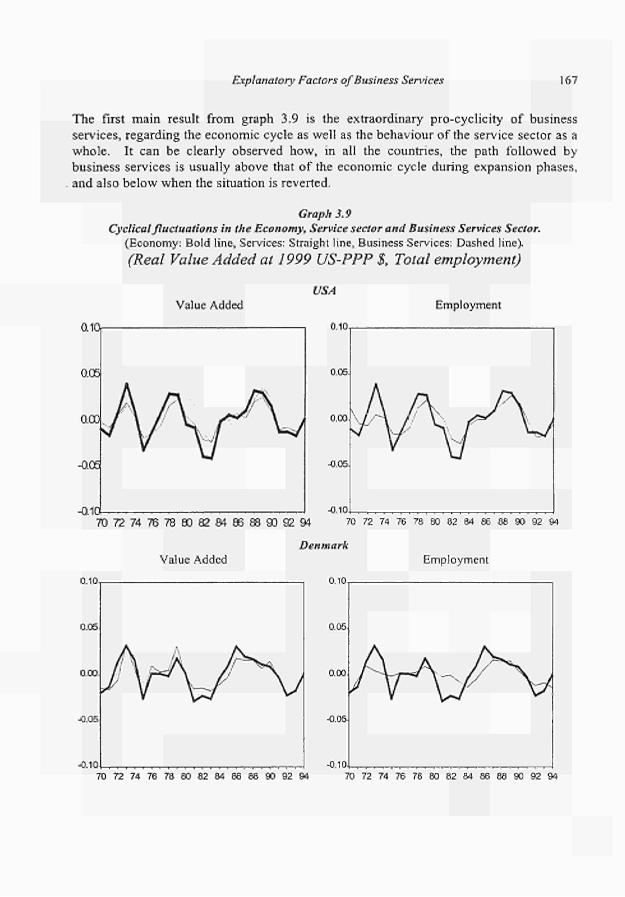
Explanatory Factors of Business Services 167
The first main result from graph 3.9 is the extraordinary pro-cyclicity of business services, regarding the economic cycle as well as the behaviour of the service sector as a whole. It can be clearly observed how, in all the countries, the path followed by business services is usually above that of the economic cycle during expansion phases, and also below when the situation is reverted.
Graph 3.9 Cyclical fluctuations in the Economy, Service sector and Business Services Sector.
(Economy: Bold line, Services: Straight line, Business Services: Dashed line). (Real Value Added at 1999 US-PPP $, Total employment)
USA Value Added Employment
0.10,
0.05
0.00
-0.05
-0.10t
0.10
0.05
0.00
•0.05
-0.10. 70 72 74 76 78 80 82 84 86 88 90 92 94 70 72 74 76 78 80 82 84 86 88 90 92 94
Denmark Value Added Employment
0.10
0.05
o.co
-0.05
-0.10
0.10
0.05.
0.00
-0.05
-0.10. 70 72 74 76 78 80 82 84 86 88 90 92 94 70 72 74 76 78 80 82 84 86 88 90 92 94
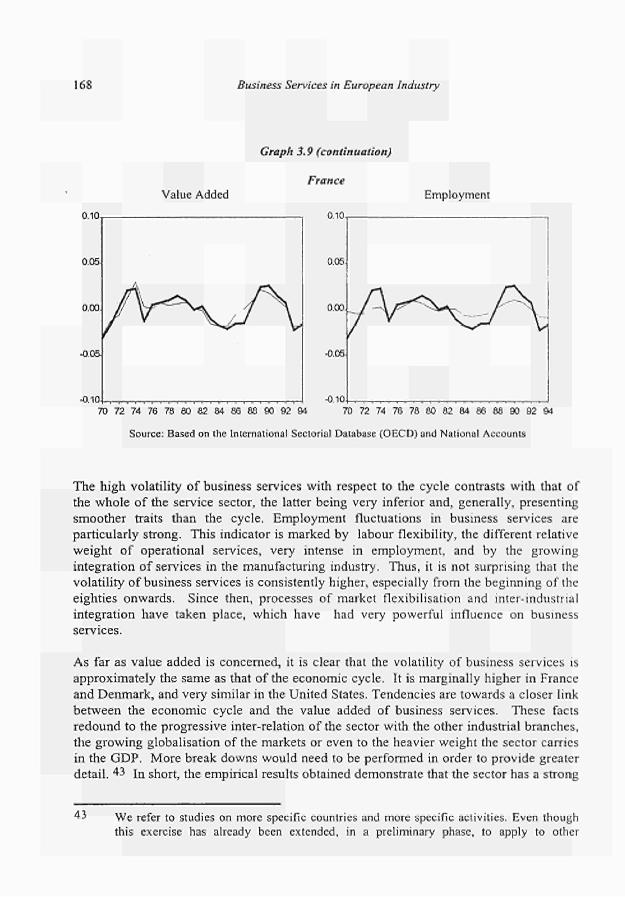
168 Business Services in European Industry
Value Added 0.10
0.05.
0.00
-0.05
-0.10
Graph 3.9 (continuation)
France
0.10
Employment
0.05.
0.00
-0.05.
-0.10 70 72 74 76 78 80 82 84 86 88 90 92 94 70 72 74 76 78 80 82 84 86 88 90 92 94
Source: Based on the International Sectorial Database (OECD) and National Accounts
The high volatility of business services with respect to the cycle contrasts with that of the whole of the service sector, the latter being very inferior and, generally, presenting smoother traits than the cycle. Employment fluctuations in business services are particularly strong. This indicator is marked by labour flexibility, the different relative weight of operational services, very intense in employment, and by the growing integration of services in the manufacturing industry. Thus, it is not surprising that the volatility of business services is consistently higher, especially from the beginning of the eighties onwards. Since then, processes of market flexibilisation and inter-industrial integration have taken place, which have had very powerful influence on business services.
As far as value added is concerned, it is clear that the volatility of business services is approximately the same as that of the economic cycle. It is marginally higher in France and Denmark, and very similar in the United States. Tendencies are towards a closer link between the economic cycle and the value added of business services. These facts redound to the progressive inter-relation of the sector with the other industrial branches, the growing globalisation of the markets or even to the heavier weight the sector carries in the GDP. More break downs would need to be performed in order to provide greater detail. 43 i n short, the empirical results obtained demonstrate that the sector has a strong
43 We refer to studies on more specific countries and more specific activities. Even though this exercise has already been extended, in a preliminary phase, to apply to other
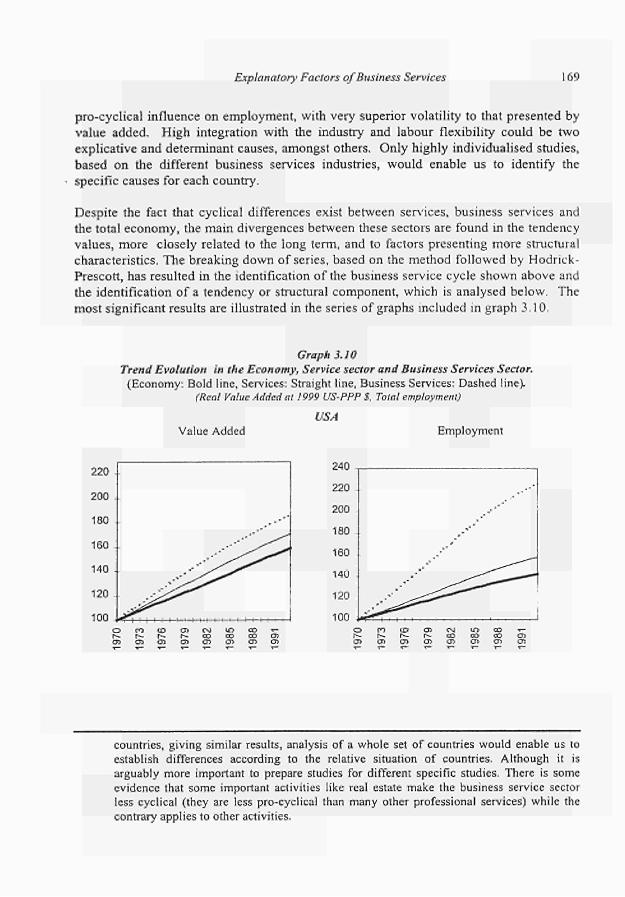
Explanatory Factors of Business Services 169
procyclical influence on employment, with very superior volatility to that presented by
value added. High integration with the industry and labour flexibility could be two
explicative and determinant causes, amongst others. Only highly individualised studies,
based on the different business services industries, would enable us to identify the
specific causes for each country.
Despite the fact that cyclical differences exist between services, business services and
the total economy, the main divergences between these sectors are found in the tendency
values, more closely related to the long term, and to factors presenting more structural
characteristics. The breaking down of series, based on the method followed by Hodrick
Prescott, has resulted in the identification of the business service cycle shown above and
the identification of a tendency or structural component, which is analysed below. The
most significant results are illustrated in the series of graphs included in graph 3.10.
Graph 3.10 Trend Evolution in the Economy, Service sector and Business Services Sector.
(Economy: Bold line, Services: Straight line, Business Services: Dashed line). (Real Value Added at 1999 USPPP $. Total employment)
Value Added USA
Employment
220 .
200
180 .
160 .
140
120
100
..' .^^
S¿&^^
« f i l ι ι ι ι ι ι ι ι ι
. · ' *
..-'* ^ ^ ^ ¿ ,
Ι Ι Ι Ι Ι Ι I Ι ι ' Ι
ο r
c o r
<£> Ι
σ> CM LO t co co co O Ì co
co ■<co σι σι σι
countries, giving similar results, analysis of a whole set of countries would enable us to establish differences according to the relative situation of countries. Although it is arguably more important to prepare studies for different specific studies. There is some evidence that some important activities like real estate make the business service sector less cyclical (they are less procyclical than many other professional services) while the contrary applies to other activities.
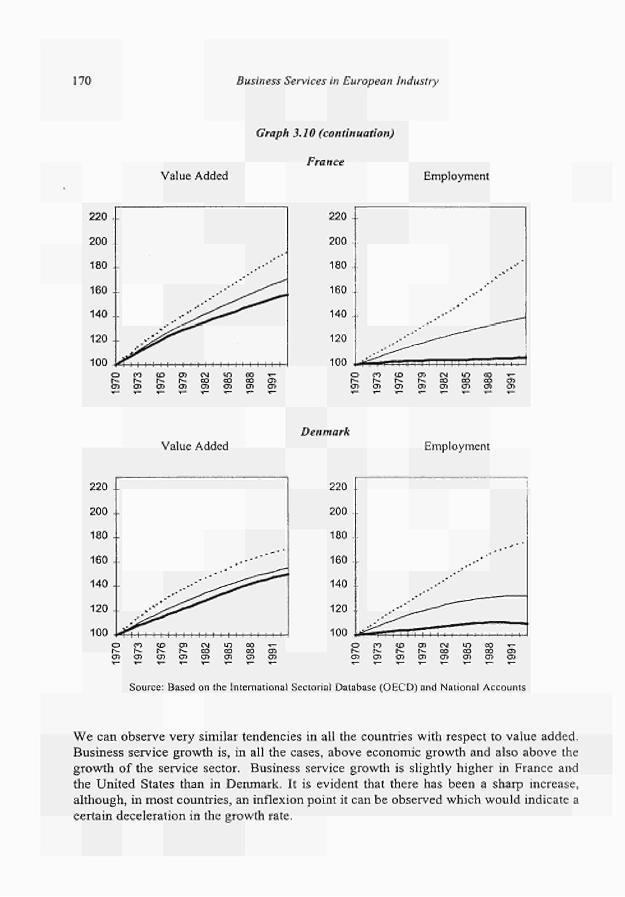
170 Business Services in European Industry
Graph 3.10 (continuation)
France Value Added Employment
220 -
200 .
180 .
160 -
140 -
120 .
100
..ν̂ ί
*Tl I M I
..-·'' .••'"'^y^'
'''^Ί^^0**"^
I I I I I I I I I I I I I I I
220 -
200 -
180 -
160 .
140 .
120
100 .
..··''
. i'! I n ι M I M M I
.<·' , . · ■ '
1
o r-σ>
cg m co co σ> σι
Denmark Value Added Employment
220 .
200 .
180 .
160 .
140 .
120 .
100
..··'''\^
•"^^^"^
< * ! I I I I I I I I I I I
..--'"
I I I I I I I I
220
200 .
180 .
160 .
140 -
120 -
100
..'" *
.-·*
. . ■ ■ \ ^ . — * " " "
J j ^ ^ f f I I I Ι ι I ι ι ι ι I 1
o rσι
co Γόο
to r-σι
σι r-σι
CM co
m co *-co co σι σι σι σι ο ΓΟΟ
co Γ-σι
«3 ΓΟΟ oo CM m r- co co co oo oo
CO T-00 oo OO OO
Source: Based on the International Sectorial Database (OECD) and National Accounts
We can observe very similar tendencies in all the countries with respect to value added. Business service growth is, in all the cases, above economic growth and also above the growth of the service sector. Business service growth is slightly higher in France and the United States than in Denmark. It is evident that there has been a sharp increase, although, in most countries, an inflexion point it can be observed which would indicate a certain deceleration in the growth rate.
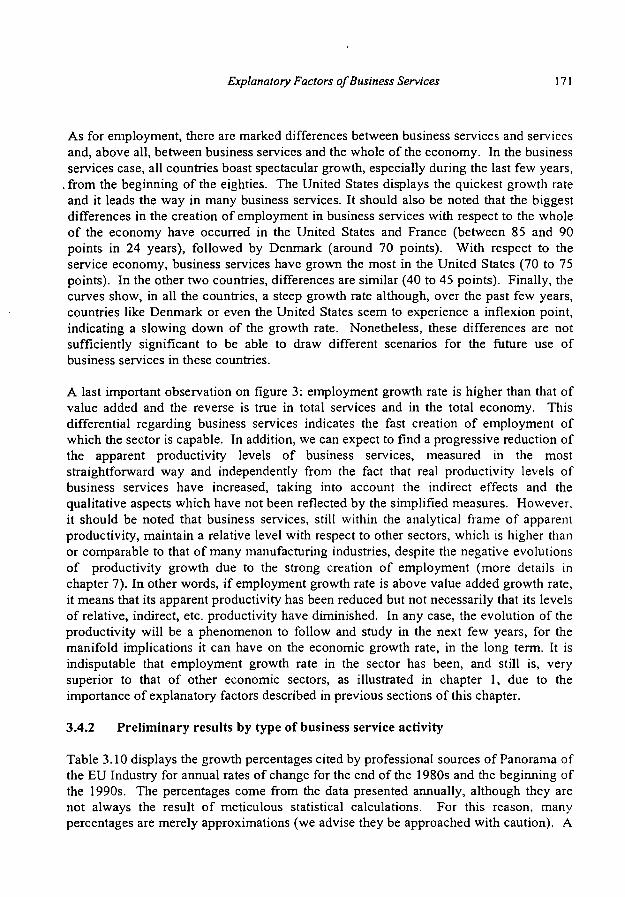
Explanatory Factors of Business Services 171
As for employment, there are marked differences between business services and services and, above all, between business services and the whole of the economy. In the business services case, all countries boast spectacular growth, especially during the last few years,
. from the beginning of the eighties. The United States displays the quickest growth rate and it leads the way in many business services. It should also be noted that the biggest differences in the creation of employment in business services with respect to the whole of the economy have occurred in the United States and France (between 85 and 90 points in 24 years), followed by Denmark (around 70 points). With respect to the service economy, business services have grown the most in the United States (70 to 75 points). In the other two countries, differences are similar (40 to 45 points). Finally, the curves show, in all the countries, a steep growth rate although, over the past few years, countries like Denmark or even the United States seem to experience a inflexion point, indicating a slowing down of the growth rate. Nonetheless, these differences are not sufficiently significant to be able to draw different scenarios for the future use of business services in these countries.
A last important observation on figure 3: employment growth rate is higher than that of value added and the reverse is true in total services and in the total economy. This differential regarding business services indicates the fast creation of employment of which the sector is capable. In addition, we can expect to find a progressive reduction of the apparent productivity levels of business services, measured in the most straightforward way and independently from the fact that real productivity levels of business services have increased, taking into account the indirect effects and the qualitative aspects which have not been reflected by the simplified measures. However, it should be noted that business services, still within the analytical frame of apparent productivity, maintain a relative level with respect to other sectors, which is higher than or comparable to that of many manufacturing industries, despite the negative evolutions of productivity growth due to the strong creation of employment (more details in chapter 7). In other words, if employment growth rate is above value added growth rate, it means that its apparent productivity has been reduced but not necessarily that its levels of relative, indirect, etc. productivity have diminished. In any case, the evolution of the productivity will be a phenomenon to follow and study in the next few years, for the manifold implications it can have on the economic growth rate, in the long term. It is indisputable that employment growth rate in the sector has been, and still is, very superior to that of other economic sectors, as illustrated in chapter 1, due to the importance of explanatory factors described in previous sections of this chapter.
3.4.2 Preliminary results by type of business service activity
Table 3.10 displays the growth percentages cited by professional sources of Panorama of the EU Industry for annual rates of change for the end of the 1980s and the beginning of the 1990s. The percentages come from the data presented annually, although they are not always the result of meticulous statistical calculations. For this reason, many percentages are merely approximations (we advise they be approached with caution). A
172 Business Services in European Industry
summary of the most important changes each of the activities is currently undergoing is also provided.
It is possible to reach a series of conclusions based on the annual growth percentages: the activities that grew the most at the end of the 1980s were the operational services, particularly courier services (30%) and security (20%). Technical and leasing services experienced the slowest growth in the sector: engineers and engineering (8%) and leasing and car rental (10%). On an individual level, the strong growth of public relations (25%) and IT services (22%), and the relatively low growth in advertising and legal services (8%) must also be highlighted. The remainder of the activities had rates varying between 10 and 15% annually.
This marked growth (an average of 13%) during the eighties was stronger than the growth in the economy as a whole. However, growth was pushed down in all cases during the recessionary period. The largest negative growth during the crisis was -5% annually in management, accounting, leasing and public relations. Conversely, legal services (8%), industrial engineering (8%) and many activities related to the area of information: electronic communication (18%), computing services (9%) and market research (6%) maintained a substantial increase. The average of business services yielded a positive increase of 2% during the crisis. In many activities, such as engineering, the crisis caused extensive redundancies and closures as a result of the slump in demand and of greater competition. This was compatible with an expanding global turnover.
On average, the crisis produced a 10-12 percentage point reduction in growth from the end of the eighties through to 1991-92. The highest reductions were for public relations (-30%), management (-20%), temporary employment (-18%) and accounting (-15%). Legal services, electronic communication and engineering maintained their growth rate and suffered the least consequences in terms of turnover. The companies, listed by function, at a standstill were marketing, personnel and operational organisations, while information and technical services were the least affected.
These results highlight two paradoxical but complementary ideas already mentioned above: a) business services can be considered to be a cyclical sector, in the sense that during the expansion, growth rates were greater than the economy's and during the crisis, they were affected by this downturn; b) business services can not only be considered to be a cyclical sector, since structural growth trends are more important than the short-term ones. At the same time, there is such disparate growth in the different activities (the variation coefficient is extremely high) that it is not possible yet to draw a general conclusion valid for all activities about the possible pro-cyclical or anti-cyclical nature of business services during the recessionary period of the nineties.
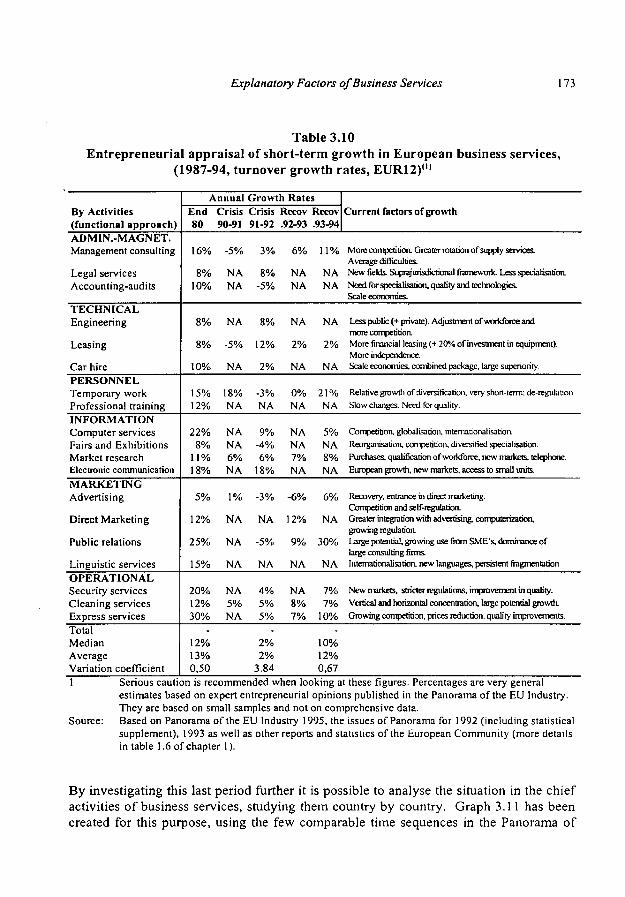
Explanatory Factors of Business Services 173
Table 3.10
Entrepreneurial appraisal of short-term growth in European business services,
(1987-94, turnover growth rates, EUR12)<"
By Activities
(functional approach)
ADMIN.-MAGNET.
Management consulting
Legal services
Accounting-audits
TECHNICAL
Engineering
Leasing
Car hire
PERSONNEL
Temporary work
Professional training
INFORMATION
Computer services
Fairs and Exhibitions
Market research
Electronic communication
MARKETING
Advertising
Direct Marketing
Public relations
Linguistic services
OPERATIONAL
Security services
Cleaning services
Express services
Total
Median
Average
Variation coefficient
Annual Growth Rates
End
80
16%
8%
10%
8%
8%
10%
15%
12%
22%
8%
11%
18%
5%
12%
25%
15%
20%
12%
30%
-
12%
13%
0,50
Crisis
90-91
-5%
NA
NA
NA
-5%
NA
18%
NA
NA
NA
6%
NA
1%
NA
NA
NA
ΝΛ
5%
NA
Crisis
91-92
3%
8%
-5%
8%
12%
2%
-3%
NA
9%
-4%
6%
18%
-3%
NA
-5%
NA
4%
5%
5%
-
2%
2%
3.84
Recov Recov
.92-93
6%
NA
NA
NA
2%
NA
0%
NA
NA
NA
7%
NA
-6%
12%
9%
NA
NA
8%
7%
93-94
11%
NA
NA
NA
2%
NA
21%
NA
5%
NA
8%
NA
6%
NA
30%
NA
7%
7%
10%
-
10%
12%
0,67
Current factors of growth
More competition. Greater rotation of supply services.
Average difficulties.
New fields. Suprajurisdictioiial framework. Less specialisation.
Need for specialisation, quality and technologies.
Scale economies.
Less public (+ private). Adjustment of workforce and
more compétition.
More financial leasing (+ 20% of investment in equipment)
More independence.
Scale economies, combined package, large superiority.
Relative growth of diversification, very short-term: de-regulation
Slow changes. Need for quality.
Competition, globalisation, internationalisation.
Reorganisation, competition, diversified specialisation.
Purchases, qualification of workforce, new markets, telephone.
European growth, new markets, access to small units.
Recovery, entrance in direct marketing.
Competition and self-regulation.
Greater integration with advertising, computerization,
growing regulation
Large potential, growing use from SME's, dominance of
large consulting films.
Internationalisation, new languages, persistent fragmentation
New markets, stricter regulations, improvement in quality.
Vertical and horizontal concentration, large potential growth.
Growing competition, prices reduction, quality improvements.
1 Serious caution is recommended when looking at these figures. Percentages are very general
estimates based on expert entrepreneurial opinions published in the Panorama of the EU Industry.
They are based on small samples and not on comprehensive data.
Source: Based on Panorama of the EU Industry 1995, the issues of Panorama for 1992 (including statistical
supplement), 1993 as well as other reports and statistics of the European Community (more details
in table 1.6 of chapter 1).
By investigating this last period further it is possible to analyse the situation in the chief
activities of business services, studying them country by country. Graph 3.11 has been
created for this purpose, using the few comparable time sequences in the Panorama of
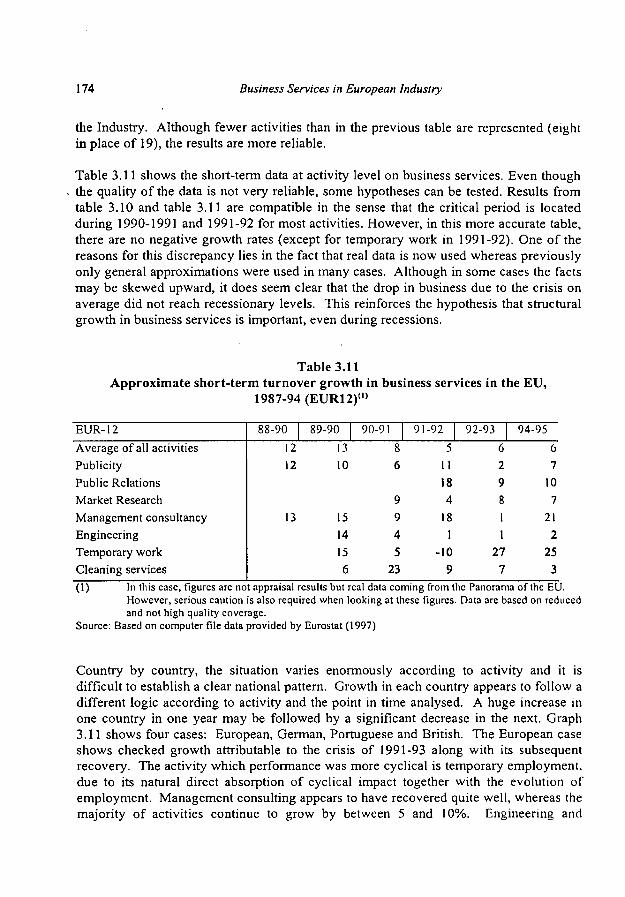
174 Business Services in European Industry
the Industry. Although fewer activities than in the previous table are represented (eight in place of 19), the results are more reliable.
Table 3.11 shows the short-term data at activity level on business services. Even though the quality of the data is not very reliable, some hypotheses can be tested. Results from table 3.10 and table 3.11 are compatible in the sense that the critical period is located during 1990-1991 and 1991-92 for most activities. However, in this more accurate table, there are no negative growth rates (except for temporary work in 1991-92). One of the reasons for this discrepancy lies in the fact that real data is now used whereas previously only general approximations were used in many cases. Although in some cases the facts may be skewed upward, it does seem clear that the drop in business due to the crisis on average did not reach recessionary levels. This reinforces the hypothesis that structural growth in business services is important, even during recessions.
Table 3.11 Approximate short-term turnover growth in business services in the EU,
1987-94 (EURI 2)"»
EUR-12 Average of all activities Publicity Public Relations Market Research Management consultancy Engineering Temporary work Cleaning services
88-90 12 12
13
89-90 13 10
15 14 15 6
90-91 8 6
9 9 4 5
23
91-92 5
II 18 4
18 1
-10 9
92-93 6 2 9 8 1 1
27 7
94-95 6 7
10 7
21 2
25 3
(1) In this case, figures are not appraisal results but real data coming from the Panorama of the EU. However, serious caution is also required when looking at these figures. Data are based on reduced and not high quality coverage.
Source: Based on computer file data provided by Eurostat (1997)
Country by country, the situation varies enormously according to activity and it is difficult to establish a clear national pattern. Growth in each country appears to follow a different logic according to activity and the point in time analysed. A huge increase in one country in one year may be followed by a significant decrease in the next. Graph 3.11 shows four cases: European, German, Portuguese and British. The European case shows checked growth attributable to the crisis of 1991-93 along with its subsequent recovery. The activity which performance was more cyclical is temporary employment, due to its natural direct absorption of cyclical impact together with the evolution of employment. Management consulting appears to have recovered quite well, whereas the majority of activities continue to grow by between 5 and 10%. Engineering and
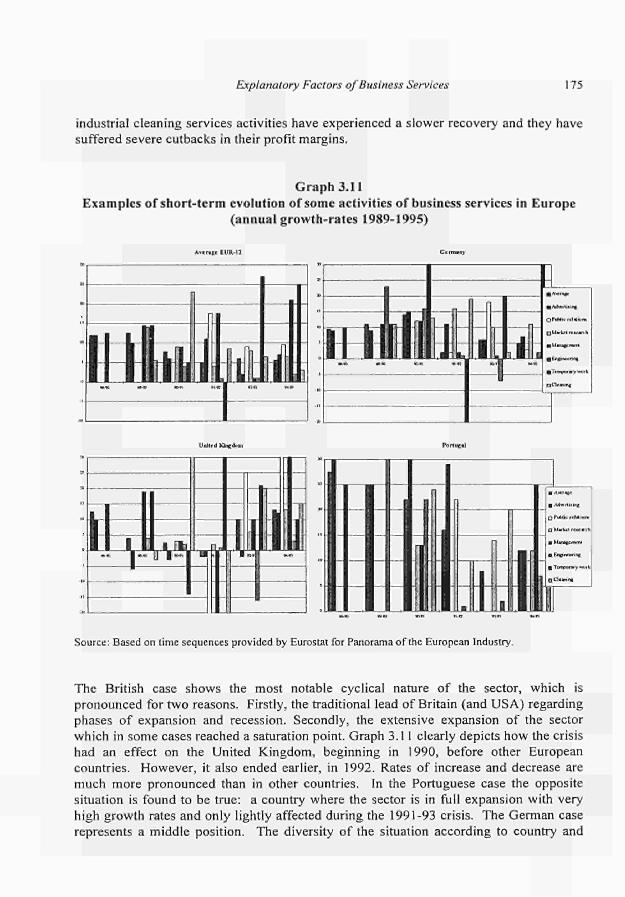
Explanatory Factors of Business Services 175
industrial cleaning services activities have experienced a slower recovery and they have
suffered severe cutbacks in their profit margins.
Graph 3.11
Examples of short-term evolution of some activities of business services in Europe
(annual growth-rates 1989-1995)
A v e n c e K I R 1 :
Ihiliil, 1 ι i
— 4 il
η
..M.
i I Β
nr
I B
■ ■VIwrilLiirsf.
r j M * V - - l i r m i l i
■ Ene nt crine
g Temporary W H L
QOcnnc
Source: Based on time sequences provided by Eurostat for Panorama of the European Industry.
The British case shows the most notable cyclical nature of the sector, which is
pronounced for two reasons. Firstly, the traditional lead of Britain (and USA) regarding
phases of expansion and recession. Secondly, the extensive expansion of the sector
which in some cases reached a saturation point. Graph 3.11 clearly depicts how the crisis
had an effect on the United Kingdom, beginning in 1990, before other European
countries. However, it also ended earlier, in 1992. Rates of increase and decrease are
much more pronounced than in other countries. In the Portuguese case the opposite
situation is found to be true: a country where the sector is in full expansion with very
high growth rates and only lightly affected during the 1991-93 crisis. The German case
represents a middle position. The diversity of the situation according to country and
176 Business Services in European Industry
activity is in line with the market fragmentation that exists and also with the different stages of growth and maturity within which the activities are evolving. The sector's own evolution along with its maturity in addition to the different economic structures, social problems and regulations are found to be behind these differences. In this context a number of elements can be understood: the greater effect which the crisis had on some British business services; the stagnation of French, Danish or Italian business services; or the anti-cyclical growth of some German, Spanish, Portuguese or Greek business services.
These results bring us to a conclusion similar to that obtained by Kirk (1987) in a study on whether or not business services could be considered immune to the business cycle. The situation varies according to type of service and market. In the United States neither the whole of the sector in mature markets (urban) nor some large short-term component activities on the national level (personnel, financial auxiliaries) were immune during the period of financial crisis at the end of the seventies and the beginning of the eighties. Our results emphasise still more, if that is possible, the heterogeneity of situations according to country and activity. Additionally, they verify that business cycles affect business services without qualification. Nevertheless, it also seems evident that a structural growth component exists that tends to take precedence over the pro-cyclical one. For this reason, the business services' slump during recessions is by any reckoning less than that which takes place in the vast majority of other economic sectors. The strong structural growth of business services explains the causes of this peculiarity. This makes business services a potential instrument for policies that aim to guarantee an equilibrated and stable economic growth.
Recent Trends
Currently, we can observe a more stable business service growth rate in most EU countries. Although data is not yet available to confirm this, 1995, 1996 and 1997 were three years of expansion of the activities of business services as well as ones of recovery and reorganisation in the sector. Table 3.10 includes the key elements underlying the main current circumstances of each activity. The recovery, currently improving the well-being of all activities, is more relevant in the services that were most affected by the recession: engineering, advertising, fairs and exhibitions, management consulting, temporary work. In every case, emergence from the crisis is not simply a return to the previous turnover, but implies an internal reorganisation of the company and the market. As a matter of fact, it is the rapid response of demand which has prevented, in part, the recession from having a serious effect on business services. This reorganisation has the following parameters: 1. Greater competition, greater quality. All activities are facing growing
competition which is producing multiple effects44: more purchases and mergers (e.g. market research, industrial cleaning services); collaboratory agreements of
4 4 See, for example, the Panorama of Industry in the EU, European Commission (1994,1995)
Explanatory Factors of Business Services 177
networks (e.g. legal services); price reductions (e.g. courier services); adjustments to staffing levels (e.g. engineering). In addition to these effects, all activities are, generally speaking, moving towards a higher quality of service in order to meet the competition.
. 2. Recovery of confidence. In some cases, such as management consulting, the crisis affected consumer confidence: the high cost of learning the business itself45; lack of a scientific basis for instruments, lack of suitable full-time professionals; and distrust in general. Regaining confidence is becoming the central element in trying to maintain and increase the number of customers. Greater competition is expediting the turnover of supply companies, as happens with American companies. They can reach the point of changing consultants five or ten times in a year. Even in advertising, where loyalty has always been a traditional factor, clients are beginning to try new suppliers. In this context, image and confidence are more important than ever.
3. International character. All activities are entering into a world which is becoming more and more globalised and in which at least one segment of the market moves in the world of international competition. This internationalisation of the economy affects companies' production methods and the area in which they operate. This is happening, for example, with information service companies and law firms. In this case, although they remain within their local niches, lawyers have to operate within a supra judicial framework which on many occasions forces them to collaborate with firms in other places.
4. Statutory environment. Within the current short-term context, business services, with traditionally little regulation, are experiencing two trends: towards deregulation and towards self-regulation. Despite this, some activities are still the object of regulations. These are not always uniform throughout the EU and do not always protect quality. Some activities currently in the process of being regulated are security, industrial cleaning, advertising & marketing, and temporary work services (see more in chapter 6).
To sum up, the current situation in business services activities is one of facing a recovery of high annual growth-rates while at the same time dealing with difficult reorganisation processes within the sector. All forecasts expect considerable increases in turnover in the near future as there exists significant potential growth in many of the markets. The appearance of new markets, new products and new technologies ensures that the future of the sector is guaranteed for the coming years as long as it continually pushes back the limits of maturity. The most mature products or activities are offset by the integration of new products or activities.
4 5 This matter is well reflected in Chapignac (1990) and Del Rio et alt. (1990), related to the difficulties for big famous consultancy firms over the course of some years.

178 Business Services in European Industry
3.5 Conclusions
The traditional way of looking on services as unproductive and a burden on the economy, although apt to absorbing redundant employment, is no longer valid. Business services play a highly relevant part in modem economic growth and, more importantly, through their integration in manufacturing and services, and through the wide number of explanatory factors explaining them, business services contribute to employment, productivity and value added in the whole economy. The comprehensive study of business services within the changes in the production system, causes, functions, integration trends, and evolution, has led to a series of conclusions which tend to verify or at least, not to refute, the positive nature of the sector and its contribution to economic development.
1. There is a considerable interrelation between the emergence of business services and the transformations in production systems. Business services are, at the same time, the cause and the result of flexibilization processes in production frameworks; the innovative integration of goods and services; and the integration and utilisation of new technologies. The economy of the sector is substantiated by many of the processes of change affecting the developed world as a whole. In this sense, business services are merely an indication, albeit a significant one, of the new situations arising.
2. The reasons supporting such a strong structural growth are manifold and can be divided into three groups of causes: productive factors, production systems, and market changes. Outstanding factors include the three mentioned in point 1 above: flexibility, technologies and the integration of goods and services. We can add to these the need for innovation and competitiveness, externalisation, an increase in demand, changes in the markets and internalisation, business characteristics, factors tied to the intervention of the State in the economy and the importance of employment and human capital. The explanation of growth via productivity does not appear to be applicable to business services in the same way as it is to other service sectors. For these reasons, it must be concluded that a variety of explanatory factors of the first order are needed in order to understand business services, a fact which in tum supports the central hypothesis about business services as consequence or factor for economic growth.
3. Business services carry out a series of vital functions for economic development: direct or indirect contribution to employment growth and value added; improvements to production systems; gains in quality; innovation and manufacturing competitive advantage; the integration of production systems; growth of small and medium-sized businesses; internationalisation and spatial bi-polarity; and on the whole, a contribution to economic development in the broadest sense of the word. Of all of these functions, in our times, political interest is shown in the functions related to innovation and manufacturing
Explanatory Factors of Business Services 179
competitiveness. This interest corresponds to the fact that business services lead a rich diversity of innovations related not only to technology, but also to organisational, strategic, commercial and operational aspects.
4. Business services as a factor stimulating economic growth: this can be confirmed by studying the input-output tables, taking into account the limits these tables have with regard to the branch of business services. The work carried out by the principal authors who have analysed the servindustrial integration using Spanish and European tables highlight the growing role of business services as integrator. This follows from their being the object of continuous use by the different manufacturing and service sectors. In particular, studies following both the European and other countries' input-output tables from the OECD (1996b) confirm the role of business services as intermediary suppliers ofinputs for a large group of manufacturing activities and for services of all sorts. This begins with the business service sector itself, which is a great user of its own services. The integration of the sector has been much greater than that of the aggregate economic activities, in both periods of crisis and expansion. Trends towards the integration of business services with industry are more obvious with regard to those reflecting the industrialisation of the business service sector, which maintains high rates of value added.
5. The break down carried out, following an econometric method enables us to isolate the cyclical effects from the structural effects. With respect to the relationship between the business service cycle and the economic cycle, it can be concluded that both follow the same direction (business services are clearly pro-cyclical) and that the former is, generally speaking, superior to the latter, above all in employment. The volatility of employment in business services can partly be explained by the high flexibility in the organisation of the markets and of the work factor, although, in order to consolidate the possible explanations, studies based on each country and business service activity would be required. From the analysis of long-term tendencies, the main differences between the behaviour of business services and that of the rest of the economy or even the total services can be deducted. Growth rates in employment as well as in value added are exceptionally high, especially as far as employment is concerned. This result, without any possible comparison with many other manufacturing and service sectors, confirms the thesis that the sector's growth is basically a structural phenomenon.
6. Business services has enjoyed the highest growth rates, during recessionary periods, therefore emphasising a positive relationship with economic cycles. Annual increases at the end of the 1980s were located between 10 and 20%, not to forget activities which attained levels of 30% or more. Even though during the recession in the 1990s such rates disappeared, negative change rates for some activities were only observed in very mature markets like the British one.
180 Business Services in European Industry
In nearly all cases, growth percentages remained substantially above the
average economic evolution. Recently, strong growth processes continue to
develop although not as vigorously as at the end of the 1980s. Additionally,
they respond not only to a spurt in demand but also to competition and activity
reorganisation processes. The growth potential of the sector continues to be a
powerful demonstration of the positive correlation between absolute
employment growth or value added and relative participation in the whole of
the economy. Business services are still far, exceptions barred, from reaching a
growth ceiling.
References
Aglietta, M. (1979) A theory of capitalism regulation. New Left Books, London.
Atkinson, J. (1985) "The changing corporation" in Clutterbuck, D. (Ed.) New patterns of
work. Gowe, Aldershot..
Audretsch, D.B.; Yamawaki, H. (1993) "The manufacturing/service interface". European
Economy Social Europe n"3, 1993: 99108. EU Commission, Brussels.
Bailly, Α.; Maillât, D. (1988) Le secteur tertiaire en question, 2nd edition Economica, Paris
Bailly, Α.; Maillât, D. (1990) "Actividades de servicios y sistema de producción". Papeles de
Economía Española, 42:4051.
Barò, E. (1990) "Cambios en la interdependencia entre sectores industriales y terciarios"
Papeles de Economía Española, 42:¡93202.
Barras, R. (1985) "Information technology and the service revolution". Policy Studies 5. 14
Barras, R. (1986) "Towards a theory of innovation in service". Research Policy. 15
Baumöl, W.J. (1985) "Productivity policy and the service sector" in Inman (Ed.), Managing
the service economy. Cambridge University Press, Cambridge.
Baumöl, W.J. (1986) "Information technology and the service sector: a feedback process?" in
Faulhaber, G et alt. (Eds.), Services in transition. Ballinger, Cambridge.
Bell, D. (1973) The coming of postindustrial society. Basic Book, Inc., New York.
Beyers, W.B.; Lindahl, D.P. (1994) "On the dynamics of producer service markets:
externalization, internalization, and innovation processes". Symposium: Externalization or
internalization of business services, 2930 May 1994. Roskilde University, Roskilde.
Bramanti, Α. (1989) "Servizi alla produzione e politiche locali: La domanda delle PMI
innovative". Quaderni del Consorzio Milano Ricerche, n°2.
Bryson, F.; Keeble, D.; Wood, P. (1992) Business networks, flexibility and regional
development in UK business services. Small Business Research Centre, working paper 19.
Cambridge University, Cambridge.
Caballero, R; Hammour, M. (1991) The cleaning effects of recessions. NBER Working Paper.
Carter, A.P.; Brody, A. (1970) Contributions to inputoutput analysis, Amsterdam.
Chapignac, P. (1990) Les services avancés en Europe. CPE Etude n° 120. Auditech,
Montpellier.
Christophersen, S. (1989) "Flexibility in the US service economy and the emerging spatial
division of labour". Transactions Institute of British Geographers, N.S. 14: 13143.
Coffey, W.J.; Bailly, A.S. (1990) "Services activities and evolution of production system: an
international comparison". Environment and Planning A, 22.
Coffey, W.J.; Bailly, A.S. (1991) "Producer services and flexible production: an exploratory
analysis". Growth and Change, vol 22, no. 4: 95117.
Explanatory Factors of Business Services 181
Cohen, S.; Zysman, J. (1987) Manufacturing matters: the myth of the postindustrial economy. Basic books, New York. Cooke, P.N. (1988) "Flexible integration, scope economies and strategic alliances: social and spatial mediations". Environment and Planning D: Society and Space, 6. Cooper, CM.; Clark, J.A. (1982) Employment economics and technology: the impact of technical change on the labour market. Wheatsheaf, Brighton. Cuadrado Roura, J.R. (1989) "Services and new information technologies: producer services" in: The spatial context of technological development. Avebury, Brussels. Cuadrado Roura, J.R. y del Rio Gomez, C ( 1993): Los servicios en España. Ed. Piramide, Madrid. Cuadrado Roura, J.R.; Del Río Gómez, C. (1989) "Structural change and evolution of the service sector in the OECD". The Service Industries Journal, 9 (no. 3): 439-468 Cuadrado Roura, J.R.; González Moreno, M. (1988) "Incidencia de las nuevas tecnologias en la organización y localización de los serviços a empresas". Estudios regionales, 22. Cuadrado Roura, J.R.; Rubalcaba Bermejo, L. (1988) "Specialization and competition in urban European cities: a new approach through Fairs and Exhibition " Regional Studies. April. No. 39: 133-147. De Jong, M.W. (1992) "Networks of service provision: a customer-oriented approach". 2" RESER: Networks in services, spatial development and the Single European Market. 2-4 September, Portsmouth. Del Río Gómez, C. (1992) La evolución de los servicios en España. Ministerio de Economía y Hacienda, Madrid. Del Río Gómez, C ; Cuadrado Roura, J.R.; Casares, J. (1990) Presente y futuro de algunas actividades a empresas en la CE y España. Análisis de algunos servicios concretos: evolución, situación actual y perspectivas. Tercera parte. Quasar, Madrid. Dertouzos, M.L.; Lester, R.K.; Solow, R.M.; Comisión MIT (1989) Made in America-regaining the productivity edge. MIT Press, Cambridge, Mass. Quoted in Audretsch and Yamawaki (1993). Ditler, L. (1986) "Logiciel et services informatiques". FAST Program, European Commission, Brussels. Eiglier, P.; Langeard, E. (1989) Servucción: el marketing de servicios. McGraw-Hill, Madrid. Elfring, T. (1988). Service sector employment in advanced economies. Gower Publishing Company eds Enderwick, P. (Ed.) (1989) Multinational service firms. Routledge, London. European Commission (1987) L'Europe des services: un virage à réussir. Programme FAST II. Résultats et recommandations, vol 3. European Commission, Brussels. European Commission (1992) Panorama de l'industrie communautaire 1991-1992. European Commission, Luxembourg. European Commission (1993) Panorama de l'industrie communautaire 1993 European Commission, Luxembourg. European Commission (1994) Panorama de l'industrie communautaire 1994. European Commission, Luxembourg. European Commission (1995): Panorama of the EU Industry 1995. European Commission, Luxembourg. European Commission (1997): Panorama of the EU Industry 1997. European Commission, Luxembourg. European Commission (1998) 7Vie contribution of business services to industrial performance: a common policy framework. Communication from the Commission to the Council. European Commission, Brussels.

182 Business Services in European Industry
Fayol, H. (1916) ¿α administración industrial y general en 1916. Edición de 1961. El Ateneo.
Buenos Aires.
Ferré Masip, R. (1988) La fábrica flexible. Productica.
Filardo, A. (1997). "Cyclical implications of the declining manufacturing employment share."
Federal Reserve of Kansas city. Economic Review 2Q 1997
Fontaine, C. (1988) "Le development des activités de service aux entreprises et dans les
entreprises". Revue d'Economie Industrielle, I trimestre.
Francois, J.F. (1990) "Producer services, scale and the division of labour". Oxford Economic
Papers, vol 42., iss 4, oct 90.: 715 729.
Freeman, C ; Soete, L. (Eds.) (1987) Technical change and full employment. Basic Blackwell,
Oxford.
Fuchs, V.R. (1968) The service economy. National Bureau of Economic Research, New York.
Gadrey, J. (1991) "L'insoutenable légèreté des analyses de productivité dans les servicies" in
De Bandt, J. (Ed.) ( 1991 ) Les services: productivité et prix. Economica, Paris.
Gadrey, J. ( 1992) L'économie des services. La Découverte, Paris.
Gemmell (1982) "Economie development and structural change The role of the services
sector". The journal of development studies, no 1.
George, C. (1974) Historia del pensamiento organizativo. Prentice Hall International, Madrid
Gershuny, J. (1978) After industrial society?. Macmillan, London.
Gertler, M.S. (1988) "The limits of flexibility: comments on the postfordist vision of
production and its geography". Transactions Institute of British Geographers, N.S. 13, 419
432.
Giarini, O; Stahel, W.R. (1993) The limits to certainty facing risks in the new service
economy, 2nd revised edition. Kluwer Academic Publishers, Dordrecht, Boston and London.
Ginzberg, E.; Votja, G.J. (1981) "The service sector of the US economy". Scientific American,
no 3.
Goe, W.R. (1990) "Producer services, trade, and the social division of labour". Regional
Studies 24: 32742.
Greenfield, H.T. (1966) Manpower and the growth of producer services. Columbia Univ.
Press, New York.
Harvey, D. (1988) "The geographical and geopolitical consequences of the transition from
Fordist to flexible accumulation" in Hughes, J. and Sternlieb, G. (Eds), America's new
economic geography. Centre for Urban Policy Research, New Brunswick, NJ.
Harvey, D. (1989) The condition of postmodernity. Blackwell, London.
Hirschman, A.O. (1958) The strategy of economic development. Yale University Press.
Spanish edition consulted: La estrategia del desarrollo económico (1973). Fondo de Cultura
Econòmica, Mexico.
Howe, W.J. (1986) "The business services industry set pace in employment growth". Monthly
Labour Review, 109 April: 2936.
Howells, J. (1988) Economic technological and locational trend in European services
AveburyCE, Aldershot.
Howells, J.; Green, A. (1988) Technological innovation structural change and location in UK
services. AveburyCE, Aldershot.
Illeris, S. (1989a) Services and regions in Europe. AveburyCE, Aldershot.
Jessop, R.; Bonnett, K.; Bromley, S; Ling, T. (1987) "Popular capitalism, flexible
accumulation and left strategy". New left review, 165: 10422.
Johnston, P. (1994) "Telework stimulation in the context of the White Paper on growth,
competitiveness and employment". Seminario: Employment in Business Related Services
Analysis, Strategy and Policy Issues. European Commission, DG V, Brussels.
Explanatory Factors of Business Services 183
Kirk, R. (1987) "Are business services immune to the business cycle?". Growth & Change,
vol 18, iss 2. Spring 1987. P.: 1523
Kuznets, S. (1971) Economic Growth of nations. Harvard University Press, Cambridge, Mass
Kydland , F. and prescott, E. (1990). "Business Cycles : Real facts and a monetary myth".
Federal reserve Bank of Minneapolis Quarterly Review, Spring, pp. 318
Lee, J. (1996). Do services temper business cycles?: Implications of the rising service sector.
University of California Irvine. Department of economics.
Lipietz, A. (1986) "New tendencies in the international division of labour: regimes of
accumulation and modes of regulation" in Scott, A.J., Storper, M. (Eds), Production, Work,
Territory. Allen & Unwin, Hemel Hempstead.
Mandel, M. (1997) "The new business cycle." Business Week, March 31, 1997.
Manshanden, W.; Lambooy, J. G.; van der Vegt, C (1997) Knowledgeintensive services and
innovation in the Netherlands. KISINN IV Framework Program Working paper, SEO.
Mañas, E. (1992) "La demanda de servicios a empresas según tamaño, actividad y
localización.". Papeles de Economía Española, 50:307311.
Marcos, C ; Palomero, E. (1990) "El futuro regional ¿servicios versus industria?". Economía y
sociedad n" 4.
Marshall, J.N. (Ed.) (1988a) Services and uneven development. Oxford University Press,
Oxford.
Marshall, J.N. (1988b) Producer services and the manufacturing sector in the West Midlands.
West Midlands Enterprise Board Ltd, Birmingham.
Martinelli, F. (1991a) "A demandorientated approach to understanding producer services" in
Daniels, P., Moulaert, F. (Eds.), 77ie changing geography of advanced producer servicies.
Belhaven Press, London.
Martinelli, F. (1991b) "Branch plants and services underdevelopment in peripherical regions:
the case of southern Italy" in Daniels, P.W., Moulaert, F. (Eds), The Changing Geography of
Advanced Producer Services. Belhaven Press, London.
Martini, M. (1989) "Laboro e professioni nell'impresa che cambia". Note e riflessioni
Quadrimestrale. Umanesimo et Società. Anno li. N"6.
Martini, M.; Vairetti, U. (1989) Terziario Avanzato. Prospettive e modelli dell'impresa futura
Il Sole 24 Ore, Milán.
Mayère, Α.; Monnoyer, M.C. (1992) "The way service networks set up and behave: an
indicator search for specifying and differentiating partnerships". 2" Forum del RESER
Networks in services spatial development and the Single European Market. 24 September,
Portsmouth.
McKenzie, R.B.; Smith, S.D. (1986) "Los nuevos empleos de producción". Perspectivas
Económicas, 55.
Ministry of Industry and Energy (1995) Interrelaciones entre la industria y los servicios. Serie
notas informativas 1995/2, Subdirección General de Estudios. MINER, Madrid.
Momigliano. F; Siniscalco, D. (1980) "Terziario totale e terziario per il sistema produttivo".
Economia e Politica Industriale. Rasegna trimestrale n°25.
Momigliano. F; Siniscalco, D. (1982) "Note su tema di terziarizzazione e
reindustrializzazione". Economia e Politica Industriale. Rasegna trimestrale n"25.
Monnoyer, M.E.; Philippe.J. (1991) "Localisation factors and development strategies of
producer services" in Daniels, P., Moulaert, F. (Eds.), The changing geography of advanced
producer servicies. Belhaven Press, London.
Nusbaumer, J. (1984) Les services: nouvelle donné de l'économie. Economica, París.
Ochel, W.; Wegner, M. (1987) Service Economies in Europe: Opportunities for Growth.
Printer Pub. & Wesriew Press, London.
OECD (1995) Liberalisation of trade in professional services, OECD. Documents, Paris.
184 Business Services in European Industry
OECD (1996a) Services Statistics on Value Added and Employment, OECD.
OECD (1996b) InputOutput Tables, OECD.
O'Farrell, P.N.; Moffat, L.A.R. ; Hitchens, D.M.W.N. (1993) "Manufacturing demand for
business services in a core and peripheral region: does flexible production imply vertical
disintegration of business services?". Regional Studies, 27: 385400.
Olea, I. (1987) Horizonte 2000. Harvard Deusto Business Review. 4" Trimestre, Deusto.
Peat Marwick Mclintock (1988) The cost of non Europe for Business Services. Research on
the cost of nonEurope. Basic finding, vol 8. European Commission, Brussels and
Luxembourg.
Pellegrini, G. (1988) "L'analisi della integrazione tra settori industriali e settori terciari in un
contesto multisettoriale: alcune evidenze empiriche". Rivista di Politica Economica, Abril.
Perry, M. (1992) "Flexible production, externalisation and the interpretation of business
service growth". Service Industries Journal 12(1): 116.
Petersen, Β. and Strongin, S. (1996). "Why are some industries more cyclical than others ?.
Journal of Business & Economic Statistics. April 1996, Vol 14, N.2
Petit, P. (1986) Slow growth and the service economy. Francis Printer, London. Spanish
edition consulted: El crecimiento lento y la economía de servicios (1987). Ministerio de
Trabajo y Seguridad Social, Madrid.
Petty, W. (1683) "Several essays in Political Arithmetic". London, 1683 and 1690. Referencia
tomada de Papeles de Economía Española, 1990, no 42.
Piore, M.J.; Sabel, C. (1984) La segunda ruptura industrial. Alianza Universidad, Madrid.
Porter, M. (1990) 77ie competitive advantage of nations. Macmillan, London.
Postner, H.H. (1982) "Problems of identifying and measuring intermediate (producer) services
in the compilation and use of inputoutput tables". Review of Income and Wealth: 28 (2): 217
41.
Quinn, J.B. (1988) "Technology in services: Past myths and future challenges" in Guile B.R.
and Quinn, J.B. (Eds), Technology in services: policies for growth, trade and employment
National Academy Press, Washington.
Quinn, J.B.; Baruch, J.J.; Paquette, P.C. (1988) "Exploiting the manufacturingservices
interface". Sloan Management Review, 29, summer: 4556.
Rada, J.F. (1987) "Information technology and services" in Giarini, O. (Ed.), The emerging
service economy. Pergamon Press, Oxford.
Rubalcaba Bermejo, L. (1996) Los servicios a empresas en España. Revista del Colegio de
Economistas.
Rubalcaba Bermejo, L. (1997) Los servicios a empresas en Europa: crecimiento y asimetrías.
Universidad de Alcalá, Madrid.
Rubalcaba, L; Villagómez, E. (1997) "Employment in European Business Services and the
Spanish Case". Vllth Annual Conference of RESER. Roskilde University, Denmark.
Ruiz González, M. (1988) "La innovación tecnológica como resultado de interacciones
complejas: sus consideraciones estratégicas". Alta Dirección, 138:121128.
Sáez, F. (Coord.) (1993) Los servicios en España: situación y tendencias. Fundación de
estudios de Economía Aplicada (FEDEA), Madrid.
Samuelson, P.A.; Nordhaus, W. (1993) Economies, 14aed. McGrawHill.
Sayer, A.R. (1989) "Postfordism in question". International Journal of Urban and Regional
Research, vol 13, no 4.
Schoenberger, E. (1987) "Frugal manufacturing". Harvard Business Review, 87.
Scott, A. (1988) Metropolis, from the division of labour to urban form. University of
California Press, Berkeley.
Senn, L. (1991a) "Desarrollo económico y demanda de servicios a empresas". Jornada de
trabajo sobre desarrollo económico y servicios. IMADE, Madrid.
Explanatory Factors of Business Services 18 5
Senn, L. (1991b) "Il fabbisogno dei servizi reali da parte delle imprese manufatturiere lombarde" in Unioncamere (Ed.) Offerta e domanda di servizi in Lombardia. Unioncamere Lombardia, Milán. Simon, H.A. (1945) Administrative behaviour, 2a ed. (1961). Macmillan Company, New York. Siniscalco, D. (1988) Structural change and the integration between industry and services Documento interne Universidad de Cagliari, LUISS, Roma. Soete, L. (1987) "The newly emerging information technology sector" in Freeman, C , Soete, L (Eds.), Technical change and full employment. Basil Blackwell, Oxford. Stanback, M. (1979) Understanding the service economy. John Hopkins, University Press, Baltimore. Stanback, T.M; Bearse, P.; Noyelle, T.; Karasek, R. (1981) Services: the new economy Allenheld & Osmar, Totawa, NJ. Storper, M.; Christopherson, S. (1987) "Flexible specialization and regional industrial agglomeration: the case of the US motion picture industry". American Association of Geography, 77: 104-117. Taylor, F.M. (1911) Principios de la administración científica. Edición de 1963. Herrero Hermanos, Buenos Aires. The Economist (1996) The ups and downs of services. The Economist July 6 t n 1996. The Economist (1997) Management consultancy: special survey. 77ie Economist March 22nd 1997. UNCTAD (1989) Services in the world economy. Trade and Development Report, 1988. United Nations, New York. Valery, N. (1987) "Factory of the future". The Economist, May 30: 3-18. Wood, P.A. (1986) "The anatomy of job loss and job creation: some speculations on the producer services sector". Regional Studies, 20: 37-46. Wood, P.A. (1991) "Flexible accumulation and the rise of business services". Transactions Institute of British Geographers. N.S. 16, 160-172. Zarnowitz, V. and Moore G. (1986). "Major changes in cyclical behaviour". In the American Business Cycle, University of Chicago Press, Chicago.

186 Business Services in European Industry
Annex 3.1
Tendency and cycle
Traditionally, tendency used to be considered as determinist, and was measured through constant
(or relatively constant) change rate, that is to say, through the adjustment of lines or smooth
curves, as for instance :
yt=a+bt+e, (I)
expression in which et resulting from subtracting to each observed value of yt its trend
(tendential) value, was a stationary variable overlapped, which showed the cyclical variations
(together with the stationary and aleatory ones). This problem arising from this measuring method
is that it is not certain that the tendency will respond to the two additions on the right in ( 1 ), and as
a result its suppression could falsify the estimated component of the cycle (or residue). Thus, an
important part of the cycle of the observed product in (1) can be derived from the stochastic
variation of the tendency, which has not been eliminated. Therefore, the vision of the cycle
would not be correct if it were taken as the answer to perturbations in variables without which,
they would otherwise follow a determinist tendency.
Therefore, the most obvious conclusion is that it is not correct to formulate simplifying
suppositions as to the stochastic or determinant (variable or constant) character of the tendency
Kydland and Prescott (1990) point out that the breaking down of a series of its cyclical
components and tendency must be a guided process for the following criteria: I) The trend
component of time series should be approximately curves summarising the whole of points; 2) the
lengthening of the sample period should not significantly affect the data deviation values, except
in final extremes; 3) the scheme should be well and objectively defined and easily reproduced.
Several procedures have been used according to the former statements in modern economies. The
HodrickPrescott filter is the most common procedure because it is straightforward for
implementation purposes. This filter defines a tendency (obtained form the original time series to
obtain the cyclical component) as the value of r which minimises the expression:
¿(y.-Oa+A
E[tai-0-(*i-*i-i)] m r=l f=2
where y is the time series and λ is an arbitrary parameter (normally the value of 100 for annual
series). If λ is relatively small, the adjustment is assimilated to the original series, while a λ
towards infinity make time series closer to a straight line. The main problems of this method
centre on the arbitrary character of the λ parameter and adjustment problems.

Chapter 4
Business Service Quality: How to Deal with It?
"May no man deceive himself. If any man among you seemeth to be wise in this world, let him become a fool, that he may be wise"
St. Paul, Ist Letter to Corinthians. 3. 18.
"Quality is not an end in itself: it is, and should clearly be seen to be, closely linked with efficiency and profitability"
R. Normann, Service management, page 149.

] 88 Business Services in European Industry

Business Service Quality: How to Deal with It I 89
Chapter 4 0) Business service quality: how to deal with it?
Introduction
Having presented the basic facts of business services in the previous chapters, in chapter 4 and 5 we aim to address directly the interest of companies using or providing business services. Chapter 4 will develop different concepts related to quality in business services, including the implications and consequences for those trying to implement what can be called service culture in enterprises. Chapter 5 deals with the strategic options in business services, both from the client and from the provider point of view.
The main target group for these chapters would be any person in charge of an activity in a company who is attempting to implement a plan in an effective and profitable way in order to take advantage of the opportunities offered by business services. This embraces those working in a service business as such - the consultancy sector, i.e. - as well as any employee of a company where this culture is sought implemented. Areas such as financial services, information systems, legal and human resources are often deemed "service" ones and therefore, any executive working in these areas should consider himself a person offering a service to the rest of the organisation.
Obviously, since the scope of this book is much wider, the analysis in these two chapters is restricted to the space limits, hence the absence of a quantitative approach and the need for giving brief explanations. The aspects which these two chapters deal with are so wide that much greater detailed analysis would be required. For this reason, together with the ideas presented and formulated, a bibliography is provided so the reader can follow up the references that are of interest to him. We hope these chapters help to clarify concepts, definitions and theory so that the reader can gain greater insight into how business service quality and management work; they aim to serve as a useful point of reference or guide to aid the reader in decision-making processes.
The author thanks the collaboration of Mercedes Domínguez (Consumer Marketing Manager, Shell España) in this chapter.
190 Business Services in European Industry
Chapter 4 focuses on quality and develops in the following way. In the first section, some definitions are given, presenting the main concepts related to quality processes in services. Based on the definition of services, and the interactive characteristics of services, an example of how to co-produce a quality service is provided. Afterwards, quality evaluation and measurement is explained, focusing on the ISO 9000 standards as the best known way to promote certified quality in services. Finally, this first section concludes by explaining the role of expectation in quality. Some major factors form the expectation spectrum, which tend to be so complex and dynamic in business services that systems can become more vulnerable to economic change.
The second section presents some ideas reinforcing the role of quality as a competitive or strategic factor for business companies. Quality can be establish as a strategic objective for supply and demand. If we focus on the supply point of view, the benefits of quality prove to be more significant than its costs. This can also be seen considering the relationship between quality and innovation processes.
The third and last section deals with certain economic factors affecting the business service quality. Once uncertainty is shown to be consubstantial to service activities, the role of imperfect information is analysed, explaining all the factors that obscure comparability and quality assessment in business services. The traditional economic problems of moral hazard and adverse selections are applied here to business services within a wider context.

Business Service Quality: How to Deal with It 191
4.1 Concept and measurement of quality
How do we measure a service? How can we tell if we are receiving a good or bad
service?. This is the key question. When asked about a certain service received, the
■ most common answer people are able to give is "it was good, bad, poor, excellent,
terrible, etc.". But if someone wants to go a step further and asks "why?", few people
are able to describe in more detail which aspects, facts or activities made the service
different or better than any others they have received. But before trying to answer the
question about measurement of quality, some definitions of quality need to be set down:
- Quality is the level of excellence that a company has chosen to achieve his key
clients ' satisfaction. It represents at the same time the measurement ofthat very
same quality. (Horovitz, 1991, page 1).
- The existing gap between client needs and expectations and his perception of the
service received. (Pérez, 1994, page 94).
- Quality: level of excellence of what is produced. (Denton, 1991, page 12).
- Quality: what a client is ready to pay according to what he has got and he
values. (Drucker, 1974).
These definitions present some common aspects as the main characteristics or factors to
be taken into account today for quality measurement: the client, his needs, his
perceptions and the level of excellence. What needs to be measured is that level of
excellence, which can vary from a service to another. Of course, the level of expectation
will vary from one client to another, depending of factors such as expertise and
qualification, culture, age, sex, but what is sure is that a client is not going to reclaim if
he receives more than what he was expecting.
Before leaving this definition of quality, in which the client plays a vital role, it is
important to recall that the evolution of quality has changed according to the evolution
of goods, production and economy. Fifty years ago, when the process of
industrialisation were expanded world wide, quality consisted of an inspection task to
approve those products without faults. Later, statistical quality control was introduced.
It comprised basically the same process of inspection, but involved taking samples from
different batches. The next step was to introduce a new concept to assure quality in all
processes within the company, involving all departments, personnel and suppliers.
Finally, we have reached a stage where quality is perceived as a strategic factor in the
management activity. Without it, no company will be able to compete as quality has
become a factor of competitive advantage.
As a corollary of the evolution of the concept of quality, the measurement of quality has
changed. When treated as a strategic factor, quality includes both external and internal
factors, the main ones being the client and the personnel working in a company,
respectively. Human factors. This is what makes difficult to measure quality, given the
subjective component of good standards of quality today.
192 Business Services in European Industry
To understand the mechanisms of these subjective factors, psychological and sociological components have been included in the different techniques in order to measure human behaviour. From the marketing standpoint, this will lead to one of the most important tools used today in market research: segmentation. In the marketing part of the next chapter, this concept will be developed in greater depth.
To measure the level of excellence, the first step is to comprehend client needs/expectations. Companies and clients have a very different perception of what is important when a service is produced. For example, to define its portfolio, an assurance firm will take into account: Range of products (car, house, life, retirement, etc.) to be offered, Profitability of products, Procedures, Modality of contracts, Length of contracts. Whereas the client will look into: Clarity of procedures, Easiness to deal with the company, Kindness of personnel, Timetables, Flexibility, Competitive advantages of contracts. The goal of quality measurement is to ascertain the perception that clients have of each characteristics of the service received from a qualitative and quantitative point of view in order to take the appropriate action.
In order to draw up the framework for the forthcoming process, it is beneficial to enter into an open discussion with the potential client with regard to their different expectations inside the organisation. This discussion can be performed as an interview with various people, whom prior to this have been categorised in terms of activity, competencies, skills, age, sex, level of income/education, habitat, etc. Afterwards, the company will have to assess whether it is necessary to prepare quality procedures, in which minimum quality standards are fixed. If so, the participation of all personnel involved is essential, because it is the way to share responsibility about the level of quality that the company wants to offer.
The next step is to name someone responsible for the implementation of this new management tool and to train the employees to use the new rules correctly. Frequently, companies forget to communicate these kinds of changes to all personnel within the company. It is important to highlight that in most cases, these changes represent a cultural turn of 180 degrees and that their implementation is not automatic. Instead, implementation is a time-consuming process (long-term process) and it is always advisable to start developing expectations among the employees, for instance by sending round periodical letters. These letters can be used to communicate throughout the whole process, the decisions taken, the next steps, the results of analysis and research, etc.
Another vital point is the commitment and support of the top management to make the process credible and consistent. Executive managers should be involved from the beginning of the process, giving assistance and going through any draft document. The reader may be wondering at this point, who -person/team- develops and puts into practice this project. Standard practice is to form a taskforce of several persons from different business units and departments, who will give the global view required, taking into account all the aspects that should be considered.
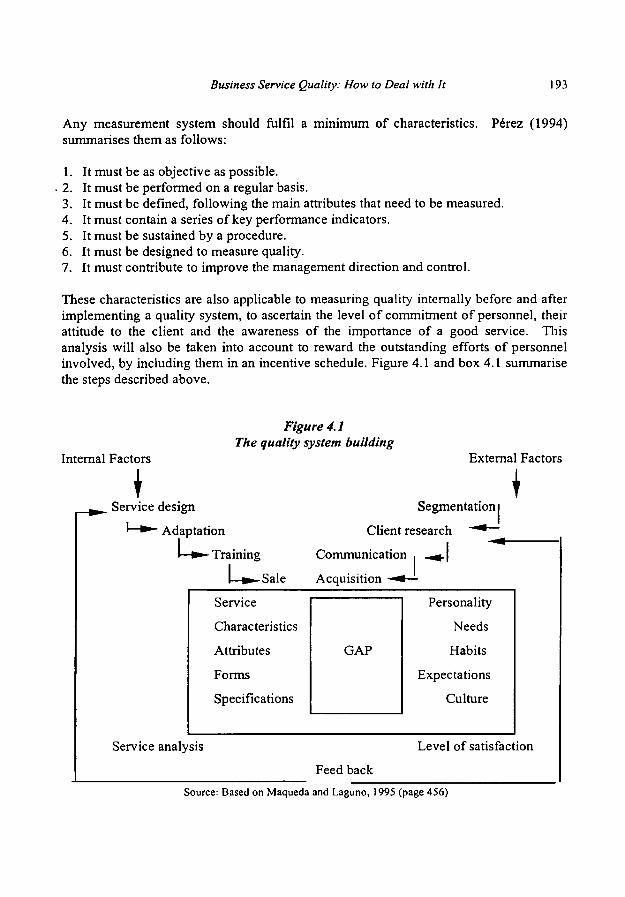
Business Service Quality: How to Deal with It 193
Any measurement system should fulfil a minimum of characteristics. Pérez (1994)
summarises them as follows:
1. It must be as objective as possible.
2. It must be performed on a regular basis.
3. It must be defined, following the main attributes that need to be measured.
4. It must contain a series of key performance indicators.
5. It must be sustained by a procedure.
6. It must be designed to measure quality.
7. It must contribute to improve the management direction and control.
These characteristics are also applicable to measuring quality internally before and after
implementing a quality system, to ascertain the level of commitment of personnel, their
attitude to the client and the awareness of the importance of a good service. This
analysis will also be taken into account to reward the outstanding efforts of personnel
involved, by including them in an incentive schedule. Figure 4.1 and box 4.1 summarise
the steps described above.
Figure 4.1
The quality system building
Internal Factors External Factors
♦ Service design
Adaptation
Training
Sale
Segmentationi
Client research ~^~"
Communication ■ _«
Acquisition ^ —
τ
Service
Characteristics
Attributes
Forms
Specifications
GAP
Personality
Needs
Habits
Expectations
Culture
Service analysis Level of satisfaction
Feed back
Source: Based on Maqueda and Laguno, 1995 (page 456)
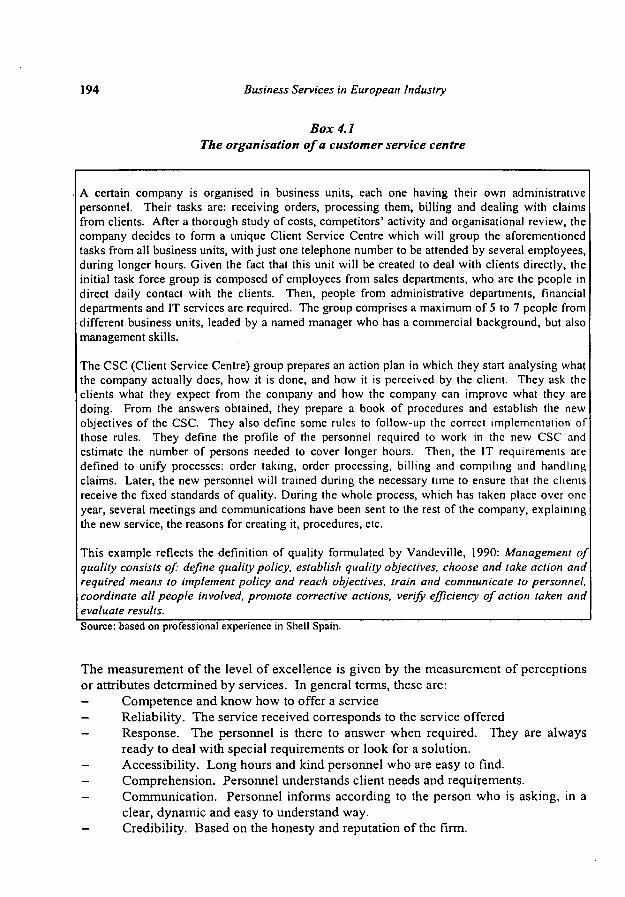
194 Business Services in European Industry
Box 4.1 The organisation of a customer service centre
A certain company is organised in business units, each one having their own administrative personnel. Their tasks are: receiving orders, processing them, billing and dealing with claims from clients. After a thorough study of costs, competitors' activity and organisational review, the company decides to form a unique Client Service Centre which will group the aforementioned tasks from all business units, with just one telephone number to be attended by several employees, during longer hours. Given the fact that this unit will be created to deal with clients directly, the initial task force group is composed of employees from sales departments, who are the people in direct daily contact with the clients. Then, people from administrative departments, financial departments and IT services are required. The group comprises a maximum of 5 to 7 people from different business units, leaded by a named manager who has a commercial background, but also management skills.
The CSC (Client Service Centre) group prepares an action plan in which they start analysing what the company actually does, how it is done, and how it is perceived by the client. They ask the clients what they expect from the company and how the company can improve what they are doing. From the answers obtained, they prepare a book of procedures and establish the new objectives of the CSC. They also define some rules to follow-up the correct implementation of those rules. They define the profile of the personnel required to work in the new CSC and estimate the number of persons needed to cover longer hours. Then, the IT requirements are defined to unify processes: order taking, order processing, billing and compiling and handling claims. Later, the new personnel will trained during the necessary time to ensure that the clients receive the fixed standards of quality. During the whole process, which has taken place over one year, several meetings and communications have been sent to the rest of the company, explaining the new service, the reasons for creating it, procedures, etc.
This example reflects the definition of quality formulated by Vandeville, 1990: Management of quality consists of: define quality policy, establish quality objectives, choose and take action and required means to implement policy and reach objectives, train and communicate to personnel, coordinate all people involved, promote corrective actions, verify efficiency of action taken and evaluate results. Source: based on professional experience in Shell Spain.
The measurement of the level of excellence is given by the measurement of perceptions or attributes determined by services. In general terms, these are: - Competence and know how to offer a service - Reliability. The service received corresponds to the service offered - Response. The personnel is there to answer when required. They are always
ready to deal with special requirements or look for a solution. - Accessibility. Long hours and kind personnel who are easy to find. - Comprehension. Personnel understands client needs and requirements. - Communication. Personnel informs according to the person who is asking, in a
clear, dynamic and easy to understand way. - Credibility. Based on the honesty and reputation of the firm.

Business Service Quality: How to Deal with It 195
— Security. Clients are protected against any physical, moral or financial risks. — Courtesy. Personnel maintains a correct relationship with clients. — Tangibility. Services are supported by tangibles, making them appreciate its
characteristics.
These elements can be measured using various methods, which combination will give a dynamic input of the level of excellence that a company is offering. Those methods include regular interviews with clients, standardised reports from personnel, telephone hotlines, special offers/campaigns, evaluation of best practices and analysis of claims. These methods should be translated into value, from days of delay, processing time, cost of lost hours, risk of clients going to a competitor, etc. It can be determined how much the lack of quality is costing a company and therefore, how much a company can save and gain in terms of competitive advantage.
As a summary, all the aspects developed regarding quality measurement lead to the concept of total quality, as a model of strategic management, including different elements: it is based on a philosophy seeking perfection, a wide range of techniques and procedures to solve problems, a series of principles at all levels helping managers to achieve objectives and a new concept of a relationship within the company, enabling employees to take decisions and making them responsible for their clients.2
4.1.1 Quality through the definition of services
According to the definition of services, quality is a concept which has to be present throughout the whole process, not only at the end, in the final product or service, as a value added. This value added needs to be identified, developed and applied from the beginning of the service production. This will provide the differentiation factor which will permit the service to be recognised as unique and outstanding.
This is based on the definition of services, in which, the main element shown in chapter 1 was the interaction between service provider and client as a quality input element. On this point, economic definitions discussed in chapter 1 coincide with some of the definitions coming from the business and administration world. In table 4.1 Grönroos (1990) makes a summary of service definitions from a management standpoint. Taking that into account, the most interesting aspect lies in trying to understand all the players that take part in the service concept and how they interact when the service-product is produced. This is due to the fact that when a service is produced, it is consumed and produced at the interactive time by the client too.
Richard Normann (1991) explains the interactive nature of services looking at the client participation in service operations. In the service management system the client appears
Literature on how total quality management systems are implemented is increasing and increasingly considers intra-organisational aspects like the ones discussed by Lewis, B. and Gabrielsen, G. (1998)

196 Business Services in European Industry
twice: as a consumer in the market segment and as part of the service delivery system.
The two aspects of the relationship with the client are interconnected, since it is of
course the totality that the client himself will evaluate (page 79). When talking about the
client as client and coproducer, Toffler (1980) uses the expression "prosumer" to
designate the increasing integration between the functions of production and
consumption. Given this fact, the management of the companyclient interface becomes
an extremely important and delicate task for any service organisation. Therefore, the
following issues are involved:
Different dimensions, such as peopleequipment, where people have to
interconnect directly with the tools offered by service companies, i.e. banking
software, automatic payment systems, etc.
Functions, such as specification of the service, coproduction, quality control
participation or maintenance of the motivation
— Modes of participation: physical, intellectual or emotional
— Participation in the development and marketing of the service system
Table 4.1.
Service definitions in business management literature
DEFINITIONS
Service: Activities, benefits or satisfactions which are offered for sale, or provided
in connection to the sale of goods.
Services represent either intangibles yielding satisfaction directly (transport,
housing), or intangibles yielding satisfactions jointly when purchased either with
commodities or other services (credit, delivery)
Marketed services: a market transaction by an enterprise or entrepreneur where the
object of the market transaction is other than the transfer of ownership (or title, if
any) of tangible commodity.
For the customer, services are any activities offered for sale that provide valuable
benefits or satisfaction; activities that he cannot perform for himself or that he
chooses not to perform for himself.
A service is an activity offered for sale which yields benefits and satisfaction
without leading to a physical change in the form of a good.
Services (are) separately identifiable, intangible activities which provide
satisfaction when marketed to consumers and/or industrial users and which are not
necessarily linked to the sale of a product or another service.
A service is an activity or a series of activities which take place in interactions with
a contact person or a physical machine and which provides consumer satisfaction.
Services are any intangible benefit, which is paid directly or indirectly, and which
often includes a larger or smaller physical or technical component.
A service is any activity or benefit that one party can offer to another that is
essentially intangible and does not result in the ownership of anything. Its
production may or may not be tied to a physical product.
The meeting of customer expectations in the course of selling and postsales
activity through providing a series of functions which match or better the
competition in a way which provides an incremental profit for the supplier.
Services is something which can be bought and sold but which you cannot drop on
your foot.
AUTHOR/YEAR
American Marketing
Association. 1960, p.
21
Reagan. 1963, p. 57
Judd. 1964, p. 59
Bessom. 1973, p. 9
Blois. 1974, p. 157
Stanton. 1974, p. 545
Lehtinen. 1983, p. 21
Andresen et al. 1983, ρ
6
Kotler and Bloom
1984, p. 147; and
Kotler. 1988, p. 477
Free. 1987, p. 75
Gummesson. 1987b, p.
22.
Source: Grönroos (1990)
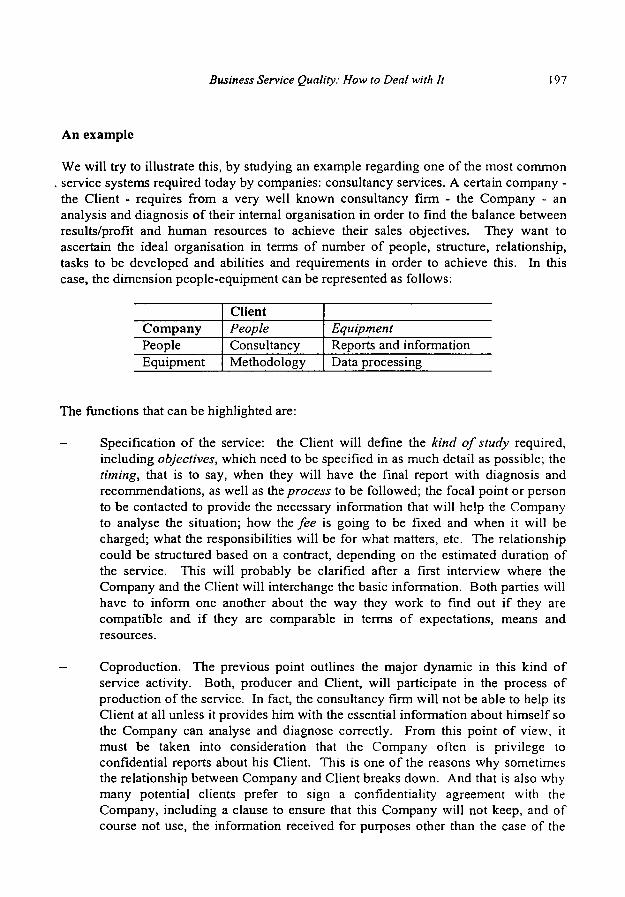
Business Service Quality: How to Deal with It 197
An example
We will try to illustrate this, by studying an example regarding one of the most common . service systems required today by companies: consultancy services. A certain company -the Client - requires from a very well known consultancy firm - the Company - an analysis and diagnosis of their internal organisation in order to find the balance between results/profit and human resources to achieve their sales objectives. They want to ascertain the ideal organisation in terms of number of people, structure, relationship, tasks to be developed and abilities and requirements in order to achieve this. In this case, the dimension people-equipment can be represented as follows:
Company People Equipment
Client People Consultancy Methodology
Equipment Reports and information Data processing
The functions that can be highlighted are:
- Specification of the service: the Client will define the kind of study required, including objectives, which need to be specified in as much detail as possible; the timing, that is to say, when they will have the final report with diagnosis and recommendations, as well as the process to be followed; the focal point or person to be contacted to provide the necessary information that will help the Company to analyse the situation; how the fee is going to be fixed and when it will be charged; what the responsibilities will be for what matters, etc. The relationship could be structured based on a contract, depending on the estimated duration of the service. This will probably be clarified after a first interview where the Company and the Client will interchange the basic information. Both parties will have to inform one another about the way they work to find out if they are compatible and if they are comparable in terms of expectations, means and resources.
- Coproduction. The previous point outlines the major dynamic in this kind of service activity. Both, producer and Client, will participate in the process of production of the service. In fact, the consultancy firm will not be able to help its Client at all unless it provides him with the essential information about himself so the Company can analyse and diagnose correctly. From this point of view, it must be taken into consideration that the Company often is privilege to confidential reports about his Client. This is one of the reasons why sometimes the relationship between Company and Client breaks down. And that is also why many potential clients prefer to sign a confidentiality agreement with the Company, including a clause to ensure that this Company will not keep, and of course not use, the information received for purposes other than the case of the

198 Business Services in European Industry
study. Keeping that in mind, both companies should work together with a good team spirit, seeking a solution or for some alternatives to the question that the Client is trying to solve.
- Quality control participation. The Client might include this aspect to assure that the service he is receiving is correct (=the service that has been contracted, according to the agreed terms). A way to do so could be for a focal point from the Client to participate with the Company whilst the analyst personnel is treating the information received, to make sure that the latter understands the information and use it correctly, by clarifying any misunderstandings or confusion of certain details.
- Maintenance of the motivation. The Company may decide to involve Client participation as part of the delivery process because it may provide benefits for its employees in terms of interesting experiences or evaluation feedback.
The modes of participation would be: - Physical, when people from the Company and the Client meet - Intellectual, when they share information and help each other to reach the right
diagnosis. - Emotional, when the Company shows a clear understanding of the Client case.
This empathy is often the key to Client satisfaction.
As regards the participation in the development and marketing of the service supply, this will be produced by the Client every time he sits down with the Company in order to analyse and review the whole process. These meetings should be held on a regular basis - once weekly, every ten days or fortnightly - as mentioned above. From this angle, the good Client is as essential to successful development as any other factor.
Finally, the Client will participate in selling and marketing the service received if he has obtained the expected results from the Company by word-of-mouth recommendations or by formal reference. When talking about "expected results" we would like to point out that the results may not always be immediately favourable for the Client. For example, one of the Company's recommendations might be to sell one of their products or to close down an office, because these are not profitable enough and the investment required to retain them does not justify the results expected over a specific period of time. These are the kind of recommendations that no client likes to receive. However, if the Company has made a good study and has been able to diagnose the problem correctly, the Client will recognise professional and competent work because it was conducted according to the specifications agreed between them before any work was started. In this case, the Company has achieved "excellence", as described by Thomas Peters and Robert Waterman (1992). The benefits for the Client can be defined as the result of team work, transformed into greater self-knowledge, in other words, now he is aware of the problems faced and what the solutions might be, so he is ready to inject new energy into the business to make it continue. Physically, it will take the form of a report containing analysis, diagnosis and recommendations. This report is therefore the

Business Service Quality: How to Deal with it 199
visible part of the service system, but as we have seen, the service is a much more complex process, full of interconnections and interchanges where the invisible aspects are crucial for the success or quality of the service system.
. 4.1.2. Quality evaluation
From both the company and client point of view, consistent quality evaluation is an important element to business service success. The goal is to secure that all products, processes and services are produced, when possible, in a controlled way and according to applicable specifications, standards and procedures. For this purpose, different tools can be used: quality audit, certification and ISO 9000 series.
Quality audit consists of the formal evaluation of performance compared with established standards. Its main objective is to identify the barriers to implementing the required quality, and to provide information to improve the service quality. External expertise is often called in to obtain a profound and objective evaluation of the service company performance. It can also be ran internally, as part of the whole quality system. 3
Specific certifications are used to confirm that a certain service is produced according to established standards and are usually prepared by private entities or manufacturers. The advantages of working with certifications are clear: it provides confidence to the client, who is sure to receive a quality service, it makes services more competitive, it reaches all kind of clients, it helps to forecast results.
ISO 9000 series are formed by a group of quality system standards which were assembled in 1994 from BS EN ISO 9001:1994, BS EN ISO 9002:1994 and BS EN ISO 9003:1994. The initials stand for International Standards Organisation. These series have been developed to meet with the following definition (Holmes, 1995): Quality is meeting the requirements. The quality elements set out in ISO 9000 series are common to any organisation, as they form the basic principles dealing with procedures, responsibilities and organisation of quality within a company.
There are 11 standards in the ISO 9000 series. The complete list of the ISO 9000 series is shown in Table 4.2. ISO 9001, ISO 9002, ISO 9003 and ISO 9004-2 are intended to be used as specifications for quality management systems. The other eight are intended to give either guidance to the application of the other three in specific circumstances or help in implementing quality improvement. Therefore, it is necessary to know what the company objective is to chose the appropriate part as certification. Table 4.3 shows the
There are many ways to evaluate quality. Some of them are very formalised while others are rather informal and subjective. An example of a quite complete system to evaluate quality is SERVQUAL, discussed by Llosa, S. et alt (1998) based on a 22 item scale with the five following dimensions: tangibles, reliability, responsiveness, assurance and empathy.
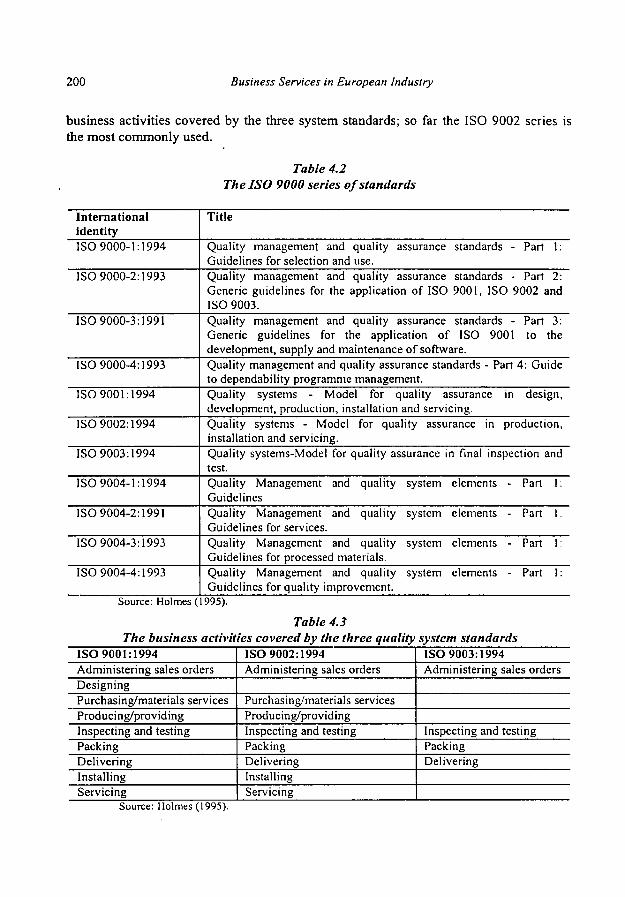
200 Business Services in European Industry
business activities covered by the three system standards; so far the ISO 9002 series is the most commonly used.
Table 4.2 The ISO 9000 series of standards
International identity ISO 9000-1:1994
ISO 9000-2:1993
ISO 9000-3:1991
ISO 9000-4:1993
ISO 9001:1994
ISO 9002:1994
ISO 9003:1994
ISO 9004-1:1994
ISO 9004-2:1991
ISO 9004-3:1993
ISO 9004-4:1993
Title
Quality management and quality assurance standards - Part 1 : Guidelines for selection and use. Quality management and quality assurance standards - Part 2: Generic guidelines for the application of ISO 9001, ISO 9002 and ISO 9003. Quality management and quality assurance standards - Part 3: Generic guidelines for the application of ISO 9001 to the development, supply and maintenance of software. Quality management and quality assurance standards - Part 4: Guide to dependability programme management. Quality systems - Model for quality assurance in design, development, production, installation and servicing. Quality systems - Model for quality assurance in production, installation and servicing. Quality systems-Model for quality assurance in final inspection and test. Quality Management and quality system elements - Part 1 : Guidelines Quality Management and quality system elements - Part 1 : Guidelines for services. Quality Management and quality system elements - Part 1 : Guidelines for processed materials. Quality Management and quality system elements - Part 1 : Guidelines for quality improvement.
Source: Holmes (1995). Table 4.3
The business activities covered by the three quality system standards ISO 9001:1994 Administering sales orders Designing Purchasing/materials services Producing/providing Inspecting and testing Packing Delivering Installing Servicing
ISO 9002:1994 Administering sales orders
Purchasing/materials services Producing/providing Inspecting and testing Packing Delivering Installing Servicing
ISO 9003:1994 Administering sales orders
Inspecting and testing Packing Delivering
Source: Holmes (1995).

Business Service Quality: How to Deal with It 201
Regarding the requirements of ISO 9000 series, a summary is outlined below.
Management responsibility. As mentioned above, the attention and success of quality management is directly linked to the strategic support offered by the top management team. Following this, management needs to clearly state its policy on quality in a written document. The major points to be included are: - Statement that good quality performance is an essential part of the
company business strategy and vital to client satisfaction - Prevention of poor quality is more profitable than its detection and
correction - Quality means fitness to purpose and understanding that everybody in
the organisation has to be enabled and encouraged to make quality a way of work.
Quality system. After the management team has defined and supported the quality policy, this needs to be made concrete through a quality system. ISO 9000 requires the system to be documented through a quality manual, which can be used by the whole organisation. In fact, this is the reasonswhy any aspect related to quality needs to be documented, so new staff can take charge of them properly. The quality manual is a document where responsibilities and tasks are clearly defined, quality standards are established, the required resources are prepared and an effective feedback mechanism is created. It will also include procedures and instructions, as well as documents which sustain those procedures such as cards, forms, etc. Apart from the external pressures to assure clients that services have been produced under a recognised quality system, the continual improvement of quality enables cost reduction and growth in market share. It has become part of the business strategy to be able to supply quality proved services. Consequently, it can be confirmed that the lack of this kind of control produces costs which can be measured. This will be analysed in more depth later on this chapter.
Contract review. The fact that the client not always knows what can be anticipated from the service also makes him unable to instruct the service company in an accurate way. ISO 9000 hence provides useful guidelines to the client by specifying what can be expected of the service. Besides, when referring to service production, this is not always done through a legal contract. Therefore, why not provide the client in order to help the provider?. It is in everyone's interest that the client/provider interface is effective. One way to do that is providing the people within the organisation with checklists, containing any relevant information about the service. They will use them every time they get in touch with the client (private or company). At the same time, the company has to make sure that it can provide the service defined. The point of contract review is to establish the goal for the job. Fulfilling the outlined criteria can be considered good quality.
202 Business Services in European Industry
Design control. This is a requirement needed by companies where design is part of an operation. In those cases, ISO 9001 is the applicable standard. It does not apply to companies working according to ISO 9002. Service companies usually do not fall into this kind of activity. Therefore, design control is not one of the major issues.
Document and data control. ISO 9000 requires that all systems documentation is controlled. This includes the quality manual, procedures, instructions and forms originated in and outside the company. Responsibility for data control needs to be clearly defined. The tasks of the named person will include update of procedures, controlled copies of any documentation, controlled editions, location, etc.
Purchasing. This requirement means that purchased material will aid the provision of the defined service. It is necessary to specify the company requirement to do so before any order is sent. The aim of purchasing is to assure the right relationship with suppliers and that the correct delivery of products/services to the company. If the supplier is also working according to ISO 9000, his contract review will complement the company's one.
Control of the client-supplied service. The requirement consists of establishing and maintaining procedures to verify and care for the product that the company is going to offer. This can seriously complicate the nature of services due to the interchange between producer and client. Therefore, any service company will base this requirement on the experience they already have with previous clients. The company should be able to show how it provides its product and what the results have been in similar circumstances.
Product identification and traceability. The application this requirement has for service production means that at any stage of the service production, the company has to be able to identify the service status and inform the client about it. Traceability is not strictly necessary for ISO 9000. But contrary to what happens with products, given the intangible nature of services, this quality control can be substantial in the service production case, because, it will increase the level of confidence of the client and diminish his feeling of high risk.
Process control. This requirement does not indicate how a job should be done, but ISO 9000 does set down fundamental practices which must be carried out in an operation to help achieve the consistent and profitable satisfaction of the client requirements. Process control requires the company to take a careful and objective look at the process and identify those aspects which, if not carefully controlled, can adversely affect quality. This may seem quite obvious, but many clients have suffered due to its absence when receiving a service. To meet this requirement, a concrete action is usually an useful tool. Evidence that

Business Service Quality: How to Deal with It 203
control exists might include documented instructions for carrying out an operation, instructions on a job portfolio about the nature and number of measurements to be taken, the use of trained, capable personnel who have a clear definition of what is acceptable and what is not, care to ensure that the working environment is conducive towards achieving quality, etc.
Inspection and testing. This requirement is related to the method of verification that the service received is in line with requirements. For example, one of the most common methods used by service companies is the questionnaire to clients after the service delivery. Methods of verification help to maintain records so that in the event of service being found non-conforming, corrective action can be taken. ISO 9000 requires that inspection and testing can be shown through documentation which includes the pass/fail criteria.
Control of inspection, measuring and test equipment. This requirement applies to the accuracy with which measurements and verifications needed have been defined, as well as to the suitability of equipment and software to carry out the quality plan. The emphasis is normally on specifying the minimum accuracy level required. This requirement is applicable to product manufacturing rather than to service production. However, a service company which is able to make the service it can supply physical, could include this requirement in his ISO 9000 standards. For example, banking services could include in their quality plan a minimum level of quality for their credit cards production, to make sure they reflect the defined image in a proper standard way.
Inspection and test status. This regards the work which does not meet requirements, and which must be clearly identified. The methods of identification are many. The aim of this requirement is to show which of the checks required by the quality plan have been completed and what the outcome of each has been, mainly in order to prevent any work which does not meet specification, from inadvertently being used or further processed.
Control of non-conforming service. This requirement covers what should happen when some work has been produced which does not meet the defined specifications. If a non-conforming service is produced, tools for analysis must be put in place, because production system can not be stopped, as it should be in the case of product manufacturing. In some cases of service production, this is indeed possible, for example, a consultancy firm could stop its project if the clients detect a failure in the information treating process. The quality plan should demonstrate what quality checks should be carried out on reworked services to ensure that it fully conforms to specification and that it can not reach the client if it does not.
Corrective and preventive action. The requirements described above will generate files of information, giving indications as to how to make the business
204 Business Services in European Industry
more profitable. ISO 9000 requires the effectiveness of the corrective action to be monitored and, if successful, for procedures to be changed to incorporate a preventive action. The usual practical way of meeting the corrective and preventive action requirement is to set up the following procedures: to deal with supplier problems, in-house problems, and client problems; to encourage and facilitate their use; to have the data summarised and reviewed at recorded corrective action meetings. A pound spent on prevention saves many pounds of failures, thus reducing total costs.
Handling, storage, packaging preservation and delivery. This requirement of ISO 9000 is concerned with activities directly related to the basic production processes. To do this, a list of the hazards to which a product/service is susceptible is the most useful way to identify methods and tools. In the case of service production, handling, storage and packing is not applicable. But there is no doubt that delivery is vital. This requirement relies on the most important aspect concerned with service production, that is to say, time. This aspect should be covered at the contract review stage and procedures must be in place to ensure that the quality of service received and the execution of the contract meet the defined requirements.
Quality records. A quality record is any information which demonstrates whether or not the service complies to specification or whether the quality system is working. They include approved supplier lists, certificates of conformity, external reports, purchase orders, training records, etc. For each quality record it is necessary to decide who is responsible for keeping it, where, how and for how long and what is done with it after the period of retention. The list of quality records for ISO 9000 must be available for client examination.
Internal quality audits. ISO 9000 requires internal audits to be carried out routinely. This can be done inside the company or this can be outsourced. The only requirement is that these audits fall under the control of the company. The purpose of internal audits is twofold: firstly, to establish that the document system meets the requirements of ISO 9000, and secondly that practice is in accordance with the document system. In other words, they check that the company is actually doing what the documents say it has to do. There have to be written procedures for internal auditing showing that there is an audit programme which recognises the relative importance of each aspect of the system, how audits are carried out, how their findings are recorded and reviewed and how corrective action is taken. Internal audit results should be included in management reviews of the system.
Training. ISO 9000 requires that anyone who has specific responsibility for activities which could affect quality must be qualified, that training needs must be regularly assessed and that any training needed must be provided. Records
Business Service Quality: How to Deal with ft 205
must be kept to show the status of reviews of training requirements and training given. Given the fact that nearly all parts of the organisation have a relation to quality management, it is beneficial to set up structures to ensure that individual training is carried out and reviewed on an annual basis. These procedures will also describe how training will be provided. Its execution and effectiveness needs to be recorded.
Statistical techniques. ISO 9000 requires the need for statistical techniques to be identified for establishing, controlling and verifying process capability and service characteristics. Once this need has been identified, then there must be procedures covering their application. It is interesting to check if Statistical Process Control (SPC) techniques can be used. SPC means understanding that every process will produce slight variations in the result of the process. Careful measurement can establish that variability in numerical terms. This will be in accordance with client requirements. Also, control charts can be produced to decide when a correction is required, before any unacceptable work has been produced. Once again, this requirement is more applicable to product manufacturing than to service production, but if a company is able to define client requirements in numerical terms, this system could be also valid for services.
Once the main requirements of ISO 9000 series have been reviewed, the question about implementation may arise. Implementing ISO 9000 is a major decision for a company. It is not a natural development, it requires a deliberate will and discipline to adopt it. It usually includes great changes in the culture and impact on the daily work in the company. As it has already been mentioned, commitment is important. It has its roots in understanding the following basic points: quality is meeting the requirements, the right approach to quality is prevention of bad quality and understanding the costs of quality.
K. Holmes (1995) summarises the recommended sequence to start ISO 9000 implementation. This is shown in table 4.4. This sequence may be a helpful tool for those companies interested in ISO 9000 series as they do not know what to do and where to start. It can also be interesting for any company which is not immediately ready to work according to ISO 9000, but which is trying to implement a quality system.
Service companies do not usually have ISO 9000 certificates. However, an increasing part of the service production has to do with procedures that might follow the ISO 9000 series and the efforts required to implement the standards are clearly counterbalanced by future benefits and competitive advantages. Therefore, it is strongly recommended that this effort be made, thus contributing to the growth of the economy and successful evolution of this sector.

206 Business Services in European Industry
Table 4.4 Quality system implementation
1 2 3 4 5 6 7 8 9 10 11 12 13 14 15 16 17 18 19 20
Ensure top management understanding Gain management commitment Quality cost measurement Select specialist help Brief all employees Set up steering group Decide how suppliers will be approved Decide how purchases will be verified Draft quality policy Draft quality plans Start supplier selection and monitoring Write manual, procedures, instructions Implement procedures Apply for assessment Carry out reviews, audits, corrective action Pre-assessment check by outsider Corrective action Assessment Celebration Continual improvement
Source: Holmes (1995, page 43).
4.1.3 Qualifying quality
The previous points have considered the key elements supporting the need for a quality system in businesses and the main ways/instruments to achieve this. However, it is useful to note some additional aspects that increase the quality process; aspects which reinforce the qualifications needed for quality. The principal ones include: quality-oriented organisation and management, specific training of personnel, human resources policy, ITC incorporation, outsourcing, service evaluation, and benchmarking, among others. Of course, many of these aspects depend on the type of service involved.
Barcet and Bonamy (1994) develop different qualification processes depending on the tangible nature of services and the implication of means and results. In some services, methodology and contents are much more difficult to evaluate, control and certify. These authors have elaborated a very interesting table (see table 4.5) which allow to know how and up to which point a specific service can be qualified
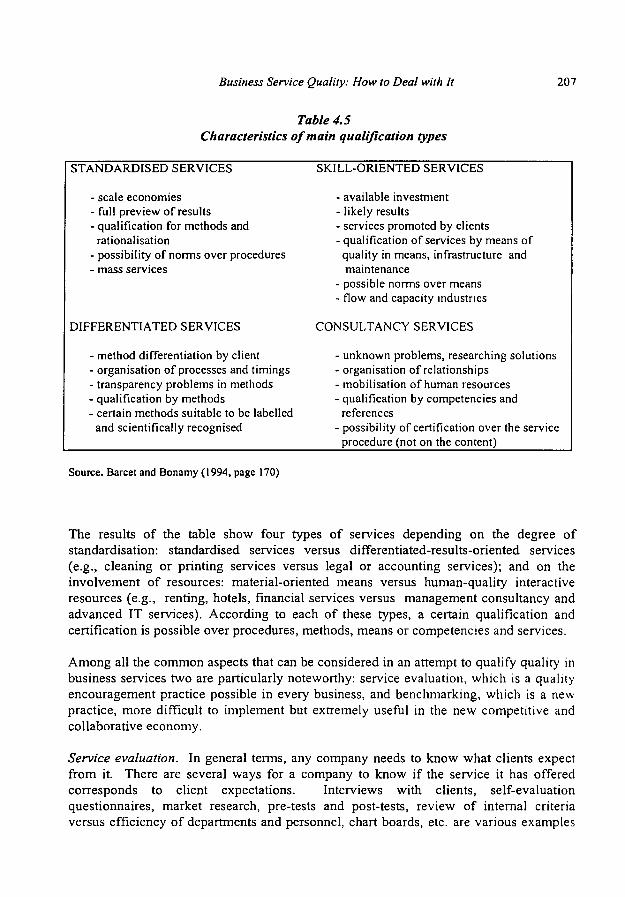
Business Service Quality: How to Deal with It 207
Table 4.5 Characteristics of main qualification types
STANDARDISED SERVICES
- scale economies - full preview of results - qualification for methods and
rationalisation - possibility of norms over procedures - mass services
DIFFERENTIATED SERVICES
- method differentiation by client - organisation of processes and timings - transparency problems in methods - qualification by methods - certain methods suitable to be labelled
and scientifically recognised
SKILL-ORIENTED SERVICES
- available investment - likely results - services promoted by clients - qualification of services by means of
quality in means, infrastructure and maintenance
- possible norms over means - flow and capacity industries
CONSULTANCY SERVICES
- unknown problems, researching solutions - organisation of relationships - mobilisation of human resources - qualification by competencies and
references - possibility of certification over the service
procedure (not on the content)
Source. Barcet and Bonamy (1994, page 170)
The results of the table show four types of services depending on the degree of standardisation: standardised services versus differentiated-results-oriented services (e.g., cleaning or printing services versus legal or accounting services); and on the involvement of resources: material-oriented means versus human-quality interactive resources (e.g., renting, hotels, financial services versus management consultancy and advanced IT services). According to each of these types, a certain qualification and certification is possible over procedures, methods, means or competencies and services.
Among all the common aspects that can be considered in an attempt to qualify quality in business services two are particularly noteworthy: service evaluation, which is a quality encouragement practice possible in every business, and benchmarking, which is a new practice, more difficult to implement but extremely useful in the new competitive and collaborative economy.
Service evaluation. In general terms, any company needs to know what clients expect from it. There are several ways for a company to know if the service it has offered corresponds to client expectations. Interviews with clients, self-evaluation questionnaires, market research, pre-tests and post-tests, review of internal criteria versus efficiency of departments and personnel, chart boards, etc. are various examples

208 Business Services in European Industry
of methods which can be used to evaluate the service produced for a client. Moreover, the basis of any evaluation is what the company wants to know, in order to take the corrective actions afterwards. A company that wants to improve the service that it is producing has to decide how many and which measures of evaluation to use. There is not just one solution, one method. Usually, a combination results in a variety and richness of information, which will give clues about the path to take. It is also necessary to decide about criteria. A company may be excellent in some aspects of the service offered whereas it is not so good in other aspects, because the criteria are not correct. And of course, procedures, personnel training, organisation and resources need to be analysed periodically. The whole evaluation system adopted must be as objective as possible. Therefore, the persons responsible for its implementation will receive proper training. They need to know the objective of their work and they need to be supervised to avoid personal views and opinions about facts and problems creeping in. It is also important for all employees to be familiar with the system. This will assure their commitment to it. A degree of stress from managers is recommended but it has to be channelled in a positive way, trying to leam from mistakes and not imposing penalties when something has been done badly. Besides that, sharing the results obtained by displaying them visually is always helpful. This means that computer systems are used to assess and measure the service produced, thus permitting a regular evaluation and follow-up process by the whole organisation with the appropriate level ofinformation at each stage. If everyone is made to feel part of the process, the degree of responsibility will rise and all will work to do things right the first time.
Benchmarking. In an increasingly competitive world, where changes occur so quickly, companies need to update their systems constantly. A more and more common method which is being used to improve performance and keep the company ranking at the edge is benchmarking. This basically consists of the collaboration of different companies to prepare a case study and analyse it in order to take the points learnt and conclusions and implement them in their respective businesses. The novelty lies in the fact that on many occasions, companies from different sectors or even from the same sector (natural competitors) agree to work together in such a way. Globalisation, transparency and information/communication technologies have made this possible. In the case of quality evaluation this practice could have an interesting role, as it could lead to the establishment of a global quality methodology based on the previously identified, analysed and adapted best practise from the most outstanding performer. It is important to highlight that the sponsorship of management is usually required in order to start this kind of process, which can be oriented in various directions: a specific area of the business, a whole business unit, organisation analysis, sector analysis, etc. The usual steps are summarised below in Table 4.6. Finally, the intervention of public policies could be required or necessary in some cases (e.g., benchmarking of the framework condition in which companies work). The aim would be to prepare a Quality Policy, although it is always preferable for private initiative to produce this kind of regulation, which enables and challenges continuous competitiveness. From this stance, there are some specific actions which can be led by public policies in order to either review the existing law or to speed up the implementation of quality systems by companies (see
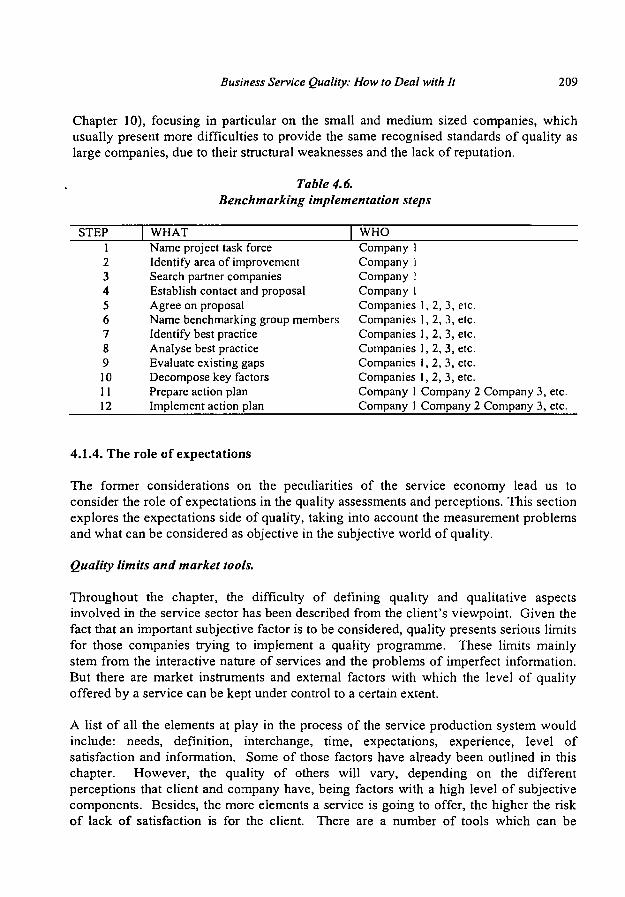
Business Service Quality: How to Deal with It 209
Chapter 10), focusing in particular on the small and medium sized companies, which usually present more difficulties to provide the same recognised standards of quality as large companies, due to their structural weaknesses and the lack of reputation.
Table 4.6. Benchmarking implementation steps
STEP WHAT WHO 1 Name project task force 2 Identify area of improvement 3 Search partner companies 4 Establish contact and proposal 5 Agree on proposal 6 Name benchmarking group members 7 Identify best practice 8 Analyse best practice 9 Evaluate existing gaps 10 Decompose key factors 11 Prepare action plan 12 Implement action plan
Company I Company 1 Company 1 Company 1 Companies I, 2, 3, etc. Companies 1, 2, 3, etc. Companies 1, 2, 3, etc. Companies 1, 2, 3, etc. Companies 1, 2, 3, etc. Companies 1, 2, 3, etc. Company 1 Company 2 Company 3, etc. Company 1 Company 2 Company 3, etc.
4.1.4. The role of expectations
The former considerations on the peculiarities of the service economy lead us to consider the role of expectations in the quality assessments and perceptions. This section explores the expectations side of quality, taking into account the measurement problems and what can be considered as objective in the subjective world of quality.
Quality limits and market tools.
Throughout the chapter, the difficulty of defining quality and qualitative aspects involved in the service sector has been described from the client's viewpoint. Given the fact that an important subjective factor is to be considered, quality presents serious limits for those companies trying to implement a quality programme. These limits mainly stem from the interactive nature of services and the problems of imperfect information. But there are market instruments and external factors with which the level of quality offered by a service can be kept under control to a certain extent.
A list of all the elements at play in the process of the service production system would include: needs, definition, interchange, time, expectations, experience, level of satisfaction and information. Some of those factors have already been outlined in this chapter. However, the quality of others will vary, depending on the different perceptions that client and company have, being factors with a high level of subjective components. Besides, the more elements a service is going to offer, the higher the risk of lack of satisfaction is for the client. There are a number of tools which can be
210 Business Services in European Industry
adopted to make those elements as measurable as possible, thus reducing the risk of non fulfilment.
Experience. Both client and company usually have a certain degree of experience in their respective fields, prior to their first contact. In turn, both have also received and produced services. Consequently, it is very important that both parts clarify the level of experience they have. For example, a medium-sized company needs to install new software equipment and they are looking for a consultancy group to analyse what kind of programmes they would need. Normally, they will look for a specialised firm with similar characteristics (medium sized), flexible and dynamic enough to solve their problem, but at the same time, which can provide them with the personnel with the appropriate technical knowledge. Initially, SMEs would not approach a large consultancy firm. However, this is not a rule and a large company can occasionally offer the right service for a small one. Therefore, an open interview between both parties is highly recommended. During the interview, the client should explain his needs and expectations and the potential producer should be able to identify those needs with some previous experience in terms of volume, personnel required, means, etc. and explain to the client what they are ready to supply. In case either of the parties perceives some interference, it is always better to say so. And of course, the reverse also occurs, which sometimes is even more important: large companies may subcontract small ones for the required service.
Interchange. In the case of two companies starting a relationship to produce/receive a service, a significant number of interchanges will occur. Information will be shared, discussed, analysed and produced. Despite the fact that information is considered as an objective element, it has to be taken into account that information can be imperfect all throughout the process because the client does not have the means to compare what he is receiving in terms of classical market structures. That is to say, he can not buy a service the same way he buys a product in the supermarket, where a wide range of items can be seen and compared. Conversely, services can not be compared because they are produced and received via an interaction between the provider and the client. From this perspective, interchange becomes an important element between both parties. They will interchange not only information, but also, experience, knowledge, energy and time. A whole series of things for which a special stream needs to be created, where personal relationship is going to play a principal role as well.
Level of demand. A client can define very well what he demands in terms of products, time, price, etc. What he will not clarify is at which point of exigency he is accustomed to work. When a company asks a publicity agency to prepare a campaign, they will prepare a briefing explaining the quantitative objectives they have, the communication objectives, the target they want to reach, the
Business Service Quality: How to Deal with It 211
strategy defined to achieve their objectives, etc. but they will not define what they expect from the proposal that the agency has to prepare in terms of additional ideas, effort invested to match the briefing with the proposal, means used to prepare and present the proposal, etc. However, the company will be able to evaluate these hidden elements because they have previous experience. Somehow, they will be able to say: "You have understood what we are looking for". If the agency has devoted time to familiarising itself with and understanding the company, the products, the market, the competitors, the distribution system, the target, etc. this will be reflected in a more accomplished and professional job. But the client would not ask the agency to do so.
Level of satisfaction. It is relatively easy to render a service, but does this mean that the company has attained client satisfaction? The level of satisfaction is related to the expectations that the client may have. The higher the expectations fulfilled, the higher the level of satisfaction will be. If a client says that he is satisfied with the service he has received, the service has accomplished its function. However, this does not mean that the expectations that the client had initially are fulfilled. This is because every time a company offers a service, it needs to sell that service to a client.
The expectation spectrum
The former considerations lead us to establish a spectrum of expectations which are decisive for the business service quality. Companies will have to evaluate the value of use within a context of uncertainty created by many expectation factors. Service production is always a dynamic process and changes throughout its implementation. Consequently, expectations also suffer variations from the beginning to the end of the process. There are at least six elements which influence the client's expectations (Rubalcaba, 1997): — The client's production capacity — The company's production capacity — The client's experience — The company's experience — The real effectiveness of the service produced — The kind of relationship established with other clients/companies which will lead
to comparisons among the different services being received/produced.
All these elements are clearly interconnected and each of them produces the perception that the client will have versus the rest of the services received. Besides, many other external factors will affect the final perception or level of satisfaction. The aforementioned elements can be represented through the figure 4.2.
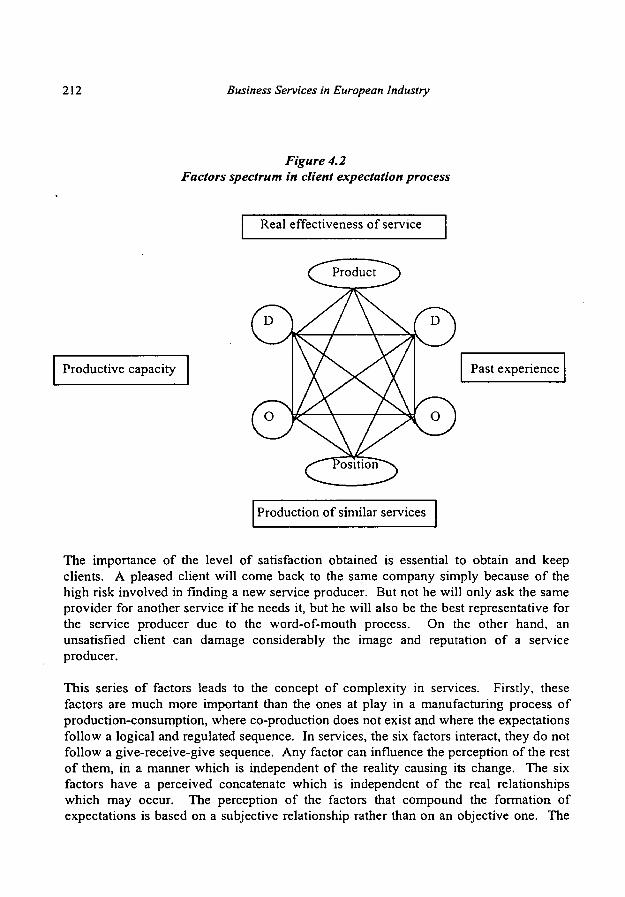
212 Business Services in European Industry
Figure 4.2 Factors spectrum in client expectation process
Real effectiveness of service
Productive capacity Past experience
Production of similar services
The importance of the level of satisfaction obtained is essential to obtain and keep clients. A pleased client will come back to the same company simply because of the high risk involved in finding a new service producer. But not he will only ask the same provider for another service if he needs it, but he will also be the best representative for the service producer due to the word-of-mouth process. On the other hand, an unsatisfied client can damage considerably the image and reputation of a service producer.
This series of factors leads to the concept of complexity in services. Firstly, these factors are much more important than the ones at play in a manufacturing process of production-consumption, where co-production does not exist and where the expectations follow a logical and regulated sequence. In services, the six factors interact, they do not follow a give-receive-give sequence. Any factor can influence the perception of the rest of them, in a manner which is independent of the reality causing its change. The six factors have a perceived concatenate which is independent of the real relationships which may occur. The perception of the factors that compound the formation of expectations is based on a subjective relationship rather than on an objective one. The

Business Service Quality: How to Deal with ft 213
comparative criteria which determine the quality of goods can not be the same as the ones which determine (or better, mark; ordinal comparison) the quality of a service.
The complexity involved in the evaluation of service and the expectations which , accompany it, increases when a dynamic perspective is introduced. From the production of a service in t, at least a t+1 can be expected which can be classified as "satisfactory" or "unsatisfactory". Not taking into account the intermediate situations, a "satisfactory" service represents a service which has fulfilled its function. However, this does not mean complete fulfilment of initial expectations. It is a partial fulfilment.
Satisfaction can partially meet the fulfilment of the expectations spectrum, and at the same time increase the expectations about the next service. When this happens between t and t+1, dissatisfaction is the usual result. The ability of the provider consists of trying to raise that part of expectation spectrum over which he can exert an influence, so expectations are not raised too high before giving the first results and produce dissatisfaction. Therefore, obtaining an initial satisfaction in t+1 does not mean the fulfilment of the spectrum, but a relative adaptation on which new expectations grow.
Once the service has been received, dissatisfaction can equally reduce or increase the expectations located in spectrum. However, a trend - implicit or explicit - will stand out, towards adopting radical changes in the spectrum composition; a trend which is finally more powerful than the one inside the increase or reduction of hopes in the same spectrum of relationships and factors. One or various factors experience a drastic reduction of positive expectations, resulting in a breakdown of relationships or in a radical change to them.
In conclusion, satisfaction tends to produce changes in the dimensions of the expectations spectrum, reinforcing the basic compositions of the spectrum and securing the continuity of the service. Dissatisfaction, in contrast, modifies, in a more or less extreme way, the expectations spectrum, with a clear trend towards disintegration (change of provider, service, etc.) breaking the continuity of the service.
Figure 4.3. shows two examples of partial fulfilment and non fulfilment of expectations in a ex-post evaluation. In the case of fulfilment, the supply and demand capacities are above expectations, as well as the expertise shown by the provider and final efficacy of the product. However, demand has resulted less experienced than what it was expected to be and the relative position against other systems is less distant than what is was thought. In the case of non fulfilment, it seems that adverse selection is taking place, where the provider does not have as much experience and capability as he should have had. Therefore, the effectiveness of the product and the perception compared to other systems gives a negative result. On the contrary, during the co-production the client has shown higher capacity and experience than he was expected to have. Both examples show extreme solutions within a broader range of solutions.
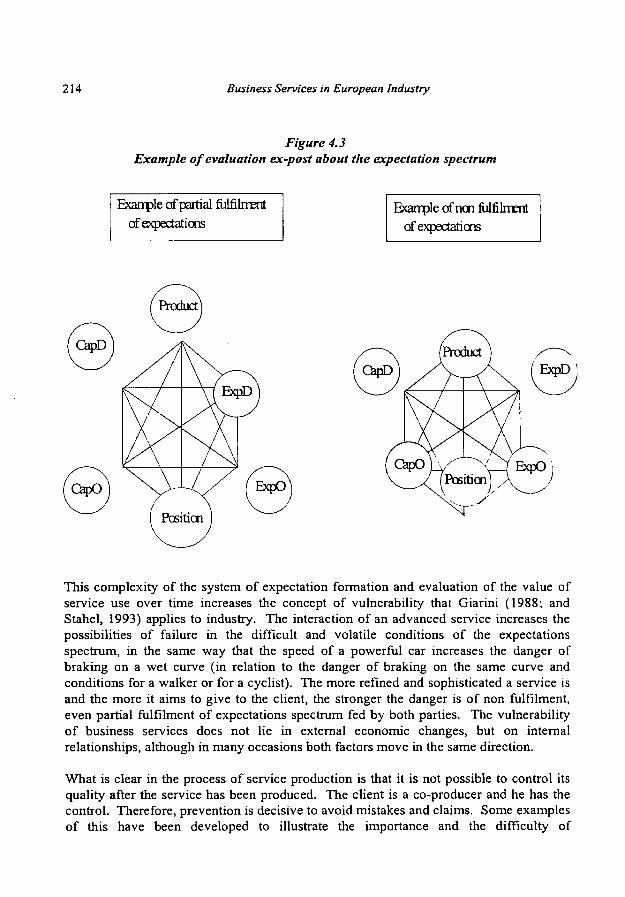
214 Business Services in European Industry
Figure 4.3 Example of evaluation ex-post about the expectation spectrum
Exarrple of partial fulfilment of expectations
Example of nan fulfilment of expectations
(CapD)
This complexity of the system of expectation formation and evaluation of the value of service use over time increases the concept of vulnerability that Giarini (1988; and Stahel, 1993) applies to industry. The interaction of an advanced service increases the possibilities of failure in the difficult and volatile conditions of the expectations spectrum, in the same way that the speed of a powerful car increases the danger of braking on a wet curve (in relation to the danger of braking on the same curve and conditions for a walker or for a cyclist). The more refined and sophisticated a service is and the more it aims to give to the client, the stronger the danger is of non fulfilment, even partial fulfilment of expectations spectrum fed by both parties. The vulnerability of business services does not lie in external economic changes, but on internal relationships, although in many occasions both factors move in the same direction.
What is clear in the process of service production is that it is not possible to control its quality after the service has been produced. The client is a co-producer and he has the control. Therefore, prevention is decisive to avoid mistakes and claims. Some examples of this have been developed to illustrate the importance and the difficulty of

Business Service Quality: How to Deal with It 215
implementing quality systems. This is not an impossible mission, but it requires the effort of the whole organisation.
Another important aspect to be highlighted is that service and quality involve a personal relationship. It is a matter of human relationship. This is why it is so important for a company, which is trying to change and implement a quality system, to invest time, effort and money to get to know the people working within the organisation, their motivation and mentality to make sure that the whole system is oriented towards the client. Hence, excellent procedures can tum out to be useless if the operative organisation consider them inefficient or futile.
Controlling and reducing vulnerability
All the aspects developed until now represent important limits on the production of a quality service. This leads to the question: Is there any way or mechanism which helps to control the limits of the service production system?. Indeed, several factors act as controllers within the service production process by securing the level of quality they must have.
These can be classified into two groups according to the effect they have and the way they work: internal controllers and external (or market) controllers. Internal "controllers" will act as the auditory systems supervising the correct implementation of the quality programmes developed within the company. External "controllers" concern all aspects related to competitors' activity: number, service offered by them, price, distribution, geographical implantation, etc.
Regarding internal "controllers", the named person should analyse quality problems by raising questions about their origin. Is there, for instance, lack of knowledge, lack of motivation, lack of performance and quality standards, or even lack of proper facilities and tools?. Problems could also stem from ambiguity between internal culture and demand of clients. According to Normann (1991) the use of mixed service management systems is the most common reason for failure, when efforts are made to maintain quality. In the case of quality improvement and quality maintenance programmes, the most common failure is the deficient interest communicated by top management to the organisation. A general tendency is to turn quality matters into a specialist problem. By so doing, the project may fail to sustain a long-term effort and correspondingly loose the connection between quality, service and social innovation. In addition, it might also influence the local management teams in their quality enhancement process and seriously damage the process. Therefore, the conclusion reached is that, internal "controllers" are more concerned with a mental framework, with the very understanding of causes and solutions for quality problems that can be found at any stage of the service production process. Again, the human aspect arises. A final aspect to be added is the importance of the motivation of the personnel involved, which can be resolved with incentive schemes according to the level of performance achieved. Those incentive
216 Business Services in European Industry
schemes would include not only economic rewards, but also become a complete system in which career development would be considered.
As far as external "controllers" are concerned, the most important aspect is probably the service offered by competitors and its price. These two elements will act and affect the quality of service in the sense that they will act as pure market regulators. The quality of a service and its price will be the two main factors taken into account by a client in choosing a specific service and to return if the level of satisfaction matches his expectations, in a second step. The mere fact that more than one company offering the same service exists, produces this control effect, to secure the standards of quality in accordance with the market demands.
Price is also a vital element. It is even included in one of the definitions for services given in this chapter. Because people know that high quality services are more expensive, they will be ready to pay for them. But how much?. The limit will also be given by the rest of similar services offered by the market. In general terms, it has been found that services are considered expensive by companies that have used them. According to a study of the European Commission (1989), 36% of those interviewed said that prices were extremely high, especially consultancy services. It can be considered that the level of satisfaction obtained is related to this opinion. This leads to an interesting conclusion: the market is seeking an increasing standard of quality, having reached the maximum level of prices accepted. In fact, some business services are decreasing their quality since the increasing competition push them to reduce quality (for example in some operational services). Price is indeed one of the most difficult elements to fix when developing a service. Hence, it is very important to keep it at a competitive level, related to the level of satisfaction obtained in such a way that price level and quality go together and always respond to the expectations that clients state. High prices in some business services can be considered to be a sign of quality in the same way as currencies are distinctive of strong economies. Low prices can be more competitive, but this does not indicate an ideal situation, usually because of reduced quality. Weak currencies can be a competitive instrument for the less competitive economies, but the monetary instrument does not generate real competitiveness. To this end, new quality considerations among the European business service providers have to be regarded as essential for future competitiveness on the international market. Correspondingly, quality awareness must be raised among both clients and providers.
Business Service Quality: How to Deal with It 217
4.2. Quality as a key competitive/strategic factor.
All authors reviewed concur that quality today is a competitive factor. Indeed, quality
■ has been upgraded to the category of a strategic factor. The reason for this is that a
good service, - this is to say, a quality service - it is good if it offers something more or
different than other similar services. Therefore, competitiveness in services is the
capacity of a company to offer services having the desired and required quality by his
clients at the lowest possible cost (Pérez, 1994, page 26).
4.2.1 Quality and business environment
Quality is important because it has become decisive in the buying decision process.
Competitors' activity is fierce and the range of products and services offered is bigger
and more and more diversified. In general terms, the economy today is determined by
three main characteristics:
- Global development and internationalisation of markets.
- Turbulent environment, rapidly changing and evolving.
- Evolution of information technologies, as the fundamental new technology of the
Service Revolution (Barras, 1990).
But at the same time, the consumer is becoming better informed and is gaining
experience, thus he is becoming more demanding and "sophisticated". As evolution
affects all aspects of life, needs change and evolve accordingly and there are a myriad of
"special cases" where the expectations and needs can differ hugely within the same
group of people classified in terms of sex, age and habitat.
In this context, the winner firm will be the one able to supply the best service. That is
why specialised services, filling market niches have sprung up so rapidly, offering a
different service, adapted to subgroups of consumers/business. Differing needs may tend
to favour one type (size and organisational structure) of service supplier over another
(Lindahl, 1994).
These different needs can be turned into competitive advantages that will create value
added for clients, offering a different/better service. And a client who perceives that one
service is better than the others will be ready to pay for it. Two aspects need to be
mentioned here: the price of service and perceptions.
Price should never be so high that the potential client thinks that he is being usurped.
Everybody knows that good recognised products/services are more expensive to
produce, so they will be very willing to pay a slightly higher price. The opportunity cost
would compensate them for buying a service now which would be received perhaps
cheaper but later. For example, if someone needs to send a letter urgently at 19:00 hrs.
which has to reach its destination next morning, he will call a courier, paying an extra
amount rather than waiting next day to send the letter through the National Post Service.
218 Business Services in European Industry
Besides, the higher the price of a service is, the more a client will expect to receive. In terms of economy, a good service will benefit from scale economy and this will have a positive effect on its price once the service has been launched and communicated properly.
Communication is a second aspect, which is very important to develop when a service is created and needs to be sold. A general role is that a firm should never promise more than what it is able to give. It is important that firms develop their offers in an attractive and persuasive way, in line with the knowledge they have from the needs/expectations of their potential clients. If those clients receive more than they expected, then the success is guaranteed. If not, the service will be very shortlived. Depending on the way a certain service is communicated, the perception that potential clients receive may vary. The concepts of communication and perception of services will be developed in the next chapter.
The strategic elements that firms can adopt to create this competitive advantage are outlined below. Of course, all of them are interchangeable, as any element mentioned can be adopted for any kind of service. Examples of the types of services which typically would adopt each strategy have been selected.
Competitive factors Examples of activities
Established reputation Market Research Quality of service Engineering Specialised expertise Accounting Wider range of services Insurance Geographical proximity to clients Local banking Personal attention to client needs Personnel selection Price of services Security Flexibility Computer services Geographical proximity to suppliers Exhibitions Speed of service Couriers
A significant factor to be taken into account is that the competitive advantage must be original, in the sense that it has been designed and developed by a firm, durable and non transferable. This, of course, is quite difficult to achieve, especially given the fact that once a certain business has been successful, the market tends to apply what innovators have started. A quality management system will assure that a firm can keep its competitive advantages over time, maintaining its leading position and business profitability. Basically, a quality management system (QMS) is the practical result of the application of the Total Quality Management (TQM) culture. This is a management culture of dedication to continual improvement in every aspect of a business (Holmes, 1995). For the purpose of this part, this system needs to fulfil the following characteristics:

Business Service Quality: How to Deal with It 219
- Compromise of Management - Identified and measured cost of bad quality - Establishment of objectives - Allocation of human resources and means - Define and plan actions - Design of control procedures and follow up - Name responsible persons for activities - Evaluation and feed back
4.2.2. Quality, costs and benefits
The benefits of quality. It is a general perception that producing quality services is expensive. Very often, companies give up before starting a change in their organisations and production plans to improve quality because they think that it will be highly costly in terms of time, resources, effort and money. But they hardly spend any time analysing how much they could win and what the benefits would be - not always easy to measure indeed - from implementing a quality system.
From the client point of view, belonging to any manufacturing or service sector, the main benefits obtained are: better service at a lower price, increase in productivity, scale economies, synergies, increase in overall profit, high level of satisfaction. In addition, the benefits for the provider can be named: reduction of costs, growth of the business, quick feedback on mistakes, reduction of claims, improvement of employee training, motivation, integration and sense of responsibility, team work, improvement of communications between company and clients, better understanding of client needs, increase of client loyalty market share and awareness (due to the word-of-mouth circle, recommending to others the services received).
Cost of quality. The lack of a quality system has a direct impact on profitability. It is not easy to demonstrate scientifically that an increase in quality produces savings. Normally, this principle is stated the other way round. That is to say, when quality is improved, failure and appraisal costs diminish so total costs are reduced. Quality is then used to prevent, rather than to solve mistakes and errors. Therefore, management should be aware of the costs that the company is incurring as a result of poor quality. From this approach, a company could then devise a quality system, determining the cost of non-quality before calculating the return on investment in quality.
It is possible to increase quality and to reduce costs at the same time. But it is important to notice that increasing quality implies an initial level of investment in many areas of activity to start the implementation of a complete quality system. Increasing quality implies a certain level of investment in many areas of activity. According to K. Holmes (1995) "it has been shown that in companies with such systems (quality systems), the total cost of quality is between 15% and 20% of annual turnover if it sells a manufactured product, twice that if the product is a service" (page 41). This initial investment would be recovered through the incremental benefits which can be obtained
220 Business Services in European Industry
from the moment that the system is implemented in a sustainable way. These benefits include the incremental businesses that can be obtained from current customers, as well as the new businesses which can be generated from a top performance company.
It is therefore quite normal for top management, worried about profitability, not to pay much attention to quality assurance, because this requires an initial effort of human and economic resources which not many are ready to start. But costs of bad quality are higher than the investment required. These costs are produced when the service quality is bad, when its cost has not been evaluated in a correct manner, when the service is not produced according to client specifications and when the service is rejected because it does not meet client needs. And in the case of services, this is the key to success because the consequence is the loss of a client. Cost of quality studies show that for most businesses, every dollar invested in prevention could save up to 110 dollars in failure costs (Rust, 1996). For example, in the service sector, one of the most common reasons for high costs due to bad quality is poor communication with clients. If a client is treated in a pleasant, patient and proper way he will be satisfied because he will perceive that someone is worrying about him, he is being listened to and his complaints about the price he has paid will be secondary.
A useful practise is to evaluate each stage of the service production process from the client's point of view, trying to identify which activity will produce value added and which will increase total cost. The trend should be towards the reduction of costs of those activities which do not add value, and the increase and improvement of those adding value, which on the other hand, will help to justify the final price of the service.
Having done this, the potential savings that can be obtained with a quality system is about 20% of total costs, according to Pérez (1994). This is why a company should be ready to learn about the costs it incurs due to bad quality, which helps to understand the processes better, identify specific data and facts, prioritise in a much more rational way, improve personnel motivation, establish objectives, etc. Quality leads to general improvement, adaptability and performance of the business.
Probably, the most practical way to do all this is to create a taskforce sponsored by someone in management to calculate the cost of quality in a chosen area of the business, which afterwards could be used as a pilot study. After collecting the necessary data, costs of quality would be tracked and areas of improvement identified. An action plan could finally be proposed to implement a complete quality system.
4.2.3. Innovation and quality
Innovation is an essential element in a service today. The key word has already been mentioned before: differentiation. A group of characteristics such as accessibility, variety of supply, price, perceived quality, necessity, etc. induces a client to choose one service over another. But overall, the fact that a service innovates means that it is adding something different, which distinguishes it from the rest. It may be not
Business Service Quality: How to Deal with It 221
necessarily better in its nature, but different. And this will in many cases be the reason why a certain service is selected. Something is deemed different when it has a characteristic or characteristics that other things do not have. In economic terms, this characteristic gives the service the value added which will justify its price.
Innovation is a pivotal concept in business services. It is a major element for improving industrial competitiveness: each business service can be related to at least one innovative source (as showed in chapter 3; technological, strategic, commercial, or operational). It can be classified according to the following criteria:
- Time/place. In this case, innovation will always be relative. An innovation will be the first one somewhere in a concrete period. When it reaches later new consumers or countries, it is a relative innovation. It will indeed be regarded as an innovation in those new countries or for those new consumers, but strictly speaking it is not new. For example, in Spain 10 years ago, services like couriers or private television did not exist. They were imported from abroad and created without knowing on beforehand the effect they might have.
- Product/Process/Service. In terms of the nature of innovation, a product can be invented or improved. It is the same with a process. A better process will incorporate the concept of service. In other words, a better product can be improved because either its performance is perfected or because the process of production is improved. Process in the sense of technical procedures in the factory, but also and mainly, in the sense of added characteristics, that is to say, service. There can be completely new services or the existing ones can be completed and enlarged according to different requirements. In the first case, it is very difficult to define a service which does not exist. These usually appear as a consequence of a unsolved need which is created by the market, technology and social evolution.
- Consumer/producer/market. Innovative services are not defined the same way by the consumer or client as by the producer and the market. A service may already exist in a market, but it will be new for the consumer or the producer when they buy or have to produce the service for the first time. When a company decides to include a certain service in its portfolio, it has to evaluate how to put into practice this "new service". If this company is able to improve upon that service, even if it already exits, it can create the differential factor which will distinguish that service from the rest. This is also due to the interactive nature of services, where the client is part of the production process of a service, as mentioned above.
New services imply new brands, new segments, new needs, new distribution systems, new production procedures, new images, etc. It is clear that there is a big risk if a company has to define all the basic aspects for the first time. Also, an enormous effort in terms of creativity is required. Creativity comes from a new way of looking at the existing client, available technologies and existing services. It is necessary to create a
222 Business Services in European Industry
new concept. Because an activity can be easily imitated but a concept can not (Eiglier and Langeard 1989). The search for a service concept can be perfectly integrated into the marketing approach of a service company which goal is the search for a positive differentiation from competitors. Being able to concretise the different factor and communicate to consumer in an intelligent and effective way requires a strong and powerful concept (p. 180).
Defining a new service, in the sense of something which did not exist before, is very tricky. Usually, innovation takes place in the processes of production of services (and products). And over the years, many little improvements have resulted in strong innovation. The case of known services enlarging their basic supply or their range of products is quite frequent. Therefore, they can supply a more complete and adequate service to their clients. Usually, innovation in services affects only the process of service delivery, but not its essence. Innovation in services appears and grows at the same time as population grow, or taking clients from competitors, or improving the quality of the service delivery system.
It is therefore quite hard to explain the relationship between innovation and services. But some authors have developed various interesting ideas about this relationship. For example, Richard Barras (1990) talks about the "reverse product cycle", where innovation takes place mainly within processes. Based on the importance of the tremendous progress of information systems - he identifies this factor as the "enabling technology" which is leading the Service Revolution - his model proposes a dynamic process of innovation in sectors adopting a new technology, in the sense that the level of innovation increases with the cycle of products or goods, so the more mature a service is, the more innovative it becomes. This model is produced in three main steps summarised as follows:
- Initial investment in new technology produces incremental innovation in existing services when designed to reduce costs and improve efficiency of delivery of mature services in saturated markets.
- In a second stage, the need to improve effectiveness leads to produce more radical process innovations, generating improved quality and therefore, expansion of markets (competitiveness).
- Again, this "regulated market" will create the need for improved products, which is normally followed by the production of improved services, directly linked to those products. This will generate in tum the need for differentiated products due to a greater competitiveness, with further adoption of new technology.
- The next step is again the production of incremental innovation: the more mature the market is, the more innovative services are.
Richard Normann (1991) explains that there is a trend towards more complex service concepts. He describes the driving forces of service innovation, classifying them into different types: social innovation (four types), technical innovation, network effects, and reproduction innovation, as internal driving forces, and regulated institutional contexts.

Business Service Quality: How to Deal with It 223
new values, lifestyles and problems, and the need for greater efficiency, as external driving forces. Business services promote several of these innovation forces; in particular, those based on the client participation rather than others related to social innovation.
Another example of quality innovation relationships is furnished by Faïz Gallouj's book (1994) on service innovation. It proposes three kinds of innovations which apply closely to advanced consultancy services: innovation-valuation; innovation-anticipation and innovation-objectivation. Besides, business services innovation face, according to this original approach, four determinants: the need (abstract, perceived, expressed, real and reconstructed), the institution (interactive groups), the social sciences (non-technological related issues), and the exact sciences (knowledge and technologies).
224 Business Services in European Industry
4.3 The role ofinformation in business service quality
Former sections have analysed the main aspects related to quality in business services: definitions, ways of dealing with, evaluation criteria, certification procedures, the role of expectations and its importance to competitive strategy. Information is the only important issue which still needs to be referred to specifically. In fact, all the former aspects of quality in business services concern the issue of information. The requirements of quality in business services are so wide because of the need for information in the service provision. The certification procedures try to reduce the problems due to the lack of information, the expectations are formed according to the degree of information, etc. This section briefly explains the main economic concerns about information in business services. First, a generic service background explains the role of time, value and prices in the generation of uncertainty, which differ to the one applied to manufacturing goods. Then, the uncertainty in the business service provision and use lead to discussion of five main issues concerning information in business services: comparability, reactive externalisation, risk diversification, asymmetric information (the classical adverse selection and moral hazard problems), and the uncertainty consistency.
4.3.1. Time, value and prices in services
The economic patterns represent time with a number. It is represented by t meaning a period and t+1 meaning the following period. The economic dynamic models discrete or continuous, in differentials or integrals, try to establish a relationship among variables through time. The limit that any model presents is that its explanatory power is restricted to variables and relationships which define the model. When the most important variables and relationships can not be patterned or quantified in the economic spectrum, then the dynamic explanation loses its meaning. This always happens in the service business economy due to the rupture of the time linear characteristic. Events can happen of completely different importance between f and t+1 and between t+I and t+2. In the manufacturing economy, when χ goods are produced and consumed in / at price px, it can predicted that in t+1, χ +sx goods are produced and consumed at price px = px. In service economy, coproduction and co-consumption in t of JC services at price px does not imply that a linear relationship can be predicted about χ and px in t+1. The lack of predictability in services, and particularly in business services, lead to uncertainty problems regarding quality. But let's consider first the service specificities for these three variables: x, px, and t.
First, quantity: x. A service is the object of a transitive interaction among provider, consumer and product. Therefore, given the fact that provider and consumer are labour intensive companies more than capital intensive ones and due to the fact that they both move in a dynamic world where perceptions about reality change, the second service will never be the same as the first one. The second service will never be an x+1 but a y. Contrary to what happens with goods, provider and consumer perceptions may not only vary their attitudes towards the product, but also they can modify, - and indeed they do -,
Business Service Quality: How to Deal with It 225
the nature of that product. The product itself changes with them in the same time interval and in latter time, but anyway, it is changed in the interaction itself. Two services can not be exactly the same, they can only be similar.
Second, price: px. Goods price determines the market agreement (without state intervention) about the value that supply and demand have from goods. In one case, based on the function of marginal costs and income, in other cases, based on the utility and indifference curves. Price determines the marginal value at the moment of interchange. However, according to Giarini (1988) good value in a service economy is "the result taken from the working of a system, during a certain period: it is a value of use" (page 205). This definition can be extended with an additional step. If the value of certain goods (which includes services) is a value of use (which can be included in price or not) based on the product and its quality and duration, the value of use in the service is not based in the service itself but in the external economies produced from the interaction among co-producers and in the compound of benefits, direct costs and opportunity costs which have an effect before, during and after the service production. Therefore, the value issue is higher than the price issue and the transmission of value to price is much more difficult and complex.
The following example illustrates this. When a company buys a computer it is quite easy to calculate its value of use considering the direct cost (price), plus additional indirect costs (maintenance, space, software, training, etc.), its possible benefits for the organisation and its estimated duration according to technological changes, programs for future investment, etc. When a second computer is acquired, the company can repeat the same exercise, calculating again the value of use. But it is very different when contracting a computer service. The problem is not the computer any more, and not only the programmes or solutions required from the expert. The key issue then is the value given to the transitive relationship between client, provider and service offered. In this value, very different factors can be present, especially direct costs (price), indirect costs (time, management, personnel involved, etc.) and opportunity costs (basically, how much has been lost by not seeking an internal solution).
This whole set of factors influencing prices lead to the fact that business services are most frequently negotiated case by case and market prices, when they exist, are mere references in order to evaluate prices. This situation, together with the lack of market transparency, leads to major price differences for very similar services. De Bandt (1994), for some apparently similar business services provided in Paris, found variations from 1 to 10 and, occasionally, even from 1 to 30/40. The services, in fact, were not as similar as they appeared to be, even if some price differences could be explained by market segmentation.
Within the interactive context based on personal relationships, expectations play a very important role, as well as all issues related to asymmetrical information and imperfect information. In an uncertain environment, price is not related so much to an accepted value within an "objective" context, as to an expected value within an "uncertain"
226 Business Services in European Industry
context. Changing any minor factor can vary completely the criteria for valuing a service and modify the nature of the next contracted service.
Finally, time: t. Time changes as a concept related to goods. This is due to four reasons: 1. Production activity coincides in time with consumption activity. 2. It is very difficult to assign the next production and consumption service in t+1; on the contrary, it is mixed up and merged with the previous service in /. 3. The continuity of an χ service is not only based in the maintenance or additional amount of χ in t+1, but in the search for new y, z, etc., within a changing relationship with the provider and very high uncertainty. 4. The dynamic and uncertain context in services "reduces" the time in which expectations are formed, "enlarging" the consequences of its satisfaction or dissatisfaction.
4.3.2. Uncertainty and imperfect information
Uncertainty is an essential part of services economy, and it has a greater effect here than in the goods economy. Its role in the service economy has still to be discovered, despite the fact that it has been analysed within the parameters of the manufacturing economy. The basic problems are revealed by the example of assurance activity: the problems of adverse selection and moral hazard. However, there is a wider repertoire of problems in the service economy which is much more standard. The main problems related to information and uncertainty are outlined below.
4.3.2.1. Nothing is fully comparable in services.
No matter what the scenario of provider choice is, all the possibilities from the different alternatives can not be considered, except in a very limited way. In the service market, the choice of a provider and product is not made in the same way that in a supermarket, where prices, quantities and qualities can be compared. Uncertainty and imperfect information dominate service markets. This is the reason why there is segmentation, despite the processes of concentration and internationalisation in the large companies within this sector.
The difficulty of comparing services stems from the nature of services itself and from the requirements of personalisation. All of them constitute a broad range of factors showing this facet in the markets and this makes it so difficult to compare services:
- Fragmentation and narrowness of markets. There are many companies offering similar services, but they hardly compete. According to the number of participants, these are competitive markets, but according to the existing segmentation, they are very narrow. These characteristics come from the lack of transparency within the sector.
- Novelty and innovation. The relative novelty of numerous services, together with the innovations that they generate, make it very difficult to
Business Service Quality: How to Deal with It 227
follow the market evolution. Besides, innovations are usually related to intangible forms and modes, which rarely are detected.
- Multiple relationship price/quantity/quality. There is a host of relationships price/quantity and price/quality due to the immaterial nature of service and the geographic dissemination of providers. These relationships tend to be established one by one and there are no rules on which to base comparisons. The classical criteria for comparisons need to be applied to each service because no two services are the same.
- Confidential information. Providers are interested in protecting their clients so that they do not promote the expansion of information which can lead to a movement of clients from one provider to another. There are numerous profitable niches where significant profits can be obtained. This is the reason why companies do not move to a more competitive environment, and therefore, confidential information is produced. The service user has nowhere to go in order to obtain detailed information about the supply. Communication using the word-of-mouth mechanism is the most common way to obtain information about the different alternatives.
4.3.2.2 Reactive externalisation
Externalisation is influenced by uncertainty. Its goal is usually to improve quality and reduce fixed costs and turn them into variable costs (see next chapter 5). Basically, there are three types of uncertainty affecting externalisation:
- Uncertainty about markets, when on the one hand, the cycle fluctuations and the irregularity of the demand lead to reduction of internal costs and externalisation, and on the other hand, the unpredictable markets require specialised services to be contracted which are more familiar with the variability and the strategies to be adopted.
- Uncertainty about the company, about the potential costs produced by the lack of capacity of internal services to adapt themselves to the new needs and about the organisational and personnel problems that can arise in crisis. The reduction of potential costs and its estimation lead to externalisation.
- Uncertainty about the market offering business services. In this case, the problems of asymmetric information can lead to internalisation.
Uncertainty has a cost and when this is higher, it is advisable to take the decision of outsourcing, particularly when dealing with specialised services. It is worth noting that the contrary is not true. Wood (1991) says: "not subcontracting specialised services can
228 Business Services in European Industry
not be understood as a reduction of uncertainty costs, but as the result of an increase of perceived certainty about the experience and capacity of resources" (page 166).
4.3.2.3. Risk diversification.
Uncertainty tends to produce risk diversification in the supply. This diversification has three consequences for business services: 1. Wider range of products, trying to obtain scope economies (this has been
observed in practically all kinds of business services). 2. Wider markets with expanded production and diminished dependency risks. 3. Collaboration agreements and networks. More strength in markets is provided
(business volumes, knowledge transfer, etc.), but also a cost reduction is achieved when the economic position or reputation are weak.
4.3.2.4. Asymmetric information.
Asymmetric information is produced when one party has more information about the service than the other. Usually, it is the provider who knows more than the consumer. The consumer has often scant experience about a service where he is not an expert. Therefore, he is in an inferior position which produces uncertainty about the service offered and the capabilities of the provider. It is also more difficult for him to follow up, control and establish incentives because he does not know the quality of the service beforehand. Asymmetric information lets prices be high in the narrow service markets, where the possible information about a certain service by another provider does not flow. There are two problems associated with asymmetric information: adverse selection and moral hazard.
Adverse selection
Adverse selection is defined as a type of asymmetric information where the client can not detect either the characteristics and the quality of the service from the provider, or the circumstances in which the service is going to be supplied. We can use a car repair workshop as an example, where the client does not know the problem his car has, the technical skill of the mechanic, or the price that he will have to pay in terms of excess charges. Another example of business services is that of a consultant working on a project where the price is difficult to estimate correctly, as well as the level of his qualifications. When the supply is not known, the wrong consultant can be contracted.
Clients have a very limited capability to distinguish bad providers from good providers. Only when the service is completed, can they evaluate what they have received. And even then, the evaluation is not complete, because the level of client satisfaction as regards price can be evaluated, but his satisfaction can not be evaluated concerning the relationship between quality and the level of qualifications contracted. This uncertainty means that in many cases, services are contracted according to brand image rather than

Business Service Quality: How to Deal with It 229
to other factors. The reputation of a large company reduces the initial uncertainty, but it does not reduce the uncertainty which remains after the services are supplied; the services received do not always match the client's real needs. This justifies the activity of many small and medium-sized companies competing with large companies within the
. same sector. Brand image and personalisation are the strategies deployed by large and small companies, respectively, to face uncertainty problems and adverse selection. Both strategies tend to build a reputation which maintain minimum quality standards for the client.
Moral hazard
Moral hazard is a form of asymmetric information where the client can not observe the actions taken by the provider. The client can not evaluate the effort or the service provided by the provider for the correct performance of the service. Again, uncertainty is produced because, once the contract has been obtained, the provider can relax his performance. A typical case in business services is when some large consultancy firms send their best executives to sell the product, but the project is handled by "juniors" thereafter, supplying a product of inferior quality than the product contracted initally. Small companies, on the other hand, can have this problem too: they can justify a lower effort by saying that they count on fewer resources.
The problem of moral hazard is due to the difficulty of verifying the quality of the service received. This is definite and it is not possible to return it or to repeat it. Quality cannot be determined in advance and therefore, there are no full objective criteria to evaluate it afterwards.
There are also external factors in which the characteristics and effort from the provider do not take part. Even the best lawyer in the world, putting all the effort to win a case, can not guarantee that he will win in court. The client might think that there has been a problem of lack of qualification or effort, when in fact, there is an external factor which has hindered the accomplishment of the client's expectations. The same happens in consultancy when, during the compiling of a report, the need for basic information which is missing suddenly appears. Its absence is not due to the effort or provider quality and obtaining it implies - if it is possible to obtain - a cost which far exceeds the agreed price. Business services have to deal with multiple external factors which can produce some confusion regarding the problems of imperfect information in markets.
The client-oriented asymmetric information
Also, it has to be taken into account that the client can create a certain level of asymmetric information the other way around because service production does not belong exclusively to the provider. The client can infringe the agreed conditions for the service production, rendering the provider effort and qualification useless. It may be that the client has not the minimum technical qualification to understand what he is asking for, he may not have any real interest in the contracted service or he may not be
230 Business Services in European Industry
able to explain his needs clearly. In those cases, adverse selection can have a certain cost for the provider.
In tarn, the provider can not assess the effort made by the client or the importance of his . requirements. Therefore, the client may have a problem of moral hazard, incurring costs for the provider if he is not interested enough or if he does not explain clearly his needs. A typical example of this situation would be when the client requiring consultancy services takes advantage of his lack of interest to procure services which need a greater effort to be delivered than the services previously contracted. The same could be true for a company that contracts a security service and incurs higher risks than those initially foreseen when the contract was agreed.
These situations of moral hazard are generally due to incomplete contracts related to asymmetric information, the different levels of facing risks, the established barriers of contracts and the cost of fulfilling contracts.
From the client point of view, the problems of adverse selection and moral hazard are more important for small companies than for big companies. Big companies make different sub-contracts for the same service, they have more experience and they can, therefore, make a better evaluation of the provider. The level of asymmetric information is higher in small companies and this makes them reluctant to contract services from unknown providers whose circumstances, effort and qualifications are uncertain for them.
4.3.2.5. Consistency or inconsistency of uncertainty.
All the elements described above constitute the real and perceived consistency that uncertainty represents for players. However, there are also inconsistencies due to perceived -not real- uncertainty. When forming their expectations about future, players introduce perceptions of comparative uncertainty which are not true. These are uncertainties which might exist, but they can be certainties related to other uncertainties (this is why the term "comparative uncertainty" has been used). For example, the client's doubts about the capability of the provider, the difficulties of following up and controlling services, the problems of adverse selection or the working conflicts generated sometimes do not need to provide additional uncertainty on top of the uncertainty that those problems produce when the service is provided internally. There is no security that uncertainty will be lower when outsourcing than when services are produced internally. Obviously, uncertainties are relative and their formation is determined by the kind of service implied, the provider and consumer conditions, the own subjective opinions and the market situation.
Business Service Quality: How to Deal with it 23 I
4.4 Conclusions
Throughout this chapter, quality has been analysed as a major factor, perhaps the most
important one, in business service management, provision and use. The role of quality
■ as a competitive factor in business services today has been highlighted. Quality can play
a significant role in defining the differentiation factor for companies, producing
competitive advantages and specialised services, different in certain aspects from their
competitors in the same market. Producing quality services has clear benefits for both
the consumer and the producer, but also it implies certain costs. These costs need to be
seen as preventive costs, which can avoid bigger problems (such as loss of clients) and
are, therefore, clearly compensated.
The role of producer and client in the service production process has also been analysed.
In this case, the client plays an important and active role in the service production
process. This is why his perception of the service matters so much. The level of
participation, the modes of participation and the functions that every party has to
develop will partly define the satisfaction obtained by the client. In this process,
innovation appears as one of the elements which needs to be present in the service
concept. It will give value added to the service and increase the global supply. It is also
linked to the product cycle and client participation in the service production process.
Quality in business services is greatly influenced by processes linked to expectations,
uncertainty and imperfect information in markets. All these problems have been dealt
with by describing: -the main factors which affect the client expectation process
(experience, competencies, relative perception) and therefore how they need to be taken
into account for the process to be successful (success of the service co-production
process); - the creation of uncertainty in business services markets (time, prices and
values); and, - the different types of problems related to imperfect information
(comparability, risks, asymmetric information, vulnerablity), useful for a better
understanding of the aspects that must be borne in mind when business services are to be
provided or contracted.
The chapter has also presented the problems of quality measurement and evaluation. It
is important to implement measurement systems with a certain number of characteristics
in order to fulfil the client's expectations related to the perceptions and attributes of the
service received. In terms of quality evaluation, the ISO series are described as the tools
guaranteeing the minimum required standards for service production. Accreditation
processes will grow in the business service activities since the increasing competition
claim for a further differentiation strategies. Possible measures for benchmarking the
best practices can be introduced by public policies and professional bodies in order to
evaluate the need to promote and diffuse the best market mechanisms for improving
quality in business services.
232 Business Services in European Industry
References
Barcet, A; Bonamy, J. (1994) "Qualité et qualifications de services" In Bandt, J. Gadrey, J.
(Eds.) Relations de service, marchés de services. CNRS Editions, Lonrai
Barras, R. (1990) "Interactive innovation in financial and business services: The vanguard of
the service revolution". Research Policy 19 215237
De Bandt (1994) "La notion de marché estelle transposable dans le domaine des service
informationnels aux entreprises?" In Bandt, J. Gadrey, J. (Eds.) Relations de service, marchés
de services. CNRS Éditions, Lonrai
Denton, D. K. (1991) Calidad en el Servicio a los Clientes. Díaz de Santos, Madrid.
Translated from (1989) Quality Service. Gulf Publishing Company, Houston.
Drucker, P.F. (1974), La gerencia de empresas, Editorial Sudamericana, Buenos Aires.
Eiglier, P. Langeard, E. (1989) Servucción. El marketing de los servicios. McGraw Hill,
Madrid. Translated from (1987) Servuction: le marketing de services, McGraw Hill, Paris.
European Commission (1989) The efficiency of business services used by manufacturing
industries. MRB Study. European Commission, Brussels and Luxembourg.
Gallouj, F. (1994) Économies de l'innovation dans les services. L'Harmattan, Paris.
Giarini, O. (1988) "Les nouvelles conditions du progrés économique: de la rigidité de l'offre à
l'économie de service". Revue d'Eonomie Industrielle
Giarini, O; Stahel, W.R. (1993) 77ie limits to certainty facing risks in the new service
economy, 2nd revised edition. Kluwer Academic Publishers, Dordrecht, Boston and London.
Grande Esteban, I. (1996) Marketing de los Servicios. ESIC, Madrid.
Grönroos, C. (1990) Service Management and Marketing. Lexington Books, Massachusetts.
Holmes, K. ( 1995) Implementing ISO 9000. Pira International, Surrey.
Horovitz, J. (1991) La Calidad del Servicio. McGraw Hill, Madrid. Translated from (1987)
La Qualité de Service. interEditions, Paris.
Lewis, B.R; Gabrielsen, G.O.S. (1998) Intraorganisational aspects of service quality
management: the employees' perspective. The Service Industries Journal vol. 18. No 2: 6489.
Lindahl, D.P. (1994) "Market Differentiation and Competitiveness in the Producer Services:
Can Local Firms Compete with Large MultiEstablishment Firms" 4 1 s t North American
Regional Science Meetings, Ontario.
Llosa, S.; Chandon, JL; Orsingher, C. (1998). An empirical study of Servqual's
dimensionality. The Service Industries Journal, vol. 18, NO 2: 1644.
Maqueda, J. Llaguno J.I. (1995) Marketing estratégico para empresas de servicios. Díaz de
Santos, Madrid.
Navas, M. (Eds) (1995) Anuario de Calidad Arthur Andersen. Gama 50, S.A., Madrid.
Normann, R. (1991) Service Management. John Wiley & Sons Ltd., Chichester.
Pérez Fernández de Velasco, J.A. (1994) Gestión de la Calidad Empresarial. ESIC, Madrid
Peters, T. J. Waterman, R. H. (1992) En busca de la excelencia. Folio, Barcelona. Translated
from In Search of Excellence, Harper & Row, New York.
Rubalcaba Bermejo, L. (1997) Los servicios a empresas en Europa: crecimiento y asimetrías
Universidad de Alcalá.
Rust, R.T and others (1996) Service Marketing. Harper Collins, New York.
Toffler, Α. (1980) The Third Wave. Collins, New York.
Vandeville, P. ( 1990) Gestion y control de la calidad. AENOR.
Wood, P.A. (1991) "Flexible accumulation and the rise of business services". Transactions
Institute of British Geographers, N.S. 16, 160172.
Chapter 5
Competitive Strategies in Business Services
"Though it looks simple, contracting out is remarkably hard to do well."
The Economist, 1994, page 77.
"The key strategic problems are usually related to implementation and continuous adaptation: go beyond strategy to organisation issues, structures, people and this kind of things."
Tom Peters, ¡992, In Search of Excellence, page 5.
"The conception of a service company as a set of interrelated dynamic processes which tend to take the form of positive or vicious circles provides a key to understanding the role of management in a change process"
Richard Normann, 1991, Service management, page 175.

234 Business Services in European Industry
Competitive Strategies in Business Services 235
Chapter 5 0) Competitive strategies in business services
Introduction
Business services can be a major competitive factor for enterprises. All the elements considered up to now have shown the strong potential economies that business services can bring about in the industrial system and particularly in firms. However, not every business service in itself is useful for improving competitiveness. Chapter 4 stressed the need for quality in business services based on the right interaction between provider and client. In this chapter, other concepts such as strategy, marketing, externalisation, customer service and service management will be developed, with the aim of clarifying what companies need to implement in order for business services to thrive in a competitive market.
Three competitive strategies are presented: the use of the "to make or to buy" choice to achieve business service effectiveness; the promotion of the marketing of services as an essential element to improve business services relationships; the reinforcement of business service management in order to make the company more competitive. The first strategy mainly concerns business service clients. This is a key issue nowadays, as the outsourcing "boom" proves. The second and third strategies deal with business services suppliers, since the idea is to summarise a number of major ideas indicating how companies can proceed in order to provide the best business services.
The chapter is divided into four sections outlining these three strategies plus an introduction. Within this framework, results of the research on how to measure business services effectiveness will be presented. The following strategies share a common objective: to increase the business service effectiveness, even though this is very difficult to evaluate at an aggregated level; at enterprise level an ex-post evaluation can be made by gauging the success or failure of the enterprise when it operates in competitive markets.
The author thanks the collaboration of Mercedes Domínguez (Consumer Marketing Manager, Shell Spain) in sections related to marketing and management.

236 Business Services in European Industry
The section presenting the option between to make or to buy has the following subdivisions. First, we explain the numerous reasons behind outsourcing. Second, we highlight the controversy between intemalisation and externalisation processes and suggest the main results of this. Besides that, the contribution of business services to the economy is reiterated, emphasising the need to understand business services in a global context beyond externalisation. Lastly, the parameters of the externalisation processes are theorised, based on innovative coproduction between supplier and client.
Then an overview of the importance of marketing business services will be given. We depart from the notion that marketing involves more than just a series of techniques implemented by experts within an organisation. The development of marketing in business services demands commitment from any professional who is aware of the competitive environment in which he has to work. The increasing importance of the customer as the main player in the marketing mix has also been taken into account in our explanation of how marketing tasks need to be implemented in order to be successful. This leads us to an analysis of communication skills, which are currently undergoing a notable evolution.
Finally, the section on management of business services gives a practical approach to the steps and factors which are required when preparing an action plan. The different theories, areas and strategies put forward by several authors will be described briefly, bearing in mind the importance of the management factor in business services to develop a winning competitive edge. The new focus on business services demands new knowledge on both the strategic and operational level. And new frameworks and concepts are required. This chapter aims to outline these new requirements for those readers facing this situation and who are willing to implement a market-oriented service strategy and manage service competition.
Competitive Strategies tn Business Services 237
5.1. Business services effectiveness
Effectiveness is in itself one of the goals of any economic activity related to businesses. It means that an activity has to be performed on a quality-oriented basis, that is, quickly, at the lowest possible cost, obtaining the maximum profit. If this principle is applied to business services, they are regarded as effective when they achieve their goals, in other words, when they attract clients, and therefore, produce profits. Thus, the effectiveness of business service requirements must be considered from both the producer and the consumer point of view. From the producer's viewpoint, effectiveness is closely related to the way services are produced. This implies analysis of costs, resources - both material and human -, procedures, techniques, etc. From the client's viewpoint, a service is effective when he is satisfied with it, as it meets his needs and expectations. This usually happens when services are well-communicated quality services. In sum, when a thorough quality system lies behind service production, as shown in chapter 4.
But services can be not only effective, but highly effective. This means that customer satisfaction can exceed the previous expectations. Up to this point, there is the argument that in some cases, it is not necessary to provide more than the client expects. This, in turn, can produce misunderstandings which will lead to the loss of that client. However, this is a subtle issue. Experience proves that on many occasions, clients are pleasantly surprised when they receive more than they were expecting. In those cases, the effect will be multiplier because their satisfaction will be greater. A new happy client will be gained and there is a strong likelihood that he will remain loyal to the company that has produced this service for him. The human factor is paramount when dealing with services. Empathy is a characteristic required by those people involved in service processes. It means that someone dealing with clients has to have the ability to listen to what the client is demanding, very often not very clearly. His capacity to adapt to the client requirements is of supreme importance.
There is a research gap regarding the measurement of business service effectiveness in externalisation. A study carried out by O'Farrell (1994) reviews the literature which has been produced on this subject, finding few empirical cases: Johnston (1963) on efficiency of management services, Resmini and Saviolo (1993) on efficiency of export services and Stock and Zinser (1987) on logistic consultancy services. However, more information is provided about services evaluation criteria and their differences versus goods evaluation (Grönross, 1980). Services criteria must be associated with the degree of disagreement related to the initial expectations of the client (Churchill et alt., 1982). These expectations are based on past experiences, direct and indirect, which produce three types of gaps: 1) differences between the client's expectations and their experiences; 2) differences between the client's expectations and professional perceptions of the client's expectations; and; 3) post-evaluation gap related to the client's experiences and the professional perceptions of the client's experiences (Brown (feSwartz, 1989).
238 Business Services in European Industry
This complex variety of evaluations means that companies experience great difficulty in assessing the efficiency of services. Many of them are unable to give an answer when asked for an assessment: Johnston (1963), 33%; O'Farrell (1994), 50%; Saviolo (1993), 70%; Peat Marwick (1988); 50%; Senn (1991b), 89% (which have not been able to evaluate properly services advantages). Some of the most outstanding results are presented below.
In the EC report (Peat Marwick, 1988), half of those interviewed were not able to evaluate the effectiveness of externalisation. 83% of respondents said that they had achieved scale economies and 88% of them remarked that the degree of quality met their expectations. In the few cases where companies were not satisfied with the service, either they decided to switch providers or they implemented stricter control. In 39% of the cases, externalisation led to the reduction of personnel, compared with the 16% without changes in staff. However, employment losses did not reach 1% of the total. On the other hand, it is estimated that the increase in employment through externalisation, due to the increase in demand, is enough to compensate the effect of dismissals.
The Italian case analysed by Senn (1991b) shows that only 10% of the companies could evaluate the advantages of business services. Only 11.5% considered they had proper knowledge of the market, although most companies were positive about the services they had received. In other Italian studies, however, disagreement soars to 40% of the cases (Centro Stadi Confindustria, 1987; from Bramanti, 1989).
O'Farrell's study (1994) of the United Kingdom displays some interesting features. The level of satisfaction is higher when results are presented in written form than when they are given verbally. Only 5.6% of the services to be implemented were not implemented, but 47% of them had to be reviewed before implementation. In some cases, services were contracted just to confirm the opinion managers had already formed. The degree of satisfaction does not vary according to the region of the UK (Southeast and Scotland), but the level of expectations about quality is higher in the Southeast of England. The last result shows that higher expectations do not necessarily mean that the level of satisfaction achieved is lower, as they can be fulfilled thanks to a greater degree of co-production.
In Spain, Cuadrado and del Rio's studies (1991) show that 63,2% of companies approve the current level of service supply. The size of the company bears no influence on this result. However, limitations to the service supply were detected, as in the case of commercialisation services. 75% of Spanish companies were happy with the services received. Satisfaction is usually obtained when traditional or compulsory services are produced. There is a higher level of disagreement in services linked to a major technological innovation (market research, technological development, project viability, etc.), especially amongst small and medium companies.
Competitive Strategies in Business Services 239
According to the European Commission study (1989), the price of business services is not a decisive factor in the contracting process. Nevertheless, although most of those interviewed (60%) stated that the price was right, 36% claimed that prices were too high (mainly in the case of consultancy services), and prices were not regarded as low in any
. of the cases presented. Although the study does not show it, it is quite interesting to note that the most negative perception of the highest prices is for:
- Consultancy services (46%), personnel (44%), computer (39%) and marketing (35%) versus information (18%) and technical services (29%).
- Medium-sized companies: 100 - 250 workers (41%), and 250 - 500 workers (37%). In small and large companies the most negative evaluation is given by 30% of those interviewed.
- Countries with more mature markets, England (40%), France (40%) and Germany (38%), versus countries with less developed markets, Italy (26%) and Spain (30%).
Assuming that the evaluation of prices in itself gives the evaluation about satisfaction, the conclusions that can be deducted reveal two interesting ideas: 1st) if medium-sized companies are the most dissatisfied, this could confirm the hypothesis of duality and the existence of a gap in a segment of the market; 2nd) if maximum dissatisfaction is found in the most mature markets, this could mean that market thresholds require new initiatives in order to satisfy more experienced clients.
We can draw the general conclusion that there are few studies which shed light on business service effectiveness. This lack of data is partly due to the complexity of the interactions between the producer and the client during the service production process (see chapter 4) and which make the quantitative measurement of business services effectiveness difficult. There is, however, a general feeling of satisfaction which depends on various factors such as the country, the service required, the size of the company and the type of study performed. This level of satisfaction justifies the development of business services as a sector with respect to the development of business services as activities (in-house and out-house services).
240 Business Services in European Industry
5.2. To make or to buy
All modern enterprises realise that they can not make everything independently. The
need to subcontract goods and services is linked to those economic specialisation
■ processes which lead to increases in productivity and economic growth. Nowadays, this
trend affects all business services, encompassing traditional and technological, standard
or personal, technical or marketing services. An enterprise has to decide what is better:
to produce business services by itself or to contract these services out to specialised
companies. Often this is not an easy problem to solve. Part of a modem enterprise's
competitiveness on price, quality or market positioning can be linked to reaching a good
solution to this issue. This question has become so prominent in the recent years that
outsourcing has become a major businesses for management consultancy firms. Large
enterprises are willing to pay a considerable amount of money for help on the decision
to make or to buy. This section deals with this critical strategic issue.
5.2.1. Reasons for externalisation
Externalisation can be defined as the subcontracting of services previously produced
within a company. In fact, externalisation is a specific case of subcontracting, and
implies a certain change in the provision of the service. However, this does not
necessarily involve an independent external company, or even a subsidiary or associated
company. According to Howells and Green (1988), externalisation can occur in three
different ways: 1) split to a subsidiary or associated company; 2) relation through
companies in the form of licence or franchise; and 3) subcontracting with an
independent company.
Subcontracting and externalisation are very often confused. The two terms are not
always used according to the definition given above. "Externalisation " is often
associated with subcontracting, and "unbundling" or "outsourcing" can refer to
externalisation.
The process of externalisation related to subcontracting lies at the heart of a current
debate. Discussion centres on whether the origin of business services as a sector is the
result of a mere transfer of internal activities (unbundling), or conversely, if it is the
result of a broader range of factors. Moreover, it raises the question of whether
externalisation processes are being imposed in the place of intemalisation processes.
Next paragraphs outline the reasons behind the development of business services as a
sector, resulting from a shift from internal provision to external provision. These
reasons include factors which affect externalisation, many of which also explain the
process of subcontracting. Generally speaking, the reasons why a company goes outside
to look for a service do not vary greatly between a case of "new" subcontracting or "old"
subcontracting (services previously provided internally). The decision to buy new
services implies the selection of external agents over internal ones. However, it can be
said that the reasons for externalisation are valid for any kind of subcontracting, but the
Competitive Strategies in Business Services 241
contrary is not true. A company could decide to subcontract any service, whether it was previously provided internally or not, and it does not mean that this subcontracting affects the internal services which could provide the service.
.There are a multitude of different reasons which justify externalisation. These are generic reasons which depend on the structure, situation and sector of each company, and also, on the kind of service required. For example, in advanced services of high value added, externalisation reasons are principally related to quality. In traditional services, reasons usually concern costs or size. Also, the characteristics of the company influence externalisation. Other factors, such as the phase of the product life cycle and the uncertainty of markets affect the "to make or to buy" decision. Finally, "the quick development of externally linked services is, therefore, the result of the multiplicity of relationships through the different economical activities. It reflects the new organisational trends of the production system" (Bailly and Maillât, 1988, page 47). The main reasons will be analysed according to the different sources consulted: Gershuny (1987), Ochel and Wegner (1987), Illeris (1989a), O'Farrell and Hitchens (1990a), O'Farrell, Moffat and Hitchens (1993), Cuadrado (1989), Goe (1990, 1991), Porter (1990), Coeffey and Bailly (1991), Perry (1990a, 1992), Beyers and Lindahl (1994), Wood (1991b), and Calza and Passaro (1994).
Scale economies, costs and imperfect information
The traditional approach to externalisation implies costs reduction. Its origin can be found in Coase (1937) who maintained that "a company will tend to grow up to a point when the costs of organising an extra transaction within the company will be the same as the costs of doing that very same transaction through an interchange in an open market" (page 395). When the internal transaction costs exceed the external transaction costs, the different activities are subject to "vertical disintegration", that is to say, externalisation. When it is cheaper buying than doing, the one able to produce scale economies will be contracted. Stigler (1951) explains the classical theory of transaction costs, where vertical integration is a pure function of scale economies and externalisation tries to maximise them. Stigler argues that some functions can only be maintained by the large companies.
Transaction costs calculations must include costs from information and research, decision-taking and policy and performance. These three types of costs can be encapsulated in one: lost resources due to imperfect information. According to Williamson (1971), there are two factors behind transaction costs: human factors and transaction factors in an uncertain environment. Integration economies can be classified into three groups (O'Farrell, Moffat and Hitchens, 1993, page 387): 1) technical economies where joint production means cost savings (Robinson, 1931); 2) management and communication economies with vertical integration (Williamson, 1971); and, 3) integration as an answer to the uncertainty in obtaining inputs and outputs (Arrow, 1975).
242 Business Services in European Industry
This last factor is the most significant one in business services where the problems of imperfect information abound. Holmstrom (1985) explains the uncertainty about the service quality as a problem of moral hazard, the incapacity to detect the provider activities and the difficulty of establishing incentives to get the desired level of effort. Intemalisation has been proposed as the solution to the risk of adverse selection associated with the uncertainty of the contractual relationships of small companies, though these uncertainties also beset large companies.
In order to offset the problems of uncertainty, the reduction of transaction costs through flexible systems implies the realisation of fairly large external economies. Apart from the advantages of scale economies for specialised companies, consumers can also take advantage of network and scope economies. These arise from the same specialisation and its influence on the differentiation of products, which produces more opportunities for diversification. Network economies appear in markets where the collaboration among companies generates lower costs and increases service quality, distribution and sale.
The interest of transaction costs reduction and external economies increases when specialised services are produced in a place where demand is concentrated (Scott, 1988) and when the effects of eliminating barriers in the European market are taken into account (Elfring, 1993). Williamson's theory (1975) argues that the potential subcontractor will be less dependent on one or two clients when the number of producers increases, and therefore, the risks and transaction costs will be lower thus stimulating external contracting. The firms agglomeration organise markets in such a way that they make the development of business services easier (Stanback et. alt., ; Goe, 1990).
Finally, it is worth noting that the explanation of externalisation based on scale economies has been criticised in many quarters. The following points have been proposed as alternative explanations. However, the classical approach is valid inasmuch as it is a significant factor in prices configurations and, furthermore, complements other explanations (Cuadrado, 1989).
Reduction and control of potential costs
External business services reduce potential costs arising from the irregular variations in demand, the possible contractual and social conflicts with personnel and the necessary reinvestment in the training of employees, together with the real costs. External contracting also allows the company to estimate better than internal contracting, the costs of the services that will be needed in the future.
Quality and capability improvement
The need to improve quality in service production is a straightforward reason for external contracting. For example, in the United States the acquisition of specialised
Competitive Strategies in Business Services 243
"expertise" is cited as the main reason for subcontracting business services, whereas considerations of price seem to be secondary (Beyers and Lindahl, 1994). This is due to the need for higher exigency when there is inadequate, scarce or no user capacity. Quality is a relative concept which depends on the possibilities and capabilities of the companies, and equally on the perception of the quality improvements to be obtained. There is growing evidence to suggest that the need to acquire expertise exerts the strongest influence on externalisation, for instance Tordoir (1995) links this expertise factor to the support for internal expertise, pinpointing the importance of internal support to guide and supplement external expertise.
In standard conditions, the levels of specialisation and efficiency produced in the business service market are higher than those produced within the company. The competitive conditions of external markets raise quality/price ratios, thus producing superior external business services. "These external services base their originality and creativity in a permanent contact with multiple potential customers. Their integration within the company could make them less efficient" (Monmoyer, 1984). However, it is worth noting that the internal resources which can potentially provide business services also benefit from greater efficiency because they are integrated in the external markets through fruitful competition internal versus external business services, and the transfer of knowledge produced between the two ways of provision.
The specialised knowledge produced by business services is necessary to help companies to adapt themselves to the changing economic conditions. Many companies appreciate services for the know-how they contribute rather than any cost reduction they might bring. This is the case of the export services contracted by the small and medium Italian companies (Resmini and Saviolo, 1993). Externalisation takes advantage when external resources are used due to the improvement of internal service support resources, both direct and indirect. Again, external and internal provisions are not two separate fields.
Externalisation is a matter of gaining experience and capabilities in order to enjoy quality services, rather than incur a problem of costs transaction. As Stanback (1979, et. alt. 1981) and many others after him affirm, externalisation is not a matter of scale economies, but a specialisation issue. The background to this statement is the fact that specialisation is more closely linked to production organisation than to its scale (Petit, 1986). In this sense, a company does not need to be a certain size to externalise its services, but it does need to have a certain level of organisation (Cuadrado, 1989). This level of organisation can "anticipate the use of certain knowledge" (Coffey and Polèse, 1987b) by taking advantage of the potential benefits that the flexibility and specialisation of the market offer.
Production organisation
Internal organisation is often subject to subcontracting and externalisation. Most companies questioned in the EC report assigned to Peat Marwick (1988) stated that
244 Business Services in European Industry
externalisation has to be an integral part of the company's policy or philosophy, that is to say incorporated in the organisational aspects. Economic culture may well play a significant role here too. The option between internal service and external service is often dictated by the economic tradition. For example, European and American companies tend to subcontract more than Japan (Perry, 1990a).
Four types of reasons associated with organisation can be mentioned:
1. Flexibility. Flexibility in production requires constant but changing inputs of information and capabilities, making it impossible for companies to hire enough personnel to accomplish this goal. Flexible specialisation means substituting fixed costs with variable costs in the same way that a company externalises the transport service by using rail services. Flexibility produces externalisation but externalisation also produces flexibility (Marshall, 1982; Piore, 1986). This is why externalisation is changing the needs of specialised knowledge. The introduction of new technologies related to flexibility processes has also been a factor behind the growth of subcontracting, as it permits better coordination.
2. Concentration on key tasks. The contracting of external business services is related to the distance of the services from the expertise heart of the company. This simply consists of doing what the company can do better than others or what it needs to keep confidential, taking advantage in both cases of the market segmentation. This is one of the most common reasons for externalisation (Peat Marwick, 1988). The competitive pressure and the increasing instability of the economic system have led companies to increase their internal efficacy margins, turning into flexible structures by transferring productive resources and capabilities from non key areas to key areas. This is how the heart of the company is strengthened (Machines, 1987; Perry, 1992).
3. Independence. In the case of technical consultancy or R&D, for example, independent advice is usually very important. An objective vision guarantees that decisions which could be determined by particular interests within the company are either taken or avoided. This is applicable to the management consultancy services, quality control and many others. The independence factor is useful in the case of internal conflicts. These happen due to problems and discrepancies among employees and, more frequently, among the management staff. Occasionally, conflicts are a consequence of externalisation; when the know-how gained is introduced internally, friction may appear between those who learnt the old knowledge and those familiar with the new knowledge (Grenco and Calvelli, 1990). Thus, a feedback process between independence and externalisation is produced through the existent differences of knowledge flows.
4. Management complexity. The last factor concerns the increasing complexity of company organisation, which has led many to seek assistance from consultancy services.

Competitive Strategies in Business Services 245
Market penetration
Business services contribute to market penetration in diverse ways: . - Passive way. By developing routine tasks which enable the management to
support key issues about new markets. — Active way. By direct help in entering the markets through the consultancy,
marketing, trade exhibitions, etc. - Instrumental way. By being the instrument or means to gain higher market
shares. These are called the intensive information services, which do not look for the markets but do make it possible for the company to know them.
When talking about markets, these have to be understood not only in a geographical way, but also as any existing market in the new international context, which can range from a big country to a small market niche produced by local companies. Business services are pivotal in the processes of market segmentation. The changes obtained in production from the good-service integration, lead to a higher differentiation of products and to a higher degree of innovation in the way in which they are produced. Also, advanced business services help us to understand the segmented markets according to different cultures and ways of organisation. In short, business services provide the required specialists to face the complexity of international markets.
Government intervention
The intervention of the governments and new and complex regulations have extended the need for specialised services. Regulations of a particular importance are: fiscal and accounting (audit and accounting services); commercial (export and import services); certificates (quality control); subsidies (access to subsidy services); labour (personnel services); environment (engineering services, waste disposal); and operational (cleaning services, security services). There are two basic mechanisms through which governments influence business services:
1. All regulations tend to require specialised personnel who possess knowledge which is not always available within the companies. Government intervention requires professionals and specialisation from business services.
2. Labour regulations particularly affect the decision regarding external or internal contracting of personnel to produce business services. The cost of employment is often lower in small service companies, where jobs are quite flexible, the pressure of unions is weaker and salaries tend to be lower. Labour regulations determine the transformation of fixed costs to variable costs and vice versa, hence influencing externalisation. Companies with rigid internal labour conditions can benefit from a more flexible external labour market. This factor is particularly decisive for sectors suffering from strong cyclical demand fluctuations.
246 Business Services in European Industry
Characteristics of the contracting companies
The factors affecting the externalisation / intemalisation of business services are numerous and depend on the different characteristics of the companies. We highlight some conclusions of several European reports below.
According to investigations by Barcet and Bonamy (1983), the demand for external services varies depending on the kind of service subcontracted. This variety lies in its use and frequency. According to the EC report (Peat Marwick, 1988), the services most frequently externalised are the operational ones (security and cleaning services), engineering, law services and advertising. A simultaneous development of internal and external services is produced in advanced services, especially in computer services. In the study by O'Farrell, Moffat and Hitchens (1993), the services most regularly subcontracted are advertising, graphic design, and market research and the least are product design, R&D, planning and quality control. Illeris (1989a) maintains that subcontracting is higher in the areas of advertising, insurance, fiscal advice and transport than in design, marketing, organisation, personnel and R&D. Manual services facilitate externalisation, mainly because they tend to offer significant cost reductions and high quality (Sundbo, 1994).
Regarding the size of the companies, the EC report (Peat Marwick, 1988) reveals that medium-sized companies (50 to 500 employees) contract many external services while small companies rely more on internal services. These results strengthen Illeris's data, and confirm the theory propounded by Barcet and Bonamy (1983) on subcontracting which, with a few exceptions, shows an inverted U according to the size of the companies; grows in line with the size, remains stable and then, decreases. This implies that the demand for services requires the client to differentiate between the functions, which means that service provision within the company and the demand for business services are complementary. The smallest companies (without differentiation of activities) and the biggest ones (with specialised departments) hardly subcontract any services. In some cases, the variety of these relationships depends on the sector under consideration. According to O'Farrell et. alt. in the United Kingdom, the inverted U will work in personnel training, market research, quality control and design. In Spain, the size is, according to Mañas (1992), the most influential variable for externalisation (related to industrial branch and industrial location); the industrial branch of the client companies being the least influential variable. In services concerning administrative tasks, there is more externalisation in medium-sized companies, though often large firms require external services more frequently in the case of advanced services, such as personnel, market research and design.
Independent companies tend to contract more external services than subsidiaries. Illeris maintains that growing export companies require more external services. Barcet and Bonamy explain that the most decentralised companies are those which subcontract the most, as well as those which are subject to market changes (especially, in the use of
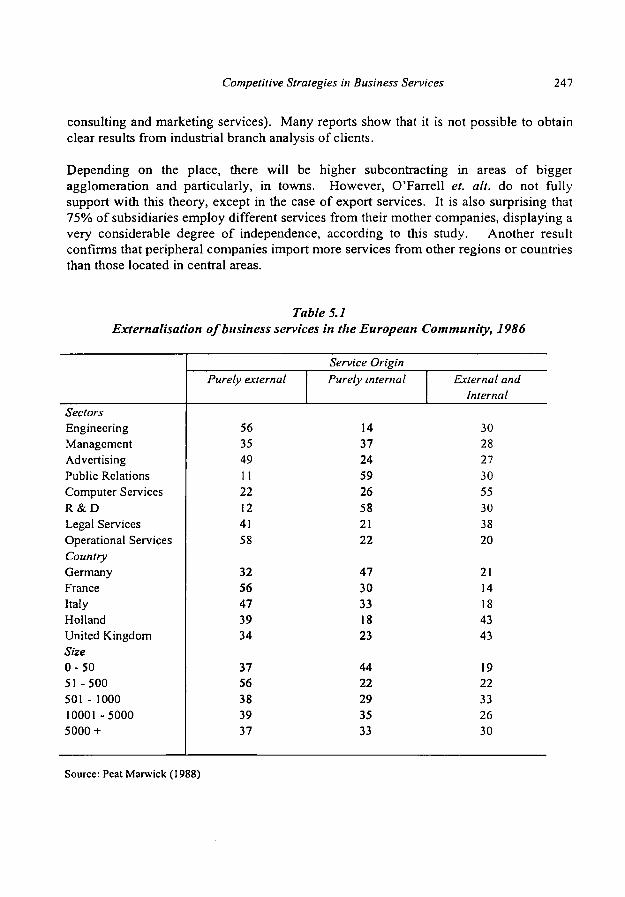
Competitive Strategies in Business Services 247
consulting and marketing services). Many reports show that it is not possible to obtain clear results from industrial branch analysis of clients.
Depending on the place, there will be higher subcontracting in areas of bigger agglomeration and particularly, in towns. However, O'Farrell et. alt. do not fully support with this theory, except in the case of export services. It is also surprising that 75% of subsidiaries employ different services from their mother companies, displaying a very considerable degree of independence, according to this study. Another result confirms that peripheral companies import more services from other regions or countries than those located in central areas.
Table 5.1 Externalisation of business services in the European Community, 1986
Sectors Engineering Management Advertising Public Relations Computer Services R & D Legal Services Operational Services Country Germany France Italy Holland United Kingdom Size 0 - 5 0 5 1 - 5 0 0 501 - 1000 10001 -5000 5000 +
Service Origin Purely external
56 35 49 11 22 12 41 58
32 56 47 39 34
37 56 38 39 37
Purely internal
14 37 24 59 26 58 21 22
47 30 33 18 23
44 22 29 35 33
External and Internal
30 28 27 30 55 30 38 20
21 14 18 43 43
19 22 33 26 30
Source: Peat Marwick (1988)
248 Business Services in European Industry
Depending on the country, three models can be discerned: large externalisation (France and Italy), strong intemalisation (Germany) and countries which combine internal and external resources. The case of France and Italy is explained in part by the heavy administrative and fiscal obligations. In the case of Germany, restrictive regulations and union influence have to be considered (Ruyssen, 1990). Another study (Scheuer, 1994) indicates relatively low external contracting in Germany, especially for personnel training (12.5%) and R&D (10.1%), but also for data processing (26.7%) and technical services (23%). However, these data are underestimated taking into account that the companies that provide these external services do not necessarily belong to the same category of business services. Table 5.1 shows the EC results of the survey carried out in 1988.
Optimisation of the competitive advantage by the providers
Besides the demand factors cited, supply development also plays a significant role in the subcontracting of business services. In many cases, the supply capacity and creativity has created the need for subcontracting, which otherwise would not exist. The mere fact that the service is there is regarded as important or very important for 67% of the companies interviewed by the EC (Peat Marwick, 1988). The territorial agglomeration of services in this sense is one of the main reasons for externalisation.
The business services offer is based on what it is able to contribute to the value chain of their clients. Porter (1990) establishes five areas for opportunity: innovation (creativity and new technologies), new needs, new market segments, costs changes and availability, and changes in the regulations and laws. Thanks to these advantages, the supply multiplies the existence of market niches for business services. "The attractiveness of business services will increase with low prices and high quality, which in turn depend upon favourable supply conditions (competition, regulation, use of new technologies, wage levels)" (Ochel and Wegner, 1987, page 85).
The way to get those advantages is related to different factors: size, internationalisation, new technologies, better education system and labour flexibility. New technologies have been able to create new services by creating in turn new needs. Business services have become more commercial and, therefore, more accessible and "provocative", due to their industrialisation (investment in technology). The mode of production has also affected this process because customer requirements are met more fully and the service production processes adopted are more adaptable. The network organisation has also facilitated its expansion by enlarging markets without the need to increase size and produce "reputation economies".

Competitive Strategies in Business Services 249
5.2.2. Externalisation versus intemalisation
The outsourcing business stems to a certain extent from the existing difficulties of providing high quality business services under the best price and organisation conditions. Even though a major part of this business still refers to the subcontracting of production phases attached to the first manufacturing or service activity, auxiliary services are increasingly evaluation subjects. This applies even to the consultancy services, the advantages, problems and risks of which often emerge (Gadrey et alt, 1992; Mitchell, 1994; The Economist, 1997). Nonetheless it is evident that the outsourcing issue leads to the need to evaluate in a professional way the best way to use or externalise business services.
Externalisation is not a simple and irreversible process, but a complex and reversible one. Many activities which are initially subcontracted to an external firm are internalised afterwards. This happens in these two cases:
1. when the company considers that it is ready to produce that service better than the external firm and, probably, after having learnt the "expertise" used by the provider up to that moment; and,
2. when the client is not happy with the provider and decides to do it on his own provided he can not find somebody better.
In the first case, business services perform a very positive task for the economic system. In contrast, the second case, at first sight, represents a negative situation. However, in both situations a net positive effect can be discerned, because a deeper understanding of the limits and possibilities of a service provided will improve the allocation of resources, give a more realistic perspective on time issues and increase the quality standards.
The limits to externalisation have been classified by Perry (1992) into four main groups: 1) criticism of the flexible production systems when there are doubts about the goal of consumption society, the substitution of internal jobs for external jobs, the low costs of flexible production and the redistribution of tasks; 2) efficiency and subcontracting problems coming from the following up, control and evaluation of external services; 3) advantages of intemalisation due to a better integration of goods and growing scale economies (classical economic reasons); 4) the technological change which improves internal services and the integration with the client.
As regards the third point, Chandler's investigations (1981) during the late 70's on intemalisation, examined the main trends in large modem firms, which consisted of internalising functions in order to create synergies within a hierarchical organisation. Williamson (1981a) attributed the success of intemalisation and service centralisation to the large multi-division corporations. Stachey and White (1993) point out four advantages of vertical integration: 1) market failures; 2) higher power market; 3)
250 Business Services in European Industry
creation of entry barriers and prices discrimination; 4) development of new markets and increase of market shares.
From this standpoint, externalisation has an opportunity cost which has to be added to the direct costs. Both costs could be higher than the possible benefits, which would explain the trend (observed mainly during crises) of reducing the external expenditure versus the reduction of internal expenditure. If this is analysed according to the kind of sector contracted, it can be observed that the case for intemalisation in some instances is supported. The fact that very often, particularly in the case of manufacturing companies, routine services are subcontracted could be seen to be to the detriment of the main role of business services in economy (Wood, 1991b) and the advantages of externalisation.
Beyers and Lindahl (1994) examine another common problem: most business service firms developed from selling the same products produced by the person who founded the company. It can be deducted from this that rather than a process of vertical disintegration, it is necessary to talk about opportunity advantage on the founder's part or the desire to control the business. This situation reduces the role of externalisation from a process which creates innovation to a simply process of taking advantage of opportunities. However, companies identify their competitive advantage within the specialised niches over time and, in any case, approximately 75% of companies think that they operate in a highly competitive environment.
Some of the non vertical integration problems do not arise if service economy is considered instead of manufacturing economy. For instance, this occurs in the case of three disadvantages usually associated with externalisation: the higher technological dependence, the difficulty of controlling costs and the possibly lower control of markets (fewer entry and exit barriers):
- Technological dependence is much more intangible in business services than in manufacturing goods.
- The difficulties of price control seem to be very important in business services markets, where providers sell at prices which depend on the competitive pressure. However, business services prices are not as decisive as they are in manufacturing and they do not change in line with international markets variations. Business services prices are not "imposed" but "put" according to the service and the expectations that the customers have about them.
- The control of markets is paramount in concentrated manufacturing markets where it is in the company's interest to retain a dominant position. In fragmented markets (such as those of business services), the entry and exit barriers are connected to the continuity of specialised segments rather than to the control of the operating companies and the transfer of technology.
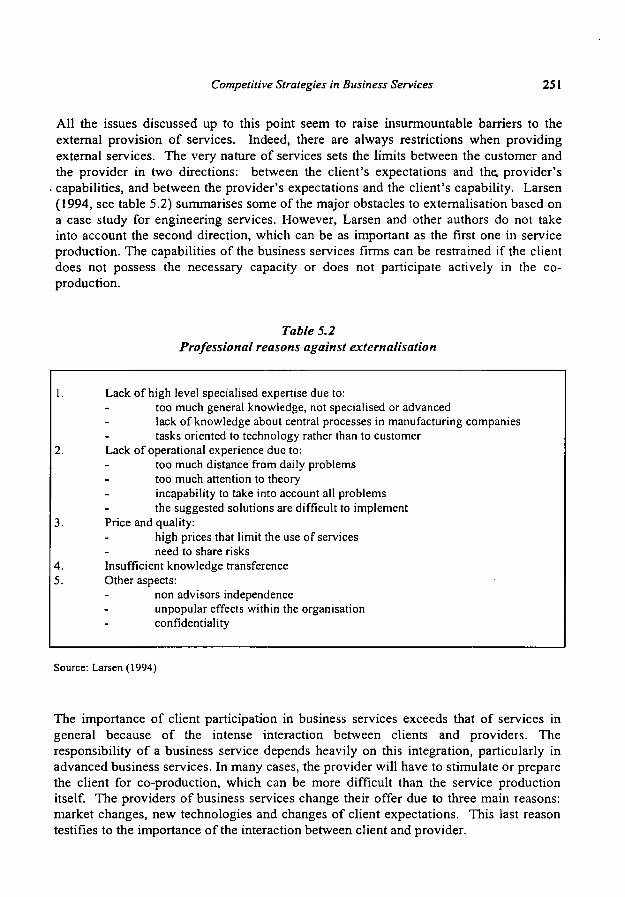
Competitive Strategies in Business Services 251
Ali the issues discussed up to this point seem to raise insurmountable barriers to the external provision of services. Indeed, there are always restrictions when providing external services. The very nature of services sets the limits between the customer and the provider in two directions: between the client's expectations and the, provider's
. capabilities, and between the provider's expectations and the client's capability. Larsen (1994, see table 5.2) summarises some of the major obstacles to externalisation based on a case study for engineering services. However, Larsen and other authors do not take into account the second direction, which can be as important as the first one in service production. The capabilities of the business services firms can be restrained if the client does not possess the necessary capacity or does not participate actively in the co-production.
Table 5.2 Professional reasons against externalisation
1. Lack of high level specialised expertise due to: too much general knowledge, not specialised or advanced lack of knowledge about central processes in manufacturing companies tasks oriented to technology rather than to customer
2. Lack of operational experience due to: too much distance from daily problems too much attention to theory incapability to take into account all problems the suggested solutions are difficult to implement
3. Price and quality: high prices that limit the use of services need to share risks
4. Insufficient knowledge transference 5. Other aspects:
non advisors independence unpopular effects within the organisation confidentiality
Source: Larsen (1994)
The importance of client participation in business services exceeds that of services in general because of the intense interaction between clients and providers. The responsibility of a business service depends heavily on this integration, particularly in advanced business services. In many cases, the provider will have to stimulate or prepare the client for co-production, which can be more difficult than the service production itself. The providers of business services change their offer due to three main reasons: market changes, new technologies and changes of client expectations. This last reason testifies to the importance of the interaction between client and provider.
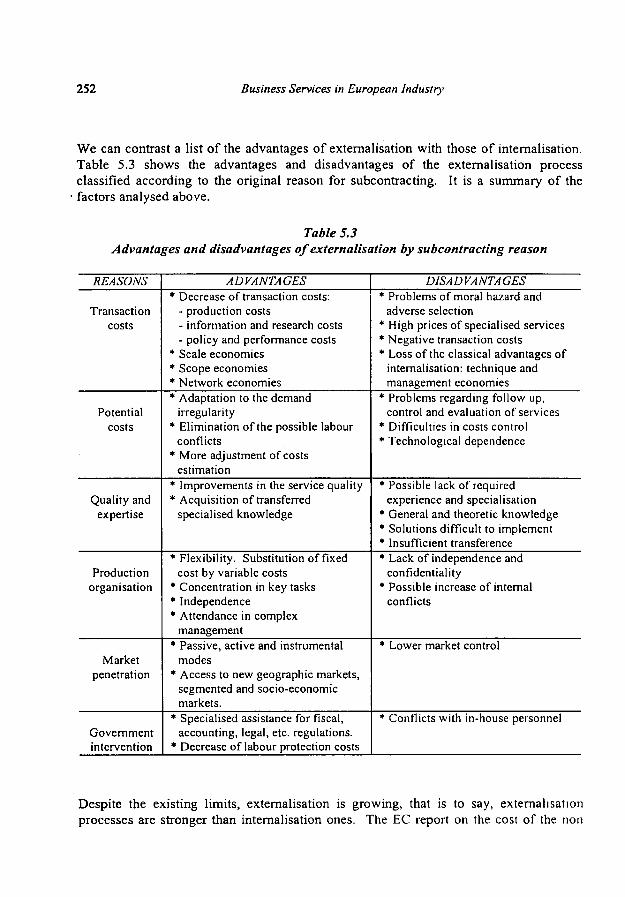
252 Business Services in European Industry
We can contrast a list of the advantages of externalisation with those of intemalisation. Table 5.3 shows the advantages and disadvantages of the externalisation process classified according to the original reason for subcontracting. It is a summary of the factors analysed above.
Table 5.3 Advantages and disadvantages of externalisation by subcontracting reason
REASONS
Transaction costs
Potential costs
Quality and expertise
Production organisation
Market penetration
Government intervention
ADVANTAGES * Decrease of transaction costs:
- production costs - information and research costs - policy and performance costs
* Scale economies * Scope economies * Network economies * Adaptation to the demand
irregularity * Elimination of the possible labour
conflicts * More adjustment of costs
estimation * Improvements in the service quality * Acquisition of transferred
specialised knowledge
* Flexibility. Substitution of fixed cost by variable costs
* Concentration in key tasks * Independence * Attendance in complex
management * Passive, active and instrumental
modes * Access to new geographic markets,
segmented and socio-economic markets.
* Specialised assistance for fiscal, accounting, legal, etc. regulations.
* Decrease of labour protection costs
DISADVANTAGES * Problems of moral hazard and
adverse selection * High prices of specialised services * Negative transaction costs * Loss of the classical advantages of
intemalisation: technique and management economies
* Problems regarding follow up, control and evaluation of services
* Difficulties in costs control * Technological dependence
* Possible lack of required experience and specialisation
* General and theoretic knowledge * Solutions difficult to implement * Insufficient transference * Lack of independence and
confidentiality * Possible increase of internal
conflicts
* Lower market control
* Conflicts with in-house personnel
Despite the existing limits, externalisation is growing, that is to say, externalisation processes are stronger than intemalisation ones. The EC report on the cost of the non
Competitive Strategies in Business Services 253
Europe for business services (Peat Marwick, 1988) revealed that 54% of the companies interviewed increased their externalisation processes during the last five years, whereas 5% of them re-internalised. This was due to the following:
1. The new production organisation is more flexible and multi-located. This makes the work division and specialisation more intense, thus increasing the need for experts and specialised services.
2. The technological innovation in information and telecommunications extends the services functions, the package good-service and the demand for specialised services.
3. The process of production internationalisation and the broadening of the services market.
Similar trends can be observed at present in the processes of internationalisation and externalisation, for example in the United States (Beyers and Lindahl, 1994). This strengthens the argument that both processes take place at the same time depending on the different reasons influencing the externalisation or intemalisation of the service. Externalisation (and subcontracting) and intemalisation are simultaneous processes but they are not substitutive or, as Barcet and Bonamy put it (1994) internal and external services are complementary rather than alternative. The reinforcement of internal and external simultaneous processes of business services has also been analysed by Illeris (1989a), Pedersen (1986) and O'Farrell, Moffat and Hitchens (1993). Interaction between internal and external services is necessary, as Tordoir's empirical study for USA and the Netherlands (1995) clearly indicates: "the necessary competence for efficient use of external professional services springs from internal professional support capacity" (page 117).
Another aspect of the problem is that more detailed analysis by sectors is needed in order to study the variability of the increasing complementary element. Internal departments compete with external business services to a different degree depending on the sector involved. Beyers and Lindahl (1994) find less competition in legal and engineering services (many companies do not have these departments) than in management and public relations services, but in all three activities it is proved that most of the departments do not compete. The option between externalisation and intemalisation depends on the characteristics of the company and on the nature of the service (Marshall, 1989; Perry, 1990a). Tordoir's (1995). Positive correlation between internal and external professional support development is evident for all external service categories except for accountancy and legal services, because these are developed internally, irrespective of eventual external use. However, all other advanced business services (economic analyses, management consultancy, communication services, human resources management, marketing and advertising, market research and engineering consutancy) fit that pattern.
254 Business Services in European Industry
5.2.3 Does externalisation explain the need for business services?
Another issue, linked to the debate about to make or to buy, arises when trying to account for the growth of business services using the processes of externalisation as the prime explanatory factor. If business services are the result of externalisation, their contribution to the value added coincides with the reduction in the internal production process, and therefore, the final result does not vary. The same tasks that were formerly performed inside the company are now done outside the company. This would reduce externalisation to a process mainly based on the following: 1) some professionals taking advantage of the experience they have acquired in order to form their own team and obtain higher salaries; 2) the reduction of costs which comes from contracting highly standardised services (operational and administrative, where scales of economy are obtained when they are produced outside); and 3) some "modish/fashion" effects in services (such as management or computer services) which are cyclical or occasional These reasons, among others, call into question the role that business services have in economic development, and fuels the specious notion that they are a marginal element in the economy.
It is evident that such an argument does not take into account most of the elements considered in this book. Even when the final net result in terms of employment produces only a change in the sector activity, its advantages could be explained by the shift in the productive process or the various reasons justifying externalisation. Even if there is not an additional movement in the real demand for business services, the consequences of externalisation would produce a positive effect in the production system due to the increased quality obtained, costs reduction, increased specialisation, increased competitiveness of internal resources, etc. The three main reasons for externalisation - costs reduction, increased quality and need for specialisation - would still be valid.
This debate has been summarised by O'Farrell, Moffat and Hitchens (1993) from an empirical study on the United Kingdom. According to this research, the consequences of externalisation are three out of the following: 1. reduction of number of employees and service activities within the industrial
sector; 2. the activity volume of services could not increase; 3. the location of services could change; 4. demand could increase for business services.
The second point does not necessarily have to happen due to the simultaneity of externalisation and increase in demand processes. The rise in subcontracting does not imply externalisation (in conditions of increased demand), but externalisation does imply subcontracting.
Competitive Strategies in Business Services 255
Some authors contend that externalisation is the main factor behind the growth of business services. For Rajan (1987) and Lewis (1988) business service growth is due to the exchanging of employment inside the companies for subcontracting of required services outside the company. The characteristics and significance of the statistical
. sample have been, however, called into question (Perry, 1990a).
Other authors consider that real growth explains the expansion of the business service sector. According to Beyers (1989) and Kutscher (1988) externalisation is a minor element of the increase in business services. Perry (1990a) says that "the interview (which has been carried out) shows that the increase of demand for services is the strong reason for the expansion of services industry rather than the transference of sectors" (page 205). Tschetter (1987) asserts: "externalisation for individual companies (the loss of working posts) can be largely overcome by the increase of internal employment for these activities in other firms" (page 39). In his analysis of input-output tables, Fontaine (1988) reaches the same conclusion as Tschetter.
A study carried out by Keeble et alt. (1991) suggests that intemalisation had a minor effect on the growth of business services in the United Kingdom during the eighties. This is deducted from the fact that only a fifth of the companies interviewed answered questions concerning the measurability of intemalisation. According to research by the European Community (Ruyssen, 1990) the movement of subcontracting in business services is not just a transfer of employment between second and third sectors, but it implies a new division of work between the demanding company and the service company. This does not imply the reinforcement of the autonomy of business services, but on the contrary, the narrowing of interrelations between this sector and industry in an increasingly competitive environment.
Although externalisation is usually produced in the region where the headquarters are located (example: Illeris, 1989a), it is not necessarily linked to the more developed structure of central regions (example: O'Farrell et alt., Mañas). The externalisation process does not appear to be related to the geographic factor, reinforcing its role in the economy in a double sense. On the one hand, because externalisation takes place in both more developed and less developed areas, with more importation in the latter though (example: Martinelli, 1991b). On the other, because when companies need to go outside the area where they operate in order to externalise a service, the potential benefits of subcontracting justify the costs produced by distance, which always are important in services, even in this new technological era.
In brief, most of the studies offer a conclusion: the main reason for the increase in the output in business services and their use centres on the expansion of demand and the changes in the productive systems, and not on the redistribution between the manufacturing sector and the service sector. Nevertheless, this does not mean that the discussion is closed. Some aspects need to be developed further. For example, it is evident that externalisation is an easier process to estimate than intemalisation, which may explain why intemalisation is undervalued. The processes of change in the modes
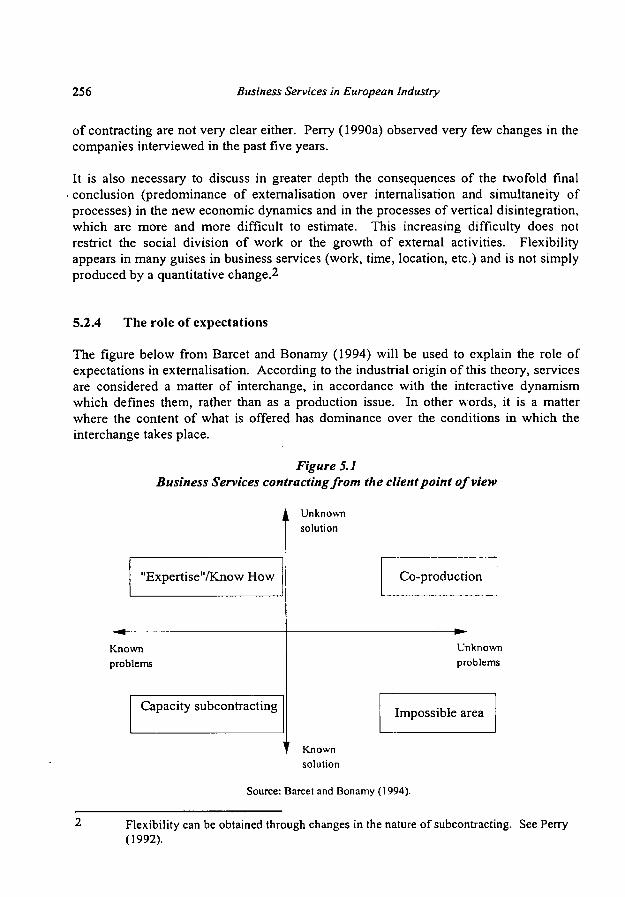
256 Business Services in European Industry
of contracting are not very clear either. Perry (1990a) observed very few changes in the companies interviewed in the past five years.
It is also necessary to discuss in greater depth the consequences of the twofold final conclusion (predominance of externalisation over intemalisation and simultaneity of processes) in the new economic dynamics and in the processes of vertical disintegration, which are more and more difficult to estimate. This increasing difficulty does not restrict the social division of work or the growth of external activities. Flexibility appears in many guises in business services (work, time, location, etc.) and is not simply produced by a quantitative change.2
5.2.4 The role of expectations
The figure below from Barcet and Bonamy (1994) will be used to explain the role of expectations in externalisation. According to the industrial origin of this theory, services are considered a matter of interchange, in accordance with the interactive dynamism which defines them, rather than as a production issue. In other words, it is a matter where the content of what is offered has dominance over the conditions in which the interchange takes place.
Figure 5.1 Business Services contracting from the client point of view
"Expertise"/Know How
Known problems
Capacity subcontracting
Unknown solution
Co-production
Unknown problems
Impossible area
Known solution
Source: Barcet and Bonamy ( 1994).
Flexibility can be obtained through changes in the nature of subcontracting. See Perry (1992).

Competitive Strategies in Business Services 257
This is the starting point for a review and revision of the theory of transactional costs. A service has to be understood as a dynamic economic reality, which generates a certain income of which every participant tries to obtain a part. But this income is not definite,
. it only appears when the service adapts to the current problem, through changes which can involve different degrees of quickness and permanence.
This theory shows the possibilities of extemalisation/internalisation according to a figure defined by two axes: the degree of knowledge of problems and the degree of knowledge of solutions. This is how Figure 5.1 is obtained. Out of the four possible areas, Barcet and Bonamy consider that one of them is impossible. Out of the remaining three, the first situation refers to co-production. When problems and solutions are unknown, innovation is necessary, and there is maximum association and co-production between provider and demand. The second case indicates the provider has expertise or know-how, which the client does not possess. Externalisation therefore takes place. In the third case, capacity subcontracting, the client would be able to produce the same service, but for different reasons he prefers to externalise. Intemalisation would take place in this case, when problems are known and there are no objective reasons or no expertise exists to suggest the contrary.
From this theory, it is possible to gain a better understanding of the dynamics of extemalisation/internalisation. An additional step can be taken if it is considered that the fourth "impossible" area is, in fact, "possible". This change is based on the concept of the economic problem as a reflection of the problem of existence. For instance, the solution to human desires (happiness, love, peace, etc.) is not as crucial as knowing what the problems are that have to be tackled in order for a solution to be really effective (which are the best objectives and the way to approach them). The objective is always to find an answer, but often the answer is already known; it is therefore necessary to pose the right questions and present the right problems to ensure that the answer and the solution are useful.
In "Nature and destiny of man" (1943) Niebuhr, an American philosopher and theologian, suggests that "nothing is more incredible than the answer to a problem which has not been raised". There is nothing more futile than giving a solution to one who does not need it. In a world where a great number of books have been written and scores of theories have been developed about management, and in which experience often guides us towards the most logical decision, the crux is to know how to articulate the right problems and the most urgent needs. Thus, the so-called impossible area is, in fact, a very important area, in which the provider attempts to show the client how to apply the solutions that he may already know. In many cases, the greatest contribution of a business service company is not to give answers, but to identify the right problems and to point to where it is necessary to take action. Therefore, an alternative figure can be presented, showing the dynamic behaviour of the intemalisation (Int) -externalisation (Ext) relationship (Figure 5.2).
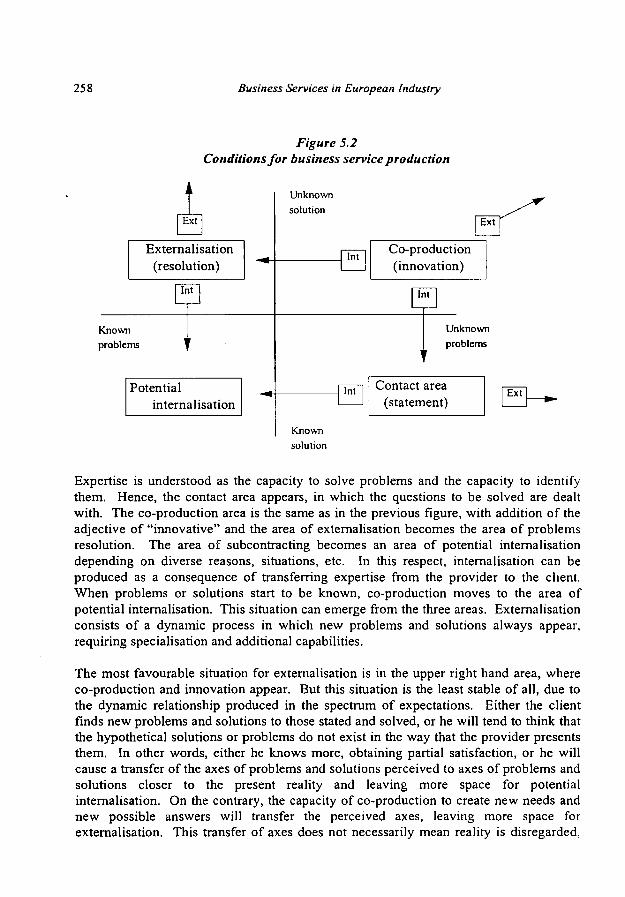
258 Business Services in European Industry
Figure 5.2 Conditions for business service production
Ext
Externalisation (resolution)
Int
Known problems
Potential intemalisation
Unknown solution
Ext
Int Co-production (innovation)
Im
Unknown problems
lnt Contact area (statement)
Ext
Known solution
Expertise is understood as the capacity to solve problems and the capacity to identify them. Hence, the contact area appears, in which the questions to be solved are dealt with. The co-production area is the same as in the previous figure, with addition of the adjective of "innovative" and the area of externalisation becomes the area of problems resolution. The area of subcontracting becomes an area of potential intemalisation depending on diverse reasons, situations, etc. In this respect, intemalisation can be produced as a consequence of transferring expertise from the provider to the client. When problems or solutions start to be known, co-production moves to the area of potential intemalisation. This situation can emerge from the three areas. Externalisation consists of a dynamic process in which new problems and solutions always appear, requiring specialisation and additional capabilities.
The most favourable situation for externalisation is in the upper right hand area, where co-production and innovation appear. But this situation is the least stable of all, due to the dynamic relationship produced in the spectrum of expectations. Either the client finds new problems and solutions to those stated and solved, or he will tend to think that the hypothetical solutions or problems do not exist in the way that the provider presents them. In other words, either he knows more, obtaining partial satisfaction, or he will cause a transfer of the axes of problems and solutions perceived to axes of problems and solutions closer to the present reality and leaving more space for potential intemalisation. On the contrary, the capacity of co-production to create new needs and new possible answers will transfer the perceived axes, leaving more space for externalisation. This transfer of axes does not necessarily mean reality is disregarded,
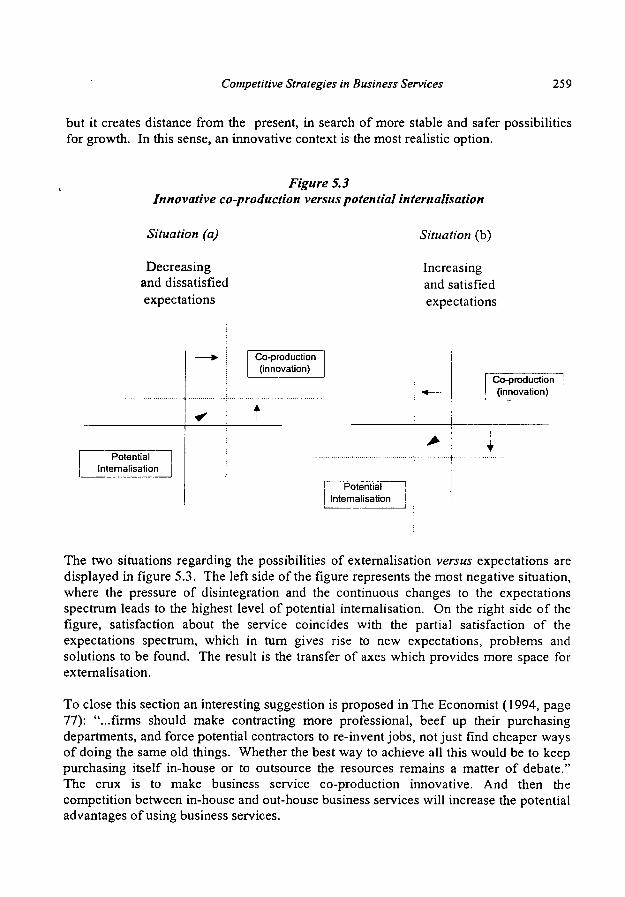
Competitive Strategies in Business Services 259
but it creates distance from the present, in search of more stable and safer possibilities for growth. In this sense, an innovative context is the most realistic option.
Figure 5.3 Innovative co-production versus potential intemalisation
Situation (a)
Decreasing and dissatisfied expectations
Situation (b)
Increasing and satisfied expectations
Potential Intemalisation
Co-production (innovation)
Co-production (innovation)
Potential Intemalisation
The two situations regarding the possibilities of externalisation versus expectations are displayed in figure 5.3. The left side of the figure represents the most negative situation, where the pressure of disintegration and the continuous changes to the expectations spectrum leads to the highest level of potential intemalisation. On the right side of the figure, satisfaction about the service coincides with the partial satisfaction of the expectations spectrum, which in tum gives rise to new expectations, problems and solutions to be found. The result is the transfer of axes which provides more space for externalisation.
To close this section an interesting suggestion is proposed in The Economist (1994, page 77): "...firms should make contracting more professional, beef up their purchasing departments, and force potential contractors to re-invent jobs, not just find cheaper ways of doing the same old things. Whether the best way to achieve all this would be to keep purchasing itself in-house or to outsource the resources remains a matter of debate." The crux is to make business service co-production innovative. And then the competition between in-house and out-house business services will increase the potential advantages of using business services.

260 Business Services in European Industry
5.3. Marketing of business services
Before examining the marketing of business services, there are other aspects within a company, which need to be reviewed, given the importance of having a global picture of the issue under consideration. Before a company decides to develop a marketing plan, it needs to have a clear idea of what is usually known as its mission, central basic idea or Leitbild (Manso, 1991), that is to say, why it exists. Coming down from this mission as a cascade, an objective or vision needs to be defined. This vision is what the company wants to become. In order to achieve this objective, a certain strategy will be developed, marking the path that the company will follow which in a consistent way will contribute to its success. The strategy is usually the result of identifying the gap between what the company is and what the company wants to become. The existing gap between those two points will be bridged by putting into place the marketing plan. Finally, organisation is simply a consequence of the strategy identified as the most appropriate to achieve the goals as it needs to be adapted according to the resources that the company decides to employ.
From this sketch, the advantages for a company which follows this itinerary and develops a marketing plan can be outlined. The marketing plan is a useful tool which makes it easier to accomplish the company objectives. In other words, it acts as a guide which helps to make the planning and allocation of resources more effective and profitable. Its dynamic nature has to be taken into account, due to the changing circumstances which require it to be brought up-to-date constantly and incorporate inputs, controls and corrective actions when necessary. But marketing can be also understood as a philosophy, inasmuch as all actions done by the company employees are imbued by the main central idea and they are oriented in such a way that they produce a culture, which can be identified and defines the personality of that company.
5.3.1. What is marketing?
Thousands of books have been written regarding the technique which allows products and services to be sold in an aggressive and changing environment. Excess supply has given meaning to the existence of those people working in companies devoted to making their companies become market leaders and then to keep that position, which is even more difficult.
There is a common misconception that marketing is synonymous with advertising. In fact, advertising is simply one of the communication tools used by marketing. In short, marketing can be defined as a series of techniques used to give life to products and services. What is needed to create products or services? What would their characteristics be? How can they be launched? Who is going to buy them? How are they going to reach the persons who might be interested in them? What will their prices be? What are the competitor's products/services? The answers to this string of questions can be found in marketing.

Competitive Strategies in Business Services 261
Therefore, marketing is related to all aspects involved in a company. This is the reason why so many authors regard marketing as a philosophy, and not just a cluster of techniques. In fact, Grönroos (1990) depicts successful marketing as a mental attitude, which inspires the whole organisation, from the doorman through to the general
. manager.
This has also serious implications for the traditional organisation of a company, in which each employee is allocated specific tasks in a department. Today, organisations have to be much more flexible and self-critical. Marketing has to be implemented by the whole organisation not by the experts alone and anyone can contribute to the process of attracting new clients, keeping them and increasing his company's profits and progress.
The concept of marketing has undergone a decisive evolution. Traditionally, marketing has been oriented towards a production point of view, with the aim of bringing together production and consumption. Basically, this was due to excess supply opposite the existing demand. Today, marketing is market-oriented, in other words the consumer is foremost. The problem has been turned on its head; the consumer is deluged every day with information about products and services. There is excess demand and he has to make a choice.
This leads us to a broader definition of marketing when applied to services. Traditionally, the four "p's" of the marketing mix (product, place, price, promotion) have been considered the critical elements to be taken into account by marketing experts. During the 80's more and more "p's" have been added to Borden's original list (1964): people, public relations, policy, publicity, etc. Grönroos (1990) contends that the fact of adding "p's" as new marketing elements shows that the marketing mix approach has failed as a general model. Indeed, in marketing for services, this approach does not cover all the resources, activities and processes involved in client relationships.
This is why Grönroos (1990) presents an alternative: the new marketing definition is client-oriented, with special emphasis on obtaining a sustainable long-term relationship with the client. Because this ensures that continuous profitable interchanges are established on a long-term basis. Grönroos (1990) defines the marketing relationship as follows: "Marketing is to establish, maintain, and enhance (usually but not necessarily always long-term) relationships with customers and other partners, at a profit, so that the objectives of the parties involved are met. This is achieved by a mutual exchange and fulfilment of promises. ... The resources of the seller - personnel, technology and systems - have to be used in such a manner that the customer's trust in the resources involved, and thus in the organisation itself, is maintained and strengthened", (page 138).
As Grönroos observes, the marketing relationship approach is not as pedagogical as the marketing mix approach. On the contrary, it is difficult to implement because "it does not provide users with an easy-to-implement list of groups of marketing variables or means of competition. Instead, it forces users to think for themselves and to analyse the
262 Business Services in European Industry
marketing situations at hand, as well as develop an understanding of what resources and activities are required to establish, maintain, or enhance a relationship with a specific customer or segment of customers", (page 140).
5.3.2. Marketing of products versus marketing of services
There are significant differences between the marketing designed for products or services. These differences stem from the nature of products and services. Grande (1996) summarises the main differences as: standardisation (no two services produced the same way), costs and prices (related to the perceived quality of the service), productivity (depending on the process quality), supply and demand fluctuation, scale economies, experience/expertise, risk of designing and launching services, entry barriers (legal, brands, financial resources), difficulty of keeping and maintaining competitive advantages, human factor, interactive nature of services, quality and time (see Chapter 4).
Therefore, the marketing mix that needs to be applied for products or services will vary. Nevertheless, there are a number of common strands: product decisions regarding design, branding, quality, lines and ranges of products, product characteristics; price decisions regarding price policy and strategy and payment terms; distribution decisions, regarding channels selection, geographic coverage, points of sale, organisation of sales representatives; communication decisions regarding advertising, promotion, publicity and public relations.
The specific characteristics of services production are highlighted below. The customer witnesses the service production process, he can see how a service is produced. For this reason, the method used should create a favourable impression on the potential customer. For example, when someone comes into a bank or goes to the doctor, he receives the service instantly as it is produced. The environment of the production scene plays a central role. On the contrary, when he buys a product, he has not been present during its production and the environment does not influence his attitude towards that product. Therefore, for services, the level of quality is defined during production, and because a service can not be produced the same way twice, the level of quality will differ from case to case.
Regarding price, the interchange value is related to the perceived quality. Nol everybody is willing to pay the same price for the same service, quite simply because not all of them perceive the service received as the same. Price is used as a regulating factor which has to be adapted to each individual case.
In the distribution of services the human factor is crucial. Usually, services are supplied through persons who contact potential customers during the service production process. The provider will be in direct contact with the consumer. In the case of products, the manufacturer will seldom contact his clients directly as products are sold through different channels.
Competitive Strategies in Business Services 263
The sales force of a service company needs to develop marketing skills in order to sell services. They must put themselves in the customer's place, understand his needs, analyse the supply and provide the best quality, according to the tools and means that the
. company has put at his disposal. This is particularly important when selling services because the representative of a firm needs to be able to make decisions, solve problems, give answers and get promises at the same time that he is offering the service in order to achieve customer satisfaction. He only has one chance of gaining the client and he has to make the most of it! For this reason this post carries a high level of responsibility, because the employee is acting as the General Manager of the company in the sense that he is using the resources to make profits and he must not do this in an unbalanced way.
All these differences are the result of the time lag in the application of the marketing techniques to the service sector. Even today, many companies do not implement marketing properly from a market/client-oriented point of view. This approach has been adopted very recently by the large service companies, due to an increasingly changing environment.
The multiplicity of life styles, determined by the changes that have taken place during the last decade regarding the roles of the members acting in a traditional society have pushed companies to compete, by adapting themselves to the market. Nowadays, men and women has similar responsibilities as regards the family, children, jobs, society, but complexity is the defining characteristic of present-day society. And in this complex world, services play a vital role. Excellent products are no longer enough. People's needs have become more and more complex - not necessarily higher - and this is where services can shine. Customers have the final word. And services companies are part of this evolution. Their capacity to adapt themselves and their commitment to these new requirements will enable them to become more and more professional, profitable and in demand.
5.3.3. Marketing in business services
When preparing a marketing plan for a business service, the first thing to consider is the basic elements in the service production process. Eiglier and Langeard (1989) identify the elements and their internal connection in figure 5.4. The client, without him, the service will never exist; the physical base understood as the necessary means for the service production and its environment; the contact personnel, who are in direct contact with the customer; and the service, as the objective of the system which is the result of the interchange among the client, the physical base and the contact personnel.
They consider the marketing tasks according to the marketing classification: interactive marketing tasks, operational marketing tasks and management marketing tasks. Interactive marketing includes all activities connected to the relationship between contact personnel and client. Operational marketing tasks require specialised personnel as they involve market research, budget control and controlling. Finally, management

264 Business Services in European Industry
marketing tasks include strategy and planning which usually rely on the marketing representative.
Figure 5.4 Key elements of the service production process
Physical base
I Contact personnel
Client
t Service
Grande (1996) maintains that the following factors must be taken into account in order to implement marketing activity in a company:
1. Basic principles to attend the customer. These are customer-oriented activities, consistency and identity.
2. Relationship marketing, where clients are considered the most valuable asset of the company.
3. Internal marketing, which is oriented to involve all employees in the company's commitment with the client. To achieve this, a company employs and keeps the best people in the organisation.
4. Cultural change. The culture of a company is an unwritten code, which serves to bring together a vast organisation through common values and traditions. A relevant culture is key to a successful marketing implementation. To modify the culture is however, a long process and the success will depend on the management style, their motivation and personal charisma. Together with the way objectives are fixed and communicated internally and the ability of employees to adapt themselves to new situations.
5. Key values of service companes. These should be consumer-oriented activities, flexibility and creativity.
6. Organisation. Service companies do not follow the standardised model of organisation. Given its importance, this aspect will be analysed in greater depth later on in this chapter.
Once a company has analysed all these factors in relation to their specific objective and the means to achieve it, it must start the marketing process. Grönroos (1990) calls this the moment of truth. Because this is when the company shows if it is really

Competitive Strategies in Business Services 265
market/consumer-oriented and, depending on the way it develops the marketing plan, it will succeed or fail.
Here, marketing is an integral part of producing and delivering services. In other words, . managing the moments of truth of the buyer-seller interactions is a marketing task. The marketing function can be divided into two separate sub-functions: a specialist function, concerning the traditional marketing mix activities; and a marketing function, related to the buyer-seller interactions where the marketing tasks are performed by "part-time marketers" (page 141), or employees involved in marketing activities but who are not aware of their link with customers and marketing.
Marketing is a dynamic process, where traditional marketing activities (market research, promotion, advertising, etc.) and interactive marketing resources and activities will have to collaborate so that profitable long-term customer relationships are developed and maintained. The Grönroos (1990) Three-stage model demonstrates this long-term marketing approach. This is shown in table 5.4.
Table 5.4. The three-stage model
Stage Initial stage
Purchasing process
Consumption process
Objective of marketing To create interest in the firm and in its services To turn the general interest into sales. First purchase: giving promises.
To create re-sales, cross-sales, and enduring customer relations. Fulfilling promises.
Marketing function The traditional marketing function (1). The traditional and the interactive marketing functions. The interactive marketing function.
(1) The traditional marketing functions are considered selling, sales promotion, price, positioning, placement, pubi
Source: Service Management and Marketing. Grönroos 1990,
here to be advertising, ic relations, page 143
In interactive marketing, internal and external communication is key to success, because service companies need to communicate with their clients and with their employees. As regards internal communication it is essential for employees to understand what it is going to be sold. It is not just the representatives or the contact personnel who have to know this, but also all personnel involved in any process affecting the final service to be offered. A clear and stimulating message must be sent about the quality standards required, so that the employees are able to develop their work according to the objectives for the final customer. From this standpoint, the first client for a company is its own employees.

266 Business Services in European Industry
Many managers show a worrying incapability to communicate the basic lines of performance to their subordinates. This lack of dialogue leads to negative attitudes. The people in charge should be able to explain the promises they are proposing to their clients, so all employees know exactly what to do to fulfil them. In this way, employees will also feel responsible for the customer satisfaction and they will be motivated to contribute. There are several ways to achieve this: regular meetings, public recognition of achievements and contributions to customer satisfaction, awards for successful initiatives, etc.
Once the company managers are sure that their organisation is client-oriented, external communication with clients can begin. However, due to the characteristics of services, a potential client can not evaluate and compare (as with goods) the service offered, in terms of quality and price. This increases the risk involved in their decision and hence, explains the difficulties of attracting clients for the business service sector.
Eiglier and Langeard (1989) maintain that any communication strategy must be guided by the following principles: existence, continuity, differentiation, clarity, realism, adaptability and internal acceptance. Grande (1996) proposes the following steps in a communication programme: market segmentation, objectives establishment, message designing and media planning. Other communication activities such as promotion, sales and public relations must conform with the aforementioned principles and steps. It is important not to overlook that fact that the main goal of communication is to inform the potential customer about the service that a company can offer him. Then, to persuade him to choose that service and over another and finally, activate the purchasing stage.
If the offer is well targeted and meets with the client's approval, this might trigger the advantageous process of word-of-mouth. The marketing impact of hearsay can sometimes be the most fruitful communication tool. As Grönroos (1990) says, "word-of-mouth " is the message about the organisation, its credibility and trustworthiness, its way of operating, its services, and so on that is communicated from one person, a customer or practically anyone, to another" (page 158). He summarises the guidelines for managing market communication as follows: 1. Direct communication efforts to employees; 2. Capitalise on word-of-mouth; 3. Provide tangible clues; 4. Make the service understood; 5. Communication continuity; 6. Promise what is possible; 7. Observe the long-term effects of communication; and 8. Be aware of the effects of the absence of communication.
5.3.4. Customer service
Increased interest in client-oriented communication, besides traditional advertising, has led to the development of customer service centres in many companies. The revolution of communication techniques - telephone, mobiles, internet, modems, etc. - have indeed also facilitated the growth of more client-oriented structures within companies.

Competitive Strategies in Business Services 267
A customer service centre will act as the link between the company and the customers, providing open client access to the company in order to meet their different needs. Therefore, this department will become the face of the company in front of the customers. It is easy to understand, therefore, the importance of creating and
- maintaining good relationships with existing clients and potential clients.
The creation of these centres requires a great deal of preparation and commitment. The first step is to identify the issues which concern the customers the most in terms of orders, information, claims, general questions and requirements. Secondly, the department currently responsible for answering client questions must be identified. In most cases, this is the sales section. Hence a customer centre becomes a support department and enables the sales representatives to dedicate more time to sales activities and work on the client portfolio.
The next step is to select the employees who will form the centre. A clear profile needs to be drawn up, including technical, psychological and personal skills in interactive communication. A company may decide to promote current employees, look for specialists outside or train the people who usually handle these issues. But it is the essential for them to understand the objectives and resources to secure a good performance.
In terms of techniques, a complete management information system should be backed up by some procedures to ensure supervision. Feedback from both internal and external sources should be given to improve communication flows. This means that regular customer surveys need to be carried out, analysed and communicated to the employees (internally) in order to explain and also improve the current standard of client support.
For the service centre to be a successful investment, new technology is useful, but seldom decisive. Instead, the challenge is to find the right staff to conduct the all important relationship with the clients in a positive and proactive, dynamic and flexible way.
Finally, management recognition and commitment is necessary for customer service centres to be implemented successfully. Otherwise, this service will be perceived by the rest of the organisation as a cost centre that does not generate benefits and profits, which will impair the level of performance and motivation.
This process is even more important in the cases of service companies and business services companies than in manufacturing companies. The model and the purpose of a customer service centre is essentially the same. The main difference lies in that whereas in the case of manufacturing companies, customer service centres are developed as a final step, for business service companies and for service companies, customer service centres are the first areas to be developed. The reason for this is that service companies can not show physically what they are selling. A service requires support lent by a group of people who are ready and able to be consulted whenever the potential or
268 Business Services in European Industry
existing client has a doubt, claim, question or suggestion. Service companies have introduced toll free calls, claim services, suggestion boxes, etc. Because customer satisfaction is their goal and leit motif, they need to poll their clients and a whole range of new tools have been developed for this purpose. Manufacturing companies have begun to latch on to this with the aim of improving their competitive edge as well.
5.3.5. Organisation and marketing
The importance of organisation in a customer-oriented company, or business service company has already been indicated. We can depart from assertion that the right model for the organisation of a company operating in the service sector does not exist. In fact, there are great a number of ways to organise activities in a service company. But a common thread runs through all of them -that is, they are open systems. This means that organisations are flexible enough to adapt themselves to market requirements and that there are formal links which assure the correct flow of activities, but also, informal links which enhance the relationship with customers.
It is much more complex and difficult to define the organisation required in the relationship which needs to be established throughout service companies than that of manufacturing companies. Owners, managers, providers, employees, clients, etc. are linked through diverse kinds of relationships which interconnect and exchange information. This is caused by the interactive nature of services (see chapter 4) and by the fact that both, producer and consumer, participate in the service production process. In service companies, the producer is not only the manufacturer, as this role is extended to practically any person working in the organisation.
Maqueda and Laguno (1995) have represented this flow of relationships as shown in Figure 5.5. They reach the conclusion that one main difference between the organisation of service companies and that of the manufacturing sector is that the former needs to be straightforward, participatory, communicative and more "humanised" (page 145). The human factor must be recognised as the key factor for the success in the business service organisations.
Therefore, every company will have to strive towards the ideal organisation by taking into account their own situation in terms of activity, resources and environment. According to Flipo (1989) there are however some general principles which may help service companies to define their organisation: market needs, competitors, service standard, service production system, employees characteristics, kind of employees system, organisational structure and motivation system.
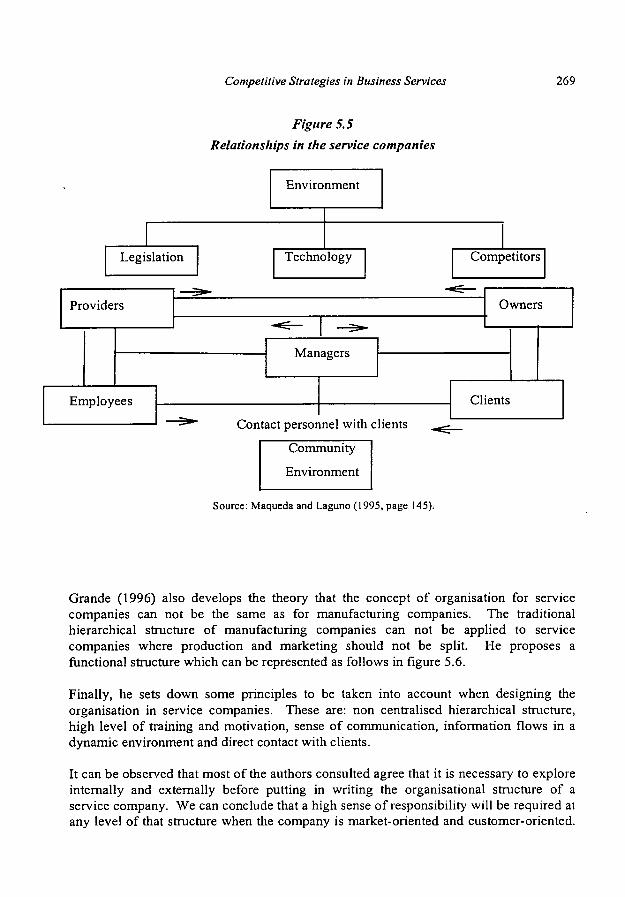
Competitive Strategies in Business Services 269
Figure 5.5 Relationships in the service companies
Environment
Legislation Technology Competitors
Providers Owners
Managers
Employees
Contact personnel with clients
Clients
Community
Environment
Source: Maqueda and Laguno (1995, page 145).
Grande (1996) also develops the theory that the concept of organisation for service companies can not be the same as for manufacturing companies. The traditional hierarchical structure of manufacturing companies can not be applied to service companies where production and marketing should not be split. He proposes a functional structure which can be represented as follows in figure 5.6.
Finally, he sets down some principles to be taken into account when designing the organisation in service companies. These are: non centralised hierarchical structure, high level of training and motivation, sense of communication, information flows in a dynamic environment and direct contact with clients.
It can be observed that most of the authors consulted agree that it is necessary to explore internally and externally before putting in writing the organisational structure of a service company. We can conclude that a high sense of responsibility will be required at any level of that structure when the company is market-oriented and customer-oriented.
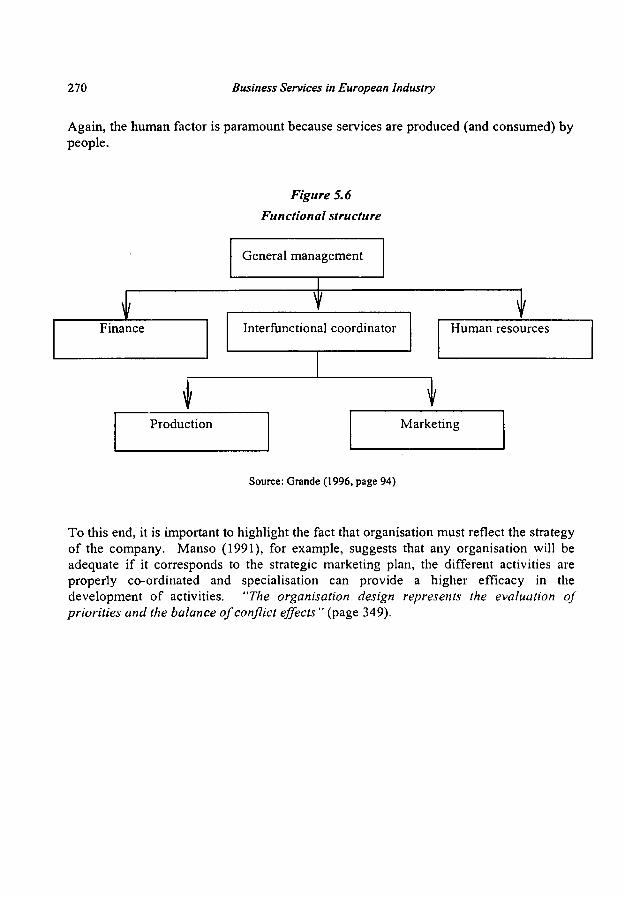
270 Business Services in European Industry
Again, the human factor is paramount because services are produced (and consumed) by people.
Figure 5.6 Functional structure
\ / Finance
j
General management
Y Interfunctional coordinator
w
1
Human resources
Production Marketing
Source: Grande (1996, page 94)
To this end, it is important to highlight the fact that organisation must reflect the strategy of the company. Manso (1991), for example, suggests that any organisation will be adequate if it corresponds to the strategic marketing plan, the different activities are properly co-ordinated and specialisation can provide a higher efficacy in the development of activities. "The organisation design represents the evaluation of priorities and the balance of conflict effects " (page 349).

Competitive Strategies in Business Services 271
5.4. Management of business services
5.4.1. Management theories
■ A selection of management theories is presented below, based on the evolution in the
business arena. We aim to clarify how the different ways of understanding the
management have led to the present management style in service companies and how
these are structured and managed according to market and consumer demands.
Maqueda and Laguno (1995) give an interesting account of the different schools which
have grown up throughout the evolution of economy from the beginning of this century.
The first of these is the classical school, epitomised by the theories propounded by
Taylor (1911) and Fayol (1916). The classical school champions scientific
management, which represents an integration of the two directions of business. During
this period, a manager's concerns centred on the improvement of productivity in
factories in order to increase the company's profits and employees' salaries, as well as
the organisational issues from the perspective of the management board. The main
studies focus on human efficacy, workers' productivity, tasks and specialisation and
operations designs. Scientific organisation is proposed as the solution, which divides
tasks by specialised workers and classifies all activities and operations into the well
known functions: production, finance, commercial, accounting, administration and
security.
Later, during the 20's up to the 40's, a new factor is included in the study of the
management: the importance of human relationships and the behavioural schools. This
is linked to progress in the study of psychology applied to industrial development. New
research areas were discovered at this time: motivational theory by Maslow, leadership
and formal/informal organisations.
The Weber school develops the two previous theories in greater depth and uses the
umbrella term bureaucracy. The salient characteristics of this theory are: existence of
rules, norms and procedures to regulate internal formal relationships, selection and
promotion of employees linked to their technical training and productivity,
specialisation of labour and specification of responsibility, separation of shareholders
and management, hierarchical principles, objective evaluation. Informal influence or
leadership capabilities hold no sway in this school.
The quantitative school reflects the problems related to the Second World War, when
companies had to tackle new logistic and operational problems. During the war,
scientific teams were formed to improve the massive production demand, at the lowest
possible cost. Once the war was over, these techniques and in particular high volume,
standard quality and low costs spilled over to the large industrial sectors.
From the 60's onwards the school of social systems started to develop management
theories. The study of the large companies, the inter-personal relationships, their

272 Business Services in European Industry
internal behaviour, analysing the processes of decision taking, as well as the economic and social implications of those companies was developed from a sociological point of view. They introduced theories about systems, in which people's interests, behaviours and findings were interconnected and which encompassed the entire organisation.
The New Classical school bases its values on the concrete case, in the experience, through direct observation of reality. They return to the idea of maximisation of profit at lowest costs, efficacy and formal structure as a measurement of the productivity of the company. Technical management, called objectives-oriented management, is based on the centralisation of strategic decision taking and decentralisation of tactical decision taking. Control and motivation through competitiveness are other characteristics of this school.
The general systems theory have largely influenced the management approach. This theory considers the companies as open, complex and human organisations where multiple interchanges between the internal and external players take place, giving rise to the different products, processes and services. In these systems synergies are produced as a consequence of the interchange activity and better results are obtained through effective pooling of efforts, information and skills.
The contingency approach is more than a theory. It understands the company as an open system, highly influenced by the environmental and technological changes and urges (therefore) the management style to reflect the current circumstances. This approach regards service companies as open social-technical systems. The main management activities include analysis of the decision-making process, formulation of objectives and internal communication. There are two kinds of variables which affect the results of the company: the "hard" variables coming from the technological system and the "soft" variables, coming from the social system, which are the psychological, cultural and social aspects. Both types of variables interact in the company producing different results and effects.
Service companies present specific characteristics related to this last management approach. There are various groups of people who establish a certain type of relationship: public authorities, associations, parties, media, competitors, clients, shareholders, financial entities, unions, employees, providers and technological structures. The relationships which take place among them differ from the relationships which exist in the case of manufacturing companies. As described earlier in this chapter, there is a direct relationship between clients and providers in the service production process.
We highlight below the contribution of several authors who have applied this theory to the service sector.
1. The service production system, by Eiglier and Langeard. They consider the service production process as a compound of six elements which are
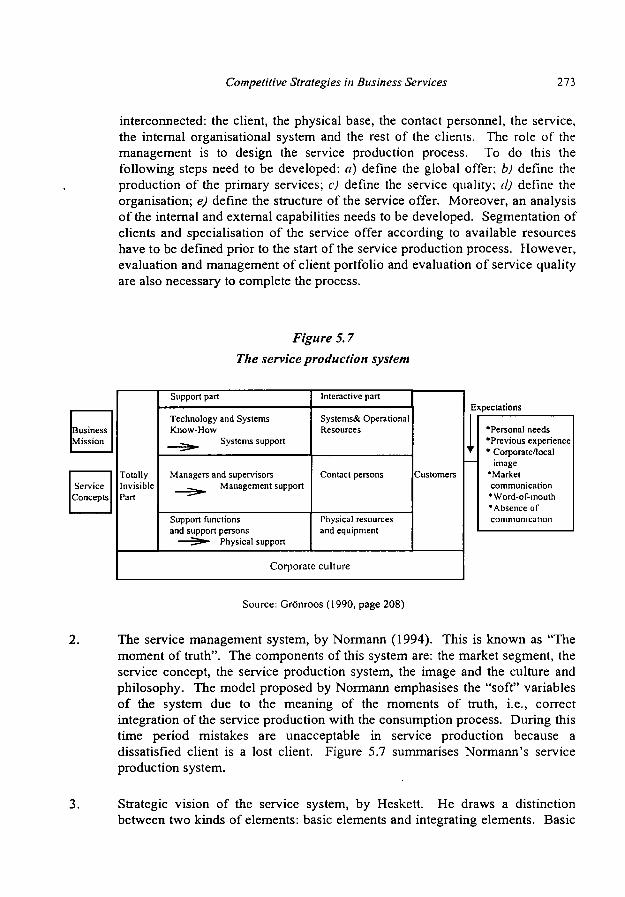
Competitive Strategies in Business Services 273
interconnected: the client, the physical base, the contact personnel, the service, the internal organisational system and the rest of the clients. The role of the management is to design the service production process. To do this the following steps need to be developed: a) define the global offer; b) define the production of the primary services; c) define the service quality; d) define the organisation; e) define the structure of the service offer. Moreover, an analysis of the internal and external capabilities needs to be developed. Segmentation of clients and specialisation of the service offer according to available resources have to be defined prior to the start of the service production process. However, evaluation and management of client portfolio and evaluation of service quality are also necessary to complete the process.
Figure 5.7 The service production system
Business Mission
Service Concepts
Totally Invisible Part
Support part
Technology and Systems Know-How
, Systems support
Managers and supervisors Management support
Support functions and support persons
^ ^ Physical support
Interactive part
Systems& Operational Resources
Contact persons
Physical resources and equipment
Customers
Corporate culture
Expectations
•Personal needs •Previous experience * Corporate/local
image •Market communication •Word-of-mouth •Absence of communication
Source: Grönroos (1990, page 208)
The service management system, by Normann (1994). This is known as "The moment of truth". The components of this system are: the market segment, the service concept, the service production system, the image and the culture and philosophy. The model proposed by Normann emphasises the "soft" variables of the system due to the meaning of the moments of truth, i.e., correct integration of the service production with the consumption process. During this time period mistakes are unacceptable in service production because a dissatisfied client is a lost client. Figure 5.7 summarises Normann's service production system.
Strategic vision of the service system, by Heskett. He draws a distinction between two kinds of elements: basic elements and integrating elements. Basic
274 Business Services in European Industry
elements include the market segments, the well defined concept of the service, the focused operational strategy, the designed system of service production, the service positioning, the power of value versus cost and the integration of the operational strategy with the service production system. On the other hand, the service concept, the approach value/cost and the operational strategy act as integrating elements. Heskett's approach falls under the theory of systems and strategic management of services. Both elements need to be examined in order tackle the different questions concerning the management of services. Indeed, it represents a complete vision of all elements involved in the service management process and an excellent approach to identifying key areas of opportunity.
5.4.2. Management areas
The theories set out above enable us to define a number of key management areas in the service production process. The basic management areas can be summarised and described as follows:
1. Client management. In service production processes the client acts as co-producer. He participates actively in the process to acquire the service he requires. Therefore, it is not enough to concentrate research efforts on consumer habits when dealing with services. Here, client management is vital because external factors may influence the client's decisions, for example, the level of satisfaction attained and loyalty to the provider. In most cases, these factors will be beyond the service provider's control. But there are ways to avoid at least unpleasant reactions from a dissatisfied client. The first step is to understand and develop client participation. It is essential to adapt the client demand to the offer that the provider is able to give. Segmentation will help to do this. It is necessary to gauge the customer's behaviour in terms of their participation in each service case. Different scenarios can be designed in order to adapt participation and offer based on the results obtained.
Another important aspect is that participation needs to be presented in an attractive way to the client so that he realises the significance of active participation. This will boost trust in the company.
Finally, unless the client is prepared for it, participation is not controlled and effective for both producer and consumer. Initially, this will require time and resources because the company has to train its clients to effectively co-produce. Unless this is approached as collaboration (producer + consumer), there will always be a certain imbalance between the management of external and internal human resources. Essentially, service production is a matter of interchange and the first step is to be ready for it.
2. Operations management. In service production, it is necessary to identify all the steps which need to be taken in order to produce the required service. Every

Competitive Strategies in Business Services 275
element of the service production process will develop a number of activities. All of them are interconnected in the sense that they produce part of the service. Two examples -auditing and market research services- are given below, based on Eiglier and Langeard's (1989) example for restaurants. They take the service production process and describe all the operations that every element of the process needs to do. Tables 5.5. and 5.6. summarise them. They illustrate at which point of the service production process different components need to be considered. The client's assessment after receiving that service will depend on his analysis of every single detail he is able to observe. Therefore, it is advisable to carry out this exercise when a service is being designed. This helps ensure that all factors are covered, but it can also serve as useful quality control tool.
Table 5.5. Auditory service production
3. 4.
5.
6. 7. 8. 9.
10 11
CLIENT OPERATIONS First meeting Terms of reference approval Definition and evaluation of the operating system Control test Evaluation test First conclusions Main conclusions presentation Approval meeting Final report
1. 2.
3. 4. 5. 6. 7. 8.
PHYSICAL SUPPORT
Auditee bank data Matrix and audit program Schedule Operating system Test First report Conclusions report Final report
CONTACT PERSONNEL
1.
2.
3. 4.
5.
6.
7. 8. 9. 10 11
12 13 14
15 16 17 18
Auditor analyses background Auditor prepares terms of reference First meeting Control evaluation matrix preparation and audit program Preparation of schedule audit Definition and evaluation of the operating system Control test First evaluation Evaluation test First conclusions Identification of participants for corrective action implementation List of weaknesses Control evaluation Main conclusions presentation Final report preparation Final report project Approval meeting Final report

276 Business Services in European Industry
Table 5.6. Market Research service production
CLIENT OPERATIONS 1. 2. 3. 4. 5. 6. 7. 8. 9.
10
11
Briefing preparation First meeting Proposal evaluation Proposal discussion Project approval Schedule definition First report presentation Report analysis Identification of deviations
. Corrective actions approval
. Final analysis and decision taking process
PHYSICAL SUPPORT 1. 2.
3. 4. 5. 6. 7. 8. 9.
Briefing Market research proposal Project Schedule Sample Methodology Analysis Report Final analysis
CONTACT PERSONNEL 1.
2.
3. 4. 5. 6. 7. 8. 9. 10 11 12 13 14 15
First meeting. Presentation of briefing Study of briefing and alternatives Proposal presentation Proposal discussion Project approval Schedule definition Objectives definition Kinds of studies selection Sample selection Field work methodology Analysis criteria Field work First report Report presentation Corrective action proposal
Contact personnel management. As mentioned above, the contact personnel in the service production is key to the process. The first decisions to be taken regarding contact personnel management concern the profile of the employees who will be in direct contact with clients. Of course, properly trained people are required in terms of both communications and technical skills. The main action points for contact personnel management are as follows: definition of style, definition of tasks, training and actions to be developed. As regards definition of style, aspects such as costs, education level, evaluation of performance and responsibility areas, further definitions need to be envisaged. When defining tasks, it is very important to bear in mind that the contact personnel receive pressure from two directions: on one hand, they will be seek to protect the company's interests and the established procedures; on the other hand, they have to listen to, understand, and try to resolve the client's problems, which in some cases can be contradictory or even run counter to the company's interests. Indeed, they act as moderators. This is not a comfortable situation and contact personnel must endeavour to as be professional as possible. Finally, the two kinds of operations they have to develop are operational and relational. The operational tasks are usually dictated by the job description as in any other position of the company. The relational tasks tend to appear at any stage of the tasks development.

Competitive Strategies in Business Services 277
A final consideration from the management point of view is the evaluation and supervision of contact personnel. The importance ascribed to them must be proportional to the role they" play in the service production process. They usually represent the last level in the hierarchical structure, but they establish the first contact with the company's clients. The burden of maintaining client loyalty and satisfaction falls on their shoulders and therefore their training, professionalism and behaviour must be geared towards those responsibilities. It is essential to recognise that for the success of the whole process.
5.4.3. Strategic management
When the management style exerts a decisive influence on the success of the company's activity, the term strategic management is employed. In an unstable environment, a firm should think in terms of strategy, before defining any managerial aspects, organisation or resources. The first step consists of analysing the strategic issue. For this purpose, Ansoff (1976) proposes the classical analysis of the environment in terms of opportunities and threats and the internal analysis regarding weaknesses and strengths. This establishes where the company stands, i.e. what its situation is with regard to itself and to its competitors. The company then needs to discover how to adapt itself to the environment in such a way that it is able to compete and achieve its main objectives. Of course, the strategic issue has been developed. Manso (1991) presents this evolution in his discussion of corporate planning and strategic planning which leads to the concept of strategic management (table 5.7).
Table 5.7 Strategic planning versus strategic management
CONCEPTS
1. System
2. Horizon 3. Strategy and decision processes 4. Management style 5. Environment changes
6. Variable nature
STRATEGIC PLANNING Structured process based on forecasting Long-term definition Centralised and focus on experts Rationalist Seen as parameters
One way
STRATEGIC MANAGEMENT
Non structured process, flexible and adaptable Short, medium and long term Decentralised and participating: all organisation involved Creative Dynamic: changes are included in the system as variables or signs to react Open to the environment: economic, social, cultural, legal, technological influence.
Source: Manso (1991, page 109)

278 Business Services in European Industry
Corporate planning was considered to be the first management system, based on the organisational issue and characterised by highly classified processes and policies establishment. Strategic planning succeeded corporate planning, where the management style stressed adaptation to the objectives. The strategic issue is introduced as long-term planning. Finally, strategic management supplanted strategic planning. The main difference is that strategic management focuses on strategic problems, trying to find alternative answers to the different pressures coming from outside the company. At the same time, it attempts to forecast the changes that may occur in order to prepare an adequate response and avoid negative results.
When it devises a strategy, the company attempts to answer to the following basic question: How are we going to compete?. A strategy involves a process that takes place between the company and the environment and as such, it requires objectives and policies to be set in order to defend and improve the company's competitiveness. Next, the company's mission, the differentiating capacities of the company, the competitive advantages and the synergies all need to be identified. Numerous approaches have been applied to the business service sector. The common strand that runs through them all is that strategic management can and needs to be applied to all factors, departments and tasks operating in a business service company. The following items can be dealt with as strategic areas and managed accordingly: co-ordination between marketing and operations, quality control, evaluation of efficacy and efficiency, internal marketing, external analysis, etc.
Porter (1987) identifies three general types of strategy: total leadership in costs, differentiation and focus or segmentation. The first of these was very popular during the 70's when the effects of the experience curve started to be applied to improve costs in the production systems. Differentiation and segmentation are clearly important strategies to develop in the service sector. It is fundamental for all strategies to be consistent with the company's objectives. Although this is an obvious point to make, it is crucial to remember it on a day-to-day basis, as it is a common mistake to develop or select strategies which are inconsistent with the company's main objective. Grande (1996) adds a fourth type of strategy, that is the situation of the market in each of the service situations, as shown in Table 5.8.
This table shows five different situations of service development: actual or existing services, services which can be modified, services which can be enlarged, new services linked to a related technology and new services linked to a different technology. Markets fall into three categories: new, existing or related to suppliers or distributors with a resource required to produce the service. From those variables, the different strategies are developed according to the market and status of the service in each case. For example, in the case of range extension strategies we can cite the case of banking in an existing market, offering new products such as insurance or fiscal and financial consultancy, besides the traditional products, i.e. bank accounts, saving accounts, loans,
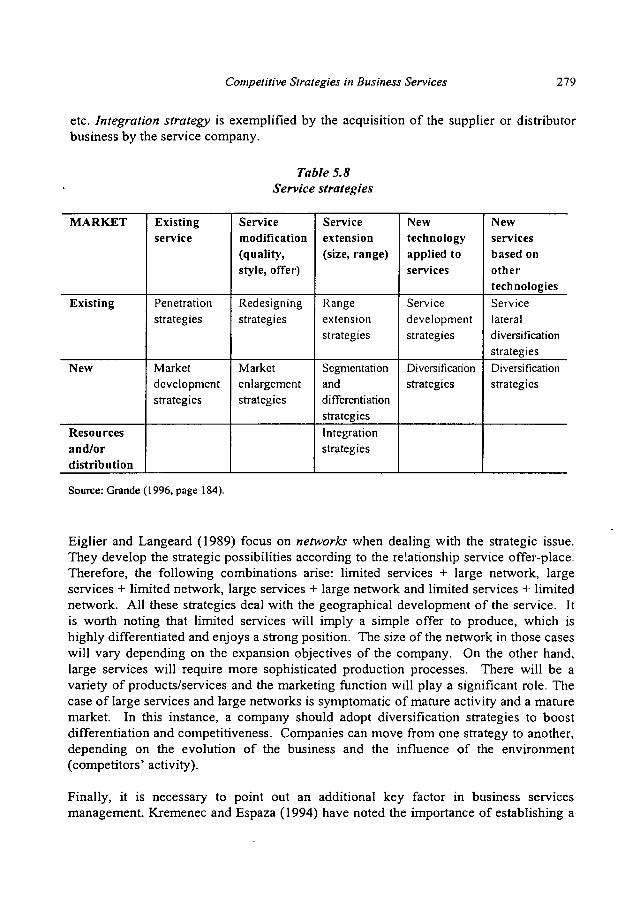
Competitive Strategies in Business Services 279
etc. Integration strategy is exemplified by the acquisition of the supplier or distributor business by the service company.
Table 5.8 Service strategies
MARKET
Existing
New
Resources and/or distribution
Existing service
Penetration strategies
Market development strategies
Service modification (quality, style, offer)
Redesigning strategies
Market enlargement strategies
Service extension (size, range)
Range extension strategies
Segmentation and differentiation strategies Integration strategies
New technology applied to services
Service development strategies
Diversification strategies
New services based on other technologies Service lateral diversification strategies Diversification strategies
Source: Grande (1996, page 184).
Eiglier and Langeard (1989) focus on networks when dealing with the strategic issue. They develop the strategic possibilities according to the relationship service offer-place. Therefore, the following combinations arise: limited services + large network, large services + limited network, large services + large network and limited services + limited network. All these strategies deal with the geographical development of the service. It is worth noting that limited services will imply a simple offer to produce, which is highly differentiated and enjoys a strong position. The size of the network in those cases will vary depending on the expansion objectives of the company. On the other hand, large services will require more sophisticated production processes. There will be a variety of products/services and the marketing function will play a significant role. The case of large services and large networks is symptomatic of mature activity and a mature market. In this instance, a company should adopt diversification strategies to boost differentiation and competitiveness. Companies can move from one strategy to another, depending on the evolution of the business and the influence of the environment (competitors' activity).
Finally, it is necessary to point out an additional key factor in business services management. Kremenec and Espaza (1994) have noted the importance of establishing a

280 Business Services in European Industry
reputation first in order to obtain entrepreneurialism by developing external markets or by simply increasing revenues through diversifying clients. Imperfect information problems lead business service managers to consider all the aspects related to quality developed in chapter 4. The importance of those quality problems will depend on the type of activity concerned.3
Finally, strategic management in the business service sector has gained importance, directly proportional to the development of the sector. Many companies may not know which strategy they should choose. We have presented here several options and approaches as general guidelines. But it is worth adding that realism, objectiveness and common sense are often the tools used when managing service companies. All the other factors stem from shared experience in a world increasingly dominated by interchanges and information flow, where the capacity to adapt to the environment and take measurable risky decisions will be the key to survival and growth.
For example, the advertising case provided by Nachum (1996) shows three reasons underlying advertising agencies' competitiveness: 1) international activity; 2) size, scope and reputation; 3) productivity per employee and other supply aspects. These aspects are not as important in all business services activities (international activity is not always relevant) but those aspects related to reputation will always be foremost.
Competitive Strategies in Business Services 281
5.5 Conclusions
In this chapter, various aspects related to competitive strategies in business services have been described. The starting point was the need for effectiveness in the business service sector due to strong existing competition. There are considerable hurdles to be overcome in quantifying business service effectiveness, stemming from the client's difficulties in assessing quality. However, effectiveness could be approached by gauging the failure/success rate of different competitive strategies. A discussion of effectiveness leads us to an analysis of the three different strategies which need to be taken into account in order to succeed.
The first strategy is concerned with a fundamental decision faced by all enterprises nowadays: to make or to buy. There are many reasons behind the boom in outsourcing and increasing trends towards externalisation. However, intemalisation trends must not be overlooked. A balance between the two is provided, summarising the debate on this key issue. Most results conclude that intemalisation and externalisation processes are complementary rather than alternative, although externalisation trends will continue to grow in the near future fuelled by the increasing specialisation process and the need to be more competitive. Nevertheless, externalisation processes are only one of the many reasons behind the emergence of business services, as explained in former chapters. Enterprises should strive to make good use of in-house or outsourced business services alike, before trying to evaluate which method they prefer. Successful externalisation requires conditions to be put in place for innovative coproduction of services. The more experience enterprises have dealing with business services, the greater the advantages can be for in-house and out-house services.
The second strategy deals with the marketing required in business services; its implementation and distinguishing characteristics compared with the marketing of manufacturing goods. In the case of marketing for business services, internal communication, organisation and relationships shape the company's mental attitude towards the client. A business service marketing plan must be client- oriented and it must be regarded as a dynamic process in which resources and activities combine forces to achieve the same goal: client satisfaction and long-term relationships. Customer service centres exemplify the attempts made by business services to get closer to clients, thus providing value added to their products. In those cases, technology and training underpin the success of these centres. Finally, the organisation of business services has to promote a marketing mentality in all employees working for the final client.
The third and last strategy is related to business services management. We described the different theories of management styles which have paved the way towards the current model in which companies are considered open social-technological systems. In the case of business service management, the Eiglier and Langeard, Normann and Heskett's theories on the development of service strategies are outlined. From those theories, we extract the main management areas which define a strategic vision and examine the concept of strategic management in contrast to previous approaches. Finally, various
282 Business Services in European Industry
types of strategies are presented as first draft suggestions for business service
management.
References
Ansoff, I. (1976) La estrategia de la empresa. EUNSA,
Arrow, J.K. (1975) "Vertical integration and communication". Bell Journal of Economics.
6:17383.
Bailly, Α.; Maillât, D. (1988) Le secteur tertiaire en question, 2aedición. Economica, Paris.
Barcet, A. Bonamy, J. (1983) "Differentiation des prestations de services aux entreprises"
Revue d'Economie Industrielle n° 24, 2éme trimestre.
Barcet, Α.; Bonamy, J. (1994) "Intemalisation vs externalisation, valeur et dynamique de
l'offre". Symposium: Externalization or internalization of business services, 2930 May 1994
University of Roskilde, Roskilde.
Barcet, Α.; Bonamy, J.; Mayère, A. (1983) Economie des services aux entreprises: Approach
empirique et théorique. Économie et Humanisme, Lyon.
Beyers, W.B. (1989) 77je producer services and economie development in the United States:
the last decade. US Department of Commerce. Economic Development Administration.
Technical Assistance and Research Division. US Department of Commerce, Washington.
Beyers, W.B.; Lindahl, D.P. (1994) "On the dynamics of producer service markets:
externalization, internalization, and innovation processes". Symposium: Externalization or
internalization of business services, 2930 May 1994. University of Roskilde, Roskilde.
Borden, N.H. (1964) The Concept of Marketing Mix. Journal of Advertising Research, June.
Bramanti, A. (1989) "Servizi alla produzione e politiche locali: La domanda delle PMI
innovative". Quaderni del Consorzio Milano Ricerche, n" 2.
Calza, F.; Passaro, R. (1994) "The management of logistic services: a case study in the frozen
foods sector". Symposium: Externalization or internalization of business services, 2930 May
¡994. University of Roskilde, Roskilde.
Chandler, A. (Ed.) (1981) Managerial hierarchies. Cambridge, Mass.
Churchill, Jnr, G.A.; Suprenant, C. (1982) "An investigation into determinants of customer
satisfaction". Journal of Marketing Research, 19: 491504.
Coase, R. (1937) "The nature of the firm". Economica 4: 386405.
Coffey, W.J.; Bailly, A.S. (1991) "Producer services and flexible production: an exploratory
analysis". Growth and Change, vol 22, no. 4: 95117.
Coffey, W.J; Polése, M. (1987) "Intrafirm trade in Business Services: implications for the
location of officebased activities". Papers of Regional Science Association, 61.
Cuadrado Roura, J.R. (1989) "Services and new information technologies: producer services"
in: The spatial context of technological development. Avebury, Bruselas.
Cuadrado Roura, J.R.; Del Río Gómez, C. (1991) La demanda de servicios por las empresas
en España. Economistas, Madrid.
Eiglier, P.; Langeard, E. (1989) Servucciön: el marketing de servicios. McGrawHill, Madrid.
Translated from (1987) Servuction: le marketing de services, McGraw Hill, Paris.
Competitive Strategies in Business Services 283
Elfring, T. (1993) "Structure and growth of business services in Europe" in De Jong, H.W.
(Ed.), The structure of European Industry. Kluwer A.P., London.
European Commission (1989) The efficiency of business services used by manufacturing
industries. MRB Study. European Commission, Brussels and Luxembourg.
Fayol, H. (1916) La administración industrial y general en 1916. (1961 Ed). El Ateneo,
Buenos Aires.
Flipo, J.P. (1989) Gestión de Empresas de Servicios. EADA, Barcelona.
Fontaine, C. (1988) "Le development des activités de service aux entreprises et dans les
entreprises". Revue d'Eonomie Industrielle.
Gadrey, J. et ait. ( 1992) Manager le conseil. Ediscience Internationale, Paris.
Gershuny, J. (1987) "The future of service employment" in Giarini, O. (Ed.), The emerging
service economy. Pergamon Press, Oxford.
Goe, W.R. (1990) "Producer services, trade, and the social division of labour". Regional
Studies 24: 32742.
Goe, W.R. (1991) "The growth of producer service industries: sorting through the
externalization debate". Growth and Change, Fall: 11841.
Grande Esteban, I. ( 1996) Marketing de los Servicios. ESIC, Madrid.
Grönroos, C. (1980) An applied service marketing theory. Working paper n° 57. Swedish
School of Economics and Business Administration, Helsinki.
Grönroos, C. (1990) Service Management and Marketing. Lexington Books, Massachusetts.
Holmstrom, Β. (1985) "The provision of services in a market economy" in Inman (Ed.).
Managing the service economy. Cambridge University Press.
Howells, J.; Green, A. (1988) Technological innovation structural change and location in UK
services. AveburyCE, Aldershot.
Illeris, S. (1989a) Services and regions in Europe. AveburyCE, Aldershot.
Keeble, D.; Bryson, F.; Wood, P. (1991) "Small firms, business service growth and regional
developments in the UK: some empirical findings". Regional Studies 25: 439457.
Krmenec, A; Esparza, A. (1994) "Entrepreneurship and producer service markets". 4list
North American Meeting of the Regional Science Association, November 1994.
Kutscher, R.E. (1988) "Growth of services employment in the United States" in Guile B.R.
and Quinn, J.B. (Eds), Technology in services: policies for growth, trade and employment.
National Academy Press, Washington, DC.
Larsen; J.N. (1994) "Impediment to externalization Demandside views on independent
technical engineering services". Symposium: Externalization or internalization of business
services, 2930 May 1994. University of Roskilde, Roskilde.
Lewis, J. (1988) "Services post industrial transformation or flexible production" in Marshall,
J.N. (Ed.), Services and uneven development. Oxford University Press, Oxford.
Manso, F. J. (1991) Curso de Dirección Estratégica Comercial. ESIC, Madrid.
Mañas, E. (1992) "La demanda de servicios a empresas según tamaño, actividad y
localización.". Papeles de Economía Española, 50:307311.
Maqueda, J.; Llaguno, J.L. (1995) Marketing estratégico para empresas de servicios. Díaz de
Santos, S.A., Madrid.
Marshall, J.N. (1982) "Linkages between manufacturing industry and business services".
Environment and Planning A, 14: 52340.
284 Business Services in European Industry
Marshall, J.N. (1989) "Corporate reorganization and the geography of services: evidence from the motor vehicle aftermarket in the West Midlands Region of the UK". Regional Studies 23: 139-50. Martinelli, F. (1991) "Branch plants and services underdevelopment in peripheral regions: the case of southern Italy" in Daniels, P.W., Moulaert, F. (Eds), The Chanching Geography of Advanced Producer Services. Belhaven Press, London. Mitchell, V.W. (1994) "Problems and risks in the purchasing of consultancy services". The Service Industries Journal, Vol 14, No 3: 315-339. Monnoyer, M.E.; Philippe.J. (1991) "Localisation factors and development strategies of producer services" in Daniels, P., Moulaert, F. (Eds.), 77ie changing geography of advanced producer servicies. Belhaven Press, Londres. Grande Esteban, I. ( 1996) Marketing de los Servicios. ESIC, Madrid. Grönroos, C. ( 1990) Service Management and Marketing. Lexington Books, Massachusetts. Manso, F. J. (1991) Curso de Dirección Estratégica Comercial. ESIC, Madrid. Maqueda, J. Llaguno J.I. (1995) Marketing estratégico para empresas de servcios. Díaz de Santos, Madrid. Niebuhr, R. (1943) The nature and destiny of man, vol. II. Human Destiny, London. Normann, R. (1991) Service Management. John Wiley & Sons Ltd., Chichester. Ochel, W.; Wegner, M. (1987) Service Economies in Europe: Opportunities for Growth. Printer Pub. & Wesriew Press, London. O'Farrell, P.N. (1994) "Business services and their impact upon client performance: an exploratory inter-regional analysis". Symposium: Externalization or internalization of business services, 29-30 May 1994. University of Roskilde, Roskilde. O'Farrell, P.N.; Hitchens, D.M.W.N. (1990) "Producer services and regional development: a review of some major conceptual policy and research issues". Environment and Planning A. 22: ¡¡41-1 ¡54.
- O'Farrell, P.N.; Moffat, L.A.R.; Hitchens, D.M.W.N. (1993) "Manufacturing demand for business services in a core and peripheral region: does flexible production imply vertical disintegration of business services?". Regional Studies, 27: 385-400. Peat Marwick Mclintock (1988) 77ie cost of non Europe for Business Services. Research on the cost of non-Europe. Basic finding, vol 8. European Commission, Brussels and Luxembourg. Pedersen, P.O. (1986) Business service strategies: the case of provincial central of Esbjerg. Fast series n° 19. European Commission, Brussels. Perry, M. (1990) "Business service specialization and regional economic change". Regional Studies, 24: 195-209. Perry, M. (1992) "Flexible production, externalisation and the interpretation of business services growth". Service Industries Journal 12(1): ¡-16. Petit, P. (1986) Slow growth and the service economy. Francis Printer, London. Piore, M.J. (1986) "Perspectives on labour market flexibility". Industrial Relations 25: 146-66.
- Porter, M. (1987) Estrategia Competitiva. CECSA, México Porter, M. (1990) The competitive advantage of nations. Macmillan, London. Rajan, A. (1987) Services: the second industrial revolution?. Butterworths, London.
Competitive Strategies in Business Services 285
Rajan, Α.; Pearson, R. (1986) UK occupational and employment trends to 1990. Butterworth,
London.
Resmini, L.; Saviolo, S. (1993) "The impact of the export promotion services on small and
medium sized firms: a case study". 3" Forum Reser: Services, labour market and small firms.
2325 September. RESER, Siracusa.
Robinson, E.A.G. (1931) The structure of competitive industry. Cambridge University Press,
Cambridge.
Ruyssen, O. (1990) La situation et le rôle des business services dans la CE. Rapport à
l'attention du Comité des Directeurs Généraux de l'industrie. Commission of the EC. DG III,
Brussels.
Saviolo, S. (1993) L'efficacia dei servizi reali a sostegno delle esportazioni.
Scheuer, M. (1994) "Make, buy or sell. An empirical analysis of the externalisation or
intemalisation of technical business services in German manufacturing relying on official
data". Symposium: Externalization or internalization of business services, 2930 May 1994
University of Roskilde, Roskilde.
Scott, A. (1988) Metropolis, from the division of labour to urban form. University of
California Press, Berkeley.
Senn, L. (1991) "Il fabbisogno dei servizi reali da parte delle imprese manufatturiere
lombarde" in Unioncamere (Ed.) Offerta e domanda di servizi in Lombardia. Unioncamere
Lombardia, Milan.
Stachey, J.; White, D. (1993) "When and when not to verticalle integrate". Sloan Management
Review, Spring.
Stanback, M. (1979) Understanding the service economy. John Hopkins, University Press,
Baltimore.
Stanback, T.M; Bearse, P.; Noyelle, T.; Karasek, R. (1981) Services: the new economy.
Allenheld & Osmar, Totawa, NJ.
Stigler, G.J. (1951) "The division of labour is limited by the extent of the market". Journal of
Political Economy, 59: ¡85200.
Stock, J.R.; Zinszer, P.H. (1987) "The industrial purchase decision for professional services".
Journal of Business Research, ¡5: 116.
Taylor, F.M. (1911) Principios de la administración científica. Edición de 1963. Herrero
Hermanos, Buenos Aires.
The Economist (1994) "Farming out the farm". The Economist, Management Focus, March
5'h, ¡994.
The Economist (1997) "Management consultancy". The Economist, Special Survey, March
22nd, 1997.
Tordoir, P.P. (1995) The professional knowledge economy. The management and integration
of professional services in business organisations. Kluwer Academic Publishers, Dordrecht,
Boston, London.
Tschetter, J. (1987) "Producer services industries: why are they growing so rapidly?". Monthly
Labour Review, 110 December: 3140.
Williamson, O.E. (1971) "The vertical integration of production: market failure
considerations". American Economic Review, 61:1 ¡2123.
Williamson, O.E. (1975) Markets and hierarchies. The Free Press. Macmillan Publications
CO., New York.

286 Business Services in European Industry
Williamson, O.E. (1981) "The modem corporation: origins, evolution, attributes". Journal of Economic Literature, vol 19; n"4. Wood, P.A. (1991) "Flexible accumulation and the rise of business services". Transactions Institute of British Geographers, N.S. 16, 160-172.
Chapter 6
The Internationalisation of Business Services
"Services industries have enabled the process of internationalisation to take place, while themselves being active participants"
Peter Daniels. 1993 Services Industries in the World Economy: page xi
"Business services are sectors in which some useful steps could indeed be. taken to bring about freer trade in ways that represent new opportunities and new challenges for all of the parties involved"
Thierry J. Noyelle and Anna B. Dutka. 1988 International Trade in Business Services: page 131

288 Business Services in European Industry
The Internationalisation of Business Services 289
Chapter Six The internationalisation of business services
Introduction
The previous chapters introduced one of the central issues concerning the business service economy, namely, internationalisation. Chapter one presented the main data on the sector, including the first "international profile". The development of employment was analysed within a European context in the second chapter where it was established that growth in business services is a phenomenon which occurs in all countries, albeit with national differences in labour markets. In chapter three the causes and functions of business services were examined, many of which are related, either directly or indirectly, to international economic changes. New technologies or the flexibility of production systems are two factors which can only be explained in the context of transferring technology and the exploitation of international markets. Chapters four and five examined the key aspects of quality, management and marketing in business services, when used appropriately, give comparative advantages in an international context. In many of the areas covered, an international dimension is central to an understanding of the business service economy.
It is important to understand how and why the sector becomes internationalised in order to comprehend the most recent trends and predict future behaviour. Supplying firms adopt a specific position in an international market. This involves submitting to the processes of globalisation and having to overcome the existing barriers in order to operate in other markets. In addition, companies and countries need to know if business services can provide comparative advantages. A business service market may be sufficiently developed in order to encourage these advantages or, on the opposite, so distanced from the most advanced guidelines that its services do not offer sufficient quality or quantity to meet the needs of the client companies. If competitive and effective business services are desired, company and government policies must take into account the phenomenon of internationalisation.
Chapter six aims to introduce the reader to the internationalisation issues in business services, its consequences and rationale. It is divided into three sections. The first analyses internationalisation itself: it presents a typology, the main explanatory factors and what the advantages of international expansion are for those involved. The second section summarises the main obstacles to internationalisation: the barriers to a single market for business services. The third section examines briefly the regulatory framework that tends to liberalise the business service markets.
290 Business Services in European Industry
6.1. Internationalisation through Nationalisation
The internationalisation of business services presupposes "nationalisation"; in other
words, adaptation to the regulatory, economic, social and cultural parameters of the
■ country or market in which the clients operate. The personal characteristics of services,
above all advanced ones, require the understanding of client needs and knowledge of
the environment in which the client functions. It is trae that internationalisation involves
a degree of adaptation whether it be in agriculture, manufacturing or services. However,
in business services this does not mean a simple adaptation to national idiosyncrasies.
The effort needed is much greater in business services. Etymologically speaking, it
supposes a conversion to a new area, turning towards what demands special attention,
towards circumstances and new problems, aspects that demand the personalisation of the
service (even when a service is little more than a poor imitation). Selling milk or cars in
a foreign country requires, for example, specific labelling or a special advertising
campaign. Offering an advanced management service in another country requires
perfect knowledge of the client and environment, in order for this service to be unique
and its success or failure will be influenced considerably by the success or failure of the
process of cultural adaptation carried out.
There is a close relationship between the dual and asymmetric nature of business
services and the way in which they are internationalised. The predominance of
personalisation over the repetition of a service naturally imposes certain limits on
international expansion. As was examined earlier, the advantages that standardisation of
services has for the supplier come into conflict with the desires of the client to receive a
personalised service. When a service is internationalised, this assumes that in one sense
it has achieved a specific level of repetition, capable of being sold abroad, it presupposes
success in the advantages of standardisation. However, demand never relinquishes
personalised services, and what is really internationalised is not so much the final
product, as the image associated with it. Internationalisation presupposes a certain
degree of standardisation, but without relinquishing personalisation.
International expansion of business service companies is subject to a powerful process
of nationalisation. The management of branches usually rests with local directors and,
occasionally, with great autonomy. The advertising activity serves as an example; it has
been conditioned heavily by purchases and acquisitions during the last 15 years. The
need to know the local environment has meant that the decision making has on the
whole fallen on the managers in the country of operations despite high levels of
concentration.! There are also abundant examples in the world of consulting and, in
fact, in most business services.
For example the leaders of Cap Gemini affirmed "there is not a single French citizen in any of our branches" (Dreyfus in Centre Français du Commerce Exterieur, 1988), to show how internationalisation should be introduced. The presence of native workers in companies in the activity is high and above the average in other sectors.
77je Internationalisation of Business Services 291
This approach is thoroughly appropriate if we consider the differences between the European nations. It is different to offer a service in a northern country or in a southern country, in a developed region or in an impoverished region, in a country with a Latin cultural tradition or in one with an Anglo-Saxon cultural tradition. To be successful,
, internationalisation presupposes nationalisation. Services can not be set up without regard to the idiosyncrasies of each place but by adopting them they grow. Even standardisation has its limitations. For example, big multinational advertising agencies might find it more efficient to constraint the central control in favour of more local campaign, considered the type of production, the autonomy of the local establishment and the nature of the local market (Perry, 1990b)2.
Business services have developed internationally according to special national characteristics, coherent with the type of internationalisation that the nature of services demand (Petit, 1994). In this way the historical and geographical origin of Japanese trading companies, American auditors, French software companies, or the British or German reinsurance companies can be explained. They date from the nineteenth century or even earlier and the process of internationalisation of accountancy or auditing companies was developed after the second world war (Chadler, 1981). In particular, the international growth of activities in Europe is closely linked to factors such as physical, linguistic or historical proximity (Petit, 1994) and to the fact that large manufacturing companies expanded after the second world war, together with the providers of services such as consulting (Leysho, Daniels and Thirft, 1987) or advertising (Perry, 1990b). Some big companies have emerged from complement markets previously segmented both geographically and by products, as in the case of Clifford Chance, when Clifford Turner and Coward Chance, the two largest law firms in London, merged in 1987 (Daniels, 1993).
6.1.1 Types of internationalisation
The business service sector has accompanied and stimulated the processes of internationalisation. On the one hand, the biggest business services companies have decided to expand often to follow or "accompany" their national clients in the expansion process initiated by them. On the ofher hand, some business services have contributed specifically to the internationalisation of the industry. Some advanced services (e.g. management, fairs and exhibitions, market research) have supplied information on international markets, promoting expansionist and internationalist strategies. Elsewhere, business services have brought the markets closer by facilitating quick communication
Analysis of the demand for advertising makes explicit the need for local services in an activity where huge economies of scale are generated. Demand establishes product differentiation, high profitability, oligopolistic control, non-durable products and low elasticity. In the sixties, products were standardised but in the seventies this trend decreased as it was less effective. "The dissimilarities between national markets, especially for consumer goods, were greater than supposed...decentralisation of advertising continues" (Perry, 1990b, page 42).
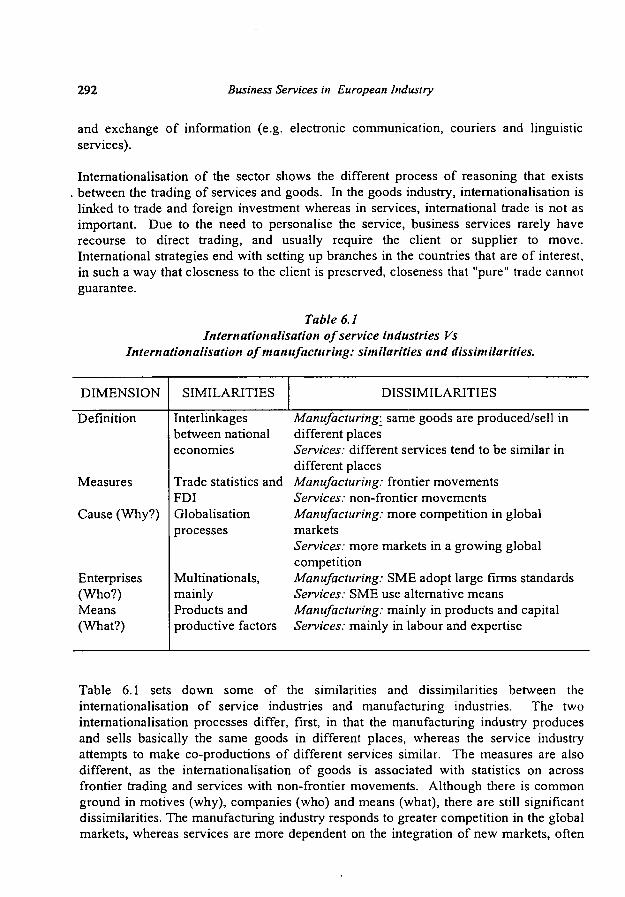
292 Business Services in European Industry
and exchange of information (e.g. electronic communication, couriers and linguistic services).
Internationalisation of the sector shows the different process of reasoning that exists between the trading of services and goods. In the goods industry, internationalisation is linked to trade and foreign investment whereas in services, international trade is not as important. Due to the need to personalise the service, business services rarely have recourse to direct trading, and usually require the client or supplier to move. International strategies end with setting up branches in the countries that are of interest, in such a way that closeness to the client is preserved, closeness that "pure" trade cannot guarantee.
Table 6.1 Internationalisation of service industries Vs
Internationalisation of manufacturing: similarities and dissimilarities.
DIMENSION
Definition
Measures
Cause (Why?)
Enterprises (Who?) Means (What?)
SIMILARITIES
Interlinkages between national economies
Trade statistics and FDI Globalisation processes
Multinationals, mainly Products and productive factors
DISSIMILARITIES
Manufacturing: same goods are produced/sell in different places Services: different services tend to be similar in different places Manufacturing: frontier movements Services: non-frontier movements Manufacturing: more competition in global markets Services: more markets in a growing global competition Manufacturing: SME adopt large firms standards Services: SME use alternative means Manufacturing: mainly in products and capital Services: mainly in labour and expertise
Table 6.1 sets down some of the similarities and dissimilarities between the internationalisation of service industries and manufacturing industries. The two internationalisation processes differ, first, in that the manufacturing industry produces and sells basically the same goods in different places, whereas the service industry attempts to make co-productions of different services similar. The measures are also different, as the internationalisation of goods is associated with statistics on across frontier trading and services with non-frontier movements. Although there is common ground in motives (why), companies (who) and means (what), there are still significant dissimilarities. The manufacturing industry responds to greater competition in the global markets, whereas services are more dependent on the integration of new markets, often

The Internationalisation of Business Services 293
segmented ones, in increasingly more global competition. The role of multinationals is similar in both cases but the alternatives for SMEs are different in goods markets, subject to international standards more than in service markets, as well as the mantle of competition and different opportunities. Finally, internationalisation of the
, manufacturing industry is produced mainly through products and capital, whereas the service industries relies on labour, skills and the spread of knowledge and technology.
There is no doubt that these similarities and dissimilarities are not the only points of comparison between the internationalisation of goods and services. Dunning (1993) puts forwards some complementary ones that emphasise the special nature of services: 1st, they have a lower geographic concentration; 2nd they do not need global markets to compete, with a few exceptions; 3rd, the range of specialisation and international division of labour is lower; 4th the competitive advantages of multinationals are lower in business services, 5th they have different finance and investment modes, investment services follow rather than direct investment in goods; 6th, many services are not capital intensive.
Noyelle and Dutka (1988), amongst others, have shown that it is a mistake to think direct exporting has more advantages over direct investment. In services the profits from in situ services work both in theory and practice. First, because direct investment ends up generating exports and therefore they are not internationalisation modalities that can substitute one another completely. Second, because the development of home markets is gradually conditioned by the development of foreign markets. Third, because the international markets are increasingly more segmented according to clientele and not to the country. And finally, because it is increasingly obvious that quality is guaranteed by the staff resident in the foreign country. In fact, direct exporting is mainly taking place where communication costs are relatively low (Coffey, 1987) as occurs in consulting services in developing countries.
All these factors lead to the internationalisation of business services being produced in the first instance, with the switch away from occasional movement to permanent movement on the supplier's part, so that a new branch is set up. However, on many occasions, internationalisation does not follow this natural path. Through purchases or mergers with other companies, deliberate expansion occurs, directly or indirectly. The purchasing, acquisitions, mergers, or franchises processes were significant at the end of the eighties, at the height of international expansion in the sector. Recently, as the economy recovers in the second half of the nineties, the boom of mergers appears to have re-emerged strongly again. This can be deducted from some paradigmatic examples, such as for example the reduction of the Big 6 to Big 4 following the agreements in October 1997 between Coopers & Lybrand and Price Waterhouse, first, and KPMG and Ernst & Young shortly after. Nonetheless, the mergers in the nineties would seem to differ in some strategic respects in comparison to the mergers of the eighties (Aparicio, 1997). They form part of a less speculative process, Europe has acquired a more important role, risky financing for purchasing has been rejected (trash bonds) as has huge scale debt, acquisitions and mergers are carried out in the same
294 Business Services in European Industry
sector, aiming for concentration in the same specialisation and not diversification, and, finally, investments are made in markets with great potential economic growth.
Parallel to these developments, affecting above all large companies, small ones are also facing up to international dynamism, although the internationalisation of SMEs depends heavily on the type of activity, region and business nature, as can be seen in O'Farrell and Wood (1996). On the other hand, some SMEs have started an alternative process of internationalisation consisting of the creation of collaboration networks, of a formal or informal nature as explained below. Access to international or distant markets is sought with the necessity of increasing the size of the company, nor investing directly abroad. They are usually formal or informal contracts in which, for example, reciprocity is assumed so that the clients at one end can be dealt with by the partner at the other end when they move to the country of the latter. Many law firms, consulting firms, market research firms etc. have started to put this into practice, creating a radial concentration of the market instead of the traditional vertical or horizontal concentration.
There are many forms of internationalisation. Some are explicit, like the ones stemming from the exchanges between national and non-national firms and others are implicit, focusing on the internationalisation of products, production factors and savoir faire. The implicit factors will be analysed later on. The set of explicit modes of internationalisation of business service firms is shown in figure 6.1. This diagram shows the different options open to a company offering its services from one country 1 ( O l ) to national clients (C_l) or foreigners (C_2). The base market for this firm will be national clients (C_l) or clients from other nations (C_2), resident in the same country. Offering across-frontier services generate trade with clients who can be residents of the same country (and therefore have a follow-up relationship), or be from a foreign country (operating within "pure" trade with this other country). If the firm opts to move the service provision permanently, it will find itself in a foreign country with clients that will come from the country of origin (market based on the above, consolidating the follow-up relationship) or from the foreign country (penetrating a new market).
The other option is to operate in a network with collaboration agreements or formulas like the reciprocity principle, in which the national company obtains non-national clients in exchange for giving up its clients to another firm when the former moves to the country where this other firm operates. Networks can take many guises (Reser, 1995) and are preferred by business services rather than consumer services (Nicolaidis, 1993). They provide more flexible international organisation systems, useful in contexts of uncertainty, although problems always persist in maintaining minimum standards in quality, optimum distribution criteria of costs and profits, or transferring knowledge and reputation (Aharoni, 1993; 1997). Generally a clear autonomy is maintained and the stages of integration described by Daniels et al. (1989)3 a re seldom fulfilled: 1) work on
Daniels et alt. 1989 describes Arthur Andersen as the most significant example of international integration. The majority of organisational forms in intra- networks and especially inter-corporate networks maintain high levels of autonomy.

The Internationalisation of Business Services 295
cases referred by other members, 2) refer work to other members, 3) maintain minimum standards, 4) periodic quality control, and 5) send members or professionals for training.
Figure 6.1 Modes of business service internationalisation
Supplier Resident Client (S) ¡" ( Q
Country 1
Internationalisation ways Supplier Resident client (S) in (C)
Country 2
S 1 C_
S I C 2
National clients at home: no international trade
Foreign clients inbound
National clients abroad C
S 1 Foreign clients abroad: "Pure " international trade
C 2
Suppliers following client expansion: foreign market based on previous one
Suppliers investment abroad: new foreign market and new clients
s_i C-l
S I C 2
S I C 2 Networking and reciprocity agreements S_2 C
S 1 Intra-firm trade in business service firms S 2
C 1 Intra-firm business service trade in manufacturing and other service firms
C 2
There are also two other forms of internationalisation represented by intra-firm trade between firms and business services or manufacturing companies, which has been of considerable significance in recent years (Coffey and Polèse, 1987a/b) within the wide variety of networks used by business services companies to be internationalised (Roberts, 1999).
296 Business Services in European Industry
6.1.2 International trade of business services
Out of all the modes of internationalisation that exist, the only ones that are presently quantified for business services are those relating to international trade in the classical sense: transactions between residents and non-residents.4 A number of conclusions can be drawn from this data affecting the group of services. In general, it can be stated that services are much less internationalised than goods in proportions of 1 to 5 (Perry, 1990a), although in recent years the services trade has grown more than that of goods, but not in all activities. For instance, not in transport, but in business services (Landesmann and Petit, 1995). Data for 1994 from the World Trade Organisation (The Economist, 1996) places the United States in first position in exporting services (16.5bn) followed by France (8.3bn), Italy (5.5bn), United Kingdom (5.4bn), Japan (5.3bn), Germany (4.9bn) and the Netherlands (3.7bn).
If we take the data from Eurostat (1995) for the trade of business services,5 a number of general conclusions can be reached:
• The magnitude of international trade of business services is very small in the context of all the international transactions of the European Community: around 10% of exports and imports of all services and 2% of the total trade of goods and services. These figures for 1993 are considerably higher than those registered some 3-4 years before, when they stood at 7% and 1% respectively. Anyway, given the importance of many business service activities in Europe, it would not be surprising if the volume of transactions in statistical form were to underestimate real transactions and the real weight of Europe in the business service trade as a whole.
• The trade balance of business services in Europe in 1993 shows negative figures for the group (Europe 12), with the deficits in Germany and Spain being of particular relevance. The rest of the countries do not maintain this pattern, with France, the Netherlands and especially the United Kingdom displaying trade surpluses in business services. However, the former trajectory was very different. The current 1993 deficits were surpluses during 1984-1992, as can be observed in graph 6.1. Most business services activities had a positive balance, expect publicity, always with deficit. The trade balance in business services seems to be related to the economic cycle.
There are also other sources of statistical information yet to be developed for business services, such as ones providing information on direct investment. The statistical limitations here are obvious.
For a description of the existing limitations, see Eurostat (1994, 1995). For further detail on the analysis of data on international business service trade see two earlier studies Rubalcaba (1992b and 1993).
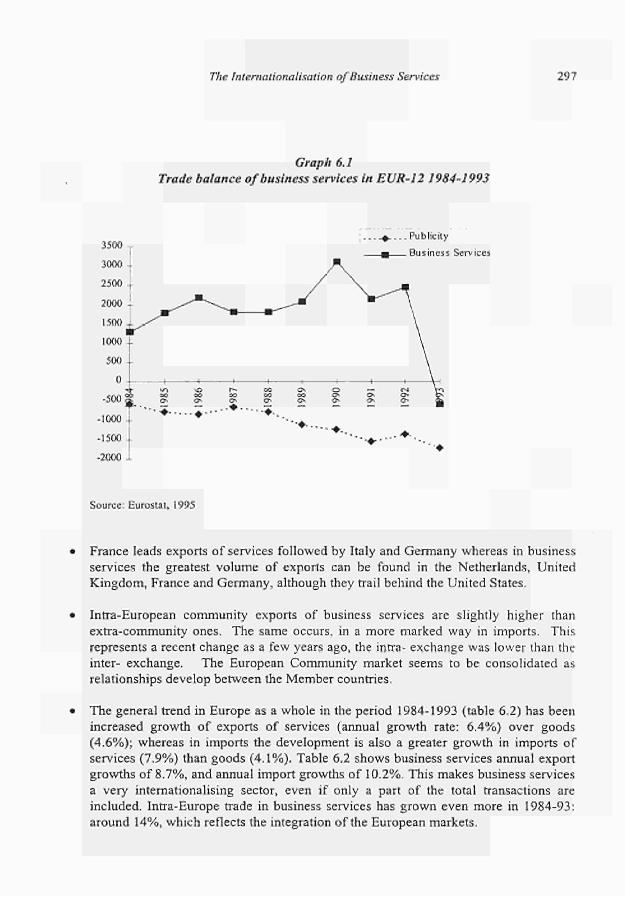
77ie Internationalisation of Business Services 297
Graph 6.1 Trade balance of business services in EUR-12 1984-1993
. .Publicity Business Services
Source: Eurostat, 1995
France leads exports of services followed by Italy and Germany whereas in business services the greatest volume of exports can be found in the Netherlands, United Kingdom, France and Germany, although they trail behind the United States.
Intra-European community exports of business services are slightly higher than extra-community ones. The same occurs, in a more marked way in imports. This represents a recent change as a few years ago, the intra- exchange was lower than the inter- exchange. The European Community market seems to be consolidated as relationships develop between the Member countries.
The general trend in Europe as a whole in the period 1984-1993 (table 6.2) has been increased growth of exports of services (annual growth rate: 6.4%) over goods (4.6%); whereas in imports the development is also a greater growth in imports of services (7.9%) than goods (4.1%). Table 6.2 shows business services annual export growths of 8.7%, and annual import growths of 10.2%. This makes business services a very internationalising sector, even if only a part of the total transactions are included. Intra-Europe trade in business services has grown even more in 1984-93: around 14%, which reflects the integration of the European markets.
298 Business Services in European Industry
Table 6.2. Annual growth rates of imports and exports 1984-93 (average of annual growth rates between 1984 and 93)
Manufacturing Services Publicity Business Services Publicity + business services
EUR-12 Exports
4.6 6.4 8.7 8.8
8.7
Total-Trade Imports
4.1 7.9 9.7 10.4
10.2
EUR-12 Exports
5.7 8.2 10.8 14.4
13.5
Intra-Trade Imports
5.1 8.7 12.2 14.3
13.7
Source: Eurostat 1995.
Graphs 6.2 and 6.3 are drawn from the detailed study of the most recent data available (1993). The first graph shows the importance of business services in the trade of services as a whole. The European average of 2-2.5% in both imports and exports stands out in comparison to the percentages of value added in the sector in the European economy that are in the order of 14%. This divergence is even more plausible in the United States. Graph 6.3 displays the absolute data on exports and imports in 1993. With respect to graph 6.2, graph 6.3 shows the fact that the balances in absolute terms are very similar to those expressed in relative terms. Europe is a net importer on a small scale, although in previous years it was a net exporter. This is true in 1993 for the negative balances in Germany, Spain and Italy, that contrast with the positive ones in the United Kingdom, France, the Netherlands and Portugal. Busines services in the United States are clearly an exporting sector, like in United Kingdom. The information in the two graphs is limited by problems of methodology in collating the statistics and the lack of coverage of real internationalisation.
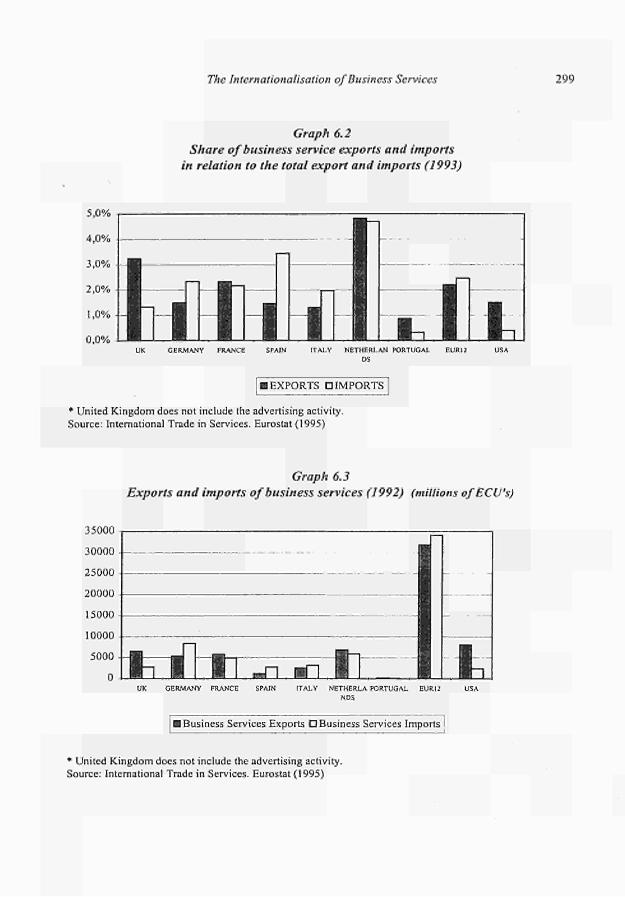
77ie Internationalisation of Business Services 299
5,0%
4,0%
3,0%
2,0%
1,0%
0,0%
Graph 6.2 Share of business service exports and imports
in relation to the total export and imports (1993)
MMJL vfFi: UK GERMANY FRANCE SPAIN ITALY NETHERLAN PORTUGAL EURI 2 USA
DS
I EXPORTS D IMPORTS
* United Kingdom does not include the advertising activity. Source: International Trade in Services. Eurostat (1995)
Graph 6.3 Exports and imports of business services (1992) (millions of ECU's)
35000
30000
25000
20000
15000
10000
5000
0 fcjTj UK GERMANY FRANCE SPAIN ITALY NETHERLA PORTUGAL EUR12 USA
NDS
I Business Services Exports D Business Services Imports I
* United Kingdom does not include the advertising activity. Source: International Trade in Services. Eurostat (1995)

300 Business Services in European Industry
6.1.3 Factors promoting internationalisation
There are multiple factors influencing internationalisation in an activity, in an explicit way exemplified by agreements between firms, and implicitly when no agreement is required and it is the result of the globalisation of the markets. In both cases this involves factors traditionally used to explain the trade of business services (the relative size of the country and the level of income amongst others) and other economic factors, or as François (1993) indicated, geographical, cultural and linguistic ones. Obviously, there will be differences according to the way in which this trade is carried out (Coffey andPolèse, 1987a/b, 1991).
The influencing factors facilitate, encourage or promote internationalisation in an activity. We can draw a distinction between internal factors of supply and external factors of demand. The former is explained by the very nature of the activity and therefore will differ according to the activity analysed. The latter is exogenous, in the sense that the factors can not be foreseen in the internal dynamics of the activity itself. Other factors share characteristics of both types: the ones that have a bearing on the construction of a single market and suppress existing barriers.
6.1.3.1 Supply Factors.
Different packages and specialisation of productive factors, in accordance with classical models of international trade adapted in line with the considerations that follow below:
* The levels of concentration, through multiple forms (take-overs and purchases, mergers, joint ventures, subcontracting, etc.) and modalities, vertical, horizontal or in networks.
* The existing margin in order to develop economies of scale, of extension or organisation (Landesmann and Petit, 1995)6.
Economies of scale derive from network externalities, goods-services packages, or headstarts (this explains the success of the Italians and French in design services and the difficulties non-Anglo Saxon countries have in entering accounting, legal and advertising services, etc.). The organisation economies produce intra-firm trade through the expansion of multinational companies. The economies of extension explain the oligopolistic concentration in banking, insurance, advertising, marketing, auditing, etc. and the trends towards despecialisation.
7Vte Internationalisation of Business Services 301
* Transaction costs in the business service markets, often high due to the lack of standardisation in supply and demand (Dunning, 1993) 7 although relatively lower than many of the organisation costs (Barcet and Bonamy, 1997). 8
* Degree of industrialisation and standardisation of a service, as a necessary condition albeit not sufficient for international expansion. It depends on the use of industrial capital, the degree of externalisation of services, levels of specialisation and standardisation required, the degree of creative innovation and the incorporation of new information and communication technologies.
* Quality levels, that grow with the expansion and interconnection of the markets. * Linking with the multinational client, that explains why many firms
internationalise to follow the client. In this sense, multinationalisation of other sectors explains to a certain extent the internationalisation of many business services such as advertising (Perry, 1990b)
* Need to access sources of information and competition, sometimes a higher priority than simply penetrating a market (De Bandt, 1995)
* Expectations anticipate the effects of the integration of the markets.
6.1.3.2 Demand Factors.
* Growth of demand, that requires more and better services. * Appearance of new markets, resulting from the discovery of new needs or the
deepening of associated ones that are already partly covered. * Economic development in general, the levels of economic wealth, income and
standard of living of a country. * The size of the country and its trade traditions, that explains the differences
between countries very open towards foreign countries and those linking with only specific trading partners.
6.1.3.3 Political, institutional and other factors
* Economic policies, influencing the liberalisation of trade and the promotion of activities, particularly industrial and regional policies.
* Suppression of barriers to the single market of business services. * Other types of institutional and cultural factors
According to Dunning, 1993, the transaction costs in services are higher than those for goods for the following reasons: they are more idiosyncratic; they are more closely linked to the human factor; there is more information; opportunities to misuse knowledge; price discrimination; and control problems by non-service firms. See the idea referred to in the previous chapter on the advantages and costs of externalisation. The externalising facility necessarily leads to greater internationalisation.
302 Business Services in European Industry
6.1.4 Advantages of internationalisation
Once the different modes of internationalisation have been presented, the advantages of the process can be examined. It can be stated that when the co-productive and personalised nature of services is respected, internationalisation offers numerous advantages to those participating in the process. Three fundamental results stand out:
1. Better quality services. The international expansion of service activities and the professionals engaged in them encourages an exchange of techniques, innovations and ways of improving the quality of the service. Quality is a requisite in the context of international business today.
2. Reduction of costs. Internationalisation means that a certain level of economies of scale has been reached. Expansion enables the use of productive resources, especially work, to be optimised. The experience gained in one place is conveyed to another making savings on investment, training and information costs. These savings have a knock-on effect on prices in the client's favour.
3. Greater confidence. International expansion is justified in part by the need to maintain relationships of trust based on international reputation. The prestige of an international supplier enables them to forge relationships of trust that are often better than those reproduced by local firms.
Other macro and microeconomic advantages spring from these points. From a business point of view it is worth noting the following:
1 Exploitation of comparative advantages. Through cost reduction, making the work production factor cheaper, and through improvements to quality and innovation that generates competition.
2. Returns for economies of scale or extension. Business service activities develop in particular economies of extension. Internationalisation allows these to be accompanied by economies of scale as the size of the market is extended.
3. Competitive pressures. The trend towards concentration is very strong and the process of internationalisation very fast in all the dynamic business service activities. The effects on competition are immediate on the segments dominated by multinational companies and less important in protected segments.
4 Restructuring in industries. The continuous redefinition of strategies, frontiers and production modes changes systematically with internationalisation. Joint ventures, take-overs, networks emerge as a consequence of the processes of integration.
5 Price decreases. This factor is more feasible in manufacturing than in services. In services occasionally stagnation in price increases can be observed: the downward pressure comes from international competition and is not counterbalanced by the upward pressure created by increases in demand. A decrease in prices due to internationalisation and cost reduction is only
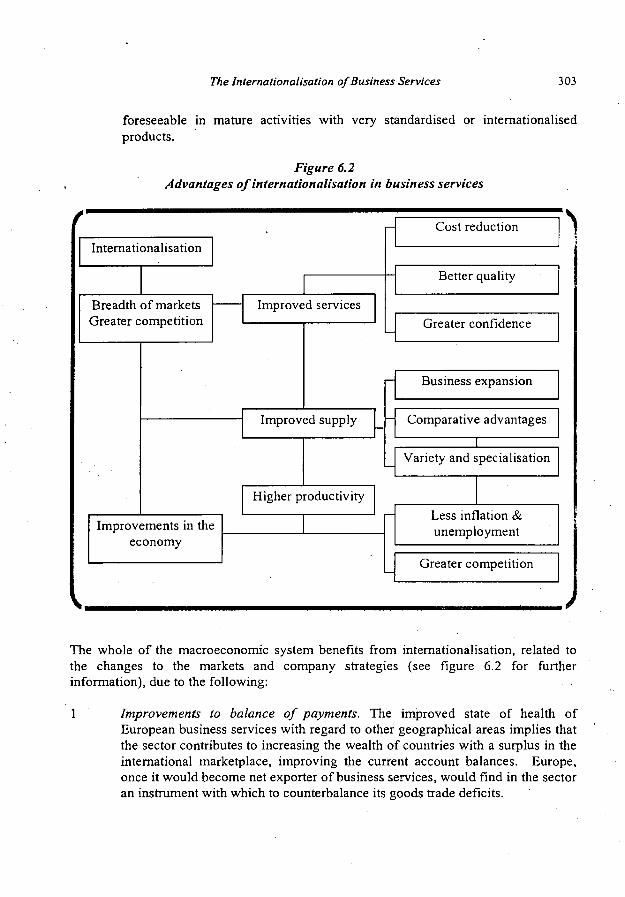
The Internationalisation of Business Services 303
foreseeable in mature activities with very standardised or internationalised products.
Figure 6.2 Advantages of internationalisation in business services
> Internationalisation
Breadth of markets Greater competition
Improved services
Cost reduction
Better quality
Greater confidence
Improved supply
Improvements in the economy
Business expansion
Comparative advantages
Variety and specialisation
Higher productivity Less inflation & unemployment
Greater competition
The whole of the macroeconomic system benefits from internationalisation, related to the changes to the markets and company strategies (see figure 6.2 for further information), due to the following:
1 Improvements to balance of payments. The improved state of health of European business services with regard to other geographical areas implies that the sector contributes to increasing the wealth of countries with a surplus in the international marketplace, improving the current account balances. Europe, once it would become net exporter of business services, would find in the sector an instrument with which to counterbalance its goods trade deficits.
304 Business Services in European Industry
2 Purchase power of national incomes. The benefits of the integration of the markets, improvements to quality and reduction of costs enhance the business purchase power that in tum feeds the demand for business services.
3 Increase in employment and GDP. The pace of growth of employment and GDP can be increased due to internationalisation through the improvements this brings to development in the sector and the possibilities of increasing its direct and indirect contribution to the domestic product.
These advantages are to a certain extent based on international trade theory and comparative advantage. The studies carried out using economic theory apply different models to producer services, based on the applicability of the aforementioned theories on trade in services9.
The traditional models for international trade (of the Heckscher-Ohlin-Samuelson type) explain that a country will specialise in products for which it has a relative abundance of positive factors. Exchanges will enhance the production and consumption possibilities of the countries through the access to goods or services produced in relatively favourable conditions. The cost and intensity of factors are the two parameters that explain trade and specialisation. It can be supposed that business services follow this logic as they are intensive in capital (leasing), or highly qualified workforce (advanced services), or in low skilled workers (operational services). Production can be expected to be located in countries that provide the production factor with greatest ease, in that they are more intensive, creating trade with other countries.
In spite of the generic validity of this argument, the classical models have been criticised because of the unrealistic nature of a number of the suppositions and the co-existence of trends, both towards specialisation and despecialisation (Landesmann and Petit, 1995). Markusen (1989) indicates the application difficulties in a market with few competitive characteristics. Nusbaumer (1987) highlights how the supposition of available technology runs counter to the objective of many services, based precisely on the nonavailability of technology. Melvin (1989) and François (1990) point to the difficulties of the supposition of mobility of factors at an international level.
Melvin (1989) shows how the propositions of the Hesckescher-Ohlin model adapt to producer services, but require a reinterpretation of the law of comparative advantage. He concludes that, for example, if a service is used intensively in the production of goods, then the country well endowed with K factor will import, however, goods intensive in this K factor. At the same time, a country exporting services could import goods. Markusen (1989) analyses the benefits of the trade of producer services within
A thorough examination of these studies is beyond the scope of this work. Studies that have sought to apply economic models to trade in services are Landesmann and Petit (1995), Dearforff (1985), Bhagwati (1987), Sapir and Lutz (1981) and UNCTAD (1988). Some of these ideas are analysed in Chapter 8 on the location and concentration of business services.
77te Internationalisation of Business Services 305
the monopolistic competition model with differentiated or specialised products. He surmises that the free trade of services is Pareto-efficient in service autarchy and efficient in free trade of goods in the world as a whole, although not necessarily for an individual country. The possibility of liberalising the trade of producer services can be
. deducted from the Markusen model.
François (1993) also arrived to this conclusion when he indicated that liberalisation is beneficial for the gains in specialisation derived from trade. This can be confirmed by the specialisation of large multinationals that have benefited from the mobility of people and a degree of standardisation of the service (Aharoni, 1993). In this way, the growth and specialisation in hotel chains, American Express and airline companies can be explained, as can, to a certain extent, Arthur Andersen's specialisation in integrating consulting systems, McKinsey's in management or BCG in strategy. Trade, specialisation and comparative advantages are all terms that are closely linked. For firms, these advantages can be translated into (Daniels, 1993): production of market-cost specialised knowledge, development of economies of scale and extension, maintaining highly specialised staff, reinforcement of corporate identity and reputation, and variations in the access to inputs and markets.
The advantages of international trade in business services, acknowledged in most studies, should be evaluated bearing in mind that it is necessary to clarify several points:
1. All the positive effects are attenuated by the following: higher levels of demand cause inflationist effects; there are extremely narrow and weak markets that diminish the effects of internationalisation; the pressures of competition can have a negative influence on specific places where there is not a comparative advantage; high qualifications employment productivity in business services means that the abundance of the work factor does not necessarily presuppose lower costs, instead specific market situations can arise, with a positive correlation between the abundance of a factor and the price of this same factor (by creating differences between the real ability and perceived ability, problems of prestige, etc.).
2. The effects of internationalisation can not be generalised in all sectors and regions. The different activities and sectors are affected differently according to their specific conditions, maturity, degree of present concentration, growth dynamic, etc. Equally, the effects on countries, regions or cities are necessarily different.
3. Not all countries react in the same way faced with the advantages of the liberalisation of the international trade of services. The thorough study by Bhagwati (1987) details the differences between rich countries and developing countries, presenting the reasons why developing countries have always wanted to associate service negotiations with goods negotiations. Despite the differing opinions on the subject (Giarini, 1987), there are objective reasons to make one think that countries benefiting the most from the opening up of services must in contrast loose ground in the goods market.

306 Business Services in European Industry
6.1.5 Types of market according to level of internationalisation.
.It is possible to identify different types of markets according to the degree of internationalisation. They can be presented in the following way:
1. A business service is international when its activity develops frequent exchanges between countries. Internationality is fundamentally the exchange between different nations with the aim of achieving a host of economic phenomena: production (goods and services); production factors (land, work and capital); ownership of the production means; economic finance means (capital); production techniques (technology); and production modes (methods and economic cultures).
2. An activity is internationalised when it fulfils any of the three following conditions: there is a considerable international concentration (of suppliers); there is a considerable volume of direct exchanges (of services); the service offered is an international service (modes, techniques, and standards). The level of internationalisation of an activity is called degree of effective internationalisation (Iefl.
3. Expected internationalisation arises from the expectations of the agents about a possibly greater degree of Ief. We shall call it lexp-
4. The potential internationalisation represents theoretically maximum internationalisation of activities, discounting the degree of effective internationalisation (Ip). Ip represents the degree of lef to be expected in the short or medium-term future. ' °
5. Finally, internationability (ID), is defined as the maximum level in the short or medium term of total internationality (effective and potential): ¡D = lej+ Ip. The supposition that lies behind the introduction of this new category is the unequal internationability of the business service activities. Not all of them have the same international development Ier, or the same opportunities for future expansion Ip. There are activities that by their very nature are likely to be more international than others are. Others, due to the costs the producer and user incur during the interaction: the less they are, the greater the "commercialness" of the service will be (Daniels, 1993)
'0 The long term is of no use conceptually: in a protected period of time anything can happen.
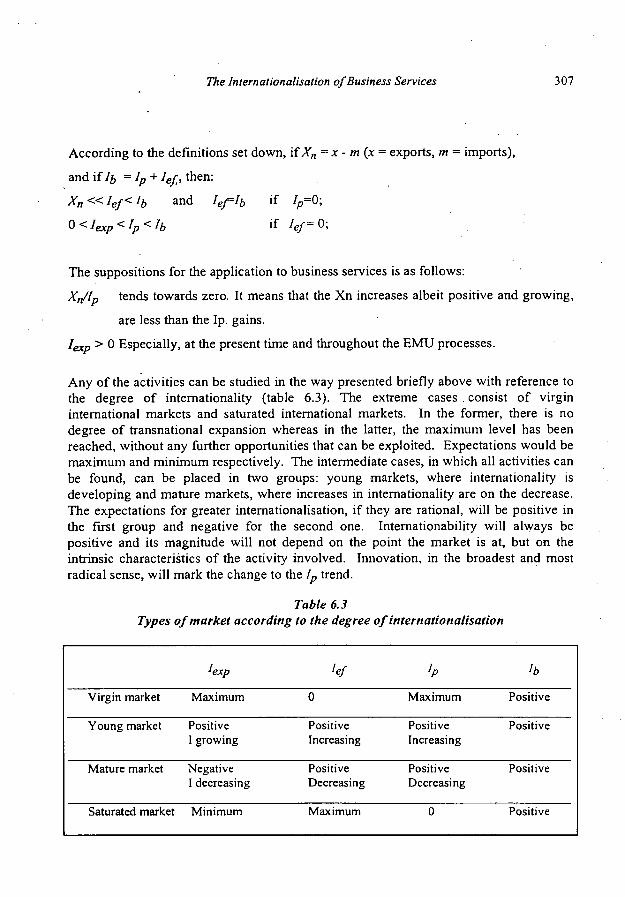
The Internationalisation of Business Services 307
According to the definitions set down, if Xn =x-m(x = exports, m = imports),
and if l0 = Ip + Ief, then:
* n « / c f - < / ¿ and Ief=I0 if ip=0;
0<Iexp<Ip<Ib if /, ef-
The suppositions for the application to business services is as follows:
Xn/Ip tends towards zero. It means that the Xn increases albeit positive and growing,
are less than the Ip. gains.
lexp > 0 Especially, at the present time and throughout the EMU processes.
Any of the activities can be studied in the way presented briefly above with reference to the degree of internationality (table 6.3). The extreme cases consist of virgin international markets and saturated international markets. In the former, there is no degree of transnational expansion whereas in the latter, the maximum level has been reached, without any further opportunities that can be exploited. Expectations would be maximum and minimum respectively. The intermediate cases, in which all activities can be found, can be placed in two groups: young. markets, where internationality is developing and mature markets, where increases in internationality are on the decrease. The expectations for greater internationalisation, if they are rational, will be positive in the first group and negative for the second one. Internationability will always be positive and its magnitude will not depend on the point the market is at, but on the intrinsic characteristics of the activity involved. Innovation, in the broadest and most radical sense, will mark the change to the Ip trend.
Table 6.3 Types of market according to the degree of internationalisation
Virgin market
Young market
Mature market
Saturated market
lexp
Maximum
Positive I growing
Negative I decreasing
Minimum
V 0
Positive Increasing
Positive Decreasing
Maximum
¡P
Maximum
Positive Increasing
Positive Decreasing
0
/*
Positive
Positive
Positive
Positive

308 Business Services in European Industry
The following results can be obtained by applying this theory to each specific activity and all of the variables from a previous study (Rubalcaba, 1992):
* European business services have a very high Ip , parallel to the level of expectations generated and much higher than the current degree of concentration and Iej: The differences between Ief and Ip diminish according to the relative comparison of the activities in the ID degree.
* The variables with greatest weight in the final Ip are market expectations and expansion. The variables with the least influence are the pace of take-overs and mergers (due to the extreme youth of many activities) and the degree of association (due to the existence of some very standardised business services).
* If we order the activities, no clear functional logic emerges, which reveals the heterogeneous character of the activity in growth, development and internationalisation as well as the existence of specific modes of integration of non-identifiable markets at first sight. The markets are very fragmented by countries and it is necessary to examine each country and activity individually.
77ie Internationalisation of Business Services 309
6.2 Principles and Barriers for a Single Market in Business Services
. Despite the world trends towards globalisation, the internationalisation of business services is a quite complex process mainly due to the host of trade barriers that hamper international expansion. Some barriers are related to the restrictions placed on competition by political or economic powers, but others are simply due to the particular characteristics of the markets. This section deals with both kinds of barriers, examining the areas where an action to eliminate or lessen the barriers is feasible.
6.2.1 Regulatory principles of a single competitive market
The different obstacles to internationalisation contradict the principles on which free circulation of goods, services, capital and labour and the basic foundations of the constitution of the Common Market are based. Occasionally, this contradiction is clear. However, for the majority of barriers, the political or economic authorities that create them justify themselves through clauses, safeguards and exceptions to the principles set down in the treaties. A number of issues arise from the relatively free -given the actions undertaken by the European Court of Justice- interpretation of the law of each Member State. The existence of general agreements accepted in the Treaty of Rome and the Single Act does not guarantee that they are carried out faithfully.
Many authors have studied the reasons justifying explicitly or implicitly protective regulation of services. Argandoña (1990) indicates the following reasons:
1. Market power. The regulating objective is frequently faced with limitations relating to competition, insufficient designation of resources and natural monopolies (for example, problems related to EU and national competition policy).
2. Externalities. When effects are generated without the need for any economic transaction (for example, the protection of user or client privacy in certain services).
3. Internalities. When the transaction generates costs or profits not included in the agreement, usually due to unexpected higher costs or insufficient or asymmetric information. Examples include the cases of adverse selection and moral risk, or the costs needed in order to acquire information on the quality of the professionals or the service.
4. Protection of employment, of newly created activities, defence of sovereignty, security and kealth, cultural identity, balance of payments equilibrium, etc.
These reasons incite the State to regulate to obtain a more favourable framework for the development of the different activities involved and to correct the failures in the existing markets. Hence, the regulation of services can be fully justified and can bring considerable advantages to society as a whole. Nonetheless, regulation also gives rise to
310 Business Services in European Industry
three important problems: 1st) regulation can lead to failures by the State comparable to market failures, 2nd) liberal regulations usually have clauses or exceptions to the principles that have been turned into protectionist measures; 3rd) political subjectivity comes into play when weighing up the reasons for and against a specific regulation.
.Advertising is a good example of this. The main European agreements (Community Treaties, European Convention on Human Rights, Helsinki Act) guarantee freedom of expression. The cases in which this right can be refused are in those of "national security". The considerable obstacles that have existed to the free circulation of advertising and marketing services in Europe (EAAA, 1989) usually seek protection in these kinds of safeguards or exceptions. Moreover, it is logical for national states to have the political right to decide matters such as the amount of advertising allowed on television, the kind of advertising in accordance with the legislation on misleading advertising, ethical restrictions (for reasons of public health or morality), requisites for control, etc. In many instances a restrictive measure has as many pros as contras. The criteria in this area are difficult to harmonise at a Community level. There are always many reasons to safeguard exceptions in regulatory harmonisation processes, since these are guaranteed by the EU Treaty. It is a key and difficult issue to identify when the proportionality principle of the Treaty is used or when it is not.
A draft version of a document produced by DGXV and DGV on business services and internal market proposes an "examination of to which extent identified barriers are admissible under Community Law and in particular whether they fulfil the condition of proportionality. The principle of freedom to provide services (Article 59 of the Treaty) guarantees that a Member State cannot restrict services emanating from another Member State unless such restrictions fulfil certain conditions. Discriminatory restrictions are only compatible with community law if they can be brought within the scope of the exemptions contained in Article 56 of the Treaty (public policy, security and health). Non-discriminatory restrictions may arise as a result of the additional application of national rales to service providers established in the territory of another Member State who already have to satisfy the requirements of the State's legislation. Such restrictions would only be in accordance wit Article 59 if they are justified by reasons relating to public interest (i.e. protection of workers or fair-trading) and if agreements on mutual recognition of qualifications, etc. do not yet exist. A further condition for the compatibility of discriminatory as wall as non-discriminatory restrictions is that they are proportionate to the objectives pursued by access restrictions. European Court of Justice case law has settled that requirements imposed on the providers of services must be appropriate to ensure achievement of the intended aim and must not go beyond what is necessary to achieve this objective. It must not be possible to obtain the same result by less restrictive rales. The assessment of proportionality requires a case by case approach in each of the Business Services sectors. The range of potential actions in this field is very wide and the setting-up of a methodology and a framework for the assessment of proportionality would greatly enhance the possibilities for taking appropriate actions at national and Community level." (European Commission, 1999)

The Internationalisation of Business Services 3 1 I
For obvious reasons, whether the interpretations themselves are coherent with the objectives of the Single Market cannot be studied here. ' ' In many cases there are as many pros as contras regarding the barrier, so political criteria would have to shape the justifying certain arguments. As Schultz noted (1985), in practice, "it is difficult or
. impossible to draw a line between normal business practice and the distortion of trade" (p. 89).
All the impediments constitute obstacles to the "ideal principles" pertaining to a Single Market. The most relevant can be taken from the international trade of services framework (Arkell and Harrison, 1987) ' 2 . The principles set down here concern services. The first premise before any liberalising negotiation (Noyelle and Dutka, 1988) is that services be dealt with in a special way, as they do not behave like goods.
/. - National treatment. The principle governing National treatment refers to both the services produced across frontiers and companies belonging to or controlled by foreigners. The National treatment principle substitutes the one on free access to the markets, as the latter does not recognise the effective access of foreign services; an attempt is made in order to guarantee equality of treatment with regard to national services. '3 Qualification problems, for example, are linked to the application of this principle. The two basic rights coming from National treatment are the free provision of services and the establishment right.
2. - No discrimination. This principle comes from the application of National treatment during the development of the activity of foreign firms. Once the free provision of services and the establishment right have been granted a lack of discrimination must be guaranteed. The need for reciprocity has been argued for the application of this principle. The advisability of a generalised lack of discrimination must not insist on an impossible bilateral agreement on all the aspects to be dealt with. The complexity of services basically requires multilateral and horizontal agreements. The equality of treatment in each member country is guaranteed by articles 48 (salaried workers) and 52 and 59 (non-salaried) in the EU Treaty.
3. - Competitive Markets. The general principle of maintaining a competitive market is adequate as far as it points to the advisability of not having large
11 The case law of the European Court of Justice provides important contributions to these interpretations
12 Arkell and Harrison (1987) give a good account of the basic principles of international trade, its definitions and basic issues. Some of the principles presented here can be found in the work cited.
13 The principle of Free Access to service markets is similar to the one applied to goods and, therefore, presupposes a similar movement. See Arkell (1987a, 1987b) for a more detailed explanation.
312 Business Services in European Industry
distortions or powers reducing the advantages of the free markets. Noncompetitive practices and abuse of dominant position as well as the excessive concentration of the market threaten this principle. This is set down in articles 85 and 86 of the European Union Treaty for the former and in the Regulation on Concentrations for the latter. Examples of this include public or private monopolies with the power to fix prices above the competitive price to the detriment of the consumer, oligopoly shares in the market, fixing different conditions for third parties, predatory practices, etc.. State grants and failures in public procurement rules also distort competition, affecting specific business services.
4. - Control of exceptions and safeguards. The existence of exceptions and safeguards is justified by the need to protect national security, health, cultural identity, etc., and some activities with not very competitive "industries". Even though the incorporation of clauses that ensure protection are justified in many instances, governments often abuse them in order to transform the exception into the rale in protectionist behaviour. Controlling these clauses seems to be justified.
5. - Guided self-regulation. This can be considered as a new principle.14 Self-regulation has been shown to be more advantageous than state regulations, as the latter display a short-sightedness in identifying problems and solutions. However, self-regulation is not completely in line with the law either, as occasionally it can become a tool of monopolistic power. Hence, self-regulation is required which is guided or corrected by a higher authority than the main protagonists.
6. - Transparency. Transparency constitutes a principle as it guarantees accessibility of reliable information. International trade and internationalisation base their development on inputs of reliable information that catalyse the agents. The clarity needed by exporters, support for negotiators and deepening of the processes of liberalisation is the means cited in order to enhance transparency. Public procurement rales also need transparency for improving the collaboration between private sector and public administration. However, in the business service markets this principle is faced with the generalisation of imperfect information, which complicates the attainment of the levels of transparency desired. It must be observed that all the proposals to liberalise information come up against limits set by reality itself. For every extra bit of information revealed there are others which are not. The uncertainty of the markets, associated with this apparent paradox is fortunately an irreducible
14 Previously "Objectives for National Regulations" were talked about in fairly generic terms and the advantages and disadvantages of the regulation were not analysed. A regulation is not necessarily good: it can place serious limits on the internationalisation of services and act as an important obstacle for free development in an activity.
The internationalisation of Business Services 3 13
phenomenon. 15 The principle of transparency remains as a "principle of ideal equilibrium" towards which economic development tends, knowing that the more integrated the economies are, the further away the optimum transparency moves. The role of politics is to help encourage this development in a modest way.
6.2.2 The four types of barriers
The main barriers that, directly or indirectly, have contradicted the principles of the Single Market and the articles of the Treaty of Rome and the Single Act, are described here even though some of the obstacles have not been fully recognised by those affected'6. Four large groups will be established to order all the barriers identified (more explanation and examples are given further on):
A. Legal barriers. These are the ones that exist only according to law and administrative regulations. The law creates them and the law can make them disappear. Basically there are two kinds: prohibitions on the development of specific activities and development difficulties due to horizontal laws. They are often barriers defined by the political power that fails to comply with articles 52 to 56 of the Treaty, establishment right and 59 to 66, free provision of services. I 7
15 The word "fortunately" may appear to be a little surprising here so a brief explanation is required. During the centuries of classical economics, the economy was understood in general terms as a process which was conditioned by mechanical and determinist forces to a greater or lesser extent, leading to a state of progress in which the main economic problems -work, poverty, etc. would disappear. This position, only criticised by the pessimistic economists of the crisis of overproduction, overpopulation, etc., finds its parallel today in the utopia that some proclaim in a system with perfect informative transparency. This new ingenuous illusion falls back on once more a determinism that does not leave space for the development of creativity and the Schumpterian impulses. The key to economic development is concentrated in facing a series of economic paradoxes and not in supposing that there are miraculous solutions however socialist or liberal they may be.
' 6 On the other hand, it is interesting to observe that the long list of barriers presented is often not known by those involved. It seems to be quite generalised for supplier companies not to know the restrictions they have to face in international expansion. This conclusion was reached by the report on the cost of non Europe for business services (Peat Marwick, 1988). In this survey, the barriers that were detected were nearly always considered as simply "facts of life ".
17 Other barriers -economic and intrasectorial- also spring from the failure to comply with Community agreements. A good account of some of the barriers of this kind (legal) was carried out by the Commission in 1990, European Commission (1990a) in an internal document. This is updated in Rubalcaba (1992a, 1997).
314 Business Services in European Industry
Β. Economie barriers. These exist purely due to economic reasons independent of the existence of laws accompanying them. They represent basically the different distortions to competition and lack of adequate access to information. The former is included in this group as it comes from economic powers and not necessarily from laws. The latter, because the economic development centre in a service economy is the potential of information. Information is the basic economic problem of services, in the light of which we can understand other problems: co-ordination, expansion, quality of service, strategies, organisation, etc.
C. Intrasectorial barriers. These come from the sector itself independent of the legal or economic powers. They are barriers that emerge from an activity due to its own dynamics and spatial diversity. An activity that is unrestrained by laws and fully competitive, in a microeconomic sense, can see its international development slowed dov/n by differences in methods, techniques, standards and regulations. 18
D. Social barriers. These are barriers imposed by the social reality on the market agents through ethical behaviour, linguistic diversity or cultural idiosyncrasies. They are elements that business services cannot overlook. A precise knowledge of this kind of barrier is needed, more than in any other sector of the economy. 19
The barriers will be presented schematically, without giving detailed information on each country and activity as this is beyond the scope of this study. Each type of barrier is analysed by a table (6.4, 6.5, 6.6., and 6.7 for legal, economic, intrasectorial, and social barriers, respectively) including the different kinds of specific barriers, the principles they break (those regarded in the former section), the main business services activities affected and the level of current seriousness (Low/Medium/High) for the European market integration. Much of this detailed information comes from the Panorama of the EU Industry, reports from Competition Policy organisms, and sectoral reports.
18 These types of obstacles have not been considered as barriers as there is no legal imposition behind them. In one sense they can be considered as barriers in a negative way: it is not the existence of good regulation that gives rise to obstacles. The fact that a barrier is formulated positively or negatively does not alter the end result.
19 Usually only the so-called "cultural barriers" are taken into account, and this term is fairly ambiguous. The term "social" is used as it makes explicit what is meant by culture; otherwise it is necessary to use a term in which all the idiosyncratic factors of a society are associated.
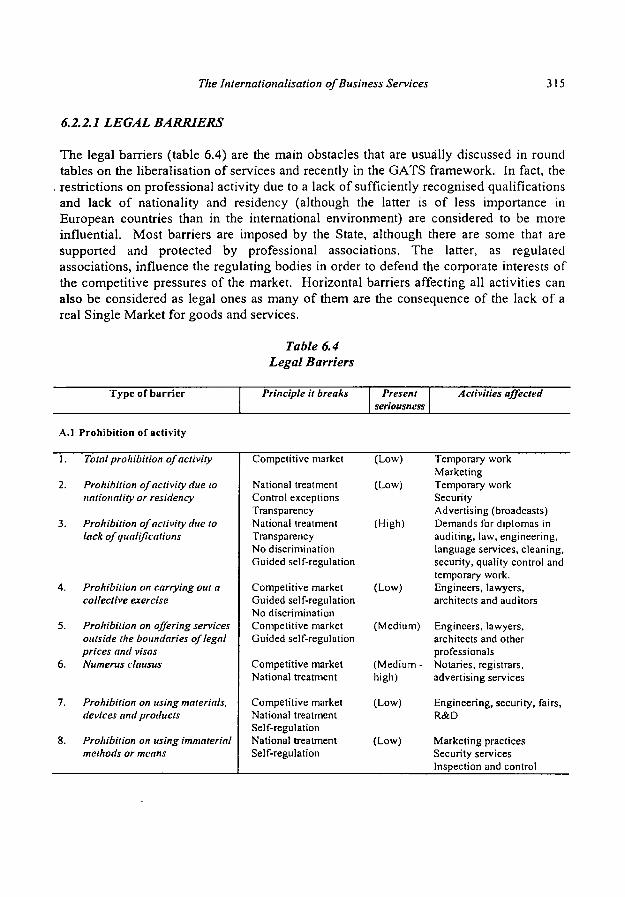
The Internationalisation of Business Services 315
6.2.2.1 LEGAL BARRIERS
The legal barriers (table 6.4) are the main obstacles that are usually discussed in round tables on the liberalisation of services and recently in the GATS framework. In fact, the restrictions on professional activity due to a lack of sufficiently recognised qualifications and lack of nationality and residency (although the latter is of less importance in European countries than in the international environment) are considered to be more influential. Most barriers are imposed by the State, although there are some that are supported and protected by professional associations. The latter, as regulated associations, influence the regulating bodies in order to defend the corporate interests of the competitive pressures of the market. Horizontal barriers affecting all activities can also be considered as legal ones as many of them are the consequence of the lack of a real Single Market for goods and services.
Table 6.4 Legal Barriers
Type of barrier Principle it breaks Present seriousness
Activities affected
A.l P roh ib i t ion of act ivi ty
1.
2.
3.
4.
5.
6.
7.
8.
Total prohibition of activity
Prohibition of activity due to nationality or residency
Prohibition of activity due to lack of qualifications
Prohibition on carrying out a collective exercise
Prohibition on offering services outside the boundaries of legal prices and visas Numerus clausus
Prohibition on using materials. devices and products
Prohibition on using immaterial methods or means
Competitive market
National treatment Control exceptions Transparency National treatment Transparency No discrimination Guided self-regulation
Competitive market Guided self-regulation No discrimination Competitive market Guided self-regulation
Competitive market National treatment
Competitive market National treatment Self-regulation National treatment Self-regulation
(Low)
(Low)
(High)
(Low)
(Medium)
(Medium -high)
(Low)
(Low)
Temporary work Marketing Temporary work Security Advertising (broadcasts) Demands for diplomas in auditing, law, engineering, language services, cleaning, security, quality control and temporary work. Engineers, lawyers, architects and auditors
Engineers, lawyers, architects and other professionals Notaries, registrars, advertising services
Engineering, security, fairs. R&D
Marketing practices Security services Inspection and control
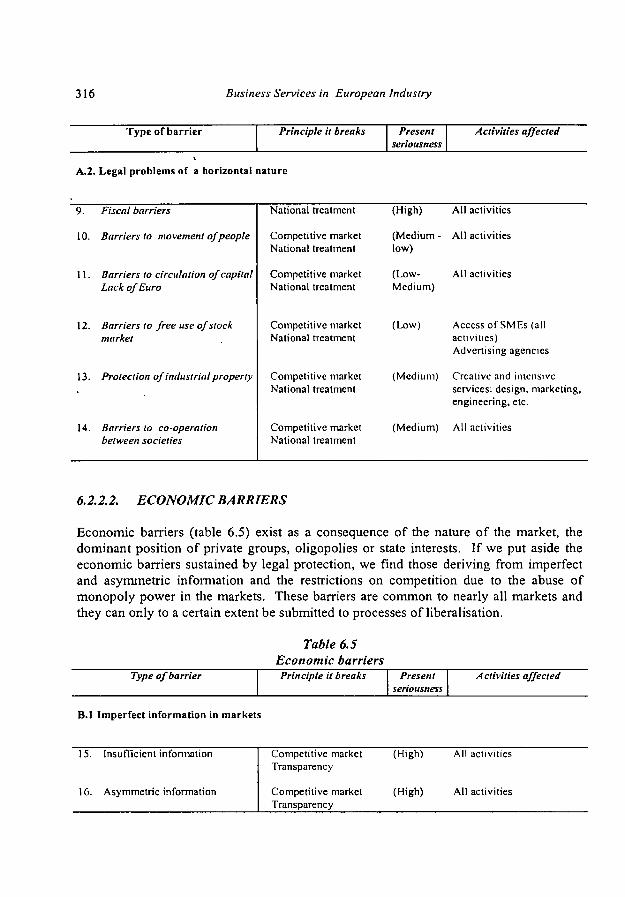
316 Business Services in European Industry
Type of barrier Principle it breaks Present seriousness
Activities affected
A.2. Legal problems of a horizontal nature
9.
10.
11.
12.
13.
14.
Fiscal barriers
Barriers to movement of people
Barriers to circulation of capital Lack of Euro
Barriers to free use of stock market
Protection of industrial property
Barriers to co-operation between societies
National treatment
Competitive market National treatment
Competitive market National treatment
Competitive market National treatment
Competitive market National treatment
Competitive market National treatment
(High)
(Medium -low)
(Low-Medium)
(Low)
(Medium)
(Medium)
All activities
All activities
All activities
Access of SMEs (all activities) Advertising agencies
Creative and intensive services: design, marketing, engineering, etc.
All activities
6.2.2.2. ECONOMIC BARRIERS
Economic barriers (table 6.5) exist as a consequence of the nature of the market, the dominant position of private groups, oligopolies or state interests. If we put aside the economic barriers sustained by legal protection, we find those deriving from imperfect and asymmetric information and the restrictions on competition due to the abuse of monopoly power in the markets. These barriers are common to nearly all markets and they can only to a certain extent be submitted to processes of liberalisation.
Table 6.5 Economic barriers
Type of barrier Principle it breaks Present seriousness
A ctivities affected
B.l Imperfect information in markets
15. Insufficient information
16. Asymmetric information
Competitive market Transparency
Competitive market Transparency
(High) All activities
(High) All activities
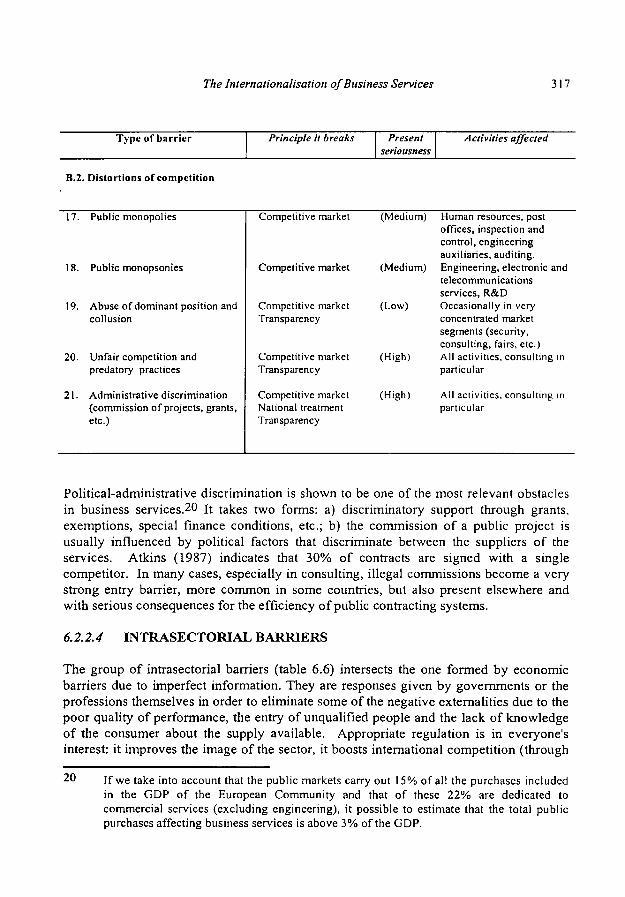
The Internationalisation of Business Services 317
Type of barrier Principle it breaks Present seriousness
Activities affected
B.2. Distortions of competition
17.
18.
19.
20.
21.
Public monopolies
Public monopsonies
Abuse of dominant position and collusion
Unfair competition and predatory practices
Administrative discrimination (commission of projects, grants, etc.)
Competitive market
Competitive market
Competitive market Transparency
Competitive market Transparency
Competitive market National treatment Transparency
(Medium)
(Medium)
(Low)
(High)
(High)
Human resources, post offices, inspection and control, engineering auxiliaries, auditing. Engineering, electronic and telecommunications services, R&D Occasionally in very concentrated market segments (security, consulting, fairs, etc.) All activities, consulting in particular
All activities, consulting in particular
Political-administrative discrimination is shown to be one of the most relevant obstacles in business services.20 It takes two forms: a) discriminatory support through grants, exemptions, special finance conditions, etc.; b) the commission of a public project is usually influenced by political factors that discriminate between the suppliers of the services. Atkins (1987) indicates that 30% of contracts are signed with a single competitor. In many cases, especially in consulting, illegal commissions become a very strong entry barrier, more common in some countries, but also present elsewhere and with serious consequences for the efficiency of public contracting systems.
6.2.2.4 INTRASECTORIAL BARRIERS
The group of intrasectorial barriers (table 6.6) intersects the one formed by economic barriers due to imperfect information. They are responses given by governments or the professions themselves in order to eliminate some of the negative externalities due to the poor quality of performance, the entry of unqualified people and the lack of knowledge of the consumer about the supply available. Appropriate regulation is in everyone's interest: it improves the image of the sector, it boosts international competition (through
20 If we take into account that the public markets carry out 15% of all the purchases included in the GDP of the European Community and that of these 22% are dedicated to commercial services (excluding engineering), it possible to estimate that the total public purchases affecting business services is above 3% of the GDP.

318 Business Services in European Industry
greater prestige) and stimulates professional development and the quality of the service. At the same time, the harmonisation derived from it enables technical and non-technical economies of scale to be carried out, it reduces administrative costs and certificates and promotes competition. In order to help achieve these effects legislation must be spare, clear and neutral and bear in mind the interests of all parties. The current European Community trend follows three criteria:
Limit harmonisation to basic health and security matters. Standards are set at a Community level Promote self-regulation when this is shown to be more efficient than the other alternatives Encourage mutual recognition of standards and national regulations whilst European regulations are drawn up, and attempt to limit these to the lowest possible number.
Two different intrasectorial barriers can be distinguished: lack of harmonisation and regulatory deficiencies. The first refers to regulations that have already been consolidated but not harmonised at an European level. The second refers to the defects and deficiencies of the regulations themselves. Obviously, both types are closely interrelated.
Table 6.6 Intrasectorial barriers
Type of barrier Principle it breaks Present seriousness
Activities affected
C.l Lack of harmonisation at an European level
22.
23.
24.
Diversity of community standards
Diversity in compatibility systems
Diversity in statistical information systems
Competitive market Guided self-regulation National treatment
Competitive market Guided self-regulation National treatment Competitive market Guided self-regulation National treatment
(High)
(Low)
(Low)
Engineering, consulting, auditing, quality control, computer services, market research, advertising, security Lawyers, auditing-consulting
All activities, fairs and exhibitions, market research
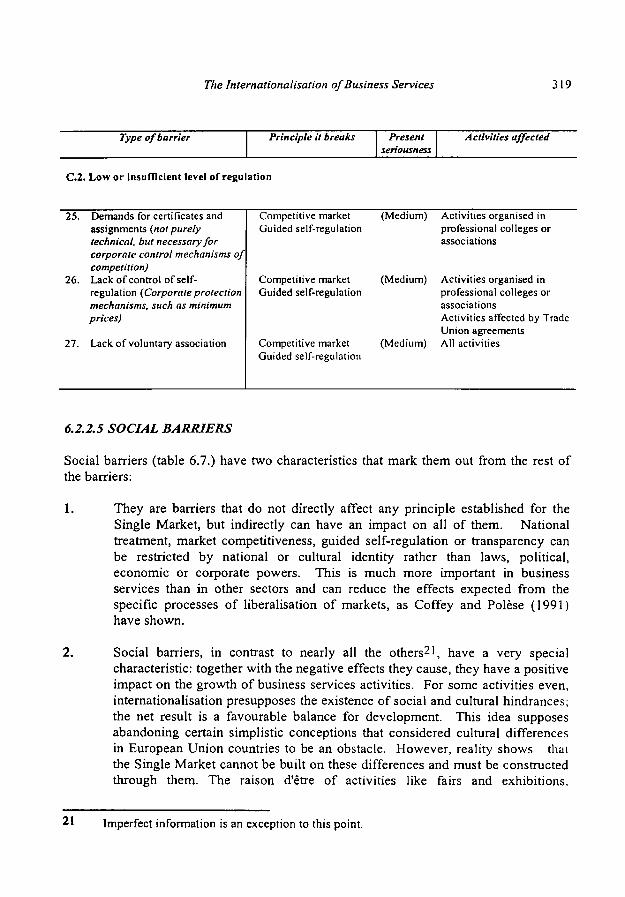
The Internationalisation of Business Services 319
Type of barrier Principle it breaks Present seriousness
Activities affected
C.2. Low or insufficient level of regulation
25. Demands for certificates and assignments {not purely technical, but necessary for corporate control mechanisms of competition)
26. Lack of control of self-regulation {Corporate protection mechanisms, such as minimum prices)
27. Lack of voluntary association
Competitive market Guided self-regulation
Competitive market Guided self-regulation
Competitive market Guided self-regulation
(Medium)
(Medium)
(Medium)
Activities organised in professional colleges or associations
Activities organised in professional colleges or associations Activities affected by Trade Union agreements All activities
6.2.2.5 SOCIAL BARRIERS
Social barriers (table 6.7.) have two characteristics that mark them out from the rest of the barriers:
1. They are barriers that do not directly affect any principle established for the Single Market, but indirectly can have an impact on all of them. National treatment, market competitiveness, guided self-regulation or transparency can be restricted by national or cultural identity rather than laws, political, economic or corporate powers. This is much more important in business services than in other sectors and can reduce the effects expected from the specific processes of liberalisation of markets, as Coffey and Polèse (1991) have shown.
2. Social barriers, in contrast to nearly all the others2 ' , have a very special characteristic: together with the negative effects they cause, they have a positive impact on the growth of business services activities. For some activities even, internationalisation presupposes the existence of social and cultural hindrances; the net result is a favourable balance for development. This idea supposes abandoning certain simplistic conceptions that considered cultural differences in European Union countries to be an obstacle. However, reality shows that the Single Market cannot be built on these differences and must be constructed through them. The raison d'être of activities like fairs and exhibitions.
21 Imperfect information is an exception to this point.
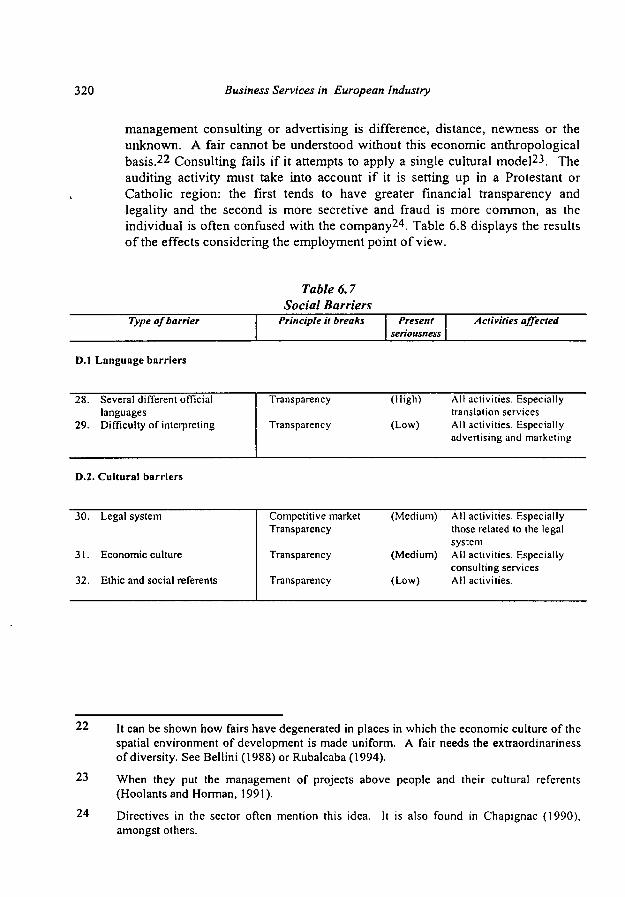
320 Business Services in European Industry
management consulting or advertising is difference, distance, newness or the unknown. A fair cannot be understood without this economic anthropological basis.22 Consulting fails if it attempts to apply a single cultural model2^. The auditing activity must take into account if it is setting up in a Protestant or Catholic region: the first tends to have greater financial transparency and legality and the second is more secretive and fraud is more common, as the individual is often confused with the company24. Table 6.8 displays the results of the effects considering the employment point of view.
Table 6.7 Social Barriers
Type of barrier Principle it breaks Present seriousness
Activities affected
D.l Language barriers
28. Several different official languages
29. Difficulty of interpreting
Transparency
Transparency
(High) All activities. Especially translation services
(Low) All activities Especially advertising and marketing
D.2. Cultural barriers
30.
31.
32.
Legal system
Economic culture
Ethic and social referents
Competitive market Transparency
Transparency
Transparency
(Medium)
(Medium)
(Low)
All activities. Especially those related to the legal system All activities. Especially consulting services All activities.
22
23
24
It can be shown how fairs have degenerated in places in which the economic culture of the spatial environment of development is made uniform. A fair needs the extraordinariness of diversity. See Bellini (1988) or Rubalcaba (1994).
When they put the management of projects above people and their cultural referents (Hoolants and Horman, 1991).
Directives in the sector often mention this idea. It is also found in Chapignac (1990), amongst others.
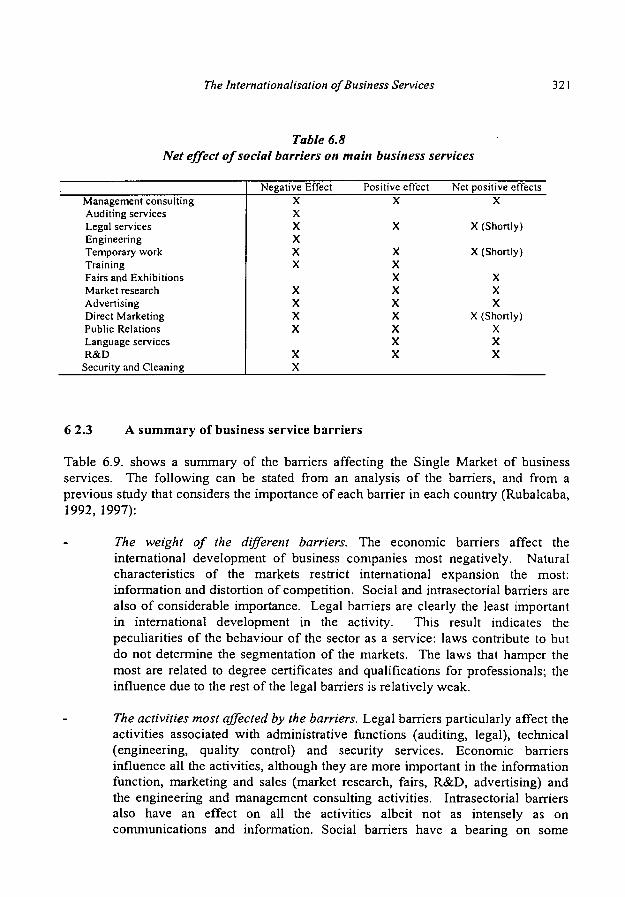
77ie Internationalisation of Business Services 321
Table 6.8 Net effect of social barriers on main business services
Management consulting Auditing services Legal services Engineering Temporary work Training Fairs and Exhibitions Market research Advertising Direct Marketing Public Relations Language services R&D
Security and Cleaning
Negative Effect X X X X χ χ
χ χ χ χ
χ χ
Positive effect X
X
X X X X X X Χ Χ Χ
Net positive effects Χ
Χ (Shortly)
Χ (Shortly)
Χ Χ Χ
Χ (Shortly) Χ Χ Χ
6 2.3 A summary of business service barriers
Table 6.9. shows a summary of the barriers affecting the Single Market of business services. The following can be stated from an analysis of the barriers, and from a previous study that considers the importance of each barrier in each country (Rubalcaba, 1992, 1997):
The weight of the different barriers. The economic barriers affect the international development of business companies most negatively. Natural characteristics of the markets restrict international expansion the most: information and distortion of competition. Social and intrasectorial barriers are also of considerable importance. Legal barriers are clearly the least important in international development in the activity. This result indicates the peculiarities of the behaviour of the sector as a service: laws contribute to but do not determine the segmentation of the markets. The laws that hamper the most are related to degree certificates and qualifications for professionals; the influence due to the rest of the legal barriers is relatively weak.
The activities most affected by the barriers. Legal barriers particularly affect the activities associated with administrative functions (auditing, legal), technical (engineering, quality control) and security services. Economic barriers influence all the activities, although they are more important in the information function, marketing and sales (market research, fairs, R&D, advertising) and the engineering and management consulting activities. Intrasectorial barriers also have an effect on all the activities albeit not as intensely as on communications and information. Social barriers have a bearing on some

322 Business Services in European Industry
activities in particular (management, legal, temporary work, fairs, language services, public relations) and the marketing function in general (advertising, direct marketing). Overall the activities affected the most by the four types of barriers are management, advertising, legal, temporary work, professional training, market research, engineering, fairs, quality control and security. The least affected are R&D, IT-services, language services, courier services and cleaning services.
Table 6.9 The barriers to the Single Market for business services
A. LEGAL BARRIERS
A.l PROHIBITION OF ACTIVITY: I Total prohibition of activity; 2 Prohibition of activity due to nationality or residency; 3 Prohibition of activity due to lack of qualifications; 4 Prohibition on carrying out a collective exercise; 5 Prohibition on establishing different prices and visas; 6 Numerus clausus; 7 Prohibition based on the use of materials, equipment and products; 8 Prohibition based on the use of immaterial methods or means.
A.2 LEGAL DIFFICULTIES OF A HORIZONTAL NATURE: 9 Fiscal barriers; 10 Barriers to the free-movement of people; 11 Barriers to the free movement of capital; 12 Barriers to the free use of the stock market; 13 Diversity in regulations on industrial property; 14 Barriers to co-operation between societies.
B. ECONOMIC BARRIERS
B.l IMPERFECT INFORMATION: 15 Insufficient information; 16 Asymmetrical information. B.2. DISTORTIONS TO COMPETITION: 17 Public monopolies; 18 Public monopsonies; 19 Abuse of
dominant position and collusion; 20 Unfair competition and predatory practices; 21 Administrative discrimination
INTRASECTORIAL BARRIERS
C.I. LACK OF HARMONISATION AT AN EUROPEAN LEVEL: 22 Disparity in the European community standards; 23 Incomparability in the statistical information systems; 24 Different systems of incompatibilities.
C.2 LOW OR INSUFFICIENT LEVEL OF REGULATION: 25 Demands for non-technical certificates and attestations; 26 Lack of guided self-regulation; 27 Little voluntary association or pro-quality codes
D. SOCIAL BARRIERS
D.I LANGUAGE BARRIERS: 27 Different languages; 28 Difficulties in interpreting the language. D.2. CULTURAL BARRIERS: 29 Diverse national legal systems; 30 Specific economic cultures; 31
Ethical, religious and social referents.
More positive than negative barriers. As can be observed, one of the characteristics of business services is that there are some barriers that are more positive than negative for the sector. Although, at first sight all obstacles are
77ie Internationalisation of Business Services 323
negative when we consider the direct effects, business services to a certain extent benefit from the indirect effects caused by the same barriers as in other manufacturing and service sectors. The diversity of norms, regulations, economic environments, etc. favours the recourse to business services by many other sectors wishing to overcome the difficulties in their path to internationalisation. This is especially obvious as regards social barriers. In the way linguistic services are justified by the existence of different languages, many services are created in response to the diversity of the markets. Anyway, it is necessary to distinguish between some social and economic barriers, which are good for some business services, and most legal and intra-sectoral barriers, which are negative for most business services.
The need to nationalise the international. The idea presented at the beginning of the chapter that internationalisation in the sector presupposes nationalisation of the sector is reinforced by an examination of the different barriers. The obstacles that exist to the Single Market for business services show that a company can only triumph in the international market when it adapts to the legal, economic, intrasectorial and socio-cultural framework of the country it aims to set up in. Abolishing some of these legal barriers does not remove the need for nationalisation, in the sense that a significant accumulation of barriers influences the development of the sector, and they are not particularly likely to be eliminated by non-protectionist legislation.
324 Business Services in European Industry
6.3 Removal of barriers in business services
6.3.1 Framework for removing barriers
The barriers can be classified into four types from the point of view of European political action: barriers affecting the consolidation of the internal market (fundamentally legal barriers), barriers that affect the competition policy, (distortion of competition barriers and State grants), barriers to be removed by the activities themselves according to the principle of subsidiarity; the Commission can only stimulate some processes (intrasectorial barriers and imperfect information), and barriers that are not sensitive to abolition measures, with a really small margin of activity (social barriers and some economic ones). The framework for abolishing barriers can be summarised as follows, depending on whether the barriers are legal, economic or intrasectorial in nature:
A. Abolition of legal barriers. Many of the legal barriers are being eliminated withiri the consolidation process of the Single European Market. The long process of liberalisation of professional activities is of particular importance. The prohibitions due to lack of technical or professional qualifications, the important legal obstacle, has been censured by the three main systems for the recognition of qualifications and diplomas. These systems consist of updating and realisation of the principles in the Treaty (1957) in articles 52 to 66, the general programme for the abolition of restrictions on the free provision of services (1962), of the different part directives (from 1964 to 1985)25, and the Single European Act (EC, 1986), especially article 13. The three systems are as follows:
The first system (directive 85/368/CEE) concerns the recognition of professional training qualifications, establishing a general framework that enables the achievements reached by the general programme to be developed. The second system (directive 92/51/CEE, valid from 18 June 1994) extends the third system to the rest of professional education (courses lasting less than three years). The third system (directive 89/48/CEE) enshrines the recognition of higher education degree certificates when the duration of the course is at least three years (valid from 4 January 1991).
Occasionally, the comparison of certificates or diplomas requires periods of adaptation and aptitude tests, still insufficient in most countries in the Union. As regards the rights of free provision of services and right of establishment, the Commission has moved
25 It serves as a model especially for the directive 77/249/CEE dedicated to facilitating free provision of services for lawyers.
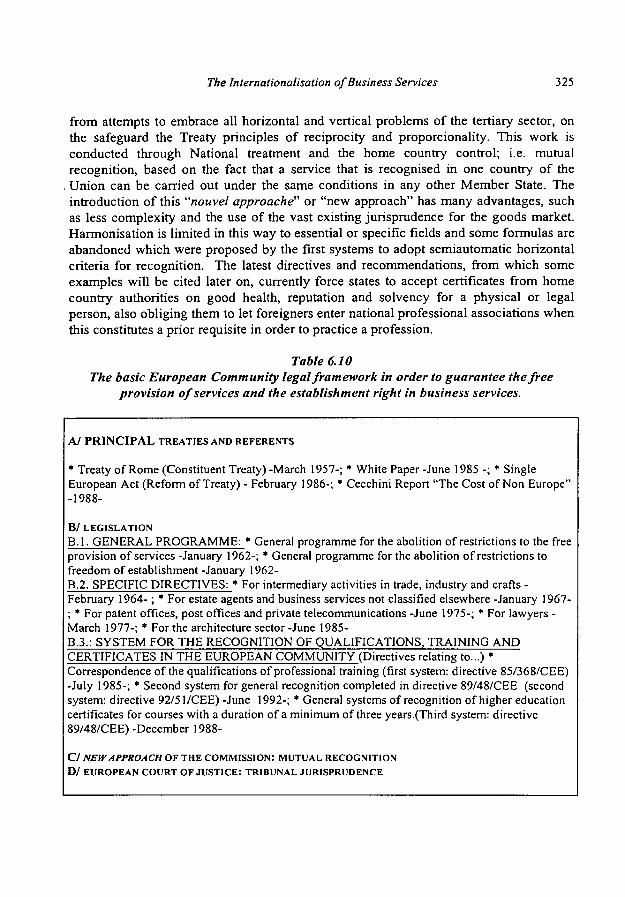
The Internationalisation of Business Services 325
from attempts to embrace all horizontal and vertical problems of the tertiary sector, on the safeguard the Treaty principles of reciprocity and proporcionality. This work is conducted through National treatment and the home country control; i.e. mutual recognition, based on the fact that a service that is recognised in one country of the
. Union can be carried out under the same conditions in any other Member State. The introduction of this "nouvel approache" or "new approach" has many advantages, such as less complexity and the use of the vast existing jurisprudence for the goods market. Harmonisation is limited in this way to essential or specific fields and some formulas are abandoned which were proposed by the first systems to adopt semiautomatic horizontal criteria for recognition. The latest directives and recommendations, from which some examples will be cited later on, currently force states to accept certificates from home country authorities on good health, reputation and solvency for a physical or legal person, also obliging them to let foreigners enter national professional associations when this constitutes a prior requisite in order to practice a profession.
Table 6.10 The basic European Community legal framework in order to guarantee the free
provision of services and the establishment right in business services.
A/ PRINCIPAL TREATIES AND REFERENTS
* Treaty of Rome (Constituent Treaty) -March 1957-; * White Paper -June 1985 -; * Single European Act (Reform of Treaty) - February 1986-; * Cecchini Report "The Cost of Non Europe" -1988-
B / LEGISLATION B.l. GENERAL PROGRAMME: * General programme for the abolition of restrictions to the free provision of services -January 1962-; * General programme for the abolition of restrictions to freedom of establishment -January 1962-B.2. SPECIFIC DIRECTIVES: * For intermediary activities in trade, industry and crafts -February 1964- ; * For estate agents and business services not classified elsewhere -January 1967-; * For patent offices, post offices and private telecommunications -June 1975-; * For lawyers -March 1977-; * For the architecture sector -June 1985-B.3.: SYSTEM FOR THE RECOGNITION OF QUALIFICATIONS, TRAINING AND CERTIFICATES IN THE EUROPEAN COMMUNITY (Directives relating to...) * Correspondence of the qualifications of professional training (first system: directive 85/368/CEE) -July 1985-; * Second system for general recognition completed in directive 89/48/CEE (second system: directive 92/51/CEE) -June 1992-; * General systems of recognition of higher education certificates for courses with a duration of a minimum of three years.(Third system: directive 89/48/CEE) -December 1988-
Cl NEW APPROACH OF THE COMMISSION: MUTUAL RECOGNITION D / EUROPEAN COURT OF JUSTICE: TRIBUNAL JURISPRUDENCE

326 Business Services in European Industry
Another characteristic of the new approach is the recognition of selfregulation by
professions, as a means through which the traditional ways of guaranteeing the quality
of the service are maintained, in order to avoid competition and quality going in
opposite directions. This type of new approach has also been followed, albeit with more
reservations, by agreements at the Uruguay Round, when the foundations were laid for
the liberalisation of the trading of professional services respecting the principles of
national treatment, bilateral agreements of mutual recognition and the role of
professions. It is a flexible system that creates rather than exhausts all the opportunities
for liberalisation, as will be shown at the end of the chapter.
Table 6.10 covers the basic existing legal framework guaranteeing the free provision of
services and the right of establishment in the European Union. In short, the basic
European Community legislation for the application of principles guaranteed by the
Treaty and the Single Act can be divided into three sections: 1 The General Programme
for the abolition of restrictions to the free provision of services and authorised
exceptions; 2 The system of specific directives developing the previous system for
specific professions; 3 The three recognition systems for certificates, diplomas and
professional training.
Together with the advances in prohibitions, the legal obstacles tend to disappear as
programmes and measures are developed. In this way, some fiscal barriers (excluding
income tax), circulation of capital and stock market, legislation on property and co
operation between limited companies are engaged in a slow process of harmonisation.
Β. Abolition of economic and intrasectorial barriers.
In the medium term, and especially in view of the fact that the realisation of the
Economic and Monetary Union continues, many of the measures to abolish legal
barriers will be consolidated and concerns will focus on reducing the distortions to
competition (e.g. discrimination, public grants, public markets). The gradual process of
harmonisation and efficiency in regulation and indeed selfregulation might also grow
more apparent over medium term perspective. The abolition of economic and
intrasectorial barriers is peculiar in that it is not possible to overcome once and for all
the type of obstacles affecting them above all. This could be due to the fact that
distortions can evolve, become complicated or emphasised or because of new demands
for quality in the services or the emergence of new needs for information and new
economic barriers. There is also a problem of political will and of facilitating the
appropriate tools to solve the problems. The measures used to facilitate transparency in
public appointments through public examinations do not always reach their objectives
(occasionally the systems of free contracting have favoured the interests contrary to
those pursued by the law). Policies aimed at "competition courts" are principally
responsible for eliminating some of the economic or intrasectorial barriers efficiently
(Petitbó, 1997).
77ie Internationalisation of Business Services 327
C. Achieving the liberalisation of the business service markets. To conclude this section, the following observations are made on achieving liberalising measures:
- The European Union is far from having a single business services market for several reasons, only a few of which can be eliminated through legal or administrative measures. In any case, greater liberalisation of the markets is desirable in as far as this could bring reductions to prices and increases in quality in the services concerned. Legal barriers, although important, are less significant than other types of barriers such as economic, intrasectorial or social ones. Therefore, the efforts directed at reducing legal barriers must be complemented with other types of measures for them to be effective (see chapter 10) In the processes of internationalisation of services, specific factors such as technology are more important than the abolition of barriers (Daniels, 1993), which leads to think that liberalisation is simply another contributing factor to the market integration. The problem of liberalisation does not depend so much on the movement of factors as on the modes of service (Nicolaidis, 1993; Riddle, 1986; Daniels 1993). This is especially true in advanced business services.
- The progressive adoption of the programme of mutual recognition creates both convergence in regulation and competition between regulations (Nicolaidis, 1993). Liberalisation implies a re-regulation that needs to be analysed together with its consequences before being adopted.
- Experience shows that liberalisation process of business services requires a slow, broad discussion in order to involve all parties, with the main aim to raise a necessary level of consensus. Therefore, measures which are of little use and inefficient should be reformulated, or new more efficient and market compatible ones should be considered. It is necessary to combine vertical measures in specific activities with horizontal measures that involve several activities and with measures that fit within a political framework embracing the whole industry.
6.3.2 Examples of the Commission actions
In its determination to abolish obstacles, mainly of a legal nature, to the Single European Market, the Commission has acted in a preferential way on four fronts: customs duties; the exchange control framework promoted by the EMS, the defence of competition supported by the Court of Justice; the harmonisation of national legislation through directives that allow for greater transparency in the markets. Business services have been affected on all these fronts. Actions to reduce and abolish custom duties have affected the courier service for instance, specially given the regulatory differences between public courier and private courier.
The policy of competition on the other hand has had an impact in activities such as advertising (although monopolies are maintained in countries like Ireland, Finland and
328 Business Services in European Industry
Austria). Temporary work has been de-regulated in the United Kingdom, the Netherlands, Portugal, Sweden and Finland, and legalised in Spain. In the fairs and exhibitions activity the European Commission has forced organisers to be transparent in their decision-making. The industrial estate agents have been questioned about the imposition of minimum fees in Spain, as can be seen in Report XXV on competition policies (European Commission, 1996). Anyway, competition policies basically watch over the markets and supervise the self-regulatory processes in pricing and fees, restrictions on advertising, control of dominant positions and exceptions to the principles of competition. In fact, this surveillance means that little active action is necessary in the sector.
In the field of harmonisation of national legislation there are a large number of proceedings that have affected activities from landscape design through to leasing, or franchising services. Examples include estate agents (Second Directive on Bank Coordination), advertising and marketing (Directive on misleading advertising), accounting (Eighth Directive on the approval of persons responsible for carrying out set auditing of accounts), industrial cleaning (directives on information and consulting of workers in the European Community and on awarding contracts to the public service), and leasing (Directive on the control of large irrigation areas). The existence of specific directives in a activity does not usually meet the requirements in that activity. For example, neither 77/249/EEC Directive, nor the referential connected systems, nor the most recent regulation proposal (between 1992 and 1994), have been enough to achieve a Single Market for lawyers acceptable to everyone. In fact, in 1996 the European Parliament discussed the specific measures that would facilitate the integration of the profession in Europe. It is obvious that there are specific problems in the different activities that require a specific approach.
At any rate, there is a trend towards horizontal directives covering several activities at once. Examples include: the Directive on the Mutual Recognition of Qualifications affecting the legal profession, engineers, accountants, architects and language services; the Directive on Data Protection affecting advertising, marketing, market research and computer services; the Directive on Temporary Work affecting particularly market research, temporary work and industrial cleaning; directives on minimum requirements for safety and health on construction sites and the one modifying the conditions of public contracts with a turnover of over 200.000 Ecus, affecting engineering services and consulting; the Directive on Industrial Property affecting computer services and IT-services and finally the Directive on Misleading Advertising affecting advertising, marketing and IT-services.
Another example of Commission action concerns public procurement. A recent draft document on this issue (European Commission, 1999) states two key right directions for removing of the related barriers: 1) The need of changes in the existing legal framework. The Commission has decided to reinvigorate and redefine the public procurement policy in the EU in adapting existing instruments to the changing economic environment, characterised inter alia by the predominance of services in the economy. Business
The internationalisation of Business Services 329
Services contracts, contrary to most cases of contracts concerning goods or work, often
need to be defined in a relationship between the provider and the customer. The
customer does not always fully perceive his needs because of fast changes and
upgrading in the service products and in many cases the service provider will have to
, tailor his product to specifities of the client. Future amendments to the public
procurement directives will take account of this situation by permitting more flexible
contracts taking account of the product and price development and by opening up the
possibilities of real negotiations during the tendering procedure without sacrificing the
principles of transparency and equal treatment; 2) The need of encouraging an easier
access to the public procurement market. The opening up of public procurement markets
to competition will have significant consequences for the competitiveness of Business
Services providers and their clients. Measures proposed in the Communication on public
procurement will have significant interest for Business Services and can be upgraded
continuously in view of developments in the Information Society and electronic
commerce. These developments will lead to more transparent markets through better
information and the Commission will propose amendments to the public procurement
directives in order to put electronic means of exchanging information on an equal
footing with other means. It is also the intention of the Commission to develop a
framework for an effective public procurement training policy in the Union, based on a
stock-taking of existing training needs, best practices and current programmes in this
field.
6.3.3 The role of GATS in liberalisation of professional service markets
One of the outstanding results from the GATT Uruguay Round has been GATS, that
regulates for the first time the trading of services and lays the foundations for a later
liberalising process directed by the new World Trade Organisation (see Hoekman, B;
Sauvé, Ρ, 1994 and OCDE, 1995). Although there are sectorial and national exceptions,
many activities are involved: professional services, computer and related services, R&D
services, estate agents, leasing without operators, and several other business services
such as advertising, market research, surveys, management consulting, technical trials
and testing, personal services, security services, industrial cleaning and photographic
services, etc. In fact, the new liberalising framework covers the most extensive group
possible of business services as the GATS implications for professional services and
companies are very broad (see Kakabadse, 1995, who includes a list of all the activities
involved).
GATS introduces the treatment of the most favoured nation in an unconditional way,
avoiding discrimination regarding local operators, the obligation for transparency of
conditions and restrictions for access to the market and creating stable foundations for a
gradual liberalisation process. (There are exceptions in recognition of certificates, some
forms of advertising, establishment of legal companies, entry of non-qualified workers,
treatment within areas in the process of integration, benefits, etc.). These conditions
allow foreign suppliers access to the markets, prohibiting discriminatory regulation

330 Business Services in European Industry
except in the agreed cases: health protection, safety and privacy of individuals, national security and fraud prevention and strategic monopolies.
GATS recognises and regulates basically four modes of international service trading: the .across borders trading, through telecommunications networks or any other means; foreign direct investment; when the provider moves temporarily to the client and, when the client moves to the client temporarily. Other forms of trade or internationalisation are not dealt with directly by GATS. GATS forecasts the WTO will control national legislation on service trading, promote the recognition of foreign qualifications or the definition of international standards and settle international disputes. It will also be in charge of creating a work group that makes recommendations on the requirements and procedures for qualifications; technical standards and non-necessary permit requisites, especially in the professional service activities like accountants, engineers and lawyers.
The recent advances in the effectiveness of GATS reveal the difficulties that exist in order to progress in liberalising measures, even within the OECD. If there is still much ground to be covered in the European Union there is still a good deal of work to be done within GATS. The process has only begun. In this sense, GATS is meeting the challenge of learning from experiences outside the EU, NAFTA, in the United States, Canada and Mexico or ANZCERTA, in Australia and New Zealand26. The existence of different experiences shows that there are different ways of liberalising the markets in accordance with the existing restrictions, the political philosophies and the framework of consequent actions. For this reason, government representatives and professional associations have recognised the need to identify clearly the barriers to international trade (OCDE, 1995), by separating the ones adopted to defend consumer interests from the rest. Despite the fact that there is agreement about the need for an inventory, decision-making level and promotion of the agreements are not as clear. Some maintain that government must promote the agreements. Others prefer professional associations. Others point to the OCDE as the ideal forum for further advances. In development terms it is clear that GATS still has a good deal of ground to cover.
2 6 See Cockbome (1995), Sauvé (1995) Australian Department of Foreign Affairs (1995), all in OCDE (1995) in order to compare the cases that are presented respectively on the European Union, NAFTA and the association between Australia and New Zealand.
The Internationalisation of Business Services 33 I
6.4 Conclusions
Business services are active agents in internationalisation. There are many activities
that encourage client internationalisation by providing them with information services,
■ strategy and foreign markets. In this way, services such as advertising, marketing, fairs
and exhibitions or management consulting represent activities that facilitate
internationalising processes in all the companies that use them. But at the same time all
business services are affected by internationalisation. Different factors (supply, demand
and political, institutional or social ones) contribute to the internationalisation of
companies and bring with this numerous advantages for themselves and the economic
system as a whole. Through many modes of internationalisation, to a large extent
different from the ones that exist in goods trading, benefits in product quality, breadth of
markets and in general economic efficiency are generated. There is no doubt that the
phenomenon of internationalisation does not affect all activities and countries equally,
hence a market typology can be conceptualised according to the degree of
internationalisation.
The most notable factors that differentiate between the levels of internationalisation
centre on the barriers that exist between markets. These can be placed into four groups:
legal, economic, intrasectorial and social. Some of the social and economic barriers also
act as beneficial factors in certain activities in the sector. Legal barriers receive the most
attention but are no significant in slowing down the processes of internationalisation.
The abolition of economic barriers or the promotion of technological processes can be
much more decisive when a company decides to internationalise. At any rate, many
barriers, especially legal barriers are being eliminated by policies created by the
European Commission. There is a legal framework for the removal of barriers departing
from the Treaty of Rome and branching out into numerous horizontal and vertical
directives that facilitate a Single Market for business services. The World Trade
Organisation also contributes to the liberalising trends through GATS, which is still
being developed.
It is clear from this chapter that the internationalisation of business services requires
nationalisation, in the sense of setting down parameters indicated by the national
markets. In the context of great segmentation due to the many barriers that exist, or to
the personalised nature of many services, the legal, social, economic and cultural
proximity to the local client becomes an essential requirement in order to achieve
competitive services. Liberalisation policies can help these processes, specially when
reducing some adverse barriers to the European Single Market.
332 Business Services in European Industry
References:
Aharoni, Y. (Ed.) (1993) Coalitions and competition: the globalization of professional
business services. Routledge, London and New York.
Aharoni, Y. (Ed.) (1997) changing roles of state intervention in services in the area of open
international markets. Suny, New York.
Aparicio, L (1997) "Cinco diferencias sobre las fusiones de los 80" Suplemento de Negocio de
El Pais, 19 October 1997.
Argandoña, Α. (1990) "Regulación y desregulación de los servicios". Papeles de Economía
Española, 42:218239.
Arkell, J. (1987a) Examination of the relevance of the conceptual framework to professional
services. OCDE.
Arkell, J. (1987b) Consultancy and international trade policy issues. Conference in the
Graduate School of International Management. Thunderbird University, Glendale, Arizona.
Arkell, J. ; Harrison, S. (1987) A sectoral study on the relevance of the OECD conceptual
framework to international trade in consultancy services (215). OECD
Atkins W.S Management Consutant (1987) The cost of nonEurope in public sector
procurement. Research on the cost of nonEurope, vol 5. Comisión de la C E , , Luxembourg.
Australian Department of Foreign Affairs and Trade (1995) "Liberalisation of Trade in
Professional Services between Australia and New Zealand and within Australia" in OECD
(1995), OECD.
Barcet; Bonamy (1998) "Servicios a empresas y la eficacia del sistema productivo: de la
transacción a la valorización" Economía Industrial 313: 5966.
Bellini, Ν. (1988) Il sistema fieristico italiano. Il Sole, Milán.
Bhagwati, J. (1987) "International trade in services and its relevance for economic
development" in Giarini, O. (Ed.), The emerging service economy. Pergamon Press, Oxford.
Centre Français du Commerce Exterieur (1988) "L'internationalisation; un enjeu pour les
services". 2eme· Journée Nationale des Services. Centre Français du Commerce Exterieur,
Paris.
Chandler, A. (Ed.) (1981) Managerial hierarchies. Cambridge, Mass.
Chapignac, P. (1990) Les services avancés en Europe. CPE Etude No. 120. Auditech,
Montpellier.
Cockborne, JE (1995) "Professional Services in the European Union" in OECD (1995),
OECD.
Coffey, W.J; Polése, M. (1987a) "Trade and location of producer services" Environment and
PlanningA, 19/5:597611.
Coffey, W.J; Polése, M. (1987b) "Intrafirm trade in Business Services: implications for the
location of officebased activities". Papers of Regional Science Association, 61.
Coffey,W.J.; Polese, M. (1991) "Cultural barriers to the location of producer services; The
MontrealToronto rivalry and the limits of urban polarization". Canadian Journal of Regional
Services, voI.XVI, No. 3.: 433446.
Daniels, Ρ; Thrift, N.J., Leyson, A. (1989) "Internationalisation of professional producer
services: accountancy comglomerates", in Enderwick, P. (Ed.) Multinational Service Firms,
Routledge, London.
Daniels, P.W. (Ed.) (1991) Services and metropolitan development: international
perspectives. Routledge, London.
Daniels, P.W.; Moulaert F. (Eds.) (1991) 77¡e changing geography of advanced producer
services. Belhaven Press, London.
Daniels, P.W. (1993) Service industries in the world economy. Blackwell, Oxford.
77ie Internationalisation of Business Services 333
De Bandt, J. (1995) Services aux enterprises: informations, produits, richesses. Economica,
Paris.
Dearforff (1985) "Comparative advantage and international trade in services" in R.M. Stern
(Ed.) Trade and investment in Services. Ontario Economic Council.
Dunning (1993) "The internationalisation of the production of services: some general and
specific explanations" In Aharoni (Ed.) The globalisation of professional business services,
Routledge, London and New York.
European Association Of Adversiting Agencies (EAAA) (1989) Obstacles to the free flow of
adversiting and marketing communications' services in the EC. Mimeo. EAAA.
European Commision ( 1990a) Achèvement du marché intérieur: obstacles subsistants pour les
services aux entreprises. Mimeo DGIII. European Commission, Brussels.
European Commission (1985) White Book for the Internal Market. European Commission,
Brussels.
European Commission (1986) Single European Act. Supplement 2/86 European Commission,
Brussels.
European Commission (1990b) La situation et le rôle des "Business Services" dans la
Communauté Européenne. Mimeo DGIII European Commission, Brussels.
European Commission (1994a) Panorama de l'industrie communautaire ¡994. European
Commission, Luxembourg.
European Commission (1994b) A Single Market of Services. Situation at I s t July 1994
European Commission, Brussels and Luxembourg
European Commission (1996) XXV Competition Policy Report, 1995. European Commission,
Luxembourg.
European Commission (1999) Business services: internal market and public procurement.
DGXVDGIII internal document. Draft version.
Eurostat (1995) International Trade in Services, Eurostat, Luxembourg.
Francois, J.F. (1990) "Producer services, scale and the division of labour" Oxford Economic
Papers, vol 42., iss 4, oct 90. p; 715 729.
Francois, J.F. (1993) "Explaining the pattern of trade in producer services". International
Economic Journal, volume 7, No 3: 2331.
Giarini, O. (Ed.) (1987) 77¡e emerging service economy. Pergamon Press, Oxford.
Hoekman, B. and Sauvé, Ρ (1994) Liberalisazing Trade in Services. World Bank Discussion
Papers. The World Banck, Washington, D.C.
Hoolants; Horman, J. (1991) "Successful multicultural management in Europe". Journal of
European Business, 2.
Kakabadse, M. A. The General Agreement on Trade in Services: implications for Professional
and Business Services in OECD (1995), OECD.
Landesmann and Petit (1995) "International Trade in Producer Services". 77ie Service
Industries Journal, Vol. 15. No. 2: 123161.
Leysho, Daniels and Thirft (1987)
Markusen, J.R. (1989) "Trade in producer services and in other specialized intermediate
inputs". American Economic Review, 79: 8595.
Melvin, J.R. (1989) "Trade in Producer Services: a HecksherOhlin Approach". Journal of
Political Economy, 97: 11801196.
Nicolaidis, K. (1993) Mutual recognition, regulatory competition and the globalization of
professional services. In Aharoni (Ed.) Colalions and Competition: the globalization of
professional business services. Routledge, London and New York.
Noyelle, T.J; Dutka, A. (1988) International Trade in Business services. American Enterprise
Institute. Ballinger publication, Washington DC.
Nusbaumer, J. (1987a) The service economy: lever to growth. Kluwer, Boston.
334 Business Services in European Industry
Nusbaumer, J. (1987b) Services in the global market. Kluwer, Boston. - O'Farrell, P.N.; Hitchens, D.M.; Moffat, L.A.R (1993) "The competitive advantage of
business service firms: a matched pairs analysis of the relationship between generic strategy and performance. 77ie Service Industries Journal Vol. ¡3 No I: 40-64 O'Farrell, PN.; Wood, PA. (1996) "Regional Influences on Foreign Market Development by business Service Companies: American Perspectives on UK Evidence". North American Meetings of Regional Science Association International, Washinton DC, November 14-17 1996. OECD ( 1995) Liberalisation of trade in professional services OECD Documents, Paris Peat Marwick Mclintock (1988) 77ie cost of non Europe for Business Services. Research on the cost of non-Europe. Basic finding, vol 8. European Commission, Brussels and Luxembourg. Perry, M. (1990a) "Business service specialization and regional economic change". Regional Studies, 24: 195-209. Perry, M. (1990b) "The internationalisation of advertising". Geoforum, vol 22, No. / ; 35-50. Petit, P. (1994) "Formes de services at modes d'internationalisation des économies". In De Bandt J.; Gadrey, J. (Ed.) Relations de services, marchés de services. Paris, CNRS Editions. Petitbó, A. (1997) La promoción y la defensa de la competencia en las modernas economías de mercado. Mimeo, Madrid. RESER (1995) Consultancy services networks in Europe. Serdeco Editions, Aix en Provence. Riddle, D.I. (1986) Services and growth: the role of the service sector in the world development. Praeger Special Studies, New York. Roberts, J. (1999) "The internationalisation of Business Service Firms: a stages approach." The Services Industries Journal. October 1999, vol 19, No 4. Rubalcaba Bermejo, L. (1992) Las implicaciones del Acta Única Europea en los servicios prestados a las empresas. Proyecto de Investigación. Universidad de Alcalá de Henares, Madrid. Rubalcaba Bermejo, L. (1993) "La intemacionalización de los servicios a empresas" Información Comercial Española, 719: 148-167. Rubalcaba Bermejo, L. (1994) Fairs and Exhibitions in the European Economy. Eurostat, Luxembourg. Rubalcaba Bermejo, L. (1996) Los servicios a empresas en Europea: crecimiento y asimetrías. Tesis doctoral. Universidad de Alcalá, Madrid. Sapir and Lutz (1981) "Trade in services: economic determinants and development related issues". World Bank Staff Working Paper 410, Washington.
- Sauvé, P. (1995) "The long and Winding Road: NAFTA and the Professions" in OECD (1995), OECD. Schultz, S. (1985) "Protectionism in international trade in services". EAD1 Bulletin 2.85. The Economist (1996) "Trade in Services". The Economist, May 18 tn 1996. UNCTAD (1989) Services in the world economy. Trade and Development Report, 1988. United Nations, New York.

Chapter 7
Productivity in Business Services
"Productivity is not everything, but in the long term it is nearly everything"
Paul Krugman (¡990)
"The main economic priority in developed countries should be to increase productivity in intellectual work and the service sector. The country initiating this aspect will economically lead the XXI century."
Peter F. Drucker (1992)

336 Business Services in European Industry

Productivity in Business Services 337
Chapter 7 (,)
Productivity in business services
Introduction
If there is a controversial and indeed fundamental area in the analysis of service economy it is clearly productivity. Many of the economic explanations on the growth of services have been based on the evidence of relatively low productivity in the tertiary sector in comparison with the primary or secondary ones. The consequences derived from these studies are of great significance and concern at political decision-making levels. If we assume that the service sector in developed economies is increasing, it is easy to understand the implications of productivity in services within the economy as a whole. In this way, far from being faced with a subject exclusive to the field of sectoral analysis, the debate has taken on a relevant role in the study of general economic growth. If productivity is the motor of economic activity, measures to help raise it in services could contribute to the growth of the economy. However, this fundamental debate is also controversial. The key problem is methodological and conceptual. Some researchers defend the applicability of measures utilised to measure productivity in manufacturing industry and agriculture in services. Others maintain that this exercise is erroneous. There are even those who maintain that it is impossible to measure productivity within the service sector.
What is trae is that traditional measures reflect the slow growth of productivity in the service sector in general. But empirical evidence shows high relative productivity levels in some services such as telecommunications. And long term productivity decreasing trends in most services contrasts with recent recovery trends in some services. New trends therefore point to a detailed study of the productivity of service sectors. This chapter aims to contribute to the discourse by providing information on the productivity of business services.
This chapter is divided into several sections. The first aims to outline the main theoretical arguments on the well-known question of low productivity in the service
The author thanks the collaboration of Alvaro Ortiz (Servilab) in this chapter.

338 Business Services in European ¡ndustry
sector and its most relevant consequences. The second tackles the problem of measuring productivity and summarises some of the results presented by different researchers. The third section presents three measurements of productivity in business services: labour, relative and index. First, analysis of the labour productivity growth in work (the most commonly used) reflects the productive development of business services in traditional terms. Relative productivity (quotient between the percentage of value added and employment utilised by the sector) supposes an aggregate analysis of the sector in statistical and dynamic terms (if the development of this magnitude is observed over time). Finally, a microeconomic study is carried out through a multidimensional-scaling technique that proposes using productivity indices for a comparative study. Unfortunately, it is not possible to utilise other measures proposed by the best known experts in the field, such as indirect or systematic productivity. The lack of comparable data at a European level requires an in-depth research project beyond the scope of this study. This also applies to some key productivity aspects: analysis by the different business services activities, which are very heterogeneous, the study of Total Factor Productivity and Capital Productivity, or the business services impact on clients' productivity (effect on business services in increasing the total economic productivity). These concepts might have led to interesting conclusions about the real productivity in business services and its contribution to the economic growth but, unfortunately, not enough data on business services are available at the moment to present a complete approach to productivity.

Productivity in Business Services 339
7.1 Importance of productivity in the service sector.
The reasons why the service productivity is important are easy to understand. The concept becomes a key player in the economic growth of developed economies, which
' as a whole have shown a progressive intensification of the service sector reaching figures of approximately 70% of the economy. For this reason, in the long term, and given the growing participation in production and employment of the service sector within the economy as a whole, the total productivity of the economy must converge with growth rates similar to productivity rates in the service sectors. Hence affecting the living standards of the population. In addition, income from work and workers' salaries tend to follow labour productivity, hence having a direct influence on most employees in developed economies (Kendrick, 1985).
If growth in productivity in the service sector is lower than in other sectors, it can be expected that the economy will converge with the growth propelled by the main economic sector. The decrease in global economic growth can be deducted in the same way as the reduction of productivity in industry has explained the reduction of the role of the manufacturing industry as a motor of the economy (Petit, 1987). The structural changes of the economies influence the total growth of productivity factors in such a way as lower growth in advanced economies can be explained by a change to the service sector with less productivity (Raymond, 1995). However, the service sector makes the largest contribution to the convergence in the total productivity of factors in comparison to the manufacturing sector for the period 1970-1987 (Bernard and Jones, 1996). In this way, the productivity of services becomes a decisive question in order to understand the growth of economies and their processes of convergence. The positive productivity growths in the process of convergence due to services can compensate the negative effects of sectoral change on growth. The following chapter will discuss the convergence question in relation to the location of business services.
Fourastié (1952) carried out pioneering work on productivity in the service sector. He highlighted two key questions in the service economy. The strong increase in demand and the high elasticity of income in services (consequence of the application of Engel's Law) and the relatively low productivity of the service sector (explained by comparing the productivity of a hotel room in comparison with a bicycle and potatoes). As Kindleberger (1958, Economic Development) affirms, "based on the systematic differences in productivity and demand between different sectors, Fourastié obtained a systematic pattern of the variations of the exchange relationship through a projection, which favours the tertiary sector over the primary one and both of these over the secondary".
Taking up again the traditional ideas of Fourastié, Fuchs (1968) and Baumol (1967) advocated a "service revolution" and analysed the causes and consequences of the progressive importance of the sector. In both models the slow productivity of the

340 Business Services in European Industry
service sector is in fact one of the main explanations for the services growth2. For Fuchs (1968), the relatively slow growth of productivity in the service sector (with regard to the rest of the sectors) could be translated by the higher than average costs in this sector in comparison to the agricultural or manufacturing sectors. Assuming then that demand
.for services is relatively inelastic as regards price, the progressive increase in costs (including salaries) provokes a growing participation of employment in the service sector in the total employment of the economy as the process of economic expansion advances.
There is no doubt that the most important advances in the existing relationship between the progressive growth of services in the economy and its low productivity are established by Baumöl through his three studies (1967, 1985, et alt. 1985 ). Baumöl shows the difference between productivity as the result of the role that the labour factor plays in each of the activities. In the progressive sectors (identified initially with the manufacturing ones) labour represents a tool, whereas in the stagnated sectors (that the same author identifies with part of services) labour usually represents an end, in which quality is often the important element, leaving little room for the introduction of technological innovations and extreme gains in productivity. Therefore, in an economy where the salaries are fixed according to the growth of productivity (principally in the manufacturing sector), the costs in stagnated sectors are relatively speaking higher over time. If demand in these sectors is not affected by the higher relative prices (low demand elasticity price), unavoidably there will be a continuous flow of the workforce towards these sectors. Nonetheless, in other activities with high elasticity price, where demanded quantity is affected negatively by the increases in prices, the opportunities for new jobs tend to disappear. Baumöl explains in this way the progressive disappearance (except grants) of sectors such as the theatre, crafts, haute cuisine...; and the pressing problem of public services (clearly stagnated sectors) in which he foresees growing deficits "which no one should be responsible for, as they are part of a trend that nobody can stop". In another work, Baumöl (1985) creates a new classification of services in accordance with productivity, in which sectors with slow growth in productivity coexist with services with growth in productivity similar to or greater than manufacturing products. McLean (1997) proves that in Canada only a third of the service sector can be identified as being activities with slow growth in productivity whereas the rest includes sectors that show similar growth rates to (transport and storage) or even higher (telecommunications) than the manufacturing sector^.
Using a model based on a hypothesis from Baumol-Fuchs (differences in the growth of productivity) and including other variables, Fuchs estimated that during the period 1929-1965 approximately 55% of growth in employment in the service sector in the US economy was due to the differential in productivity in comparison to the manufacturing sector, whereas 14% was due to an increase in income and the remaining 31% to exogenous causes.
McLean (1997) includes business services in a group together with community and social services (sectors with slow growth in productivity) hence the high growth in the former does not emerge in his analysis.
Productivity in Business Services 341
For Hutler (1985) the dynamic growth of both sectors differs. The manufacturing goods sector has grown basically because of improvements in technical efficiency and technology (gains in productivity that will be translated into higher salary rises and
. hence in increases in the relative costs of less progressive sectors in the economy). The rapid increase in the service sector is explained by the increase in capital and labour factors. The persistence of this dynamic, together with the increasing weight of the service sector within economic activity, leads one to think that the growth rate of the economy in general will decrease, as a result of the slow growth in productivity in the service sector. Naturally, this affirmation is central to the hypothesis of the slow growth of productivity of the service sector or at least that traditional measures of productivity be adequate for the service sector.
Cuadrado and Rio (1993) summarise three basic reasons for the slow growth of productivity in services. 1) The more personal nature of services (in other words the heightened difficulty of mechanising the sector), causing an increase in the workforce in order to increase supply. 2) Technological backwardness and the difficulties of incorporating technological progress. 3) The lack of ,or non-existence of, competition in many jobs (a factor that is of greater importance in Europe than in the United States). Using a series of suppositions, Gershuny and Miles (1983) affirm that a similar or higher level of quality in services, together with a relative increase in price, implies necessarily a decrease in relative productivity in market services. De Bandt (1991) explains the lowest productivity in services through the greater difficulty of substituting labour for capital: the labour productivity growth was compensated to a greater or lesser extent by a decrease in the capital productivity growth. In business services, personnel often represents 70% of the total expenditure. Substitution can be important in leasing, transport or telecommunication services, but in the rest, despite heavy capital investment (computers mainly), productivity remains weak. This last fact introduces the so-called paradox of productivity. Empirical evidence shows that the growth rates of developed economies are quite remote from those reached previous to the oil crisis, coinciding paradoxically with the current unprecedented efforts by companies in R+D expenditure and with a stage of high technological development.
Delanauy and Gadrey (1992) indicate that even though this debate deserves more attention, three arguments can be extracted about the complex subject of the slow productivity of services. 1) Accepting the measures and classification of services, some service branches show periods of high growth in productivity (transport, communications). 2) A growing number of researchers are questioning the validity of the traditional measures of productivity used in the service sector. This fact is reinforced vis à vis the most modem services whose interaction with new technologies related to knowledge and information is higher. 3) Finally, most productivity indicators do not measure aspects that are not related to mass production, and, hence, indirect key contributions, such as customer services, product quality or secondary services, are barely explained or included by these indices.

342 Business Services in European Industry
7.2 Problems of measuring productivity.
Strictly speaking, productivity is defined as the "existing relationship between output with associated input in terms of real fiscal volume" (Kendrick, 1985). This relationship usually is expressed in the index number rates for successive periods of time4. Therefore, apart from defining the output and input units in real terms there are additional problems derived from the selection process of inputs that must be taken into account. Different measurements of productivity are obtained according to the selection of inputs.
If all the production factors are taken into account the concept used corresponds to the total factor productivity; in this case factors of capital, labour and intermediary inputs from other sectors are considered. Changes to this measurement reflect the net saving of inputs per output unit. However, at an aggregate level (sectoral or of the economy as a whole), these exchanges between sectors are cancelled out, hence the measure used is the output (in real terms) times production factors (capital and labour). This definition corresponds to what is known as Total Productivity of Factors. By referring to the productivity of any of the factors individually, the partial productivity of the factors is expressed (of the capital or labour). Hence changes to the partial productivity reflect a process of substitution between production factors.
An additional problem is the real measure of output. Normally, the value of the output in constant currency is used, in other words, corrected by the price level (although it is generally better to deflate it by the unitary costs in an analysis of productivity). If we make adjustments through the general price level we will be slanting downwards the productivity of the sectors with relatively higher price levels. For this reason we must adjust the production of each sector by its price level, reflecting moreover changes to the quality of the products from the different sectors.
De Bandt (1995) summarises the problems of measuring the productivity of services. First, there are difficulties that exist in identifying the product unit and its price. In goods, qualitative elements, aesthetics are less present than the quantitative elements, which can be referenced based on a series of technical specifications. In contrast, in services there is no specificity in the price paid: it is directed to a group of product units even hard to separate. Second, traditional measures do not take quality into account. In addition, there is an arbitrary distribution of quality regarding other components of the product. In goods quality is ignored, in services it is not, as quality is linked to price; as a consequence the growth of prices is overestimated, and productivity growth is underestimated.
The reader will observe that in the definition, no reference is made to a concept thai acquires much more relevance in services than in manufacturing, namely quality.
Productivity in Business Services 343
All these aspects lead to several alternative ways of measuring. Riddle (1986) suggests that an appropriate measure would be the maximisation of the output of acceptable quality when the total costs of the production process are minimised (quantitative and qualitative considerations are included). De Bandt (1991) proposes that the best
, measure should include indirect productivity, which the services induce in the clients (very important in business services) or even the relative productivity in percentages over the total economy, with which the productivity of many services is higher than that of other economic services. Many researchers maintain today the suitability of utilising specific productivity factors for each sector. These indicators are more appropriate for understanding the development of the productivity of each group of services than some homogenous measures. These specific ad hoc indicators are used regularly in sectors such as transport or tourism, combined with the supply of elements of demand such as number and type of passengers or travellers.
The utilisation of any of the measures (or others) mentioned above is of particular importance. The differentiation between sectors with low or high growth in productivity will vary according to the measure employed. The now classic study of the American economy by Baumöl (1985) serves as an example in which the difference between progressive sectors (with relatively high growth rates in productivity) and stagnated sectors (with lower growth rates) are established according to different productivity measures.
Taking the first productivity measure as the gross product created per person employed in the sector, three activities in the service sector were progressive, Communications, Retail and Leasing, whilst the rest formed part of the stagnated sectors. Adjusting the output by the prices of each sector, transport and communications remain within the progressive sectors, whereas if the measure used is the total productivity of factors (including labour and capital) the retail sector moves to the non-progressive sector. Finally Baumöl utilises a productivity measure that takes into account the quantity of direct and indirect work in the sector (which would explain the high growth rates in productivity of some manufacturing sectors that subcontract part of their production to other sectors including some subsectors of the service sector). In this case the business service sector becomes part of the progressive sectors together with renting and leasing. transport, communications and retail. This phenomenon is especially relevant in business services that generally represent a sector bringing productivity gains to the rest of the sectors be they manufacturing ones or services ones.
Other researchers (Elfring, 1988; De Bandt 1991) indicate that productivity should be counted in relative terms rather than absolute terms (quotient between the percentage of value added represented by the sector (GVA¡) in the economy (GVAT) and the percentage employment in the sector(N¡) brings to the total (NT).
Relative productivity = ( G V % V A T ) ' ( % )
Hence the analysis becomes spatial (although we could analyse relative productivity at
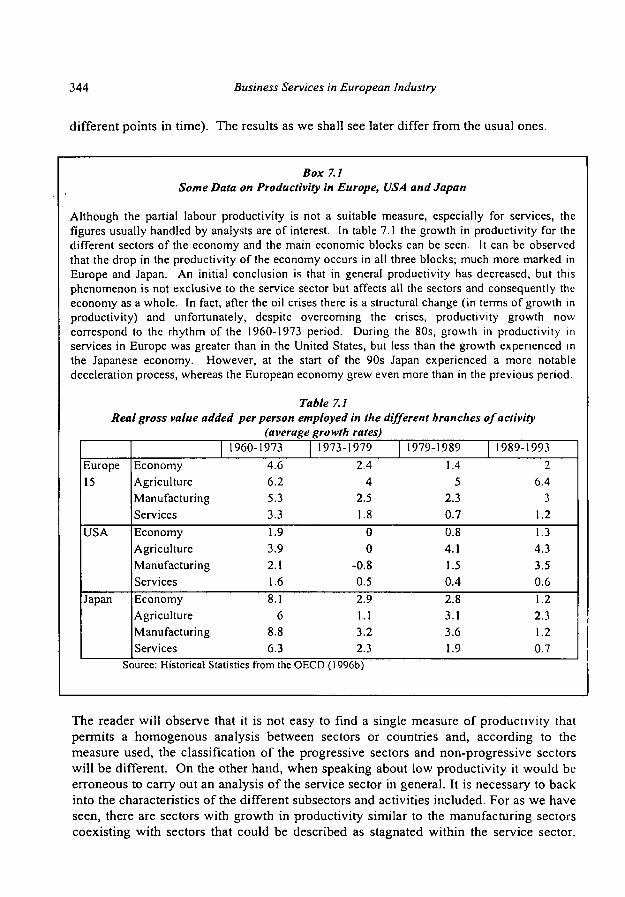
344 Business Services in European Industry
different points in time). The results as we shall see later differ from the usual ones.
Box 7.1 Some Data on Productivity in Europe, USA and Japan
Although the partial labour productivity is not a suitable measure, especially for services, the figures usually handled by analysts are of interest. In table 7.1 the growth in productivity for the different sectors of the economy and the main economic blocks can be seen. It can be observed that the drop in the productivity of the economy occurs in all three blocks; much more marked in Europe and Japan. An initial conclusion is that in general productivity has decreased, but this phenomenon is not exclusive to the service sector but affects all the sectors and consequently the economy as a whole. In fact, after the oil crises there is a structural change (in terms of growth in productivity) and unfortunately, despite overcoming the crises, productivity growth now correspond to the rhythm of the 1960-1973 period. During the 80s, growth in productivity in services in Europe was greater than in the United States, but less than the growth experienced in the Japanese economy. However, at the start of the 90s Japan experienced a more notable deceleration process, whereas the European economy grew even more than in the previous period.
Table 7.1 Real gross value added per person employed in the different branches of activity
(average growth rates)
Europe 15
USA
Japan
Economy Agriculture Manufacturing Services Economy Agriculture Manufacturing Services Economy Agriculture Manufacturing Services
1960-1973 4.6 6.2 5.3 3.3 1.9 3.9 2.1 1.6 8.1
6 8.8 6.3
1973-1979 2.4
4 2.5 1.8
0 0
-0.8 0.5 2.9 1.1 3.2 2.3
1979-1989 1.4
5 2.3 0.7 0.8 4.1 1.5 0.4 2.8 3.1 3.6 1.9
1989-1993 2
6.4 3
1.2 1.3 4.3 3.5 0.6 1.2 2.3 1.2 0.7
Source: Historical Statistics from the OECD (1996b)
The reader will observe that it is not easy to find a single measure of productivity that permits a homogenous analysis between sectors or countries and, according to the measure used, the classification of the progressive sectors and non-progressive sectors will be different. On the other hand, when speaking about low productivity it would be erroneous to carry out an analysis of the service sector in general. It is necessary to back into the characteristics of the different subsectors and activities included. For as we have seen, there are sectors with growth in productivity similar to the manufacturing sectors coexisting with sectors that could be described as stagnated within the service sector.

Productivity in Business Services 345
Hence this initial identification of the service sector as a stagnated sector is shattered in Baumol's second study (et alt., 1985), by differentiating between progressive services, stagnated services and those in asymptotic stagnancy.
.According to Baumöl (1985), progressive services are characterised by their impersonal nature, with a weak relationship between producer-consumer and a strong capacity to absorb high technology (telecommunications...). These services are characterised by high growth rates in productivity. In stagnated services (of a much more personal nature than the rest of the services), quality is closely related to production time, and the main characteristic is slow growth in productivity (medical care, education...). The third group is formed by the so-called asymptotically stagnated services that consist of a mixture of the two above. In the first stages of growth they show spectacular growth in productivity (computer services and other business services) although growth diminishes gradually as a consequence of the increase in the labour factor.
A recent report by the OECD (1997) indicates the main factors contributing to the devaluation of traditional measures used to analyse growth in productivity. First, the report highlights the problems that emerge on the input side (especially the labour factor). In this way, the labour productivity data would have failed to take into account the huge drop in the average number of hours worked by employee, which could have underestimated the growth in productivity in the 70s and 80s (Bailey and Gordon, 1988). For this reason it is recommended, when possible, to measure productivity in terms of hours more than in terms of people.
The report also highlights more serious problems in the service sector especially in the analysis of output. In this way, in sectors such as the public sector, social and personal services inputs are utilised to derive the quantity of output, so the growth in productivity inevitably converges at zero ( e.g. the health industry). A second factor is related to the qualitative changes produced by the new processes of innovation. The conventional price indices fail to capture qualitative changes, by underestimating productivity in the sectors where this process has been produced in a more or less intense way (computers, finance and insurance, business services...).
In short, all these factors (produced with greater intensity in the sector that has increased its participation in the economy the most) contribute to questioning the general drop in productivity in the developed economy as a whole over the last two decades. Moreover, the reduction in labour productivity in the service sector seems to be related to the reduction of labour productivity in general and with a different composition of the service sector, including sectors with very different regulatory natures and environments (see boxes 7.1 and 7.2).
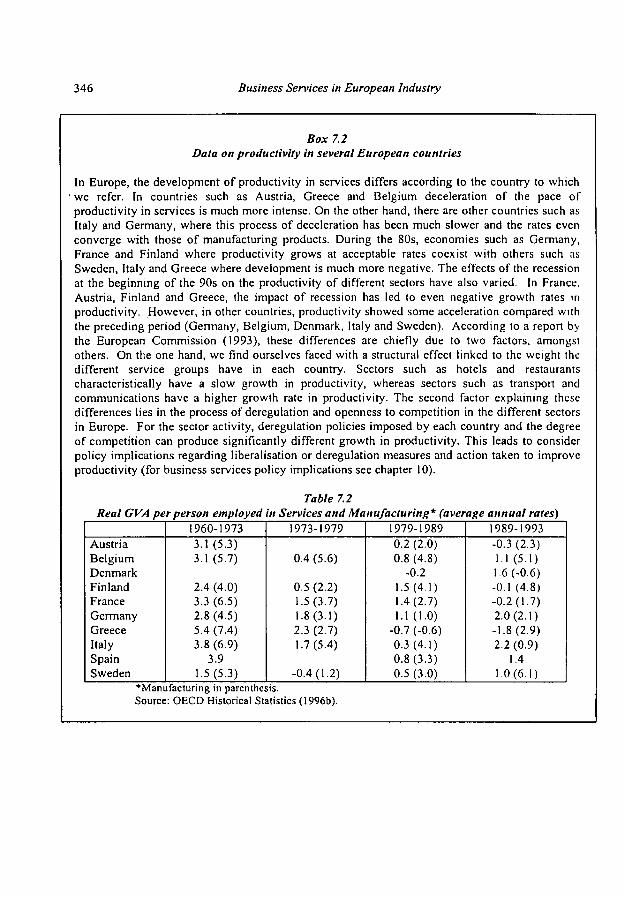
346 Business Services in European Industry
Box 7.2 Data on productivity in several European countries
In Europe, the development of productivity in services differs according to the country to which we refer. In countries such as Austria, Greece and Belgium deceleration of the pace of productivity in services is much more intense. On the other hand, there are other countries such as Italy and Germany, where this process of deceleration has been much slower and the rates even converge with those of manufacturing products. During the 80s, economies such as Germany, France and Finland where productivity grows at acceptable rates coexist with others such as Sweden, Italy and Greece where development is much more negative. The effects of the recession at the beginning of the 90s on the productivity of different sectors have also varied. In France, Austria, Finland and Greece, the impact of recession has led to even negative growth rates in productivity. However, in other countries, productivity showed some acceleration compared with the preceding period (Germany, Belgium, Denmark, Italy and Sweden). According to a report by the European Commission (1993), these differences are chiefly due to two factors, amongst others. On the one hand, we find ourselves faced with a structural effect linked to the weight the different service groups have in each country. Sectors such as hotels and restaurants characteristically have a slow growth in productivity, whereas sectors such as transport and communications have a higher growth rate in productivity. The second factor explaining these differences lies in the process of deregulation and openness to competition in the different sectors in Europe. For the sector activity, deregulation policies imposed by each country and the degree of competition can produce significantly different growth in productivity. This leads to consider policy implications regarding liberalisation or deregulation measures and action taken to improve productivity (for business services policy implications see chapter 10).
Table 7.2 Real GVA per person employed in Services and Manufacturing* (average annual rates)
Austria Belgium Denmark Finland France Germany Greece Italy Spain Sweden
1960-1973 3.1 (5.3) 3.1 (5.7)
2.4 (4.0) 3.3(6.5) 2.8 (4.5) 5.4 (7.4) 3.8(6.9)
3.9 1.5(5.3)
1973-1979
0.4(5.6)
0.5 (2.2) 1.5(3.7) 1.8(3.1) 2.3 (2.7) 1.7(5.4)
-0.4(1.2)
1979-1989 0.2 (2.0) 0.8 (4.8)
-0.2 1.5(4.1) 1.4(2.7) 1.1(1.0)
-0.7 (-0.6) 0.3 (4.1) 0.8(3.3) 0.5 (3.0)
1989-1993 -0.3 (2.3) 1.1(5.1) 1.6 (-0.6) -0.1 (4.8) -0.2(1.7) 2.0(2.1) -1.8(2.9) 2.2(0.9)
1.4 1.0(6.1)
•Manufacturing in parenthesis. Source: OECD Historical Statistics (1996b).
Productivity in Business Services 347
7.3 The productivity of business services in Europe.
This section presents the three measures of productivity mentioned for business services: labour productivity, relative productivity and index productivity. Labour productivity
' will be measured as value added per employee. Relative productivity as relative value added per relative employment (as explained section 7.2). Index productivity as a statistical index based on several productivity measures will be explained in section 7.3.3. But before this, some hypotheses about productivity in business services can be set down. First, and as indicated in Baumol's work on the North American economy, it is to be expected that business services are found, under one of the most traditional measures, within the group of services asymptotically stagnated (lower growth rates). However, according to the relative measures approach followed by De Bandt, business services could be expected to be extremely productive. According to the data of chapter 1, business services have a much higher participation in value added than in employment, so they should be relatively more productive than other sectors. Although in some countries like the United States (table 1.7 in chapter 1), growth in employment has been greater than value added, implying a halt in the growth in labour productivity in the aforementioned countries. Nonetheless, it must be stated that the tables in chapter 1 grant, in general, growth percentages of value added on average higher than employment ones in Europe. The following section will try to verify the results coming from the Baumöl approach, the De Bandt approach, and those following data analysed in chapter 1.
From a theoretical point of view, it must be pointed out that the characteristics of business services, defined in earlier chapters, exacerbate some of the problems of measuring productivity in services. The problems of quality, product valuation, intensity of labour factor, estimates, fixing and variability of prices, hours worked, qualification of employment, contexts of uncertainty and imperfect information, etc., increase and sharpen the criticisms of traditional measures of productivity applied to business services (not to mention the unsustainable suppositions on elasticity of income and price used in a traditional explanation of the low productivity in services). A consultant is productive because of the quality of the service provided and the effects it can have on his clients, because of the value added generated (from which qualitative endogenous and exogenous factors that comprise it are difficult to disassociate). Productivity will increase in parallel for the processes of learning by doing, improvements made to the organisation of the company and also the clients' expectations which are met by financing precarious markets and broadening them. In this instance, the consultant will be more productive as he contributes to improving the competitiveness of his client companies. In all these factors of inputs and outputs, traditional measures of productivity have shortcomings that are difficult to overcome. For this reason, among other statistical ones (lack of comparability, lack of detailed data splitting heterogeneous groups of activity, etc.) the three measures presented below should be approached with great caution.
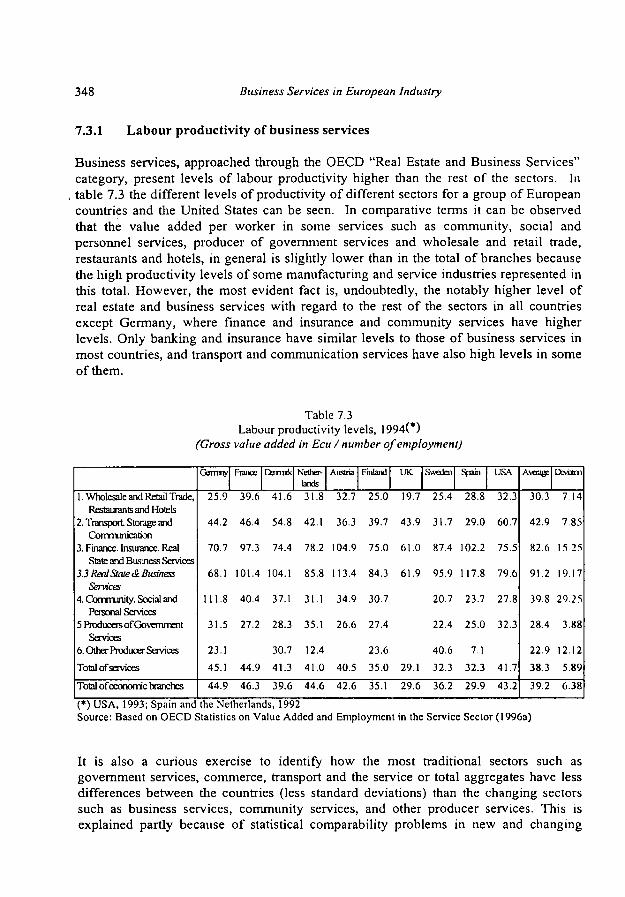
348 Business Services in European Industry
7.3.1 Labour productivity of business services
Business services, approached through the OECD "Real Estate and Business Services" category, present levels of labour productivity higher than the rest of the sectors. In table 7.3 the different levels of productivity of different sectors for a group of European countries and the United States can be seen. In comparative terms it can be observed that the value added per worker in some services such as community, social and personnel services, producer of government services and wholesale and retail trade, restaurants and hotels, in general is slightly lower than in the total of branches because the high productivity levels of some manufactaring and service industries represented in this total. However, the most evident fact is, undoubtedly, the notably higher level of real estate and business services with regard to the rest of the sectors in all countries except Germany, where finance and insurance and community services have higher levels. Only banking and insurance have similar levels to those of business services in most countries, and transport and communication services have also high levels in some of them.
Table 7.3 Labour productivity levels, 1994( )
(Gross value added in Ecu / number of employment)
1. Wholesale and Retail Trade, Restaurants and Hotels
2. Transport Storage and Communication
3. Finance. Insurance. Real State and Bus-jiess Services
3.3 Real State & Business Services
4. Community. Social and Personal Services
5 Producers of Government Services
6. Other Producer Services
Total of services
Total of economic branches
Garraiy
25.9
44.2
70.7
68.1
111.8
31.5
23.1 45.1
44.9
France
39.6
46.4
97.3
101.4
40.4
27.2
44.9
46.3
lXumk
41.6
54.8
74.4
104.1
37.1
28.3
30.7
41.3
39.6
Netherlands 31.8
42.1
78.2
85.8
31.1
35.1
12.4
41.0
44.6
Austria
32.7
36.3
104.9
113.4
34.9
26.6
40.5
42.6
Finland
25.0
39.7
75.0
84.3
30.7
27.4
23.6
35.0
35.1
UK
19.7
43.9
61.0
61.9
29.1
29.6
Sweden
25.4
31.7
87.4
95.9
20.7
22.4
40.6
32.3
36.2
Spain
28.8
29.0
102.2
117.8
23.7
25.0
7.1
32.3
29.9
USA
32.3
60.7
75.5
79.6
27.8
32.3
41.7
43.2
Average Devoni
30.3 7 14
42.9 7.85
82.6 15 25
91.2 19.17
39.8 29.25
28.4 3.88
22.9 12.12
38.3 5.89
39.2 6.38
(*) USA, 1993; Spain and the Netherlands, 1992 Source: Based on OECD Statistics on Value Added and Employment in the Service Sector (1996a)
It is also a curious exercise to identify how the most traditional sectors such as government services, commerce, transport and the service or total aggregates have less differences between the countries (less standard deviations) than the changing sectors such as business services, community services, and other producer services. This is explained partly because of statistical comparability problems in new and changing

Productivity in Business Services 349
sectors, and also partly because of very expansive markets for these services in some countries. This last hypothesis could explain why the most advanced and mature business service markets like the States or the British ones have less productivity levels than other young and expanding markets like the Spanish, Austrian or Sweden ones. In
. any case, a characteristic that should be patent in the discussion on the productivity of business services is its configuration as a sector leader at a European level in terms of productive level per worker, at least in labour terms. Of course, this conclusion must not underestimate the high differences between the high productivity levels in real estate and some advanced business services and the reduced productivity levels in many professional and traditional business services.
To make a temporary comparison, the Eurostat category "other market services" can be use even if the related concept is broader than the business services one. Comparing the development of production between 1980 and 1990, table 7.4 shows how productivity in other market services is placed amongst the highest in the service sector, together with banking and insurance, and high above the average 100 for the industry as a whole. Whilst in most branches of services productivity has decreased (in relation to average productivity =100, pushed by manufacturing and agriculture), productivity has increased slightly in business services and communications.
Table 7.4 Labour Productivity by branch of service (EUR7)
Data from 1980 and 1990 in terms of value added per employee (Labour global productivity for EUR10 =100)
Market Services Trade Tourism (hotels and accommodation) Transport Communications Finance and Insurance Business Services / Other market services Non Market Services Total (Services)
1980
117 85 61 98 118 253 161 80 105
1990
115 83 62 95 121 182 162 71 101
Change. %
-2% -2% 2% - 3 % 3%
-28% 1%
-11% -4%
Eur7 = Belgium, Denmark, Germany, France, Italy, Portugal , UK. Source: National Accounts from Eurostat. European Commission (1993a)
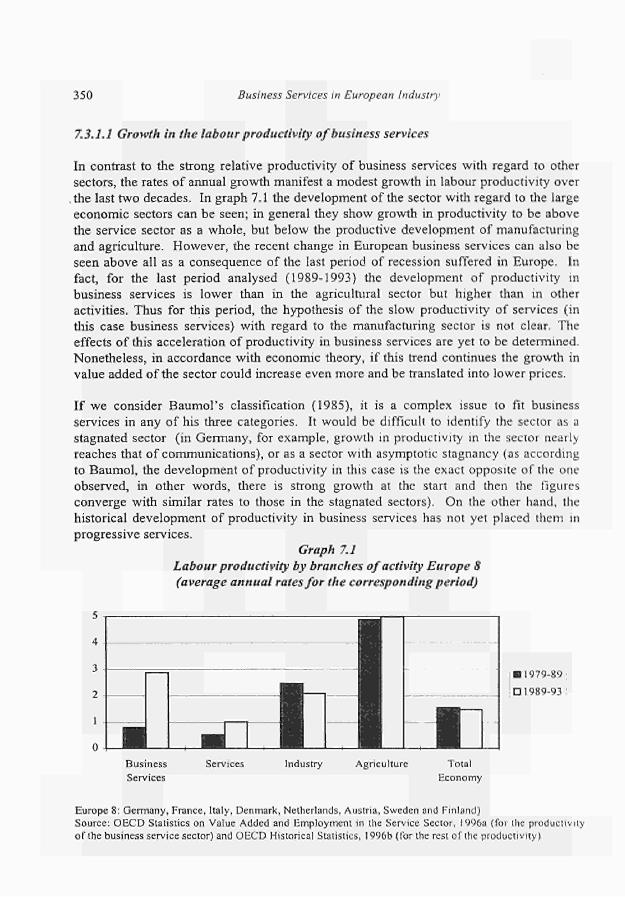
350 Business Services in European Industry
7.3.1.1 Growth in the labour productivity of business services
In contrast to the strong relative productivity of business services with regard to other
sectors, the rates of annual growth manifest a modest growth in labour productivity over
.the last two decades. In graph 7.1 the development of the sector with regard to the large
economic sectors can be seen; in general they show growth in productivity to be above
the service sector as a whole, but below the productive development of manufacturing
and agriculture. However, the recent change in European business services can also be
seen above all as a consequence of the last period of recession suffered in Europe. In
fact, for the last period analysed (19891993) the development of productivity in
business services is lower than in the agricultural sector but higher than in other
activities. Thus for this period, the hypothesis of the slow productivity of services (in
this case business services) with regard to the manufacturing sector is not clear. The
effects of this acceleration of productivity in business services are yet to be determined.
Nonetheless, in accordance with economic theory, if this trend continues the growth in
value added of the sector could increase even more and be translated into lower prices.
If we consider Baumol's classification (1985), it is a complex issue to fit business
services in any of his three categories. It would be difficult to identify the sector as a
stagnated sector (in Germany, for example, growth in productivity in the sector nearly
reaches that of communications), or as a sector with asymptotic stagnancy (as according
to Baumöl, the development of productivity in this case is the exact opposite of the one
observed, in other words, there is strong growth at the start and then the figures
converge with similar rates to those in the stagnated sectors). On the other hand, the
historical development of productivity in business services has not yet placed them in
progressive services.
Graph 7.1
Labour productivity by branches of activity Europe 8
(average annual rates for the corresponding period)
■ 197989;
□ 198993;
Industry Agriculture Total
Economy
Europe 8: Germany, France, Italy, Denmark, Netherlands, Austria, Sweden and Finland)
Source: OECD Statistics on Value Added and Employment in the Service Sector, 1996a (for the productivity
of the business service sector) and OECD Historical Statistics, 1996b (for the rest of the productivity)

Productivity in Business Services 351
In table 7.5 the long-term development of different services in Europe and the USA can be seen. As can be noted, there is asymmetrical behaviour in Europe and in the US economy. Highly productive sectors such as communications and transport coexist with other services where the development of productivity has been much slower such as finance and insurance and business services.
The fundamental explanation of the slow productivity growth in business services according to this measure seems to lie, in Europe and the USA, in the high growth rates of employment in the sector. In general, the growth rate for employment in business services doubles the rest of the services analysed. In contrast, there are sectors with greater growth in productivity, such as the communications sector, which presents growth rates in employment close to zero. This fact can also be seen at national level. Countries where development of productivity has been much slower (USA, Finland and Norway) show growth rates for employment near to, or even above 5% per annum (as had been noted in chapter 1).
Table 7.5 Growth of labour productivity in services (1970-1993)
Wholesale & Retail trade Restaurants & Hot. Transport & Storage Communications Finance & Insurance. R. S & Business Services Community, Social & Personal .Services
Europe 8 Gross V. Employment Productivity Added
2.4 0.4 2.0 0.9 1.1 -0.3 3.1 0.5 2.7 6.0 1.2 4.8 2.4 2.2 0.2 4.2 4.1 0.2 3.0 2.0 1.0
USA Gross V Added
3.7 2.4 3.1 5.3
3 3.6 2.9
Employment
2.2 1.8 1.3 0.4 2.7 5.4 3.3
Productiva}
1.5 0.6 1.8 4.9 0.3
-1.8 -0.4
Source: OECD Service Statistics on Value Added and Employment (1996a)
On the other hand, with the exception of the communications sector, business services show growth rates of value added above the rest of the sectors. Therefore, it is this balanced growth in terms of value added and employment that has, in the long term, resulted in slow growth in productivity. Germany is a clear example of this situation, with growth in value added of around 7.5% above even the communications sector.
An analysis of the development of productivity of business services by countries shows some peculiarities (graph 7.2). Of the countries analysed, Germany and Austria have high growth rates of productivity in the eighties and early nineties; their rates supersede 3% of annual growth. In contrast, France shows slow growth in productivity, which has
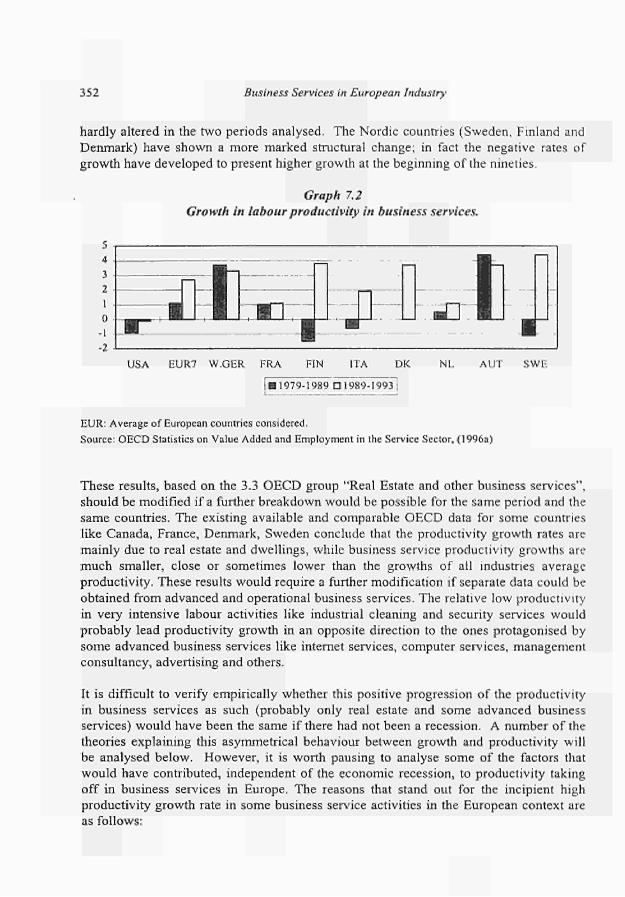
352 Business Services in European Industry
hardly altered in the two periods analysed. The Nordic countries (Sweden, Finland and Denmark) have shown a more marked structural change; in fact the negative rates of growth have developed to present higher growth at the beginning of the nineties.
Graph 7.2 Growth in labour productivity in business services.
USA EUR7 W.GER FRA FIN ITA DK NL AUT SWE
1979-1989 D 1989-1993
EUR: Average of European countries considered. Source: OECD Statistics on Value Added and Employment in the Service Sector, (1996a)
These results, based on the 3.3 OECD group "Real Estate and other business services", should be modified if a further breakdown would be possible for the same period and the same countries. The existing available and comparable OECD data for some countries like Canada, France, Denmark, Sweden conclude that the productivity growth rates are mainly due to real estate and dwellings, while business service productivity growths are much smaller, close or sometimes lower than the growths of all industries average productivity. These results would require a further modification if separate data could be obtained from advanced and operational business services. The relative low productivity in very intensive labour activities like industrial cleaning and security services would probably lead productivity growth in an opposite direction to the ones protagonised by some advanced business services like internet services, computer services, management consultancy, advertising and others.
It is difficult to verify empirically whether this positive progression of the productivity in business services as such (probably only real estate and some advanced business services) would have been the same if there had not been a recession. A number of the theories explaining this asymmetrical behaviour between growth and productivity will be analysed below. However, it is worth pausing to analyse some of the factors that would have contributed, independent of the economic recession, to productivity taking off in business services in Europe. The reasons that stand out for the incipient high productivity growth rate in some business service activities in the European context are as follows:

Productivity in Business Services 353
Some business services show a high degree of accumulation and knowledge, and the learning by doing processes, together with the development of scale, scope or organisation economies, could have started to be reflected in the first results. A high degree of work qualifications within the sector and growing specialisation that converts into a higher value added per employee than in the rest of the sectors (an effect that would not only operate in business services but also in finance, insurance and leasing). In fact, a study carried out for the G7 countries (OECD, 1997) on the growth of employment confirms that the sector with the greatest growth rates in employment is the group of finance, insurance and business services. Moreover, in many of these countries, the group of most qualified workers has been responsible for this development in employment (a phenomenon that is marked in France and Italy). Some business services show a higher degree of investment in new technologies (above all in information technology) than the rest of the sectors. This fact is evident above all in IT- services, already producing results, whereas other services are still to appear. This factor could be especially relevant in the case of Germany, the United Kingdom and United States (OECD, 1997), where growth in productivity has been higher than in other activities.
7.3.1.2 Productivity and economic cycle in business services
The anticyclical nature of productivity is an interesting aspect of the business service growth. Generally, the productivity of the labour factor with regard to the growth of the economy is procyclical. This phenomenon is explained, amongst other things, by a certain degree of rigidity in the labour market. In the expansive processes of companies they do not hire in proportion to the increases in production, utilising the labour factor much more intensively. In contrast, in recessions the drop in employment is not equivalent to the decreases in production of companies, which make it more difficult to adjust to the falling labour factor due to the rigidity of the labour market. We could interpret the parallel movements of economic growth and productivity of a sector as the result of the lack of a certain degree of labour flexibility in this activity. However, graph 7.3 shows the asymmetry of the productivity in the business service sector and economic growth. It can be observed clearly how productivity in the business service sector and the economic cycle in general, in seven European countries and for the period analysed 1979-1993, behaves in an anticyclical manner.
One of the possible explanations could be the high degree of labour flexibility in the sector, but the lack of labour flexibility in Europe prevents conclusions being drawn in this sense (see chapter 2). The following graph seems to corroborate the hypothesis of flexibility as growth in employment for the group of economies analysed and the corresponding economic growth behave in the same way, in other words they are essentially procyclical, a process that is accentuated in recent years.
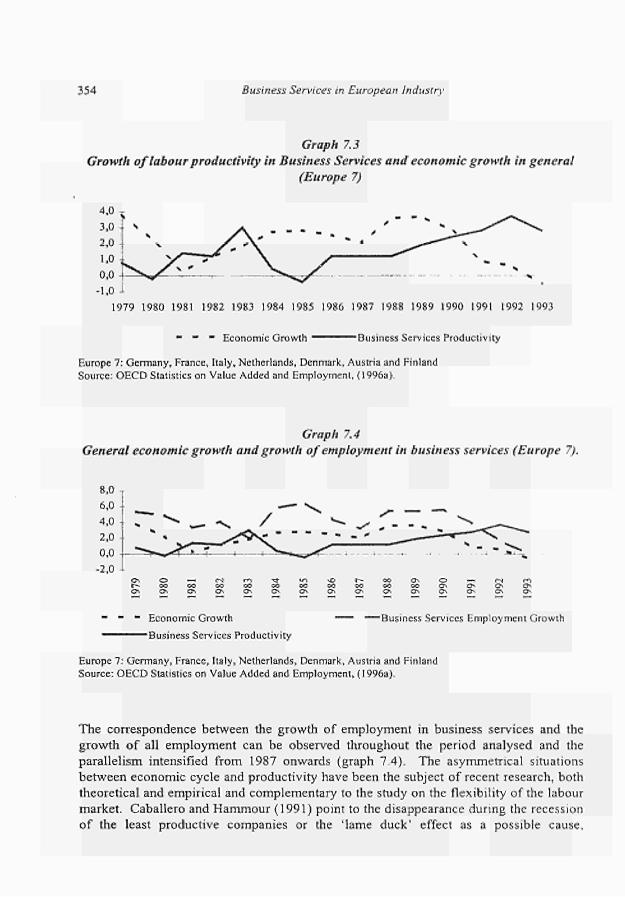
354 Business Services in European Industry
Graph 7.3
Growth of labour productivity in Business Services and economic growth in general
(Europe 7)
1979 1980 1981 1982 1983 1984 1985 1986 1987 1988 1989 1990 1991 1992 1993
Economic Growth "Business Services Productivity
Europe 7: Germany, France, Italy, Netherlands, Denmark, Austria and Finland
Source: OECD Statistics on Value Added and Employment, (1996a).
Graph 7.4
General economic growth and growth of employment in business services (Europe 7).
Economic Growth
■Business Services Productivity
■Business Services Employment Growth
Europe 7: Germany, France, Italy, Netherlands, Denmark, Austria and Finland
Source: OECD Statistics on Value Added and Employment, ( 1996a).
The correspondence between the growth of employment in business services and the
growth of all employment can be observed throughout the period analysed and the
parallelism intensified from 1987 onwards (graph 7.4). The asymmetrical situations
between economic cycle and productivity have been the subject of recent research, both
theoretical and empirical and complementary to the study on the flexibility of the labour
market. Caballero and Hammour (1991) point to the disappearance during the recession
of the least productive companies or the 'lame duck' effect as a possible cause.
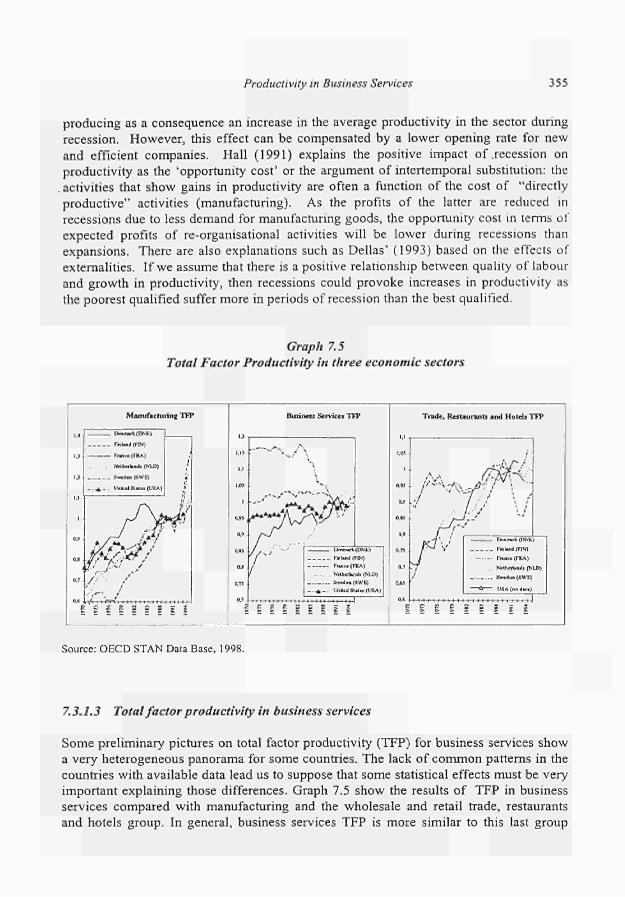
Productivity in Business Services 355
producing as a consequence an increase in the average productivity in the sector during
recession. However, this effect can be compensated by a lower opening rate for new
and efficient companies. Hall (1991) explains the positive impact of .recession on
productivity as the Opportunity cost' or the argument of intertemporal substitution: the
. activities that show gains in productivity are often a function of the cost of "directly
productive" activities (manufacturing). As the profits of the latter are reduced in
recessions due to less demand for manufacturing goods, the opportunity cost in terms of
expected profits of reorganisational activities will be lower during recessions than
expansions. There are also explanations such as Delias' (1993) based on the effects of
externalities. If we assume that there is a positive relationship between quality of labour
and growth in productivity, then recessions could provoke increases in productivity as
the poorest qualified suffer more in periods of recession than the best qualified.
Graph 7.5
Total Factor Productivity in three economic sectors
Manufacturing ΤΠ*
.,
I J
I J
1.1
1
0.9
i
0.T
M
Dcnmart (DNK)
FhUnd (FTN)
Fnnoc (FRA)
NeiherWidi (NLD)
Sw«d«a(SWQ
- . . * - . UniU«15»»lei(USA)
* , / **. ^ i * .'
(C /
I
t
J!
1 t t t t t
Ρ Γ Í Ρ s s s
Business Services TFP
us
I.l
tfii
1
<W ¡
OJ
0,15
a t
0.73
0.7
/
Ι Ι Ι Ι I Ι Μ Μ I I
Ocnnwt (DNk)
Ι Ί ι Un J t MS) Franc« (FRA) Nílheífcndi (NLD)
SwedtnfSWE}
_ . - A _ . t ¡mr J Stata <USA)
ε I
Trade, Restaurants and Hotels TFP
Λ .,
■i
7
t \ 1 h t I 1 l i t i
í
//ef·/·· af f
OcnmanfDNK)
Fnland(FIN)
Franc« (FRA)
Nïlhetluidt (NLD)
S*«dtn(SWE)
û USA (no dala)
Ε κ ε s l i
Source: OECD STAN Data Base, 1998.
7.3.1.3 Total factor productivity in busin ess services
Some preliminary pictures on total factor productivity (TFP) for business services show
a very heterogeneous panorama for some countries. The lack of common patterns in the
countries with available data lead us to suppose that some statistical effects must be very
important explaining those differences. Graph 7.5 show the results of TFP in business
services compared with manufacturing and the wholesale and retail trade, restaurants
and hotels group. In general, business services TFP is more similar to this last group
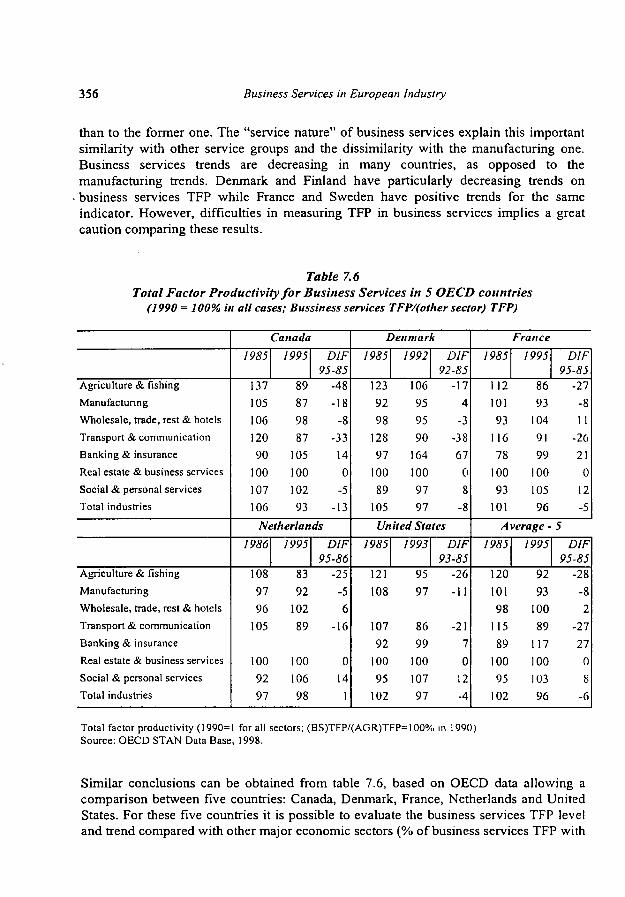
356 Business Services in European industry
than to the former one. The "service nature" of business services explain this important similarity with other service groups and the dissimilarity with the manufacturing one. Business services trends are decreasing in many countries, as opposed to the manufacturing trends. Denmark and Finland have particularly decreasing trends on business services TFP while France and Sweden have positive trends for the same indicator. However, difficulties in measuring TFP in business services implies a great caution comparing these results.
Table 7.6 Total Factor Productivity for Business Services in 5 OECD countries
(1990 = 100% in all cases; Bussiness services TFP/(other sector) TFP)
Agriculture & fishing Manufacturing Wholesale, trade, rest & hotels Transport & communication Banking & insurance Real estate & business services Social & personal services Total industries
Agriculture & fishing Manufacturing Wholesale, trade, rest & hotels Transport & communication Banking & insurance Real estate & business services Social & personal services Total industries
Canada 1985
137 105 106 120 90
100 107 106
1995
89 87 98 87
105 100 102 93
DIF 95-85
-48 -18
-8 -33 14 0
-5 -13
Netherlands 1986
108 97 96
105
100 92 97
1995
83 92
102 89
100 106 98
DIF 95-86
-25 -5 6
-16
0 14
1
Denmark 1985
123 92 98
128 97
100 89
105
1992
106 95 95 90
164 100 97 97
D1F 92-85
-17 4
-3 -38 67
0 8
-8 United States
1985
121 108
107 92
100 95
102
1993
95 97
86 99
100 107 97
DIF 93-85
-26 -11
-21 7 0
12 -4
France 1985
112 101 93
116 78
100 93
101 A
1985
120 101 98
115 89
100 95
102
1995
86 93
104 91 99
100 105 96
verage -1995
92 93
100 89
117 100 103 96
DIF 95-85
-27 -8 11
-26 21
0 12 -5
5 DIF
95-85 -28
-8 2
-27 27
0 8
-6
Total factor productivity (1990=1 for all sectors; (BS)TFP/(AGR)TFP=100% in 1990) Source: OECD STAN Data Base, 1998.
Similar conclusions can be obtained from table 7.6, based on OECD data allowing a comparison between five countries: Canada, Denmark, France, Netherlands and United States. For these five countries it is possible to evaluate the business services TFP level and trend compared with other major economic sectors (% of business services TFP with

Productivity in Business Services 357
respect to TFP in each of the sectors included; 100% indicates the same level, >100% indicates more level of TFP in business services). The table shows decreasing trends of business service TFP with respect to the total industries, except for the Netherlands. This confirms the results from the former graph and results from the former section. However, this decreasing growth for business services TFP is not the same with respect to some specific sectors. The more negative growth rate is revealed when comparisons are made with agriculture (all countries), manufacturing (specially in Canada and USA) and transport and communications (all countries). However, there are positive trends in business services TFP: with respect to banking and insurance (Denmark and France in particular), social and personal services (except Canada), and with respect to wholesale trade and hotels (in France and the Netherlands; not in Denmark or Canada).
7.3.2 Relative productivity
In the following section, the average productivity levels for different sectors and countries is shown. The use of this measure (see section 7.2) produces results that contrast with those resulting from measuring productivity by growth rates, especially for the service sector group5. The hackneyed low service productivity growth (referring to growth rates), does not imply that on relative levels, the service sector should be much less productive than the rest of the sectors (Elfring, 1988), although it does show a lower productivity level than the manufacturing sector. In the case of business services, positive rates of relative productivity can be expected.
Table 7.7 indicates the low diversion of the sectoral relative productivity of the different European countries analysed. In fact, the classification between progressive sectors (those where relative productivity is above the unit, obviously representing the relative productivity of the entire economy) and non-progressive sector is much clearer in the European context. Of the sectors analysed, manufacturing and above all business services represent the group of progressive sectors, whereas the rest of the services display relative productivity below the unit.
On the other hand, this measure allows us to easily identify the situation of each sector within the economy as a whole. In table 7.8 the European relative productivity of several services for the years 1970 and 1993 can be observed. First, it can be seen how some services show above average relative productivity for 1970 and 1993. Business services stand out particularly (including leasing), followed by finance and insurance and transport and communications. In contrast, retail trade and wholesale (in the two periods) and personal, social and community services, together with restaurants and hotels, are below the average of the sectors as a whole.
The basic measures of productivity refer to growth rates. This includes partial work productivity, the total productivity of factors (including work factor and capital) and system productivity (including quantity of direct and indirect work factor used by the sector).
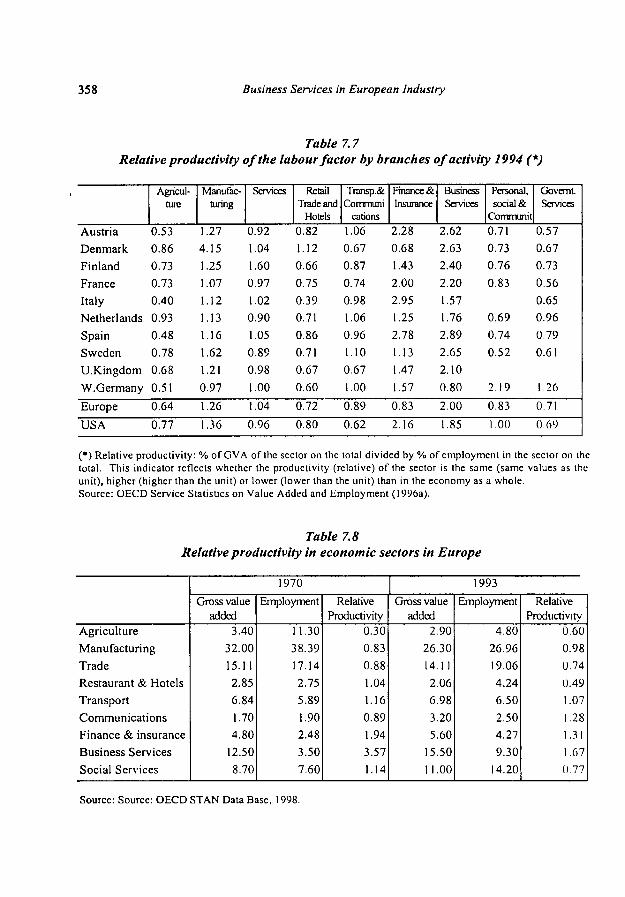
358 Business Services in European Industry
Table 7.7 Relative productivity of the labour factor by branches of activity 1994 (*)
Austria Denmark Finland
France
Italy Netherlands
Spain Sweden U.Kingdom
W.Germany
Europe
USA
Agriculture
0.53
0.86 0.73
0.73 0.40 0.93 0.48 0.78
0.68
0.51
0.64
0.77
Manufacturing
1.27 4.15
1.25 1.07 1.12 1.13
1.16 1.62
1.21
0.97
1.26
1.36
Services
0.92 1.04
1.60
0.97 1.02 0.90
1.05 0.89
0.98
1.00
1.04
0.96
Retail Trade and
Hotels 0.82 1.12
0.66
0.75 0.39 0.71 0.86
0.71 0.67
0.60
0.72
0.80
Transp.& Communi
cations 1.06 0.67
0.87 0.74
0.98 1.06 0.96
1.10 0.67
1.00
0.89
0.62
Finance & Insurance
2.28
0.68 1.43 2.00
2.95 1.25 2.78
1.13 1.47 1.57
0.83
2.16
Business Services
2.62 2.63 2.40
2.20 1.57 1.76
2.89
2.65 2.10
0.80
2.00
1.85
Personal, social &
Communit 0.71 0.73 0.76
0.83
0.69
0.74 0.52
2.19
0.83
1.00
Governi Services
0.57
0.67
0.73 0.56
0.65 0.96
0.79
0.61
1 26
0.71
0.69
(*) Relative productivity: % of GVA of the sector on the total divided by % of employment in the sector on the total. This indicator reflects whether the productivity (relative) of the sector is the same (same values as the unit), higher (higher than the unit) or lower (lower than the unit) than in the economy as a whole. Source: OECD Service Statistics on Value Added and Employment (1996a).
Table 7.8 Relative productivity in economic sectors in Europe
Agriculture Manufacturing Trade Restaurant & Hotels Transport
Communicat ions Finance & insurance Business Services
Social Services
1970
Gross value added
3.40
32.00 15.11 2.85 6.84
1.70 4.80
12.50 8.70
Employment
11.30
38.39 17.14
2.75 5.89
1.90 2.48 3.50 7.60
Relative Productivity
0.30
0.83 0.88 1.04 1.16
0.89 1.94
3.57 1.14
1993
Gross value added
2.90
26.30 14.11
2.06 6.98
3.20 5.60
15.50 11.00
Employment
4.80
26.96 19.06 4.24 6.50
2.50 4.27
9.30 14.20
Relative Productivity
0.60
0.98 0.74
0.49 1.07
1.28 1.31
1.67 0.77
Source: Source: OECD STAN Data Base, 1998.

Productivity in Business Services 359
The only sector that shows growth in relative productivity (increases in participation of value added greater than increases in employment) has been the communications group, probably due to the high degree of intensity of the capital factor existing in the sector.
. Business services, together with personal services, have decreased as a consequence of the strong increase in the participation of the work force, although this process has been more intense in personal services. However, both sectors have shown the greatest increases in production and employment of the sectors analysed. On the other hand, the increase in productivity in the agricultural sector can be seen, due to the tremendous fall in agricultural employment whereas production has remained constant.
In short, business services have manifested the highest relative productivity despite a strong reduction in recent years. Opposite trends are shown in telecommunications, about to become the sector with greatest relative productivity. The shift towards high percentages of gross value added and employment has coincided with a maturing stage, absorbing a large part of the work force and a logical reduction of relative productivity.
Again, differences should be pointed out according to the type of business service. Some estimations^ for Denmark, France, Sweden, the Netherlands and United States show that real estate has an extremely high relative productivity: around 10% (10 times more relative value added than relative employment). Some advanced services have a high relative productivity: 1.5-1.8% (computer, technical and management services). Some operational (cleaning and security) and miscellaneous services (legal, personnel and other services) have a relative low productivity: 0.5%; lower than the economic average. Unfortunately, no estimates on growth rates can be done at this detailed level.
7.3.3 Microeconomic measuring of the productivity (index) of European business services
Annex 7.1 analyses the business service sector at a European level, based on data obtained by the Pilot Survey carried out by Eurostat (1995) and the Industrial Panorama of the European Community (European Commission, 1992, 1993b, 1994). Through the Multidimensional Scaling procedure (see appendix) and after analysing the different variables related to the sector for the group of countries, an attempt will be made to identify its outstanding characteristics, from which it is hoped to identify the productivity as a synthetic measure, product of a group of significant variables in the sector. As it is not possible to carry out a year by year comparison (the Pilot Survey) has not been repeated), the analysis centres on the comparison between countries. The statistical summary of the procedure and the degree of adjustment can be seen in Box 7.3. Due to the technical level of this measure, this section will only include the main
Estimates based on: the OECD (1996) for real estate, a recent unpublished OECD report (1998) for advanced business services and, finally, Eurostat and Panorama data for the rest of business services.
360 Business Services in European Industry
conclusions. Details are offered in annexes 7.1 and 7.2.
Box 7.3 Summary of the statistical procedure for the MDS procedure
Data used. This statistical application uses data from the Eurostat Pilot Survey and from the Industrial Panorama of the EU. In total 19, variables related to employment, turnover, number of companies, productivity measures, investment, characteristics of employment, characteristics of companies and growth are included. After studying the atypical ones and ensuring the comparability of the different sources, in cases where data are not available estimates are carried out. The study embraces thirteen countries in the Union: Germany (D), Denmark (DK), Spain (E), France (F), Italy (I), Ireland (IRL), Luxembourg (L), Netherlands (NL), Portugal (P), Sweden (S), Finland (SF) and the United Kingdom (UK). 8 sectoral groups are formed: information services (INF), professional activities (PRO), marketing and sales activities (VT), technical production services (TEC), leasing of furniture goods (ALQ), selection and provision of personnel (PER), operational services (OP) and other business service activities (OT).
Design of options. The options used for the multidimensional scaling (MDS) are as follows: Matrices of disparities (one for each country) constructed ad hoc based on the Coxon distance (1982) based on the correlation coefficients; metric MDS analysis, appropriate for data of a quantitative nature, according to the algorithm of the ALSCAL programme and which can be executed on the statistical package SPSS for Windows; model of individual differences (INDSCAL) able to take negative weights; conditioned matrices; 4 dimensions taken according to the application of the Kruskal criterion; Minimum s-stress = 0.005. Maximum iterations =30. Convergence criterion = 0.001.
Statistical application and adjustment. The execution of the statistical application shows a series of results based on the following adjustment: S-stress criterion=0.287; average stress criterion (Kruskal's formula 1) = 0.194; average coefficient R 2 =0.665; Scatter plot with adequate form to prevent degenerate solutions; better adjusted countries (stress < 0.17): Germany, France, Spain, Luxembourg and Sweden; worse adjusted countries (stress > 0.24): Italy and Ireland. According to the different criteria used (for example, Young and Harris, 1988), this adjustment could be considered to be good, although not excellent. The main business services countries are well adjusted.
The procedure used permits four dimensions (or underlying variables) to be obtained for the group of countries and variables taken into account in the analysis. Each one of these underlying variables contains the group of indicators used, although with different weights of each individual indicator in each of the dimensions. The indicators and their relationship with the different dimensions can be seen in table A 7.1.
According to the statistical method, four index dimensions are obtained: productivity, spatial expansion, youth of markets and growth. The first one relates to several productivity-related variables: turnover per employee, value added per employee, investment per employee, turnover per inhabitant, and employment per number of companies, among others. Spatial expansion relates mainly to internationalisation and
Productivity in Business Services 361
number of local units. Market youth relates to turnover, employment and other volume variables. Growth relates to growth rates and market concentration rates. Regarding the position of all these four dimensions in the EU countries, these are the main conclusions:
Sweden, Germany and France have a very strong business service sector due to, above all, high productivity, great expansion and maturity of the markets. The growth and lack of growth does not affect its configurations, except in the case of France. The United Kingdom stands out in productivity artd growth. However, it is not very conditioned by spatial development or the youth of the market. Italy represents an average country in all respects and therefore it does not show a tendency towards any relevant specialisation. Spain is characterised by youth and growth. Productivity and spatial extension are not very important. The Netherlands is characterised by high productivity and youth and to a lesser extent by extension and growth. Ireland stands out because of its extreme youth and the very limited effects of productivity and growth. Portugal is only affected by productivity in a very limited way.
Adjustment of the dimensions for each country shows different "specialisations" or modes of configuring the space of business services. The statistical method resolves, hypothetically, some of the elements of the explicative dynamic of business service growth. A certain asymmetry of the large countries is verified (Germany, France and the United Kingdom) with regard to the rest, as they are the only mature markets that have based their growth fundamentally on high productivity. The small countries also usually have some positive differentiating factors, especially Sweden, the Netherlands and Luxembourg. Portugal and Ireland stand out because of their low productivity. Denmark, Italy and Finland represent countries where no differentiation is expected. Spain offers the youth of its markets as the only clear differentiating factor.
362 Business Services in European Industry
7.4 Conclusions
The analysis carried out in this chapter provides a number of relevant conclusions. First, it is clear that the analysis of productivity of services is the subject of a wide-ranging debate, especially in the field of measuring. The paucity of data and information for analysis can be added to the conceptual problems. The importance of the question is the result of the implications of productivity of the services in the current economic growth of countries.
The most recent research indicates some inconsistencies in the traditional result pointing to the low and slow productivity in services as the final word on the tertiary economy. Traditional measures and the extraordinary nature of the results have been questioned (some empirical analyses reflect the fact that the pace of productivity in Western economies has decreased in general from the 70s onwards, but this phenomenon is not exclusive to the service sector since it affects the economy as a whole). Moreover, it is paradoxical that the lowest productivity coincides with significant increases in investment in R+D and with a higher level of qualifications amongst workers. On the other hand, the existence of services displaying growth in productivity similar to or even higher than the rest of the economic sectors, like business services, raises the question of whether all services can be classified in the same way. These are the results from the three types of measurement productivity:
1) Business services and real estate have an apparent labour productivity, and possibly a real one, higher or at least similar than other large economic sectors, including the manufacturing industry. However, growth rates on productivity show decreasing trends for most countries over the last twenty years, according to the extremely strong absorption of employment. This is also confirmed by the decreasing evolution of the business services total factor productivity with respect to manufacturing, agriculture and transport and communications. This fact could lead to coming losses of the current relative high level of productivity. However, a notable acceleration is reflected from the last period of recession at a European level. Although one of the main causes of this phenomenon seems to have been the recent deceleration of the growth rate of employment in the sector, other aspects (the expected performance of information technology, an intensification of the degree of qualifications of the work force...) may have contributed to this change in the behaviour of productivity in some business services like real estate and some advanced business services. Labour market flexibility can play a role too, due to the anticyclical nature of the business service productivity.
2) Relative productivity places business services as the sector leader within the European context, although a reduction of this relative measure has been observed since 1970. Nonetheless, business services show percentages of value added and employment that are higher over time, reflecting not only the high

Productivity in Business Services 363
levels of relative productivity but also its growing importance in the European economic context. This is particularly valid for the participation of real estate and some advances business services. The relative productivity level of some operational and miscellaneous business services is much lower.
3) From the analysis carried out through the technique of Multidimensional Scaling on the group of economic variables, it can be deducted that the productivity of business services is the variable of greatest explanatory value when explaining the development of the sector in the European context. Productivity is, at the same time, the main dimension that discriminates between countries when distinguishing their national characteristics.
In short, there is a great deal of qualitative and quantitative data that shows how productivity in business services has been extraordinarily high (because of real state and some advanced business services), although decreasing in the long term (because of the great capacity of the sector to absorb employment). The latest data shows, however, a new recovery in the productivity of some business service activities since the last recession. All this strengthens business services as important factors in economic growth. Especially if we would consider that its greatest contribution lies in the gains in competitiveness and productivity, produced in the companies that use them. The contribution of business services to the Total Economy Factor Productivity through the productivity increases in resources of client companies is so important that further studies should be required for a better assessment. It is very likely that in the medium term business services will become a research laboratory in order to be able to follow economic growth in countries and a powerful policy priority sector in order to improve the global economic productivity. Policy implications can be deducted to stimulate the market conditions which could improve the productivity in business services themselves, trying to stop some decreasing trends and to reinforce the current industrial productivity gains due to the use of business services.
364 Business Services in European Industry
References
G Bailey, M and Gordon, R. (1988). "The Productivity Slowdown, Measurement Issues and the
explosion of Computer Power". Brookings Papers on Economic Activity 2, 34743 1
D Baumol, W. (1967)." Macroeconomics of unbalanced growth: The anatomy of urban crisis".
American Economic Review , June 1967 (57).
D Baumol, W. (1985). "Productivity policy in the service sector". In R. Inmann (eds). Managing
the service economy. Cambridge University Press.
O Baumol, W., Blackman, S and Wolff, N (1985). "Unbalanced growth revisited: Asymptotic
Stagnancy and new evidence". American Economic Review. September 1985.
Π Bernard, A and Jones, C. (1996). "Productivity across industries and countries: time series
theories and evidence". The review of economics and statistics: ¡35J 46
G Caballero, R. and Hammour, M. (1991)." The Cleaning effects of Recessions", NBER
Working Paper (1991).
Π Carrol, J.D; Chang, J.J (1970). "Analysis of individual differences in multidimensional scaling
via an ηway of EckartYoung decomposition". Psychometrica, 35
D Coxon (1982). "77ie User's Guide to Multidimensional Scaling". Heinemann Educational
Books.
D Cuadrado and Del Rio ( 1993). " Los servicios en España". Pirámide, Madrid
Π De Bandt, J. ( 1991 ). "Les services: productivité et prix". Economica, Paris.
Π De Bandt, J. (1995). Services aux entreprises. Economica, Paris.
D Delanauy, JC. and Gadrey, J. (1992). "Services in Economie thought". Kluwer Academic
Publishers.
D Dellas, H. (1993). " Recessions and ability Discrimination". Mimeo, University of Maryland.
Q Drucker, P. F. (1992) "The new productivity challenge". Harvard Business Review.
Q Elfring, T.(1988). "Service sector employment in Advanced Economies". Gower, Aldershot.
Π European Commission (1992). Panorama of EC Industry ¡992. European Commission,
Brussels.
D European Commission (1993a). "Market Services and European Integration". European
Commission, Brussels.
G European Commission (1993b). Panorama of EC Industry 1993. European Commission,
Brussels.
G European Commission (1994). Panorama of EC Industry ¡994. European Commission,
Luxembourg.
G Eurostat (1996) National Accounts. Eurostat, Luxembourg.
G Eurostat ( 1995) Business services in Europe. Eurostat, Luxembourg.
G Fourastié, J. ( 1952). "Le grand espoir du XXsiècle ". PUF, Paris
G Fuchs, V. (1968). "The Service Economy". Columbia University Press. New York
G Gershuny, J; Miles, I. (1983) 77ie new service economy, the transformation of employment in
industrial societies. Francis Printer, London.
Q Hall, R. (1991). Recessions and Reorganizations. NBER, Macroeconomics Annual.
G Kendrick, J. (1985)." Measurement of output and productivity in the service sector" in
Inmann, R. (eds). Managing the service economy. Cambridge University Press.
G Kindleberger ( 1958) . Economic Development
G Krugman, P. (1990). "The age of diminished expectations". The Washington Post Company

Productivity in Business Services 365
G Kruskal, J.B. ;Wish,M. ( 1978) Multidimensional Scaling. SAGE, London. G Mar Molinero, C. (1991) La relación entre las escalas multidimensionales y otras técnicas
estadísticas. Mimeo, University of Southampton April 1991, Southampton. D McLean, D. (1997)." Lagging productivity growth in the service sector: mismeasurement,
mismanagement or misinformation?. Bank of Canada. Working Paper 97-6. Q OECD (1996a). "Service statistics on Value added and Employment". OECD Publications. G OECD ( 1996b). "Historical Statistics". OECD Publications. D OECD (1997). " Technology, productivity and Job Creation". OECD Publications. G Petit, P. (1986) Slow growth and the service economy. Francis Printer, London. Q Raymond, JL (1995). "Crecimiento económico, factor residual y convergencia en los países de
la Europa Comunitaria". Papeles de Economía Española, 63 G Riddle, D.I. (1986). Service-led Growth, the role of the service sector in World Development,
New York G Schiffman, SS; Reynolds, ML; Young, F. (1981). Introduction to multidimensional scaling.
Academic Press, New York. G Young, F.W.; Harris, D.F.(1988). " Multidimensional Scaling" in Norusis, M.J./SPSS, Spss
for Windows, Professional Statistics, release 5.
366 Business Services in European Industry
Annex 7.1. Technical application of Multidimensional Scaling
The objective of multidimensional scaling (MDS) is to establish configurations reflecting the "hidden structure of data" (Kruskal and Wish, 1978), offering information that is easier to understand than the original. To do so, it establishes proximity as an intermediate step between data and the final analysis. These proximities indicate how far or near two points are, so that we can obtain spatial representations or mappings.
The main use of the MDS lies in the possibility of utilising several disparity matrices comparing between different individuals that form each matrix. The first model is called the Euclidean model, which is similar to ACP and even coincides with it under certain conditions (Mar Molinero, 1991). The second model is known as the individual differences scaling or 1NSCAL Several MDS models can be identified depending on the number of disparity matrices, the form of the matrices and the type of MDS analysis used. We find the following MDSs depending on the model: - Classic MDS: A matrix, Euclidean model (comparable to ACP). - Replicant MDS: Several matrices without differences, Euclidean model. - Weighted MDS or INSCAL: Several different matrices, Euclidean weighted model.
It is possible to distinguish between metric and non-metric models within each of these groups, depending on the disparity measures given in cardinal mode, intervals or ratios (metric) or in ordinal mode (non-metric). Moreover, the model can be analysed in each type taking into account the form of the matrix or data matrices: symmetric, asymmetric or rectangular. In our empirical case, the idea is to develop a weighted MDS with several matrices, each one of them representing a country, squared matrices, symmetric with metric data. More specifically, correlation coefficients will be used. All details concerning the application will be explained in annex 7.2.
Normalisation of weighted model
The weighted Euclidean model, also called INSCAL, of individual indifferences or "three way", is formalised in Carrol and Chang (1970). The idea is to include in the MDS analysis several S^ matrices that can be different from one another in non-monotonie non linear modes. The individuals represented in every matrix can have different perceptions of the same elements. In our case, this supposes that different countries can represent different structures of business services, having a common information structure at the same time.
We have two spaces as a result of the introduction of several different matrices: the X Space, on which the position of every element is defined. In the same way that, in ACP, the component from which the relevant variables and their projections in cases or elements are defined. When several matrices are used, A" will represent the common information shared by all the individuals on the structure of the elements. We also find the W Space, with the same dimensions, on which the position of every individual-matrix is defined in all dimensions. For every a dimension, we have a w, normalised weight, indicating the importance that the a dimension has for the
individual (country) k. These weights can vary from 0 to 1, depending on their importance. A
stretching of the axis takes place according to *J w. . for the first axis, *J w, . for the second one, and so on.

Productivity in Business Services 367
These weights represent the W space vectors where the direction indicates the importance of each
dimension. The length of the vector only indicates the degree of adjustment carried out by the
model for the individual. The longer the length, the better the adjustment is.
'The model can be shown in the following way using matrix algebra. If we have m individuals, we
will have Wj¡ weighted matrices corresponding to each individual, of r χ r order, with weights
for the individual k in the diagonal. This notation7, permits the Euclidean weighted model to be
described from
the coordinates are centred
Σ' *ia = ° &
and the weights normalised with r 2
Σ: "ka "V Ι Ί
2 where r, is the correlation coefficient between weighted Euclidean distances of the individual k, 2
D, and the matrix of disparities data of the same individual, S, .
If the personal space of an individual k is defined by the matrix X,, so that
1/2 xk = xwk [4]
then the Euclidean weighted model can be expressed as
rfijk=t^ik-V^k-V]1/2 [5]
where x., is the row i of X. , that is the Euclidean distance in the individual space of k.
The dimensions of the group space X cannot rotate, as they have their own meaning and an
This matrix Wk is not the one normally defined in scalar algebra, and defined in rectangular way, although both of them have same information. Rows wk of the scaled W are now diagonals in the new Wk scales- The elements in diagonal w, of matrix Wk, correspond to elements w, of the row k of matrix ff expressed in a scaling development. The scaling distance is defined as d¡j = [Zra wka (.ria ;cja)2 ] 1 / 2 where 0 Ω wka Ω 1 and
rA2.

368 Business Services in European Industry
orthogonal rotation of the type
Χ* = ΧΤΙΤΤ'=Τ·Τ=Ι [6]
would break the suppositions of the model, as it would have a nondiagonal W*. = TW.T'.
The MDS weighted model generates a group of m unique D, matrices, one for every S, data
matrix. Distances are calculated in a similar way to the nonweighted model, trying to make it as
similar to S, as possible. In our metric model with quantitative data, this means a problem of
squared minima.
¡k{S)=Dk2 + Ek [7]
that is resolved for η χ r matrices of A" coordinates, for the m diagonals matrices r x r W, and for
the m transformations /, . The solution seeks to minimise the sum of all the squared elements in
error matrices E, . The measures of goodness of adjustment are the same as those that existed for
the MDS nonweighted. It must be pointed out that the stability of the dimensions depends on the
goodness of adjustment and the variation of weights. A perfect fit without variations in the
weights would permit complete stability. Further to this, the perfect adjustment is the result of
having a sstress and a Kruskal stress near to zero, and a multiple correlation coefficient with a
value of 1. The scatter plot must be a straight and compact line, as if it was disperse, skewed or
with simple geometric groupings, it would indicate degenerated solutions, in which the optimum
has not been reached. The long distances are better adjusted than the small ones by forming the
algorithm that optimises the sstress.
The fundamental equation takes the form:
V=
VD
k2 + £
k t«!
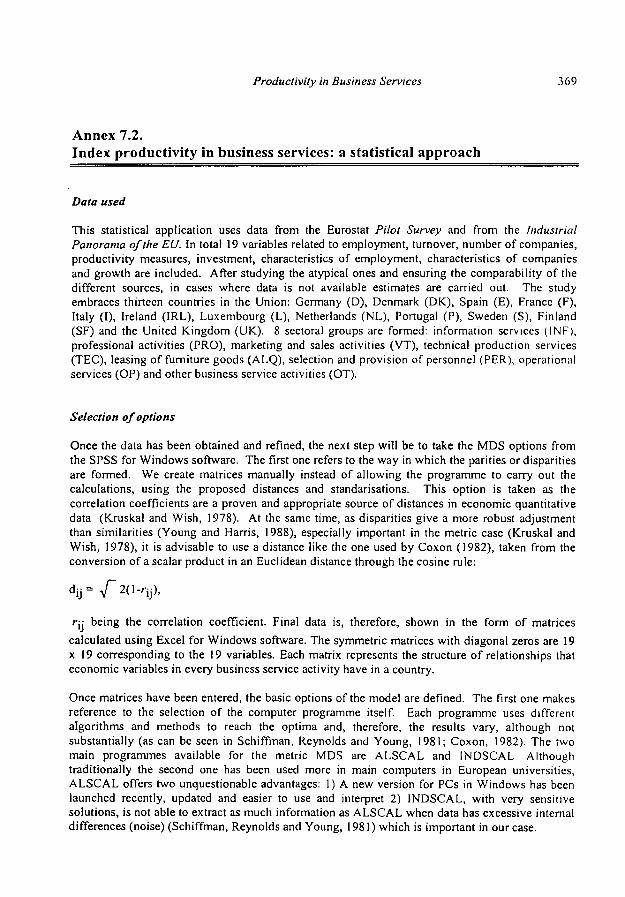
Productivity in Business Services 369
Annex 7.2. Index productivity in business services: a statistical approach
Data used
This statistical application uses data from the Eurostat Pilot Survey and from the Industrial Panorama of the EU. In total 19 variables related to employment, turnover, number of companies, productivity measures, investment, characteristics of employment, characteristics of companies and growth are included. After studying the atypical ones and ensuring the comparability of the different sources, in cases where data is not available estimates are carried out. The study embraces thirteen countries in the Union: Germany (D), Denmark (DK), Spain (E), France (F), Italy (I), Ireland (IRL), Luxembourg (L), Netherlands (NL), Portugal (P), Sweden (S), Finland (SF) and the United Kingdom (UK). 8 sectoral groups are formed: information services (INF), professional activities (PRO), marketing and sales activities (VT), technical production services (TEC), leasing of furniture goods (ALQ), selection and provision of personnel (PER), operational services (OP) and other business service activities (OT).
Selection of options
Once the data has been obtained and refined, the next step will be to take the MDS options from the SPSS for Windows software. The first one refers to the way in which the parities or disparities are formed. We create matrices manually instead of allowing the programme to carry out the calculations, using the proposed distances and standarisations. This option is taken as the correlation coefficients are a proven and appropriate source of distances in economic quantitative data (Kruskal and Wish, 1978). At the same time, as disparities give a more robust adjustment than similarities (Young and Harris, 1988), especially important in the metric case (Kruskal and Wish, 1978), it is advisable to use a distance like the one used by Coxon (1982), taken from the conversion of a scalar product in an Euclidean distance through the cosine rule:
dij=7"2(1- ψ ry being the correlation coefficient. Final data is, therefore, shown in the form of matrices
calculated using Excel for Windows software. The symmetric matrices with diagonal zeros are 19 χ 19 corresponding to the 19 variables. Each matrix represents the structure of relationships that economic variables in every business service activity have in a country.
Once matrices have been entered, the basic options of the model are defined. The first one makes reference to the selection of the computer programme itself. Each programme uses different algorithms and methods to reach the optima and, therefore, the results vary, although not substantially (as can be seen in Schiffman, Reynolds and Young, 1981; Coxon, 1982). The two main programmes available for the metric MDS are ALSCAL and INDSCAL Although traditionally the second one has been used more in main computers in European universities, ALSCAL offers two unquestionable advantages: 1) A new version for PCs in Windows has been launched recently, updated and easier to use and interpret 2) INDSCAL, with very sensitive solutions, is not able to extract as much information as ALSCAL when data has excessive internal differences (noise) (Schiffman, Reynolds and Young, 1981) which is important in our case.
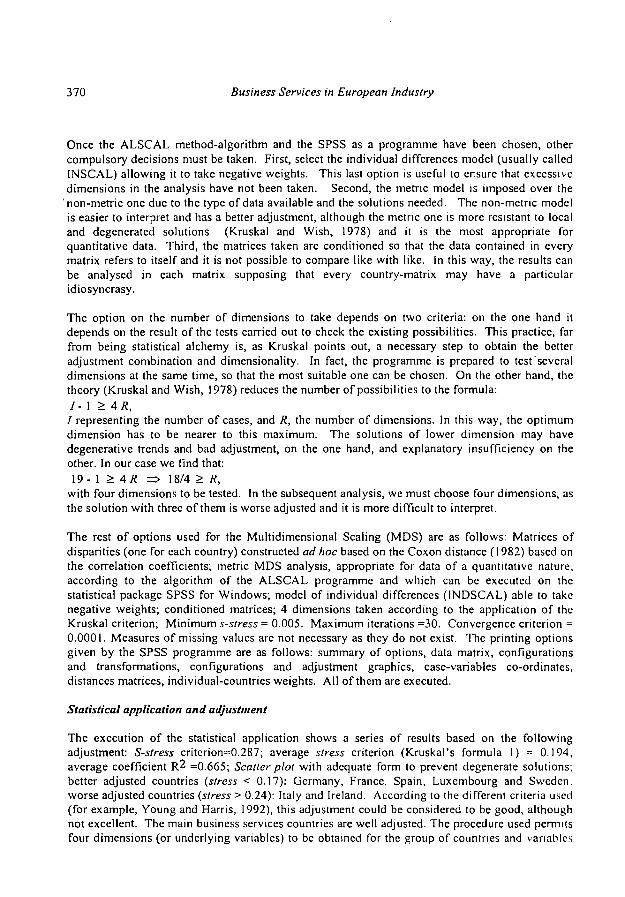
370 Business Services in European Industry
Once the ALSCAL method-algorithm and the SPSS as a programme have been chosen, other compulsory decisions must be taken. First, select the individual differences model (usually called INSCAL) allowing it to take negative weights. This last option is useful to ensure that excessive dimensions in the analysis have not been taken. Second, the metric model is imposed over the
'non-metric one due to the type of data available and the solutions needed. The non-metric model is easier to interpret and has a better adjustment, although the metric one is more resistant to local and degenerated solutions (Kruskal and Wish, 1978) and it is the most appropriate for quantitative data. Third, the matrices taken are conditioned so that the data contained in every matrix refers to itself and it is not possible to compare like with like. In this way, the results can be analysed in each matrix supposing that every country-matrix may have a particular idiosyncrasy.
The option on the number of dimensions to take depends on two criteria: on the one hand it depends on the result of the tests carried out to check the existing possibilities. This practice, far from being statistical alchemy is, as Kruskal points out, a necessary step to obtain the better adjustment combination and dimensionality. In fact, the programme is prepared to test'several dimensions at the same time, so that the most suitable one can be chosen. On the other hand, the theory (Kruskal and Wish, 1978) reduces the number of possibilities to the formula: 7-1 > AR,
ƒ representing the number of cases, and R, the number of dimensions. In this way, the optimum dimension has to be nearer to this maximum. The solutions of lower dimension may have degenerative trends and bad adjustment, on the one hand, and explanatory insufficiency on the other. In our case we find that: 19- 1 > AR => 18/4 > R,
with four dimensions to be tested. In the subsequent analysis, we must choose four dimensions, as the solution with three of them is worse adjusted and it is more difficult to interpret.
The rest of options used for the Multidimensional Scaling (MDS) are as follows: Matrices of disparities (one for each country) constructed ad hoc based on the Coxon distance (1982) based on the correlation coefficients; metric MDS analysis, appropriate for data of a quantitative nature, according to the algorithm of the ALSCAL programme and which can be executed on the statistical package SPSS for Windows; model of individual differences (INDSCAL) able to take negative weights; conditioned matrices; 4 dimensions taken according to the application of the Kruskal criterion; Minimum s-stress = 0.005. Maximum iterations =30. Convergence criterion = 0.0001. Measures of missing values are not necessary as they do not exist. The printing options given by the SPSS programme are as follows: summary of options, data matrix, configurations and transformations, configurations and adjustment graphics, case-variables co-ordinates, distances matrices, individual-countries weights. All of them are executed.
Statistical application and adjustment
The execution of the statistical application shows a series of results based on the following adjustment: S-stress criterion=0.287; average stress criterion (Kruskal's formula I) = 0.194, average coefficient R2 =0.665; Scatter plot with adequate form to prevent degenerate solutions; better adjusted countries (stress < 0.17): Germany, France, Spain, Luxembourg and Sweden; worse adjusted countries (stress > 0.24): Italy and Ireland. According to the different criteria used (for example, Young and Harris, 1992), this adjustment could be considered to be good, although not excellent. The main business services countries are well adjusted. The procedure used permits four dimensions (or underlying variables) to be obtained for the group of countries and variables
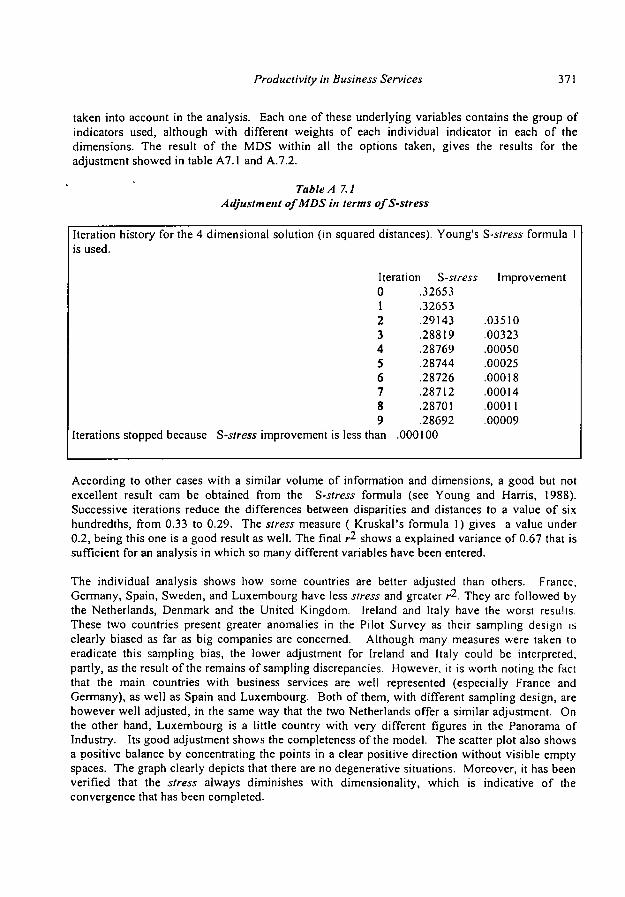
Productivity in Business Services 371
taken into account in the analysis. Each one of these underlying variables contains the group of indicators used, although with different weights of each individual indicator in each of the dimensions. The result of the MDS within all the options taken, gives the results for the adjustment showed in table A7.1 and A.7.2.
Table A 7.1 Adjustment of MDS in terms of S-stress
Iteration history for the 4 dimensional solution (in squared distances). Young's is used.
Iteration S-stress 0 1 2 3 4 5 6 7 8 9
Iterations stopped because S-stress improvement is less than
.32653
.32653
.29143
.28819
.28769
.28744
.28726
.28712
.28701
.28692 .000100
S-stress formula 1
Improvement
.03510
.00323
.00050
.00025
.00018
.00014
.00011
.00009
According to other cases with a similar volume of information and dimensions, a good but not excellent result cam be obtained from the S-stress formula (see Young and Harris, 1988). Successive iterations reduce the differences between disparities and distances to a value of six hundredths, from 0.33 to 0.29. The stress measure ( Kruskal's formula 1 ) gives a value under 0.2, being this one is a good result as well. The final r 2 shows a explained variance of 0.67 that is sufficient for an analysis in which so many different variables have been entered.
The individual analysis shows how some countries are better adjusted than others. France, Germany, Spain, Sweden, and Luxembourg have less stress and greater r2 . They arc followed by the Netherlands, Denmark and the United Kingdom. Ireland and Italy have the worst results. These two countries present greater anomalies in the Pilot Survey as their sampling design is clearly biased as far as big companies are concerned. Although many measures were taken to eradicate this sampling bias, the lower adjustment for Ireland and Italy could be interpreted, partly, as the result of the remains of sampling discrepancies. However, it is worth noting the fact that the main countries with business services are well represented (especially France and Germany), as well as Spain and Luxembourg. Both of them, with different sampling design, are however well adjusted, in the same way that the two Netherlands offer a similar adjustment. On the other hand, Luxembourg is a little country with very different figures in the Panorama of Industry. Its good adjustment shows the completeness of the model. The scatter plot also shows a positive balance by concentrating the points in a clear positive direction without visible empty spaces. The graph clearly depicts that there are no degenerative situations. Moreover, it has been verified that the stress always diminishes with dimensionality, which is indicative of the convergence that has been completed.
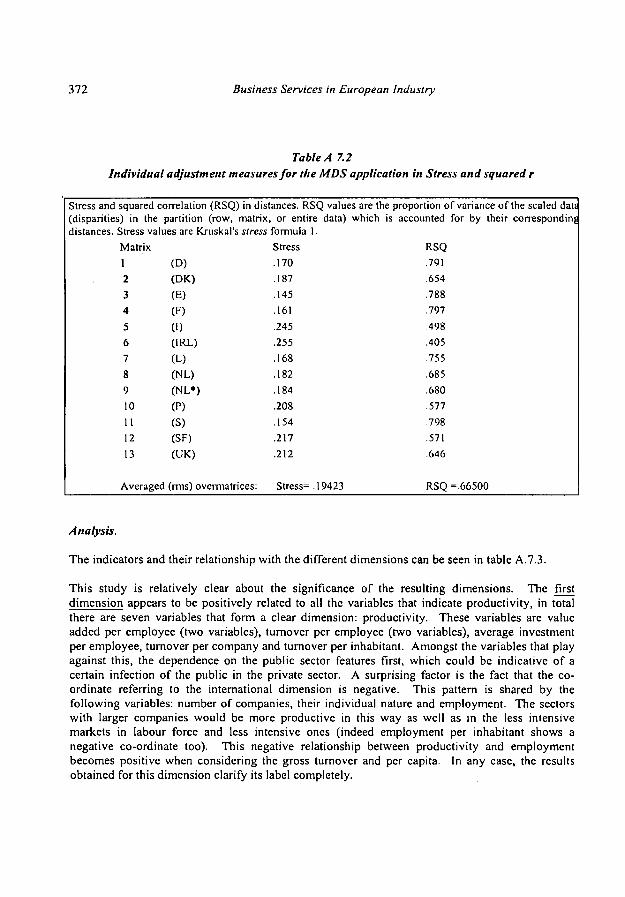
372 Business Services in European industry
Table A 7.2 Individual adjustment measures for the MDS application in Stress and squared r
Stress and squared correlation (RSQ) in distances. RSQ values are the proportion of variance of the scaled dat« (disparities) in the partition (row, matrix, or entire data) which is accounted for by their corresponding distances. Stress values are Kruskal's stress formula 1.
RSQ .791 .654 .788 .797 .498 .405 .755 .685 .680 .577 .798 .571 .646
Averaged (rms) overmatrices: Stress= .19423 RSQ = 66500
Matrix 1 2 3 4 5 6 7 8 9 10 11 12 13
(D) (DK) (E) (F) (I) (IRL) (L) (NL) (NL*)
(P) (S) (SF) (UK)
Stres .170 .187 .145 .161 .245 .255 .168 .182 .184 .208 .154 .217 .212
Analysis.
The indicators and their relationship with the different dimensions can be seen in table A.7.3.
This study is relatively clear about the significance of the resulting dimensions. The first dimension appears to be positively related to all the variables that indicate productivity, in total there are seven variables that form a clear dimension: productivity. These variables are value added per employee (two variables), turnover per employee (two variables), average investment per employee, turnover per company and turnover per inhabitant. Amongst the variables that play against this, the dependence on the public sector features first, which could be indicative of a certain infection of the public in the private sector. A surprising factor is the fact that the coordinate referring to the international dimension is negative. This pattern is shared by the following variables: number of companies, their individual nature and employment. The sectors with larger companies would be more productive in this way as well as in the less intensive markets in labour force and less intensive ones (indeed employment per inhabitant shows a negative co-ordinate too). This negative relationship between productivity and employment becomes positive when considering the gross turnover and per capita. In any case, the results obtained for this dimension clarify its label completely.
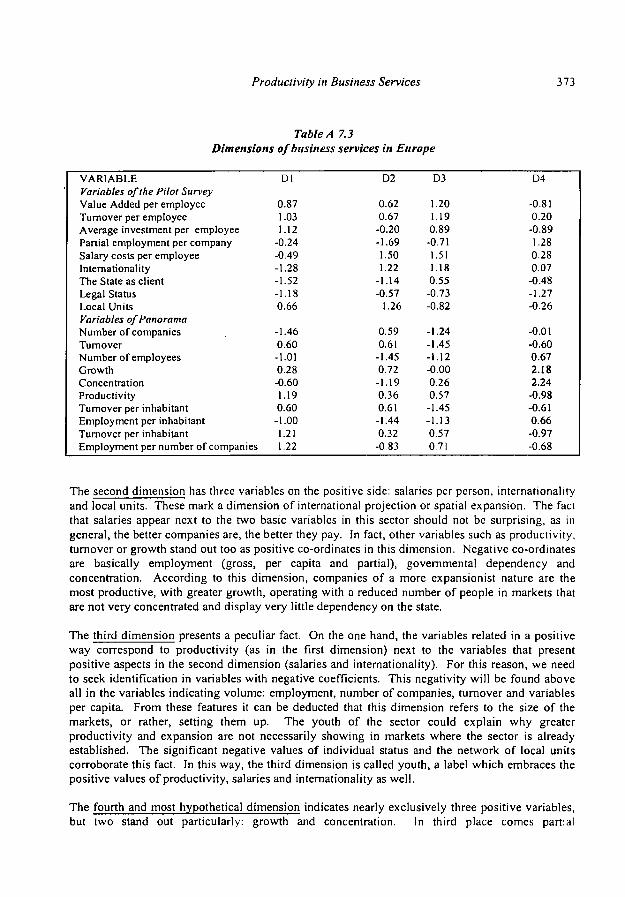
Productivity in Business Services 373
Table A 7.3 Dimensions of business services in Europe
VARIABLE Variables of the Pilot Survey Value Added per employee Turnover per employee Average investment per employee Partial employment per company Salary costs per employee Internationality The State as client Legal Status Local Units Variables of Panorama Number of companies Turnover Number of employees Growth Concentration Productivity Turnover per inhabitant Employment per inhabitant Turnover per inhabitant Employment per number of companies
Dl
0.87 1.03 1.12
-0.24 -0.49 -1.28 -1.52 -1.18 0.66
-1.46 0.60 -1.01 0.28 -0.60 1.19 0.60
-1.00 1.21 1.22
D2
0.62 0.67 -0.20 -1.69 1.50 1.22
-1.14 -0.57
1.26
0.59 0.61
-1.45 0.72
-1.19 0.36 0.61
-1.44 0.32
-0.83
D3
1.20 1.19 0.89
-0.71 1.51 1.18 0.55
-0.73 -0.82
-1.24 -1.45 -1.12 -0.00 0.26 0.57 -1.45 -1.13 0.57 0.71
D4
-0.81 0.20
-0.89 1.28 0.28 0.07
-0.48 -1.27 -0.26
-0.01 -0.60 0.67 2.18 2.24
-0.98 -0.61 0.66
-0.97 -0.68
The second dimension has three variables on the positive side: salaries per person, internationality and local units. These mark a dimension of international projection or spatial expansion. The fact that salaries appear next to the two basic variables in this sector should not be surprising, as in general, the better companies are, the better they pay. In fact, other variables such as productivity, turnover or growth stand out too as positive co-ordinates in this dimension. Negative co-ordinates are basically employment (gross, per capita and partial), governmental dependency and concentration. According to this dimension, companies of a more expansionist nature are the most productive, with greater growth, operating with a reduced number of people in markets that are not very concentrated and display very little dependency on the state.
The third dimension presents a peculiar fact. On the one hand, the variables related in a positive way correspond to productivity (as in the first dimension) next to the variables that present positive aspects in the second dimension (salaries and internationality). For this reason, we need to seek identification in variables with negative coefficients. This negativity will be found above all in the variables indicating volume: employment, number of companies, turnover and variables per capita. From these features it can be deducted that this dimension refers to the size of the markets, or rather, setting them up. The youth of the sector could explain why greater productivity and expansion are not necessarily showing in markets where the sector is already established. The significant negative values of individual status and the network of local units corroborate this fact. In this way, the third dimension is called youth, a label which embraces the positive values of productivity, salaries and internationality as well.
The fourth and most hypothetical dimension indicates nearly exclusively three positive variables, but two stand out particularly: growth and concentration. In third place comes partial
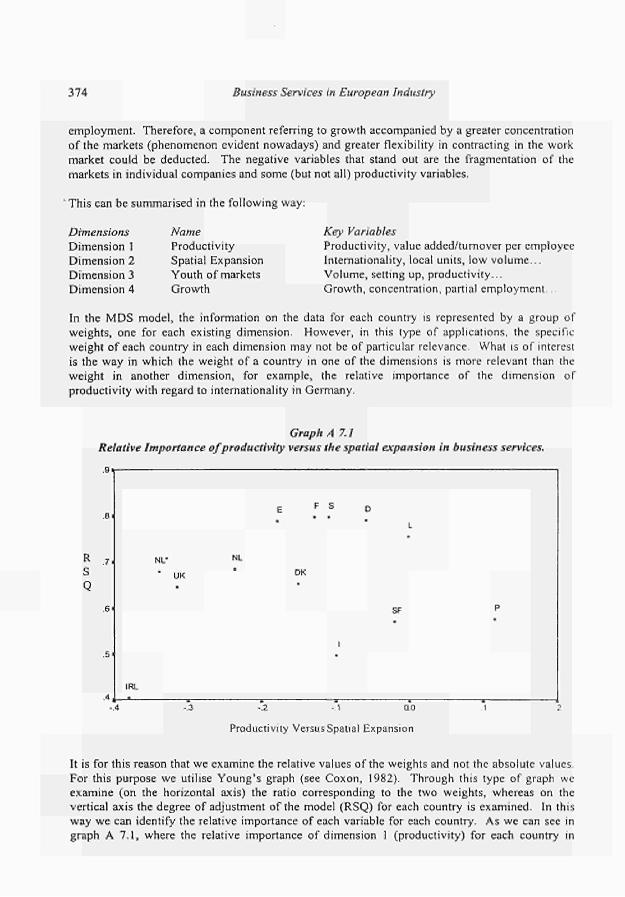
374 Business Services in European Industry
employment. Therefore, a component referring to growth accompanied by a greater concentration of the markets (phenomenon evident nowadays) and greater flexibility in contracting in the work market could be deducted. The negative variables that stand out are the fragmentation of the markets in individual companies and some (but not all) productivity variables.
' This can be summarised in the following way:
Dimensions Dimension 1 Dimension 2 Dimension 3 Dimension 4
Name Productivity Spatial Expansion Youth of markets Growth
Key Variables Productivity, value added/tumover per employee Internationality, local units, low volume... Volume, setting up, productivity... Growth, concentration, partial employment..
In the MDS model, the information on the data for each country is represented by a group of weights, one for each existing dimension. However, in this type of applications, the specific weight of each country in each dimension may not be of particular relevance. What is of interest is the way in which the weight of a country in one of the dimensions is more relevant than the weight in another dimension, for example, the relative importance of the dimension of productivity with regard to internationality in Germany.
Graph A 7.1 Relative Importance of productivity versus the spatial expansion in business services.
R S Q
-.2 -.1 0.0
Productivity Versus Spatial Expansion
It is for this reason that we examine the relative values of the weights and not the absolute values. For this purpose we utilise Young's graph (see Coxon, 1982). Through this type of graph we examine (on the horizontal axis) the ratio corresponding to the two weights, whereas on the vertical axis the degree of adjustment of the model (RSQ) for each country is examined. In this way we can identify the relative importance of each variable for each country. As we can see in graph A 7.1, where the relative importance of dimension 1 (productivity) for each country in
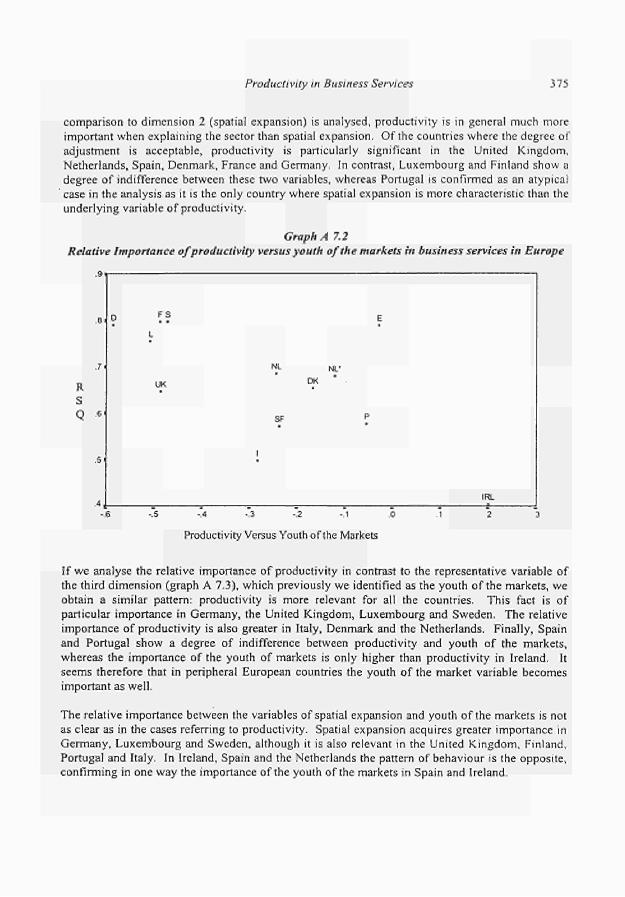
Productivity in Business Services 375
comparison to dimension 2 (spatial expansion) is analysed, productivity is in general much more important when explaining the sector than spatial expansion. Of the countries where the degree of adjustment is acceptable, productivity is particularly significant in the United Kingdom. Netherlands, Spain, Denmark, France and Germany. In contrast, Luxembourg and Finland show a degree of indifference between these two variables, whereas Portugal is confirmed as an atypical
' case in the analysis as it is the only country where spatial expansion is more characteristic than the underlying variable of productivity.
Graph A 7.2 Relative Importance of productivity versus youth of the markets in business services in Europe
-.A -.3 -.2 -.1 .0
Productivity Versus Youth of the Markets
If we analyse the relative importance of productivity in contrast to the representative variable of the third dimension (graph A 7.3), which previously we identified as the youth of the markets, we obtain a similar pattern: productivity is more relevant for all the countries. This fact is of particular importance in Germany, the United Kingdom, Luxembourg and Sweden. The relative importance of productivity is also greater in Italy, Denmark and the Netherlands. Finally, Spain and Portugal show a degree of indifference between productivity and youth of the markets, whereas the importance of the youth of markets is only higher than productivity in Ireland. It seems therefore that in peripheral European countries the youth of the market variable becomes important as well.
The relative importance between the variables of spatial expansion and youth of the markets is not as clear as in the cases referring to productivity. Spatial expansion acquires greater importance in Germany, Luxembourg and Sweden, although it is also relevant in the United Kingdom, Finland, Portugal and Italy. In Ireland, Spain and the Netherlands the pattern of behaviour is the opposite, confirming in one way the importance of the youth of the markets in Spain and Ireland.
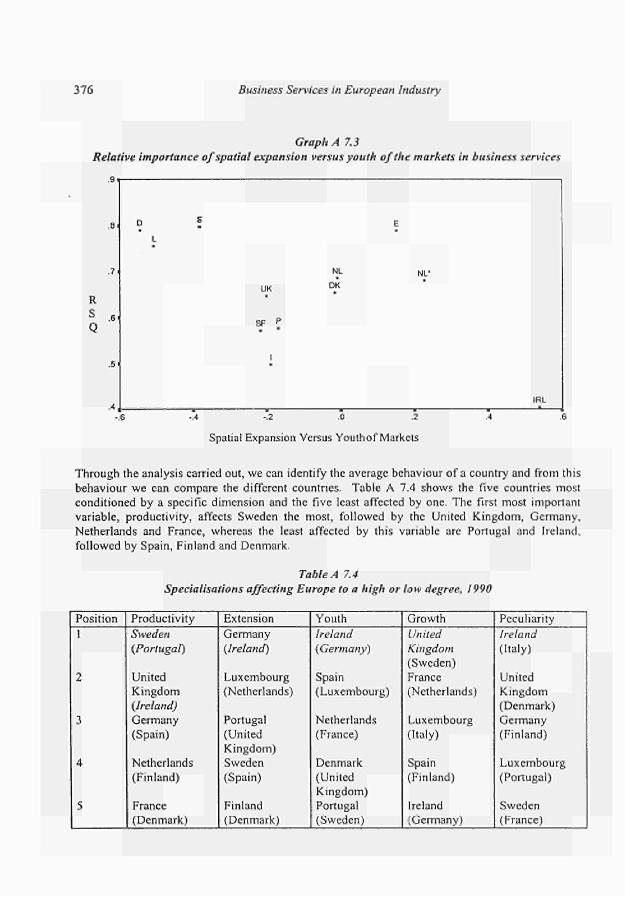
376 Business Services in European Industry
Graph A 7.3
Relative importance of spatial expansion versus youth of the markets in business services
R
S
Q
. 9 .
.8
. 7 .
. 6 '
.5
·<
D
L
ε
UK ■
sr Ρ
ι
NL
DK
E
NL" ■
IRL
-.6 -.4 -.2 .0 .2
Spatial Expansion Versus Youth of Markets
Through the analysis carried out, we can identify the average behaviour of a country and from this
behaviour we can compare the different countries. Table A 7.4 shows the five countries most
conditioned by a specific dimension and the five least affected by one. The first most important
variable, productivity, affects Sweden the most, followed by the United Kingdom, Germany,
Netherlands and France, whereas the least affected by this variable are Portugal and Ireland,
followed by Spain, Finland and Denmark.
Table A 7.4
Specialisations affecting Europe to a high or low degree, 1990
Position
1
2
3
4
5
Productivity
Sweden
(Portugal)
United
Kingdom
(Ireland)
Germany
(Spain)
Netherlands
(Finland)
France
(Denmark)
Extension
Germany
(Ireland)
Luxembourg
(Netherlands)
Portugal
(United
Kingdom)
Sweden
(Spain)
Finland
(Denmark)
Youth
Ireland
(Germany)
Spain
(Luxembourg)
Netherlands
(France)
Denmark
(United
Kingdom)
Portugal
(Sweden)
Growth
United
Kingdom
(Sweden)
France
(Netherlands)
Luxembourg
(Italy)
Spain
(Finland)
Ireland
(Germany)
Peculiarity
Ireland
(Italy)
United
Kingdom
(Denmark)
Germany
(Finland)
Luxembourg
(Portugal)
Sweden
(France)
Productivity in Business Services 377
Main results
The following points form part of the final conclusions:
1. The MDS analysis is shown to be adequate for the study of business services at a European level. The information that appears not to be connected, or has an obvious correlation has shown that it is of much more interest than was expected initially. A synthetic measure of relative productivity has been obtained based on the indicators most sensitive to the concept of productivity. Apart from the descriptive information, it has been possible to identify some explanatory elements on growth as regards the fact that each country adopts a different position making them stand out from the average.
2. The MDS shows relationships between the variables that determine a map, which includes the dimensions that define the behaviour of business services. Adjustment of the four dimensions reached fits statistical rigour and the interest pursued. The final variables identified are as follows: productivity (variables of profitability per person), spatial extension (variables of internationality and local units), youth (variables of volume and setting up) and growth (variables of growth and concentration of markets). The order of these dimensions goes from the most relevant (productivity) to the least relevant (growth).
3. Adjustment of the dimensions for each country shows different "specialisations" or modes of configuring the space of business services. The MDS resolves, hypothetically, some of the elements of the explanatory dynamic of growth. A certain asymmetry of the large countries is verified (Germany, France and the United Kingdom) with regard to the rest, as they are the only mature markets that have based their growth fundamentally on high productivity. The small countries also usually have some positive differentiating factors, especially Sweden, the Netherlands and Luxembourg. Portugal and Ireland stand out because of their low productivity. Denmark, Italy and Finland represent countries where no differentiation is expected. Spain offers the youth of its markets as the only clear differentiating factor.
4. The fact that the power of the large countries in business services is based on productivity rather than on other variables is coherent with the central thesis on the contribution of the sector to the economic development and importance of productivity in the business service economy.

378 Business Services in European industry
Chapter 8
The Location of Business Services in Europe
"Service activities are becoming a target of regional development policies, due to the recognition that many of them, especially producer services, today have a directly or indirectly basic character. A number of measures may increase the regional supply of services, but it is equally important to support the demand for producer services, as well as the functioning of the often rather opaque regional service market."
Sven Illeris (1996. page 143). The Service Economy. A Geographical Approach

380 Business Services in European Industry
77ie Location of Business Services in Europe 381
Chapter 8 The Location of Business Services in Europe
Introduction
Internationalisation generates movement, and movement generates the concentration phenomena. As Europe becomes more and more integrated and companies begin to benefit from this integration, the EU can be considered to be only one large region of regions where companies operate at an international level. Concentration processes of economic and entrepreneurial activity cannot only be regarded form a national point of view. They are more and more international. Even though the most representative cases of this process are provided by manufacturing companies, it is trae that some services are also absorbed in this dynamic. Even European processes are not only European, they relate to world-wide changes. As a consequence, internationalisation of services is one of the prevailing lines of research in the world of services (see amongst others: Bhagwati, 1987; Nusbaumer, 1987; Enderwick, 1989; Dicken, 1992; Ruane, 1993; Daniels, 1993), and the international trends in professional services have been dealt with (from the pioneering work of Noyelle and Dutka, 1988, to Aharoni, 1993 or the discussion on barriers and liberalisation found in the OECD, 1995).
Business services stand out from other services as the most dynamic group of activities of recent years, they have registered the greatest growth in terms of value added and employment. Although the majority of business services are currently very localised, the requirements for internationality are growing, imposed to a large extent by international clients and the need to compete. Internationalisation in business services is registered by the presence of large multinationals in the sector. The movements of the Big 6 -today Big 5- in the world of consulting, of the large advertising agencies and the multinationals in the security activity are prime examples of this. Multinational companies, retaining a local base and autonomy, lay down strategies at an international level and privilege the markets in which they perceive greater business potential. In this sense, the concentration of business services at an international level can be explained in part by the movements of large multinationals, whether they maintain hierarchical structures from the international head office, or if they simply aim to repeat the service in different offices. The SMEs can also be affected by these phenomena, as, despite the
382 Business Services in European Industry
multiple niche markets, the processes of globalisation are forcing them to adopt competitive strategies and policies of collaboration networks '.
The fact that there are international strategies in the world of business services does not explain fully their possible concentration. It is evident that European economies are different, with varying degrees of economic development and disparate socio-economic organisation. The concentration of services in a specific country can be due to the particular economic situation rather than to deliberate expansion by companies. Moreover, there are barriers limiting international movements between countries. Although die greatest obstacles to international trade are economic, intrasectorial or cultural rather than of a legal nature (see chapter 6), it is true that these obstacles reduce choice within an international context. For example, the problems of imperfect and asymmetric information mean that many niche markets that constitute the organisational base of many companies persist, thus acting as genuine entry barriers. Anyway, it is evident that business services, which are increasingly dynamic, do not have to be concentrated uniformly throughout the European economic territory. It can be supposed that some countries will concentrate on some activities more than others and some will be more advanced than others.
The previous two chapters have illustrated several questions affecting the location and concentration of services. Chapter 6 indicated the trends towards internationalisation, albeit within economic, legal and cultural limits preventing business service markets from being as integrated as those in other sectors. Chapter 7 has shown how the most developed countries in Europe also have a high level of productivity in their business services.
Chapter 8 starts with a summary of the main theories on the location of business services. It is possible to set up an analogy at an international level between the theories of location developed at a regional or urban level. Concentration, agglomeration economies, decentralisation, etc., developed in the regional economy are concepts that are gaining greater importance at an international scale. The main factors of location, dislocation and differentiation by type of services are examined in order to show the regional logic underlying the international movement of business services. Clearly, the regional logic differs in part from the one that exists at an international level. At a regional level it makes much more sense to study the location of companies in areas that share some urban characteristics (lifestyle, proximity to client, presence of civil service, etc.), which are of far less importance at an international level. On the contrary, the level of economic income can explain international concentration better than if it were to
There are numerous references showing examples of the role of multinationals in the processes of internationalisation (see for example Daniels, 1993 and Aharoni, 1993). There are also references, albeit fewer in number, illustrating the entrance of SMEs in foreign markets, for example O'Farrell and Wood (1996) on trade between the United States and the United Kingdom, or Rubalcaba (1996) for companies in the Madrid region.
The Location of Business Services in Europe 383
be applied at an urban level. In any case, the analogy is useful as will be demonstrated shortly. For example, the location of a national company in a city in which there is a highly qualified labour market can be copied by a multinational which decides to invest heavily in countries where this kind of labour market exists.
For this reason, this chapter proposes to study the concentration of business services in Europe, departing from the business service location factors at local, regional and international levels. The international point of view constitutes the core part of chapter 8, involving an empirical work. This comes from the expected verification of two main hypotheses:
1 ) as business services are linked to the most innovative trends of economic change, they tend to be distributed in correlation with the economic development of the countries and 2) as business services are very heterogeneous and can behave very differently according to the type of activity and country they operate in, the most productive or profitable services will tend to be concentrated in either the most developed countries, or where productivity is highest (this attempts to be fully complementary to chapter 7 results). Indubitably, these two hypotheses do not cover all the possible explanations about the location and concentration of business services. These two have been selected and above others because they are the only ones that can be contrasted empirically using the available data2.
The data used here come from two sources: the only survey on business services that exists for Europe, carried out by Eurostat in 1990-91, and published in 1995, and the data from the annual report "Panorama of the EU Industry", referring to the same period. The first source provides relative data on labour productivity, cost-effectiveness per worker or international presence, amongst other concepts. The second source permits the evaluation of the magnitude of the different activities in each country with the basic variables of employment, turnover and number of companies. In this analysis, the technique of principal components (PCA) will be used to extract from the many variables available in the first source, a single measure of productivity-cost-effectiveness3 and from the variables of the second source, a representative size index.
For a much more detailed analysis referring specifically to the location of services, data and information on aspects such as the ones indicated by Marshall and Wood (1995) is needed: 1) Accessibility and proximity to each other; 2) Good physical access to customer ; 3) Accessible transport facilities; 4) A competitive market environment; 5) High-quality telecommunication infrastructure; 6) High-quality labour; 7) Ample number of clerical and administrative workers. 8) Sites accessible and attractive to staff; 9) Supply of suitable quality office accommodation 10) High-quality urban environment, including cultural, social and shopping facilities. In order to make this index, as will be shown in section 3, variables such as turnover per worker, value added per worker or investment per worker are taken into account. To simplify this, from now onwards we call this measurement of productivity, mindful that this concept has a stricter definition, admitting different forms of measurement and the conceptual problems that occur when referring to service activities.

3 84 Business Services in European Industry
The adoption of size indices and cost-effectiveness in labour, instead of taking the original variables, is justified by the difficulty of choosing an absolute representative measure of a relative concept and by the need to reduce the strong statistical deviations that appear in many of the individual variables. The statistical indices provide a more reliable measure of the concepts of size and productivity-cost-effectiveness that we wish to transmit.4
After focusing on the dynamics of business services concentration and location, the following sections cover the verification or refutation of the two main hypotheses set down earlier. In the first, the relationship between business services and national economic levels will be studied, while in the second we will attempt to verify the second hypothesis, namely, the possible relationship between countries, service activities and productivity. The chapter ends with some brief conclusions.
Several aspects relating to the statistical treatment and development not dealt with in this paper appear in detail in Rubalcaba (1996).
The Location of Business Services in Europe 385
8.1 Dynamics of business service location
The majority of empirical studies carried out shows the trend for business services supply to be concentrated in high income regions and geographical locations and, above all, in large cities. It has even been verified that in big cities, business services choose certain districts near to the head offices of main industrial companies and ministries, government offices or regional governments. In the favoured areas, this concentration of business services generates a highly competitive space for services, making a comparison between services and price reduction possible. Although there are trends towards decentralisation, the concentration of business services seems to be predominant. Many business services are drawn towards financial and administrative centres creating differences between post-industrial areas and deindustrialised areas, as Marshall, Damesick and Wood (1987) show in the case of Britain or Cuadrado and Del Rio (1993) in Spain. There are very few cities interconnected at the highest level in the urban hierarchy that forms the global economy of services (Daniels, 1993). The concentration of business services in big cities is greater than in other sectors (Coffey and Polése, 1987), although there are variations according to the type of service.
8.1.1 Location factors
The reasons for this concentration can be found in several factors, many of which are based on the classic location forces set down by Moulaert and Gallouj (1993): transport costs, labour costs and agglomeration (built-up external) economies, related to carrying out scale economies for a company, location economies for all companies and development economies at the level of economic size, population, income or wealth. In fact, there are many different factors. Marshall and Wood (1995) list ten (see footnote number 2) including supply and demand aspects (e.g., proximity, infrastructure, labour markets). The range of location factors is very broad and the emphasis on certain aspects depends on the approach adopted. For instance: cost factors or client location (traditional theories), ranking of the city in the international urban hierarchy and relative specialisation of the subsystem (Senn, 1993), labour qualifications and innovation of the service (Barò and Soy, 1993), training and educational level of the region (Hansen, 1990), industrial characteristics of the area (Cuadrado and Rubalcaba, 1993), creation of collaboration networks or the limits of agglomeration economies (Moulaert and Gallouj, 1993). The theory of producer service location has even been modelised, as the Coffey-Polèse model show (see a summary in Bailly, Coffey, Paelinck and Polése, 1992, chapter 2). The total production cost for a given bundle of producer services is depending on the output level, the units of information-intensive services in man-hours, the units of skilled management and professional labour in man-hours, the unit cost per man-hour in the form of wages, commissions, and other, the communication cost per unit, including transaction and opportunity costs, and the recruitment costs per unit. These are considered the basic variables to optimise the choice of office location.
Many of all these location factors require a reformulation of the simple applications found in the Christaller model (1933) in which location is fixed according to the client

386 Business Services in European Industry
and transport costs, giving prominence to central locations. Although the theory is still of some interest as it highlights the proximity factor (Ellger, 1997), new factors exist. The location of business services is more complex because of the interactions between industry, economic structures and the presence of multinationals (Illeris and Philippe,
. 1993). The presence of collaboration networks changes the ways of doing things (May, 1994), regardless of whether they are hierarchical networks (pyramidal division of labour organised by head office or powerful partner) or clone (with no division of labour).
The nature of the service is decisive in many of these factors. Their personalised nature requires face to face meetings for which relative proximity between suppliers and clients is necessary. This is not as important in other sectors. In the same way, the high switching cost (replacing one supplier with another) also explains why the client and supplier work together. Uncertainty and imperfect information associated with services argues for the need to locate in a privileged and prestigious area. Big cities minimise the risk of introducing a new market and encourage the "follow the leader" effect (Daniels, 1993). They also serve to enter into the flow of information that enables companies to make the most of international markets.
Therefore, there is an association between a series of factors that define the specific agglomeration economy of business services. The following can be considered to be the most important twelve locational factors according to the demand, supply and market requirements:
Demand factors 1- The consideration of an area as a business centre, linked to image and prestige
of a country, region or district within a city. 2- The access to clients and to the information for potential clients. 3- The economic base/foundation of the region or city. 4- The highest economic income of the place, region or country and the
international nature of these geographical spaces.
Supply factors 5- The quantity and quality of production factors and, human capital in particular.. 6- Infrastructure for transport and communications. 7- The physical proximity of the service suppliers to residential areas. 8- Cost of living, land and renting. 9- Urban and regional environment, and cultural and social facilities.
Market factors 10- The personalised nature of services and the standardisation degree. 11- The context of uncertainty and the switching costs (more important in narrow
markets). 12- The presence of multinationals
77ie Location of Business Services in Europe 387
The traditional cost factors are less important than those associated with demand, markets or advanced factor supply costs. For example, it has been verified that the cost of land is low on the list of priorities when a company decides to locate in one place or another; it acts as a restriction or impediment but never represents an insurmountable
.obstacle when other advantageous factors exist. At a regional level, suppliers seek a central location. Occasionally, specific functions can be decentralised and located in back-offices in areas outside the city centre and high rent areas. However, this practice has greater limits in services than in industry, because services have no big factories and they are not extensive technical capital oriented. For this reason, the process of geographical decentralisation must be approached with caution in business services, particularly in most labour intensive ones. Moreover, many suppliers in the sector only have one office, as the size of companies is generally small and does not allow for subdivisions. For example, it would be difficult to locate the average legal office or computer services company in an area far away from the clients and sources of information. This applies for many business services but not for very routine activities (renting, security, etc.) or for very advanced business service activities (ITC, consultancy, etc.).
As indicated in the introduction, some of these more studied locational factors cannot be translated into an international level; they are only useful at urban level, not regional, national or international ones. However, there are other factors affecting expressly the international location of business services. The level of economic income, marginal productivity, levels of internationalisation of the economies, existence of trade barriers and mobility of factors, level and pace of convergence between countries are particularly relevant in this respect. Simple economic logic presupposes a greater concentration in more advanced countries, with large marginal productivity, heavy presence of multinationals, freedom of movement and fast pace of convergence between countries. Some of these processes can explain, at least in part, international differences in the business service economy as will be discussed in points 8.3 and 8.4.
In short, the spatial concentration of business services is a clear differentiating factor, requiring the utmost attention. The concentration in some areas and countries means that other areas or countries do not have the same opportunities and their business service markets are much narrower. In outlying areas and weaker regions and countries, business service markets will have little diversification in supply, there will be serious problems of imperfect information and difficulties in the provision of advanced services. Highly qualified professionals only use these narrow areas to offer traditional services that are necessary or obligatory. There is no doubt that the benefits that can be gained by business services in non-central areas are necessarily much lower than those obtained in central countries, regions or cities. They are obliged to do without these services and import them from central areas.
388 Business Services in European Industry
8.1.2 Decentralisation factors
All these elements force us to rethink the future of business services in less-developed countries or regions. Although increases in income are a draw in these places, the possibility that business services could be the cause and not only the consequence of economic development makes us consider the promotion of certain activities that naturally go to these markets. In this sense, political determination to help outlying regions or countries must take into account the three phenomena that encourage déconcentration the most:
1. Attaining position income that could be generated by locating in areas with a better standard of living, environmental conditions and closeness to centres of interest for professional services (for example, universities). This income is relative to what could be found in a concentrated area and the limits on agglomeration economies affected by factors such as cost of floor space, traffic, and pollution etc are discounted from the calculation.
2. The incorporation of new technologies meaning that a service can be carried out at a distance and encouraging decentralisation. Information technology and communications do away with a priori many technical difficulties for location in an area that is not concentrated, the same technology sometimes produces the opposite effect, acting as a tool to attract the information centre and real or potential contacts. This ambivalence of technology must be taken into account when attempting to decentralise services. This phenomenon varies enormously depending on the sub-sector of activity, regions or countries and the specific nature of the business considered.
3. Transport and travelling costs have decreased considerably in recent years; thus the space in which one remains close to clients has grown. However, the decrease in travelling costs is compensated partly by greater time costs in a society that increasingly values the creation of business and leisure opportunities. For this reason this factor encourages dislocation only if the accessibility and standard of transport reduces time and makes it more convenient.
These three factors are causing services to move to different spatial levels. For instance, the changes to the location of clients, improvements to infrastructures and environmental problems explain the movement from the centre to the outskirts of Milan (Airoldi, Janerti, Gambardella, Senn, 1997). These factors also appear in the trends towards decentralisation in the suburbs of London (Marshall, Wood, 1995). The Madrid case also reveals the importance of environmental and high quality residential areas for some peripheral business service location in the North and the lack of supplies in the South, despite the fact that the Southern part of Madrid is very industrialised with a lot of manufacturing companies (Rubalcaba et alt, 1998).
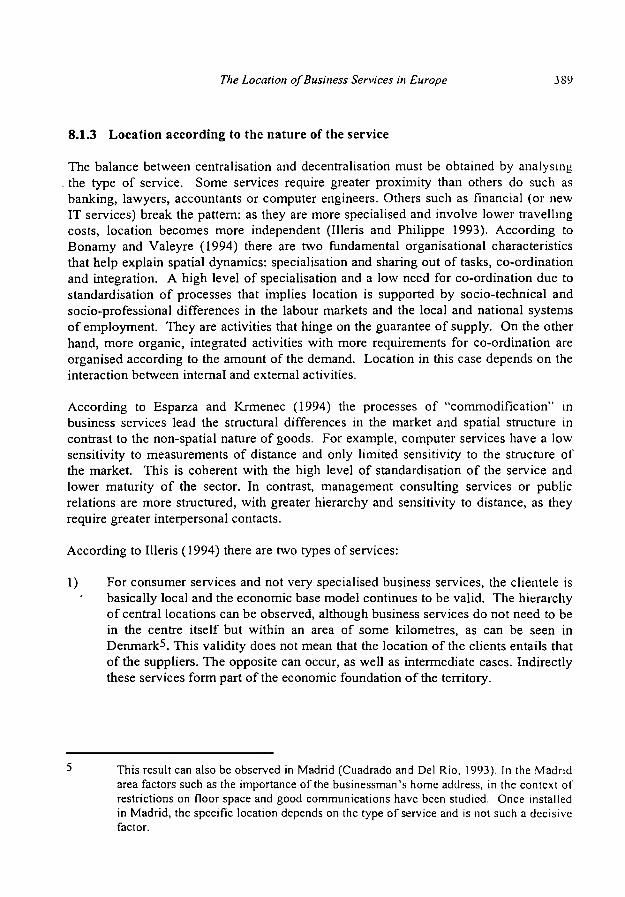
77ie Location of Business Services in Europe 389
8.1.3 Location according to the nature of the service
The balance between centralisation and decentralisation must be obtained by analysing . the type of service. Some services require greater proximity than others do such as banking, lawyers, accountants or computer engineers. Others such as financial (or new IT services) break the pattern: as they are more specialised and involve lower travelling costs, location becomes more independent (Illeris and Philippe 1993). According to Bonamy and Valeyre (1994) there are two fundamental organisational characteristics that help explain spatial dynamics: specialisation and sharing out of tasks, co-ordination and integration. A high level of specialisation and a low need for co-ordination due to standardisation of processes that implies location is supported by socio-technical and socio-professional differences in the labour markets and the local and national systems of employment. They are activities that hinge on the guarantee of supply. On the other hand, more organic, integrated activities with more requirements for co-ordination are organised according to the amount of the demand. Location in this case depends on the interaction between internal and external activities.
According to Esparza and Krmenec (1994) the processes of "commodification" in business services lead the structural differences in the market and spatial structure in contrast to the non-spatial nature of goods. For example, computer services have a low sensitivity to measurements of distance and only limited sensitivity to the structure of the market. This is coherent with the high level of standardisation of the service and lower maturity of the sector. In contrast, management consulting services or public relations are more structured, with greater hierarchy and sensitivity to distance, as they require greater interpersonal contacts.
According to Illeris (1994) there are two types of services:
1) For consumer services and not very specialised business services, the clientele is basically local and the economic base model continues to be valid. The hierarchy of central locations can be observed, although business services do not need to be in the centre itself but within an area of some kilometres, as can be seen in DenmarkS. This validity does not mean that the location of the clients entails that of the suppliers. The opposite can occur, as well as intermediate cases. Indirectly these services form part of the economic foundation of the territory.
This result can also be observed in Madrid (Cuadrado and Del Rio, 1993). In the Madrid area factors such as the importance of the businessman's home address, in the context of restrictions on floor space and good communications have been studied. Once installed in Madrid, the specific location depends on the type of service and is not such a decisive factor.
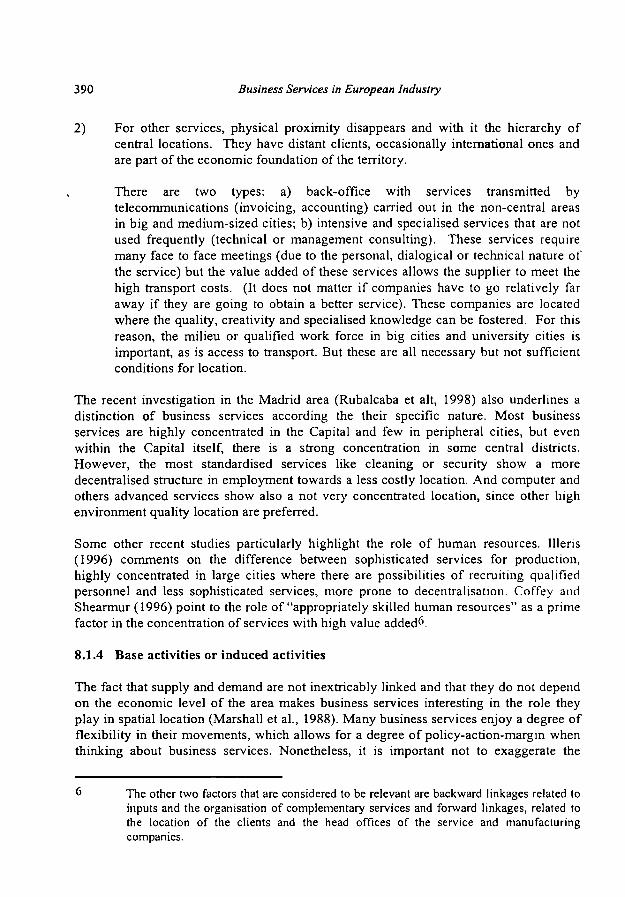
390 Business Services in European Industry
2) For other services, physical proximity disappears and with it the hierarchy of central locations. They have distant clients, occasionally international ones and are part of the economic foundation of the territory.
There are two types: a) back-office with services transmitted by telecommunications (invoicing, accounting) carried out in the non-central areas in big and medium-sized cities; b) intensive and specialised services that are not used frequently (technical or management consulting). These services require many face to face meetings (due to the personal, dialogical or technical nature of the service) but the value added of these services allows the supplier to meet the high transport costs. (It does not matter if companies have to go relatively far away if they are going to obtain a better service). These companies are located where the quality, creativity and specialised knowledge can be fostered. For this reason, the milieu or qualified work force in big cities and university cities is important, as is access to transport. But these are all necessary but not sufficient conditions for location.
The recent investigation in the Madrid area (Rubalcaba et alt, 1998) also underlines a distinction of business services according the their specific nature. Most business services are highly concentrated in the Capital and few in peripheral cities, but even within the Capital itself, there is a strong concentration in some central districts. However, the most standardised services like cleaning or security show a more decentralised structure in employment towards a less costly location. And computer and others advanced services show also a not very concentrated location, since other high environment quality location are preferred.
Some other recent studies particularly highlight the role of human resources. Illeris (1996) comments on the difference between sophisticated services for production, highly concentrated in large cities where there are possibilities of recruiting qualified personnel and less sophisticated services, more prone to decentralisation. Coffey and Shearmur (1996) point to the role of "appropriately skilled human resources" as a prime factor in the concentration of services with high value added6.
8.1.4 Base activities or induced activities
The fact that supply and demand are not inextricably linked and that they do not depend on the economic level of the area makes business services interesting in the role they play in spatial location (Marshall et al., 1988). Many business services enjoy a degree of flexibility in their movements, which allows for a degree of policy-action-margin when thinking about business services. Nonetheless, it is important not to exaggerate the
The other two factors that are considered to be relevant are backward linkages related to inputs and the organisation of complementary services and forward linkages, related to the location of the clients and the head offices of the service and manufacturing companies.
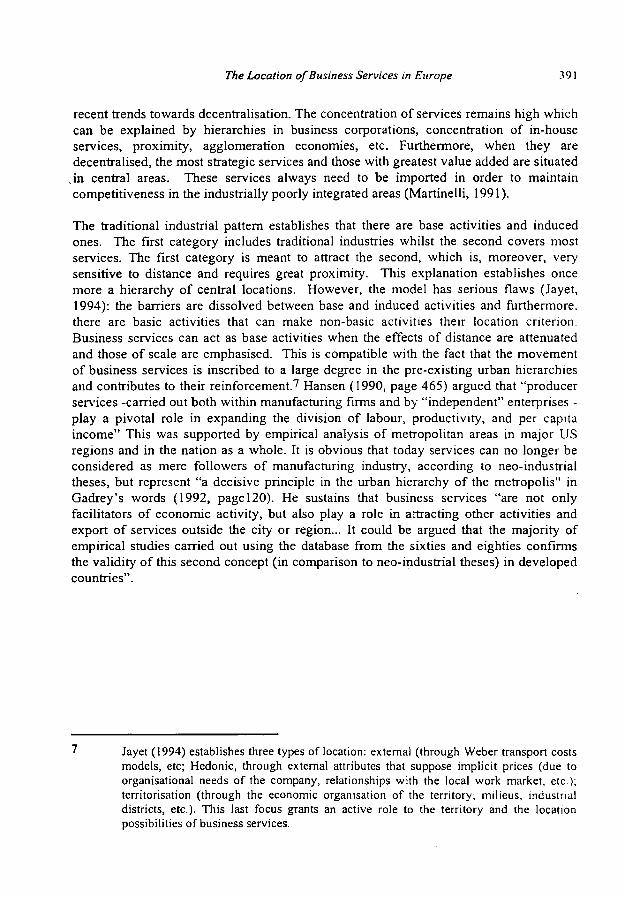
The Location of Business Services in Europe 391
recent trends towards decentralisation. The concentration of services remains high which can be explained by hierarchies in business corporations, concentration of in-house services, proximity, agglomeration economies, etc. Furthermore, when they are decentralised, the most strategic services and those with greatest value added are situated
,in central areas. These services always need to be imported in order to maintain competitiveness in the industrially poorly integrated areas (Martinelli, 1991).
The traditional industrial pattern establishes that there are base activities and induced ones. The first category includes traditional industries whilst the second covers most services. The first category is meant to attract the second, which is, moreover, very sensitive to distance and requires great proximity. This explanation establishes once more a hierarchy of central locations. However, the model has serious flaws (Jayet, 1994): the barriers are dissolved between base and induced activities and furthermore, there are basic activities that can make non-basic activities their location criterion. Business services can act as base activities when the effects of distance are attenuated and those of scale are emphasised. This is compatible with the fact that the movement of business services is inscribed to a large degree in the pre-existing urban hierarchies and contributes to their reinforcement.7 Hansen (1990, page 465) argued that "producer services -carried out both within manufacturing firms and by "independent" enterprises -play a pivotal role in expanding the division of labour, productivity, and per capita income" This was supported by empirical analysis of metropolitan areas in major US regions and in the nation as a whole. It is obvious that today services can no longer be considered as mere followers of manufacturing industry, according to neo-industrial theses, but represent "a decisive principle in the urban hierarchy of the metropolis" in Gadrey's words (1992, page 120). He sustains that business services "are not only facilitators of economic activity, but also play a role in attracting other activities and export of services outside the city or region... It could be argued that the majority of empirical studies carried out using the database from the sixties and eighties confirms the validity of this second concept (in comparison to neo-industrial theses) in developed countries".
Jayet (1994) establishes three types of location: external (through Weber transport costs models, etc; Hedonic, through external attributes that suppose implicit prices (due to organisational needs of the company, relationships with the local work market, etc.); territorisation (through the economic organisation of the territory; milieus, industrial districts, etc.). This last focus grants an active role to the territory and the location possibilities of business services.

392 Business Services in European Industry
8.2 The location of business services in Europe: some data
The location of European business services** will be analysed in this section and the following one using data supplied by the Panorama of European Industry 1994 (see
• chapter 1 for further references). The aim is to ascertain the degree of concentration in the main countries hence the most reliable set of data is used, although these data are not very reliable since they are collected by professional associations and the different weight and representativeness of each national association distorts the comparative analysis. However, overall figures can be useful for obtaining a preliminary approach. This gives an indication of the presence of a specific activity in the group of countries, and facilitates a comparison with the average economic size of the countries in question.
Table 8.1. displays the results of selection, estimates and standardisation, in order to study the relative volume that each activity has in a specific country of the European Union.9 The first conclusion that can be drawn is that Germany comes top in many business services activities, followed by the United Kingdom, France, Italy and Spain (the averages per country are shown at the end of the table). 10 Germany is the overall leader; it commands the lead in 14 categories out of 21. The United Kingdom leads 5 activities (legal services, inspection and control, electronic communications, public relations and courier services), France and Italy one each (temporary work and estate agents respectively) and Germany leads the rest. Second place is generally taken by France and the United Kingdom, whilst Italy dominates some third and fourth positions. In the top places, Spain has two activities in third position (advertising and linguistic services).
In one sense, the leaders do not necessarily mean absolute dominance within an activity. For example, the leading companies in many activities such as accounting and auditing are found in the United Kingdom. However, Germany has the greatest volume in this activity. In other cases, the existence of statistical problems can affect the results, as well as other economic factors among which the underground economy must be highlighted.
8 Only business services activities within the business service sector. Unfortunately, in-house business services cannot be measured. The methodology of the study was as follows: first, the most reliable variables in each sector were selected. In some cases estimates had to be made using auxiliary data (Accounting and Legal services activities). Then, in order to compare the scales and different variables, an average of 100 was set for each sector so that all the figures are easily intelligible. The results for the economy as a whole in GDP and employment are added (the two variables will be compared later on). These results contrast with the ones coming from the National Accounts results showed in chapter 1 (tables 1.5 and 1.7). In case of discrepancies, data on National Accounts can be considered as being more reliable for the understanding of business services as a sector (including real estate). However, as regards the different specific activities, the Panorama of the EU Industry is the only possible source provinding information for most EU countries and general trends are also reliable (not specific data which can be more estimative).
10
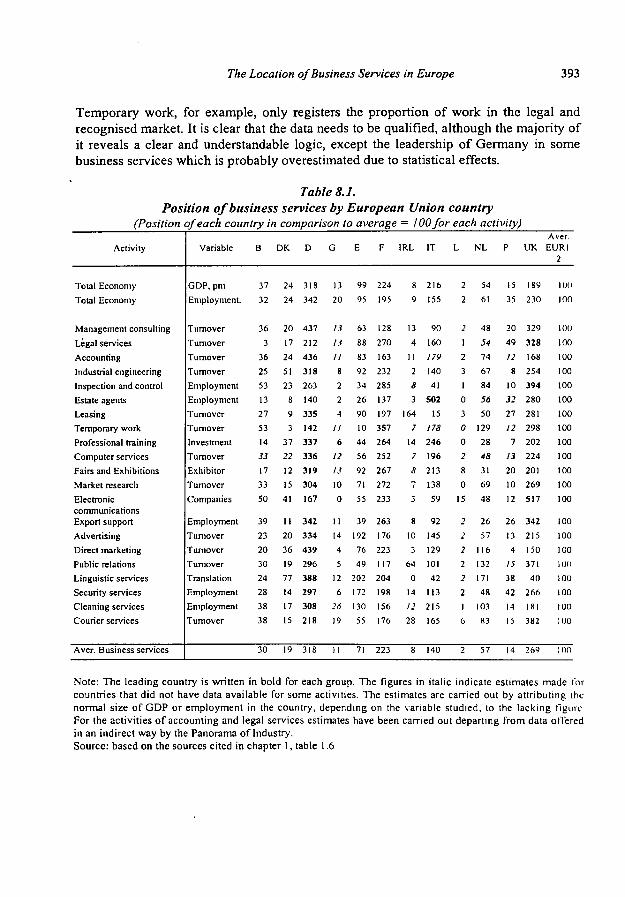
The Location of Business Services in Europe 393
Temporary work, for example, only registers the proportion of work in the legal and
recognised market. It is clear that the data needs to be qualified, although the majority of
it reveals a clear and understandable logic, except the leadership of Germany in some
business services which is probably overestimated due to statistical effects.
Table 8.1.
Position of business services by European Union country (Position of each country in comparison to average = ¡00for each activity)
Activity
Total Economy
Total Economy
Management consulting
Legal services
Accounting
Industrial engineering
Inspection and control
Estate agents
Leasing
Temporary work
Professional training
Computer services
Fairs and Exhibitions
Market research
Electronic
communications
Export support
Advertising
Direct marketing
Public relations
Linguistic services
Security services
Cleaning services
Courier services
Aver. Business services
Variable
GDP, pm
Employment.
Turnover
Turnover
Turnover
Turnover
Employment
Employment
Turnover
Turnover
Investment
Turnover
Exhibitor
Turnover
Companies
Employment
Turnover
Turnover
Turnover
Translation
Employment
Employment
Turnover
Β
37
32
36
3
36
25
53
13
27
53
14
33
17
33
50
39
23
20
30
24
28
38
38
30
DK
24
24
20
17
24
51
23
8
9
3
37
22
12
15
41
11
20
36
19
77
14
17
15
19
D
318
342
437
212
436
318
263
140
33S
142
337
336
319
304
167
342
334
439
296
388
297
308
218
318
G
13
20
13
13
11
8
2
2
4
// 6
12
13
10
0
11
14
4
5
12
6
26
19
II
E
99
95
63
88
83
92
34
26
90
10
44
56
92
71
55
39
192
76
49
202
172
130
55
71
F
224
195
128
270
163
232
285
137
197
357
264
252
267
272
233
263
176
223
117
204
198
156
176
223
IRL
8
9
13
4
II
2
S
3
164
7
14
7
S
7
3
8
10
3
64
0
14
/' 28
8
IT
216
155
90
160
179
140
41
502
15
775
246
196
213
138
59
92
145
129
101
42
113
215
165
140
L
2
2
2
1
2
3
1
0
3
0
0
2
8
0
15
2
2
2
2
2
2
1
6
2
NL
54
61
48
54
74
67
84
56
50
129
28
48
31
69
48
26
57
116
132
171
48
103
83
57
Ρ
15
35
20
49
12
8
10
32
27
12
7
13
20
10
12
26
13
4
15
38
42
14
15
14
UK
189
230
329
328
168
254
394
280
281
298
202
224
201
269
517
342
215
150
371
40
266
181
382
269
Aver.
EURI
2
1 Ull
100
100
100
100
100
100
100
100
100
100
100
100
100
100
loo 100
100
ι oo
100
100
100
100
100
Note: The leading country is written in bold for each group. The figures in italic indicate estimates made for
countries that did not have data available for some activities. The estimates are carried out by attributing the
normal size of GDP or employment in the country, depending on the variable studied, to the lacking ligure
For the activities of accounting and legal services estimates have been carried out departing from data offered
in an indirect way by the Panorama of Industry.
Source: based on the sources cited in chapter 1, table 1.6
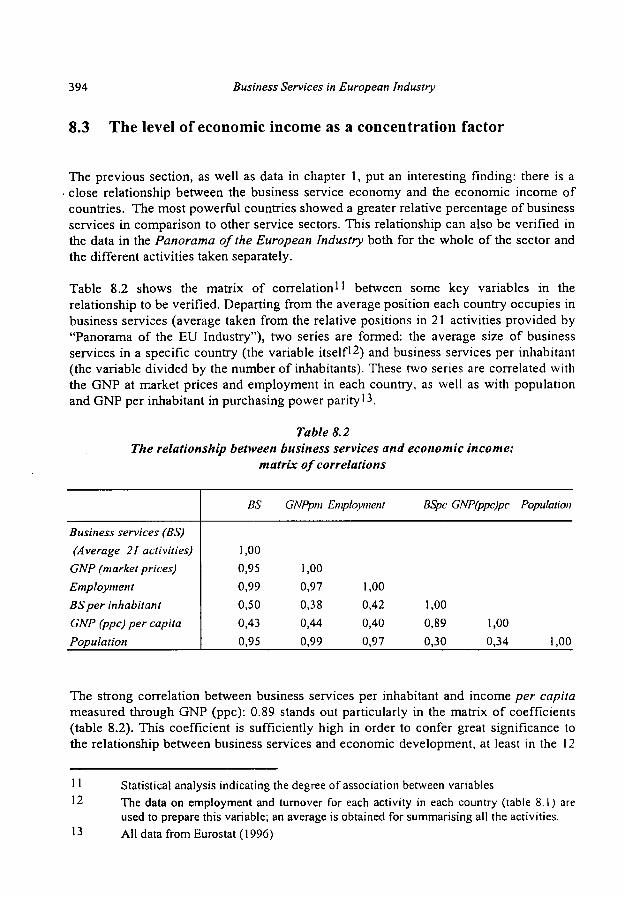
394 Business Services in European Industry
8.3 The level of economic income as a concentration factor
The previous section, as well as data in chapter 1, put an interesting finding: there is a close relationship between the business service economy and the economic income of countries. The most powerful countries showed a greater relative percentage of business services in comparison to other service sectors. This relationship can also be verified in the data in the Panorama of the European Industry both for the whole of the sector and the different activities taken separately.
Table 8.2 shows the matrix of correlation11 between some key variables in the relationship to be verified. Departing from the average position each country occupies in business services (average taken from the relative positions in 21 activities provided by "Panorama of the EU Industry"), two series are formed: the average size of business services in a specific country (the variable itself12) and business services per inhabitant (the variable divided by the number of inhabitants). These two series are correlated with the GNP at market prices and employment in each country, as well as with population and GNP per inhabitant in purchasing power parity· 3.
Table 8.2 The relationship between business services and economic income:
matrix of correlations
Business services (BS) (Average 21 activities)
GNP (market prices) Employment BS per inhabitant GNP (ppc) per capita Population
BS
1,00 0,95 0,99 0,50 0,43 0,95
GNPpm Employment
1,00 0,97 0,38 0,44 0,99
1,00 0,42 0,40 0,97
BSpc GNP(ppc)pc
1,00 0,89 1,00 0,30 0,34
Population
1,00
The strong correlation between business services per inhabitant and income per capita measured through GNP (ppc): 0.89 stands out particularly in the matrix of coefficients (table 8.2). This coefficient is sufficiently high in order to confer great significance to the relationship between business services and economic development, at least in the 12
11 Statistical analysis indicating the degree of association between variables 12 The data on employment and turnover for each activity in each country (table 8.1) are
used to prepare this variable; an average is obtained for summarising all the activities. 13 All data from Eurostat ( 1996)
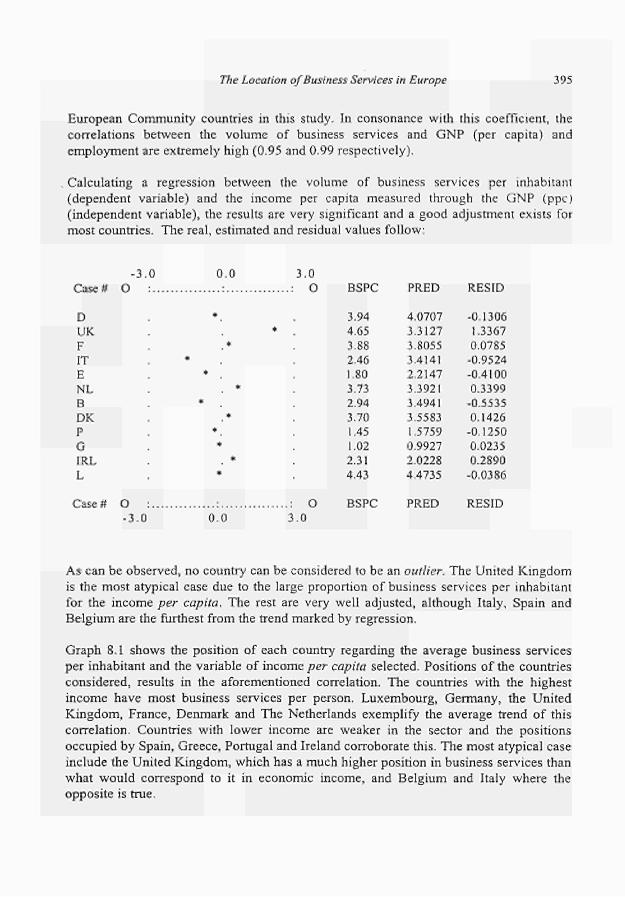
77ie Location of Business Services in Europe 395
European Community countries in this study. In consonance with this coefficient, the correlations between the volume of business services and GNP (per capita) and employment are extremely high (0.95 and 0.99 respectively).
Calculating a regression between the volume of business services per inhabitant (dependent variable) and the income per capita measured through the GNP (ppc) (independent variable), the results are very significant and a good adjustment exists for most countries. The real, estimated and residual values follow:
-3.0 0.0 Case# O
D UK F IT E NL Β DK Ρ G IRL L
Case # O -3.0
3.0 O BSPC
3.94 4.65 3.88 2.46 1.80 3.73 2.94 3.70 1.45 1.02 2.31 4.43
PRED
4.0707 3.3127 3.8055 3.4141 2.2147 3.3921 3.4941 3.5583 1.5759 0.9927 2.0228 4.4735
RESID
-0.1306 1.3367 0.0785
-0.9524 -0.4100 0.3399
-0.5535 0.1426
-0.1250 0.0235 0.2890
-0.0386
O BSPC PRED RESID 0.0 3.0
As can be observed, no country can be considered to be an outlier. The United Kingdom is the most atypical case due to the large proportion of business services per inhabitant for the income per capita. The rest are very well adjusted, although Italy, Spain and Belgium are the furthest from the trend marked by regression.
Graph 8.1 shows the position of each country regarding the average business services per inhabitant and the variable of income per capita selected. Positions of the countries considered, results in the aforementioned correlation. The countries with the highest income have most business services per person. Luxembourg, Germany, the United Kingdom, France, Denmark and The Netherlands exemplify the average trend of this correlation. Countries with lower income are weaker in the sector and the positions occupied by Spain, Greece, Portugal and Ireland corroborate this. The most atypical case include the United Kingdom, which has a much higher position in business services than what would correspond to it in economic income, and Belgium and Italy where the opposite is true.
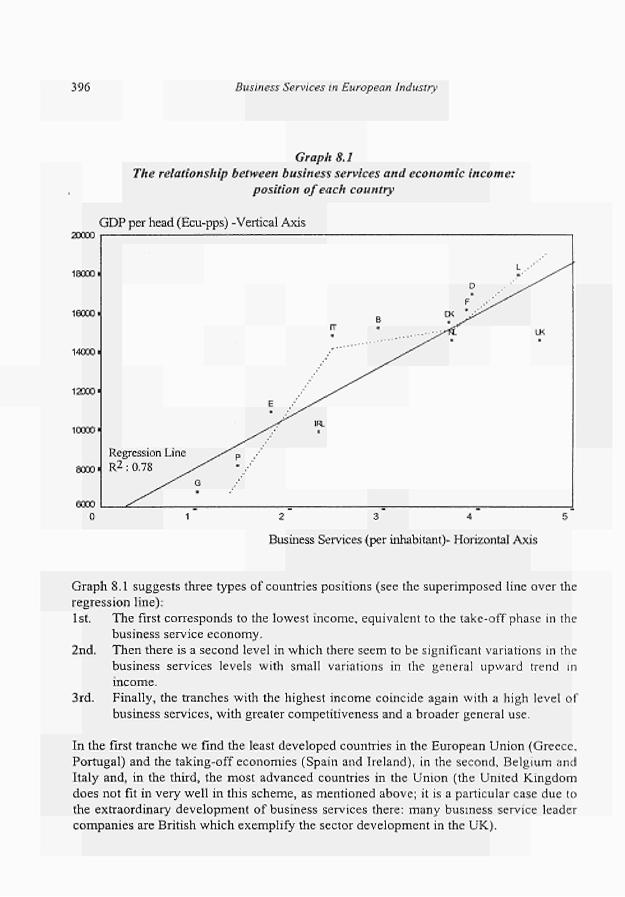
396 Business Services in European Industry
Graph 8.1
The relationship between business services and economic income:
position of each country
GDP per head (Ecupps) Vertical Axis
10000 ■
16CCOI
140001
120001
10000'
8000'
6000
Regression Line
R2 : 0.78 ^ ^
^ ^ G
Ρ
E
rr ■
IR.
Β
D
F y.
CK \ ¿ ^
L . β '
LK ■
2 3 4 5
Business Services (per inhabitant) Horizontal Axis
Graph 8.1 suggests three types of countries positions (see the superimposed line over the
regression line):
1st. The first corresponds to the lowest income, equivalent to the takeoff phase in the
business service economy.
2nd. Then there is a second level in which there seem to be significant variations in the
business services levels with small variations in the general upward trend in
income.
3rd. Finally, the tranches with the highest income coincide again with a high level of
business services, with greater competitiveness and a broader general use.
In the first tranche we find the least developed countries in the European Union (Greece,
Portugal) and the takingoff economies (Spain and Ireland), in the second, Belgium and
Italy and, in the third, the most advanced countries in the Union (the United Kingdom
does not fit in very well in this scheme, as mentioned above; it is a particular case due to
the extraordinary development of business services there: many business service leader
companies are British which exemplify the sector development in the UK).
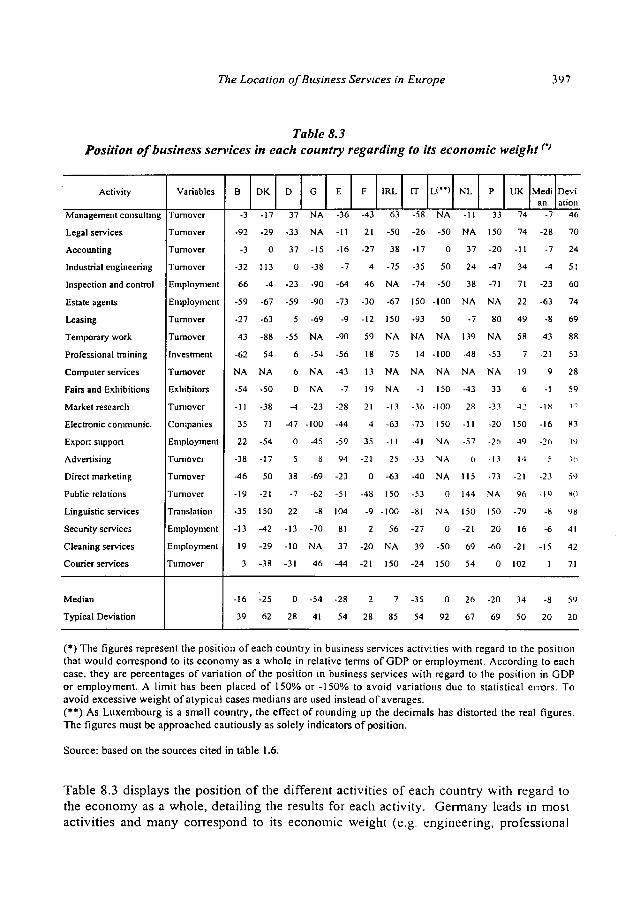
77ie Location of Business Services in Europe 397
Table 8.3
Position of business services in each country regarding to its economic weightn
Activity
Management consulting
Legal services
Accounting
Industrial engineering
Inspection and control
Estate agents
Leasing
Temporary work
Professional training
Computer services
Fairs and Exhibitions
Market research
Electronic communie.
Export support
Advertising
Direct marketing
Public relations
Linguistic services
Security services
Cleaning services
Courier services
Median
Typical Deviation
Variables
Turnover
Turnover
Turnover
Turnover
Employment
Employment
Turnover
Turnover
Investment
Turnover
Exhibitors
Turnover
Companies
Employment
Turnover
Turnover
Turnover
Translation
Employment
Employment
Turnover
Β
-3
-92
-3
-32
66
-59
-27
43
-62
NA
-54
-11
35
22
-38
-46
-19
-35
-13
19
3
-16
39
DK
-17
-29
0
113
-4
-67
-63
-88
54
N A
-50
-38
71
-54
-17
50
-21
150
-42
-29
-38
-25
62
D
37
-33
37
0
-23
-59
5
-55
6
6
0
-4
-47
0
5
38
-7
22
-13
-10
-31
0
28
G
NA
NA
-15
-38
-90
-90
-69
NA
-54
NA
NA
-23
-100
-45
8
-69
-62
-8
-70
NA
46
-54
41
E
-36
-11
-16
-7
-64
-73
-9
-90
-56
-43
-7
-28
-44
-59
94
-23
-51
104
81
37
-44
-28
54
F
-43
21
-27
4
46
-30
-12
59
18
13
19
21
4
35
-21
0
-48
-9
2
-20
-21
2
28
IRL
63
-50
38
-75
NA
-67
150
NA
75
NA
NA
-13
-63
-1 1
25
-63
150
-100
56
NA
150
7
85
IT
-58
-26
-17
-35
-74
150
-93
NA
14
NA
-1
-36
-73
-41
■33
-40
-53
-81
-27
39
-24
-35
54
L ( " )
NA
-50
0
50
-50
-100
50
NA
-100
NA
150
-100
150
NA
NA
NA
0
NA
0
-50
150
0
92
NL
-11
NA
37
24
38
NA
-7
139
-48
NA
-43
2R
-11
-57
(i
115
144
150
-21
69
54
26
67
Ρ
33
150
-20
-47
-71
NA
80
NA
-53
NA
33
-33
-20
-26
-13
-73
NA
150
20
-60
0
-20
69
UK
74
74
-11
34
71
22
49
58
7
19
6
42
150
49
14
-21
96
-79
16
-21
102
34
50
Medi
an
-7
-28
-7
-4
-23
-63
-8
43
-21
9
-1
-18
-16
■26
5
-23
-19
-8
-6
-15
I
-8
20
Devi
:iuon
46
70
24
51
60
74
69
88
53
28
59
37
83
V)
3d
59
HO
98
41
42
71
59
20
(*) The figures represent the position of each country in business services activities with regard to the position
that would correspond to its economy as a whole in relative terms of GDP or employment. According to each
case, they are percentages of variation of the position in business services with regard to the position in GDP
or employment. A limit has been placed of 150% or -150% to avoid variations due to statistical errors. To
avoid excessive weight of atypical cases medians are used instead of averages.
(**) As Luxembourg is a small country, the effect of rounding up the decimals has distorted the real figures.
The figures must be approached cautiously as solely indicators of position.
Source: based on the sources cited in table 1.6.
Table 8.3 displays the position of the different activities of each country with regard to
the economy as a whole, detailing the results for each activity. Germany leads in most
activities and many correspond to its economic weight (e.g. engineering, professional

398 Business Services in European Industry
training, fairs and exhibitions, export support, computer services) and others supersede it easily (e.g. management consulting, accounting, direct marketing, linguistic services), but it also has others in a much lower position than would correspond to it due to us economic size (e.g. estate agents, temporary work, electronic communications). In the
.United Kingdom, most activities supersede the situation that might be expected (e.g. especially management, legal services, inspection and control, electronic communications, temporary work, public relations and courier services). This situation reflects the fact that the leading business services companies are mainly British, and that the United Kingdom is considered to be the real European leader in many activities. The only activity which comparatively lags behind other countries is linguistic services. In this sense, France has a very solid position in many activities, such as inspection and control and temporary work. In Italy, the typical large deviation shows the enormous disparity between situations in which business services activities find themselves in there. In Spain, the situation is worse than expected in most service activities with the notable exception of advertising, linguistic, security and cleaning services.
Overall, reading down the columns of averages and deviations in table 8.3, the results are thoroughly coherent with the ones from the regression carried out previously. The United Kingdom stands out because of its high level of development of nearly all the activities, much higher than one might expect from its economic size. Examining the origin and nationality of the main European multinationals operating in the sector backs up the relative superiority of the United Kingdom. The Netherlands also stands out in this respect, which is home to the head offices of several multinationals in the sector. Ireland shows a fairly positive result; part of its closing the gap on other European countries can be attributed to this, although together with Luxembourg (the latter due to statistical problems) it remains the country with the greatest typical deviation. France, Germany, the Netherlands and Luxembourg show results coherent with their economic average. Belgium, Portugal, Denmark, Spain, Italy and, above all, Greece show lower values than would correspond to them by their average. Portugal, Italy and Spain have very strong deviations, indicating a disparity in the internal behaviour of the sector. In many cases, very consolidated activities indicate the level of maturity reached, whereas the backward activities indicate current weakness and great potential for growth. As the medians of the activities and countries are negative, two conclusions can drawn: 1st, in general the sector can contribute to reducing territorial differences between countries, 2nd there is still great potential for growth in many countries.
The typical deviation per activity gives an idea of its concentration, although it says nothing about where this concentration is located. A priori, the most concentrated ones are linguistic services (98), temporary work (88), electronic communications (83) and public relations (80). The least concentrated are export support (39), market research (37), advertising (36), computer services (28) and accounting (24).
The spatial concentration of the activities varies greatly according to three types of factors: nature of the activity, current market and economic wealth. The nature of the activity explains, for example, why linguistic services are concentrated in countries
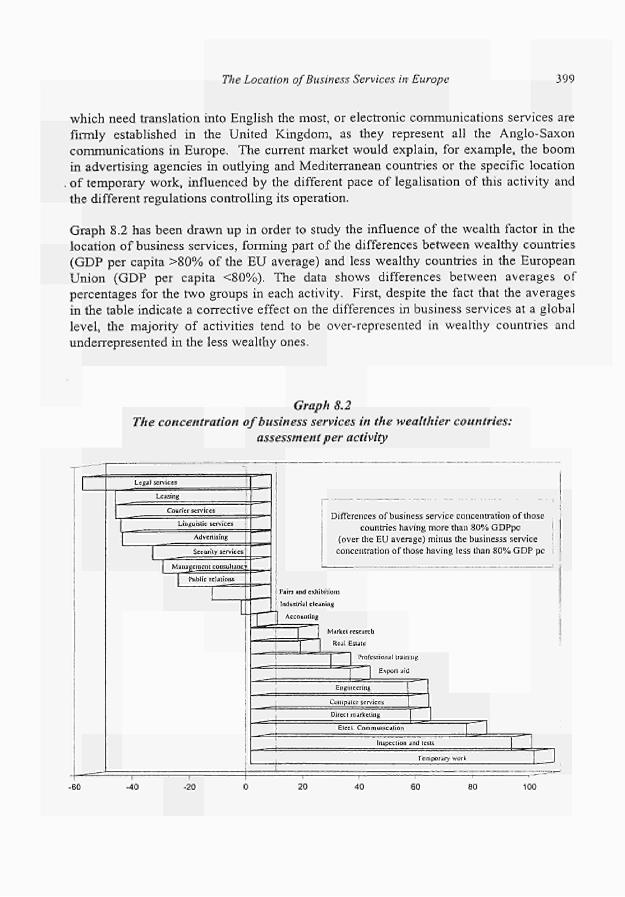
The Location of Business Services in Europe 399
which need translation into English the most, or electronic communications services are firmly established in the United Kingdom, as they represent all the Anglo-Saxon communications in Europe. The current market would explain, for example, the boom in advertising agencies in outlying and Mediterranean countries or the specific location of temporary work, influenced by the different pace of legalisation of this activity and the different regulations controlling its operation.
Graph 8.2 has been drawn up in order to study the influence of the wealth factor in the location of business services, forming part of the differences between wealthy countries (GDP per capita >80% of the EU average) and less wealthy countries in the European Union (GDP per capita <80%). The data shows differences between averages of percentages for the two groups in each activity. First, despite the fact that the averages in the table indicate a corrective effect on the differences in business services at a global level, the majority of activities tend to be over-represented in wealthy countries and underrepresented in the less wealthy ones.
Graph 8.2 The concentration of business services in the wealthier countries:
assessment per activity

400 Business Services in European Industry
Many of the services that are considered to be the most advanced are more established in wealthy countries than in less wealthy ones. This is true in the case of inspection and quality control, electronic communications, computer services, industrial engineering, professional training or export support. In temporary work, the differences are even more marked, but this is not true in a statistical sense because the less wealthy countries are only represented by Spain, where this activity operated in illegal conditions. But there are also services that are better represented in less wealthy ones than in wealthy countries: legal services, leasing, courier services, linguistic services, advertising, security services and management consulting, although in the latter the differences are fairly small (as also occurs in fairs and exhibitions and public relations). It can be observed that many of these activities are operational or "administrative" in nature. This could in some cases be due to the traditional nature of the activities (legal services, fairs and exhibitions), the strong expansion at the end of the 80s (advertising and security services) or idiosyncratic factors (linguistic services).
In conclusion, there seem to be conflicting location characteristics between administrative services, marketing and operational services which are very common in less developed countries in the European Union and engineering, information services and human resources which are highly concentrated in the wealthier countries. In the latter, there are wider and more competitive markets and a higher skilled workforce to carry out very specialised tasks, oriented towards new technologies and production modes.

The Location of Business Services in Europe 401
8.4 Productivity as a factor of concentration
Once the location and concentration of business services in Europe has been examined, it is worth analysing the role of productivity in these processes. The most advanced countries where the most advanced business services are concentrated are also, as shown in the previous chapter, the ones with the highest level of productivity. However, it remains to be seen if there is a specific link between these value added activities produced in advanced countries and relative productivity in each one of them. It also remains to be seen if productivity can be considered a factor of concentration.
First, productivity can be considered a fundamental descriptive criterion in the trend of concentration. The weight of the theory of economic growth and convergence between countries lies in the theories of productivity. In fact, although it may not have been explicitly formulated in the earlier analysis on location, it is obvious that implicitly productivity is a cause and consequence of concentration phenomena. When minimisation of costs, proximity or using scale economies effectively were mentioned above, we were referring indirectly to productivity. Productivity rerums are related to all these reasons, as companies systematically direct their decisions towards attaining maximum profits and greatest efficiency. Using effectively new modes of technology and organisation facilitates a closer relationship between the outputs and inputs used.
The development of productivity and especially labour productivity naturally influences the location of economic activity. Companies head towards the places where marginal productivity, rerums and business opportunities are highest. This is the intermediate step that explains why some services choose to concentrate in large urban agglomeration areas and others pursue decentralisation trends. At first sight there does not seem to be a special logic for business services. According to this logic, the economic activity moves towards the area where the marginal labour productivity or capital is highest, depending on the type of activity. In the same way that manufacturing industry is currently experiencing processes of decentralisation due to the high levels of productivity that some developing countries offer, advanced services could move towards areas where labour productivity is greatest. But the movement of manufacturing and business services could offer opposite trends. Manufacturing often decentralises towards countries where routine human work is very cheap and productive. Business services often decentralise towards countries where advanced human capital is productive but expensive.
These ideas are partly coherent with Heckscher-Ohlin's traditional model of comparative advantage, which explains the sectorial and geographical distribution of trade according to the strength of factors and costs. Countries would export goods with a high proportion of relatively abundant production factors and import goods intensive in relatively few production factors. If we follow the model, business services, intensive in human resources, would export in countries where there is a greater abundance of these resources. High skilled intensive services would tend to be exported from the most
402 Business Services in European Industry
developed countries to the less developed ones whereas in the less skilled services the opposite could occur. But it is worth noting that the trade patterns could come from the differences in productivity and technological progress rather than the strength of factors (as shown by Leontiefs famous paradox created when the North American economy
.exported in sectors with moderately intense resources but with a technological comparative advantage). Situations like this explain why the advantages of low salaries can be compensated for by out-of-proportion productivity in the most advanced countries.
Recent theories on international trade and endogenous growth explain why a country, for example, imports goods intensive in relatively abundant factors. Equally, the processes of convergence theoretically derived from equalling out marginal productivity can be slowed down by the existence of barriers to the movement of factors or by the accumulative processes of human resources and technology. Moreover, it is highly likely that productivity in business services is more closely related to the total productivity of factors, including many of the elements outlined above, than strictly to apparent productivity of the labour factor. The differences in this total productivity could block the processes of convergence in the most intensive services. For this reason, at an international level it is impossible to forecast a specific location for business services without taking into account endogenous elements of growth.
As we saw in the previous chapter, it seems logical for business services to still enjoy a relative high level of productivity. Some of them are intensive in human resources, but usually recruit highly qualified workers, which gives them a great capacity to generate value added. Although the technological incorporations are comparatively modest, the accumulation of knowledge, "learning by doing" and the margin for scale, scope or organisational economies might explain the relative high levels of productivity. Many of the location factors shown above are related, directly or indirectly, to the productivity of some services that are intensive in human resources and therefore sensitive to all the elements that stimulate the returns of this resource. This means that the sector has grown in turnover and employment with high ratios of productivity. Therefore, two basic hypotheses can be formulated. Business services, in line with growth models, have been able to develop more quickly where the gains in marginal productivity appear to be greatest, and, business services can behave differently according to whether they are intensive in highly skilled human resources or in low skilled labour.
To carry out an in-depth empirical study by activity and country, we proceed to a statistical analysis based on the technique of principal components (PCA) (see annexes
The Location of Business Services in Europe 403
8.1, 8.2 and 8.3), with the aim of differentiating between sectorial groups'4 . In this way, the redundant information that exists in the statistics on European business services is reduced. Through this procedure we aim to obtain the following results:
. 1) to determine the variables that distinguish statistically sectorial groups from one another in each country (in particular, productivity and volume,); 2) to carry out an association of country clusters for each activity (in order to discover if there is any sectorial or international logic behind it); 3) to determine the role of productivity-cost-effectiveness of the activities in the concentration of services.
In the study of the components resulting from the application of PCA, the clarity of the identification of the two first components (which are going to be identified here as "productivity" and "volume" respectively) and the relative obscurity in the identification of the rest stand out. The first component is related to the all the overall productivity and cost-effectiveness variables per worker. The most influential variables are the turnover per worker and per company, the value added per worker and investment per worker. Within the known limits, this measure could be called "productivity", as it embraces the various variables of apparent productivity and cost-effectiveness. The second component embraces all the volume variables: employment, number of companies, turnover, etc. It can be called here "volume" of business services.
The result suggesting that "productivity" and "volume" can be considered as the two principal components is an important one. It means that there is not a correlation between "productivity" and "volume". The largest business services countries do not necessarily have the greatest productivity and vice versa, at least when the eight activities selected are taken into account. Productivity in business services is not related to the volume of business services.
Three types of additional theoretical contributions can be obtained through the application of the PCA technique. The first, a comparison between the different activities, which will permit an examination of the differences amongst them. The second, a comparison of countries based on the business services activities that exist there. And, finally, the definition of groups or clusters formed amongst countries for each service analysed.
'4 It is not possible to use the previous section data, as it does not allow us to obtain productivity measures. Very few sectors and not always representative ones would give us data on apparent productivity, and this would be in terms of turnover per person and not in value added per worker, which means we have to return to the data used in the previous chapter on productivity. However, in this case, in contrast to the exercise carried out in the previous chapter, a matrix will not be formed for each country (to compare countries and adjustment), but a single matrix to form the basis of each of the sectors grouped together in this data.
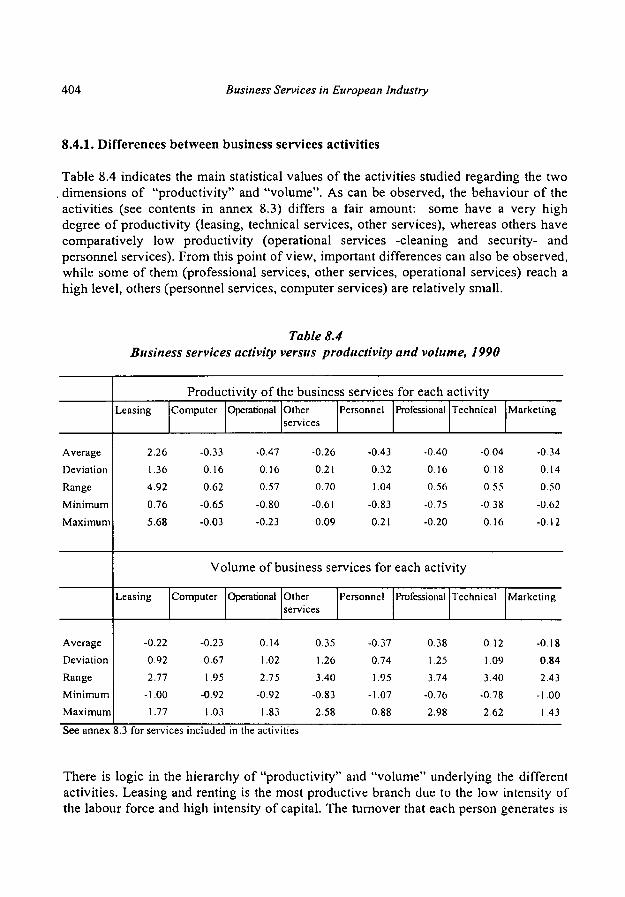
404 Business Services in European Industry
8.4.1. Differences between business services activities
Table 8.4 indicates the main statistical values of the activities studied regarding the two , dimensions of "productivity" and "volume". As can be observed, the behaviour of the activities (see contents in annex 8.3) differs a fair amount: some have a very high degree of productivity (leasing, technical services, other services), whereas others have comparatively low productivity (operational services -cleaning and security- and personnel services). From this point of view, important differences can also be observed, while some of them (professional services, other services, operational services) reach a high level, others (personnel services, computer services) are relatively small.
Table 8.4 Business services activity versus productivity and volume, 1990
Average Deviation
Range Minimum Maximum
Average Deviation Range Minimum Maximum
Leasing
2.26 1.36
4.92
0.76
5.68
Productivity of the business services Computer
-0.33 0.16 0.62
-0.65
-0.03
Operational Other services
-0.47
0.16 0.57
-0.80
-0.23
-0.26 0.21
0.70
-0.61 0.09
Personnel
-0.43 0.32 1.04
-0.83 0.21
for each activ Professional
ty Technical
-0.40
0.16 056
-0.75 -0.20
-0.04
0.18 055
-038 0.16
Marketing
-0 34
0.14 0 50
-062
-0 12
Volume of business services for each activity
Leasing
-0.22 0.92 2.77
-1.00 1.77
Computer
-0.23 0.67
1.95 -0.92 1.03
Operational Other services
0.14 1.02
2.75 -0.92 1.83
0.35 1.26 3.40
-0.83 2.58
Personnel
-037 0.74
1.95 -1.07
0.88
Professional Technical
0.38 1.25 3.74
-0.76
2.98
0.12 1.09 3.40
-0.78 2.62
Marketing
-0.18 0.84
2.43 -1.00 1.43
See annex 8.3 for services included in the activities
There is logic in the hierarchy of "productivity" and "volume" underlying the different activities. Leasing and renting is the most productive branch due to the low intensity of the labour force and high intensity of capital. The turnover that each person generates is
The Location of Business Services in Europe 405
big, greater than in many manufacturing industries'5. Technical services have a similar component but on a much lower scale. In the third place in the productivity hierarchy comes "other services". In this case the reason for high productivity could be sought in the newness of many of the activities included under this heading, which have only been
. able to attract incipient demand. Beneath this classification comes operational and personnel services. By definition, they are labour-intensive services, with relatively low cost-effectiveness per person. Finally, computer services and marketing show intermediate productivity, greater than professional services.
From the point of view of "volume", professional services comes top and is without doubt the most numerous and traditional activity. Following close behind come "other services", the result of the progression of many young services that a few years ago did not even merit classification in an independent statistical category. Operational services also have a huge turnover and very important level of employment, as do technical services. Marketing (including marketing and advertising), followed by leasing, computers and personnel have a lower volume.
Marketing and computer services show the most homogenous behaviour amongst the countries. In these two cases, the deviations are typically very small in both productivity and volume. Operational and professionals services only display uniform behaviour in productivity. Technical services are characterised by heterogeneity, as the deviations of the two variables indicate. Leasing and personnel are disparate in productivity. Professional and other services are disparate in volume. Between the first and last country (range) there are large differences in leasing and personnel (productivity) and in professional and other services (volume). The differences in the eight groups are the result of the heterogeneity of activities that each one contains, as can be seen in the analysis in the previous section.
8.4.2. Differences amongst activities in each country
The strength of each country in the different activities is represented in Table 8.5'6. From our "volume" index, the most important countries in the EU are logically those with the greatest absolute volume: Germany, France, the United Kingdom and Italy. This matches the results of the previous section. Occasionally, Spain appears to join this group. At times the group with the greatest volume is also the group with highest productivity, although small countries often supersede large ones in this dimension. In general, the behaviour of small countries is considerably more homogeneous.
'5 This confirms the effect of real estate related activities in the overall importance of the business services.
16 It is worth remembering that at this extremely detailed level, statistical errors in the sources of information may be considerable and, therefore, the positions that each country occupy regarding each sector must be approached with caution. In any case, the main conclusions from the graphs are perfectly logical and are supported by the two clearly-identified dimensions.
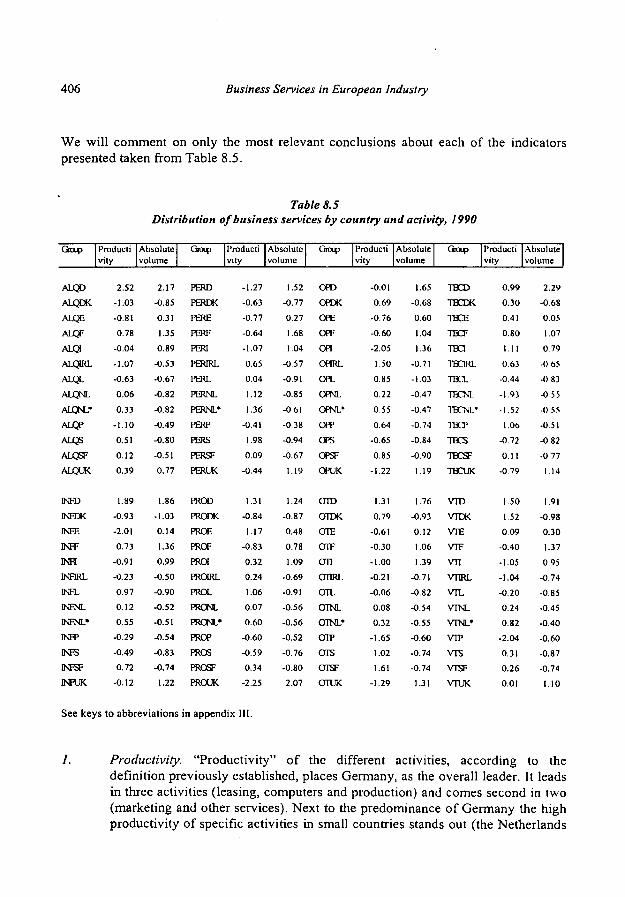
406 Business Services in European Industry
We will comment on only the most relevant conclusions about each of the indicators presented taken from Table 8.5.
Table 8.5 Distribution of business services by country and activity, 1990
Group
ALQD
ALQDK
ALQE ALQF
ALQI
ALQJRL AUQL
ALQNL
ALGNL*
ALCP ALQS
ALQSF ALQUK
INTO
INFDK INFE
INFF
INFI INFIRL
INFL INFNL INFNL* INFP
INFS INFSF INFUK.
Producti vity
2.52 -1.03
-0.81
0.78
-0.04 -1.07
-0.63
0.06
0.33 -1.10
0.51
0.12 0.39
1.89
-0.93 -2.01
0.73 -0.91
-0.23
0.97 0.12 0.55
-0.29
-0.49 0.72
-0.12
Absolute volume
2.17
-0.85
0.31 1.35
0.89
-0.53 -0.67
-0.82
-0.82
-0.49 -0.80
-0.51
0.77
1.86
-1.03 0.14 1.36
0.99
-0.50
-0.90 -0.52 -0.51 -0.54
-0.83 -0.74 1.22
Group
PERD
PERDK
PERE PERF
PERI
PERIRL
PERL
PERNL
PERNL·
PERP
PERS
PERSF PERUK
PROD
PRODK
PROE PROF
PRO! PRORL
PROL PRONL
PRONL* PROP
PROS PROSF
PROUK
Producti vity
-1.27
-0.63 -0.77
-0.64
-1.07
0.65 0.04
1.12
1.36
-0.41 1.98
0.09 -0.44
1.31
-0.84 1.17
-0.83
0.32 0.24
1.06 0.07
0.60 -0.6Ό -0.59 0.34
-2.25
Absolute volume
1.52
-0.77 0.27
1.68
1.04
-0.57 -0.91
-0.85
-0 61
-0.38 -0.94
-0.67 1.19
1.24 -0.87
0.48 0.78
1.09
-0.69 -0.91
-0.56 -0.56
-0.52 -0.76 -0.80 2.07
Group
OPD
OPDK
OPE
OFF
OPI OPIRL
OPL OPNL
OPNL*
OPP OPS
OPSF
OPUK
OTD
OTDK OTE
OTF
on OT1RL
OTL OTNL
OTNL*
cm? OTS OTSF
OTUK
Producti vity
-0.01
0.69 -0.76
-0.60
-2.05
1.50
0.85
0.22
0.55
0.64
-0.65
0.85
-1.22
1.31 0.79
-0.61 -0.30
-1.00
-0.21 -0.06 0.08
0.32 -1.65
1.02 1.61
-1.29
Absolute volume
1.65
-0.68 0.60
1.04
1.36
-0.71
-1.03
-0.47
-0.47
-0.74
-0.84
-0.90 1.19
1.76
-0.93
0.12 1.06
1.39 -0.71
-0.82 -0.54 -0.55
-0.60 -0.74 -0.74 1.31
Group
TECD TECDK
TECE
TECF
TEQ
TEC1RL
TECL
TBCNL
TECNL*
TECP
TECS
TECSF TECUK
VTD VTDK
VTE
VTF
vn VTM.
VTL VTNL
VTNL* VTP
VTS VTSF
VTUK
Producti vity
0.99 0.30
0.41
0.80 I I I
063 -0.44
-1.93
-1 52
1.06
-0.72 O i l
-0.79
1.50
1.52 0.09
-0.40
-1.05 -1.04 -0.20
0.24 0.82
-2.04
0.31 0.26 0.01
Absolute volume
2.29 -0.68
0.05
1.07 0.79
-I) 65
-0.83 -0 55
■0 55
-0.51
-0.82
-0.77
1.14
1.91
-0.98
0.30
1.37
0.95
-0.74
-0.85
-0.45
-0.40
-0.60
-0.87
-0.74
1.10
See keys to abbreviations in appendix III.
/. Productivity. "Productivity" of the different activities, according to the
definition previously established, places Germany, as the overall leader. It leads
in three activities (leasing, computers and production) and comes second in two
(marketing and other services). Next to the predominance of Germany the high
productivity of specific activities in small countries stands out (the Netherlands
77ie Location of Business Services in Europe 407
in personnel, Denmark in marketing, Finland in operational and other services, Luxembourg in computers), as well as the positions occupied by France in leasing and computers and by Italy in technical services. Spain and Portugal come second in professional and technical services respectively. Considering the supremacy of the big countries in nearly all activities, the relatively low productivity in some activities in these countries is surprising: technical, operational and others services in the United Kingdom, operational services and marketing in Italy, personnel in Germany, professional services in France and computers in Spain.
2. Absolute volume. The "volume" of the activities is dominated by the big four: Germany, the United Kingdom, France and Italy, in this order. Germany dominates overall, leading in six out of the eight activities. Only France in personnel and the United Kingdom in professional services rob Germany of this supremacy. In both cases, Germany occupies the second position. The United Kingdom is, together with Germany, the only country that always appears in the top three places. It comes third in nearly all the activities except in professional services (1st), and technical services (2nd). France and Italy share out the rest of the top positions although France occupies most of the gaps in the first places. Logically, since "volume" is an absolute index of business service size (not relative, or divided by...) the small countries, Luxembourg, Finland and
.Denmark occupy the bottom positions.
8.4.3. Groups between country activities: clusters
The two resulting components allow us to sketch a map of the European business services, forming clusters between the different countries. This is carried out via a hierarchical cluster, taking as an average the "average linkage between groups", and forming groups with rescaled distances (0-25) starting with 10 (see annex 8.2). The series of graph 8.3 presents the results.
The first striking aspect is the strong grouping the big four have. They are always, and nearly always exclusively, the components of a group. Only France is excluded on one occasion (professional services), but at a very short distance. Amongst the big four, one usually stands out from the other three: Germany in leasing, advertising and other services, Italy in operational services, the United Kingdom in professional and technical services. They remain totally together on one occasion only, namely, in personnel services. In computer services the big four divide into two groups: Germany and France on one side, and the United Kingdom and Italy, on the other. The small countries are usually clustered, normally in areas of similar productivity.
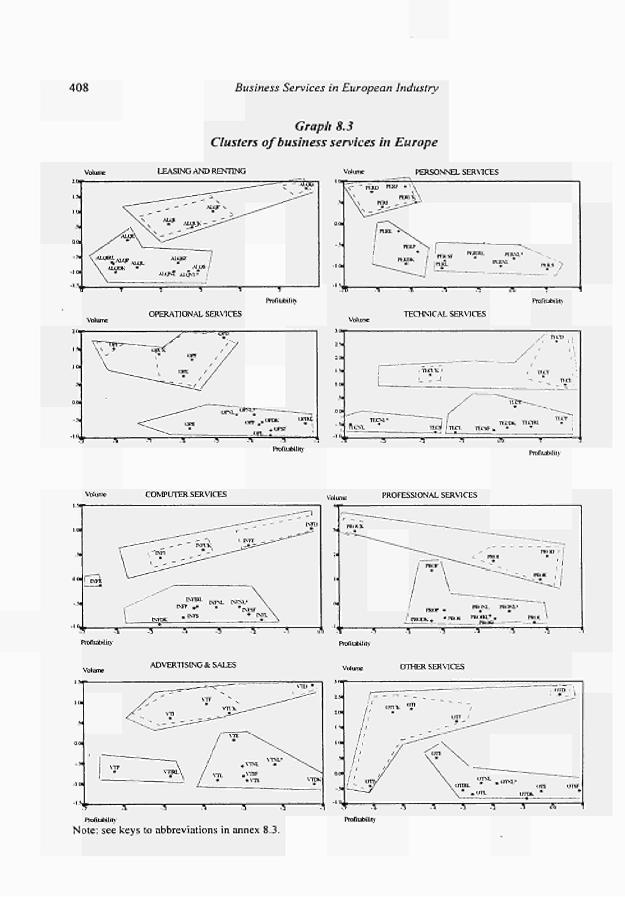
408 Business Services in European Industry
Graph 8.3
Clusters of business services in Europe
LEASING A N D RENTING PERSONNEL SERVICES
nsaxL MM.· nt* 7
OPERATIONAL SERVICES TECHNICAL SERVICES
COMPUTER SERVICES PROFESSIONAL SERVICES
1 ( 1
s
o n
■ *m
S
Τ
Γ -1
■ ' tNrí
^^
ISTDK
Λ
—- ' - - INÇ^
R™
L N O I
IMI' , · ·
a IM\
Λ .5
_—-~"—'—-""*" r "
ΐ ί * ^ ^ ^ ' ^
ISTNL· \ "lNPSF \
• ΓΝΠ. \
■1
-^~>
Λ
—^1
d
ADVERTISING & SALES OTHER SERVICES
Τ J Λ 3 Î Profitability
Note: see keys to abbreviations in annex 8.3.

77ie Location of Business Services in Europe 409
This analysis permits us to draw conclusions for each country. Take, for example, the case of Spain which is a peculiar case. Spain manages to join the big four only on two
. occasions: operational and professional services. These are the strongest activities in the country. In the remainder of the activities, Spain falls outside the group of big countries, although on some occasions by very little, especially in advertising and marketing, technical services, personnel and other services. It clearly seems to be far behind in leasing and computers. In leasing it is placed very close to the small countries or those with low productivity (Ireland, Portugal, Luxembourg). In computers, it constitutes a group apart, due to its low productivity. It is fully integrated with the big four in operational and professional services. In other services, it seems as if Portugal takes its place (which is surprising). In personnel and technical services it joins Portugal and Ireland again, although in advertising and marketing it is separated from these two countries to be placed with the small countries and the Netherlands. Spain acts as a hinge between the big four and the rest of the countries, although it struggles to find a gap amongst the big ones, due to a lack of volume (especially in operational, other, technical and advertising services) or productivity (especially in computers and leasing). The strategy of adapting to small or intermediate countries with greater productivity still seems far away. In any case, the situation in Spain in business services is sometimes better than one might expect considering its average economic size. Marketing, professional, operational, and technical services are especially above what one might expect. Leasing, computers and personnel are below than what might be expected.
To verify the hypothesis of concentration of activities with regard to the average wealth of the countries, we draw a distinction between the most developed countries (GDP per capita in purchasing power parity (PPS) above 80% of the European community average) and less developed countries (GDPpc (pps) < 80%). This last group includes Spain, Portugal and Ireland. Greece is absent because of the lack of data. The remainder of the countries are included in the first group. These two groups enable us to establish differences in productivity per type of activity. The results are displayed in graph 8.4. In general, it is confirmed that there is greater productivity in the most developed countries.
There are four activities in which the differences in productivity in favour of the richer countries are noticeable: marketing, leasing, computers and other services. This would explain the strong potential for growth that business services still have in the most developed countries. In the marketing activity, these differences may well come from direct marketing and market research rather than from advertising agencies. In leasing, the differences are explained by the resistance shown by some outlying countries to enter into leasing and renting related culture. In computer services, the reasons lie in the professionalisation of the activity in the most advanced countries and the very considerable growth in demand. In other services, finally, the reasons may be the concentration of many new services with greater growth.
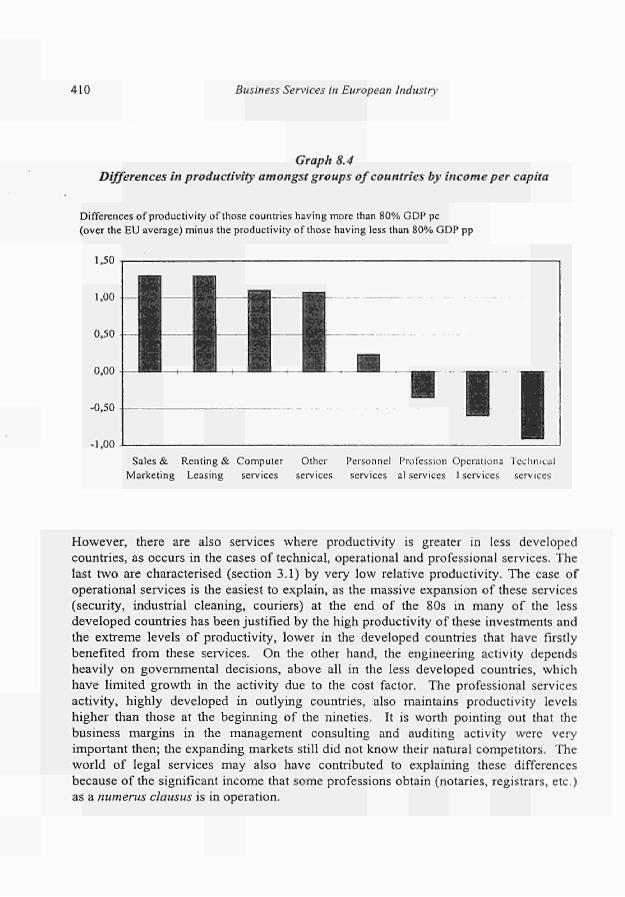
410 Business Services in European Industry
Graph 8.4 Differences in productivity amongst groups of countries by income per capita
Differences of productivity of those countries having more than 80% GDP pc (over the EU average) minus the productivity of those having less than 80% GDP pp
0,50
0,00
-0,50
-1,00 Sales & Renting & Computer Other Personnel Profession Operationa Technical
Marketing Leasing services services services al services I services services
However, there are also services where productivity is greater in less developed countries, as occurs in the cases of technical, operational and professional services. The last two are characterised (section 3.1) by very low relative productivity. The case of operational services is the easiest to explain, as the massive expansion of these services (security, industrial cleaning, couriers) at the end of the 80s in many of the less developed countries has been justified by the high productivity of these investments and the extreme levels of productivity, lower in the developed countries that have firstly benefited from these services. On the other hand, the engineering activity depends heavily on governmental decisions, above all in the less developed countries, which have limited growth in the activity due to the cost factor. The professional services activity, highly developed in outlying countries, also maintains productivity levels higher than those at the beginning of the nineties. It is worth pointing out that the business margins in the management consulting and auditing activity were very important then; the expanding markets still did not know their natural competitors. The world of legal services may also have contributed to explaining these differences because of the significant income that some professions obtain (notaries, registrars, etc.) as a numerus clausus is in operation.

The Location of Business Services in Europe 411
Less developed countries have higher "productivity" than the most developed in technical services. Two reasons can be pointed out to explain it: 1) large engineering works have been carried out in developing regions, many of them co-financed by the European Community funds ( mainly the ERDF and the Cohesion Fund); 2) during a relatively long period, the limited dimension of engineering and public works markets offered great opportunities to grow and to get high productivity levels. However, this last reason has been diminished recently by greater international competition, transparency and mobility in the activity. "Productivity" levels have decreased relatively in those countries, forcing some companies to undergo restructuring and/or to merger with national or multinational companies.
412 Business Services in European Industry
8.5 Conclusions
The results obtained enable us to draw a number of important conclusions regarding the
■ two hypotheses set down in the introduction. They also suggest several closing remarks.
1. As the processes of internationalisation are integrating the different countries in
Europe and mobility at every level (people, resources, techniques, etc.), continues
to push forward the barriers in business services, we can consider that some
location theories applied to an urban or regional level have an analogy at an
international level. To be specific, it is possible to verify partly where European
business services are located, to what degree they are concentrated in any area and
the role productivity plays in these processes.
2. There is a clear correlation between the level of development reached in the
different European countries (measured in terms of GNP per capita) and the
concentration of business services. This does not prevent a certain disorder in the
intermediate levels of GNP pc , as occurs in Italy and Belgium (with a lower level
of business services per inhabitant than would seem to correspond logically with
their income), and in the United Kingdom (where the number of business services
per inhabitant -concentration- is much higher than in countries with the same level
of income).
3. In general, the less wealthy countries have a better-developed business service
sector than one might expect from their economic size. It cannot be affirmed that
the sector is more concentrated at an international level than the economy as a
whole. An analysis must be carried out for each activity. The most traditional
activities emphasise the hypothesis of decentralisation most strongly: operational
services, some marketing and many administrative services. On the other hand,
engineering, computer, information services and human resources stress the
concentration in the wealthiest countries. The discriminating factors seem to be the
traditional nature or advanced nature of the service, the nature of some services, the
current situation of markets and the levels of relative wealth over the personalised
or standardised nature of the service. In this context, the argument that services
with greatest value added resist the processes of decentralisation could be valid, at
least up to the beginning of the nineties
4. The existence of many activities in countries in lower positions than one might
expect, due to their economic size, leads one to assume that there is still great
potential for growth in the sector.
5. Our analysis through the principal components technique shows the existence of
two non-correlated indices which can be called "productivity" and "volume".
Whether the country has a big or small business services volume does not
necessarily mean it should be correlated with higher or lower levels of productivity,
as it is defined in this chapter. Business service productivity is related to economic
income per capita, but not to the economic volume. This is a logical result when
considering a statistical sample of 96 activities groups ( 12 countries by 8 activities)
with specific situations in each of them. Then, since productivity does not depend
The Location of Business Services in Europe A13
on volume, clusters of countries can be established according to the type of activity. Although the individual situation in each country and sector does not allow us to draw very general conclusions, it is possible to deduct that there are associations between large and small countries with pertinent results according to the activity considered.
6. The big European countries, such as Germany, France and the United Kingdom reach a high level of "productivity" in a number of key business services activities and with high value added. The differences in productivity are particularly significant when compared to the less developed European countries. These ones are clearly less productive in most of the services of greater value added: leasing, marketing, computers and other services. In contrast, they are more productive than the rich countries in services that either have lower value added (some professional and operational services), or thrive in especially favourable market conditions (as occurs in technical services or in some professional ones).
These conclusions would be qualified if factors that are more difficult to quantify could be taken into account, such as the ownership of the principal business services companies, the places where decisions are taken and the countries where innovation and research are focused. If these were taken into account, it could result in some business services activities, that are apparently more productive in less developed countries (as in the case of technical services and some professional ones), being linked to and more dependent on the more developed countries. Nonetheless, the simple distinction between rich countries in the EU with highly developed business services and less rich countries of the EU with lower development in business services is not illogical in itself. Similar differences, or greater ones, could be found in comparing other manufacturing or service sectors.
Finally, it is worth noting that if productivity, despite all the problems measuring of it, is the main factor in the growth of countries and sectors, the fact that some business services could be productive in the more outlying regions and countries is, surely, a guarantee to stimulate the total productivity of factors and encourage the reduction of differences amongst countries. However, the follow-up and analysis of the evolution of different business services still falls short of desirable research needs. There is a paucity of adequate statistical information and this represents one of the most pressing gaps to be filled by national economic, statistical and political authorities.
A final and important observation: The empirical analysis presented here has been developed from a fairly limited database, although it is the only one available one at European Union level. Some conclusions might be modified if we had more statistical information at our disposal and more extensive temporal coverage. If this is the case, some of the conclusions highlighted here would be qualified and possibly other changes and/or new trends of interest would be observed.
414 Business Services in European Industry
References
Aharoni, Y. (Ed.) (1993) Coalitions and competition: the globalization of professional
business services. Routledge, London and New York.
Airoldi, Α.; Bianchi, G; Gambardella, Α.; Senn, L. The impact of urban structure on the
location of producer services. The Service Industries Journal, vol 17, No 1:91114.
Bailly, A; Coffey, W.; Paelinck, J. H. P.; Polése, M. (1992) Spatial Econometrics o f Services.
Avebury, Aldershot.
Barò, E.; Soy, Α. (1993) Els serveis a les empreses a la Regió Metropolitana de Barcelona
Quaderns de Competitivitat. CEP, Barcelona.
Barò, E.; Soy, Α. (1993) Business service location strategies in the Barcelona metropolitan
region. In Daniels et alt. The Geography of Services. Frank Cass, London.
Bhagwati, J. (1987) "International trade in services and its relevance for economic
development" in Giarini, O. (Ed.), The emerging service economy. Pergamon Press, Oxford.
Bonamy, J.; Valeyre, A. (1994) Services, relation de service et organisation. In Bonamy, J.
and May, N. Bonamy, J. and May, Ν Services el mutatons urbaines: questionnements el
perspectives. Anthopos, Economica, Paris.
Enderwick, P. (Ed.) (1989) Multinational service firms. Rouledge, London.
European Commission (1993) Panorama de l'industrie communautaire 1993. European
Commission, Luxembourg.
European Commission (1994). Panorama of EC Industry ¡994. European Commission,
Luxembourg.
Eurostat ( 1995) Business Services in Europe. Eurostat, Luxembourg.
Coffey, W.J; Polése, M. (1987) "Trade and location of producer services". Environment and
PlanningA, 19/5:597611.
Coeffy, W. J.; Shearmur, R. G. (1996) The growth and location of high order services in the
Canadian urban system, 19711991. North American Meetings of the Regional Science
Association International. Washington, D.C., November 1417 1996.
Cuadrado Roura, J.R.; Del Río Gómez, C. (1993) Los servicios en España. Pirámide, Madrid.
Cuadrado, J. R.; Rubalcaba, L. (1993) Regional Trends in Business Services Supply in Spain.
In Daniels et alt. The Geography of Services. Frank Cass, London.
Daniels, P.W. (1993) Service industries in the world economy. Blackwell, Oxford.
Dicken, P. (1992): Global Shift. The Internationalization of Economic Activity; The Guilford
Press, New York and London.
Ellger, C. (1997) Planning Christallerian landscapes: the current renaissance of central place
studies in East Germany. The service Industries Journal, vol. 17, NO 1: 5 I 68.
Enderwick, P. (Ed.) (1989) Multinational service firms. Rouledge, London.
Esparza, Α.; Krmenec, Α. (1994) "Producer services trade in city systems: evidence from
Chicago". Urban Studies, 31 (I); February 1994: 2946.
Eurostat (1995) Business services in Europe. Eurostat, Luxembourg.
Eurostat (1996) National Accounts. Eurostat, Luxembourg.
Gadrey, J. (1992) L'économie des services. La Découverte, Paris.
Hansen, N. (1990) "Do producer services induce regional economic development? Journal of
Regional Science Vol 30, No 4: 465476
Illeris, S.; Phillipe, J. (1993). "Introduction: the role of services in regional economic
growth". In Daniels et alt. The Geography of Services. Frank Cass, London.
Illeris, S. (1994) "La localisation des producteurs et utilisateurs de services". In Bonamy, J.
and May, N Services et mutatons urbaines: questionnements et perspectives. Anthopos,
Economica, Paris.
The Location of Business Services in Europe A15
Illeris. S. (¡996) The service economy: a geographical approach. John Wiley & Sons, Chichester. Jayet, H. (1994) "Services et space". In Bonamy, J. and May, N Services et mutatons urbaines: questionnements et perspectives. Anthopos, Economica, Paris. Marshall, N; Damesick, P. Wood, P. (1987) Understanding the location and role of producer services in the United Kingdom. Environment and Planning A: 19: 575-96. Marshall, J.N. (Ed.) (1988) Services and uneven development. Oxford University Press, Oxford. Marshall, N; Wood, P. (1995) Services & Space. Key aspects of Urban and Regional Development. Longman Singapore Publishers, Singapore. Martinelli, F. (1991) "Branch plants and services underdevelopment in peripherical regions: the case of southern Italy" in Daniels, P.W., Moulaert, F. (Eds), The Chanching Geography of Advanced Producer Services. Belhaven Press, London. May, N. (1994) Introdcution to Bonamy, J. and May, N Services et mutatons urbaines: questionnements et perspectives. Anthopos, Economica, Paris. Moulaert, F.; Gallouj, C. (1993) The locational geography of advanced producer firms: the limits of economies of agglomeration. In Daniels et alt. The Geography of Services. Frank Cass, London. Noyelle, T.J; Dutka, A. (1988) International Trade in Business services. American Enterprise Institute. Ballinger publication, Washington DC. Nusbaumer, J. (1987) Services in the global market. Kluwer, Boston. O'Farrell, P.; Wood, P. (1996) "Regional Influences on Foreign Market Development by Business Service Companies: American Perspectives on UK Evidences". 43r" North American Meetings, Regional Science Association International, Washington DC, November, 14-17 1996. OECD (1995) Liberalisation of trade in professional services. OECD Documents, Paris. Ruane, F. (1993) "Internationalization of services: conceptual and empirical issues". European Economy, 3: 109-124. Rubalcaba Bermejo, L. (1993) "La internacionalización de los servicios a empresas". Información Comercial Española, 719: 148-167. Rubalcaba Bermejo, L. (1997) Los servicios a empresas en Europea: crecimiento y asimetrías. Tesis doctoral. Universidad de Alcalá, Madrid. Senn, L. (1993) "Service activities, urban hierarchy and cumulative growth". In Daniels et alt. The Geography of Services. Frank Cass, London.
416 Business Services in European industry
Annex 8.1. Application of Principal Components Analysis (PCA)
Data used
This statistical application uses data from the Eurostat Pilot Survey (Eurostat, 1995) and the Panorama of the EU industry for 1990, 1992, 1993 and 1994 (European Commission, 1993, 1994). In total 19 variables are included relating to employment, turnover, number of companies, measures of productivity, investment, characteristics of employment, characteristics of companies and growth. After studying the atypical ones and checking the comparability of the different sources, in some cases estimates were carried out when data was not available. The study covers 12 countries in the Union: Germany (D), Denmark (DK), Spain (E), France (F), Italy (I), Ireland (IRL), Luxembourg (L), the Netherlands (NL), Portugal (Ρ), Sweden (S), Finland (SF) and the United Kingdom (UK). There are eight sectorial groups: computer services (INF), professional activities (PRO), marketing and marketing activities (VT), technical production services (TEC), leasing (ALQ), selection and personnel services (PER), operational services (OP) and other business services activities (OT). All the data is grouped together in a single matrix with a range of 124x24 (cases χ variables). To the 19 variables used previously five variables relating to information on each country are added: population, GDP at market prices, GDP per capita, growth of GDP and percentage of service economy in all the sectors.
Preparation of the data
Panorama of the EU industry and the statistical supplement private data can be obtained covering 25 activities of business services, amongst them all the fundamental ones catalogued in the second source used, the Pilot Survey of Business Services. Given that for some activities the information from the Panorama of the EU industry was insufficient (e.g. temporary work, leasing) or nonexistent (e.g. design, fairs and exhibitions) several unpublished complementary reports were located, produced by the Commission. The variables finally obtained are displayed in Table A 8.1.
All the figures for the 25 subactivities have been added to the data on the eight activities of the Pilot Survey. The data on employment, turnover and number of companies are additions to each subactivity. For the growth and concentration variables weighted measures are taken according to the relative weight of the sum of previous variables. The grouping of services by activities is displayed in appendix III. There are only two notable differences between the two statistical sources: auditing in professional services is not included in the Panorama but it is in the Pilot Survey and the mixed bag activity "other services" in which there are important differences.
Overall, the data from the Panorama covers the volume and relative importance of the different subactivities in each country very well. There are, however, two problems affecting the quality of the figures: the amount of data not available and number of atypical cases. To solve the first problem, estimates are carried out using two criteria: 1) use as far as possible the other sources of information reviewed, and 2) keep the relative size of the countries in terms of the number of companies, volume of business and employment. The atypical cases, on the other hand, are identified according to box-plots and Mahalanobis preceding an individual study and, if
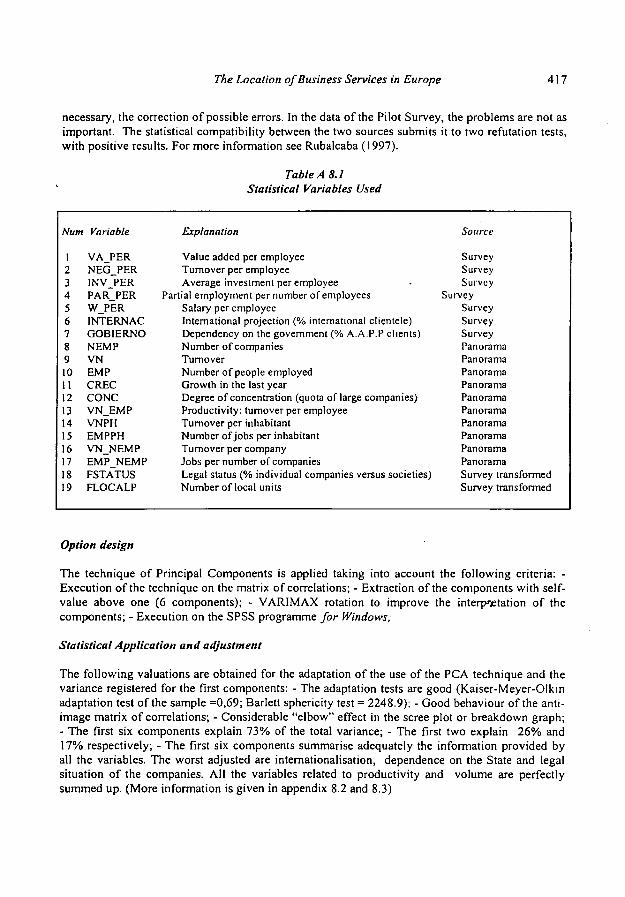
The Location of Business Services in Europe 417
necessary, the correction of possible errors. In the data of the Pilot Survey, the problems are not as important. The statistical compatibility between the two sources submits it to two refutation tests, with positive results. For more information see Rubalcaba (1997).
Table A 8.1 Statistical Variables Used
Num Variable
1 2 3 4 5 6 7 8 9 10 11 12 13 14 15 16 17 18 19
VA_PER NEG_PER INV PER PAR_PER W_PER INTERNAC GOBIERNO NEMP VN EM Ρ CREC CONC VN EMP VNPH EMPPH VN_NEMP EMP NEMP FSTATUS FLOCALP
Explanation
Value added per employee Turnover per employee Average investment per employee
Partial employment per number of employees Salary per employee International projection (% international clientele) Dependency on the government (% A.A.P.Ρ clients) Number of companies Turnover Number of people employed Growth in the last year Degree of concentration (quota of large companies) Productivity: turnover per employee Turnover per inhabitant Number of jobs per inhabitant Turnover per company Jobs per number of companies Legal status (% individual companies versus societies) Number of local units
Source
Survey Survey Survey
Survey Survey Survey Survey Panorama Panorama Panorama Panorama Panorama Panorama Panorama Panorama Panorama Panorama Survey transformed Survey transformed
Option design
The technique of Principal Components is applied taking into account the following criteria: -Execution of the technique on the matrix of correlations; - Extraction of the components with self-value above one (6 components); - VARIMAX rotation to improve the interpretation of the components; - Execution on the SPSS programme for Windows;
Statistical Application and adjustment
The following valuations are obtained for the adaptation of the use of the PCA technique and the variance registered for the first components: - The adaptation tests are good (Kaiser-Meyer-Olkin adaptation test of the sample =0,69; Barlett sphericity test = 2248.9); - Good behaviour of the anti-image matrix of correlations; - Considerable "elbow" effect in the scree plot or breakdown graph; - The first six components explain 73% of the total variance; - The first two explain 26% and 17% respectively; - The first six components summarise adequately the information provided by all the variables. The worst adjusted are internationalisation, dependence on the State and legal situation of the companies. All the variables related to productivity and volume are perfectly summed up. (More information is given in appendix 8.2 and 8.3)
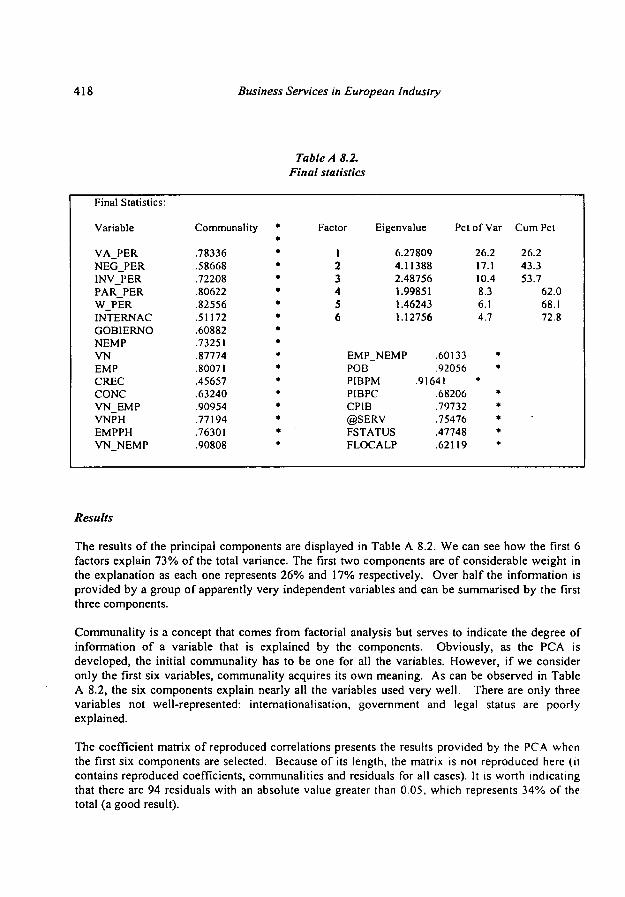
418 Business Services in European Industry
Table A 8.2.
Final statistics
Final Statistics:
Variable
VA_PER
NEG_PER
INV_PER
PAR PER
W_PER
INTERNAC
GOBIERNO
NEMP
VN
EMP
CREC
CONC
VN EMP
VNPH
EMPPH
VN NEMP
Communality
.78336
.58668
.72208
.80622
.82556
.51172
.60882
.73251
.87774
.80071
.45657
.63240
.90954
.77194
.76301
.90808
* * *
* * * • * • * « ♦
* * * * * *
Factor Eigenvalue
1
2
3
4
5
6
6.27809
4.11388
2.48756
1.99851
1.46243
1.12756
EMP_NEMP
POB
PIBPM
PIBPC
CPIB
@SERV
Pct
.60133
.92056
.91641
FSTATUS
FLOCALP
.68206
.79732
.75476
.47748
.62119
of Var
26.2
17.1
10.4
8.3
6.1
4.7
• *
* * * * * *
Cum Pet
26.2
43.3
53.7
62.0
68.1
72.8
Results
The results of the principal components are displayed in Table A 8.2. We can see how the first 6
factors explain 73% of the total variance. The first two components are of considerable weight in
the explanation as each one represents 26% and 17% respectively. Over half the information is
provided by a group of apparently very independent variables and can be summarised by the first
three components.
Communality is a concept that comes from factorial analysis but serves to indicate the degree of
information of a variable that is explained by the components. Obviously, as the PCA is
developed, the initial communality has to be one for all the variables. However, if we consider
only the first six variables, communality acquires its own meaning. As can be observed in Table
A 8.2, the six components explain nearly all the variables used very well. There are only three
variables not wellrepresented: internationalisation, government and legal status are poorly
explained.
The coefficient matrix of reproduced correlations presents the results provided by the PCA when
the first six components are selected. Because of its length, the matrix is not reproduced here (it
contains reproduced coefficients, communalities and residuals for all cases). It is worth indicating
that there are 94 residuals with an absolute value greater than 0.05, which represents 34% of the
total (a good result).
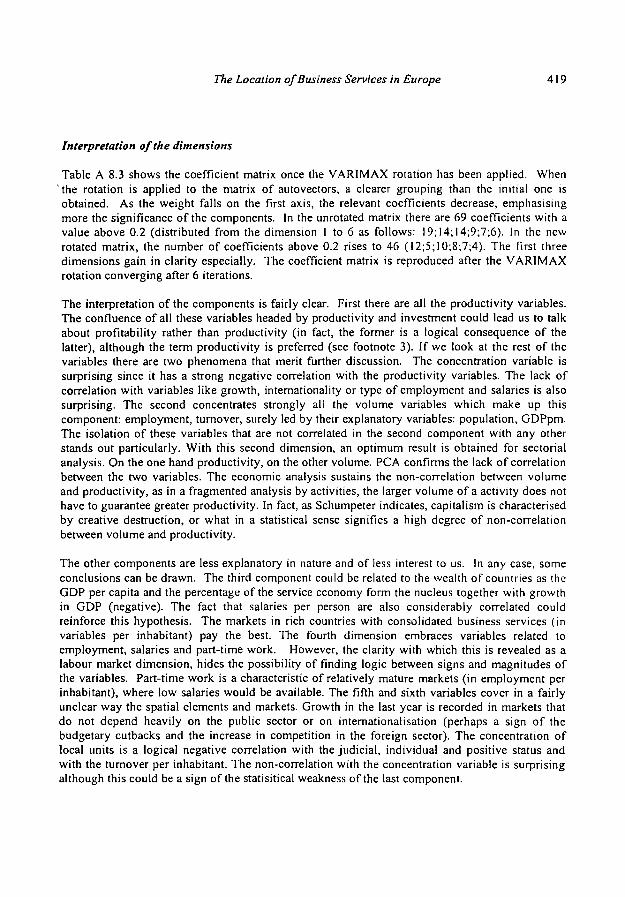
The Location of Business Services in Europe A19
Interpretation of the dimensions
Table A 8.3 shows the coefficient matrix once the VARIMAX rotation has been applied. When 'the rotation is applied to the matrix of autovectors, a clearer grouping than the initial one is obtained. As the weight falls on the first axis, the relevant coefficients decrease, emphasising more the significance of the components. In the unrotated matrix there are 69 coefficients with a value above 0.2 (distributed from the dimension 1 to 6 as follows: I9;14;I4;9;7;6). In the new rotated matrix, the number of coefficients above 0.2 rises to 46 (12;5;10;8;7;4). The first three dimensions gain in clarity especially. The coefficient matrix is reproduced after the VARIMAX rotation converging after 6 iterations.
The interpretation of the components is fairly clear. First there are all the productivity variables. The confluence of all these variables headed by productivity and investment could lead us to talk about profitability rather than productivity (in fact, the former is a logical consequence of the latter), although the term productivity is preferred (see footnote 3). If we look at the rest of the variables there are two phenomena that merit further discussion. The concentration variable is surprising since it has a strong negative correlation with the productivity variables. The lack of correlation with variables like growth, internationality or type of employment and salaries is also surprising. The second concentrates strongly all the volume variables which make up this component: employment, turnover, surely led by their explanatory variables: population, GDPpm. The isolation of these variables that are not correlated in the second component with any other stands out particularly. With this second dimension, an optimum result is obtained for sectorial analysis. On the one hand productivity, on the other volume. PCA confirms the lack of correlation between the two variables. The economic analysis sustains the non-correlation between volume and productivity, as in a fragmented analysis by activities, the larger volume of a activity does not have to guarantee greater productivity. In fact, as Schumpeter indicates, capitalism is characterised by creative destruction, or what in a statistical sense signifies a high degree of non-correlation between volume and productivity.
The other components are less explanatory in nature and of less interest to us. In any case, some conclusions can be drawn. The third component could be related to the wealth of countries as the GDP per capita and the percentage of the service economy form the nucleus together with growth in GDP (negative). The fact that salaries per person are also considerably correlated could reinforce this hypothesis. The markets in rich countries with consolidated business services (in variables per inhabitant) pay the best. The fourth dimension embraces variables related to employment, salaries and part-time work. However, the clarity with which this is revealed as a labour market dimension, hides the possibility of finding logic between signs and magnitudes of the variables. Part-time work is a characteristic of relatively mature markets (in employment per inhabitant), where low salaries would be available. The fifth and sixth variables cover in a fairly unclear way the spatial elements and markets. Growth in the last year is recorded in markets that do not depend heavily on the public sector or on internationalisation (perhaps a sign of the budgetary cutbacks and the increase in competition in the foreign sector). The concentration of local units is a logical negative correlation with the judicial, individual and positive status and with the turnover per inhabitant. The non-correlation with the concentration variable is surprising although this could be a sign of the statisitical weakness of the last component.
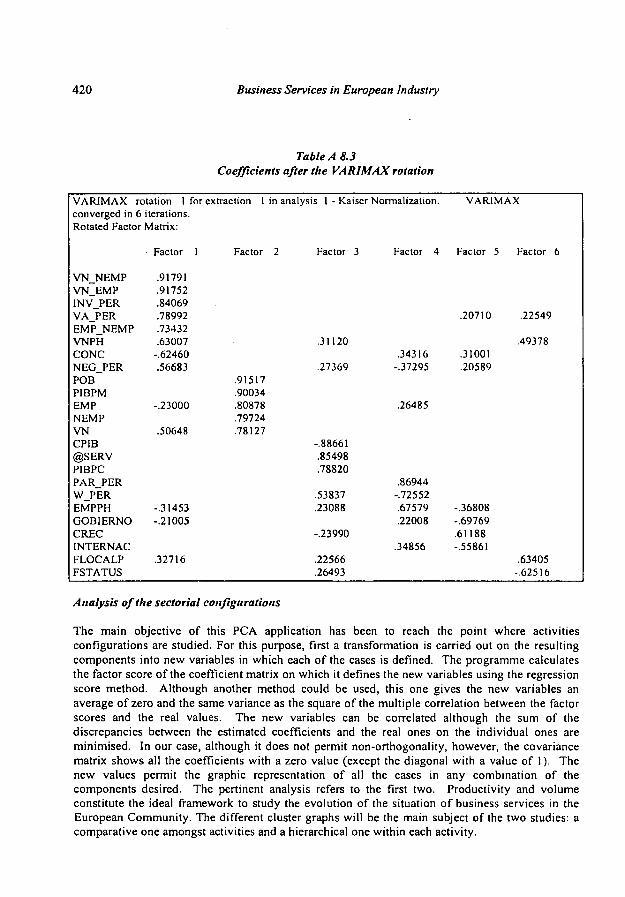
420 Business Services in European Industry
Table A 8.3 Coefficients after the VARIMAX rotation
VARJMAX converged in
rotation 1 for extraction 1 6 iterations.
Rotated Factor Matrix:
VN_NEMP VN_EMP INV_PER VA PER EMP_NEMP VNPH CONC NEG_PER POB PIBPM EMP NEMP VN CPIB @SERV P1BPC PAR_PER W PER EMPPH GOBIERNO CREC INTERNAC FLOCALP FSTATUS
Factor 1
.91791
.91752
.84069
.78992
.73432
.63007 -.62460 .56683
-.23000
.50648
-.31453 -.21005
.32716
Factor
.91517
.90034
.80878
.79724
.78127
n analysis 1 - Kaiser
2 Factor 3
.31120
.27369
-.88661 .85498 .78820
.53837
.23088
-.23990
.22566
.26493
Normalization.
Factor 4
.34316 -.37295
.26485
.86944 -.72552 .67579 .22008
.34856
VARJMAX
Factor 5
.20710
.31001
.20589
-.36808 -.69769 .61188 -.55861
Factor 6
.22549
.49378
.63405 -.62516
Analysis of the sectorial configurations
The main objective of this PCA application has been to reach the point where activities configurations are studied. For this purpose, first a transformation is carried out on the resulting components into new variables in which each of the cases is defined. The programme calculates the factor score of the coefficient matrix on which it defines the new variables using the regression score method. Although another method could be used, this one gives the new variables an average of zero and the same variance as the square of the multiple correlation between the factor scores and the real values. The new variables can be correlated although the sum of the discrepancies between the estimated coefficients and the real ones on the individual ones are minimised. In our case, although it does not permit non-orthogonality, however, the covariance matrix shows all the coefficients with a zero value (except the diagonal with a value of 1 ). The new values permit the graphic representation of all the cases in any combination of the components desired. The pertinent analysis refers to the first two. Productivity and volume constitute the ideal framework to study the evolution of the situation of business services in the European Community. The different cluster graphs will be the main subject of the two studies: a comparative one amongst activities and a hierarchical one within each activity.

77ie Location of Business Services in Europe 421
Annex 8.2 Application of the cluster analysis
The analysis carried out is a hierarchical cluster, which is the one most frequently used and the most useful. It permits us to form groups without knowing or determining beforehand the exact number. Euclidean distances are taken,
vÆ^-v This option is carried out, not because it is the most common distance but because the two main problems it causes principally remain much diminished in our case. On the one hand, the units of measurement are the same as standardised variables are analysed. On the other hand, the variables come from orthogonal vectors in which there is no correlation. The possible increase in distances that the use of the PCA variables supposes does not have to make the interpretation of such reduced groups difficult. In order to take into account all the pairs of cases and not just the most distant, or the nearest, etc., the average linkage between groups method is used.
The results requested (linkage scheme, deondogram) are not displayed here because of the lack of space. However, the definitive groups are transposed to the PCA graphs per activity. In order to form the groups that appear in graph 8.3, the distances have been taken that the deondograms have rescaled from 0 to 25. The small groups have been formed from the distance rescaled from 10, except in some cases in which this distance does not allow the formation of more than two groups (leasing, operational and professional services). In these cases, the groups have been formed at levels under 10, but very close to it (between 7 and 10). The big groups (of which only the one representing the big four, Germany, France, the United Kingdom and Italy) are formed from the distance 15.
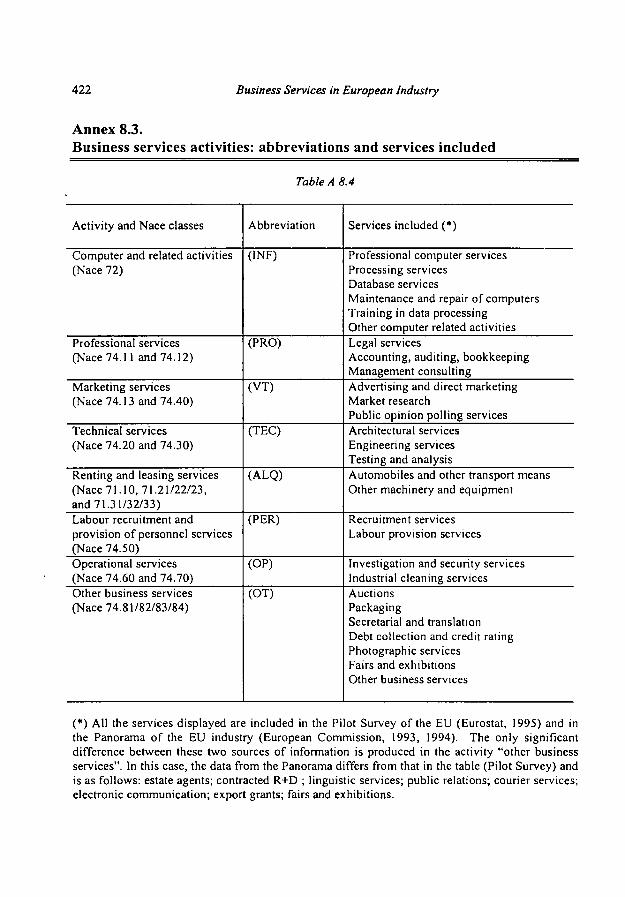
422 Business Services in European Industry
Annex 8.3. Business services activities: abbreviations and services included
Table A 8.4
Activity and Nace classes
Computer and related activities (Nace 72)
Professional services (Nace 74.11 and 74.12)
Marketing services (Nace 74.13 and 74.40)
Technical services (Nace 74.20 and 74.30)
Renting and leasing services (Nace 71.10, 71.21/22/23, and 71.31/32/33) Labour recruitment and provision of personnel services (Nace 74.50) Operational services (Nace 74.60 and 74.70) Other business services (Nace 74.81/82/83/84)
Abbreviation
(INF)
(PRO)
(VT)
(TEC)
(ALQ)
(PER)
(OP)
(OT)
Services included (*)
Professional computer services Processing services Database services Maintenance and repair of computers Training in data processing Other computer related activities Legal services Accounting, auditing, bookkeeping Management consulting Advertising and direct marketing Market research Public opinion polling services Architectural services Engineering services Testing and analysis Automobiles and other transport means Other machinery and equipment
Recruitment services Labour provision services
Investigation and security services Industrial cleaning services Auctions Packaging Secretarial and translation Debt collection and credit rating Photographic services Fairs and exhibitions Other business services
(*) All the services displayed are included in the Pilot Survey of the EU (Eurostat, 1995) and in the Panorama of the EU industry (European Commission, 1993, 1994). The only significant difference between these two sources of information is produced in the activity "other business services". In this case, the data from the Panorama differs from that in the table (Pilot Survey) and is as follows: estate agents; contracted R+D ; linguistic services; public relations; courier services; electronic communication; export grants; fairs and exhibitions.
Chapter 9
The Business Service Markets
"There is wisdom in smallness, if we bear in mind the smallness and limited nature of human knowledge, which departs more from experiment than from global understanding."
E.F. Schumacher (1973) Small is beautiful, page 31.
"A monopoly is socially reprehensible in the hands of others.'
D.W. Carlton and J.M Perloff (1994) Modern Industrial Organisation, page 143.

424 Business Services in European industry
The Business Service Markets 425
Chapter 9. The business service markets
Introduction
The aim of this chapter is, on the one hand, to discover the type of structure that characterises the supply of business services and, on the other hand, to show on what basis this structure can contribute to business services being a real factor of and not simply an expression of development. The existence of dual markets with large companies on one side and small ones on the other, could be a decisive element in the configuration of new potential competitiveness in economies. The fact that large and small firms coexist presupposes the shift of advantages, traditionally assigned to one or the other in the markets. Quality, innovation, prices, personalisation, are all aspects of the provision of services in which the two types of companies contribute their know how. The fact that the two market segments can be in a competitive framework, rather than being parallel, would make the accumulation of profits possible for all companies involved.
The chapter is organised in two sections. The first one deals with the vertical concentration of business service markets, market structure and advantages and limitation to concentration processes. This section will test the hypothesis about the duality of the market between SMEs and large companies, using the available data. The second section deals with the horizontal concentration of business service markets: the interrelations between the different activities, and the ways in which companies can diversify their services. The map of business service synergies reinforce the idea of considering business services as an heterogeneous but only one sector, with multiples interlinks within.
Finally, it is necessary to mention that this chapter on business service markets is fully complementary to other market oriented sections in former chapters. This chapter is particularly connected to section 3 in chapter 4, dealing with the economic characteristics of business service markets: time, prices, value, expectations, uncertainty, imperfect information, etc.; all are market elements already explained which are not going to be repeated here. The same applies for the regional and international differences in business services, analysed in chapter 8.
426 Business Services in European Industry
9.1. The concentration of business services
9.1.1 The concept of concentration
Several different realities lie behind the phenomenon of concentration that do not always have the same effects on the economy: purchases, acquisition, take-overs, mergers, joint ventures, franchises, joint R&D projects, collaboration agreements, etc. Indeed, it is possible to talk about concentration according to the type of economic elements that are concentrated:
Concentration of capital. In this first example, which is far from being the most important in business services, the capital of the companies is concentrated on a reduced number of owners. The most important companies buy or fusion with other firms in order to increase their influence and market share. Concentration of the market. This refers to the turnover of a market dominated by the first or first few companies. The greater the rate is, the greater the concentration will be. Economic textbooks define the degree of concentration as the proportion of sales that a few large sellers represent with regard to the total sales in the market or industry. The large business service firms constantly seek to increase their market share. Concentration of activity. In this example, a specific activity is developed by several companies. Agreements like joint ventures conserve each firm's capital and concentrate efforts in a sole activity. Concentration of products. Products can also be concentrated when certain standards are imposed due to the demand requirements or the determining factors of supply and technology. Products and production modes are concentrated creating common ground between companies that were initially different. Product concentrations are the direct result of the concentration of activities and capital. Concentration of relationships. In markets highly conditioned by information, such as business services, the concentration of information and relationships is a key to the co-ordination and expansion of the companies' plans. In this way, the phenomena of networks reviewed earlier would impose its logic through which (conserving capital, activities and products) companies collaborate for support and mutual benefit. This last kind of 'symbiotic' concentration is of most interest at the present time for European business services.
These different kinds of concentration require different evaluations. For example, the European Union imposes barriers to the concentration of capital related to market concentration (the competition policy) but it encourages the rest of the concentrations (industrial co-operation policy). The European Commission considers the co-operation between companies to be one of the guiding factors in the integration of markets; it is held to be an objective of Community policies through company law, intellectual rights and fiscal status of companies (EC, 1990). In general, the concentration of capital tends
The Business Service Markets 427
to be judged in a negative way whenever it supposes a loss of social well-being in a monopolistic sense. In contrast, the other concentrations are thought to be positive when they improve the standard of living and allow for innovative co-operation, the transmission of knowledge and integration of markets.
9.1.2 Factors explaining concentration
When we talk about concentration we usually refer to classical concentration of capital and markets, through two modes: vertical and horizontal concentration. The first represents the concentration produced within the same activity, whilst the second includes different activities.
Vertical concentration has been justified in several ways within services (Noyelle, 1991): 1) in the need to meet higher cost investments, 2) in following the clients wherever they move, and 3) in the generation of scale economies reducing the cost of the service. Recent explanations link the concentration processes to the internationalisation ones. The concentration in manufacturing and service industries push business service companies to concentrate as well, since in this way they can meet the new international requirements.
Horizontal concentration, on the other hand, seeks to broaden the product range using the existing synergies between different activities, hence obtaining scope economies. Using these synergies (see next section), it is possible to move towards more profitable activities, develop long-term strategies, in order to 'package the services as a system' (Schlossberg, 1989). These reasons are not exclusive, but can all be reconciled in one objective, as occurs with the option for integrated marketing.
The reasons behind vertical or horizontal concentration do not always correspond to attainment of economies of scale or scope. Occasionally, each sector or company adopts a separate strategy. For instance in financial services, the process of mergers and acquisitions is more a response to the expectations created than to obtaining impossible scale economies or new costly investments.' As The Economist (1997, page 6) stated about the management consultancy: "Consultancies have to decide whether to grow organically or by acquisition. Growing organically can be attractive, but is bound to be slow. It takes almost a decade... Therefore a growing number of companies, A.T. Kearney and Mercer Management foremost among them, have chosen growth by acquisition. Yet such acquisitions are fraught with danger. The company you bought may not live up to your standards. Or you may find that you have bought a lot of hot air." In many instances the expansion strategies represent an attempt to maximise in the market reputation and the total income that companies tend to maximise in their internal management (when appropriate, the Baumöl model on maximisation of total income) over what would be a maximisation of profits.
The need for heavy investment is standard in expanding activities. A mature sector like banking has serious management problems in this sense.
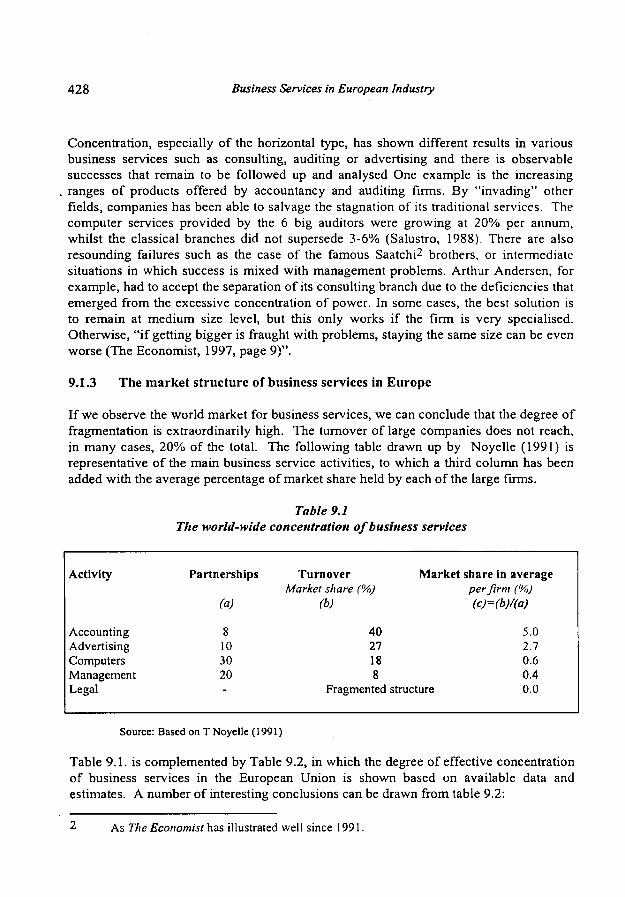
428 Business Services in European Industry
Concentration, especially of the horizontal type, has shown different results in various business services such as consulting, auditing or advertising and there is observable successes that remain to be followed up and analysed One example is the increasing ranges of products offered by accountancy and auditing firms. By "invading" other fields, companies has been able to salvage the stagnation of its traditional services. The computer services provided by the 6 big auditors were growing at 20% per annum, whilst the classical branches did not supersede 3-6% (Salustro, 1988). There are also resounding failures such as the case of the famous Saatchi2 brothers, or intermediate situations in which success is mixed with management problems. Arthur Andersen, for example, had to accept the separation of its consulting branch due to the deficiencies that emerged from the excessive concentration of power. In some cases, the best solution is to remain at medium size level, but this only works if the firm is very specialised. Otherwise, "if getting bigger is fraught with problems, staying the same size can be even worse (The Economist, 1997, page 9)".
9.1.3 The market structure of business services in Europe
If we observe the world market for business services, we can conclude that the degree of fragmentation is extraordinarily high. The turnover of large companies does not reach, in many cases, 20% of the total. The following table drawn up by Noyelle (1991) is representative of the main business service activities, to which a third column has been added with the average percentage of market share held by each of the large firms.
Table 9.1 The world-wide concentration of business services
Activity
Accounting Advertising Computers Management Legal
Partnerships
(a)
8 10 30 20 -
Turnover Market share (%)
(b)
40 27 18 8
Fragmented
Market share in average
structure
per firm (%) (c)=(b)/(a)
5.0 2.7 0.6 0.4 0.0
Source: Based on Τ Noyelle ( 1991 )
Table 9.1. is complemented by Table 9.2, in which the degree of effective concentration of business services in the European Union is shown based on available data and estimates. A number of interesting conclusions can be drawn from table 9.2:
As 77ie Economist has illustrated well since 1991
The Business Service Markets 429
1) The business services activities are very fragmented
The number of business services companies is very high. On average, each activity has 40,000 companies, although there are great deviations from this average. The traditional activities have the highest number of companies: legal services, engineering, accounting or estate agents. Some more modem activities have a lower number of companies; between 500 and 5000 companies embrace electronic communication, direct marketing, market research, public relations, inspection and control and security services. There are only two activities with less than 500, R&D under contract and fairs and exhibitions, which are poorly covered statistically.
2) There is a relatively low but growing concentration
The market share of the most important companies in each activity indicates the concentration of the market. As shown table 9.2, the greatest concentrations are registered in electronic communication (80%), export support (65%), security services (62%), advertising (55%), car hire (50%), fairs and exhibitions (40%), temporary work (35%) and cleaning services (35%). Other business services have very low percentages: accounting (10%), computer services (9%), management consulting (8%), industrial engineering (7%) or legal services (2%). However, in some of these business services, there are many "out-competition" niches, in the sense that many of the professionals gathered together in small companies deal with market segments that are practically ignored by the large companies. Hence it is estimated that in the markets where competition is strong, for example, accounting services, the share of the large 20 can be in the order of 50%, of which the majority corresponds to the Big 5. In temporary agencies, Manpower and its new rival together account for only around 15% of the world market (The Economist, 1996a), but in certain type of works, countries and cities the percentages for the first two are much stronger.
The pace of mergers and acquisitions marks the current concentration dynamic. In fact, it is already generalised in activities such as auditing, IT services, market research3, electronic information services^ and security5. The same process is beginning to appear in management, engineering, estate agents, market research, courier services and advertising.
3 Strong tendency mainly due to the decrease of margins and to a degree of excess supply.
4 One of the most concentrated activities today. Even ten years ago, "The Services Barometer" (1989a), 29, page 8-9.
5 The incorporation of Esabe is symptomatic of the international expansion of Securitas in Spain.
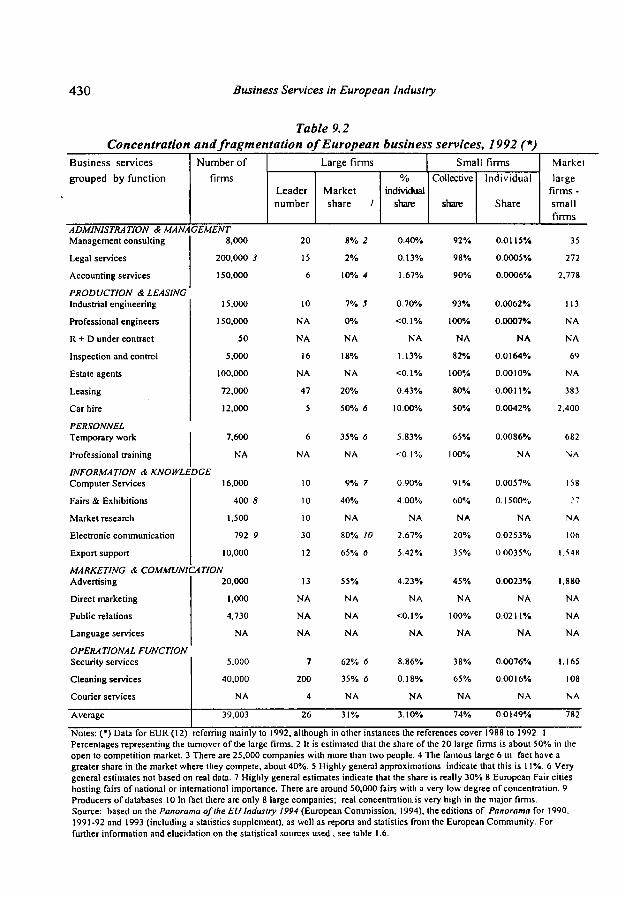
430 Business Services in European Industry
Table 9.2 Concentration and fragmentation of European business services, 1992 (*)
Business services
grouped by function
Number of
firms
Large firms
Leader number
Market share I
% individual
share
Small firms Collective
share
Individual
Share
Market.
large firms -small firms
ADMINISTRATION <* MANAGEMENT Management consulting 8,000
Legal services
Accounting services
PRODUCTION & LEASING Industrial engineering
Professional engineers
R + D under contract
Inspection and control
Estate agents
Leasing
Car hire
PERSONNEL Temporary work
Professional training
INFORMATION & KNOWLE Computer Services
Fairs & Exhibitions
Market research
Electronic communication
Export support
MARKETING & COMMUNI! Advertising
Direct marketing
Public relations
Language services
200,000 3
150,000
15,000
150,000
50
5,000
100,000
72,000
12,000
7,600
NA
DGE 16,000
400 5
1,500
792 9
10,000
NATION 20,000
1,000
4,730
NA
20
15
6
10
NA
NA
16
NA
47
5
6
NA
10
10
10
30
12
13
NA
NA
NA
8% 2
2%
10% 4
7% 5
0%
NA
18%
NA
20%
50% 6
35% 6
NA
9% 7
40%
NA
80% 10
65% 6
55%
NA
NA
NA
0.40%
0.13%
1.67%
0.70%
<0.1%
NA
1.13%
<0.1%
0.43%
10.00%
5.83%
<0.l%
0.90%
4.00%
NA
2.67%
5.42%
4.23%
NA
<0.1%
NA
92%
98%
90%
93%
100%
NA
82%
100%
80%
50%
65%
100%
91%
60%
NA
20%
35%
45%
NA
100%
NA
0.0115%
0.0005%
0.0006%
0.0062%
0.0007%
NA
0.0164%
0.0010%
0.0011%
0.0042%
0.0086%
NA
0.0057%
0.1500%
NA
0.0253%
0.0035%
0.0023%
NA
0.0211%
NA
35
272
2.778
113
NA
NA
69
NA
383
2.400
682
NA
158 17
NA
106
I.54K
1.880
NA
NA
NA
OPERATIONAL FUNCTION Security services
Cleaning services
Courier services
Average
5,000
40,000
NA
39,003
7
200
4
26
62% 6
35% 6
NA
31%
8.86%
0.18%
NA
3.10%
38%
65%
NA
74%
0.0076%
0.0016%
NA
0.0149%
1,165
108
NA
782
Notes: (*) Data for EUR (12) referring mainly to 1992, although in other instances the references cover 1988 to 1992 I Percentages representing the turnover of the large firms. 2 It is estimated that the share of the 20 large firms is about 50% in the open to competition market. 3 There are 25,000 companies with more than two people. 4 The famous large 6 in fact have a greater share in the market where they compete, about 40%. 5 Highly general approximations indicate that this is 11%. 6 Very general estimates not based on real data. 7 Highly general estimates indicate that the share is really 30% 8 European Fair cities hosting fairs of national or international importance. There are around 50,000 fairs with a very low degree of concentration. 9 Producers of databases 10 In fact there are only 8 large companies; real concentration is very high in the major firms. Source: based on the Panorama of lhe EU Industry 1994 (European Commission, 1994), the editions of Panorama for 1990. 1991-92 and 1993 (including a statistics supplement), as well as reports and statistics from the European Community. For further information and elucidation on the statistical sources used . see table 1.6.
7Vier Business Service Markets 431
The process of mergers, purchases, acquisitions and take-overs occurs within the framework of a number of factors: the trend towards the internationalisation of markets; the expectations created regarding the single market; the facilities provided by the
. fluidity of the financial markets; and the lag caused by the spectacular explosion of manufacturing concentration levels (business services have followed their clients' trends). The singularity of the process lies in the fact that in this way a "fast track" is used; negotiations or the purchase is easier and faster than "natural development". In this sense, the contention that this integration implies a structural, cultural and organisational change is borne out at the end of the eighties, when these phenomena grew fast (Hogg, and Syrett, 1989).
3) concentration is not opposed to fragmentation
As can be observed, market fragmentation is a general characteristic of many of the business services activities. Usually, fragmentation is understood to be an antithetical concept to concentration but in fact they are not antonymous. An activity can be very concentrated whilst having a large number of companies and vice versa. In the results shown in table 9.2 it can be observed that an activity like advertising with nearly 20,000 firms has a concentration in the first 13 with 55% of the market. An activity like management consulting, with "only" 8,000 firms has a concentration of 8% in the top 20 consulting firms.
There are a large number of firms even in the most concentrated activities. The case of accounting and auditing is paradigmatic although it goes beyond the available data; it is a response to the typical concentration process through huge multinationals, the now big 4, that coexist with local niche firms. The oligopoly formed only dominates a segment of the market. In general, there is not a functional logic in the concentration by activities. It meets the unique characteristics of each activity. There are fragmented and concentrated markets in innovative functions, in mature activities or in any specific group.
The lack of equivalence between concentration and non-fragmentation leads one to think that there is not a fixed relationship between competition and concentration. It is true that the latter is stimulated by strong competitive pressures. However, the reverse is not true: a variation in competition in a specific direction should not be expected from greater concentration. The segmentation of markets and insufficient levels of information place limits on the causal relationship between concentration and competition. All that can be indicated is that high levels of concentration and competition generate instability at the same time (Noyelle, 1991). Competition depends on the situation of the different markets and their development, where the existing concentration is just one factor explaining competition.
The activities with greatest competition between firms are those with a strong current expansion -courier services- and the most traditional ones -engineering, auditing,
432 Business Services in European Industry
advertising, IT services, fairs and exhibitions, market research-. In some activities such as advertising (Jerry, 1989; European Commission 1994), the effects of competition are extremely important.
4) Market share and duality in the markets
The last four columns of table 9.2. analyse the market share of large and small companies in each case. The market share of a large firm is ascertained, in order to compare it with that of a small company. In this way, the final column deducets the difference in market share between a large and a small company in the same activity.
The market share of a large company gives different sectorial results compared to the market share of the top firms group all together. Activities in which individual firms have a greater influence on the market as a whole (not in the segments in which it operates) include car hire (each one has 10% of the market), security services (8.9%), temporary work (5.8%), export support (5.4%), advertising (4.2%), fairs and exhibitions (4%), electronic communication (2.9%) and accounting (1.7%). Some traditional services do not reach 1% per firm (computer services, engineering, management), and others scarcely reach 1% (legal services, estate agents, professional training, public relations).
The market share of a small company also differs substantially according to the activity under consideration. A small exhibition centre participates on average with 0.15% of the market. A small electronic communication product 0.025%, and a small public relations company 0.021%, on average. The majority of activities have a percentage below 0.01%, with some under 0.001% (legal services or accounting), hence small companies are really only a drop in the ocean.
The division between the market share of a large company and that of a small company indicates how much more powerful a large firm is than a small one. The difference in market power is more significant in accounting; a large firm has 2,778 times more power than a small one. There are also notable differences in car hire firms (2,400), advertising (1,880), export support (1,548) and security services (1,165). The difference between large and small firms is less noticeable in legal services (272), computer services (158), engineering (113), cleaning services (108), electronic communication (106), inspection and control (69) management consulting (35) and fairs and exhibitions (27).
These results manifest the duality in the business service markets with big differences between large and small firms. It can be observed how the most dual markets are the ones that can offer greater scale economies and where there will be a greater trend towards the segmentation of markets by size. The scale economies of a large auditor establish segmentation of the market in such a way that a small accountant-auditor has a totally different segment of the market. In the most extended markets, where a large firm is 1000 times more powerful than a small one, scale economies and the market
The Business Service Markets 43 3
niches justify much of this coexistence. However, this duality does not mean the is not competition between large and SME firms. This only means that the specific size oriented market are more relevant than the ones where large and SME firms compete with each other.
9.1.4 The limitations of concentration
In general, the concentration of business services is still in an initial phase if we compare it with that of other services -banking, insurance, tourism, etc.- and especially with manufacturing. The frenzied pace of acquisitions and mergers in manufacturing has intensely been felt in some activities -auditing, management, security, computer services, market research-. Is the duality of the sector due to a time lag or are there special limits that hinder concentration in business services?
The answer to this question depends on three issues. First, whether the existence of a "temporary" concentration should be considered as a "good and irreversible" process. In manufacturing itself, concentration has shown the limitations and dangers of an excessive accumulation of power, a clear example can be found in automobile manufacturing^, which has changed its strategy in recent years. Second, services and especially business services, require a personalised approach; in contrast to what happens in the consumption of goods, knowledge and information which the client possess are indispensable since the client is the "co-producer". Third, faced with a growing process of market sharing, the level of fragmentation or concentration should be measured according to the different segment.
Traditional concentration in both vertical and horizontal forms displays limitations in the following manner:
1. Loss of closeness and personalisation. When a company grows, the relationship between client-supplier becomes more distant as regards the original point of contact since the group of people that maintained the co-production of the service change its position. Through promotion within the organisation or being responsible for a greater number of tasks, the high qualified suppliers have less time to daily service with clients (co-production work), and, hence, tempt to send them less experienced and less qualified staff to do the work after the settlement of the deal.
In the seventies, it showed how the costs of the accumulation of power increased more rapidly than the profits generated by them and an increasing number of car makers was emerged in the last 15 years. This has been changing back recently according to the new wave of European mergers (BMW-Rover, VW-Rolls Royce, Daimler-Benz-Chrysler). However these mergers are produced to face shrinking of profits when prices are falling faster than productivity rises in a very competitive environment (The Economist, 1999, p. 23-25)

434 Business Services in European Industry
2. Loss of comparative advantage. The personalisation of the service guides the taking of comparative advantages that are diluted when the supplier is so big that he carries out the same services as the competitors.
3. Negative expectations. As they give all their know-how to individual clients and collaborators of service partnerships, they do not always accept certain kinds of purchases or mergers (Chapignac, 1990); growth is associated with the future loss of closeness and gain in future conflicts. At other times, a merger can signify too much standardisation. For example, in activities such as advertising, the concentration process must take care of preservation of variety when clients want it: "advertising agencies have merged to provide their customers with a one-stop shop. But some of the clients stubbornly prefer variety" (The Economist, 1996b, page 82).
4. Strong product differentiation. The existence of differentiated products through specialisation and the spectrum of client perceptions prevents a concentration that would do away with the personalisation of products through standardisation. It forces large firms to operate like their smaller counterparts offering different and personalised products even within the same large company. The huge range of "type" products in services favours the fragmentation of the markets.
5. Lack ofinformation on the markets. The lack of information and the problems of asymmetric information related to it favour the autonomy and segmentation of the markets, allowing for differences in quality and prices. The difficulties in carrying out comparisons and the costs of information on other suppliers form part of the exchange costs favouring the fragmentation of the business service markets.
6. Size as a generator of conflicts. This problem emerges especially within horizontal concentrations. There are four typical limitations: a) through wanting to do everything, nothing can be done well; b) it is not easy to get staff with different objectives working together; c) in the user companies, distrust is aroused when services are contracted
that could be incompatible, as can sometimes happens, for example, between computer services and management consulting (Clavaud, 1991), when management companies set at the first "independent" recommendation to buy the computer services provided by the same company);
d) growing organisational difficulties in the management of large firms.
7. Movement of optimum size. As the size of the markets is conditioned by the existence of an optimum number of companies operating efficiently in the market according to demand functions, business services can raise their optimum number through new economies. This factor merits a longer
The Business Service Markets 435
explanation. The classical point of view7, that develops the theories of competitive advantage in international trade, establishes a number of balancing agents according to the functions of costs and the possibilities of generating economies of scale (for a given product) or of scope (for a range of products that use the same inputs). The application of these theories to services, according to Sapir (1993), reveals two basic determining factors of the demand curve. First, it allows an efficient producer to operate at minimum cost (natural monopoly; there is room for one only enterprise achieving scale economies and overcoming large fix and sunk costs), or several producers (natural oligopoly) or many suppliers (perfect competition). Some of the monopolies or oligopolies that exist in telecommunication, rail, airway, audiovisual and other services can be explained in this way. Business services stay, according to Sapir, in the block called monopolistic competition. Second, the demand conditions also dictate if the products are homogenous or differentiated. This depends on the degree of substitutability perceived between the competing products. If this is high, homogeneity will be high. Business services represent extremes according to these two criteria, as they permit the existence of many companies and they represent the maximum differentiation between products through three distinctive features: the existing attributes, the quality of the services and spatial location. These three factors explain in large part the fragmentation of the business service markets. The appearance of duality in business services would seem to modify some of the classical presuppositions, when the concentration of business services cannot be justified on monopolistic markets or standardised products but has to justify itself in unexpected scale economies generated by the innovation and generalisation of new technologies. The constant growth in demand and the level of quality and personalisation of the services must be added to this.
8) Establishment of a network economy. A different approach is slowly being imposed across Europe as an alternative to concentration. This is radial development, one of the most interesting economic phenomena of the present time. Networks are the main exponent of the modem economic development in services. They facilitate the real expansion of the market without implying an excessive and complicated accumulation of power. Networks as several European researchers have examined**, represent the organisational form of business services in the future. It has been proven that major international networks increase economies of scale and scope through the introduction of new technologies, widening the product range and improving professional reputation. In this way, added entrepreneurial gains are achieved, such as
There are "non-classical" points of view, bearing in mind elements that are more "real": innovation, power or domination, etc.
For example the works of the RESER members (Services & Space Network) and the RESER reports (1995).
436 Business Services in European Industry
increasing the entry costs for other competitors (Noyelle and Dutka, 1988). The European Commission has not adopted a specific approach as regards the type of integration that would be ideal (vertical concentration, horizontal concentration, networks)^, instead it attempts to promote all manners of agreements, collaborations and constitutions to integrate the markets to a greater extent. Chapter 10 will explain in more details the possible policies related to this area. In many cases, a network is a long-term strategy to provide a service in a broad consortium -not necessarily of the same branch-10, and access in this way the markets more easily. For this reason, it is a process that is more developed where the business service economy has a longer tradition. This has been studied in countries such as Spain, where the scant information available revealed a certain delay in the construction in the radial fabric (Cuadrado and Rubalcaba, 1993). There is no uniform sectorial logic but the creation of networks seeks geographical proximity (in the provinces), or national or international potential markets (in large cities).
9.1.5 The duality of the business service markets
It can be deducted from the above that the business service markets have a dual structure. On one side, the large partnerships and, on the other, small companies; concentrated, oligopolistic segments next to hugely disparate segments. Of course, there is a great space between them. Medium size companies and specialised companies are normally between them, charring characteristics from both extremes of the markets. However, duality is a typical business service profile with respect to other industrial markets. The dynamics of each end is even dual; as can be observed in many activities, for example, in auditing (as Aoulu and Quint, 1991 indicate, small firms employ strategies of proximity, large ones employ multiservice strategies), computer services and advertising (through very different levels of growth as Del Rio, C. et alt., 1990 indicate), etc. Nearly all the activities confirm the hypothesis of dual dynamics in business services.
There is little concentration in contrast with the competitive advantages described by Noyelle (1991). Large firms coexist with small companies in the same activity without creating too many conflicts. In many instances, supply and demand seem to be conditioned by size: large firms operate mainly with large clients and small firms mainly
9 Laws do not always favour the so-called integration and often it is not clear what is legal and what is not. See the dossier in 77ie Economist (1991), June, "A survey of business in Europe" .
•0 In the United Kingdom several consortiums emerged at the end of the 80s grouping together different business services. See Anonymous ( 1991 ). "Business Services Providers Try Togetherness". B. Marketing Digest vol. 16, page 128-132.
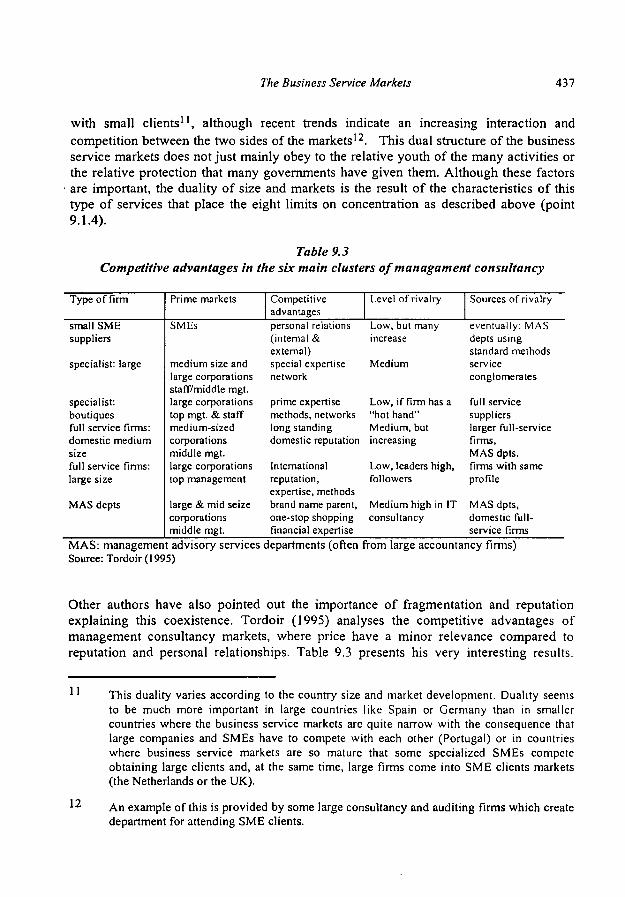
The Business Service Markets 437
with small clients11, although recent trends indicate an increasing interaction and competition between the two sides of the markets12. This dual structure of the business service markets does not just mainly obey to the relative youth of the many activities or the relative protection that many governments have given them. Although these factors are important, the duality of size and markets is the result of the characteristics of this type of services that place the eight limits on concentration as described above (point 9.1.4).
Table 9.3 Competitive advantages in the six main clusters of managament consultancy
Type of firm
small SME suppliers
specialist: large
specialist: boutiques full service firms: domestic medium size full service firms: large size
MAS depts
Prime markets
SMEs
medium size and large corporations staff/middle mgt. large corporations top mgt. & staff medium-sized corporations middle mgt. large corporations top management
large & mid seize corporations middle mgt.
Competitive advantages personal relations (internal & external) special expertise network
prime expertise methods, networks long standing domestic reputation
International reputation, expertise, methods brand name parent, one-stop shopping financial expertise
Level of rivalry
Low, but many increase
Medium
Low, if firm has a "hot hand" Medium, but increasing
Low, leaders high, followers
Medium high in IT consultancy
Sources of rivalry
eventually: MAS depts using standard methods service conglomerates
full service suppliers larger full-service firms, MAS dpts. firms with same profile
MAS dpts, domestic full-service firms
MAS: management advisory services departments (often from large accountancy firms) Source: Tordoir (1995)
Other authors have also pointed out the importance of fragmentation and reputation explaining this coexistence. Tordoir (1995) analyses the competitive advantages of management consultancy markets, where price have a minor relevance compared to reputation and personal relationships. Table 9.3 presents his very interesting results.
11
12
This duality varies according to the country size and market development. Duality seems to be much more important in large countries like Spain or Germany than in smaller countries where the business service markets are quite narrow with the consequence that large companies and SMEs have to compete with each other (Portugal) or in countries where business service markets are so mature that some specialized SMEs compete obtaining large clients and, at the same time, large firms come into SME clients markets (the Netherlands or the UK).
An example of this is provided by some large consultancy and auditing firms which create department for attending SME clients.
438 Business Services in European Industry
Fragmentation can be established for four groups: small SME, specialist (large and, boutique ), full service firms (domestic medium size and international large size) and Management Advisory Services departments of large corporations like accountancy firms. Competitive advantages come mainly from personal relations, expertise,' standing and reputation, and brand name respectively. Logically, rivalry levels are lower in SMEs and specialised firms like in large and international firms, even if competition is increasing in all markets. Therefore, SMEs can adopt different strategies from large firms in order to gain competitive advantages.
As has been mentioned before, the coexistence of large and small companies is not symmetrical with regard to the markets in which they operate. The large ones are small in number (they normally do not reach one out of a thousand of the total of existing companies) with a relatively reduced market share (28% on average from the available data), but great market power as far as product innovation and prices are concerned. The small firms have a high volume, but very little power individually. As was shown in table 9.2, a large company has an average of around 800 times more market power than a small one.
Another asymmetrical feature refers to the dynamics between companies. Large ones tend to be concentrated in either a horizontal or vertical way, as well as having relative stability in the markets. Once they are established in a market, it is difficult for other large competitors to enter the market, and so, in many activities, the hierarchy of major companies tends not to vary much from year to year. Small ones, on the other hand, are characterised by a vigorous entry and exit dynamic in the markets with high birth and death rates. Many work under trial and error and are bom associated with or within a previous association to a large company. The personnel in these small companies tends to be permanent in the microcompanies already established, whereas it is very variable in those which do not last long. It is common to find people who have worked in several large and several small companies during their professional career. The most highly qualified services face a relatively rigid demand for work, with high rates and changes to hand-picked staff. The job market is one of the intersection points of small and large firms.
The persistence and generalisation of small companies, dominant in number but not in power, leads to a debate on the advisability of one type of company or another. The net advantages of large companies put forward by Noyelle (1991)13 must be clarified from the moment when, as he himself affirms, obtaining certain economies do not always brings the best gains; neither from a business point of view nor a social one. A priori, the limits of concentration mentioned above reveal the ontologicai preference of being-like-a -service or being-like-goods. This means that the personalisation employed by the small companies can provide relatively average profits that can be higher than those of
'3 Large companies according to Noyelle make the most of economies of scale (in fixed and technical costs), scope economies (through multiservices), information (especially financial) Noyelle ( 1991 ), page 354-358.
The Business Service Markets 439
large companies. In the same way, the large companies do not have to have a priori lower average production costs, as in the services with elastic demand and qualified workforce, small companies are usually cheaper and produce with lower costs. The same dynamic transition of new companies created by workers from the large firms who
. decide to set up their own business show that smallness is not incompatible with profit.
The expansion of small companies in the sector has followed systematically the Schumpeterian hypothesis of the "creative destruction of capitalism"14 . For this reason, size is not an absolute obstacle to innovation. It is true that innovation tends to be developed in large companies but it is also true that small ones apply it, extend it and use it to the full (Barras, 1990). All the same, innovation in business services does not lie solely in techniques and applications but includes production modes and creativity needed to co-produce a service within highly competitive parameters. As the basic value added of the service is immaterial, any innovative change to content and extension is focused on the human work developing it and that a priori can take place within a small company just as well as in a large one. The greater innovation found in large companies is due to their need to have recourse time and time again to the search for scale economies.
On the other hand, based on the argument that internationalisation of markets reduces the number of medium-sized companies -proof of which can be seen in the USA and Europe-, today it is maintained that all these companies can find their place in the markets through cultivating a degree of sophistication and specialisation (Noyelle and Dutka, 1988).
In short, size is not a problem in itself; it is a problem for companies that do not adjust their structure and expertise to the changing market demands, and this affects companies regardless of size or activity. The current trends show that large firms are increasing their horizontal concentration and mergers, purchases and take-overs. However, small ones survive if they maintain their niche in the market, personalised treatment and proximity to the client. The medium-sized firms, that have been decreasing in number and importance (Noyelle and Dutka, 1988), must cultivate specialisation and sophistication in the services they offer.
The different features defining diverse companies point to the social benefits of the coexistence of different types. The large firms give social benefits through their innovative capacity, the recycling and training of a qualified workforce, internationalisation of economies and spreading and promoting subcontracting of services. Small firms provide employment, personalisation and attention to specific segments of the market, especially the small client companies for which the large
14 One of the most famous examples is found in the years in which Microsoft was covering the world computer software markets. Interesting comparisons were made between Microsoft and General Motors (The Economist "Capitalism's creative destruction". April, 4-10 1992.)
440 Business Services in European Industry
business services companies are very expensive and do not usually pay much attention. They focus on specialisation in products, in a territory, in a client segment or in ways of offering a service. This specialisation contributes to progress through better use of resources and the benefits of diversity and multilocation.
9.1.6 Other general features of the business service markets
In addition to the asymmetric coexistence of small and large companies, business service markets are characterised by another series of phenomena closely linked to the classical problems related to information and markets in services. First, there are problems associated with imperfect information: moral hazard and adverse selection, as well as all those deriving from the raising of expectations, customer loyalty and switching costs. These points were dealt with in former chapters so they are not going to be considered again. Finally, the following section deals with the interrelations between service activities, which cause scope economies and some horizontal concentration. All these elements will contribute to an explanation of the duality of business service markets and the relationships that spring from them.
Finally, it can be considered that the whole set of features identifying business service markets (those explained in this chapter and those explained of chapters 4, 6 and 8) can constitute a business service profile which is quite different from other industries. Business services are peculiar markets which could be considered organisational oriented markets due to the differences compared to other industrial markets. The role of information, prices, barriers, duality, etc., configure the most outstanding elements of a diverse economic and social organisation. ' 5
" Considering all elements differentiating these markets from other kinds of manufacturing or services markets, one can arrive at the conclusion than business services are organise more in a different kind of structure than other markets. This is the conclusion pointed out by De Bandt (1994) when analysing how business services do not match with the market logic; business services deal more with organisation problems than with market problems (due to the different means of performances, price determination, barriers and competition and international trade patterns). However, as shown in this and former chapters, business services can be considered a peculiar case of industrial markets, even an organisational-oriented market. The logic underlying this and other chapters have tried to identify, directly or indirectly, the similarities and dissimilarities of business service markets with respect other industrial markets.
77te Business Service Markets 441
9.2 The interrelations between business services
One of the main factors explaining the concentration of business services, above all at the end of the eighties, has been the creation of scope economies and the expansion of activities capitalising on the affinities and interrelations that exist. In this section, the self-fuelled or synergetic growth between different activities will be explored, stemming from the creation of scope economies and giving rise to strong competitive pressures between certain branches of activity.
9.2.1 Synergetic growth
Synergetic growth has different causes and factors:
/. Intra-service business relationships. Some business services are both providers and clients of business services. As examined in chapter three (input-output section), the degree of business service intra-integration is very high. Although it does not usually reach over 5-10% of usual clients, some activities such as management consulting obtain from other business services up to 20% of their business. Computer services are another typical example of supply that is at the same time demand. These intra-service relationships are the first synergetic source that cause a degree of self-sustained growth, although logically conditioned by structural and cyclical growth.
2. Convergence of outputs. Several different activities can produce similar services. Horizontal concentration and scope economies that are so abundant, refer to precisely this convergence of productive interests. Similarities between some businesses facilitate horizontal expansion, that in turn is boosted when one of the most traditional services decreases in profits, whilst other newer ones appear as a salutary lesson for the companies. Hence, territorial incursions and dissolution of barriers are produced that, even though they occasionally halt growth, often stimulate it.
3. Polyvalence ofinputs. The expansion towards similar activities can be carried out relatively easily through the polyvalence of most of the inputs used in production. Sometimes the scarce capital used (e.g. buildings, IT services) is usually as polyvalent as part of the personnel hired, both staff employed to carry out advanced tasks (e.g. consultants) and those employed to carry out routine tasks (e.g. secretaries). A senior auditor, for example, can go from consulting to directing market research. His high level of training might also permit him to assess computer or engineering problems. This polyvalence in the labour market stimulates interactions between activities and services.
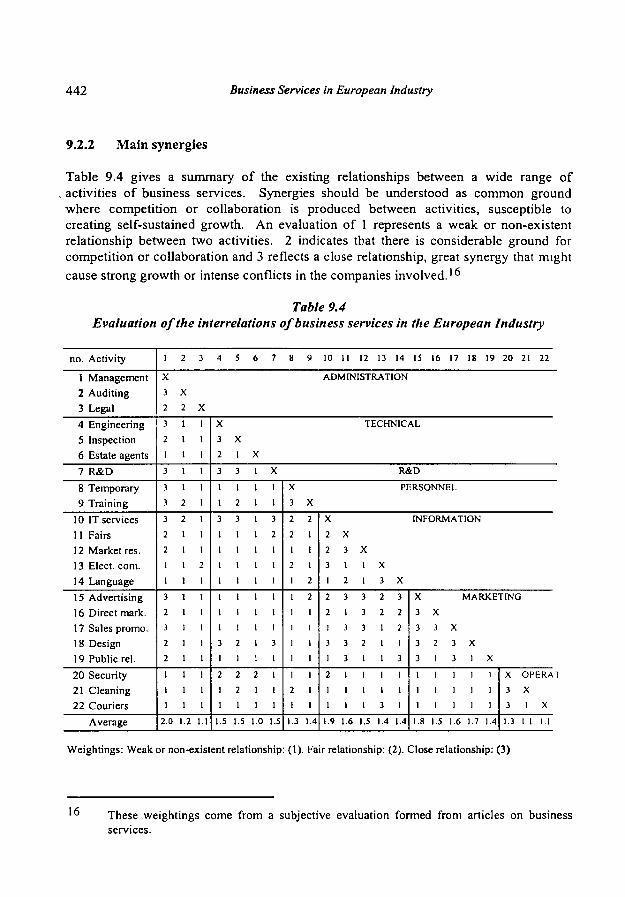
442 Business Services in European Industry
9.2.2 Main synergies
Table 9.4 gives a summary of the existing relationships between a wide range of activities of business services. Synergies should be understood as common ground where competition or collaboration is produced between activities, susceptible to creating self-sustained growth. An evaluation of 1 represents a weak or non-existent relationship between two activities. 2 indicates that there is considerable ground for competition or collaboration and 3 reflects a close relationship, great synergy that might cause strong growth or intense conflicts in the companies involved.16
Table 9.4 Evaluation of the interrelations of business services in the European Industry
no. Activity
1 Management 2 Auditing 3 Legal 4 Engineering 5 Inspection 6 Estate agents 7 R&D 8 Temporary 9 Training
10 IT services 11 Fairs 12 Marketres. 13 Elect, com. 14 Language 15 Advertising 16 Direct mark. 17 Sales promo. 18 Design 19 Public rel. 20 Security 21 Cleaning 22 Couriers
Average
Weightings: Weak
1 2 3 4 S 6 7 8 9 10 11 12 13 14 IS 16 17 18 19 20 21 22
Χ ADMINISTRATION 3 X 2 2 X
3 1 1 2 1 1 1 1 1
3 1 1
3 1 1 3 2 1
3 2 1 2 1 1 2 1 1 1 1 2 1 1 1
3 1 1 2 1 1
3 1 1 2 1 1 2 1 1
1 1 1 1 1 1 1 1 1
2.0 1.2 1.1
ar non-exist
X TECHNICAL 3 X 2 1 X
3 3 1 X R&D
1 1 1 1 1 2 1 1
3 3 1 3 1 1 1 2 1 1 1 1 1 1 1 1 1 1 1 1
1 1 1 1 1 1 1 1 1 1 1 1 3 2 1 3 1 1 1 1
2 2 2 1 1 2 1 1 1 1 1 1
1.5 1.5 1.0 1.5
ent relationship
X PERSONNEL 3 X
2 2 2 1 1 1 2 1 1 2
1 2
1 1 1 1 1 1 1 1
1 1 2 1 1 1
1.3 1.4
(1). Fa
X INFORMATION 2 X 2 3 X 3 1 1 X 1 2 1 3 X
2 3 3 2 3
2 1 3 2 2 1 3 3 1 2 3 3 2 1 1 1 3 1 1 3
2 1 1 1 1 1 1 1 1 1 1 1 1 3 1
1.9 1.6 1.5 1.4 1.4
r relationship: (2).
X MARKETING 3 X 3 3 X 3 2 3 X 3 1 3 I X
1 1 1 1 1 1 1 1 1 1 1 1 1 1 1
1.8 1.5 1.6 1.7 1.4
Dlose relationship:
X OPERAT 3 X 3 I X
1.3 I.I 1.1
3)
16 These weightings come from a subjective evaluation formed from articles on business services.

The Business Service Markets 443
According to the table, the most synergetic activity is management (average 2) followed in this order by computer services, advertising, design, fairs, sales promotion, engineering, inspection and control, R&D, market research and direct marketing. The least synergetic activities are cleaning, couriers, legal services and estate agents. By function, the fact that the synergies are much stronger within activities with the same function than with those with other functions stands out. Synergies are greatest in most of the intra-function cases, which justifies the logic of a functional approach.
Within the interfunctional relationships, the ones that share the functions of information and marketing stand out together with the function of administration, especially with the activity of management consulting. These synergies respond to the conjunction of strong powers highlighted by Chapignac [1990], where lies the complementarity between management and IT services, the coherence between organisation, administration and management and the emergence of a sphere of communication (reflected in activities with the information or marketing function).
The most important bilateral synergies between activities can be summarised as follows:
Management with auditing. The inrush of the Big Six in the world of management is the best- known exponent of close interrelations between these two activities. The diversification of the large auditors towards the management markets has been an opportunity marked by the possibility of capitalising on the knowledge that the auditor has of the client. The practice of auditing and consulting at the same time, prohibited in some states, is the origin of this strong synergy. Later, these functions have begun to be separated, as many people did not approve of the fact that the management consultant who was theoretically independent was hired and depended on as auditor ' 7 . Mixing the two functions could call into question professional ethics. It is worth noting that the auditors' entry into the world of management has been provoked by relative stagnation in auditing.
Management with IT services. Management, the activity with the most synergies of the business services, has a close relationship with computer services. The reason for this is clear. On the one hand, one of the main areas of management consists of the need clients have to make the most of, rationalise and benefit from the available computer resources. On the other hand, all advice ends up in one way or another on a computer framework: business organisations increasingly require the use of the computer. Hence this synergy appears, which is one of the strongest at the present time. "Clients want
' ' See, for example, Underwood (1989)

444 Business Services in European Industry
increasingly an integrating strategy, management of change and the capacity to redefine an information system" (Stiel, 1991, page 26).
Management with advertising and marketing. A healthy relationship between management and marketing is important in any company. Beyond the attempts made by some suppliers to provide both services, it can be said that today all medium and large companies need to rationalise their marketing strategies by incorporating them with management.
Auditing and IT services. There is a strong synergy between these two areas, not only because IT services are the work tools on which auditing is processed, but also due to the effects they have on the organisation of the company. It is really an extension of the synergy management-auditing-IT services. The conflicts between large auditors-consultants and computer services firms have been dubbed the war of the Titans, where strategic interests and "personal" conflicts and discussions on ethical problems merge. The question of the independence of a consulting firm arises once more when products are to be sold (computer services in this case). ' °
Engineering with inspection and control. Engineering jobs increasingly need to incorporate elements of quality control. The engineering activity stimulates the development of firms dedicated to quality control.
Engineering with IT services. Many of the applications of engineering services work internally with IT services and, moreover, they offer products with computer applications.
Personnel training with personnel selection. The relationship here is obvious. As the human factor becomes more crucial in the productive processes, the issues of flexibility and training seem to be increasingly united. Companies need temporary personnel trained in specific areas. Employees, in order to be able to aspire to a more full-time contract, require training to prepare them for this.
Personnel training with language services. These two activities form the nucleus of turnover and of personnel of the majority of training companies.
IT services with design. Computer-assisted design is decisive for the current advances in the activity dealing with "form". New technologies have revolutionised design techniques, up to the point that today the development of design is not explained without reference to the development of computer techniques.
1 8 See, for example, Clavaud (1991) and Rubalcaba and De Haro (1992).

The Business Service Markets AAS
IT services with R&D. R&D is another area that has been revolutionised by the arrival of computer technology. Much of the R&D of Western societies uses a computer framework. Simply investing in ITC is usually considered to be R&D.
Fairs and exhibitions with market research. Fairs and exhibitions are an extraordinary source ofinformation for all the companies participating in them. This basic function is complementary and does not substitute market research.
Fairs and exhibitions with advertising. The essential function of fairs is information. However, advertising and marketing are traditionally considered as the area to which the fair activity belongs. There are obvious interrelations.
Fairs and exhibitions with public relations. Attending fairs requires personnel, often professionals specialised in maintaining a certain area of public relations. The "PRs" deal with the company's contacts with other agents, with the press and the specialised public.
Advertising with direct marketing. The current reorganisation of advertising has led to the acquisition of new marketing formulas grouped together in what has been called direct marketing. This is the reason for the gradual take-over of the second area by the large advertising agencies.
Advertising with market research. The proximity of functions is creating a growing synergy. "Around the function of production, storage and distribution of messages cluster training, information, media, advertising and research" (Chapignac, 1990, page 107).
Advertising with sales promotion. Sales promotion, that has been considered an activity in its own right, is now another part of advertising. This merger is the result of nearly total synergy19.
Cleaning with security. The synergy between the two operational activities mentioned has three causes: 1) the client company that wishes to improve its external image, usually uses these two services, although there is a gap according to needs; 2) the suppliers of both services have discovered in one another the possibilities of carrying out scale economies and new markets20; 3) the two activities approach at the same time new types of activities:
' -* A clear example is provided by Panorama of the EU Industry, which used to dedicate two different monographs to what is now considered as a single sector.
2 0 See, for example, Del Rio et alt. (1990).
446 Business Services in European Industry
environmental services and waste treatment, that in some cases can be toxic waste and in others simply rubbish2 ' .
In short, the activities which are of the greatest importance in creating synergies are:
1. The management consulting activity, often presented as the pivot for the activities of other business services. Direct involvement in other activities is expanding. Not only towards IT services, auditing, legal services etc., but also towards some new activities such as public relations, market research and lobbying.22
2. The IT services activity, because of its great use and dependence with all other business service activities. In addition, the computer and communication services, moreover, enjoys considerable growth generated within the activity itself. Supply and demand are found in the activity, software and hardware, software and software, etc.
3. Other activities with outstanding relationships:
fairs and exhibitions (synergies with management, design, marketing, communication, public relations) 2 3 , design (synergies with management, marketing, engineering, R&D, IT services24), advertising (synergies with market research, fairs, management, public relations, media) or security (synergies with couriers and security transport services and cleaning2^).
Figure 9.1 displays the main synergies causing the current integration of business services in Europe. The principal synergies are represented in the diagram (weightings of at least 2 or 3 in table 9.4), showing five conflictive areas, where the synergies are not just a source of growth but also of conflict and competition between activities. The area with greatest intensity, at the present, is shown to be between management, auditing and IT services, and four areas of incipient conflict and above all potential conflict: security, cleaning and waste treatment; management, auditing and legal services; IT services,
2 1 See Panorama of the EU Industry (European Commission 1994). 2 2 See this synergy in 77je Services Barometer ( 1989a). 2 3 See Rubalcaba (1994). 2 4 See, for example, The Services Barometer ( 1989b). 2 5 See, for example, Del Rio et alt. ( 1990).
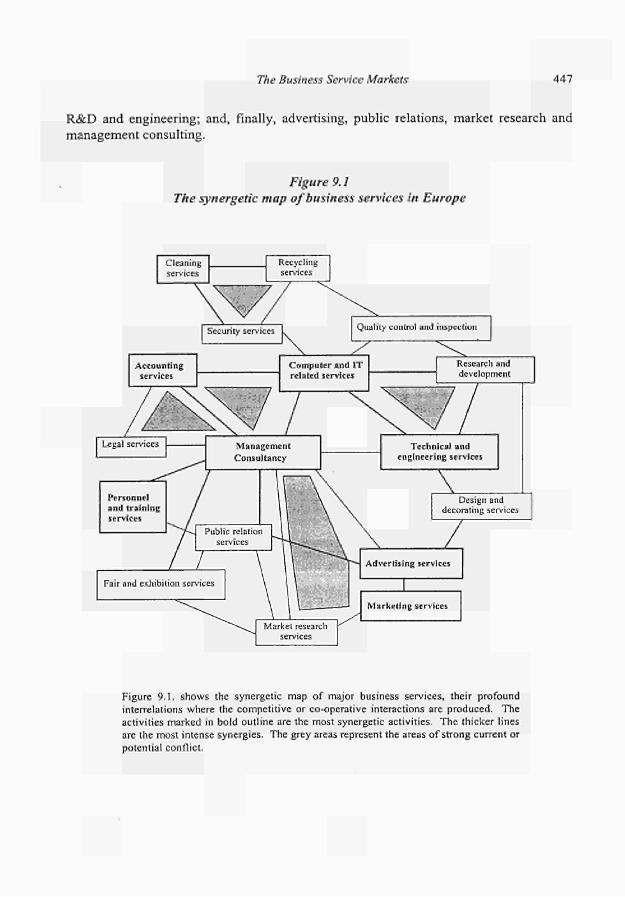
The Business Service Markets 447
R&D and engineering; and, finally, advertising, public relations, market research and management consulting.
Figure 9.1 The synergetic map of business services in Europe
Quality control and inspection
Accounting services
Computer and IT related services
Research and development
Legal services
Design and decorating services
Market research services
Marketing services
Figure 9.1. shows the synergetic map of major business services, their profound interrelations where the competitive or co-operative interactions are produced. The activities marked in bold outline are the most synergetic activities. The thicker lines are the most intense synergies. The grey areas represent the areas of strong current or potential conflict.

448 Business Services in European Industry
The whole set of interrelation and co-operation / conflictive areas lead to reinforce the hypothesis confirming business service as an only real and separate economic sector, even if it includes a lot of heterogeneous activities. They all have common characteristics, based on the business service nature and definition (chapter 1) but they also interact so much among them, that market behaviours are quite similar. This addresses the need of a single business services framework for possible policies to be defined, implemented and followed. The next chapter 10 will deal with policy implications of business service markets.
The Business Service Markets 449
9.3 Conclusions
Business services develop their functions in the economy through a dual organisation of the markets. Large companies coexist with small and medium-sized companies. There are few large companies but they dominate the markets. The vast majority of companies in the sector are small and medium-sized firms, but, separately they lack power in the market. The persistence of this duality over time is explained by the dual ontology of business services. The pressure to act as goods, involves standardisation, industrialisation and concentration of activities. The pressure to be a service implies personalisation, flexibility and fragmentation. The asymmetric nature of business services is established on the predominance of service behaviour over goods behaviour.
As a corollary, some limitations on the concentration of the markets are naturally imposed: there will always be small firms that preserve their niche thanks to the advantages of sufficient personal relations, specialisation, or location. These limits explain why, in many instances, the concentration of business services has tended to be more horizontal than vertical. Suppliers have found new fields of operation within the same activity, which explains the synergetic growth of the sector and the points of current and potential conflict. In this way, the transformations of business services suppliers imply both inter- and intra-sectorial mutations. The existence of abundant niche markets and competitive strategies allows us to draw consequences for economic policy. It is possible to influence either markets that appear too opaque, or that have an insufficient supply of business services for the industrial needs of a region or of a group of companies. The next chapter will develop this more in detail.
References
- Aoulu, Y.; Quint, N. ( 1991 ) "L'audit". Courier Cadres No. 911. Barras, R. (1990) "Interactive innovation in financial and business services: the vanguard of services revolution". Research Policy, 19: 215-237. Carlton D.W; Perloff J.M (1994) Modern Industrial Organisation. Harper Collins, New York. Chapignac, P. (1990) Les services avancés en Europe. CPE Etude No. 120. Auditech, Montpellier. Clavaud, R. (1991) "Consultants contre informaticiens: une guerre". L'expansion, 23-3:5-6. Cuadrado Roura, J.R; Rubalcaba Bermejo, L. (1993) "Regional trends in business services supply in Spain". The Service Industries Journal, 13 (No. 2). Special Issue: 5 J-68. De Bandt (1994) "La notion de marché est-elle transposable dans le domaine des service informationnels aux entreprises?" In Bandt, J. Gadrey, J. (Eds.) Relations de service, marchés de services. CNRS Éditions, Lonrai Del Río Gómez, C; Cuadrado Roura, J.R.; Casares, J. (1990) Presente y futuro de algunas actividades a empresas en la CE y España. Análisis de algunos servicios concretos: evolución, situación actual y perspectivas. Tercera parte. Quasar, Madrid. European Commission ( 1990) Condiciones para facilitar la cooperación entre empresas. Situación a 31-12-90. European Commission, Brussels. European Commission (1992) Panorama de l'industrie communautaire 1991-1992. European Commission, Luxembourg.
450 Business Services in European Industry
European Commission (1993) Panorama de l'industrie communautaire 1993. European Commission, Luxembourg. European Commission (1994) Panorama de l'industrie communautaire 1994. European Commission, Luxembourg.
- Hogg, C ; Syrett, M. (1989) "Getting the right management for 1992". Director vol 42. Jerry, R. (1989) "Advertising the European way". Europe. Mochón, F. (1993) Economía, 3"ed. McGraw-Hill, Madrid. Noyelle, T.J. (1991) "Les services aux entreprises dans les négociations d'Uruguay sur le commerce des services" in Naciones Unidas (Ed.) Commerce des services: questions sectorielles. Naciones Unidas. Noyelle, T.J; Dutka, A. (1988) International Trade in Business services. American Enterprise Institute. Ballinger publication, Washington DC. RESER (1995) Consultancy services networL· in Europe. Serdeco Editions. Rubalcaba Bermejo, L. (1994) Fairs and Exhibitions in the European Economy. Eurostat, Luxembourg. Rubalcaba Bermejo, L.; De Haro Izquierdo, F. (1992) "Las consultorias ante el Mercado Único". Nueva Empresa, No. 369. Octubre 1992. Salustro, E. (1988) "L'internationalisation: un enjeu pour les services". 2éme. Journée Nationale des services. Centre Français du Commerce Exterieur, Paris. Sapir, A. (1993) "The structure of services in Europe: a conceptual framework". European Economy, 3: 83-98. Schlossberg, H. (1989) "Business services now a long term affair". Marketing News vol 23. Schoenberger, E. (1987) "Frugal manufacturing". Harvard Business Review, 87. Schumacher, E.F. (1973) Small is beautiful. Spanish edition: Lo pequeño es hermoso (1978). H. Blume Ediciones, Madrid. Stiel, N. (199!) "SSII et cabinet d'audit: les liaisons forcées." En el dossier: Les manoeuvres europénnes des SSII. Informatique, 1155. The Economist (1991) "A survey of business in Europe". 77ie Economist, June 1991. The Economist (1992a) "Innovation, the machinery of growth". 77ie Economist, January Nth 1992: 19-21. The Economist (1992b) "Capitalism's creative destruction". The Economist, April, 4-10 1992. The Economist (1996a) "Business services: full-time activity". The Economist, May ¡lth 1996. The Economist (1996b) "Advertising: a passion for variety". 77ie Economist, November 30'h 1996. The Economist (1997) "Management consultancy". The Economist, Special Survey, March 22nd, 1997.
- The Economist (1999) "The car industry". The Economist, February I3tn-I9th, ¡999. The Services Barometer (1989a) "Trends in business services". 77ie Services Barometer 30: 12. The Services Barometer ( 1989b) "Industrial design". The Services Barometer 30: 10-11. Tordoir, P.P. (1995) The professional knowledge economy. The management and integration of professional services in business organisations. Kluwer Academic Publishers, Dordrecht, Boston, London. Underwood, L. (1989) "Management consultants look for a world power". Director vol. 42.
Chapter 10
Towards a Business Service Policy in Europe
"Because of the growing integration of business services into manufacturing (and vice versa) and their importance for overall economic development, the policy on industrial competitiveness needs to be visibly extended and targeted on Business Services."
European Commission (1998) The contribution of business services to industrial
performance: a common policy framework, page 3

452 Business Services in European Industry
Towards a Business Service Policy in Europe 453
Chapter 10: Towards a Business service policy in Europe
Introduction
This final chapter of the book deals with the implications for economic policy derived from all the matters that have been dealt with in the previous chapters. Throughout this book some of the relations between the business services economics and related areas of political action have been identified. For example, matters regarding employment in chapter 2, helped to point out various reflections on how to stimulate the creation of jobs in business services and through business services. Chapters 4 and 5 led to the consideration of a number of possibilities for reinforcing services quality and industrial competitiveness. Chapter 6 put forward the problem of liberalisation of service markets and the barriers that still exist. Chapter 7 indicates the need to improve productivity. Chapters 8 and 9 consider those market situations that would require, in certain cases, a specific policy. Likewise, we could continue to point out all the detailed aspects that are related, in one way or another, to pertinent political actions in the different chapters. However, this chapter prefers to outline the main lines of action that could be taken for business services in a unitary and organic way.
With this in mind, the chapter starts by presenting those main factors that justify the necessity for a business service policy. This first section emphasises the most outstanding elements dealt with in the previous nine chapters and, in particular, the reasons that enable a further strong growth of business services. After this justification summary for a business service policy, the second section presents the instruments and objectives of business service policy. Thirdly, a framework of action of the aforementioned policy will be proposed by using the different "related-policies". Finally, the chapter ends with a reflection on the need to co-ordinate the different possible actions, enumerating the top priority actions that may arise or, as the case may be, could be adopted in the short or medium term.
454 Business Services in European Industry
10.1 Factors that justify a business service policy
The factors that justify a business service policy are numerous and varied. The different aspects that have been dealt with in the previous nine chapters put forward the main ones:
the role of business services in the new servindustrial and information society (CI) the strong growth of the sector over the past 20 years (CI) the capacity for employment creation and new flexible employment (C2) the key functions they develop in the economy (C3) the growing relationships with other branches of industry (C3) the importance of quality in the development of competitive services (C4) the necessity for encouraging competitive strategies in clients and providers (C5) the existence of limitations for the market internationalisation and integration (C6) obstacles and barriers to a Single European market on business services (C6) the necessity to improve productivity in the supply of services (C7) the differences in the location of business services (C8) the peculiar situation of SMEs, out of the reach of certain advanced services (C9)
As regards all these elements that have been examined thoroughly, it is worth pointing out two more that are implicit in some of the previous ones:
Firstly, the existence of actions that already take place regarding business services and, therefore, the national regulations that are liable to be reviewed in the cases in which they are different, are not very up to date or can seriously affect the principles of competition. Secondly, the coming perspectives of business services, that is, their growth margin for the near future. The next points deal with these two justification factors, starting with the second one.
10.1.1 Perspectives of business service sector
The future of business services is related to the type of growth that constitute them. A purely circumstantial growth would leave the business services to the mercy of the cyclical movements of demand. A strong structural growth indicates the consistency of the necessity of intermediary services to be required in times of expansion and during phases of recession. The hypothesis that business services represent a development factor and not merely a consequence of this, is coherent with the continuation of a clear future prospect. The factors that condition the future growth of business services can be developed by summarising the following four points: the continuity of causal processes;
Towards a Business Service Policy in Europe 455
the existence of asymmetries in provision methods, the cyclical behaviour and the relationship between economic income and business services.
10.1.1.1 The continuity of causal processes
In previous chapters the causal factors of business services were studied, related to the changes of productive processes. Undoubtedly, the continuity of growth of the sector will depend on the fact that these processes continue. For example, the processes of flexible production unfold at a fast pace in all advanced economies. On the one hand, flexible systems allow successive quality gains having recourse to specialised services. On the other hand, outsourcing and the conversion of fixed to variable costs continues to be the aim in many firms' policy. In this sense, moves towards labour flexibility represent the most striking expression of the whole process of industrial change.
Flexibility in productive processes is gradually being integrated with the unceasing incorporation of new technologies. As a first result, economic progress generates a change in production processes by way of the improvements in capital. As regards this process, that has expanded over recent years, there is no reason to believe that there will be a possible stagnation. In the same way, nothing leads us to suppose a reduction in the use of business services in relation to the incorporation, generalisation and taking advantage of technological resources. On the contrary, for example, the Internet recent boom can help with the rendering of specialised services at a distance, or teleworking, which suits the world of professional services. The new technologies are, without any doubt, promoting exchanges, reducing transport and communication costs and multiplying the opportunities for new business services.
In the same way that flexibility and technology indicate tendencies predicting that the use of business services will, at least, not decrease, the processes of integration of goods and services should follow the same direction. Nothing seems to indicate that the innovation processes will cease to be necessary for firms. On the contrary, the growing globalization of economies and greater competition spur technological, organisational, strategic and commercial innovation. This innovation is the first catalyst for new business services. In the new information and servindustrial society, the incorporation of intangible inputs in the value-added chain will remain absolutely crucial, The processes of service integration will continue to increase value before, during and after any production phase.
No negative evolution is expected from the other explanatory factors affecting business services either. The internationalisation of economies, externalisation of in-house services, the coexistence of SMEs and large multinational companies, or the central nature of human capital in economic activity, are all elements that are likely to maintain their positive influence on business services. Only government intervention could have negative effects. This would happen in the case of increasing protectionism (new regulation), or because the positive effects of deregulation diminish in the case of there being no material left to regulate (full liberalisation processes). However, a correct

456 Business Services in European Industry
political action in business services would contribute, without any doubt, to the improvement of its possibilities as a driving sector of the economy, as it will be stated in the next sections.
10.1.1.2 Maintaining asymmetries: externalisation over intemalisation; integration of different markets over market uniformity
An important factor which has traditionally been used to explain business services is that of externalisation. The discussion about this phenomena, explained in chapter five, concluded that externalisation cannot be considered the primary factor of business service sector, in the sense that the sector is not the result of a mere transfer of employment which emerges from in-house services. Nevertheless, the importance of externalisation in the development of the sector is beyond any doubt. In this sense, it is worth asking oneself if this phenomenon will continue in the future, or if, on the contrary, the tendencies towards internationalisation will become more significant than the current one.
The most recent studies (see chapter 5.2.2) grant the processes of externalisation a force that is beyond that of the intemalisation processes, nevertheless, to a certain extent, they should be considered as two complementary processes. There is a certain asymmetry in the sense that externalisation used to grow more quickly than intemalisation. A predominance of intemalisation could imply that the advantages of external subcontracting are fewer than those of vertical integration and, therefore, there would be a contrary force to the development of the business service economy. However, existing evidence defends this asymmetry in favour of externalisation. The continued growth of business services as an economic sector, and not only as an activity, would seem to testify to this fact. However, it is noteworthy that in-house resources are and will continue to be increasingly important in fruitful business service use.
Together with externalisation, chapter six analysed the internationalisation of the sector. Taking into account the processes of globalisation and integration in progress, everything seems to point to the coherence of the processes of internationalisation of the sector. Even with the special characteristics which must be borne in mind in order to understand this process, a greater integration can be expected of the business service markets which have been fragmented up until now. An element that would reduce the necessity of business services would be a growing market uniformity. The elimination of national differences or barriers between markets could seriously affect the functions of some business services that, indeed, exist as a result of the existence of these barriers and differences. Nevertheless, this fact does not seem to be become common place. To a certain extent, the processes of internationalisation are not eliminating the differences and barriers between countries and markets, instead, in a certain way, they are discovering them. The uniforming process could be followed by the discovery of new differences. Even if Europe were to reach a situation of uniformity, as is the case of many regions in the United States, the majority of business services would not be negatively affected. It is important to remember that within the American giant, business
Towards a Business Service Policy in Europe 45 7
services have experienced a considerable development and, in many cases, far superior to that of Europe. The market integration process is clearly conditioned by the necessity that supply companies have for obtaining a reputation where incomplete information exists. As Esparza and Krmenec (1994) demonstrate in a study regarding business
. nature on a regional level, "overcoming the inherent information asymmetry between services producers and the potential demand base, intra- or extraregional, requires learning and time" (page 12). This creates expectations of a possible rapid growth of business services in new markets in the medium or long term. '
10.1.1.3 The evolution of demand, cyclical behaviour and long-term growth
Chapter three analysed the relation between the sector and the economic cycle. It has been demonstrated how the large expansion of many activities in the eighties has been very closely related to the increases in demand which have taken place during that decade, together with supply performances. In the periods of expansion, business services have shown clear procyclical behaviour. It has been observed that in the face of an impulse of the economy, business services respond to a generation of value added so considerable that, in time, it gives rise to employment growth (new companies entering, more contracts, etc.).
The cycle of expansion of business services has not been broken during periods of recession. In the crisis of the seventies, they displayed a marked anticyclical behaviour as in the case of other service sectors and the annual variation rates in those years were extraordinarily positive. However, a similar evolution was not repeated in the recession of the nineties. In this case, the activities of business services were seriously affected by the crisis, suddenly diminishing the annual percentages of accumulated growth towards the end of the eighties. But, this reduction does not allow us to talk about negative growth rates during the recent recession. The annual growth rates have never fallen as low as for the whole of the economy and, negative growth rates have seldom been registered. Even during the worst years, many activities have enjoyed an average growth of 2-4%. Statistical analysis from chapter 3 showed that the business service sector has a very intensive structural long-term growth, as well as being a very cyclical sensitive sector too. But long-term growth is currently more relevant than short-term growth.
The first information received regarding the recuperation of the nineties shows a new expansion of business services. The reduced dimension that business services markets presented at the beginning of the eighties, given their young nature, made a process of strong and progressive growth possible throughout the decade. Nowadays, growth can be considered to be more mature. In this sense, it is necessary to point out that the young nature of markets does not always coincide with the newest activities.
This expectation can be supported historically by some experiences that show how the more mature markets (urban) tend to show a procyclical character, while on a national level the situation varies according to each activity and more short-term components appear.
458 Business Services in European Industry
"Traditional" activities, like those of computing services, continue to grow at the pace of technological change. On the contrary, growth in some new activities is being curbed as they fail to adapt initial expectations to firms' needs or due to market saturation in a number of services (e.g., traditional accountancy and auditing, some training services, some marketing services). Mature business services markets tend to grow at a similar rate as the rest of the industrial markets. Where markets continue to emerge, very narrow segments of the market can be found in which problems exist for the rendering of a service in the best conditions of price and quality, characteristic of markets with a certain amount of maturity. There is, therefore, a large margin for growth in many business service markets.
Although they do not reach the levels obtained before the recession, many services are reactivating their portfolio of clients, finding new markets and trying to consolidate a diversified and rational growth. The setting up of scale, scope and network economies is one of the keys to the future development of the sector. Taking advantage of existing synergies and the search for collaboration agreements between companies will be the two main dimensions that will shape the strategies of firms during the coming years, in this way, extending the prosperous perspectives of the sector in the midst of growing competition.
10.1.1.4 The development of the relation between revenue and business services
The previous chapters have also made an in-depth analysis of the special relationship between business services and economic development. Germany, the United Kingdom and France are the three most important European business services economies and Italy comes in fourth place. Despite the fact that in terms of volume data, the fifth place corresponds to Spain, the Netherlands seems to vie for this position. Many indicators for the latter show a distinctly superior position to that of Spain, in the same way that, occasionally, some of the smaller countries of the Union surpass the most important countries as regards productivity and location of multinationals.
From the analysis made in chapter 8, it can be deducted that there is a relation between economic revenue and development of business services. The correlation between the number of business services per inhabitant and income per capita is extraordinarily high. From such a close relation, it can be deducted that the future of the sector will evolve together with countries' wealth. Thus, it is probable that the future increases of welfare in the more developed countries will be accompanied by a greater implementation of the sector in the economy, at least in the less developed countries of the Union (Spain, Ireland, Greece and Portugal) and in some advanced countries that demonstrate certain delays in some activities (Italy and Belgium). The more wealthy countries also have an important potential for growth, although logically it is lower than the aforementioned. In general, business service sector during the eighties was above average in most countries. All analyses show signs that saturation levels are still far off. The case of the United Kingdom, for example, testifies to the fact that it is possible to obtain superior

Towards a Business Service Policy in Europe 459
development levels in the sector, well above those corresponding to economic size and despite the considerable maturity of many activities.
. 10.1.2 Current EU actions for business services
On the path towards a business service policy it is necessary to consider two decisive premises: first, since quite a long time, there have been many non-co-ordinated initiatives that, directly or indirectly, do in fact affect business services; second, the recently approved Communication on business services (European Commission, 1998a) provides a single policy framework which had not been conceived before. The Communication on business services and the related Commission Report to the Industry Council (European Commission, 1998b) are key references for any policy action which pretend to improve the business service economy as a way to improve employment and competitiveness. These are going to be developed further in this chapter but before that, it is useful to mention which have been the main policy actions related directly or indirectly to business services:
The steps taken to guarantee the free movement of services and the right to establishment in all European Union countries. The regulations that affect contract fulfilment and the guarantees of systems for certification of service quality. Employment policies, although they are not aimed specifically at business services, given that this is the sector with the highest amount of employment creation in the past few years, directly affect business services. The instruments of external trade use business services in order to achieve their aims. Technological policies, of R&D, and of SMEs contain aspects that relate to advanced services. Local development policies often consist of the provision of business services.
In fact, a central part of these policies such as technological development and those related to SMEs can be considered as business service policies: they use services in their instrumentation and propose the provision of services as the final achievements of their aims. Advisory services for SMEs, technology diffusion, or the establishment of regional public services, all constitute actions connected to business services, whether they are public or private.
Therefore, the evaluation of all present-day policies affecting business services constitutes the first task of a specific policy for business services. Some of the current steps are of particular relevance in the overall new industrial and economic policy of advanced societies. However, others could end up being contrary to the idea of the Single Market, could damage competition, or simply be a waste of public money. Furthermore, the current steps regarding business services might need to be complemented by other steps or simply be framed within a wider political perspective.
460 Business Services in European industry
All these facts reinforce the justification of the current Commission actions for business services. Current policies can be more useful once a common policy framework becomes operative. This can solve, for example, the coherence problem which is also linked to the compatibility one. Many community policies affecting business services already exist or are in the course of development but they sometimes lack coherence and a global vision which could create better synergies between and mutual reinforcement of actions with an impact on business services. The necessity of creating a business service policy stems from the fact that uncoordinated policy actions could lead to incompatibilities between objectives and policy instruments (productivity/employment, quality assurance/deregulation, competition rules/structural policies, etc.)... Thus, coordination needs to take place in all the stages of planning, policy application, follow-up and evaluation. With respect to a new coherent business service framework for a policy action, it is necessary to look at the main actions promoted by DGIII. These can be classified in two groups: knowledge creation and organisational issues and the targeting of EU policies on business services. Several actions have already been undertaken regarding the first aspect:
1) Co-operation with Eurostat. Follow-up of the pilot projects on business services (currenüy four projects in IT services, personnel services, industrial cleaning services and engineering services) and new pilot projects for the first time supplementing data collection on the supply side of business services with data-collection on the demand of business services by industry. Finally a major project on new indicators and variables for determining competitiveness and employment in business services and their knock-on effects on industry.
2) The DGIII research project with the Joint Research Centre Body, The Institute For Prospective Technological Studies (IPTS) on Industry Value Added Services (IVAS) will enable the Commission to define an overall research strategy on core Business services and other services directly affecting Industry.
3) The outcome of this book, which could lead to further scientific and promotional works on business services
4) Collaboration and information exchange on business services within the Commission services themselves and with professional associations
With respect to the second aspect (targeting of Community policies on Business Services), the policies relevant to Business Services and their impact on industrial competitiveness are essentially the Information Society (ICT policy), Electronic Commerce, RDT and training, Internal Market including public procurement, GATS, structural policy, employment policy, SMEs, competition policy and quality assurance. They involve a broad range of other Commission services. Important work on defining concrete policy actions in cooperation with these services lies ahead. The objective of a business service policy should coincide with a modem industrial policy giving priority to horizontal policies and covering the whole spectrum of business services, although in certain cases actions could be directed towards sector specific problems (in particular the different state of liberalisation and deregulation in the various Business service sectors).
Towards a Business Service Policy in Europe 461
This dichotomous (horizontal versus vertical) approach should be refined during the business service development of these policy-related actions.
Therefore, policies can basically be divided into two categories: creation of better . knowledge on business services and targeting of already existing EU policies. These
policies are expected to be developed through the Commission Communication on Business Services approved under de Austrian Presidency (EC, 1998a). This recent Communication (September 1998) is based on former related EU initiatives. The first one was the Conclusions of the Industry Council on Business Services, which was approved under the Spanish presidency (EC, 1995). They invited the Commission to carry out an analysis of the situation of business services from the point of view of their contribution to the competitiveness of European enterprises and job creation. The result of this analysis was presented to the Council in a Report from the Commission Services on Industrial Competitiveness and Business Services (EC, 1998b). The Council Conclusions furthermore invited the Commission to examine, among other issues, how national and Community policies can contribute to improving framework condition within which business services operate and to produce a Communication bringing together the arguments for and against a policy on the subject, which has now been done.
Other EC key policy papers which support the current actions on business services are: the White Paper on Growth, Competitiveness and Employment (EC, 1993); the Commission Communication on an Industrial Competitiveness Policy for the European Union (EC, 1994); a Confidence Pact on Employment (EC, 1996a); an Integrated Program for SMEs and the Craft sector (EC, 1996b); the Single Market Review (EC, 1996c); First Action Plan for Innovation in Europe (EC, 1996d); Commission Communication on Europe at the Forefront of the Global Information Society: Rolling Action Plan (EC, 1996e); the Commission Communication on Benchmarking the Competitiveness of European Industry (EC, 1996f); the Commission Communication on putting Service to Work (EC, 1996g); and, the Commission Report on the Competitiveness of the European Industry (EC, 1997). All the main ideas related directly or indirectly to business services in these papers, have been summarised in the Commission Communication of September 1998, and provide a very useful background to justify, define and implement policy actions on business services. The next sections, presenting the main aspects of a business service policy are fully compatible with that background, even if they are presented in a different way.2
The aim of this chapter is to provide a better understanding of the business service policy definitions and general criteria, and there is less emphasis on specific policies at EU or national level. Further research is needed for a study of business service policies at national level.

462 Business Services in European Industry
10.2 Objectives and instruments of a business service policy
10.2.1 Objectives
The objectives of a business service policy should basically coincide with the objectives of all economic and industrial policies. The ultimate objective should be to seek the maximum welfare possible of the population, encouraging balanced growth and employment. For this to occur, a business service policy should contribute to the objectives of the new industrial policy. It should not be a policy destined to defend companies in difficulties, or to promote some peak sectors, as done by traditional industrial policy, instead, it should comply with the guidelines of a modem competitiveness policy. This can be considered to be the following:
1st The balance between market and public intervention should give priority to the indicators of the market. Incentives should not reduce the efficiency of the market, instead, it should increase it.
2nd Government should not interfere in competition, but should complement what the market does not satisfy.
3rd Measures should have a horizontal nature, and at the same time try to promote certain specific sectors (for example, actions that encourage the supply of all business services, rather than a specific business service sector)
4th Industrial policy should seek to guide capital and labour from the more mature sectors towards the emerging sectors and high technology.
In the direction indicated by the four guidelines, a business service policy finds a clear justification:
1st Without government intervention, the market has enabled the emergence of many services capable of improving the competitiveness of the European industry. Whatever action to encourage these can be an adequate response to the market signs.
2nd Government can stimulate the supply and demand of private services at the same time as intervening with public services in situations in which the market fails. Flexibility of service markets impedes the benefits of those actions that do not scrupulously maintain the principle of subsidiarity.
3rd The steps used to encourage business services can be considered to have a horizontal nature in the sense that they attempt to encourage innovative services for the whole industry and not only for a particular activity. Specific action, however, can be taken when considering certain cases, such as liberalisation measures (for example, the removal of specific barriers)
4th Business services represent the most dynamic sector in the creation of employment and growth and the sector is a key transmitter of new technologies,
Towards a Business Service Policy in Europe 463
which makes it one of the target-sectors for the promotion of new and high employment.
, Once the convergence of a business service policy with a modem industrial policy has been presented, its is necessary to specify some objectives of this:
lsl To stimulate the growth of the sector, thus encouraging the creation of employment and the diffusion of new technologies and innovation within industry.
2nd To activate the employment creative capacity of the sector, given its growth potential and the new methods of organisation of labour that it implies.
3rd To help the integration of new advanced services within European industry, in order to improve industrial competitiveness.
4th To encourage the productivity of advanced service suppliers, in order to make them more competitive on an international level.
5lh To encourage the integration of markets, internationalisation and competition in a way that benefits in quality can be obtained and that those price rises not in consonance with productivity levels can be curbed.
6th To intervene where market failures exist so that companies can benefit from the economic advantages of business services, according to the principles of efficiency and subsidiarity. As a result of this, redistribution of the effects of revenue and wealth within an economy can be achieved in which the principle of fairness is compatible with efficiency. This final objective proposes equal opportunities for all market agents, so that all can have access to the competitiveness stemming from the business service economy.
10.2.2 Instruments
According to the six aforementioned objectives, six different policies related to two types of procedures can be implemented: those that aim to defend fair business service markets, and those destined to the promotion and stimulus of business service activities.
A. Policies intended to defend fair business service markets.
1". Deregulation policies. The scope of the markets and the gains derived, as a result, can be obtained from a policy of market deregulation. This focuses, basically, on the elimination of legal barriers and the reduction of intra-sectorial barriers (both described in chapter 6). To guarantee the unrestrained movement of services, the right to establishment, free movement of services, and the mutual recognition principles is a demand of the Single Market and a condition for opening up of markets within Europe. These steps usually imply a reduction of the government interventionism in markets.
464 Business Services in European Industry
2. Competition policies. Distortions of competition produced by dividing up markets, abuse of dominant position, collusive mergers, discrimination in subsidies or management of public acquisitions or contracts, etc., has to be controlled by a competition policy that guarantees the quality and good behaviour of the companies and agents involved. On a European level, this policy basically implies a supervision of the application of the Articles 85, 86 and 92 of the Treaty, together with the control of concentrations and mergers ruling.
3. Quality policies. In relation to the aforementioned policies, one of the objectives of this policy is to review existing regulations, their contents, efficiency and costs, so as to improve the quality of the services rendered. Some regulations can produce inefficiencies in markets, creating entry barriers or encouraging "rent-seekers". Therefore, it is necessary to review the different regulations, both those created by government, and those managed by the professions in question themselves. In both cases, situations that are far removed from the original aims of the regulations can be found. This policy of regulation should aspire to stimulate service assurance, to improve the transparency of public and private contracts and to consider as a whole the multiple regulations that exist, affecting final quality.
B. Policies aimed at promoting business services
4. Competitiveness policies. The main aid that may be offered to business services comes from the creation of a favourable business environment, which improves the productivity of companies and their functions in the economy. Within a competitiveness policy, actions that incise on productivity, technological transfer and diffusion, internationalisation of SMEs or service innovations are inserted. All these may contribute to the performance of business service suppliers and demanders, to be more competitive in a changing international context.
5. Employment policies. All the aforementioned policies may contribute to creation of employment, both directly and indirectly. The improvement of markets, or the promotion of competition may bring about incentives for the appearance of new jobs in the sector and better quality employment in the medium and long term. At the same time, as far as business services improve their productivity and quality, client companies will notice these changes and will be, in turn, more competitive and more capable of creating employment. Nevertheless, a policy that is specifically aimed at creating employment in the sector is also possible, beyond that which has been indicated previously. For example, fiscal steps are possible in order to promote new dynamic activities creating new employment. Moreover, training programmes can also be encouraged in order to improve workers' qualifications or those that wish to set
Towards a Business Service Policy in Europe 465
up a service business. All these opportunities may be found within an employment policy aimed at business services.
6. Direct promotion policies. This type of policy attempts to promote the use of business services in client companies using three methods: 1st, the co-operation and networking between innovative companies that
can benefit from the use or, in some cases, joint production, of advanced services, thus contributing to improving the technological and innovative level of the country;
2nd, the co-finance or concession to private companies for the use or contracting of advanced services; and
3rd, the supply of public business services, which are made available to those private companies that for reasons of cost, location or knowledge/information do not usually seek these services. In the first instance, this is the policy of technological parks and business service centres. The second instance, usually covers the specific horizontal policies aimed at SMEs. The third and last instance includes the services intended for the local development agencies, organisations that promote fairs and exhibitions, public services for aiding exports, etc.
Among the same objectives, the tools, and between one and another, certain incompatibilities and divergences may appear. At the present time, a co-ordinated business service policy is just emerging, which leads to the fact that each horizontal instrument is used with specific aims in mind, which may be neither compatible nor coherent with those conceived by other steps or a different line of action. For example, it is usual to consider that there is a certain incompatibility in the short term between the objective of competitiveness and efficiency with the objective of employment and justice. Despite the fact that in the long run general agreement is reached on the positive relation between both objectives, it is also true that in the short ran, certain steps, on the road to efficiency, may generate unemployment or inequalities.
As for instrumental policies, the most characteristic example is given when the intervention to promote advanced services is contradictory to the interventions that guarantee fair markets and competition. Some steps to promote activities may be contrary to the competition among private companies or among companies from different countries. Although these situations are more typical in manufacturing industry sectors (subsidies to large companies in reconversion) or traditional services (granting of permits, etc.), to a certain extent business services are also exposed to these problems. It is difficult to distinguish when an advanced public service complements, or on the contrary, substitutes, a private service. Nor is it easy to assess the influence or efficiency of a group of actions based on public creation of actions that change negatively the motivations for clients looking for private markets. Besides that, certain regulations in professional services are drawn up in order to safeguard quality for the consumer. However, this safeguard sometimes implies competition restriction, which is not always
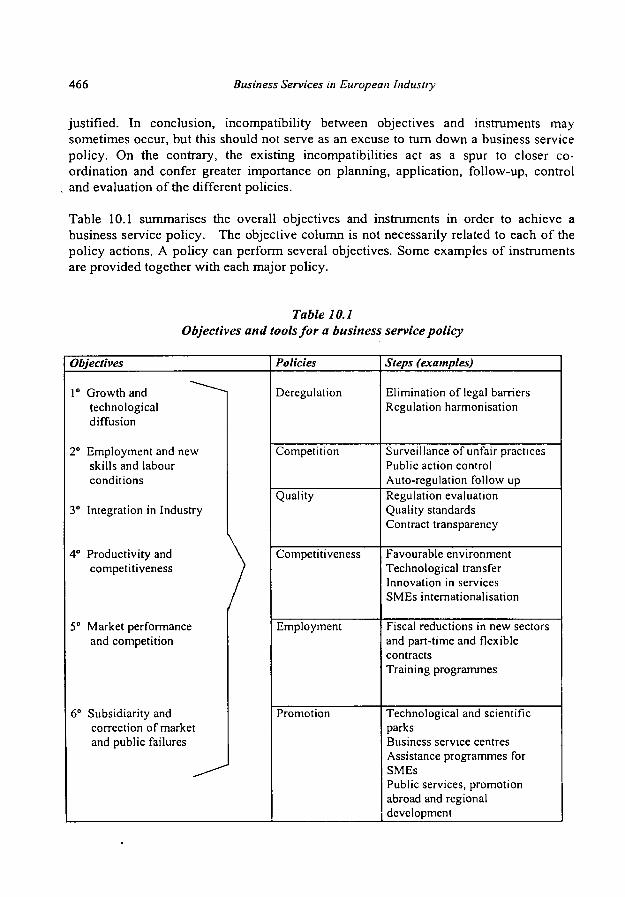
466 Business Services in European Industry
justified. In conclusion, incompatibility between objectives and instruments may sometimes occur, but this should not serve as an excuse to rum down a business service policy. On the contrary, the existing incompatibilities act as a spur to closer coordination and confer greater importance on planning, application, follow-up, control and evaluation of the different policies.
Table 10.1 summarises the overall objectives and instruments in order to achieve a business service policy. The objective column is not necessarily related to each of the policy actions. A policy can perform several objectives. Some examples of instruments are provided together with each major policy.
Table 10.1 Objectives and tools for a business service policy
Objectives
Γ Growth and technological diffusion
2" Employment and new skills and labour conditions
3° Integration in Industry
\ 4° Productivity and \
competitiveness /
5° Market performance and competition
6° Subsidiarity and correction of market and public failures
^**^
Policies
Deregulation
Competition
Quality
Competitiveness
Employment
Promotion
Steps (examples)
Elimination of legal barriers Regulation harmonisation
Surveillance of unfair practices Public action control Auto-regulation follow up Regulation evaluation Quality standards Contract transparency
Favourable environment Technological transfer Innovation in services SMEs internationalisation
Fiscal reductions in new sectors and part-time and flexible contracts Training programmes
Technological and scientific parks Business service centres Assistance programmes for SMEs Public services, promotion abroad and regional development

Towards a Business Service Policy in Europe 467
10.3 Working framework for a business service policy
Having considered the main objectives and tools of business service policy, this section presents the action framework necessary for its development. Due to limitations of space, each and every policy and steps indicated will not be dealt with in depth. The six important policies that implement the business service policy, will be presented with suggestions of some possible measures or lines of action. The objective is to stimulate an initial reflection on a European level regarding a policy that could affect, and in fact, does affect the levels of employment and competitiveness of European Industry. At the end of each policy a box is presented covering the main related implications which have been specified in the Business Service Communication (EC, 1998a)3.
10.3.1 In principle, liberalisation policy
As indicated in the introduction to this book, in recent years, the explosion of the business service sector has been followed closely by academics and politicians. Although up until the last decade, these services were the most confined of all, particularly according to official statistics, which always included them in residual categories, today the situation is changing radically. The productive character of these services is slowly being accepted as being able to generate a high value added, which create more and more employment and have a strong relation to the other sectors of the economy. Gradually, the role played by business services in economic development, in its relation to new technologies, in the changes in productive systems and in the competitiveness of all manufacturing and service industries has been revealed.
This process of understanding what business services represent and what they contribute to in economic growth has coincided with the impetus that has been given recently to the processes of liberalisation of service activities as a whole. Business services, like transport and communications services, tend to come together when markets open up and to shield themselves with protectionist type rulings, albeit for different reasons. As a result, the prices of these services tend to be high and positions of power generate losses in efficiency, social welfare and competitiveness. If one takes into account the fact that these practices contradict the principles of a Single Market and of unrestrained international trade, the European Commission and the various Member States have adopted policies of liberalisation and deregulation. The aim is to guarantee the principles
The policy actions indicated in the Commission Communication on Business Services are not exactly the same that the ones indicated in this book. The Commission indicates six main policy objectives: Improving Productivity; Promotion of Employment possibilities; Improving Competition in the Business Services sector; Promotion of Industrial Co-operation between Business Services Suppliers; Promotion of Business Services; Encouraging Modernisation of Public Administrations. Only two of these have the same title and content with respect to what is presented in this section. However the overall contents are so similar that the different specific actions and measures included in the Communication can be assigned to our six policies. The boxes reproduce exactly the contents of the Communication.
468 Business Services in European Industry
seen in the sixth chapter: national treatment, non discrimination, competitive markets, control of safeguards and exceptions, guided self-regulation and transparency. These "liberal" policies are ultimately based on the advantages of international trade of services that, as has also been dealt with, tend to be superior to those derived from trade of goods. At the same time, the foreseeable capacity that these policies have to stimulate growth of services enables an efficient alternative to more interventionist types of policies, at least in theory, which consist of the direct promotion of these types of services. Therefore, it can be stated that liberalisation policies of the sector have been motivated by the following three factors:
1. by the growing importance and notoriety of business services; 2. by the natural extension of the liberalisation and re-regulating policies initiated
in other service sectors; 3. by presenting an efficient way of encouraging services, as an alternative to
other types of more costly and interventionist types of policies.
Liberalisation policies of business services activities in Europe have been clearly guided by the European Commission. As explained in chapter six, since the Treaty of Rome. Community action has been geared towards confirming the free movement of services and the right of establishment for European professionals. The general programmes for these two principles (1962), the partial guidelines developed for specific sectors (for example, those referring to lawyers in 1977 or those referring to architects in 1985), the White Papers (1985) and the Single European Act (1986), the Cechini report regarding the cost of Non-Europe (1988), the three systems for qualification and diploma recognition, and the associated guidelines (1985,89,92), the different regulations, decisions and proposals of the Commission regarding freedom of movement for workers, professionals and the unrestrained rendering of services, the accepted mutual recognition principle as a new approach and, last, but not least, the jurisprudence of the Court of Justice have all contributed to this.
One of the most unfamiliar matters of the current situation refers to the evaluation of the liberalisation steps of services carried out over the last 35 years. Nowadays, there are controversies regarding the effects of some liberalisation policies in the field of transport (in particular, air and rail transport), commerce (large establishments versus the small retailer) or postal services (number and composition of the operators). Staunch supporters of liberalisation face opponents that argue that liberalisation does not always imply reduced prices, better quality and improved competitiveness. In the case of business services the discussion is not so relevant due to two reasons. Firstly, the flexibility that is finally imposed in the liberalisation strategies allows for cautious progress and, on occasions, with a notable dose of conservatism. Secondly, because of the natural way in which international companies remain in their markets means that they do not exert strong political pressure for liberalisation measures to be adopted or refused; in other words, the most important businesses can be made regardless the existing regulations.
Towards a Business Service Policy in Europe 469
Although the lack of figures or reports regarding the effectiveness of the liberalisation of business services prevents a quantitative assessment from being made, nevertheless, we can point out the obstacles that exist in order for the steps carried out to lead to greater market integration^:
1- Difficulties in the application of liberalisation policies 2- Weakness of international trade as a way of integration 3- Multiplicity of existing barriers 4- Incomplete information
/ - Difficulties in the application of liberalisation policies
The first obstacle to liberalisation policies effectiveness for business services lies in the drawing up and the fulfilment of these policies themselves. There is a strong argument that limits its scope: an excessive opening may allow professionals with lower qualifications to enter, reduce the quality of the services and, as a consequence, harm the economy as a whole. Therefore, agreements tend to be very flexible, leaving scope for governments to apply the principle of mutual recognition and maintaining those principles of professional associations in the sector that contribute to the quality of the service.
In the same way that these agreements may have relatively limited objectives and allow for, in some cases, government interpretation, implementation of the agreements is not without its difficulties. The system of mutual recognition does not guarantee a transparent and quick procedure of professional validations and certificates. There is a large gap between theory, widely accepted, and practice, hard to manage.
2- Weakness of international trade as a way of integration
On the contrary to what occurs in other sectors of goods and services, international trade of business services is not the most significant aspect of the international nature of the activities of the sector. The levels of exports of the compames do not reach 3-5% of turnover in the majority of activities, if we exclude engineering services that manage to export up to an average of 30%. There are many methods in which international expansion of the sector takes place: direct investment, purchase or take-over of companies, the establishment of joint ventures, the creation of collaboration networks, intra-firm trade, diffusion of international know how and temporary mobility of highly qualified workers. Liberalisation measures do not directly affect most of these modes of internationalisation. The integration of business services markets requires a strong "nationalisation", that is to say, to come to terms with the economic, social and cultural
The in-depth treatment of these matters was dealt with in chapters four and six. Here we simply attempt to ascertain which particular methods of rendering business services place a constraint on liberalisation.
470 Business Services in European Industry
parameters of the nation in which one operates. This requires time and an understanding that no law could substitute.
3- Multiplicity of existing barriers
As already explained, there are many barriers that affect business services markets: legal, economic, intrasectorial and socialcultural. Of these, legal barriers and few others are subject to elimination by the liberalisation measures. Economic or intersectorial barriers can also be subject to political action, however the extent to which these actions can be effective is far lower than the case of legal impediments. The multiplicity of the market limitations to market integration reduces the effectiveness of liberalisation policy based on the elimination of legal barriers.
It is necessary to take into account the fact that the legal business service barriers may be less significant than economic, social or other types of barriers. For example, the limitations to the internationalisation of a firm of lawyers in another country are only legal in a small proportion (it is necessary to hold the certificate and have practical experience in the country of origin that are subject to recognition), given that the greater difficulties are of an economic nature (to know the market in which the firm will operate and to have the resources for expansion), social-cultural (to know the language, culture and judicial order of the country in question), and organisational (to establish coordination between the different offices and to affiliate itself to the pertinent organisations adopting the respective deontological codes). In conclusion, political action encourages but does not determine the international expansion of business services.
4- Incomplete information
Business services markets are characterised by the presence of incomplete information. This entails a problem when evaluating the correspondence between prices and quality of services, with the consequent implications that this involves: market narrowness, inflationary pressure, uncertainty, etc.; a natural restriction is imposed on all possible liberalisation measures. Incomplete information in markets has two components: the incomparability of the service, given the nature of the service and market composition: and asymmetric information, due to the fact that one market side has a greater knowledge than the other. Traditional problems of adverse selection and moral hazard, dealt with in chapter four, stem from the latter.
All the aforementioned problems (scope of legislation, internationalisation methods, multiplicity of barriers and incomplete information) originate from the personalisation of the service and the difficulty that the provision of a service has to assume characteristics of goods, which are easily identifiable and comparable to other goods. The interactive nature of the service establishes limitations for the traditional liberalisation policies.
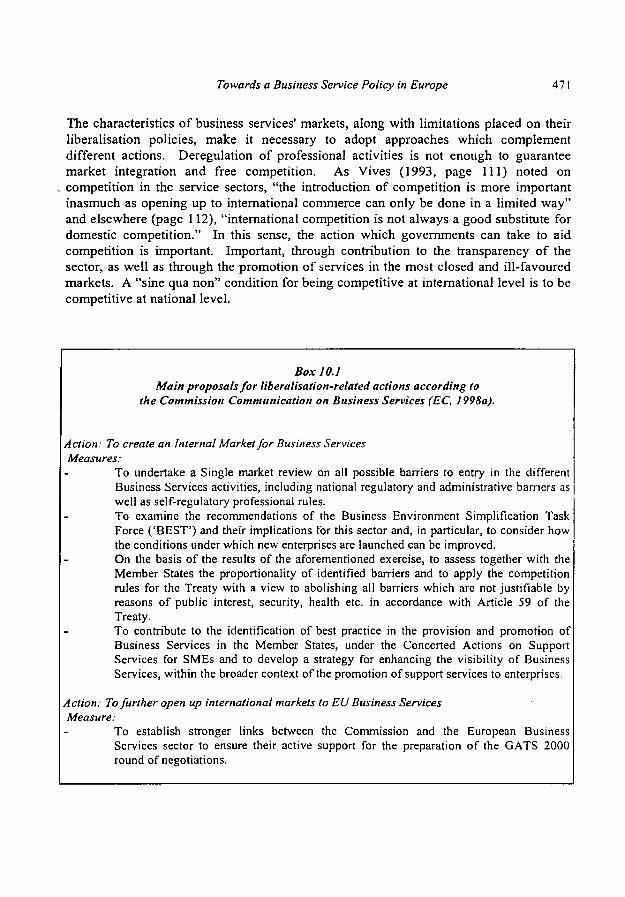
Towards a Business Service Policy in Europe 471
The characteristics of business services' markets, along with limitations placed on their liberalisation policies, make it necessary to adopt approaches which complement different actions. Deregulation of professional activities is not enough to guarantee market integration and free competition. As Vives (1993, page 111) noted on competition in the service sectors, "the introduction of competition is more important inasmuch as opening up to international commerce can only be done in a limited way" and elsewhere (page 112), "international competition is not always a good substitute for domestic competition." In this sense, the action which governments can take to aid competition is important. Important, through contribution to the transparency of the sector, as well as through the promotion of services in the most closed and ill-favoured markets. A "sine qua non" condition for being competitive at international level is to be competitive at national level.
Box 10.1 Main proposals for liberalisation-related actions according to
the Commission Communication on Business Services (EC, 1998a).
Action: To create an Internal Market for Business Services Measures:
To undertake a Single market review on all possible barriers to entry in the different Business Services activities, including national regulatory and administrative barriers as well as self-regulatory professional rules. To examine the recommendations of the Business Environment Simplification Task Force ('BEST') and their implications for this sector and, in particular, to consider how the conditions under which new enterprises are launched can be improved. On the basis of the results of the aforementioned exercise, to assess together with the Member States the proportionality of identified barriers and to apply the competition rules for the Treaty with a view to abolishing all barriers which are not justifiable by reasons of public interest, security, health etc. in accordance with Article 59 of the Treaty. To contribute to the identification of best practice in the provision and promotion of Business Services in the Member States, under the Concerted Actions on Support Services for SMEs and to develop a strategy for enhancing the visibility of Business Services, within the broader context of the promotion of support services to enterprises.
Action: To further open up international markets to EU Business Services Measure:
To establish stronger links between the Commission and the European Business Services sector to ensure their active support for the preparation of the GATS 2000 round of negotiations.
472 Business Services in European ¡ndustry
In addition, it must be pointed out that liberalisation encompasses more than just international legal harmonisation or national deregulation. On many occasions, liberalisation measures must be followed by re-regulation processes in order to guarantee the transition to the new situation and ensure the desired market order. With regard to all this, it can be concluded that the other five types of policy which follow are fully complementary to the necessary liberalisation policy. Box 10.1 includes the liberalisation measures proposed by the Commission with respect to business services. They mainly concern the Single Market review and the GATS international agreement.
10.3.2 Competition policy
Competition policy is inseparable from the deregulation policy presented in the previous section. Domestic competition should be fostered at the same time as international competition. As the market does not guarantee self-regulation with respect to competition, it is necessary for government to oversee those regulations which control the rules of the game and which should be respected by all parties. In this way, the competition policy which is carried out by many Member States has begun to approach some of the issues which most affect business services. Such is the case of some restrictive practices pursued by professional organisations, regulations covering the transparency of public tenders, or permits for concessions and the provision of services.
These same subjects are those which have been at the centre of actions related to competition policy in the EU The fact is that agreements which divide up the market as well as mergers which oppose free competition are scarce within the context of fragmented markets. Due to this, competition policy focuses its attention on the formation of entry barriers through the recognition of certificates, low tariffs, quality requirements, demand for non-technical permits, public tenders, exclusion of companies, etc. As it is difficult to distinguish the formation of artificial entry barriers from that of natural ones, it is pertinent to realise that competition policy is a case by case approximation guaranteed by the jurisprudence of courts of law. In this way, competition is monitored starting from reliable observation of a situation with a lack of competition. This, for example, has been the way to approach situations where professionals are excluded for reasons of different nationality or rulings on whether or not the exclusion of exhibitors from certain fairs was out of order. Once a breach in competition has been established, one can observe power conflicts in markets starting with the precedents which have been created.
Another of the matters which competition policy should keep an eye on in the coming years is the conduct of large multinationals in the sector. In some cases, they are in the position to follow certain unfair practices. Collusive actions on price or market fixing, unfair practices as a result of loss of independence (as sometimes happens on sharing services such as consulting, auditing, legal or information within the same group), or predatory actions for the acquisition of new markets (in the SMEs markets or in public
Towards a Business Service Policy in Europe 473
tenders in which the quality of service is of secondary importance5). In the near future there is also the possibility that some mergers might violate EU competition rales.
All of these areas of possible public action should not lead one to the impression that . competition is heavily distorted by the oligopolies of large companies. The sector still has a very low level of business concentration compared with other economic sectors. That is to say that the monopolistic power of large multinationals in the sector is currently justified by market rales. The abuse of monopolistic power, when it exists, is concentrated in certain markets of large companies and in the Civil Service. For this reason, competition policy should be selective. It must also be said that certain practices which constitute an abuse of market power may not have to be eliminated, as long as they do more good than harm. Lastly, some close to being "contestable" markets may exist, with ease of entry and exit, which would recommend adopting a less active attitude towards certain actions. To sum up, competition policy should make a case by case study of the situation before deciding how advantageous or disadvantageous certain unfair practices are. It is necessary to evaluate the magnitude and the consequences of the supposedly punishable action.
Box 10.2 presents the competition-oriented actions proposed by the EU Commission. These regard analyses of national practices in order to promote the best ones and public procurement markets.
It is important to point out that regulation of public tenders has not always reached the proposed objectives. For example, there are countries where the limit on how much can be contracted by way of public tenders has been considerably reduced. Thus, almost all public contracts have had to go through official bulletins, etc. This has been the case in Spain. Currently raising the limit is being proposed due to the fact that it slowed down administration and did not resolve the question of competition. Occasionally, SMEs which specialise in a required service are excluded, either by predatory prices offered by large companies or by pressure applied by some large multinationals' lobbies. In this way, the increase in the number of public tenders, far from increasing competition, in a certain sense, can reduce it by encouraging the growth of objectives which do not deal with quality. This in turn becomes of secondary importance. Quality procurement polices in business services should be different to other more standardised goods or services. For example, negotiation and quality/price definition and redefinition during the call for tenders should always be possible in a transparent way (see current actions in chapter 6, section 6.3.2).

474 Business Services in European ¡ndustry
Box 10.2 Main proposals for competition-related actions according to
the Commission Communication on Business Services (EC, 1998a).
Action: To promote transparency in the supply and demand side of the market. Measures:
To improve data-collection, analyses and research on the demand and supply of Business Services by allocating more resources to this field at Community and national level. The guidelines for future work in this field, mentioned in the Report on Industrial competitiveness and Business Services (chapter IV) can be used for the initial definition of this task. To examine in detail the dynamics of Business Services, taking particular note of the role of smaller firms and their potential contributions to its future development To support dissemination of the information collected to all interested parties, while ensuring that this does not restrict or distort effective competition.
Action: To ensure that EU and national competition policies are based on the best possible knowledge of the Business Services sector
Measure: To analyse continuously the structure of the European Business Services market and to reflect the results of such analyses on Community and national competition policies. To systematically examine the impact of competition decisions concerning Business Services companies on the competitiveness of EU Industry.
Action: To improve the functioning of the European public procurement market for Business Services
Measure: To take into account, in the amendments of the public procurement directives announced in the Commission Communication on Public Procurement in the European Union, possibilities to make procurement procedures more flexible and allowing dialogue between purchasers and suppliers in the course of such procedures and not just in exceptional circumstances.
10.3.3 Quality policy
Quality policy is understood as being the aggregate measures which regulate the business services market in order to enhance quality. On some occasions, regulations are brought together or put forward by other types of policies. One of the main results of regulations which tend to facilitate competition or the opening of markets is quality too. Nevertheless, quality can also be the express objective of a policy which affects innumerable aspects of relations between provider and client.
Towards a Business Service Policy in Europe 475
As has been seen, the problem of imperfect information creates an obstacle to quality, both for service providers and for clients. Problems arising from market segmentation and a lack of transparency could be the objective of a business service policy on influencing prices and quality. First it is necessary to observe the mechanisms supplied by the market to resolve these problems. State action is only justified if the market is not capable of adequately resolving the different situations. The following factors supplied by the market can be considered in relation to the problems of imperfect information and transparency.
Reputation: Reputation is the first mechanism of the market which reduces the levels of adverse selection and moral hazard. The reputation of the provider guarantees a certain level of quality. Reputation is associated with a name and an image. In business services, the company name is usually closely related to the name of the professionals who run the company, firm or consultancy. On occasions, reputation can stem not from a name or an image, but from the simple transmission by word of mouth of the good experiences of former customers.
Contractual clauses: Contracts can be written in such a way as to specify guarantees in the case of services rendered, not corresponding to an established minimum. The classic example is that of a lawyer who reaches an agreement with his client to receive payment only in the case of winning the lawsuit. In principle, this type of contract reduces moral hazard, as the effort made by the provider carries a greater guarantee. Adverse selection is not directly affected, though the fact that less-qualified businesses leave the market affects it indirectly. In any case, these solutions do not only have advantages. A link between salary and results is negative inasmuch as the success of services often depends on factors which are not controllable by either of the parties involved. Whether the best lawyer wins or loses a lawsuit does not only depend on his qualifications or effort, but on the interest and attitude of the client and on the emotions and actions of the judge or jury. It is understandable that professionals endeavour to charge for their work and not for its end result.
Insurance: Obtaining insurance linked to the service is one way of reducing the problems generated by imperfect information. There are insurance policies linked to the service which take effect in the case of failure or error. An example is found in security services, where providing the service may be coupled with various insurance policies (for the guards, the objects or persons guarded and for the likelihood of errors in service).
Certification: As seen previously (chapter 4), one of the most noteworthy phenomena in the world of services has been the extension and expansion of accreditation and certifications guaranteeing quality. As quality control is the key issue in problems of imperfect information, many business services providers seek to be accredited by institutions and organisations which
476 Business Services in European Industry
guarantee the commitment of their members to comply with determined standards of quality. Thus, for example, the ISO 9000 in the world of consultancy is a certification of service which provides the customer with certain guarantees.
Professional requirements. Public or professional organisations associated with qualifications also exist. Examinations, university degrees, diploma, etc., are key instruments to guarantee quality in many business services. In addition, professional associations have the responsibility of serving as a quality upgrade of sendees. Professional societies and associations themselves also emerge as a response to the issue of quality. They do so in an attempt to distinguish their members from other non-members as having higher quality requirements. Besides lending their name to their members, they ensure loyalty to their deontological principles and codes. Problems in this area arise in discussions on the voluntary or compulsory character of certain exams, certificates, belonging to professional associations, price guides, technical requirements, etc. Trends are towards distinguishing between quality assurance (e.g., technical visa) and corporate protectionism (e.g., prices control). In any case, it is necessary to strike a balance between quality and entry barriers.
Training and qualification: The problem of adverse selection is closely related to the educational system of the country; the quality of instruction and the different alternatives available in universities, technical studies, and professional education. Masters degrees and courses promoted by interested companies themselves reduce the level of adverse selection as they raise qualifications. Professional societies and associations also promote courses and training methods for their members, with the same effect.
Concentration of companies: Low market transparency has a natural self-correcting mechanism according to the dynamic of the companies which constitute a sector. An expansion of companies in one determined area increases competition and, probably, the level of similarity. The fact that business services tend to be concentrated is to the advantage of the area in which they are concentrated and in the segment of the market towards which concentration is directed. In the same way, the processes of internationalisation which guide markets are advanced. In any case, it is necessary to remember the wide limitations to concentration processes (chapter 9) and the different business service ways of integrating markets and networking (chapters 6 and 9).
Information: By producing tools for obtaining information: magazines, trade directories, membership lists, etc., societies and associations also contribute to the reduction of low market transparency and incomparability of markets. The consultation or publication of these works reduces the amount of imperfect information.

Towards a Business Service Policy in Europe 477
As it has been shown, market mechanisms are dealing adequately with imperfect information and improve quality. Within this context it is logical to ask what the role of the State is in a possible policy which might contribute to further reducing information problems in markets. In this matter, past experience and studies consulted lead to very
. clear conclusions:
1. Government is not necessarily more efficient than the market in providing incentives for the improvement of quality of service. Furthermore, individual incentives cannot be regulated by the State, therefore its work in this field must be secondary to the work of the market.
2. In the context of imperfect information, regulation by the State will have effects which will not be effective in the Pareto sense. That is to say, it is necessary to carry out interpersonal utility comparisons, evaluating who will benefit and who will be harmed by a particular measure ß
3. Government can and should support the actions of those private agents who create mechanisms for reducing information problems. To this end, among the possible positive measures which could be adopted are the following: promoting certifications and guarantees for quality of service, allowing legislation appropriate to these problems, improving the educational system, fostering the internationalisation and deregulation of the sector. Government should also endeavour to maintain quick and efficient Courts and legal operations. In this way, possible conflicts would have a more prompt resolution and the number of potential violations of service contracts would be reduced.
4. Government could carry out promotion actions in those segments of the market where service providers are not interested in having a presence and where, therefore, the structures of the existing markets are not developed enough or do not have the same usefulness. Within this context, one might establish direct promotion in favour of small business and less-developed areas, which, as we have already seen, are the two segments which benefit the least from the business services economy.
Excluding those actions which improve quality of service from other policies laid out, one may suggest the following specific actions:
Regarding existing regulations it is possible to revise and evaluate: the current importance and appropriateness of existing regulations limits to the number of providers of certain services (capacity)
This result, as well as a model of the problems of adverse selection and moral hazard as applied to services, can be seen in Holmstrom ( 1985).

478 Business Services in European Industry
regulations for making the law widely known within business services legislation on fulfilling contracts examinations taken previous to practising a profession the costs of regulations in markets
Regarding the promotion of quality in services, here are some suggestions: standardising contracts and analysing guarantee clauses encouraging rules of conduct and the employment of deontological codes promoting the use of accreditations and certifications of quality reviewing the standards for granting licenses and certificates facilitating public information about markets
Regarding the method for carrying out these actions one must pay attention to two objectives: creating policies in co-ordination and agreement with affected agents and preventing the regulators from being taken over by the regulated. In order to accomplish these two objectives it is important to bear in mind:
involving companies in action planning, including large multinationals as well as SMEs seeking the active participation on the part of both specialists in the affected sectors and independent experts (preferably university professors or experts in public administration) having the results evaluated by external advisers
Box 10.3 presents the main action proposed by the EU on quality, market transparency and quality of human resources.
Box 10.3 Main proposals for quality-related actions according to
the Commission Communication on Business Services (EC, 1998a).
Action: To promote transparency in the supply and demand side of the market. Measures:
To promote measures for improving quality and access to certification of Business Services in a partnership approach with the interested parties. To evaluate shortcomings in quality assessment and to support improvements.
Action: To improve the quality of human resources Measures:
To analyse qualifications, skills and labour conditions in Business Services companies and identify future needs. To analyse how those Business Services activities related to human resources (management consultancy, labour recruitment, etc.) contribute to improving the human capital productivity in Industry. To promote the elaboration of a European system of quality control of training, based on an approach similar to that of process and product quality standards and backed up by certification taking into account the need to focus on skills transferability, making them more transparent for both workers and employers.
Towards a Business Service Policy in Europe 479
10.3.4 Competitiveness and productivity policy
The lack of competitiveness and productivity in many business services markets is the result of how narrow many of its markets are and of the damaging effects this has on prices and quality of services. For this reason, the policies of deregulation, competition and quality were described previously. In addition, there are others related to traditional measures for improving the competitiveness of companies.
This is the case of policies which favour internationalisation, whose object is to supplement the natural trends toward global markets. Internationalisation of business services markets has been introduced by large multinational corporations which dominate in each activity. This fact has encouraged the creation of collaborator/ networks among some small and medium-sized enterprises, which, in tum, have been internationalised to a certain extent. Conditions for co-operation among European companies have improved greatly, due to economic integration, but also thanks to Community action to eliminate barriers to the Single Market and support for cooperation among companies. In any case, much still remains to be done with regard to the internationalisation of SMEs. This policy could be further targeted on business services.
The application of some processes to promote international commerce also belongs here. The advanced services of fairs and exhibitions, export aid or IT services are all capable of improving the competitiveness of European manufacturing and services. Of these, some of them, such as fairs and exhibitions, are already dedicated instruments in countries' strategies for improving external competitiveness.
Additionally, innovation and the policy of technology transfer may have an unbeatable ally in business services. Business services produce innovative effects in companies and generate a change in the state of technological knowledge in companies. However, at the same time, they are carriers of the most important technological advances in society. This makes them possible pivots in policies which seek to stimulate and disseminate innovations. This is especially true if innovation is understood in the broad sense of the word and not only in the traditional sense of R & D carried out for certain products. Innovation of both processes and organisation proves to be very important in providing innovative services.
Another, more structural measure consists of those measures put into action to improve the productivity of supply. These may be many and highly varied. The majority of them should not be by nature specifically for advanced services, but should be of a horizontal type, although they may have a special effect on advanced services. In light of this, it is advisable to apply some of the factors pointed out by authors such as Denison(1985), Maddison (1987) orKendrick (1979) to business services:
480 Business Services in European Industry
Improvements in the growth rate of physical capital per worker. As there is a positive correlation with the output of workers, it is advisable to stimulate not only the quantity, but also the quality of investments, thus high rates of return can be obtained. This, however, also requires a low interest rate policy. Encouraging new technologies, for example, is more and more over-riding in the midst of an information society, where obtaining, manipulating and processing information constitute assets which are inseparable from the training of human capital.
Advances in technological knowledge. This is the decisive technological element in productivity output. In the world of business services, this technology should be understood in the broad sense, almost equal to organisation, manufacturing methods, and training processes. Among these advances, investment in R & D stands out, although it may not always be easy to identify R & D in the world of services. Sometimes it is related to the development of fixed capital rather than to the creation of a product or process, separate from production activities. In any case, support for R & D at its different levels and, especially, in forms that are considered intangible, such as quality and design projects, information management, etc., make up an invaluable part of reaching the objectives of productivity and competitiveness of any modem industrial policy. The State is responsible for correcting market errors due to the nature of public good which many of the most important developments in these circumstances acquire.
Training of human capital. In this aspect business services stand out due to high qualification requirements in many of its sectors. This does not mean, however, that some services which require lower qualifications do not exist. The plurality of qualifications in advanced services makes jobs and their training a decisive issue in improving productivity (chapter 2). In fact, the skills and expertise required to provide more advanced services are not always available due to limited training and development markets in many fields.
All of these elements contribute to improving the productivity of workers and their organisation. In this way human capital is the essential part of policies which stimulate productivity in supply. Thus, one must also remember that there are certain elements which are very characteristic of business services. These may recommend making maximum use of resources which at times do not adapt properly to the labour market rigidity. Therefore, it is not strange that the great opportunities for using qualified and unqualified manpower on a part-time basis in the Netherlands, coincide with the fact that this country has highly developed business services markets.
Box 10.4 presents the numerous actions proposed by the EU Commission in this field. They concern first the measurement of productivity. Second, research and evaluation of barriers to productivity improvements. Third, innovation related measures. Fourth, encouragement of co-operation between business services suppliers.

Towards a Business Service Policy in Europe 481
Box 10.4 Main proposals for competitiveness and productivity-related actions according to
the Commission Communication on Business Services (EC, 1998a).
Action: To create new instruments for measuring productivity Measures:
To find new indicators for price/quality ratio, real inflation, output growth, etc, creating a new statistical methodology for measuring input and output in each Business Services activity. To find indicators and to measure Business Services role in improving the productivity of their clients and, therefore, of the whole economic system. To analyse other factors that determine the demand for Business Services, including the existence of market failures in the relevant markets and the policy responses to them.
Action: To identify and evaluate barriers to productivity improvements Measures:
To assess the role of Business Services in overcoming existing barriers to improving productivity in the economy. To analyse the effects of outsourcing on the productivity of Industry.
Action: To foster innovation Measures:
To create awareness and facilitate Business services companies' participation in projects that promote innovation in service provision, including those under the 5 t r l Framework Programme and the Multi-annual Programme for SMEs. To facilitate Business services companies participation in actions under the First Action Plan on Innovation, in particular in actions promoting Business Services application of IT-technologies through demonstration and pilot projects, workshops, etc.
Action: To support the creation of cooperative networks between Business Services suppliers. Measures :
To facilitate the setting up of data-bases on cooperative networks between Business Services suppliers and to promote certification of such networks in order to create confidence in the ability of these networks. To raise the visibility of the advantages of cooperation by promoting participation in projects under the Community instruments to promote business cooperation (BC-Net, BRE, Euro-partenariat, Interprise) and the 5 t n RDT framework programme. To support an improved institutional representation for the entire Business Services sector.
482 Business Services in European Industry
10.3.5 Employment and training policy
Within a globalised world, only those companies capable of competing are those which combine the conditions needed to generate stable jobs. Thus, jobs and productivity form an inseparable binomial where business services are the crucial linking between. Business services, as we have seen in chapters 1, 2, and 3, contribute both to the aggregate of industrial jobs and to industrial competitiveness. Through its functions in the production value chain, business services improve quality/cost relationships, allow technological and innovative improvements, and attract new jobs to those areas which benefit from the inclusion of services provided both in-house and externally. Business services therefore generate jobs in their sector itself as well as in the other sectors of the economy.
Employment policies which may be directed towards reinforcing the relationship of jobs, productivity, competitiveness and business services can be implemented through the following possible actions:
A. Actions which boost jobs in the sector. Insofar as business services have constituted the most dynamic sector in job creation in recent years, an active job policy may be contributing to the acceleration of this process established in the market, which might reduce current levels of unemployment. Jobs generated in the sector will in tum create indirect jobs through positive results: greater presence of services and greater competition. User companies will see the benefits of greater quality and lower costs, making them more competitive and capable of in rum creating new jobs. Three suggestions for action in this area follow:
1 s t . Special tax treatment for companies in the most strategic business services activities; those which create the most direct or indirect jobs or those which produce better conditions in companies for competitiveness.
2 n " . Access to capital for new initiatives in new advanced services. In particular, those initiatives directed towards young people who want to set up their own business or those who, having some experience in the sector working for a large corporation, decide to start their own business in new services or those which are geared towards new markets.
3 . Reduction or elimination of VAT for activities with the greatest amount of job creation, as stated in the Commission's recent proposals for stimulating job creation; some strategic business services activities could benefit from this measure.
B. Actions which improve job conditions. Employment levels do not only benefit from direct stimulus of job creation, but also by creating a good working environment. Furthermore, it is a good working environment which is able to create jobs which are much more stable and productive than those which are related to direct promotion. In
Towards a Business Service Policy in Europe 483
the case of business services, flexible working conditions appear to be a requirement for their strengthening. Business services are founded on professional, autonomous, variously qualified and very dynamic jobs. Rigidity in labour markets is contrary to the economy of business services. On the contrary, flexibility encourages the appearance and expansion of advanced services, many of which develop with very little structure, part-time jobs and in conditions of high job rotation. For these reasons, it is important to take into account the following possible measures towards improving work conditions:
1 Furthering the flexibility of the job market, in general. 2nc* Obtaining favourable tax treatment for contracts with flexible hours, conditions
and remuneration. 3 r " Promoting part-time and tele-working contracts. 4"1 Encouraging initiatives which compensate the conversion of temporary jobs
into fixed ones. 5th Promote equal opportunities for women, handicapped people, and tele-workers.
C. Activities which encourage competitiveness in user-companies. A third type of beneficial measures for business services are those which have a direct influence on the demand for the services, rather than on the supply (the previous suggestions). Insofar as demand is motivated to incorporate new business services in its chain of production, new jobs will be created. This occurs as much in the supply of these services, as in the company itself when it sees improved results and competitiveness as the fruit of the use of the aforementioned services. The following course of actions can be suggested for this area:
1st Favourable tax treatment for services outsourcing, such as the reduction of VAT previously mentioned.
2nd Favourable tax treatment for the coexistence of internal and external services. Those companies which subcontract external services and which, at the same time, have employees performing related tasks, could benefit from incentives for maintaining both sources of advanced services (internal + external). Maintaining both supply sources reinforces competition and the end quality of the service, which ultimately may generate profits for the companies as well as gains in jobs.
3rd Measures to stimulate those segments of the market not present in strategic services. These are companies which have no demand for advanced or strategic services because they are in regions where there is not a sufficient supply or because they are of a size which does not allow them to gain access to certain excessively expensive services (the case of SMEs). They can be encouraged to contract certain services by way of tax rebates, subsidies or public supply of services (see the following heading). In this way, there is also a contribution to better employment in those segments of markets where other measures may rum out to be insufficient.

484 Business Services in European Industry
Box 10.5 includes the actions proposed by the Commission on employment. They focus on new job creation, co-ordination of national employment policies and the business service use of some Commission programs such as the Structural Funds.
Box 10.5 Main proposals for employment-related actions according to
the Commission Communication on Business Services (EC, 1998a).
Action: To improve knowledge about the job creation potential of Business services Measure:
To collect data and analyse relationships between qualifications, skills and labour conditions in order to understand how employment in the Business Services sector is created and how this affects job creation in other sectors of the economy.
Action: Co-ordination of national employment policies Measure:
To create awareness in Business Services organisations and companies of the new possibilities which will follow from the guidelines of the 1998 National Action Plans for employment. To remove barriers to mobility and promote access to education and training through development at distance learning, University/School/Industry partnership and the exchange of best practices.
Action: To encourage employment development in Business Services through the European Social Fund and other human resources-related programmes.
Measures: To create a co-ordinated and systematic employment and training scheme, for example in the form of an ICT based job-watching scheme, in order to link education, training and employment at a European level. To improve the awareness of Business Services organisations and companies of the possibilities for support from the European Social Fund under its new priorities. To develop Business Services training and education infrastructure, particularly in the context of local development and the promotion of employment and training in the third system of employment (cooperatives, mutualities, etc).
10.3.6 Promotion policy
The final area for political action is reserved for those markets to which business services naturally do not pay much attention. This is the case of small businesses and those in peripheral regions. It is in these two segments of the market where it is possible to bring about more decisive action, establishing a change in trend from the current situation. It is possible to make an additional effort to reduce those problems which

Towards a Business Service Policy in Europe 485
neither the market nor public intervention manage to resolve in a co-ordinated and suitable way.
As a result of the processes of mergers, internationalisation and information, two types . of duality, typical of the sector, are reinforced: duality due to size and duality due to physical location. The flow of international activities is usually concentrated in segments of the market which are more qualified and which have greater power in the market. These mergers leave some segments of the market, basically small businesses and the most peripheral geographic areas, under-provided with the activities of the sector.
Let us first consider access to business services by small businesses. Small businesses are those which have the most difficulty in outsourcing their services. Additionally, when they do so, they usually contract those standardised services which they cannot provide in-house due to their small size. Advanced services are generally left out of business plans. Lack of information as to the possibilities available and the different prices which exist reduce the field of vision of small businesses. They then end up considering these services as dispensable and excessively expensive.
At the same time, the problems of incomplete information are much more serious for small businesses than for large ones. The latter subcontract the same service in several instances, have more experience, and can, for this reason, better evaluate the provider. In small businesses, the rate of imperfect information is higher. This causes many small business owners to be reluctant to contract services from unknown parties whose qualifications, circumstances and effort to be brought to bear in the job appear to be completely uncertain. Together with information problems, market internationalisation itself, and the duality created within markets with a great deal of competition and niches on the edge of competition all bring about different situations according to the type of services being offered.
When highly standardised services are internationally offered in competitive sections, prices tend to go down. This enables small businesses to gain access to the services. A recent example is that of security services. The growing integration of the market, the standardisation of security systems and the achievement of economy of scale have given rise to a decrease in the cost of guard services and alarm centres. This has brought a service, which was financially out of reach before, closer to small businesses and consumers.
On the other hand, in more advanced and personalised services, which are seldom subject to standardisation and scale economies, internationalisation has concentrated the most highly qualified professionals in the most competitive activities. The competition which acts to bring down prices, as in the opposite case, does not make up for the high cost of qualification, personalization and reputation in these services. Thus, large consultancies, for example, charge rates which are impossibly high for many small businesses. Therefore, some potential customers seek out a niche where they can be
486 Business Services in European Industry
provided with these services at less expense, and others give up the service or try to resolve the problem in-house, although this may not be the most effective method.
All of these factors justify creating an active policy in favour of small businesses with the aim of improving competition and allowing the use of services with a good quality/price ratio (better quality and lower prices). Thus, they could benefit from the innovative advantages which these services are already providing for medium and large-sized businesses. Analogous reasoning may apply to the strategy of regional assistance to the regions which are most peripheral with regard to economic power centres and centres of services which the market naturally create. The problems of access to service, quality and price are similar to those of small businesses.
From the point of view of the experiences obtained7, the adoption of business services and new technologies as tools in the service of manufacturing policy in the Community's regional plans originated in the 1980s. It was during this decade that competitiveness in manufacturing manifested itself as a real challenge for all EU Member States. This was also the best way to respond to, on the one hand, the economic crisis and, on the other, growing international competition within an increasingly globalised market situation.
Along these lines, it is important to point out that, while on the one hand, the economic crisis of the 1970s produced a strong negative impact on the economies and business of the Community, it also had other, more positive effects. The crisis also meant a real unpleasant yet therapeutic shock in the sense that, due to its presence and development, a series of changes in the different economic spheres, production sectors and businesses reached their peak. These changes in rum served as a basis for a new process of changes, in this case, on the two levels of economic theories and policies and that of models for action. Within this new process the change in direction of regional policy, in general, and manufacturing policy, in particular, can be included. This change, leaving aside its traditional balanced position at the regional level, made economic growth and competitiveness its primary objectives.
The first reactions to this new positioning on the EU level manifested themselves in those governments and regions which were more advanced in the economic and business areas. They took shape in the creation of tools for business innovation related as much to new technologies — technology parks, centres of innovation, etc. — , as to business services — traditional and advanced service centres, training centres, etc. — . The experiments carried out in Japan — Technopolis Scheme — and, above all, in the
For an in-depth analysis of the political question in business services in Europe, see Del Rio and Rubalcaba (1995) in a document created for the Spanish Ministry of Industry. This work includes a detailed analysis of the most significant political actions for promoting public business services which have been undertaken in the principal countries of the European Union. Other works on business service policies which can be consulted are those of González (1998), Del Rio (1998) and Más (1998) in a recent issue of the Spanish journal "Economía Industrial".
Towards a Business Service Policy in Europe 487
United States — Silicon Valley, Route 128 in Boston and the Triangle in North Carolina —. These gave direction to the true beginning of innovation processes in some Member States, such as the United Kingdom, Germany and France, among others, at the beginning of the eighties. However, some of them had already begun to develop these
. new tools years before (Del Rio, 1997).
Observing the current situation in Europe, one notes, on the one hand, a wide variety of models and patterns created for competitiveness policy in the business services industry and, on the other, great potential for extending business services and bringing them into general use in those markets which, for reasons of size, location or other factors, do not enjoy the same conditions as more mature markets. Thus, the deepening of competitiveness policies in Europe may be a factor of primary importance for the future growth of business services and, hence, for those businesses and regions which benefit from them.
The objectives of a policy to promote business services can be summarised as follows:
promoting the modem competitiveness policy with an emphasis on intangible aspects of investment, taking advantage of technological resources, and strategic elements of the new information society encouraging the diffusion of technology, as well as its transfer, incorporation and exploitation obtaining access to advanced and innovative services for businesses cultivating private initiative in less-developed areas co-ordinating activities which promote public services together with those which stimulate the supply of private services. place promotion activities for advanced services within a strategic and integrated framework; this should include policies on infrastructure, communications, environmental, education, urban planning, etc.
To accomplish these objectives, countries can rely on innumerable ways of promoting public, semi-public and private services. These range from technological parks and service centres to incubators and business innovation centres, from RTO (Research and Training Organisations) to R & D programmes and technological exchange. All of these forms tend, in some way or another, to render advanced services to companies and to improve the areas in which they are developed. The success and scope of the said activities is according to resources used, the approach followed by the policies and the degree of co-ordination with local agents which exists below the production network in each area. When the State intervenes decisively in a programme, with criteria for independence and effectiveness and in response to the demands of private agents, then the models for regional development and business services are usually successful (Más,

488 Business Services in European Industry
1998)8. When there is strong intervention, there is a great political dependency on the governing parties, and the development programs are too politically cyclical. Consequently, the policy in question may find itself doomed to fail. The differences in policy intervention (independence degrees of regional programs), regional models (centralised, de-centralised, private participation, etc.) and the balances between market failures and public failures (difficult to evaluate before, during and after action takes place) explain some of the unequal results (success versus failures) of business service promotion initiatives throughout Europe.
In the interest of making services promotion policies more effective, the following initiatives are recommended at a European level:
catalogue all existing models (technological parks, BIC (Business Innovation Centres), RTO, incubators, etc.), as well as tools used (subsidies, public capital, etc.) to create a register of initiatives for promoting services along with agents involved in this work; make a survey of the aforementioned initiatives in order to analyse objectives, motives, services rendered, similarities and differences, with the aim of promoting a better understanding of what is happening in this complex world of multiple initiatives and being able to evaluate (benchmarking) the implications for regional development and local business networks; promote training courses on initiative review programmes in order to encourage those which are obtaining better results and revise the approach of those which involve under-utilised resources; stimulate efforts to co-ordinate initiatives which may be over-lapping or which together would achieve more; evaluate on a case by case basis the advisability of providing subsidies for customer companies or of promoting public or private supply of services; determine the field of action for public services in accordance with the principle of subsidiarity; encourage organisational philosophies for centres according to principles of technical and not political effectiveness; evaluate the congraity of services offered and needed in the area; encourage the participation of private agents in centres as well as self-financing
It is important to point out that the aforementioned possible actions regarding sector transparency, promotion of internationalisation, quality, etc. come together with regard to business service policy towards small and medium-sized enterprises and less-developed regions. As previously mentioned, the narrow nature of markets and a lack of information are more critical in the setting of small and medium-sized business and in
This work from Más (1998) shows a very interesting comparison between four main European models: Baden-Württemberg, Denmark, Emilia Romagna and Comunidad Valenciana.
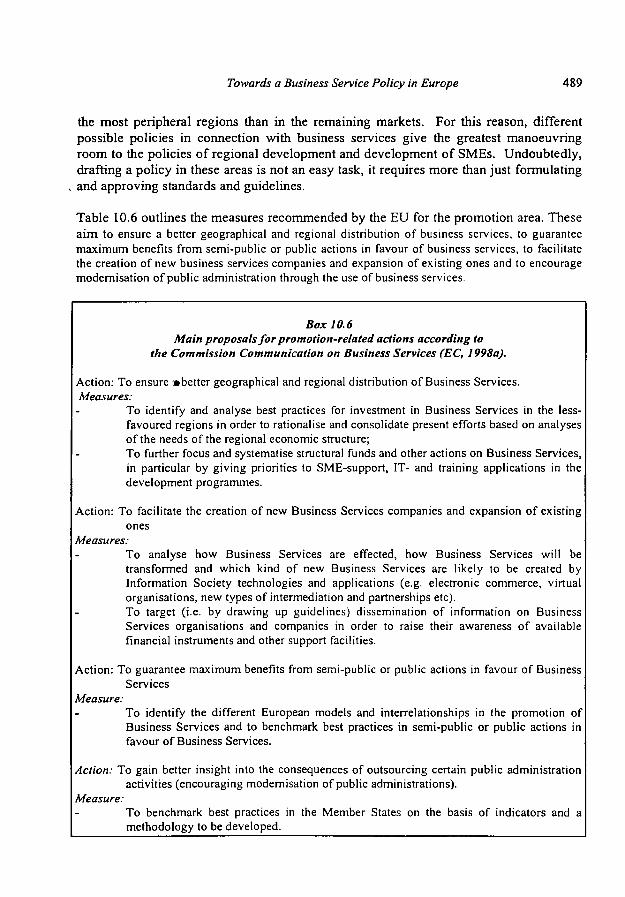
Towards a Business Service Policy in Europe 489
the most peripheral regions than in the remaining markets. For this reason, different possible policies in connection with business services give the greatest manoeuvring room to the policies of regional development and development of SMEs. Undoubtedly, drafting a policy in these areas is not an easy task, it requires more than just formulating and approving standards and guidelines.
Table 10.6 outlines the measures recommended by the EU for the promotion area. These aim to ensure a better geographical and regional distribution of business services, to guarantee maximum benefits from semi-public or public actions in favour of business services, to facilitate the creation of new business services companies and expansion of existing ones and to encourage modernisation of public administration through the use of business services.
Box 10.6 Main proposals for promotion-related actions according to
the Commission Communication on Business Services (EC, 1998a).
Action: To ensure »better geographical and regional distribution of Business Services. Measures:
To identify and analyse best practices for investment in Business Services in the less-favoured regions in order to rationalise and consolidate present efforts based on analyses of the needs of the regional economic structure; To further focus and systematise structural funds and other actions on Business Services, in particular by giving priorities to SME-support, IT- and training applications in the development programmes.
Action: To facilitate the creation of new Business Services companies and expansion of existing ones
Measures: To analyse how Business Services are effected, how Business Services will be transformed and which kind of new Business Services are likely to be created by Information Society technologies and applications (e.g. electronic commerce, virtual organisations, new types of intermediation and partnerships etc). To target (i.e. by drawing up guidelines) dissemination of information on Business Services organisations and companies in order to raise their awareness of available financial instruments and other support facilities.
Action: To guarantee maximum benefits from semi-public or public actions in favour of Business Services
Measure: To identify the different European models and interrelationships in the promotion of Business Services and to benchmark best practices in semi-public or public actions in favour of Business Services.
Action: To gain better insight into the consequences of outsourcing certain public administration activities (encouraging modernisation of public administrations).
Measure: To benchmark best practices in the Member States on the basis of indicators and a methodology to be developed.
490 Business Services in European ¡ndustry
10.4 Co-ordination of policies and concrete suggestions
10.4.1 Common criteria
The presentation of six types of policies related to business services leads us to consider all of them under one common lens: the policy of business services. The total of the actions is so great that it is essential to have a vision of the whole in order to evaluate the revision or introduction of modern policies. Although these policies have common points and obvious synergies, they also show possible incompatibilities and points of potential conflict. For this reason, it is best to view the possible actions under the prism of the efficiency of having points in common. All the actions should have in common the objectives of jobs, growth, competitiveness and regional re-balancing which were indicated at the beginning.
We have to bear in mind a series of very heterogeneous elements including:
1. The positioning of business service policy within modem industrial policies, beginning with current competitiveness criteria which govern these policies.
2. Regarding business services as a key economic progress sector within which an economic policy can be defined.
3. The identification of the objectives of business service policy and the potential users: workers, enterprises, regions, professions, where their participation, to their benefit, is desired.
4. The principle of effectiveness in providing services must guide all applicable policies.
5. The heterogeneity of policies implemented in Europe as regards business services and technological innovation. And seeing them as an opportunity to leam from different experiences and encourage the best of each one (benchmarking).
6. The principle of subsidiarity which should be respected and to take advantage of existing initiatives already carried out by society, professions, municipalities, regional communities and, lastly, national governments.
It is also necessary to emphasise the limits and costs of the different policies. For example, as we have seen, the policy of deregulation of business services is a necessary condition but not sufficient for the integration of its markets. Factors such as imperfect information, the multiplicity of methods of internationalisation or the heterogeneous panoply of barriers impose heavy limits on the effectiveness of deregulation measures, especially in relation to what happens in other sectors. As a consequence of all this, it is necessary to consider the actions on three fronts as complementary: the policy of coordinating the measures which the market itself generates to improve the quality of service; the policy of deregulation, to facilitate internationalisation processes and the opening of competition; and the policy of promotion of business services for, basically, small and medium-sized enterprises and less-favoured regions. With these actions, one
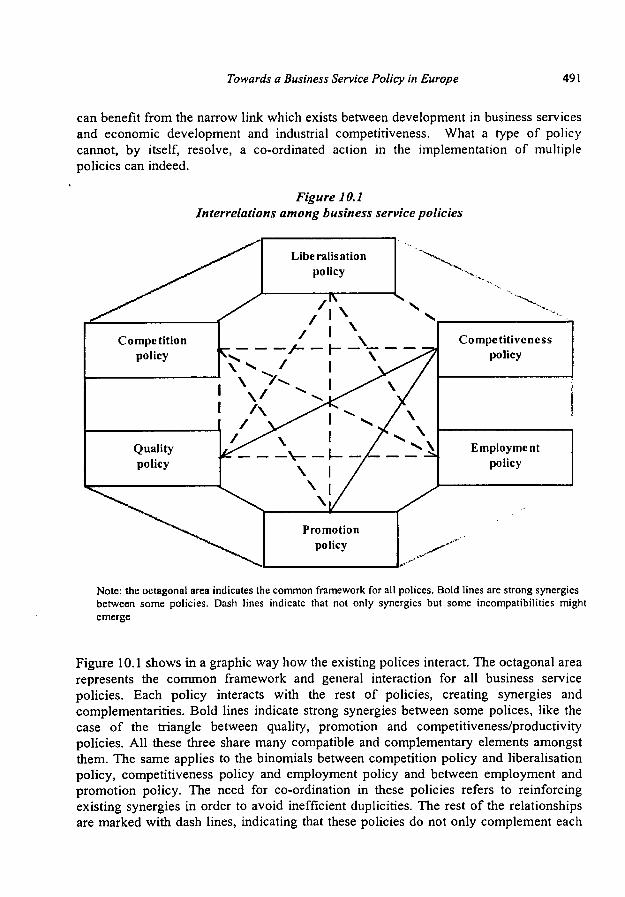
Towards a Business Service Policy in Europe 491
can benefit from the narrow link which exists between development in business services and economic development and industrial competitiveness. What a type of policy cannot, by itself, resolve, a co-ordinated action in the implementation of multiple policies can indeed.
Figure 10.1 Interrelations among business service policies
Liberalisation policy
Competitiveness policy
Employment policy
Promotion policy
Note: the octagonal area indicates the common framework for all polices. Bold lines are strong synergies between some policies. Dash lines indicate that not only synergies but some incompatibilities might emerge
Figure 10.1 shows in a graphic way how the existing polices interact. The octagonal area represents the common framework and general interaction for all business service policies. Each policy interacts with the rest of policies, creating synergies and complementarities. Bold lines indicate strong synergies between some polices, like the case of the triangle between quality, promotion and competitiveness/productivity policies. All these three share many compatible and complementary elements amongst them. The same applies to the binomials between competition policy and liberalisation policy, competitiveness policy and employment policy and between employment and promotion policy. The need for co-ordination in these policies refers to reinforcing existing synergies in order to avoid inefficient duplicities. The rest of the relationships are marked with dash lines, indicating that these policies do not only complement each

492 Business Services in European Industry
other, causing similar effects, but also might cause incompatibilities and lack of coherence. This is particularly important for the following relationships: triangle liberalisation-quality-employment (some liberalisation measures could affect quality and employment if they are not implemented correctly), liberalisation-competitiveness (when certain practices to promote international competitiveness arise), liberalisation-promotion (in some cases promotion can create additional protectionism in specific markets) and some of the relationships affecting the competition policy with employment, quality, promotion or competitiveness (some measures in many areas need to be supported by competition policies, especially when referring to state aid, for example, taking into account that most of business service actions generate more profits in terms of market performance and even long-term competition, than disadvantages from short-term competition constraints). For all these potential cases, co-ordination is even more essential.
10.4.2 Some priority suggestions
Of the many concrete suggestions which have been put forward in previous sections with the purpose of profiling a business service policy, it is important to highlight a group of actions which can be considered to be top-priority. First of all, before adopting a specific measure, it is advisable to evaluate its possible advantages and disadvantages. Given the scarcity of resources and the multiple possibilities for action, it is necessary to determine whether or not the chosen measures are really the most effective. This point takes us back to an even earlier point: knowledge of business services in Europe is still scarce. For reasons of space we are unable to develop specific points further, as this would probably entail carrying out surveys in the majority of cases and field works which currently do not exist. The highest priority therefore would be to support studies on business services and the improvement of information sources, that is to say, of statistics. Despite advances made in recent years, business services statistics are still very underdeveloped in comparison with other economic sectors which have been studied in greater depth and which have a much more robust statistical system. These deficiencies make studying different subjects, conducting surveys with a dearth of reliable registers, etc. more difficult. For this reason, the final suggestions for business service policy require it to establish two standards for itself: a standard connected to studies and sources of statistical information and a standard for carrying out policy measures. Logically, many of the issues of the second standard dealt with in this chapter require specific studies in accordance with the first standard of information. In any case, these are the proposals considered to be of the highest priority on the road towards a business service policy.
On the level of studies and statistics:
1/ Encourage improvement in the existing statistical system of business services in Europe, endeavouring to bring up-to-date available and reliable registers and to improve them. Examples are given when available statistics are collected,

Towards a Business Service Policy in Europe 493
analysed and improved, pilot studies are performed and methodologies are followed and harmonised. This responsibility chiefly rests with Eurostat and National Statistical Offices, although other regional administrations, universities and professional associations can collaborate too.
2/ Encourage future scientific and professional studies and research on business services in order to have a better knowledge of the different activities involved and to be able to evaluate the advisability of following one policy or another. Specific suggestions are:
Prepare studies similar to present-day ones but which focus on some activities in particular; those which are considered the most relevant; Prepare horizontal studies of business services but, at the same time, more specific and detailed for some aspects (i.e., labour markets. internationalisation, etc.); Evaluate the extent of a common market in business services, the effectiveness of measures adopted and the margin of efficiency which may await future deregulation measures; Study the actions of competition policies as regards business services in Europe and its Member countries; Catalogue all the means which exist in each country to guarantee and promote the growth of quality in services; Conduct a large survey to evaluate policies for promoting services, cataloguing the various existing initiatives and obtain information on their motivations, objectives and methods. The said survey would shed light on the current situation and enable more co-ordinated and effective adoption of promotion policies.
On the level of a specific action plan, many policies should be subject to preliminary studies before being put into practice. The following four actions are among the most feasible in the short and medium-term:
1/ Propose formulas which would allow, at European level, improvement in the quality of business services and encouragement of the use of certifications and organisations guaranteeing quality.
2/ Encourage international agreements between small and medium-sized business and business services, facilitating labour mobility and the exchange of information on methods and opportunities for internationalisation.
3/ Through VAT and other taxes, reduce fiscal pressure on those activities which are more able to create employment, encouraging flexible work contracts and promoting part-time contracts and tele-working.
4/ Grant a quality classification to the different tools used in business services promotion policy. This would encourage fulfilling objectives and stimulate the co-ordination of the previously mentioned active policies within each country.
494 Business Services in European Industry
10.5 Conclusions
This last chapter has examined the justification, definition, content and implementation criteria of a business service policy. It alludes to aspects described in the rest of the book in order to emphasise the huge number and the quality of the arguments supporting the need for such a policy. In addition, the prospect of future growth in business services was raised, which led to the conclusion that there is no indication that the structural and long-term factors behind business service growth would weaken. Although cyclical movements are important in the sector and could even condition the cyclical movement of the economy, the long-term reasons underlying structural growth are still very strong, even in markets where the business service markets are more mature.
The objectives, instruments and different related policies have also been presented. Within the trends marked by modem industrial policies, a business service policy would contain six different instrumental policies: liberalisation policy, competition policy, quality policy, competitiveness/productivity policy, employment and training policy and promotion policy. These policies all interact, which leads us to consider the limitations, complementarities, potential incompatibilities and existing synergies for each one. A co-ordinated action for business services is required to provide a coherent framework which would increase the positive effects created by the business service economy.
The most important conclusion concerns the formulation of economic and industrial policy. If it is accepted that business services are a key factor in economic and industrial development, then policy-makers should follow and support these activities and their implication in the whole system. In fact, the most advanced countries are the first to give precedence to liberalisation and promotion policies in national and regional budgets, respectively. Over a long period of time, the European Commission has also been introducing measures to achieve a common professional services market and now, it is involved directly or indirectly through a complex set of still uncoordinated measures. However, within the new challenges of modem industrial competitiveness policy, the possibilities for action go beyond international deregulation, regional promotion or specific uncoordinated programs. The success of the European Commission Communication on Business Services can represent a great step forward in achieving the required common policy framework.
All six of the policies related to business services, still to be developed further, constitute the basic links in a modern policy for the business services industry. This policy, in accordance with the many factors and facts which justify it, is necessary to improve competitiveness and employment in Europe in the 21st century. It is a matter of encouraging and following the signs which the market has given to confirm that business services are essential elements of modem economic growth.
Towards a Business Service Policy in Europe 495
References
Del Rio, C. (1998) "Los servicios a empresas y la nueva política regional". Economia
Industrial 313: 157174.
Del Río, C ; Rubalcaba, L. (1995) Los servicios a empresas y la política de competitividad
industrial en Europa. Ministerio de Industria y Energía, Madrid.
Denison, E.F.(1985). Trends in American economic growth., ¡9291982. Washington DC,
The Brookings Institution.
Esparza, Α.; Kimenec, A. (1994) "Producer services trade in city systems: evidence from
Chicago". Urban Studies, 31 (1); February 1994: 2946.
European Commission (1985) White Papers. European Commission, Brussels.
European Commission (1986) Single European Act. European Commission, Brussels.
European Commission (1993) White paper on growth, competitiveness and employment
(doc.COM(93)700, Dec 1993)
European Commission (1994) Commission Communication on an Industrial Competitiveness
Policy for the European Union (doc.COM(94)3l9final of ¡491994)
European Commission (1995a) Business services and industrial competitiveness in the
European Union. Discussion Paper of the Spanish Presidency. Informal Meeting of the
Ministers of Industries of the European Union, Bilbao, 8 July 1995.
European Commission (1995b) Council conclusions on industrial competitiveness and
services to business. Meeting of the Industry Council on 6 and 7 November 1995. European
Union. The Council.
European Commission (1996a) A Confidence Pact on Employment (doc.SEC(96)1093 of 65
¡996)
European Commission (1996b) An Integrated programme for SMEs and the Craft sector
(doc. COM(96)329 final of ¡3 7 / 996)
European Commission (1996c) The European Observatory for SMEs, Fourth Annual Report
(1996), Chapter 5
European Commission (1996d) Single Market Review (doc.COM(96)520 final of 301 Ο
Ι 996)
European Commission (1996e) First action plan for Innovation in Europe (doc.COM(96)589
of07ll96)
European Commission (1996f) Commission Communication on Europe at the forefront of the
Global Information Society: Rolling Action Plan (doc.COM(96)607 of 27111996)
European Commission (I996g) Commission Communication on Benchmarking the
Competitiveness of European Industry (doc.COM(96)463 final of 9101996)
European Commission (1996h) Commission Communication on putting Services to Work
(doc.CSE(96)6final of 27111996)
European Commission (1997) Commission Report on the Competitiveness of European
Industry (doc SEC(96)2121/2 of 03031997)
European Commission (1998a) The contribution of business services to industrial
performance: a common policy framework. Communication from the Commission to the
Council. European Commission, Brussels. Reference: doc COM(98)534 final of 21091998.
European Commission (1998b) Commission Report to the Industry Council: Industrial
Competitiveness and Business Services. Reference: doc SEC(98)735 of 24041998.
González Romero, A. (1998) "Servicios a empresas, innovación y competitividad industrial:
un análisis para la Unión Europea". Economía Industrial 313: 129140.

496 Business Services in European ¡ndustry
Holmstrom, Β. (1985) "The provision of services in a market economy" in Inman (Ed.),
Managing the service economy. Cambridge University Press.
Kendrick, J.W (1979). "Productivity trends and the recent slowdown: Historical Perspective,
causal factors and policy options". In Contemporary Economic Problems, Fellner Eds.
Washington DC American Enterprise Institute for Public Policy Research.
Maddison, A (1987). Growth and slowdown in advanced capitalist economies. Journal of
economic literature 25.
Más, F.; Cubei, L. (1998) "Servicios a empresas y centros tecnológicos: un análisis comparado
de modelos europeos". Economía Industrial 313: 141156.
Vives, X. (1993). "La competencia en la perspectiva europea". Papeles de Economia
Española, n"57: 103116.

European Commission
Business Services in European Industry — Growth, Employment and Competitiveness
Luxembourg: Office for Official Publications of the European Communities
1999 — vi, 496 pp. — 16.6 χ 23.8 cm
ISBN 92-828-6697-1
Price (excluding VAT) in Luxembourg: EUR 17


Venta · Salg · Verkauf · Πωλήσεις · Sales · Vente · Vendita · Verkoop · Venda · Myyntt · Försäljning
BELGIQUE BELGIË
Jean De Lannoy
Avenue d u Roi 202/Koníngslaan 202 Β·1190 Bruxelles.Brussol Tel (322) 5 3 8 « 06 Fax (32-2) 538 08 41 E-mail: Jeande.lanrtoyOinfoboarTj.be URL: http://www jean-de- annoy bo
La l ibrair ie eu ropéenne / De Europeso Boekhande l Rue de la Loi 244/Wetstraat 244 B-10-10 BtuxoilOS.Bru55.Ol Tél. (32-21 295 26 39 Fax (32-2) 735 08 60 E-mail maiJOIrbeurop.be URL: httpv/www hbeurop be
Mon i teur bel ge/Bel g i t e h Staatsb lad Rue de Louvam 40-42/Leuvenseweg 40-42 B-1000 Bruxelles/B russel Tél. (32-2) 552 22 11 Fax (32-2) 511 01 84
DANMARK
J . H. Schu l tz I n fo rma t i on A/S
Herstedvang 10-12 DK-2620 Albertslund TW. (45) 43 63 23 00 Fax (45) 43 63 19 69 E-mail: schuttzOschultz.dk U R L http //www schult? dk
DEUTSCHLAND
Bundesanze iger Ver lag GmbH
Vertriebsabteilung
Amsterdamer Straße 192 D-50735 Köln Tel. (49-221) 97 66 80 Fax (49-221) 97 66 82 76 E-Mail: vertrieb tí bunde sa n zeiger.de URL: http J/www. bu ndesanzeiger.de
ΕΛΛΑΔΑ/GREECE
G. C. E le f theroudnk is SA International Bookstore PanepistimkHJ 17 GR-10564 Ainina Tel. (30-11 331 41 80/1/2:3/4/5 Fax (30-1) 323 98 21 E-mail: e lebooksOnetor gr
ESPANA
Bole t ín Of ic ia l de l Es tado
Trafalgar, 27 E-28071 Madrid Tel. ( 3 4 ) 9 t 5 3 8 2 1 11 (Lbros) .
9 1 3 8 4 17 15 (Susc ip > Fax (34) 915 38 21 21 (Lbros) .
9 1 3 8 4 17 14(Suscnp.) E-mail: c l ientes**com.boe es URL: http://www.boe.es
M u n d i Prensa L i b r o s , SA
Castellò. 37 E-28001 Madrid Tel. (34)914 36 37 00 Fax (34)915 75 39 98 E-mail: i ibreriaOmundiprensa.es URL: htapJ/Vww. rmjndiprensa.com
FRANCE
J o u r n a l o f f ic ic i
Service des publications des CE 26, rue Desaix F-75727 Paris Cedex 15 TOI. (33) 140 58 77 31 Fax (33) 140 58 77 00 URL: http:.'/www journal-officiel gouv.fr
IRELAND
G o v e r n m e n t Supp l i es A g e n c y
Publications Section 4-5 Harcourt Road Dublin 2 Tel . (353-1166131 11 Fax (353-1) 475 27 60
ITALIA
L icosa SpA
Via Duca di Calabria, 1/1 Casella postale 552 1-50125 Firenze Tel. (39) 055 64 83 1 Fax (39) 055 64 12 57 E-mail: lkrosaOftbcc.it URL: http:.Vwww.ftbcc.iM:cosa
LUXEMBOURG
Messager ies d u l iv re SARL
5, rue Raitfeisen L-2411 Luxembourg Tél. (352)40 10 20 F a x ( 3 5 2 ) 4 9 06 61 E-mail: mai lOmdl . lu URL: http://www.mdl.lu
NEDERLAND
S D U Serv i cecen t rum Ui tgevers Christoffei Plantljnstraat 2 Poelbus 20014 2500 EA Den Haag Tel. (31-70)378 98 80 Fax (31-70) 378 97 83 E-mail: sduOsdu.n l URL: http://www.sdu.nl
OSTERREICH
M a n e s c h e Ver lags- u n d Un l va rs l t å t sbuchhand lung GmbH Kohlmarkt 16 A-1014 Wien Tel. (43 -1 )53 16 11 00 Fax¡43-1>53 16 11 67 E-Mail: bestellen » i m a n ; co at URL: http J/www. manz. at/index, h im
PORTUGAL
D is t r ibu idora de L iv ros Ber t rand L d . '
Grupo Bertrand. SA Rua das Terras dos Vales. 4-A Apartado 60037 P-2700 Amadora Tel. (351-1) 495 90 50 Fax (351-1) 496 02 55
Imprensa Nacional -Casa da Moeda , EP
Rua Marquas Sa da Bandeira, 16-A Ρ-1050 Lisboa Codex Te l . (351 -1 )353 03 99 Fax (351-1)353 02 94 E-mail: del.incmOmail.1elepac.pt URL: http J/www. incm.pt
SUOMI/FINLAND
FIN-00101 Helsinki Holsingfor;; P j l f r i (358-9) 121 44 18 F^tax (358-9) 121 44 35 Sähköposti: akatilaus O akateeminen com URL: Http /www akateeminen corn
SVERIGE
B T J A B
Traktorvägen 11 S - 2 2 1 8 2 L u n d Tfn (46-46) 18 00 00 Fax (46-46) 30 79 47 E-post: bt jeu-pubObtj.se URL: htlp7/www.bl).se
UNITED KINGDOM
T h e Sta t ionery Of f ice L td
International Sales Agency 51 Nine Elms Lane London SW8 5DR Tel. (44-171)873 90 90 Fax (44-171) 873 84 63 E-mail: ipa. enquiries θ theso co.uk URL: http ; www the-stationery-office CO u k
ISLAND
B o k a b u d Larusar B londe l Skolavôrdustig, 2 IS-101 Reykjavik Tel. 354) 551 56 50 Fax (354) 552 55 60
NORGE
S wet s Norge A S
Ostenioveien IB Boks 6512 Etterstad N-0606 Oslo Tel. (47-22)97 45 00 Fax (47-22) 97 45 45
SCHWEIZ/SUISSE/SVIZZERA
Euro In fo Center Schweiz
c/o OSEC Stampfenbach Straße 65 PF 492 CH-8035 Zürich Tel. (41-1 )365 53 15 Fax ¡41-1) 365 54 11 E-mail: e i c s O o s e c c h URL: ht tpJ/www.osecxh/eics
BÀLGARIJA
Europ ress Euromed ia L t d
59. blvd Vitosha BG-1000 Sona Tel. (3592)980 37 66 Fax (359-2) 980 42 30 E-mail: Mi lenaOmbox.ci t .bg
CESKA REPUBLIKA
ÚSIS
NIS-prodejna Havelkova 22 CZ-130 0 0 P r a h a 3 Tel. (420-2)24 23 I 4 86 Fax (420-2) 24 23 11 14 E-mail: nkpospOdec.nis.cz URL: http .'.usiicr.cz
CYPRUS
Cyp rus Chamber of Commerce and Indus t ry
PO Box 1455 CY-1509 Nicosia Tel. (357-2) 66 95 00 Fax (357-2) 66 10 44 E-mail: demetrapOccci .org.cy
EESTI
Eest i Kaubandus -Töös tuskoda (Es ton ian C h a m b e r of C o m m e r c e and Indust ry )
Toom-Kool i 17 EE-0001 Tallinn Tel. (372) 646 02 44 Fax (372»646 02 45 E-mail: e infoOkoda.ee URL: http:/Avww.koda.ee
HRVATSKA
Med in trade L t d Pavia Hatza 1 HR-10000 Zagreb Tel. (385-1)481 94 11 Fax (385-1)481 94 11
MAGYARORSZAG
E u r o Info Serv ice
Europa Haz Margi ts ; iget PO Box 475 H-1396 Budapest 62 Tel. (361)350 80 25 Fax (361)350 90 32 E-mail: euroinfoOmail .matav.hu URL: http^/www.eurolnfo.hu/lndex.htnn
MALTA
Mi l ler D is t r i bu to rs L t d
Malta International Airport PO Box 25 Luqa LOA 05 Tel. (356) 66 44 88 Fax(356) 67 67 99 E-mail: gwir thOusa.net
POLSKA
Ara Po lona
Krakowskie Przedmlescle 7 Skr. pocztowa 1001 PL-00-950 Warszawa Tel. (48-22)826 12 01 Fax (48-22) 826 62 40 E-mail: ars_polObevy.hsn.com.pl
ROMANIA
Euromed ia
Str. G-ral Berthelot Nr 41 RO-70749 Bucuresti Tel. (40-1) 315 44 03 Fax (40-1) 314 22 86
ROSSIYA
CCEC
60-letiya Oktyabrya Av. 9 117312 Moscow Tel. (7-095) 135 52 27 Fax (7-095) 135 52 27
SLOVAKIA
Cent r u m V D SR
Nam Slobody, 19 SK-81223 Bratislava Tel. (421-7) 54 41 83 64 Fax (421-7) 54 41 83 64 E-mail: europOtbbt .s l lk .s luba.sk URL: http://www.sllk.stuba.sk
SLOVENIJA
G o s p o d a r s k l Vestn lk Dunajska cesta 5 SLO-1000 Ljubljana Te l . ( 386 )613 09 1 6 4 0 Fax (386) 613 09 16 45 E-mail: europOgvestnik.s i URL: http://www.gvestnik.si
TURKIYE
Dünya Infotel A S
100. Yil Mahallessi 34440 TR-80050 Bagcilar-Istanbul Tel. (90-212)629 46 89 Fax (90-212)629 46 27 E - ma i I : inf ol el G du ny a-g azete co m. (r
AUSTRALIA
Hunter Pub l i ca t i ons
PO Box 404 3067 Abbots lord. Victoria Tel. (61-3)94 17 53 61 Fax (61-3) 94 19 71 54 E-mail: jpdaviesOozemai l .com.au
CANADA
Les éd i t i ons La L iber té Inc.
3020. chemin Sainte-Foy G1X 3V Salnte-Foy. Quebec Tel . (1-418)658 37 63 Fax (1-800) 567 54 49 E-mail: liberte O mediom.qc.ca
Renouf Pub l i sh ing Co . L i d
5369 Chemin Canotek Road Unit 1 K U 9J3 Ottawa. Ontario Tel. (1-613)745 26 65 Fax (1-613) 745 76 60 E-mail: ordor.dep1arenoufbooks.com URL: http7/www.renoufbooks.com
EGYPT
The Midd le East Observe r
41 Sherif Street Cairo Tel. (20-2) 392 69 19 Fax (20-2) 393 97 32 E-mail: mafoudaOmeobserver .com.eg URL: httpJ/www.meobserver.com.eg
INDIA
EBIC India
3rd Floor. Y. B. Chavan Centre Gen. J . Bhosale Marg. 400 021 Mumbai Tel. (91-22)282 60 64 Fax (91-22)285 45 64 E-mail: ebicOgiasbmOl.vsnl .net. in URL: http://www.ebiclndia.com
ROY In ternat iona l
4 1 . Misturar Mayar den Street PO Box 13056 61130 Tel Aviv Tel. (972-3)649 94 69 Fax (972-3) 648 60 39 E-mail: royilOnetvtslon.net.ll URL: httpJ/www.royint.co.l l
Sub-agent lor the Palestinian Authority:
Index In fo rma t ion Serv ices
PO Box 19502 Jerusalem Tel. ( 972 -2 )62716 34 Fax (972-2) 627 12 19
PSI-Japan
Asahi Sanbancho Plaza «206 7-1 Sanbancho. Chtyoda-ku Tokyo 102 Tel. (81-3)32 34 69 21 Fex<81-3>32 34 6 9 1 5 E-mail: booksOpsl- japarvco. jp URL: http://www.psi-japan.com
EBIC Malays ia
Level 7. Wisma Hong Leong 18 Jalan Perak 50450 Kuala Lumpur Tel. (603) 262 62 98 Fax ¡60-3) 262 61 98 E-mail: ebic-kIOmol.net.my
M u n d i Prensa Mex i co , SA d e CV
Rio Panuco No 141 Colonia Cuauhtemoc MX-06500 Mexico, DF Tel. (525) 533 56 58 Fax (52-5) 514 67 99 E-mail: 101545.2361Ocompuserve.com
PHILIPPINES
EBIC Ph i l i pp ines
19th Floor. PS Bank Tower Sen. GH J. Puyal Ave. cor. Tindalo St. Makati City Metro Manilla Tel. (632) 759 66 80 Fax (632) 759 66 90 E-mail: eccpcomOglobe.com. ρ h URL: hl tpJ/www.eccp.com
SRI LANKA
EBIC Sr i Lanka Trans Asia Hotel 115 Sir chittampalam A. Gardiner Mawatha Colombo 2
Tel. (94-1)074 71 50 78 Fax (94-1) 44 87 79 E-mail: ebicslOi tmin.com
EBIC Tha l l and
29 Vanissa Building, 8th Floor Soi Cr» idiom Ploenchit 10330 Bangkok Tel. (662) 655 06 27 Fax (66-2) 655 06 28 E-mail: eblcbkkOksc15. th.com URL: http:/www.ebicbkk.org
UNITED STATES OF AMERICA
Bern an Assoc ia tes
4611 -F Assembly Drive Lanham MD20706 Tel. (1-800) 274 44 47 (loll tree telephone) Fax (1-800) 865 34 50 (loll free fax) E-mail: queryObeman.com URL· http://www.bernan.com
ANDERE LANDER/OTHER COUNTRIES/ AUTRES PAYS
Bit te wenden Sie s i ch an e i n Büro Ihrer Wah l / P lease con tac t t he sa tes o f f ice of y o u r cho i ce / Veui l lez v o u s adresser au bu reau de ven ts d e vo t re c h o i x
On i ce fo r Of f i c ia i Pub l i ca t i ons of t he E u r o p e a n C o m m u n i t i e s 2. rue Mercier L-29B5 Luxembourg T e l . ( 3 5 2 ) 2 9 29-42455 Fax ( 3 5 2 ) 2 9 29-42758 E-mail: info.IntoOopoce.cec.be URL: htlp://eur-op.eu.int