Formation, stability and properties of multilayer emulsions for application in the food industry
Upload
khangminh22Category
view
0download
0
DOCUMENT RESUME
En 159 402 CB 916, \
TITLEINSTITUTION
Service Industries. Trends and .prospects.Bureau of Domestic Business Development (t0C).Washington, D.C. \\
PUB DATE Aug 7570p.; Not aviilable in bird copy; Farts are . ,NOTE \
marginally legible dUe to small type . .
AVAILABLE _FROM Superintendent of Documents", 0.E. Government printingOffice, Washington, C.C. ,20402' ($1.40) - \
EDRS PRICE MF -$0.83 Plus Postage. EC Not Available face EDRS.\\-'DESCRIPTORS Adult Education; Banking; Census Figures; ;.-1,-.
*Comparative Statistics; *Empleyment-Trendg;'FilmIndustry; Financial Services;'Food ServiceJndustry;\*Futures (of Society); Health Services; Inflation-(Economics); Insurance CompaniesuMarketing; Medical 'Services; Occupational Surveys; Froductivity;Professional services; Public Service,Occupations;Retailing; School Services; *Service Occupations;*Service Workers; *Trend Analysis; Whcleseling
IDENTIFIERS Automotive Services; ICdgirg Industry; PersonalServices
i
ABSTRACT f .
This publication is .designed, tc provide the businesscommunity with information on growing markets fcr many hkisiness alid .
consumer services. Divided into two parts, the document overview inpart I identifies two service area problems: lagging productiiritygains and rapidly rising prices of services. The overview slates,however, that service sector growth is expected to increase. Theremainder of part I contains five sections and a bibliography. Thesections include (1) nature and extent cf Orited States serviceindustries, t2) inflation impact on service industries, (3) ervicesector-employment trends since 1960, (4) service sector produ tivity,and (5) impact of demographic changes cm service industries. P t IIconsists of individual service industry studies: advertising, .
automotive services, banking/other financial services, educational. services, health/medical services, hotels/sctels, life insurance ,
motion' pictures, personal services, wholesale trade, nonfoodretailing, and food retailing. The advertising study, for example,looks at advertising in the present and futtre and examines the ,adagency's changing character, competitiveness, and responses toconsumerism and special service agencies. A 1963-1.S74 advertisingexpenditure chart is also included. At the end of part II, 1972census data are presented for selected service industiies, retailtrades, and wholesale trades. (CSS)
********************************************t*************************** Reproductions supplied by EDRS are the best that car be made *
from the, original document.*******************************************************1***************

U.S. DEPARTMENT OF COMMERCE -Rogers C. B. Morton, Secretary
JAMES A. BAKER, IIIUndei Secretary
TRAVIS E. REEDAssistant Secretary for
Domestic and International Business
SAMUEL B. SHERWINDeputy Assistant Secretary for
Domestic Commerce
AUGUST 1975
'to

, f
N\
For sole by theSuperintendent of Documents, U.S. Government Printing Qffice, Washi/gton, D.C., 20402.
Price $1A0
1
.4
4

Contents
Foreword vPaq I.Overview
Page
,Section 1.Nature and Extent of Service Industriesin the United States -
Section 2.---Impact of Inflation on Service Industries.4.7
Section 3.Service Sector Employment Trends Since 960 ... . 8'Section 4.Productivity in the Service Sector 10Section 5.=-Impact of Demographic Changes on Servi e
Industries 12- Aibliography 13
Part II.Individual Service Industry StudiesAdvertising 17Automotive Services 18Banking and Other Financial Services 21Educational Services 23Health and MedicUl Services 27Hotels and Motels 30Life Insurance 32Motion Pictures 34Personal Services 36Wholesale Tracke 42Nonfood Retailing"
Department Stores 45Mail Order and Direct Selling 48c\-.Apparel Stores 50
Food Retailing.Grocof5k Stores a 52 .
Restaurants and Bars - 54Technical Note and Selected Census Tabulations 57

ForewordThe transition year of 1975as the Nation copes with problems of curbing inflation
and moving out of a recessio9 is an especially appropriate time to introduce "ServiceIndustries: Trends and Prospects." This new publication is designed to provide thebusiness community with information on growing Markets for praCtically all types ofbusiness and consumer services.
Part I details significant trends emerging in the services sector since the early 1960'sand contains a general discussion of the probable jmpact of demographic-and economicchanges on, service industries in the years ahead. Part II includes analyses of 15 indi-vidual service industries, focusing oh 'recent trends and future prospects for these par-ticulh industries.
"Service Industries: Trends and Prospects" was coordffiated by Renee L. Gallop underthe general sypervision of Norris 'A. Lynch, Director, Consumer Goods ,and ServicesDivision. Office of Business Research and Analysis. Individual industry statements wereprepared by the following Division industry specialists: Jacob H. Bennison, Gary R. Boss,Wray O. -Candilis, Marvin J. Margulies, Theodore A. Nelson, and Steven. H. Sternlieb.Statistical data from the 1972 Census of Business were provided by the Business Divi-sion of the Bureau of the Census.
V
V6

6 -a
.4
11,
4
OVERVIEW
1
8

Service Ind stries: Tends and Prospects
'ovEizvAEW
-The dramatic' growth Of the services sector of
the Nation's economy during the "soaring sixties"was accompanied by rising income, strong deniandfor a variety of business and consumer services, anela growing po ulation.
During thes years, service industries provided,.expanding markets for such manufactured productsas computers and advanced machinery, designedto improve, serviced delivery. At the same time, theservicing of these manufactured products plus grow-ing needs of manufacturers for legal, financial, andadvertising services expanded markets for the serv-ices sector. .
Since .1970. the slower pace of the Nation'sV economic activity has accentuated two major prob-
lems associated with the country's continued shifttoward a service- oriented economylagging pfo-
. ductivity gains and rapidly rising prices for services.The issue of slow productivity gains becomes in-
(creasingly significant when it is realized that servicesoutput in 1974 accounted for $89 billion of theNation's gross national product, very little of whiais exportable or enters into the balance of paymentsaccounts. Hopefully, continuing efforts to improveproductivity in the service sector in 'the next severalyears may reduce the above-average inflation ratecharacteristic of :service-producing industties. (
Service sector(rcceipts and jobs generally are lessaffected by business slowdowns than the maggfac-turing sector because sick people continue to(requireimmediate medical children attend:school,--fire and life insurance policies are not allowed tolapse, and government protective services are con-
-cc
0,"lie.d. At the same time, business capital invest-., _ment' and consumer purchases of. big-ticket itemslike automobiles and appliances can be posiPoned.
Although sales and pfofits for many service-producing industries 1 were,disappolnring during therecession year of 1974, real personal consumptio4spending for services (adjusted for price changes)rose modestly whije expenditures for manufacturedgoods declined.
With economic recovery anticipated in 1976,strong service sector growth is expected to resume
. and new, marketable service industries probably willcontinuevc,r., emerge. The growing complexities ofmodern business will stimulate increased deniand
'for such business services as equipment rentals, em-ployment agencies, legal services, and systems man-agement. Home maintenance services are expectedto expand significantly in the late 1970s as apart-ment living.continues to increase sharply:The stead-ily growing proportion of women workers. will pro-vide expanded markets for labor-saving services.With a sizable increase in the number of elderlypeople in the next several years, larger 'markets areexpected for home health services, medical services,leisure activities, small apartments, .an'd retirementcommunities in warm-weather regions. By 1980,services production, probably will account for an1.,creasing share of the Nation's gross national out-ut.
Service-prod.ucing industries include transportation, communication,public utilities. finance, public administration, private household serv-ices. and miscellaneous services. which include hotels, repair, recrea-tional, medal, legal, and educational services.
8

\ .
Section 4. Nature and Extent of Service Industries in the United States.
As service industries have grown in v4riety and penditures on consumer products. Total personalvolume, a broadened definition 'of industries in- 'consumption expenditures almost doubled from 1960eluded in .1,hel service sector has emerged. Private to 1970 while . spending on Services mole than
. sector service industries whose output consists of doubled, 1974, consumer expenditures* on serv,ices'increas-billion!
ctually, speated In. the
sinee personal...couda sp.en,ding by Federal; State, And local gov-
ments far- such services educati6n, publicsaniation, secgrity, and firefighting. Also, an
increasing share,Nof government 'funds has been speninon envitonmental quality control activities since19 O. The Census Bureau reports 'that Federal,
int,angibleS-Nnciude such diverse activitiqs as bank-. -.. mg. legal services, health care, insurance, auto repair,
beauty shops. and travel agencies,,. Activities pro:vided largely by ;over. ment,- such. as education,'-san-itation, aqd :protectiV alSo- serviceoriented iddustries,. In holes*
.,;trade maybe conside d serviceOrluting ndustreisalthciugh the -distribution and selling services. often
.._pre measured io..term of consumer ouflays for; goods,.
services, a
addition, reta
'not 'services. .
Since the early 1960'sosubstantial,gains in, receipts
e
40 percent further to,a3ore than $369
.ing on service$, probably is under-
ational income accounts seriestfigttiati` expettdi tures: for services*
and employment were recorded by Such'irriajor serv- State and local governments spent approximately $6'ice, activities as banking, legal services,.insurance" billion or. water:quality control, solid waste manage-.
.'reit estate, and medical care. In contrast. booming ment, and air quality activities in fiscal. yearsa s of television sets.,d high-fidelity. equipment 1972-73, about 9 percent above year Earlier
r
*for 'honk etitOtainment moderated spenning for such- -,! drec eation
ser1
Vick as ,Movies, theatra, and "spec-l'a
- . .4sports. Another /service- category ,in. 'which
nstimer spending hap/ leveled off is ersonal care-rvices - beauty a' Ad barlierr shops, shoe repair:
ryud laundry and cleaning. 1 1
-GNP 15gfiects Service Sector GrowthThe/continuing shift towar service economy is
reflected in the significant grd (4 the dollar valueof sertices produced compared to increases in the
- output of goods:Between 1960 and 1970, the dollarvalue 'of the NJion's gross national prod
uced-2-s growth
in. In 1960,
overall measure of goods and services pralmost doubled, with the service-sectoaccountin for more than ..half of thethe proddcliOn of mantif;ctured goods accounted formore than half of all output whil4 the service sector'sshare was only,31 perceitt. By the 1970's, the dollarvalue of goods production and ,sirvices ottput hadequalized': ,caqh accotgiled 'for more, than two-fifthsof the entire gross ational product.
Last, year, the gross niitional product' reachedalmost $1.4 trillion, with siavices produced account-ing for $589 milliod. It should be noted -that servicesproduced excludes such business service activities. .asequipment rentals and transportation costs for pred-'"uct shipments which are included in the value ofgoods output.
The increasing affluenee--of Americans during the1960's fueled a rapid rise in consumer spending..with the increase in service spending outpacing ex-.
f..
Trends in Consumer Spending on ServicesIn absolute' tekms, nsumets now are spending
mbre orr-stvices than they spent for everything in4960-'-services, durable goods, and nondurab II
such as food: and clothing. In current dollars, eo -sumer outlays (Or Services rose at a 7.7 percentannual rate.4 brill 1960. to 1973 while Personal con-sumptionnually, p ing these years, disposable in- -\sumOtion CnditUreS increased 7.2 percent an-
. .personal.
come rose at a 7.6 percent ;aInnual rate. The portion ..'-
Sector Composition of Crbss Product' rightating 11 80
.
Selected and Projected .1.--- :(percentage distribution b4ed on-1972 dollars)
' .
Manufacturing 27.1Transportation. commu-
nication. ant publicutilitjes
WholeSale and'retailtin&
Finance, insurance. andreal estate
Other servicesGovernment enterprisesOther
kector ' 1960 196$ g 1972 1980Total 100.0 10.6.0, 100.0 100.0
Agriculture1.9 1.8 1.3
4.9 3.6 3.4 2.4MiningConstruction . t 7.9 6.0. 5.5 4.8
t 29.0 28.5 28.6
9.3 10.0 11.0
18.5 18.6 1%1 18.7
-`)16.1 . 16.4 16.1 16.714,2 13.7 13.3 14.9
1.5 1.7 4i . 1.7-1.2 . :-.2 .0
tThe of gross
of gross national product orlssproduct originattng attribu
inating there.es to each industry
only thSource: Bureau of Economic. Analysis; U.S. Department of Com-
merce, and Bureau of Labor Statistics; U.S. Deprment of Labor.
4

) ". p
contiA's
for. stopercoed,
urba
4," .
onal income sp nt CI; services. pr bably willto grow in e years ,afiAstl--
zable share'4, ilicrea'seofconsume .peOingvices reflects, larger outlays for household
idlisl7eded to maintain and repair built-in..air.-ibning systems 04:fippliances in modern sub-."homes inll=apartments. In addition, spending
fiat- utilities...and-telephone -genic, es has been gisingrapidly in recentrYears., In 1973, almost two-thirdsof 'the-estimated. $18:9 billion in expenditures onup p and improvement of residential propertiesw spent by owner occd ants of properties collain-in one to fout.units. T e remainder Was sPen't 'Onr ntal properties by nonresident owners.
Patterns
0. .
of Coosumei Spending on Servicet
itillioris of dollas)....
; 1960 1970 1972
Household Opel-at ns ' , . 28,622 .50,669_ 59,996Household,stitipl es,.. 3,397 5,796 6,389Utilities' . , 7 - 13,749 24,325 29396Tetep t eittraPb - 4,515 9,879 12,208.Dom 16 service 3,799 21,830 5,021
Al.o repairs.+Nrictn.g, and rental'.: 5,198 8,719 10,436stAuto in444.In_
onc /1,966 3,478 4561
A-Public tkrmsportaii.
3,309 5,526 61210
2.200 4.800 5,700i 16,182 29,286 33,261
15,000 35.300 41.2002.354 4429 4,405
14,740 .38,711 .47,739
Consunier Spending;1960-73 and 4967-73 ,
Ave'ritte annual growth rate(percent)
. 1960-73 ' 12h7s73.Current G. Coxstant Current Co4stAtdollars dollars dollars do11,7k
DipDstth19 pc.r.sels11,11- °- . ..'Acorne 7.'6 4.7 . 8.8
. '
' ...,Versonal consumer, ` .
- expenditures ' 7:2 4.4 8.6 fDtlrables .8 7.4 10.1
Nondufables 6.4 3.3 441'Servict - ___, 43:- -8.7
.fioreilE t avelReta171attts °
Personal business ervicesPersona.' care,ServiegsMedical care servicesAdmissions ,to spectator
amusements 1,606Private :41cation, research 3,700Religicus Welfare activities 4,700
2.421 2,63110.400 12,0008.600 107100
Incl'ude's such hoUsehold operations as writing supplies, services on`appliances and howl furninNtis, premiums for fire and theft insur-ance, rogtage, ana-Nwing expenses that are ttot shown separately.
&tit° insurance less claims paid. r-
rj;;Source: Bureau of Economic Analysis, U.S. Department of Corn-, merce-Bropk.clown of selected persongl consumption expenditures by
type of expenditure.
. Source: Bureau of Economic, Analysis, .U.S. Department of COrn-..
merec; - . 'i ... .
'''Ihcreased spending .on
1 medical skyices and .onlpersonal ,bu.siness Services - brokerage charges,baliking-/and legal 8eirvices; and life insurance ex.::
,Penses..--, account for an increasing "share 4 theConsuna. er's service &liar. In contrast, the share of
, .personal income speng r'fo such recreational se/vicesAMovies'snd spectator sports,aCtually deelined-dur-
Aing the past decade as people spent 'more gisure. .
( 'hours at-home with newly purchased television sets.)1.and expensive high-fi elity equipment. However, ,
constirner spending inc eased significantly for suchleisure activities as camping and-luxury' vacationsand/boating.
The large yolume of consumer -expenditures Jorrepair services of all types, of consumer prodUcts. i.
.,ranging from automobiles and appliances to electric.',.-
hairdryers and shavers. has :resulted in j growingProbleni.of consumer relations. Although many con-
.sumer. complaintis originate from manufacturing1problems. the servicesector is the direct and some
times .the only contact available to. receive expres-*ions of consumer' dissatisfaction, Ibe increasingsri;compleXity of manufactured, products- malees' ade-
..., -,,
.5'
quote repair services.more difficult, leading to furthercomplaints of poor service.
-The \ impact of .the slowdown in the Nation'seconomy -- in 1974 on consumer service industrieswas uneven. For example, some popular forms ofrecreatipn remained unaffected by shvish businessactivity and the high eost.of -energy. Backpackingand outdoor camping, which have become a way oflife for many Ankrieans in. recent years, continuedpopular: Because' of the high cost of air travel /tooverseas resorts, domestic ski resorts attracted in-creasing numbers.of winter holiday skiers. .
Sirpirly, postponement of automobile purchasesboosted auto repair receipts. Also, limitedjob op-pOrtunities throughouf the Nation lowered workerturnover in s intensive service industries.(fast .fOod cha ns. laundry and drycleaning estab-lishments, hospitals) and, in turn,, lowered ,costs-oftraining pew employees. In contrast, in areas of highunenlloyment- and Tesult nt declining personal in-code, receipts
.ot servic establishments declined
sharply.' -
'Strong Demand for Busilt ss Services
Because_the cost of services to business is pre-sumably added to the final saleS price of goods andservices. spending pn business. services is not iden-tified the rtational income accounts. However,data c fleeted in Census Bureau surveys indicaterapid 'grOwth in services to business since 1960.

t.
7Tdday, 4iness firms depend upon a ,variety of
' s service/ sup Tiers .to handle data processing needs,vece ing ccounts, and legal services, and to install,i,
d 're, tejephones, plan conventions, and lease`---...9 yipnter!,. . I- .
-, Among the fastest growing business dur -'ii* thet.ipast decade were eqqpment, leasing andlegal services. According to thek.Amefican AssOcia-tion of Equipment Lessors, the volume of leasing hasbeen .increasing about 15 percent annually-for sev-efa'1')fears. New equipment valued at an estimated$11 billion was leased solely for businAs in 1973, , -4m,,,additioq to equipment leases outstanding valuedin an esti4dted $64 billion.'
Increalingly, /business' firms prefer leasing suchitems ,iii oil tankers, aircraft, ships, computers, andheavy industry machinery to investing. scarce capi-tal for the purchase of these expensive items. Ad-°"
k.
vantages of equipment leasing include reduction ofinterest costs, presavation of bank- credit deservesfor inventory Arcliages and less risk of obsoles-cence. Leisors include independept finance leasingcompanies,pnks and other financial institutions,and manufacturers, &specially in the computer field.
Demand for legal services has grown markedlyin recent years because of tile 'complexities of busi-ne)ssiactivitiesinvolving Iabpr union contracts, pat-ents, securiti ncl. government regulatory agencies.The recently en cted pension legislation, for exam-ple, requires c mpanies to submit all existing andnew plani to both the LabOr and Treasury Depart-ments. °Attempting to cuL,legal costs, 'some majorcorporations are beginning to monitor legal fees,use paralegal staff for routine legal research work,and maintain internal legal staffs: In 1972,receiptsfor legal services totaled $10.9 billion.
Selected Services Receipts, 1966-74
(millions of dollars)
Year
ti Hotels,.motels,
courts, etc.Personalservices
Businessservices.
Automotiveservices
ref
Miscellaneous Motion pictures,repair services amusements
1966 6,501 10,981 18,567 6,516 3,939 7,4981967
1--6,813 11,168 18,356 -. 7,023 0385 7,159
1968 7.010 11,827 23.367 8,109 3,687 8;6891969 , 6,823 11,481 25,406 8,647 3,885 8,671970 7,417 12,74ff 31,682 10,040 4,602 10,2561971 7,856, 12,965 31,398 11,113 5,368 10,5221972 8,548 12,965 34;165 12,266' 6,190 11,8761973
r, $491 13,561 37,716 13,891 7.396 12,2701974 9,319 13,793 42,334 15,190 8,439 14,189I
Source: Bureast of the Census, U.S. Department of Commerce.
9
3
c
Section 2. Impact of Inflation_ on Service Industries
AYnajor'economic consequence of a services-dom-inated economy is the inflatioeary pressure or prices
for services. The uPvlard push. of Costs forservice suppliers reflects rising wages in this highlylabor-intensive sector as vvell.as increased costs forsuch items. as real estate, maintenance upkeep, andequipment needed todeliver services. In recent years,seyice sector 'investment in expensive capital equip-ment has grown significantly.'
From 1.963 to 1973, the price index, for con-sumer services rose '57 .4eent while prices for dur-able goods advanced 25 percent. With sharply risingcosts for enerzy boosting prices for services during1974, 'prices for consumer services rose 9.3 percentand ,priCes for durables increased 7.1 percent. Forexample, higher costs of such items as utilities, linenupkeep, ftrniturt, and food in 1974 accounted inpart for the steadily rising prices of hotel and motelaccommodations .and of restaurant food..
Prices and output of service-producing industriesare greatly influenced by 'developments' in manufacturing industries which supply equipment, improvedniaterials, and new teehnology to the service sector.Medical services 'have been transformed during thepas decade with the introduction of such modern.and stly lifesaving products as kidney dialysisunits, radiographs which can process X-rays in 90'seconds, and manufactured 'heart valves. Similarly,the growing use of computer technologylin banks,airlines, insurance, and real estate has a ed to bother
Consumer Price indexes for,Various Service Industries(1967=100)
the cost! and quality of these services. Mny routinebusiness attiNtities - accounting, pIyrolls, and in-...'vensories are now handled by expensive informa-tioh' systems that record, transmit, store, and re-.,trieve data.' .
- According to a survey' conducted by the Ceeesui Bureau, the gross value of fixed assets forlected service industries (hotels and motels; persOnal,business, and repair services; and motion pictureand other amusement and recreational services)amounted to about-S50 billion at the. start 'of 1973.-
Consumer Price_ Index(1967=100)
Year All items Seivices Commodities
1960 88.7 83.51961 , 89.6 , 85.2 92.01962 90.6 86.8 92.81963 .., -91.7 88.5 93.61964 92.9 90..2. 94.61965 '94.5. 92.2 95.71966 97.2 95.8 .. 98.2
100.0 100.0 1(40QX19671968 1Q4.2 105.2 t03.7'1959 109.8 112.5 108.41970 146.3 121.6 113.51971 121.3' 1243.4 117_41972 125.3 1.33.3 .120.91973 133.1 139.1 129.91974 147.7, 152.0 145.5
Source: Bureau of LatiOr Statistics. U.S. Department of Labor.
1967, 1969 1971 1973 1974Rent .(for shelter1' 100.0 105.7 115.2 124.2 130,2Rest-lam:int meals 100.0 111.6 126.1 141.4 15 4Auromobile- repairs and mainteetneg 100.0 112.42 129.2 142.2 '15Pi14)1 ic transportation 100.0 112.7 137.7 144.8 14 .01Medical care services' 100:0 116,0 133.3 144.3 159.1PerSonal care services 100.0 110.9 120.0 130.6 . 141.5Reading and. recreation 100.0 108.7 119.3 125.9 133.8Fut;1 and utilities 10.0.0 101.3 115.1 126.9 150.2
I Also includes hotel and motel sales not shown separately.Also includes residential telcp-hones, bid nil, cual, water, and sewerage service not
Sonrce: Bureifil of Labor Statistics, U.S. Department of Labor.shown separately.
)
f
i
: . Section 3: Service Industry Employment Trends Since 1960i .
. -. ..
Today, two out,of three.workers holdS' alob in a Married Women in the Workforceserviee-producing industry in a proad spectrum ot , r
-occupations ranging from Maintenance workers, contributing to rising family inconies has been thetrutk crriv'ers,,-,and retail clerick_i'o physicians, corn- steadily increasing number of married women whoputer 'proiranT.iers. and television unnouncers._,In - are working outside the. home. In 1973, about 19-19607 dn ly three-fdth if the:employed population million or 35 percent of all families received annual
Were working-in :service-producing irldustrieS. earnings of $15.000 or more cominred with-6 mil-lion or 12 percent of all families in this incomebracket in 1960.
Today, almost half of the wives in husband/wifefamilies receive money from earnings ;compared toabout 36 percent in 1960. The proportion of Chil-dren under 18 whose mothers were employed out-side the hOme reached 40 percent last year. Abouta third of all employed motherS have children ofpreschool 'age. As the number of working wives in-creases, markets expand4or a variety of servicesincluding child 'care and restaurant services, beautyparlors, and appliance and repair services.
Among the factors that contribute to the additionof large numbers of women to the job market duringthe 1960's was that the bulk of new job opportuni-ties occurred mostly in the service-producing indus-tries where women traditionally have been employed- teaching, retail trade which offers fle;iible hOursand Opportunities for part-time work, and nursingand other health service occupations. Other develop-ments encouraging participation of women in theworkforce in recent years include better education,
, increasing social acceptance of working women, and,the decline in the fertility rate.
'During the I 960's, employment in all industriesinsreased opercerI , with :most of the 'gliins in the
Eniployment in professional and re:-latch services.rose 66 percent, employMent in busi-ness and repair services increased 40 percent. and
.there was an 18 percent increase in entertainment.and recreation jobs. Becinise of ..a sharp drop inPrivate, household service workers during these ,years. employment in the personal service sectordeclined ,15 percent.' Excluding private householdservice (housekeeping, maid service, etc.), however,personal services employment -NA,.se 7 percent (luringthe decade.
Finployment in the, finance. insurance,' and realestate industries increased 36 pe-rccnt and publicadministration employment (Federal, Slate and localgovernments) rose 32 percent.
Largely reflecting the dramatic employment growthin the service-producing Industries from 1960 to1970, median family income rose from $5,620 to$9.867. After adjustment for inflation, median familyincome rose 35 percent during the decade. By 1974,median family income (in current dollars) reached$12.840.
Employees on Nonfarm-Payrolls, by Major Sectors, Selected Years ' (000)SectorToa' ''''''''''''''''''''''''
' ' icing ........ .............. ''''''''''''''''''''''''....
196054,23420,393
712
196560,81521,880
632
197070,59323,352
623
197478,33724,674
672Contract construction .... 2.885. 3,186 3,381 3,984Manufacturing .................................................... 16.796 18,062 19,349 20,017
el-N,iee-producing ............. ........ 33,840 38,936 47,%42 53,664Transportation and .public utilities .4.004 4.036 4,493 4,699Wholesale trade ........ . ................................Retail trade .................
, 3,0048,388
3,3129.404
3,81211,102
4,26112,749
Hnan ce. insurance, and real estate 3,023 3,688 4,161Miscellaneous services.' .................... ... 7,423 9,087 11,612 eL), 13,508Government ' ............................ : 8.353 10.074 12,535 14,286
Federal 2.270 2,378 2,705 2,725State and. local 6.083 7.696 9.830 11,561
' Data include, .Alaska and Hawaii beginning in 1970.t),m, excludes proprielor,:, the self-employed. (:um Workers, and domestic workersin householdc.Include, howls, repair, household. recrational, personal.medical, business, legal, and educational services.
' Imludes only civilian .employee,: military personnel are CM:hided.I.ahor StatistiL:s. U.S. Department of Labor.Simrce: Bureau of.
8 13

Married Women in the Labor Force by Presence of. Children
$
YearLabor force (thousands)
Totalmarried women
(husband present)
'Presence of childien under 18 years
None 6-17 YearsUnder6 years
\ 1960 . ................. . ..................... : ............. 12,253 5,692 4,087 2,4741965 . ....... -14,708 6,755 4,836 3,1171970 18.377 8,174. 6,289 3,9141972 19.249 8;797 6,706 3,7461974 20,367 9,365 6,792 4,210
Participation rate'1960 30.5 34.7 39.0 18.61965 34.7 38.3 42.7 23.31970 40.g 42.2 49.2 3e..31972 41.5 " 42.7 50.2 30.11974 43.0 43.0 51.2 36.0
Number of women working or seeking. work.Source: Bureau of Labor Statistics. U.S. Departm t of Labor.
l'oung Adults Will Dominate Workfo ce in 1980Tomorrow's labor force will be better educated
han ever before as young people continue to devotenore of their early adult years to getting an educa-ion in lieu of -a job. In line with population growth)atterns, labor force growth in the early 1970's has)een concentrated in the 20- to 34-year age groupvhich numbered more than 34 million in 1974 com-)ared to 30 million in 1970 and only 23 million 10rears earlier.
In 1960, the workforce included almostmore 35- to 54-yeir olds than 20- to 34-year olds.Today, each of these labor force groups total about34 Million. By 1980, the younger group is expectedto outnumber the older group by almost 7 million.With increases in social security and other pensionbenefits, the number of workers aged 65 and overis expected to remain constant during the 1970'sdespite a numerical increase in the age group.
Labor Force and Employment, Selected Years and, Projected 1980, 1985(in millions unless otherwise indicated)
Actual1960 1972 1980
Projections1985
.ahor- force, total 72.1 89:0 101.8 107.716 to 19 years ........ 5.2 8.4 8.3 7.220 to 34 years 22.7 32,5 42.2 44.835 to54 years ..................... . ............ . 31.6 33.7 32.5 39.5,55 years and over 12.6 14.5 16.1 16.3,Median age in years 39.8 37.2 35.2 c. 35.8
imployment, total 65.7 - 81.6 95.7 ' 101.5. White-collar and service workers 36.7 50.0 62.0 67.1
Professional and technical 7.2 11.5 15.0 17.0Managers and administrators 7.4 8.0 10.1 .10.5Sales workers 4.2 5.4 6.3 6.5Clerical workers \ 9.5 14.2 17.9 19.7Private household workers 2.0 1.4 1.3 1.1Other service workers 6.4 9.5 11.4. 12.3
Blue-collar workers 23.8 28.5 31.7 32.8Craftsmen and kindred workers 8.7 10.8 12.2 13.0Operatives................... ............................ f". 11.4 .13.5 15.0 15.3Nonfarm 19.berrers 3.7. 4.2 4.5 4.5
Farm workers . ............. . 5.2' 3.1 , 2.J 1.6
Source: "The Jnited States Economy in 1985." Monthly Labor Review, December 1973. Bureau of Labor Statistics, U.S. Department of Labor.
Section 4. Prcidnctivity in the Service SectorWith a high proportion of the workforce employed
in the service sector, efforts to increase productivityin service industries are- essential to offset rising/wages and costs and to improve profit margins. From1963 to 1973, manufacturing sales more thandoubled, yet the number of employees 1-ose by lessthan 3 million or 17 percent. During the same 10-year period, the dollar value of services sold (ex-eluding government services) grew at a slightly fasterrate, but a 43 :percent employment increase, or anadditional 11.5 million workers, were needed toachieve these gains.
Productivity gains generally tend to. run above'average when 'output is expanding and -below aver-age when output slows. With the decline in grossnational output in 1974, productivity in the servicesector aetually, declined since such service employeesas retail clerks, barbers, lawyers, and stock brokersserviced a declining Volume of sales. In addition,lower speed limit regulations last year resulted inslowe( or less productive truck freight deliveries ofsupplies to both manufacturing and nomanufacturingindustries. .
Productivity Measurement Problems
Lagging productivity gains (luring the buoyant1960's in a number of service industries underscoredthe need to improve efficiency through applicatiOnof laborsaving devices and modern managementtechniques: However. it should be recognized thatpart of the slow productivity gains in the servicesector reflect problems of measurement since outputoften is measured by 'statiStics on employment andwages. The use of employment data rather than man-hours may underestimate productivity levels in suchlabor-intensive industries as retail trade, personalservices, hospitals. and hotels/motels because a largeportion of the workforce is employed on a part--time basis. In the education field, costs for additionalteachers and materials tailored to meet the speciallearning problems of inner-city disadvantaged young-sters cannot be effectively measured in terms of out-put until these young people reach adulthood.
Productivity Gains in Some Service Industries
Productivity levels vary sharply within the servicesector. depending upon the type of service rendered.For example, trendS in output and employment inthe banking induStry suggest improvements in pro-ductivity during the past decade. Measured in termsof increasing volume of checks, deptsit accounts.
10
and trust and loan departments, bank output hasbeen rising sharply. Between 1960 and 1973 thevolume of checks handled through Federal Reservebanks (accounting for one-third of all banking oper-.ations) rose from 3.4 billion to 10 billion, reflectingan annual groWth rate of 8.3 percent. During thesame period, eniploythent increased by only 4.5 per-cent annually, less than the rate of growth in the'Volume of deposits, checks, and other bank- services.
Examples of productivity gains in other servicesare numerous. Today, some illnesses which involvedmany patient visits in past years can be curedquickly with antibiotic treatment, taking less of thephysician's time. The widespread use of copiers hasgiven secretaries more time for non-typing duties.In retailing, some stores employ past-timers to workonly at Peak periods during the day in order toprove both productivity and the quality of service.In the laundry and drycleaning business-, two oper-ators using the latest pressing equipment now caniron 85 io 90 shirts.. an hour compared with 65 ,shirts an hour several years ago.
Computer Applications Aid Productivity
Increasingly, the' computer is being utilized in avariety of service industries. The introductiOn ofcomputerized records has reduced ManpoWer re-quiremepis and sharply increased productivity infinance, airlines, insurance, and real estate. Com-puters have revolutionized airline reservation sys-tems and the maintenance of library archives. In thehealth services industry, computer technology haseliminated endless clerical tasks and is even beingused to automate physical examinations. Similarly,recently developed electronic bank teller terminalsoffer fast deposit, withdrawal," and funds transferservices, reducing long lines in front of tellers' win-dows. To monitor warehouse inventories, visual dis-play termirials are capable of increasing order-select-ing productivity and reducing warehouse operatingcosts. In Tacoma, Washington, a computerized courtscheduling'.system saved about 40 percent in policeovertime costs during the first 13 months of opera-tion.
In the retail field, a few supermarket- chains aretesting an automated pricing and checkout systemthat identifies prices, adds a customer's bill and, atthe same time, offers instant inventory control and amethod to check results of the store's sales and pro-,motion campaigns. The key to the operation is aproduct coding system under which -thousands of

grocery items are identified by 10-digit .numbers byfood packagers. Optical scanners installed in com-puterized checkout counters are connected to acomputer programmed with the store's current prices.The scanner identifies each item's sales price on adigital display screen and grocery orders can bechecked out in about half the time of traditionalcash registers. The estimates! $125,000 co S1 of in-stalling the system could be 'offset by estimatedannual savings of $40.000 in an eight-lane super-
, market.
Franchising Improves Efficieney_of Small Businesses
Under the franchising system, franchisors offer,management expertise and research marketing 're-sources to small business enterprises with limitedcapital to help them achieve success. During thedecade of the 1960's, the dramatic growth of Iran"-chising in a. broad ra'nge of service industriesgasoline stations, fast food, hotels and motels, autoanqc truck rentals, ?retailing, and campgrounds --- sig-nificantly changed the traditional distribution systemfor consumer goods and 'services. According to arecent survey conducted by the Bureau of DomesticCommerce on the extent of. franchising, an estimated
I
444,000 establishments were engager in franchisingbusiness in 1974 with estimated receipts of almost$162, billion.
In recent years, the growth sector ofindustry has been the franchised fast-food business.Fast-food franchises.. expanded rapidly1960's providing 'opportunities for franchisees to owna business with a .relatively small inVestment anddecreased costs resulting from automationrinsgtanciduaierdk:mends, and strict portion control. Offeringservice; convenient locations, and easy parking; fast-food units sell inexpensive meals of chicken, ham-
pe9tiUtUtilizingezinsgburgers. roast beef sandwiches, pizza, etc.market research techniques to survetomer demand, sonic fast-food franchisors have ex-tended the limited menu technique to eheflessbdin-ner restaurants which serve such items as roaststeak, or lobster in a more lu'x'urious restaurant.environment.
Despite a -Current slowdown in franchising ex-pansion, long-range prospects arc favorable since thefranchising concept has proved to be a successfulmethod to create efficient new businesses to accom:oxidate the needs of shifting consumer markets.
Section 5. Impact. of Demographic Changes on Service IndustriesBesides income levels, U.S. spending habits are
influenced by population age-mix, birth rates, educa:-tional achievement.rand-housing patterns. Statisticaltrends of .births, deaths, population distribution, laborforce, and family formation Offer insights into con-,sumer and business markets. During the 1960's, overfour-fifths of the Nation's growth occurred in metro-politan areas, largely within suburbs outside centralcities. About 70 percent of the 213 million Ameri-cans now livd in metropolitan areas. Larger num-bers and proportions of the population are nowcompleting high school and college than ever before".
The Population mix is changing as the very largeschool age population of the 1960's reaches adult-hood during this decade..Today, more than half of..all Anietieans between the ages. of 20. and 55 'are'under 35. These young., adults, haviitli been raisedin an affluent society, are likely to spend an increas-ing share of ;income on such ,luxury services as air-conditioned apartments, travel, entertainment, art,books, and recreation.'" The sharp decline in thebirthrate during the past 10.years has resulted in adecrease in the proportion of presc400lers andincrease in the proportion of school-age children.
The typical family has 'changed significantly inrecentf years because marriage is occurring later,couples' are having- fewer children, and the life span
Changes in Personal Consumption Expenditures(percent distrihulion based on 1972 dollars)
1960 1968 1972Projected
1980Personal consumption
expenditures' 100.0 100.0 100.0 100.0Durable good, 11..6 14.6 16.2 16.0Nondurable goods 46.1 42.7 41.3 39.6Ser. ices 42.3 '42.7 42.6 44.4
Source: Bureau of F.conolojc Analysis, U.S. Department of Com-rne-rce. and Bureau of Labor Statistics, Department of Labor.
is lengthening with medical advmany more unmarried personand elderly people, are maintholds. Non-husband/wife houincreasing proportion of ne--- '40 percent of the 5formed between 1970 andyear age bracket, hushan79 percent of all family70 percent in 1974.Future Directions
Because of the cha ging aof the population, there aredevelopments in spending fo consumer services in,the years ahead. Families in the under 35-year agehiticket probably will account for more than one-third.of all retail Salds in 1980 compared -to aboutone-fourth in 1970. ..
With the trend toward condominiums and .apart -'ment .rentals accelerating because of the high costof home ownership, an increasing proportion' ofyOung adult households and families will rely oncommercial home and grounds maintenance servicesinstead of the homeowner 'maintenance upkeep ofthe 1960's.
Other fast-growing service industries in the nextseveral years will be medical services, utilities, tele-phone service, domestic and foreign travel, personalbusiness services, and recreation. At the same timeoutlays for educational services probably wnl slowsignificantly because of the declining birth rate allotbecause the population of college-age youngsters oilbe growing less rapidly.
Another service category for which the rate ospending will be slower in the next few yearspersonal care. Consumer spending in barbershopsbeauty parlors, and drycleaning establishments has-increased relatively little in the past few years and isunlikely to change markedly by 1980 because of the
nces. Furthermore,, both /young adults
ming separate house-ceholds/a count for an
household formationsillion /new households'
1973. n the under 35-/wife /families fell from
ouseho ds in 1969 to only\4"
e-mix and life stylesnumber of expected
Population by age Groups (as of July 1)(millions of persons)
Total Age groupsYear population Under 5. 5-1-71 18-39 40-64 65 and over1960 180.7 20,4 44.2 51.6 47.9 16.71965 ... 194.6 20.4 50.0 54.6 51.5 18.21970 . 204.9 17.2 52.5 61.1 53.9 20.2Projections1975 ......... 213.9 .. 16.8 50.0 70.4 54.5 22.21980 ...... 224.1 18.6 46.3 80.2 55.0 24.1,198'5 235.7 20.6 46.3 85.7 57.1 25.9
Source: Bureau of the Census: Series F. (low series) projection.
I
12

emphasis on the "natural look" and development ofsynthetic materials which do not require drycleaningservice.
Although incomes are not expected to rise asrapidly in the next several yearsas during the 1960's,a slower projected rate of population growth willresult in hither per capita consumer buying power
by 1980. 'In .ter4,Of sales and employment, theservice sector is-expected to grow more rapidly than[manufacturing. However, unless major efforts aremade to improve productivity in the service sector,a large part of the increase in sales will be in
reflecting the continued influence of somelabor,intensive, low-productivity servile industries.
...?The Growing Young Adult Workfbrce....
55 yrs.and .oyer
'16%169
;;yrs. 9%
1960
72 Million
19727
'89. Milli9n
Source Bureau of Labor Statistics, U.S. Department of Labor. .
Bibliography
Productivity .in the Tertiary Sector, by SoloniodFabricant, National Bureau of Economic Research,Inc.. 1972.
Toward a Trillion Dollar Consumer Market. TheConferenCe Board, 1973.
A 'Guide to Consumer Markets, 197,V1975. TheConference Board, 1974.
CoOtaining Inflation in 'Environment of the1970's. The Conference Board, 1971.
The Disaster in Productivity. Fortune, December1914.
Manufacturers Move Into the S 'ces. lodustryWeek, April 8,' 1974.
Population. Labor Force and EmpinyMent: 1972-81and Personal Income, Savings and Consumer Spend-ing: 1972-81. National Planning Association, 1973,
Where Women ,Work An Analysis by Industry andOccupation and Children of Working Mothers.Monthly Labor Review, May 1974.
;
1980
102 Million
t'Population of the United States Trends an Pro-spects: 1950-1990, Series P-23, No.149,Ma' 1974.°,.Bureau of the Census, U.S. Depar tment Com-merce. -
.
SurVey of Current Business. Seleeted issues, Socialand Economic Statistics Administration, Bureau of,Economic Analysis, U.S. Depirtment o(Commerce..
Population Estimates and Projections, Series P-25,No. 470, November 1971 and No. 519, April 1974.Bureau of the Census, U.S. Department of Coni-tmerce.
Money Income in 1973 of Families and Persons inThe United States. J'anuary 1975, Series P-60, No.97. Bureau of the Census, U.S. Department of Com-merce.
Illustrative Projections of Money Income Size Distri-butions, for Families and , Unrelated Individuals.Series P -23, No. 47, February 1974. 'Bureau of theCensus. U.S. Department of Commdiet
Technological Change and Manpower Trends in SixIndustries, 1974, Bulletin 181,7. ,Bureau of LaborStatistics. U.S. Department of Labor.
-It
.45
da
PART IIS
INDIVIDUAL SERVICE INDUSTRY STUDIES
)

ADVERTISING
The advertising industry is made up of advertisers,advertising agencies, special purpose' establishments,and the various media that print. or broadcast ad-vertising. messages: In addition stimulating tie -
wand for the advertiseks products and . se,Oivs,advertising dollaist agencies and special-sAvice establishments that work for agencies, and thevarious media organization's' that depend upon 41money for the bulk(of their operating re'enues.
Advertising in 111(idern Society
- .advertising expenditures totaled $26.5 billion inI974;nearly twice, as much as a decade. ago. Therapid expansion of the economy during these years,together with tho prolifera ion of ew products andservices, account for advertis g's percent:aVerageannual groWth rate since-1963..During such expan-sionary periods as the late' 1960's, business maintams high levels 'of advertising and is quick to in-crease spending.. However, .mlexpenditures histori-cally have increased at, a slightly slower pace thanthe Nation's gross national product (GNP). Ad-vertising expenditures now represent about two per-cent of GNP, down marginally from the 2.1- to 2.2percentages characteristicof the past decade.
.National advertising expenditures money spentby advertisers in national and regional media mar-kets (network television, .radio: magazines, etc.)totaled $14.6 billion in 1974, while' local advertis-iiw----7 money- spent by advertisers in local markets(principally news0aPertzind local broadcasting)totaled $11.9 billion.. II °
Local advertising is growing. faster than bothnational and TOTirt-,40 expenditures and is expectedto surpass the national share in the late 1970's. This
'..trend reflects the increasing use of media by localretail chains .,ffld supermarkets qind the leveling offof national advertising growth.
Newspapers, the Nation's largt ad. media, is
essentially a local medium as most o s $8 billionin 1974 ad revenue originate/ from local businesssources, Some of the Nation's major national retailchains direct much more of their [id dollars to local-than to national media.
rThe Changing Character of Ad Agencies\
Once thought of as a haven for creative pursuits;..the modern full .service ad agency must he skilled indelivering a wide spectrum of special services. Com-petition for new clients is severe. The changing'advertising demands of, clients require a group of
17
profesionals whose specialties span advertising; mar-ket research, distribution, pSychology, soctolgy,.and international business. Not every agency,ever, offers such 'a 'variety of multi-disciplinarytalent. Most ad agencies are, in fadt, quite snil,andlimited to developing and preparing advertising mes-sages the service for which ad agencies originally ,
evolved.In 1972, about 28,560 establishments, with re-
ceipts of $10.6 billion, provided advertising services,up from 20,124 establishments with receipts of $8.3billion. in 1967. Accounting for 9'8 percent Walleceipts, however, were only 35 percent of the
c`tablishments with paid T mploYees. Included in
this count are ad' agencies, ou or advertising serv-ices (billboard and poster specialists)i, media repro.s'entatives,. -and miscellaneous specialized organiza-tions.
Ad Agencies pre CoMpetitive
In 1974, tyre were an estimated 5,500 achiertis-ing agency companies, some with' several, branchoffices, wh k se collective billings (client money formedia payme s) totaled $10.8 billion. About 650were -full service agencies handling nearly all na-tional advertising expenditures. The remaining 5,000,agencies were the smaller, creative shops servicingpredominantly local clients.
Despite the steady overall giowth in advertisingbusiness over %the past decade, agency employmc tdeclined in the early 1970's. Unlike other .profsional services, where licensing and tests of compe-tencetence requirements limit market entry, adagericiescan be established' with little difficulty. Frequentaccount. changes and a rigid commission rate struc-ture characterize the industry.' A single major client account change can spcdisaster for an age cy. For examplf, in 1971.sluggish year for bus and advertising ..---- nearly200 major advertisers moved their accounts, billing$350 million to different agencies. Agency employ-ment rolls were trimmed by nearly 4,500, as agencynet profits as a percent of billings fell to their lowestpoint since 1963.
Outside. Pressures Inside Changes
The advent of organized consumerism and in-creased goverbment consumer protection regulationshave forced agencies and their advertiser clients tobe more careful about advertising claims and moresensitive to current public issues. While these forcesmay ,have da pcned some of the creative' c mcnt inadvertising, e ective advertising that avoid public ,A

Total ailvertising expo MuresNational' adsrertis. gLocal advert isip
Number of etilblis ments
'Receipts, (000) '
Number of eshihlishrneAswith h (,000)
I Receipts U
Employment (0001'
Advertising(in. millions-of dollars excert as noted)
1963 1967Percent inciRase i. .
1963-67* 1972Percent increase.
1967-72*13,107 1.6,866 6.5 23,060 6.4 .8 4 10,250 6.0 13,100 5.04,9 6,616 Y. 7.3 9,260 8.5
12. 20.1 11.7. 28.5 " 7.26,384 8,341.6 *. 6.9 10,591.3 r 4.9
7,7 r 8.2 1.:6' 10.6 - 5.36 5,0 8,201:5 6.7 10,342.3 4.8
100.3 109.1... 2.1 111.5 1.2
! Cbmpound annual rate iY1 growth.,Estintated he
A', of March.Source.: Hureatiiif the Census. Advertising Age, andJ3DC.'
and private critieisin has posed a reativc challengeto ad agencies..Also, public servic adveqing hasopened up. a new -market segment for many igencies,The growing -dominance of television as file 'mostinfluential medium also has 'created a continuingmarket for creative artists.
Within ad agencies, cost,control concern and com-puter sophistication now are being emphasized. Tra--ditional full 'service agencies the ones that per-form a full range of services for their clients arefaced with increased competition from independentmedia buying services and "creative only" agencies.These "special servi&" independent agencies,spawniid several years. ago, partly resulted frontadvertiser disenchantment over the inflexible 15-percent-of- billing commission rate charged by fullservice agencies. Also, many advertisers now absorb,more of the promotional activities formerly con-tracted to agencies.
Future -Directions
Total advertising voluble probably will match orslightly trail GNP growth-throughout the 1970's withlocal advertising scoring the greatest gains. Localtelevision, radio and newspapers are expected to increase their share of total advertising while directmifil,-magaActes, and national newspapers will Con-tinue to lose. Part' of their share as local advertising
,slowly becomes the dominant force in advertising.Advertising revenues are not expected to he appre-clattly affected by increased subscribif cable tele-vision penetration in the next se '\eral years since themajor source of cable televiion revenues are sub-scriber fees.
The larger agencies, those few hundred accounting
Percent increase1974 1972-74
26,550 7.314,620 '5.6 ,,
11,930 9.5
11,290' 3.0
1 l',000 3:0
a.1
)
for nearly all national advertising, will groW justfasfast, primarily because of their rapidly e panding'international business and diversification i o fnori-advertising ventures. Already, foreign busirmss ofthe very large agencies accounts for up to 25 ,percentof their sales. By 1980, some-of these agencies prob-ably will have worldw,ide sales of $1 billion.
,Diversificati 'n-Cipliortunities for the- large talent-laden agdnci are many, especially in services such'as public re tions, research, and rsons'ulting. Stiffcompetition for a mited number of national ac-counts will be a ma pr influence on these agenciesto continue seeking foreign sales and diversificationVentures. .
Public pressure for truth-in-advertising and ac-countability will continue as advertisers and tlieairagencies strive to construct advertisements which 1*-eeffective sales tools without being objectionable- tothe many public and private watchdog organizations..
AUTOMOTIVE SERVICESThe 'automotive services industry continued its
long-term growth trend through 1974 despite thesevere disruptive effects of the energy crunch andgenerally lower levels of buSiness activity in theNation's economy. Although 1974's performancevaried by sector, r ceipts for all automobile servicesrose 12.1 percent annually-from 1972. to 1974, par-tially reflecting rising. prices for services., In 1974,receipts totaled $15.1 billion, more than double thelevel of receipts in 1967.
In 1974, there were 116 million vehicles on theNation's highwys compared with only 79 million10 years previoly. As a result, demand rose rapidly
18
21
for automobile repair and such emergent' specializedservices as parking and auto and track rental./leasing. In 1974, only auto renting/ leasing failedto register a substantial gain but this service is ex*-
pceted tot resume its growth witlt, the anticipatedbusiness upturn in 1976.
Establishments .seryiag the ailI°motive public
employ more than-400,000 workers -inationwide in
such areas as auto repair, auto rental Id leasing.and. parking. Of the 1,70,000 auto service establish-
.inents in 19/1, only 54 percent were large enoughto employ, paid 'workers, Counti4' proprietorshipsand typically small partnerships, the total numberof individuals ,earning a livelihood from- servicingautomobiles probably exceeds 509A}0.0. Except for'parking establiishments which rely increasingly on
-customer self irking, significant employment' gainshave accompanied receipt ncreaSies in all auto serv-ices sectors. Auto servie s employMent rose 3.8percent annually from 196 to 1972.
Auto Repair Donaiid Keeps., urging
Despite a sharp de-Cline car sal andreduced auto- usage during 19/4, demand f r autorepair sety,ices continit'es its long established growth
trend. Auto repair demand spillover resulting fromnumerous new car dealerships closings.and an esti-mated 10.000 service statioi iailures in 1974 prob-ably will further increase business activity of thenearly 130,000 independent auto repair establish-niL)nts in operation today. Also.. auto repair shopscontribute significantly to improVed auto mainte-nance needed to combat polltitiOncaused by exces-sive auto emissions. It is increasingly recOgnized thatperiodic tuneups .keep exhaust emissions low andimprove gasoline mileage.
The greatest challenge facing the auto repair in-dustr' has:been its ability to maintain an adequatepool of competent mechanics. Ftiture prospects oftraining an additional 200,000 mechanic's needed by1980 to. meet' anticipated Telmir workload require-ments is less than optimistic. Nearly half of theseauto mechanics will be required by independent autorepair shops which. generally perform ibott..half ofall auto repair work. "1- he remainder would he em-ployed in car dealerships and gasoline stations,An_creasing sophistication' of automobiles equipped withcomplicated emission control and pollution equip-ment and the prOliferation of state .and local inspec-tion requirements will contribute toward increasingdemand for mechanics.
. Major reasons cited for the past shortage ofqualified mechanics include relatively low wage levels
19
despite high skill requirements, inadequate tests ofcompetency standards, and a limited number ofeffective mechanic training programs. eports ofwidesptead mechanic incompetency. has led. to in-creasing consumer complaints on the quality of .autorepair work.
Efforts to upgrade the profession through im-proved training programs, mechanic testing and cer-tification, and 'licensing, have yielded mixed resultsand sonic controversy on the subject of licensing.Until such efforts improve the tittractiwness of theauto mechanic profqs.ion, the shortage or qualifiedmechanics will continue to-baithe industry's greateStproblem.
Auto Rental ,easing Popular
Althotigh tlic limo rental and leasing Service sectordid not post a significant gain in 1974 largely be-cause of reduced gasoline consumption and generalsluggish business activity, substantial growth hasoccurred since the early 1960's as business add-con-sumer markets for auto rentals ,expanded sharply.Since 1963, establishments Flit.ged in washing. rent-ing, and leasing cars and trucks More than doubled,from 22,500 to 46,800. Pas'senger car rental, espe-cially daily rent-a-car agencies, and truck, leasingcomprise the largest subsectof, accounting fot. overhalf of all establments engaged in renting and/orleasing.
Increasingly, businesses and individuals are turn-ing to mitt' lease/rental in lieu of purchasing ve-hicles. Advantages of lease/rental versus ownershipinclude less capital ticup; a ,constant stream of newcars, and fewerrepair problems under typical main-tenance agreements. For private individuals, easingautos can be cost effective as well as- less trouble:-sonic in toins of Maintenance upkeep and shoPpingtime inconvenience: Individual leasing probably willcontinue to outpace all other leasing 'Sectors.
About 12 percent 'of new passengercar sales arefleet sales, 70 percent of which represent purchasesby lessor companies (those who lease or rent /o com-panies ,and individuals) and daily rental companies.Such purchases are taking an increasingly largershore of new car- output as leasing and rentals gainin llopularitY.
In recent years, car washes have emerged as sastrong growth industry, although their growth hasslowed significantly i..the last 2 years. Their strengthhas been built on techmilogical advancement inlaundering autos quickly and cheaply _along withtheir successful on- premise; tie-in, with service sta,Lions.

Parking Lot Industry .
Rapidly rising parking industry receipts .largelyroflect higher parking costs since the number ofparking lots and structures actually deel;ned from11,300 to 10.500 from 1963 to 1972. Receipts dur-ing this period -rose from $416 milli& to $725
an average 'tinnwal increase of 6.4 13etAent.The trend toward fewer parking establishmentshasnot actually resulted in a reduction in parking.spacessince many new establishments are multistory struc-tures., AbOut- 2.0 percent of all parking establish-ments arc strictures, a percentage likely to increase
:ILL the next decade as real estate values continue tosoar and old lots are replaced by spaciou'Srrnultistory,
-'structures,Like most auto service sectors, the parking indus-
try is dominated by small establishments. Nearly80percent of the Nation's 10,000 parking esblish-
..
ments have a work force of under 20 workers,tt'nostof whom are 'unskilled workers. The parkingtry as a whcie employs the fewest number of people
just over 37,000 paid employees -- of all majoriuto service sectors.
tr.=Future Directions
Auto: service receipts are expected to continuerising for the next several years despite'modelatingnew car sales and increasingly 'cost-conscious con -Bunters: Actually, such factors may help to sustainthe high growth 'rate of auto services. With coc-sumers expeOed` to keep 'their cars longer, ,demandfcir automobile service and repair will continue tollrise as consumers strive to keep their existing ye-
' hides in good working order in lieu of purchasing anew car. Further increasing demand for auto serviceswill be the !rend toward increased mandatory state
Selected Automobile Services.(in millions of dollars except as noted)
Percent intAease Percent increase Percent increase1967-72 197.4' 1.972 -74*,
Auto s
Nurribttol. establishment:,
1963.. 1967 . 1963-6. 1972,
(000) 114:5 109.9 127.2Receipts 3,588.1 4,08,5.5 , 3.3 7,045.1Number of establishments
with payroll (000) '58:3 55.8 - 655Receipts
' .1 049 3 3,505 6,434.3
..47, Payroll /year 778.3 943.3 4.9 1.699.3Paid employment' (000) 184.4 187.9 3; 237.8
Automobile parkingNumber of establishments
(000) 11.3 10.6 10.5Receipts 415,6 483.8' 3.9 725.3Number of 'establishments
with payroll (000) 9.6 9.3- '9.4Keceipts 404.1 473.2 4.0 711.4Payroll/year 114.3 129.5 3.2 174.3raid empldyrnent (000) 34.9 33.5 -.7 37.2
Car, truck rental and leasing .-,and other servicesNumber of establiThments
(000) 13.9 18.7 31.2Receipts 1,440.2- 2,489.3 14.344 4,310,7Number of establishments 411.4
with payroll (000) 8.6 12.0 - 15.6Receipts 094.8 2,420.6 14.8 4,083.3Payroll year 242.5 7 395.8 13.0 679.0Paid employment (000) 68.7. 95.0 , 118.2
Total automobile servicereceipts 5.44.0 7.028.0 6.6 12,081.1
Paid' emplONApent (000) 296.8 343.5 3.7 414,0
Estimated by .BDc., As of March.
Compound animal rate of itrostli.Source: Bureau of Census and BDC.
20
1I.f-
--11.912.54.8
8.4
8.5
2.1
959
15.9
15.0
11.6 4 :773
11.43.8
5.2
. 15,187 12.1

auto inspection, enforcement tigktening of safetyand emission control standards, d more technolog-ical cfficieficy in repair service elivery' Recent re-ductions in the number of gas st tions and new cardealershihs also will increase the repair load on autorepair service facilities.
However, the auto service field still frill beplagued by the aftninuing Shortage of 5Jcilvitkd me-chanics. Lessehed emphasis on 'mechanic training',bYthe major auto makers who are-becoming more costconscious may further compound this problem. Re-cent efforts, both voluntary and mandatory, in up-grading mechanic skillg' via certification and/orlicenSing may help to expand the pool or quality \mechanics in coming years. A number of states haveinitiated mandatory mechanic anchrepair shoplicjns--ingand/or certification designed to reduce outomo-
'bile service complaints 'and upgrade mechanicalquality. ditional pressure for state licensing andCertific is expected to continue.
Stro wth prospects. also arc in store for theParking rental/leasing service:sectors as these
`incustrie c flnue to provide essential services tothe at on's automobile drivers. In the future thetragitamal parking lot will slowly be replaced bymultistory structures as land values MCI-ease and theavailability of city space' diminishes. While fringeand suburban parking areas are still lOt-oriented,multistorj, parking structures are gaining popularityin these ifreas.
iong gran
BANKING AND OTHER FINANCIALSERVICES
;.;
4the bank managkment process, the banking industryis able to anticipate problem areas before they reachcrisis proportions. For itistaRce, with the "age of
'consumeriSni" during the 1960's, banks expandedconsumertioan operations, home mortgage _loan ac-tivity, and credit services, emphasized retail bank-,ing, and expressed willingness to revise any practicesthat might be considered questionable or unfair,tbconsumers.
Marketing and long-raige planMng; 'full 'serVicbanks: bank holding companies, the age of consum-erism; and electronic. funds transfer systems weresonic of the prinepal trends characterizing the bank-ing system duri g' the past 15 years. They can ail, besummarized into' one word== expansion.
Expansion was translated in more' time deposits$184 billion in 1967 compared with $432 billion in1974; more demand deposits$211 billion in 1967compared with $3.16 in 1974; more assets$451billion compared ,with. $919 billion; and incceas-edemployment-870;000 compared with 1,234,000.
Banking institutions have had remarkable successin adapting to the innumerable changes in the U.S..economy that influence,the financial community. Asa result, the financial community has. anticipated:,problems:in the structure and operations of com-mercial banks. As long:range .planning and market-
.market-
ing techniques have 'become more integrated. intos;
2
...The Bank Credit ,Card
One of the fa-stesLgroWing phenomena iti con-sumer-oriented_ banking has been the credit card,which was developed in response to the consumer'sneed for expanded credit use and for safe and fastfunds transfer. -
An estimated 60 million Aniericans ` held bankcards in.,1974 and used them to'obtain $13.8 billion.in goods, services, and cash adyances, Near14.11,400of, the Nation's 14,000 banks are involved in someaspect of the bank card business, but only about1,500 actually issue cards 'and operate their ownplans. The rest serve as agents of larger banks.Virtually all are affiliated with Master. Charge orBankAmericard, the two nationwide .corporations jthat administer the system for their Member banks.
Bank cards are accepted at more than two million-retail businsses. The average card purchase is about$20, and the average outstanding balance- is $280.Bank cards also are used for a cash advance 'at ia bank within `a prearranged credit limit, usually,$400 to $,600, ,, .
4 ,AnOther form of bank card is the debi: cardissued to customers so they.may'haveI access t. theirbank accounts 24 hours a day, 7 days a week. Thesecards are designed to activ)te cash dispc--Isers andautomated tellers that are usually installed throughthe walls,.of bank buildings. Customers can depqsitor withdraw funds from their. checking or savingsaccounts, or transfer funds from one account to theother_
Bank Holding Companies
Another form of bank expansion relates to thebank 'holding company-movement. While the num-ber of banks has' reriiained fairly constant sinceWorld War II, the number of branches and facili-ties has grown considerably. In 1946 therewereroughly 14,000 banks and 4,000 branches; by 1960the number of banks and branches were almost-even; today, branche-s outnumber main offices by twoto one. This area-wide expansion Was partly due toliberalized _branching laws. In addition, the banks
+:
is
wanted to provide customer's ,with new seroiceS notnecessarily oriented to teaditional .banking activitiesand to expand services outside restrictive banking.'laws and 'regulations. The -answer was the bankholding company which, while not a new phenornc-.non, made such tremendous strides duringthe 1960'sthat fundamental changes resicdted in the traditionalstructure of banking. ' .-
Some.ofthe advantages inherentin holding -companies we' 1-6 opportunitieS' to tap major money and,capifal -markets, econoniies of scale, .recruitment ofbetter talent, the ability to plan on a longer rangebasis, and to trinket services more effectively. Non-bank activities have ranged from mortgage, finance,credit card, factOring, or leasing companiesothNpro-,
...viding bookkeeping, data processing, and investmentservices: Sonic areas being considered by tI1e Fed-.eral Reserve Board as permissible actiyities,f r bankholding companies include leasing real property,underwriting 'mortgage guarantee insurance, operat-ing savings and loan associations and armored carservices, and providing manageMent consulting sere- ..ices to non-affiliated banks. "
Holding company operations are expected to growvigorously over the next few years, particularly inStates which restrict or prohibit branching. However,with the recent trend towards the liberalization ofbranching laws; the real potential for growth prob-ably lies in the area of additional nbnbank activitiesthat may be _permitted by the Fed rather than. inthe number of hank holding companies. .
Electronic Funds Transfer System
The growing volume of checks has long. been thep.,.. bject of discussion and apprehension on-the par'
...of regulatory authorities and' the banking industry.TO avoid a total collapse of the system under anavalanche of an estimated 45 billion Checks by 1980and a 7 percent annual' growth in checkwriting,banks extended their automation capabilities consid7
i erably in the 1960's and are lookitig forward to thedevelopment of paperless entr,ies that must inevitablyculminate in a cashless and checkless' monetarysystem. -
-According to results of a 1972 survey conductedjointly by the American Bankers Association and
.' ',the. Bank AdminiStration Institute,. 56, percent of allbanks wire using computer facilities that com-pared to a mere 7 percent in 1963. In ,addition,banks have started using automatic' tellers and cash
dispensing machines, a form of expansion that car-ries entormous poS'sibilities depending' on future int-,provemcnts in methods and equipment.
22
An eloctrotnic funds,:transfersy,stern; however, in-volves more than the use of computers. It basidallyMeans the debitin,and crediting of funds by elec-tronic methods' zither thgn by the use of checks.The first banker grotip to develop a noncheck 'pay-ments, systerh was fhe,California Special Committee.on Paperless Entries (SCOPE) formed by the ,Lbs'Angeles and San Francisco Cleating House Associa-tions in 1968. Located' in the Los Angeles and San
, -
Francisco Federal Reserve offices, SCOPE began topshandle funds transfers in 1972:A similar ayments
system began operating in 1-973 arthe At mita Fed-,eral Reserveyank, 'and two nre groups ip NewEngland and 'ft the .Minneapolis-.Saint Pall 'areajoined the system in 1974. Many more areas areconsidering implementing, SCOPE systenis.
Another form of computerized payments systemis the point,of-sale (POS) mechanism located 'in re-1:
-tail establishments and connected to the computers ,
of a bank or Credit card organization. When a saletakes place, the computer debits the customer's
'account and credits the merchant's account- for theamount of the transaction. The POS potential foreventually:replacing checks Obviously is considerable.
The Future. iis During the -next few years the magic word in the
field of banking will be'coniPetition. As thrift insti.-tutions enter new fields of endeavor unrelated tohousing finance, as industrial and retailing corpora-tions venture _in fieldS such as ,insurance, consumerand business financing, rhoitgage-banking, and otherfinancial services; and aS.consumers :become increas-ingly more demanding, competition'for banking cus-torriers-will tend to intensify. ,
The "Financial Institutions Act" under considera-tion in: the Congress would develop. mutual savingsbanks and savings and loan associations into "fullservice" 'institutions, offering customers the sameservices"that r"full service" -commercial banks nowoffer. Based ,upon the recommendations of a specialPresidential commission on financial structure andregulatiOn, the Act would provide.checking -accountand credit card authority for, Mutual savings banksand savings and loan associations, check clearingauthority :similar to that of the Federal ReserveSystem for the Federal Home Loan Bank Board andits members, broader powers for mutual savingsbanks and savings and loan associations in the areaof consumer loans, federal chartering for mutualsavings banks, and liberalization of credit unionpowers.

Commei-cial .Banking, 1967.1974 (selected years)an billions.. of dollars except othecwise noted)
7 .
Percent increase.'
AssetsLoans ... ....... , . . .. .f &vestments-bemand depositsTime. deposits`Employment (000's)*omenjpercent)Establishments
,.,. ,
\
...
19674451 ..2361.124
211184876 4
62,,
13,721
1972'739415.184
297319
1,105fi4
13,940
1967 -7210.412,08.27.1 ,
11.74.9
'1973'
835495t 40310372
1.16265
N,194
Pefcent increase1972-73
13.0'19.3
2.7. ',
4.416.6
5.2
' Compound annual rate of kOwth, _
Source; Board of Governors DI Me Fcderal Reserve System, Bureau of Labor,Statisties,'..:1
Subjects relating to Ornmercial`bankr.will also,-:probably be included in bank legislative proposals-in,the near future. Examplek include the removal o'finterest rate ceilings frou,time and-savings deposits,the granting of interesC qt demand deposits, theexpansion of lending and testment powers in therearestate and community Welfare and development.areas, the introductiOn bf corporate savings adevunts,and certain rediganizational spects of- he Federal..Reserye System, the Federal Deposit In urance Cor-poration, and the Administratkr of National banks.
In the years ahead, some large, nationwide, multi7,unit department stores , that have become service'conglomerates may' establish th4nselves as the chiefcompetitors of 'commercial bankk in the field of con-sumer finance. These retail companies have demOn-strated theft stability and `earnitigs capacity to thefinancial community, and have aefess to large sumsfor financial needs. In, addition, their reputation; iswell established,lhey'are.able to recruit outstandinv--finanCial staff, and are far. less Ogulated: than de-positor); institutions. 1
.
The heightening of competitive ' ;activity will in-tensify even more in the years allead as potentialConsumerism problems catch up' Wjth the banl$ingindustry and as banks become. increasingly orientedtowards societal rather than strictly business relatedactivities.
Some indicatioriof the legislative concern for pro-tecting consumers' rights can be clOrly perceivedfrom recent trends in both Federal and State bank-ing legislation. The passage of the Trnth in LendingAct, the Fair Credit Billing Act, and the Fair Credi'Reporting :Act, the establishm4t of Ithe NationaBUsiness .council for Consumer AffOrs .and. theNational Commission on Consumer Finance, plusa. number of pending bills before Congress, are allindicatiOrm of the fundamental changes that aretaking iplace for the pdpose of siMplifYing financial
t
It
r
1974919549195316432
1.23466
14,961
Percent increas.e1/973-74
I 10.1.10.9
3.21.9
16.1
6.2
proceduis and Of guarding consumers against, un-vo,Ale practices.Atihe State level, several legislatures have passed
consumer protection laWs, ranging from sweepingnew . -..onstt_Mer credit acts to more narrow enact-ments such as a "cooling off'',Period within whicha consumer -tray' cancel 4' hOme solicitation s le.Some States ha4.,legislated in the area of credit i.dt0activity,- have mo4ied the "holder in due course"'-,doctrine, or have enacted consumer-oriented, mort-gage laws covering.sifch areas as cloSing costs, un-fair. escrow practicesr=-and 'services provided by titleinsurance companies.
EDUCATIONAL SERNIICESSignificant gains achieved in education since the -
early 1960'S include a record number .g high schooland college graduates, iinpro,yed school-constructionand educational equipment, incteaSed efforts to adaptcurricula to student needs, and improved teachereducation..;
-During this period; the business community has .
become increasingly involved with the educationalenterprise both as 'suppliers to school Markets andas employers of school graduates'. Traditional teach-ing has been supplemented by Such-deyices as com-puter instructional systems,'closed circuit television,and film strip projections, Prefabricated ."packaged
. classrooms" supplement customary school structuresin some school districts.
With the increasing number of working motners,.business firms have entered the growin eld ofr'early,.childhood education through the estab ishmentof daycate, centers with modern lear'ni'ng and playequipment. Despite , a declining birth date, enroll-,ments in nursery schools tripled from 1964 to 1974,
from 470,000 to 1.6 million and. private, nui-s-,erY school's account for about three-foOriliS'.of all ,,
preschool enrollnients.
23
2-6

Spending on educational services more thantripled during the past 10 years. Despite decliningelementary school ''enrollments since 1970, educa-
, tional expenditures have continued to rise because ofincreased enrollments at the more eimensive-Per-pupil high school and college levels and higher costsfor salaries,, teaching materials, maintenance ,serv-ices ;. and utilities. In the 1974-75 school year, ex-penditures for public and private schools, includingcolleges, were estimated at $110 billion, reflectinga 9.6 percent annual increase over 1970-71 levels.
New Technology Benefits Schools
Ancreasingly, modern technology is being adaptedto school needs. The use of computer techniques tostore student academic and health records is grow-
.ing each year, eliminating needless retesting and re-immunization of students. ,Mobile vans equippedwith technical teaching aids move among countyschools in many, rural areas.
Experimental efforts are underway to determinewhether a satellite can provide a practical means ofdelivering edtkation to students in isolated regions.In the Rocky Mountain States, for example, 4,900junior high school children 'are watching satellite-beamed career education programs each weekdaymorning.
Teachers in eight Rocky Mountain States Ari-zona, Colorado, Idaho, Montana, Nevada, NewMexico. Utah, and Wyoming can now order andreceive any of 460 videotaped programs listed in acatalog for use in classrooms. In about half of the56 participating- schools in this experimental pro-gram, special equipment .provides. a' 2-way audiocapacity by which teachers and students can talkdirectly. via satellite, to the program originators inDenver, Coldado.
Changing Eniollment Patterns ,
- 'Because of the high birth rate_of the1950's andearly 1960'S, enrollments in regular public and pri-vate schools at all grade levels, including college,rose from almost 51 million in 1963 to-59.2 millionin 1970. Between 1970 and 1974, enrollmentsdropped to 58.2 million, reflecting a 2 percent de-cline in elementary school enrollments due to lowerbirth rates in recent years. High school and collegeenrollments continued to riSe, steadily during these 4years,' however, as yesteryear's fast growing schtfolpopulation continued their studies. About II mil-lion persons graduated from high school in 1974;the class-of 1975 is expected to exceed 3.1 million!'
Today, about three fourths of the Nation's young
. people finish. high school and more than half of allhigh school graduata enter a degreecreait programin a college or university. In the early 1960's, onlyabout two-thirds of American youngsters graduatedfrom high school.
Employment
Employment in educational services' is estimatedat about 6 million. RegUlar elementary and second-ary schools 'employ nearly 2.4 million classroomteachers and' -more than 300,000 principals,.super-visors, and other professional staff members. Thenumber of professional staff members in collegesand universities totals about 900,000, of whom620,000 are instructional staff. The remainder arenonprofessional workers employed in school sup-portive occupations.
Teaching staffs of schools and colleges ex andedat a rapid rate' during the mid- and late 19 's inorder to keep pace with burgeoning enroll ents.With the decline in total enrollments since 970,there has been a continuing improvement in thepupil - teacher .ratio in public schools. In the falr of1974, there were about 21.1 pupils per teacher com-pared with 25.1 pupils per, teacher 10 years, earlier.
The largest item in setiqol budgets is teachersalaries. Salary increases in recent years reflect' ef-forts of school systems to keep salaries in pace withthe rising cost, °Hiving. Average annual salary ofclassroorn.)teachers in, public elementary and second-,ary schools was estimated at $11,300 in the 1974-75school year compared with $6,195 in 1964-65. Theaverage salary of full-time faculty members in 4-year colleges and universities has been rising about5122 percent annually in recent years ana was esti-mated at about $15,200 in 1974-75.
Since 1970, the supply of trained teachers seek-ing employment has exceeded the number of 'posi-tions available. Coupled'with the diminished demandfor teachers has been the graduation of, record num-bers of qualified teachers. Also, because of fewerjob opportunities in the past few years, the rate ofteacher loss through turnover has declined too. Atthe start of the 1974 school year, it was estimatedthat many prospective beginning teachers at theelementary and secondary levels were unlikely tolocate teaching positions.
Public Schools Have Money Worries
Although education has consistently been thelargest item in State and local budgets during thepast decade andnoW accounts for 39 cents of everybudget dollar expended, the main crisis confronting
24
2i
public education today is financial. Expenditure perpupil in average daily attendance in the Nation's91,000 public elementary and secondary schoolsmore than doubled during the past decade, risingfrom about $485 in 1964-65 to more than $1,200in 1974-75.
Fina'ncing problems are especially acute in thebig cities. Because of the movement of the affluentto suburbia in recent years and the increasing con-centration of low-income families in urban areas,State legislative efforts continue to find ways tochannel more resources to inner city schools whereneeds are high in relation to the tax base. In April1975, the Department of Health, Education andWelfare proposed regulations for Congressional re-view that would reimburse States for 'the cost ofdeveloping and implementing 'plans for equalizingschool finances transferring money from wealthyschool districts to poor districts.
rreRising costs in o er communities have resultedin austerity progra s cafeteria closings, curtail-,merit of music and art programs in elementaryschools, elimination of- summer school enrichment.programs, and cutbacks in aintenance services.It
,,,The 1973/74 energy crisis a 'd subsequent higherprices for heating fuel and electricity brought fur-ther money problems to school administrators. Avariety of approaches have been used in the Na-tion's schools to conserve energy,- including longerwinter vacations in schools located in cold climates,reduction in. the required number of school dip perschool year in some Stales, a:4-clay School Weal, andless frequent field trips.
Also plagued by rising-costs and resultant financialproblems, many private elementary and secondaryschools have closed in recent years. From/1964 to1974, private school enrollments declined from 15to 10 percent of, all elementary school enrollments.
Changing Role of Colleges
During the past 10 years, the Nation's collegeshave changed from being exclusive institutions toservicing a large portion of the population. With therapid growth of 2-year colleges, work/study collegeprograms, and off-campus course offerings in urbanareas, there has been a major trend toward decen-tralization of higher education. Increasingly, adjunctprofessors from the professional community offerpost-secondary or college level courses in such sub-jects as banking, computer programming, and film
king: /With part-time students out-numbering full-time students this past year, college learning oppor-
25
tunities have been extended to increasing numbersof Americans.
The proportion of women mid older persons in thecollege population has been increasing significantlyin the past few years. Continuing a long-term trend,women accounted for 44 percent of 1974 collegeenrollments. Since 1970, the number of 18 to 24Year old college students increased 9 percent whileenrollments of persons 25 to 34 years of age in-creased 63 percent. Furthermore, enrollments ofpersons 35 years and older mostly part-timestudents rose 30 percent to one million from1972 to 1974.
Rapid Growth of 2-Year CollegesAt the start of the 1974-75 school year,, degree-
credit college enrollments totaled 8.5 million, almostdouble the number of such enrollments in 1963.Higher education expenditureS were estimated at$39.5 billion for the year, twice the level of spend-ing than 7 years. earlier.
Two-year colleges accounted for nearly three-fifths of the 500 new colleges established during the1960's and enrollments in these colleges more thantripled during the decade. While the overall growthof degree-credit college enrollments has slowedsince 1970, enrollments in community and juniorcolleges mostly commuter colleges with low tui-tion fees continued to rise rapidly.
Two-year colleges generally offer both academictransfer programs and associate degree programs ina variety of technical and semi-professional fieldssuc as law enforcement, fire science, food servicemanagement, data precessing, and practical nursing.
Empty Spaces in 4-Year CollegesEmpty student spaces in 4-year colleges are in,
creasing, mostly in high-tuition private colleges butalso in State-supported schools. Applications for .freshman places in baccalaureate programs in col-leges and universities across the country have beendeclining since 1970, intensifying financial, p'rob-lems for colleges. With faculty positions already filledand the need to maintain facilities, student vacancieshave resulted in higher costs per pupil. Contribut-ing to declining applications in the past few yearswere changes in the draft law that exempted collegestudents, the high cost of a traditional 4=year collegeeducation, and the weak job market for ' recentcollege graduates.
Future DirectionsToday's seventh graders will be among those en-
tering the teaching profesSion in the mid-1980's,knowledgeable about environmental problems,
v.1
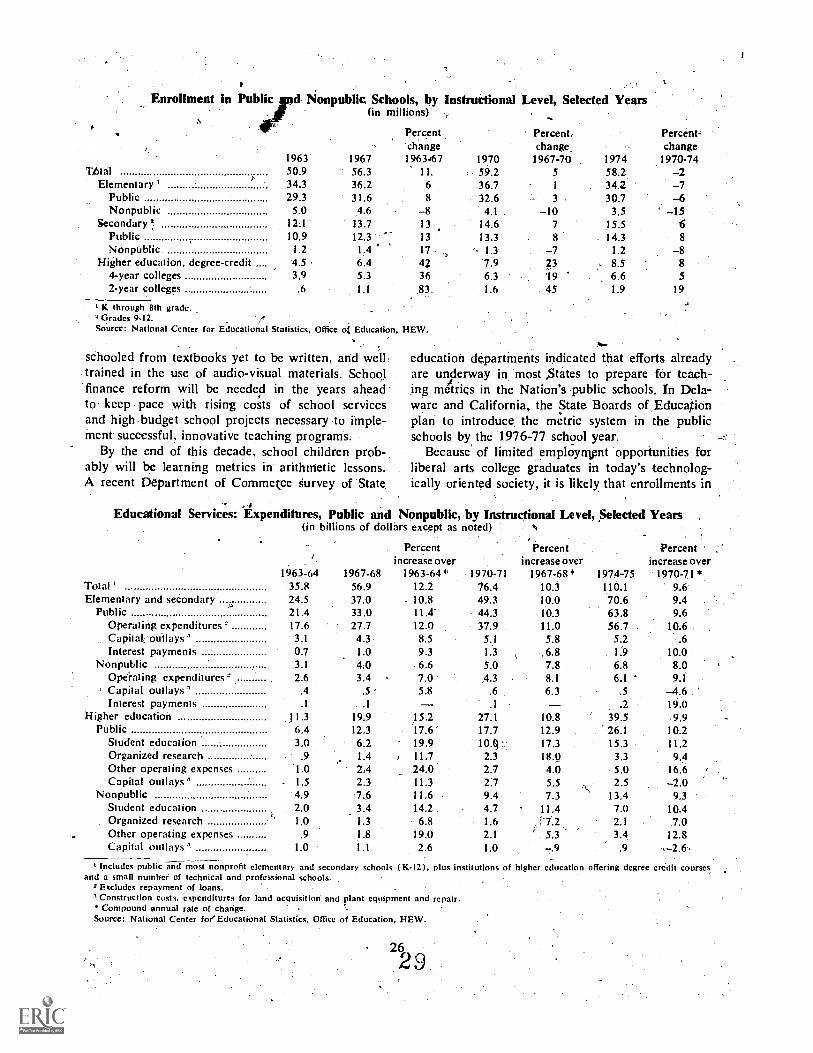
Enrollment in Public d Nonpublic Schools, by Instructional Level, Selected Years(in millions)
Percentchange
Percent,change.
Percent,,change
1963 1967 1963467 1970 1967-70 1974Ibtal 50.9 56.3 11. 59.2 5 58.2
.1970-74-2
Elementary' 34.3 36.2 6 36.7 1 34.2 -7Public 29.3 31.6 8 32.6 3 30.7 -6Nonpublic 5.0 4.6 -8 4.1 -10 3.5 -15
Secondary' 12.1- 13.7 13 14.6 7 15.5 6Public 10.9 12.3 13 13.3 8 14.3 8
Nonpublic 1.2 1.4 17 1.3 -7 1.2 -8Higher education, degree-credit 4.5 6.4 42 7.9 23 8.5 8
4-year colleges 3.9 5.3 36 6.3 9 6.6 52-year colleges .6 1.1 83 1.6 45 1.9 19
K through 8th grade.3 Grades 9-12. 4
Source: National Center for Educational Statistics, Office of Education, NEW.
schooled from textbooks yet to be written, and welltrained in the use of audio-visual materials. Schoolfinance reform will be needed in the years aheadto keep pace with rising costs of school servicesand high budget school projects necessary to imple-ment successful, innovative teaching programs.
By the end of this decade, school children prob-ably will be learning metrics in arithmetic lessons.A recent Department of Commece Survey of State
Educational
education departments indicated that efforts alreadyare un'erway in most States to prepare for teach-ing metrics in the Nation's public schools. In Dela-ware and California, the State Boards of Educationplan to introduce the metric system in the publicschools by the 1976-77 school year.
Because of limited employtrient opportunities forliberal arts college graduates in today's technolog-ically oriented society, it is likely that enrollments in
Services: Expenditures, Public and Nonpublic, by Instructional Level, Selected Years(in billions of dollars except as noted) )
1963-64 1967-68
Percentincrease over
1963 -64* 1970-71
Percentincrease over
1967-68* 1974-75
Percentincrease over
1970 -71 *Total' 35.8 56.9 12.2 76.4 10.3 110.1 9.6Elementary and secondary
...24.5 37.0 10.8 49.3 10.0 70.6 9.4
Public 2t.4 33.0 11.4- 44.3 10.3 63.8 9.6Operating expenditures' 17.6 27.7 12.0 37.9 11.0 56.7 10.6Capitak outlays' 3.1 4.3 8.5 5.t 5.8 5.2 .6Interest payments 0.7 1.0 9.3 1.3 .6.8 1.9 10.0
Nonpublic 3.1. 4.0 6.6 5.0 7.8 6.8 8.0Operating expenditures' 2.6 3.4 7.0' 4.3 8.1 6.1 9.1Capital outlays' .4 .5 5.8 .6 6.3 .5 -4.6Interest payments .1 .1 -- .1 .2 19.0
Higher education 11.3 19.9 15.2 27.t 10.8 39.5 9.9Public 6.4 12.3 17.6 17.7 12.9 26.1 10.2
Student education 3.0 6.2 19.9 10.0 17.3 15.3 11.2Organized research .9 1.4 . 11.7 2.3 18.0 3.3 9.4Other operating expenses 1.0 2.4 24.0 2.7 4.0 5.0 16.6Capital outlays' 1.5 2.3 11.3 2:7 5.5 2.5 -2.0
Nonpublic 4.9 7.6 11.6 9.4 7.3 13.4 9.3Student education 2.0 3.4 14.2 4.7 11.4 7.0 10.4Organized research 1.0 1.3 6.8 1.6 7.2 2.1 7.0Other operating expenses .9 1.8 19.0 2.1 5.3 3.4 12.8Capital outlays' 1.0 1.1 2.6 1.0 -.9 .9
Includes public and most nonprofit elementary and secondary schools (K-12), plus institutions of higher education offering degree credit coursesand a small number of technical and professional schools.
Excludes repayment of loans.Construction costs. expenditures for land acquisition and plant equipment and repair.Compound annual rate of change.
Source: National Ccntcr foe Educational Statistics, Office of Education, HEW.
26r
29
.
career-oriented courses in both 2-year and 4-year'icolleges will continue to rise in the next severalyears. In. addition, many of the Natrdn's collegeshave introduced 3-year bachelor's programs whichhelp to reduce the cost of education fore studentsand c911els. With many of ,today's college-boundstudents having studied college level material in highschool, the 3-year curriculum can shorten the school-ing period for those planning graduate studies and,at the same time, ease the colleges' financial burdenof providing additional facilities to accommodatesteadily rising enrollments.
HEALTH AND MEDICAL SERVICESThe dramatic growth of the health services indus-
try since the mid- 1960's reflects the Nation's popu-lation growth, increased longevity, rising prices perunit of service, and rapid advances in medicAlknowledge and capabilities. In addition, rising levelsof income and education have .contribdted to increased consumer demand for more and improvedmedical care which is largely financed through priyaw and government health insurance plans.
Estimated health and medical service spending in1974 topped $110 billion, 11 percent above 1973levels 'and.almost three times the level of Spending
11965, the year 'before the Medicare/Medicaidprograms were implemented. In terms of .gross na-tional product, health expenditures increased from5.9 percent in 1965 to 7.7 percent since ,.1972.
The Nation's expanding health care industry hasprovided a growing market for manufacturers ofhealth related products and suppliers of health re.:lated services. A large share of the" medical dollaris spent on such manufactured goods as furnitureSand linens for hospitals and nursing homes, closedcircuit television for training health workers, com-puters Which speed hospital recordkeeping and suchbiomedical equipment as kidney dialysis units, radio-graphs, and iautomated Analyzers for blood tests.Caterers rroYide-food service to many hosphAis and"meals-on-wheels" to the elderly in some communi-ties. Cleaning and maintenance companies contracttheir services to hospitals and nursing hOrnes-: In-creasingly. business firms are providing capital andmanagement expertise through acquisition and op-eration of nursing homes and other health facilities.
A Unique Industry,
Unlike other service industries, dccisions to pur-chase various types of medical services generally arenot made by the consumer but are determined by
27
ph3isiciaps who prescribe medicine, order clinicallaboratory tests and X-rays, instruct, patients on, fur-ther office visits, and may suggest hospitalization.Thus, the physician is both a pr'ovider of medical.`care and an advisor on how much medical care'should be purchased. Furthermore, medical servicesare distributed on the basis.-of need rather than theability to pay and a large portion of payments aremade by third parties. Thus, hospital care, the mostcostly sector of the health services industry, is' pio-vided by one set of institutions while payment forthese services is made through another set of in-stitutions.
Following, the enactment of Medicare/Medica'id.legislation in 1965, the sudden addition of billionsof dollars worth of pill-chasing power to the limitedresources ,of the health services industry pushedprices up and, at the same time, provided funds fortechnological advances in medical care. By fiscal,1974, Medicare/Medicaid outlays reached $22:5billion, more than 20 percent over a year earlier andalmost twice the level of public sector spending forhealth care in 1967.
The introduction of new and expensive treatmentprocedures. to improve health care services. hastended to increase rather than reduce staff require-ment in hospitals. Technical staff and additionalnurses re essential to help operate, such complexelectron' devices as physiological monitoring equip-ment an electronic flowmeters that regulate theflow of blood during heart-lung operations. In con-trast, technological advances which increase outputof manufacturing industries usually result in reducedmanpower needs.
Impact of Third-Party Payments
Third-party payments now account for the bulkof medical care outlays since third partieS together
government, private health insurance companies,philanthropy, and Industry -- finance almost two-thirds of the Nation's personal health bill. More than90 percent of hospital bills and about 60 percent ofphysician fees are now paid by private health in-surers or from public funds.
Nearly all or the public financing of medicalspending since 1967 the first full year of Medi-care and Medicaid programs has been to payhospital, physician, and nursing home bills for theelderly. During these years, private health insurancecoverage also increased rapidly. Last year, somefour -fifths of the population under 65 years of agewere enrolled in varying private insurance planscovering hospital care and almost three-fourths were
3 0
enrolled in insurance programs which met some ofthe colts of surgical-serviccs. By 1974, third partieswere paying an estimated 65 'percent of the totalhealth bill, with the government share at 38 percentand Private health insurance, 26 percent. In '1960,third-party payments accounted for about 45 percentof personal health care spending.
Cutting Medicare/Medicaid Costs
In 'recent years, there has beef .a marked trendtoward tighter_ government regulation of publicly.financed medical programs. Implementing the 1972amendments to the Social Security Act, the Depart-ment of Health, Education and Welfare (HEW) isdeveloping a network of physician-dominated pro-fessional standards review organizations (PSRO's)to monitor the cost, and qualh of medical careunder Federally financed programs. Stringent audit-
- ing by medical review professionals is expected toeliminate unnecessarily lengthy hospital stays, need-less injeCtions, and other uneconomical procedures,and result in significant dollar savings in Medicare/Medicaid expenditures.
In addition, HEW is now implementing the healthPlanning regulation legislation (S. 2994) enacted inearly 1975 which provides for establishment of anational network of health planning agencies respon-sible for developing shortand long-term healthplans tailored to the health needs of particular areas,'The agencies will make recommendations on con-struction of new health facilities and determine howFederal resources authorized under the Public HealthService Act are used in their jurisdiction.
Other efforts to cut costs and increase efficiencyin health services delivery include the availabilityof Federal funds to support establishment of healthmaintenance organizations (HMO's) which provideenrollees, including some Medicare/Medicaid recip-ients: with comprehensive medical services for afixed fee and reimbursement limits for prescriptiondrugs for Medicare and Medicaid patients to the"lowest cost at which a drug is generally available."
Hospital Costs Continue Up
Public concern about rising health care costs hasfocused on hospitals the largest single medicalservices expenditure segment. From 1965 to 1974,spending on hospital care increased at an annual.rate of 13.8 'percent, reaching an estimated $43.5billion last year.,While hospital admissions have beenrising steadily since 1966, the average length of ahospital stay declined from a high of 8.1 days in1968 and 1969 to 7.4 days in 1974.
a
Despite shorter hospital stays, hospital expensesper patient day continue to. rise rapidly, reflectingexpensive diagnostic tests generally administered inthe first 2 days of a hospital stay, as well as arsharpincrease in such nonpayroll expenses as rent, inter-est, equipment, and utilities. Also, because of ashortage of family phnicians in many areas, hospitalemergency rooms increasingly are serving as generalhealth facilities. Between June 1970 and,June 1974,there was a 35 percent increase in patient visits toemergency rooms nationwide compared with onlyan 11 percent increase in hospital admissions. Asemergency tom activity has increased, communityhospitals have begun staffing emergency departmentswith full time', salaried physicians. Nationally, totalexpense per adjusted patient day in community hos-pitals was -$118 in 1974, up from $105 in 1973 and$78 in, 1970.
In early 1975, decreasing hospital occupancy ratesfurther boosted hospital expenses. Routine costs donot decline appreciably because an unoccupied bedcosts two-thirds as much to maintain as an occu-pied one. Among the factors accounting for emptyhospital beds are lower utilization rates in maternitydepartments because of declining birth rates andpostponed elective surgery because of lapsed healthinsurance policies ok laid-off workers. Furtherm'ore,inoarne cities, hospitals and welfare authorlties arecoping with unexpected costs of the sick but /med-ically indigent unemployed.
Shared Services Reduce Costs
The hospital industry is making a concerted effortto reduce costs through shared services which lowercapital outlays, eliminate duplicate facilities, andbetter utilize personnel and facilities. According toan American. Hospital Association survey, abouttwo-thirds of the 4,725 responding hospitals re-ported instances of services sharing. The five mostfrequently shared services were blood banks, pur-chase of medical/surgical supplies, data processing,disaster plans, and laboratory professional staff. Inaddition, such administrative services as ambulance,food service, housekeeping, laundry, medical library,and motor pools frequently are. shared.
Medical Prices Rose Sharply in 1974
From 1965 to 1971, medical care service pricesincreased at an annual rate of 7.3 percent whileprices for goods and services rose at an annual rateof 4.2 percent. A .slower 'rise in medical care pricesfrom late 1971 to early 1974 because of the. Eco-nomic Stabilization program was followed by steep
28
3i

`increases . prices during 19:74 after wage-price .c, .
controls ended. Consumer prices for medical careservices rose 12.4 percent last year compared with5.2 percent a year earlier. Similarly, hospital chargesrose 14.2 percent in 19'14 compared with only 4.3percent in 1973.
Nursing Home. Care '
Increased Igingevity due to advances in medicalknowledge and changing social and family attitudes,together with the availability of Medicaid anc_Medi-care funds for nursing home care, have resulted in atremendous -expansion, of nursing hinme facilitiesduring the past decade. Today, there are about23,b00 nursing honies with about 1.2 million beds.Expenditures on nursing home care totaled an esti-mated $8 billion in 1974 compared with$4.3 billionin 1970 and only $1.3 billion in 1965. -Althoughaboullikwo-thirds of nursing home revenues ,comefrom public funds, most nursing homes are privatelyowned franchise or ch\ain operations, leasing arrangements, or independent enterprises.
Because nursing homes are required to meetvarying standards established under Medicare andMedicaid programs in order to qualify for reim-bursement, facilities may be divided into three cats-gories. Medicare-qualified homd are classified asextended-care facilities, (ECF) and provide 24-hournursing services and medical supervision as an ex-tension of hospital care. Medicaid;qualified homesinclude intermediate care facilities for people whoneed some nursing supervision in addition to per-sonal care assistance. Skilled nursing homes provideround-the-clock nursing services for residents sickenough to require them. Nursing hoines may becertified in one, two, or all three categories.
Growing Health Worker Needs
Growing needs for all types of health serviceworkers have accompanied the tremendous expansionof the medical services industry during recebt years.From 1960 to 1970, health services employmentrose from -2.8 million to 4.6 million. In 1974, em-ployment reached an esfimated,5.5, million. About60 percent of the- persons employed in_healtb.care.occupations work in hospitals.
Large numbers of trained supportive staff healthworkers have been required to keep pace withdevelopments in -medical tecfinology and advancesin patient care. New allied health ()cell- pations in-clude physician assistants, nurse practitioners, intra-venous' technicians; physician therWassistants, in-
halation therapy assistants, biomedical technicians,and 'medical transcriptionists.
All types of nurses registered nurses, licensedpractical nurses, and nurse aides continue in greatdemand in hospitals, nursing !comes, and healthmaintenance organizations as well as in physicians'offices. Although the number of physicians in theUnited States continues to increase each year, height-ened demand for medical services, coupled with in-creasing specialization, has resulted in shortages offamily physicians, especially in rural areas. Several .-medical schools have undertaken programs whichenable persons holding doctoral degrees. in the bin*logical, physical, or engineering sciences'to becotheM.D.'s or dentists with shorter periods of trainingthan are normally required.
29
Computer-aided Patient Management
In the past few years, the use of computers forscheduling hospital admissions and recordkeepinghas become widespread. Increased' use of computertechnology has eliminated many hospital 'clericaltasks and is widely used to automate clinical labora-tory tests and to assist in diagnosis procedurei. Mul-tiphasic screening centers can process 30,000 pa-tients a year on an a -hour day and double that num-ber on a 16-hour day. Through the screeningthe physician ca, obtain an important clinical profileof a patient.
In some areas, computerized systems -have beendeveloped to provide a single expert physician withpatient information necessary to make therapeuticdecisions at distant lncations. F6r example, the Com-munity Electrocardibgraphic Interpretive Service inDenver, Colorado, services 20 hospital 4-Statearea. The -Denver Center 'can process an electro-cardiogram and transmit its analysis to the attendingphysician or nurse at a remote hospital within 6minutes.
Future Directions
The volume of health care spending in the nextseveral years will be partly influenced by the growthand success of health maintenance organizations thatemphasize preventive medicine practice and tend toeliminate costly, fragmented medical services. Also,mediCal .costs may be reduced through increasedsurveillance of publicly financed medical care pro-grams; improved health facilities construction plan-ning; expansion of multiphasic ,screening centers;the training of 'additional physicians, nurses, and

Health and Medical Services Industrybillions of d011ars except as noted)-r Percent -
increase1960 1965 1960-654
Total 26,895 40,468 8.5
Health services and supplies 25,185 37,087 8.0
Hospital care 9,092 13,605 8.2
Physicians' services .5,684 8,745 8.9
Dentists' services 1,977 2,808 7.3
Other.professional services 862 1,038 '3.8Drugs and drug suncVes' 3,657 4,850 5.8
EYeglasses and appliances 776 (,230 9.7Nursing hdme care' 526 1,328 20.0Expenses for prepayment and i?)
. administration 861 1.293 8.4
Government health activities - 414 698 11.0Other health services 1,336 1,492 2.2
Research and medical facilities,construction 1,710 3,3[---- 14.5
Research' 662 4,469\ 17.3Construction 1,048 1,912 12.8
Medical care services-COnsumerprice index (1967=100)
Personal health care74.9
.
87.3.---t
expenditures' 23,680 34,821 8.0Rrivate direct payments 12,990; 18.053 6.8Private insurance benefits 4,996 8,729' 11.8Public funds 5,157 7,342 7:3
Compound annual rate of growth.I Estimated by BDC.
197072,96267,74827,44414,3064,7501,462
-7,4091,7874,333
2,111.1.5682,578
5,2141,8483,366I4.2
3,65225,13715,74421,840
,...Egrcent/ increase
1965-70 1973
Percent 4increase1970-73 19741
Percentincrease1973-74
1,2.5 99,069 10.7 110,400 11.412.8 92,327 10.9 103,175 11.715.0 38,270 11.7 43,465 13.5
p0.4 ' 18,200 8.4 19,895 9.311.1 5,970 7.9 ,46,475 8.5
7.1 -1,900 9.1 2,055 8.28.8 9)00 7.9 10,140 .9.0-7.7 2,()91 5.4 2,270 8.5
26.0 7,050. 17.6 . 8,035, 14.0
10.3 3,998 24,0 4,520 13.017.5 1,905 ,6.7 2,3855 25.211.5 3,643 ° 12.2 3,935 8.0
9.1 6,742 9.0 7,225 7.24.7 2,484 7.7 2,735 10.1
12.0" 4,258 8.1 4,490 5.4
144.3 162.2
12.7 85,894 10.5 - _. 6.8 31,243 7.5 -12.5 21,614 11.1 -24.0 31,859 1 13.4
Research expenditures of drug companies included in drugs and 'drug sundries and excluded from research expendittires.3 T4 definition of nursing homecare has been changed to include all facilities that provide some level of nursing care. Revisions have been made
for all years.Includes hospital care, physicians' and dentists' services. drags, other professional' services, nursing homes, care, eyeglasses, appliances, etc.Includes OED health activities which have been transferred to the Department of Health, Education and Welfare.
,
other health personnel; and possible research -break-throughs to .treat costly .chronic illnesses. Further-More, home-delivered health and medical servicesare now being increasingly recognized as an alterna-tive, less expensive way to offer care to the elderlysick wlio do not require continuous institutional nurs-ing care. In some areas, community home healthcare programs providing such services as visitingnurses, physical therapy. medicines, and "meals-on-wheels" have reduced hospital stays and cut costs topatients' and third-party payers.
Legislators, chambers of commerce, labor unions,hospital and health insurance executives, physiciansand public health officials, and consumers continueto work together to seek new ways to finance anddeliver quality medical care to all Americans. Expe-rience with Medicare and Medicaid has shown thata mechanism that simply pays bills is not the an-swer to a problem calling for better systems ofdelivery. Health care proposals now before Congresswould. generally provide greater health benefits butdiffer with regard to payment mechanism and extentof coverage.
a
HOTELS AND MOTELSThe lodging industry has demonstrated steady
growth over the past decade. Lodging industry re-ceipts and payroll more than doubled between 1963and ,1972 and receipts totaled an estimated $10.1billion by 1974 The sharp decline in the numberof hotels and the -modest increase in the, numberof motels and motor hotels during these years re-flects the growing trend toward larger motels andmotor hotels, developed mostly by franchise orga-nizations. In 1972, motor hotels accounted for lessthan 10 percent of all motels and motor hotels butfor about one-fourth of all receipts.
During the 1960's, rising personal income andincreased leisure .time resulted in a highly mobile
(population. For example, the number of 'persontrips on Which at least one night was spent awayfrom home rose to 458 million in 1972 from 361million in 1967. Busirres'smen continue to be major4users of commercial lodging facilities but their sharehas been declining because of increased pleasuretravel as well as the greater use of air transpo?tationfor one-day trips without overnight stays.
30
33

/7 Most of .the grow*th in the 'lodging 1ndu'stiy inrecent years has been through franchise chains. Pro-motional marketing techniques of franchisors, to-gether with chain-wide reservations systems, pro-.vidid expanding markets for franchisoed hotels andmotels since the early 1960's.
Lodging Market Segmented
The lodging market is really *a number of markets,including sports enthusiasts, sightseers, luxury seek-ers, commercial travelers, vacationing families, andbudget-conscious 'travelers. All have definite re=quirements and. no one facility can successfullycater to all types of guests. Hotel and motel man-agers generally key their accommodations to meetthe needs of closely defined market segments ratherthan attempting to appeal to broad markets. Thosewith adequate facilities for hosting conventions workclosely with business groups to find ways of attract-ing conventions to their cities. Because of the "newmoney" introduced into the local ,economy by out-of-town guests, the community benefits as well asthe convention hotel. A large number of loclgibgfacilities augment_ restaurant sales by drawing heavilyfrom the local population.
The position of chains and franchise groups whichexpanded significantly during the past decade re-mains. strong The economy motel is playing anincreasing role during the current economic slow-down, catering particularly to transient familiestraveling on lirnited budgets.
Impact of Energy Crisis
During the early months of 1974, the energycrisis caused severe dislocations in the lodging in-dustry: With gasoline stations closed -during the-weekends of the 1973-74 winter, months, occupancy,rates at some motels along interstate routes and inwinter resort arcas declined sharply.. Since then, thehigher cost of gasoline, together with shorter gaso-line station hours, continued to have a restrainingeffect on long automobile trips and' motel occupancy
Domestic- Travel '
1967 1972Ntimher of person trips (00(1) 36).2 458.5Number of perspn nights (millions) 1.579.9 1,781.9Number of person nights in
commercial lodgings (millions) 489.8 ,60615Numhelufrersori miles (hilligns) 311.8 369.6
'Includes travel by all modes. of transportation automobile.- train.bus. airplane. etc.,
Sourr National Survey of Travel. CenstWof Transportation,Bureauof the Census.
4,rates. In some parts of the country, decreased tourist-traffic or excessive capacity due to overbuilding haveresulted in extreme price competition. In contrast,hotels in down wri areas and resort hotels within
:a 4- or 5-hour dive of large population centers haveenjoyed improved occupancy. Also, many resorthotels were filled to capacity during vacation seasonsin 1974 is va*itioners sought nearby accommoda-tions in lieu or traveling, abroad.
Employment
Employment in the lodging industry rose modestlyduring recent years, reflecting the fast growth ofmotels and motor hotels which generally .furnishfewer services for guests than do hotels. In addi-tion, many: large city hotels, have reduced the levelof services rendered- because of lowered occupancyrates and rising labor costs.
Except for a few occupations, lodging industryworkers are usually of highly skilled. Chamber-Maids, housemen, ,,. cleaning staff, who constitutethe bulk of the .,:rkforce, are usually trained onthe job. Electricians and other maintenance techni-cians may either learn skills on the job or throughapprenticeship programs.,Increasinglx, skills of cleri,.cal workers are being ,upgraded because computersare being installed in increasing numbe'rs to handlereservations and bookkeeping chores.
Future Directions
Future trends in e hotel-motel industry will beinfluenced by mans/ act s. Though the gasolineshortage has eased in pfst year, increased pricesfor fuel and the general economic slowdown willadversely affect long highway travel.
The recent trend towards budget chains and fran -.chising operations will probably continue strong withthe independent owner/operator having .a smallershare of the market inthe years ahead. The traveleris less likely to be making his own reservations, pre-ferring to have some type of referral or reservationassociation service. The use of computers in thereservation, area will continue to grow.
To attract new customers, hotels and motels willbe trying such new marketing devices as discountrates for senior citizens as well as children. Thismove, coupled with an increased push to capture the'fast-growing group travel tours, should help boostoccupancy rates, in the future.
The move of many motels to include restaurantfacilities will continue in an effort to strengthen theirsurvival capabilities in times of reduced' travel. Inmany areas, these restaurants have become favorite
31
3 St

Hotels and Motels(in millions of dollars except as noted)
1963 .1967Percent increase
1963-67* 1972Percent increase
1967-72* 1974'Percent increase
1972-74*Hotels
Number of establishments 22,692 23,625 13,989Receipts 3,005.7 3,823.2 6.2 4,794.3 4.6 5,274.0 4.9Payroll 1,035.1 1,272.0 5.8 1,601:8 4.7Paid empipyees ' (000) N.A. 378.0 -- 347.0
Motels, moor hotels, andtourist courts
,XNumber of establishments 41,584 41,954 44,699Receipts 1,661.4 2,709.6 13.0 5,293:5 14.3 5,823.0 2.9Payroll 337.9 622.6 16.5 1,275.9 15.4Paid employees' (000) N.A. 222.6 , 3644Compound annual rate of growth.Estimated by BDC,
2 For one week including March 12.N.A Not available. "
Source: Bureausaf the Census and BDC.
eating spots of local residents and serve to offset
P.
reduced highway traffic.pected to continue expsurrounding major cities imen visiting industrial par
tels are generally ex-in . suburban areas
r to attract busine0-s growing in these areas.
,. LIFE INSURANCEAlthough the primary function of life insurance
is tO provide financial protection for families ofdeceased policyholders, other uses have evolved inrecent years to provide cWsh for payment, of,estate taxes and debts of the deceased, to compen-sate a corporation for the death of (key executive,and to proviae retirement income for- the policy-holder. Increasingly, fatly heads rely on th6 grow-ing convertible cash valbe of most ordinary, lifeinsurance policies to supplement, their Social Se-curity and private pension paynoAlts..
In early 1974, some 145 million persdns twoout of every three peopie in the country'- - wereinsured b some type of life insurance polidy. Lifeinsurance% force soared frOrn $q98 billion in 1964to nearly $2 trillion, in 1974, raectIng an l'hnualincrease of 9.5 percent. During,these years, life in-surance purchases more than doubled, ffom $105billiod to $268 billion, and premium receipts ad-vanced' from almost $23 billion to almost $53 bil-
lion. At the same time,' life insurance 'companyassets grew from $149 billion to more than $263billion. .
Policy Mix Changing'
From 1964 to 1974, group life insurancemostly -covering employer-employee groups 'en-larged its share of all.life insurance i -farce from
32
32 percent to 42.percent. Group life insurance inforce reached $828 billion last year. In contrast;total ordinary life insurance valued at $1 trillion in1974, accounted for 51 percent of all life insurancein force, down from 57 percent 10 years earlier.Many group life plans provide coverage on the liVes .of dependents of members as well as coverage inreduced amounts for retirees. Some plans includeprovisions for annunities to survivors.
Life Insurance PensiOn Plans GrowThe number of Americans enrolled in pension
plans with life 'nsurance companies in early 1974totaled 13.6 ml lion. Inclusled were retirees already'receiving pension benefits, those who had ,left theirjobs with vested pension benefits, and those stillemployed and accumulating pension credits. Thenumber of .persons covered by private retirementplans with life insurance companies, as a percentageof all persons enrolled in, all types of private plans,increased from about 23 percent in 1963 to abou33 percent in 1974.-71he recently enacted FederalPension Reform Act probably will boost the life in-surance -share of to retirement plans, further.The rising impor e .f individual pensions hasspurred a numbe of co panies to review the mar-ket potential of these pr. Jams with a view to ex-panding services and pr.fits. One large ,firto hascreated a separate- individual pension trust depart-ment. a
, .Mutual Life Companies Dominate
Although more than 90 percent of the more than1,800 insurance companies (required by State legis-lation to maintain minimum cash reserves) are ownedby Stockholders, fewer than 200 large mutual life
companieS account for more th6n half of all lifeinsurance in force and own about two-thirds of all.life. company assets. Companies are located in everyState, ranging from one in Alaska.to 399_in Arizona.However, companies based in New York, NeyvJersey, and Connecticut account for the greatestproportion of life insurance in force.
Employment Rising Steadily '.
Life insurance employment climbed steadily be-tween 1 7 and-073, from 740,04)0 to an estimated888,30 ; about one-third were sales personnel --chiefly agopts, brokers, and others who sell policiesto individuals and business firms, Over half .of 'pitlifr'insurance company employees work in clericaland related. jobs, maintaining records and handlingservices including benefits paid to polityholders.Because of increased efficiency. in Tecordketping re-sulting from the introduction of computers, employ7,ment has increased at a far slower rate than sales inrecent years. 1
Investment Earnings Add to Income > , .
Premium, receipts account for about three-fourthsof the annual income of life insurance companies!Because 5 pdrtion of each premium is available forinvestment in the Nation's economy, a significantshare of income about 20 percent 'is derivedfrom such investments as bonds, notes, governmentdebentures, stocks: mortgages, real estate, policyloans,and short-term debt issues. Rising investmentearnings help to cut the cost of life insurance topolicyholders and the average policy cost has de-
., creased significantly in recent years despite inffh-.,tionary pressures. According to industry sources, theaverage premium payment for each $1,000 of life'insurance in force decreased from $26.90 -in theearly 1950's to $14.70 by 1970.
Life insurance companies were the source of$15.4 billion to money and capital markets i%1974,according to the American Life Insurance Associa-
I, tion. Corporate bond investments and nonresidenti'almortgage loans each accounted or a $5.2 billionincrease in life company portfo os. However, net
_purchases of corporate stock declined'to $2.1 billionin 1974 from $3.6 billion in 1973.
Outstanding policy .loans increased during 1974by an estimated $2.7 billion, surpassing the previousrecord high or $2.5 billion in p1969. Total value ofpolicy loan's in 1974 was $22.9.4billidn: about 8.7percent Of all assets of U.S. life insurance companies.In 1964. policy loans accounted for less than 5percent` of total assets. In all but 2 of the past 10
years, policy loan gniwth outpaced the growth intotal assets. The unusually high interest rates avail-able on market investments in 1974 were an inducementLto pokeyof their life insurates set in Seir p
olders to borrow on the cash valuescc policies of the relatively low1icips.
Industry Activf in Pit tc InterestDuriag recent years, the life insurance industry
has made contributions to the public interest in ways"'beyond its traditional services. For example, the in?dustry initiated a $2 'billion Urban Investment Pro-gram which financed new housing projeAs and job-
.creating businesSes or community enterprises forcentrak-city residents. An outgrowth of this activitywas the formation of the Committee on CorporateSocial Responsibility, to further the industry's ip-volvement in such areas as health, environment, andcommunity development and a Committee Oil COn-sumer Affairs. Furthermore, the Life InsuranceMedical Research Fund, in ekistence for many years,has awarded millions of dollars in research grantsto institutions and-,to medical students working inheart research.
Consumer Attitudes Changing.Results of a 1974( life insurance industry survey
of consumer attitudes toward life insurance showedthat about 7 out of 10 people surveyed thought thatthe insurance agent is influenced primarily, by thesize Of the sales commission rather than the custo-mer's needs. About 42 percent of the respondentspreferred to purchase insurance from a bank orother financial service institution than from an in-surance agent, up from 31 percent in 1971. Al-though most respondents considered life insurance,,anecessity, 4 out of 10 had misgivings about whethertheir purchased policies were the best they couldhave for the money.
Another problem confronting the life insuranceindustry is the steadily rising rate of "dropouts" orlapsed policies. According to a recent Senate Sub-committee study' of 60 leading life insurance com-panics, nearly one-fourth of whole life policyholdersdiscontinue their policies within the first year of mu-
-chase and .46 percent allow their -policies to, lapse-MTh-in 10 years. Only about one-third of all policy-holders keep their 'policies into old age. ,
Future DirectionsIn the next several years, life insurance companies
will continue to introduce new kinds of policies toaccommodate changing consumer needs. Some firmsalready have announced a new, lbw-cost, "non-
33
36

smoker" discount :policy, charging lower premiumsto abstainers.' Another innovative type of policy, offers lower premium rates to 'women because of theirgreater longevity. One life company recently an-nounced a nNt policy series that includes a specialterm contract, renewable annually:115r 7 years, which,provides for a 20 percent discount on the first year'spremium if the premium is paid at the time: of appli-cation. Two general areaS of great p ntial for lifeinsurance companies are health and spitalizationpolicies and insured persion' irogr s for bothgroups and individuals.?
Policy loan demand, registering a pronounced up-surge during the past 2 years, is leveling off now.However, this situation has prompted at least threelarge mutual life companies to raise interest rates onpolicy 'loans from the 6 percent level' to a maximumof 8 percent where State law permits: This action isbound to, trigger similar action 'by other lifepanies. Raising the policy loan interest rate is ex-pected to' lessen future policy loan demand, to im-prove investment earnings, and to benefit policy-holders with higher dividends or lower premiumcharges.
Because of the life insurance industry's concernwith continuing inflation and problems of financingcapital formation, the American Life Insurance As-
.
sociation is sponsoring two special research projects,One project will examine the impact of double,digitinflation on financial markets and various forms ofsayings, including life insurance, as well as the con-.sequences of redistribution of real income amongvarious sectors of the population. The second projectwill examine and analyze the future role, of privatepension plans in mobilizing private savings'and allo-cating these savings' among its optional uses infinancing capital formation. The report will be en-,
Life Insurance, 19 elected Years)(in hi s of dollars except as noted)
1964 1974
Total premium receipts 22.7 52:6
Percentincrease
1964-74
8.8New life insurance purchases ....life insurance in force in ill!?
105.0 268.5* 9.8
United States 797.4 1.985.7 9.5Assets of U.S. life companies 149.4 263.3 5.8.Employment 1000's) 474:6 538.8 1.3
Women (percent) 43 . 46
Data excludes $29.4 billion of servicemen's group life insurance.Compound annual 'rate of gAvtit.
Source: Institute of Life Insurance and Bureau of Labor Statistics.
titled "The Role of Private Pension Say- :ings and Capital Formation in the United St tes."
MOTION PICTURES
Reflecting the increased popularity, 64 motionpictures both in theaters and on television screens,receipts for motion picture production and alliedservices film production and rentals,'.casting bu-reaus, educational and industrial motion' pictures,commercials for television reached alk.estimated$3.3 billion in 1974 compared with $2.9 billion in1972. Similarly, increased movie attendance andhigher admission fees, together with the continuedconstruction of new and better equipped theaters in.convenient neighborhood shopping centers since1972, have contributed to rapidly rising movietheater recOts..
In 1974, Kox office and concessionaire receipts-ofMotion picture- theaters totaled an estimated $2.5billion compared with $1.8 billion in 1972. Boxoffice receipts generally account for about three-fourths of gross theater income. Also, averagt re-ceipts for ,indoor movies are higher than for seasonaldrive-in theaters. Movie attendance topped one bil-lion last year, the highest since the mid-1960's.
About one-fourth qf all motion picture industry,receipts are 'Spent onk--payrollt. In 1972, 'industryemployment: totaled approximately 192,000; abouttwo-thirds were employed in:motion picture housesas managers, cashiers, concession attendants, jan-itors, projectiodists, and Ushers: Except for man-agers and projectionists, may movie theater workersare part- timers. Women ace ant for about one-thirdof all employees. Only about 8 percent of all moviehouses have no paid employees.
New Theatirs tuiltThere were 12,699 theaters in operation in 1972;
about 30 percent were drive-in theaters., Althoughthere has been very little change in the number oftheaters since the early 1960'snew construction ofmultiplex and minitheaters in shopping centersparking facilities have replaced many unprofitable ormarginal theater operations located in downtowncity areas. In addition, many large theaters have,been remodeled into minitheaters during recent years.Multiplex theaters generally consist of two to fourminitheaters, each 'acdOmmodating an audience ofless than 400, and can be operated With a minimumof personnel. In' these theaters, starting times arestaggered to permit a common ticket-selling lobby.
34
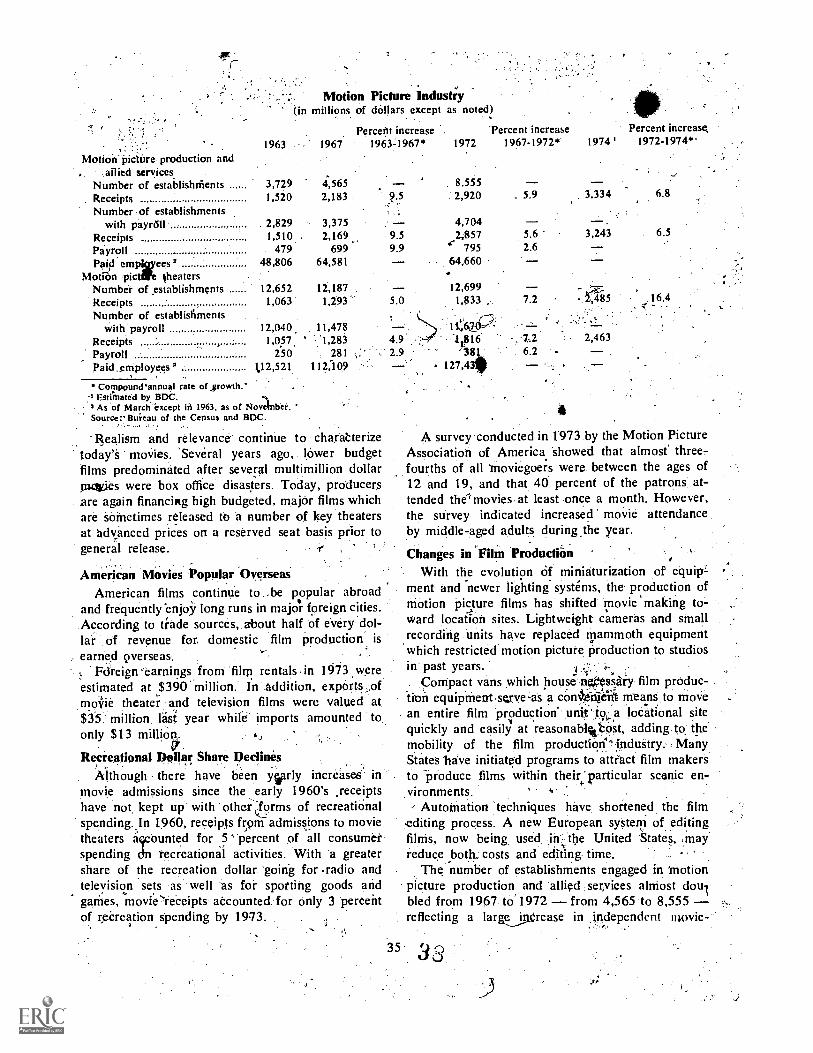
Motion Picture Industry(in millions of dollars except as noted)
Percent increase Percent increase1963 1967 19634967
Motiodpiciiire production andallied services
Number of establishthents 3,729Receipts 1,520 2,183
Number of establishmentswith payrdll 2,829 3,375
Receipts 1,510 , 2,169Payroll 479 699
Paid emptyees =Motion pictM theaters
48,806 64,581
Number of establishments 12,652 12,187
Receipts 1,063 1,293'Number of establisAments
with payroll 12,040 11,478Receipts 1,057 ' 1,283
Payroll 250 281
Paid.employees 3 1.12,521 112,109
Compound'annual rate of 4trowth.--, Estiinated by BDC.2 As of March except in 1963, as of Novlber.Source:' Buieau of the Census and BDC.
9.5
9.59.9
5.0
Percent increase
1972 1967-1972* 1974' 19724974*.
8,5552,920 5.9 3.334 6.8
J .
4,7042,857 5.6 3,243 6.5
795 2.6
64,660
12,6991,833
4.9
-liealism and relevance continue to charatterizetoday's movies. 'Several years ago, lower budgetfilms predominated after several multimillion dollarPm-its were box office disasters. Today, producersare again financing high budgeted, major films whichare Sometimes released to a number of key theatersat advanced prices on a reserved seat basis prior togeneral release. fi
American Movies. Popular OyerseasAmerican films continue to .be popular abroad
and frequently enjoy long runs in major foreign cities.According to trade sources, about half, of every dol-lar .of revenue for domestic film production' isearned overseas.
Fdreign 'earnings from film rentals .in 1973 wereestimated at $390 million. In addition, expOrts .ofmale theater and television films were valued at$35 million list year while imports amounted to.only $13 million.
Recieational Dollar Share DeclinesAlthough there have been yiarly increases in
movie admissions since the early 1960's ,receiptshave not, kept up' with othecforms of recreationalspending.. In 1960, receipts from admissions to movietheaters accounted for 5 percent of all consumerspending dn recreational activities. With a greatershare of the recreation dollar. -going for -radio andtelevision sets as well as for sporting goods andgames, movie receipts accounted for only 3 percentof recreation spending by 1973:
35
A survey conducted in 1'973 by the Motion PictureAssociation of America showed that almost' three-fourths of all moviegoers were between the ages of12 and 19, and that 40 percent of the patrons at-tended the' movies at least once a month. However,the survey indicated increased movie attendanceby middle-aged adults during_the year.
Changes in Film ProductionWith the evolution Of miniaturization of equip
ment and 'newer lighting systems, the' production ofmotion picture films has shifted movie 'making to-ward location sites. Lightweight cameras and smallrecording units 'have replaced mammoth equipmentwhich restricted' motion picture production to studiosin past years. P;'
Compact vans which house nOess'ary film produc-ihm equipiriern,serve4s a con4nreWt means to movean entire film production unit' to a locational sitequickly and easily at reasonabl%';cOst, adding to themobility of the film production 'industry.' ManyStates 'have initiated programs to attract film makersto 'produce films within their 'particular scenic en-
+.
vironments. '
Automation techniques have, shortened the film,editing process. A new European system of editingfilMs, now being, used in the United States, mayreduce both, costs and editing time.
The number of establishments engaged in 'motionpicture production and allied services alniost douibled from 1967 to'1972 from 4,565 to 8,555reflecting a large jnerease in independent movie
3

makers and related movie service enterprises,in re-cent years. However, establishments with paid em-ployees, which account for more than 98 percent ofall receipts. represent only one out of every three ofthese new establishments. Receipts -.4 motion pictiare
-film exchanges which rent films to movie thefiterexhibitors rose at an annual rate of 10.2 percentduring this period and generally account for about40 percent of .all receipts of companies with paidemployees.
Channels of DiMribution
In the early 1960's, motion picture distributionfunctions were controlled by film distributors whOassuilltd the majority of the financial risk. Sincethen, a system of bidding for films has emergedwhereby the financial responsibility is'eassed on tothe exhibitor, whO must incest a large su'ia'of Moneywithout viewing the film prior to showing. Thismethod Often delays the showing of feature films inneighborhood theaters. A new method of distribu-tion developed in recent years is "four-walling."This is a method whereby the distributor sells hisown pictures through theater leasing by renting amovie house for a flat fee, to include operating ex-
' penses, plus a Tall- profit.
Future Directions
Production: of feature' films is expected to bemaintained at tOligh level in the next several yearsand the supply of films should be sufficient to meetth demands of exhibitors. Multiauditoriums offer-
g wide choice of movies that 'appeal to'diverseges and Movie tastes probably Will continue to in-
Crease indoor movie attendance. The grhwing pop-,ulation or young moviegoers and top box officeattractions, together with continued educed week-end travel beCatike of the high cost of '-'-dnerg/, prob-ably will boost" box office reCeipts during the re-mai.nder 'of this decade.
As poptilation trends: shift, toward mbre singles,, later marriages:later 'childbearing, and fewer chil-
dren per family; there will be increased leisure titgefor entertainment activities in evenings and on week-ends. It is expected that a larger nUmber Of youngpeople will attend movie theaters than in previousyears, less hampered by family responsibilities.
Competition for the recreational dol r probablywillcontinue and the motion picture p uction in-dustry may enter the emerging cable television mar-ket, which. would :provide- additional' otitIet- formovies besides theaters. and pay-broadcasktelevision.Because increased cable television playoff of feature
films probably -will only benefit producers, growth-of motion picture exhibitoi,receipts nidy be limitedirr future years._ Factors which 'niay Slow pay-cablemovie growth, however, include the inability of pay-television to obtain initial release of feature filmswhich are no,rmally distributed first to exhibitors andthe large capital outlays 'needed for films,, projec-tionists, and 'equipment, and installation of dalliesand adapters for existing CATV equiPment.
PERSONAL SERVICES,Receipts. V persdual services industries totaled
an estimated $14.7 billion' in 1974 compared with$13.5 billion in 1972. These services include faun -dry and drycleaning, beauty and barber shops, shoerepair, photographic studios, funeral services, andsuch miscellaneous services as dressmaking, baby-sitting and beauty spas. In recent years, price in -'creases have far outpaced increases in spending formost personal services, indicating a probable dropin the volume of some types of personal servicesactivities.
During the period of economic growth and risingincomes in the 1960's, demand for personal..s
servicesincreased steadily as people tended to buythat they otherwiSe would have performed for them-.selves or bought less frequently. The increased, num-ber of households and steadily gro-wing number ofemployed women had a strong impact on such busi-
,nesses as automatic laundry and drycleaning estab-lishments, car and tag ando title services, and beautyshops. Photographic studios benefited from the ris-ing number 'Of school graduates and marriageable,adults. However, lessened' shoe repair needscreated'by the proliferation-of inexPensive shoes, as well asby lohger wearing 'materials, prompterepair shops to offer a variety of relaterepair and alteration of all types of leath -garments,
.haddhags, and sporting- goods, and custom leatherwork.
With'fhe exception of industrial launderers, linensuppliers, and some,' Chak-pPerated beauty salonsand funeral homes, personal services are predom .inantly independently owned businesses: In.1972, more than half of the 528.000 personal service
.establishments were operated by independent pr,f)..prietors wiihout paid employees. For example, morethan half of the 655,000 licensed barbers and beauticians in 1)972 operated their own business'! Sireflarly, most-drycleaning stores were owner operated.
The labor-intensiVe beauty Salons, barber shops,and laundry and drycleaning establishments employ
t.
ost shoervides

Consumer'Price Inflexes for Selected(1,967--=100)
Personal Services
item 1965 1970 1972 ,1973 1974pryeleaning, suits and dressesLaundry, men's shirts
92.191.2
112.941.1115.07"
117.7122.0
122.04,129.0
115.9ar .21431
Laundry, finished flatworle 92.4 .124.3 138.7 148.9 170,1Automatic laundry service 98:1 110.7 114.9 117.7 124.3Shoe repairs, women's lifts 99.2 107.5 . .116.0 122.1 132.0Men's haircuts '89.7 119.0 125.3 132.9 144.5Beauty shop services 93.1 113.9 ' 121.3 129.1 139.4Funeral services, adult 95.6 112.9 121.2 - 126.4 . 135.0Babysitter services 89.9 123.0 136:3 ,:.. 142.8 165.4
Souree: Bureau of Labor Statistics, U.S. Ddpartment of Labor.
about 80 percent of per-sonar service workers on.payrolls, but account for only 70'percent Of personal,service reeipts. In contrast, funeral homes with paidemployees account for about 17 percent gf all Ire-.ceipts, but less than.9 percent of employment: TheimPact of yearly minimum wage increases requiredby the 1967 Amendments to the Fair Labor Stand-ard Act has been greatest 'in the South where wagesgenerally are lowest. Beginning on January 1, 1975,the minimum hourly wage for most personal serviceindustries rose to $2. A lar0 proportion of. personal
melts of many of the personal services have at-tractea. franchising during . the past deOade: Fran:-chising has made inroads in laundry and dryeleanlng,beauty salons, and spas. According to a recent'Bureau of Domestic Commerce- survey of, franehiS-ing, there were more than 3,600, franchised laundry -
and drycleaning establishments with. sales of about .
$235 million in 1973. Many offer 1 -day or 1-hoUrseitice.on both dryclnaning and shirts.
_Although. 'profits ',,try..7arnong personal, service in-dustries anrlwithin:4 particular industry, opportuni-
service workers are employeelesi than a 40-hour ties continue for-imaginative:and talented entrepre-.week. nears to Prosper by offering quality services to con-.,
'the growth potential and limited capital require- sumers. Fewer oppOrtunitieS for' mechanization: and....,
NuMber of estalilishments (000)Receipts
Number of establishments withpayroll (000)
Receipts /Payroll/yearPaid employees' (000)
Compound annual rate of growth.I,Estrrtiatecl by BDC.7 As of March. gtSource: Bureau of the Census and HOC,
Photographic Studios(in' millions of dollars except as noted)
196319.5
502.7
7.4415.4125.3
33.6
Percent increase -
1967 1963-67* 197226.6 - 33.0
745.2 10.3 1,678.7
8.1596.6187.135.8
. 9.510.5
8.5845.3236.7
38.9
C
Percent increase Percent increase1967-724' 1974 ' 1972-74*-
7-.7 1,212.0 6.0
Shoe Repair; Shoeshine, and Hateleaning(in millions of dollars except as noted)
7.24,8
940.0 5.5
Percent increase. Percent increase Percent increase,Number of establishments (000) 1963 1967 1963-67* 1972 1967-72* 1974 -r 1972-74*
Receipts 21.5 16.3 - - ' 12.9 -"Number.of estabIROments with 208.1 .207.1 -0.1 209.9, 0.2 210.0 0.0
payroll (000) 6.2 , 5.3 -, . ,, 4.0,, -Receipts 12 1-34.5 L8 125.9 -0.2 .124.0 . 0.0Payroll/year 34. 46.0 7.3 37.7 -4.0
- Paid employment' (000) 12. 11.5 , - 8.5 -tompound 'annOal rate of growth.' Estimated by BDC.
,
M of March.Source: Bureau Of the Census an-d,BDC..

rlimited technological developments have resulted inlow productivity levels for many peronal services.However, improved productivity, together with pricestability and the timely marketing of services to meetnew cousumer needs, probably will result in a highervolume of business activity and an improved profitpicture in the 'years ahead.
Family Laundry/Dryclepning Activity Slows
Laundry, drycleaning, and garment repair andstorage receipts totaled an estimated. $5.6 billion in1974, only a negligible increase over 1967 levels.Re pts of coin-operated stores increaAd about5.8 percent annually during this period, partiallyoffsetting the sharp decline in the volume of tradi-tional laundry and drycleaning activity.
The impact of new textile developments, im-proved home laundering equipment, and the in-creaseq useAcoin-ops since the early 1960's havebeen most severe on power laundries and dryclean-ing plants. New synthetics and finishing processeswidely used in the manufacture of clothes which re-tain their shape after home laundering have sharplyreduced the volume of family laundry-and dryclean-ing at commercial establishments during the pas'decade. The ,number of power laundries dropped\
from 6,350 in 1967 to abOut 3,100 in 1972 andreceipts declined from $94knillion to only $670million during this period. Similarly, because of adecline in both drycleaning establishments and re-ceipts during these years, the share of industryreceipts for drycleaning dropped from 39 percent in1969 to 34 percent in 1972.
Many enterprising laundry and drycleaning estab-lishments.have broadened their services to includedrapery processing, carpet cleaning, rental of Unitsfor cleaning rugs at home, alteration work, andrental of storage space for safety from robbery aswell as from moths. Some firms offer specializedservices for fire damaged goods where soil andsmoke odor create special cleaning problems.
Rental Laundry Industry Markets
Receipts of the rental laundry industry, consistingof almost 1,600 establishments engaged in linen sup-ply, industrial laundry, and diaper service, totaledabout $1.8 billion in 1972. Rental laundry firmstrefairly large businesses which require considerable in-vestment in plant and equipment. According to theLinen Supply Association, the linen supply industryalone processes about 5.5 billion pounds of linenannually and spends about $30 million on buildings,
Laundry, Drycleaning, and Garment Service(in millions of dollars except as noted)
Percent increase Percent increase Percent change1963 1967 1963 -67 *- 1972 1967-72* 1974' 1972-74*
Industry' totalNumber of establishments
(000) 109.7 . 111.9 - 94.1Receipts 4.357.3 5,432.3 5.6 5,561.8 0.5 5,617.0 0.5
Number of 'establishmentswith payroll (000) 65.0 65.7 -- 58.7
Receipts 4.008.7 5,002.1 5.7 5,103.6 0.4 5,144.0 0.4Payroll/ year
7N1,623.3 2,012.8 5.5 2,016.7 0.0
Paid employees' (000) 755.0 572.5 ,---,- 456.7Coin-operated laundries' and
drycleaning stores eNumber of establishments
(000) 26.2 29.6 30.4Receipts 372.7 557.4 10.5 742.3 5.9 826.0 5.5
Number of establishmentswith payroll (000) 11.7 16.0 - 16.8
Receipts 225.6 407.4 '15.9 545.6 6.0 608.0 5.8Payroll/year. 46.3 85.4 '13.0 11,6.0 6.1Paid employees' 21.7 32.2 41.9
Compound annual rate of growth.' Estimated by 13130.
Coin - operated laundry machine routes arc not included.As of March.
Source: Bureau of the Census and bDC.
38
machinery, and equipment each year. Althoughmany hospitals have inplant laundries, the sharpincrease jiff, nursing home occupancy and hospitaladmissions during recent years has provided a grow-ing market for linen suppliers. In contrast, the pop-ularity of disposable diapers, together with a de-clining birth rate, has adversely affected the diaperservice industry.
Because of rapidly rising costs of fuel, wages,and delivery services in the past 2 years, industriallaundries and linen suppliers have attempted to cutcosts with improved maintenance of equipment,elimination of unprofitable routes and minimumcharges for route stops, and shortened workweeks.To prevent linen losses, these firms are emphasizingcareful inventory control systems. In some instances,closed-circuit television networks have been installed.
New technology for industrial and institutionallaunderers include sorters that can fold 1,000 mixedsize towels per hour and stack each of three differentsizes on precounted stacks on separate conveyors;dryers which can handle more than 100 pounds ofwash at one time; self-closing hamper bags; rinsingaids which save fuel needed to heat water; ultra-sonic drycleaning; and Monorail systems to transportlaundry between departments.
knvironmental Laundry Requirements
The Federal Environmental Protection Agency(EPA) recently released a proposed draft of waterquality standards for laundries limiting the hexanesolubles and mercury allowed in water discharge.Public hearings on these standards will be held inthe fall of 1975. Laundry industry representativesplan to present data showing that mercury in excessof the proposed standards is caused by its presencein soiled fabrics submitted for laundering and cannotbe tilf,.red out by any known treatment system otherthan leansing compounds. Suppliers to family laun-dries already have changed and perfected new for-mulations of cleansing products without hexanesolubles.'
The EPA also has adopted a regulation whichwould deny Federal financial assistance to metro-politan water treatment plants unless a dual sur-charge is imposed on the use of watera general
surcharge for all water users and another surchargeto large users to help defray the cost of treatmentWorks,
Coin-op Store Receipts UpCoin-operated laundry and drycleaning stores
have been the fastest growing segment of the in-
dustry, with coin-op receipts increasing at a 7.9percent annual rate from 1963 to 1972. Receipts ofstores with paid employees rose more than 10 per-cent, annually during these years. By 1974, coin-opstore receipts reached an estimated $826 million.Commercial coin-operated laundries are used mostlyby those unable to afford the convenience of homeinstalled equipmentthe poor, the -elderly, andyoung adults living in small apartment houses with-out laundry facilities.
According to a recent industry-sponsored survey,'coin-ops in the western half of the country arelarger than in the eastern regions. While the per-centage of gross receipts paid for rent is similarthroughout the country, New England and EastCoast stores pay more than twice as much for utili-ties than those in the Western States. The averagecharge for a 12-pound or less wash is 35 cents, butthere is a steady movement toward 40, 45, and 50cents because of steadily rising costs for gas, elec-tricity, water, rent, and attendants. The averagecharge for an 8-pound load of drycleaning rangesfrom $3 to $3.50.
Today, about half Of all coin-op stores are-equipped with drycleaning machines compared withabout 20 percent a decade ago. Increasingly, coin-ops have added pressing and 'dropoff services. Also,vending machines for soft drinks, coffee, popcorn,and candy add to profits and help customers passthe necessary waiting time for the washer or dryercycle to be completed.
Prices for coin-op laundry/drycleaning probablywill continue upward, reflecting the probable highercosts of natural gas and electricity in the next seV-eral years. In order to conserve energy, it is ex-pected that new laundry equipment will be de-signed for low water consumption, shorter cycletime, and high extract speed. Successful coin-opsin^the future probably will offer services to ,supple-ment the home laundry machinelarge capacity rugwashers, economical drycleaning, and "cleast andsteam" services. The well-equipped coin-op storewill continually attract new. customers.
Beauty and Barber Shops
Combined beauty and barber shop receiptsreached an estimated $4.2 billion in 1974. Beautyshop receipts totaled an estimated $3.3 billion lastyear, reflecting an average annual gain of 5.1 per-cent over 1967. Barber ..Shop receipts, slowed bythe long hair style trend in the late 1960's declined2 percent annually from 1967 to 1974.
39 ti

Beauty and Barber Shops(in millions of dollars except as doted)
1963 1967Percent increase
l,963-67*3
1972Percent increae
1967-72* 1974'Percent increase
1972-74*Beauty shops to
Number of establishments.
(000) 151.7 179,2 - 189.1 -Receipts 1,618.0 2,354.4 9.8 3,025.1 5.1 3,335.0 5.0
Number of establishments .with payroll (000) 64.1 72.8 -- 79.6 -
Receipts 1,321.3 1,947.3 10.1 2,417.6 4.4 2,630.0 4.3Payroll/year 577.9 943.3 13.2 1,164.6 4.3Paid employees' (000) 203.7 255.0 278.3 - _
Barber shops,Number of establishments
(000) 105.5 112.5 - 91.8 -Receipts 906.6 1,020.3 3.0 884.9 (-3.0) 957.0 4.0
Number of establishmentswith payroll (000) 37.1 32.5 - 19.8 -
Receipts 585.3 603.2 0.8 393.8 (-8.0) 425.0 3.9Payroll/year 254.4 307.5 4.8 178.6 (-10.0)Paid emplOyees ' (000) 73.5. , , 67.2 - 38.1
Estimated by BDC.2 As of March.
Compound annual rate of growth.Source: Bureau of the Census and BDC.
Dominatekl-brSmall, independent businesses, al-most 60 percent of all beauty salons and nearly 80
. percent of all barber shops are owner-operated withno paid employees. However, beauty and barbershops with paid employees account for almost three-fourths of all industry receipts. Beauty shops accountfor more than three-fourths of the 317,000 paid em-ployees in these industries, partly because there aremany part-time beauticians and few part-timebarbers.
Retailing in beauty and barber shops has con-tinued to grow in the past few years with shopstypically selling such items as cosmetics, hair con-ditioners, wigs, toupees, and a variety of relatedproducts.
Impact of Changing Hairstyle FashionsSince hairstyling is closely linked to fashion
changes, successful beauty shops have operatorstrained in the professional details of new stylesprior to each new fashion season. The current trendtoward short- or mid-length hair with curls haslargely replaced the simple, long straight style of thelate 1960's and requires frequent visits to the beautyparlor for cutting, shampoo/setting, and perma-nents.
While most beauty shops limit services to hair-dressing, haircoloring, manicuring, and retailingbeauty products, some large expensive salons' beautytreatments include such related services as saunas,
exercises, maspages, and facials. In recent years, aseries of technological improvements such as fasterpermanents, speedy hair dryers, and coloring ma-chines have made it possible to give quality hair-dressing service in less time. Most beauty salonsare open 6 days a week and many adjust their busi-ness hours to accommodate the increasing number,of working women.
Because of the long hail' casual style for men inthe late 1960's, the once-a-week visit to the barber-shop was replaced by a 4 to 6 week interval betweenhaircuts and receipts of traditional barbershops weresharply reduced. Haircutting alone no longer pro-vided an adequate income for barbers despite risingprices for haircuts, and barber-stylists emerged. Thetypical styling shop offers full grooming services formen, including haircutting and styling haircoloring,hair and scalp cleansing and treatments, hair straight-ening, manicuring, as well as servicing hail-goods andselling toiletries:-By 1974, the fashion of sideburns,moustaches, beards, and long hair was beginning toshift toward the more traditional clean-shaven,shorter hair look. Prospects for barbershops in thenext several years are bajghter than during the late1960's.
The number of unisex shops in metropolitan areasis increasing, boosted by the repeal of several Statelaws prohibiting cosmetologists from servicing malepatrons. These shops usually cater to, young adults,mostly featuring individual. haircut-styling.
40
43

Funeral Receipts RisingReflecting yearly- increases, in the number of
elderly Americans as well' as steadily, rising prices,Luneral home crematory receipts reached anestimated $2,6 billion.in 1974, an 8 percent annual-gain over 1967 levels. The death rate, estimated at9.2 per 1,000 n 1974 is expected to rise to 9.4this year and tir 9.6 by 1980.
Although incorporated establishments are growingin number, most' of the Nation's 20,800 funeralhomes are owned and operated by families who have.been in the funeral business for generations. Aboutthree-fourdpi, of all funeral homes are businesses'withpaid employees and account for about 93 percentof all funeral receipts. Funeral directors have sub-stantial investments in facilities and equipmentranging from about $120,000 for funeral homeswhich conduct fewer than 100 funerals annually toover $600,000 for those with more than 300 serv-ie'es a year.
Funeral Charges-,
A complete funeral includes embalming, viewing,
. .
transpOrtation, supervision of services, and paper-work. Cemetery, monument, vault, flowers, andclergy costs arc extra, although these services fre-quently are billed with the basic price. Although theprice of a standard funeral may vary from less than$400 to more than $10,000, depending upon theprice of (he casket and the type of service, themajority of adult funerals in 1973 cost between$1,200 and $1,500. In 1974, funeral service chargesrose an estimated 7.3 percent.
Today's trend is toward simpler funeral cere-monies. Viewing frequently is limited to a singleevening and plain wooden coffins are more widelyused.
Cremation
Although the number of cremations and body do-nations to medical institittions accounts for less than
percent of all funerals, the total is rising: In1974, the total in this category was 39,000 com-pared with 1.9 million caskets purchased. Morecremations occur in the Pacific States than in anyother region of the country.
Funeral Service and Crematories(in millions of dollars except as noted)
Percent increase1963 1967 1963-67*
NuMbe4- of establishments MOO) 20.5 20.2.Receipts. 1.20.5 1,516.6 3.9
NuMber of establishments with rpayroll (000) 15.7 . 14.7 -
Receipts 1.200.4 1.394.7 3.8Payroll_ 'year - 257.3 320.4 5.6Paid employment ' (000)
, .
58.8 -63.1 -" Compound annual rate of gro,th.
Estimated by ,BDC.As of March.
Source: Bureau of the Census and UDC:.
.197220.8
Percent increase1967-72* 1974'
Percent increase1972-74*
2.218.3 7.9 2,602.0 8.3
15.42.071.4 8.2 2,435.() 8.4
464.0 7.770.2
Miscellaneous Personal Servicesin millions of dollars except as noted)
1963 1967Percent increase
1963-67* 1972'Percent increase
1967-72* 1974'Percent increase
I972-74Number of establishments (0001 18.5 32.3 64.6
Receipts 279,8 474.3 14.1 1,38 l .8 30.0 1.642.0 9.0Number of establishments with
payroll '(000) 5.0 5.5 13.7Receipts 2292 325.0 9.2 1.032.6 33.0 1.272.0 11.0Payroll year . 67.5 105.7 11.8 338.5 33.0Paid emplin...:6)ent )0001' 20.8 24.6 96.9
Compound annual rate of grotAth.Estimated byAs of Attach.
Source: Ituremi of the Census and 1117C
41
4
Miscellaneous Personal ServicesReceipts for miscellaneous personal services more
than doubled between 1967 and 1972 and totaledan estimated $1.6 billion in 1974. Growing miscel-laneous personal services include such varied activ-ities as babysitting bureaus, all types of dressmakingservices, rug and furniture cleaning on owners' prem-ises, massage parlors, slenderizing salons; collegeclearing houses, valet parking, and car,title and tagservices. These services probably will continue, toexpand in the next several years as imaginative en-trepreneurs develop new ideas.
TRADE
WHOLESALE TRADE
During the past decade, sales of merchant whole-salers mostly local independent distributorsrose at a 10 percent annual rate. Since the mid-1960's, merchant wholesalers' receipts as a percentof the gross national product have increased fromabout 26 percent to 32 percent in 1974.
The niajor wholesaling functions associated withthe sale of goods include maintaining inventories;extending credit; physically assembling, sorting, andgrading goods in large lots; breaking bulk and re-distributing in smaller lots; delivery; refrigeration;and promotional Advertising. Functions associatedwith the physical(when the wholes,performed in ware
andling and distribution of goodsler takes title to the goods)' areouses operated by wholesalers.
Because retailers and manufacturers also are per-forming distribution functions, the isable to act as a distributor only in those marketswhere he has demonstrated his economic efficiencyand capability.
Merchant wholesalers represent the largest whole-saling group in terms of sales (51 percent) andemployment (75 percent), and are the most homog-eneous group as well. Between 1967 and 1972, thenumber of merchant wholesale establishments in-creased from 213,000 to 290,000,. up 36 percent.
Duripg 1974, sales by merchant wholesalers rose23 percent to $448 billion, largely reflecting the 20percent increase in wholesale prices during the,:year.Sales of durable goods lines increased about 20 per-cent while sales of nondurables, led by farm productraw materials, jumped 25 percent.
Employment Increases Steadily
Employment in the wholesale trades .has grownsteadily during the last 10 years. Employment in
42
merchant wholesaling totaled about 3.2 million in1974 compared with nearly 2.5 million in 1967, arise of about one-third. From 1964 to 1974, averageweekly earnings increased annually, ranging from4 to 6 percent. During the same period, the averagework week has hovered around 39 hours.
In, an effort to improve worker productivity, manyfirms have initiated training programs aimed at up-grading employee skills, and have sponsored frequentmanagement Seminars. The increasing use of com-puterization and sophisticated equipment has openednew employment opportunities and prompted specialtechniCal training programs. Often, firms favor asalary-plus-inCentive plan for the sales force insteadof 'a straight salary or commission-only plan. Thelarge wholesalers with big fleets of delivery trucksare seeking such cost-cutting benefits in distributionmanagement' as improved route planning and themeasurement and control of route-driver perform-ance. This effort is especially important during thecurrent period of high gasoline prices.
Changing Pricing Practices
'Because of higher operating costs, competition,and shifting markets, wholesalers are continually -reviewing their pricing practices. Pricing merchan-dise to reflect rising prices during the past, year hasmultiplied problems for wholesalers.. From late 191g3through most of 1974, frequently changing productprices caused lags in accounting systems, making itdifficult to measure the true impact of cfst factors,pricing, and accounting policies. In addition, strongcustomer resistance to rising prices made it harderfor wholesalers to pass on their own rising costs. Tomeet these problems, wholesalers have responded inseveral ways:
Improved accounting systems and a reevalua-tion of costs. For example, some firms are nowcharging customers for such extra services as emer-gency or late deliveries.
Establishing or raising minimum order levels.Recognizing the inherent higher costs of slow-
moving items, management has lowered prices onsuch items tospeed up turnover.
In order to improve collections ailid cash flow,more firms are charging interest for accounts overdue more than 60 or 90 days, as well as for creditextensions.
Storage Improvements
Inventory-handling, a vital functions of whole-saling, has changed markedly during the past fewyears. Wholesaling's majort large customers re-
4J
sailers, institutional users, commercial nd industrialusershave reduced their onsite invent r holdingsand have kept backup stock in distributors' ware-houses. This practice strongly reinforced the serv-ices which wholesalers perform. .- -
The preference of many retail customers forquick turnover items that produce good volume and'profit has increased the rack jobber type of service.
"by wholesalers. Providing point -of -sale merchandisein stores, rack jobbers own the goods up : to thetime the goods are turned over to the retailers, thusreducing retailers' inventory investment. By render-ing such service, the wholesaler assumes completeresponsibility for replacement needs for certain cus-tomer commodity lines. Rack jobbing is a largebusiness with retail food and drug chains.
Improving Productivity
in recent years, rising operating costs have pressedwholesalers to sell a greater volume Of goods. in
ccorder to maintain a reasonable level of 4ollar profit.To improve their long-term profit posi ion, manywholesalers are expanding facilities and moderniz-Ofg their capital base through warehouse moderniza-tion, greater reliance on and use of labor-savingequipment. and increased use of computers.
Many warehouse operations today are simplifiedby electronic equipment that automatically 'readsinformation from labels on cartons as they move onhigh-speed conveyor belts, thus eliminating excesshandling and improving productivity. According to arecent survey by the National Association of Whole-saler-Distributors, 56 percent of the survey respond-ents reported that they were .using computers orplanning to do so during 1975, up .from about 45pet-Cent in 1972. Smaller wholesale firms, especiallythose in metropolitan areas, . have instituted suchcost-cutting methods as cooperative financing, billing,buying, and data processing,
Since warehousing requires a high percentage offixed costs and a high debt/equity ratio, a numberof wholesalers are establishing distribution centers.These centers plan modes of transportation, storagemethods, layout considerations,- locator, systems, in-teraction of handling systems, material handlingequipment, and schedtiling of deliveries. Wholesalersdecide the limits of service required of a distribution
.center which may include some or all of the follow-ingin4entory stockpiling cOnsolidntiOn, distribu-tion, product-mixing, and test marketing:
Smaller grocery w olesalers often share a distri-bution center with holesalers of other products.Cost-cutting benefits of shared distribution _centers
include use of handling equipment required forefficient operation; suitable layouts for various sizesof wholesale firms in multiple-occupancy buildings;efficient modes of transportation of products to andfrom the distribution center; and ample parkingspace- and docking facilities.
It has become increasingly necessary to coordi-nate transportation of goods- with storage facilitiesand customer requirements. Increased costs of ship-ping and distribution handling require better trans-port utilization. In some areas of the country, how-ever, deteriorating railroad service has 'created ship-ping problems for regional and local distributors.Profit-minded tlistributors increasingly are using thecomputer order processing technique which auto-matically reorders low stock items from suppliers,selects carriers and delivery routes, and pinpointsdelays or bottlenecks.
Changing Markets 'Reshape TrendsThe changing nature of wholesaling markets,
owing largely to the spreading out of metropolitanareas and the emergence of new communities withtheir super-size shopping centers, actually reversed atrend that began in the early 1960's toward productspecialization in wholesaling. Even though manywholesalers have retained specialized line titles, theyhave broadened product bases. Also, the introduction6Ithousands of new products during the 1960's re-sulted in a diversification of commodity lines, fur-
ther emphasizing the need for expanded product dis-tribution.
Competition, a major influence on recent trendsin wholesaling, also has compelled wholesalers tovary commodity lines, expand territories, . and di-versify operations. Manufacturers have become thewholesalers' greatest competition follthe business oflarge customers through direct selling to ultimateusers, bypassing wholesalers. However, since ship-ping distance for wholesalers in local and regionalmarkets is leS's than for national manufacturers, lowerfreight costs frequently benefit wholesalers.
Competition together with rising costsespeciallyfixed costswhich continually narrow gross margins,have spurred wholesalers to seek ways of improv-ing services as a means of boosting sales-. Somehave extended more generous Credit arrangements,to their customers; others advise customers on storelocations, on store layout, and on effective display_ofmerchandise. Still others provide product ,promo-tional material and notify customers of new productscoming on the market.
Increasingly, a variety of small manufacturers are
43
4,J
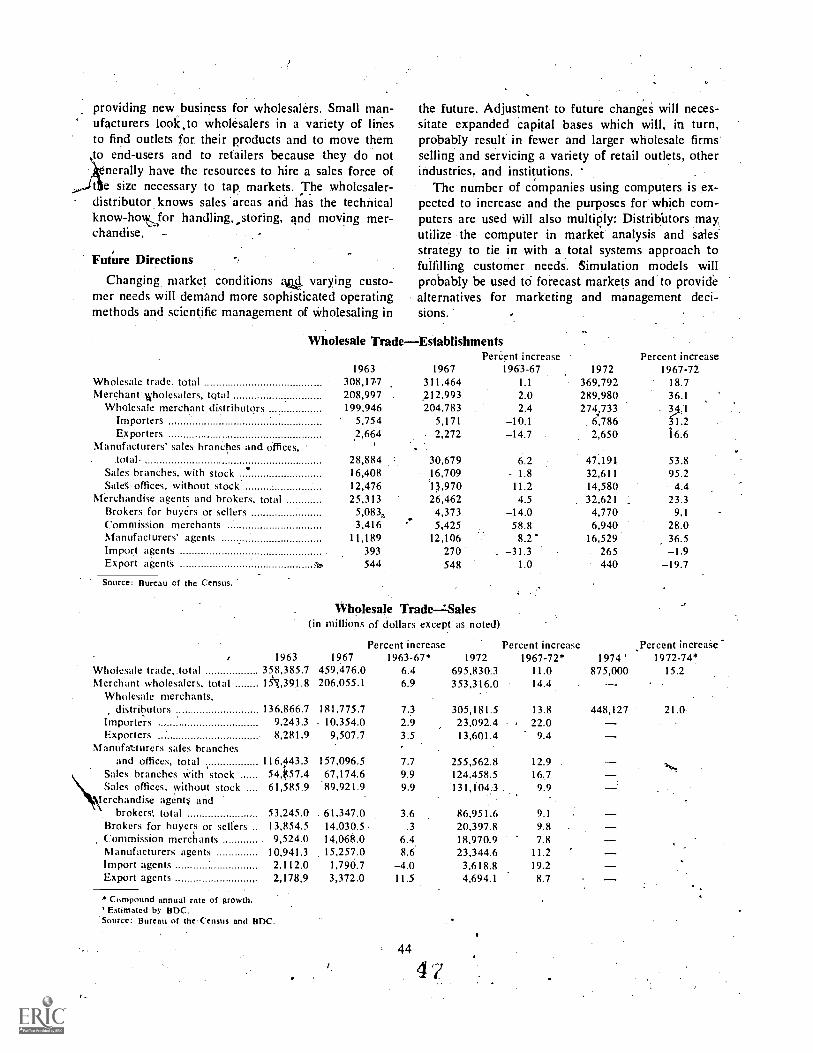
providing new business for wholesalers. Small man-ufacturers look,to wholesalers in a variety of linesto find outlets for their products and to move them
jttto end-users and to retailers because they do not
nerally have the resources to hire a sales force ofe size necessary to tap markets. The wholesaler-
distributor knows sales areas and has the technicalknow-hoNtcfor handling, storing, and moving mer-chandise, -
Future Directions
Changing market conditions zwf. varying custo-mer needs will demand more sophisticated operatingmethods and scientific management of wholesaling in
the future. Adjustment to future changeS will neces-sitate expanded capital bases which will, in turn,probably result in fewer and larger wholesale firmsselling and servicing a variety of retail outlets, otherindustries, and institutions.
The number of companies using computers is ex-pected to increase and the purposes for which com-puters are used will also multiply: Distribbtors may\utilize the computer in market analysis and salesstrategy to tie in with a total systems approach tofulfilling customer needs. Simulation models willprobably be used to forecast markets and to providealternatives for marketing and management deci-sions.
Wholesale Trade-EstablishmentsPercent increase
1963 1967 1963-67 1972Percent increase
1967-72Wholesale trade, total 308,177 311,464 1.1 369,792 18.7Merchant' wholesalers, total 208,997 ,212,993 2.0 289,980 36.1
Wholesale merchant distributorsImporters
199,946 204,783.5,754 5,171
2.4-10.1
274,7336,786
141..12
Exporters .2,664 2,272 -14.7 2,650 16.6Manufacturers-sales branches and offices,
. 28,884 30,679 6.2 47,191 53.8Sales branches, with stock 16,408 1.8 32,611 95.2Sale offices, without. stock
.16,70912,476 13,970 11.2 14,580 4.4
Merchandise agents and brokers, total 25,313 26,462 4.5 32,621 23.3Brokers for buydrs or sellers 5,083, 4,373 -14.0 4,770 9,1Commission merchants 3,416 5,425 58.8 6,940 28.0Manufacturers' agents 11,189 12,106 8.2 16,529 36.5Import agents 393 270 -31.3 265 -1.9Export agent's cte. 544 548 1.0 440 -19.7
Source: Bureau of the Census.
Wholesale Trade--:-Sales(in millions of dollars except as noted)
Percent increase Percent increase Percent increase1963 1967 1963-67* 1972 1967-72* 1974 ' 197244*
WholeSale trade_total 358,385.7 459,476.0 6.4 695,830.3 11.0 875,000 15.2Merchant wholesalers, total 15t391.8 206,055.1 6.9 353,316.0 14.4
Wholesale merchants,distributors 136,866.7 181.775.7 7.3 305,181.5 13.8 448,127 21.0
Importers 9,243.3 10,354.0 2.9 23,092.4 22.0Exporters 8,281.9 9,507.7 3.5 13,601.4 9.4
Manufatttirers sales branchesand offices, total 116,443.3 157,096.5 7.7 255,562.8 12.9
Saks branches with stock 54,k57.4 67,174.6 9.9 124,458.5 16.7Sales offices, without stock 61,585.9erchandise agents and\ brokers', total 53,245.0
89,921.9 9.9 131,104.3
61,347.0 3.6 86,951.6
. 9.9
9.1
Brokers for buyers or sellers 13,854.5 14.030.5 .3 20,397.8 9.8Commission merchants 9,524.0 14,068.0 6.4. 18,970,9 7.8Manufacturers agents 10,941.3 15,257.0 8.6 23,344.6 11.2Import agents 2,112.0 1,790.7 -4.0 3,618.8 19.2Export agents 2,178,9 3,372.0 11.5 4,694.1 8.7
*Compound annual rate of growth.Estimated by BIDC.
Source: Bureau of the Census and BIDC.
44
4 '>1.

Changing market conditions will require contin-ual adjustments in the type, variety, and quality ofprodUcts carried. Emphasis will be on operatingeconomies and retaining customers. For example,wholesalers are attempting to trim costs and improveefficiency through "route engineering," a techniqueof mounting importance in a future that promiseshigher fuel costs. This method requires an analysisof tic route man's activities, from the time he leavesthe warehouse the time he returns, including thescheduling of deliveries and work content of eachdelivery man's route.
Always alert for new ways to retain customersand expand sales, wholesalers generally seize oppor-tunities to pass on to customers the benefits of costsavings and .price reductions by manufacturers.Growing competition among wholesale distributors,continual product changes, introduction of newproducts. and shifting consumer preferences will fur-ther increase wholesalers' efforts toward product linediversification.
If conditions warrantthat is, if the economyimproves substantially----wholesalers will plan newbranches or additions to present facilities. Decisionsconcerning new facility locations will be influencedby the level of retained earnings-. the cost of borrow-ing. land prices, and proximity and access to cus-tomers.
NONFOOD RETAILING
DEPARTMENT STORES
Department store retailing in the 1970's ismarkedly changed from only a decade ago. Duringthe past 10 years. department stares have followedcustomers to suburban- areas, opening stores in cli-mate-controlled shopping malls which frequentlyhouse motion picture theaters; hotels, and offices:More ,and more, merchandise offerings are gearedto the Nation's fast-growing young adult populationacc9stomed to spending an increasing share of in-:ome on luxury itemssports equipment, books,high fidelity sets. As the number of working wiveshas increased, markets have expanded for such time-
Standard Industrial Classification hlanual definition: Retail storestarrying a general line of apparel. such as suits. coats, dresses, fur-Ushings: home furnishings. such as furniture. floor coverings, curtains.Iraperies, linens, major household appliances: and housewares such as-able and kitchen appliances, dishes, and utensils. These and othernerchandisc lines are normally arranged in separate sections or depart.nents with the accounting on a departmentalized basis. The depart.nents and functions at integrated under a single management. Theitores usually provide their own charge accounts, deliver merchandiseInd maintain open 'stocks.
45
and labor-saving purchases as dishwashers, hairdryers, cosmetics, and pocket calculators for balanc-ing household accounts.
In recent .years, rapidly growing department storesales exceeded the growth rate of all retail sales,with discount department stores contributing signif-icantly to the steady upward trend. Sales of depart=ment store chains (11 or more stores) now accountfor the bulk of all department store sales. Depart- .
meat store chains are now advertising on televisionand radio in addition to traditional adverting innewspapers. Apparel, home furnishings, and cus,to...-mer service are favored subjects for local color"-television advertising.
Keeping pace with changing consumer needsthrough new merchandise offerings and innovativeretailing techniques is essential to department storeretailing success. Department stores have respodded,to the special, needs of working _women throughlonger store hours, Sunday openings, and upgradingwomen's fashions. Home improvement nets are animportant sales area that many department store re-tailers are finding lucrative. With repairs of all typesbecoming increasin ly costly more people are learn-ing to make home pairs the selves and are seekingproduct inforthat. on from kn ledgeable salesper-sons as well as merchandise.
More people are taking a greater interest in sportsactivities, thereby increasing sales of television sets,sporting goods equipment, and clothing. Sales ofsporting goods equipment covering a wide variety ofactivities rose rapidly during recent years. Depart-ment stores and their mail order divisions are in agood position to accommodate these needs throughMerchandise selections in their stores, via their mailorder departments and through specialized storesselling these products.
Rapid Sales Grol,Vth
In recent years, departrrient stores' sales growthoutpaced the growth of all retail sales, largely re-flecting the strong gains of both traditional anddiscount chain department stores. In 1974, depart-ment store _sales totaled an estimated $62 billioncompared to $51 billion in 1972. From 1963 to1972,'sales more than doubled, reflecting high levelsof consumer spending as well as the addition ofabout 3,500 new department stores.
From' 1963 to f973, sales of chain departmentstores almost quadrupled. About half of the sharprise in sales growth, however, reflected price in-creases over the period. Discount retailers experi-enced rapid expansion in the decade of the 1960's,
accounting for a peak sales volume of 11 pekcent ofdepartment -store sales in 1970. In the past .2 years,severe competition among discounters' operationsbecause of overbuilding, overextension of financialresources, and high interest rates' caused some of theNation's large discounters to bewme 'bankrupt orreduce operating units. Despite 'these problems, con-tinued price consciousness assures a viable marketfor discount -type department stores:
Employment Gainso
Reflecting department store expansion from 1963to 1973, employment rose fr.qa about ) million toalmost 1.7 million, an average annual increase/of5.1 percent. More than two-thirds of departmentstore employees are women, who generally hold thegreatest proportion of sales jobS, and such clericalpositions as bookkeepers, cashiers, and office workers. About half of all salespersons are part-timeworkers and/on, tempOr:iry -salesclerks hired duringsuch peak. selling periods as the .Christmas season.Part-time sales' job opportunities have increased inrecent year as suburban shopping center stores aregenerally 'open several- nights each week.
Staffing requirements at the executive level intoday's, department store. requires a variety of skillsbesides a background in merchandising. The intro-.duction of, sophisticated electronic equipment tomonitrdr inventory and- credit accounts requireStrained technical staff. Large multiunit stores employprofessionally qualified persons to supervise cen-tralized departments of advertising, public relations,accounting, and personnel.
"Suburban Shopping Center Growth
,During the 1960's, shifts of population to sub;urban areas and the growth of circumferential high-ways improved the profit potential of retail storeslocated in areas surrounding cities. Climate-con-trolled malls serving as retail centers are generallydominated by four department stores and provideone-Stop shopping for customers. Vertical construc-tion of shoppimg malls permits additions to sellingarid parking space on smaller areas of land than isrequired for traditional shopping centers. With thefocus of shopping now centered in suburbia ratherthan downt(iwn city stores, the volume of retailsales in suburban mall accounts for about two-thirds of all retail sales.
Pepartment stores now require about 3 years leadtime from the decision to build to the actual -openingof the store because of the complexities involved insite seleL!tion, financing, construction, and delivery
of merchandise stock. Department stores generally`1Decome "anchor" unitt in a regional shopping center
where the typical general merchandise store is
smaller in size and less demanding with regard tostore fixturing and furnishing.
Managing Inventory Buildup
Levels of retail inventories have a major impacton the economy's production and employment levels.Large inventories in the manuficturing and whole-.sale sector are often reflected in equally high retailinventories. Excessive .inventories stem from bupi-nessmen's expectations outpacing reality and resultin a "ripple" effect in terms of reduced purchasesfrom wholesalers and fewer orders frOm manufac-turers.
Retailers in many ,merchandising categories foundthemselves with excessive inventories,in the summerand fall of 1974. The overstoclq)situation deVelopedbecause of supply dislocations resulting from eco-nomic controls and an oversupply of petrochemicalbased products in the aftermath of the oil embargo,as well as a decline in consumer demand accompany-ing the recessionary cycle,
In November 1974, department store inventorieswere 25 percent over the previous year level.' HoW-ever, as a result of heavy pre-Christmas sales atlower than usual markups, department store man-agement eliminated overstocked merchandise andreduced substantial inventory carrying costs. ByFebruary 1975, department store inventories wereonly about 6 percent bigher than the previous year.
The problem of inventory accumulation. and de-cumulation is a familiar one to the department storesector. Aided by computers, point of sale inventorydevices and early warning systems, department storeshave been better able to manage this problem. Be-tween 1963 and 1973, the sales'- inventory ratio was'about 7.7, varying less than half a- percent duringthe entire period.
Impact of Rising Energy Costs
The impact of rapidly rising energy costs forgasoline, heating, lighting, and air conditioning hasSlowed consumer spending and increased department,store operating expenses. During the remaining yearsOf t,his decade, additional energy cost increases canbe expected as domestic petroleum and natural gasprices elevaIc. because of high foreign -Oil costs andincreased domestic oil industry investment.
Higher energy costs have other implications fordepartment store management. Among these are de-cisions concerning new construction versus curtail-
46
j

ment of store expansion in suburban growth areas orthe central cities, with mass transit systems; altera-tions of consumer shopping patterns associated withdriving distance and gasoline cost; and deferrals ofhome Ownership and fewer durable and nondurable
.
put-Chases. Furthermore, the growing consumer pref-erence for smaller and mprc energy efficient houSingmay lead to reducCd home floor spaCe in futtehome construction and will require Continuing re-view and modification of merchandise product lines.
ImOVing Department Store Productivity
As a service indiristry, retailing does not producegoods that can be nielsured or quantified. Depart-ment store retailers enYphasize nevtz ways to producegreater sales per square foot of selling space whichultimately increase profits. With the high' costs of alltypes of construction materials, display items areselected with a view toward promoting reuse ofbuilding' components through redesign and maneu-verability of internal display to meet the needs ofvarying nierchandisti lines. . ) ,
In a department store, the incorporation of non-selling functions, such as storage and warehousing,can maximize the use of existing high priced sellingSpace. Strategically locatedcentral 'warehouses. usingSophisticated receiving, handling, and packaging sys<7terns. can speed the flow of merchandise to salesareas and customer deliveries. Other nonselling storefunct,kms. such as customer repair services, account-ing and clerical staff operations. as well as the loca-tion. of data processing, can be planned for lesscostly noneetail site locations. The computer con-tinues to be the single effective tool for -increasingproductivity. Before 1980. point-of-sale cash regis-ters linked to central computers should be installedin most de'partment stores., As a central informa-tion gatheririg unit, point-of-sale registers provideinstant. detailed sales data, help to reduce clericalerrors,,tmd provide on-line inventory controls. Addi-tional benefits include rapid cash register balancing,
reductiOn i udit expense, and speeded. creditauthorization procedures. 'Also, advertising and salespromotion campaigns can be closely monitored andmodified to meet changing market demands andcredit control; and authorization can be accom-plished with speed and accuracy as part of thecustomary retail checkout procedure at the cashregstcr.
For warehouse inventory control,- computer- linkedscanners can he positioned to read information fromcartons or tagged merchandise as it moves on high=speed conveyor belts. This procedure helps to elim-
inate extra merchandise handling and clerical work.Also, computer prepared shipping lists and sched-ules serve as inventory control units to check con-tainer contents as merchandise*.is lo.aded and un-loaded. Additional computer- generated econtimiesare obtained from more efficient sqeduling of truck"deliveries and a reduction _In down-time due to thecontrol and coordination of 1truck and automotiveequipment maintenance.
Credit Card Popular
The widespread use of credit cards, often permit-.
ting customers the-option of repaying balances on aninstallment basis, has vastly extended thetvailabilityof credit for retail store purchases. Since the mid-1_960's, annual expenditures on credit cards issuedand usable at department stores have eccounted formore than half of all annual sales. In the past few-years, use of bank credit cards for all types of .con-sumer purchases has risen sharply and a number ofdepartment stores have begun to accept bank-issuedcredit cards. In some instances, store credit cardsare being replaced by bank credit card's, eliminatingthe overhead costs of .department store credit' andcollection departments. Credit cards serve to en-tourage impulse buying.
New Department. Store Services
.Many department stores are now engaged incatalog selling and offering shop-at-home services.Printed catalogs of department store merchandisewhiCh can be ordered by mail, especially benefit cus-tomers who are housebound or have limited time forshopping. For the past several years, departmentstore mail order sales havz accounted for 10 to 12percent of sales annually. ..Shop -at -home services'usually relate to home furnishingsparticularly car-pets and drapesenabling customers to judge newfurnishings in their home surroundings.
Profit Gains Through Diversification
Department store diversification into nonretailsales fields has expanded dramatically. in recentyears. Realty ventures involving town or city plan-ning, shopping center development, and living ac-,commodationsfor entire communities are examplesof the typcs Of projects large corporate chain depart-ment stores have financed. One such real estate jointventure, involving two large chain department storesubsidiaries and a large insurance company subsid-iary, will finance and build a new suburban city with20.000 homes near Chicago. The first phase of thedevelopment, completed in 1974, is a $35-million-
Shopping center which will benefit the retail sponsorswho_turty take advantage, of the contract sales tech-niques to sell such items as carpeting. furniture, andappliances for the pfanned residential housing. Other;depar mentstore corporations own and operate nu-merous shopping centers throughout the :UnitedStates.
Some fllrge chain department stores offer to sellsubsidiary- permed financial services such as insur-ance 'and,i. ifortgage loans on store premises. Otherdepartmen store complexes have entered the fieldof manufacturing (paints, household detergents,;lawnmowers, and cash registers); thereby celinrollingquality and'specifications for a variety of productsfrom the manufacturing process through retail dig:tribution.
Future Directions
Department store retailers will continue to adaptfi changing consumer needs in the years ahead.
mplOyment will probably increase More nioderatelythan sales because of the trend toward self-service
.
and the increasing use of. computers to perform time;cons'uming sales and bookkeeping prOcedures. How -ever, there. will alwilys be a continuing need forhighly trained. experienced salespersons with productknowledge to demonstrate and sell big-ticket. highquality merchandise.
Business costs for department store opera areexpected to continue upward, partially rhigh cost of energy required' for heating/colighting. Broader product lines needed to sell to
-
expanding consumer markets will .rere, more in-ventory investment. As shopping centers are expen-sive to build. there probably be more verticaldevelopment and multipurpose use of commercialbuildings. Increasingly.' developers' sire .adapting theshOpping center idea to central 'business districts;using redeveloped, land or existing sites of retailestablishments. Aiding in the effort to conserve gaso-line supplies, customers can come,to downtown one-stop shopping centers via public transportation.
Multiunit chains, emphasizing mass distributionof merchandise to the cost-conscious' consumer, willcontinue to. predominate and increase their share ofthe total department -storestore market in the years.ahead:These chains. which include many old-line stores aswell as regional and local companies.. now accountfor 8d1 percent of department store sales. The con-tinuing growth of this group will not entirely -dis-place the family-owned department store in the'future. The single-unit store will remain a potentmarket force, providing.spccialized merchandise se-
.
lections, personalized service, and a knowledge ofregional or individual preferences that the multiunitor national chain cannot always duplicate.
Attracting and retaining new executive talent is aproblem for individual firms, which do not offer thebroad baNd employment benefits of multiunit com-panies. Mechanical or cost-intensive hardware toimprove productivity and output, and specialists tb
:advise on important intangibles including inventorylevels and borrowing capability, are critical to viableoperations and are not generally supported tolarge extent by family-owned units. 'Store trafficdislocations, because of subway construction or the.altering of highWay interchanges, will affect con-sumer shopping patterns and some single-unit storesin the years ahead.
Departnient stores will probably continue to di-versify retail and nonretail activities. While manydepartment.stores attempt to Fprovide one -stop retailshopping, larger chains will offer a similar arrayof financial services. These may include insurance(automobile, property, liability, life, and unusualrisk), mutual; funds, and the origination and servicingof mortgage loans on residential, property. Increasinguse of sales techniques to maximize facilities and toreach the "at-home" customer will broaden the fu-
.'cure sales base. Emphasis-will be placed on shop-at-hoine services, catalog mail order sales, and tele-phone sales. Expanding international trade may pro- ,
vide potential for overseas expansion of catalog ormail order operations.
By the 1980's, the use of bank credit cards inlieu of cash for sales transactions may increase sub- ,
stantially. Automated banking and pointTof-Sale ter-minals in retail establishments will allow direct trans-actions and retaiPpurchaseS withoul a monetary orcheck exchange.- Retailers should benefit by greatersales. generated through increased store traffic; byimproved cash flow attributed to a reduced float inthe payment of outstanding customer bills; and byadding to financial services already offered.
a
MAIL ORDER AND DIRECT SELLING
Increasingly, businesses are.'engaged in direct sell-ing and 'mail order marketing " -- selling techniquesthat react' many customers far froin the neighbor-hood or suburban stores as well as people withlimited time for shopping.' in past years, mail.orderand door-to-door selling involved highly specializedproducts such as cosmetics; sewing machines,kitchenware, books, encyclopedias, magazines, 'andeducational courses. More recently, large mail order
48 -

houses with no retail outlets include a variety of,related products in their catalogs, and advertise cata-
,togs for sale in optional magazines. Direct sellingcompanies also offer a selection Of Consumer prod-:ucts through their neighborhood representatiVes.
Mail Order House Sales Gaining
In 1972, sales of 5,410 mail .order houses withpaid employees accounted for 99 percent of all mailorder sales which totaled $4.5 billion, reflecting an8.2 percent annual rate of increase over' 1967.' An,additional 2.572 owner-operated mail order busi-nesses reported sales' of about $45.8 million for theyear. By 1974,, sales of mail order companiesreached an estimated $5.2 billion._ -
Advantages of Mail Order Selling ,
A Mail Order Selling business appeals to individ-uals seeking additidnal income by working on a part-or full-time basis from the home. Entry into the fieldrequires a small investment in inventory. The Tailsare used to advertise and deliver merchandise andrising postage rates have increased costs.,
Consumers favor mail order kales as an additionalshopping vehicle. that brings new ifleas and productsinto the quiet of their own home. They can perusebrochures or catalogs at their leisure, comparingproducts and prices with items- advertised via tele-vision. radio, magazines, and new papers. Whilestore prices tend to fluctuate, items listed in a catalogare generally available at a specific price for a pre:plictable period of time.
'Large mail order houses are almost completelyautomated, using computers-to maintain and updatemailing lists, to seek out potential customers basedon ate, sex or income, maintain inventory records,and process orders and billing with, a minimum ofdelay.
Mail Order Prescription Handling.
According to a recent survey conducted by theDepartMent of Health, Education and Welfare, themail order volume of prescription drugs involvesabout 17 million prescriptions annually comparedWith the more than one billion prescriptions dis-pensed by retail pharmacies. Nonprofit governmentand private ore nizations account for almost two -thirds of the mail order prescriptions volume. Custo-mers tend to be elderly people with chronic condi-tions living in rural areas whO are high volumep 5 ption users. Special precautions usually areundei liken by the mail order firms to screen outfraud ent orders.
I).
49
l'\Direct Sales Increasing .
While the number of direct selling establishmentsrose 82 percent to almost 141,300 from 1967 to1972, small owne -operated businesses accountedfor the bulk of th increase. In 1972, a. total -of8,86+ companies with paid employees accounted: for59.percent of the $4 billion in sales during the year.In 1974, sales reached an estimated $4.5 billion.
Direct Selling Methods,Direct selling serves as a primary source of dis-
tribution or an additional means of extending prod-uct sales and market penetration for some corpora-tions. Direct .selling is accomplished through house-.to- house, canvassing or the party planselling mer-chandise through demonstrations in prospective cus-tomers' houses.
To be successful in the direct selling businessinvolving many part-timers who are not necessarilyretail experts, the products sold are usually itemsthat everyone needsdetergents, soaps, car waxes,vacuum cleaners, vitamins,, cosm ics, aluminumcookware, and other commonly used ousehold and'personal products. One large cosmetic corporationwith annual sales of more than $1 billion, involvedin' direct selling for many years, generates :salesthrough representatives throughout the country whoare given lists of former customers in their neighbor-hoods. However, with more women working away .
from the home, there are fewer prospective custo-mers in the daytime and more problems in recruitingrepresentatives.
Efforts to Regulate, Direct SellersCurrent Federal Trade Commission regulations
require that door-to-door sales signed contracts mustbe accomparti d by a "notice of cancellation state-ment" which permits buyers to cancel transactionswithout penal y or obligation within 3 days-of thecompleted sale. The Direct 'Selling Association hasrequested an opinion on conflicts between Sfate andFederal cooling-off requirements in instances wherethe cooling-off period varies.
In the 1974/75 legislative year, over 55 bills con-,cerning six major direct selling issuescooling-off,licensing, franchise regulation, pyramid selling, con-sumer complaints,and remedie, and' telephtine soli-citationhave been introduced in State legislalureS.In addition, several °States have introduced legisla-tion to enable local governments to enact ordinancesrequiring the licensing of peddlers, solicitors, and/ortransient merchants. With increased emphasis beingplaced on the rights of the consumer in the market-

Nonfood Retailing(in millions of dollars except as noted)
Percent Increase Percent1963 1967- 1963-67* 1972 19 -72*
Department storesSales 20,537.3 32,344.0 12.0 51,085.5 9.6.Payroll 2,941.9 4,673.4Number of eitablisliments
with Payroll 4,251 5,792 8.1 7,742 6.0Employment (000) 1,021.2, 1,324.0 6.7 1,594.0 3.8
Women arpercent of total 69.3 69.0 69.0Mail order houses
Safes 2,378.5. 3,083.8 6.7 4,574.1 8.2Payroll 360.0 558.5 736.8Number of establishments
with payroll 3,172 4,430 8,7 5,410 6.9Direct selling
Total sales 2,372.7 2,494.3 1.3 3,983.4 , 9.8All establishmentsgales of establishments with
payroll
66,223
1,721
77,632
1,719
4.3 141,294
2,349
12.7.
6.5Payroll 362.2 330.0 483.8Number of establishments
with payroll 9,323 6,9 ?1 8,864 4.9
ompound annual rate of growth.Estinnterkby BDC.
mplace, it' is reasonable to expect that gover entefforts will focus 6n direct selling' in the fut re. '
Future Directions
Direct and mail order sales will continue' to ex-pand rapidly. A more affluent and older population,with limited time for shopping at a retail storey; willpiefer to make purchases in the home. Ease of entryinto direct selling should continue to offer enter-prising people and crOanies an opportunity toprovide a viable service. The Mail 'order field isexpected -to remain dominated by large firms usingmodern sales ;management and production tech-niques. About I 1 percent of these establishmentsshould continue to account for almost 50 .percentof mail, order, sales. However, the diversity of prod-ucts adaptable to the mail order technique will pro-vide smaller firms the opportunity to grow rapidly.Consumers will continue t6 favor buying by mailorder because of its convenience, higher gasolthecosts, growing price consciousness, and the interest-ing and unique merchandise offered.
7APPAREL STORES
Despite growing competition for the apparel dol-lar from department stores and the home sewing,market, sales of men's and women's apparel storescontinued upward during the past decade, increasing
50
..: 1974'Percent
1972-74*
5,214.0
4 541 1
2,675.6
6.7
6.877;
,6.7
1
at a 5.5 percent annual 'rate from 1963 to 1,974.Apparel.'Stc*e sales in 1974-, reached an' estimated$16.4 billion. Specialized apparel stores generallycan offer. more personalized attention to cdstonier§and adapt inventories rapidly to new style trends.Part-time workers ften employed by apparel shops,help improve' e iency by limiting the number offull-tiMe workers employed during slow periods.
Apparel'Stores Move to Subarbit
Apparel retailers account for a substantial portionof the movement of stores from downtown areas to i
suburban shopping .centers. Stores carrying moreconservative styles and clothing for the family havebeen particularly active, in suburban areas. Many ofthese are branches of long-established downtownstores, while others are small, independent one- ortwo-store companies. New stores opening in down-town areas tend to features.the newer .styles, cateringto foung single adults, and-yoUng couples withoutchildren. Such groups of customers traditionally,spend larger portions of their incomes. for apparelthan do older individuals or families with childrenand ,therefore constitute a desirable market. Compe-tition for this market is keen.
Casual Clothes are 'Popular
Apparel retailing has grown rfpidly in.. recentyears, as a result of high levels of disposable in-
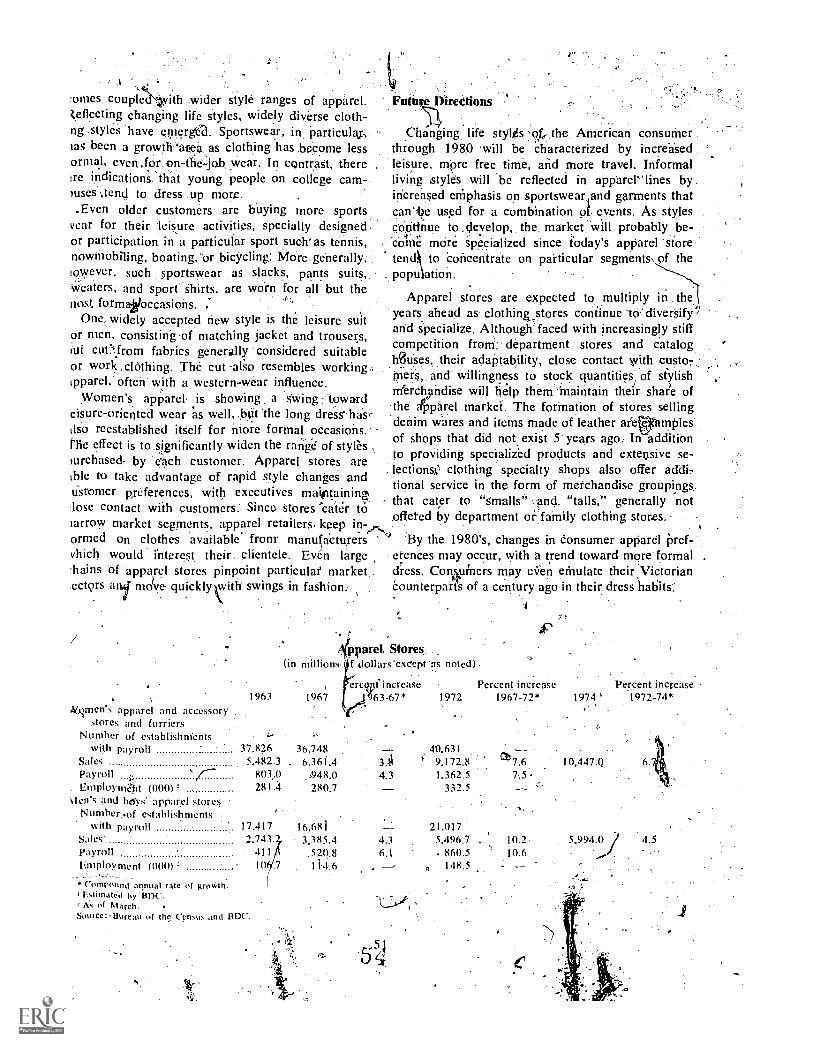
:ornes couple with wider style ranges of apparel.reflecting changing life styles, widely diverse cloth-ng styles have entered. 8portswear, in. Particulas-,las been .a grow th'a'rea as clothing has .become lessorrnal, even .for, on -the --job wear. In contrast, thereire indications, that young people on college camruses iend to dress up more.-Even older customers are buying more sports
year for their 'leisure activities, specially designed.or participation in a particular sport such' as tennis,nowrnobIling, boating, 'or bicycling: More generally;lowever, such sportswear as slacks, pants suits,'Weaters, and sport' Shirts, are worn for all but thenost fOrmayoccasions.
One, widely accepted new style is the leisure suitor men, consisting of matching jacket and trousers,iui ct0.from fabrics generally considered suitableor work sclOthing. The cut -also resembles working,,ipparel, often with a western-wear influence.
Women's apparel, is showing a Swing 'towardeisure-oriented wear as well, .hnt the long dress' ha's,'ilso reestablished itself for more formal occasions.'rhe effect is to.significantly widen the rangd'of stylesmrchased by each customer. Apparel stores areible to take advantage of rapid style changes anduStomer preferences, with executives mail tainin4:lose contact' with customers. Since. stores 'cater to'arrow market segments, apparel retailers. keep inormed on clothes available from manufacturersvhich would interest their, clientele. Even large:hales of apparel stores pinpoint particulat market,.ect9rs and move quickly zith swings in fashion:
Future iiireitions
Changing life stylis 'of, the American consumer.,through 1980 'will be characterized by increased
, leisure, mere free time, and more travel. Informalliving (styles will be reflected in apparellines byincreased ernphasis on sportsweariand garments thatcan'te used for a combination of events. As stylescontinue to .develop, the market will probably be-come more specialized since today's apparel storetend. to Concentrate on particular segments of thepopu ation.
Apparel stores are expected 'to multiply in theyears ahead as clothing stores continue 'to' diversify'and specialize. Although. faced with increasingly stiffcompetition froni: department stores and cataloghOuses, their adaptability, close contact with custo7
...
triers, and willingness to stock quantities, of stylishm'ercbandise will help them `maintain their share ofthe allparel market: The forMation of stores sellingdenim wares and items made of leather areWriplesof shops that did not exist 5' years ago.. In additionto providing specialized products and exteusive se-
, lectionsl,s, clothing specialty shops also offer addi-tional service in the form of merchandise groupings.that cater to "Smalls" ;and "tails," generally notoffeted by department oifarnily clothing stores.,
,
By the 1980's, changes in consumer apparel Pref-erences may occur, with a trend toward more formal .
dress. Con4ulners may even emulate their VictorianCounterparts of a century ago in their dress habits:
kvten's apparel and accessorystores and furriers'
Number of establishmentswith payroll
1963.
37.826
pparet Stores(in millions if dollars 'exCept 'as noted)
crew-increase1967 1(4063-67* 1972
36,748 . 40,631Sales . 5,482:3 6,361.4 3.41 9,172.8Payroll 4,, 803.0 4.3 1,362.5Employ ini;lit (000) . 281.4 280.7 332.5
,len's and beiys' apparel storesNuMber.:of establishments
with payroll 17,417 16,68 21,017Sales' 2,743. 3,385.4 4.3 5,496.7Payroll 411 .520.8 . . 860.5Employment (000) ' 10
,fill148.5
, .
Compound annual rate or gromith.Estimated by 'BM%
2 As of March.SOIll cc : Mire au of the Census and FIDC.
_51
Percent increase Percent increase1967-72* 1974' 1972-74*
7.67.5
, 10.210.6
10,447.Q
5,994.0 / 4.5. ,

FOOD RETAILING
GROCERY STORES
Grocery stores continue to represent the lion'sshare of retail food sales, accounting for more than92 percent of all food sales. During the past decade,grocery store sales', employment, and wages haverisen substantially, reflecting a mixture of. real growthand inflation. The grocery store operation which hasremained unchanged for many decades is now onthe threshold of major technological advancementwhich promises to significantly improve productivityand management control.
Grocery Store Sales Grow SharplyGrocery store sales more than doubled from 1963
to 1974, rising from almost $53 billion to more than$111 billion. Accounting fora large portion of theincrease in sales were prices which rose at a mod-erate 3.1 percent annual rate during 1963-72 andthen accelerated to an annual rate of 15.6 percentbetween 1972 and 1974. The price- rise between1972 and j974 exceeded the entire increase in pricesfrom 1963 to 1972 because of sharply higher rawmaterial, marketing, prdduction, and distributioncosts since 1972. Between -1963 and 1972 grocerystore sales rose 6.6 percent annually, from $53 bil-lion to $93 billion. In the 1972-74 period sales rose9.2 percent annually, albeit on a larger base. Grocerystores with paid employees account for the bulk ofgrocery store sales 96.5 percent of all grocerystore sales in 1972 compared with 95 percent in1967 and 94 percent in 1963.
In 1972, there were 194,300 grocery stores, down21 percent and more than 50,000 fewer stores thanin 1963. This reflects the demise of "mom and pop".stores, the family-operated neighborhood grocerystore. Establishments with payroll declined only 3percent from 132,100 in 1963 to 128,100 in 1972.'
The size of grocery stores has grown. In 1963,the Progressive Grocer's annual report of the groceryindustry indicated that the average store area was19,900 square feet. In contrast, average area in 1974was 30,000 square feet. Growth in store size wasinfluenced by several factors, including greater landavailability in the suburbs where. many stores werebuilt, the addition of new lines of nonfobd merchan-dise, the proliferation of the number of food items;and the desire to achieve economies of scale.
Employment. GainsWith the growth of large supermarket operations
since 1965, grocery store employment increased
sharply. Employment rose from 1.1 million in No-vember 1963 to 1.5 million in March 1972, indicat-ing an. increase in the average number of employeesper establishment.
The number and prop ti of women workersemployed in grocery 'stores have increased: .From1963 to 1974, the number of women employed in allfood stores; including grocery stores, rose from356,000 or 29 percent of the workforce to 627,200or 36 percent :of total employment.' Contributingto the increased' employment of women in foodstores was the general increase in the number andproportion of women in the workforce as well as thegrowing opportunities for part-time employment inlocal neighborhoods for housewives, with children,who were unable to be employed full-time.
Wages in the food industry have risen substan-tially while the. workweek has fallen slightly. AVer-age weekly earnings almost doubled from 1963 to1974, increasing from $'67.74 to $120.34. Averagehourly earnings rose from $1.93 in 1963 to $3.68in 1974, reflecting sharp wage gains under collectivebargaining, especially since 1970. Average weeklyhours declined from. 35.1 in 1963 to 323 in 1974,reflecting the growing number of part-time wor ers,a trend likely to continue into the future.
Major Factors Affecting Industry Trends
Among the factors contributing to grocery storesales growth during the past decade were popu ationincreases and rising incomes. The per capita- faodconsumption index rose from 96.6 in 1963 to'a highof 103.5 in 1972, and then declined slightly to 102.9in 1973. Sales also were influenced by changes in theproduct mix, reflecting consumer preference for con-venience and processed foods and increased con-sumption of meat, poultry,, and fish.
Grocery stores have been'greatly affected by theshifts in population in recent years. Successful storeoperators attempt to 'anticipate and follow popula-tion shifts in opening new stores. Although the num=ber of establishments with payroll has -remainedstable, the location of these stores has changed con-siderably and is no concentrated in suburbia. Storeoperators are continually owning new stores andclosing those that have becolre marginal operationsor unprofitable.
1 These data, published by the Bureau of Labor Statistics, represent ,-SICs 541-3, grocery, meat, and vegetable stores. Grocery store em-ployees, based on a comparison of Bureau of the Census and Bureauof Labor Statistics total employment figures for a comparable March1972 period. represent 90.2 percent of grocery, meat, and vegetable .
store employees.
52
JJ

Factors affecting current grocery store operationsinclude inflation, health consciousness, and govern-ment regulation. The effect of inflation on grocerystore merchandising is yet to be fully. felt. Higherprices may lead consumers to return to basics fromconvenience-type foods. The present and future mixand pricing structure of grocery stores will have tobe continually evaluated. Also, the grocery industryis coping with the greater health and nutritionalconsciousness of consumers, aided by new and pro-posed government regulations requiring nutritional-type information. The- outcome of these develop-ments will be reflected in the mix of food productsavailable to ,the consumer in the future. Other gov-ernment propdsals under consideration that mayaffect future industry trends are nonreturnable bev-erage container bans and requirements that a'pricebe displayed on each individual item sold.
Future Directions
Grocery stores will continue to reflect populationand income trends. Food is, of course, an essentialitem, and food at home accounted for 14 percent ofconsumer spending in early 1975.
The industry today is on the threshold of a majortechnological advancement with the developmentand introduction of the Universal ProdUct Code and`the, automated front-end.'
,The Univ rsal.Product Code is a postage stampsize symbo consisting of bars of varying thicknessand numbers. When passed over an optical scan-ning device, the symbol, utique for that product andsize, is transmitted to a computer, which identifiesthe product, matches it with its price, and recordsthe transaction. .
Qsing this system, the grocery clerk no longer hasto key in prices on a cash register. Instead, theclerk passes the item over the optical scanner whichreads the Universal ProduCt Code-. The system pro-vides' for comprehensive inventory control sincetransactions are recorded for each specific product.
This system can result in fewer errors, speedier:heckout, more informed ordering, fewer out-of-;tocks, tracking of inventory movement, identifica-tion of products selling poorly or well, and bettei:ustomcr service. Already in operation in a handful,-)f test stores, the product -coding, system can gen-erate cost savings which have the potential to eitherreduce food prices or hold the line on them.
The retail food industry also is at. the forefront)f another major technological advancement---elec-Ionic fund trans . This system, involving the use)f telephone line nd computers, debits the custo-
,
mer ,s bank account and credits the merchant's ac-count for the amount of the transaction each timea sale takes place, Some transfer systems allow thecustomer to make deposits and withdrawals in par-ticipating supermarkets. Supermarket operators inseveral States already have developed an electronicfund capability and others are considering installingthe system. It is expected that the use of these trans-fers may become widespread in the next few years.
There will be a greater diversity of store types inthe years ahead. Grocery store operators are experi-menting with new store concepts to provide food at
-lower costs. One large company has opened severalsmall stores, with limited hours of operation andsmall staffs, which carry about 700 items, many ofthem private label products. Another large grocerychain is using previously unprofitable supermarketsas "compact stores," offering about 1,000 fast-mov-ing items representing the full range of product typessold in supermarkets, except general merchandise,If these experiments prove successful, smaller limitedproduct stores are likely to become widespread,
At ihe other end of the spectrum is the super-store or hypermarche. Ranging up to more than100,000 square feet in size and carrying a full rangeof general merchandise as well as food, these storesmay become the flagship of the industry. Several.arenow operating in various sections of the country anda number of supermarket chains are consideringopening others.
Not to be confused with the experimental smallstores, convenience stores also are expected to growin number, sales, and market share. Characterized assmall self-service stores having long hours and fea-turing a limited product selection, convenience storesare expected to continue to expand their share dfthe grocery market. These stores, as their name im-plies, offer convenience to the shopper in the formof continuous, or long hours and daily operation.
The long-term trend in the reduction of the num-ber of grocery stores, however, is likely to continuein'the years ahead, The disappearing grocery storesare generally family-operated neighborhood stores,representing an earlier era of food retailing that hasfaded in the face of today's economics. Althoughfood retailers will continue to try to emPhasizeper-sonal service, these grocers will not be able to replacethe personal rapport that existed at the corner groc-ery store.
Energy, too, will have an impact on the groceryindustry. It may also influence decisions on thesuperstore as store operators focus on outlets de-signed for maximum energy conservation. A wide
53.5

range of factors will be considered in new storeconstruction, including location, size, land neededfor parking facilities, frozen food display 'equipment,store design, lighting, heat, cooling, and power gys-terns. Grocery stores built in the years ahead willadopt to changing economic conditions and con-sumer needs.
RESTAURANTS AND BARS
During the past decade, the shift in populationfrom urban to suburban areas moved potential cus-tomers away from downtown restaurants :and re-sulted in strong suburban restaurant growth. From1967 to 1972, sales of eating and drinking placesincreased 9.1 percent annually, from $23.8 billionto $36.9 billion, and the number of establishmentsrose .from 348,000 to 360.000. In 1974, industrysales totaled 'an estimated $45.8 billion, with drink-ing places accounting for 15 percent of all sales.
Reflecting the inroads made by chain restaurantsin recent yearsrestaurants with paid employees ac-counted for four-fifths of all establishments but 96percent of all sales in 1972 despite, a small increasein the number of family-owned or "ma and pa"type of operation from 1963 to 1972. Similarly, onlyabout three-fourths of all establishments primarilyserving alcoholic beverages have paid employeesand account for 90 percent of all bar sales. Be--ycause an increasing number of restaurants are serv-ing alcoholic beverages, sales of drinking placesreflect a shrinking market share of all r taurant andbar sales, falling from 21 percent in 1,967 to 17percent in 1972.
Fait Foods Lead Restaurant Growth
The most rapidly growing segment of the restau-rant industry has been the fast food category. Salesrose 13.2 percent annually between 1967 and 1972and increased its share of total market sales from15 percent to 23 percent during these years. Thefast food sector is expected to continue its rapidgrowth in the years ahead, further increasing itsshare of the total market.
Franchising organizations dominate the field withfranchise units selling everything from fried chicken,hamburgers, and roast beef sandwiches to pizza andtacos. The "fast food" concept fills a basic need pro-viding quick service and nutritious, uniform por-tions at reasonable prices. The industry also hasprovided increased. employment opportunities, par-ticularly for people who want to work on a part-timebasis.
Chains are Growth Leaders. .
During the past decade, major sales growth in thefood service industry has been accomplished throughmultiunit expansion and through company-owned orfranchised units.
According to an industry-sponsored survey, the25 largest companies in the field increased theiraggregate market restaurant share from about onefourth to almost one-third between 1964 and 1973.As a company expands, economies of scale in pur-chasing and advertising, as well as the ability toattract and retain competent management, oftenprovides a competitive- advantage over smaller unitgroups. For companies that operate on a national
Grocery Stores(in millions of dollars except as noted)
Percent increase Percent increase Percent increase1963 1967 1963-67* 1972 1967-72* . 1974' 1972-74*
Grocery storesall.establishments
Number of establishments(000) 244.8 218.1 194.3
Receipts 52.566.0 65,073.7 5.5 93,327.5 7.5 111,347.0 9.2Establishments with payroll
Number of establishments(000) 132.1 128.7 128.1
Receipts 49.186.9 61,770.6 5.9 90,048.2 7.8 107,434.3 9.2Payroll 3.693.3 4.897.5 7,845.7Paid employees (000) 1.080.9 1,241.8 1,471.7
Compound annual rate of growth.Estimated by BDC.1963 data are for the workweek nearest November 15, 1963. 1967 and 1972 data are for the week including March 12, 1967, and March 12,
1972.
54

Eating and Drinking Places(in billions of dollars except as noted)
1963 1967Percent increase
1963-67* 1972Percent increase
1967-72* 1974'Percent increase
1972-74*Ealing places
Number of establishmentsdat00).
Eslirshmerns with payroll
223.913,919.0
236.618,879.0 7,9 .
.
253.130,385.0
-
10.0 38.741.0 12.9
(000) 180.9 189.4 - 208.9Sales 13,329.0 17,955.0 7.7 '29,313.0 10.3Payroll 3,371.0 4,555.0 7.8 7,620.0 10.8Employment' (000(..- 1,490.0 1,737.0 2,31,7.0
Drinking placesNumber of establishments
(000) 110.6 111.3 106.4Sales .... ....... 4,493.0 4,964.0 2.5 6.482.0 5.5 7,020.0 41-
7Establishments with payroll(000) 83.1 81.8 - 78.4
-",
Saks \ 4,001.0 4,263.0 1.6 5,735.0 6.1Payroll 694.0 839.0 4.8 1,114.0Employment 7 (000) 272.0 296.0 317.0
I Estimated by BDC.As of November 15 in 1967 and 1963;.as of March 12 in 1972.Compound annual rate of growth.
Source: Bureau of the Census and BDC.
basis, a familiar corporate image results in readyconsumer Acceptance when new units are. opened ornew geograhic areas are penetrated.
Opportunities for moderately priced restaurantsthat provide a variety of menus, quality food, andefficient service are also expanding. Although therewill always be a demand for gourmet prepared foods,higher priced lupryl restaurants have been affectedby declining expense account business and less osten-tatious spending by younger adults.
Future Directions
The successful restaurant chain is flexible in itsapproach to the type of meals it sells, offeringdifferent specialties at different locations. Today,Americans consider eating out a "fun experience"and increasingly seek foods that represent culinarydelights of different ethnic groups-Chinese, French,Italian, German-, etc. When restaurants are plannedin a cluster setting, economies in ordering, delivery,and advertising can be maximized. Standardizedpreparation methods have resulted in greater effi-ciency. portion control, and lower labor costs for"chef - less" restaurants. More family-type full serv-
55
ice restaurants will probably offer less varied menusin the years ahead. The trend toward menu speciali-zation-steaks, roast beef, seafood, or chicken-hasalready begun. In recent years, medium priced res-taurants have sought to accommodate the "middleAmerican" consumer by offering a quality product,served in an atmosphere designed to create repeatsales. I
Restaurant and bar sales are expected to increasein the future because of changing American lifestyles that stress increased leisure time and greatermobility. Retirees and the growing young adultpopulation with a high proportion of working womenwill be eating out rather than preparing food athome.
Flexibility by food management in their approachto the needs of the consumer also will provide forincreased sales in the future. Recent innovations inthe fast food group include the addition of a break-fast menu and an increased number, of entrees avail-able. In the restaurant, area, changing the restaurantdecor and type of food served and new menu selec-tions will provide the means to adapt to changingconsumer preferences.

TECHNICAL NOTE AND SELECTED CENSUS TABULATIONSData from the Bureau of the Census which supplement individual industry statements in this publica-
tion are baed on 1967 Standard Industrial Classification Manual definitions in order to compare selecteddata from the Economic Censuses conducted' in 1972 and 1967.
The following statistical tables from the Bureau of the Census are based on the 1972 Standard Indus-trial Classification Manual' definitions and are not necessarily comparable to the 1967 Census.
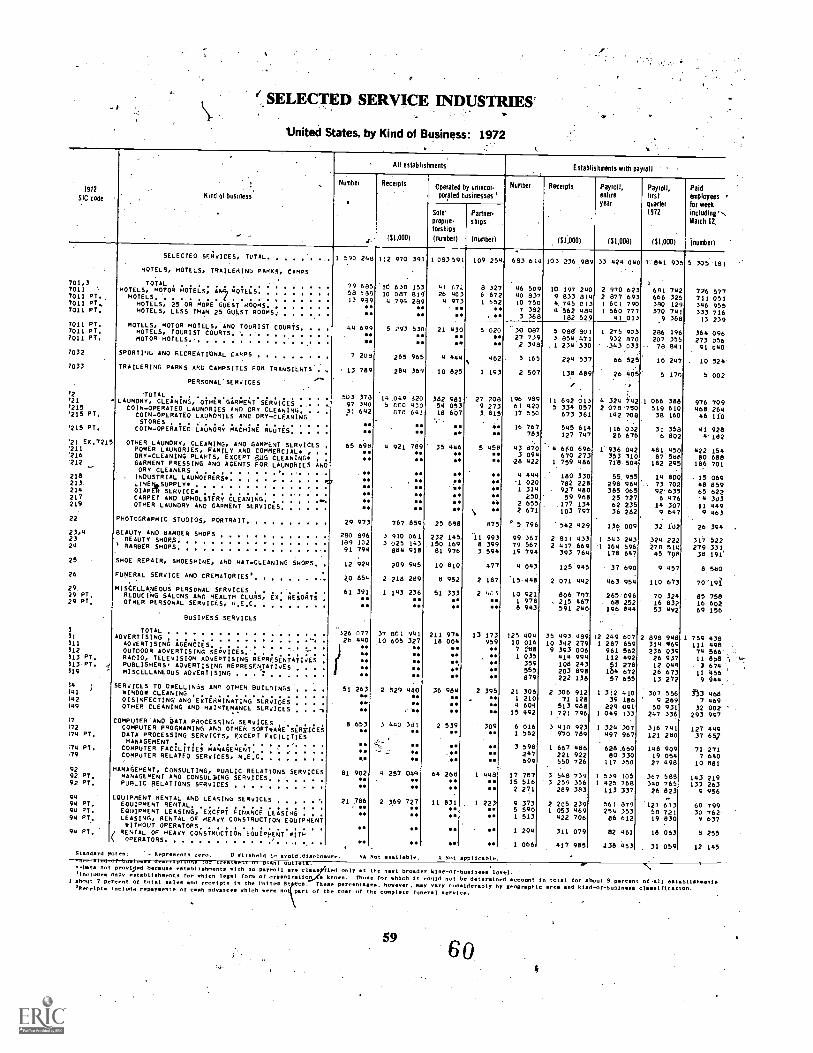
f
1:.SELECTED SERVICE INDUSTRIES'
United States, by Kind of Business: 1972
All establishments Ester li hments with payroll .
.
Number Receipts-Operated by unincor. Number Receipts. Payroll, Payroll, Paid1912
.
porated businesses' entire first employeesRind ol businessSIC code . 1lAr quarter for weekSole' Partner. 1972 including -,
March 12.mune- ships .
toeships
31,0001 (number) (umbel) (SIM (SIX% MOM Inumber)y,
number)1.
SELECTEO SERVICES, TOTAL 1 590 248 112 970 391 1 083591 109 254 683 614 103 236.989 33 424 040 7;841 935 5 308'181HOTELS, MOTELS, TRAILEHING PACKS, CAMPS
701,3 TOTAL 79 685 '10 6,38 )53 111 67a 8 327 46 1,09 ID 197 200 2 970 623 691 742 726 5717011 ' HOTELS, MOTOR HOTELS, A49, MOTELS 58 698 10 087 819- 26 403 6 672 40 837 9 833 814 2 877 693 666 325 711 0517011 PT. HOTELS.., . . . . . ( 13 939 4.794 289 4 973 1 652 10 750 4.745 013 I 601 790 . 390 129 346 95!7011 PT,, HOTELS, 25 OR HOPE GUEST ROOMS .,A 7 382 4.562 484 1 560 777 570 741 333 7147011 PT. HOTELS, LESS THAN 25 GUEST ROOMS so
, 3 368. 182 529 AI 013 9 386 13 2317011 PT. HOTELS, MOTOR HOTELS, ANO TOURIST COURTS. . . . 44 699 5 293 530 21 430 5 020 "30 087 5 088' 801 1 275 903 286 196 364 0947011 PT. HOTELS, TOURIST COURTS. '.. . . . . . . 0 0 27 739 3 854,471 932 970 207 355 273 OSE7011 PT. MOTOR HOTELS so 2 346 1 234 330 .343 033 78 841 91 o4CT032 SPORTING ANO RECREATIONAL CARPS 7 203 265 965 4 444
9462 3 165 224'537 66 525 10 247 10 521
7033 TRAILERING PARKS AND CAMPSITES FOR, TRANSIENTS. 13 789 284 369 10 825 1 193 2-507 138 669 26 cis' 5 170 5 001
PERSONAL. SERVICES /.
.
12 'TOTAL . . . . . . ,, . ! . . 503 378 14.049 320 362 981 27 208 196 989 11 692 013 4 324 i42 1 066 388 976 70,121 - LAUNDRY, CLEANING, OTHER.GARMENT SERVICES .,.. 97 340 5 880 430 -54 053 9 273 61 420 5 334 057 2 078'750 519 610 468 2611215 COIN - OPERATED LAUNDRIES AND DRY CLEANING.
. . _31..642 070 641 18 607 3.815 17 550 673.361 142 700 38 160 46 111'215 PT. COIN - OPERATED LAUNDRIES ANC DRY-CLEANINGSTORES
. . . . 16 767 545 614 116 032 31 358 41 921'215 PT, COIN-OPERATED LAUNDRY MACHINE ROUTES u 763 127 747 26 676 6 802 1 181'21 EX.7215 OTHER-LAUNDRY. CLEANING, ANO GARMENT SERVICES . 65 698 4 921 789 35 996 5 451A 43 850 4 660 696 1.'936 042 481.450 422 151'211 POWER LAUNDRIES, FAMILY AND COMMERCIAL , . 3 094 670 273 353 710 87 568 80 681'216 DRY- CLEANING PLANTS, EXCEPT auo CLEANING. . . 28 422 1 759 486 718.504 182 295 186 701'212 GARMENT PRESSING ANO AGENTS FOR LAUNDRIES AND
ORY CLEANERS . . . . . . ... , . . -..1. ... 4 444 . 100 330 55.955 14 BDO . 15 06'/18 INDUSTRIAL LAUNOERERsx. - ox.
.
::,..... 1 020 762 228 298 969 '..- 73 702 40 851213 A. 1 314 927 480 385 068 92'635 65 621214
LINEN. .. ... 250 59 968 25 727 6 476 '4 3u:217 CARPET AND UPHOLSTERY CLEANING ... 9 Amp 2 655 177 134 62 235 14 307 11 44.219 OTHER LAUNDRY AND GARMENT SERVICES \ so 2 671 103 797 36 262 9 647 9 46:
22 PHOTOGRAPHIC STUDIOS, PORTRAIT 29 973 767 859 25 688 675 " 5 796 '542 429 136.009 32 102 26 39123,4 BEAUTY AND BARBER SHOPS 280 896 3 910 061 232 195 -11 993 99 311 2 All 433 1 343 243 324 222 317 52;23 BEAUTY SHOPS' 189 102 3 025 143 150 169 8 399 79 567 2 417 669 1 164 596 278 514 279 33,24 ! BARBER SHOPS 91 794 884 918 81 976 3 594 19 794 393 764 178 647 45 706 38 19125 SHOE REPAIR, SHOESHINE, AND HAT-CLEANING SHOPS. 12 924 209 945 10 810 477 4 043 126 945 -.37 690 9 457 1358(26 FUNERAL SERVICE AND CREMATORIES!
. 40 859 2 218 289 a 952 2 187 15.448 2 071 442 463 954 110 673 70'19129. MISCELLANEOUS PERSONAL SERVICES . . . . . 61 391 1 143 236 51 333 2 403 10 921 806 707 265'096 70 324 8S 75129 PT. REDUCO4G SALONS AND HEALTH CLUBS, EX: RESORTS : A,A, 1 978 ,. 215 467 68 252 16 832 16 60129 PT. OTHER PERSONAL SERvICEs, N E C
8 943 591 240 196 844 53-492 69 151BUSINESS SERVICES
.
3 TOTAL 326 077 37 801 941 211 974 13 173 125 404 35 493 489 12 299 607 2 898.948 1 759 431II ADVERTISING - 26 490 10 605 327 18 004 959 10 016 10 342 279 1 287 659 314 169 111 991111 ADVERTISING AGENCIES . ., es 7 flAB 9 393 006 961 562 236 039 74 561712 OUTDOOR 09E117151NR SEPVICES.-. . . . s. ow ox. " 1 035 414 994 112 492 26 937 11 al713 PT. RADIO, TELEVISION ADVERTISING REPRESENTATIVES a A 0 359713 PT. v PUBLISHERS' ADVERTISING REPRESENTATIVES. . . flo .1 Oa 555 108 g: IN 278 12 ceT3
-if t;:49 - MISCELLANEOUS ADVERTISING ,OA. 879 222 138 57 655 13 272 9 Ow
$4 ) SERVICES TO DWELLINGS ANY OTHER BUILDINGS. . . 51 263 2 529 440 36 984 2 395 21 306 2.306 912 1 372 910 307 556 353 461141 ' wINDOO CLEANING . . . . . . . . . ... .e. 0. . so 1 210 71 128 39 186 ' 9 269 7 46'142 OISINFECTING- ANO EXTERMINATING SERVICES . . . 8 Am 4 604 513 988 224 091 50 931 32 00;149 OTHER CLEANING AND MAI "TENANCE SERVICES. . .-a AA 15 492 1 721 796 1 049 133 247 336 293 99'
17 COMPUTEWAND DATA PROCESSING SERVICES .' . . . , a 653 3 440 331 .2 539 309 6 016 3 410 923 1 324 307 316 741 127 49'172 COMPUTER PROGRAMING AND OTHEk SOF/wARE.SER1C10ES1 562 970 769 497 967 121 260 37 65;174 PT. DATA PROCESSING SERVICES, EXCEPT FACILITIES
MANAGEMENT . . . . . . . . 4 . . . .-.. .. . T. so ,,,,, 3 598 1 667 986 628.660 148 909 .71 27,174 PT. COMPUTER FACILITIES RANAGERENT . 0 247 221 922 80 330 19 054 7 691179 COMPUTER RELATED SERVICES, N E C ,o. '. 609 550 726 117 350 27 498 10 aa::92 MANAGEMENT, CONSULTING, PUBLIC RELATIONS SERVICES 81 902 4 257 049 64 268 1 948 17 787 3'548 739 1 539 105 367 589 143 21'12 PT. mANAGERENT ANO CONSULTING SERVICES. . . . . . . 0 .... 15 516 3 259 356 1 425 768 340 765 133 26:92 PT. PUBLIC RELATIONS SERVICES * 0 2 271 289 383 113 337 26 823 9 95194 EQUIPMENT RENTAL AND LEASING SERVICES 21 786 2 369 727 11 831 I 223 9 373 2 205 239 561 879 '127 673 60 79'94 PT. EQUIPMENT RENTAL... . . . . . . . . . . .
.
4,0 5 590 1 053 469 254 353 58 721 30 76SAI P7. EQUIPMENT LEASING, EXCEPT FINANCE LEASING .. . ox. 1 513 422 706 86 612 19 830 Y 63'94 PT. LEASING, RENTAL OF HEAVY CONSTRUCTION EQUIPMENT
wITROUT OPERATORS. . . . . . . . . . . . , . 0 0 1 204 311 079 82 461 la 063 8 25!99 PT. , RENTAL OF HEAVY CONSTRUCTION EQUIPMENT AITHk OPERATORS. . . . . . . . . . . . .'. . .. . . . 0 so 1 066 417 985 438 453 31 059 12 141
Standard Notes, - Represents zero. 0 withheld to avoid Atiaclusure SA Not available. X Not .PPIlcble.---..,,e-Ortertof-bus+rmrsm-dem-crtutsons tor tre.aeot or plAnt outlets.
,,
N,...Data not proytjled because emtblIshments .Ith no payroll are class only at the next broader kind -of-buiness 10001.'Include, only establilthente for which legal form of organizalon kno.n. Those for which it could not be deterained account in total for about 9 percent of-all establish...IsI shout 7 percent of total ales and In the United Std' cs. These percentages, however. may vary considerably by geographic isre and kind -of -bullness el ..... icatIOn.'Perot pia Include rprwento of csh sylnee hich .ere notl part of the coat Of the coeplete funeral Sere'. et,
5960

SELECTED SERVICE INDUSTRIES
United States, by Kind of Business: 1972Continued
1972
SIC codeNina of business
All establishments Otablishments with payroll
Number Receipts
(S1,000)
Operated by unincoirporated businesses,
Number Receipts
(51,0001
Payroll,entire.year
(51.000)
firstquarter1912
(S1.000)
Paidemployeeslot week
includingMatch 12.
'(numbet)
Solepiopiie-taiships(number)
.Partnei-Milos
(number)
BuBINESS SERVICES-.-CONTINUED
OTHER 73 OTHER RUSINESS SERVICES .. . . . 134 033 14 600_017 78 348 6 839 60 906 13 679 397 6 224 247 1 464 421 983 005732 PT. ADJUSTMENT AND COLLECTION AGENCIES AA AA As 4 201 422 167 189 09B 44 525 30 415732 PT. MERCANTILE REPORTING AGENCIES AA AA AA Po 381 174'385 91 812 23 306 11 63873? PT. CONSUMER CREDIT REPORTING AGENCIES. . *A AA A. MR 1 662 206 606 104 479 24 870 21 0797331 DIRECT MAIL /ADVERTISING SERVICES. A A 1 755 537 603 200 640 Va 217 33 3137332 Eit.UEPRINTING AND PHOTOCOPYING SERVICES. . AA AA AA 1 413 227 029 78 25B 18 209. 11 4927339 PT. STENOGRAPHIC, COURT REPORTING, TYPING SERVICES AA WA 1 616 120 877 46 687 11 352 7 54117339 PT,
7333
DUPLICATINGI SERVICES, EXCEPT PRINTING . . . .
COMMERCIAL P OTOGRAPHY, ART, GRAPHICS, AND
AA AA AA 792 83 098 30 972 7 612 4 741
RELATED 0 IGN . . . . . . . . . . . .. OA OA AO 6 055 Bel 613 319 316 75 856 35 0637333 PT, COMMERCI L P OTOGRAPHY 'AS 2 684 302'414 103 195 24 741 12 9687333 PT. COmmERCI RT (m. ' 1 387 213 756 B7 162 21 065 1857333 PT. OTHER . . . OA I 984 365 443 12B 9S9 30 050 13 910735 NEWS SYNDICATES OA AA 269 195 512 78 120 17 350
817361 PRIVATE EMPLOYMENT AGENChS MO AO 6 378 504 855 242 836 S3 547 S:7362 PT. TEMPORARY OFFICE rink. SUPPLY SERVICES x ... . OA OM AA 1 709 475 024 3S3 471 79 418 120 0397362 PT. TEMPORARY HELP SUPPLY, EXCEPT OFFICE WORKERS OA AA 1 244' 443.189 327 394 70 314 59 1367369 PERSONNEL SUPPLY SERVICES, N.E.C. . . . . .. MA OA AA 797 814 504 484 220 110 997 49 482
7391 COMMERCIAL RESEARCH, DEVELOPMENT LABORATORIES 4. .11h0 AA 2 021 . 1'764 057 908 595 219 132 72 5367397 COMMERCIAL TESTING LABORATORIES . . . . . 4oh 1 813 393 004 193 486 45 627 22 5157393 PT. DETECTIVE AGENCIES AND GUARD SERVICES * 3 490 912 252 669
9159 630 176 315
7393 PT. ARMORED CAR 'SERVICES. . . . . AA 1 019' 232 464 2 ::1 34 709 21 26Q7393 RT, BURGLAR AND FIRE ALARM SYSTEMS sits AA 717 274 785 119 219 28 981 14 3827345 PHOTOFINISHING LABoRATORIES 00 Ao; Ax, 1 979 1 165 297 700 849 72 527 44 4177396 :TRADING STAMP SERVICES (SALES 'OFFICES) 261 57Q 397 2R BBB 7 364 3 5S97399 PT. SIGN PAINTING SHOPS *A A* 1 546 105 529 38 193 B 9S3 S 7487399 PT. INTERIOR DESIGNING. . . . . . . , -*A 1 697 241 191
'64ji
15 180 6 7927399 PT. TELEPHONE ANSWERIN SERVICES 1 AA AA 2 403 204 8807399 PT. WATER SOFTENING SERVICES 1 593 227 552
10176
24 60317 745
26 11210 091
7399 PT. PACKAGING AND LABELING SERVICES OA 11 701 217 119 79 723 19 107 14 2387399 PT. MISCELLANEOUS BUSINESS SERVICES, N E C OA WA 13 444 2 284 388 955 435 225 210 137 079
AUTOMOTIVE REPAIR, SERVICES, AND GARAGES
1
75 ,TOTAL . . . 1. . ... . ....... 168 959 , 12 081 100 102 748 14 440 90 536 10 928 961 2 553 377 606 759 392 498753 AUTOMOTIVE REPAIR SHOPS 127 203 1 7 045 122 85 192 11 301 65 49B 6 134 262 1 699 338 398 475 237 865'7538 GENERAL AUTOMOTIVE REPAIR SHOPS . . . 71 862.1 '3.175 673 52 029 6 154 30 652 2 569 121 653 285 1S2 518 98 2387538 PT. GENERAL AUTOMOTIVE REPAIR SHOPS, EX. DIESEL A. A M1. AA A AA 29 175 2 343 642 S91 777 138 423 90 4797578 PT. DIESEL REPAIR SHOPS . . . . . . . . . . AA , AA 1 477 225 479 61 50B 09S 7 7597531 TOP AND BODY REPAIR SHOPS 31 B10, 1 776 468 1 20 971 3 109 18 293 1 577.588 ABS 953 115 396 65 6S9
7534,5,9 OTHER AUTOMOTIVE REPAIR SHOPS 23 531 1 2 092 981 , 12 192 2 038 16 553 1 487 573 S60 100 130 .561 73 9687534 TIRE RETREADING AND REPAIR SHOPS Ai AA 2 056 485 541 110 769 2S 973 15 6487535 6A/NT SHOPS . . . . . . . . . . . .. A AA 2 463 232 36S 77 907 18 635 41 4707539 PT. AUTO ELECTRICAL AND FUEL SYSTEM SERVICES AA 522 133 441 36 52B B 541 S 2817539 PT. RADIATOR REPAIR .. AA 1 AA AA 2 058, 156 073 42 614 9 57B 5 9227539 PT. GLASS REPLACEMENT AND REPAIR7534. PT. BRAKE, FRONT END, ANY ((HEEL ALIGNMENT
AA A! to AAAA I
AA r 0111 266 6942 304, 243 247
72 72579 992
1718 g::
8 7609 936
7539 PT. EXHAUST SYSTEM SERVICES (MUFFLER SHOPS) AA 1 AA AA AA 128 1 170656 44 02B 9 540 4 8857539 PT. TRANSMISSION REPAIR SHOPS : . . . ..7534 PT. OTHER AUTOMOTIVE REPAIR SHOPS, N E C
AA 1 AA AA' 2 449 215 7021 AA AA 762! (33 854
70 76224 77S ig rog
8 72B3 338
751. AUTOMOTIVE RENTAL AND LEASING, WITHOUT DRIVERS 10 474 3 55B B25 2. 175 415 7 390 1 3 4136 412 482 550 117 294 62 6877512 PT. PASSENGER CAP RENTAL, WITHOUT DRIVERS . . . ow, AA mo 2 332 1 002 209 161 651 39 692 24 7617512 PT. PASSENGER CAR LEASING, EXCEPT FINANCE LEASING A 1 451 1( 755 199 62 038 14 946 7 2S27513 PT. TRUCK RENTAL, WITHOUT DRIVERS . . . . . . AA 939 1 451,-554 58 296
1:
7.3177513 PT. TRUCK LEASING, EXCEPT FINANCE LEASING SA OS 2 326 1 241 805 '194 83S
:::22 525'
7519 UTILITY AND RECREATIONAL VEHICLE RENTAL AS AA 3421 35 6451
5 730 832
752. AUYOmORILE PARKING7523 PARKING LOTS ),. io 505 725 305 2 2571 9 389 1 711 368
7 396 420 770174 76294 949
43 09523 390
37 29522 990
7525 PARKING STRUCTURES AA :41- JAA 1 993 290 59B 79 813 19 705 14 30S754 AUTOMOTIVE SERVICES, EXCEPT REPAIR 20 777 1 751 846! 13 174 t 2 037' B 259 I 596 899 196 727 97 895 54 6517542 CAR +ASH. . . . . . . . . AA 1 AA 6 267 1 429 394 136 072 692 45 2677544 'OTHER AUTOMOTIVE SERVICES 1 992 1 167 505 60 655 203 9 384
MISCELLANEOUS REPAIR SERVICES
148 9251
176 TOTAL . . . . . . . . . . . . . .... 5'854 906 117 399' 6 632 46 677, 4 835 956 1 585 687 369 029 206 842767 ELECTRICAL AND ELECTRONIC REPAIR SHOPS7622 RADIO AND TELEVISION REPAIESHOPS
53 357.1 2 142 081 42 141 2 370 16 565, 1 729 26134 RIO 1 086 464 28 361 1 563 9 850 829 349
573 148260 327
135 10363 061
74 44238 015
7673,9 OTHER ELECTRICAL AND ELECTRONIC REPAIR 18 547 1 1 P55 617 13 780. 607 6 714 899 912 312 821 72 042 36'4277623 REFRIGERATION AND AIR-CONDITIONING REPAIR AA AA 2 868 304 996 89 606 19 793 10 2747629 ELECTRICAL AND ELECTRONIC REPAIR, N.F.C. AA [ 846 1 594 916 223 215 52 249 26 153764 REUPHOLSTERY AND FURNITURE REPAIR 24 499 1 490 594 20 550 1 136 6 821 334 249 106 377 5 191 19 139
763,9 OTHER REPAIR SHOPS AND RELATED SERVICES763 WATCH, CLOCK, AND JEWELRY REPAIR. .
769 MISCELLANEOUS REPAIR ANO RELATED SERVICES .
71 069 7 222 231 54 708 3 126 21 291 1 2 778,2,'=,
WA . AA AA 21 766 2 683 106
906 16227 32187B 841
22d18 77561
202 123
113 2614 256109 005
7692 WELDING REPAIR. . .. , AA AA AA 4 7171 367 303."9 5"
8577644 ARMATURE KEwINDING SHOPS. .. . . .... AA AA AA 2 473 . 606 067 124: :1!, ;51 8687699 PT. FARE, MACHINERY AND EQUIPMENT REPAIR SHOPS7699 PT. LAWNMOWER, SAM, KNIFE, TOOL SHARRENING,REP417604 PT; SEWER AND SEPTIC TANS CLEANING. SERVICES .,
AA AA A. Ao 906AA A. A* I 396
1
AA As AA ! ,... 1 311
76 915100 762.122 197
17 144
478
3 9136 2659 492
2 7013 9055 217.
7699 PT. OTHER REPAIR AND RELATED SERVICES, N.E.C. .'. A.. i 11 367 1 409 862 469 583 110 043 59 457.
.
Standard Notes. - Rnpre.VnIS Fero. It Withhold to avoid dinclomure. NA Mot availably., X Not applteable.Dsta not provided becalm., entablishmento with no payroll are cl ..... led only at the next broader kInd-of-businen level..inrludel only establishment, for which legal forn of organiaation, Is known. Those for wnieh It could not be deiermined account In total for about 9 percent of all establishments
and .boot 7 percent of total sales and i.,eipts in the Ilnitetl Staten. Theme percentage,. nowewer,may vary ednsidnrahly by geographic area and kind-of-business clansification.
60
61

A
SELECTED SERVICE INDUSTRIES
United States, by Kind of Business: '1972 Continued
1912
SIC code
.
.
.Kire Of business'
All establishments' ' Establishments. with payroll
Number Receipts
""
.
(S1,000)
Operated by unmoor:paroled businesses I
. i
Number Receipts
(51,000)
Payroll,entireyear
($1,000)
Payroll,firstdwalter1972
01,0001.
Paidemployeesfor weekincluding 'March 12
(number)
Solemane.lorships(number)
Partner.ships ,
(number)
8,7981,2813An819 .'823 ,
824829
83832833
92' --
929 PT.929,9T.
929 PT.922 PT.922 PT.022 PT.922 .PT.
922 PT.
93 l',,,,BORLING932 .1!
933
9 EX.792,39191 PT.91 PT.
94141041 .PT.941 PT.{41 PT.141 PT.
148148 PT.146 PT.148 PT.Ho PT.148 PT.
9297939699 PT.99 PT.99 PT.99 PT.
172
1
11 PT.11 PT.il'.
.AMUSEMENT AND RECPEATIO, ,SEnviCES,
INCLUOI{NG MOTION PICTURESt
TOTAL . ....... . . . . . .
MOTION PICTURE PA .. RipUTION, SEmVICESPOTION PICTURE PRODUCTION, EXCEPT FOR IV.MOTION PICTURE, TAPE PRODUCTION FOR TV.
.
SERvICES ALLIED TO POTION PICTURE 900DoLT10NmOTION.PICTuRE FILM EXCHANGES , . . . .
FILM OR TAPE DISTRIBUTION FOR 'TV. .
SERVICES ALLIED TO MOTION PICTURE DISTRipuTI
POTION PICTURE THEATERS . . . . . . . .
MOTION PICTURE THEATERS, EXCEPT DRIVE-IN.DRIVE -IN MOTION PICTURE THEATERS.
PRODUCERS,.ORCHESTRAs, ENTERTAINERSDANCE RANDS, ORCHESTRAS, EXCEPT SYMPHONYSYMPHONY ORCHESTRAS, OTHER CLASSICAL MUSIC ANDDANCE GROUPS . . . . i . 9... .
OTHER ENTERTAINMENT PRESENTATIONS INCL. VARIxTPRODUCERS OF LEGITIMATE THEATER . . . . .
,PRODUCERS OF RADIO AND TO SHONS, EXCEPT TAPE.THEATRICAL SERvICES
. . . . . . . . .
ARTISTS, AND ENTEATAINEmS, MANAGERS 04AGENTS, CONCEPT BUREAUS, POOKIN, AGENTS.OTHER THEATRICAL SERvICES . .. . .
ALLEYS, BILLIARDS, POOL{
BILLIARD AND POOL. ESTAPLISHmENTS1900LING A L L E Y S . , , , , . . . . , .
.
OTHER AMUSEMENT AND RECREATIONISERvICES .
DANCE HALLS, STUDIOS, AND SCHOOLSRUBLIC DANCE HALLS OR RALLR00,15DANCE SCHOOLS, INCLUDING CHILDREN'S 11,0PROFESSIONALS, . . . . . .
COMMERCIAL SPORTS . . . . . . . . . .
PROFESSIONAL SPORTS CLO8S, mGHS, PROxOTERS. RASERALL CLUBS
FOOTBALL CLUBS . . . . .......OTHER PROFESSIONAL SPORTSMANAGERS AND PROMOTERS
RACING, INCLUDING TRACK OpERATIO,.RACETRACK OPERATION
AUTO RACETRACK OPERATIONHORSE RACETRACK oPERATIO.DOG RACETRACK OPERATION
RACING STABLES, RACING, N.E.C
PuPLIC GOLF COURSES, EXCEPT MUNICIPALMEMBERSHIP SPORTS AND RECREATION CLURSCOIN-OPERATED AMUSEMENT DEVICESAMUSEMENT PARES . . . . . . R. . .
CONCESSION OpERATORS'OF AMUSEMENT 8E4ICES,R1
FAIRSCARNIVALS, CIRCUSES ..... . . . . . . .
&)4MiROI;.,..RECAEITi0,7, :,NO.:{m5MiNTS:
DENTAL LARORATOuIFS
TOTAL
. LEGAL SM./ICES
TOTAL,
ARCHITECTURAL, ENGINaRINO, ANDLAND- SURVEYING SERVICES
I.
.TOTAL
ARCHITECTURAL sERvICFS 0ENGINEERING SERVICESL,N9SUMVEYIN5SERVJCES e.
. . 145 9836 555....
N
12 699
47 727
...
.
'...0
.
Au
14 301,5 847'
' 8 454
, 62 701
. ..
on.
..
A.
..
ES. . .0
... . AN
8 543
. 144 452
64 246.0
' ..L
13 445 0502 920 415
A.A.
I 832 R6.8
.
1 436 093
.0.
. I'.
A.
.
1 204 03,.115 199
1 088 098
6 051 537..A.
..,, ..
..
.0..
573 126
10 935 178
7 588 117....
84 2783 174
...,{.{
2 321..
41 444
.̀.
6 8984.0882 810
30 439
..
R.
..
..
..
..
5 095
95 820
41 5761,.0.1.
1 .
7 960443j
..
... 993..
1'225. A.
i.,..
ee
A.
1 112472640
4 199
..
..
...
..
..
722
25 488
5 304....o
66 0644 7041 3921 138855877151291
11.670,8 326.3 342
7 6413 018
3691 735
934256
1 249
809,440
9 0482 5316 517
33 9012 370
339
2 031
2 733'5377,52
46173166
2 196803
!'593.24743
1 313
2 31159 5532 061
6821 041
037529
11.380
''S 131
77 262
29 02210 54413 6764 802__.
1.2660 1132056 799238 517464 971389 419
1 3.1 491319 64863 253
..1 815 9161 402 758413 158
1 110 505109 624
P5 497297 671277 209
. 92 842257 456
156 362'99 094
1 142 266el 004
1 061 262i
5 734 627p9 515.21 905
65 610
1 520 279512 904120 207144 440151 19397 064
1 007 375893 241102 989684 232106 020114 134
257 363.1 598 528
297 406467 718112 83297 56560 521
1 232 900
510 579
9 724 199
7 186 4392 203 9934 567.369
415 077
,
3 846 259.795 490217 911241 094148 476135 02333 30119 683
381 065300 03981 026
473 86158.303
82 67192 P1299 84230 360009 873
55 86054 013
324 05620 115303 941
I. 873 78733 2527 424
25 820
433 450207 01960 54563 24455 13028 092
226 431194 32716 342
153 P6054 12532 104
82 724649 661.72 027159'04327 34719 72615 971380 586
218 376
,
2 317 640
3 355 721869 426
2 275 52I210 774
860 BIM192 31451'92357 99633 965.34 8528 7844 794
90 30673 20817 099
112 85414 122
20 91421 26123 3577 17726 023
13 20212 821
84 513'5 41579 094
380 9018 6841 804
6 880
92 46645 5359 20711 10117 9977 230
'46 95139 3442 66731 3425 3357 607
14 402127 54616 94026 3434 0612 7122 51785 210
52 230
537 016
768 927197 251525 44846.22ft
653 04764 66016 94115 10611 97515 1102'0753 453
127 435101 73725 698
58 35915 880
9 6599 327
10.M,-2279910 972
4 3966 076
94 8776 463
68 414
307 716'10 7562 739
6 017
48 30814 5153 9441 509
, 5 7071 3 355
33 79327 886
. 4 20119 8943 7915 907
12 785116,54610 16520 3993 8933 2052 688
78 971
29 827
267 656
292 58"673 683190 90627 998
Standard Notes. - Represents zero. 0 Withheld to scold dlsdosure.. NA Not available. Y Not appl,cab/e."Data not promdedbecause etadlshents with no payroll are damnified only of the next broader kind,tf-business level.'includem only establishments for which legal form of organlration in know,.
Those for which it could not be determined accOunt In total for about 9 percent of all establishments1 about 7 percent or Iola! sales and revel pis in the United States.
These percentages, however, may vary considerahlyhy geographic area and kind-of-bustnesn classtricatlon.
612

RETAIL .TRADE
United Statei, by Kind of Business: 1972
.
.1912
SIC cedeReid al business
-
All establishments Establishments Wilk payroll
Number
,
Sales
31.0001
Operated byunincorporated
businesses
Number
'
Sales
'
(91,000)
Payroll,entire year
MAO)
'Payroll,firstWaiter1912
(91,0001
.
Paid'employeesfor eel*includingMarch 12
(number)
Soleproprre'torships
(number)
Partnerships
(number)
. .. RETAIL TRADE, TOTAL 1 912 871 459 040 436 987 554 149 742 1 264 922 440 221 656 55 372 140 13033 237 11'210 99E
.
6UILDING MATERIALS, HARDWARE, GARDEN SUPPLY,.
6AND MOBILE HOME DEALERS .
,
.. ,
52 TOTAL . . . . . . . . . . . ..... ... 83 842 23 844 148 30 938 8 248, 62 046 22 957 855 2 674 905 61P-950 '405 325521,3, RUILOING MATERIALS ANO SUPPLY STORES. . . . . .. 38 881 15'313 940 10 471 3 431 31 869 15 027.431. 1 784 225 410 595 250 469521 ,LUMBER AND OTHER BUILDING MATERIALS DEALERS . . A. A. . 23 062 13 526 507 1 550 984 354,896 2L5 555523 PAINT, GLASS, AND pALLFAPER STORES , :: 8 807 1 500 924 233 241 55 699 34 914525 MARDmARE STORES
. . . . . . . . . . . . . . . . 26-374 '5 957 373 12 173 -3 432 18 530 3 634 359 490 279 113 922 95 164526 RETAIL NURSERIES, LAWN AND GARDEN SUPPLY STORES . 8 ui 829 547 5 109 555 3 849 694 607 121 537 26 034 22 051527 m081LE ROME DEALERS . . . . . ..... . . . , . lo 456 3 743 288 3 185 ..830 7 .798 3 601 258 278.864 61 199 37 631
GENERAL MERCHANDISE GROUP ,STORES
53 TOTAL 56 245 65 090 832 17 211 3 534 44 409 64 668 930 9 036 647 2 082 364 1 8e7 153531 DEPARTMENT STORES' 7 742 51 083 522 6 '31 7 742 51 083 522 7 225 719 1 652 637 1 437 065533 VARIETY STORES...................... 21 852 7 343 967 6 375 1 054 18 393 7 220 301 1 112 752 268 381 290 061539 MERCHANDISEMISCELLANEOUS ,GENERAL STORES 26 65r 6 663 343 10 830 2 449 .18-274 6 365 107 698 176 161-346 16o 021
FOOD ;TOPES
54 . TOTAL ,267 352,100 718 864 141 349 21 584 173 084 96 374 793 8 820 188 2 088 104 1 722 486541 GROCERY STORES. . . . . . . . . . . . . . . . . 194 346 93 327 525 100 097 15 464 128 115 90 048 234 7 845 656 1 858 651 1 471 695542 MEAT, FISH (SEAFOOD) MARKETS, INCL. FREEZER PROv 16 586 2 809 928 9 386 1 987 10 706 2 506 072 254 090 60 326 47 6665422 FREEZER AND LOCKER MEAT PROVISIONERS A. 769 240 568 29 227 6 960 5 563542.0 PT. MEAT MARKETS. . . .. . . . . . . . . . . . . '8 234 1 987 828 196 878 41.032 36 0635473 PT. FISH (SEAFOOD) MARKETS 1 703 277 676 27 985 6 334 6 06C543 FRUIT STORES AND VEGETABLE MARKETS 8 371 695 115 6 354 699 3 127 517 876 50 185 10 632 AO 834544 CANDY, NUT, AND CONFECTIONERY STORES . 12 872 690 961 7 085 640 6 804 493 551 ,,6 368 18 500 25 201
546 RETAIL BAKERIES . . . . . . . . . . ...... 19 203 1 663 911 9 662 1 642 15 q48 1 541253 426 131 101 363 119 2795462 RETAIL BAKERIES-.8AKINGAAND SELLING .. A. '12 870 1 310 262 , 383 531 90 842 106 7595463 RETAIL BAKERIES--SELLING ONLY A. A. . .. 2 278' 236 991 " 42 600 10 521 .12 52C545,9 OTHER FOOD STORES 15 9 1 531 424 8,765 1 132 9 184 1 261 807 167 756 38 632 47 791545 DAIRY PRODUCTS STORES A. 6 015 874 529 110 948 25 634 35 .377549 MISCELLANEOUS FOOD STORES. A. A. 4 . 3'169 387 276 56 810 12 998 12 414
. AuTOmoTIVE.DEALER
55 EX. 554 TOTAL 121 369 90 030 255 49 528 9 589 85 085 88 490 748 8 622 410 2 043 502 1 035 372551 MOTOR VEHICLE DEALERs--NEW ANO UsED CARSCARS 32 452 73 309 216 3 612 2 347 31 558 73 253 676 6 843 029 1 640 747 765 606551 PT. DEALERS WITH DOMESTIC CAR FRANCHISE ONLY. . . A. 22 574 50 908 080 4 573 489 i 098 843 521459551 PT. DEALERS 111TH IMPORTED CAR FRANCHISE ONLY. . . 3 939 6 459 353 794 507 189 535 85149551 PT. DEALERS WITH DOMESTIC, IMPORTED CAR FRANCHISES AP A. 5 045 15 886 243 1 475 033 352 369 158 998552 MOTOR VEHICLE DEALERSUSED CARS ONLY . . . . . 31 785 4 523 963 21 910 2 363 12 754 3 563 413 256 438 58 867 39 445
. n553 AUTO AND HOME SUPPLY 5TORER' 37 510 7 542 846 14 291 3 168 29 126 7 271 354 1 103 114 253221 167 679553 PT. TIRE, BATTERY, AND ACCESSORY DEALERS 22 395 5 526 485 885 013 203 413 131 004553 PT. OTHER AUTO AND HOME SUPPLY SToDES .. .. . 6 731 1 744 869 218 101 49 808 36 675555,6,7,9 -mISCELLANEOuS AUTOMOTIVE DEALERS 19 622 4 654 228 9 119 1 691 11 647 4 402 305 419 829 90 667 62 642555 80AT DEALERS. A. .. ... . 318 1 568,308 153 555 33'189 23 617556 RECREATIONAL ANC, UTILITY Tr,AiLE., DEALERS. e 'AP 2.251 1 167 290 82 064 17 530 11 579557 MOTORCYCLE DEALERS .. 3 416 1 179 906 137 045 29 548 20 178559 AUTOMOTIVE DEALERS, N.E.C. 1 662 494 801 47 165 , 10 400 7 268
GASOLINE SERVICE STATIONS
554 TOTAL 226 459 33 655 378 128 833 .18 700 183 385 31 440 364 2 974 126 706 467 747 668. .
APPAREL AND ACCESSORY STORES. )
56 TOTAL . . . . . . . . . . . . . . . 129.201 24 741 375 41 974 11 729 105 717 24 114 731 3 602 359 86o 589 800 394567,3,9 WOMEN'S CLOTHING, SPECIALTY STORES, FURRIERS: 49 639 9 397. 068 16 530 4 552 40 631 9 172 819 1 362 548 326 236 332 463562 WOMEN'S READY -TO -WEAR STORES. . . . .... 3P 762 8 451 228 11 883 3 806 33 375 8 307 713 1 222 012 291 938 299 537563 WOMEN'S ACCESSORY AND SPECIALTY S70455 8 859 746 362 3 410 548 6 231 686 023- 107 579 26 167 28 065563 PT. MILLINERY S T O R E S . . . . . ... .. A. 828 64 853 11 252 2 737 3 254563 PT, CORSET AND LINGERIE STORES. . . . . . . . A. 833 90 942 14 528 3 550 3 565563 PT. OTHER WOMEN'S ACCESSORY, SPECIALTY_ STORES .. .. . 4 570 530 228 81 799 19 880 21 246568 FURRIERS AND FUR SHOPS. . ; . ....... . 2 015 199 4;: 1 137 lie 1 025 179 003 32 957 8 131 4 861
r561 MEN'S AND BUYS' CLOTHING ANo FURNISHINGS STORES 23 156 5 584 318 5 466 2 288 21 017 5 496 728 860 476 204 870 148 525565 FAMILY CLOTHING STORES 18 224 4 926 842 6 798 2 110 13 845 4 814 567 669 628 160 765 165 677566 SHOE STORES 26 850 4 074 583 6 627 1 623 23 390 3 972 325 605 046 143 841 127 923566 PT. MEN'S SHOE STORES W. 2 583 443 360 61 595 14 354 252566 PT. OmEN.S SHOE STORES . ..... -. A. 5 077 944 569 156 897 37 733 31 15566 PT. CHILDREN'S AND JUVENILES' SHCE STORES A. HA 803 102 889 18 730 . 462566 P T . FAMILY SHOE STORES. . . . . . . ....... .... 14 927 2 481 507 367 824 87 292 02 414564,9 OTHER APPAREL AND ACCESSORY STORES 11 330 758 5 4 6 53 1 156 6 834 65P 292 '104 661 24 877 25 806564 CHILDREN'S AND INFANTS' REAR STORES .. 3 695 406 025 53 933 12 785' 15 260569 MISCELLANEOUS APPAREL AND ACCESSORY STORES. . A. 3 139 252 2671 50 778 12 092 10 546
FURNITURE, HOME FURNISHINGS, ANO. EQUIPMENT STORES
c
.....,
il
57 , TOTAL 116 857 22 533 328 GI 285 9 150 82 473 21 504 846 112 854 734 558 474 594F A T HT A Air Fi OR TOR 05 __.,64_401 8 10 5 834
,347 681 13 512 445 2 059 803 483 781 301 683
5717- FURNITURE STORES 38 732 lo 442 856 13 905 3 598 30 04 10 127 .
OTHER 571 FORE F.MNIS1IINGS 5109E5 27,973 3 621 545 14 205 2 236 17 638 3 384 942 545 720 126 873 85 9535713 FLOOR COVERING STORES , . '. . . . . . .. .0. 9 501 2 299 449 359 781 82 963 48 9925714 DRAPERY, CURTAIN, AND TIPHO STERY STORES . . . 4.140 478 865 89 098 21 181 17 9075719 miSCELLANEOUS.HOmE FuRNISH NGS STORES . . . . . 3 997 606 628 96 841 22 729 19 054
Standard Notes -Represents zero.'Darawl Provided because establishments nth no payroll are classr bed only at the next Am der kind-ol-tusiness level )lIrkludes sales from catalog order desks.
0 Withheld In avoid disclosure. NA Not available. X Not applicable.
62
6 3
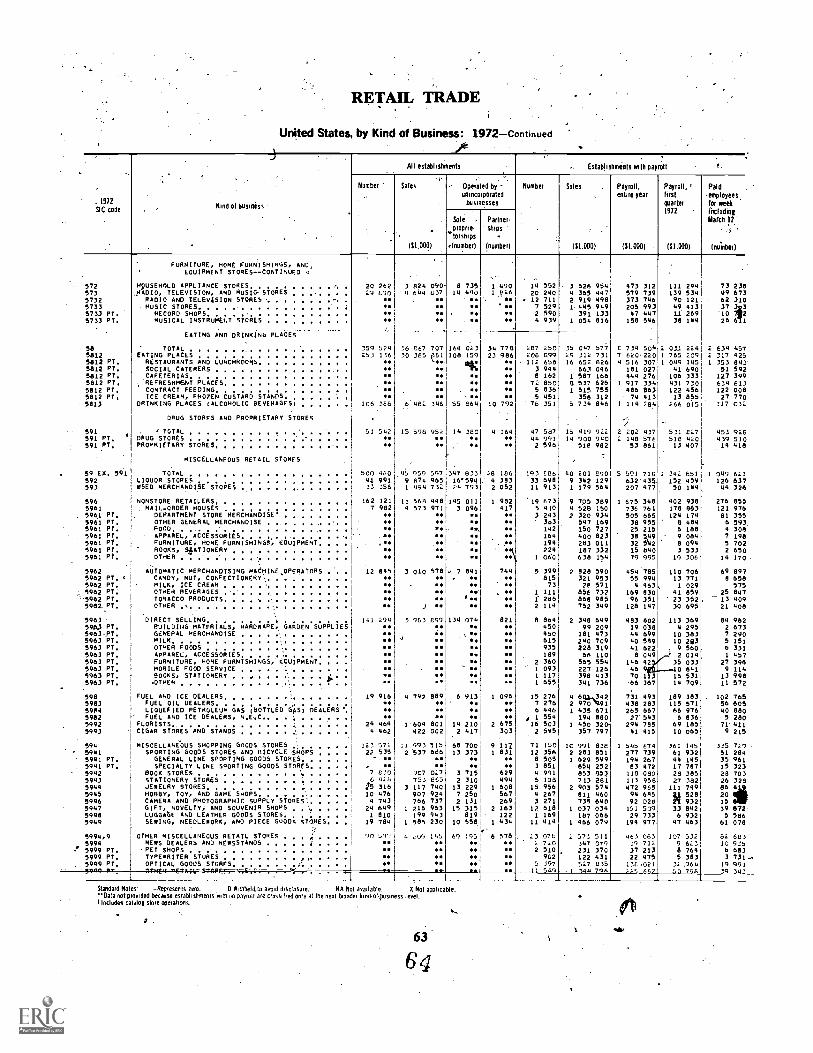
RETAIL TRADE
United States by Kind of Business: 1972Continued
All establishments Establishments with payroll
Number Sales - Operated by Number Sales Payroll, Payroll, I Paidunincorporated entire year first employees
. 19/2Kind 01 business
businesses quarter for weekSIC code 1972 including
.Sole . Partner- Match 12
' CIO' rc'PsrilS
Ships
.(11.0001 ,(number) (number) (11.800) .111.0001 (11,000) (number)
FURNITURE, HOME FURNISHINGS, AND,EOUIPMENT STORES--CONTINUED 4
,-- ,
572 H9USEHSLD APPLIANCE STORES.............. 20 262 3 624 090 8 735 1 490 14 552 3 626 954 473 312 111 244 73 238573 RADIO, TELEVISION, AND MUSIC, STORES 29, 690 4 644 637 14 440 1 026 20 240 4 365 447 579 739 139 534 69 67]5732 RADIO AND TELEVISION STORES . - 12 711 2 919 498 373 746 90 121 62 3105733 MUSIC STORES. . .
7 529 1 445.949 205 993 49 413 37 l
o.
3
5733 PT.5733 PT.
RECORD SHOPS , .1 . 2 $90 391 133 47 447 1.1. 269 '10MUSICAL INSTRUMEI.T STORES
2
PP, 4 939 1 054 816 158 546 38 144 26 6 1
EATING AND DRINKING pLACEs-_2..
.
.
58 TOTAL '59 524 36 667 707 164 023 34 778 207 250 35 047 577 E 734 504 2 031 224 2 634 4575812 EATING PLACES ....................... .6 30 365 061 108 159 23 986 206 699 29 312 731 7 620.220 1 765 209 2 317 4255812 PT. RESTAURANTS AND LUNCHROOMS O No. 112 656 16 652 6326 4 516 307 1 049 145 1 353 8425812 PT. SOCIAL CATERERS . . . . .. . . . . . . . . . . . . . . . ,
.. .. 4:: 3 944 663 046 181 027 41 690 51 5925612 PT. CAFETERIAS . 8 162 i 587 166 444 276 106 333 127 3995812 PT. .,REFRESHMENT PLACES o. A. AM 72 850 8 537 626 1 917 334 431 730 634 61:5812 PT. CONTRACT FEEDING. . . . . . . ......... . 5 836 1 515 755 486 863 122 456 122 004
::5812 PT, ICE CREAM, FROZEN CUSTARD STANDS . ... .. 5 451 358 312 74 413 13 859 27 77c5813 DRINKING PLACES !ALCOHOLIC BEVERAGES) 106 3E6 64632 346 55 664 10 792 76 351 5 734 846 1 114 254 266 015 .317 032
DRUG STORES AND PROPRIETARY STORES . ..
591 . . TOTAL 51 542 15 596 952 14 360 4 164 47 587 15 419 922 2 202 437 531 027 453 928591 PT. ° DRUG STORES M. 44 991 14 900 940 2 146 576 516 420 439 SIC591 PT, PROPRIETARY STONES IR 2 596 SIP 982 53'861 13 407 14 414
misCELLANF0u5 RETAIL STORES .
. .
59 EX. 591 TOTAL 500 460 45 959 597 347 833 26 166 193 666 40 201 890 5 591 710 1 342 651 1 049 621592 LIQUOR STORES 41 991 9 R74 465 16'594 4 383 33 698 9 342 129 632'435 152 459 126 637593 mSED MERCHANDISE STOPES I 33 356 1 u94 732 24 793 2 052 11 913 1 179 564 207 477 50 144 44 32e
596 NONSTORE RETAILERS 162 121 11 568 448 145 011 1 992 '19 673 9 705 389 1 675 348 402 938 276 8505961 MAIL-ORDER HOUSES . . . . .
7 952 4 573 971 3 096 417 5 410 4 528 150 736 761 178 863 121 9765961 PT. 'DEPARTMENT STORE MERCHANDISE' ... 3 243 2 320 934 505 665 124 174 81 3555961 PT. OTHER GENERAL MERCHANDISE . . . . . M. Ms 383 547 169 38 955 8 484 6 59]5961 PT. FOOD. . ... . . . . . ....... . co , 142 150 727 25 215 6 188 4 3095961 PT. APPAREL, ACCESSORIES. . . . . . . .
,. M. 164 400 823 7 1985961 PT. FURNITURE, HONE FURNISHINGS., EouipmENT , AA .0 . P. 194 283 011
38 49 9 0845 700
9961 PT. ROOKS, STATIONERY AM . :..., 224 187 332 15 840 3 533 2 65C5961 Pt. OTHER . . 1 060 638 154 79 995 19 306 14 17C
, . .
5962 AUTOMATIC MERCHANDISING MACHINE OPERATORS 12 845 3 010 578 0 7 841 744 5 399 2 828 590 454 785 110 706 69 8915962 PT. o CANDY NUT, CONFECTIONERY.. . .. o. 815 321 953 55 994 13 771 8 6585962 PT. MILK, ICE CREAM . . , 73 2P 571 4 463 1 029 5755962 PT. OTHER REVERAGES M. Mo. 1 111 856 732 169 830 41 854 25 8475962 RT, 209ACCO PRODUCTS 9 1 286 868 985 96.351 23 352 13 4095962. PT. OTHER .
'.
o. 3 M. o. 2 114 752 349 128 147 30 695 21 408
5963 DIRECT SELLING. . . . 141 294 3 963 699 134 074 821 8 964 2 348 649 483 802 113 369 84 962
5963-PT.59A) PT. RuILDING MATERIALS, HARDKARE, GARDEN SUPPLIES
:M ,
450 99 209 19 038 4 295 2 673GENEPAL MERCHANDISE . . . . ... . . . . 450 181 473 44 699 10 383 7 290
5963 PT. MILK ' .. o o. 615 240 709 40 589 10 203 5 1515963 PT. OTHER FOODS AM ... 935 228 319 41 622 9 560 6 3315963 PT, APPAREL, ACCESSORIES. . . . % o. o. 189 66 110 8 049 2 014 1 4075963 PT. FURNITURE, HOME FURNISHINGS, EDUIPMENT . o. . 2 360 565 554 146 42 35 033 27 3965963 PT. NORILE FOOD SERVICE . . . . . 2 .... - 1 093 227 126 46 9 0 641 9 1149063 PT. BOOKS, STATIONERY . . . . . . :. . . . i Mo. M. AM Mo. 1 117 398 413 70 1 3 16 531 13 9985963 PT. 'OTHER 1 655 341 736 .66 367 14 709 11 572
,
.
598 FUEL AND ICE DEALERS 19 916 4 792 889 6 913 1 096 15 276 4 60.1.,342 731 493 189 383 102 7655983 FUEL OIL DEALERS. . . . .. . , . M. M. ' o. o. 7 276 2 970 2491 438 283 115 571 56 6055984 LIQUEFIED PETROLEUM GAS (BOTTLED,. GAS) nE L RS' o. 6 446 1 435 671 265 667 66 976 40 8805982 FUEL AND ICE DEALERS, N.E,C.. .. ; .. o. a 1 554 194 880 27.543 6 836 5 28059925903
FLORISTS . 24 464 1 604 801 14 210 2 675 16 503 1 450 320 294 785 69 185 71 4114 462 422 002 2 417 303 2 595 357 797 41 415 10 065CIGAR STORES AND STANDS 9 215
594 MISCELLANEOUS SHOPPING GOODS STORES 123 571 :1 993 115 68 700 9 117 71 150 10 991 838 1 545 674 361 145 335 7295941 SPORTING GOODS STORES AND RICyCLE SHOPS 22 535 2 537 686 13 373 1 831 12 356 2 283 851 277 739 61 932 51 2845941 PT. GENERAL LINE SPORTING GOODS STONES - 8 505 1 629 599 194 267 44 145 35 9615941 PT. SPECIALTY LINE SPORTING GOODS STORES , M. .. 3 851 65y 252 83 472 17 787 15 3235942 BOOK STORES . . . . . . ...... , . 7 830 907 027 3 715 629 4 991 853 853 118 080 28 385 29 7035943 STATIONERY STORES 6 428 753 E6 2 310 404 5 108 713 281 113 958 27 382 26 3295944 JEWELRY STORES 15 316 3 117 740 13 229 1 608 15 956 2 903 574 472 965 111 749
5946. . . . ...
CAMERA AND PHOTOGRAPHIC SUPPLY STORES'. 4 793 766 237 2 131 269 3 271 7739 640 92 D2d 1 932 iii5945 HOBBY, TOY, AND GAME SHOPS. 10 476 907 924 7 250 567 4 267 811 460 2094 685 al 528
155947 GIFT, NOVELTY, AND SOUVENIR SHOPS . . ', . 24 699 1 216 963 15 315 2 163 12 618 1 037 034 151 509 33 842 39 8725948 LuGGotE AND LEATHER GOODS STARES. . . . 1 810 190 943 819 122 1 169 187 066 29 733 6 932 5 5865940 SEWING, NEEDLERORK, AND PIECE GOODS STONES 19 784 1 585 230 10 558 1 434 11 419 1 466 079 194 977 47 463 61 078
. ..
5994,0 OTHER MISCELLANEOUS RETAIL. STORES So Lio, , 20.1, 195 69 195 6 578 23 076 2 573 511 463 063 107 532 62 6635994 NEWS DEALERS AND NEWSSTANDS ..... . 4. o. 2 720 347 079 39 712 9 623 10 9355999 PT. -PET SHOPS o. Me 2 510 231 370 37 213 a 764 6 6835999 PT. TYREMRITER STORES .0 .I. 902 122 431 22 475 5 383 3 7315999 PT. OPTICAL GOODS STORES 4 . .
.__. _Me M. 5 397 527 635 138,021 32.964 19 991
X49 '9 4'
Slxidald Notes -Represents zero. D Withheld to avoid disclosure.. NA Not available. X Not applicable.Data not provided because establishments with no payroll are classified only at the next broader kind-ohpusiness level.I Includes calalOg store operations. .
ti
63'
6
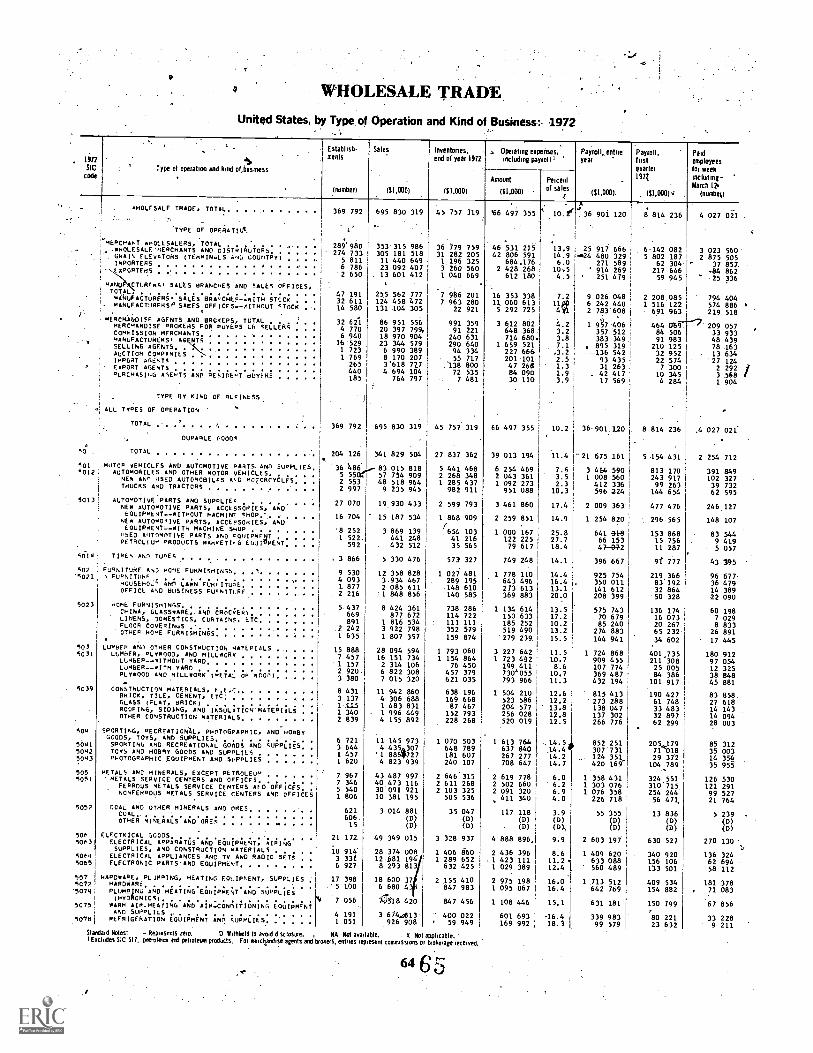
4 WHOLESALE TRADE
United States, by Type of Operation and Kind of Business:- 972
19nSIC
code
Type of opetallon and NoxIol.business
Establish.
Dents
(Rumen)
Sales
(II,000)
Inventories,end of year 1972
101,800)
Operating esPekses;including payroll I
Payroll, entireyear
(51,000).
Payroll,lustquarterI 97Z
31,00010
Paulemployeeslot weekincludingMarch I 2.
(numbes)
Amount
($1,000)
Percentof sales
HOLESALE TRADE, TOTAL 369 792 695 830 319 45 757 319 6 497 35 10.1 f36 901 120 8 814 236 4 027 021
TYPE OF OPERATIO,
MERCHANT AHOCESALERS, TOTAL . . . 28 9' 980 353'315 986 36 779 759 46 531 215 13.9 25 917 666 6.142 082 3 023 56041NOLESALE-GERCHANTS AND DISTmIRUTORS 274 733 305 181 518 31 282 205 42 806 591 14.9 .24 480 329 5 802 187 2 875 505GRAIN ELEVATORS tTEHmINALS AND COUNTRY 5 811 11 440 649 1 196 325 684.176 6.0 271 589 62 304 ' 37 857.IMPORTERS 6 786 23 092 407 3 260 560 2 428 268 10:5 ' 914 269 217 646 .84 862EXPORTERS2 650 13 601 412 1 040 669 612 180 4.5 251 479 59 945 25 336
AIR) CTURERst SALES BRANCHES AND SALES OFFICES,TOTAL. . . . . . . . . . . . . . . . . 47 191 255 562 777 7 986 201 16 353 338 7.2 9 026 048 2 208 085 794 404HiNuFACTURFRS SALES BRA.CHEF-.51TH STUCK . . 32 611 124 458 472 7 963 280 It 060 613 nip 6 242 440 1 516 122 574 886mANLFACTURFRSP SARES OFFICFSA-KITHOUT STOCK . . 14 580 131 104 305 22 921 5 292 725 43).1 2 783'608 691 963 219 518
mERCISAbDISE AGENTS AND BACKEPS, TOTAL 32 621 86 951 556- 991 359 3 612 802. 4.2 1 9457.406 464 croT---.> 209 057MERCHANDISE RROKEAS FOP BUYERS CA SELLER 4 770 20 397 799, 91 221 648 368. 3.2 357 512 84 506 33 933COMMISSION MERCHANTS 6 940 18 970 904 240 631 714 680. 3.8 383 349 91 983 48 439MANUFACTURERS, AG NTs 16 529 23 344 579 290 640 1 659 521 7.1 , 895 319 210 125 78 163SELLING AGENTS1 723 6 990 389 94 334 227 666 .3.2 _136 542 32 952 13 634AUCTION COMPANIES1 769 8 170 207
. 55 717 201 101 2.5 93 435 22 574 27 124IMPORT AGENTS 265 3.618 717 138 800 47 268 1.3 31 263 7 300 2 292EXPORT AGENTS 440 4 694 104 72 535 84 09D 1.9 . 42 417 10 345 3 568RUREHASING AGENTS AND RESIDE T BUYERS 185 764 797 7 481 30 110 3.9 17 569 4 284 1 904
TYPE By KIND OF PUmINESS.
9 ALL TYPES OF OREPATION
TOTAL 369 792 695 830 319 45 757 319 66 497 355 10.2 36 901 120_ 8 814 236 .4 027.021'DURABLE GOODs
5c; TOTAL 204 126 341 829 504 27 837 362 39 013 194 11.4 "21 675 161 5 154 431 2 254 712SOI MOTOR VEHICLES AND AUTOMOTIVE PARTS. ANT SUPPLIES. 36 ).58:Te- 83 015 818 5 441 468 6 254 469 7.6 3 414 590 813 170 391 849012 AUTOMOBILES ANSI OTHER MOTOR VEHICLES.
5 2 268 348 2 043 361 3.5 1 008 560 243 917 102 327NE. ANY USED AUTOMOBILES A'D ROURCYCLFS 2 553 48 518 964 1 285 437 1 092 273 2.3 412 336 99 263 39 732TRUCKS AND TRACTORS 2 997 9 235 945 982 911 951 088 10.3 596-224 144 654 62 5955013 AUTOMOTIVE. PARTS AND SUPRLIE . . . . . 27 070 19,930 433 2 599 793 3 461 860 r 17.4 2 009 363 477 476 246 127NEP AUTOMOTIVE PARTS, ACCESSORIES, AND
EQUIPMENT -- WITHOUT NACMINC SHOP... . 16 704 15 187 534 1 868 909 2 259 851 14.9 1 254 820 296 565 148 107NE5 AUTOMOTIVE PARTS, ACCESSORIES, ANDEQUIPMENT_ -KITH MACHINE SHOP . . '8 252 3 869 139 /654 103 1 000 167 25.8 641 318 153 868 83 544USED sUTDMYT IRE PARTS AND KCPIIPMENT 1 522 441 248 41 216 122 225 27.7 66 153 15 756 9 419PETROLEUM PRODUCTS MithmETIG EQUIPMENT 592 . 432 512 35 565 79 617 18.4 47-042 11 287 5 057
5614 TIRES AND TUBES 3 866 5 330 476 573 327 749 248 14.1 396 667 9't 777 43 395002 FURNITURE AN) HONE FURNISHINGS 9 530 12 358 828 1 027 481 1 778 110 14.4 925 754 219 366 96 677.-S021 t FuPNITOAF . . . . . . . . . . 4 093 3.934 467 289 195 643 496 16.4 , 350 011 83192 36 479HOUSEROLG AND LAKIN FUR. ITUsi 1. 877 2 085 611 148 610 273 613 13.1 141 612 32 864 14 389OFFICE AND BUSINESS FUKNITOE 2 216 1 848 856 140 585 369 883 20.0 208 399 '50 328 22 0905023 NONE FURNISHINGS 5 437 8 424 361 738 286 1 134 614 13.5 575 743 136 174 60 198CHINA, GLASS5ARE, AND CRoCvERN 669 877 672 114 722 150 633 17.2 70 679 16 073 7 029LINENS, 10mESTICS, CURTAINS, ETC 891 1 816 534 111 111 185 252 10.2 85 240 20 267 8 833FLOOR COVERINGS 2 242 3 922 798 352 579 519 490 13.2 274 883 65 232 26 891OTHER HOME FURNISHINGS 1 635 1 807 357 159 874 279 239. 15.5 144 941 34 602 17 445503 LUMBER ANO OTHER CONSTRUCTION MATERIALS 15 888 28 094 594 1 793 060 3 227 642 11.5- 1 724 868 401,735 180 9125031 LUMBER, RLYKOOD, AND MILLOORK . 7 457 16 151 734 1 154 864 1 723 452 10.7 909 455 211 308 97 054LURGER.-IITHOUT YARD 1 157 2 314 106 76 450 199 411 8.6 107 774 25 005 12 325LuMbER--KITH YARD . . . . . . . . 2 920 6 822 308 457 379 730'055 10.7 369 487 84 386 38 848'PLymOOD AND MILLWORK smETAL OR MOO")
3 380 7 015 320 621 035 793 966 11.3 432 194 101 917 45 881. 5039 CONSTRUCTION MATERIALS, ...E.G. 8 431 11 942 860 638 196 1 504 210 12.6 815 413 190 427 83 858BRICK, TILE, CEMENT, ETC' 3 137 4 306 688 164 668 523 586 12.2 273 288 61 748 27 618GLASS (FLAT, BRICK) . . . . . . 1.115 1 483 831 87 467 204 577 13.8 138 047 33 483 14 143ROOFING, SIDING, ANO INSULATION NATERIAL 1 340 1 996 449 152 793 256 028 17.8 137 302 32 897 14 094OTHER CONSTRUCTION MATERIALS 2 839 4.155 892 228 268 520 019 12.5 266 776 62 299 28 003
504 SPORTING, RECREATIONAL, PHOTOGPARHIC, AND HORSY
5041GOODS, TOYS, AND SUPPLIES. . . .
SPORTING AND RECREATIONAL GOODS AND SUPPLIES,6 721 11 145 973 1 070 5033 644 4 435007 648 789
1 613 764637 840
852 25114.5114.4 307 731 2??'ilg85 31235 0035042 TOYS AND HOARY GOODS AND SUPPLIES 1 457 '1 886,427 181 607 267 277 14.2 124 351 29 372 14 354'5043 PHOTOGRAPHIC EQUIPMENT AND SUPPLIES 1 620 4 823 939 240 107 708 647 14.7 42D 169 104 789 35 955
505 METALS ANC MINERALS, EXCEPT PETROLEUM 7 967 43 487 997 2 646 315 2 619 778 6.0 1 358 431 324 551 126 5305051 METALS SERVICE CENTERS AND OFFICES, . . 7 346 40 473 116 2 611 268 2 502 660 6.2 1 303 076 310715 121 291FERROUS METALS SERVICE CENTERS ACD OFFICES. 5 540 30 091 921 2 103 325 2 091 320 6.9 1 076 358 254 244 99 527NONFERROUS METALS SERVICE CENTERS ANO OFFICES 1 806 10 381 195 505 536 411 340 4.0 226 718 56 471, 21 7645057 COAL AND OTHER MINERALS AND. ORES
COAL.:. ', . . . .
OTHER MINERALS AND ORES.., . .
6216D6
3 014 881(D)
35 n;
15 (D) (D)
117 118(D)
(D)
3.9
(D(q,
55 355 13 836(D) (D)(D) (D)
5 239(17)(17)
500 ELECTRICAL G O O D S .' 2 1 1 7 2 49 349 015 3 328 937 4 888 896, 9.9 2 603 197 630 527 270 1305003 ELECTRICAL APPARATUS AND EQUIPMENT, AIRINGSUPPLIES, AND CONSTRUCTION MATERIALS . . . . . 10 914' 28 374 008 1 406 660 2 436 396 8.6 1 409 620 340 920 136 3245004 ELECTRICAL APPLIANCES AND TV AND RADIO SETS
. . 3 331'. 12 681 194' 1 289 652 1 423 111 11.2 633 088 156 106 62 6945065 ELECTRONIC PARTS-AND , , , .EQUIPMENT. ...... 6 927 8 293 813 632 425 1 029 389 12.4 L 560 489 133 501 58 112SO7 HAPDKARE, PLINKING, HEATING EQUIPMENT, SUPPLIES ; 17 398 18 600 37
2410 2 975 198 16.0 1.713.512 409 534 181 3785072
'5074
HARDWARE. . . . . ... . . . . .PLUMPING HEATING EQUIPMENT' SUPPLIES
,- 5 100 6 680 4 iB 1 095 067 16.4 642 769 154 882 71 083AND 1, .
(HyDRONICS). . . . . . . . . . . . . . . . . . i',1418 420 847 4567 056 1 108 446 15.1 631 181 150 799 67 8565075 HARM A/R.HEATING AND AIM-CONGITIDNING EQUIPMENTAND SUPPLIES
. . ..... 4 191 3 6140613 400 0225076 REFRIGERATIONSUPPLIES ..
ANn ca.PLIES 1 051 926 908 , 59 949601 693169 992 -1S:1
339 98399 579
80 22123 632
33 2289 211
Vandal.] Notes: - Rep leumls rem. D Withheld In mid disclosure. , NA Not available. . X No applicable.I Excludes SIC SIP, petroleum and petroleum producM. For merchandise e agents and brokers, entries represent commissions Or brokerage received,
64 65

WHOLESALE,TH ADE
United States, by Type of Operation and Kind 'of Business; 1972 c.ontinued
1972
SIC
codeType of operation and kind of business
,
Eslablishimerits
(number)
Sales
(SIAM
_-
'riven !met,end 01 year 1912
(PAO)
Operating expenses,including payroll I
aYroll, entireyear
.
MOW)
.Payroll,lull .matter1972
(91,000)
Paidemployeeslot week'includingMarch 12
(number)
Amount
($1,000)
Percentor 014
5085081
.
5082
5083
5084
SOPS
5005
5087
50P8
5045093
5094
5094
51
311511151125113
5125122
5155133
5134,31365137
5139
.
TYPE ..y.mIND OF BUSINESS--DONTINUtu
ALL TYPES OF OPERATI0NACO.TINUED
DuPARLEDOOLCONTINUED
MACHINERY, E0u1PmENT, AND suPPLIESCOMMERCIAL MACHINES AND EQUIPMENT. OFFICE MACHINES -AND EQUIPMENT . .
RESTAURANT AND HOTEL SUPPLIESSTORE MACHINES AND FIXTURE,
CONSTRUCTION AND MINING MACHINERY AND EQUIPMENT
FARI,tAND GARDEN MACHINERY AN,- Etu IPNCNT ,,
. 4IN TRIAL MACHINERY AND EnuiPmENT. .
. .
F 9- PROCESSING mACHINEAy AND EQUIPMENT,:EPAL PURPOSE INDUSTRIAL MACH., EQUIPMENTALmoRmING MACHINERY AND EQUIPMENTERIALS HANDLING EQUIPMENT, . . . .
L WELL, OIL.REFINERy, PIPELINE EQUIPMENTHER INDUSTRIAL MACHINERY AND EDUIPEFT,
INDUSTRIAL SUPPLIESSUPPLIES-tENERAL-LINE INDUSTRIAL SUPPLIES
MECHANICAL POWER TRANSHISSIOP EQUIPMENTINDUSTRIAL VALVES, FITTINGS, AND EQUIPMENTPELDING SUPPLIES. . . . . . . . .
OTHER INDUSTRIAL SUPPLIES . . . . . .. .
PROFESSIONAL EQUIPMENT AND SoPPLIEs. . . .....DENTAL SUPPLIES .
RELIGIOUS AND 'SCHOOL SUPPLIESSUPPLIESPLIE SAND HOSPITALSURGICAL, MEDICAL,
OPTICAL AND OPHTHALMIC GOODS .. . .
OTHER PROFESSIONAL EQUIPMENT
SERVICE ESTABLISHMENT Enol9NENT ANC SUPPLIESPEAUTY ANO BARRER SuPPLIES ......CUSTODIAL SUPPLIES. . . . . . .
LAUNDRY ASP DRY-CLEANIPG SuPPLIE;OTHER SERVICE ESTABLISHMENT SUPPLIES
Tig7NON,AJOSEQUIPMENT,ANU SUPPLIES, EXCEPT
AIRCRAFT AND RERON'AUTIC.AL EQUIPMENT ;IN;MARINE MACHINERY AND EOUIPNENT........
EQUIPMENTOTHER. TRANSPORT ION EQUIPMENT
MISCELLANEOUS DuRA8L GOODSSCRAP AND CASTE MA ERIALS
S RAPEIRON AND STEEL .
` WITH PROCESSIN EQUIPMENTWITHOUT PROCES NG EQUIPMENT
CASTE AND SECONDA r HATERIA\S DEALERS
JEWELRY. MATCHES, IAMONoS, ANtl OTHER PRECIOUSSTONES . . . . . . . . ........ .
1. t
DURABLE 00005, E CMUSICAL INST umENTSFOREST PRODUCTS, EXCEPT UH5ENOTHER DURABLE GOODS
NONDURABLE GOODS
TOTAL
PAPER AND PAPER PRODUCTSPRINTING AND WRITING PAPERSTATIONERY SUPPLIES . .
SERVICE ,. . . .....
INDUSTRIAL AND PERSONAL sERVI. CE PAPER
omuGS, !Demo PROPRIETARIES, DouoG/)-rsi sumunIE5.ORuGS, DRUG PROPRIETARIES, DRUGGISTS` SUNORITS,
GENERAL-LINE DRUGS. . . .
SPECIALTY -LINE PHARMACEUTICALS, COSMETICS,AND TOILETRIES . . . . ...... . .
APPAREL, PIECE GOODS, AND OTIoN-PIECE GOODS ..................
PIECE GOODS-JOBBERSPIECE 6000S-CONVERTER
NOTIONS AND OTHEP DAY GOODS . . . ..HEN'S AND 3005 CLOTHING ANG FURNISHINGSwOmSNS, CHILDRE4.5, ATD INFANTS. DLDTHIP4AND ACCESSORIES
FOOTWEAR .....,
PARTS
. .
.
. .
:
.
.
.
.
73 75211 1217 6691 1632 290
3 917
15 618
15 228825
3 9602 2642 2092 0533 917
11. 8572 1301 6411 3981 9464 742
7 199730
1 1732 1941 6631 439
6 5471 7551 774
8352 183
2 265.1 266
657342
15 2127 4613 8062 D651 741
3'.655
3 340
4 411314
1 4392 658
165 666
10 7141 4585 3933 863
4 0244 024-956
3 068
12 3833 9143 168
746
1 4912 323
3 670985
801210
,
1
8
12
17
5
221
4
16221
1
9
6
2
2
3
.
1
42
1
156
32
42
3
523
354
175
38
12122
9
2712102
2
4
62
692 D48692 098542 004-745 879404-215
037 li
599:
098880593 408800 747180 838459 957979 539084 391
451 376298 110114 547698 853331 971007 895
721 940551 471773 399399 119959 764038 187
004 295639 900638 282442 700.283 413
084'354149 506743 973192 875
084 852035 233
7 901.3 2178 6527 332
291 122
758 497371 560048 095338 842
000 815
280 148246 499949 670083 979
666 327"466'727827 688
838 639
932 961725 104417 414307 690
476 459538 690
085 275107 433
' 91
1
2
1
.....
1
,
'
1
17
1
1
2
092 763030 451823 63867 579
1639 234
924 42,5
065 616
467 22353'466358 586190 856313 146194 997356 172
237 927304 916205 662179 243133 268414 838
749 08384 99297 930267 543107 856190 762
292 10585 68558 26943 319104 832
'3Y5 819207 15579 78838 970
281 425396 387247 595197 44850 147148 792
500 254
384 78452 68880 791251 305
919 957
867 213264 635271 328331 250
072 423072 423371 9 2
700 4
008 154773 602452 203321 399
265 022320 271
418 840230 419
133
. 2
1
1
2
2
r
1
21
27
2
-
1
1
1
21
489 418135 842641 916152 285341 641
308 808
650.701
579 123112 897659 656319 826519 421260 408706 915
201 760447 355271 641251 549330 518900 697
382 104134 026183 630457 904263 823342 721
729 854180 884193 602112 385242 983
361 'il292 638121 81986 769
165 919089 331604 056491 939"112 117485 275
437 963
638 62579 139133 969425 517
484 161
201 994547 738823 406830 850
792 711792 711331 017
461 694
874 322012 580753 767258 813
336 811474 287
749 167301 477
16.724.725.I.20.424.3
16.3
13.1
15.119.011.414.721.113.217.4
13.419.512.814.824.810.0
20.624.323.719.127.516.8
24.328.330.325.418.9
12.313.616.47,2
14.318.017.221.09.5194.
13.3
11.121.36.512.7
8.9
12.710.420.810.3
14.214.211.7
24.9
10.28.07.2
11.2
13.610.4
12.314.2
7
2
1
`
1
1
1
.
15
1
.
1
,
999 774176 018893 41987 360195 239
745 196
929 652
449 62961 488388 361176 085304 437130 486388 772
228 237271 471146 488140 113180 582489 583
804 82276 59498 040260 415187 887181 886
414 269102 594122 52456 196132 955
251 951'139 -671"69 38642 894
082 784543 849296 731'241 81254 919
247 118
223 570
315 36535 63467 658211 873
225 959
290 920323 094495 779472.047
803 325'803 325183 229
620 096
388 910496 086373 825122 261
166 790230 719
361 376173 939
1 893 971'513 796446 730'20 746
. 46 320
177 906
215 139
346 21714 93991 32942 04273 12832 35692 423
291 98164 49134 71334-06342 300116 414
192 17218 996.23 49563 28943 89742 495
97 76725 241'26 70014 09831 728
58 99332 45816 35610 179
...,i56 398,-130 243fl. 70 118
57 09713.02160 125
53 395
72 7608 66716 04848 045
1
. 3 659 805
312 72678 216
119 077115 433
195 784195 78445 142
150 642
-336 370121 34090 83630 504
39 81855 586
86 60733 019
800 371183 482152 9869 718
20 T78
67 380
123 586
137 1756 21235 72C15 66530 35813 39535 825
173 785;28 46314,635
3 10918 827
- 48 747
89 9008 293
12 221.25 86C25 06218 461
49 60;13 81514 2206 371
15 191
25 45:14 5476 79(4 12(
134 55:74 62;311 131
, :.-317 12:
Or 8 01:36 481
23 67;
36 2513 788 99:
23 477
-1.772 301
130 491.28 41155 30:46 77:
87 62:87 62:23 65!
63 961
134 01!42 03132 91:
- 9 12r
16 29:
24 581
37 90:13 20,
Standard Holes: - Represents Zero. 0 Illitheld to avoid disclosure. NA Not available. X Not applicable. .
I Excludes SIC 517, petroleum and petroleum products. For merchandise agents and brokers, entries represent cOmmrssions Or brokerage received..
.
65
6 8
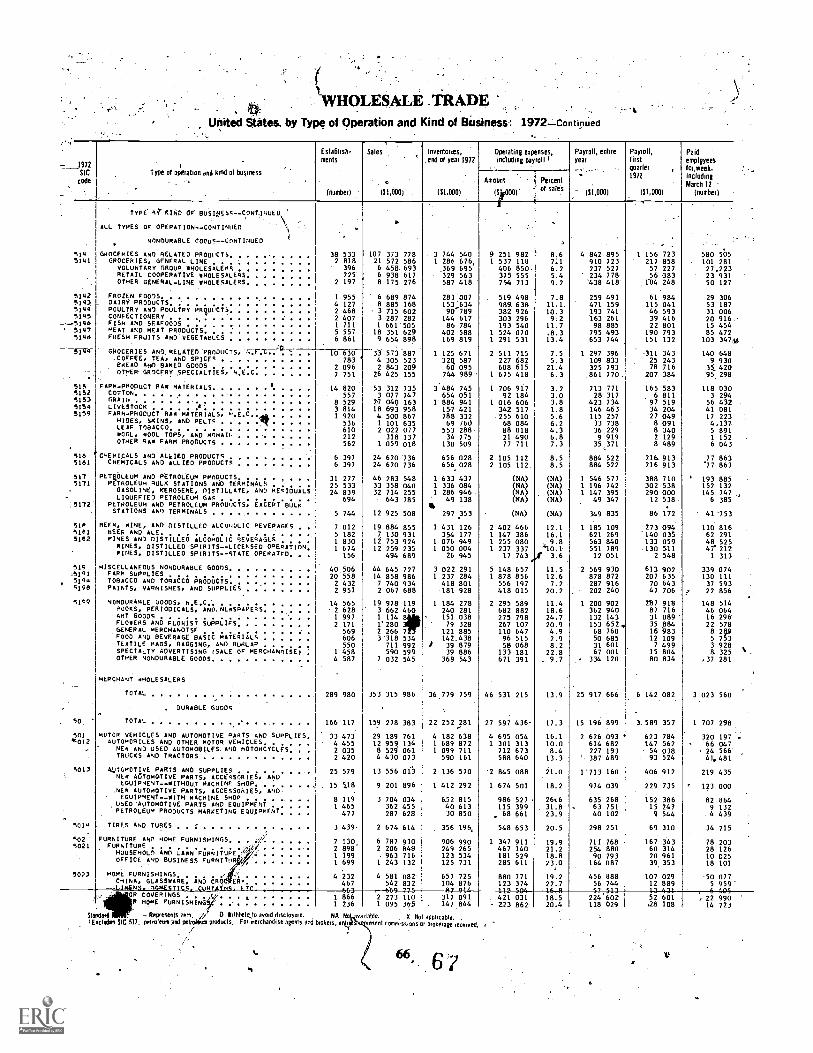
cHOLESALE TRADEUnited. States, by Type of Operation and Kind of Bnsiness: 1972-Contiptied
_____ 1972SICcode
1
Type of opfiation and kind of business
Establish-ments
(number)
,Sales
(S1,0001
Inventories,end of year 1977
.(S1,000)
Operating expenses,
including payroll IPayroll, entireyear
-
(S1,000).
Payroll,firstquarter ,1972
(51,000)
Paidemplgyeeifor week.includingMarch 12
(number)
-Amount
ra)'Percentof sales
.
TYPE' 4' KIND or BuSIVEs*--CoNTINUED
ALL TYPES OF OPERATION -- CONTINUED ..
. .NONDURABLE GOODS -- CONTINUED
514 GRoCFRIES AND RELATED PRoovCTs 38 533 107 373 778 3 744 540 9 251 982 8.6 4 842 895 1 156 723 580 5055141 GROCERIES, GFNERAL LINE 2 818 21 572 586 .1 286 676, 1 537 118 7.1 910 723 217 858 101'281
VOLUNTARY GROUP. WHOLESALERS 396 6 458.693 369 695 406 850- 6.2 237 527 57 227 27,223RETAIL COOPERATIVE WHOLESALERS 225 6 938 617 329 563 375 555 5.4 234 778- 56 383' 23 931OTHER GENERAL-LINE WHOLESALERS 2 197 8 175.276 587 418 754 713 9.2 *438 418' ,104 248 50 127
.
5142 FROZEN FOolS 1 955 6 689.874.
283007 519 498 7.8 259 491 61 984 29 3069141 DAIRY PRODUCTS. . . . . . .... 4 127 8 885 168 153634 989. 638 11.1. 471 159 115 041 53 1875144 POULTRY AN1 POULTRY PR(DC.CTS 2 468 3 715 602 90.-789 382 926 10.3 '193 741 46 593 31 0065145 CONFECTIONERY . . 2 407 3287282 144 617 303 296 9,2 163 261 39 416 20 916
---,Spit, FTSR AND SEAFOODS 1 711 1 661'505 86 784 193 540 11.7 98 885 22 801 15 454. 5147 MEAT 'AND MEAT PRODUCTS 5 557 18 351 629 402 588 1 524 070 .8.3 795 493 190 793 85 472
5148 FRESH FRUITS AND VEGETABLES
17-
6 861 9 654 898
33.573 887
169 819
1 125 671
1 291 531
2 511 715
13.4
7.5
653 744
1 297 396
151 132
311 343
103 347,
140 6485149 GROCERIES AND. BELATED PRoDuCTS, r..F.C. -lb 630.COFFEE, TEA, AND SPICE* 783 4 305 523 32Q 587 227 682 5.3 109 833 -25 243 9 930BREAD AND BAKED GOODS 2 096 2 843 209 60 095 608 615. 21.4 325 793 78 716 420OT)-EP- GRICFRY SPECIALTIES, N E C
..
7 751 26 425 155 744 989 1 675 418 6.3 ,861 770 207 384.31.
95 298
515 FARR-pR000CT RA* MATERIALS 14 820 53 312 735.
3 484 745 1 706 917 3.2 713 771 165 583 118 0305152 COTTON. . . ;.. . . . 557 3 077 747 654 051 92 184 3.0. 28 317 6 811 3 2945153 GRAIN 8 529 27 040 163 1'884 941 1 016 606 3.8 423 734. 97 519 56 4325154 LIVESTOCK . . A-
3 81.4 18 693 958 157 421 342 517 1.8 146 463 34 204 41 0815159 FARM - PRODUCT RA* MATERIALS, .H.E.6.. a 1 920 4 500 867 788 332 255 610 5.6 115 257 27 049 17 223
HIDES, SKINS, AND PELTS . .. . .-volf 536 1 101 635 69 /60 68 084 6.2 33 738 8 091 4,137_LEAF TOBACCO 610 2 022 077 553 288- 88 018 4,3 36 229 8 340 5 891POOL, WOOL TOPS, AND MORALE 212 318 137 34 775 21 490 6.8 9819 2 129 1 152
'516
OTHER RA* FARM PRODUCTS 562 1 059 018 130 509 77 711 7.3 35 371 8 489 6 043
r cHERIGALS AND ALkIED PRODUCTS 6 397 24 620'736 656 028 2 105 112 8.5 884 522 216:913 77 8635161 CHER/GALS AND ALLIED PRODUCT* 6 397 24 620 736 656 028 2 105 112. 8.5 884 522 216 913 '77 863
517 PETROLEUM AND PETROLEUM PRODUCTS 31 277 46 283 548 1 633 437 (NA) (NA) 1 546 577 388 710 193 8855171 PETHoLEum BULK STATIONS AND TERmINALS . . . . 25 533 33 358 040 1 336_084 (NA) (NA) 1 196 742 302 538 152 132
GASOLINE, KEROSENE, DISTILLATE, AND RE*IDuAL 24 839 32 714 255 1 286 946 (NA) (NA) 1 147 395 290 000 145 747LiOuEFIE0 PETROLEUM GAs . . . . . . . . . 694 643 785 49 138 (NA) (NA) 49 347 12 538- 6 385
:5172 PETROLEUM AND PETROLEUM PROO'ICTS, EXCEPT BULK 41STATIONS AND TERMINALS . . . . . . .... 5 744 12 925 508 297 355 (NA) (NA) 349 835 86 172 41'753
. .50 BEEN, WINE, AND DISTILLED ALCOHOLIC SEvEPAGE5 . 7 012 19 884 855 1 431 126 2 402 466 12.1 1 185 109 273 094 110 8165181 BEER AND ALE................... 5 182 7 130 931 354 177 1 147 386 16.1 621 269 140-035 62 2915182 MINES AND DISTILLED ALCOHOLIC BEVERAGES 1 830 12 753 924 1 076 949 1 255 080 9.8 563 840 133 059 48 525
WINES, DISTILLED SPIRITS-LICENSED OPERATION 1 674 12 259 235 1 050 004 1 237 337 '10.1 551 789 -130 511 47'212PINES, DISTILLED SPIRITS-STATE OPERATED. .
.
156 494 689 26 945 17 743,f 3.6 12 051 2 548 1 313
519 MISCELLANEOUS NONDURABLE GOODS 40 506 44 645 727 3 022 291 5 148 657 11.5 2 569 930 613 902 339 074:5191 FARM SUPPLIES 20 558 L4 858 986 1 237 284 1 878 856 12.6 878 872
.
207 635 130 1115194 TOBACCO ANO TOBACCO PRODUCTS 2 432 7 740 934 418 801 556 197 7.2 287 916 70 643 37 5935198 PAINTS, VARNISHES, AND SUPPLIES 2 951 2-067 688 181 928 418 015 20.2 202.240 47 706 , 22 856
5149 NONDURABLE GOODS, N.E.C... . . . .... .. 14 565 19 978 119 1 184 278 2 295 589 11.4 1 200 902 287 911 148 514ROOKS, PERIODICALS, AND.NENSPAPERS 2 628 3 662 460 240 281 682 882 18.6 362 940 87 716 46 064ANT GOODS . . . . . . . . ; . .... .. 1 997 1 114 8 151 038 275 798 24.7 132 143 31 089., 16 296FLOWERS AND FLORIST SUPPLIES 2 171 1'280 79 328 267 107 20.9 153 652 35 884 22 578GENERAL MERCHANDISEFOOD AND BEVERAGE BASIC MATERIALS
569606
2 266 73'318 534
121 885142.438
110 64796 515
4.92.9
68 76050 685
16'98312 109 8 R3 9
TEXTILE SAGS, BAGGING, ANO BURLAP . 550 711 992 I 19 879 58 068. 8.2 31 601 7 499 3 928SPECIALTY ADVERTISING SALE OF MERCHANnI;Ee 1 458 590 599 39 886 133 181 22.8 67 001 15 804 & 325OTHER NONDURABLE GOODS ...... , . . . . 4 587 7 032 545 369 543 671 391 9.7 334 120 80 834 .37 281
MERCHANT WHOLESALERS
TOTAL.
289 980 353 315 986 36 779 759 46 531 215 13.9 25 917 666 6 142 082 3 023 560
.
.
, DURABLE GOODS%
90. * TOTAL . 166-117 159 278 383 22 252 281,
27 597 436- 17.3 15 196 899 3,589 357 1 707 298
501 MOTOR VEHICLES AND AUTOMOTIVE PARTS AND SUPPLIES. 33 473 29 189 761 4 182 638 4 695 054 16.1 '2 626 093 ' 623 784 320 197*012 AuTOHORILES AND OTHER MOTOR VEHICLES. .V E H I C L E S . . . 4 455 12.959, 134 'I 689 872 1 301 313 10.0 614 682 147 562 66 047
_ NEW AND USED AUTOMOBILES. AND MOTORCYCLES: . . 2 035 8 529 061 1 099 711 712 673 8.4 227 193 54 038 24 566.TRUCKS AND TRACTORS . . . . . .. . 2 420 4 430 073 590 161 588 640 13.3 ' 387 489 93 524 41.481
1013 AUTOMOTIVE PARTS AND SUPPLIES . . ...... 25 579 13 556 013 2 136 570 -2 845 088 21.0 1'713 160 406 912 219 435NEW AUTOMOTIVE PARTS, ACCESSORIES, ANDEQUIPMENT -- WITHOUT MACHINE SHOP. . . . . -. . 15 In 9 201 896 1 412 292 1 674 501 18.2 974 039 . 229 735 123 000
,NEW AUTOMOTIVE PARTS, ACCESSORIES, ANDEQUIPMENT - -WITH MACHINE SHOP . . . . . 8 119 3 704 034 652 815 986 527 26..6 635 268 152 386 82 864
. USED 'AUTOMOTIVE PARTS AND EQUIPMENT 1 465 362 455 40 613 115 399 31.8 . 63 751 15 247 9 132PETROLEUM PRODUCTS MARKETING EOUJPmENT.. . . 477 287 628 30 850 68 661 23.9 40 102 9 544 . 4 439
5014 TIRES AND TUBES .3 439- 2 674 614 356 196, 548 653 20.5 298 251 69 310 34 715
. ..
502 FURNITURE AND HOME FURNISHINGS. . 42/ 7 130 6 787 930 906 990 1 347 911 19.9 711 768 167 343 78 2035021 FURNITURE . . 2 898' 2 206 848 249 265 467 140 21.2 254 880 60 314 28 126
__.HousEteoLn AND LAIN FURNITUREOFFICE AND BUSINESS FuRNIT,m
1 1991 699
- 963 7161 243 132
123 534125 731
181 529285 611
18.823.0
90 793164 087
20 96139.353
10 02518 101
5023 HONE FURNISHINGS 4 232 4 581 082- 657 725 880 771 19.2 456 888 107 029 .50 077CHINA, GLASSWARE, AND CRO ERT 467 542 832 104 876 123 374 22.7 56 744 12 889 5 959
OR COVERINGS r,. 1 866 2 273 110 317 091 . 421 031 18.5 224.602 52 601 , 22 990g HOME FuRNISHINGq 1 236 1 095 365 147 844 - 223 862. 20.4 118 029 .28 108 14 723
stand. tRpc _ Represents zero. /7 0 Illithheld,,to avoid disclosure. NA No available. X No aPplicabie..s
lEacluies SIC 517, petroleum and petroleum products. For merchandise agents and brokers, e r resent commissions or brokerage received..
66. 6

WHOLESALE TRADEUnited Siatei, by Type of One ration and Kind of.Business: 1972-Cpntiqued
1912
SIC
Cede
Type of operation and kind of ness
.. . 1-,.!.7'1
o,
Establishmelts
kumbet11
Sales
V
(11,0001
Inventories,end of year 1972
Operating/expenses, entireincludintparofl I , yet
Amount Percent,
($1.000)of sales
41,00P
"Payroll,' Paid'first employees "',.Quarter` for week1972 including
March 12111,0001 (number)
TYPE AY KIND OF BUSINFs.s.CONiTINUIL,
MERCHANT wHOteiSALERS--CONT,INNAD
DuRAPLE 0000S--CONTINvED': 1
5D3. LumBEH'ANU OTHER CONSTRUCT/ON MATERIALS5031 CUMBER, PLYWOOD, AND MILLWORK
LUmBEA--wITHDLIT YAROLUMBER --wITH YARD , . . .
PLYWOOD 4Nn MILLWORK (METAL Om own)50391 CONSTRUCTION MATERIALS, N.E.C.
PRICK, TILE, CEMENT, ETC ...... .GLASS (FLAT, dRICK) . . . . . . . .
ROOFING, SIOING, AND INSULATION NATERIALSOTHER CONSTRUCTION MATERIALS.- . . ....
SON SPORTING, RECREATIONAL, PHOTOGRAPHIC, AND H0148y;GOODS, TOYS, AND SUPPLIES. . . . . . . . .
5041 SPORTING AND RECREATIONAL GOODS AMP SUPPLIES:5042 TOYS AND HOBBY GOODS AND SUPPLIES .5043 PHOTOGRAPHIC EQUIPMENT AND SUPPLIES . .
505 METALS AND MINERALS, EACEPT PETROLEUM5051 PETALS SERVICE CENTERS AND OFFICEs.
FERROUS METALS SERVICE CENTERS AND OFF S.NONFERROUS METALS SERVICE CENTERS ANC OFFICES
5052 COAL ANU OTHER MINERALS AND ORESCOAL. . . . . . . . ..... , .
OTHER MINERALS AND ORES
12 601 16 914 1786 212 11.468 154985' -1 730 829
2 665 5 916 8602 562 1 820 465
6 3892 364778
9 ma2 109
5 446 0241 528 059457 145
1 2/5 7532 185 067
1 419 913- 2 481 463930 6764 1 433 12875 299 177 282
431 662 689 439423 715 566 407
489 237 1 048 335138 426' 356 480b4 459 134 195123 241 196 381'163 111 361 279
5 573 5 416 238 878 257 , 960 470'3 108 . 3 104 051 560 493 515 163;1 193 1.145 320' 152 997 205 405.1..272 1#166 867 164 767 219 902
5 427 15 021 681 2 054 661 1 899 0345 014 14'158 639 . 2 031 988 1 830 3353 947 . 11 099 573 ! 1 736 992 1 587 6501 067 3 059 066 294 996 242 685
413 I 863 042 1400 846 97813i 16 064
506 :ELECTRICAL GOODS. .. . . . . . . .,. f.. 14 278 18 848 0685063 . ELECTRICAL APPARATUS AD EQUIPMENT, w1RINGSUPPLIES, AND CONSTRUCTION mATERIALS
SF TS. . 7 347 8 A87 1505064 ELECTRICAL APPLIANCES ANT TV AND RADIO SFT5 . ;. 2 385 6 734,9665065 ELECTRONIC PARTS AND EQUIPMENT, . . . . . . . . 4 546 3 225 952
507 'HARDWARE, PLUMBING, HEATIN. FWIPmENT, SUPPLIES . 14.336 13 328 4095072 . HARDWARE. . . . P. 4 083 4 823 4355074 PLUMBING AND HEATING EQUIPMENT AND SUPPLIES ...-
WARN 5 623 211'5075 AAD'AIR:CONn171ORINC E061;940 't119
6 054
L
AND SUPPLIES . . . . . . . . . \ . ..... . 3 354 2 383 7325078 REFRIGE,RATION EQUIPMENT ANT nuPP S 845 498 031. ...,
508 MACHINERY, EQUIPMENT, ANC SUPP1 IFSi 59 323 42 496 792
5081 COWNEBOIAL MACHINES AND EQUIPMENT 8 335 3 465 757OFFICE MACHINES AND EQUIPMENT 5 390 1 860 923RESTAURANT AND. HOTEL SUPPLIESSTORE MACHINES AND FIATUREs 5 1 StI
621 9073 982 927
.5082 CONSTRUCTION ASS MINING MACHINERY AND EQUIPMENT 1, 3 375 , 5.897 241
5083 FARM AND GARDEN MACHINERY ANY FulipmENT 14 444, 8 268 413
5084 INDUSTRIAL MACHINERY AND EQUIPMENT 10 374F000-pROOESSING MACH1NFRy AND EQUIPMENT .
METALWORKING MACHINERY AND EQUIPMENT. .-. . 1 :955489GENERAL PURPOSE INOUSTPIAL MACH., EQUIPMENT 2 455
MATERIALS HANDLING EQUIPMENT, ... . . . 1 690999. WELL., OIL REFINERY, PIPEUINE EQUIPMENT
21
/592.OTHER INDUSTRIAL MACHINERY ANU E0u1P"InT,
5085 INDUSTRIAL SUPPLIES . . . . ..... 9 237GENERAL-LINE INDUSTRIAL Sui>PLIES. . . 1 971
... MECHANICAL POWER TRANSmtSSION EQUIPMENT . 1 237INDUSTRIAL VALVES, FITTINGS, AND EQUIPMENT 940WELDING SUPPLIES. . ...... . . 1 755
.OTHER INDUSTRIAL SUPPLIES.
3 334
5086 PROFESSIONAL EQUIPMENT AMD SUPPLIES . /DENTAL SUPPLIES . . . ......RELIGIOUS AND SCHOOL SUPPLIES . . ...SURGICAL, MEDICAL, AND HOSPITAL SUPPLIES.OPTICAL AND OPHTHALMIC GOUTS, . . . .'.OTHER PROFESSIONAL EQUIPMENT
5087 SERVICE ESTABLISHMENT EQUIPMENT SUPPLIESBEAUTY AND BARBER SUPPLIES ...... . .
CUSTODIAL SUPPLIES. , . . . , . ....LAUNDRY AND DRY-CLEANI.,G.suPPLIEs . .
OTHER SERVICE EsTAPLISH4FNT 5UPPLIe5
14.7'12.510.2.11.714.8
19.223.329.415.416.5
17.716.617.920.6
4.. ...
1'352 157.722 88236.608350,030'3,76 244
57.9 275183.. 88692: 289
10 t. 716195 384
471:1;
J86246'90499 859
124 423
12.6 981 30912.9 946 41414.3 821 4917.9 I. 124 923
22 673 68 699 8.0 34 89522 442 67 871 8.0 34 417
231 822 5.1 478
2 515 484 2 928 311 15.5 1 560 81,7
999 078 - 1 331 497 15.0 773 738`971 899 911 223 13.5 417 268544 507 685 591 21.3 1 369 811
.
1 980 664 2 539 753 19.1 1 464 703774 0,36 1 926 298 19.2 547 794
803 930 990 4881 17.6 562 587
352 456 495 156 11 20.8 278 96850 242 127 811 25.7 75 354
7 117, 065 8 841 040432 412 91984425266 138 786113 2 1 256 860
1 623 994 . 1 075 915
1 773 335 1'364 172
8 189 7874
1 083 044 . 1 614 047361 408 39 563 78 821
2 002 192 288 258 403 9011 075 247' ' 136 218 209 9531 581 779 214 025 ,!.. 379 799 ,
1 227 350 127 735 158 4081 7941, 811 277 245 383 165
7 738 848 t 1 011 212 1 674 0332 126 455 299 341. 430 434
978 40 172 736 202 550893. 14 115 847 '6.174 865996 099 112 936 293 589
2 )44 740 310 352 572 595
5 799 , 4 731 763 , . 643 026 1 097 031684
! \ 512 962 ti 82 281 128 320I 050 . 4671,694 ' 95 111 169 9081 792 1 689 .779 209 385 339 9931 184 660'483 81 880 191 6651 089 4:196.845 174 369 267 105
.
5 934 2 200 565 262 328 628 8611'691 544381 ' 82 634 167 3821.659 515-900 56 680 169 661
782 3311747 41 067. 102 3711 802 . 759.437 81 947 189 447
5088 TRANSPORTATION EQUIPMENT ANC SUPPLIES, ExCEPT1
I.*.MOTOR VEMICLES . . . . . . . . . .;. . - . . . 1 825 2 wit 418 287 714 390 783AIRCRAFT AND AERONAUTICAL EQUIPMENT .NP PARTS I 038 1 16 923 186 235 229 633MARINE MACHINERY AND EQUIPMENT. . . . . . . . 569 623. 160 74 237 I 110 524OTHER TRANSPORTATION coUIPmENT 218 211
n
;335 27 242 I .50 626
Slumlord Notes: - Represents zero. 0. Ildbbeld to avoid disclosure. NA Not available..0
Not applicable.I Excludes SIC 517,- petroleum and petroleum products. For merchandise agents and brbkers, entries represent commitsrons.or brokerage received. .
.
20.828.732.322.326.1
18.2
5'062 257595 682372 29380 891142 498
633 639
16.5. 763 641
19.721.820.219.524.0 I.12.919.7 1
904 61141 493241 186112 969223 53078 808206 625
21.6 954 34720.2 260 82920.7. 110 64619.6 98 30129.5 160 92320.9, 123 648
23.2 641 91525.0 73 87825.3 91 35020.1 . 195 27429.0 135 69922.3 145 714
28.6 366 31630.7 96 15032.9 113 15126,8 52 08724,9 104 928
19.519.717.723.7,
202 107113 75664 59323 758
312 058178 51822 28379 73846.497
133 54040 80022 28425 15745 299
110 00357 48823 26729 248
231 609222 827191 84730 980
8 7828 656
12(
375 403
184 792103 03087 401
348 249130 894
'1'1'134 144
65 465, 17 746
1 192 555-140.01887 39219 24133 385
4
151 55
$.174 8 1
. 214 29410 08556 43526 74653. 21819 37448. 436
225 43861 77626 00023 830
.,37 815'76 017
153 14318 37821 93047 33711 31334 185 , 15 155
145 13183 667
! 11 32036 59235 755
61 464,19 5409 61611 38220 9269.
55 73229 81111 99613 925
96 01092 23979 54112 698
3 771.93 719
42
168 '573 -
82 926,42 73442 913
1I92 W
.6i 509
28 0447 320
56066419
15
57
107
904
231022
820
629534669'105760
797
856
377133774583652749486
1011i.27
72 2768 00411 41920 13517 563
86 389 44 71723 700 13 09124 540 13 20613 059 .5 955
- 25 090 12 465
46 882 21 03726 317 12 25115 027 ' 6' 2735 538 2 513
I
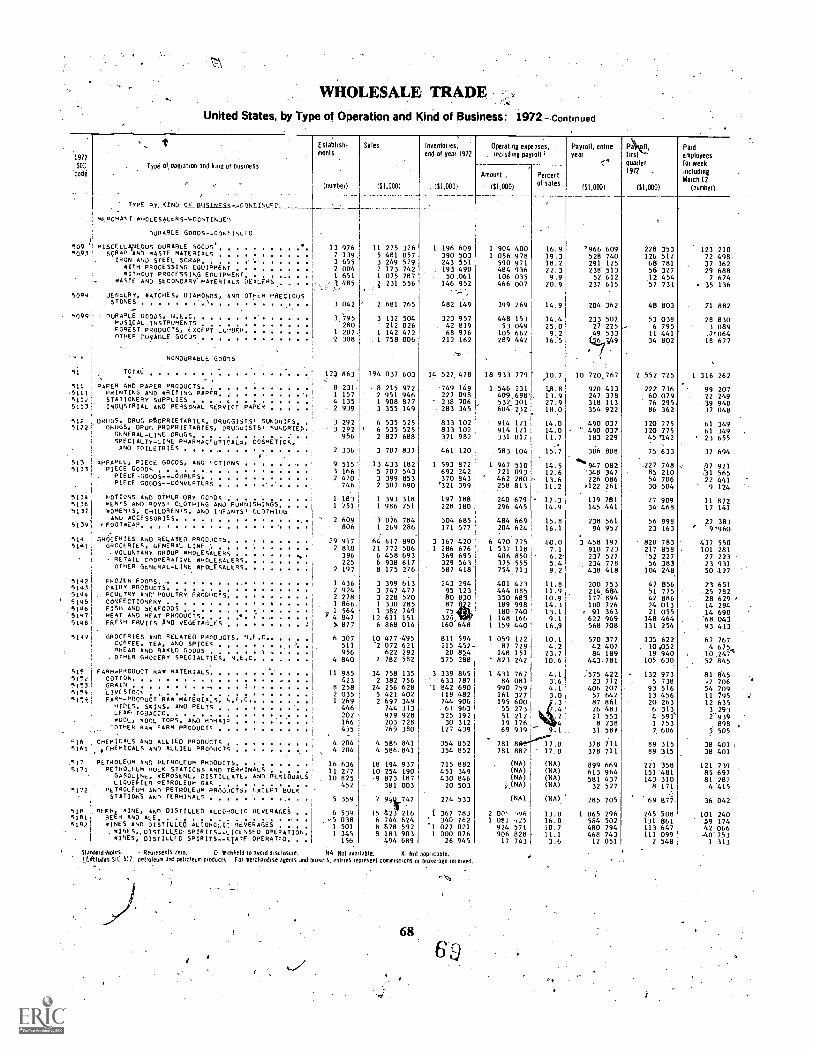
WHOLESALE. TRADEUnited States, by Type of Operation and Kind of Business: 1972-Continued
sEstablish. Sales Inventories, Operating expenses, Payroll, entire Pa 11, Paidmoils end of year 1912 , including payroll I year first employees1912 :"'
SIC Typeol,operationandkm quarter for weekOolbusmess ,1912 . moludingcode Amount . Percent
of sales, , 4 (number) (SIAM . 111.000 11.000) (SLOW MAO) ( number)..
TYPE .y, KIND. DE__BUSINE.54--CONT.PAUED..- _______L___ __ '
mEACmANT mmoLESALLPS-CoNTINuEn
DuRA9LE GOODS-CoNTI,.DFD
' .509 misCELLA,1EDUS DURABLE GOODS' 13 976 11 275 326 1 196 609 1 904 400 16.9 °966 609 228 353 123 21050.93! SCRAP AND TASTE MATERIALS 7 139. 5 481 057 390 503 1 056 978 19.3 528 740 126 512 72 498IRON AND STEEL SCRAP 3 655 3 249 529 243 551 590 971 18.2 291 125 68 781 , )7 362WITH PROCESSING EQUIPMENT 2 004 2 173 742 193 490 484 936 22.3 238 513 56 327 29 688WITHOUT PROCESSING EQUIPMENT, . . ... . 1 651 1 075 787 50 061 106 035 9.9 52 612 12 454 7 674
' BASTE AND SECONDARY MATERIALS DEALERS . . . -3485 2 231 556 146 952 466 007 20.9 237 615 57 731 - 35 138.
. .--_. -.
50941 JUILLRY, WATCHES, DIAMONDS, AND OTHER PRECIOUS. STONES . . . . .',\ 3.042 2 681 765 482 149 399 269 14.9 204 362 48 803 21 882. .
..
5099; nuRAALE 60005, N E C 1 795 3 552 504 323 957 448 153 14.4 233 507 53 038 28 83CMUSICAL. NsTRumENTS . . ... .. '280 212 026 . 42 819 53 049 25.0 27 225.- 6 795 3 081FOREST PRODUCTS, EXCEPT Lu.BER
1 207. 1 142 472 68 976 105 662 9.2 49 533 11 441 .'064nn6ER nuqABLE GOODS -2 308 1 758 006 212 162 289 442 16:5 I.567749 34 802 18 677
'1- NONDURABLE GOODS
,.
.
51 TOT AI.
.
.
12],863 194 037 603 14 527.478 18 933 779 10.7 10 720,767 2 552 725 1 316 262,
-.-,
.
511, PAPER AND PAPER PRODUCTS 8 231. 8 215 972 749 149 1 546 231 18.8 920 413 222 736 99 20;
5111 1 PRINTING AND WRITING PAPER 1 157 2 951 946 227. 098 409,698' 13.9 247 378 60 079 . 22 24551121 STATIONERY SUPPLIES . . . 4 135 1.908 877 238 706 532- 301 27.9 318 113 76 295. .39 94E51131 INDUSTRIAL AND PERSONAL SERVICE PAPER 2 939 3 355 149 . 283 345 604 232 18.0 354 922 86 362 37 041
512 DRUGS, DRUG PROPRIETARIES, DRUGGISTS' SUNDRIES. 3 292 6 535 525 833 102 914 121 14.0 490 037 120 775 61 3455127: DRUGS, DRUG PROPRIETARIES, DRUGGISTS, sUND 1E5 3 292 ' 6 535 525 833 102 914 121 14.0 `.490 037 120 775 61 345GENERAL-LINE DRUGS. . . . . . . . . .. . . 956 2 827 688 371 982 331 017 11.7 183 229 45 742 , 23 65"SPECIALTY -LINE PHARmAcEuTICALA, COSMETICS,..AND TOILETRIES . . .. . . . . . , 2 2 336 3 707 837. 461 120 583 104 15.7 306 808 75 633 37 694
513 : APPAREL, PIECE GOODS, AND AcirInNs 9 515 13 433 182' 1 593 872 1 947 510 14.5 947 082 -727 748 u 147 9219 1 3 3 PIECE GOODS 3 166 5 707 543 692.242 721 093 12.6 '348 347 85 210 11 56' PIECE -GOODS--JOBRERS 2 420 3 399 853 370 843 ' 462 280 5 13.6 226 086 54 706 22 441PIECE GOODS -- CONVERTERS 746 2 307 690 '321 399 258 813 11.2 3122 261 30 504 9 124
5134 MOTIONS AND 01HEA DRY GOODS . . . - 1 183 1 393 318 197 188 240 679 17.3 119 781 27 909 11 871'51361 MEN'S AND SOYA' CLOTHING AND FURNISHINGS.
. 1 751 1 986 251 228 180 296 445 14.9 145 441 34 468 17 1415137 mOHEN,S, CHILDREN'S, AND INFANTS' CLOTHING _
AND ACCESSORIES ' 2 609 1 076 784 304 685 484 669 15.8 238 561 56 998 27 38:51391 ,Fo0TREAR 806 1 269 286 171 577 204 624 16.1 94 952 23 163 ' '9'96(. .
. .
514 ,GROCERIES AND RELAYED PRODUCTS 29 917 64 617 890 3 167 420 6 470 775 10.0 3 458 197 820 783 ' 437 5515141 - GROCERIES, GENERAL LINE :. 2 81.8 21 772 5136 1 286 676 1 537 118 7.1 910 723 217 858 101 28'
' .VOLUNTARY GROUP WHOLESALERS 396 6 458 693 369 695 406 850 6.2 237 527 -52 227 27 22:RETAIL COOPERATIVE WHOLESALERS 225 6 938 617 329 563 375 555 5.4 234 778 56 383 23 93'OTHER GENERAL-LINE WHOLESALERS 2 197 8 175776 587 418 754 713 9.2 438 418 104 248 50 42'-
51421 FROZEN FOODS r
1 436 3 399 613 243 294 401 423 11.8 200 753 57 856 23 655143; DAIRY PRODuCTS. . . . . 2 924 3 747 477 95 123 444 085 11.9 214 684 51 775 25 78:51441 ADULT-We AND' POULTRY PRODUCTS 278 3 228 520 80 8)0 350 681 10.9 177 894 42 886 28 62'51451 CONFECTIONERY .
1 866. 1 330 285 87 2 189 998 '14.3 100 726 24 013 14 29451461 FISH AND AEAFOODS , I 564 1 382 749 75 180-740 13.1 e 91 363 21 055 14 6915147i HEAT AND MEAT PRODUCTS ' 4 847 12 611 151 325, 1 148 166 9.1 622 969 148 464 '68 045140 FRESH FRUITS AND VEGETABLES 5 877 6 868 014 160 648 1 159 440 16,9 568 708 131 254 93 41
1
.
5147i GROCERIES AND.RELATEO PRODUCTS, N.E.C. 6 307 10 477 495 811 594 1 059 122 10.1 570 377 135 622 67 76COFFEE, TEA, AND SPICES . . . . . 511 '2 072 621 215 452. 87 729 4.2 42 407 10,052 4 67'AHEAD AND RAKED GOODS . . . . A 956 622 292 20 854 148 151 23.7 84 189 19 940 . 10 24. OTHER GROCERY SPECIALTIES, N E. C 4 840 7 782 582 575 288 ' 823 242 10.61 443.781 105 630 52 84'
515 FARM-PRODUCT RAW MATERIALS II 985 34 758 135 3 339 865 I 431 767 4.1 .575 422 132 973 Ell 84'5I54 COTTON. 423 2 382 756 633 787 84 081 T.6 23 712 5 738 -2 7015153 GRAIN .. 8 258 24 256 628 '1 842 690 990 759 4.1 406 207 93 516 54 70'5154 'LIVESTOCK 2 035 5 421 402 118 482 161 327 3.0 57 642 13 456 11 19'504. FART - PRODUCT RAW MATERIALS, ..;..E. 1 269 2 697 349 744 906 195 600 7 87 861 20 263 12 63HIDES, SKINS, AND PELTS 446 744 313 . 61 963 55 273 4 26 483 6 313 3 29LEAF- TODACCO 202 979 928 525 192 51 2122 21 553 4 591' 2-93,WOOL, moor., TOPS, AND RnHAIP 166 203 728 30 312 19 176 4 8 238 1 753 891-OTHER RA. FARM PRODUCTS 455 769 380 127 439 69 939 9.1 31 58i 7 606 5 50'
516 CHEMICALS AND ALLIED PRODUCTS 4 204 4 586 841 354 852 , 781 8 - 17.0 378 711 89 315 38 401
5161 ,CHEMICALS AND ALLIED PRODUCTS 4 204 4 586.841 354 852 781 882 17.0 378 711 89 315.
38 40
.517 PETROLEuR AND PETROLEUM PRODUCTS 16 636 18 194 937 715 882 (NA) (NA) 899 669 221 358 121 73'5171 PETROLEUM BULK STATIONS AND TERAINAL5 . 11 277 10 254 190 451 149 (NA) (NA) 613 964 .151 481 85 69GASOLINE, KEROSENE, DISTILLATE, AND RESIDUALSu4;LS 10 825 .9 873 187 430 846 (NA) (NA) 581 437 143 310 81 28LIQUEFIED PETROLEUM GAs . . . . . . . . . . 452 381 003 20 503 2(NA) (NA) 32 527 8 171 4%15172 PETROLEUM AND PETROLEUM PRODUCTS, EXCEPT trULx
- STATIONS AND TERRINALS . . . . . . . . ... . 5. 359 7 91747 274 533 (NA) (NA) 285 705-
69 872. 36 04
51s BEEN, MINE, AND DISTILLED ALCOHOLIC UEVERAGES , , 6 539 15 423 216 1 367 783 2 00, 46 13.0 1 065 296 245 508 101 245181 BEER AND ALE. . . . . . . . . . . . . .5 038 6 744 624 1 340 762 1 081 425 16.0 584 502 131 861 59 17.82 TINES ANT DISTILLE6 ALCOROLIC BEVERAGES
1 501 8 678 592 'I 027 021 924 571 10.7 480 794 113 647 42.061wINES,D1STILL.ED. SPIRITS--LICENSTD'OPEAATIoN.'
1 345 8 183 903 1 000 076 906 828 11.1 468 743 III 099 0 75WINES, DISTILLED SPIRITS--sTATF OPERATED. . . 156 494 689 26 945 17 743 3.6 12 051 2 548 1 31
StanderdiNoles, - Represents Zero. D Withheld to avoid discloSurr. NA Not ova lable. X Not applicable.I Eeeludes SIC 517, petroleum and petroleum products. far merchandise :vents and brokers, entries represent commissions 01 brokerage received.
..
68
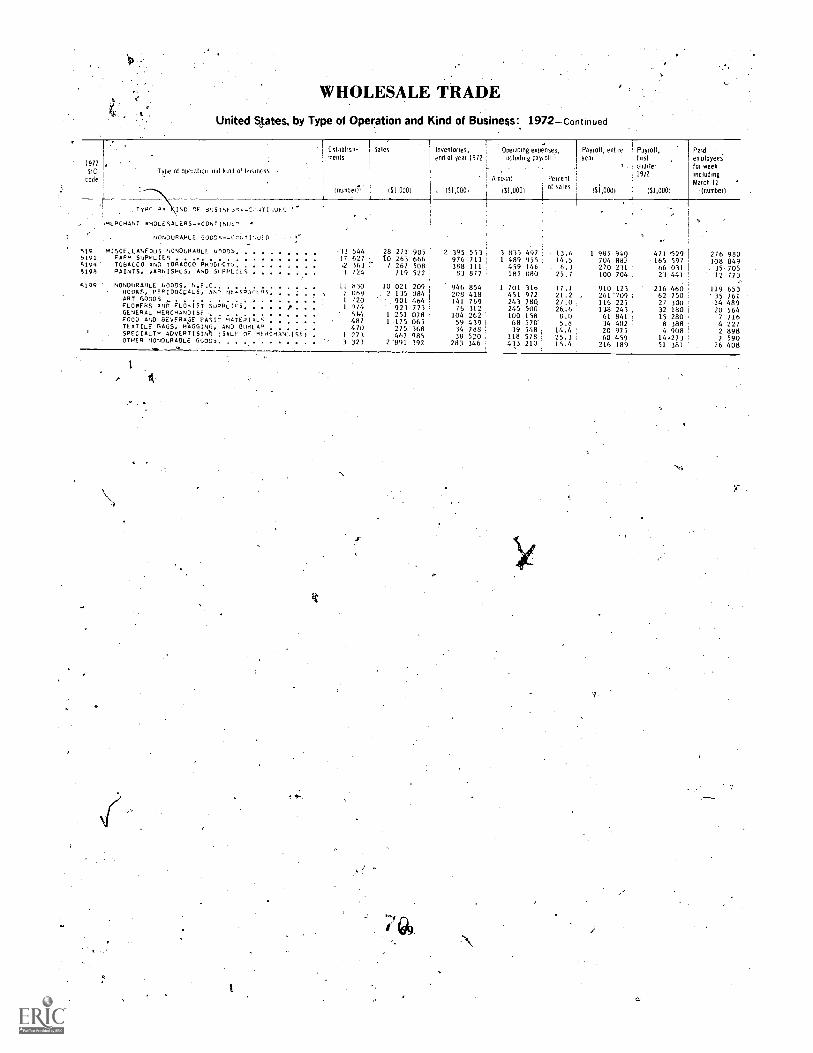
WHOLESALE TRADE
United Slates, by Type of Operation and Kind of Business: 1972continued
1972 ,SIC
code
Type of operation and kind of business
.TYPE Av IND OF eiliSiisdss--drardldJEC
,ft_PCHAN7 roiDLESALEPS--CONT1NuE,
NONDURABLE G00DA--CrNTINUE0 .
Establisb- Sales . Inventories, Operating expenses,menu end of year 1972 including payroll,
1
,
Amount
I
I Percent
insimbeli, st,onc) 1 . 1$1,4601 151,0001of sales
1
519 015CELLANR0u5 60NOGRAHLE unOos .11 544 28 271 9055191 rAPP SUPPLIES 17 627 10 263 6665199 TOBACCO AND TCMACE0 PRODUCT, .2 161 7 267 5085198 PAINTS, VARNISHES. AND 50PPL11.5 1 724 719 522
5199 NONDURABLE NOODS, N F,C, II 810aooRS, RE-RiOrElcALS. 441' 61_SAAAL95 -, 2 069ART 60005 ... . . . . . .. . , . . . 1 1 720FLONFHS ANt,FLOMIST SUPPI:IRS .0 . 1 974GENERAL MERCHANDISE: 565Foo0 AND 8EvERAGE PASIo 9ATEA1AER . . . 487TEXTILE RAGS, 8804180, AND OuLAP . . 470. . .
SPECIALT ADVER7ISIN'S fSALF OF MEACHAq.ISE, I 273OTHER NONO6RABLE 60005 3 323
10 021 2092 135 084.901 464923 773
1 251 0781:175 065275 368467 985
2'891 392
2 395 553 ,976 711388 11183 877;
946 854:
208 418141 76976 312104 26259 43934 78838 520
283 346
1
Payroll, entireyear
15.1.,131303
Payroll,firstquarter1972
151,13130i
Paidemployeesfor weekincludingMarch 12
-(numbel)
3 8151 489459185
1 7014512432451006839
118433
497955 :
146080
316972786500 '
1585701:548578210
13.614.56.3
25.7
17.121.227.026,68.05.8
14.425.315.4
1 935 949704 8811270 231100 704
910 121261'709116 225138 24360 84134 48220 97560 459216 189
471 529165 59766 03123 441
216 46062 75027 30032 18015 2808 3884 908
14,27351 381
2761083512
119'3514207
42
7
26
980849705773
653761489564716227898590408
Copyright © 2022 FDOKUMEN