Deloitte Motor Industry Services Dealer Guide - eProfitFocus
20
Deloitte Motor Industry Services Dealer Guide
-
Upload
khangminh22 -
Category
Documents
-
view
0 -
download
0
Transcript of Deloitte Motor Industry Services Dealer Guide - eProfitFocus

Deloitte Motor Industry Services
Dealer Guide

ProfitFocus Reports
A Management Tool
ProfitFocus reports give you the management tool to highlight where you should
focus your attention in order to optimise the dealership’s profit performance.
You have five businesses in one,
treat each department as a separate business.
Deloitte Motor Industry Services strongly believes that a dealership should be
viewed as five businesses:
New
Used
F&I
Parts
Service
Each of them needs to perform to its full potential.
The numbers have shown us, that those dealers who view each department as a
separate business or profit centre and aim to maximise the results of each
department, will have a better chance of maximising the total dealership bottom
line.
A dealership should avoid the mindset that "the total dealership overall bottom line
is good, so we are doing just fine."
Often one or two poorly performing departments are not given the attention they
deserve because one strong department disguises the poor performers.
"How much more potential does the business have?"
Understanding the reports
The ProfitFocus Dealer Guide provides you with a basic outline of how to interpret
key features of a ProfitFocus report.
If you are unsure as to what is included in each description, refer to a ProfitFocus
Accounting Manual for further guidance.
For further information or queries, please contact the ProfitFocus team:
Email: [email protected]
Free call telephone numbers:
Australia: 1300 784 511 | New Zealand: 0800 773 307


Dealership Benchmarks
Key Operational Performance Indicators
Benchmarking is an excellent way to monitor performance and set goals and
aspirations.
The benchmarks are a measure of "best practice" as identified in the industry. This
does not mean the benchmarks represent the best performing dealers, nor are they
an average/composite of dealers.
The starting point for developing the benchmarks is the performance of more than
800 dealers in the Australian market for the 12 months leading up to the benchmark
period. The performances of the Top 30% of these dealers are isolated and taken
as the reference point for the benchmarks.
Given that the philosophy behind the Deloitte dealership benchmarks is that they
should be a guide to building a sustainable, long-term business, we take that raw
data and adjust for unusual circumstances which may have affected the underlying
numbers. By doing this we blend the realities of the current market with long-held
best practice to arrive at a set of benchmarks which provide sound guidance on
how to build a profitable and lasting business in the real world.
As the benchmarks are a guide, some dealerships due to certain geographic or
demographic circumstances, cannot achieve all the guidelines. Nonetheless, we
consider the benchmarks to be realistic for a typical dealership.
Measuring Performance
The reports effectively provide you with three criteria to measure your current
performance against:
DMIS Benchmarks
Past performance of dealership
Two industry composites of your choosing
With such a comprehensive range of criteria, this should leave you in no doubt as
to how your dealership is travelling.

Dealership Orientation The key to optimising gross performance in each department
The gross orientation figures above will indicate whether your dealership's
departments are proportionately big or small.
The "Front End" refers to new and used vehicles whilst the "Back End" refers to
parts and service.
For a 'well balanced dealership' we suggest 56% of the gross
should come from the front end and 44% from the back end.
All our benchmarks are driven around the 'well balanced dealership' model which
will tend to have more sustainable profits over the longer term and a bottom line
closer to our 3.5% benchmark if the expense benchmarks are achieved.
A front end driven dealership will have a larger proportion of gross coming from the
new and used vehicle departments and a proportionately small proportion from
parts and service. The opposite is true for a back end driven dealership.
Front-end driven dealerships typically have volatile profits. Profits will fluctuate
wildly with vehicle sales and the break-even point is longer because front end gross
comes at a much higher cost. For example, a weak vehicle sales month caused by
a supply problem or the release of a competitor’s hot selling new model will result in
Sample Dealership
DEALERSHIP ORIENTATION
Departmental Contributions to Gross Profit
$ % BENCHMARK $ %
New 543,938 57% 37% 485,270 55% 55%
Used 83,746 9% 17% 84,820 10%
Parts 96,941 10% 15% 102,837 12% 12%
Service 227,975 24% 31% 204,610 23% 23%
Sub-total 952,600 100% 100% 877,538 100% 100%
F & I 137,521 14% 14% 124,006 14%
TOTAL 1,090,120 1,001,544
Front End 627,684 66% 54% 570,090 65% 65%
Back End 324,916 34% 46% 307,448 35% 35%
Sales and Gross Profit
Sales $ Gross $ % BENCHMARK Sales $ Gross $ %
New 7,522,165 543,938 7% 7 - 9% 7,615,249 485,270 6%
Used (Only Retail Sales) 836,722 83,746 10% 13 - 15% 851,511 84,820 10%
Parts 530,164 96,941 18% 24 - 28% 551,532 102,837 19%
Service 281,808 227,975 81% 66 - 70% 271,070 204,610 75%
Sub Total 9,170,860 952,600 10% 9,289,361 877,538 9%
Used wholesale sales 257,678 231,039
TOTAL 9,428,538 952,600 10% 13 - 15% 9,520,400 877,538 9%
Dec-10Dec-11
Dec-10Dec-11
0%
20%
40%
60%
80%
100%
Current Period BM Previous Period
New
Used
Parts
Service
How much gross does each
department contribute?
Is the dealership front end or
back end driven?
New & Used
Parts & Service

a large drop in dealership profits. Conversely, when sales are strong, profits also lift
strongly.
In a back end driven business the dealerships profits are less vulnerable to a drop
in vehicle sales in the short term and a strongly performing dealership will normally
have a higher net profit as % of sales. (We suggest a 3 - 3.5% benchmarki).
However, there are shortcomings in the long term! As the vehicle departments are
ultimately the source of future parts and service customers, the customer base will
eventually shrink over the long term and the viability of the business will be
questionable. The following graph summarises these features:
The gross orientation and the implications of the size of each department were
discussed on the previous page. We now look at the quality of each department’s
gross profits relative to the sales turnover (gross as % of sales) - in essence,
reflecting your trading margins.
The Deloitte Motor Industry Services Benchmarks shown are designed to achieve a
3.5% bottom line. The benchmark for the Total dealership of 13-15% applies to an
evenly balanced dealership, however it does depend on your orientation (i.e.
department sales mix).
For example, a heavily front end driven dealership with a larger proportion of total
sales coming from lower grossing new and used vehicles will be lower, say 9%,
while a back end driven dealership with a larger proportion of sales coming from
the higher grossing parts and service will be higher, say 15%.
Sample Dealership
DEALERSHIP ORIENTATION
Departmental Contributions to Gross Profit
$ % BENCHMARK $ %
New 543,938 57% 37% 485,270 55% 55%
Used 83,746 9% 17% 84,820 10%
Parts 96,941 10% 15% 102,837 12% 12%
Service 227,975 24% 31% 204,610 23% 23%
Sub-total 952,600 100% 100% 877,538 100% 100%
F & I 137,521 14% 14% 124,006 14%
TOTAL 1,090,120 1,001,544
Front End 627,684 66% 54% 570,090 65% 65%
Back End 324,916 34% 46% 307,448 35% 35%
Sales and Gross Profit
Sales $ Gross $ % BENCHMARK Sales $ Gross $ %
New 7,522,165 543,938 7% 7 - 9% 7,615,249 485,270 6%
Used (Only Retail Sales) 836,722 83,746 10% 13 - 15% 851,511 84,820 10%
Parts 530,164 96,941 18% 24 - 28% 551,532 102,837 19%
Service 281,808 227,975 81% 66 - 70% 271,070 204,610 75%
Sub Total 9,170,860 952,600 10% 9,289,361 877,538 9%
Used wholesale sales 257,678 231,039
TOTAL 9,428,538 952,600 10% 13 - 15% 9,520,400 877,538 9%
Dec-10Dec-11
Dec-10Dec-11
0%
20%
40%
60%
80%
100%
Current Period BM Previous Period
New
Used
Parts
Service
2.5
1
4
Net Profit % Sales
Back End
Front End
WELL BALANCED
Each department’s
Gross as % Sales
This is the weighted average of
the above. Therefore
department sales mix will affect
this.

Unfortunately for most dealerships, the overhead costs are based on turnover and
not gross profit, the more turnover, and the more overheads. That's why it takes
longer in working days for a front-end dealer at 9% total dealership gross, to break
even.
Trading Summary
An overview of all major expense categories
The above table gives an overview of the dealerships trading summary. It breaks
the dealerships expenses into the four key expense categories. i.e. Advertising,
Interest, rent & outgoings and wages/commissions. These represent 70-80% of all
expenses, get these right and the net profit takes care of itself.
The layout will give you a simple snapshot to see how your expenditure has
changed from period to period.
It also shows how your net profit (bottom line) is determined after taking these
expenses from your gross profit/income.
Sample Dealership
TRADING SUMMARY
Sales 9,428,538 9,520,400
Gross Profit 952,600 877,538
F & I Income 137,521 124,006
Other Income 73,257 70,749
TOTAL 1,163,378 1,072,294
EXPENSES
Advertising 25,767 34,256
Interest 91,886 91,886 94,125 ####
Rent & Outgoings 182,745 182,268
Wages/Commissions 509,063 516,796 413,326 ####
Other 239,076 231,343 230,502 ####
Total Expenses 1,048,537 954,478
Net Profit 114,841 117,816
% of Gross profit BENCHMARK*
Gross Profit 100.0% 100.0% 100.0%
Expenses 0.1
Advertising -5% (2.7%) 5.0% (3.9%)
Interest -8% (9.6%) 7.5% (10.7%)
Rent & Outgoings -12% (19.2%) 12.0% (20.8%)
Wages & Commissions -35% (53.4%) 35.0% (47.1%)
Other -29% (25.1%) 29.0% (26.3%)
Total Expenses -89% (110.1%) 89.0% (108.8%)
F&I Income 14% 14.4% 14% 14.1%
Other Income 7.7% 0% 8.1%
Net Profit % Gross 12.1% 13.4%
Net Profit % Sales 1.22% 2.5 - 3% 1.24%
* These benchmarks are for an "Evenly Balanced" Dealership
Dec-11 Dec-10
To give further meaning to expenses, they are also compared to the gross profit.
After all, you incur expenses to generate gross profits.
Each major expense category is compared to the total dealerships gross profit
(expressed as a percentage).
The Deloitte Motor Industry Services Benchmarks are for a 'Well Balanced
Dealership' (refer to orientation discussed earlier) resulting in a 3 – 3.5% net profit
to sales when the expenses fall within our benchmark range.
Sample Dealership
TRADING SUMMARY
Sales 9,428,538 9,520,400
Gross Profit 952,600 877,538
F & I Income 137,521 124,006
Other Income 73,257 70,749
TOTAL 1,163,378 1,072,294
EXPENSES
Advertising 25,767 34,256
Interest 91,886 91,886 94,125 ####
Rent & Outgoings 182,745 182,268
Wages/Commissions 509,063 516,796 413,326 ####
Other 239,076 231,343 230,502 ####
Total Expenses 1,048,537 954,478
Net Profit 114,841 117,816
% of Gross profit BENCHMARK*
Gross Profit 100.0% 100.0% 100.0%
Expenses 0.1
Advertising -5% (2.7%) 5.0% (3.9%)
Interest -8% (9.6%) 7.5% (10.7%)
Rent & Outgoings -12% (19.2%) 12.0% (20.8%)
Wages & Commissions -35% (53.4%) 35.0% (47.1%)
Other -29% (25.1%) 29.0% (26.3%)
Total Expenses -89% (110.1%) 89.0% (108.8%)
F&I Income 14% 14.4% 14% 14.1%
Other Income 7.7% 0% 8.1%
Net Profit % Gross 12.1% 13.4%
Net Profit % Sales 1.22% 2.5 - 3% 1.24%
* These benchmarks are for an "Evenly Balanced" Dealership
Dec-11 Dec-10
The dealership’s major
expenses expressed as a
percentage of the total
dealership gross.
How much of the dealership’s
gross is left after expenses and
adding back F&I income and
other income?

New Vehicle Department
An analysis of the new vehicle department performance

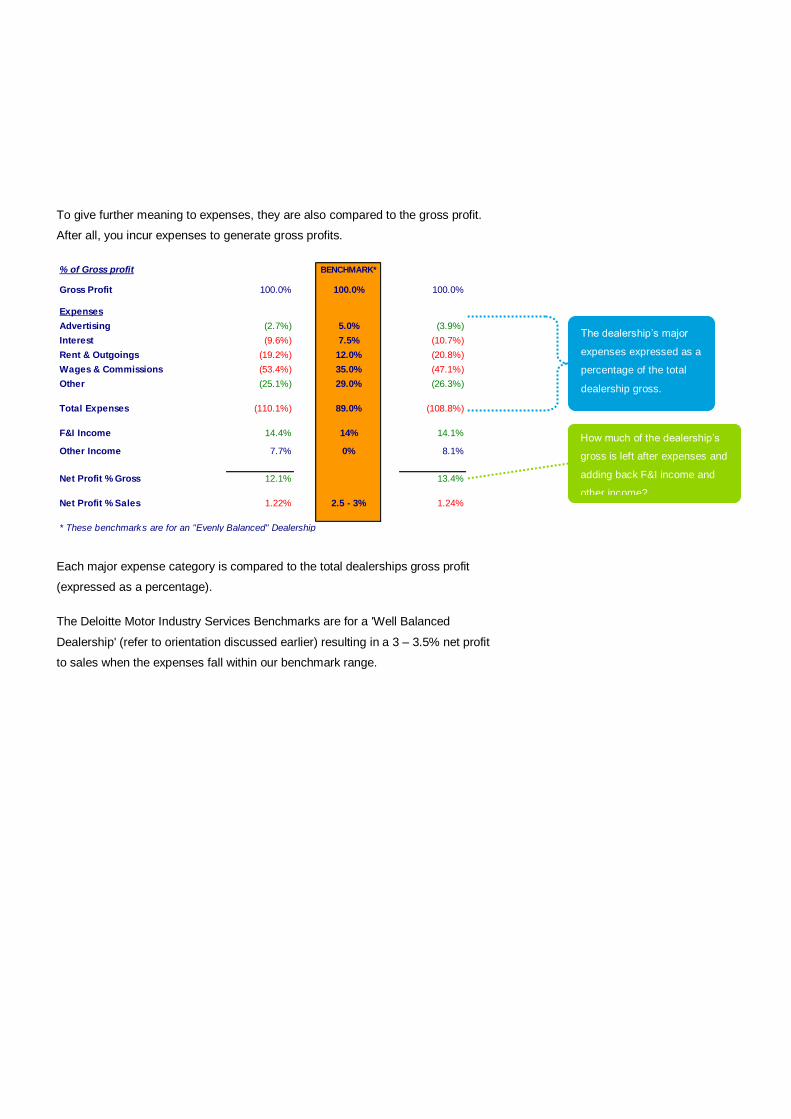
Used Vehicle Department
An analysis of the used vehicle department performance
Sample Dealership
NEW VEHICLE DEPARTMENT
UNIT SALES
Retail
Holden 30 FALSE 20 #
Kia 21 FALSE 13 #
Toyota 65 FALSE 45 #
TRUE #
Total Retail 137 96 #
#
Government/Rental Sales - Reporting Franchise 41 34 #
Fleet Sales - Reporting Franchise 88 134 #
Fleet & Govt Sales - Other Franchise/s 3 3 #
#
TOTAL UNITS 269 267 #
AVERAGE GROSS (before A/market + H/back)
Retail
Holden 323 ### 401 #
Kia 907 ### 1,118 #
Toyota 169 ### 268 #
### #
467 596 #
#
Government/Rental Sales - Reporting Franchise (596) (559) #
Fleet Sales - Reporting Franchise (28) (467) #
Fleet & Govt Sales - Other Franchise/s (312) (11) #
#
#
After Market Income 38,124 26,538
After Market per retail unit 278 276
Holdback/FPA Income 507,861 515,116
Holdback/FPA per unit 1,888 1,929
Gross per Retail Unit (incl H'back) 2,633 2,801
Gross per unit (total units) 2,022 $2,350 - 2,650 1,817
KEY BENCHMARKS
carrying value 9,484,545 9,598,864
units on hand 315 300
average cost 30,110 31,996
BENCHMARK
Days Supply (based on all sales) 36 45 - 60 34
Units/sales staff/month (all sales) 29.9 15 - 18 29.66666667
Gross per unit as % of Cost of Sale 8% 7 - 9% 7%
Gross per salesperson per mth 60,438 ### $37,500 - 45,000 53,919
BENCHMARK
Dec-11 Dec-10
Retail gross including
accessories and delivery
charges. Any loads are
reversed back to gross
(i.e. excluded).
Average holdback and
floorplan assistance per
unit. This includes FPA’s
calculated as a % of cost
of vehicle which are in
effect ‘quasi’ holdbacks.
Total new car gross
(including holdback and
aftermarket) per unit sold.
How well do I control my
new vehicle stock levels
and therefore floorplan
interest?
Total units sold = Sales/day
No. of days
Units on hand = Days supply
Sales/day
Gross per unit (total units)
divided by average cost
of sales.
How productive are my sales staff? Do I have
too many or do they have more potential?
Calculated using Total Units sold per month
divided by No of Sales Staff.
Sample Dealership
USED VEHICLE DEPARTMENT
SALES
Retail - $ 836,722 851,511
- units 40 51
Wholesale - units 48 42
GROSS
average retail gross (inc. After-market)
Cars 1,977 $2,350 1,430
Trucks
- -
average wholesale gross
Cars 97 Breakeven 283
Trucks - -
KEY BENCHMARKS
carrying value 1,772,318 1,723,656
units on hand 105 98
average cost 16,879 17,588
average cost of sale 18,941 15,266
BENCHMARK
Days Supply (based on retail sales) 80 45 - 60 58
Units per sales staff per month 8.0 14 - 16 10.2
No. of Sales Staff 5.0 5.0
Gross per unit as % of Cost of Sale 10% 13 - 15% 9%
Used / New Ratio (excl. Govt/Fleet) 0.3 0.7 0.5
Gross per sales person per month 15,818 $32,000 - 37,000 14,586
Dec-10Dec-11
BENCHMARKRetail gross including
aftermarket and
accessories. Any loads
are reversed back to
gross (i.e. excluded).
How does the average
cost of vehicles on the lot
compare to the value of
cars I sell?
Total retail sales = Sales/day
No. of days
Units on hand = Days supply
Sales/day
How well do I control my
used vehicle stock levels
and therefore my interest
costs?
Calculated using Used
Retail Units sold per New
Vehicle Sold (excluding
Fleet/Govt.)
How big is my used vehicle operation relative
to my new vehicle department? An evenly
balanced dealership ratio is 7 retail units to
10 new.

Finance & Insurance Department
An overview of F&I generated income/expenses and their related
benchmarks
Sample Dealership
FINANCE AND INSURANCE DEPARTMENT
Dec-11 Dec-10
SALES
Number of Contracts Written - New 72 37
Used 6 15
Total 78 52
GROSS
Finance Income - New 92,990 55,083
Used 6,149 40,337
Other
Insurance Income New 37,772 27,940
Used 610 646
Other 0 0
Total F& I Income 137,521 124,006
KEY BENCHMARKS
BENCHMARK
Finance Penetration - New 53% # 38 - 40% 39%
Used 15% # 39 - 43% 29%
Finance per Retail Sale - New 679 $750 574
Used 154 $700 791
Insurance per Retail Sale - New 276 $165 291
Used 15 $225 13
Salaries & Commissions as % of Gross 31% 22% 22%
Vehicles retailed per F&I Staff 49 40 - 60 42
This amount includes
commissions and interest
offset benefits.
New/Used finance
contracts written divided
by the New/Used retail
ratio (on Used page).
How effective am I at
converting vehicle
customers to finance
contracts?
F&I salaries and
commissions as a % of
total F&I income.
New/Used finance income
divided by new/used retail
units.
If this figure is high and
your penetration rate is
low, then you may need
to put on more F&I staff.

Parts Department
A summary of parts operations including gross
performance, sales mix and stock
Sample Dealership
PARTS DEPARTMENT
SALES MIX $ % BENCHMARK $ %
Retail 19,327 4% 7% 14,857 3%
Wholesale 20,493 4% 25% 32,032 6%
Workshop 212,451 40% 33% 197,665 36%
Warranty 22,512 4% 14% 21,861 4%
Internal 14,198 3% 21% 13,524 2%
Other 241,183 N/A N/A 271,593 N/A
TOTAL DEPARTMENT SALES 530,164 100% 100% 551,532 100%
GROSS PROFIT Retail 5,653 29% 35% 5,466 37%
Wholesale 7,704 38% 23% 8,235 26%
Workshop 41,505 20% 40% 37,671 19%
Warranty 1,485 7% 15% 1,521 7%
Internal 3,199 23% 22% 3,493 26%
Other (incl inventory adj) 37,395 16% N/A 46,452 17%
TOTAL DEPARTMENT GROSS 96,941 18% 28% 102,837 19%
KEY BENCHMARKS
BENCHMARK
Carrying Stock 551,130 487,448
Days Supply 39 40 - 55 33
Monthly Sales per employee 58,907 $70,000 - 80,000 61,281
No. of Parts Staff 9.0 9.0
$ Sales per $ salary 14.79 $17.00 20.04
Externally Generated Sales 8% 32% 9%
Dec-11 Dec-10
This shows where the
department’s sales come
from. Our benchmarks
are based on the parts
department being a profit
centre in its own right,
and not just simply
relying on the other
departments for sales.
Gross profit as % sales –
essentially reflecting the
size of your trade margins
Carrying stock = Days supply
Sales/day
Parts sales per month
divided by Total Parts Staff
How well do I control my
investment in parts stock?
A key indicator to parts
department performance
as salaries are the only
major expense in the
department, achieving a
high figure here, practically
guarantees a strong
bottom line.
Retail and
wholesale sales
mix percentage.
This analyses how much you pay
your staff relative to their
productivity. This ratio in
conjunction with parts sales per
employee allows you to assess
both your staff numbers and how
much you pay them.
Is your parts department self
supporting? A figure of 74%
or more shows your
department is extremely
externally focused and is a
true profit centre in its own
right.
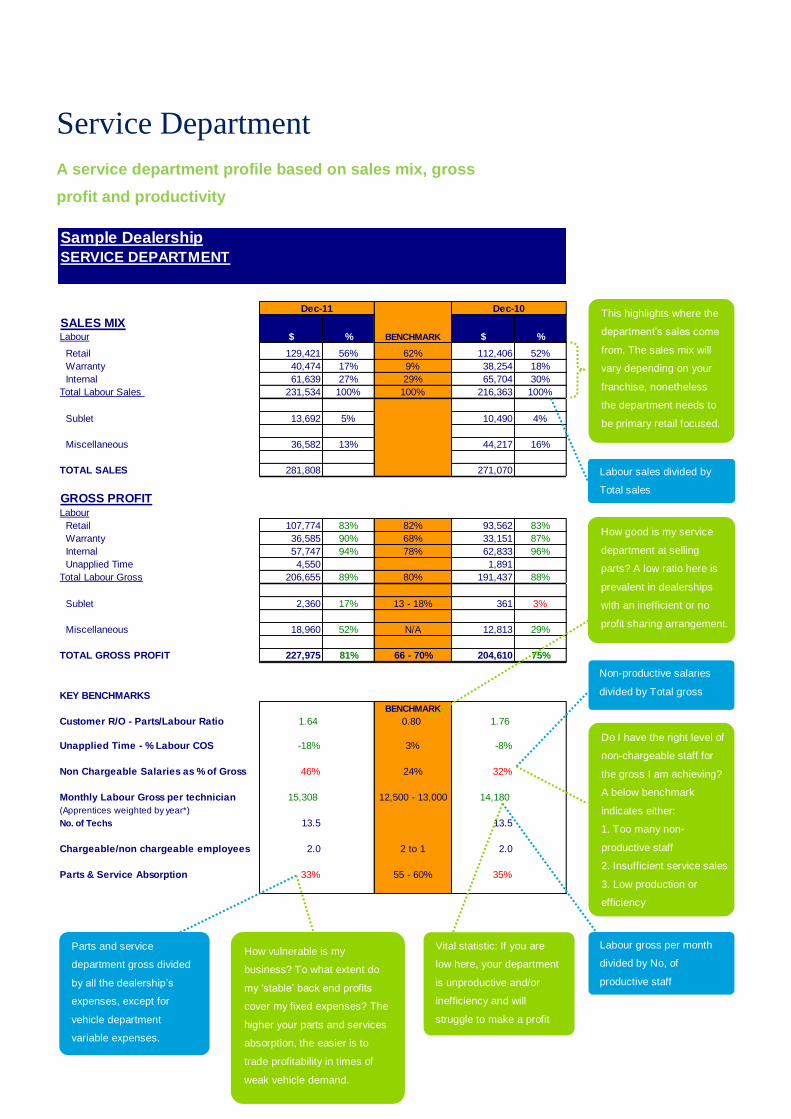
Service Department
A service department profile based on sales mix, gross
profit and productivity
Sample Dealership
SERVICE DEPARTMENT
SALES MIXLabour $ % BENCHMARK $ %
Retail 129,421 56% 62% 112,406 52%
Warranty 40,474 17% 9% 38,254 18%
Internal 61,639 27% 29% 65,704 30%
Total Labour Sales 231,534 100% 100% 216,363 100%
Sublet 13,692 5% 10,490 4%
Miscellaneous 36,582 13% 44,217 16%
TOTAL SALES 281,808 271,070
GROSS PROFITLabour
Retail 107,774 83% 82% 93,562 83%
Warranty 36,585 90% 68% 33,151 87%
Internal 57,747 94% 78% 62,833 96%
Unapplied Time 4,550 1,891
Total Labour Gross 206,655 89% 80% 191,437 88%
Sublet 2,360 17% 13 - 18% 361 3%
Miscellaneous 18,960 52% N/A 12,813 29%
TOTAL GROSS PROFIT 227,975 81% 66 - 70% 204,610 75%
KEY BENCHMARKS
BENCHMARK
Customer R/O - Parts/Labour Ratio 1.64 0.80 1.76
Unapplied Time - % Labour COS -18% 3% -8%
Non Chargeable Salaries as % of Gross 46% 24% 32%
Monthly Labour Gross per technician 15,308 12,500 - 13,000 14,180
(Apprentices weighted by year*)
No. of Techs 13.5 13.5
Chargeable/non chargeable employees 2.0 2 to 1 2.0
Parts & Service Absorption 33% 55 - 60% 35%
Dec-11 Dec-10This highlights where the
department’s sales come
from. The sales mix will
vary depending on your
franchise, nonetheless
the department needs to
be primary retail focused.
Labour sales divided by
Total sales
How good is my service
department at selling
parts? A low ratio here is
prevalent in dealerships
with an inefficient or no
profit sharing arrangement.
Labour gross per month
divided by No, of
productive staff
Do I have the right level of
non-chargeable staff for
the gross I am achieving?
A below benchmark
indicates either:
1. Too many non-
productive staff
2. Insufficient service sales
3. Low production or
efficiency
Non-productive salaries
divided by Total gross
Vital statistic: If you are
low here, your department
is unproductive and/or
inefficiency and will
struggle to make a profit
How vulnerable is my
business? To what extent do
my ‘stable’ back end profits
cover my fixed expenses? The
higher your parts and services
absorption, the easier is to
trade profitability in times of
weak vehicle demand.
Parts and service
department gross divided
by all the dealership’s
expenses, except for
vehicle department
variable expenses.
Snapshot Performance Graph
How does my dealership compare to industry
benchmarks?
These graphs show in an instant how your dealership compares to benchmark for
ten key performance indicators - the ultimate performance indicator being Net
Profit %.
The more BLUE you see, the more Profitable your Dealership. Track the Shape of
your graph from period to period.

Departmental Profit Analysis
How well do I keep the gross that I make?
How well do the departments retain the gross that they make? Selling grosses are
tabulated for each department where achievement of benchmarks at each line will
lead to a 2% bottom line.
Sample Dealership
KEY BENCHMARK GRAPH - Current Period
CURRENT PERIOD:
PREVIOUS PERIOD:
Dec-11
Dec-10
-
50
100
150
200
250 Net Profit %
Labour Gross per Technician
Parts to Labour Ratio
$ Parts Sales per employee
Parts GP%
New F&I Penetration
Used / New Ratio
Used Cars - stock turns
Used Car GPU
New GPU
Benchmark
Actual
-
50
100
150
200
250 Net Profit %
Labour Gross per Technician
Parts to Labour Ratio
$ Parts Sales per employee
Parts GP%
New F&I Penetration
Used / New Ratio
Used Cars - stock turns
Used Car GPU
New GPU
Benchmark
Actual
Being significantly under
the benchmark, there
could be some great
opportunities by focusing
on finance and insurance
performance.
Sales people commission
as a % of gross profit
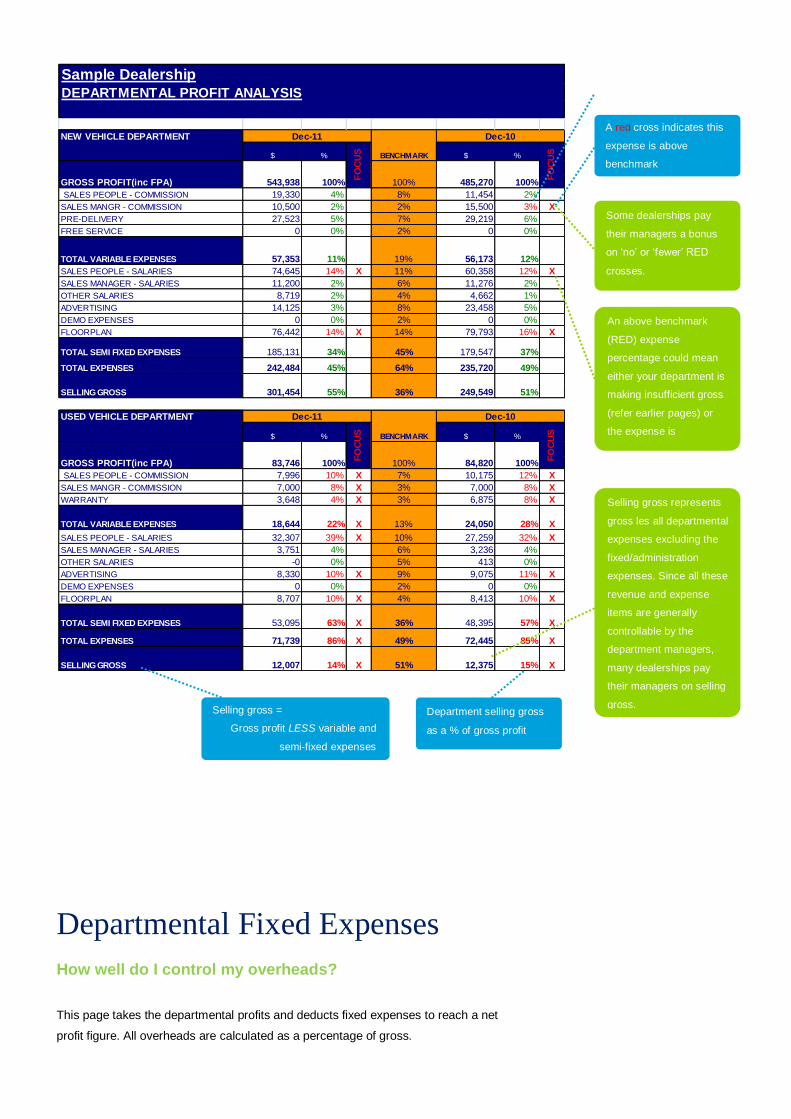
Departmental Fixed Expenses
How well do I control my overheads?
This page takes the departmental profits and deducts fixed expenses to reach a net
profit figure. All overheads are calculated as a percentage of gross.
Sample Dealership
DEPARTMENTAL PROFIT ANALYSIS
NEW VEHICLE DEPARTMENT
$ % BENCHMARK $ %
GROSS PROFIT(inc FPA) 543,938 100% 100% 485,270 100%
SALES PEOPLE - COMMISSION 19,330 4% 8% 11,454 2%
SALES MANGR - COMMISSION 10,500 2% 2% 15,500 3% X
PRE-DELIVERY 27,523 5% 7% 29,219 6%
FREE SERVICE 0 0% 2% 0 0%
TOTAL VARIABLE EXPENSES 57,353 11% 19% 56,173 12%
SALES PEOPLE - SALARIES 74,645 14% X 11% 60,358 12% X
SALES MANAGER - SALARIES 11,200 2% 6% 11,276 2%
OTHER SALARIES 8,719 2% 4% 4,662 1%
ADVERTISING 14,125 3% 8% 23,458 5%
DEMO EXPENSES 0 0% 2% 0 0%
FLOORPLAN 76,442 14% X 14% 79,793 16% X
TOTAL SEMI FIXED EXPENSES 185,131 34% 45% 179,547 37%
TOTAL EXPENSES 242,484 45% 64% 235,720 49%
SELLING GROSS 301,454 55% 36% 249,549 51%
USED VEHICLE DEPARTMENT
$ % BENCHMARK $ %
GROSS PROFIT(inc FPA) 83,746 100% 100% 84,820 100%
SALES PEOPLE - COMMISSION 7,996 10% X 7% 10,175 12% X
SALES MANGR - COMMISSION 7,000 8% X 3% 7,000 8% X
WARRANTY 3,648 4% X 3% 6,875 8% X
TOTAL VARIABLE EXPENSES 18,644 22% X 13% 24,050 28% X
SALES PEOPLE - SALARIES 32,307 39% X 10% 27,259 32% X
SALES MANAGER - SALARIES 3,751 4% 6% 3,236 4%
OTHER SALARIES -0 0% 5% 413 0%
ADVERTISING 8,330 10% X 9% 9,075 11% X
DEMO EXPENSES 0 0% 2% 0 0%
FLOORPLAN 8,707 10% X 4% 8,413 10% X
TOTAL SEMI FIXED EXPENSES 53,095 63% X 36% 48,395 57% X
TOTAL EXPENSES 71,739 86% X 49% 72,445 85% X
SELLING GROSS 12,007 14% X 51% 12,375 15% X
Dec-11
Dec-11
Dec-10
FO
CU
S
Dec-10
FO
CU
S
FO
CU
SF
OC
US
An above benchmark
(RED) expense
percentage could mean
either your department is
making insufficient gross
(refer earlier pages) or
the expense is
excessive.
Some dealerships pay
their managers a bonus
on ‘no’ or ‘fewer’ RED
crosses.
Department selling gross
as a % of gross profit
Selling gross represents
gross les all departmental
expenses excluding the
fixed/administration
expenses. Since all these
revenue and expense
items are generally
controllable by the
department managers,
many dealerships pay
their managers on selling
gross.
A red cross indicates this
expense is above
benchmark
Selling gross =
Gross profit LESS variable and
semi-fixed expenses

Overview Result
Which of my departments is making me money?
Sample Dealership
DEALERSHIP FIXED EXPENSE ANALYSIS
DEPT CONTRIBUTION TO PROFITS $ % $ %
(excluding Parts Gross Transfer) SELLING GROSS OF GROSS BENCHMARK SELLING GROSS OF GROSS
NEW 301,454 55% 36% 249,549 51%
USED 12,007 14% X 51% 12,375 15% X
PARTS 50,846 52% X 69% 67,200 65% X
SERVICE 103,007 45% X 64% 119,762 59% X
TOTAL DEALERSHIP SELLING GROSS 467,314 49% 52% 448,887 51%
AS % OF TOTAL GROSS
DEALERSHIP FIXED EXPENSES EXPENSES EXPENSES
ADMINISTRATION SALARIES(Inc Dealer salary) 146,463 15.38% X 6.00% 129,386 14.74% X
FRINGE BENEFITS TAX (Net of contributions) 6,500 0.68% X 0.50% 6,500 0.74% X
PAYROLL TAX 28,004 2.94% X 2.50% 21,607 2.46%
SUPERANNUATION 46,832 4.92% X 4.00% 39,488 4.50% X
LONG SERVICE LEAVE -7,733 -0.81% 0.50% 1,900 0.22%
RENT OR EQUIVALENT 140,576 14.76% X 9.00% 140,603 16.02% X
RATES AND TAXES 15,400 1.62% X 1.00% 15,400 1.75% X
OUTSIDE SERVICES 26,769 2.81% X 2.00% 26,265 2.99% X
TELEPHONE 7,250 0.76% 1.00% 7,250 0.83%
INSURANCE (Including workers comp.) 16,950 1.78% 2.00% 16,950 1.93%
OFFICE SUPPLIES 7,600 0.80% X 0.75% 7,600 0.87% X
PROF. FEES (Accounting, Legal, Other) 3,200 0.34% 0.75% 3,334 0.38%
DATA PROCESSING 8,250 0.87% 1.50% 8,250 0.94%
BANK CHARGES AND TAXES 4,843 0.51% X 0.50% 5,752 0.66% X
INTEREST (overdraft, working capital etc) 6,738 0.71% 1.00% 5,918 0.67%
BAD DEBTS 0 0.00% 0.00% 0 0.00%
DEPRECIATION 41,000 4.30% X 1.50% 41,000 4.67% X
ELECTRICITY 8,570 0.90% 1.00% 8,570 0.98%
TRAVEL & ENTERTAINMENT 932 0.10% 0.50% 1,177 0.13%
MISCELLANEOUS - Training, licenses etc 12,773 1.34% 2.50% 11,237 1.28%
TOTAL FIXED EXPENSES 520,918 54.68% X 38.50% 498,188 56.77% X
F & I (Net) / OTHER INCOME 168,444 18% 14% 167,117 19.04%
NET PROFIT 114,841 12% 25 - 30% 117,816 13%
NET PROFIT AS % OF SALES 114,841 1.2% 2.5 - 3% 117,816 1.2% 0.03
TOTAL DEALERSHIP SALES 9,428,538 9,520,400 14%
TOTAL DEALERSHIP GROSS 952,600 877,538
Dec-10
FO
CU
S
FO
CU
S
FO
CU
S
FO
CU
S
Dec-11
Department selling gross
Administrative salaries as
a % of gross profit
If this expense is above
benchmark, you may
either have:
1 Too many admin staff
and/or
2. More gross potential
Net profit as a
Percentage of Sales
A well balanced
dealership should aim for
3 – 3.5%
A red cross indicates this
expense is above
benchmark
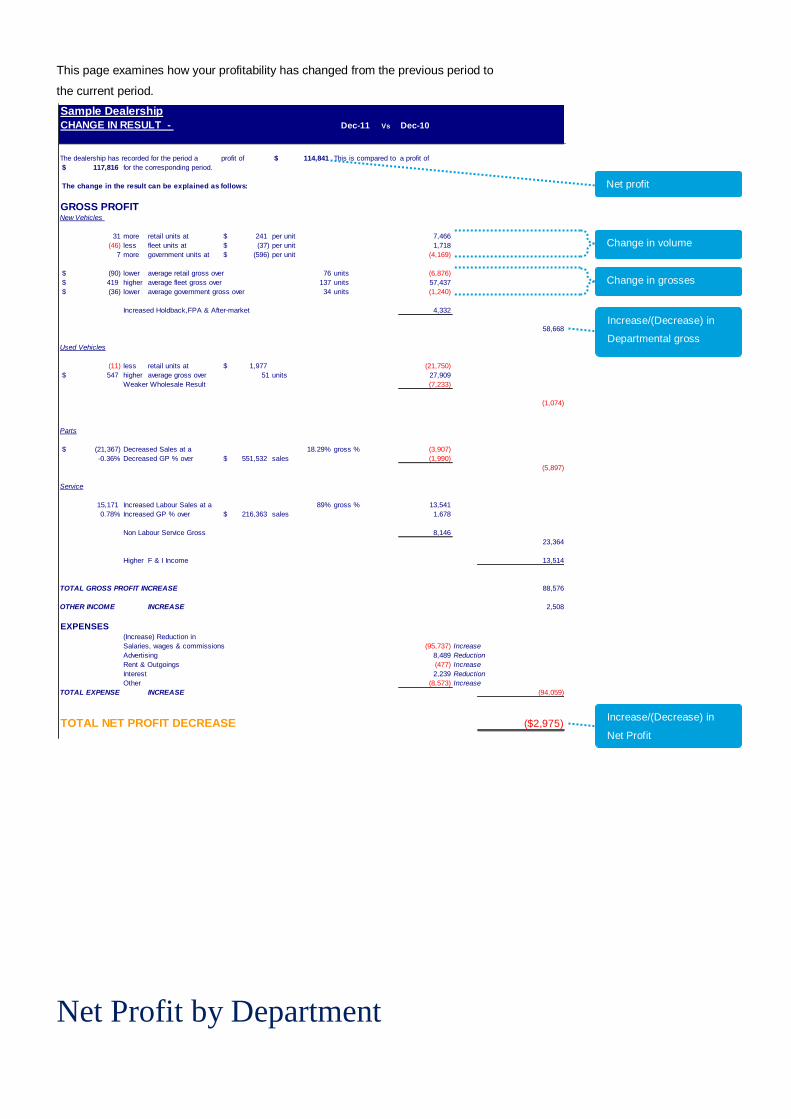
This page examines how your profitability has changed from the previous period to
the current period.
Net Profit by Department
Sample Dealership
CHANGE IN RESULT - Vs
The dealership has recorded for the period a profit of 114,841$ This is compared to a profit of
117,816$ for the corresponding period.
The change in the result can be explained as follows:
GROSS PROFITNew Vehicles
31 more retail units at 241$ per unit 7,466
(46) less fleet units at (37)$ per unit 1,718
7 more government units at (596)$ per unit (4,169)
(90)$ lower average retail gross over 76 units (6,876)
419$ higher average fleet gross over 137 units 57,437
(36)$ lower average government gross over 34 units (1,240)
Increased Holdback,FPA & After-market 4,332
58,668
Used Vehicles
(11) less retail units at 1,977$ (21,750)
547$ higher average gross over 51 units 27,909
Weaker Wholesale Result (7,233)
(1,074)
Parts
(21,367)$ Decreased Sales at a 18.29% gross % (3,907)
-0.36% Decreased GP % over 551,532$ sales (1,990)
(5,897)
Service
15,171 Increased Labour Sales at a 89% gross % 13,541
0.78% Increased GP % over 216,363$ sales 1,678
Non Labour Service Gross 8,146
23,364
Higher F & I Income 13,514
TOTAL GROSS PROFIT INCREASE 88,576
OTHER INCOME INCREASE 2,508
EXPENSES(Increase) Reduction in
Salaries, wages & commissions (95,737) Increase
Advertising 8,489 Reduction
Rent & Outgoings (477) Increase
Interest 2,239 Reduction
Other -8573 (8,573) Increase
TOTAL EXPENSE INCREASE (94,059)
TOTAL NET PROFIT DECREASE ($2,975)
Dec-10Dec-11
Net profit
Change in volume
Increase/(Decrease) in
Net Profit
Change in grosses
Increase/(Decrease) in
Departmental gross

This page allocated administration/fixed expenses to the department to come up
with a Department Net Profit.
Deloitte refers to one or more of Deloitte Touche Tohmatsu Limited, a UK private company limited by guarantee, and its network of member firms, each of which is a legally separate and independent entity. Please see www.deloitte.com/au/about for a detailed description of the legal structure of Deloitte Touche Tohmatsu Limited and its member firms.
Liability limited by a scheme approved under Professional Standards Legislation. 20
Member of Deloitte Touche Tohmatsu Limited
© 2014 Deloitte Motor Industry Services Pty Ltd
i Based on 2014 Deloitte Motor Industry Benchmarks – Australia
Sample Dealership
NET PROFIT BY DEPARTMENT
Sales $
Departmental
Selling Gross
Admin expenses
allocated in
proportion to
Gross
Departmental Net
Profit
Net Profit
%Sales B/Mark
New (Inc F&I) 7,522,165 391,962 297,446 94,516 1.3% 2-3%
Used (Inc F&I) 1,094,400 16,686 45,796 -29,110 -2.7% 3.5 - 4%
Parts 530,164 50,846 53,011 -2,165 -0.4% 7 - 9%
Service 281,808 103,007 124,665 -21,659 -7.7% 14 - 16%
Other Income 73,257 73,257
TOTAL 9,428,538 635,759 520,918 114,841 1.2% 2.5 - 3%
Sales $
Departmental
Selling Gross
Admin expenses
allocated in
proportion to
Gross
Departmental Net
Profit
Net Profit
%Sales B/Mark
New (Inc F&I) 7,615,249 314,068 275,493 38,575 0.5% 2-3%
Used (Inc F&I) 1,082,550 44,224 48,153 -3,929 -0.4% 3.5 - 4%
Parts 551,532 67,200 58,382 8,818 1.6% 7 - 9%
Service 271,070 119,762 116,160 3,603 1.3% 14 - 16%
Other Income 70,749 70,749
TOTAL 9,520,400 616,003 498,188 117,816 1.2% 2.5 - 3%
Dec-11
Dec-10
Department selling
gross contribution
Expense allocated on Gross
Orientation. If your New Vehicle
Department contributes 30% of
the dealership gross, then it is
allocated 30% of the overheads.