Burrard Bride Bike Lanes Status Report: 2009 Nov 3
46
ADMINISTRATIVE REPORT Report Date: October 27, 2009 Contact: Jerry Dobrovolny Contact No.: 604.873.7331 RTS No.: 08127 VanRIMS No.: 08-2000-20 Meeting Date: November 3, 2009 TO: Standing Committee on Transportation and Traffic FROM: General Manager of Engineering Services SUBJECT: Burrard Bridge Bike Lanes Status Report, Fall 2009 RECOMMENDATION A. THAT Council receive this report for information. B. THAT, following the 2010 Winter Games, staff report back with options for permanent bridge configurations which do not include bridge widening. COUNCIL POLICY On May 7, 2009, Council directed staff to implement a re-allocation of the west curb lane of the Burrard Bridge to provide a southbound bicycle lane on the bridge, to convert the east sidewalk to an exclusive northbound bicycle path and to direct all pedestrians to use the west sidewalk. PURPOSE This report provides a review of the findings to date resulting from the bridge reconfiguration, which was implemented in July 2009. BACKGROUND In May 2009, staff began a monitoring program aimed at assessing the impact of changes to the Burrard Bridge on pedestrian, bicycle and vehicular traffic, on transit operations and on surrounding neighbourhoods. Supports Item No. 1 T&T Committee Agenda November 3, 2009
-
Upload
khangminh22 -
Category
Documents
-
view
0 -
download
0
Transcript of Burrard Bride Bike Lanes Status Report: 2009 Nov 3

ADMINISTRATIVE REPORT
Report Date: October 27, 2009 Contact: Jerry Dobrovolny Contact No.: 604.873.7331 RTS No.: 08127 VanRIMS No.: 08-2000-20 Meeting Date: November 3, 2009 TO: Standing Committee on Transportation and Traffic
FROM: General Manager of Engineering Services
SUBJECT: Burrard Bridge Bike Lanes Status Report, Fall 2009
RECOMMENDATION
A. THAT Council receive this report for information.
B. THAT, following the 2010 Winter Games, staff report back with options for permanent bridge configurations which do not include bridge widening.
COUNCIL POLICY
On May 7, 2009, Council directed staff to implement a re-allocation of the west curb lane of the Burrard Bridge to provide a southbound bicycle lane on the bridge, to convert the east sidewalk to an exclusive northbound bicycle path and to direct all pedestrians to use the west sidewalk. PURPOSE
This report provides a review of the findings to date resulting from the bridge reconfiguration, which was implemented in July 2009. BACKGROUND
In May 2009, staff began a monitoring program aimed at assessing the impact of changes to the Burrard Bridge on pedestrian, bicycle and vehicular traffic, on transit operations and on surrounding neighbourhoods.
Supports Item No. 1 T&T Committee Agenda November 3, 2009

Burrard Bridge Bike Lanes Status Report
2
As an integral part of the project an extensive communications program was undertaken. This campaign included mass media advertising in print and on radio, banners placed on the bridge itself, signage, extensive information on the City’s website, social media, and earned media opportunities (over 30 media interviews were done with City staff). Focus group research and a survey were done to understand awareness and attitudes around the issue, the bridge and the options (see Appendix A). The objective was to ensure that drivers knew and would not be surprised by the reconfiguration, and made aware of alternatives – primarily transit and the nearby Granville Bridge. On the weekend of July 10-13, 2009 changes were put in place on the Burrard Bridge and adjacent streets to create protected bike lanes on the bridge and connecting streets. On the morning of Monday, July 13 the new walking and cycling facilities were opened to the public. Staff have collected and analysed data over the period leading up to and since the installation of the protected bike lanes. Findings of these analyses are discussed below. DISCUSSION
Pedestrians All pedestrians crossing the Burrard Bridge must now use the west sidewalk, which is no longer shared with bicycles. Most feedback from pedestrians has been positive, citing the comfort and safety of a pedestrian only route. Some have objected to the closure of the east sidewalk to pedestrians. The number of walking trips across the bridge has not significantly changed noticeably. Cyclists Cyclists can now cross the bridge on northbound and southbound bike paths, separated from both vehicles and pedestrians. Feedback from cyclists has been overwhelmingly positive. Cyclists feel much safer separated from other bridge users. Cycling volumes are up appreciably. Between July 13 and September 30, 26% more bicycle trips were made over the bridge than would have been made had the reconfiguration not happened. This amounts to an additional 70,000 bike trips. Growth on weekends has been the most dramatic, with volumes up 40-70%. Since Labour Day, the number of new trips has fallen when compared with summer usage, but remains above the level which would be expected on an unchanged bridge. New cycling trips are not evenly distributed across age and gender lines. Trips by women are up 31%, compared to 23% for men. Anecdotally, many more children are seen cycling across the bridge. Transit Transit operations appear to be unaffected by the bridge changes. According to a TransLink analysis of bus running times before and after the reconfiguration “there is little to no negative effect on bus running time since the introduction of the bike lane”.

Burrard Bridge Bike Lanes Status Report
3
Vehicles Neither the Burrard nor the Granville Bridge has seen appreciable changes in the number of daily vehicle crossings. The first few days following the re-configuration on Burrard saw some redistribution of traffic to Granville, but that had returned to pre – trial status within a week. As with buses, general vehicle travel times along Burrard Street are unchanged. Driving trips which approach the north end of the bridge from the east along Pacific are longer by about 30 seconds during peak periods. The most noticeable change to vehicle travel times is for trips approaching the north end of the bridge from the west along Thurlow or Pacific. Accessing the bridge from Georgia street via Thurlow and Pacific now takes an average 1½ minutes longer in the morning peak period and 3 minutes longer in the afternoon. Safety The City has received many comments from pedestrians and cyclists who believe that the Burrard Bridge is now safer. Preliminary findings from a University of British Columbia cycling safety study indicate that accident rates have decreased. In a nine week period in the summer of 2008, three cyclists where injured on the Burrard Bridge severely enough to attend Emergency at Saint Paul’s or Vancouver General Hospital. Two of these incidents involved collisions between cyclists and pedestrians with the cyclist falling into the roadway. In the same nine week period in 2009, since the re-configuration, only one cyclist attended Emergency. This southbound cyclist fell onto the adjacent sidewalk after colliding with a wrong-way cyclist. It needs to be emphasized that these safety-related findings are preliminary, as they are based on small sample sizes and a short study period. A longer study is warranted. Staff continue to work with the UBC researchers running this study. Business Businesses in the downtown core do not appear to have been affected. The Downtown Vancouver BIA has polled its members twice to solicit input regarding the bridge trial. There has been no response to these polls, suggesting that these businesses do not perceive any change. Closer to the bridge, two retailers on Hornby Street have seen drive-by traffic reduced in front of their shops. They have requested that a safety-related vehicle right-turn restriction at Pacific and Hornby be removed. Reinstating this right-turn would create a situation where, in peak hours, approximately 250 vehicles would turn across the path used by up to 200 cyclists. Staff have reviewed options beyond the previous and current arrangements, and are confident that the current arrangement, with vehicle right-turns prohibited, is the safest possible. Neighbourhoods Re-direction of traffic onto Howe and Beach, related to the new right-turn restriction at Pacific and Hornby, has been a concern of residents of Beach Avenue. The re-direction of this traffic is considered by staff to be an acceptable consequence of increasing cyclist safety at

Burrard Bridge Bike Lanes Status Report
4
Pacific and Hornby. Traffic volumes on these streets remain within norms for downtown residential streets. East bound traffic queues are a concern for some residents of Pacific, west of Burrard. This queuing is a consequence of the reduced capacity of the Pacific to Burrard Bridge right-turn which resulted from introducing the protected bike lane. The length of these queues appears to have diminished since the summer, possibly as some drivers are choosing other routes across False Creek. Communication and Public Opinion The City has received feedback from many bridge users. The opinions of pedestrians and cyclists have been positive and those of motorists have been more critical of the reconfiguration. A public opinion survey of Vancouver residents conducted in September 2009 found strong broad support for retaining the reconfiguration (see Appendix A). The communications were successful in reaching their objective and the tactics which were notably effective were the use of the Vancouver Sun front page wrap and the television and radio interviews, which was reflected strongly in the survey (as well as anecdotally and in the media). Also evidenced in the research was substantial support for the reconfiguration (by a two to one margin both before and after changes were made) and correspondingly weak support for the more expensive alternatives to either build a new bridge or widen the sidewalk. Next Steps Monitoring and analysis of pedestrian, cycling and vehicle use of the Burrard Bridge will continue. Following the 2010 Winter Games, staff will report back with an updated status report and options for permanent bridge configurations which do not include bridge widening. FINANCIAL IMPLICATIONS
There are no financial implications. CONCLUSION
The reconfiguration of the Burrard Bridge, implemented in July 2009, has generated many positive outcomes and been a successful step forward in our sustainable transportation initiative and our work towards the goal of being the greenest city. Notable outcomes include:
• the number of cycling trips across the bridge has increased significantly (26% increase in the period July 13 to September 30)
• pedestrians and cyclists feel safer and more comfortable • the risk of serious cyclist injury has likely been reduced • gender split amongst cyclists on the bridge is more equal and more women are cycling
on the bridge.

Burrard Bridge Bike Lanes Status Report
5
• the reconfiguration has shown that the bridge can function with only two southbound vehicle lanes under existing vehicle volumes without significant negative impact on transit or other traffic
The reconfiguration has also created some issues which will continue to be monitored and considered in the report back. These include:
• some pedestrians remain opposed to being prohibited from the east sidewalk • travel times have increased somewhat for vehicle trips on Pacific and Thurlow • redirection of traffic from Hornby to Howe and Beach is a consequence of a cyclist
safety measure at Pacific and Hornby, and no acceptable alternatives to this impact have been identified
Given these findings, it is the opinion of staff that the protected bike lanes should remain in place and staff will report back after the 2010 Games with a proposal for the permanent plans for bridge reconfiguration which do not include bridge widening.
* * * * *

402 – 1505 West Second Avenue Vancouver BC V6H 3Y4
[email protected] www.mustelgroup.com Tel 604.733.4213 Fax 604.733.5221
Presented to:
City of Vancouver Burrard Bridge Lane Reallocation Residents Surveys — Mid-Trial Report
September 2009
Burrard Bridge Lane Reallocation — Residents Surveys
Mustel Group Market Research Table of Contents
Contents
Executive Overview ...................................................................................... 1
Foreword ........................................................................................................ 6
Detailed Findings ......................................................................................... 8
1. Awareness and Knowledge of Lane Re-allocation Trial .......................................... 8
2. Pre-implementation Support for Trial ........................................................................ 14
3. Opinion on Retention of Cycle Lane and Other Options ..................................... 16
4. Influence of the Trial on Personal Behaviour ........................................................... 19
5. Preferred Type of Communication about Bridge Trial ......................................... 24
6. Infrastructure for Sustainable Travel Alternatives .................................................. 25
7. Current Transportation Patterns (Mid-trial) .............................................................. 27
8. Demographics ..................................................................................................................... 32
Appendix ...................................................................................................... 33
Questionnaire

Burrard Bridge Lane Reallocation — Residents Surveys
Mustel Group Market Research Page 1
Executive Overview Introduction
As part of its Greenest City Initiative, the City of Vancouver is currently conducting a lane
reallocation trial on the Burrard Bridge, offering greater opportunities for bridge use among
current and potential cyclists and pedestrians by providing a safer alternative. The reallocation
measures include conversion of one southbound traffic lane to bicycles only, the east sidewalk
to northbound cycle traffic and the west sidewalk to all pedestrian traffic. Mustel Research
Group was commissioned to conduct research among residents prior to and during this trial
and the accompanying information campaign.
For each of the pre-trial and mid-trial phases of research, 300 random telephone interviews
were completed among City residents with an emphasis on target neighbourhoods most
affected by the changes to the bridge—i.e., all of the Downtown and the near Westside (west
of Granville Street and north of 33rd Avenue). Approximately 80% of the interviews were with
residents of these target neighbourhoods and 20% with residents from the rest of the City.
Results in total are weighted on the basis of age within gender and brought into regional
proportion according to the latest census data.
The purpose of the research is to track:
i) Public awareness of the trial and related communications
ii) Attitude toward the trial and retention of the lane reallocation after the trial period
iii) Degree to which the trial is expected to have/has had an impact on use of the bridge
The pre-wave was conducted June 18-29, 2009—just preceding launch of the
communications campaign and prior to the July 13th implementation of the trial. The mid-
wave was conducted September 23-28, 2009. A copy of the questionnaire is appended.
This Executive Overview summarizes the key findings from both pre-trial and mid-trial waves
of research. A more detailed description of the methodology and an illustrated presentation of
the findings are found in the Methodology and Detailed Findings sections of this report.
Key Findings
Awareness and Knowledge of Changes and of Lane Reallocation Trial Changes on Burrard Bridge: A sizable majority of City residents have heard that
some changes have been made to the Burrard Bridge (73%). Awareness is higher in
the target neighbourhoods, where about 8-in-10 knows of changes (79% of
Downtown area residents and 86% of those residing in the Near Westside).

Burrard Bridge Lane Reallocation — Residents Surveys
Mustel Group Market Research Page 2
Television and newspaper are the most common sources of awareness, followed next
by radio. Personally witnessing the changes and banners on the Burrard Bridge were
also mentioned, in addition to word of mouth and the Internet.
When asked to articulate knowledge about the changes, most people know of adding
or allocating a lane for cycling. There generally is less mention about changes for
pedestrians.
Awareness of the Trial: City-wide, about 6-in-10 residents had already heard of
the lane reallocation trial by the end of June, not surprisingly given the considerable
media attention. Since then, awareness of summer-fall trial has grown significantly.
Currently, about 7-in-10 City-wide know of the trial. Awareness is higher among target
area residents (over 8-in-10) and increased most dramatically among Downtown
residents (from 63% in late June to 82% by mid-trial).
Perceived Reasons for Trial: Environmentally-related reasons are given most
often when residents are asked why they think the City is conducting this trial—for
example, reducing traffic congestion, encouraging mode shift/being more bicycle-
pedestrian friendly, improving air quality.
Safety and appeasing cyclists are cited as other rationale for the trial.
Pre-implementation Support for Trial Prior to implementation, support outweighed opposition to the lane reallocation trial
by significant margins city-wide and in the target neighbourhoods. In total, somewhat
under half (46%) gave their support versus 20% opposed. In the target areas at least
half favoured the trial (50-52%), while around 25-30% opposed it. The balance was
neutral on the subject.
Support was found across all demographic groups including single occupant vehicle
drivers (42% in favour vs. 31% against).
Reasons for support were primarily environmentally-oriented (encouraging alternative
transportation, being more cycle-/pedestrian-friendly, good for the environment/
emissions reduction). Other reasons for support included safety, worth a try/ to
produce real data on feasibility and to reduce traffic congestion.
Among those who opposed the trial, the most common concern was an increase in
traffic congestion on the bridge, which some felt was already congested. Other
objections voiced included negative comments about cyclists, bad idea/not properly
thought out/consider other solutions, unnecessary/have enough room and unsafe.

Burrard Bridge Lane Reallocation — Residents Surveys
Mustel Group Market Research Page 3
Opinions on Retention of Southbound Cycle Lane and Other Options
Residents tend to support retaining the southbound lane reallocation beyond the
trial period. City-wide, 45% favour retention versus 21% against. As well, support
tends to be solid (33% strongly favour vs. 12% somewhat in favour). The balance of
residents are neutral, as they are largely unaffected by the change.
• In the target areas, support for retention is significantly higher with 60% of Near
Westside residents and 57% of Downtown residents in favour of keeping the
southbound cycle-only lane. Opposition in these areas is about 18-20%. Most
cyclists and pedestrians who use Burrard Bridge are in favour of retention (90%
and 71%, respectively, with most being ‘strongly’ in favour). Even single occupant
drivers tend to be in support (51% vs. 31% against).
• Supporters consider retention a good idea since it increases safety for cyclists and
pedestrians—noted significantly more by target neighbourhood residents (24%)
and by cyclists and pedestrians themselves (45-47%). Other rationale for retention
include that it encourages alternative modes of transportation, is good for the
environment (reducing emissions/traffic congestion), and is more cycle/pedestrian
friendly.
• The primary objection is traffic congestion and disruption of traffic flow.
Two other possible future configurations for Burrard Bridge which require new
funding in the range of $30-60 million are rejected by most residents holding an
opinion. Opposition outweighs support by wide margins.
• In total, about half of residents city-wide are against widening the sidewalks at a
cost of $30 million. While 20% favour this idea, the remaining 24% are neutral.
Support is slightly higher on the Near Westside than Downtown (26% vs. 15%).
• Building a new bridge exclusively for pedestrians and cyclists at a cost of $60
million or more is rejected by somewhat more residents (62% city-wide vs. just
16% in favour). Support is slightly higher in the Downtown (28%) and the Near
Westside (23%) than elsewhere in the City (11%).
Influence of the Trial on Personal Behaviour Findings reveal that the trial has had a positive impact thus far, as about 14% of
residents, city-wide have been encouraged to walk or cycle across the Burrard Bridge
due to the changes made. Those who reside in the Near Westside are more likely to
have been encouraged by the changes to walk or cycle across the bridge (26%).

Burrard Bridge Lane Reallocation — Residents Surveys
Mustel Group Market Research Page 4
Burrard Bridge usage (past month, past 7 days) is fairly consistent with the pre-trial
measure for Near Westside and other City residents, but is down somewhat among
those from the Downtown peninsula; this may be reflective of a seasonal shift.
Since the pre-trial, significant shifts are evident in mode of transportation used to cross
Burrard Bridge among past month bridge users, as follows:
• Increased cycling overall, but especially among Near Westside and Downtown
peninsula residents, both of which nearly doubled among past month Burrard
Bridge users;
• Increased walking across the bridge among Downtown residents;
• Single occupant vehicle usage down, but increased carpooling to cross the bridge.
Preferred Type of Communication about Bridge Trial When residents are asked their preference, newspaper is named unprompted as the
most preferred channel for receiving more information about the lane reallocation
trial, although other media are suggested too (e.g., TV, direct mail, City website).
Infrastructure for Sustainable Alternatives City infrastructure is the best regarded for walking among the alternative modes of
travel measured (rated 7.7 out of 10). Cycling infrastructure and mass transit receive
similar ratings (6.2 and 6.1 out of a possible 10).
Changes to the City’s cycling infrastructure in past year, in the form of expanding the
number of cycling routes and cycle-oriented road and traffic light improvements, have
been noticed by nearly six-in-ten residents (58%).
These improvements have had a positive effect among those who have noticed the
changes. Just under half say that due to these improvements they have either chosen
to cycle more often (20%) or become more interested in cycling in the future (26%).
Current Transportation Patterns (Mid-trial) Travel to/from Downtown for any purpose by any mode: 2.3 days per week on
average; 3.5 days per week among Downtown peninsula residents
Commuting to Work Downtown: 20% city-wide; 35% of Downtown residents
Commuting to School Downtown: 4% city-wide; 8% of Downtown residents
Frequency of riding a bicycle: 61% past year; 27% at least weekly in total
Year-round cycling: 22% and slightly higher in the target areas (27-32%)

Burrard Bridge Lane Reallocation — Residents Surveys
Mustel Group Market Research Page 5
Demographic Considerations The Burrard Bridge is used by a cross-section of City residents. Those who walk or cycle
across the bridge is also represented by the spectrum of residents including all age
segments and different household compositions.
Conclusions
In sum, the mid-trial findings are as follows:
The public is broadly aware of the Lane Reallocation Trial, particularly in the target
neighbourhoods with noticeable gains among Downtown residents since the pre-trial.
At mid-trial there is support for retaining the southbound cycling-only lane by a
significant margin among those with an opinion. In the target neighbourhoods
support outweighs opposition by nearly three to one. Furthermore, support is most
likely to be strong (‘strongly’ in favour rather than just ‘somewhat’ in support).
All demographic segments, including single occupant drivers, tend to support the
current lane reallocation.
Supporters recognize the current configuration as “a good idea”, “the way of the
future”, increasing safety for cyclists and pedestrians, encouraging alternative modes
of travel and good for the environment.
Other possible future options to make Burrard Bridge more pedestrian and cycling
friendly but requiring funds of $30 to 60 million or more are rejected at this time.
Two months into the trial, about 14% of the population overall has been encouraged
to walk or cycle across the Burrard Bridge more often, reaching 26% among those
residing on the Near Westside.
The Burrard Bridge Lane Reallocation Trial, in addition to the cycling infrastructure
improvements made in the past year, are having a positive effect on getting people to
cycle more often and to be interested in beginning to cycle more in the future.

Burrard Bridge Lane Reallocation — Residents Surveys
Mustel Group Market Research Page 6
Foreword Research Objectives
In concert with the Greenest City Initiative, the City of Vancouver is conducting a lane
reallocation trial on the Burrard Bridge in the summer and fall of 2009. The purpose of the trial
is to offer greater opportunities for bridge use among current and potential cyclists and
pedestrians by providing a safer alternative. Beginning July 13, reallocation measures include
conversion of one southbound traffic lane to bicycles only, exclusive use of the east sidewalk
for northbound cycle traffic and exclusive use of the west sidewalk for pedestrian traffic in
both directions.
Mustel Group was commissioned to conduct polling among residents prior to and during this
trial and the accompanying information campaign. Focus groups were also conducted prior to
the trial to assist in planning and refining communications (reported separately).
The quantitative research has been designed to:
i) Track public awareness of the trial and related communications,
ii) Assess attitudes toward the trial and post-trial retention of the lane reallocation,
iii) Determine the degree to which the trial has an impact on use of the Burrard Bridge,
iv) Gain greater understanding of Downtown travel habits and the use of the bridges over
False Creek.
Methodology
Random telephone interviews were conducted among residents of the City of Vancouver 18
years of age and over. For each of the pre-trial and mid-trial phases of research, approximately
300 interviews were completed city-wide with an emphasis on target neighbourhoods most
affected by the changes to the bridge—i.e., all of the Downtown and the near Westside (west
of Granville Street and north of 33rd Avenue). Approximately 80% of the interviews were with
residents of these target neighbourhoods and 20% with residents from the rest of the City.
Industry-standard random selection techniques were used to draw a random sample of
households and individuals within the households from an up-to-date database of telephone
listings. Up to five call attempts are made to each selected household/individual in order to
minimize potential bias due to non-response.

Burrard Bridge Lane Reallocation — Residents Surveys
Mustel Group Market Research Page 7
The survey sample is weighted to match the latest Canada Census data on the basis of age
within gender and area of the City. As well, the pre-trial and mid-trial waves of research were
matched by area on proportion of licensed drivers. The following table outlines the
distribution of actual and weighted interviews.
Pre-trial Mid-trial
Actual (304)
%
Weighted (304)
%
Actual (310)
%
Weighted (310)
%
Gender
Male 48 48 48 48
Female 52 52 52 52
Age
18 – 34 23 33 24 33
35 – 54 41 38 39 39
55 or over 36 28 37 28
Refused <1 1 <1 <1
Area of Residence
Downtown Peninsula 40 16 39 16
Near Westside 40 16 39 16
Other Areas of City 20 68 22 68
Licensed Driver
Yes 88 88 87 88
No 12 12 13 12
Field dates for the pre-wave were June 18-29, 2009—just preceding launch of the
communications campaign and prior to the July 13th implementation of the trial. The mid-
wave was conducted September 23-28, 2009. A copy of the questionnaire is appended.
Results
The findings are reported in the format of an Executive Overview, followed by Detailed Findings. Base sizes shown represent the actual number interviewed (unweighted).
The following notations have been used in this report:
Significantly higher Directionally higher Significantly lower Directionally lower Significance is tested at the 95% confidence level. Directionally higher/lower is not yet statistically significant at the 95% confidence level.

Burrard Bridge Lane Reallocation — Residents Surveys
Mustel Group Market Research Page 8
Detailed Findings 1. Awareness and Knowledge of Lane Re-allocation Trial
Most residents know that some changes have been made to the Burrard Bridge (73%
in total). Awareness of changes is higher in the target neighbourhoods of the Near
Westside and Downtown peninsula.
Awareness of changes to the bridge has remained about the same, since the pre-trial
measure when a majority already knew of potential changes due to widespread
media coverage.
Awareness of Changes to Burrard Bridge
Total COV
Q.1) As you may know, three bridges link the Downtown peninsula with the City of Vancouver: the Burrard, Granville and Cambie Street Bridges. The Burrard Bridge is the bridge closest to English Bay in Vancouver. PRE-TRIAL; Have you seen or heard anything about potential changes to the Burrard Bridge? MID-TRIAL: Have you seen or heard anything about changes to the Burrard Bridge?
70%
73%
80%
79%
85%
86%
64%
68%
29%
27%
20%
21%
15%
14%
35%
32%
Pre-Trial (n=304)
Mid-Trial (n=310)
Pre-Trial (n=121)
Mid-Trial (n=121)
Pre-Trial (n=122)
Mid-Trial (n=122)
Pre-Trial (n=61)
Mid-Trial (n=67)
Yes No Don't know
Downtown
Near Westside
Other COV

Burrard Bridge Lane Reallocation — Residents Surveys
Mustel Group Market Research Page 9
The primary sources of awareness are television and newspaper items, both noticed
by about half of residents—similar levels at pre- and mid-trial surveys.
Radio is the next most commonly mentioned (34% in total), up slightly since the pre-
wave survey but particularly among residents outside of the target areas.
Other sources mentioned at mid-trial include personally witnessing the changes,
banners on the Burrard Bridge, word of mouth and to a lesser extent, websites.
Sources of Awareness Regarding Bridge Changes (Unaided)
Those who have seen/heard anything about potential changes to
the Burrard Bridge
Total COV Downtown Near Westside Other COV
Pre-Trial (248)
%
Mid-Trial (248)
%
Pre-Trial (99) %
Mid-Trial (97) %
Pre-Trial (107)
%
Mid-Trial (104)
%
Pre-Trial (42) %
Mid-Trial (47) %
Newspaper (net) 50 52 50 40 50 55 49 55
Newspaper article/item 49 52 49 39 49 54 49 55
Newspaper advertisement/notice 2 6 1 6 3 17 2 2
Television 55 53 51 51 44 40 59 57
Radio 22 34▲ 28 22 32 36 17 37▲
Saw in person/live nearby/commute on bridge - 15▲ - 21 - 27 - 10
Word of mouth/from people I know 8 14▲ 10 13 16 14 5 14
Banner on [Burrard] Bridge 4 11▲ - 26 1 17 6 5
Banner in Stanley Park/near Lions Gate Bridge - 1 - 4 - 1 - -
Web (net) 4 5 9 2 10 5 - 6
Other website 3 5 9 2 9 3 - 6
City website <1 2 - - 2 2 - 2
Other - 3 - 1 - 3 - 4
Don’t recall 2 <1 3 - 1 1 2 -
Q.2) Where did you see or hear about these changes?
Significantly higher Directionally higher Significantly lower Directionally lower Significance is tested at the 95% confidence level. Directionally higher/lower indicates a possible trend but not yet statistically significant at the 95% confidence level.

Burrard Bridge Lane Reallocation — Residents Surveys
Mustel Group Market Research Page 10
Most residents aware of changes make some mention of addition or allocation of a
cycling lane in general or with more specifics about the configuration.
Greater mention is made at the mid-trial about traffic congestion and changes for
pedestrians.
Bridge Changes Seen or Heard About (Unaided)
Those who have seen/heard anything about changes to the
Burrard Bridge
Total COV Downtown Near Westside Other COV
Pre-Trial (248)
%
Mid-Trial (248)
%
Pre-Trial (99) %
Mid-Trial (97) %
Pre-Trial (107)
%
Mid-Trial (104)
%
Pre-Trial (42) %
Mid-Trial (47) %
Will add/ Added a bike lane (general) 35 51▲ 44 39 42 38 30 59
One vehicle lane allocated to cyclists 38 29 32 28 36 39 40 26
Increase in traffic congestion/ created bottleneck off bridge 1 16▲ 2 24 1 15 2 14
Re-routes pedestrians/altered sidewalk access/ dedicated pedestrian-only walk 3 12▲ 3 11 - 17 4 12
A trial period/Bike lane trial/ starting July 10 10 7 6 14 10 9 11
One lane and one sidewalk for cyclists 2 10▲ - 8 1 11 3 10
Expanded access for cyclists & pedestrians - 6▲ - 8 - 4 - 5
Trial seems to be going well - 5▲ - 12 - 3 - 4
Barriers separating bike lane from vehicles 1 4▲ 1 5 5 5 - 4
Complaints from drivers/ Pre-trial: Some unhappy with plan/think unnecessary 5 4 6 7 1 9 6 2
It’s a good idea/ Good for cyclists - 3 - 7 - 4 - 2
Concern about loss of business - 2 - 2 - 4 - 2
Traffic rerouted to Granville and Cambie/ Pre-trial: Will reduce vehicle traffic on bridge/rerouting traffic
1 2 2 6 5 4 - -
One southbound lane allocated to cyclists. Bikes northbound have exclusive use of east sidewalk, pedestrians west sidewalk
5 - 8 - 13 - 2 -
Two lanes (north & southbound) will be allocated for cyclists 5 - 7 - 9 - 3 -
Expanding capacity/widening sidewalks 3 - 3 - 3 - 2 -
Tried a few years ago/failed after a week 1 - 2 - 1 - 2 -
Miscellaneous 5 5 5 6 4 6 5 4
Nothing specific/ don’t know 9 - 3 - - - 14 -
Q.3) What have you seen or heard about the Burrard Bridge changes?
Burrard Bridge Lane Reallocation — Residents Surveys
Mustel Group Market Research Page 11
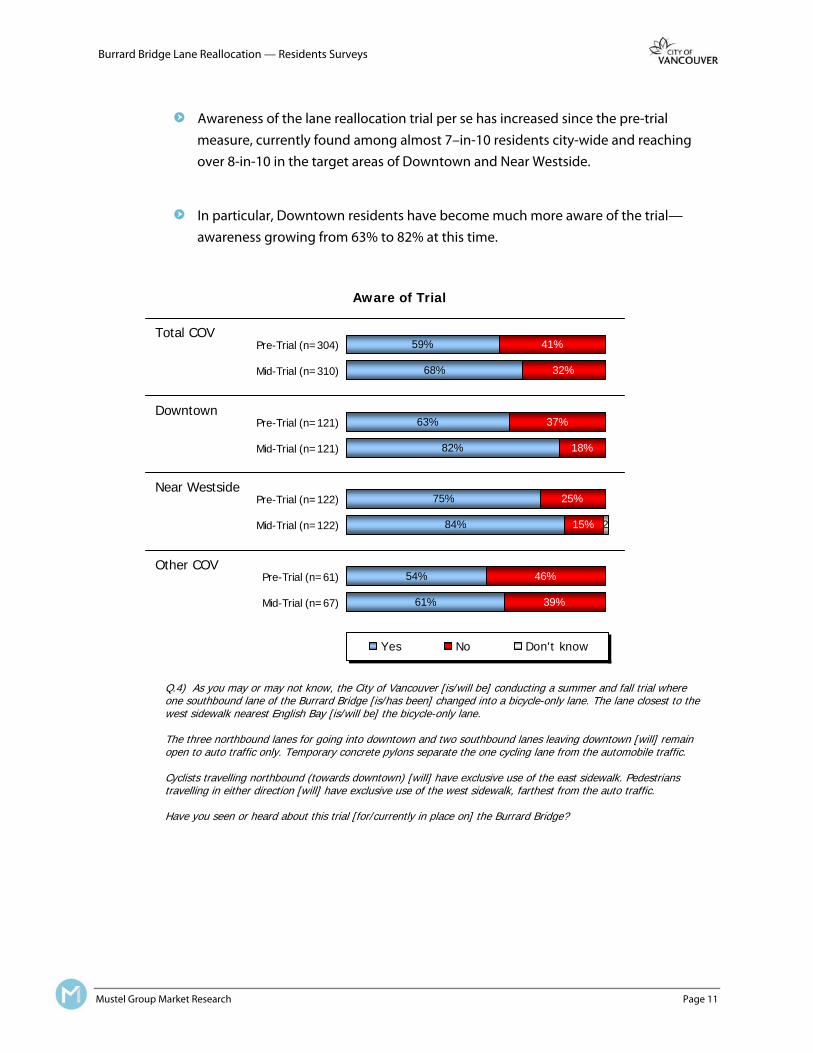
Awareness of the lane reallocation trial per se has increased since the pre-trial
measure, currently found among almost 7–in-10 residents city-wide and reaching
over 8-in-10 in the target areas of Downtown and Near Westside.
In particular, Downtown residents have become much more aware of the trial—
awareness growing from 63% to 82% at this time.
59%
68%
63%
82%
75%
84%
54%
61%
41%
32%
37%
18%
25%
15%
46%
39%
2
Pre-Trial (n=304)
Mid-Trial (n=310)
Pre-Trial (n=121)
Mid-Trial (n=121)
Pre-Trial (n=122)
Mid-Trial (n=122)
Pre-Trial (n=61)
Mid-Trial (n=67)
Yes No Don't know
Aware of Trial
Total COV
Q.4) As you may or may not know, the City of Vancouver [is/will be] conducting a summer and fall trial where one southbound lane of the Burrard Bridge [is/has been] changed into a bicycle-only lane. The lane closest to the west sidewalk nearest English Bay [is/will be] the bicycle-only lane. The three northbound lanes for going into downtown and two southbound lanes leaving downtown [will] remain open to auto traffic only. Temporary concrete pylons separate the one cycling lane from the automobile traffic. Cyclists travelling northbound (towards downtown) [will] have exclusive use of the east sidewalk. Pedestrians travelling in either direction [will] have exclusive use of the west sidewalk, farthest from the auto traffic. Have you seen or heard about this trial [for/currently in place on] the Burrard Bridge?
Downtown
Near Westside
Other COV

Burrard Bridge Lane Reallocation — Residents Surveys
Mustel Group Market Research Page 12
The public perceives the main reasons for doing the trial to be environment-related,
such as reducing traffic congestion, encouraging mode shift/being more bike and
pedestrian friendly, improved air quality (net first mention 40%, net total mentions
63%—see next page).
Safety and appeasing cyclists are secondary reasons given, and to a lesser extent to
gauge public interest (respectively, 23%, 19% and 12% total mentions—see next page).
Results are generally similar to that found in the pre-trial survey.
Reasons Believe City is Doing the Trial – First Mention (Unaided)
Total COV Downtown Near Westside Other COV
Pre-Trial (304)
%
Mid-Trial (310)
%
Pre-Trial (121)
%
Mid-Trial (121)
%
Pre-Trial (122)
%
Mid-Trial (122)
%
Pre-Trial (61) %
Mid-Trial (67) %
Environment (Net) 43 40 41 46 47 49 42 37
Reduce vehicle usage/traffic congestion 10 14 13 16 8 15 10 14
Encourage more people to cycle/walk 13 12 13 17 20 16 12 10
Improve air quality/good for the environment 12 6 3 3 5 6 15 7
Make city more bike-/pedestrian-friendly 2 6▲ 3 8 3 9 2 5
Promote Vancouver as a green city/ environmentally aware 6 2 9 2 12 3 4 1
To appease cyclists/ pressure from the bicycle rider lobby/Critical Mass protest 17 15 16 11 12 14 19 16
Safety (Net) 10 11 17 13 14 17 7 9
Increase cyclists’ safety crossing bridge 6 8 14 9 11 15 2 6
Reduce the risk of accidents between pedestrian and cyclist on the sidewalks 5 3 3 4 3 3 5 2
To get feedback/gauge public interest 1 7▲ 3 6 3 11 - 6
To win votes/part of election campaign 1 4 2 5 1 1 - 4
Negative comment re: Mayor/ Councillors 4 1 1 1 2 1 6 1
Mayor is cyclist/pro-bike people on council 2 1 - 2 1 - 2 1
Encourages a healthy lifestyle - 1 - - - 1 - 2
Least expensive option/ Costs too much to alter Burrard Bridge/ build a new bridge - 1 - 5 - 2 - -
Olympics/ making a good impression 1 <1 1 2 1 - 2 -
Trying to better utilize Burrard Bridge/ move traffic flow to Granville Bridge 6 <1 8 1 9 - 5 -
Miscellaneous 1 <1 3 1 3 - - -
Don’t know 14 19 8 7 5 5 18 25
Q.5) Why do you think the City is doing this trial?

Burrard Bridge Lane Reallocation — Residents Surveys
Mustel Group Market Research Page 13
Reasons Believe City is Doing the Trial – Total Mentions (Unaided)
Total COV Downtown Near Westside Other COV
Pre-Trial (304)
%
Mid-Trial (310)
%
Pre-Trial (121)
%
Mid-Trial (121)
%
Pre-Trial (122)
%
Mid-Trial (122)
%
Pre-Trial (61) %
Mid-Trial (67) %
Environment (Net) 57 63 64 68 69 74 53 59
Reduce vehicle usage/traffic congestion 32 31 39 38 39 38 28 28
Encourage more people to cycle/walk 27 31 33 34 39 44 23 28
Improve air quality/good for the environment 23 22 13 15 20 19 27 25
Make the city more bike pedestrian friendly 7 11 3 12 7 16 7 9
Promote Vancouver as a green city/environmentally aware 11 10 16 15 22 11 7 9
Safety (Net) 25 23 38 29 33 37 20 19
Increase safety of cyclists crossing bridge 19 20 31 25 26 37 15 15
Reduce the risk of accidents between pedestrian and cyclist on the sidewalks
8 8 9 10 13 15 6 7
To appease cyclists/pressure from the bicycle rider lobby/Critical Mass protest 19 19 20 20 18 18 19 19
To get feedback/gauge public interest 5 12▲ 7 10 8 14 5 12
Encourages a healthy lifestyle 4 6 5 5 5 1 3 7
Trying to win votes/party of election campaign 3 5 5 7 4 3 3 5
Least expensive option/ Costs too much to alter Burrard Bridge/ build a new bridge
- 3 - 10 - 7 - -
The Mayor is a cyclist/pro-bike people on council 4 2 3 3 4 1 5 1
Olympics/making a good impression 2 2 2 4 3 4 2 2
Trying to better utilize the Burrard Bridge/move traffic flow to Granville Bridge
13 1 15 2 18 1 11 1
Negative comments about Mayor/Councillors 5 1 2 2 4 1 6 1
Waste of resources/ There are more pressing concerns (e.g. infrastructure, housing)
- <1 - 3 - - - -
Miscellaneous 8 1 10 5 9 2 7 -
Don’t know 14 19 8 7 5 5 18 25
Q.5) Why do you think the City is doing this trial?

Burrard Bridge Lane Reallocation — Residents Surveys
Mustel Group Market Research Page 14
2. Pre-implementation Support for Trial
Pre-implementation, support for conducting the trial outweighed opposition by
significant margins in all areas studied. In the target neighbourhoods at least half of
residents supported the trial (50-52% in favour vs. 26-30% against). Similarly in other
areas of the City, support prevailed, though almost 4-in-10 residents were neutral.
Support came from across all demographic groups, including single occupant vehicle
drivers using the Burrard Bridge (42% in favour vs. 31% against).
Reasons for supporting the trial are primarily environment-related (encourages use of
alternative transportation/to be more cycle and pedestrian-friendly, being good for
environment/reduces carbon emissions). Other reasons include safety, a good
idea/worth a try, to reduce traffic congestion, to provide real data on feasibility.
Among those opposed to the trial, the most common concern is about an increase in
traffic congestion. Other objections include: negative comments about cyclists, cycle
lane unnecessary (enough room to share with pedestrians), bad idea/not properly
thought-out/should consider alternative solutions, unsafe.
Those who are neutral largely say that they are unaffected by the change.
Total Against
20%
26%
30%
17%
29%
31%
33%
28%
17%
20%
17%
17%
32%
20%
19%
38%
8%
12%
15%
18%
18%
14%
5
3
3
Total COV (n=304)
Downtown (n=121)
Near Westside (n=122)
Other COV (n=61)
Strongly in favour Somewhat in favourNeutral Somewhat againstStrongly against Don't know
Opinion on Conducting the Trial
Pre-Trial: Q.6) In general, are you in favour, neutral or against this trial? Is that: strongly or somewhat [in favour/against]? Rounding may cause some %s not to add to 100% or to subtotals.
Total in Favour
46%
52%
50%
44%
Pre-Trial

Burrard Bridge Lane Reallocation — Residents Surveys
Mustel Group Market Research Page 15
This chart shows the reasons by area of residence.
Reasons Support for/Opposition to Trial (Unaided)
Pre-Trial
Total COV
(304) %
Downtown
(121) %
Near Westside
(122) %
Other COV
(61) %
NEUTRAL
Doesn’t affect me (i.e. don’t cycle, don’t use Bridge) 22 14 11 26
It will provide real data/determine whether or not this is a feasible idea 10 11 11 10
Need more information 2 1 2 3
POSITIVES
Will encourage use of alternative transportation/get people out of their cars 17 18 27 15
Good for environment/will reduce carbon emissions 16 12 15 17
It’s a good idea/worth trying 15 18 14 14
Need to make cycling safer 11 17 17 7
Will reduce traffic congestion 8 7 10 8
I’m a cyclist 5 10 6 3
Vancouver needs to be more bike/pedestrian friendly /like European cities 4 7 9 1
It promotes a healthy lifestyle 1 5 4 -
NEGATIVES
Will increase traffic congestion/ Burrard Bridge is already congested 16 30 22 11
It’s a bad idea/has not been properly thought out 9 10 14 7
Dislike cyclists/negative comments regarding cyclists 8 5 7 8
It’s not necessary/cyclists and pedestrians have enough room on the sidewalks 5 5 7 4
Increases the potential for accidents (i.e. pedestrians crossing on Kits side, more bikes crossing into traffic) 4 3 2 4
Should consider alternate solutions (extending bridge deck, bike/pedestrian lanes underneath bridge deck) 3 6 8 1
Will disrupt traffic flow/access/egress 2 4 8 -
Will increase pollution due to traffic congestion 2 3 2 2
It’s a waste of money 2 2 2 2
Didn’t work last time they tried it 1 2 6 -
Miscellaneous 2 4 4 1
Don’t know 4 4 2 5
Pre-Trial: Q.7) Why do you say that?
Burrard Bridge Lane Reallocation — Residents Surveys
Mustel Group Market Research Page 16
3. Opinion on Retention of Cycle Lane and Other Options
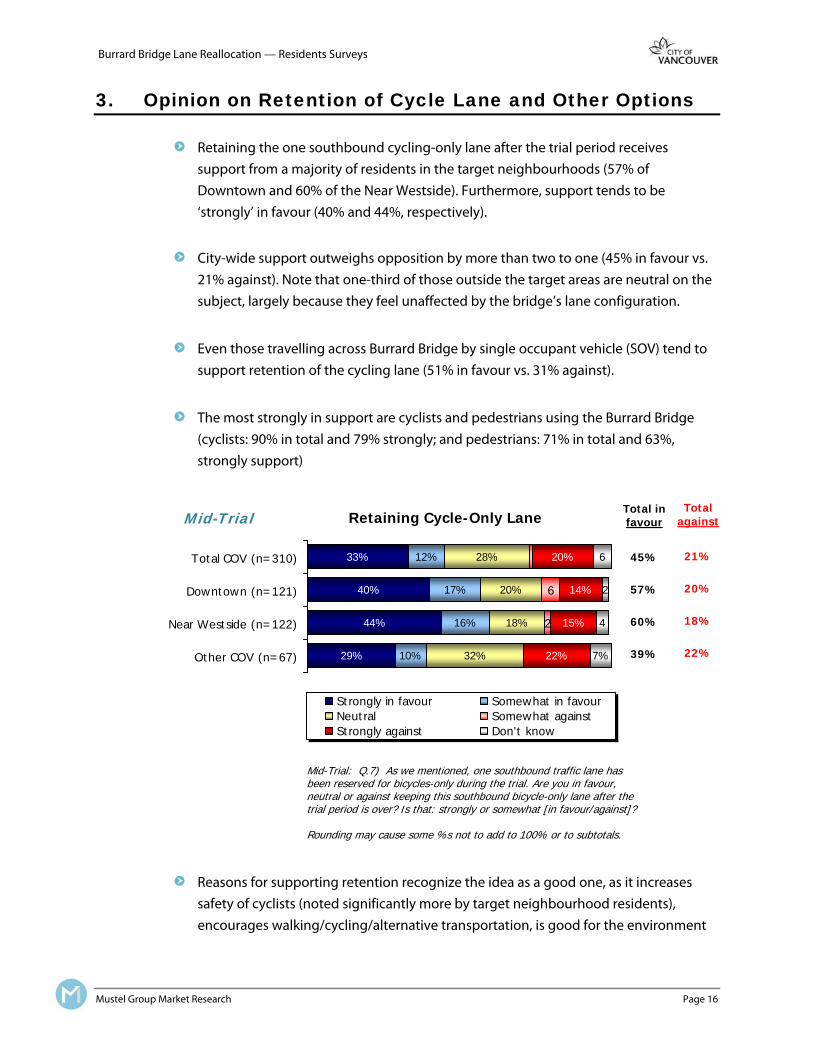
Retaining the one southbound cycling-only lane after the trial period receives
support from a majority of residents in the target neighbourhoods (57% of
Downtown and 60% of the Near Westside). Furthermore, support tends to be
‘strongly’ in favour (40% and 44%, respectively).
City-wide support outweighs opposition by more than two to one (45% in favour vs.
21% against). Note that one-third of those outside the target areas are neutral on the
subject, largely because they feel unaffected by the bridge’s lane configuration.
Even those travelling across Burrard Bridge by single occupant vehicle (SOV) tend to
support retention of the cycling lane (51% in favour vs. 31% against).
The most strongly in support are cyclists and pedestrians using the Burrard Bridge
(cyclists: 90% in total and 79% strongly; and pedestrians: 71% in total and 63%,
strongly support)
Reasons for supporting retention recognize the idea as a good one, as it increases
safety of cyclists (noted significantly more by target neighbourhood residents),
encourages walking/cycling/alternative transportation, is good for the environment
33%
40%
44%
29%
12%
17%
16%
10%
28%
20%
18%
32%
20%
14%
15%
22% 7%
2
6
4
2
6Total COV (n=310)
Downtown (n=121)
Near Westside (n=122)
Other COV (n=67)
Strongly in favour Somewhat in favourNeutral Somewhat againstStrongly against Don't know
Mid-Trial: Q.7) As we mentioned, one southbound traffic lane has been reserved for bicycles-only during the trial. Are you in favour, neutral or against keeping this southbound bicycle-only lane after the trial period is over? Is that: strongly or somewhat [in favour/against]? Rounding may cause some %s not to add to 100% or to subtotals.
Total in favour
45%
57%
60%
39%
Mid-Trial Retaining Cycle-Only LaneTotal
against
21%
20%
18%
22%

Burrard Bridge Lane Reallocation — Residents Surveys
Mustel Group Market Research Page 17
(reducing carbon emissions/traffic congestion) and acknowledges a need to be more
cycle/pedestrian friendly.
The primary objection is increased traffic congestion and disruption of traffic flow
(12% and 3%, respectively). Some say there are not enough cyclists to justify it (11%).
Reasons for Opinion on Retaining Cycle-Only Lane (Unaided)
Mid-Trial
Total COV
(310) %
Downtown
(121) %
Near Westside
(122) %
Other COV
(67) %
NEUTRAL 35 23 28 40
Doesn’t affect me (don’t cycle, don’t use Burrard Bridge) 23 15 14 27▲
Waiting to see the trial results 8 3 7 9
Should consider alternate solutions (e.g. extending bridge deck, bike/pedestrian lanes under bridge deck) 5 5 8 4
POSITIVE 44 55 57 38
It’s a good idea/ Way of the future 16 17 8 18
Increases safety of cyclists/ pedestrians crossing bridge 13 24▲ 24▲ 8
Encourages more people to cycle/ walk 12 15 17 9
Good for the environment/ will reduce carbon emissions 10 10 13 9
Will reduce traffic congestion 8 6 8 8
Vancouver needs to be more bike/ pedestrian friendly/ more like European cities 7 13 10 5
Will encourage use of alternative transportation/ get people out of their cars 7 12 9 5
I’m a cyclist 7 6 13 5
Seems to be working/ not noticed any traffic problems 4 5 4 3
It promotes a healthy lifestyle 2 - 4 3
NEGATIVE 22 25 21 21
Has increased traffic congestion on bridge 12 10 10 13
It’s not necessary/ not enough cyclists use the lane 11 8 11 12
Dislike cyclists/ negative comments regarding cyclists 4 3 - 5
Has disrupted traffic flow access/ egress (i.e. Pacific – Burrard, 2nd Ave – Burrard) 3 7 4 2
Increases the potential for accidents (e.g. pedestrians crossing on the Kits side of the bridge, more bikes on the road crossing into traffic)
2 4 1 1
Will increase pollution due to traffic congestion 1 1 1 1
It’s a waste of money 1 1 1 1
Miscellaneous 1 - 2 1
No reason in particular 5 4 4 6
Mid-Trial: Q.8) Why do you say that?
Burrard Bridge Lane Reallocation — Residents Surveys
Mustel Group Market Research Page 18
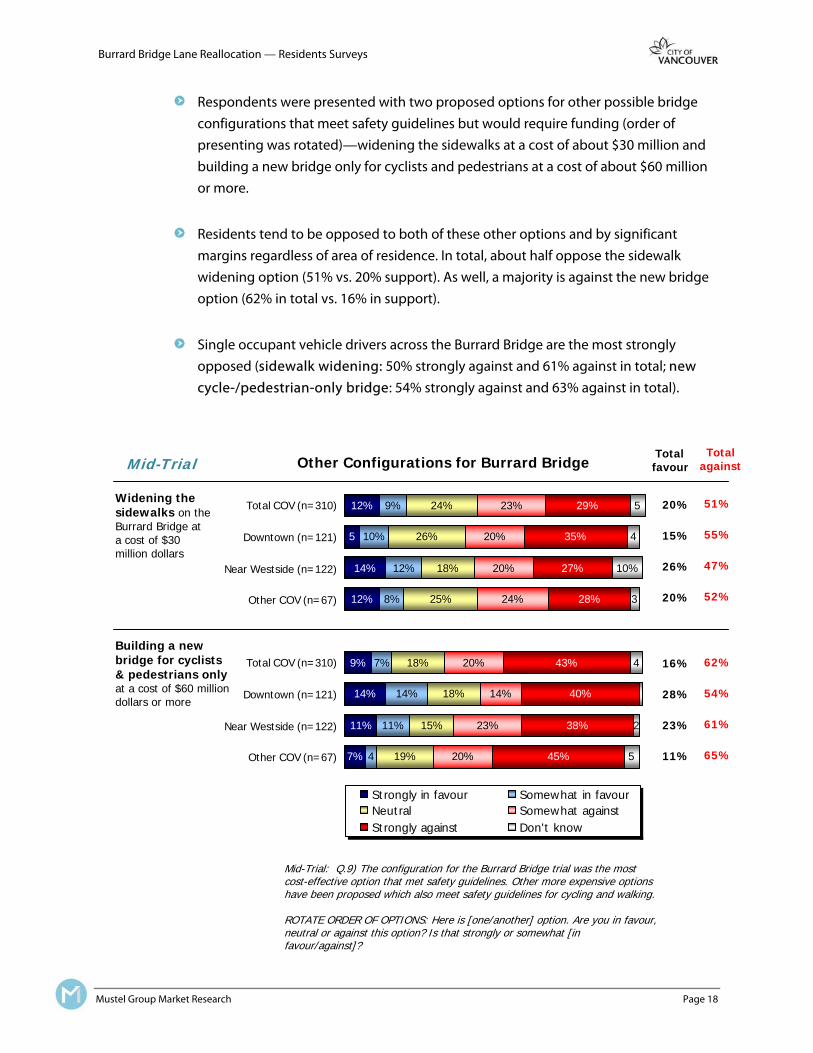
Respondents were presented with two proposed options for other possible bridge
configurations that meet safety guidelines but would require funding (order of
presenting was rotated)—widening the sidewalks at a cost of about $30 million and
building a new bridge only for cyclists and pedestrians at a cost of about $60 million
or more.
Residents tend to be opposed to both of these other options and by significant
margins regardless of area of residence. In total, about half oppose the sidewalk
widening option (51% vs. 20% support). As well, a majority is against the new bridge
option (62% in total vs. 16% in support).
Single occupant vehicle drivers across the Burrard Bridge are the most strongly
opposed (sidewalk widening: 50% strongly against and 61% against in total; new
cycle-/pedestrian-only bridge: 54% strongly against and 63% against in total).
Total against
51%
55%
47%
52%
62%
54%
61%
65%
Mid-Trial: Q.9) The configuration for the Burrard Bridge trial was the most cost-effective option that met safety guidelines. Other more expensive options have been proposed which also meet safety guidelines for cycling and walking. ROTATE ORDER OF OPTIONS: Here is [one/another] option. Are you in favour, neutral or against this option? Is that strongly or somewhat [in favour/against]?
12%
14%
12%
9%
14%
11%
7%
9%
10%
12%
8%
7%
14%
11%
24%
26%
18%
25%
18%
18%
15%
19%
23%
20%
20%
24%
20%
14%
23%
20%
29%
35%
27%
28%
43%
40%
38%
45%
10%
5
4 5
2
4
3
4
5Total COV (n=310)
Downtown (n=121)
Near Westside (n=122)
Other COV (n=67)
Total COV (n=310)
Downtown (n=121)
Near Westside (n=122)
Other COV (n=67)
Strongly in favour Somewhat in favourNeutral Somewhat againstStrongly against Don't know
Other Configurations for Burrard Bridge Total favour
20%
15%
26%
20%
16%
28%
23%
11%
Mid-Trial
Widening the sidewalks on the Burrard Bridge at a cost of $30 million dollars
Building a new bridge for cyclists & pedestrians only at a cost of $60 million dollars or more

Burrard Bridge Lane Reallocation — Residents Surveys
Mustel Group Market Research Page 19
4. Influence of the Trial on Personal Behaviour
At the pre-trial stage almost one-quarter of residents city-wide expressed that the
changes would encourage them to walk or cycle across Burrard Bridge more.
When residents in the mid-trial survey are asked if the changes did in fact encourage
them to walk or cycle across the bridge more often or not, we find that somewhat
fewer actually did so (14% in total) — except those in the Near Westside who
marginally exceeded the pre-trial prediction (26% at mid-trial).
Nevertheless, to date, the trial has had an overall positive impact in this respect.
23%
14%
28%
13%
21%
26%
23%
11%
72%
80%
69%
82%
76%
72%
72%
81%
3
4
3
3
3
3
3
4
5
3
2Pre-Trial (n=304)
Mid-Trial (n=310)
Pre-Trial (n=121)
Mid-Trial (n=121)
Pre-Trial (n=122)
Mid-Trial (n=122)
Pre-Trial (n=61)
Mid-Trial (n=67)
More often Makes no difference
Less often Don't know
Encouragement to Walk/Cycle across Bridge
Total COV
Pre-Trial: Q.8) Will this change encourage you to walk or cycle across the Burrard Bridge? Mid-Trial: Q.6) Thus far, have the changes encouraged you to walk or cycle across the Burrard Bridge?
Downtown
Near Westside
Other COV

Burrard Bridge Lane Reallocation — Residents Surveys
Mustel Group Market Research Page 20
Burrard Bridge usage (past month, past 7 days) is fairly consistent with the pre-trial
measure for Near Westside and other City residents, but is down somewhat among
those from the Downtown peninsula; this may be reflective of a seasonal shift.
Since the pre-trial measure, use of the Granville Bridge is down among target area
residents in the past month and among Downtown residents in the past seven days.
Use of Cambie Bridge appears to be more consistent. Note that these findings are
based on respondents’ best recollection of the past month and past seven days.
Bridges Used in the Past Month (Any Mode)
Total COV Downtown Near Westside Other COV
Pre-Trial (304)
%
Mid-Trial (310)
%
Pre-Trial (121)
%
Mid-Trial (121)
%
Pre-Trial (122)
%
Mid-Trial (122)
%
Pre-Trial (61) %
Mid-Trial (67) %
Granville Bridge 71 66 92 79 83 69 63 63
Burrard Bridge 62 59 89 79 88 82 49 49
Cambie Bridge 58 56 77 72 50 45 56 54
Q.10a) Next, a few questions about your current transportation to and from the Downtown area. Which, if any, of the following bridges have you used in the past month?
Bridges Used in the Past 7 Days (Any Mode)
Total COV Downtown Near Westside Other COV
Pre-Trial (304)
%
Mid-Trial (310)
%
Pre-Trial (121)
%
Mid-Trial (121)
%
Pre-Trial (122)
%
Mid-Trial (122)
%
Pre-Trial (61) %
Mid-Trial (67) %
Granville Bridge 41 34 68 50 53 45 31 28
Burrard Bridge 37 29 70 49 66 56 22 18
Cambie Bridge 31 34 53 46 24 23 27 34
Q.10b) Next, a few questions about your current transportation to and from the Downtown area. Which, if any, of the following bridges have you used in the past 7 days?

Burrard Bridge Lane Reallocation — Residents Surveys
Mustel Group Market Research Page 21
Among users of the Burrard Bridge, findings on mode of transportation for crossing
the bridge during the past month indicate some significant changes since the pre-trial
measure, as follows:
• Increase reported in cycling, particularly among Near Westside but also
Downtown residents—both doubling among bridge users.
• Increase reported in walking by across the bridge by Downtown residents, but
a decline among those from the Near Westside.
• On the other hand, Near Westside residents register the highest increase for
cycling—plus 19 percentage points. Although a decline in walking across the
bridge is noted among these residents, some may have shifted to cycling.
• Finally, single occupant vehicle use is down since the pre-trial measure, but
carpooling has increased, particularly among those outside the target
neighbourhoods.
Mode of Transportation
Those who crossed the Burrard Bridge in past month
Total COV Downtown Near Westside Other COV**
Pre-Trial (240)
%
Mid-Trial (229)
%
Pre-Trial (107)
%
Mid-Trial (97) %
Pre-Trial (108)
%
Mid-Trial (99) %
Pre-Trial (25) %
Mid-Trial (33) %
Automobile (Net) 88 85 76 76 91 85 92 88
Driver without passengers 63 52▼ 51 45 60 55 68 54
Driver with passengers (as a driver or passenger) 57 71▲ 55 64 80 74 48 73▲
Transit 24 29 34 35 39 44 14 21
Walking 16 15 23 37▲ 25 14▼ 8 8
Cycling 9 18▲ 12 23▲ 16 35▲ 5 10
Other ways 1 1 3 - 1 3 - -
Q.11) In the past month, which of the following forms of transportation did you use to cross the Burrard Bridge? ** Caution: small base sizes.

Burrard Bridge Lane Reallocation — Residents Surveys
Mustel Group Market Research Page 22
Among licensed drivers, the perceived change in driving across the three bridges
across False Creek was asked in the mid-trial survey.
• Findings suggest some diversion from the Burrard Bridge to the Granville and
Cambie Bridges.
• About one-quarter of residents (23% in total) say they are driving across the
Burrard Bridge less often since the lane reallocation.
• Meanwhile, about 10% of drivers are taking the Granville Bridge more often
than before the trial and 8% taking the Cambie Bridge more. About 4-6% says
they are using the Granville and Cambie Bridges less, somewhat off-setting the
reported increases.
Base: Those who have a valid driver’s license Mid-Trial: Q.15a/b/c) Since the bicycle lane reallocation, do you think you are now driving across the [Burrard/Granville/Cambie} Bridge:
10%
11%
8%
11%
8%
10%
8%
74%
77%
72%
73%
80%
85%
85%
78%
82%
83%
93%
79%
23%
20%
27%
23%
7%
7%
7%
3 4
4
6
4
2
4
6
3
4
2
5
4
2
3Total COV (n=271)
Downtown (n=104)
Near Westside (n=108)
Other COV (n=59)
Total COV (n=271)
Downtown (n=104)
Near Westside (n=108)
Other COV (n=59)
Total COV (n=271)
Downtown (n=104)
Near Westside (n=108)
Other COV (n=59)
More often About the same
Less often Don't know
Perceived Change in Driving Across Bridges since the Bicycle Lane Reallocation Mid-Trial
Burrard Bridge
Granville Bridge
Cambie Bridge

Burrard Bridge Lane Reallocation — Residents Surveys
Mustel Group Market Research Page 23
Since opening of the new Canada Line there has been a noticeable shift to using
public transit more often. Over one-in-five city-wide say they are taking public transit
more often now.
Residents of the Downtown and other areas of the City are the main source of this
ridership with about one-quarter of residents of these areas riding transit more often.
Those from the Near Westside are less likely to report a shift (with just 7% saying they
ride transit more often now).
Mid-Trial: Q.15d) Since the Canada Line opening, are you now using public transit:
22%
24%
7%
25%
73%
72%
90%
69%
2
3
4
4
2
3
Total COV (n=310)
Downtown (n=121)
Near Westside (n=122)
Other COV (n=67)
More often About the same
Less often Don't know
Frequency of Using Public Transit Since Opening of the Canada Line
Mid-Trial

Burrard Bridge Lane Reallocation — Residents Surveys
Mustel Group Market Research Page 24
5. Preferred Type of Communication about Bridge Trial
Measured in the pre-trial survey only, newspaper is named as the most commonly
preferred communication channel for receiving more information about the Burrard
Bridge lane reallocation trial. Other media mentioned include television, direct mail
and the City’s website.
Preferred Channel for More Information about Lane Reallocation Trial (Unaided)
Pre-Trial
Total COV
(304) %
Downtown
(121) %
Near Westside
(122) %
Other COV
(61) %
Newspaper 37 25 33 40
Television 16 18 12 17
Direct mail (newsletters, flyers, etc.) 11 10 7 12
City’s website 11 12 10 10
Email 8 13 11 6
Radio 5 6 10 3
Signage on the road <1 3 - -
Not interested in receiving information 18 16 21 18
Don’t know <1 1 1 -
Pre-Trial: Q.9) How would you most like to receive more information about the Burrard Bridge changes? (By what type of communication?)

Burrard Bridge Lane Reallocation — Residents Surveys
Mustel Group Market Research Page 25
6. Infrastructure for Sustainable Travel Alternatives
Ratings of City infrastructure for sustainable modes of travel reveal that pedestrian
infrastructure is the most highly regarded (average score of 7.7 out of 10).
Cycling and mass transit receive similar average ratings overall—6.2 and 6.1 out of 10,
respectively.
Since sidewalks are nearly ubiquitous, but cycling and transit routes more limited, this
is a not surprising outcome. However, the fact that cycling and mass transit are
perceived in a similar light is interesting.
Pre-Trial ONLY: Q.16) Next we’d like your opinion about the infrastructure provided in the City for some different modes of travel. Please picture a scale from 1 through 10, where 1 means very poor and 10 means excellent. The numbers in between represent your feelings in between. How would you rate the City of Vancouver’s infrastructure overall for:
7.7
7.8
7.7
7.6
6.2
6.1
5.9
6.3
6.1
6.4
6.2
6.0
Total COV (n=304)
Downtown (n=121)
Near Westside (n=122)
Other COV (n=61)
Total COV (n=304)
Downtown (n=121)
Near Westside (n=122)
Other COV (n=61)
Total COV (n=304)
Downtown (n=121)
Near Westside (n=122)
Other COV (n=61)
Average Rating of City Infrastructure for Alternative Modes of Travel
9 or 10 [Excellent]
28%
30%
26%
27%
5%
7%
4%
4%
9%
12%
10%
8%
Pre-Trial
Walking
Cycling
Mass transit (i.e. buses, SkyTrain, SeaBus)

Burrard Bridge Lane Reallocation — Residents Surveys
Mustel Group Market Research Page 26
The mid-trial survey measured awareness of cycling infrastructure changes made in
the past year throughout the City, such as an expanded number of bicycling routes
off of the main arterial streets and road and traffic light improvements for
cyclists. A majority of residents city-wide say they have noticed these types of cycling
infrastructure changes.
These improvements have had a positive effect on those who have noticed them. Just
under half say that as a result of these improvements they have either chosen to cycle
more often (20%) or become more interested in cycling in the future (26%).
Effect of Cycling Infrastructure Changes
Mid-Trial
Those who have noticed infrastructure changes
Total COV
(184) %
Downtown
(74) %
Near Westside
(70) %
Other COV
(40) %
Made you choose to cycle more often 20 24 29 17
Made you more interested in cycling in the future 26 23 24 27
Had no impact on your interest of frequency of cycling 54 52 47 56
Mid-Trial: Q.16b) Have these changes:
Mid-Trial: Q.16a) In the past year the City of Vancouver has expanded the number of bicycling routes off of the main arterial streets and made road and traffic light improvements for cyclists. Have you noticed any of these infrastructure changes?
58%
59%
58%
58%
41%
40%
42%
41%
Total COV (n=310)
Downtown (n=121)
Near Westside (n=122)
Other COV (n=67)
Yes No Don't know
Aware of Cycling Infrastructure Changes Made in Past Year
Mid-Trial

Burrard Bridge Lane Reallocation — Residents Surveys
Mustel Group Market Research Page 27
7. Current Transportation Patterns (Mid-trial)
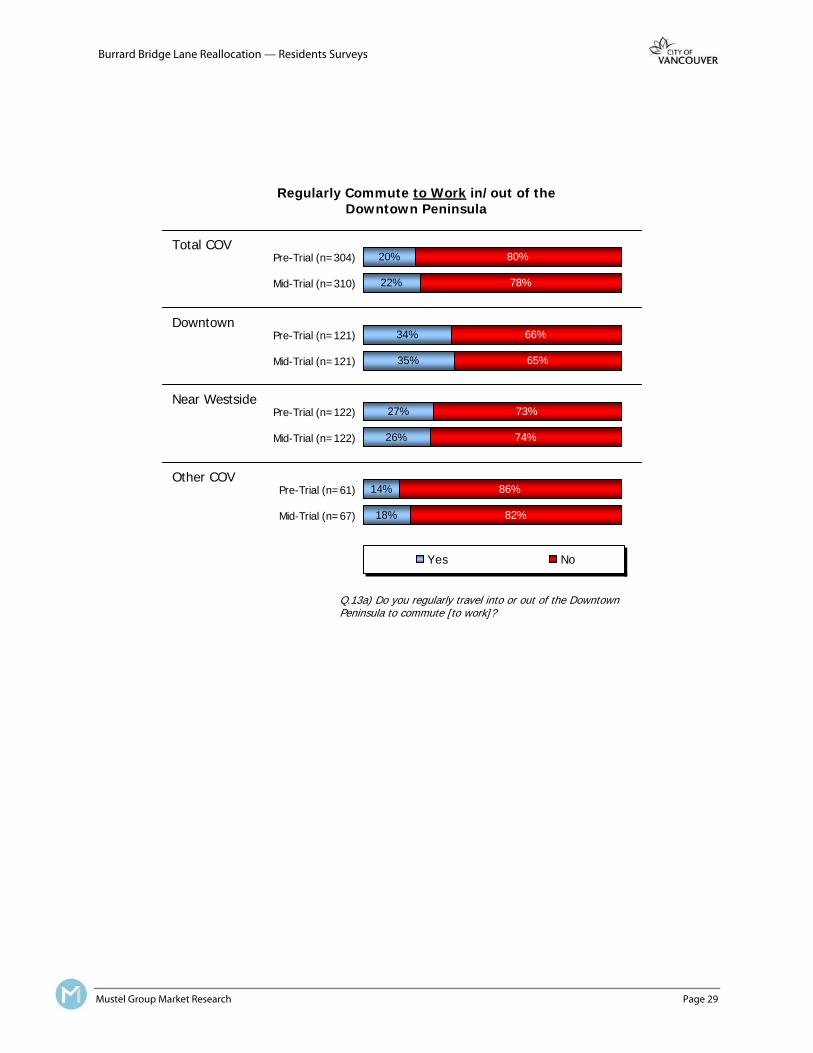
The charts on the pages following illustrate these findings on travel patterns (mid-trial
measure):
• Travel to and from the Downtown Peninsula for any purpose by any mode:
The average is 2.3 days per week city-wide and is highest for Downtown
residents at 3.5 days per week.
• Commuting to Downtown for Work: About 20% of the adult population city-
wide work Downtown, with over one-third among Downtown residents and
about one-quarter of Near Westside residents.
• Commuting to Downtown for School: About 10% of the adult population
commutes to the Downtown peninsula to travel to school.
• Frequency of Cycling: City-wide, about 6-in-10 of residents cycle at least
annually with almost 4-in-10 doing so at least monthly and over one-quarter
cycling at least weekly. Since the pre-trial in late June, more target
neighbourhood residents report riding daily at the time of the mid-trial in late
September.
• Year-round Cycling: Cycling year-round is reported by just over 2-in-10
residents city-wide, with slightly higher levels among Downtown and Near
Westside residents (27% and 32%, respectively at mid-trial)

Burrard Bridge Lane Reallocation — Residents Surveys
Mustel Group Market Research Page 28
3.7
3.5
2.6
2.3
1.6
2.0
2.1
2.3
Pre-Trial (n=304)
Mid-Trial (n=310)
Pre-Trial (n=121)
Mid-Trial (n=121)
Pre-Trial (n=122)
Mid-Trial (n=122)
Pre-Trial (n=61)
Mid-Trial (n=67)
Average # of Days per Week Travel to and from Downtown Peninsula (Any Mode)
Total COV
Q.12) On average, about how many days per week do you travel to or from the Downtown Peninsula by any form of transportation? (IF NEEDED: the Downtown Peninsula includes the West End, Coal Harbour and Yaletown/False Creek North)
Downtown
Westside
Other COV
Burrard Bridge Lane Reallocation — Residents Surveys
Mustel Group Market Research Page 29
20%
22%
34%
35%
27%
26%
14%
18%
80%
78%
66%
65%
73%
74%
86%
82%
Pre-Trial (n=304)
Mid-Trial (n=310)
Pre-Trial (n=121)
Mid-Trial (n=121)
Pre-Trial (n=122)
Mid-Trial (n=122)
Pre-Trial (n=61)
Mid-Trial (n=67)
Yes No
Regularly Commute to Work in/out of the Downtown Peninsula
Total COV
Q.13a) Do you regularly travel into or out of the Downtown Peninsula to commute [to work]?
Downtown
Near Westside
Other COV

Burrard Bridge Lane Reallocation — Residents Surveys
Mustel Group Market Research Page 30
9%
8%
10%
10%
96%
91%
92%
90%
98%
96%
96%
91%
4
4
2
4Pre-Trial (n=304)
Mid-Trial (n=310)
Pre-Trial (n=121)
Mid-Trial (n=121)
Pre-Trial (n=122)
Mid-Trial (n=122)
Pre-Trial (n=61)
Mid-Trial (n=67)
Yes No
Regularly Commute to School in/out of the Downtown Peninsula
Total COV
Q.13b) Do you regularly travel into or out of the Downtown Peninsula to commute [to school when in session]?
Downtown
Near Westside
Other COV

Burrard Bridge Lane Reallocation — Residents Surveys
Mustel Group Market Research Page 31
12%
7%
12%
8%
14%
14%
15%
20%
24%
18%
22%
26%
12%
19%
11%
12%
8%
12%
9%
10%
12%
12%
20%
21%
17%
17%
27%
17%
19%
22%
42%
39%
45%
41%
34%
33%
43%
41%5
5
Pre-Trial (n=304)
Mid-Trial (n=310)
Pre-Trial (n=121)
Mid-Trial (n=121)
Pre-Trial (n=122)
Mid-Trial (n=122)
Pre-Trial (n=61)
Mid-Trial (n=67)
Daily Weekly Monthly
Less often Never Don't know
Frequency of Riding a Bicycle
Total COV
Q.21) About how often, if ever, do you ride a bicycle? Q.22) Do you cycle year-round?
Cycle Year- Round
21%
21%
23%
28%
25%
31%
19%
18%
Downtown
Near Westside
Total COV

Burrard Bridge Lane Reallocation — Residents Surveys
Mustel Group Market Research Page 32
8. Demographics
The Burrard Bridge is used by a cross-section of City residents. Those who walk or cycle
across the bridge is also represented by the spectrum of residents including all age
segments and different household compositions. Persons with difficulty walking, as might
be expected are less represented than in the population overall (1-2% vs. 5-7% overall).
Less use by families in the mid-trial results may be due to September back to school time.
Demographic Profile
Total COV Downtown
Near Westside
Burrard Bridge User
(Any mode)
Walk/Cycle Burrard Bridge
Pre-Trial (304)
%
Mid-Trial (310)
%
Pre-Trial (121)
%
Mid-Trial (121)
%
Pre-Trial (122)
%
Mid-Trial (122)
%
Pre-Trial (240)
%
Mid-Trial (229)
%
Pre-Trial (71) %
Mid-Trial (82) %
Gender
Male 48 48 54 54 46 46 40 53 37 47
Female 52 52 46 46 54 54 60 47 63 53
Age
18 – 34 33 33 42 41 35 33 41 33 31 45
35 – 54 38 39 37 36 38 40 40 38 46 30
55 or over 28 28 22 22 27 27 20 30 23 24
Refused 1 <1 - 1 - - - <1 - 1
Household composition
Single, living alone or with other adults 43 48 59 62 48 47 50 48 47 61
Married or equivalent with no children 23 25 28 27 23 27 20 25 24 27
Family with children at home 32 26 13 12 30 26 30 27 29 11
Refused 2 2 1 - - - <1 - - -
Home tenure
Own 51 59 44 34 63 62 52 59 46 49
Rent 47 35 56 66 37 37 48 37 54 51
Refused 2 6 1 - 1 1 <1 4 - -
Licensed Driver
Yes 88 88 85 85 94 94 90 89 83 90
No 12 12 15 15 6 6 10 11 17 10
Mobility Difficulty (re: walking)
Yes 7 5 5 5 9 7 4 7 2 1
No 93 95 95 95 92 93 96 93 98 99

Burrard Bridge Lane Reallocation — Residents Surveys
Mustel Group Market Research Page 33
Appendix
Questionnaire

Burrard Bridge Lane Reallocation Study Study A822 Final Questionnaire
A822_COV BBridge_QUEST FINAL(Pre & Mid)_23sep09 Page 1
INTRO
Hello, my name is ___ calling on behalf of the City of Vancouver from Mustel Research Group. Today we are conducting a very brief survey for the City to get feedback from residents on topics of public interest. Please be assured we are not selling or soliciting anything and all responses are strictly confidential. IF ASKED: The survey takes about 6‐8 minutes, on average. A. First of all, just to confirm that you fall into our study area, may I please have your
postal code? __ __ __ __ __ __ (CHECK LIST OF VALID FSAs) IF NO, THANK AND END. B. Next, to randomize our sample for this survey, may I please speak to the
male/female in this household who is 18 years of age or older and whose birthday comes next? RECORD GENDER:
MALE FEMALE
C. AS APPROPRIATE (IF ACCENT): Would you prefer to conduct this survey in Cantonese or Mandarin?
Persuaders—only if needed
• This is strictly an opinion survey; we are not selling or soliciting anything. • Your number was selected at random.
• This study will help us better understand the opinions and experiences of residents on topical issues. • All responses are strictly confidential and anonymous; your identity is never revealed to anyone else,
including the client.
• The survey averages about 6‐8 minutes.
• Mustel Group is a member of the Better Business Bureau.
• City of Vancouver Contact name: Colin Fenby, Communications Assistant Director, 604‐871‐6106
Privacy Issues—only if needed • Mustel Group is committed to protecting your privacy and the confidentiality of your personal information.
• Mustel Group is committed to keeping the personal information you share with us confidential.
• The information you provide will only be used for the purposes of this research. Under no circumstances do we sell OR share contact lists or personal information to others, not even the survey sponsor.
• The information you provide will be retained only for the time it is required for the purposes of this research.
• Mustel Group will protect the information you provide with appropriate safeguards and security measures.
• We are fully compliant with the new federal privacy legislation (New act is called PIPEDA: Personal Information Protection and Electronic Documents Act)
• The information you provide will be combined with the responses given by all other survey respondents and reported only in aggregate form. Your answers will remain completely confidential and anonymous.

Burrard Bridge Lane Reallocation Study Study A822 Final Questionnaire
A822_COV BBridge_QUEST FINAL(Pre & Mid)_23sep09 Page 2
MAIN SURVEY
1. As you may know, three bridges link the Downtown peninsula with the City of Vancouver: the Burrard, Granville and Cambie Street Bridges. The Burrard Bridge is the bridge closest to English Bay in Vancouver. Have you seen or heard anything about changes to the Burrard Bridge?
YES NO GO TO Q4 NOT SURE GO TO Q4
2. Where did you see or hear about these changes? DO NOT READ
BANNER IN STANLEY PARK/NEAR LIONS GATE BRIDGE BANNER ON BURRARD BRIDGE NEWSPAPER – PROBE: Was that a news article or an advertisement?
o NEWSPAPER ARTICLE/ ITEM o NEWSPAPER ADVERTISEMENT/NOTICE
RADIO TELEVISION WEB – PROBE: Which website was it?
o CITY WEBSITE o OTHER WEBSITE
WORD OF MOUTH/ FROM PEOPLE I KNOW OTHER (SPECIFY) _____________________________________
3. What have you seen or heard about the Burrard Bridge changes? PROBE FOR SPECIFICS.
4. READ TO EVERYONE: As you may or may not know, the City of Vancouver is
conducting a summer and fall trial where one southbound lane of the Burrard Bridge has been changed into a bicycle‐only lane. The lane closest to the west sidewalk nearest English Bay is the bicycle‐only lane.
The three northbound lanes for going into downtown and two southbound lanes leaving downtown remain open to auto traffic only. Temporary concrete pylons separate the one cycling lane from the automobile traffic.
Cyclists travelling northbound (towards downtown) have exclusive use of the east sidewalk. Pedestrians travelling in either direction have exclusive use of the west sidewalk, farthest from the auto traffic.
Have you seen or heard about this trial currently in place on the Burrard Bridge? YES NO NOT SURE

Burrard Bridge Lane Reallocation Study Study A822 Final Questionnaire
A822_COV BBridge_QUEST FINAL(Pre & Mid)_23sep09 Page 3
5. Why do you think the City is doing this trial? RECORD FIRST MENTION.
FIRST MENTION: ____________________________________________________ Any other reasons the City is doing this trial? RECORD AS OTHER MENTIONS OTHER MENTIONS: __________________________________________________ DON’T KNOW
6. PRE‐TRIAL Will this change encourage you … MID‐TRIAL Thus far, have the changes encouraged you to walk or cycle across the Burrard Bridge: READ
More often, Less often or Made no difference? NOT SURE
7. As we mentioned, one southbound traffic lane has been reserved for bicycles‐only during the trial. Are you in favour, neutral or against keeping this southbound bicycle‐only lane after the trial period is over? IF IN FAVOUR OR AGAINST, ASK: Is that: strongly or somewhat [in favour/against]?
Strongly in favour Somewhat in favour Neutral Somewhat against Strongly against (DO NOT READ) DON’T KNOW/UNDECIDED
8. ASK EVERYONE: Why do you say that? PROBE FOR SPECIFICS.
PRE‐TRIAL ONLY Q9 How would you most like to receive more information about the Burrard Bridge changes (by what type of communication)?]
9. MID‐TRIAL ONLY The configuration for the Burrard Bridge trial was the most cost‐effective option that met safety guidelines. Other more expensive options have been proposed which also meet safety guidelines for cycling and walking.
Here is [one/another] option. ROTATE ORDER OF READING 9a/9b. Are you in favour, neutral or against this option? PROBE: Is that strongly or somewhat [in favour/against]?
a) Widening the sidewalks on the Burrard Bridge at a cost of $30 million dollars?
b) Building a new bridge for cyclists and pedestrians only at a cost of $60 million dollars or more?

Burrard Bridge Lane Reallocation Study Study A822 Final Questionnaire
A822_COV BBridge_QUEST FINAL(Pre & Mid)_23sep09 Page 4
10. Next, a few questions about your current transportation to and from the Downtown area.
a) Which, if any, of the following bridges have you used in the past month? READ. b) FOR EACH YES, ASK: in the past 7 days?
a) Past month? b) Past 7 days? Burrard Bridge 1 1 Granville Bridge 2 2 Cambie Bridge 3 3 NONE OF THESE 4 4
IF USED BURRARD BRIDGE IN PAST MONTH, CONTINUE. OTHERWISE, SKIP TO Q12.
11. In the past month, which of the following forms of transportation did you use to cross the Burrard Bridge? Please tell me ‘yes’ or ‘no’ for each: READ LIST (MULTIPLE OK)
YES Automobile driver without passengers 1 Automobile with passengers (as driver or passenger) 2
Transit 3 Cycling 4 Walking 5 Other (specify) _______
12. On average, about how many days per week do you travel to or from the Downtown Peninsula by any form of transportation? (IF NEEDED: the Downtown Peninsula includes the West End, Coal Harbour and Yaletown/False Creek North) # DAYS PER WEEK: ___ (VALID CODES = 0 TO MAX 7)
13. Do you regularly travel into or out of the Downtown Peninsula to commute: READ
To work? 1 YES 2 NO To school when in session? 1 YES 2 NO
14. EVERYONE: Do you have a valid driver’s license?
1 YES 2 NO GO TO Q15d
15. MID‐WAVE ONLY IF LICENSED DRIVER, ASK Q15‐a/b/c: Since the bicycle lane reallocation, do you think you are now driving across the [INSERT a/b/c]: READ SCALE ASK EVERYONE: Q15‐d: Since the Canada Line opening, are you now using public transit : READ SCALE
a) Burrard b) Granville c) Cambie d) Public Bridge Bridge Bridge Transit
More often, 1 1 1 1 Less often or 2 2 2 2 About the same as before 3 3 3 3

Burrard Bridge Lane Reallocation Study Study A822 Final Questionnaire
A822_COV BBridge_QUEST FINAL(Pre & Mid)_23sep09 Page 5
16. PRE‐TRIAL ONLY Next we’d like your opinion about the infrastructure provided in the City for some different modes of travel. Please picture a scale from 1 through 10, where 1 means very poor and 10 means excellent. The numbers in between represent your feelings in between. How would you rate the City of Vancouver’s infrastructure overall for:
a) Walking? __ b) Cycling? __ c) Mass transit (e.g., buses, SkyTrain, SeaBus)? __
16a) MID‐WAVE ONLY In the past year the City of Vancouver has expanded the number of bicycling routes off of the main arterial streets and made road and traffic light improvements for cyclists. Have you noticed any of these infrastructure changes? YES NO
16b) MID‐WAVE ONLY IF YES: Have these changes: READ IN ORDER
Made you choose to cycle more often, Made you more interested in cycling in the future or Had no impact on your interest or frequency of cycling?
DEMOGRAPHICS
Finally, some demographic questions to make sure we’ve included all types of residents.
b) Into which of the following age groups do you fall? 18‐24 years 25‐34 35‐44 45‐54 55‐64 65 or over REFUSED
c) Which of the following best describes your situation? READ Single, living alone or with other adults Married or equivalent with no children at home Family with children at home: IF YES, PROBE: Any pre‐school children? 1 YES 2 NO
d) Do you own or rent your current home? Own Rent OTHER
e) Do you have any mobility difficulties (such as, difficulty walking)? YES NO

Burrard Bridge Lane Reallocation Study Study A822 Final Questionnaire
A822_COV BBridge_QUEST FINAL(Pre & Mid)_23sep09 Page 6
f) About how often, if ever, do you ride a bicycle? Daily Weekly Monthly Less often Never GO TO Q23
g) Do you cycle year‐round? 1 YES 2 NO
h) LANGUAGE OF INTERVIEW: 1 ENGLISH 2 CANTONESE 3 MANDARIN
Thank you, this completes our survey. The City of Vancouver and Mustel Group appreciate your input.