
Bundling in the television market
92
SAMFUNNS- OG NÆRINGSLIVSFORSKNING AS Institute for Research in Economics and Business Administration Arbeidsnotat Working Paper 19/13 Bundling in the television market - who will benefit the most from à la carte channel choice in the Norwegian television market? Daniel A. Sørensen
-
Upload
khangminh22 -
Category
Documents
-
view
1 -
download
0
Transcript of Bundling in the television market

E t s e l s k a p i N H H - m i l j ø e t
S A M F U N N S - O G N Æ R I N G S L I V S F O R S K N I N G A S
I n s t i t u t e f o r R e s e a r c h i n E c o n o m i c s a n d B u s i n e s s A d m i n i s t r a t i o n
A r b e i d s n o t a tW o r k i n g P a p e r19/13
Bundling in the television market- who will benefit the most fromà la carte channel choice in the Norwegian television market?
Daniel A. Sørensen

SNFSamfunns- og næringslivsforskning AS
- er et selskap i NHH-miljøet med oppgave å initiere, organisere og utføre eksternfinansiert forskning. Norges Handelshøyskole og Stiftelsen SNF er aksjonærer. Virksomheten drives med basis i egen stab og fagmiljøene ved NHH.
SNF er ett av Norges ledende forsk-ningsmiljø innen anvendt økonomisk-administrativ forskning, og har gode samarbeidsrelasjoner til andre forsk-ningsmiljøer i Norge og utlandet. SNF utfører forskning og forskningsbaserte utredninger for sentrale beslutnings-takere i privat og offentlig sektor. Forskningen organiseres i programmer og prosjekter av langsiktig og mer kort-siktig karakter. Alle publikasjoner er offentlig tilgjengelig.
SNFInstitute for Research in Economics and Business Administration
- is a company within the NHH group. Its objective is to initiate, organize and conduct externally financed research. The company shareholders are the Norwegian School of Economics (NHH)and the SNF Foundation. Research is carried out by SNF´s own staff as well as faculty members at NHH.
SNF is one of Norway´s leading research environment within applied economic administrative research. It has excellent working relations with other research environments in Norway as well as abroad. SNF conducts research and prepares research-based reports for major decision-makers both in the private and the public sector. Research is organized in programmes and projects on a long-term as well as a short-term basis. All our publications are publicly available.

Working Paper No 19/13
Bundling in the television market - who will benefit the most from à la carte channel choice in the Norwegian television market?
by
Daniel A. Sørensen
SNF project no 1411 “Satsing i tele og media”
THE ECONOMICS OF MEDIA AND TELECOMMUNICATIONS This report is one of a series of papers and reports published by the Institute for Research in Economics and Business Administration (SNF) as part of its telecommunications and media
economics program. The main focus of the research program is to analyze the dynamics of the telecommunications and media sectors, and the connections between technology, products and
business models. The project “Satsing i tele og media” is funded by Telenor AS, TV2 Gruppen AS and the Norwegian Broadcasting Corporation (NRK).
INSTITUTE FOR RESEARCH IN ECONOMICS AND BUSINESS ADMINISTRATION BERGEN, AUGUST 2013
ISSN 1503-2140
© Materialet er vernet etter åndsverkloven. Uten uttrykkelig samtykke er eksemplarfremstilling som utskrift og annen kopiering bare tillatt når det er hjemlet i lov (kopiering til privat bruk, sitat o.l.) eller avtale med Kopinor (www.kopinor.no) Utnyttelse i strid med lov eller avtale kan medføre erstatnings- og straffeansvar.

SNF Working Paper No 19/13

1
Abstract
Bundling of television channels has been heavily criticized by consumers, but is still observed
in most television markets. In this paper I investigate the consequences of unbundling the
Norwegian market, especially from the distributors’ and channels’ points of view.
Classic bundling theory does not apply particularly well to this market, and I therefore look at
industry specific models which have helped to achieve a better understanding of the television
market. Since the models have been developed in the US, I also discuss whether or not the US
and Norwegian television markets differ. I find that the US industry models, with some
modifications, also can be applied to the Norwegian market.
Interestingly, I find that the consumer favored à-la-carte policy will not reduce the average
household expenditure on television channels. Furthermore, the industry models indicate that
the distributors and channels will be slightly better off under à la carte.
SNF Working Paper No 19/13

2
Preface
This paper is written as the final part of the Master of Science in Economics and Business
Administration program at the Norwegian School of Economics (NHH), with a major in
Business Analysis and Performance Management (BUS).
I have always found the television market interesting because of the ever changing market
environment and its constant public attention. The bundling of channels has been heavily
criticized by consumers, but is still practiced in most television markets.
Classical bundling theory is not enough to understand the full effects of bundling in this
market. I had to look at industry specific models which have helped me to a better
understanding of the television market both in the US and in Norway. Finally, it has also been
important to consider the rapid technological change in the market, which surely will have an
impact on how bundling will work in the future.
A special thanks to my supervisor Øystein Foros for useful input and suggestions during all
stages of the working process.
Bergen, June 10th 20131
Daniel Audun Sørensen
1 Author can be contacted at [email protected]
SNF Working Paper No 19/13

3
Contents Abstract ................................................................................................................................................... 1
Preface ..................................................................................................................................................... 2
Figures ..................................................................................................................................................... 6
Tables ...................................................................................................................................................... 6
1. Introduction ......................................................................................................................................... 7
1.1 Background and Motivation .......................................................................................................... 7
1.2 Problem formulation ..................................................................................................................... 8
1.3 Structure ........................................................................................................................................ 8
1.4 Limitations ..................................................................................................................................... 9
2. The Economics of Bundling ................................................................................................................. 9
2.1 Bundling ......................................................................................................................................... 9
2.2 Bundling as a field in economics ................................................................................................. 10
2.3 Sources of Bundling Profitability ................................................................................................. 11
2.3.1 Consumer preferences ......................................................................................................... 11
2.3.2 Costs ..................................................................................................................................... 12
2.3.3 Bundling as an entry barrier ................................................................................................. 13
2.4 Bundling two goods ..................................................................................................................... 13
2.4.1 The two goods model (Adams & Yellen, 1976) .................................................................... 13
2.4.2 Pure components strategy ................................................................................................... 14
2.4.3 Pure bundling ....................................................................................................................... 14
2.4.4 Mixed bundling ..................................................................................................................... 15
2.4.5 Evaluation of the strategies .................................................................................................. 16
2.5 Bundling more than two goods ................................................................................................... 17
2.5.1 The N-goods Model (Bakos & Brynjolfsson, 1999) ............................................................... 18
2.5.2 Substitutes and complements .............................................................................................. 20
2.5.3 The Monopoly Assumption .................................................................................................. 21
2.6 Television market expectations ................................................................................................... 22
3. Industry models for the television market ........................................................................................ 24
3.1 Background .................................................................................................................................. 24
3.2 The 2007 Industry Model (Crawford & Cullen, 2007) ................................................................. 25
3.2.1 The model ............................................................................................................................. 26
3.2.2 The à-la-carte scenario ......................................................................................................... 27
3.2.3 The bundling scenario .......................................................................................................... 28
SNF Working Paper No 19/13

4
3.2.4 The market simulations ........................................................................................................ 30
3.2.5 The data ................................................................................................................................ 30
3.2.6 The baseline case.................................................................................................................. 31
3.2.7 Welfare effects of full à-la-carte .......................................................................................... 32
3.2.8 Channel Exit .......................................................................................................................... 33
3.2.9 Robustness ........................................................................................................................... 34
3.3 The 2011 Industry Model (Crawford & Yurukoglu, 2011) ........................................................... 35
3.3.1 The model ............................................................................................................................. 36
3.3.2 Household Demand .............................................................................................................. 36
3.3.4 Modeling the bargaining process ......................................................................................... 39
3.3.5 The Dataset........................................................................................................................... 41
3.3.6 Parameter Estimation ........................................................................................................... 42
3.3.7 Estimation results ................................................................................................................. 45
3.3.8 Welfare effects of full à-la-carte .......................................................................................... 47
3.3.9 Robustness ........................................................................................................................... 50
4 The US and Norwegian Markets for television ................................................................................... 52
4.1 Overview ...................................................................................................................................... 52
4.2 Households and preferences ....................................................................................................... 52
4.3 Distributors .................................................................................................................................. 54
4.3.1 US and Norwegian Distributors and Platforms .................................................................... 55
4.3.2 Bundle composition and prices ............................................................................................ 57
4.3.3 Other Bundle Characteristics ................................................................................................ 59
4.4 TV Channels ................................................................................................................................. 61
4.4.1 Advertising funded programming ........................................................................................ 61
4.4.2 Premium programming ........................................................................................................ 62
4.4.3 NRK (Norwegian Broadcasting Corporation) ........................................................................ 62
4.5 Channel Conglomerates .............................................................................................................. 63
4.5.1 Cross Ownership ................................................................................................................... 64
4.5.2 Relative Bargaining Power .................................................................................................... 65
5. À-la-carte in Norway .......................................................................................................................... 66
5.1 Welfare effects of à-la-carte........................................................................................................ 66
5.2 Future Trends .............................................................................................................................. 68
6. Concluding Remarks .......................................................................................................................... 71
References ............................................................................................................................................. 72
SNF Working Paper No 19/13

5
Appendix ................................................................................................................................................ 75
Appendix A: Exponentially distributed hours watched for CNN ....................................................... 75
Appendix B: Bundle Composition and Prices USA ............................................................................. 76
Appendix C: Channel Summary Statistics .......................................................................................... 77
Appendix D: Estimated WTP each channel ....................................................................................... 78
Appendix E: Input Costs and Welfare Effects by Channel ................................................................. 79
SNF Working Paper No 19/13

6
Figures
Figure 1: Pure Components Strategy 14
Figure 2: Pure Bundling Strategy 15
Figure 3: Mixed Bundling Strategy 15
Figure 4: Increasing bundle size 19
Figure 5: Bundle profit for different demand distributions 20
Figure 6: The incentives to offer stand-alone products 28
Figure 7: The incentives to offer products in a bundle 29
Figure 8: Share of customers for different distributors in Norway 56
Figure 9: Number of subscribers for different distribution platforms in Norway 57
Tables Table 1: Negatively correlated reservation prices 11
Table 2: Market outcomes and welfare 31
Table 3: Estimated price sensitivity parameters 46
Table 4: Estimated input cost parameters 47
Table 5: Baseline results: Full à-la-carte with and without input cost re-negotiations 48
Table 6: Number of customers for television providers and platforms in USA 55
Table 7: Selected bundle prices in the US 58
Table 8: Selected bundle prices in Norway 58
Table 9: Average viewership ratings top 15 channels in USA (2012) 63
Table 10: Market shares most watched channels in Norway (2012) 64
Table 11: Summary of predicted welfare effects of à-la-carte introduction 67
SNF Working Paper No 19/13

7
1. Introduction
1.1 Background and Motivation
In this paper, the bundling of goods and its economical effects on both consumers and
producers are investigated further. Specifically, the market under interest is the multichannel
television market, or just the television market, where the bundling of channels has been the
sole practice for a long time. I want to look at welfare effects of different pricing strategies in
this market. Since this is a paper within the Business Analysis and Performance Management
profile I will be mostly concerned with the effects bundling has on the firm’s profitability.
Many studies have been conducted on the welfare effects of bundling in general (notably
Adams & Yellen, 1976 and Bakos & Brynjolfsson, 1999), and on bundling in the television
market (Crawford & Cullen, 2007 and Crawford & Yurukoglu, 2011). This paper sets out to
assess the consequences of new market regulations that will let consumers choose individual
channels from a full menu of channels, also called a full à-la-carte policy. The most extensive
studies on these welfare consequences have been conducted in the USA, but the results might
also be applicable to the Norwegian market. I want to assess the welfare consequences
bundling compared to à-la-carte in Norway, and therefore it will later be necessary to discuss
in which ways the two markets differ.
Bundling in the television market is a much debated topic. Consumers are seemingly
frustrated of being forced to subscribe to channels they never watch. Being able to choose
channels à-la-carte seems to be the consumer-favored policy both in the USA (Consumers
Union USA, 2004) and in Norway (Forbrukerombudet, 2011), but bundling is still the
dominating strategy for distributors in the market. Forbrukerinspektørene, a Norwegian
consumer rights television program, compared today’s distribution of TV channels to a world
where consumers would have to buy all newspapers at a newsstand instead of just the one
they wanted (NRK, 2009). There seems to be dissatisfaction with how the market works
today, but as I will come back to later, consumers might not fully understand the
consequences of a the à-la-carte policy.
There are also legal issues surrounding bundling strategies. In February 2013, Cabelvision, a
US cable television distributor, filed an antitrust lawsuit against Viacom (PRNewswire,
2013), a major US media conglomerate carrying popular channels like MTV and Comedy
SNF Working Paper No 19/13

8
Central. Cablevision claimed they were being forced by Viacom to carry 14 additional small
channels on top of the two or three channels they actually were interested in.
Here, the distributor has taken the consumer perspective trying to stand up to this classic
example of channel bundling. In a press release Viacom described the lawsuit as “a
hypocritical attempt to void the transaction” (Reuters, 2013) drawing on the fact that
Cablevision sells bundles to their own customers as well.
1.2 Problem formulation
I want to investigate the consequences of bundling and à-la-carte in the multichannel
television market and find out if any party, consumers or firms, can benefit from unbundling
the market. It is natural to focus my analysis on the Norwegian market. Specifically I want to
find out if the consumers benefit and the distributors suffer from an à-la-carte policy, and by
how much. My problem formulation will therefore be:
What would be the consequences of a full à-la-carte policy in the Norwegian television
market, and who stands to benefit and lose the most by unbundling?
1.3 Structure
The television market is dominated by bundling, and therefore bundling theory will be central
in this paper. In the first section I will present important models in the field of bundling.
These models are general, and not tailored for the television market, but are still important to
get an understanding of the basic concepts behind bundling. I want to present the sources of
bundling profitability, and explain why the television market is well suited for a bundling
strategy. Furthermore, the welfare consequences of different forms of bundling are presented.
After the basic concepts I will present in detail the framework used by Crawford, Cullen and
Yurukoglu in their two studies from 2007 and 2011. This framework is very useful to
understand the television market, and will be the most important basis for my discussion of
the Norwegian market which will follow at the end of the paper. I will sometimes refer to
these models as the first (2007) and second (2011) industry models, respectively.
I discuss the differences between the US and the Norwegian market and give a brief
presentation of each market where I focus on consumers, distributors and channels. Finally,
with potential market differences in mind, I will comment on the effect bundling has in
Norway and give a prediction of future trends in the market with the emergence of on demand
streaming services as an important factor.
SNF Working Paper No 19/13

9
1.4 Limitations
I base my conclusions on simulations from the US market, and even though the datasets in
these studies are very extensive, the results do not necessarily apply to the Norwegian market.
These issues I address by comparing the markets, specifically looking at how the assumptions
taken in the US simulations are comparable to the characteristics of the Norwegian market.
Most of the assumptions concern the estimation of parameters in the market simulations. I
have not assessed the consequences of using different statistical distributions in these
estimations, although I have justified the distributions already used in the studies.
I only look at the two extremes, namely pure bundling and full à-la-carte, which may lead to
exaggerated results that are not fair in practice. This can be the case if a golden mean between
the two policies exists, for instance a mixed bundling alternative. Policymakers love golden
means. I expect that pure bundling and full à-la-carte will yield very different results.
The models I present does not explicitly address the emergence of on-demand streaming
services like Netflix, HBO and Viaplay, accessible from consumers’ computers, phones or
tablet devices. At the end of my discussion, I will consider the effects of such services and
how they will relate to the bundling models.
2. The Economics of Bundling
In this section I will present the concepts behind bundling from scratch using the basic
literature within the field as a starting point. I also want to describe which factors that should
be present in order for bundling to work as a tool for price discrimination. Furthermore, there
will be a short discussion on how firms can decide whether to pursue a bundling strategy or
not. Also, I will discuss how this general framework relates to the multichannel television
market, and which modifications that will have to be made.
2.1 Bundling
A bag of Twist, an ever popular Norwegian chocolate assortment, consists of many different
chocolate varieties. Most people can say that they like some, but maybe not all of the pieces in
the bag. When a bag of Twist is served at special occasions all pieces usually disappear in a
short period of time. There seems to be a natural law making sure that nothing is left. The
guests have different tastes for the chocolate pieces and some guests might prefer pieces that
other guests avoid. Economists at the party, of course not speaking out loud, would here
SNF Working Paper No 19/13

10
define the guests as consumers, and their chocolate tastes as the consumers’ preferences. The
economists would also note that the bag of Twist is a bundle of goods.
There are many reasons why selling the chocolate pieces in one package instead of singles can
be beneficial for both producers and consumers. At the same time, consumers can in many
cases be worse off if goods are sold in packages. The profitability and welfare consequences
of bundling are the main subjects I want to address in this paper. Both these subjects can be
presented through intuitive models from economics.
Bundling can be defined as the practice of selling two or more products in a package
(Pindyck & Rubinfeld, 2009). Bundles can contain both differentiated products (television
channels) and undifferentiated products (a container of eggs). The main focus here will be on
bundles consisting of different products and from now on, the term bundle describes a bundle
consisting of differentiated products.
There are different forms of bundling (Adams & Yellen, 1976). Pure bundling describes the
practice of only selling the goods in a package form, like when cable television distributors
only sell their channels in bundles. Firms that offer their products both in a package form, and
separately, follow what is called a mixed bundling strategy. An example of this could be fast
food restaurant where customers can either buy the full meal or the food and beverages
separately.
2.2 Bundling as a field in economics
As a result of a lawsuit in the US (USA vs Loew’s Inc 1962, Supreme Court) the so-called
“block-booking” of movies was ruled to violate the Sherman Antitrust Act2. The concept of
block-booking is one early example of bundling. Loew’s Inc, owner of the rights to the
particular movies, forced the television channels to purchase a bundle of movies.
In this specific case some of the movies bundled together were the international blockbuster
Gone With the Wind (GWTW) and the flop Getting Gertie’s Garter (GGG). In the television
market this could translate to pairing the popular sports channel ESPN with a niche network
like Shopping TV.
Loew’s Inc refused to sell the movies separately to television channels, hence pursuing a pure
bundling strategy, but the court ruled this practice to be illegal in this particular case. This
2 US equivalent of Konkurranseloven
SNF Working Paper No 19/13

11
does not necessary imply that pure bundling is forbidden in the USA, which is not the case,
but illustrates the antitrust issues surrounding a pure bundling strategy.
The court’s decision led to an in-depth discussion of bundling and its role in the somewhat
controversial field of price discrimination (Stigler, 1963). Stigler’s thorough comment to the
ruling has later been regarded as the first time product bundling entered economic theory in
the field of price discrimination (Liebowitz & Margolis, 2008). Stigler argued that two movies
bundled together could extract more consumer surplus than selling movies individually – even
if demand for each movie varied. Producers would benefit from this extraction, while the total
welfare effects were unclear. The reasoning behind this argument will be presented in the
following sections and is in many ways the foundation of bundle pricing.
2.3 Sources of Bundling Profitability
The ultimate goal with bundling is to increase the firm’s profit by adding to the firm’s
revenue and/or reduce the firm’s costs. Whether bundling is suitable in a particular industry or
not must be assessed in each case, but it will be useful to consider bundling within a
theoretical framework. This paper sets out to investigate the overall welfare consequences of
bundling in the television market for the consumers, the distributors and the channels. It is
therefore necessary to address factors that will affect bundling profitability in this particular
industry.
2.3.1 Consumer preferences
A key factor determining the profitability of bundling is the correlation between consumers’
reservation prices for the products in the bundle. In the case described above, the reservation
price correlation turned out to be negative so that one buyer valued GWTW higher than the
other buyer, whereas the roles were reversed for GGG (even though both channels valued
GWTW significantly higher than GGG).
Pindyck & Rubinfeld have created a simple example (Table 1) showing how the relative
valuations could be utilized by the movie company to extract consumer surplus.
Table 1: Negatively correlated reservation prices, modified Supreme Court Case (Pindyck & Rubinfeld, 2009,
p.414)
Gone With The Wind Getting Gertie's Garter
Channel A 12 000.00$ 3 000.00$
Channel B 10 000.00$ 4 000.00$
SNF Working Paper No 19/13

12
When selling the movies separately Loew’s Inc would charge $10 000 for GWTW and $3 000
for GGG thereby getting a total revenue of $13 000 from each channel. Another alternative
would be to bundle the movies. Assuming additive reservation prices, the maximum price
Loew’s could charge for the bundle would be $14 000, a price both channels would agree to.
In total, bundling would extract more consumer surplus by increasing the total revenue from
$26 000 to $28 000. This is why bundling is especially suitable when correlation in demand
for the individual components are negative.
Economists later supported Stigler’s idea (Adams & Yellen, 1976) and the ability of sorting
customers into groups is widely thought of as the main economic reasoning behind bundle
pricing. Since firms through bundling are able to take advantage of the customer
heterogeneity, bundling can serve the same purpose as third degree price discrimination.
Third degree price discrimination can be defined as “the practice of dividing consumers into
two or more groups with separate demand curves and charging different prices to each
group” (Pindyck & Rubinfeld, 2009). By reducing the variation in customers’ reservation
prices, firms are able to extract more consumer surplus. Consumer preferences as a reason for
bundling will be discussed more thoroughly in the presentation of the Adams & Yellen
framework later in this section.
2.3.2 Costs
Bundling does not necessarily only affect the firm’s revenue. Administration and marketing
costs could be lower if the products were sold in a bundle rather than individually. The
literature presented above talks little about the demand-cost interaction and focus mostly on
the demand side (Adams & Yellen, 1976). It has been argued that this one-sided focus can
result in wrong conclusions when the cost functions differ (Salinger, 1995). In fact, Salinger
shows that when a bundling strategy lowers the firm’s costs, it tends to be more profitable
when demand for the individual goods is positively correlated and component costs are high.
Although interesting, the cost implications in bundle pricing are not the main focus in this
paper. In the more sophisticated and market specific models later in the paper, assumptions
about costs will necessarily have to be taken. These cost assumptions will only be discussed
on a practical level related to the cable television market.
SNF Working Paper No 19/13

13
2.3.3 Bundling as an entry barrier
Another reason to bundle is the entry-deterrent effect which, in fact, has been suggested to
have even more effect on profitability than the price discrimination effect (Nalebuff, 2004). A
firm with market power in two products can by bundling them together, stop entrants that
only supply one of the two products. This effect goes beyond the scope of this paper, and is
not particularly suited for this market. To compete in the television market the distributors
offer bundles composed of roughly the same channels. There are entry barriers in this
industry, but these are related to distribution technology and bargaining power, rather than the
bundle strategies, in my opinion.
2.4 Bundling two goods
Adams and Yellen suggested a simple model that in various forms has been incorporated in
most introductory microeconomic textbooks. Although it may be a very basic model where a
monopolist sets the prices on two goods, it is helpful in understanding the main drivers behind
product bundling, and some of the welfare effects of bundling. The more complex framework
that will be discussed in later sections is also partly based on this model. Furthermore, the
model provides insight on key factors that have to be present for bundling to be profitable. It
is therefore useful to give the model some space in this paper to explain the fundamentals of
bundling.
2.4.1 The two goods model (Adams & Yellen, 1976)
Pure price discrimination is in many cases legally problematic, but a monopolist selling two
goods can instead resort to bundling to capture consumer surplus. The monopolist has three
alternatives when setting the pricing strategy; pure components (separate sales), pure bundling
and mixed bundling. In this model, consumers compare their reservation prices for each
product ( and ) with observed market prices ( and ) and base their decisions on these
comparisons.
When it comes to costs, it is assumed that the marginal cost of supplying each good separately
( and ) does not change with output. Also, the bundle cost is seen as the sum of the
separate cost ( ). The model does not consider fixed costs.
In addition, consumers do not gain any utility for a second unit of either of the goods so they
will either buy zero or one unit of each good.
SNF Working Paper No 19/13

14
2.4.2 Pure components strategy
Selling the two goods separately will divide consumers into four groups where some will buy
both products, some buy either product 1 or product 2, and some will not buy any product.
This is called the pure components strategy, unbundled sales or à-la-carte and will result in
ordinary monopoly pricing in this model.
Fig. 1: Pure Components Strategy - Modified Adams & Yellen (Pindyck & Rubinfeld, 2009, p.415)
2.4.3 Pure bundling
When the products only are offered in a bundle the firm sorts consumers into just two groups.
One group with a reservation price for the bundle that is lower than the actual price and
one with a higher reservation price for the package of goods. It is assumed that the bundle
reservation price is equal to the sum of the separate reservation prices (1), a strong assumption
also called strict additivity (Guiltinan, 1987). At last, resale of components is impossible.
This will create a straight line where both intercepts are equal to the bundle price with a
slope of minus one.
(1)
The first group consumes the bundle (area I), while the second group consumes no goods
(area II). In this scenario it is not possible to purchase the products separately.
SNF Working Paper No 19/13
15
Fig. 2: Pure Bundling Strategy - Modified Adams & Yellen (Pindyck & Rubinfeld, 2009, p.416)
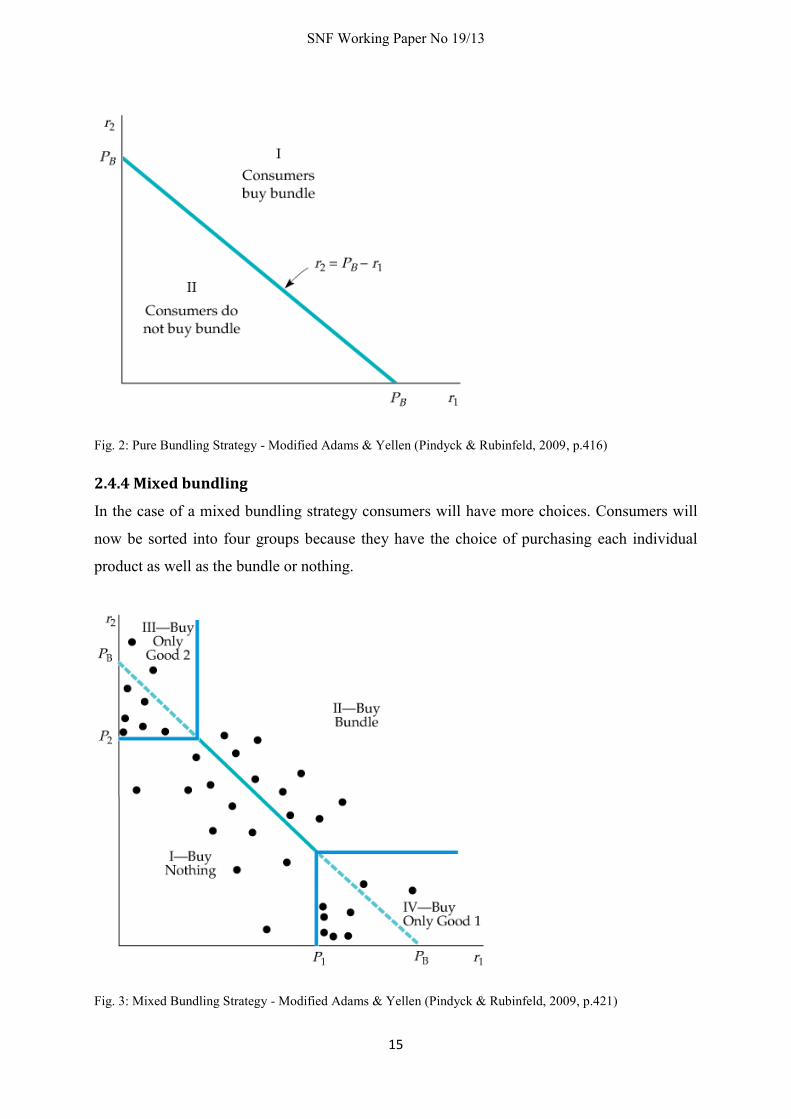
2.4.4 Mixed bundling
In the case of a mixed bundling strategy consumers will have more choices. Consumers will
now be sorted into four groups because they have the choice of purchasing each individual
product as well as the bundle or nothing.
Fig. 3: Mixed Bundling Strategy - Modified Adams & Yellen (Pindyck & Rubinfeld, 2009, p.421)
SNF Working Paper No 19/13

16
Consumers (represented by dots) will again base their decisions on reservation prices. When
, and the consumer will not buy any products (I). If , the
consumer will decide to buy the bundle (II). In III and IV consumers will only purchase the
single product where the price is lower than the matching reservation price.
2.4.5 Evaluation of the strategies
The profitability of these strategies will depend on the distribution of consumer reservation
prices. The mentioned literature within the field shares the same view on the role correlations
in demand have for profitability. In general, it is when firms observe negative correlation in
reservation prices that they have the most to gain by pursuing a bundle strategy as seen in
Table 1, but bundling can also be profitable even if the valuations are independent or slightly
positively correlated (Schmalensee, 1984). It has also been argued that bundling can be
profitable if consumer valuations for the goods are high relative to marginal costs (McAfee,
McMillan & Whinston, 1989).
Each of the strategies above can be suitable for a monopolist depending on several factors.
Adams and Yellen evaluate the strategies by comparing them to the case of first degree price
discrimination where every consumer pays their reservation price hence extracting all CS
(Pindyck & Rubinfeld, 2009). Every profit maximizing firm would prefer this pricing scheme
if achievable, and the complete extraction scenario can be used as a benchmark to evaluate the
three strategies above.
In the case of pure price discrimination no individual will realize any CS (Complete
Extraction). At the same time no individual will consume a good if the cost of that good
exceeds the reservation price (Exclusion). Finally, any individual whose reservation price for
a good exceeds its cost will consume the particular good (Inclusion). If bundling can serve the
purpose of price discrimination it will be natural to compare pure bundling and mixed
bundling with the three conditions above.
If the firm decide to follow a pure bundling strategy it will be difficult to comply with the
exclusion condition. Some consumers may for instance not satisfy and still purchase
the bundle thus violating the exclusion condition for one of the bundle components (product
1). Pure bundling will therefore only dominate the pure components strategy (where exclusion
never will be violated) if the greater profits attained from more complete extraction of CS are
not outweighed by less complete exclusion of consumers that are not viable.
SNF Working Paper No 19/13

17
In the article, Adams & Yellen give proof that “whenever the exclusion requirement is
violated in a pure bundling equilibrium, mixed bundling is necessarily preferred to pure
bundling”. Creating two additional consumer categories will help the firm extract more
consumer surplus from the consumers that value just one of the goods highly. In the pure
bundling scenario these consumers could have been excluded from the market because the
total bundle price was too high.
The exclusion requirement will often not be violated when marginal costs are low and the
model says little about the optimal strategy in this scenario. As I will discuss later, pure
bundling will often be the optimal strategy when marginal costs are low, and when there are
more than two components.
2.5 Bundling more than two goods
The Adams and Yellen article concludes that mixed bundling yields higher profits than pure
bundling in most markets. This was probably right at the time (1976), when marginal costs
were an important factor in almost any market and it was more profitable to divide consumers
into four groups than in two. The question is why mixed bundling is not observed to a larger
extent in the multichannel television market? Pure bundling seems to be the dominating
strategy both in the USA and in Norway.
There are many reasons why the model is not especially suited for the market under interest in
this paper. The model includes only two goods, which makes it good for discussion purposes,
but it will fail to grasp the reality of many markets in the real world. One of these markets is
the television market, where the typical bundle in most cases consists of much more than two
channels. Furthermore, the model deals with the three different strategies in an intuitive way,
but fails to address which of the strategies is the optimal under different cost assumptions.
With the emergence of the internet in the 1990s digital products with nearly zero marginal
costs attracted more and more interest. Examples are digital subscriptions of magazines,
streaming of music and software products. Having in mind that bundling can be profitable
when marginal costs are low; bundle pricing seemed perfectly suited for the digital market.
For instance, the marginal cost of a printed newspaper is much higher than the marginal cost
of the digital version.
There was not much research on so-called N-good models in the bundling literature before the
IT emergence, simply because large bundles of goods typically had been unprofitable and also
SNF Working Paper No 19/13

18
very complex to model (Hanson & Martin, 1990). When marginal costs decreased towards
zero, bundling a large number of goods suddenly became more interesting.
2.5.1 The N-goods Model (Bakos & Brynjolfsson, 1999)
When marginal costs are zero, Bakos and Brynjolfsson show that the profitability of bundling
increases with the number of goods in the bundle (Bakos & Brynjolfsson, 1999). In other
words, the firm can to a larger degree benefit from the reduction in consumer heterogeneity
when they increase the number of goods in the bundle. They approach the problem of model
complexity by drawing upon general theorems from statistics. Because of this, even bundles
with large number of goods can be analyzed, and the different bundling strategies can be
evaluated also in the market for information goods. They find that when bundle size increases
without bound the bundle profit is maximized and total welfare surplus will equal the firm’s
profit, thereby extracting all consumer surplus. This is the main contribution of their article,
but cannot be applied to physical goods because of the assumptions of zero marginal costs.
One major advantage with their model is that, unlike earlier work (Hanson & Martin, 1990), it
does not get more complex as the number of goods in the bundle increases. The reason is the
assumption that consumer valuations of goods are independent and identically distributed
(i.i.d). In total, three assumptions have been taken.
1. The marginal costs of all information goods are zero.
2. For all bundle sizes, , consumer valuations are independent and uniformly
bounded, with continuous density functions, non-negative support, mean and
variance .
3. Consumers have free disposal
The second assumption means that every consumer’s valuation (for the whole bundle) is
characterized by only a single variable. In other words, the model can only capture consumer
valuations for the aggregated bundle, which in this case is adequate when we are interested in
pure bundling, as observed in the multichannel television market. If, on the other hand, we
want to look at the mixed bundling scenario, more assumptions will have to be taken in order
to account for correlations across the bundle components.
Bakos and Brynjolfsson find that, given the assumptions above, bundling information goods
can be remarkably superior to selling the goods separately, seen from the firm’s
perspective. Bundling will substantially reduce the average deadweight loss, maximize the
SNF Working Paper No 19/13

19
firm’s profit and reduce consumer surplus. In fact, as increases, the deadweight loss per
good and the consumer surplus per good converges to zero.
To explain the intuition behind this result it can be useful to draw parallels to the
diversification of stocks (Kobayashi, 2005). Bundling reduces the variation in consumer
valuations in the same way diversification reduces unsystematic risk in a portfolio of stocks.
When the distribution of consumer valuations for each component is uniform [0.1], there will
be an increasing fraction of consumers with moderate valuations near the mean of the
distribution as the number of goods in the bundle increase as seen in Figure 4. In other words
the demand curve for a large bundle will be more elastic near the mean valuation of the
population and more inelastic away from the mean.
Fig.4: Increasing Bundle Size - Demand for bundles of 1, 2 and 20 information goods with i.i.d. valuations
uniformly distributed in [0,1] (linear demand case) (Bakos & Brynjolfsson, 1999, p.5)
The findings suggest that pure bundling can be very profitable in some industries where
marginal costs are low and valuations for the bundle components are independent. Television
distributors can take advantage of this finding by offering large bundles and increase their
profit substantially compared to pursuing a pure components strategy. At the same time,
consumers will be worse off under bundling in this case.
Figure 5 below illustrates how the firm’s profit monotonically increases with higher bundle
size even with different distributions of consumer valuations. Eventually the firm will capture
total surplus, but seen from the figure, this will require a very large bundle. In the television
market, there are 100-150 channels in most markets which leads one to expect that based on
SNF Working Paper No 19/13

20
this model, the firm’s cannot hope to extract all consumer surplus through bundling.
Nonetheless, the figure shows how powerful bundling can be and why bundling is observed in
the television market as well as in music streaming and online magazine subscriptions.
Fig.5: Bundle Profit for Different Demand Distributions - The lower bound on the profits per good from a bundle
of i.i.d information goods increases monotonically with (Bakos & Brynjolfsson, 1999, p.11)
On the contrary, bundling may not be so attractive when marginal costs are positive, which
they in most cases are. Marginal costs can make bundling unprofitable, particularly if they are
high compared to the mean valuation. If this is the case, the firm will get a reduction in profits
when bundling the goods. The reason is that the strategy will reduce the fraction of buyers
with valuations that are above the total marginal cost of the bundle. A pure components
strategy would then be the best alternative because it would limit the consumption of the
separate goods to the consumers that actually value these goods above the marginal costs.
2.5.2 Substitutes and complements
When a firm decides to bundle several goods, some of these goods will most likely be either
substitutes or complements. For instance, ESPN and Fox Sports (with complementary
broadcasting rights for sporting events) are definite complements for many consumers, while
on the other hand the financial news channels Bloomberg and CNBC probably will be seen as
substitutes. If a complementary channel is added to the bundle the consumer will experience
SNF Working Paper No 19/13

21
increased utility, while the opposite will be the case when adding a substitute. Bundling
substitutable products can be frustrating for consumers, and can affect the firm’s profit as well
as the consumer surplus. Since the previous models (Adams & Yellen and Bakos &
Brynjolfsson) have assumed that the reservation price for the bundle is the sum of the
components’ individual reservation prices it does not address substitutes and complements. If,
in fact, goods in a bundle are substitutes or complements the reservation price for the bundle
as a whole will not equal the sum of reservation prices.
The consequences of bundling these goods have been formalized in an analytical model of
contingent valuations (Venkatesh & Kamakura, 2003). The model provides optimal strategies
when substitutes and complements are present, and the study suggests that strong or moderate
substitutes should be offered separately in a pure components strategy. Complements, on the
other hand, should be purely bundled if the marginal costs are low. The television market
consists of both complements and substitutes, but still the trend is to bundle all types of
channels.
In study that follows this section (Crawford & Cullen, 2007) several bundles of channels with
similar themes (Theme tiers) are suggested as a golden mean between pure bundling and à-la-
carte. Based on the theory above, this could in my opinion be feasible for some bundles with
complementary channels, but not for bundles with substitutes. With the themes suggested in
the following model, distributors could risk to have bundles of mainly complements (Sports),
or bundles consisting of mainly substitutes (Financial News). While the first bundle goes in
hand with the theory above, the latter alternative does not because bundles of substitutes are
not preferred. Because of this I will not discuss theme tiers in much detail and my focus in the
further sections will instead be on the two extremes, namely pure bundling and à-la-carte.
2.5.3 The Monopoly Assumption
Most models in the field of bundling have either assumed simple monopoly or dominant firm
(Liebowitz & Margolis, 2008). In a follow up study to the n-goods model (Bakos &
Brynjolfsson, 2000) the monopoly assumption is questioned, and bundling is investigated in
more competitive information goods markets. Both upstream competition between content
producers and downstream competition between providers are investigated further. Since I
have taken the perspective of television distributors I will briefly discuss the impact of
downstream competition and how the monopoly assumption might be unrealistic.
SNF Working Paper No 19/13

22
All the models above assume that the firm has monopoly power in the market. This is not the
case in the television market, neither in the USA nor in Norway. In both markets, there is
downstream competition between cable distributors and satellite distributors. I will give an
overview of the markets in Section 4, but for now it is enough to know that there are normally
one cable and two satellite distributors competing in each local market. Usually consumers
will have just one cable alternative in their street or geographical area. Because of this, an
oligopoly setting with three distributors is more realistic than simple monopoly.
Later I will discuss welfare effects of bundling compared to à-la-carte in the television
market. Competition will have an impact on these measures. For instance, Crawford and
Cullen argue that competition will be higher under à-la-carte because there is no way to
differentiate a channel offered on cable versus satellite (Crawford & Cullen, 2007). Since the
second industry model in Section 3.3 takes competition into account, I expect the model to be
more suitable than the general framework above for the specific market. Specifically, the
industry model accounts for the bargaining process where the distributor input costs are
decided. Instead of assuming monopoly, the estimated cost parameters are a result of a
bilateral oligopoly bargaining model. These costs might be different for each distributor
depending on a number of characteristics, in particular the bargaining power.
Finally, I want to note that the monopoly assumption not necessarily will give wrong results.
The assumption simplifies bundling models which makes the models easier to interpret, and
competition does not necessarily change the market outcomes to a large degree. Nonetheless,
I find the oligopolistic setting more realistic and will therefore expect the model that
incorporates competition to be of more predictive value when talking about the profitability
and welfare effects of bundling in the television market.
2.6 Television market expectations
Before I move on I will outline some other expectations of how bundling works in
multichannel television markets. Bundling was first thought of as a tool for price
discrimination after the package selling of movies was taken to court in the US. Although one
cannot say that the bundling phenomenon emerged from this particular market, the sale of
movies was especially suited for a pure bundling strategy. I expect that bundling in the
television market have the same positive effect for firms, because the market is in many ways
very similar to the market for movies in the 1960s.
SNF Working Paper No 19/13

23
My first argument for this is the nature of consumer preferences in both cases. I find no
reasons to believe that consumers are more homogenous (or heterogeneous) in tastes whether
you look at a bundle of movies or a bundle of channels. The correlations in tastes, as
described previously, will often be negative for pairs of channels something that makes
bundling very attractive. I therefore expect the distributors to be significantly better off under
bundling than under à-la-carte based on the basic framework.
On the other hand, the Adams & Yellen framework has its limitations, especially because it
only considers the bundling of two goods and assumes monopoly. Also, as I mentioned in the
model presentation, the framework was introduced at a time where high marginal costs had a
large impact on pricing strategies. This is why it concludes that mixed bundling is the
preferred alternative, because the consumers with reservation prices below costs could be
excluded from purchasing the bundle. Undoubtedly, the majority of consumers do not satisfy
the exclusion condition for one or more channels in the television market today. In fact, some
consumers can in practice value a channel in their bundle at zero. At the same time I think
firms can gain more by the overall extraction of consumer surplus through pure bundling, than
they lose by excluding consumers through mixed bundling or à-la-carte. The main reasons
will be the nature of marginal costs, and the fact that there are much more than two goods in a
typical channel bundle. Since mixed bundling is not observed in the market under interest, I
think it is fair to assume that pure bundling is more profitable.
A typical basic bundle in Norway consist of around 50 channels (Providers websites, 2013),
but Bakos & Brynjolfsson argued that the bigger the bundle, the more profit could the firm
extract from consumers given that marginal costs were close to zero. I would therefore expect
large bundles that pools consumer preferences to the full. However, as they also explain, their
model explicitly addresses digital information goods with zero marginal costs. One
explanation for why not all television channels are part of a single bundle is these input costs.
I expect that the affiliate fees paid per subscriber are higher for premium channels, which
explains why these channels often are offered on top of the basic bundles. These channels
often target a very specific group of consumers.
Finally, I think it must be questioned how the previous models deal with correlations in
demand between the goods. In the television market there will certainly be channels that are
related either as substitutes or complements. This must be reflected in the consumer
reservation prices for a model to have good predictive value. Because of this, the strict
SNF Working Paper No 19/13

24
additivity condition in reservation prices is unrealistic for this market. One cannot simply find
the bundle reservation price as the sum of individual channel reservation prices. This is
therefore a potential problem in all the previous models.
In the next section, I will present market specific models that take more variables into account
in order to give more accurate predictions of welfare measures in the television market. The
main challenges will be to model the consumer preferences in a more realistic way, to account
for downstream competition and to measure accurate welfare effects and profitability of
bundling.
3. Industry models for the television market
In the first part of this paper the main drivers of product bundling have been presented, and
the multichannel television market is shown to be especially suited for firms to extract the
potential benefits from bundling. This section will in more detail look at the benefits from
bundling in the television market as seen from the profit maximizing distributor’s perspective.
At the same time there will be a discussion on the impact of offering channels à-la-carte
compared to the bundled world we observe today. Such a comparison is very useful in order
to assess each strategy because it is easier to measure the exact profitability of bundling when
there is an alternative scenario. Since bundling is the dominating strategy it can be seen as the
baseline case in the welfare discussions. From now on the pure components strategy will be
noted à-la-carte, as in a restaurant menu with free choice.
3.1 Background
The independent Federal Communications Commision (FCC) in the USA has analyzed the
effect of à-la-carte pricing (FCC, 2004) through a six-month study and concluded that
consumers would end up worse, paying more for television, if channels were offered à-la-
carte so that consumers could choose individual channels.
Interestingly the FCC issued a modified report only two years later (FCC, 2006) contradicting
the first report. The further report conclude that à-la-carte is economically feasible and
beneficial for consumers, and the FCC admitted that the 2004 report was based on unrealistic
assumptions and had a number of errors. In fact, the latter report suggests that households
could save up to 13 percent on their bill if à-la-carte was introduced.
SNF Working Paper No 19/13

25
3.2 The 2007 Industry Model (Crawford & Cullen, 2007)
Partly motivated by the FCCs reports and the contradicting conclusions provided, economists
have tried to answer the same questions about welfare consequences through more
sophisticated numerical analysis. By taking into account more variables when looking for the
welfare effects of à-la-carte opposed to bundling the hope has been to predict the
consequences more accurately. When talking about the welfare effects most recent studies
focus in particular on the impact on consumer welfare. Nonetheless, two interesting studies
(Crawford & Cullen 2007 and Crawford & Yurukoglu 2011) offer insight on the
consequences for the firms as well, in an overall welfare analysis.
The first of these studies, which now will be discussed thoroughly, addresses the questions
already discussed on a practical level about the impact on prices, number of products offered
and effects on welfare. Calibrating a basic welfare model, the paper discusses the effect of
introducing two different à-la-carte alternatives in a world where consumers first must have
purchased a “limited basic” bundle of channels. The study looks at both the extreme
alternative where every channel is offered à-la-carte, denoted full à-la-carte, and a case where
so-called theme tiers are offered consisting of channels covering specific themes like sports or
science.
Crawford and Cullen also build their welfare model on the work presented in earlier sections
of this paper, but is naturally based on the n-goods model to be able to describe this particular
market. An important addition to the model is the effect bundling and à-la-carte can have on
the number of products supplied. In the television market it is highly likely that a policy
change will affect, in this case, the number of channels offered. At least, this is what the
industry claims (Booz Allen Hamilton, 2004).
For the rest of this section the focus will primarily be on the full à-la-carte alternative, but
results from both cases are included to illustrate how also theme tiers could serve as a golden
mean between pure bundling and full à-la-carte.
Before the results can be presented the article model will be explained briefly to underline
which assumptions that have been taken in the simulations to follow. I have modified some of
the notations so that the equations will be easier to interpret.
SNF Working Paper No 19/13

26
3.2.1 The model
A monopolist offers a single product, but is considering offering an additional product, either
including the new product in a bundle with the existing product or offering it as a stand-alone
product.
With the à-la-carte option let and be the prices charged for each product, and let be
the total price charged if the products were to be offered in a bundle.
For a given market size N define
(1)
(2)
(3)
as the per-capita (per household) demand curves in each scenario and let
(4) for
be the associated per-capita variable cost functions where is the marginal cost for product .
Some of the later simulations also incorporate fixed costs for each product and is denoted ,
but is ignored in the baseline model. Since the model assumes positive marginal costs it looks
different from the Bakos and Brynjolfsson model, but remember that the conclusions will
most likely not differ if these marginal costs are sufficiently low.
Now it is possible to derive the per-capita consumer surplus (5), gross profit (6) and gross
total surplus (7) for each product .
Consumer Surplus:
This can be interpreted as the sum of the welfare surplus area including all households that
have a willingness to pay (WTP) above the price set for each product.
SNF Working Paper No 19/13

27
Producer Surplus (total revenue – total costs)
Gross total surplus for each product (simply CS + PS)
The distributor will only be interested in the profit maximizing price for each product, here
denoted:
(8)
while on the other hand from a social perspective, the total welfare maximizing price will be
denoted:
(9)
Assuming that the goods are neither substitutes nor complements it is possible to describe the
welfare effects of the introduction of a new product either as a stand-alone product or bundled
with the existing product. This independent valuations assumption deals with several potential
effects. For instance, adding an extra financial news channel (substitute) will have a different
impact on the willingness to pay than adding an extra sports channel (complement because of
different content). It can be questioned if this assumption is an oversimplification that will
result in wrong conclusions. In Section 2, I explained how correlations in the demand for
goods are determinants of bundling profitability and even though difficult to model for large
bundles, correlations should be addressed. Nonetheless, this does not necessary mean that the
model is of no predictive value.
From now it is assumed that the household demand curve for the new channel is based on an
exponentially distributed WTP with mean and variance equal to $1. The marginal cost is set
to $0.30. In Appendix A the observed distribution of viewing hours for CNN is reported, and
it turns out that this distribution is very similar to the exponential distribution. Other channels
also have similar distributions.
3.2.2 The à-la-carte scenario
In the case where the monopolist simply offers the products à-la-carte the profit from the
newly introduced product will be . Because of the no correlation assumption, the profit
SNF Working Paper No 19/13

28
for the existing product will not be affected. Profit-maximizing price will be $1.31 returning a
PS equal to the area B and a CS equal to the area A in Figure 6. There will be a dead-weight-
loss equal to area C since some consumers with WTP above cost are excluded from the
market as a consequence of the monopoly power.
Fig.6: The incentives to offer stand-alone products (Crawford & Cullen, 2007, p.386)
In the à-la-carte scenario there will never be introduced products that reduce total welfare
because the monopolist will only introduce products that by themselves add profit. Therefore,
additional products introduced in an à-la-carte world will never reduce total welfare within
this framework.
3.2.3 The bundling scenario
Suppose the new product enters a bundle that is offered on the market instead. With the same
assumptions as in the scenario above more insight can be given of the firm’s incentives to
offer products in a bundle.
The monopolist will now instead of only looking at instead look at the incremental
profit of adding the product to the existing bundle.
SNF Working Paper No 19/13

29
(10)
If this change in profit through bundling is more than the incremental surplus from offering
the new product as a stand-alone product instead, bundling will be the preferred alternative.
Fig.7: The incentives to offer products in a bundle (Crawford & Cullen, 2007, p.387)
The left panel in Figure 7 describes the demand for the already existing product, while the
right panel shows the demand curve when adding the new product to a bundle.
The β as seen in Figures 6 and 7 was introduced as a way to measure the difference between
private (producer) and social (total welfare) incentives to offer new products (Spence 1975).
When β is increasing, the more surplus can the monopolist extract from the total surplus
created as a result of introducing the new product. In other words, when the producer surplus
increases relatively to the consumer surplus, the β will increase. The fraction can here be used
to compare the à-la-carte and the bundling scenarios seen from the firm’s perspective.
Deriving the change in beta, , that occurs when bundling (here a positive 0.41) it can be
concluded that the monopolist in this case can extract a larger share of total surplus created.
He should therefore offer the new product in the existing bundle rather than à-la-carte given
the assumptions taken.
SNF Working Paper No 19/13

30
Even though the firm is better off when bundling, this does not necessarily mean that total
welfare increases like in the à-la-carte scenario. The fundamental bundling models presented
in previous sections also confirm this. Through bundling the firm takes advantage of
customers’ different taste preferences across the goods which may well result in the
introduction of additional products that decrease social welfare. It can be in the firm’s interest
to introduce such products to increase surplus extraction on the other products in the bundle
even if the new product decreases total welfare (Crawford & Cullen, 2007).
Crawford and Cullen put this model in use by obtaining a dataset from a local US cable
television market. By running simulations they are able to predict more accurately the welfare
effects of bundling compared to à-la-carte in the television market.
3.2.4 The market simulations
The complexity of the multichannel television market makes the analysis difficult without
several assumptions. In the model it is assumed that the marginal costs to cable systems are
positive, reflecting the so-called affiliate fees that channel conglomerates charge the
distributors per subscription for the right to carry their channels.
The simulations introduce a hypothetical à-la-carte world where the affiliate fees are likely to
differ from what we observe today. If the market is unbundled, the channels will charge
higher affiliate fees to offset the loss of subscribers. In the à-la-carte scenario the model
assumes that the cable system and the channel conglomerate share equally the revenues. It is
also assumed that there are no fixed costs for the cable distributors associated with offering an
additional channel and that the system maximizes short-run economic profit. Even though the
cable system is likely to face competition from satellite television providers, this model
assumes that the cable provider operates as a monopolist. Finally, the potential change in
channel advertising revenues that might happen if à-la-carte was to be introduced is not
addressed in this model. With all these simplifying assumptions one must be careful when
interpreting the results. A discussion of model weaknesses will follow after I have presented
the results.
3.2.5 The data
The simulations were done in two stages using price and market data from Monterey,
California. California Cable of Monterey, owned by the largest cable distributor in the US,
Comcast, was used as the sample system. The data that was not observable in the market, in
particular each household’s channel reservation prices, were obtained through surveys.
SNF Working Paper No 19/13

31
In the first stage of the simulations the observed market outcomes like reservation prices for
bundles and marginal costs were used as input to calculate the observed welfare measures
(consumer surplus, producer surplus and total surplus) by using the baseline welfare model.
Secondly, the policy proposals, full à-la-carte and theme tiers, were analyzed numerically
using simulations taking a number of assumptions.
In the following, full à-la-carte and theme tiers are compared to the baseline bundle that
existed in the Monterey market. The results are summarized in Table 2 below.
Table 2: Market outcomes and welfare, baseline bundle compared to two policy proposals (Crawford & Cullen,
2007, p.394)
3.2.6 The baseline case
Since it is assumed that all consumers already subscribe to the “limited basic” service the
more interesting bundle is the popular “expanded basic” service that at the time 72% of the
households subscribed to with a price of $44.05. In order to find the welfare measures of the
existing bundle the WTP for the bundle must be estimated. WTP for the bundle is assumed to
be normally distributed with mean and variance . This is a fair assumption thanks to the
central limit theorem which states that a sum of random variables tends to be normally
distributed on the whole, even though the individual variables, in this case the WTP for
individual channels, may have completely different distributions. Based on industry data the
marginal costs in Monterey are assumed to be 28% of the price.
With these assumptions the predicted WTP for the expanded basic package is normally
distributed with mean $47.00 and variance $151.29. Consumer surplus predicted per
SNF Working Paper No 19/13

32
household is $13.72, while producer surplus is estimated to $27.14 giving a total surplus of
$40.86. These values will be compared in the next stage with the two alternative à-la-carte
policies to find the welfare effects of a policy change, and will be referred to as the baseline
case.
3.2.7 Welfare effects of full à-la-carte
When offering channels à-la-carte it is not the WTP distribution for the bundle that has to be
estimated, but the WTP distribution for each individual channel since consumers now are free
to choose their preferred channels. Because of this the article authors have taken numerous
new assumptions that must be explained.
The model opens for the fact that a proportion of consumers can have a WTP at zero for some
channels offered. Some households never watches sport networks like ESPN and would not
pay anything for that channel, while others might have no interest in subscribing to the Disney
Channel. For network only a portion of households, , will have a positive WTP while the
remaining proportion of the population, , value the network at zero. Among the
consumers with a positive WTP it is assumed that the taste for each network is distributed
independently and follows a lognormal distribution3 with location parameter and a shape
parameter .
On the cost side there are strong reasons to believe that there would be a fundamental change
in affiliate fees from the baseline case if the market instead was unbundled. In a Kagan Media
Research report it is estimated that “TV channel operators would need to raise per-capita
channel carriage fees by a multiple of four to offset a 50% loss of subscribers from big basic
bundles” (Kagan Media Research, 2005). Furthermore, it has been estimated that the cable
distributor in Monterey gets a 9% discount on affiliate fees when assuming that the marginal
costs are 28% of the bundle price. The reason for this discount is the bargaining power
Comcast has, being the country’s largest distributor. Because of this, the obtained market data
on affiliate fees has been multiplied by a factor of 0.91 to make the simulations more accurate
in the Monterey market.
3 In other words, the logarithm of the WTP’s are normally distributed. It has been shown that the household income distribution in many countries is consistent with a two-parameter lognormal function for the low-mid income group (Clementi & Gallegati, 2005). Therefore it makes sense to do the same with the reservation prices which are closely connected to income.
SNF Working Paper No 19/13

33
To find the WTP for the individual channel the article authors assume the mean WTP to be a
multiple of the estimated affiliate fee (cost) charged by each network i.e. .
In the case of full à-la-carte the total price a consumer have to pay for all the channels is much
higher ($78.54) than the previous bundle price for the same channels ($44.05). However, the
number of consumers purchasing every single channel under à-la-carte will be very low.
Therefore it is expected that many channels, by definition all of them, will lose subscribers as
a result of the new policy.
3.2.8 Channel Exit
In the article the welfare effect is measured under two different assumptions, the first
assuming that all channels are still being offered and the second that opens for channel exit.
It does not come as a surprise that consumers are much better off under à-la-carte, assuming
no channel exit, with an increase in the per-household consumer surplus by 65.6%. At the
same time it is easy to understand the firms’ unwillingness to introduce this policy with a
predicted 44.2% decrease in gross profit. Overall this drastically different allocation of
surplus results in a total welfare loss of 7.4% compared to the baseline bundling scenario.
On the long term though, the pricing strategy can potentially affect which products that are
supplied in the market. Especially interesting is the result of a pricing policy change in the
television market. The industry claims that unbundling the market will drastically reduce the
number of channels available in the market and at the same time increase consumer costs
(Booz Allen Hamilton, 2004). What will happen with the number of channels when there is a
shift from the bundled world that is observed today, to a market where every channel can be
picked individually? Crawford and Cullen also investigate this in their 2007 study.
One effect of à-la-carte could be that some channels, though still adding to the aggregate
consumer surplus, could exit the market affecting consumer welfare on the long term. This
effect of à-la-carte has been addressed in the study by calculating the profit for each channel
under à-la-carte and then looking at how many channels that could exit before bundling would
give higher consumer surplus than à-la-carte. In fact 41 out of 50 channels in the market
would have to exit for this to occur something that seems very unlikely to happen. Therefore
the à-la-carte scenario, even when considering the impact of network exit, seems to improve
consumer welfare and reduce firms’ profit to a high degree, based on this study. Though, as I
SNF Working Paper No 19/13

34
will discuss further, there are a number of reasons why the study might be of low predictive
value.
3.2.9 Robustness
The model is very simplified and relies on a few strong assumptions for the results to be valid,
especially about the nature of fixed and marginal costs. Furthermore, the model does not take
into consideration competition between cable and satellite television which surely is an
important factor in this market. In fact, it does not take competition into account at all because
of the monopoly assumption which I have questioned earlier.
The potential effects the à-la-carte policy would have on advertising revenues were not taken
into consideration either. I expect the advertising revenues to be approximately a linear
function of the time households spend watching the channel. If 50% of households drop the
channel, the advertisers would surely want to renegotiate the terms with the channels.
Although insightful, I would argue that the 2007 model gives more insight on a few
theoretical aspects of introducing à-la-carte rather than providing a practical result applicable
to all television markets. The model also incorporates a few reasonable assumptions, and can
therefore provide a basis for further research. It goes hand in hand with the general bundle
models when it describes the positive effect unbundling will have on the consumer surplus.
The dataset is limited to just one geographical area in the US, and as we all know, the
demographic dispersion in the country is very high. In my opinion, it is more than likely that
areas with different demographic compositions also will have different distributions of the
channel reservation prices. The model can therefore not be generalized to the whole market.
In fact, this might not be such a big problem in Norway, but more on that later.
When it comes to the input cost estimation, it is very unlikely that the marginal costs are
simply a constant multiple (0.28) of the observed subscription price. Furthermore, the market
discount in Monterey for the big distributors is not necessarily the same across markets. The
most important, and most unrealistic assumption in my opinion, is the assumption of
unchanged input costs after a policy change. On a short term basis one could imagine that the
affiliate fees paid per subscriber would not change, but they would surely change on the long
term. It is unrealistic that channels would charge the same prices as under bundling if they lost
50% of their customers under à-la-carte. Most likely the affiliate fees would be renegotiated.
SNF Working Paper No 19/13

35
All these issues raise questions about the model’s predictive value for the US and other
television markets. I would say that the model is at its most helpful in the discussion of the
assumptions taken. These assumptions outline what must be improved in future framework in
order to predict welfare consequences more accurately. In the next section, I will present a
new model that emerged, partly, from the model above, but which also tries to deal with many
of these issues.
3.3 The 2011 Industry Model (Crawford & Yurukoglu, 2011)
In an attempt to deal with all the issues above, a much more sophisticated model was
presented in the American Economic Review in April 2012 (Crawford & Yurukoglu, 2011).
The new industry model takes into account more variables and is based on a much larger
dataset than the geographically limited 2007 model. As a result of this, one would expect that
the results are more realistic and can provide better guidelines also for other markets, like the
Norwegian.
Again the article authors seek to measure the effect a hypothetical full à-la-carte policy would
have on the US television market. Consumer, distributor and channel welfare consequences
are all analyzed and the model framework will be presented and discussed in detail in this
section of the paper.
During the discussion of model robustness in the previous section the assumptions about
static costs and lack of competition were the most important model shortcomings. Introducing
à-la-carte would definitely change the input costs and this must somehow be modeled. The
affiliate fees will change, but the question is by how much.
Crawford and Yurukoglu approach the cost issue by incorporating a different field of
economics to their model in order to find how input costs are determined. In the model, input
costs are determined in a bilateral bargaining setting under oligopoly (Horn & Wolinsky,
1988). The latter theoretical framework will not be presented in detail, but just explained
briefly in the context of this industry model. Accounting for the bargaining process, the model
will be much more dynamic because it will allow for change in input costs if a policy change
occurred. By taking competition between distributors into account, I expect the model to be
more realistic.
SNF Working Paper No 19/13

36
3.3.1 The model
The model consists of four stages. Channel conglomerates, like Viacom or TV2, and
distributors, like Comcast or Canal Digital, will first bargain bilaterally to decide input costs
before in stage two the distributors can compose bundles and set prices. In stage 3 households
purchase channels and bundles and in the last stage they watch television channels. In the
following model presentation these steps are presented in reverse order working backwards
from observed market data on ratings and viewership to observed bundle prices. Finally, the
bargaining equilibrium resulting from the negotiations between distributor and channel is
modeled using elements from game theory.
3.3.2 Household Demand
First of all the household demand for television must be estimated. The industry model
assumes that households maximize utility and that the utility function is based on a time
allocation model on the form of a Cobb-Douglas in logs. Households value time watching
television as well as time doing non-television activities and maximize total utility from this.
(1)
The vector helps incorporate the number of hours household watches channel when
they have the bundle available. Channel taste preferences are denoted and the
distribution of this will later be estimated based on the available ratings data.
For each household maximizes utility of their time
(2)
subject to
(3)
SNF Working Paper No 19/13

37
When households maximize utility the resulting indirect utility from viewing the channels in
bundle j can be found as the term
(4)
which will enter the bundle utility function along with price- and other characteristics.
(5)
The subscripts denote bundle , cable system , designated market area (DMA) and month-
year . One example could be the Family Package offered by Canal Digital in Oslo in March
2013, although the DMA variable does not apply to the Norwegian market where prices are
the same for almost all locations. This is not the case in the US market.
Households’ indirect utility will just be the first part of the bundle demand function. Each
household will have a different marginal utility of income, or in other words different price
sensitivity when it comes to the purchasing of television bundles. Some value their TV-time
high with high willingness to pay, while others watch TV just occasionally and are more
sensitive to price. The price sensitivity parameter is denoted in the bundle utility function
(and will be negative since the function is written as a sum). In more detail this can be written
as , to see the relation between the total price sensitivity for each household,
the income price sensitivity and the household income .
Which distributor that offers the bundle and in what year the bundle is being offered are some
components of . These components are therefore observed characteristics. Individual
household taste preferences for these characteristics are denoted with .
Other unobserved characteristics in the dataset affecting demand, for instance the extent of
HD-service or the quality of technical support, are denoted in two parameters. The first,
, represents characteristics that are the same for all households in the market, while the
second, , is an idiosyncratic term meant to describe individual household deviations.
Both these unobserved terms are likely to be correlated with price to some degree.
SNF Working Paper No 19/13

38
One can make a distinction between household specific utility variables and general utility
variables by separating the function and define
(6)
and
(7)
Letting be the distribution of household preferences and demographics, the market share
for bundle in market will be
(8)
3.3.3 Distributor Supply
Distributors want to maximize profit and to achieve this they will want to find optimal bundle
sizes with the corresponding profit maximizing prices.
The affiliate fees the distributor pays per channel for each household that receives the
channel is denoted and will be input costs for the distributor.
Without taking fixed costs into consideration the profit of distributor will then be the
following
Where is a list of offered bundles and are the corresponding prices to these
bundles. In other words the distributor profit will be the price of the bundle short of the sum
of affiliate fees, multiplied by the market share.
It is assumed that the observed bundles and prices in the market form a Nash Equilibrium
meaning that no party has anything to gain by changing their own strategy assuming other
parties hold their strategies constant (Pindyck & Rubinfeld, 2009).
SNF Working Paper No 19/13

39
An existing Nash Equilibrium assumes that the distributor’s chosen bundle with its
corresponding price is the optimal strategy given the strategies chosen by all other distributors
in the market. This can be generalized for all distributors in all markets , formally:
and , and maximize given and
This implies that if a distributor decides to change strategy, either modifying bundle size or
changing its price, the new profit will be less than or equal to the original bundle’s profit. The
article authors cannot prove uniqueness of the equilibrium in this game, but when doing
numerical analysis the authors do not find multiple equilibriums (which would have affected
the bargaining game).
3.3.4 Modeling the bargaining process
Before any of the above steps can be taken, distributors and channel conglomerates will have
to agree to the affiliate fees that will be paid to the channels, usually as a linear function of the
number of subscribers. It is assumed that the conglomerates bargain on behalf of all their
belonging upstream channels with the distributors (e.g. Viacom bargain on behalf of MTV
with Comcast), meaning that each channel’s payoff depend on negotiations they do not
participate directly in. This is different from early bargaining theory (Nash, 1950 and
Rubinstein, 1982) which does not incorporate the case where one agent serves several
interests at the same time. Distributors and conglomerates bargain a la Nash in this game.
The Nash Product concept (Nash, 1950) is utilized in this section, and therefore requires an
explanation. Below it is assumed that the bargaining equilibrium between conglomerates and
distributors will occur for the level of input costs that maximize the Nash Product.
Suppose a two player bargaining game where each player seeks to maximize their utility (u1
and u2) of the respective payoffs (x1 and x2) from the game. At the same time there are
outcomes that are unacceptable for each player and will result in withdrawal from the game.
The so-called disagreement point (d) will be the point where no agreement can be found and
the negotiations break down – here if the affiliate fees cannot be agreed upon. The Nash
Product can be written as the product of the excess utilities for both parties.
(10) NP =
The bargaining process is modeled as a game where the two parties determine whether to
form an agreement or not, and at which affiliate fees. These fees are simply assumed to be a
SNF Working Paper No 19/13

40
fixed amount for each subscriber. All distributors and conglomerates meet bilaterally, and in
the simulations every conglomerate and distributor meets separately and simultaneously to
negotiate.
Let
(11)
denote the input costs between each pair of distributor ( ) and channel ( ) while will be a
vector of input costs for conglomerate K. This opens for the different input costs incurred by
large and small conglomerates which are observed in the US market. I expect this to be the
case in Norway as well. Conglomerate size matters significantly when input costs are
determined. Conglomerate revenue from all distributors for all channels can be written as
(12) (
The conglomerates’ revenues come from two sources; subscriptions and advertising.
is the number of subscribers coming from distributor f for each channel c and the
total subscription revenues will be a product of this number and the corresponding affiliate
fees. In addition, the advertising revenues add to the conglomerates’ revenues. These are
modeled as a function of time spent watching each channel, , multiplied by the observed
advertising rates per household hour for each individual channel.
The Nash Product will be the following
(13) =
This is a modification of the general Nash Product (10) where is the distributor’s profit as
seen in (9) and the conglomerate’s profit as seen in (12). Remembering from above, the
equilibrium affiliate fees will be the fees that maximize the Nash Product given the set of
all other input costs . These input costs are unknown to the parties because the
negotiations are assumed to be simultaneous and separate for all market participants. At the
disagreement point, or threat point, where there is no agreement between the parties, the input
costs are set to positive infinity.
SNF Working Paper No 19/13

41
The can be seen as a bargaining parameter which helps distinguish between symmetric
and asymmetric Nash Bargaining. When there is asymmetry which means that the
payoffs from the different strategies in the game will depend on who is playing the strategy
because the two parties will have different bargaining power.
In the further simulations the bargaining equilibrium will be a result of the following
maximization
and , maximizes given
For all distributors and conglomerates the bargaining equilibrium will occur for the input
costs that maximize the Nash Product given the set of all other input costs (that are unknown,
but assumed for the players in the game).
3.3.5 The Dataset
The model has now been established, and now it is time to put it to work. I have already
mentioned that the dataset is very extensive. The data is collected for a wide range of local
television markets in the US over several years.
First of all, it is important to clarify that all the data collected in the article is not available to
the general public, and that “the exact methods used (*when collecting) are not disclosed”.
The dataset provides information on a wide range of variables both on the supply and demand
side over a significant period of time. This makes it one of the most extensive datasets in the
field of quantitative analysis in multichannel television markets. Summary statistics from the
article data are provided in the appendix of this paper.
Compared to the limited dataset from the more simplified 2007 industry model, the new
extensive dataset is much more representative for the US market as a whole. Around 25 000
system-bundle-years4 are in the sample, providing data on price, bundle composition and
number of subscribers. The average basic bundle costs $23.70 and consists of 20 channels. A
full summary of bundle composition and prices in the US is found in Appendix B.
The data does not only offer information about bundles, but also provide detailed information
for each channel. Data on total number of subscribers, affiliate fees and advertising revenue
have been collected over a period of 12 years for 120 TV channels. Detailed viewership data
4 8000 systems with their respective bundles over a period up to 10 years.
SNF Working Paper No 19/13

42
on channel level both from tuning data and survey data has also been collected (Appendix C)
which in total gives a realistic input to the industry model.
3.3.6 Parameter Estimation
After the industry model has been specified and the data collected, all parameters have to be
estimated before the welfare predictions can be done in the final step. These parameters are
related to household channel preferences, the input cost function and the bargaining process.
The next section will in detail present the parameter estimates together with the logic behind
the estimates, provided in the framework.
In the estimation of parameters the term moments is applied. Moments provide information
about the distribution’s shape with the mean and variance being the first- and second
statistical moment (Taraldsen, 1999). From the obtained dataset, sample moments can be
estimated, and these are used in the following estimation of the parameters. The estimation
method of moments will not be discussed further as the focus will be on the outcomes.
Channel taste preferences (
Seven moments, including mean hours watched per household per channel per demographic
group, are used in the estimation of the channel taste preferences .
The amount of time household i spend watching TV channels, , in their available bundle
j will depend on the particular household’s channel preferences which in the article is
modeled as a vector, . The distribution of the parameter γ is estimated by matching the
moments of time spent viewing predicted by the model, with the sample moments obtained
from the ratings data (which are measurements of time spent viewing at the individual and
market level).
The more simplified 2007 model incorporated the fact that some households would have a
WTP of zero for some channels, which is a realistic assumption. This must necessarily be
incorporated in the household taste parameter, in this model as well. The problem is solved
by using a vector whose components are indicator variables (taking value either zero or
one).
(1)
So that
SNF Working Paper No 19/13

43
(2)
If a household has a non-zero WTP for channel c, the indicator variable takes the value 1 and
the channel will have a positive value for the household. How large this value will be depends
linearly on observed household demographics (represented by the vector ) and some other
unobserved household heterogeneity (represented by the vector ).
Marginal utility of income ( and taste for other bundle characteristics ( )
These parameters have been estimated using linear instrumental variables regression, based
on existing work (Berry, Levinsohn and Pakes 2004 and Petrin 2003). The estimation is based
on the defined from the model’s predicted market share equation.
(3)
Briefly explained the parameterization is done by estimating from observations, and
then given estimate the parameters and from instrumental variables regression. By
using instrumental variables it is possible to deal with possible endogeneity problems (where
the independent variable is correlated with the error term) that can cause biased parameters.
(Stock & Watson, 2012). It is clear that the bundle price p will be correlated with the
unobserved characteristics (HD-service, quality of tech-support) captured by the error
term . This is likely to result in a wrong estimation of and instrumental variables are
therefore more appropriate. If the instrumental variables applied are valid (which the article
authors argues) and will be consistent.
In practice, the bundle price is instrumented with which is the average price of other
cable system’s bundles in the same geographical area. Non-price product characteristics
are assumed to be uncorrelated with the error term. This paper will not go into further detail
on the validity discussion, but will just assume that these parameters are consistent.
Cost estimation
Now it is time to parameterize the affiliate fees paid by the distributor to the channel. The
parameter is a pretty straightforward function of the channel characteristics scaled by a
function of firm and channel conglomerate characteristics. The latter will capture the relative
size of the distributor and conglomerate as well as any ownership the distributor might have in
SNF Working Paper No 19/13

44
the channel. As mentioned, it is very likely that this would affect the affiliate fees paid by the
distributor.
(4)
is the observed average input cost from the obtained dataset for channel c. The distributor’s
number of subscribers is denoted and any ownership share distributor have in the
channel is denoted (vertical integration dummy variable).
The model’s predicted aggregated input costs should equal the observed aggregated input
costs for the first moment conditions to hold
(5)
The remaining moment conditions in the cost parameterization are related to the Nash
Assumption, and will not be presented in this paper as the main focus will be on the results. A
short discussion will still be necessary.
Since the observed prices and bundles are assumed to form a Nash Equilibrium the bundle’s
optimal price should be equal to the bundle’s input cost plus a mark-up that depends on
demand conditions and other bundles in the market. This will hold in each firm in each market
given all other bundles and prices. The implied marginal cost for each bundle, , can be
found by using the previously estimated demand parameters and the observed prices and
bundles.
The next set of moment conditions implies adding a bundle-specific error term to the bundle
marginal costs and assuming that this error term is uncorrelated with the firm’s actual size and
ownership in channels. In practice bundles might be altered with, either adding or dropping
channels. With the Nash Assumption this should not occur, but it is nevertheless observed in
the market. Firms may have unobservable information about the optimal bundle composition
which could cause profit to increase if the bundle is altered with. The final assumption is that
the firm’s profit is higher for the chosen and observed bundle, than for any other bundles.
With these moment conditions and can be estimated by the method of moments.
Bargaining Parameter
The final unobserved parameter that needs to be estimated is the bargaining parameter, ,
describing the relative bargaining power between the distributor and the channel
SNF Working Paper No 19/13

45
conglomerate. Since the bargaining process ultimately results in input costs, it is natural to
estimate based on a comparison between the model’s estimated input costs and the
observed input costs. The value for is simply chosen as the value that minimize the
difference between estimated and observed costs. Of course, the agreed upon input costs will
also give information about the actual resolution point of the negotiations.
There are also other factors that influence the negotiations, like the respective parties’ outside
options if they were to pull out, but in the television market the parties’ bargaining power is
the most important parameter. This parameter is not surprisingly strongly correlated with firm
size, according to an experimental FCC report in the industry (FCC, 2002).
Due to the many variables the model has simplified the bargaining game by reducing the
number of players in the game. It is assumed that there is one large market and one small
market which are served by separate cable distributors. At the same time there are two
national satellite television firms that compete with the cable distributor in each market. This
way the number of players is been reduced to three for each market; one cable and two
satellite options. The benefit of assuming just one cable option in each market is that there is
no need to compute many simultaneous negotiations, which would require a lot of
computations. Furthermore, it is also assumed that the size of the cable system is either large
or small so that there still will be a connection between size and input costs when estimating
, thus capturing the size effect.
3.3.7 Estimation results
Given that the model is specified in a good way, and reasonable assumptions have been taken,
the results can provide much insight on the television market. With the extensive dataset the
resulting parameters and welfare effects can be relied upon. This is very useful in the section
where à-la-carte is compared to bundling. After I have presented the results, I will also here
discuss the model’s predictive value.
Household Demand
Reported in Table 3 are both the price sensitivity and the price-income interaction parameters.
The IV regression yields a significant different result from plain OLS (Ordinary Least
Square), which suggests that the IV approach gives a more accurate estimator for the price
sensitivity given that the instrument is valid. One explanation for the higher value will be that
the error term in plain OLS captures effects that the consumers value positively, like high
SNF Working Paper No 19/13

46
extent of HD-service and/or good technical support. Holding all other factors constant one
will expect a 0.5% decrease in household utility for a 1% increase in bundle price, though
such a relation in itself is difficult to interpret. It is necessary to translate this relation into
actual demand effects of changes in price rather than difficult to interpret utility effects.
The simulation results from the article suggest that there are differences in own-price
elasticity for different bundles. In most markets there are both a Basic and an Expanded Basic
bundle of TV channels, and not surprising the price sensitivity for the Expanded is higher (-
6.34) in absolute terms than for the Basic (-4.12) package. This is natural because the
expanded bundle must be purchased on top of the basic bundle in these markets. As we can
see the model estimates demand to be relatively elastic something that other work and
research in the field also finds (FCC2002, Petrin 2004).
Table 3: Estimated price sensitivity parameters (Crawford & Yurukoglu, 2011, p.24)
A summary of the estimated willingness to pay for individual channels can be found in
Appendix D, together with an example of the demographic dispersion in WTP for each of
these channels. Estimated correlations in reservation prices are also illustrated in Appendix D.
For instance, the household WTP for ESPN 2 is highly correlated with the WTP for ESPN, as
one would expect.
The simulations reflect both the ratings data (Nielsen) and the survey data (Mediamark) to a
large extent. Naturally, when the observed mean and variance of the ratings for a channel like
ESPN is high, the industry model will estimate a WTP for ESPN with the same pattern.
Input Cost
Using the model marginal cost for the Basic bundle is estimated to be $11.08, but the most
interesting will be the estimated affiliate fees for individual channels. As mentioned the
affiliate fees are estimated using the cost data (Kagan), but the model also accounts for the
distributor size and the potential ownership distributor might have in the channel.
SNF Working Paper No 19/13

47
Table 4: Estimated input cost parameters (Crawford & Yurukoglu, 2011, p.28)
Table 4 reports the impact of the three factors on the model’s estimated input costs.
Interestingly, but not surprising, both the size of the distributor (tens of millions of
households) and its potential channel ownership (percent) matters significantly to the affiliate
fees. The relation is as expected, large distributors with ownership in the channel
conglomerates face the lowest input costs. For example, the model predicts that the large
distributor Comcast faces input costs 17% below the input costs of the average distributors.
When building the model, was defined as a bargaining parameter, ranging between zero
and one, between distributor and channel conglomerate. Per definition the relative bargaining
power for channel conglomerates will be high for small values of . As one would expect
the model predicts higher bargaining power for the distributors in negotiations with small
conglomerates. The situation is reversed for small distributors dealing with large channel
conglomerates.
3.3.8 Welfare effects of full à-la-carte
The detailed framework built in this article can now be applied to answer the problem I
formulated in the introduction chapter. Crawford and Yurukoglu naturally focus on the US
market when drawing conclusions, but this paper will later argue that the model can help
understand the Norwegian television market as well.
A lot has been said about the welfare effects of bundling, and how à-la-carte would, in many
cases, re-allocate social welfare from producer to consumer. Neither of the basic literature
takes into account the bargaining process that was built into the new industry model. A
summary of the welfare measures can be found in Table 5.
SNF Working Paper No 19/13

48
Table 5: Baseline results: Full à-la-carte with and without input cost re-negotiations (Crawford & Yurukoglu,
2011, p.32)
The idea of unbundling does indeed have major consequences in the television market, also
indicated in the more simplified 2007 study. The simulations have been conducted on two
different scenarios, one that assumes there are no re-negotiations after unbundling, and one
that does take this into account. Results are reported in dollars (year 2000) and percentages,
but for the rest of this section the main focus will be on the percentage changes. Some of the
changes that are reported are close to zero, but given the large dataset even small percentage
changes can be statistically significant.
No re-negotiations of affiliate fees
When there are no re-negotiations of the affiliate fees, these fees will be the same as under the
bundling alternative. The results are very similar to the outcome of the 2007 model. The
industry model predicts that consumers on average will get rid of around half (48.5%) of the
channels that were in the original bundle. Without the re-negotiations this will result in a
23.8% decrease in consumers’ television expenditure. Consistent with theory presented earlier
in this paper, the consumer surplus under à-la-carte will increase. On average, each household
experiences an increased consumer surplus of 19.2% when they are allowed to choose
SNF Working Paper No 19/13

49
individual channels. Since the affiliate fees cannot be re-negotiated the channel profits from
these fees will decrease dramatically (50.4%), on par with the reduced consumer viewership.
Some of the channel profits though are recovered through increased advertising revenues
which are assumed to be a linear function of the channel viewership. In other words, today’s
advertising revenues are multiplied by the percentage change in viewership caused by the new
à-la-carte policy. On the whole, channel profits will decrease almost 23% under à-la-carte
with no re-negotiations. Distributors are actually better of under à-la-carte (13%). In total the
effect on consumers, channels and distributors is a slight increase in total surplus of 4.1%,
compared to the baseline bundling scenario.
Re-negotiations of affiliate fees
The first scenario is somewhat unrealistic in the television market because the affiliate fees
will most likely be re-negotiated when consumers change their behavior, as described earlier.
Television channels would not accept the same affiliate fees, which dramatically reduce their
profits, under à-la-carte if the model’s prediction is right. Because of this, it would be more
realistic to allow for re-negotiations of the affiliate fees when simulating the welfare effects.
It is assumed that the in the new equilibrium distributors will set the à-la-carte prices equal to
the affiliate fees and then charge fixed fees for access to their platforms. Again this is done for
computational reasons, and will only affect the distributors’ profits. From the dataset the
article authors have found margins of 5-10% on the affiliate fees, and in calculating the
distributors’ profit this markup will instead be reflected in the fixed access fee giving
approximately the same result.
In Appendix E the welfare measures for each individual channel are given. Remember that
also under à-la-carte the distributor will have to pay the channel on a per-subscriber basis.
Because of this one would expect a large increase in the fees since the number of subscribers
for all channels will decrease when unbundling.
As expected, the second scenario has major consequences for the affiliate fees. Under à-la-
carte the affiliate fee for Comedy Central are predicted to be 187.5% higher than under the
baseline bundle scenario. The predicted changes in costs fluctuate wildly from channel to
channel, which naturally affect profits. Similarly, the effects on revenue are drastic where for
instance CNN are predicted to increase revenue by 144% whilst Disney Channel are predicted
to reduce revenue by almost 60%. These effects are driven by the consumer heterogeneity that
under à-la-carte takes into effect. Overall the affiliate fees are expected to increase by 103%
SNF Working Paper No 19/13

50
when allowing for renegotiations, but since the number of subscribers changes under à-la-
carte the overall channel revenue effect is barely positive with a 2.6% increase. Nevertheless,
this is a drastic change from the no re-negotiations scenario where channels were much worse
off.
Under the second scenario consumers cannot expect a big difference in their expenditure. In
fact the model predicts an overall increase of 2.2% in expenditure, even though consumers
subscribe to fewer channels (19.3). Compared to the baseline bundle scenario, consumer
surplus is unchanged which should be very interesting for policymakers. Consumers will have
to face much higher input costs reflected in the subscription prices and will in fact spend a
similar amount of money on fewer television channels.
Overall the second scenario predicts a slight increase in total social surplus of 2.4% with the
distributors and channels benefiting the most from the new policy. The outcome of these
simulations is very interesting to say the least. It contradicts much of the fundamental
bundling theory, and actually suggests that distributors are better off under à-la-carte.
Consumers experience the same consumer surplus, as under bundling, but will have access to
about half of the channels from the original bundle. The main reason for the new results is the
strong assumption taken in the earlier models of fixed input costs. In the television market this
is highly unlikely and by adding the distributor-channel bargaining game the model becomes
much more applicable to the television market.
3.3.9 Robustness
I will now briefly discuss possible weaknesses of the model, and explain why I conclude the
model can provide accurate results in the television market.
First of all, I find the 2011 industry model to be much more realistic than all the previous
models because more market specific variables are taken into account. Competition and the
channel conglomerates are addressed and most importantly, the simulations allow for changes
in costs thereby making the model much more dynamic. Of course, the extensive dataset also
makes sure that the outcomes are accurate for the US market and that the model predictions
must be taken seriously.
When it comes to the demand side I think the bundle utility function is reasonable. It seems to
incorporate the most important factors which the consumers value. Nonetheless, the time
allocation function is a simple approach, and might be insufficient to predict utility from
SNF Working Paper No 19/13

51
channels that households value high, but do not watch a long time. Typically this will be the
case for sports channels with a few big events per month. However, if this is incorporated the
model would be much more complex, and I think the approach taken in the model is fair.
Crawford and Yurukoglu also point this out, and argue that the errors caused by these “time
versus value” issues cancel out in total and that the overall welfare predictions will be
accurate.
Furthermore, I would suggest dividing the two error terms in order to separate different utility
effects. In my opinion there is a consumer trend to demand better platform technology, for
instance higher capacity and speed. It would be interesting to measure the utility effect of this
factor, even if it increased the model complexity.
On the cost side the dynamic approach allowing for re-negotiations is the only realistic
assumption in my opinion. The results from the first scenario are therefore questionable and
cannot be used by policymakers. The bargaining game is a good way to add dynamics to the
model, but there are still some weaknesses with its design.
First of all, the model takes an important assumption about information asymmetries, and in
fact ignores the possible existence of these asymmetries. Once the negotiations have started
the players in separate games cannot coordinate with each other, something that seems
unrealistic in practice. Another weak assumption that might not hold in practice relates to the
result of disagreement between distributor and conglomerate. Every channel conglomerate is
treated as a block of channels meaning that the result of a disagreement would be that the
distributor would lose access to all channels from the particular conglomerate. The message
would be that either you get the rights to all channels or no channels without exceptions. In
practice it would be more realistic to assume that the parties could agree to the distribution of
a portion of the total channels even if they could not agree to the whole package. This would
especially be the case if the conglomerate represents both advertising funded channels and
premium channels. Later I will discuss how different types of channels often can call for
different bundling strategies.
Even with its simplifications in mind, I think the bargaining game is a good way to account
for competition in the market. Crawford and Yurukoglu found that the welfare measures were
very sensitive to the bargaining game outcome, but I believe that the assumptions taken about
costs are realistic. I think the bargaining power and the degree of vertical integration are the
SNF Working Paper No 19/13

52
most important determinants of the distributor input costs. Both these factors were
incorporated in the model.
Earlier, I mentioned how the monopoly assumption was unrealistic in this setting, and now it
will be easier to measure the effects actual market participants will experience under à-la-
carte. Most importantly the model becomes more dynamic with respect to changes in input
costs under à-la-carte.
With the large dataset and the much more realistic approach compared to the basic
framework, I have confidence in the model’s predicted results. Still it should be noted that the
industry model is meant for short to medium term use. With a longer time perspective some
channels could change their profile or even exit the market while new channels could enter
the market. This would affect the welfare measures on the long term.
4 The US and Norwegian Markets for television
I will now give a short overview of how the Norwegian market for television relates to the US
market. This discussion will be closely linked to the two market specific models and their
assumptions, but I will first present the Norwegian television market. After I have given the
market presentation I will go on and discuss to what degree the 2011 industry model has any
predictive value in the Norwegian market, or if it must be modified. Finally, I will suggest
some modifications to the model, if it were to be applied on the Norwegian market. Some of
these suggestions will be based on recent trends in the television market.
4.1 Overview
Similar to most television markets, there are also three important forces in the Norwegian
market. Consumers, channel conglomerates and distributors participate in the same market
space under similar regulations as in the US. I will now present each of the market
participants, and outline important similarities and differences between the two markets.
4.2 Households and preferences
The total number of TV-subscribers, usually households, in Norway is around 2.2 million
(PT, 2013). Compared to the US, with its more than 100 million subscribers in 2010 (FCC,
2012), this number illustrates the huge difference in market size.
SNF Working Paper No 19/13

53
Other than the size there are many differences between the two markets when it comes to the
demand side. USA and Norway have a very different demographic composition of people.
There is no doubt that the cultural differences are bigger in the US, and that the Norwegian
population are quite homogenous in comparison. One would expect that the consumer taste
heterogeneity is even higher in the US because of this, and if this is the case, bundling could
be more profitable there than in Norway. Having said this, I cannot with certainty conclude
that consumer tastes vary between the markets on an aggregated level. Also, as the
globalization continues, the demographic differences between the countries should diminish
over time.
In the 2011 industry model designed for the US market, the bundle utility varies both with
location and demographic characteristics of each household. Furthermore, every state in the
US has the opportunity to regulate the prices of the basic bundles as well as imposing
different taxes on these bundles (FCC, 2013). This is not the case in Norway. I would not say
that location matters for the household utility of a bundle in Norway, but I see how this can be
the case in the US. For instance, the median household income in Maryland is almost twice as
much as for Mississippi households (US Census Bureau, 2012). One must expect that
Mississippi households are more sensitive to price than their Maryland counterparts. Nothing
compares to this in Norway, even if there are some small regional differences.
In other words, while Norway more or less can be seen as one integrated market, USA
consists of many markets with different regulations and where consumers’ purchasing power
differ to a significant extent. As a result of this, the prices vary between markets and bundles
are often composed differently depending on location even if the bundle is provided by the
same firm.
The preferences for specific distributors, represented by , does not seem very significant for
the household utility in Norway. Overall, only 14% of households report that they are
unsatisfied with their specific provider (Kulturdepartementet, 2011). Furthermore there does
not seem to be a pattern between the providers when it comes to consumer satisfaction, except
for Altibox who enjoys higher reported satisfaction (Norsk Kundebarometer, 2012). In line
with my expectations, it is the bundle composition itself that adds utility to households as well
as the additional services, not by which firm the bundle is provided. Altibox probably benefits
from their more advanced technology. To implement such a “technology factor” in the model
could be useful because I think it is the platform technology, rather than the particular firm,
SNF Working Paper No 19/13

54
that adds to the households’ utility. Of course this factor can be seen as an observed
characteristic entering the first error term, but in my opinion it would be best to separate
technology preferences from the pool of other characteristics. In this way, it would be easy to
measure its specific effect on household utility and demand. The trend in the market is that the
technological platforms gets more and more important to consumers as the extent of online
streaming services increase. My guess is that fiber technology will have positive effect on
utility compared to ordinary cable.
Finally, I expect that the time allocation function (Cobb-Douglas) used in the industry model
to estimate viewership utility is suitable also in Norway. Norwegian households will in the
same way maximize their utility of watching channels given their available bundle. If I
assume that Norwegians and Americans value their television time the same (with the same
Cobb-Douglas function), the household utility functions on the aggregate will not differ too
much.
However, when using the time allocation function, it must be assumed that the time watched
television reflects the willingness to pay for the subscription in total, and for each channel.
This can be questioned, especially for expensive channels carrying big sports events which
consumers value high, but do not watch more than a few events.
Even though I have outlined some certain and possible differences, the industry model
specification of household utility provides a decent match to Norwegian households. One
advantage with having one integrated market and a more homogenous population, in this
setting, will be that the potential simulation results in Norway can more easily be generalized
to the whole market.
4.3 Distributors
I will now look at the distributors with two main talking points. First, it is important to discuss
which platform technology that is used, and whether there are significant differences between
the two markets in technology. Also, any differences in the observed bundle characteristics
between the markets must be discussed.
Both in the US and in Norway there are a few major companies that distribute channels to a
large share of households. As I mentioned earlier, the monopoly assumption taken in many of
the previous models is therefore unrealistic. Only in the 2011 industry model, downstream
SNF Working Paper No 19/13

55
distributor competition was incorporated and therefore I will relate the discussion to this
model in particular.
4.3.1 US and Norwegian Distributors and Platforms
When I have talked about the profit maximizing firm in the more general models, I have
really talked about the television distributors. These are the companies that decide bundle
composition and prices. In Table 6 the market shares of US television distributors are noted,
with Comcast being the largest distributor in the cable market, and DIRECTV the largest
satellite provider. Time Warner also enjoys a significant market share in the cable market, but
after the two big nationwide distributors (which also are part of the so-called big six media
conglomerates) the market is more fragmented with many smaller distributors. There are only
two satellite providers in the US of any significant size; DIRECTV and DISH Network. In the
table below, an overview of the cable and satellite markets in the US are given from a few
years back. The cable platform on aggregate observes a decline in subscribers, while satellite
providers experience an increase.
Table 6: Number of customers (households) for multichannel video programming distributors (MVPD) and
platforms in the US (Millions), (FCC 2012, p60)
There are not that many major distributors operating in Norway either. In the cable market
there are two main distributors, Canal Digital (Telenor) and Get, which had a combined
market share of more than 90 % on the cable platform at the end of 2012 (PT, 2013). Adding
Canal Digital’s satellite service, the firm has an aggregated market share of 45.9% in the
whole television market. Get, who only operates on the cable platform, has a market share of
17.1%. RiksTV, with their digital terrestrial television (DTT) platform, enjoys a market share
SNF Working Paper No 19/13

56
of 13.1% while Viasat’s satellite service accounts for 6.7% of television subscribers. Altibox,
which distribute their service through local fiber providers accounts for around 14% of the
market as of 2012.
Fig 8: Share of customers for different television distributors in Norway (percent), (PT, 2013)
The different platforms seem to have approximately the same share of consumers in Norway
(Figure 9) and the US. Fiber is not as common in the US as of yet.
SNF Working Paper No 19/13

57
Fig 9: Number of subscribers for different distribution platforms last 4 years (percent) (PT, 2013, p67). (Digitalt
Bakkenett - DTT).
The simplifying assumption in the industry model of just two national satellite providers
seems reasonable, both in the US (DIRECTV and DISH Network) and in Norway (Canal
Digital and Viasat). This assumption was made during the bargaining parameter estimation in
the negotiations, in order to reduce the computational complexity of having too many
simultaneous negotiations. In fact, there are not that many players in the real world game
either, so the model assumptions are reasonable. A final observation is that, unlike Norway,
there is an increasing amount of subscribers to satellite television providers in the US. In
Norway the trend is reversed, possibly because of better cable and fiber infrastructure.
4.3.2 Bundle composition and prices
All the distributors in the market offer some sort of bundle in line with what theory predicts,
and full à-la-carte is non-existent.
SNF Working Paper No 19/13

58
Table 7: Selected bundle prices in the US (FCC, 2012, p58)
Actually there are differences in the basic bundle compositions and prices in the US seen from
Table 7. The satellite distributors evidently offer a higher number of channels for the same
price as Comcast. I will not go further than to say that the extra channels offered on satellite
are likely to be niche channels from other countries with low mean valuations and affiliate
fees. Therefore I assume that the basic bundles for the large distributors are similar both when
it comes to valuation and costs. Even though there are differences between bundles, Crawford
and Yurukoglu argue that the US market is in a Nash Equilibrium. I will discuss how
reasonable this assumption is in the Norwegian market soon.
Below is a comparison of the basic bundles offered by the six largest distributors in the cable-,
satellite- and digital terrestrial television (DTT) markets in Norway.
Table 8: Selected bundle prices in Norway. (Providers websites, May 2013)
When it comes to bundle composition in Norway, the differences are very small. Get and
Provider Technology Bundle Price per month(NOK)
Canal Digital Cable "Basic" 359
Get Cable "Basic" 359
Altibox Fiber Optic Cable "Basic" 379
RiksTV DTT "RiksPakken" 379
Canal Digital Satellite "Family" 378
Viasat Satellite "Folkepakken" 299
SNF Working Paper No 19/13

59
Canal Digital offers almost the exact same bundle at the same price with only a few differing
channels (Providers Websites, 2013). As mentioned, the industry model assumes that
observed bundle compositions and prices form a Nash Equilibrium. Given Canal Digital’s
bundle, Get has nothing to gain by changing the composition or price of their own bundle. In
fact, by changing the bundle, Get would get a reduction in profit with this assumption.
Looking at the bundles and prices, I think it is fair to assume a Nash Equilibrium also in
Norway. The providers seem to follow closely their competitors’ actions and this is reflected
in the similar prices and bundles. Even though the bundles differ a bit more across the three
platforms (e.g. RiksTV does not offer SVT2 and Eurosport2 compared to Altibox), the
platform penetration is so high that all distributors seem to participate in the Nash game. If
one firm could add to its profit by changing bundle composition or price, it would already
have done so.
It should be noted that all the bundles offered are not entirely equal, and the Viasat bundle
consists of less channels than the others. In addition, Modern Times Group-owned Viasat is
not only a distributor, but also a producer of content through own channels like Viasat4. Their
business model may be different as a result of this, something that also could explain the
deviation from the average bundle market price.
4.3.3 Other Bundle Characteristics
The extent of HD-service varies between distributors, and the cable companies all offer
broadband service at a discounted price for their TV-subscribers. About 41% of cable
consumers in Norway report that they have a “double-play” subscription with both television
and internet (Kulturdepartementet, 2011).
Consumers value such additional attributes as well. I would say that these attributes will have
increasing importance as new technology change how people consume television. Other than
Internet connection, examples of additional services provided are Viasat, who offers their On-
demand Web-TV service, Viaplay, free of charge to their subscribers. Canal Digital offers a
similar service, Canal Digital Go, which was introduced recently (Providers websites, 2013).
In the industry model these additional attributes enter the consumer utility function in two
terms (one common for all households, , and one household specific, ).
Crawford and Yurukoglu argue that the additional attributes will be correlated with price, but
in my opinion this is not necessary the case in Norway as of now. In my opinion, prices seem
SNF Working Paper No 19/13

60
to be driven by competition more than by consumer value. For instance, cable technology
allows for internet services, like movies on demand, unlike DTT and Satellite, but this is not
reflected in the prices for television bundles. It is interesting to note the small price
differences in general and across platforms which indicate a high level of competition. An
independent report prepared for the Norwegian Ministry of Culture (Kulturdepartementet,
2011) concludes that the observed level of competition across platforms partly can be
explained by the increasing platform penetration in Norway. More and more households now
have several options when choosing their television provider. Particularly, the fiber optic
cable infrastructure, which allows for higher speed and capacity, has been built rapidly over
the last years. As a result of this, Fiber has captured market share from both the Cable and
Satellite platforms.
4.3.4 Distributor Input Costs
The next step will be to discuss the affiliate fees, , paid per subscriber from distributor to
the channel conglomerate. In the industry model, these fees are the result of the bilateral
negotiations between the distributors and the channel conglomerates. It is fair to assume that
the affiliate fees in Norway, also for historically advertising funded channels, are a linear
function of the number of subscribers (E24, 2013).
Both the market specific models suggest that large distributors will get a discount on the input
costs as a result of the bargaining power. Comcast was predicted to get a 9% and a 17%
discount respectively by the two models. I think it is fair to assume that the bargaining power
is a function of the number of subscribers for each distributor. I would therefore expect that
also Time Warner, DIRECTV and DISH Network all have significant bargaining power, but
still less than Comcast. In Norway, I will expect Canal Digital and Get to get a discount
compared to the other distributors.
It is important, however, to remember that the model bargaining parameter measures the
relative bargaining power between distributor and conglomerate. In other words, the
parameter will not be a fixed number for each distributor, but different depending on which
conglomerate the firm negotiates with. Because of this, it is also important to have an
understanding of the different television channels and channel conglomerates in the US and
the Norwegian markets.
SNF Working Paper No 19/13

61
4.4 TV Channels
In Norway there are basically three different types of channels. Within the commercial market
there are two main categories of channels; the advertising based channels and the premium
subscription channels. After a short description of these I will give an overview of channel
conglomerates in the US and in the Norwegian market. I will also come back to the third
channel category, the state owned non-commercial broadcaster NRK.
4.4.1 Advertising funded programming
Historically advertising funded programming have had low distribution costs for the
providers, but recently conglomerates have started to demand higher affiliate fees. This has
led to bitter conflicts between distributors and conglomerates (VG, 2012). In a Norwegian
case, Canal Digital and the TV2 Group could not negotiate a deal for the TV2 niche channels.
As a consequence, the niche channels had to be removed from the basic bundle, in fact from
the whole portfolio of channels Canal Digital could offer. The parties agreed in May 2013 and
are now friends again.
The channels in this category will have two main sources of revenue; advertising revenue and
subscription fees. This goes well in hand with the channel revenue function derived in the
industry model. I expect that all advertiser funded channels operating in Norway also receive
a linear affiliate fee, even though distributors are reluctant to share information on this matter.
In other words, I assume that pure advertiser funded programming is nonexistent in the
Norwegian market. Even if such channels existed it would not have implications for the
model framework, but simply make the last term in the conglomerate profit function zero.
The industry model incorporates both sources of revenue which is very important to get the
right results. Advertising revenues were modeled as a linear function of household time
watching television which is the most practical way of dealing with these revenues. In my
opinion, this can be a problem for the high valued channels which at the same time are not
watched many hours, which can be the case for sports channels as described earlier. The
opposite could occur for news channels like CNN, which can be watched more passively than
live sporting events, for many hours. If the average advertising rates for every channel reflects
these issues the modeling should be accurate, and data material is limited on these figures.
Also, modeling the advertising revenues can be subject to whole studies in itself so I see the
point of the simple approach taken in the study which helps reduce complexity.
SNF Working Paper No 19/13

62
4.4.2 Premium programming
Premium channels are the second category of commercial programming and exist in most
markets. Prominent examples are HBO in the US, and CMORE in Norway, both producing
various content on their platforms. These channels are ad-free, based on subscriptions, and not
part of basic bundles. Households must purchase these channels on top of their basic bundles.
Because I am more interested in the profitability of bundling I will not go into much detail on
this category of channels. In my opinion, it is very unlikely that the premium channels, in
today’s form, will ever enter a basic bundle since they often target a specific crowd like film
enthusiasts or football fans. Earlier, I mentioned how Bakos and Brynjolfsson argued that
marginal costs could make bundling unprofitable. This would be the case especially if the
marginal costs were high compared to the mean valuation for the product, which is the case
for most premium channels. It will be better to sell the channels individually (or in theme
tiers) in order to exclude the households that value the channels less than the marginal cost.
Premium channels are not addressed in the 2011 industry model, and since a Nash
Equilibrium is assumed, changing the basic bundle composition to include such channels will
not be discussed further.
4.4.3 NRK (Norwegian Broadcasting Corporation)
One very important difference between the US and the Norwegian markets is the presence of
the state owned NRK in Norway. All households that own a TV have to pay a significant
license fee, set by the Norwegian Parliament every year (2680 NOK, NRK, 2013) to finance
NRK.
I expect the bundle price sensitivity of consumers to be affected by this fee, and therefore the
distributors will have to take this into account in their strategies. Within the industry model
framework it can be discussed whether or not NRK can be seen as an expansion of the bundle
where the license fee simply enters the monthly subscription fee for the bundle. I think this is
fair to assume, even though many consumers do not think of the access to NRK as a monthly
subscription the same way as other channels. If this assumption is right the presence of a
license fee will not alter the price sensitivity parameter, but just increase the monthly
subscription price for households. In a Norwegian setting it is therefore necessary to portion
out the license fee over the 12 months before simulating household demand. Finally, I expect
the price sensitivity of households to be higher relative to the other attributes in the utility
function compared to the US as a result of the license fee.
SNF Working Paper No 19/13

63
4.5 Channel Conglomerates
To better understand the industry model bargaining game, an overview of the content
producers must also be given. There are close connections between some of the distributors
and channels in the US. The content producers have been noted as channel conglomerates
throughout this paper as the market consist of media conglomerates both in the US and in
Norway. First, it is useful to show a summary of viewership ratings in USA (Table 9) and in
Norway (Table 10) to get an impression of the size of each channel. Note that the available
data is measured differently, but it will still be easy to see the major differences.
Table 9: Average viewership ratings top 15 channels in USA 2012 (millions of viewers primetime) (Nielsen
Company, 2012)
Clearly there are many channels that compete for ratings in the US. This has most likely to do
with the demographic dispersion in the country and the fact that more channels can survive
when the market is big. The term critical mass can be used to describe the number of
subscribers a channel needs in order cover fixed costs and to survive as a channel. It is fair to
assume that the fixed costs in the US and in Norway are similar, but the different market sizes
will make sure that more channels can survive in the US. From the table, it is apparent that the
market concentration in USA is low compared to Norway. Finally, it is important to note that
many of the channels above are part of large media conglomerates. For instance are Disney
Channel, ESPN and ABC all owned by the Walt Disney Company (Walt Disney, 2013).
Channel Avg Millions of viewers primetime
USA Network 2.98
Disney Channel 2.47
ESPN 2.21
History Channel 2.19
TNT 2.18
Fox News Channel 2.03
TBS 1.97
Arts & Entertainment 1.63
Adult Swim 1.45
FX 1.44
ABC Family Channel 1.35
SyFy 1.34
Discovery 1.29
Food Network 1.24
Lifetime 1.20
Total 26.97
SNF Working Paper No 19/13

64
The situation in Norway is very different illustrated by the table below.
Table 10: Market shares most watched channels Norway 2012 (PT, 2013)
In the Norwegian market there are two very important channel conglomerates, if the industry
model’s terminology is to be used. The TV2 Group to begin with is the largest commercial
channel conglomerate in the Norwegian market. In 2012 the total market share of the
conglomerate’s channels measured in viewership was 25.5%. NRK and the TV2 Group have a
total market share of 66.7%, coincidentally two thirds in 2012, which in turn illustrates the
high market concentration. NRK cannot really be compared to the other conglomerates in this
setting though as NRK is non-commercial and therefore does not seek to maximize profit.
4.5.1 Cross Ownership
Several companies in the US are both distributors and content producers at the same time.
Comcast and Time Warner, the two largest cable providers in the US are subsidiaries of two
of the largest media conglomerates in the world; NBC Universal/Comcast and Time Warner
Inc. These firms are also big in content production which means that they also own many of
the channels that are offered in their bundles. For instance, NBC Universal/Comcast also
owns 26 television channels in the US, among others CNBC and Bravo (Comcast, 2013).
Time Warner, on the other hand, has full ownership in the premium network HBO and in the
news channel CNN among many other holdings (Time Warner, 2013).
Channel Market share(%)
NRK1 31.9
NRK2 5.3
NRK3/Super 3.9
TV2 19.3
TV2 Zebra 2.3
TV2 Nyhet 2.0
TV2 Film 0.6
TV2 Bliss 1.3
TVN 7.6
FEM 2.2
MAX 2.4
VOX 1.0
TV3 4.4
Viasat 4 2.6
Others 13.0
Total 100
SNF Working Paper No 19/13

65
The media cross ownership that is observed in the US is more extensive than in Norway.
While the largest distributors in the US, Comcast and Time Warner, also produce content,
their Norwegian counterparts, Canal Digital and Get, are dedicated distributors. One
exception in the Norwegian market is the 33% ownership share the TV2 Group has in the
DTT distributor RiksTV. This could possibly affect the input costs of RiksTV for TV2
channels, but since the ownership share is not higher, I think it can be assumed that this effect
is either small or non-existent. The difference between the two markets can have implications
for the model’s parameters and its predicted input costs.
The industry model explicitly addressed the cross ownership by adding a vertical integration
variable, , into the input cost function. In my opinion, cross ownership relations between
distributors and channel conglomerates in Norway is so rare that this factor is unnecessary. Of
course, this dummy variable would take the value zero, but I still want to point out that it is
almost entirely redundant in a Norwegian setting. I think the small degree of cross ownership
is one of the reasons for why the bundle prices between distributors are so similar. I suspect
that the input costs for distributors is more even, and that no firm experience the large
predicted discount of 17% Comcast enjoys in the US. The bargaining parameter is therefore
the decisive factor in Norway affecting each distributor’s input costs.
4.5.2 Relative Bargaining Power
In the section about distributors I discussed how important the relative bargaining power
between distributors and conglomerates was for the input costs. However, it is not only the
size of the distributor that matters, but also the size of the conglomerate. I therefore expect the
TV2 Group to have high bargaining power relative to the smaller distributors. The
disagreement between Canal Digital and TV2 which led to the parties’ withdrawal from the
negotiations illustrates this. While all the other smaller distributors could negotiate a deal with
TV2, Canal Digital could not. In my opinion the disagreement was a result of the more evenly
matched parties when it comes to bargaining power. While small distributors and
conglomerates must take the prices as given, bigger parties can negotiate better deals because
they are more powerful representing a larger number of customers. The bargaining power
parameter is clearly present in the Norwegian market as a function of the number of
distributor customers or channel viewership. I do not expect the estimated parameter to differ
much from the US market. Because of this, each distributor’s input costs should be a similar
function of the observed average affiliate fees.
SNF Working Paper No 19/13

66
5. À-la-carte in Norway
Now I will turn my attention to the two policy alternatives; pure bundling and à-la-carte. This
is the last section of this paper, and I will present the distributor and consumer consequences
of a policy change. Furthermore, I will discuss how recent trends in the television markets can
affect the model’s predicted effects. Finally, I will come back to the problem formulation I
started with. What are the effects of bundling in this market, and what should be preferred by
firms and consumers? Here, I will sum up why, based on the bundling framework, I believe
the à-la-carte policy will neither benefit distributors nor households in the long run although
the distributors can profit from à-la-carte under some assumptions
5.1 Welfare effects of à-la-carte
The first market specific model predicted that consumers would be better off under full à-la-
carte by a staggering 65.6%. Distributors would on the other hand experience a 44.2%
decrease in profit. This goes in line with the basic models, which all suggest that producers
extract more consumer surplus under bundling. The main problem with this result is the short
time perspective. As I outlined, the market assumptions taken were not realistic, especially the
static input costs and the fact that no channel would exit the market. There are too many
doubtful assumptions in the first model so I cannot conclude with the effects of à-la-carte.
The second model is much more dynamic and realistic also in the Norwegian setting. In
addition, the two markets do not differ on critical assumptions taken in the model. Even
though there are differences when it comes to demographic dispersion, distribution
technology and the extent of cross-ownership the markets are similar in many ways. I would
actually say that it is easier to navigate in the less complex Norwegian market. The industry
model should therefore be at least as predictive in Norway as in the US. It is important to note
that the market differences will affect the estimated parameters, but not the model framework
itself.
I have presented the complete US simulation results from the industry model earlier, but a
summary can be found in Table 11.
SNF Working Paper No 19/13

67
Table 11: Summary of predicted welfare effects of à-la-carte introduction.
It is striking how small the effects turn out to be in the most realistic scenario, at least for
consumers.
Ask consumers if they want to reduce the number of channels in their bundle by 50% for a $1
decrease in the monthly price and I think most will say no or be indifferent. Even if they value
the dropped channels at close to zero. The market simulations in the US actually suggest that
the outcome of à-la-carte will be higher consumer expenditure for only half of the original
channels. All this will happen because the input costs will be re-negotiated and the
simulations suggest that these costs will double which in turn will lead to higher prices.
Since I have found that the US and the Norwegian markets are similar there is no reason to
believe that the welfare consequences will be very different in Norway. Some of the estimated
parameters will differ because of market differences, but the effect will not be large. I expect
that consumers will get rid of the channels they value at zero, but still pay the same price as
today. Channel conglomerates will charge more for channels in order to outweigh their loss of
subscribers which increase input costs for distributors. However, since distributors pay the
affiliate fees per subscriber, the aggregated effect is unclear. The model predicts the aggregate
effect to be positive for the distributors and negative for channels. Because of this I expect
that some channels’ subscription figures will drop below the critical mass, resulting in market
exit.
The distributor seems to be better off under à-la-carte, but as discussed earlier additional costs
might occur in an à-la-carte world. Norwegian distributors expect increased costs in
administration, customer support and infrastructure in order to facilitate à-la-carte, which
would reduce the benefits (Kulturdepartementet, 2011). The magnitude of these costs is
unclear, but the fact that distributors all follow bundling strategies leads me to expect that the
costs outweigh the benefits. Though unlikely, it could also be that the distributors stick to the
basic theory in the field and wrongly expect to lose profit if à-la-carte were introduced. If this
Introduction of á-la-carte 2007 Model 2011 Model 2011 Model
Cost assumption Constant No re-negotiation Re-negotiation
Consumer Surplus +65.6% +19.2% +0.2%
Distributor Profit -44.2% +13.1% +10.4%
Channel Profit NA -22.9% +2.6%
Total Surplus -7.4% +4.1% +2.4%
SNF Working Paper No 19/13

68
is the case it is only a matter of time before distributors introduce à-la-carte. A small
indication of this last point is Canal Digital’s introduction of à-la-carte for a part of their basic
bundle (Providers Website, 2013). Customers can choose 15 of the channels in their bundle
from a menu of less popular channels, but the majority of channels are still fixed. It will be
very interesting to see if this is the beginning of a strategy moving more towards à-la-carte,
which distributors actually could profit from.
5.2 Future Trends
One factor that has not been addressed explicitly up till now is the increasing popularity of
on-demand streaming services like Netflix or Viaplay. I would argue that if the market shares
of such services increase more and more, the traditional cable and satellite television market
will shrink. This will especially be a problem for the satellite distributors who cannot deliver
internet connection through their technology.
I expect that the price sensitivity of streaming services is lower than for expanded bundles
because there is no need to purchase a basic bundle first. However, there are not many
households that only resort to streaming in today’s market, so as of now it can be assumed
that the price sensitivity is similar to expanded bundles. The new services are also sold in
bundles and do not offer à-la-carte options as of today.
I would place streaming services in the category of premium programming I discussed earlier,
and as I explained, such channels will rarely enter basic bundles. It might be so that streaming
takes the place of premium channels like HBO and CMORE, but at the moment these
channels offer their content both on television and through streaming so there would not be an
immediate threat. The trend is therefore that the content producers simply switch platform
from television to streaming which is not that dramatic from the conglomerates’ perspective.
Another popular market trend is the option to record television programs on Digital Video
Recorders (DVR) to watch later. More and more consumers take advantage of this technology
and DVR will definitely have effects on the market. In a 2012 PhD thesis (Bergh, 2012) the
future effects on advertising revenue were discussed. With new technology like streaming and
DVR , consumers will find it easier to avoid advertising. One would therefore expect that the
traditional advertising funded channels would experience a reduction in revenue in the future
as more consumers adapt the new technology. At the same time the consumer surplus would
increase.
SNF Working Paper No 19/13

69
In fact Bergh finds just the opposite, and argues that because the DVR technology comes with
a sunk cost for the equipment, it will only be adapted by the most advertising averse
consumers. When these consumers are gone, the channel can increase the advertising level
because the remaining consumers are not that ad-averse. In the context of the industry model
this would mean that even with the new DVR technology, advertising revenues in the future
would be quite constant. If the impact of streaming and DVR is not that large as many expect
the industry model should predict accurately the welfare consequences of à-la-carte. From
Table 5, it can also be observed that the advertising revenues are much more stable in each of
the two model scenarios.
Since my main focus has been on the distributors I will finish with some future predictions for
these firms and what will happen with the much debated bundles. As I have already
mentioned I expect the platform technology to become a more important factor for consumers
in the future. More and more streaming content requires high speed connections, which suits
the cable and fiber companies best at the moment. It will be difficult to reverse the trend of
customers switching from satellite, and therefore Viasat is particularly vulnerable. I expect
that the satellite platform will see a reduction in customers as a function of increasing cable
and fiber penetration. However, since Norway is a vast country, the building of cable
infrastructure will not be profitable in many low populous areas. Therefore both the Satellite
and DTT platforms will have a considerable market presence in many years to come. These
technologies will also continue to dominate in the vacation house and cabin markets. One
more important factor having an impact on this market is the mobile broadband coverage.
When this technology improves, the impact on all the classic distribution platforms can be
large. Yet, I do not expect this technology to be ready and available for stable television
streaming for the general public in the next 5-10 years.
Bundling has been around for a long time in the multichannel television market and will also
be dominant in the years to come. In Norway, the possible regulation of this market to
facilitate à-la-carte was investigated in the Sønneland Report (Kulturdepartementet, 2011).
The independent report concluded, like I also do in this paper, that à-la-carte would not
necessarily benefit consumers. Therefore, no new market regulations were suggested.
There is no reason to believe, based on my model presentation and discussions, that à-la-carte
would reduce consumer expenditure for television channels in Norway. In fact, I would
expect consumers to spend more of their budget on television, either on streaming, classic
SNF Working Paper No 19/13

70
channel bundles or both, than we do today if à-la-carte was introduced. For distributors the
outcome would not be as bad as expected in the basic bundling framework. Without
accounting for à-la-carte marketing and implementation costs I have explained how the
distributors in fact could be better off.
However, I do not expect the distributors to drastically change their pricing strategy from
bundling to à-la-carte to possibly gain a few percent increase in profits as was predicted by
the US simulations (10.4%). Therefore, the pricing strategies in the television market will not
change in the coming years unless more research indicates the same results as the 2011
industry model. All in all, it will be up to the distributors whether or not to change policy,
because there are no governmental indications of a more regulated market in the future.
SNF Working Paper No 19/13

71
6. Concluding Remarks
In this paper I have presented models that all help understand how bundling works and why
bundling can be profitable in general and in the multichannel television market. I explained
the market specific framework in detail, and presented the results of simulations conducted in
the US. I structured the final part of the paper as a discussion about welfare effects of a
hypothetical à-la-carte policy.
I rely much on the 2011 industry model, simply because I find it to take the most realistic
assumptions. This model incorporates competition, and allows for re-negotiated input costs if
the market is unbundled. I presented the how the US and the Norwegian markets differ both
on the demand and the supply side. I found that the framework also can be applied to the
Norwegian market. However, the market differences will result in a change in the estimated
parameters.
I conclude that the introduction of full à-la-carte will not increase welfare for consumers,
which on aggregate will pay the same prices as today for fewer channels. The simulations
suggest that distributors are better off under full à-la-carte, but I believe more research is
needed before a conclusion can be made on this. Distributors will incur costs when switching
strategy and these costs has not been incorporated in the industry model. The long term effect
of channel exit is still unclear for distributors.
Finally, I discussed future trends in the market. I argued that new technology like streaming or
DVR not necessarily will lead to a change in bundling profitability. However, satellite and
DTT distributors are vulnerable because their platforms lack internet connection support. I
conclude that distributors will pursue a bundling strategy also in the future market, because
there are no indications of legal restrictions. Even though I suggested that distributors should
welcome à-la-carte, the full effects of changing strategy are still difficult to predict without
more assumptions.
The next natural step would be to obtain data from the Norwegian market, and simulate
welfare measures by using the 2011 industry model. I have found that these potential
simulations will provide accurate results also for the Norwegian market.
SNF Working Paper No 19/13

72
References
Adams, W.J. and Yellen, J.L. (1976). Commodity Bundling and the Burden of Monopoly. The Quarterly Journal of Economics, Vol. 90 (August 1976), pp 475-498.
Bakos, Y. and Brynjolfsson, E. (1999). Bundling Information Goods: Pricing, Profits and Efficiency. Management Science, Vol. 45(12), (December 1999), pp 1613-1630.
Bakos, Y. and Brynjolfsson, E. (2000). Bundling and Competition on the Internet, Marketing Science, Vol. 19(1), (Winter 2000), pp 63-82.
Bergh, H.N. (2012). Four Essays on Media and Entertainment Economics - Chapter 4: Ad-Avoidance Technology; Who Should Welcome It? PhD Thesis, Norwegian School of Economics, 2012. Berry, S., Levinsohn, J. and Pakes, A. (2004). Differentiated Products Demand Systems from a Combination of Micro and Macro Data: The New Car Market. Journal of Political Economy, 112(1), 2004, pp 68-105.
Booz Allen Hamilton (US consulting firm) (2004). The À-La-Carte Paradox: Higher Consumer Costs and Reduced Programming Diversity. Discussion paper, Booz Allen Hamilton, Report prepared for the National Cable & Telecommunications Association
Clementi, F and Gallegati, M. (2005), Pareto’s Law of Income Distribution: Evidence for Germany, the United Kingdom, and the United States. Chatterjee, A., Yarlagadda, S., and Chakrabarti B. K. (2005). Econophysics of Wealth Distributions, pp 3-14 Comcast (2013). Annual Review 2012, Accessed 30 May from http://www.comcast.com/2012annualreview/?SCRedirect=true#&panel1-1 Consumers Union USA (2004), Let the market decide - The à la carte option in the cable market. Accessed 8 May 2013 from http://www.consumersunion.org/wp-content/uploads/2013/05/0901-a-la-carte-white-paper.pdf Crawford, G.S and Cullen, J. (2007). Bundling, product choice, and efficiency: Should cable television networks be offered à la carte? Information Economics and Policy, Vol. 19 (2007), pp 379-404.
Crawford, G.S and Yurukoglu, A. (2011). The Welfare Effects of Bundling in Multichannel Television Markets. The American Economic Review, Vol. 102(2), (April 2012), pp 643-685.
E24 (2013), Canal Digital møter TV 2 i retten, 4 January 2013, Accessed 30 April 2013 from http://e24.no/media/canal-digital-moeter-tv-2-i-retten/20319331 FCC (2002). 2001 Report on the Cable Industry Prices. Technical Report, , Federal Communications Commission
FCC (2004). Report on the Packaging and Sale of Video Programming to the Public. Technical Report, Federal Communications Commission, November 2004. Accessed 30 April 2013 from http://hraunfoss.fcc.gov/edocs_public/attachmatch/DOC-254432A1.pdf
FCC (2006). Further Report on the Packaging and Sale of Video Programming to the Public. Technical Report, Federal Communications Commission, February 2006. Accessed 30 April 2013 from http://hraunfoss.fcc.gov/edocs_public/attachmatch/DOC-263740A1.pdf
FCC (2012). 14th Video Competition Report . Technical Report, Federal Communications Commission, Accessed from http://hraunfoss.fcc.gov/edocs_public/attachmatch/FCC-12-81A1.pdf
SNF Working Paper No 19/13

73
FCC (2013). Regulation of Cable TV Rates. Consumer Guide, Federal Communications Commission, March 2013. Accessed 5 June 2013 from http://transition.fcc.gov/cgb/consumerfacts/cablerates.pdf
Forbrukerombudet (2011), Vil ha økt valgfrihet på TV-markedet, 7 June 2006, Accessed 8 May 2013 from http://www.forbrukerombudet.no/2011/06/vil-ha-oekt-valgfrihet-paa-tv-markedet
Guiltinan, J. P. (1987). The price bundling of services: A normative framework. Journal of Marketing 51, no. 2 (1987), pp 74–85. Hanson, W. and Martin, R.K (1990). Optimal Bundle Pricing. Management Science, Vol. 36(2), (February 1990), pp 155-174. Horn, H. and Wolinsky, A. (1988). Bilateral Monopoly and Incentives for Merger. The RAND Journal of Economics, 19 (1988), pp 408-419.
Kagan Media Research (2005). À La Carte Pricing Makes Great Theory, But TV Channel Bundling Tough to Beat, Discussion paper, Kagan Media Research. Kulturdepartementet Norway (2011). TV, mangfold og valgfrihet. Assessment of à la carte in Norway, Accessed 8 May 2013 from http://www.regjeringen.no/upload/KUD/Medier/Rapporter/Arbeidsgruppen_Sonneland_2011_TVmangfold_og_valgfrihet.pdf
Liebowitz, S.J. and Margolis, S.E. (2008). Bundles of Joy: The Ubiquity and Efficiency of Bundles in New Technology Markets. Journal of Competition Law and Economics, 5(1). (2009) McAfee, R.P., McMillan J., and Whinston, M.D. (1989). Multiproduct monopoly, commodity bundling and correlation of values. The Quarterly Journal of Economics, Vol. 114 (May 1989), pp 371-384.
Nalebuff, B. (2004). Bundling as an entry barrier. The Quarterly Journal of Economics, Vol. 119 (1) (February 2004), pp 159-187.
Nash, J. (1950). The Bargaining Problem. Econometrica, 18 (2) (1950), pp 155–162. Nielsen Company (2012). 2012 Basic Cable Ratings. 17 December 2012, Accessed 6 June 2013 from http://www.deadline.com/2012/12/2012-basic-cable-ratings-usa-tops-again-history-tbs-lifetime-up-mtv-nick-at-nite-fall/ Norsk Kundebarometer. (2012), Mest fornøyd med Altibox, 17 April 2013, Accessed 24 May from http://www.eb.no/aktuelt/aktuelt_2013/mest_fornoyd_med_altibox/ NRK (2009). OK med kanalpakker? 20 April 2009. Accessed 6 June 2013 from http://www.nrk.no/helse-forbruk-og-livsstil/1.6574268
NRK (2013). Fakta om kringkastingsavgiften. 13 May 2013, Accessed 25 May 2013 from http://www.nrk.no/informasjon/lisens/1.2843183 Petrin, A. (2003). Quantifying the Benefits of New Products: The Case of the Minivan. Journal of Political Economy, 110(4), 2003, pp 705-729.
Pindyck, R.S. and Rubinfeld, D.L. (2009). Microeconomics, 7. Edition, Pearson Education Inc, USA.
Post og Teletilsynet. (2012) Det norske markedet for elektroniske kommunikasjonstjenester - 2012, Accessed 31 May 2013 from http://www.npt.no/aktuelt/nyheter/_attachment/8257?_ts=13ea833c18c
SNF Working Paper No 19/13

74
PRNewswire (2013). Cablevision Files Federal Antitrust Lawsuit Against Viacom For Illegally Forcing Purchase Of Programming Services. 26 February 2013, Accessed 8 May 2013 from http://www.prnewswire.com/news-releases/cablevision-files-federal-antitrust-lawsuit-against-viacom-for-illegally-forcing-purchase-of-programming-services-193307941.html
Providers websites. (2013), http://www.canaldigital.no/ http://www.rikstv.no/ http://www.viasat.no/ http://www.altibox.no/ http://www.get.no/ Reuters (2013). Cablevision: Viacom made $1 billion threat over bundling, 7 March 2013, Accessed 8 May 2013 from http://www.reuters.com/article/2013/03/08/us-viacom-cablevision-idUSBRE9261DR20130308 Rubinstein, A. (1982). Perfect Equilibrium in a Bargaining Model. Econometrica, 50(1) (1982), pp 97-109.
Schmalensee, R.L. (1984). Gaussian demand and commodity bundling. The Journal of Business, Vol. 57 (January 1984), pp 211-230.
Spence, A.M. (1975). Monopoly, quality and regulation. Bell Journal of Economics, 6 (1975), pp 417-429. Stigler, G.J. (1963). United States v. Loew’s Inc.: A note on block booking. The Supreme Court Review, 1963, pp 152-157.
Stock, J. and Watson, M. (2012). Introduction to Econometrics. 3rd Edition, Pearson Education Inc, USA, pp 461-490
Taraldsen, G. (1999), Grunnkurs i statistikk og sannsynlighetsteori, NTNU Lecture Script, p104. Accessed 22 April 2013 from http://ntnu.diva-portal.org/smash/get/diva2:216473/FULLTEXT01
Time Warner (2013). Annual Report 2012, Accessed 30 May 2013 from http://www.timewarner.com/our-company/pdf/TWX_AR_2012.pdf United States v. Loew's Inc. - 371 U.S. 38 Supreme Court (1962), Accessed 25 April 2013 from http://supreme.justia.com/cases/federal/us/371/38/case.html
United States Census Bureau. (2012), Household income in the past 12 months (2009), American Community Survey, Accessed 23 May 2013 from http://www.census.gov/compendia/statab/2012/tables/12s0706.pdf VG (2012). Brudd mellom Canal Digital og TV 2. 23 November 2012, Accessed 30 April 2013 from http://www.vg.no/nyheter/innenriks/artikkel.php?artid=10071363 Walt Disney (2013). Company Overview , Accessed 30 May from http://thewaltdisneycompany.com/about-disney/company-overview
SNF Working Paper No 19/13

75
Appendix
(Crawford & Yurukoglu, 2011, pages 18-8-9-26-34 respectively)
Appendix A: Exponentially distributed hours watched for CNN
SNF Working Paper No 19/13

76
Appendix B: Bundle Composition and Prices USA
SNF Working Paper No 19/13

77
Appendix C: Channel Summary Statistics
SNF Working Paper No 19/13

78
Appendix D: Estimated WTP each channel
SNF Working Paper No 19/13

79
Appendix E: Input Costs and Welfare Effects by Channel
SNF Working Paper No 19/13

SNF Working Paper No 19/13
PUBLICATIONS WITHIN SNF’S TELE AND MEDIA ECONOMICS PROGRAM
2008- Daniel A. Sørensen Bundling in the television market - who will benefit the most
from á-la-carte channel choice in the Norwegian television market?
SNF Working Paper No 19/13 Kenneth Fjell On the Choice of Royalty Rule to Cover Fixed Costs in Input Øystein Foros Joint Ventures Hans J. Kind SNF Working Paper No 16/13 Kenneth Fjell Employing endogenous access pricing to enhance Debashis Pal incentives for efficient upstream operation David E.M. Sappington SNF Working Paper No 09/13 Harald Nygård Bergh The Market for Consumption Devices- On Complementary
Products and Seller-Side Revenue-Extraction SNF Working Paper No 40/12 Harald Nygård Bergh Do premium channels decrease program variety? SNF Working Paper No 39/12 Håkon Sæberg Multi-purchasing in the linear city SNF Working Paper No 28/12 Kjetil Andersson Empirical evidence on the relationship between Øystein Foros mobile termination rates and firms’ profit Bjørn Hansen SNF Working Paper No 27/12 Julie Eliassen Brannfjell Informasjonstjenester på nett – en riktig oppgave for en offentlig kringkaster? SNF Working Paper No 24/12 Kim Ø. Lea Netthandel: Litteraturgjennomgang innenfor emnet internetthandel og prissammenligning SNF Working Paper No 23/12 Armando J. Garcia-Pires News sources and media bias Hans J. Kind SNF Working Paper No 21/12 Lars Sørgard Elisabeth Heimdal Nes Avisprodukter til nettbrett
- redningen for den norske avisbransjen? SNF Working Paper No 19/12 Harald Nygård Bergh Ad-avoidance technology: who should welcome it? SNF Working Paper No 17/12

SNF Working Paper No 19/13
Harald Nygård Bergh Competition between Content Distributors in Two-Sided Hans Jarle Kind Markets Bjørn-Atle Reme SNF Working Paper No 11/12 Lars Sørgard Johann Roppen Ideutvikling i redaksjonelle og kommunale nettmedia SNF Working Paper No 07/12 Jarle Møen Publication bias in the returns to R&D literature Helge Sandvig Thorsen SNF Working Paper No 06/12 Simon P. Anderson Media market concentration, advertising levels, Øystein Foros and ad prices Hans Jarle Kind SNF Working Paper No 02/12 Martin Peitz Ruth Rørvik Digital musikk for en digital generasjon En analyse av forretningsmodellene bak Spotify og Wimp SNF Working Paper No 01/12 Leif B. Methlie An analysis of the interplay among the dimensions of the Sven A. Haugland business model and their effects on performance SNF Working Paper No 35/11 Hans Jarle Kind Newspaper differentiation and investments in journalism: Guttorm Schjelderup The role of tax policy Frank Stähler SNF Working Paper No 32/11 Stig Tenold The Bergen wave and the media, 1990-2008 SNF Working Paper No 29/11 Ruth Rørvik Hvordan finansiere journalistikk? – Jakten på bærekraftige forretningsmodeller i en digital mediehverdag SNF Working Paper No 28/11 Jesper Hatletveit Mergers in two-sided media markets: Pricing and welfare Ole-Jakob S. Lillestøl implications SNF Working Paper No 24/11 Marius Hagen Drivkreftene bak opplagsutviklingen til en landsdekkende norsk Øyvind Nøstdal tabloidavis. En økonometrisk tidsserieanalyse av Verdens Gang
fra 1978 til 2009 SNF Working Paper No 23/11 Hans Jarle Kind Indirekte pressestøtte: Momsfritak vs Jarle Møen skattefradrag SNF Working Paper No 21/11 Armando J. Garcia Pires Advertising, news customization and media pluralism SNF Working Paper No 54/10

SNF Working Paper No 19/13
Armando J. Garcia Pires Media plurality, news customization and the intensity of readers’ political preferences SNF Working Paper No 53/10 Jarle Møen Samfunnsøkonomiske perspektiver på pressestøtten SNF Working Paper No 49/10 Ida Rødseth Kjosås Konjunkturutvikling og annonseinntekter i Henrik Hylland Uhlving redaksjonelle medier SNF Working Paper No 44/10 Øystein Foros Do advertisers or viewers decide TV channels’ Hans Jarle Kind programming choice? Guttorm Schjelderup SNF Working Paper No 43/10 Kenneth Fjell The economics of social networks: The winner takes Øystein Foros it all? Frode Steen SNF Working Paper No 42/10 Stine Grønnerud Huseklepp WiMP – Styring av verdinnettverk og digitale Ole-Jon Norgård Lund forretningsmodeller – en casestudie SNF Working Paper No 41/10 Ådne Cappelen Evaluation of the Norwegian R&D tax credit scheme Erik Fjærli SNF Working Paper No 36/10 Frank Foyn Torbjørn Hægeland Jarle Møen Arvid Raknerud Marina Rybalka Tor Jakob Klette R&D investment responses to R&D subsidies: A theoretical Jarle Møen analysis and a microeconomic study SNF Working Paper No 33/10 Ørjan Robstad Optimal merverdibeskatning av mediemarkeder: En tosidig Øyvind Hagen analyse SNF Working Paper No 32/10 Håkon Eika Velferdsimplikasjoner av restrukturering i TV-markedet Linda Solheimsnes SNF Working Paper No 22/10 Simon P. Anderson Hotelling competition with multi-purchasing: Time Magazine, Øystein Foros Newsweek, or both? Hans Jarle Kind SNF Working Paper No 21/10 Hans Jarle Kind Price coordination in two-sided markets: Competition in the TV Tore Nilssen industry Lars Sørgard SNF Working Paper No 20/10

SNF Working Paper No 19/13
Leif B. Methlie The drivers of services on next generation networks Jon Iden SNF Report No 09/10 Per E. Pedersen An empirical study of variety and bundling effects on choice and Herbjørn Nysveen Satisfaction: New telecommunication and media services SNF Report No 03/10 Kenneth Fjell Endogenous Average Cost Based Access Pricing Øystein Foros Review of Industrial Organization Dabashis Dal (2010) 36: 149-162 Armando J. Garcia Media Bias, News Customization and Competition Pires SNF Working Paper No 14/10 Armando J. Garcia Media Bias and News Customization Pires SNF Working Paper No 13/10 Øystein Foros Mergers and partial ownership Hans Jarle Kind SNF Working Paper No 12/10 Greg Shaffer Johann Roppen Markedsfinansiering og privatisering av allmennkringkasting SNF Working Paper No 11/10 Peder Dalbæk Bruknapp Det norske TV-markedet – Hvorfor tilbyr distributørene Anne Marthe Harstad kanalpakker, og vil sluttbrukerpris påvirkes av distributørenes kostnadsendringer ved overgang til enkeltkanalvalg?
SNF Working Paper No 42/09 Kenneth Fjell Online advertising: Pay-per-view versus pay-per-click with
market power SNF Working Paper No 32/09 Jonas Andersson A simple improvement of the IV estimator for the classical Jarle Møen errors-in-variables problem SNF Working Paper No 29/09 Øystein Foros Entry may increase network providers’ profit Hans Jarle Kind Telecommunications Policy 33 (2009) 486-494 Merete Fiskvik Berg Gjeldsfinansiering av immateriell investeringer Marit Bjugstad SNF Working Paper No 26/09 Hans Jarle Kind Tax responses in platform industries Marko Koethenbuerger SNF Working Paper No 24/09 Guttorm Schjelderup Oxford Economic Papers 62 (2010): 764-783 Øystein Foros Slotting Allowances and Manufacturers’ Retail Hans Jarle Kind Sales Effort Jan Yngve Sand Southern Economic Journal, Vol. 76(1) 266-282

SNF Working Paper No 19/13
Jon Iden Identifying and ranking next generation network services Leif B. Methlie SNF Report No 12/09 Kjetil Andersson Network competition: Empirical evidence on mobile termination Bjørn Hansen rates and profitability SNF Working Paper No 09/09 Martine Ryland Hvordan påvirker termineringsavgifter små mobiloperatører
som One Call? SNF Working Paper No 08/09 Terje Ambjørnsen Customer Ignorance, price cap regulation and rent-seeking in Øystein Foros mobile roaming Ole-Chr. B. Wasenden SNF Working Paper No 05/09 Hans Jarle Kind Market shares in two-sided media industries Frank Stähler SNF Working Paper No 04/09 Journal of Institutional and Theoretical Economics 166 (2010) 205-211 Hans Jarle Kind Should utility-reducing media advertising be taxed? Marko Koethenbuerger SNF Working Paper No 03/09 Guttorm Schjelderup Morten Danielsen Muligheter og utfordringer i fremtidens rubrikkmarked Magnus Frøysok på Internett SNF Working Paper No 02/09 Johanne R. Lerbrekk Markedssvikt i TV-markedet og behovet for offentlige kanaler
- sett i lys av digitaliseringen av bakkenettet SNF Working Paper No 01/09
Tore Nilssen The Television Industry as a market of attention SNF Arbeidsnotat 39/08 Nordicom Review 31 (2010) 1, 115-123 Per E. Pedersen The effects of variety and bundling on choice and satisfaction: Herbjørn Nysveen Applications to new telecommunication and media services SNF Working Paper No 33/08 Øystein Foros The interplay between competition and co-operation: Market Bjørn Hansen players’ incentives to create seamless networks SNF Working Paper No 22/08 Per E. Pedersen An exploratory study of business model design and customer Leif B. Methlie value in heterogeneous network services Herbjørn Nysveeen SNF Report No 09/08, Bergen

SNF Working Paper No 19/13
Hans Jarle Kind Business models for media firms: Does competition matter for Tore Nilssen how they raise revenue? Lars Sørgard SNF Working Paper No 21/08, Bergen Marketing Science, Vol. 28, No. 6, November-December 2009, 1112-1128 Helge Godø Structural conditions for business model design in new Anders Henten information and communication services – A case study of
multi-play and MVolP in Denmark and Norway SNF Working Paper No 16/08 Hans Jarle Kind On revenue and welfare dominance of ad valorem taxes in two- Marko Koethenbuerger sided markets Guttorm Schjelderup SNF Working Paper No 08/08 Economics Letters, Vol. 104 (2009) 86-88 Øystein Foros Price-dependent profit-shifting as a channel coordination Kåre P. Hagen device Hans Jarle Kind SNF Working Paper No 05/08 Management Science, Vol. 8, August 2009, 1280-1291 Hans Jarle Kind Efficiency enhancing taxation in two-sided markets Marko Koethenbuerger SNF Working Paper No 01/08 Guttorm Schjelderup Journal of Public Economics 92(2008) 1531-1539


E t s e l s k a p i N H H - m i l j ø e t
S A M F U N N S - O G N Æ R I N G S L I V S F O R S K N I N G A S
I n s t i t u t e f o r R e s e a r c h i n E c o n o m i c s a n d B u s i n e s s A d m i n i s t r a t i o n
Bundling of television channels has been heavily criticized by consumers, but is still observed in most television markets. In this paper I investigate the consequences of unbundling the Norwegian market, especially from the distributors’ and channels’ points of view.
Classic bundling theory does not apply particularly well to this market, and I therefore look at industry specific models which have helped to achieve a better understanding of the television market. Since the models have been developed in the US, I also discuss whether or not the US and Norwegian television markets differ. I find that the US industry models, with some modifications, also can be applied to the Norwegian market.
Interestingly, I find that the consumer-favored à-la-carte policy will not reduce the average household expenditure on television channels. Furthermore, the industry models indicate that the distributors and channels will be slightly better off under à la carte.
Helleveien 30 N-5045 BergenNorwayPhone: (+47) 55 95 95 00E-mail: [email protected]: http://www.snf.no/
Trykk: Allkopi Bergen