bull40-03-04-197-255.pdf - Dansk Geologisk Forening
59
Salt and fault interactions in the northeastem Dish Cenal Graben: observations and .inferences John A. Korstgard, Ian Lerche, Tommy E. Mogensen & Rene 0. Thomsen Korstgard, J. A., Lerche, I., Mogensen, T. E. & Thomsen, R. 0.: Salt and fault interactions in the northeastem Danish Central Graben: observations and inrences. Bulletin of the Geological Society of Denmark, Vol. 40, pp. 197-255. Copenhagen, 1993-12-30. https://doi.org/10.37570/bgsd-1993-40-10 Salt structures in the Spgne Basin and the Tail End Graben, the northeaste part of the Danish Central Graben, have been studied using a 1/2-1 km spaced seismic grid together with publically available well data. The investigated area has been divided into three main basin areas: the northe part of the Spgne Basin, a plateau area; the southe part of Spgne Basin, a shallow halfgraben; and the Tail End Graben, a deep halfgraben. These basins are flaed by the Ringkpbing-Fyn High and the Manda! High. Pre-Zechstein, and/or Pre-Permian normal faults, together with the shape of reflectors in the northemost Spgne Basin, indicate an Early, possibly Late Carbon- iferous, extension phase. The structural configuration of the sediments above the Zechstein salt pillows in the shallow halfgraben part of Spgne Basin, when compared with the structural configuration of the sediments in the much deeper Tail End Gben, indicates deeply buried salt pillows in the Tail End Graben. The salt structures fall into two basic groups, graben boundary salt pillows/diapirs and salt pillows/diapirs updip in halfgrabens. The evolution of these Zechstein salt structures is complex and intimately related to ult activity. Development of Triassic depocentres was primarily controlled by halokinesis with large thicknesses of sediments being deposited in primary and secondary rim synclines in the Spgne Basin. Middle Jurassic rift initiation was associated with synrift sediments along the Coffee Soil Fault and Late Jurassic fting caused a separation of the Spgne Basin and the Tail End Graben, and the formation of a ramp dipping to the south at the Coffee Soil Fault, which was· a pathway for sediments om the deeply eroded Ringkpbing-Fyn High otwall. This ramp has high sand potential. In the Early Cretaceous the Spgne Basin and Tail End Graben were separate depositional areas and the position of the Lower Cretaceous sediments were controlled by the Late Jurassic footwall uplift of the Manda! High, the southemost part of the Spgne Basin, and the Ringkpbing-Fyn High. Upper Cretaceous deposits were the first sediments to overlay the Ringkpbing-Fyn High and the Manda) High footwalls, indicating a change of the structural amework and in the Late Cretaceous and Early Tertiary inversion occurred in the area with renewed halokinesis, especially in the Tail End Graben. Continued halokinesis in the Late Miocene is indicated by the position of Late Miocene channels. Using vitrinite reflectance measurements om the Lulu-I well, drilled on top of a salt structure, it is possible to determine the excess maturity caused by the focusing of heat due to the higher thermal conductivity of salt. A method is presented for assessing the time of onset of diapirism and salt flow-speed. The method is based on calculation of the thermal anomaly surrounding a rising salt diapir. For a given salt speed, predicted vitrinite reflectance values are calculated and compared with the observed values at given depths. In this way salt migration rates are determined by forward modelling. The method can easily be tailored to thermal indicators other than vitrinite reflectance, thereby enhancing the resolution of the thermal history, and constraining both the onset of salt rise as well as the speed. In addition geohistory, thermal history, source capacity and oil generation have been examined in the northweste part of the Danish Central Graben using a one-dimen- sional fluid flow-compaction model. The burial history suggests that this part of the Danish Central Trough developed through three stages of subsidence, a Late Jurassic differential stage, a Late Cretaceous-Early Tertiary unirm stage and a Late Miocene- Quateary unirm stage. Pseudo-wells "drilled" on seismic sections in areas without well data are used to improve the spatial distribution of wells. The palaeotemperature and palaeoheat flow have been modelled by inversion of vitrinite reflectance data. The inversion was carried out on wells with available vitrinite reflectance data and was Bulletin of the Geological Society of Denmark 197 13
-
Upload
khangminh22 -
Category
Documents
-
view
7 -
download
0
Transcript of bull40-03-04-197-255.pdf - Dansk Geologisk Forening

Salt and fault interactions in the northeastem Danish Central
Graben: observations and .inferences
John A. Korstgard, Ian Lerche, Tommy E. Mogensen & Rene 0. Thomsen
Korstgard, J. A., Lerche, I., Mogensen, T. E. & Thomsen, R. 0.: Salt and fault interactions in the northeastem Danish Central Graben: observations and inferences. Bulletin of the Geological Society of Denmark, Vol. 40, pp. 197-255. Copenhagen, 1993-12-30. https://doi.org/10.37570/bgsd-1993-40-10
Salt structures in the Spgne Basin and the Tail End Graben, the northeastern part of the Danish Central Graben, have been studied using a 1/2-1 km spaced seismic grid together with publically available well data. The investigated area has been divided into three main basin areas: the northern part of the Spgne Basin, a plateau area; the southern part of Spgne Basin, a shallow halfgraben; and the Tail End Graben, a deep halfgraben. These basins are flanked by the Ringkpbing-Fyn High and the Manda! High. Pre-Zechstein, and/or Pre-Permian normal faults, together with the shape of reflectors in the northernmost Spgne Basin, indicate an Early, possibly Late Carboniferous, extension phase. The structural configuration of the sediments above the Zechstein salt pillows in the shallow halfgraben part of Spgne Basin, when compared with the structural configuration of the sediments in the much deeper Tail End Graben, indicates deeply buried salt pillows in the Tail End Graben. The salt structures fall into two basic groups, graben boundary salt pillows/diapirs and salt pillows/diapirs updip in halfgrabens. The evolution of these Zechstein salt structures is complex and intimately related to fault activity.
Development of Triassic depocentres was primarily controlled by halokinesis with large thicknesses of sediments being deposited in primary and secondary rim synclines in the Spgne Basin. Middle Jurassic rift initiation was associated with synrift sediments along the Coffee Soil Fault and Late Jurassic rifting caused a separation of the Spgne Basin and the Tail End Graben, and the formation of a ramp dipping to the south at the Coffee Soil Fault, which was· a pathway for sediments from the deeply eroded Ringkpbing-Fyn High footwall. This ramp has high sand potential. In the Early Cretaceous the Spgne Basin and Tail End Graben were separate depositional areas and the position of the Lower Cretaceous sediments were controlled by the Late Jurassic footwall uplift of the Manda! High, the southernmost part of the Spgne Basin, and the Ringkpbing-Fyn High. Upper Cretaceous deposits were the first sediments to overlay the Ringkpbing-Fyn High and the Manda) High footwalls, indicating a change of the structural framework and in the Late Cretaceous and Early Tertiary inversion occurred in the area with renewed halokinesis, especially in the Tail End Graben. Continued halokinesis in the Late Miocene is indicated by the position of Late Miocene channels.
Using vitrinite reflectance measurements from the Lulu-I well, drilled on top of a salt structure, it is possible to determine the excess maturity caused by the focusing of heat due to the higher thermal conductivity of salt. A method is presented for assessing the time of onset of diapirism and salt flow-speed. The method is based on calculation of the thermal anomaly surrounding a rising salt diapir. For a given salt speed, predicted vitrinite reflectance values are calculated and compared with the observed values at given depths. In this way salt migration rates are determined by forward modelling. The method can easily be tailored to thermal indicators other than vitrinite reflectance, thereby enhancing the resolution of the thermal history, and constraining both the onset of salt rise as well as the speed.
In addition geohistory, thermal history, source capacity and oil generation have been examined in the northwestern part of the Danish Central Graben using a one-dimensional fluid flow-compaction model. The burial history suggests that this part of the Danish Central Trough developed through three stages of subsidence, a Late Jurassic differential stage, a Late Cretaceous-Early Tertiary uniform stage and a Late MioceneQuaternary uniform stage. Pseudo-wells "drilled" on seismic sections in areas without well data are used to improve the spatial distribution of wells. The palaeotemperature and palaeoheat flow have been modelled by inversion of vitrinite reflectance data. The inversion was carried out on wells with available vitrinite reflectance data and was
Bulletin of the Geological Society of Denmark 197
13

based on known bottom hole temperatures, some temperature measurements with depth and the surface temperature. The thermal history assessed by inversion of vitrinite reflectance data gives a consistently cooler past; the available data's resolution of the thermal history is also discussed. The modelled maturation history of the Upper Jurassic shale in terms of vitrinite reflectance suggests that the shale reached maturity some 5-50 Ma ago. A geochemical study of the Upper Jurassic shales shows that these shales contain a mixture of type II and type III kerogens and have good to excellent source potential. Modelling of the hydrocarbon generation data indicates that the peak generation took place some time between 10 Ma BP and the present day. Possible migration paths are determined from modelled excess fluid pressure, and four areas of possible accumulation of hydrocarbons are indicated. The hydrocarbon potentials of the areas are evaluated and an area along the eastern boundary fault between the Tail End Graben and the Ringkøbing-Fyn High is suggested as a target for further exploration.
J. A. Korstgård, Department of Geology, Aarhus University, DK-8000 Århus C, Denmark. I. Lerche, Dept. of Geological Sciences, University of South Carolina, Columbia SC 29208, USA. T. E. Mogensen, Norsk Hydro a.s., P.O. B. 200, N-1321 Stabekk, Norway. R. O. Thomsen, Saga Petroleum a.s., P.O. B. 490, N-1301 Sandvika, Norway. 17th March 1992.
Introduction Previous work in the Danish Central Graben has mainly been concerned with Mesozoic stratigraphy and structure (Cartwright, 1987, 1989; Glennie, 1986; Heilmann-Clau-sen, 1987; Michelsen et al., 1987; Møller, 1986; Olsen, 1987; Vejbæk, 1986; Ziegler, 1987). Apart from a review paper by Gowers & Sæbøe (1985) not much attention has been paid to the pre-Mesozoic geological history.
To a large extent the impact of the Zechstein salt in the Tail End Graben and the Søgne Basin has been treated rather cursorily or not at all. This paper emphasizes the salt, its influence on the overburden, and its relationship to faults. Furthermore, the structural development is also examined in the area under investigation (Fig. 1). Using vitrinite reflectance measurements a method for assessing the time of onset of salt diapirism is presented and finally geohistory, thermal history, source capacity and oil generation in the northwestern part of the Danish Central Graben are examined using a one-dimensional fluid flow-compaction model.
Structural and depositional analysis Structural outline of the investigated area
The investigated area can be divided into three distinctive regions (Fig. 2). A plateau-like northern part of the Søgne Basin (NSB), a shallow halfgraben in the southern part of the Søgne Basin (SSB) and a deep halfgraben area in the Tail End Graben (TEG). There are some similarities in the structural development between the NSB and the SSB, and between the SSB and the TEG. Between each separate area graduations exist.
The Northern Søgne Basin is characterized by (for abbreviations see Table 1):
1) A plateau like configuration of the TPZ to LCU strata;
2) Pre-Zechstein normal faults (extension); 3) Erosion of the TPZ surface; 4) Zechstein salt pillows; 5) Listric faults in the overburden, detaching into the
salt; 6) Relatively minor Late Jurassic to Middle Jurassic rift
ing along the Coffee Soil Fault; 7) Halokinetic contributions to subsidence from the
Triassic to the Late Miocene (perhaps the Quaternary);
8) Small channels above the Top Middle Miocene Unconformity.
The Southern Søgne Basin is characterized by:
1) Halfgraben configuration of the TPZ to LCU strata; 2) Salt pillows along boundary faults; 3) Salt pillows/diapirs updip in the halfgraben; 4) Uniformly thick lowermost Triassic sequence; 5) Intra-Triassic primary and secondary rim synclines; 6) Triassic sequence thinning towards the boundary
fault and towards the updip part of the halfgraben, especially west of the Lulu salt structure and to the south;
7) Thickening of the Middle Jurassic sequence, relative to the NSB area;
8) Middle Jurassic above the caprock on salt diapirs; 9) Collapse features in the halfgraben, forming anti
thetic faults towards the Coffee Soil Fault; 10) Upper Jurassic wedge-shaped syn-rift sediments; 11) A south dipping ramp on the Ringkøbing-Fyn High
along the Coffee Soil Fault initiated in the SSB area; 12) Very little to no Lower Cretaceous sediments; 13) Thickening towards the south of the Chalk sequence.
The Tail End Graben is characterized by:
198 Bulletin of the Geological Society of Denmark

Table 1. Interpreted reflectors on geoseismic sections and their abbreviations.
12) Salt movements in the Arne salt structure, recognized after Top Mid Miocene time.
TMMU Top Middle Miocene Unconformity TEM Top Early Miocene . TLO Top Late Oligocene TCH Top Chalk TLC Top Early Cretaceous LCU Late Cimmerian Unconformity (Base Cretaceous) TMJ Top Middle Jurassic TT Top Triassic TMZ Top Mobile Zechstein (salt) TPZ Top Pre-Zechstein PPR Pre-Permian Reflectors
1) Half graben configuration of the TPZ to LCU strata; 2) Salt pillows along boundary faults; 3) Salt pillows/diapirs updip in the halfgraben; 4) Fairly uniformly thick Triassic sequence, but thinner
than in the Søgne Basin; 5) Middle Jurassic syn-rift sequence; 6) Middle Jurassic initiation of halokinesis; 7) Late Jurassic continued halokinesis and extensive
rift sedimentation, closely related to salt structures and salt movements;
8) The Coffee Soil Fault - Ringkøbing-Fyn High ramp ends in the southern part of the investigated TEG area;
9) Thickening of the Lower Cretaceous sequence towards the south and west;
10) Late Cretaceous inversion tectonics, and a close relationship between salt structures and inversion;
11) Major basement fault(s) along the Arne-Elin Trend;
Fig. 1. The investigated area in the northeastern part of the Danish Central Graben. Jurassic fault pattern after Møller (1986).
The transition zones between these three areas are complex for both structural and depositional development. In the following sections, the structural and depositional patterns in the investigated area from the Pre-Zechstein to the Tertiary, will be analyzed and discussed in some detail.
Seismic and well data Seismic data
The seismic data used in this study consist of eleven seismic surveys (Fig. 3a and Table 2), all shot between 1981 and 1987. All lines are 60 fold stacked and migrated, except ELF 8083 which is 40 fold stacked and migrated. ELF8083, SGT8606, ST8630 and ST8716 are
4°00' 4°30' 4°40' 56°40'
56°30'
10 km
56°15'
56°00'
Fig. 2. The division of the area into the northern Søgne Basin, the southern Søgne Basin and the Tail End Graben shown on a Top pre-Zechstein fault map.
Bulletin of the Geological Society of Denmark 199
4°30' + 56°40'
4°00' 56°40'
56°30'
56°15'
56°00
56°30'
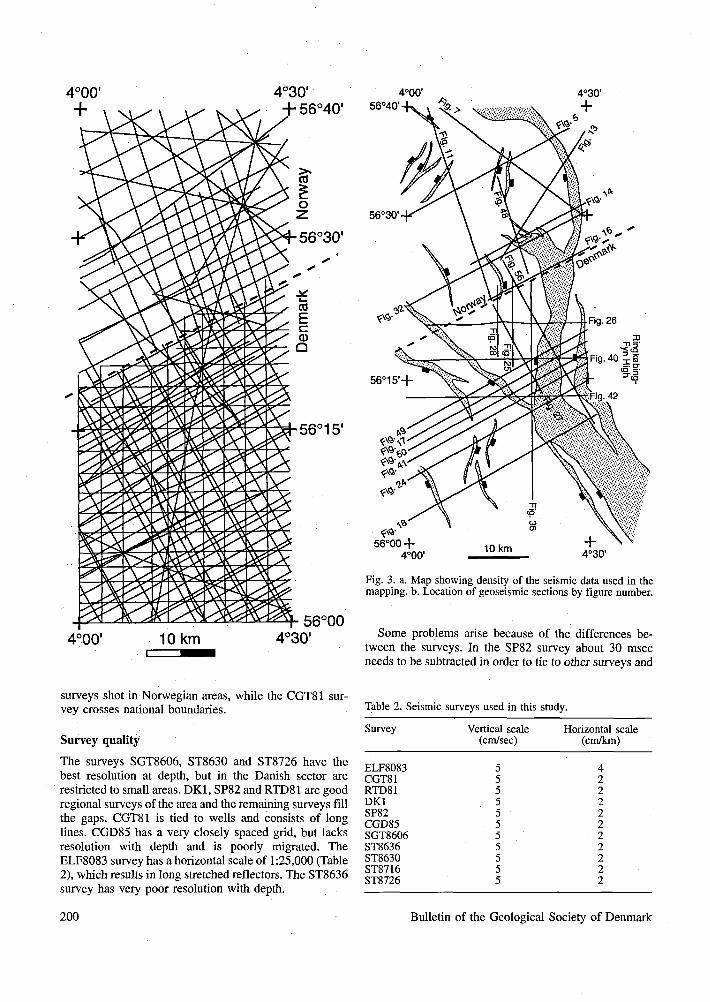
Fig. 3. a. Map showing density of the seismic data used in the mapping, b. Location of geoseismic sections by figure number.
Some problems arise because of the differences between the surveys. In the SP82 survey about 30 msec needs to be subtracted in order to tie to other surveys and
surveys shot in Norwegian areas, while the CGT81 survey crosses national boundaries.
Survey quality
The surveys SGT8606, ST8630 and ST8726 have the best resolution at depth, but in the Danish sector are restricted to small areas. DK1, SP82 and RTD81 are good regional surveys of the area and the remaining surveys fill the gaps. CGT81 is tied to wells and consists of long lines. CGD85 has a very closely spaced grid, but lacks resolution with depth and is poorly migrated. The ELF8083 survey has a horizontal scale of 1:25,000 (Table 2), which results in long stretched reflectors. The ST8636 survey has very poor resolution with depth.
Table 2. Seismic surveys used in this study.
Survey
ELF8083 CGT81 RTD81 DK1 SP82 CGD85 SGT8606 ST8636 ST8630 ST8716 ST8726
Vertical scale (cm/sec)
5 5 5 5 5 5 5 5 5 5 5
Horizontal scale (cm/km)
4 2 2 2 2 2 2 2 2 2 2
200 Bulletin of the Geological Society of Denmark

Table 3. Time structure and isopach maps.
Time Structure Maps Time Isopach Maps
Top Pre-Zechstein (TPZ) Top Mobile Zechstein (salt) (TMZ) Top Triassic (TT) Top Middle Jurassic (TMJ) Late Cimmerian Unconformity (Base Cretaceous) (LCU) Top Lower Cretaceous (TLC) Top Chalk (TCH)
Mobile Zechstein Group Triassic Group Middle Jurassic Group Upper Jurassic Group Lower Cretaceous Group Chalk Group
Local Time Structure Maps Local time Isopach Maps
Pre-Permian Surface (PPS) Triassic Primary Rim Syncline Triassic Secondary Rim Syncline
wells. The ST8630 survey has a slight difference between the available shot point maps and the seismic sections, the scale of the shot point map being a little less than 1:50.000, which means that the seismic sections are probably slightly condensed.
Well data
All released wells in the Danish area and the Norwegian wells 3/7-1, 3/7-2, 3/7-3, 2/6-1, 3/5-2, and 2/9-2 have been used in this study (Fig. 1).
Maps
From the interpreted reflectors (Table 1), structure contour and isopach maps in two-way travel time (TWT) have been made (Table 3). The time thicknesses on the isopach maps have been measured at right angles to the bedding planes, except for the Mobile Zechstein Group isopach map, where the thicknesses have been measured vertically.
Pre Permian (Carboniferous?) Time structure map (TWT)
JOOO— Tir>ie depth contour (msec)
Normal fault
5 km
Fig. 4. Pre-Permian structures from the northern Søgne Basin. For location of map see Fig. 2.
Pre-Zechstein The NSB area
The shallow depth of the northern Søgne Basin makes it possible to identify and map faults and reflectors below the TPZ reflector. The Pre-Permian time structure map (Fig. 4) shows contours of a mapped reflector below the TPZ reflector and some north trending extensional faults, cutting Pre-Zechstein, and possibly Pre-Permian, reflectors. Although some reactivation of these faults may have occurred in the Mesozoic, especially in the southern part of the area and thereby changing the fault direction to a WNW direction, the faults are clearly of Pre-Zechstein age, being truncated by the TPZ (Fig. 5). The widespread Rotliegendes volcanism in the Central Graben area (Fig. 6) together with the faulting, clearly indicates a Pre-Zechstein tectonic event.
A wedge-shaped sequence occur in the northernmost part of the NSB area (Fig. 7) indicating a Pre-Zechstein (Pre-Rotliegendes?) rift phase. The Pre-TPZ reflectors are angularly truncated by the TPZ (Fig. 7) indicating an erosional hiatus at the base of the Zechstein. The Pre-Zechstein faulting implies that the TPZ had topographic variations in Late Permian time, and that the Zechstein salt was deposited in topographic lows.
The Southern Søgne Basin and Tail End Graben areas
These areas have been buried so deeply that events below the TPZ are difficult to see, although some reflections are seen below the TPZ at the margins of the halfgrabens. At the present time verification of Pre-Zechstein faulting in
Bulletin of the Geological Society of Denmark 201

WNW Fig. 11 Fig. 7 3/5-01
l _ ESE . ST8716-698
Fig. 5. Geoseismic section. Line drawing of a seismic section with name of section in upper left comer. On this and most of the following sections the pre-Zechstein seismic "basement" is shown with dotted pattern, Zechstein salt with cross-hatched pattern, and chalk (Upper Cretaceous) with hatched pattern. All sections are dip-sections unless indicated on the section. Reflector names are given in Table 1. For location of line see Fig. 3b.
the TEG is not possible, but the Coffee Soil Fault might still have been active at that time.
Zechstein
The time structure maps of Top Pre-Zechstein (Fig. 8) and Top Mobile Zechstein (Fig. 9) give the TWT isopach map for the Mobile Zechstein (Fig. 10). Note that it is the stems or pillows beneath the diapirs that have been mapped on Fig. 9 and not the tops of the diapirs.
The NSB area
The Zechstein salt pillows in this area are fairly regularly distributed probably as a consequence of the relatively
flat lying TPZ surface (Figs 5, 8 & 11). The section in Fig. 11 shows pillows/diapir with a specific wavelength of separation. According to Jenyon (1986, p. 143) such wavelengths would correspond to original salt thickness in the order of less than 300 msec, in the right hand side of the section, and probably more than 300 msec, to the left in the section. However, salt structure development may also be related to underlying faults.
Listric faults, detached along the upper surface of the salt, are commonly seen in the NSB area (Figs 5,7 & 11). Such listric faults originated either as decoupled extension over basement faults or simply because of salt withdrawal. Figure 12 shows an extreme case of salt withdrawal causing the overburden to slide away and be totally detached. The Triassic "highs" on Figs 5, 7, 13 &
LATE CARBONIFEROUS AND EARLY PERMIAN DISTRIBUTION OF VOLCANICS AND FAULTS
Legend
H i l Highs in the North Sea p -s j Major faults F1H Volcanic Dykes
Fig. 6. Late Carboniferous and Early Permian rocks and major structures in the North Sea region (from Michelsen et al., 1992).
202 Bulletin of the Geological Society of Denmark
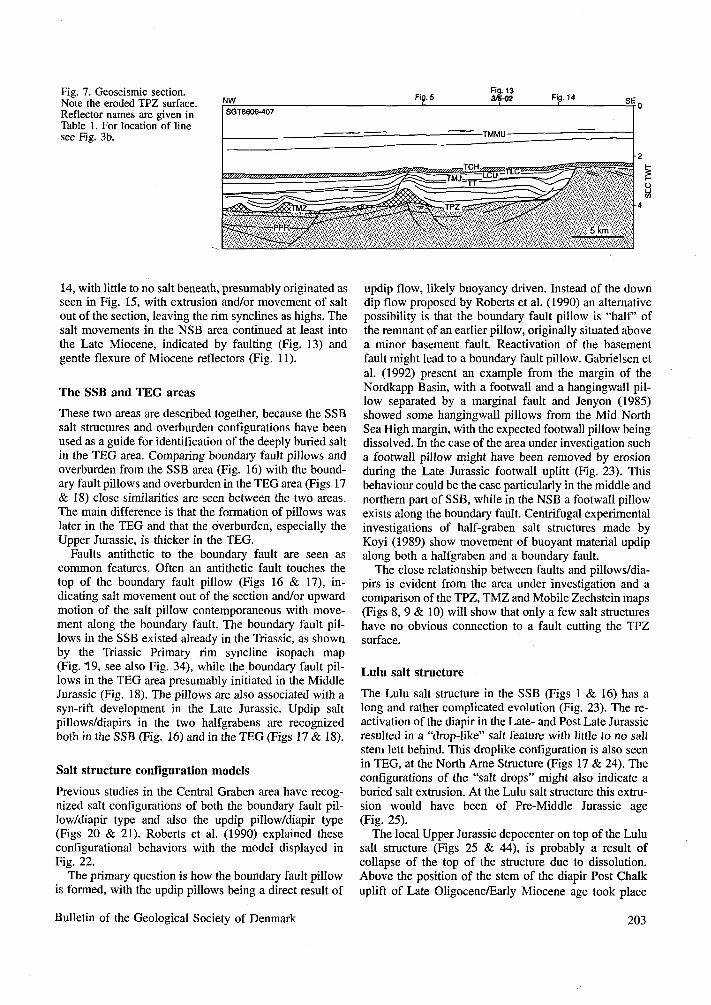
Fig. 7. Geoseismic section. Note the eroded TPZ surface. Reflector names are given in Table 1. For location of line see Fig. 3b.
Fig. 5 Fig. 13 3/5-02 Fig. 14 SE„
SGT8606-407
-TMMU-
/JMM»mm>*mmm»»'l!m!l"""""»>'"'»'
5 km
14, with little to no salt beneath, presumably originated as seen in Fig. 15, with extrusion and/or movement of salt out of the section, leaving the rim synclines as highs. The salt movements in the NSB area continued at least into the Late Miocene, indicated by faulting (Fig. 13) and gentle flexure of Miocene reflectors (Fig. 11).
The SSB and TEG areas
These two areas are described together, because the SSB salt structures and overburden configurations have been used as a guide for identification of the deeply buried salt in the TEG area. Comparing boundary fault pillows and overburden from the SSB area (Fig. 16) with the boundary fault pillows and overburden in the TEG area (Figs 17 & 18) close similarities are seen between the two areas. The main difference is that the formation of pillows was later in the TEG and that the overburden, especially the Upper Jurassic, is thicker in the TEG.
Faults antithetic to the boundary fault are seen as common features. Often an antithetic fault touches the top of the boundary fault pillow (Figs 16 & 17), indicating salt movement out of the section and/or upward motion of the salt pillow contemporaneous with movement along the boundary fault. The boundary fault pillows in the SSB existed already in the Triassic, as shown by the Triassic Primary rim syncline isopach map (Fig. 19, see also Fig. 34), while the boundary fault pillows in the TEG area presumably initiated in the Middle Jurassic (Fig. 18). The pillows are also associated with a syn-rift development in the Late Jurassic. Updip salt pillows/diapirs in the two halfgrabens are recognized both in the SSB (Fig. 16) and in the TEG (Figs 17 & 18).
Salt structure configuration models
Previous studies in the Central Graben area have recognized salt configurations of both the boundary fault pil-low/diapir type and also the updip pillow/diapir type (Figs 20 & 21). Roberts et al. (1990) explained these configurational behaviors with the model displayed in Fig. 22.
The primary question is how the boundary fault pillow is formed, with the updip pillows being a direct result of
updip flow, likely buoyancy driven. Instead of the down dip flow proposed by Roberts et al. (1990) an alternative possibility is that the boundary fault pillow is "half of the remnant of an earlier pillow, originally situated above a minor basement fault. Reactivation of the basement fault might lead to a boundary fault pillow. Gabrielsen et al. (1992) present an example from the margin of the Nordkapp Basin, with a footwall and a hangingwall pillow separated by a marginal fault and Jenyon (1985) showed some hangingwall pillows from the Mid North Sea High margin, with the expected footwall pillow being dissolved. In the case of the area under investigation such a footwall pillow might have been removed by erosion during the Late Jurassic footwall uplitt (Fig. 23). This behaviour could be the case particularly in the middle and northern part of SSB, while in the NSB a footwall pillow exists along the boundary fault. Centrifugal experimental investigations of half-graben salt structures made by Koyi (1989) show movement of buoyant material updip along both a halfgraben and a boundary fault.
The close relationship between faults and pillows/diapirs is evident from the area under investigation and a comparison of the TPZ, TMZ and Mobile Zechstein maps (Figs 8, 9 & 10) will show that only a few salt structures have no obvious connection to a fault cutting the TPZ surface.
Lulu salt structure
The Lulu salt structure in the SSB (Figs 1 & 16) has a long and rather complicated evolution (Fig. 23). The reactivation of the diapir in the Late- and Post Late Jurassic resulted in a "drop-like" salt feature with little to no salt stem lett behind. This droplike configuration is also seen in TEG, at the North Arne Structure (Figs 17 & 24). The configurations of the "salt drops" might also indicate a buried salt extrusion. At the Lulu salt structure this extrusion would have been of Pre-Middle Jurassic age (Fig. 25).
The local Upper Jurassic depocenter on top of the Lulu salt structure (Figs 25 & 44), is probably a result of collapse of the top of the structure due to dissolution. Above the position of the stem of the diapir Post Chalk uplift of Late Oligocene/Early Miocene age took place
Bulletin of the Geological Society of Denmark 203

Top Pre Zechstein Time Structure map (TWT)
ime depth contour (msec.)
g Fig. 8. Top Pre-Zechstein time '• 68-w structure contour and fault
map.
204 Bulletin of the Geological Society of Denmark

Fig. 9. Top Mobile Zechstein time structure contour map.
Bulletin of the Geological Society of Denmark 205
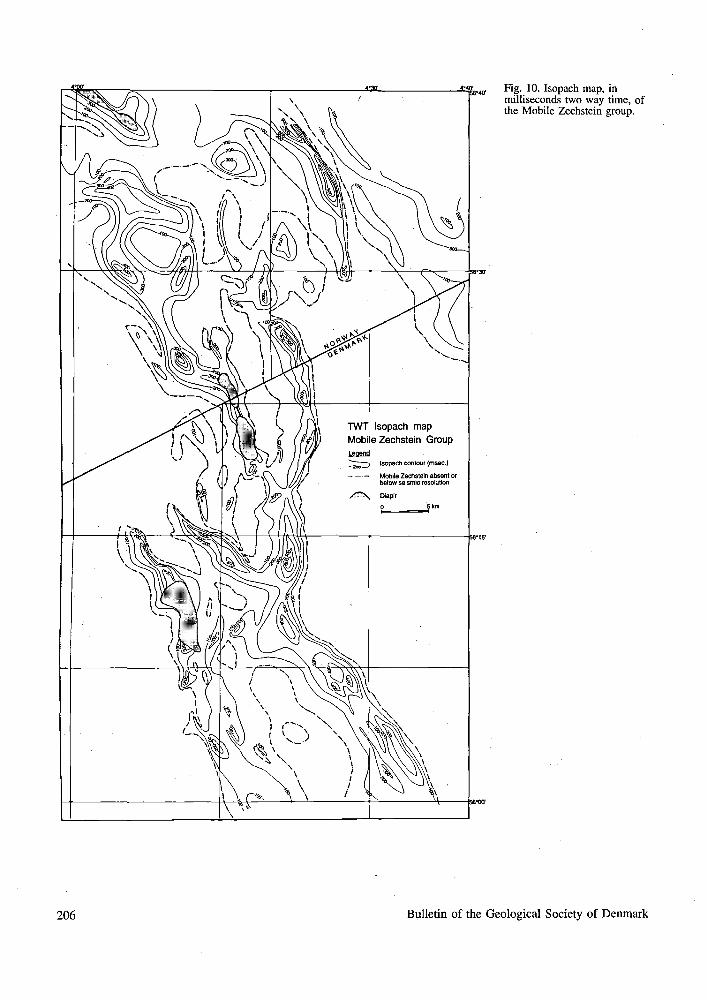
Fig. 10. Isopach map, in milliseconds two way time, of the Mobile Zechstein group.
206 Bulletin of the Geological Society of Denmark

Fig. 11. Geoseismic section. Salt structures are regularly spaced on a fairly flat TPZ surface. Reflector names are given in Table 1. For location of line see Fig. 3b.
NNW ST8716-403 (strike line)
-^J, % s j~ ~-LCu ^Zjr
w^^^S^SmSm^ss^
Fig. 5
SgS&TMZ
• TEM
T T ^ j g ^ X V
Fig. 14 Fig. 32
#$tiiiSiflSål S5(crh
Fig.
i
6
-4
(Fig. 26). The faults/fractures above and mainly west of the salt structure (Figs 27 & 28) are similar to model fractures above diapirs (Parker & McDowell, 1955).
(Fig. 33), the Triassic Group isopach map (Fig. 34), and the Triassic Primary and Secondary rim syncline isopach maps (Figs 19 & 35).
Origin and classification of salt structures in the investigated area
Salt structures have been classified by Jackson & Talbot (1986) and their classification is reproduced in Fig. 29. In the investigated area the main types found are pillows and diapirs, presumably of the detached diapir type, and buried "namakier" type or intrusive spreading type. Jackson & Talbot (1986) also list six principal mechanisms of salt tectonics (Fig. 30). In the Søgne Basin - Tail End Graben area all these mechanisms might have acted, singly or in combination, but almost always with a base salt fault to trigger movements. A contraction kind of halokinesis, type E, might have happened at the Arne salt structure in connection with transpression (Clausen et al. unpublished) in the Late Cretaceous/Tertiary, while gravity spreading halokinesis type C of Fig. 30, could have happened at the Lulu structure in the Pre-Middle Jurassic. The penetrative salt pillow at well 3/7-03 (Fig. 32) represents a transition stage to the diapir type.
Triassic
The structural and depositional development in the Triassic is outlined by the Top Triassic time structure map
Triassic deposition and rim synclines
The Triassic Group isopach map (Fig. 34) shows depo-centres in the NSB and SSB, and a more or less uniform thickness in the southern SSB and in the TEG. The deposition of the sediments in the Triassic depocentres was primarily controlled by halokinesis as seen from the Triassic Primary and Secondary rim syncline isopach maps (Figs 19 & 35, see also Fig. 23). The Triassic Primary rim syncline axis has a NNW-SSE trend, perhaps an indication of Triassic fault orientation or orientation of older faults, triggering and localizing salt structures. As shown in Fig. 23 salt may have been present on the footwall of the boundary fault in the NSB and SSB and later removed by erosion. The Northern Zechstein Basin would then have reached farther south on the Ringkøbing-Fyn High, perhaps to the southern end of the SSB depocenter (Fig. 34). The extensive Late Jurassic rifting and associated footwall uplift would then have "pushed" the Northern Zechstein Basin northward. The Triassic secondary rim syncline (Fig. 35, see also Figs 16, 25, 26, 27 & 31) is an indication of intrusive/extrusive diapirism in the Triassic. Together with the drastic decrease of the Triassic sequence thickness in the SSB this diapirism indicates that the Ringkøbing-Fyn High barrier influence at Triassic time had probably started to be felt. There might have been an E-W trending boundary fault, triggering the salt diapirism which formed the WNW-ESE to E-W trending secondary rim syncline. However, because of the extensive Late Jurassic subsidence, the southwards thinning of the Triassic was reversed in the Late Jurassic (Fig. 36).
The TEG and southern part of SSB were presumably part of a broad subsiding basin, eventually bordered by minor boundary faults, having a trend like the prior Zechstein salt basin (Fig. 37). The area had too small an overburden and/or too small an amount of salt to form recognizable salt structures.
Fig. 12. Listric faults caused by salt withdrawal (section from Badley (1989), interpretation by us).
Bulletin of the Geological Society of Denmark 207

Fig. 32 Fig. 14 Fig. 48 Fig. 13. Geoseismic section. Note the Triassic "high" in the middle of the section. Reflector names are given in Table 1. For location of line see Fig. 3b.
Middle Jurassic
No Lower Jurassic strata have been encountered in wells or identified by seismic interpretation, indicating non-deposition and/or removal by erosion. The Middle Jurassic is characterized by the Middle Jurassic time/depth structure map (Fig. 38) and the Middle Jurassic Group TWT isopach map (Fig. 39).
Rift initiation/halokinesis
The isopach map (Fig. 39) shows depocentres, primarily along or close to the Coffee Soil Fault. In combination with the wedge-shaped deposits (Figs 40 & 41) this indicates clear boundary fault activity and rift initiation. Figure 39 also shows a clear influence of salt movements. A large depocenter in the TEG is undoubtedly caused by salt withdrawal, in combination with rifting (Fig. 18 & 39). As already mentioned, the depocenter in the NSB along the Coffee Soil Fault is caused by removal of salt, probably as fault-induced salt extrusion, although salt may also have migrated laterally out of the section into
the salt pillow to the north (Figs 7, 10 & 14). Thinning of the Middle Jurassic Group over the Lulu structure (Fig. 39 & 8) indicates either later erosion and/or haloki-netic uplift at Middle Jurassic time. A small salt withdrawal basin seen to the southwest of the structure, suggests halokinesis as at least partly responsible. Erosion, and at some places total removal of the Middle Jurassic sequence in the NSB close to the SSB, is a result of footwall uplift following Late Jurassic faulting.
Boundary fault pillow closures
Figure 38 shows structural closures and possible traps along the Coffee Soil Fault (Figs 41 & 42). Depending on the sealing capacity of the fault zone other structures along the boundary fault might also be interesting as potential hydrocarbon prospects (Figs 7, 14 & 16).
Late Jurassic
Depositional and structural patterns are outlined by the time/depth map (Fig. 43) and isopach map (Fig. 44).
Fig. 11 Fig. 13
ST8716-211
Fig. 48 I
Fig. 7 ENE
O UJ to
Fig. 14. Geoseismic section. Note the Triassic "high" in the middle of the section. Reflector names are given in Table 1. For location of line see Fig. 3b.
208 Bulletin of the Geological Society of Denmark

mid-Tertiary
Intra Triassic
Early Triassic
Fig. 15. Schematic development of remnant rim syncline highs (from Roberts et al., 1990).
Én-echelon rifting/halokinesis
The isopach map (Fig. 44), shows a single depocenter in the TEG, with up to 2700 msec (TWT) of sediments. The axes of the TEG, SSB and NSB depocentres are all NW-SE trending suggesting an én-echelon rift pattern. In the border zone between TEG and SSB the depositional pattern is strongly influenced by faulting in combination with halokinesis.
The Coffee Soil Fault and a south dipping ramp
The Coffee Soil Fault became a major basement fault in the Late Jurassic and a ramp along the Coffee Soil Fault in the SSB and TEG, was formed in the Late Jurassic (Fig. 8), presumably as a kind of relay ramp (Larsen, 1988). The ramp, shown in Figs 17, 18, 26 and especially Figs 40, 41 & 42, has clear reflections (Fig. 45), with a hummocky clinoform to mounded configuration, and also a lenticular appearance that may be interpreted to be
alluvial cones sourced from fault scarps. The ramp probably has a very high sand potential (Larsen, 1988). The ramp probably evolved in the Kimmeridgian (Fig. 46) as a response to the increased subsidence in the late Late Jurassic and the change of stress direction, resulting in reduced subsidence of the SSB (Fig. 47). While less likely, it cannot be definitely ruled out that the ramp might have initiated earlier, in the Oxfordian or even in the Bajocian-Callovian.
Interference between old and new fault system
The evolution of the wedge-shaped configuration of the Upper Jurassic Group in the SSB has primarily taken place in the latest Late Jurassic (Fig. 48, also Figs 14 & 32). Superposition of the Late Jurassic faults on the old Permian/Pre-Permian extensional faults, produced, together with salt movements, a complicated transition zone between the SSB and NSB. This interference is clearly seen on the TPZ map (Fig. 8) where a branch of the Coffee Soil Fault fingers out into several minor faults.
Lulu salt structure
The Lulu structure can also be seen on the Upper Jurassic Group isopach map (Fig. 44, compare Fig. 8). The depocenter of the salt withdrawal basin has moved northwards compared to the Middle Jurassic, and provides an indication of continued evolution of the Lulu structure in the Late Jurassic. The isopach map also shows the local Late Jurassic depocenter on top of the Lulu salt structure. To the south of the Lulu structure a Late Jurassic listric fault, detached into the salt, has appeared as a result of the extensive Late Jurassic subsidence to the south in the TEG in combination with salt withdrawal into the Lulu structure (Figs 25, 26, 27 & 36).
Fig. 16. Geoseismic section from the Søgne Basin showing a boundary salt pillow initiated in the Triassic. Reflector names are given in Table 1. For location of line see Fig. 3b.
Bulletin of the Geological Society of Denmark 209

wsw Fig. 42
CGD85-012
Fig. 27
—h Fig. 36
Fig. 40 ENE
Fig. 56
O LU (O
Fig. 17. Geoseismic section showing a boundary salt pillow in the area between the Søgne Basin and the Tail End Graben. Reflector names are given in Table 1. For location of line see Fig. 3b.
Late Jurassic start of TEG -SSB separation, and subsequent halokinesis
The formation of the boundary fault pillows in the southern part of the SSB and in the TEG are clearly of Late Jurassic age and contemporaneous with rifting (Figs 42 & 49). On Fig. 49 the strata in the Triassic sequence are parallel with the top Triassic reflector, the Middle Jurassic Group shows gentle onlap, while the Upper Jurassic Lola Formation shows a steeper onlap. All three sequences are equally thick immediately on each side of the middle fault on the section, indicating that the fault (seen on Fig. 8, separating SSB from TEG), started to become active after Lola Formation time.
Figures 42 & 49 also show a clear influence of halokinesis on subsidence of this transition area in the Late Jurassic. The Lola Formation onlap on Fig. 49 becomes "downlap" on Fig. 42 because of salt withdrawal in combination with the faulting. Like Fig. 17, Figs 18, 24,41 & 50, show that the late Late Jurassic depocentres are not along the Coffee Soil Fault, but in the middle of the halfgraben as primary rim synclines caused by salt withdrawal. In fact most of the depocentres of the Late Jurassic sequence are in the middle of the basin, indicating the halokinetic influence.
Waning of the rifting at the Jurassic-Cretaceous transition
The ramp outbuilding along the Coffee Soil Fault seems to die out at the Jurassic - Cretaceous transition, and only minor faulting took place along the boundary faults. This minor faulting, together with compaction and a small upward movement of the boundary fault pillows, caused the "bending" of the Late Cimmerian Unconformity surface at the transition between ramp and basin (for example Fig. 42).
Early Cretaceous
In the Early Cretaceous the SSB and TEG have been clearly separated (Figs 51 & 52) although a "finger" of deposits into the SSB along the Coffee Soil Fault indicates activity along their common boundary fault.
Lower Cretaceous depocentres
The isopach map (Fig. 52) shows four distinct depocentres in the TEG - Gertrud Graben area and thickness and distribution of the Lower Cretaceous Group seems to depend on an interaction between faulting and halokine-
wsw Fig. 56
Fig. 18. Geoseismic section from the Tail End Graben showing a boundary salt pillow initiated in the Middle Jurassic. Reflector names are given in Table 1. For location of line see Fig. 3b.
Bulletin of the Geological Society of Denmark
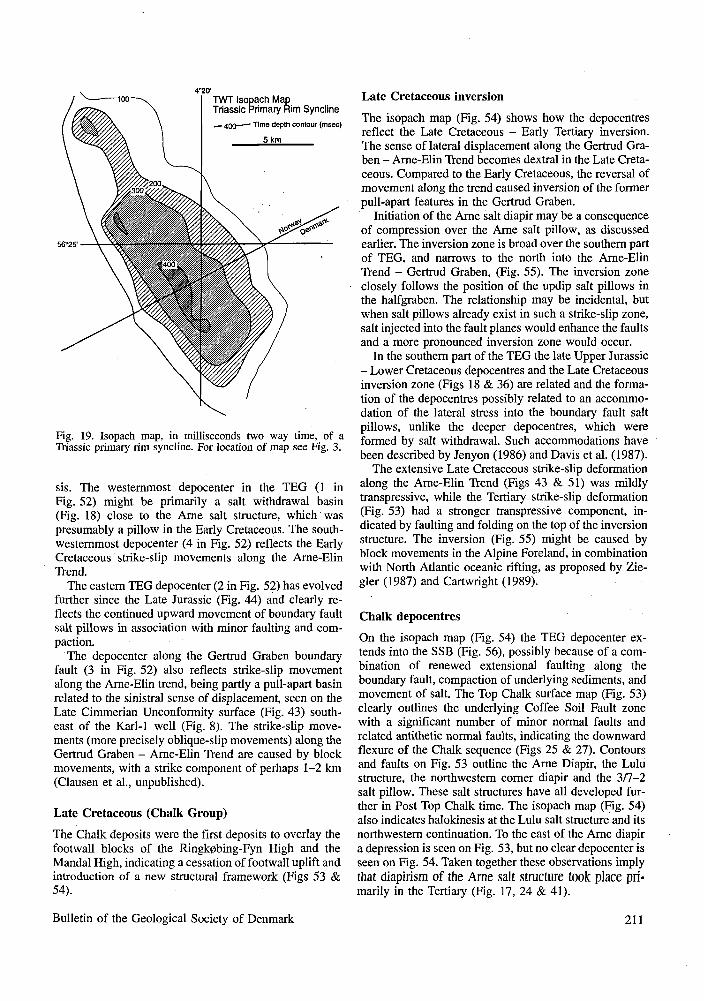
Fig. 19. Isopach map, in milliseconds two way time, of a Triassic primary rim syncline. For location of map see Fig. 3.
sis. The westernmost depocenter in the TEG (1 in Fig. 52) might be primarily a salt withdrawal basin (Fig. 18) close to the Arne salt structure, which was presumably a pillow in the Early Cretaceous. The south-westernmost depocenter (4 in Fig. 52) reflects the Early Cretaceous strike-slip movements along the Arne-Elin Trend.
The eastern TEG depocenter (2 in Fig. 52) has evolved further since the Late Jurassic (Fig. 44) and clearly reflects the continued upward movement of boundary fault salt pillows in association with minor faulting and compaction.
The depocenter along the Gertrud Graben boundary fault (3 in Fig. 52) also reflects strike-slip movement along the Arne-Elin trend, being partly a pull-apart basin related to the sinistral sense of displacement, seen on the Late Cimmerian Unconformity surface (Fig. 43) southeast of the Karl-1 well (Fig. 8). The strike-slip movements (more precisely oblique-slip movements) along the Gertrud Graben - Arne-Elin Trend are caused by block movements, with a strike component of perhaps 1-2 km (Clausen et al., unpublished).
Late Cretaceous (Chalk Group)
The Chalk deposits were the first deposits to overlay the footwall blocks of the Ringkøbing-Fyn High and the Mandal High, indicating a cessation of footwall uplift and introduction of a new structural framework (Figs 53 & 54).
Bulletin of the Geological Society of Denmark
Late Cretaceous inversion
The isopach map (Fig. 54) shows how the depocentres reflect the Late Cretaceous - Early Tertiary inversion. The sense of lateral displacement along the Gertrud Graben - Arne-Elin Trend becomes dextral in the Late Cretaceous. Compared to the Early Cretaceous, the reversal of movement along the trend caused inversion of the former pull-apart features in the Gertrud Graben.
Initiation of the Arne salt diapir may be a consequence of compression over the Arne salt pillow, as discussed earlier. The inversion zone is broad over the southern part of TEG, and narrows to the north into the Arne-Elin Trend - Gertrud Graben, (Fig. 55). The inversion zone closely follows the position of the updip salt pillows in the halfgraben. The relationship may be incidental, but when salt pillows already exist in such a strike-slip zone, salt injected into the fault planes would enhance the faults and a more pronounced inversion zone would occur.
In the southern part of the TEG the late Upper Jurassic - Lower Cretaceous depocentres and the Late Cretaceous inversion zone (Figs 18 & 36) are related and the formation of the depocentres possibly related to an accommodation of the lateral stress into the boundary fault salt pillows, unlike the deeper depocentres, which were formed by salt withdrawal. Such accommodations have been described by Jenyon (1986) and Davis et al. (1987).
The extensive Late Cretaceous strike-slip deformation along the Arne-Elin Trend (Figs 43 & 51) was mildly transpressive, while the Tertiary strike-slip deformation (Fig. 53) had a stronger transpressive component, indicated by faulting and folding on the top of the inversion structure. The inversion (Fig. 55) might be caused by block movements in the Alpine Foreland, in combination with North Atlantic oceanic rifting, as proposed by Ziegler (1987) and Cartwright (1989).
Chalk depocentres
On the isopach map (Fig. 54) the TEG depocenter extends into the SSB (Fig. 56), possibly because of a combination of renewed extensional faulting along the boundary fault, compaction of underlying sediments, and movement of salt. The Top Chalk surface map (Fig. 53) clearly outlines the underlying Coffee Soil Fault zone with a significant number of minor normal faults and related antithetic normal faults, indicating the downward flexure of the Chalk sequence (Figs 25 & 27). Contours and faults on Fig. 53 outline the Arne Diapir, the Lulu structure, the northwestern corner diapir and the 3/7-2 salt pillow. These salt structures have all developed further in Post Top Chalk time. The isopach map (Fig. 54) also indicates halokinesis at the Lulu salt structure and its northwestern continuation. To the east of the Arne diapir a depression is seen on Fig. 53, but no clear depocenter is seen on Fig. 54. Taken together these observations imply that diapirism of the Arne salt structure took place primarily in the Tertiary (Fig. 17, 24 & 41).
211
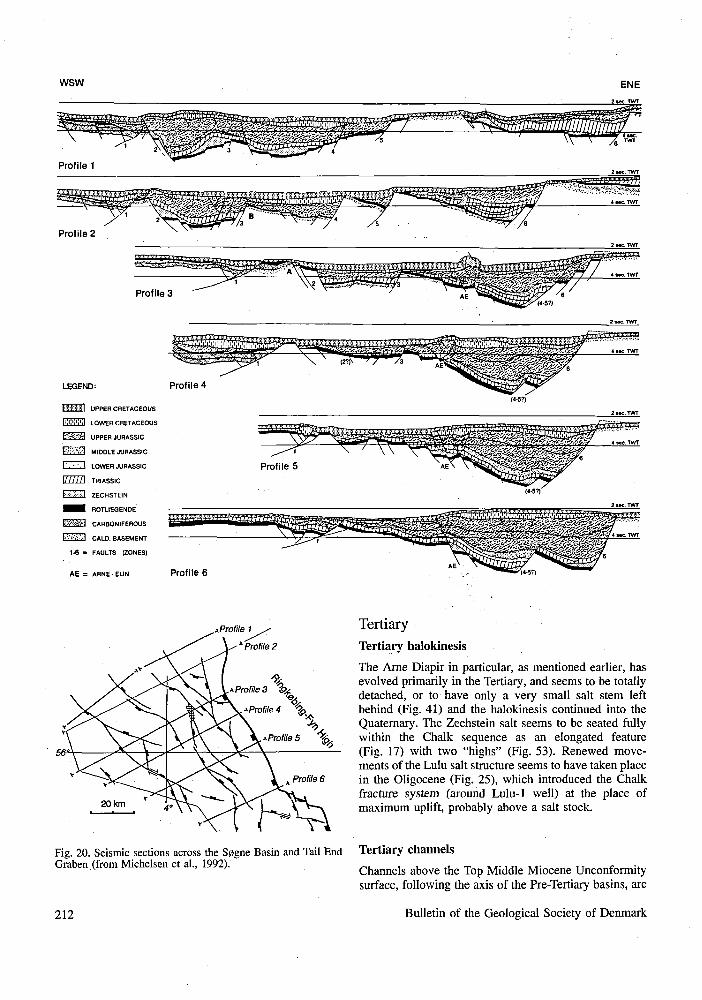
wsw ENE
Profile 2
Profile 3
LEGEND:
IWWi'iii'l UPPER CRETACEOUS
l'l'Wi'll LOWER CRETACEOUS
K&i l r l UPPER JURASSIC
friffWI MIDDLE JURASSIC
I •• '• I LOWER JURASSIC
I / / / / / 1 TRIASSIC
K?M1 ZECHSTEIN
^^M ROTLIEGENDE
IMMM CARBONIFEROUS
t::'*i'X CALD. BASEMENT
1-6 = FAULTS (ZONES)
AE = ARNE • ELIN
Profile 4
Profile 6
Profile 1
Profile 2
Tertiary Tertiary halokinesis
The Arne Diapir in particular, as mentioned earlier, has evolved primarily in the Tertiary, and seems to be totally detached, or to have only a very small salt stem left behind (Fig. 41) and the halokinesis continued into the Quaternary. The Zechstein salt seems to be seated fully within the Chalk sequence as an elongated feature (Fig. 17) with two "highs" (Fig. 53). Renewed movements of the Lulu salt structure seems to have taken place in the Oligocene (Fig. 25), which introduced the Chalk fracture system (around Lulu-1 well) at the place of maximum uplift, probably above a salt stock.
Fig. 20. Seismic sections across the Søgne Basin and Tail End Tertiary channels Graben (from Michelsen et al., 1992). _,. , , ,, T I.-JJI H- „ c •*
A Channels above the Top Middle Miocene Unconformity surface, following the axis of the Pre-Tertiary basins, are
212 Bulletin of the Geological Society of Denmark

Fig. 21. Schematic cross-section through the Egersund sub-basin showing the present situation as a result of salt activity along boundary faults and updip motion (after Lervik et al., 1989).
17/12-2 17/12-1
iM**** ;£v
;;'.,VXX^
>>$£»
>X'X'W»5B^^*!5V?X';»X'«'X'X'
lertiarv
Upper Cretaceous
Lower Cretaceous
Upper Jurassic . —"Z.
Middle Jurassic Ijffø Lower Jurassic — p j j .
_^dr&\'
;-X*X<<*X-VVi'i'i'V&»^
1000
2000
3 v-3000 -2
4000
•;-5000
seen particularly in the Søgne Basin area, although they also exist in the TEG area (Fig. 57) where channels later in the Late Miocene become broader. Strike lines do not show as many channels as dip lines, but do show a characteristic channel "avoiding" underlying salt pillows/ diapirs, indicating further salt movements at this time (Fig. 58). On Fig. 58 the seismic line has a clear right angle cross-cut of a channel (top arrow) close to the vertical axis of a salt structure (to the left), implying that
deposition in half-graben
buoyant salt movement begins
'600 and up-dip and boundary-fault
boundary- pillows formed
sequences rotate ••'• 600 and faults detach
into mobile salt
salt movement
-^buoyancy • • gravity — 600 m burial front
Fig. 22. Diagram of dynamical evolution of salt to account for the patterns of salt behaviour recorded in Figs 20 and 21 (after Roberts et al, 1990).
the channel circumvents the structural high. Although small in appearance on a seismic section, the channels have thicknesses of approximate 20-40 m. The slight velocity "pull-up" (bottom arrow, Fig. 58) indicates high velocity channel fill, presumably sand. Paleocene chan-
32303? x v x x x x x x x \ \ \ * ^iS/^v^C^/S/vS/vvS^vSÆ* x x x x x x x x x , * * * * * * * * * * * * * * i A \ A A A A A A A A A A / r i / * * * * * * * * x x x x x x x x x x x x x tJU A *\ ^l "X "̂ V N N ̂ X / i M i x x x x x x x x x . * * * * * * * * * * * * * * IMJI * * * * * * * * *JfP* * * * * * * * * x x x x x x x x x x x x x x \ * Y , x x x x x x x x jjCry x x x x x x x x x x * * * * * * * * * * * * * * *• Mis * * * * * * * Mvw* * * * * * * * .£tr X X X X X X X X X X N X X X X ^ X X X X X X X \r\ x x x x x x x x x C l x **********************************. *
.- x x x x • * * * * * ,
x x x x x x x x x x x x x ************* X X X X X X X X X X X X X •_ **************** x x x x
. x x x x x x x x ********* • X X X X X X X X " ********* X X X X X X X X X " ********* X X X X X X X X X ' **********
• X X X X X X X X X " ********** x x x x x x x x x x -********** . X X X X X X X X X " ********** X X X X X N X X X X -********** • X X X X X X X X X " **********
. X X X X X X X X X X X X X X X X X X X X \ X \ f f « k X X X X X X X X ' - X ' * * * * * * * * * * * * * * * * * * * * * * * Wis * * * * * * * * .ff *
. X X X X X X X X X X X X X X X X X X X X N X Vh X X \ X X \ S X X l l \ • * * * * * * * * * * * * * * * * * * * * * * * * * * * * * * * * * ."•• * x x x x x x x x x x x
• - - ~ * * * * * s-
Fig. 23. Evolution of Lulu salt structure, a. Triassic primary rim syncline. b. Top Triassic. c. Top Middle Jurassic, d. Top Upper Jurassic with block rotation to the east and salt withdrawal subsidence to the west (thick arrows).
Bulletin of the Geological Society of Denmark 213

wsw Fig. 36 Fig. 42 Fig. 56 Fig. 24. Geoseismic section across the Arne salt structure in the Tail End Graben. Reflector names are given in Table 1. For location of line see Fig. 3b.
nels (bottom arrows Fig. 59), as well as the Late Miocene channels (top arrow Fig. 59), are seen close to the Lulu salt structure and its northwestern continuation (Fig. 59, close to well 3/1-4).
Summary and discussion of main results Pre (Sub) Zechstein
In the shallow Søgne Basin it is possible to identify reflectors below the Base Zechstein (TPZ) reflector. These reflectors are truncated by the TPZ, which indicates the presence of an erosional hiatus at the base of the Zechstein. Pre- or syn Zechstein faulting makes it reasonable to suggest that the TPZ had an irregular topography in Late Permian time, and that the Zechstein salt was deposited in lows, controlled by the earlier faulting.
s R9-4 0 Fig. 27 Fig. 26 Lulu-1 F |g-,1 6 N
DK1-418B (strike-line)
-TMMU-
TLO-
Fig. 25. Geoseismic section. Reflector names are given in Table 1. For location of line see Fig. 3b. Any extrusion of salt in this structure would have taken place before the Late Jurassic. Note the local Upper Jurassic depocenter on top of the structure.
With the available data we were unable to demonstrate pre-Zechstein faulting in the Tail End Graben. However, by analogy to pre-Zechstein faulting in the Søgne Basin we consider it most likely that some of the major faults, such as the Coffee Soil Fault (Fig. 1) were also active in the Tall End Graben at that time.
Zechstein
Salt structures and overburden configuration in the shallow Søgne Basin have been used as a guide for the identification of deeply buried salt in the Tail End Graben. Comparing the seismic sections from the Søgne Basin (for example Fig. 16) and the Tail End Graben (for example Fig. 24) a close relationship is seen. On both sections anticlines are seen in the sedimentary sequences adjacent to the boundary fault, the Coffee Soil Fault, with apparent antithetic faults detaching into the top of the structure and towards the boundary fault. These structures we interpret as boundary fault salt pillows. On both sections an updip salt structure towards the hinge of the halfgraben also occurs.
The Zechstein boundary fault salt pillows/diapirs and updip salt pillows/diapirs are seen on the TWT isopach map of the Mobile Zechstein Group (Fig. 9). The map clearly shows how the salt has accumulated along the Coffee Soil Fault and moved updip in the halfgraben leaving the central part of the halfgraben virtually devoid of salt.
As in Koyi's (1989) centrifuge experiments a close relationship is seen between faults and salt structures in the investigated area. When the Mobile Zechstein Group map (Fig. 9) is compared with the Top Pre-Zechstein fault map (Fig. 8), only very few salt structures are seen not to be connected to a fault cutting the Top pre-Zechstein surface.
Antithetic and listric faults are found above the Zechstein salt interval and antithetic faults towards the boundary fault are seen as a common feature in the investigated area (Fig. 41). Often an antithetic fault touches the top of the boundary fault pillow, indicating either salt movements out of the section and/or a close relationship be-
214 Bulletin of the Geological Society of Denmark
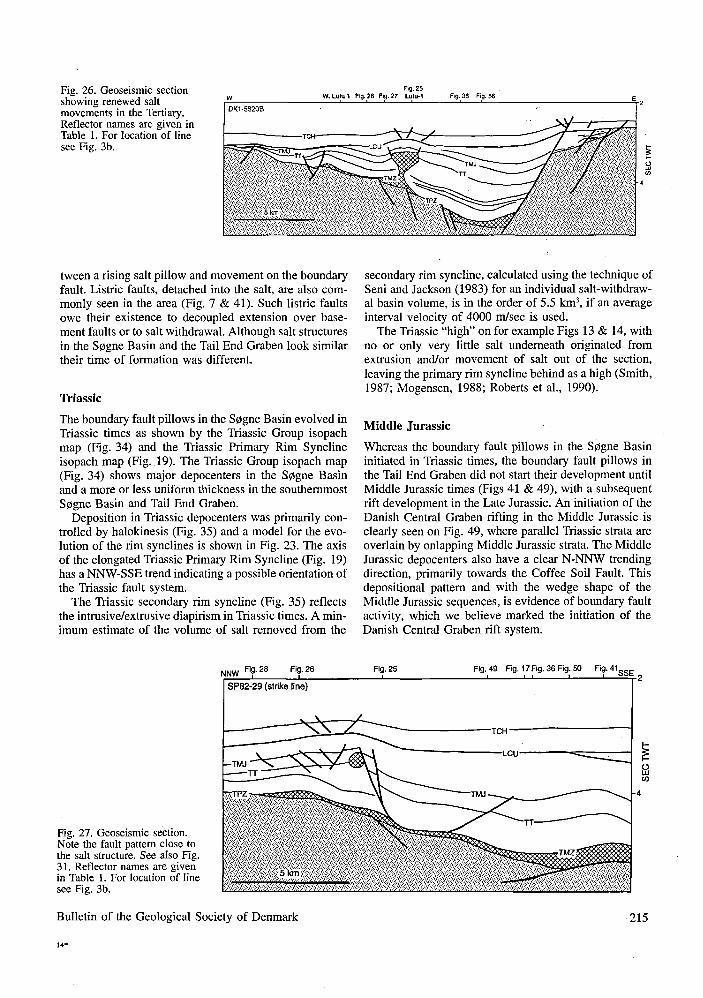
Fig. 26. Geoseismic section showing renewed salt movements in the Tertiary. Reflector names are given in Table 1. For location of line see Fig. 3b.
Fig. 25 W. Lulul Fig. 28 Fig. 27 Lulu-1 Fig. 36 Fig. 56
tween a rising salt pillow and movement on the boundary fault. Listric faults, detached into the salt, are also commonly seen in the area (Fig. 7 & 41). Such listric faults owe their existence to decoupled extension over basement faults or to salt withdrawal. Although salt structures in the Søgne Basin and the Tail End Graben look similar their time of formation was different.
Triassic
The boundary fault pillows in the Søgne Basin evolved in Triassic times as shown by the Triassic Group isopach map (Fig. 34) and the Triassic Primary Rim Syncline isopach map (Fig. 19). The Triassic Group isopach map (Fig. 34) shows major depocenters in the Søgne Basin and a more or less uniform thickness in the southernmost Søgne Basin and Tail End Graben.
Deposition in Triassic depocenters was primarily controlled by halokinesis (Fig. 35) and a model for the evolution of the rim synclines is shown in Fig. 23. The axis of the elongated Triassic Primary Rim Syncline (Fig. 19) has a NNW-SSE trend indicating a possible orientation of the Triassic fault system.
The Triassic secondary rim syncline (Fig. 35) reflects the intrusive/extrusive diapirism in Triassic times. A minimum estimate of the volume of salt removed from the
secondary rim syncline, calculated using the technique of Seni and Jackson (1983) for an individual salt-withdrawal basin volume, is in the order of 5.5 km3, if an average interval velocity of 4000 m/sec is used.
The Triassic "high" on for example Figs 13 & 14, with no or only very little salt underneath originated from extrusion and/or movement of salt out of the section, leaving the primary rim syncline behind as a high (Smith, 1987; Mogensen, 1988; Roberts et al., 1990).
Middle Jurassic
Whereas the boundary fault pillows in the Søgne Basin initiated in Triassic times, the boundary fault pillows in the Tail End Graben did not start their development until Middle Jurassic times (Figs 41 & 49), with a subsequent rift development in the Late Jurassic. An initiation of the Danish Central Graben rifting in the Middle Jurassic is clearly seen on Fig. 49, where parallel Triassic strata are overlain by onlapping Middle Jurassic strata. The Middle Jurassic depocenters also have a clear N-NNW trending direction, primarily towards the Coffee Soil Fault. This depositional pattern and with the wedge shape of the Middle Jurassic sequences, is evidence of boundary fault activity, which we believe marked the initiation of the Danish Central Graben rift system.
NNW Fig. 28 Fig. 26 Fig. 25 Fig. 49 Fig. 17 Fig. 36 Fig. SO Fig. 41 i t i i I O O t ,
Fig. 27. Geoseismic section. Note the fault pattern close to the salt structure. See also Fig. 31. Reflector names are given in Table 1. For location of line see Fig. 3b.
Bulletin of the Geological Society of Denmark 215

Fig. 26 Fig. 27 i i _ _
Fig. 16 i N
DK1-415B (strike line)
A i U k U b ^ ^ ^ B ^ ^ ^ h i wttmmmmmwxmmmmmm.
• • - . . . ''•'•'•'•'
Fig. 28. Geoseismic section. Note the fault pattern close to the salt structure. Reflector names are given in Table 1. For location of line see Fig. 3b.
Late Jurassic
In Late Jurassic times rifting continued and subsidence increased, as is well illustrated on for example Fig. 18, which shows a section across the Tail End Graben, with more than 2 sec (TWT) of Upper Jurassic sediments. Compared to the Middle Jurassic strata the Upper Jurassic Lola Formation shows a more steep onlap on Fig. 49, reflecting the increased subsidence. The halokinetic influence on the subsidence in the Late Jurassic of this border area is also shown in Figs 42 & 49. The Lola Formation onlap on Fig. 49 becomes "downlap" on Fig. 42, because of salt withdrawal in combination with faulting. What is also apparent from these lines is that the
Late Jurassic depocenters are not situated close to and along the Coffee Soil Fault, but in the center of the halfgraben. These depocenters are in fact mainly primary rim synclines, reflecting the growth of the boundary fault salt pillows and the updip salt structures. The formation of the ramp along the Coffee Soil Fault at this time is important since it was a pathway for sediments from the eroded Ringkøbing-Fyn High. The sequences up to and including the Upper Jurassic Lola Formation on Fig. 49 have the same thickness on either side of the central fault on the section. This fault, which separates the Søgne Basin from the Tail End Graben, was therefore not active until after deposition of the Lola Formation.
E£KE?2 EXTRUSIVE DIAPIRIC NAMAKIER SALT, DOME SALT STOCK
Fig. 29. The main types of large salt structures. Structure contours in arbitrary units (from Jackson & Talbot, 1986).
216 Bulletin of the Geological Society of Denmark

A. BUOYANCY HALOKINESIS
sea level
V-^ 1 -^ p L *- L ^- L |V i .V i . r a . L U L L r , > . ( . L ^ T C H i i u L L 1 - -L L L L L I L U U u V . k^^^. L U L Z
' ' • • ' • • ' U U U U L L L L, I-
- k./-* L U %. L L L L !_ L U \ U L L U U L L L L L U L U U , 4 U L i. T e L. L L u - L L U L U U l _ l _ U U t - L l . l - l . L L L L L, SO t L . >-,
- . «-. * . »-. k L L L L L L U. L, L. L. U, L U L L U L L L L L U L, U ? U L L
W I- L U t_
i bosemenr
B. DIFFERENTIAL LOADING HALOKINESIS
P <P KP 'a S C
D L L
" L ^ L ^ ^ U I I I L. t- L I L ' L L
L L t- L L L L L L L L U U U L
U L L L _ U U
^ U U L U L _ _ U L L _ _ i » L. L,
L L L L U L. I
P 2 -
po-:
C. GRAVITY SPREADING HALOKINESIS
surface
salt
D. THERMAL CONVECTIVE HALOKINESIS
L U L L L ^ W u L T V \ > L L L
u L u u u U £ L _ L U L L U L T * » W L L UJLL U L V. W T - ^ " — ± * . » ^ . • U L U L L i I D L U L U L L L _ \ L I. D V L L L >. t >. I~
L U L U L i _ ^ r , u u u u u U L fcTu i r L r , u L L L - L L W _ L L I -J - L L u L k L U U L L L 2 . L L L . L i p L U L l
L L L b . L L L L L L . I . L b L t . L L L b L fZm *- U L. " ™ ^ * " ' ' L - l - L L L L L l L L 3 •- L L 1
L_ L h L L U L . L L l i . L** , L L " L L C L L L t - L SQIt *- l
mfiiuli - ' <- u L L J U " u i L L L L
tiz>nx - / ? 3 E. CONTRACTION
Stable: Ps> P0 •'• />>/> >/* and Rj< R <f |
Unstable: /></>„ • V / J < / z< / 3 and P, <R,<P2
surfoce
A . ' cover
• * ' • * * • " . " • * ! • . ' • • ' J ^ * < * L L L^å#r'1- l
. . • • • U - - : « < A K s«-.u, *rvs s ' U L U U U L. U U
1::
F. EXTENSION
Stable:' £ >£ •'• / J ^ / ' j and P,>P->P3
Unstable: PS<P0 " PfPfP* ond R,<F|<P3
Fig. 30. Six principal mechanisms of salt tectonics. All types can combine. P refers to a point or to the lithostatic pressure at that point, based on thickness and density of the overburden; p refers to the mean bulk density of a unit where the symbol is isolated or to the mean bulk density of a complete crustal section where the symbol is adjacent to a vertical line defining the section. A. Buoyancy halokinesis. B. Differential loading halokinesis. The salt does not need to be overlain by denser cover, as in case A. C. Gravity spreading halokinesis. An extrusive dome spreads sideways, completing the cycle of overturn. Dashed line shows hypothetical profile of extrusive salt without erosional attrition. D. Thermal convective halokinesis. The convection cell has overturned several times; dashed lines represent partly homogenized layering. E. Contraction halokinesis. Salt acts as a detachment zone for an overlying fold-and-thrust belt; lithostatic pressure can retard the shortening (stable contraction) with normal density stratification or augment it (unstable contraction) if densities are inverted. F. Extension halokinesis. Salt rollers form a decoupling zone below listric normal faults in extending cover; lithostatic pressure can retard or augment this flow, depending on whether a density inversion is absent (stable extension) or present (unstable extension), respectively (from Jackson & Talbot, 1986).
Bulletin of the Geological Society of Denmark 217

Fig. 31. Triassic secondary rim syncline (outlined by white dots). From seismic line SP82-29 (see also Fig. 27).
S3P 3 W »
Early Cretaceous
The Early Cretaceous depositional pattern continued to be highly influenced by both faulting and halokinesis. A western depocenter in the Tail End Graben was presumably a salt withdrawal basin close to the Arne Salt structure. This depocenter has a primary rim syncline configuration, which indicates that the Arne Salt structure was a salt pillow in Early Cretaceous times.
An easterly depocenter developed close to but not at the Coffee Soil Fault, as one would expect from fault controlled sedimentation only, reflecting the upward movements of boundary fault salt pillows in association with minor faulting and compaction.
Late Cretaceous (Chalk Group)
The Chalk strata were the first to cover the footwall blocks of the Ringkøbing Fyn High and the Mandal High marking the ending of footwall uplift and the introduction of a new structural framework.
The Arne salt diapir was initiated in Late Cretaceous times as a consequence of compression over the Arne salt pillow during the Late Cretaceous/Tertiary inversion. The main period of diapirism of the Arne salt structure, however, took place in Tertiary times (Fig. 41).
The Late Cretaceous/Tertiary inversion zone (Ziegler, 1987; Cartwright, 1989), is broad over the southern part of the Tail End Graben area, and narrows to the north into the Arne-Elin Trend - Gertrud Graben. This narrowing seems to have a close relationship to the updip salt pil-
wsw 3/7-03 Fig. 11 Fig. 13
ST8716-212
Fig. 48 ENE„
/ / / y y y i , , y y y y y y /
Fig. 32. Geoseismic section. Note the penetrative salt pillow or remnant salt diapir at well 3/7-03. Reflector names are given in Table 1. For location of line see Fig. 3b.
Bulletin of the Geological Society of Denmark

Fig. 33. Top Triassic time structure contour and fault map.
Bulletin of the Geological Society of Denmark 219

56-401 Fig. 34. Isopach map, in milliseconds two way time, of the Triassic group.
220 Bulletin of the Geological Society of Denmark

TWT Isopach map Triassic Secondary Rim Syncline
. 400 Time depth contour (msec)
5 km
Fig. 35. Isopach map, in milliseconds two way time, of a Triassic secondary rim syncline. For location of map see Fig. 3.
lows. In the southernmost part of the investigated area the Late Jurassic - Early Cretaceous depocenters seem to be consistent with the width of the Late Cretaceous inversion zone (Fig. 18). This might be due to an accommodation of the lateral stress by the boundary fault salt pillows. Such an accommodation of stress by the salt is described by Jenyon (1986) and Davis & Engelder (1987).
Tertiary
The Arne Diapir in particular evolved primarily in the Tertiary, with halokinesis continuing into the Quaternary. The diapir seems to be totally detached, or has only a very small salt stock left behind connected to the underlying salt pillow, and the Zechstein salt is fully within the Chalk as an elongated feature. Channels above the Top Middle Miocene Unconformity surface, which follow the axis of the pre-Tertiary basins, occur particularly in the
Søgne Basin area, although they also exist in the Tail End Graben. Lines parallel to the axis of the basins do not show as many channels as dip lines, but those which do seem to avoid underlying salt pillows/diapirs, indicating either differential compaction and/or further salt movements at mis time.
Dynamical motion of the Lulu-1 salt diapir Overview
The presence of salt in the subsurface plays an important role in sedimentary basins. Three major properties of salt cause the dynamical evolution of subsurface salt bodies to impact significantly on basin evolution. On a geological time scale salt flows as a nearly incompressible fluid under applied stress, thereby both distorting sedimentary patterns and influencing further basin evolution. The density of salt (2.2 gem-3) is intermediate between sediment density at deposition (1.6-1.9 gem"3) and the density of fully compacted sedimentary formations (2.6-2.8 gem"3). The density of salt varies little during burial under an increasing overburden weight. Thus at some point in a basin's evolution the salt will become buoyant and will attempt to rise up through the overlying formations. Furthermore salt has a thermal conductivity two to three times greater than that of "typical" sedimentary formations, causing salt bodies to act as conduits for heat transport from depth. When salt bodies occur as domes with large vertical relief, they provide a path of low thermal resistance for the conduction of heat to the surface (O'Brien & Lerche, 1987). The thermal conductivities of "typical" sedimentary rocks lie in the range of 1.5 Wm-'-C"1 to 2.5 Wm-10C-' whereas halite has a thermal conductivity of about 6 Wm"ICC"' at room temperature decreasing to about 4.5 Wirr^C"1 at 50°C-100°C (O'Brien & Lerche, 1988). The presence of salt in the subsurface can therefore result in a significant disturbance of the thermal conditions in the vicinity of the salt body, with the magnitude and spatial distribution of the temperature anomaly depending mainly on the size, shape, and burial depth of the salt body.
Relative to the salt being stationary, sediments transit-
Flg.24 Frgs42441 Fig. 27 Figs49440 Ffcj.26 Fig. 56 Fig.16
Fig. 36. Geoseismic section. Note the configuration of the Triassic sequence from the Søgne Basin to the Tail End Graben. Reflector names are given in Table 1. For location of line see Fig. 3b.
DK1-421B (striks Nro)
Bulletin of the Geological Society of Denmark 221

Fig. 37. Seismic expression of the Zechstein sequence in the northern Central Graben (from Gowers & Sæbøe, 1986).
ing past the top of the salt will find themselves in an anomalously high thermal regime. Their maturity will be increased accordingly. Rapid transit means little time is spent in the anomalous zone and so little excess maturity develops, while slow transit implies a long time in the anomaly regime and a correspondingly high excess maturity. Thus by measuring the anomalous behavior (relative to regional) of a thermal indicator (vitrinite reflectance in this case) in the vicinity of a salt diapir we can figure out the speed of sediments relative to salt most consistent with the observations. Then by adding in the known sediment deposition rate we can figure the absolute velocity of salt through the sediments.
We show here how this procedure operates for the case history of the salt diapir at the Lulu-1 well (Fig. 1) in the Søgne Basin of the northeastern Danish Central Graben.
Theory
A simple analytical model describing the heat flow and temperature distribution in the vicinity of a salt dome embedded in a semi-infinite uniform medium (O'Brien & Lerche, 1987; 1988) illustrates the magnitude and expected spatial distribution of the thermal anomaly induced by the highly conductive salt.
The analytical model of O'Brien & Lerche (1987, 1988) assumes a steady-state heat flow and that heat is transported by conduction only.
Solution of the general heat flow equation:
V(kVT) = -S (1)
where k is the thermal conductivity, T the temperature,
and S describes the spatial distribution of heat sources, is simplified by two basic assumptions. First, constant thermal conductivities both within the salt and in the surrounding sediments are assumed, and second it is assumed that there is a uniform conductive heat flux across the basin, giving a constant vertical heat flux throughout the basin in the absence of a salt dome.
A cylindrical salt body in a semi-infinite medium of uniform thermal conductivity (Fig. 60) was used by O'Brien & Lerche (1987, 1988) to describe the thermal anomaly induced by salt. A set of appropriate boundary conditions is chosen in order to solve the temperature profile. The sediment surface is considered a constant temperature surface. Since the influence of the salt is a localized effect, a constant vertical heat flux at large distances (r—»<») from the salt dome is expected. A constant vertical heat flux far beneath the salt dome (z—>°°) is also expected. The temperature across the sediment-salt interface must be continuous since the thermal conductivity is finite. Finally, the component of heat flux normal to the sediment-salt interface must be continuous across the interface since no heat generation or loss takes place. A detailed development of the analytical model is given in O'Brien & Lerche (1987). Figure 61 shows the distortion of isotherms due to a cylindrical salt body of radius 600 m and height 3000 m which is buried to a depth of 1500 m (from O'Brien & Lerche, 1988). A significant increase in temperature is seen at the top of the salt (roughly 20°C) due to the thermal focusing of the salt. The effect is seen to disappear laterally over a distance of about two radii away from the edge of the salt and vertically over a distance of about one radius away from either the top or bottom of the salt body.
Now stand on a reference frame in which the salt is stationary and the sediments are moving downward vertically, past the top of the salt at a relative velocity, vrei. If vrel is large, then the sediments spend little time in the vicinity of the enhanced temperature regime near the top of the salt, accordingly their maturity is but little changed from the regional behavior far from the salt. On the other hand if vrel is small (or zero) then the sediments spend considerable time in the enhanced thermal regime around the salt top, and so their maturity is increased relative to the regional maturity far distant from the salt. Thus by measuring the anomalous increase in maturity of a thermal indicator in the vicinity of the top of a salt diapir we can invert the procedure to determine the relative velocity which is most consistent with the observed behavior. The detailed mathematical procedure for performing this inversion is given in Thomsen & Lerche (1991).
Before we turn to application of the theory outlined in Thomsen & Lerche (1991) it is appropriate to consider the dynamics of salt diapirism in general. As mentioned in the introduction, salt maintains a constant density of ~2.2 gem"3 during burial whereas clastic sediments have lower densities (1.6-1.9 gem-3) at deposition due to a high porosity. The rock density, pR, reflects the density of the matrix material pm, the density of the formation fluids,
222 Bulletin of the Geological Society of Denmark
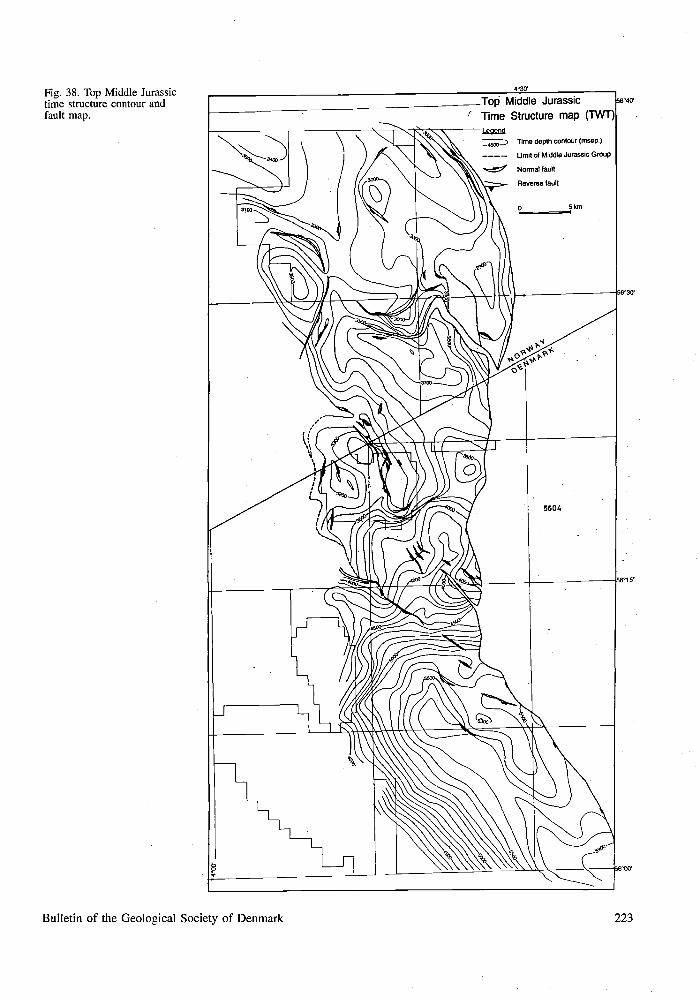
Fig. 38. Top Middle Jurassic time structure contour and fault map.
Bulletin of the Geological Society of Denmark 223

56"30.'
Fig. 39. Isopach map, in 140. milliseconds two way time, of the
Middle Jurassic group.

Fig. 40. Geoseismic section showing a wedge-shaped Middle Jurassic sequence. Note the ramp at the Coffee Soil Fault. Reflector names are given in Table 1. For location of line see Fig. 3b.
Fig. 25 Fig. 27 Fig. 49
— ' ' T - 1
Fig. 17 Fig. 56 Fig. 50
Fig. 36
;'','' V; •'•'?, '/Skfn '/':''':/'/'•,
Pi, and the porosity <&, and may be expressed as (Lerche & O'Brien, 1987)
PR = Pm(l-*) + Pf* (2)
From equation (2) it is seen that for typical values of pm
(2.6 - 2.7 gem"3) and pf (1.0 gem-3) the formation density pR is greater than that of halite (2.2 gem-3) for porosities less than 27% - 30% (Lerche & O'Brien, 1987). Thus with increasing depth the rock density will eventually equal, then exceed, the density of the salt, resulting in an upward buoyancy force exerted on the salt. Upon further burial, salt deposits will develop into diapiric structures (see Thomsen & Lerche (1991) for details).
Following the procedure described in Thomsen & Lerche (1991), we calculate a critical overburden thickness, HCrjt, which is the height of the sediment column at which the critical porosity is encountered. Values of critical height ranging from 900-1200 m for Gulf Coast shales (Atwater & Miller, 1965), and 2700 m - 3300 m in Louisiana sandstones (Lerche & O'Brien, 1987), have been reported. These numbers are minimum estimates, other factors, such as the strength of the surrounding formations and overpressured regions, may delay initiation of diapirism. The general relationship between the height of the overburden and the height of the salt diapir
is illustrated in Fig. 62. Once the critical height is reached the salt will rise with a velocity of roughly twice the sedimentation rate until a buoyant equilibrium is reached (Lerche & O'Brien, 1987).
The Lulu diapir
The Lulu-1 well is located offshore in the NE part of the Danish Central Graben area (Fig. 1). The well was drilled in 1980 as an exploration well, on top of a N-S trending anticline resulting from rising salt of presumably Triassic or Permian age. The total depth is recorded as 3690 m. The primary target was Danian/Maastrichtian chalk and had Middle Jurassic sands as a secondary target (Frandsen, 1986).
Two unconformities are recognized in the Lulu-1 well, one separating the top of the Upper Jurassic shales from Cenomanian chalks, and another marking the boundary between the Zechstein Group and Middle Jurassic sandstone. A general stratigraphic column is shown in Fig. 63.
The top of the salt is currently at a depth of 3669 m below the sediment-water interface. The salt is roughly 1500 m wide and has a height of 3000 m ± 300 m based on seismic - the base of the salt is difficult to recognize on seismic (Fig. 64). These dimensions are consistent
Fig. 42 Fig. 27 Fig. 56 ENE
Fig. 41. Geoseismic section. Note closure at Middle Jurassic level and the ramp at the Coffee Soil Fault. Reflector names are given in Table 1. For location of line see Fig. 3b.
Bulletin of the Geological Society of Denmark

Fig. 49 Fig. 41 Fig. 36 Fig. 27 J l_
Fig. 42. Geoseismic section. Note closure at Middle Jurassic level and the ramp at the Coffee Soil Fault. Note also the "downlap" at the Upper Jurassic level which is onlap on Fig. 49. Reflector names are given in Table 1. For location of line see Fig. 3b.
with other published observations (e.g. Møller, 1986; Michelsen et al; 1987). As seen from the stratigraphic column parts of the stratigraphy are missing in the Lulu-1 well. However, a reconstruction of the sedimentation is necessary in order to obtain an idea of the dynamical evolution of the salt diapir after deposition of the evapo-rites.
Triassic sedimentation reached thicknesses between 250 and 2000 m in the Danish Central Graben (Bertelsen, 1980; Jacobsen, 1982; Fisher, 1984). A mixture of shales, sandstones, and local evaporites in red-bed facies (Jacob-sen, 1982), comprises the Triassic sequence. Following the Triassic, Jurassic sediments, mainly shales, were deposited in the Central Graben area, with 4000 m reported from the Southern Danish Central Graben, decreasing northwards to about 1200 m on the Norwegian side (Koch et al.; 1982). Based on seismic data the Triassic and Jurassic sediment thickness of Bertelsen (1980) seems to be too low and an estimate of 2000 m ± 200 m of Triassic sediments, and 1500 m ± 150 m of Jurassic sediment in the Lulu area seem appropriate. We use these estimates in our considerations of the dynamical evolution of the Lulu salt. In view of the overburden thickness (see Fig. 62), and assuming a mixed lithology consisting of 80% sand and 20% shale, the critical height for initiation of diapirism in the Lulu area was apparently reached at the end of Triassic to Early Jurassic time. From Fig. 62, Hcri, is around 2200 m for the above proportions of sand and shale, and assuming that the sediments have no strength. Additional sedimentation would then cause the salt to rise with a velocity of roughly twice the sedimentation rate. Sedimentation during the Jurassic of 1500 ± 150 m would then lead to development of a salt diapir of a height of about 2500 m ± 300 m by the end of the Jurassic, again assuming equilibrium and no sediment strength.
A scenario has now been established that leads us back to the original considerations of thermal anomalies and excess maturity caused by salt. The measurements of
temperature and vitrinite reflectance in the Lulu-1 well extend into the top part of the Upper Jurassic shale formation. Both the temperature profile and the vitrinite reflectance profile have been compared to similar measurements from the well Q-l which is taken as a "normal" well far from the salt. Figures 65 and 66 show the temperature anomaly and excess maturity, in terms of vitrinite reflectance, respectively, the effect of the salt is manifest. The temperature anomaly at the salt-sediment interface is ~30°C (depth of about 3600 m) with the anomaly disappearing at a shallower depth of 1700 m (Fig. 65). The excess vitrinite reflectance maturity is 0.2 at 3600 m depth decreasing to zero at around 3000 m (Fig. 66).
Following the procedure outlined in Thomsen & Lerche (1991), the observed thermal anomaly and excess maturity yield the relative velocity of sediment to salt. The calculations were performed using two different values for the vitrinite reflectance at deposition; R* = 0.2% and R* = 0.25%. Using R* = 0.2 the calculations yield a relative velocity of 5.9 mMa"1, while for R* = 0.25 the velocity obtained was 4.2 mMa"1, for a mean estimate of 5 ± 1 mMa-1.
A relative velocity of salt to sediment of 5 ± 1 mMa"1
yields, over a 130 Ma time period, an additional movement of the salt of 650 m ± 130 m since the end of Jurassic time. This gives a total height of the salt of 3150 m ± 430 m at the present day. This result is consistent with the measured thermal anomaly on top of the Lulu salt. From O'Brien & Lerche (1987, 1988) a salt dome of height 3000 m, diameter 1200 m, would result in a thermal anomaly of about 22°C. The observed 30°C anomaly therefore points towards a height slightly greater than 3000 m.
226 Bulletin of the Geological Society of Denmark

Fig. 43. Structure contour and *jw fault map of the Late Cimmerian unconformity (Base Cretaceous).
Bulletin of the Geological Society of Denmark 227

Fig. 44. Isopach map, in milliseconds two way time, of the Upper Jurassic group.
228 Bulletin of the Geological Society of Denmark

Fig. 45. Seismic sections showing the appearance of the ramp along the Coffee Soil Fault. Top section (SP82-8 (A) is a dip-section and bottom section (SP82-31 is a strike section. See also Figs 49 and 56.
Discussion Sensitivity analysis
Model descriptions of both the present day thermal anomaly and accumulative maturity indicator (vitrinite reflectance) are used in the equations for the relative velocity of sediment to stationary salt. The sensitivity of the result to uncertainties in the input parameters (measured or assumed) is then a necessary exercise. For instance, as already demonstrated, a change of the assumed surface vitrinite reflectance value bracketed the accuracy of the assessed relative velocity to 5 ± 1 mMa-1. Uncertainty in determining the normal maturity profile, RN(Zi), produces a similar impact, while an error in age determinations of ± 10% on all ages will induce an error on the resulting velocity of ± 2 mMa-1. Errors in the excess temperature do not influence the result significantly. An error of ± 10% in all temperature measurements only gives an error of ± 0.6 mMa-1, and the same order of
• Bulletin of the Geological Society of Denmark
error occurs for a 10% error on the excess vitrinite reflectance maturity determinations. Thus a relative velocity of 5 ± 1 mMa"1 is a ruggedly stable estimate, insensitive to minor variations and uncertainties.
Dynamics
Considerations of salt dynamics and the assessment of salt motion allows a reconstruction of the dynamical evolution of the Lulu salt diapir. Earlier an assessment of the evolutionary stages of the Lulu salt diapir was provided. Figure 67 compares that evolution relative to the equilibrium evolution of the salt diapir. Until the end of the Jurassic the diapir apparently developed under equilibrium conditions. It reached a total height of 2500 m with the top of the salt at, or near, the neutral buoyancy point and buried to a depth of 1000 m. The Early Cretaceous was a period of non-deposition and the diapir was at rest. Deposition of the Late Cretaceous chalks applied a renewed overburden on the system with a resulting buoyancy drive on the salt. The salt, however, did not move to a new neutral buoyancy position during the Cretaceous, but moved only 280 m at a much slower speed (4 ± 1 mMa"1) to a total height of 2780 m ± 370 m by the end of the Cretaceous. The position of the equilibrium neutral buoyancy point would require the salt to move upward an additional 900 m upward during the Cretaceous. Some resistive force caused the salt to slow down. Two factors act as brakes on the salt motion: i) strength of the sediment to resist the buoyancy pressure from the salt, and ii) the deposited sediment acts as a seal, preventing escape of fluids vertically out of the system, thereby forcing the sediments to maintain their porosity until escape of fluids is possible. Both factors would play a role in preventing the Lulu salt from reaching the neutral buoyancy point.
Sedimentation of clastic sediments at high rates continued during the Tertiary and Quaternary, adding to the overburden acting on the salt. The salt, however, continued to move only slowly with an additional uprise of 300 m ± 60 m relative to its surrounding sediments. For a period of 30 Ma from Late Paleocene to Late Oligocene, the salt also pushed the overlying sediments into a dome structure, roughly 250 m high, leaving the salt at its present day level, buried under 3669 m of sediments. To hold down the salt the sediments must be able to resist a significant pressure whether due to buoyant salt pushing upward, or due to fluid overpressure in the deeper buried sediments. The differential pressure AP exerted (which is the pressure that the rock unit must be able to support) can be calculated from (O'Brien & Lerche, 1988)
AP = g[H (pR - p.) - (pR - p.) * . Le-^Hl - er™-)] (3)
where g is the acceleration due to gravity, pR is the rock matrix density, ps is the density of salt, pw is the density of water, <£>s is the surface porosity, L a scaling length for exponential compaction law (~2000 m for shale), h is the
229

Middle Kimmeridgian palaeogeography
I I s.« E23 Smidyficle«
Fig. 46. Ramp evolution in the Danish Central Graben in Kimmeridgian time. From Michelsen et al. (1992).
sediment height above the salt, and H is the total height of the salt.
In the extreme situation where the sediments are fully compacted, equation (3) can b written as
AP(max) = gH(pR - ps) (4)
The other extreme is AP = 0, corresponding to fluid overpressuring always maintaining the porosity at fixed values from the depth to the top of the salt to the basal mother salt depth. For pR = 2.6 gcnr3, ps = 2.2 gem"3, H = 3000 m, and g~10ms - 2 , equation (4) yields AP (max) = 1.2 x 10⁷ Pa (—120 atm) corresponding to a buoyancy pressure gradient of 4000 Pam"1. The actual buoyancy pressure can be less than or equal to the maximum com-
230 Bulletin of the Geological Society of Denmark

Fig. 47. Mid to Late Jurassic structural framework (top) and distribution of Upper and Lower Cretaceous (bottom) in the northeastern Danish Central Trough. From Michelsen et al (1992).
puted above. But any decrease in buoyancy pressure must be accounted for by an increase in fluid overpressure. For a normal compacting sedimentary column the differential pressure, AP, exerted by the salt on the overlying sediments is 90 x 105 Pa (~90 atm) which is indeed bracketed by the magnitude of AP(max). This argument also suggests that a minimum of 30 x 105 Pa (—30 atm) of salt buoyancy pressure must be compensated for by overpressure of comparable magnitude in the surrounding shales.
Bulletin of the Geological Society of Denmark
Basin analysis assessment of hydrocarbon predictions for the northern Danish Central Graben in relation to structural and thermal evolution Overview
The importance of quantitative evaluation of thickness changes in sediments during burial becomes evident in the processes of assessing fluid flow, thermal history and hydrocarbon accumulations in sedimentary basins. Isos-tatic approaches to the problem prescribe a fixed porosity function of depth for all time (Rubey & Hubbert, 1959; Perrier & Quiblier, 1974; Sclater & Christie, 1980; Bond & Kominz, 1984; Guidish et al.; 1985; Bessis, 1986).
However, an isostatic approach does not model the actual process of compaction. Accordingly dynamical fluid flow models have been suggested as more appropriate (Welte & Yukler, 1981; Ungerer et al., 1984; Cao et al., 1986; Cao & Lerche, 1987) to account for the water expulsion from sediments during burial. The models also predict drainage paths and build-up of abnormal pressure due to permeability variations with lifhologic type, porosity, and position in the basin.
In the following, a one dimensional fluid-flow model (Cao et al., 1986; Cao & Lerche, 1987) is applied to the northern part of the Danish Central Graben (Figs 1 & 68). The model consists of three separate components including geohistory, thermal history, and hydrocarbon generation models.
The geohistory model reconstructs burial history, basement subsidence, vertical fluid flow, and changes in porosity, permeability, pressure, and fluid flow rate with time and depth. It is possible to simulate cementation, dissolution, and fracturing due to abnormally high pore pressure. The flow chart in Fig. 69 outlines the geohistory model.
The thermal history model evaluates the heat flow change through time and gives the temperature evolution with time and depth. It is also possible to predict a series of maturity indicators behavior with any given burial history.
The hydrocarbon generation model simulates hydrocarbon generation based on the kinetics of kerogen degradation. Two options are available (i) following the scheme of Tissot & Welte (1978), or (ii) following the scheme of Cao et al. (1986) and Cao & Lerche (1987) (Fig. 70).
Fluid flow-compaction models are relatively new and powerful tools in basin analysis and, when used in integrated studies, can enhance understanding of the way basins evolve with respect to sedimentation, fluid-flow, tectonics, heat flow, and hydrocarbon generation. However, a model cannot encompass every aspect of the entire system at the same time, but is confined to representing a simplified version of the real world. Strategies therefore have to be tailored according to the available
231
15*

Fig. 13 Fig. 48. Geoseismic section showing the transition zone from the southern Søgne Basin into the northern Søgne Basin. Reflector names are given in Table 1. For location of line see Fig. 3b.
data, scale of modelling, and the type of model to be applied. In this case we chose the simplest type of model (one-dimensional) and applied it to a fairly complex area to see to what extent the model predictions would fit with observations.
Depositional facies and sedimentation rates
The Central Graben is a complex multi-stage rift system comprised of several highs, grabens and half grabens. Figure 68 shows the study area with the commonly used division into structural elements based on the base Cretaceous structures (Vejbæk & Andersen, 1987).
As mentioned earlier the structural evolution is believed to have initiated in the Permian or earlier but, due to lack of good well- and seismic control of the pre-Permian basinal areas, it is at present not possible to conclude to what extent the system was active at this time. However, presence of Rotliegendes volcanics in the Central Graben (Fig. 6) indicates an early rifting stage prior to deposition of the Zechstein evaporites. The present day outline of the Zechstein sequence (Fig. 10) reveals deposition in a narrow graben trending NNW through the Tail End Graben - Søgne Basin and in the
Feda Graben. The dominant lithologies in the Rotliegendes were volcanics and redbeds, while the Zechstein transgression resulted in marginal shallow water carbonates and thick evaporite sequences (Andersen et al., 1982).
The structural framework, initiated in the Permian, continued into the Triassic. However, the Triassic was marked by a regional regression and return to a continental depositional regime with deposition of sandstone, shale and evaporites in red bed facies (Jacobsen, 1982). Due to scarcity of both well data and good seismic resolution, combined with erosion during the Middle Jurassic tectonic events, very little can be said about the original sediment distribution and tectonic setting in parts of the Central Graben.
During the Early Jurassic time the Danish Central Graben subsided strongly with deposition of a uniform marine claystone (Koch et al., 1982). At the end of the Early Jurassic the Mid Cimmerian tectonic phase induced renewed block faulting in the Northwest European graben systems. Uplift in the central North Sea caused some erosion and left Early Jurassic sediments only in local basins (Andersen et al., 1982). Following the Mid Cimmerian tectonic event a continental depositional regime dominated the Danish Central Graben area with deposi-
WSW Fig. 42 i
Fig. 27 Fig. 40 Fig. 56 ENE
SP82-8(A) Fig. 36
o -4
Fig. 49. Geoseismic section. Note the internal configuration of the reflectors in the Triassic, Middle Jurassic and Upper Jurassic sequences. Reflector names are given in Table 1. For location of line see Fig. 3b.
232 Bulletin of the Geological Society of Denmark

Fig. 50. Geoseismic section. Note Middle Jurassic depocenter in the middle of the halfgraben. Reflector names are given in Table 1. For location of line see Fig. 3b.
Fig.« Fig. 36 Fig.27 Fig.5S Fig. 40
SP82-10&10A
tion of interbedded sandstones, claystones and sandy-siltstones. Transgression gradually changed the deposi-tional regime to an open marine environment with deposition first of marginal silt and clay stones and later deposition of dark shales with high organic content in a deeper shelf environment with high organic production and restricted bottom circulation, (Koch et al., 1982). Middle Jurassic rift initiation was associated with syn-rift sediments along the Coffee Soil Fault and Late Jurassic rifting caused a separation of the Søgne Basin and the Tail End Graben. The Late Jurassic tectonic event gave rise to a widespread diachronous unconformity (Late Cimmerian Unconformity) which in large parts of the basin constitutes the boundary between the Upper Jurassic and Lower Cretaceous strata.
Transgressional sedimentation is evident from on-lap sequences on seismic sections, although internal unconformities occur close to the fault zone at the western margin of the Tail End Graben suggesting tectonic activity in this area during the Early Cretaceous (Andersen et a l , 1982). The depositional regime is marine with deposition of grey claystone, marls and rare marginal sandstone (Hansen & Buch, 1982). Strike-slip movements occurred along the boundary faults of the Gertrud and Arne-Elin Grabens.
A marked change from predominantly siliciclastic sedimentation to deposition of chalk occurred during the late part of the Early Cretaceous. Compressional and wrench induced inversion of previously tensional sub-basins dominated locally during the Late Cretaceous - Early Tertiary.
Regional subsidence continued and, during the Tertiary and Quaternary, the basin subsided evenly and rapidly. More than 2-3000 m of sediments were deposited during the last 60 Ma. This uniform subsidence pattern was disturbed only by minor tectonic events and, locally, by halokinetic movements. The Early Tertiary sedimentation was mainly clay dominated while sand and silt intercalations increase towards the Late Tertiary (Andersen et al., 1982).
Well data
Data from a number of publicly released wells together with synthetic data from pseudo-wells comprise the foundation of this work. Pseudo-wells are wells "drilled" on seismic sections, converted to depth, then assigned lithologies and ages from well ties. Input parameters such as surface temperature and bottom hole temperature (BHT) together with model parameters such as the heat flow history constant, beta, and the thermal indicator conversion constant, alpha, that links the time-temperature-integral (TTI) to a thermal indicator value are obtained from contour interpolation.
A large amount of data is available in the public domain from real wells and the types of data used are summarized in Table 4. The distribution of wells and pseudo-wells is shown in Fig. 68. The unevenly distributed wells with data have many of the structural elements represented. To improve the data distribution and to include all structural elements, the seismic survey RTD-81 shot by GECO has been used for "drilling" the pseudo-wells. Dating of the individual reflectors is based on a correlation of biostratigraphy and seismic markers for selected wells in the northwestern part of the Danish Central Graben (Stouge, 1988). For depth conversion of the seismic sections an average interval velocity for each sequence has been chosen for simplicity. In Table 5 reflector ages, lithologies derived from well ties, and the interval velocities used are shown. The temperature-depth relations at the pseudo-wells have been derived from earlier temperature mapping of the Danish Central Trough (Jensen, 1983).
Burial history - geohistory
Because of the uncertainty of the ages of the deeper seismic markers and poor seismic resolution below 3.5 to 4.5 sec on most sections, the reconstructed burial histories extend only to Late Jurassic time. The subsidence pattern of a given time period in a basin is often visual-
Bulletin of the Geological Society of Denmark 233

. „„ Fig. 51. Top Lower Cretaceous time structure contour and fault map.
234 Bulletin of the Geological Society of Denmark

Fig. 52. Isopach map, in milliseconds two way time, of the Lower Cretaceous group.
Bulletin of the Geological Society of Denmark 235
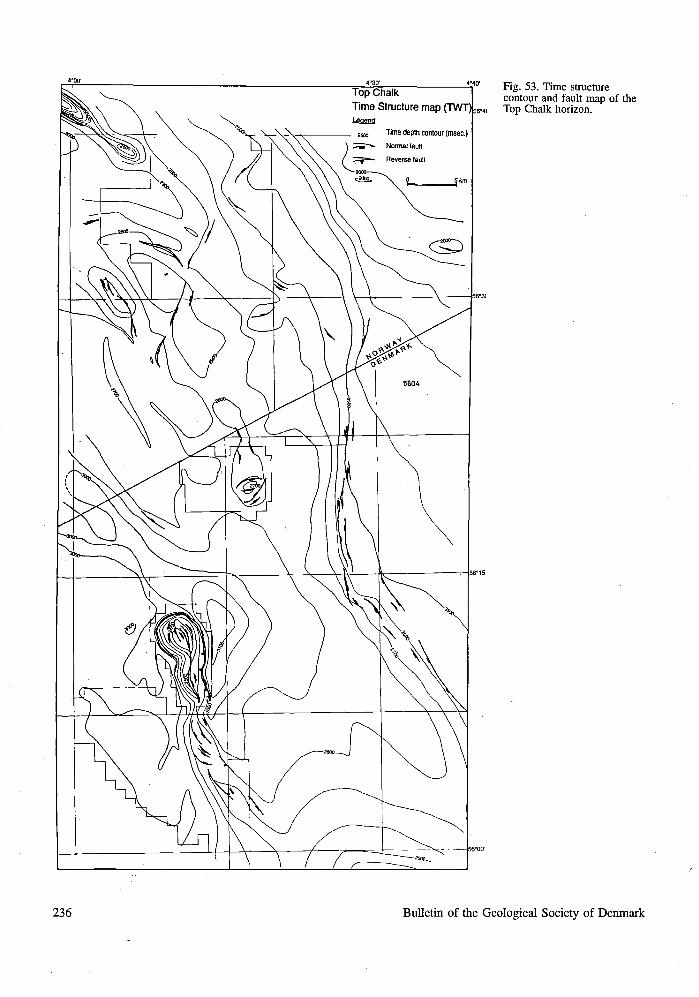
Top Chalk Time Staicture map (TWT)|
!5M Time depth contour (msec.)
^ - Normal fault
•— Reverse fault
Fig. 53. Time structure contour and fault map of the
|5S.4i Top Chalk horizon.
236 Bulletin of the Geological Society of Denmark

Fig. 54. Isopach map, in milliseconds two way time, of the Chalk group.
Bulletin of the Geological Society of Denmark 237

-56°15'
Fig. 55. Sketch map showing inversion zone in the Tail End Graben. Width of zones indicate intensity of inversion. See Fig. 2 for location of map.
ized by use of isopach maps of the different formations. The subsidence pattern revealed by isopach maps can however be influenced by differential compaction in the basin and therefore not represent the "true" subsidence pattern. To avoid this problem the subsidence patterns are expressed in terms of contoured basement subsidence rates (measured in m/Ma) for given time periods. This mapping allows for an interpretation of the subsidence patterns in terms of tectonic activity of die basement.
The contoured Late Jurassic basement subsidence rates (Fig. 71a) exhibits the characteristic outline of strong differential subsidence e.g. several distinct areas with closed contours. Rates of more than 30 m/Ma occurred in the Tail End Graben and along the Arne-Elin Trend. In the northern Gertrud Graben a total basement subsidence of about 1100 m at rates of over 40 m/Ma occurred. The Søgne Basin and the eastern part of the Gertrud Graben both subsided at lower rates than the Tail End Graben. The Heno plateau underwent subsidence at intermediate rates (15 m/Ma).
The Early Cretaceous was dominated by low to intermediate basement subsidence rates (5—15 m/Ma) throughout the area. During the early Late Cretaceous the subsidence pattern (Fig. 71b) became more uniform in character. The major subsidence occurred south of the Gertrud Graben. The Heno Plateau and the Gertrud Graben subsided at 17-24 m/Ma. Most activity along the Jurassic faults ceased, although renewed movement (inversion) along the faults Arne-Elin Trend are inferred by the markedly lower subsidence rates along this trend. This subsidence pattern continued with only minor changes throughout the Late Cretaceous Maastrichtian through Early Tertiary. The post Danian Tertiary was dominated by rapid regional subsidence, with a minor quiet period from Early Miocene to Late Miocene. The most rapid subsidence was from post Middle Miocene (Fig. 71c) to Present, where the basement subsided more than 1100 m at rates ranging from 55 m/Ma to near 300 m/Ma in the Pleistocene.
Modelled porosity, permeability and fluid pressure
The changes in porosity, permeability, fluid pressure and excess fluid pressure were modelled in order to evaluate the fluid flow pattern within the sedimentary package. A preliminary study showed that both hydrocarbon generation and build-up of excess fluid pressure was insignificant prior to Paleocene time (R. Thomsen, 1989) therefore only the time from Paleocene to present day will be treated here. Similarly since the main source rock is the Kimmeridge Clay equivalent, Farsund Formation, the focus is on possible migration of hydrocarbons out of this Upper Jurassic shale sequence.
As a basis for the evaluation of the fluid flow pattern, contour maps of porosity, permeability, fluid pressure and fluid excess pressure were produced for a series of ages ranging from 60 MaBP to present day at different levels of the Upper Jurassic shales. Only a few of these maps are presented here as examples.
The top to bottom variation in modelled porosity within die Upper Jurassic decreases from 60 MaBP to the present day: from 47% (top) to 27% (bottom) at 60 MaBP; and from 32% (top) to 17% (bottom) today. Two low porosity areas are in the central Tail End Graben, and in the Feda and Gertrud Grabens, consistent with the areas of maximum subsidence. The modelled present day porosities lie within the range of porosities for the same
NNW F i » . 1 6 * ° X
SP82-31 & 31/1 (Strke lino)
™>y''<m{ffltMMW/(""///"""//W//''/-,</<
\ / \ " / \ "~ --̂ .
^TxJ^TÉ^ . A T V ^ * ?
Fig. 26
fTCH™nn™
Fig. 49 Fig. 17 Fig. 50
Fig. 40 Fig. 41
g||p^^^
Fig. 24 Fig. 42
mmmmmv
Ssfesb.-^sls
Fig. 18 ggg
J gp^i" I T : 1 ? 2 - " ; • p ^ = £ ^
;, /:yw..v-''
Fig. 56. Geoseismic section showing chalk depocenter in the southern Søgne Basin. Note also the Late Jurassic ramp along the Coffee Soil Fault. Reflector names are given in Table 1. For location of line see Fig. 3b.
238 Bulletin of the Geological Society of Denmark

Fig. 57. Seismic expression on dip lines of Late Miocene channels (arrowheads), a. Seismic line SGT8606-4201/ 5201 from the Søgne Basin, b. Seismic line RTD81-23 from the Tail End Graben (see also Fig. 13).
7?.Q0 7250 7350
imiWHMI'l|;!lt|lil;U:li.«liMW»;aitiWli£MttW,i L ^ j S A f e ^ ^ ^ liiX
f TOIfllP
formation (3% - 30%) assessed from wireline logs in different wells throughout the Danish Central Graben area (Michelsen, 1982).
The changes in modelled permeability range from 2.10 mD to 0.20 mD at 60 MaBP, and from 0.35 mD to 0.10 mD at present. A permeability of 3 mD at a depth of 3300 m in Middle Jurassic sandy shale is recorded from the Jurassic south of the study area (Michelsen, 1982) indicating that the modelled permeabilities for the Upper Jurassic shales lie within a reasonable range. The modelled permeabilities may be slightly too low and the actual permeabilities are sufficiently high for generated hydrocarbons to migrate out of the source rock.
Excess fluid pressure, defined as the difference between the actual fluid pressure and the hydrostatic pressure at any particular depth, is the driving force for fluid
flow within a basin, with fluids flowing from high excess fluid pressure towards low excess fluid pressure. In most cases the excess fluid pressure decreases upwards resulting in a vertical drive on the fluids. In a similar way lateral excess fluid pressure differences will result in a lateral drive on the fluids. Excess fluid pressure maps then allow for an interpretation of the lateral drive on the fluids which impacts on potential migration paths for hydrocarbons. The excess fluid pressure in the Upper Jurassic shales underwent significant build-up between 60 MaBP and present day without any significant change in the spatial distribution of anomalous fluid pressure. The calculated excess fluid pressure pattern was investigated in different depths, 5000 m, 4000 m (Fig. 72a), 3000 m, and 2500 m (Fig. 72b) in order to reach an assessment of the fluid flow pattern around the Upper
Bulletin of the Geological Society of Denmark 239

I 150 1050 Fig. 58. Seismic expression on a strike line of Late Miocene channels avoiding highs. Seismic line ST8716-403 (see also Fig. 11).
Jurassic shale. Areas of low excess fluid pressure are located in the Søgne Basin around the Lulu-1 well, across the southern Tail End Graben from the Adda wells to the wells H-l and Bo-1, and in the Arne-Elin Graben around well 1-1. Whereas areas of high excess fluid pressures are located in the deep parts of the central Tail End Graben, and in the Gertrud Graben and Feda Graben, indicating a
z = 0 Constant temperature surface
TD(r,z) SEDIMENT
z = - d TB(r,z)
K2
Constant vertical heat flux TQ (r,z) far away from salt dome
^ ^ T̂ *v ^ ^
Fig. 60. Cylindrical salt body buried in a semi-infinite medium. Fig. 59. Seismic expression of Paleocene (bottom arrow) and The figure shows the scenario for development of the analytical Miocene channels (top arrow) close to the Lulu salt structure model of O'Brien and Lerche (1987, 1988) (after O'Brien & and its northwestern continuation. Seismic line ST8716-2I6. Lerche, 1987).
240 Bulletin of the Geological Society of Denmark

RADIAL POSITION (m)
1000 1500 2000 2500
6000
Fig. 61. The focusing of heat (distortion of the isotherms) due to presence of a salt body of radius 600 m and height 3000 m, buried to a depth of 1500 m (after O'Brien & Lerche, 1987).
lateral drive for flow of fluids out of the central Tail End Graben, Gertrud Graben, and Feda Graben towards the areas'of low excess fluid pressure (Fig. 73). A significant overpressuring of the mature Farsund Formation in the Tail End Graben has been suggested to play an important role in long range migration out of the Tail End Graben towards the the Southern Salt Dome Province (Damtoft et al., 1987).
Thermal history
The thermal history is assessed by inversion (Lerche, 1988a, b) of measured vitrinite reflectance with depth for several wells (Table 4) using an exponential heat flux relation:
Q(t) = Qoexp(pt) (5)
where Q(t) is the basement heat flow and Q0 is the present day heat flow, t is time and (3 is a constant determined by minimizing the difference between predicted and measured vitrinite reflectance with depth (Lerche et al., 1984). Plots of predicted and measured vitrinite reflectance (Fig. 74) for the nine wells with Ro data all show very good fits of predicted Ro to measured R0. There is, however, a systematic misfit at the top with the predicted Ro too low which can be due to some surface erosion or that the modelled depositional surface value of RQ = 0.2 is too low.
The present day heat flow, Q0, is derived from down-
6000
5500
5000
4500
4000
3500
3000
2500
2000
1500
1000
500
0
i
•
:
: !
I 1
»- 1
i i 'i i f
/ J
/ / / /
/
/ / / J
t /P f/é
. . . . . . . . . . i .
1000 2000 3000 4000
Sediment overburden H (m)
5000 6000
Projected overburden lithology from the Søgne Basin
Fig. 62. Schematic diagram showing the relationship between overburden and height of a salt diapir for different lithologies, assuming no resistance from the sediments. (1) Shows the actual dynamical evolution of the Lulu salt and (2) shows the perfect equilibrium path which would have caused the salt to be at the surface at the present day.
WELL: Lulu -1 Danish Central Graben
ft.
314
2722 2823
3215 10645
3540 11712 .3669 12134 3690 12206
§ea level ea floor
Quaternary
Tertiary
Upper Cretaceous
Upper Jurassic
C • Middle Jurassic Zechstein Group
Legend
| ] SiWSiltstone
^ ^ Clay/Shale
f**^j Marl/Marlstone
| j j j Rocksalt
| v w | Volcanics
• Oil + Gas
C Coal - lignite
Fig. 63. Lithological column of the Lulu-1 well, (from Well Data Summary Sheets, Geological Survey of Denmark).
Bulletin of the Geological Society of Denmark 241

Lulu-1 where K = Km(Kw/Km)* (7),
Fig. 64. (a) Geoseismic section across of the Lulu-1 salt diapir (from line RTD81-20). (b) Interpreted and depth converted section used in the calculations.
hole temperature logs (real wells), and by contour interpolation (pseudo-wells) using the relation (Lerche, 1988b):
dT/dz: temperature gradient, K: thermal conductivity, Km: thermal conductivity of the rock matrix, KW: thermal conductivity of water and 4>: porosity.
A contour map of the present day heat flow shows an almost uniform heat flow throughout the basin with a slightly lower heat flow in a N-S trending zone in the middle of the study area. By the nature of equation (5) used in the model it can be seen that the sensitive parameters are the accuracy of the temperature measurements down hole and the estimated thermal conductivity. Since the thermal gradient is given within a range of uncertainty the calculated present day heat flow is dependent solely on the estimated thermal conductivity of the rock column.
The reconstructed heat flow histories for the 9 wells with RQ data show consistently cooler pasts with the modelled heat flow approaching zero between 35 and 80 Ma ago implying that vitrinite reflectance cannot resolve the early heat flow history. The loss of resolution of early thermal history is a consequence of the Tertiary drop of the basin causing rapid deep burial of the pre-Tertiary sediments. The rapid heating recorded by the sediments was so dominant that the data have lost resolution of any earlier heating. This behavior also indicates that any significant maturation must be a result of the very recent burial and heating.
Temperature (°C) 30 60 90 120 150
dT/dz = QQ/K (6)
-4000
Fig. 65. The temperature profile on top of Lulu-1 compared to the typical regional trend far away from the salt as represented by the Q-l well.
242 Bulletin of the Geological Society of Denmark

Vitrinite reflectance (%) O 0.1 0.2 0.3 0.4 0.5 0.6 0.7 0.8 0.9 1
o-
-500-1
-1000-
-1500-
o . .Xr -2500-
-3500-
-4000"
-4500-
\
%'
' ! •
n<\ •
°°\
i i
\
\
_..
o Q-1
• Lulu-1
\ \ ^ 1 kr-
Fig. 66. The excess maturity in the Lulu-1 well illustrated by comparison to maturity in the Q-1 well.
Maturity
Since no thermal indicator other than vitrinite reflectance is available as a measure of the basinal maturity, vitrinite reflectance variations with time and depth have been modelled for wells and pseudo-wells with a focus on the
Upper Jurassic shale source rock. Vitrinite reflectance variation with time and depth is modelled using the relation between temperature variation with time and depth and change in vitrinite reflection with time, temperature and depth (Lerche, 1988b):
R(z(t)) = (R.1/2 + aTTI(t))2
where a is determined from:
a = SifRCzi)"2 - R91/2]/2i TTI(ti)
(8)
(9)
where R (zO: measured vitrinite reflectance, R.: vitrinite reflectance at the depositional surface, and
» - / : (10) TTI(ti)= | exp[(T-Tc)/TD]dt, i n T > T c
- t i
with the integrand set to zero in T<TC . T is present temperature, Tc a threshold or critical temperature, and TD a scaling temperature. '
A vitrinite reflectance of 0.6 has been chosen as the onset of oil generation, and 1.35 as the end of oil generation and onset of wet gas generation (Waples, 1985). Relating a thermal indicator such as vitrinite reflectance to hydrocarbon generation is usually done by defining an "oil window" within the dynamic range of variation in the thermal indicator value within which peak oil generation takes place. The vitrinite reflectance "oil window" is often referred to as lying between Ro = 0.6 and Ro = 1.35 (Waples, 1985). It has, however, been argued that the
o
1000-
2000-
3000-
4000-
5000-
6000-
7000-
a
TOD Triassic
Triassic
b TOD Jurassic
Jurassic
Top Cretaceous Cretaceous
Jurassic
Present day sea door Quaternary
Triassic
Fig. 67. Dynamical evolution of the Lulu salt diapir. (a) After deposition of 2000 m sediment on top of the Zechstein evaporites assuming 80% sand and 20% shale the critical height Hcrit has not yet been reached, (b) The critical height (2200 m) of the sedimentary column was reached in Early Jurassic time. The salt rose in constant equilibrium to a total height of 2500 m, buried to a depth of 100 m under Jurassic sand and shale, (c) Early Cretaceous was a period of non-deposition, and with deposition of Upper Cretaceous - Early Tertiary, Danian, chalks. Competent sediments now both supports the buoyancy pressure form the salt and acts as a seal for vertical escape of fluids out of the sedimentary column (see text for details), (d) Continued deposition now of Tertiary and Quaternary shale resulted in an upward motion of salt relative to sediments of 300 m with an additional upwards motion of 200 m pushing the overlying sediments into a dome structure. The neutral buoyancy point is now at the surface, however sediment resistance holds down a significant buoyancy pressure from the salt.
Bulletin of the Geological Society of Denmark 243

NORWAY
O Pseudo well • Well
"*%, Base Cretaceous structure
>^— ^* PW-5 >-i v \ \-J* °l "otto-l oPW1 Ringtøbing-Fyn
»n - lpw- i ^ %* u \ High PW-12, .0.-1J
oPt13_~ -56°00'
• H i *Adcte-2
\
PW-17
Fig. 68. Distribution of wells (solid dots) and pseudo wells (open circles) used in this study. Fault patterns after Vejbæk & Andersen (1987).
Table 4. Types of data used from wells. 1. Stratigraphic logs (Stouge, 1988); 2. Wireline logs; 3. Composite logs; 4. Well data summary sheets (Geological Survey of Denmark); 5. Formation temperature (Jensen, 1983); 6. Porosity with depth (Michelsen, 1982); 7. Vitrinite reflectance data (E. Thomsen, 1988); 8. Permeability with depth (Michelsen, 1982); 9. Organic chemical data (TOC, Leco - Rock-Eval) (E. Thomsen, 1988).
1 2 3 4 5 6 7 8 9
Adda-1 B-1 Bo-1 E-1 H-1 1-1 Lulu-1 Mona-1 Otto-1 P-l Q-1 Stenl T-l W-l
X
X
X
X X
X
X X X
X X
X X X X
X
X X X
X
X
X X X
X X
X X X
X X X
X X X
X X
X
X
X X
X X
X
X X X
X X X
X X
X
vitrinite reflectance at which peak oil generation occur varies considerably with the heating rate (Yiikler & E. Thomsen, 1989). Likewise it has been shown from using
Comparison Thickness Permeability
Porosity Pressure
T
J Output
* N», Plotter Disc | | Printer
Fig; 69; Flow chart of the geohistory model (from Cao & Lerche, 1987).
an inversion technique on residual kerogen analysis to assess the channeling probability and range of activation energies, that the kinetics of the transformation of kerogen to hydrocarbons apparently vary with heating rate (Liu & Lerche, 1990).
As vitrinite is more time sensitive and kerogen more heat sensitive it can therefore be argued that the "oil window" should be redefined to fit a specific basin. A vitrinite reflectance value of 0.7 has been proposed as the lower limit for the vitrinite reflectance "oil window" in the Central Graben (Damtoft et al., 1987).
A broadly defined "oil window" that fits many basins has, in our opinion, greater value and instead of redefining the vitrinite reflectance "oil window" other methods such as kinetic models for kerogen degradation are used to constrain the timing of oil generation.
The maturity history was modelled for each well and
superimposed on the burial history diagrams. Figure 75a
shows the Lulu-1 well with the Late Jurassic shales enter
ing the "oil window" at 30 MaBP. By modelling the
maturity history for all wells and pseudo-wells and con-
Table 5. Reflector ages, lithologies and interval velocities used.
Reflector Age (Ma) Lithology Interval velocity (m/s)
1 2 3 4 5 6 7 8 9
10
0 0.65 10.2 26.5 36
60.2 92-96
128-131 136-145 ?-175
Water Sand Shale Shale Shale Shale Chalk Shale Shale
Sandy shale '
1480 2127 1920 2032 2173 2560 3891 2525 2908 3385
244 Bulletin of the Geological Society of Denmark

Fig. 70. Scheme of thermal hydrocarbon degradation used in the hydrocarbon generation model (from Cao & Lerche, 1987).
(a) General scheme of kerogen degradation
C 0 2 H20
Hydrocarbon resins Asphaltenes Bn-1
C02 H20 H2S
Carbon residue Carbon residue Carbon residue
Y Gas 1
Carbon residue
(b) Kerogen degradation and hydrocarbon generation
r- K2 i
Kerogen
K22
J<23_ K24 K2S
*26
— C02
— H20 — N2
— SC>2
— H2S
*11 . - , ' K12
*13
Kl4 *1S r
Kl6
K26 K25 l<24
Oil K23 K22
K21
-gas
-H 2 S
- S 0 2
-N2
- H 2 0
•C02
K21 = 16/44 K26
K22 = 16/18 K26
K23= 16/26 K26
K24= 16/64 «26
K 2 5 =16/34K 2 6
touring the time the Upper Jurassic shales reached full maturity (Ro = 0.6) (Fig. 75b), it is seen that full maturity (Ro = 0.6) was reached first in the north and east 30 MaBP while the west, southeast and southwest reached full maturity only 5 Ma ago indicating that maturation moved through the basin from north and east towards west, southwest, and south. Previous modelling of maturation in terms of vitrinite reflectance (Jensen et al., 1985) on the U-l well south of the study area has suggested oil generation beginning around 40 Ma ago at the bottom of the Upper Jurassic. Only the maturity timing of the Top Jurassic has been constructed due to uncertainty of picking the bottom of the source rock on seismic (pseudo-wells) and due to the fact that the complete Upper Jurassic only rarely has been penetrated.
Organic geochemistry and oil generation
The geochemical character of the Late Jurassic shales was examined from pyrolysis data (E. Thomsen, 1988) with the objective to discriminate the proportions of kerogen types I, II, and III in the shales. Consistent with earlier studies (Lindgreen et al., 1982; E. Thomsen, 1989; R. Thomsen, 1989), the Kimmeridge Clay equivalent, Farsund Formation, shows good to excellent source capacity, and data favour type II kerogen with some type III kerogen (Lindgreen et al., 1982; E. Thomsen et al., 1983; Goff, 1983; Cornford, 1984; Waples, 1985; E. Thomsen, 1989; R. Thomsen, 1989). The underlying Oxfordian clay has less source capacity than the Kimmeridge clay and is gas prone (Cornford, 1984). As input for the hydrocarbon generation model we used the proportions of different kerogen types assessed by the geochemical study (R.
Thomsen, 1989) of the Upper Jurassic shales. Elsewhere values of 50/50 type II/III kerogen were assigned.
The hydrocarbon potential is assessed by modelling of the oil generation through time using the simple scheme of Tissot & Welte (1978). The oil generation history is expressed as oil generation rate in mg/g/Ma (Fig. 76). The model shows that no significant oil generation took place in the Jurassic sequence until between 10 MaBP and present day. On the map showing present day oil generation rate (Fig. 76a), highest generation rates are in the western and lowest generation rates in the eastern half of the area. The 10 MaBP oil generation rate map (Fig. 76b) shows highest generation rates in the east, implying that oil generation had peaked in the eastern part sometime between 10 MaBP and present day. This pattern is consistent with the maturation trend seen in the time contour map of Ro = 0.6 for the Late Jurassic (Fig. 75b) stressing the significance of the Tertiary burial and heating.
Evaluation
As hydrocarbons are produced in a basin they are subject to both an intrinsic buoyancy drive as well as to a significant hydrodynamic drive. In order to assess the pathways of hydrocarbon migration and accumulation it is essential to have a rough idea of the magnitudes and directions of hydrodynamic forces acting on the migrating hydrocarbons.
The excess fluid pressure map and fluid flow pattern in conjunction with the oil generation maps, suggests that oil generation occurred in areas of high excess fluid pressure. Thus, generated hydrocarbons were subject to a significant lateral hydrodynamic drive towards the areas of low excess fluid pressures following migration paths outlined by the fluid flow pattern. The low excess pressure areas with converging flowlines acted as accumulation sites and are shown in Fig. 77. Hydrocarbons generated in the Gertrud Graben migrated towards the Otto salt structure where the excess pressure favored possible accumulation only in the upper stratigraphic levels (area 2 on Fig. 77). Hydrocarbons generated in the central Tail End Graben migrate towards the Harald field (Lulu-1 well, area 1 on Fig. 77), the inverted structure of the Arne-Elin Graben (area 2 on Fig. 77), the eastern boundary fault along the Ringkøbing-Fyn High (area 4 on
Bulletin of the Geological Society of Denmark 245

Fig. 71. Subsidence patterns based on basement subsidence rates (m/Ma) for different time periods. Fault patterns atter Vejbæk & Andersen (1987).
246
Fig. 77), and an area between the Adda wells, well H-l and well Bo-1 (area 3 on Fig. 77).
Potential target area The most prospective areas, as indicated by the model, are shaded in Fig. 77. Three of these areas have already been drilled: 1) The Harald field (Lulu-1, now declared commercial (Energistyrelsen, 1988); 2) Arne (1-1, Q-l, Traces of hydrocarbons, now declared not commercial (Energistyrelsen, 1988); North Arne (T-l, Otto-1, now declared commercial (Energistyrelsen, 1988); 3) Roar, Boje and Adda (H-l, Bo-1 and Adda-1, Adda-2, all now declared commercial (Energistyrelsen, 1988) with commercial findings within the areas. Hydrocarbon migration towards the eastern boundary fault of the Tail End Graben along the Ringkøbing-Fyn High indicates possible accumulation sites in the area marked (4) in Fig. 77. Any hydrocarbon accumulations in this area would likely be sealed either by the tight chalk or, alternatively, the slightly flexured chalk could leak hydrocarbons through to Early Tertiary sand tongues, sealed by overlying shales. The consistency between the observations and the model predictions for areas 1, 2, and 3 in Fig. 77, lends confidence to the suggestion that the fourth area - along the Tail End Graben - Ringkøbing-Fyn High boundary fault - is a potential, new exploration target.
Discussion Sensitivity and uncertainly
Using sophisticated models in any kind of assessment, as in this case the hydrocarbon potential of an area, within any reasonable level of confidence, it is a necessity to know the sensitivity of the model results both to the intrinsic assumptions and to the uncertainties in the measured input parameters. All parameters input into the model have a range of uncertainty attached to them e.g. down hole temperature measurements, measured vitrinite reflectance, converting seismic two way time to depth and even the dating of marker horizons can be wrong. Furthermore one has to accept that not all data used to invert have the optimal resolution. This should not, however, limit the use of such models but encourage users to ask how wrong the results could be.
A detailed sensitivity analysis of the one-dimensional model was carried out (Cao, 1987) where errors in input data such as depth, age and lithology of the individual formation; disturbances in the equation parameters such as sediment surface porosity, permeability, etc., and disturbances in assumptions such as constant sediment temperature with time were considered. The work of Cao (1987) has been used to evaluate the sensitivity of the model results to the errors and uncertainties in the set of input parameters on which this study was based.
The use of pseudo-wells carries with it uncertainty in
Bulletin of the Geological Society of Denmark

Fig. 72. Modelled present day excess fluid pressure (atm) at 4 km and 2.5 km depth.
the burial history, as both ages and lithology have to be extrapolated from well ties. At the same time the conversion to depth is dependent on the accuracy of the velocity profile and the accuracy of the picking of reflectors. Both of the above can give errors of roughly 1-2% of the total thickness or 50-100 m in a 5000 m sediment column which leads to a combined 100-200 m in 5000 m. Cao's (1987) work showed that the maturity history was only slightly sensitive to errors in total depth as illustrated by a variation in the time Ro reached 0.6 from 114 Ma to 119 Ma over an increase in total depth of 200 m from 5080 m to 5280 m. Likewise an error in the assigned age of say the bottom layer of the same sediment column as above of 70 Ma will have an effect on the time of maturation of that particular layer of about 7 Ma (Cao, 1987).
The uncertainty attached to the measurement of bottom hole temperatures also has an impact on the model results. A too low BHT will lead to a too low thermal
Bulletin of the Geological Society of Denmark
gradient resulting in a too low calculated present day heat flow (as in equation 5). With every thing else fixed, an increased present day heat flow will result in earlier maturation time (Cao, 1987).
The modelled fluid pressure, porosity, and permeability for shale are all dependent on the input assumed porosity at deposition of the shale with higher surface porosity leading to higher modelled permeability, porosity, and fluid pressure. Whereas the assumption of constant surface temperature through time only influences the time of maturation slightly (3 Ma in 100 Ma) (Cao, 1987).
Results
From the above it is obvious that some output parameters are sensitive to the model input and to a minor extent to model assumptions. Especially the present day heat flow is uncertain even when corrected temperature data (Jensen, 1983) are used. This again has an impact on the modelled time of maturation of the Upper Jurassic shale. The question is now whether or not the uncertainty on time of maturation is significant. The model yielded maturation at about 50 MaBP on vitrinite reflectance and peak oil generation between 10 MaBP and present day on the kinetic hydrocarbon generation model. Both timings are after the structural development of the basin. Uncertainty from the thermal history would give or take 5 Ma on the vitrinite reflectance timing and less on the kinetic model timing. The conclusion is that the uncertainty on timing of maturation inherited from the uncertainty in determination of the present day heat flow is insignificant in this instance, and that the time of onset of oil generation could not be constrained any better than to about 50 MaBP.
Potential hydrocarbon traps
Possible hydrocarbon traps in the area would be of the kind typically associated with salt structures (see for example Jenyon, 1986, p. 174—179). Another possibility would be stratigraphic traps in hangingwalls along the Coffee Soil Fault. Here sands, equivalent to the Upper Jurassic Ula Formation (Bergan et al., 1989) in block 2/2 in the Norwegian Sector, could be potential reservoirs (Fig. 78). Possible indications of interesting prospects are seen in Fig. 79 and 80. Figure 79 shows a Middle Jurassic bulge, possibly sealed against the boundary fault. This bulge effect is also seen in Fig. 80, but here with an underlying salt structure. In addition, the migration pathways and associated hydrocarbon accumulation map (Fig. 77), indicates high hydrocarbon potential along the Coffee Soil Fault, especially along the basement ramp. Together with the very high sand potential on the ramp, this area provides a very promising yet undrilled hydrocarbon target.
247
16*

Fig. 73. Compiled fluid flow pattern based on the excess fluid pressure distribution..
Conclusions The work reported here shows a clear and close relationship between halokinesis and faulting in the investigated area. The configurations of sediment and fault patterns above salt structures in the shallow Søgne Basin half-graben can be used as an identification guide in recognizing deeply buried salt structures in the Tail End Graben. There exists a close relationship between the configuration of the basin and the position of the two main groups of salt structures, updip salt pillows/diapirs and boundary fault pillows/diapirs. The formation of Triassic rimsynclines helps to outline the Northern Zechstein Basin, which probably reached further southwards in Triassic time, but was "pushed" northwards in the Late Jurassic because of the extensive footwall uplift. A secondary rimsyncline gives a lower limit of the order of 5.5 km3 for the amount of salt that has escaped in the Triassic. Although a basin, the southern part of the Søgne Basin and most of the Tail End Graben, have acted as an intrabasi-nal barrier in the Triassic and Zechstein, presumably having a "saddle basin" configuration.
An observed thermal anomaly and measured excess maturity, in terms of a thermal indicator (vitrinite reflectance here) caused by the presence of a salt diapir in the subsurface, have been used to unravel the dynamical evolution of the salt structure over the time period for which thermal indicator information is available. Considerations of the dynamical evolution of the salt diapir prior to the earliest time (greatest depth) for which thermal indicator measurements were available, yielded an equilibrium evolution of the Lulu-1 diapir to a height of 2500 ± 300 m during Jurassic time, based on present day sediment thickness from the surrounding areas. The inversion of the excess maturity and temperature anomaly
248
data yielded an average flow speed of salt relative to the sediments since the end of Jurassic of 5 ± 1 mMa4. Based on the same equilibrium arguments, however, the salt top should have been at the sediment-water surface at the present day, which is not observed since the salt top is at about 4000 m depth. Thus other factors played roles in suppressing the rise of salt in the post-Jurassic time period. A combination of two factors that slow down or even prevent the salt from rising are: (i) presence of a competent layer, or (ii) preservation of the rock porosity due to fluid overpressure in the sediments. In the Lulu-1 case the Upper Cretaceous chalks are far more competent than the Upper Jurassic and Tertiary shales, and significant overpressure in the Upper Jurassic and part of the Tertiary shales are well documented (Møller, 1986), so that both factors play a role.
The subsidence pattern though time from the Mid Jurassic to present day indicates that the northern Danish Central Graben developed dirough three stages of subsidence: a Late Jurassic differential stage, a late Cretaceous/ Early Tertiary uniform stage, and a Late Miocene/Quaternary uniform stage. The porosities, permeabilities and excess pressures within the Upper Jurassic shales indicate that fluid flow apparently did not change considerably since Early Tertiary. The flow is directed out of the Gertrud Graben and central Tail End Graben towards areas of low excess pressure located in the Søgne Basin, the Arne-Elin Graben, the Heno Plateau, and the southern Tail End Graben. The thermal history was determined by inversion of vitrinite reflectance data from several wells. Resolution of thermal history degrades beyond 30-50 MaBP due to the recent deep burial and heating. Maturation of pre-Cretaceous rocks took place within the Tertiary. Modelled maturation of the Upper Jurassic shales in terms of vitrinite reflectance suggests that oil generation initiated between 50 Ma ago and 5 Ma ago. A Tissot-Welte oil generation kinetic model showed peaking in the eastern half of the basin between 10 Ma ago and present day, the western half not reaching significant generation until the present day. The integrated evaluation suggests that hydrocarbon migration was from the Gertrud Graben and central Tail End Graben towards the Lulu-, Arne-, Roar-, Adda- structures, and towards the eastern boundary fault of the Tail End Graben.
There exist several new prospects in the area, indicated by the new hydrocarbon finds in the Norwegian well 3/7^t, by salt plays, and by the ramp sands along the Coffee Soil Fault.
Acknowledgements We thank the Statoil Group (BHP Petroleum (Denmark) Inc., Dansk Olie- og Gasproduktion A/S, Denerco K/S, EAC Energy A/S, LD Energi A/S, Statoil Efterforskning og Produktion A/S and Total CFP), the Danish Research Academy and Aarhus University for financial support.
Bulletin of the Geological Society of Denmark

Vitrinite reflectance (%) O 0.2 0.4 0.6 0.8 1
Vitrinite reflectance (%) O 0.2 0.4 0.6 0.8 1
Vitrinite reflectance (%) 0 0.2 0.4
i •
i • i • i«
T» \«
•1
• •
Sten-1
0.6 i
• L
0.8 1 i
-500
-1000
-1500-=-
i i
ro
ro
oi
o
8 8
Dep
th (r
-3000
-3500
-4000
Vitrinite reflectance (%) 0 0.2 0.4 0.6 0.8 1
Vitrinite reflectance (%) 0 0.2 0.4 0.6 0.8 1
Vitrinite reflectance (%) 0 0.2 0.4 0.6 0.8 1
Vitrinite reflectance (%) 0 0.2 0.4 0.6 0.8 1
Vitrinite reflectance (%) 0 0.2 0.4 0.6 0.8 1
-1500S o. CD
-2000Q
-500
-1000 ^ E.
-1500 £ Q. CD
-2000 Q
-2500
3000
Vitrinite reflectance (%) 0 0.2 0.4 0.6 0.8 1
J i i_
Fig. 74. Measured versus predicted vitrinite reflectance for the wells with vitrinite reflectance data.
The work was also supported by the Industrial Associates of the Basin Analysis Group at the University of South Carolina, and the Danish National Research Council. The Nordic Council is thanked for the award of a Nordic Professorship (I.L.), based in København, which enabled completion of this work. The courtesies extended to I.L. by Ole Graversen, Geologisk Centralinstitut, are much appreciated. The manuscript benefitted from very constructive criticism by Ole V. Vejbæk.
Dansk sammendrag Salt strukturer i Søgne Bassinet og i Tail End Graven er blevet undersøgt ved hjælp af seismiske data og boredata. Det undersøgte område er inddelt i tre bassinområder: et plateauområde i det nordlige Søgne Bassin; et grundt halvgravsbassin i det sydlige Søgne Bassin; og et dybt halvgravsbassin i Tail End Graven. Disse bassinområder flankeres i vest og øst af henholdsvis Mandal Højden og
Bulletin of the Geological Society of Denmark 249

Age (My) 175 150 125 100 75 50 25 0
LulU-1
1 -D fluid flow compaction
Vitrinite R0
— i 1 1 1 1 1 —
25 50 75 100 125 150 Time (My)
Time that Upper Jurassic reached RQ = 0.6
Contours 5 Ma
• Well O Pseudo well %^ Base Cretaceous
' structure
Fig. 75. a. Burial history diagram for the well Lulu-1 with 0.6 vitrinite reflectance contour superimposed, b. Contours of the time the top of the Late Jurassic reached a vitrinite reflectance of 0.6.
Ringkøbing-Fyn Højderyggen. Normalforkastninger af præ-perm alder i det nordlige Søgnebassin tyder på en tidlig, muligvis sen karbon ekstensionsfase. Sammenlignes konfigurationen af sedimentære sekvenser over saltstrukturer i det grunde Søgne bassin med konfigurationen af sedimentære sekvenser i den dybe Tail End Grav indikerer disse, at der findes dybt begravede saltstrukturer også i Tail End Graven. Saltstrukturer i bassinerne er hovedsagelig af to typer: puder og diapirer langs afgrænsende halvgravsforkastninger og puder og diapirer op ad flanken i halvgravene. Dannelsen af disse zechstein saltstrukturer er kompleks og nært knyttet til forkastning-saktivitet. Udviklingen af triassiske depocentre var primært kontrolleret af halokinese og tykke sedimentære sekvenser blev aflejret i primære og sekundære randsænker i Søgne Bassinet. Begyndende riftdannelse i mellem jura var knyttet til syn-rift sedimentation langs Coffee Soil Forkastningen og sen jurassisk riftdannelse bevirkede en adskillelse af Søgne Bassinet og Tail End Graven og førte til dannelsen af en sydligt hældende
rampe langs Coffee Soil Forkastningen i Tail End Graven. Rampen blev tilførselsvej for sedimenter fra den dybt eroderede liggende blok på Ringkøbing-Fyn Højderyggen og har højt sandpotentiale. I tidlig kridt var Søgne Bassinet og Tail End Graven adskilte sedimenta-tionsområder og beliggenheden af øvre kridt sedimenter var kontrolleret af hævning af den liggende blok i Mandal Højden og Ringkøbing-Fyn Højderyggen. Øvre kridt sedimenter var de første som aflejredes på Ringkøbing-Fyn Højderyggen og Mandal Højden. I sen kridt var området udsat for tektonisk inversion ledsaget af fornyet saltbevægelse som fortsatte til sen miocæn.
Udfra vitrinitreflektansmålinger fra Lulu-1 boringen, som er boret over en saltstruktur, er det muligt at bestemme den forhøjede modenhed i sedimenter over saltstrukturen, en forhøjet modenhed som skyldes varmefokusering på grund af den højere varmeledningsevne af salt. En metode til bestemmelse af diapirismens start og saltets flydningshastighed præsenteres. Metoden er baseret på en beregning af den termale anomali omkring en opstigende diapir. For en given salfhastighed kan vit-rinitreflektans udregnes og sammenlignes med observerede værdier ved givne dybder. Udregninger foretages for forskellige saltopstigningshastigheder indtil overensstemmelse mellem beregnede og observerede værdier nås. Herved fås en bestemmelse af saltopstigningshas-tigheden. Metoden kan benytte andre varmeindikatorer end vitrinitreflektans og derved forbedre opløseligheden af den termale historie og bedre afgrænse saltbevægelsens hastighed og tidspunkt for saltbevægelsens begyndelse.
Begravelseshistorien, den termale historie, kildepotentiale og oliedannelse er undersøgt i den nordvestlige del af Centralgraven ved at benytte en 1-dimensional sedimentations, væskestrøms- og kompakteringsmodel. Begravelseshistorien antyder, at denne del af Centralgraven udviklede sig gennem tre indsynkningsfaser: en sen jurassisk differentiel indsynkningsfase, en sen kretassisk til tidlig tertiær ensartet indsynkningsfase og en sen miocæn til kvartær ensartet indsynkningsfase. Palæotemperatur og palæovarmestrøm er modelleret ved hjælp af vitri-nitreflektansdata. Invers modellering er udført på boringer med tilgængelige vitrinitreflektansdata og er baseret på målte temperaturer i borehuller og ved overfladen. Den termale historie bestemt ved inversion af vitrinitreflektans fortæller om en køligere fortid. Den modellerede modningshistorie for øvre jurassisk skifer fortæller, at skiferen nåede oliemodenhed for 5 til 50 mill, år siden. Modellering af kulbrintedannelsesdata fortæller, at kulbrintedannelsen kulminerede for mellem 10 mill, år siden og nu. Mulige migrationsveje er bestemt fra modelleret forhøjet væsketryk og fire mulige akkumulationsomrader er udpeget. Kulbrintepotentialet i disse områder er evalueret og et nyt udforskningsmål langs Coffee Soil Forkastningen udpeges.
250 Bulletin of the Geological Society of Denmark

Fig. 76. Oil generation in the Upper Jurassic shales, a. Oil generation rates at present day. b. Oil generation rates at 10 Ma before present.
References Andersen, C, Olsen, J. C, Michelsen, O. & Nygård, E. 1982:
Structural outline and development. In Michelsen, O. (ed.) Geology of the Danish Central Graben. Danmarks Geologiske Undersøgelse B8, 9-26.
Atwater, G. I. & Miller, E. F. 1965: The effect of decrease in porosity with depth on future development of oil and gas reserves in South Louisiana. American Association of Petroleum Geologists Bulletin 45, 334-339.
Badley, M. E. 1989: New Interpretation Techniques. Lecture Notes, Copenhagen, June 1989.
Bergan, M., Tørudbakken, B. & Wandas, B. 1989: Lithostra-tigraphic correlation of Upper Jurassic sandstones within the Norwegian Central Graben: Sedimentological and Tectonic implications. In Collinson, J, D. (ed.) Correlation in Hydrocarbon Exploration. Norwegian Petroleum Society 19, Graham & Trotman, 243-253.
Bertelsen, F. 1980: Lithostratigraphy and depositional history of the Danish Triassic. Danmarks Geologiske Undersøgelse B4, 60 pp.
Bessis, F. 1986: Some remarks on the study of subsidence of sedimentary basins. Application to the Gulf of Lyons Margin
(Western Mediterranean). Marine and Petroleum Geology 3, 37-63.
Bond, G. C. & Kominz, M. A. 1984: Construction of tectonic subsidence curves for the Early Paleozoic Miogeosyncline, Southern Canadian Rocky Mountains: implications for subsidence mechanisms, age of breakup, and crustal thinning. Geological Society of America Bulletin 95, 155-173.
Cao, S. 1987: Sensitivity analysis of 1-D dynamical model for basin analysis. Ph.D. thesis, University of South Carolina, Columbia, SC, USA.
Cao, S., Glezen, W. H. & Lerche, I. 1986: Fluid flow, hydrocarbon generation, and migration: A quantitative model of dynamical evolution in sedimentary basins. Offshore Technology Conference, Houston, Texas, 2267-2276.
Cao, S. & Lerche, I. 1987: Geohistory, thermal history and hydrocarbon generation of the northern North Sea Basin. Energy Exploration and Exploitation 5, 315-355.
Cartwright, J. 1987: Transverse structural zones in continental rifts - an example from the Danish sector of the North Sea. In' Brooks, J. & Glennie, K. W. (eds) Petroleum Geology of North West Europe. Graham & Trotman, 441—4-53.
Cartwright, J. A. 1989: The kinematics of inversion in the Danish Central Graben. In Cooper, M. A. & Williams, G. D. (eds) Inversion Tectonics. Geological Society Special Publication 44, 153-175.
Cornford, C. 1984: Source rocks and hydrocarbons from the North Sea. In Glennie, K. W. (ed.) Introduction to the Petroleum Geology of the North Sea. Blackwell Scientific Publications, Oxford, 171-204.
Damtoft, K., Andersen, C. & Thomsen, E. 1987: Prospectivity and hydrocarbon plays of the Danish Central Trough. In Brooks, J. & Glennie, K. W. (eds) Petroleum Geology of North West Europe. Graham & Trotman, 403-417.
Davis, D. M., & Engelder, T. 1987: Thin-skinned Deformation over Salt. In Lerche, I. & O'Brien, J.J. (eds) Dynamical Geology of Salt and Related Structures. Academic Press, Orlando, 301-337.
Energistyrelsen 1988: Olie og Gas i Danmark - Efterforskning og Produktion. Årsrapport 1987, Danish Energy Agency. Energistyrelsen, Danmark.
Fisher, M. J. 1984: Triassic. In Glennie, K. W. (ed.) Introduction
Fig. 77. Map showing the most prospective areas as indicated by the model.
Bulletin of the Geological Society of Denmark 251

wsw Fig. 7
ENE WSW Fig. 16 ENE
ST8716-211
a -TMMU-
ST8716-602
b
•••:•••••.••.•••.•.••••:O K m c / . - . ' . v . v . - . / . v / . - J
sw Fig. 7 3/5-02 _ l
NE Fig. 7
SGT8606-4201/5201
C
-TMMU-
wsw
o LU W
3 / 5 1 " ESE ST8716-698
d
LCU -
ii®»4 V* V••*.*X?V?'.'-*! •. ' .TPZT? ' • .• "•'.""•: • /*• '/'•'&/*•'/'• '/'• **"*• *.*"*• ",•'"• "A"/"• */"• ".•'"• 1
••'/••'•;A'̂ V-•••••/•.'.••.'• A n r ^ ? 7 ^ m A ^ 5 km +/&?m •. •' •.V •. •' •..' ' . A - " " . • ' . •*'. • ' ' . •" •. •" •• • v •' •..' •. •' - ^ •' i •'•.•'*.•• •'•'''• •'•'•'• i
^ ^ v ' & v v v ^ ^ •••• : j \M- vi- v.' v.-y • • • . • • • • • • • • • • • . • • • • • ? • • • • • • • • • • • • • • • . • • • • • • • • • • • \ v . - - . - . - . . • • • . • . • . • • • . • • • • • • • • • • • . • • • • • • . • . • . • • • . • • • . <
Fig. 78. Possible locations of Jurassic sands equivalent to the Norwegian Ula Formation. See also Figs 14 (a), 13 (c) and 5 (d).
to the Petroleum Geology of the North Sea. Blackwell Scientific Publications, Oxford, 85-103.
Frandsen, N. 1986: Middle Jurassic deltaic and coastal deposits in the Lulu-1 well of Danish Central Trough. Danmarks Geologiske Undersøgelse A9, 23 pp.
Gabrielsen, R. H., Kløvjan, O. S., Rasmussen, A. & Stølan, T. 1992: Interaction between halokinesis and faulting: structuring of the margins of the Nordkapp Basin, Barents Sea region. In Larsen, R. M., Brekke, H., Larsen, B. T. & Talleraas, E. (ed.) Structural and Tectonic Modelling and its Application to Petroleum Geology. Norwegian Petroleum Society (NPF), Special Publication 1, Elsevier, Amsterdam, 121-131.
Glennie, K. W. 1986: Development of NW Europe's Southern Permian Gas Basin. In Brooks, J., Goff, J. C. & van Hoorn, B. (eds) Habitat of Palaeozoic gas in NW Europe. Geological Society Special Publication 23, 3-22.
Goff, J. C. 1983: Hydrocarbon generation and migration from Jurassic source rocks in E. Shetland Basin and Viking Graben
of the northern North Sea. Journal of the Geological Society, London 140, 445-474.
Gowers, M. B. & Sæbøe, A. 1985: On the structural evolution of the Central Trough in the Norwegian and Danish sectors of the North Sea. Marine and Petroleum Geology 2, 298-318.
Guidish, T. M., Kendall, C. G. S. C , Lerche, I., Toth, D. J. & Yarzab, R. F. 1985: Basin evaluation using burial history calculations: an overview. American Association of Petroleum Geologists Bulletin 69, 92-105.
Hansen, J. M. & Buch, A. 1982: Early Cretaceous. In Michel-sen, O. (ed.) Geology of the Danish Central Graben. Dan-marks Geologiske undersøgelse B8, 45^18.
Heilmann-Clausen, C. 1987: Lower Cretaceous dinoflagellate biostratigraphy in the Danish Central Trough. Danmarks Geologiske Undersøgelse A17, 89 pp.
Jackson, M. P. A. & Talbot, C. J. 1986: External shapes, strain rates, and dynamics of Salt Structures. Geological Society of America Bulletin 97, 305-323.
252 Bulletin of the Geological Society of Denmark

Fig. 79. Possible Middle Jurassic traps sealed against the Coffee Soil Fault, a. ST8716-21. b. SGT8606-407 (Fig. 7).
Jacobsen, F. 1982: Triassic. In Michelsen, O. (ed.) Geology of the Danish Central Graben. Danmarks Geologiske Undersøgelse B8, 32-36.
Jensen, P. K. 1983: Formation temperatures in the Danish Central Graben. Danmarks Geologiske Undersøgelse, Årbog 1982, 91-106.
Jensen, P. K., Holm, L. & Thomsen, E. 1985: Modelling burial
history, temperature and maturation. In Thomas, B. M. et al. (eds) Petroleum Geochemistry of the Norwegian Shelf. Graham and Trotman, 145-152.
Jenyon, M. K. 1985: Fault associated salt flow and mass movement. Journal of the Geological Society, London 142, 547-553.
Jenyon, M. K. 1986: Salt Tectonics. Elsevier, London. 191 pp.
Bulletin of the Geological Society of Denmark 253

Fig. 80. Possible Middle Jurassic traps over salt structures, a. ST8716-698 (Fig. 5). b. ST8716-101.
Koch, J.-O., Holm, L. & Michelsen, O. 1982: Jurassic. In Michelsen, O. (ed.) Geology of the Danish Central Graben. Danmarks Geologiske Undersøgelse B8, 37-454.
Koyi, H. 1989: Gravity overturn, Extension, and Basement Fault activation. UUDMP-Research report no. 56, Uppsala, 43 pp.
Larsen, P.-H. 1988: Relay structures in a Lower Permian basement-involved extension system, East Greenland. Journal of Structural Geology 10, 3-8.
Lerche, I. 1988a. Inversion of multiple thermal indicators:
Quantitative methods of determining paleoheat flux and geological parameters. I. Theoretical development for paleoheat flux. Mathematical Geology 20, 1-36.
Lerche, I. 1988b. Inversion of multiple thermal indicators: Quantitative methods of determining paleoheat flux and geological parameters. II. Theoretical development for chemical, physical and geological parameters. Mathematical Geology 20, 73-96.
Lerche, I. & O'Brien, J. J. 1987: Modelling of Buoyant Salt
254 Bulletin of the Geological Society of Denmark
Diapirism. In Lerche, I. & O'Brien, J. J. (eds) Dynamical Geology of Salt and Related Structures. Academic Press, 129-162. ,
Lerche, I., Yarzab, R. F. & Kendall, C. G. S. C 1984: Determination of paleoheat flux from vitrinite reflectance data. American Association of Petroleum Geologists Bulletin 68, 1704-1717.
Lervik, K. S., Spencer, A. M. & Warrington, G. 1989: Outline of Triassic stratigraphy and structure in the Central and Northern North Sea. In Collinson, J. D. (ed.) Correlation in Hydrocarbon Exploration. Graham & Trotman, 173-191.
Lindgreen, H., Thomsen, E. & Wrang, P. 1982: Source rocks. In Michelsen, O. (ed.) Geology of the Danish Central Graben. Danmarks Geologisk Undersøgelse B8, 73-86.
Liu, J. & Lerche, I. 1990: Inverse methods and kinetic models of hydrocarbon generation. II. Case histories for residual kero-gen analysis. Mathematical Geology 22, 989-1009.
Michelsen, O. (ed.) 1982: Geology of the Danish Central Graben. Danmarks Geologiske Undersøgelse B8.
Michelsen, O., Frandsen, N., Holm, L., Jensen, T. E, Møller, J. J. & Vejbæk, O. V. 1987: Jurassic - Lower Cretaceous of the Danish Central Trough - depositional environments, tecto-nism, and reservoirs. Danmarks Geologiske Undersøgelse A16, 45 pp.
Michelsen, O., Mogensen, T. E. & Korstgård, J. A. 1992: Pre-Cretaceous structural development of the Danish Central Trough and its implications of the distribution of Jurassic sands. In Larsen, R. M., Brekke, H., Larsen, B. T. & Talleraas, E. (ed.) Structural and Tectonic Modelling and its Application to Petroleum Geology. Norwegian Petroleum Society (NPF), Special Publication 1, Elsevier, Amsterdam, 495-506.
Mogensen, T. E. 1988: Permo - Jurassisk strukturel udvikling af Central Truget - I Grænseområdet mellem Danmark og Norge. Cand. scient. thesis, Aarhus Universitet, 84 pp.
Møller, J. J. 1986: Seismic structural mapping of the Middle and Upper Jurassic in the Danish Central Trough. Danmarks Geologiske Undersøgelse A13, 40 pp.
O'Brien, J. J. & Lerche, I. 1987: Heat Flow and Thermal Maturation near Salt Diapirs. In Lerche, I. & O'Brien, J. J. (eds) Dynamical Geology of Salt and Related Structures. Academic Press, 711-750.
O'Brien, J. J. & Lerche, I. 1988: Impact of heat flux anomalies around salt diapirs and salt sheets in the Gulf Coast on hydrocarbon maturity: Models and observations. Transactions - Gulf Coast Association of Geological Societies 38, 231-243.
Olsen, J. C. 1987: Tectonic evolution of the North sea region. In Brooks, J. & Glennie, K. W. (eds) Petroleum Geology of North West Europe. Graham and Trotman, 389^103.
Parker, T.J. & McDowell, A. N. 1955: Model studies of salt-dome tectonics. American Association of Petroleum Geologists Bulletin 39, 2384-2470.
Perrier, R. & Quiblier, J. 1974: Thickness changes in sedimentary layers during compaction history; methods for quantitative evaluation. American Association of Petroleum Geologists Bulletin 58, 507-520.
Roberts, A. M., Price, J. D. & Olsen, T. S. 1990: Late Jurassic half-graben control on the siting and structure of hydrocarbon accumulations: UK/Norwegian Central Graben. In Hardman, R. F. P. & Brooks, J. (eds) Tectonic Events Responsible for Britain's Oil and Gas Reserves. Geological Society Special Publication 55, 229-257.
Rubey, W. W. & Hubbert, M. K. 1959: Role of fluid pressure in mechanics of overthrust faulting. II. Overthrust belt in geo-synclinal area of Western Wyoming in light of fluid pressure
hypothesis. Geological Society of America Bulletin 70, 167-206.
Sclater, J. G. & Christie, P. A. F. 1980: Continental stretching: an explanation of the post-Mid-Cretaceous subsidence of the Central North Sea Basin. Journal of Geophysical Research 85, 3711-3739.
Seni, S. J. & Jackson, M. P. A. 1983: Evolution of salt structures, East Texas Diapir Province: Part 1 and 2. American Association of Petroleum Geologists Bulletin 67, 1219-1244 and 1245-1274.
Smith, R. L. 1987: The structural development of the Clyde field. In Brooks, J. & Glennie, K.W. (eds) Petroleum Geology of North-West Europe. Graham and Trotman, 523-533.
Stouge, S. 1988: Biostratigraphy of selected wells from the northwestern part of the Danish Central Trough. Danmarks Geologiske Undersøgelse Internal CENBAS report, 63 pp.
Thomsen, E. 1988: Source rock analysis of Jurassic-Lower Cretaceous deposits in the wells B-l, Bo-1, E-l, 1-1, Q-l, W-l, Lulu-1, Mona-1, Sten-1. Results of Leco-Rock-Eval and optical maturity determinations - tabulated data. Danmarks Geologiske Undersøgelse Internal CENBAS report.
Thomsen, E. 1989: Source rock analysis of Jurassic-Lower Cretaceous deposits in the Danish Central Trough. Results of optical and organic geochemical analysis of the wells B-l, Bo-1, E-l, I-1, Q-l, W-l, Lulu-1, Mona-1, Sten-1. Danmarks Geologiske Undersøgelse, Internal CENBAS report.
Thomsen, E., Lindgreen, H. & Wrang, P. 1983: Investigation on the source rock potential of Denmark. Geologie en Mijnbouw 62, 221-239.
Thomsen, R. O. 1989: Burial history and 1-D modelling - Vol. 1: an integrated quantitative analysis. CENBAS Report Aarhus University.
Thomsen, R. O. & Lerche, I. 1991: Salt diapir velocity assessment from temperature and thermal indicator anomalies: application to Lulu-1, Danish North Sea. Terra Nova 3, 500-509.
Tissot, B. & Welte, D.H. 1978: Petroleum Formation and Occurrence. Springer Verlag, New York, 538 pp.
Ungerer, P., Bessis, E, Chenet, P. Y., Durand, B., Nogaret, E., Chiarelli, A., Oudin, J. L. & Perrin, J. F. 1984: Geological and geochemical models in oil exploration, principles, and practical examples. In Demaison, R. J. M. G. (ed.) Petroleum Geochemistry and Basin Evaluation. American Association of Petroleum Geologists Memoir 35, 53-77.
Vejbæk, O. V. 1986: Seismic stratigraphy and tectonic evolution of the Lower Cretaceous in the Danish Central trough. Dan-marks Geologiske Undersøgelse All, 46 pp.
Vejbæk, O. V. & Andersen, C. 1987: Cretaceous-Early Tertiary inversion tectonism in the Danish Central Trough. Tecto-nophysics 137, 221-238.
Waples, D. W. 1985: Geochemistry in Petroleum Exploration. IHRDC, Boston, 232 pp.
Welte, D. H. & Yukler, M. A. 1981: Petroleum origin and accumulation in basin evolution - a quantitative model. American Association of Petroleum Geologists Bulletin 65, 1387-1396.
Yukler, M. A. & Thomsen, E. 1989: Effects of heating rates of hydrocarbon generation and occurrence. American Association of Petroleum Geologists Bulletin, Abstract, San Antonio, Texas, Conference.
Ziegler, P. A. 1987: Late Cretaceous and Cenozoic intra-plate compressional deformations in the Alpine foreland - a geody-namic model. Tectonophysics 137, 389^420.
Bulletin of the Geological Society of Denmark 255


![Microsoft Word - \256]\255}\277o\275\327\244\345final](https://static.fdokumen.com/doc/165x107/6334cc342532592417003b0e/microsoft-word-256255277o275327244345final.jpg)