Bsc project
74
Islamic Azad University Tehran Science and Research Branch Subject: Evaluation of Enhanced Oil Recovery Mechanisms in Heavy Oil Reservoirs Supervised by: Dr. Amir Hoessein Haghighati Written by: Amir Kazemi Submitted to the Department of Petroleum Engineering in Partial Fulfillment of Requirement for the B.S. Degree in Petroleum Engineering March-2013 Tehran-Iran
Transcript of Bsc project

Islamic Azad University
Tehran Science and Research Branch
Subject:
Evaluation of Enhanced Oil Recovery Mechanisms in Heavy Oil Reservoirs
Supervised by:
Dr. Amir Hoessein Haghighati
Written by:
Amir Kazemi
Submitted to the Department of Petroleum Engineering in Partial Fulfillment of
Requirement for the B.S. Degree in Petroleum Engineering March-2013
Tehran-Iran

I
Abstract
As of current dependence of world’s energy to conventional crude oils and the
depleting trend of these reserves, the key role of heavy oil deposits in long-term
economic profit of oil industry as well as supplement of energy demands becomes
more obvious than ever.
Globally, the heavy oil reserves are estimated to be near three times of that of
conventional crudes .Hence reservoir characterization, a proper extraction
technique and recovery mechanism will lead to a longer optimized production of
crude oils from such resources.
Though heavy oil, extra heavy oil and bitumen can be close in some characteristics
(e.g. viscosity), their production mechanism markedly differs. Hence, each
production method must be specified for the special resource with the special fluid
and formation properties. A method that works in one case, may fail in different
case. So, essentially the properties of a heavy oil reservoir must be fully
understood before choosing the recovery mechanism.
This thesis provides a well-organized comparison between the commonly
implemented heavy oil recovery mechanisms. There exist some viewpoints to
classify the mechanisms in which heavy oil is recovered but, the method used in
this thesis separates them into thermal and non-thermal methods. Also each
recovery mechanism is evaluated based on its performance, and specific features
are presented.
Key words: Heavy oil - EOR mechanisms – extraction methods- unconventional
oil

II
Acknowledgments
I wish to express my honest thanks to my advisor, Dr. itAhiehaaHAniei rA rimAi ,
professoriOf Islamic Azad University Tehran Science Research and Branch .
Without hisiguidance and support, this study would not have been completed. It
has been anihonor having him as my advisor.
I am deeply indebted to my family for their support and understanding. Their
encouragement and invaluable support have been the momentum of my life.
I have been extremely fortune in grasping valuable academic experience and
knowledge of my dear professors, Dr. Mahnaz Hehmatzadeh and also Mostafa
Nematzadeh. Their assistance and support gave me a strong motivation during my
studies.

III
List of Nomenclatures and Abbreviations
A = well spacing, acres
ºAPI = American Petroleum Institute standard gravity
Bbl/d = Barrels of Oil/Day
CHOB = Canadian Heavy Oil Belt
COFCAW = Forward combustion /water Combination
h = net formation thickness, ft
IOIP = Initial Oil in Place
k = reservoir rock permeability, md
Kv/Kh = Vertical perm./ horizontal perm., md
MOBD = Millions of Oil Barrel per Day
OOIP = Original Oil in Place
p = pressure. Psi
q = flow rate, STB/D
Soi = Initial Oil Saturation, dimensionless
SOR = Steam-Oil Ratio, scf/bbl
ρ = density of liquid, lbm/cu ft
φ = porosity of reservoir rock, dimensionless
μ = viscosity, centipoise

IV
List of figures: Page
Figure 1.1: Major resources of heavy oil in the world……………………………1
Figure 2.1: laminar flow of a heavy oil sample due to its high viscosity………....5
Figure 3.1: proposed model for SAGD, Butler………………………………......10
Figure 3.2: Effect of Lowered pressure injections on production rate. ……….....12
Figure 3.3: Enhancement of SAGD using hydrocarbon additives…………..…...13
Figure 3.4: huff, soak and puff in CSS…..……………………………………….16
Figure 3.5: Hot and cold regions surrounding a production well after steam
injection to radius….…………………………………………….……………….18
Figure 3.6: Radial flow models…..………………………………………………20
Figure 3.7: Duri field Indonesia, showing wellbore damage removal
….……….21
Figure 3.8: Temperature distribution and displacement zones in a dry combustion
process…..……………………………………………………………………….27
Figure 3.9: Optimal wet combustion…..………………………………………..30
Figure 4.1: CHOB region…..……………………………………………………34
Figure 4.2: Luseland field production history…..………………………………35
Figure 4.3: Viscous fingering….………………………………………………..37
Figure 4.4: heavy oil recovery waterflooding profile…..……………………….39
Figure 4.5: Injection schedule for a continuous polymer flood….……………..40
Figure 4.6: polymer chemical formula….……………………………………….41

V
Figure 4.7: Typical molecular weight of polyacrylamides distribution………....42
Figure 4.8: Comparison of polymer flood and waterflood on 1600 cP sample…43
Figure 4.9: Effect of polymer viscosity on oil recovery………………………...44
Figure 4.10: illustration of VAPEX/Hot water…..……………………………...46
Figure4.11: 3D representation of the reservoir model in simulation…..………..51

VI
List of Tables
Table 2.1: Major commercial production methods of heavy oils………………….7
Table 2.2: Major production methods in pilot phase…………………………….....7
Table 3.1: Properties for a generic Athabasca reservoir………………………..…11
Table 3.2: Reservoir properties for estimation of CSS effect on production
data………………………………………………………………………………..17
Table 3.3: Reservoir selection criteria, CSS vs. steam drive….…………….……24
Table 3.4: Summary of COFCAW test conditions………………………………31
Table 3.5: Summary of COFCAW test results………………………………...…31
Table 4.1: incremental recovery gained by three heavy oil experiments…….…..43
Table 4.2: Timeline of studies on the determination of propane dispersion/effective
diffusivity in vapor extraction of heavy oil….…………………………………...49
Table 4.3: Reservoir properties used for simulation………..……………………51

Table of Contents
Page
Abstract……………………………………………………………………..……...I
Acknowledgements…………………………………………….………….……… II
List of nomenclatures and abbreviations…………………………………………..III
List of figures………………………………………………………………………IV
List of tables…………………………….……………………….………………... VI
Chapter one: Introduction……………………………………………….……….1
1.1 Global heavy oil reserves……………………………………………………....1
1.2 Why heavy oil recovery is difficult? ……………………………………......…2
1.3 Thesis structure. ……………………………………………….………...……..2
Chapter two: General Aspects of Heavy Oil………………………………...…..4
2.1 Heavy oil definition……………………………………………………...……..4
2.2 General specifications of heavy oil deposits………………………….………..5
2.3 Heavy oil production mechanism tables………………………………………..6
Chapter three: Thermal EOR Methods for Heavy Oils………………………..9
3.1 Steam Assisted Gravity Drainage (SAGD)…………………………..………. .9
3.1.1 Features of SAGD………………………………………………….……….10
3.1.2 Factors affecting on SAGD performance……………………………...……11
3.1.2.1 Lower SOR at lower operating pressure…………………………..………11

3.1.2.2.1 Lower operating pressure SAGD example description…………………11
3.1.2.3 Use of solvents during SAGD…………………………………….………12
3.1.2.4 Geo-mechanical effects on SAGD…………………………………..……13
3.2 Cyclic Steam Stimulation ……………………………………..…………15
3.2.1 CSS mechanism………………………………………………………….….15
3.2.2 Role of natural reservoir energy on CSS……………………………………16
3.2.3 Boberg-Lantz model to account for heat losses…………………………..…20
3.2.4 Dependence of stimulation ratio on the heated radius………………………22
3.2.5 Features of CSS………………………………………………………….….23
3.2.5.1 Optimum reservoir properties for CSS…………………………....………23
3.2.6 Operating techniques and problems in CSS………………………...………24
3.2.6.1 Additives in CSS………………………………………………………….25
3.3 In-Situ Combustion …………………………………………………....….26
3.3.1 Mechanism of dry combustion……………………………………………...26
3.3.2 Displacement from combusted zone………………………………………...28
3.3.3 Mechanism of wet combustion……………………………………………...29
Chapter four: Non-Thermal EOR Methods for Heavy Oils…………………..32
4.1 Cold Heavy Oil Production with Sand (CHOPS) …………………………….32
4.1.1 Field Application of CHOPS………………………………………………..34
4.2 Waterflooding…………………………………………………………...…….36

4.2.1 Instability of displacing front……………………………………………….37
4.3 Polymer flooding……………………………………………………………...39
4.3.1 Process description………………………………………………………….39
4.3.2 Chemical properties of polymers……………………………...…………….40
4.3.2.1 Polysaccharides…………………………………………………………...40
4.3.2.2 Polyacrylamides…………………………………………………………...41
4.3.3 Advances in laboratory experiments……………………………………..…42
4.4 Vapor Extraction (VAPEX) …………………………………………………..44
4.4.1 History of VAPEX…………………………………………………………..45
4.4.2 Introduction to VAPEX……………………………………………….…….46
4.4.3 Diffusion and dispersion of propane in vapor extraction of heavy oil…...…48
4.4.4 Incorporation of a non-condensable gas in VAPEX process……………….49
Chapter five: Conclusions, Discussions and Recommendations……………...53
5.1 Conclusions………………………………………………………………..….53
5.2 Discussions …………………………………………………………………...54
5.3 Recommendations for future research……………………………..………….55
List of References…………………………………………………………………57
Appendix A……………………………………………………………………… 61

1
CHAPTER ONE
Introduction
1.1 Global heavy oil reserves
The worldwide bitumen and heavy oil reserves are estimated at over 6 trillion
barrels in which a considerable fraction of that resides in Canada and Venezuela.
The high viscosity of heavy oil renders conventional production methods
ineffective, if not impossible (Farouq Ali 1974). Bitumen is located in several parts
of the world as shown in figure 1.1. The main difficulty with production of these
huge reserves is that they are highly viscous (more than 1000 mPa.s in reservoir
temperature and pressure) and immobile under reservoir conditions.
Figure 1.1: Major resources of heavy oil in the world (after smalley, 2000)

2
1.2 Why heavy oil recovery is difficult?
There exist distinct specifications for production and recovery of conventional and
non-conventional crude oil reservoirs. Generally, conventional crude oils are
characterized by high °API gravity number (typically more than 20) and low
viscosity. On the other hand, heavy oils are known as high viscosity crudes with
different compositions rather than light crudes, which consist of asphaltene and
heavy metals.
It is known that the pressure gradient is the main reason for natural production
mechanism of crude oil. It plays a significant role in primary recovery and
extraction as much as possible of initial oil in place (IOIP). Here it must be noted
that primary recovery for heavy oils is very low, averaging about 5 percent of IOIP
(Farouq 1997), though this quantity for light crudes is considerably greater. The
essential features of heavy oil such as high viscosity, unconventional compositions
(sand, asphaltene, heavy metals…) and reservoir characteristics make the operators
and researchers to modify conventional EOR methods so that it can be
implemented for heavy oils. Steam injection for instance, is a significant heavy oil
recovery method which makes use of hot steam injection to the desired formation
in order to decrease the oil viscosity thus it can flow to the production well. In next
chapters of this thesis, detailed discussions of heavy oil recovery methods are
given.
1.3 Thesis structure
For easier classification of contents of this thesis, the thermal and non-thermal
heavy oil recovery methods are included in separate chapters. Chapter two includes
some general aspects of heavy oil and some useful data about common production
methods of that.
Chapter three is specified to thermal heavy oil recovery methods. First, the Steam
Assisted Gravity Drainage (SAGD) mechanism is outlined; the general features
and its limitations and specifications are expressed. Second, the Cyclic Steam
Stimulation (CSS) is presented and by means of some equations the dependence of

3
stimulation ratio to heated ratio is shown. The third part is comprised of a technical
discussion about in-situ combustion and description of wet and dry combustion.
Chapter four includes non-thermal methods for heavy oil recovery. It commences
with Cold Heavy Oil Production with Sand (CHOPS), its features and current
projects working by this mechanism. It continues with water flooding and the
importance of a strong displacing front and this connects this part to polymer
flooding. In this part, most common types of polymers applied in EOR processes
are expressed. Also some successful laboratory works on polymer injection are
included at the end of this section. The last part of chapter four is specified to the
relatively new non-thermal method, the vapor extraction (VAPEX). History,
general mechanism and introduction to VAPEX are included followed by a
technical discussion of diffusion and dispersion of propane in heavy oil and the
effect of a non-condensable gas as a mixture with propane in VAPEX process.
Chapter five consists of author conclusion, technical discussion and proposal of
future work in this field.
4
CHAPTER TWO
General Aspects of Heavy Oil
This chapter introduces some general scientific terms related to heavy oil; the
definition and classification of heavy oil itself, along with some tables presenting
the common recovery method of heavy oils are presented.
2.1 Heavy oil definition
Heavy oil and bitumen are characterized through high viscosities and high
viscosities compared to conventional oil. The world Petroleum Congress defines
heavy oil as oil whose gas-free viscosity is between 100 cP and 10,000 cP at
reservoir temperature. Heavy oil is a little less dense than water with API gravity
between 10° and 20°. Heavy oil can flow in some reservoirs at dowhole
temperatures and/or with in situ solution gas, but at surface conditions, it is a thick
and black fluid. Bitumen has a viscosity greater than 10,000 cP and may be as
high as 10,000,000 cP. Bitumen is defined as those crude oils with a dead-oil
viscosity greater than 10,000 cP. If no viscosity data are available, then crude oil
with an API less than 10 is sometimes referred to as bitumen. Extra heavy oil is
that heavy crude oil with an API of <10 and a dead-oil viscosity <10,000.
Heavy oils were originally conventional oil that migrated from deep source rocks
or deep reservoirs to the near surface, where they were biologically degraded and
weathered by water. Bacteria feeding on the migrated conventional oil removed
hydrogen and produced the denser, more viscous heavy oil and bitumen. Lighter
hydrocarbons may also have evaporated from the shallow, uncapped formations.
5
Because heavy oil is deficient in hydrogen and compared to conventional crude
oils, either hydrogen must be added to the molecules (by hydro-processing), or
carbon removed (by coking or cracking) to render it useful as a feedstock for a
conventional refinery. Heavy oil may also contain heavy metals and sulphur, which
must be removed. These processes are use in more complex refineries to create
products but can also be used upstream of refineries to upgrade oil into syncrude
(synthetic crude oil) that can be processed via simpler refineries.
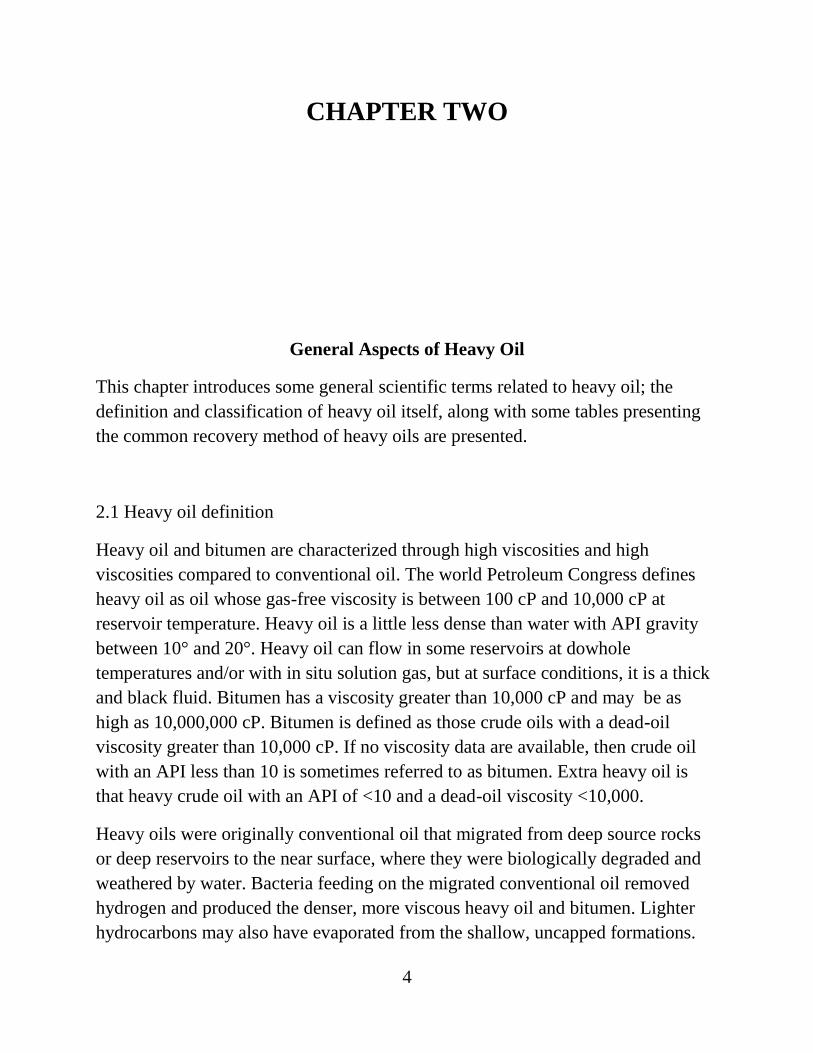
Heavy oil viscosity decreases rapidly with increasing temperatures, therefore
external heat may be required for production. High-temperature steam is
commonly used to deliver heat to the formation. The steam-oil ratio (SOR) is a
significant measure of the energy required to produce heavy oils5
Figure 2.1: laminar flow of a heavy oil sample due to its high viscosity34
2.2 General specifications of heavy oil deposits
Heavy oil may also contain water, clay and minerals containing sulphur, titanium
and heavy metals such as nickel, vanadium and molybdenum. Heavy oil deposits
are usually shallow, generally no deeper than two or three thousand feet and often
lie within feet of the surface. There are unconsolidated heavy oil deposits in
Alberta and Saskatchewan provinces in Canada, in California, in north México and
Venezuela.

6
Most recent heavy oil production comes from quartzite sandstone formations, but
heavy oil also exists in carbonate formations. Carbonate formations are much more
complex than sandstone formations and often have extensive fracturing and vugs in
addition to intergranular porosity. Oman, Iran and México have extensive
carbonate heavy oil deposits that are being developed and produced.
The International Energy Agency (IEA) estimates that there are 6 trillion barrels of
heavy oil worldwide, with only 2 trillion barrels ultimately recoverable35
. In the
United States, there are 100 to 180 billion barrels of heavy oil with large resources
in Alaska, California, Utah, Alabama and Texas. Heavy oil has been produced in
California for 100 years, with current production of 500,000 BOPD. Heavy oil
resources in Alaska are being developed on a small scale with less than 23,000
BOPD36
. Heavy oil is also located and being produced in Indonesia, China,
Mexico, Brazil, Trinidad, Argentina, Ecuador, Colombia, Oman, Kuwait, Egypt,
Saudi Arabia, turkey, Australia, India, Nigeria, Angola, eastern Europe, the north
sea, Rumania, Iran and Italy.
Since huge reserves of heavy oil are almost known today, there is no great need to
explore heavy oil. The main challenge is to optimize heavy oil production with
cost-effective and environment friendly methods.
Some essential properties of heavy oil reservoirs which determine the optimal
production mechanism to be chosen are: geological setting such as depth, areal
extent and formation thickness, oil composition such as viscosity and gas content,
presence of bottom water, petro-physical and geo-mechanical properties such as
porosity, permeability and rock strength, the presence of shale layers, vertical and
horizontal permeability and variation of these properties across the reservoir.
2.3 Heavy oil production mechanism tables
Due to complexity of heavy oil, extra heavy oil and bitumen, it is necessary to
categorize the resources, the production methods and the applicable technologies.
Tables 2.1 list the major commercial production methods of heavy oils. Table 2.2
shows major production methods in pilot phase.

7
Method Current use Comments
Open pit mining Used in Canada for shallow oil sands
High recovery factor, while high environmental impact
Cold production using horizontal wells and multilateral wells
Used in Venezuela, some used in north sea
Low recovery factor, may use water drive(north sea)
CHOPS Used in Western Canada to exploit thin layers
Low recovery factor, needs good GOR, unconsolidated sands
Cyclic Steam Stimulation Used in USA, Canada, Indonesia, many others
Reduces porosity of heavy oil, needs a good cap rock, fair to good recovery factor
Steamflood Used in USA, Canada, Indonesia, many others
Follow-up to CSS for interwell oil, good to high recovery factor
Steam Assisted Gravity Drainage (SAGD)
Used in Canada Allows production from shallower sands with weaker cap rocks
Table 2.1: Major commercial production methods of heavy oils (Natural Petroleum Council,
2007)
Method Description Comments
VAPEX Use solvent instead of steam in SAGD-type wells
Lower energy consumption, low production rates, in situ
upgrading
Hybrid Solvent plus steam in SAGD, CSS and steamflood wells
Lower energy consumption, increased production, in situ
upgrading
In situ combustion with vertical and horizontal wells
Use heavy oil in reservoir and injected air
Eliminate need for natural gas for steam injection, in situ
upgrading
Gasification of heavy ends Used for steam generation and hydrogen production
Eliminate need for natural gas
Down-hole heating with electricity
Resistance, induction, radio frequency
Offshore, deep and arctic regions, in situ upgrading
Table 2.2 Major production methods in pilot phase (Natural Petroleum Council, 2007)
Heavy oils and bitumen can be subdivided into a number of different categories
based on their location, environment and characteristics. The following
classification is intended to make the great variety among the heavy oil resources

8
obvious. Composition and viscosity are of a great importance in heavy oil
categorization but are not included in the following comparisons2.
- Shallowest resources (<50 m)
- Shallowest resources(50 to 100m, too deep for mining but no caprock seal)
- Medium-depth resources (100 to 300 m, caprock seal pressure <200 psi)
- Intermediate-depth resources( 300 to 1000 m, seal for pressure >200 psi)
- Deep resources (>1000 m)
- Arctic resources (permafrost)
- Offshore resources
- Carbonate resources (difficult petro-physics, tight rocks, dual porosities)
- Thinly bedded resources (<10 m thick)
- Highly laminated resources (low vertical permeability, possibly due to shale
layering)
These resource categories are cross-referenced to the following production
methods:
- Open-pit mining
- Waterflood
- Cold heavy oil production with sand (CHOPS)
- Cyclic Steam Stimulation (CSS)
- Steamflood
- SAGD
- Solvent without heat or steam
- Solvent with heat or steam
- Fireflood with vertical wells(~20 API oil only)
- Fireflood with vertical and horizontal wells
- Downhole steam generation (CSS, SAGD)
- Electric, induction or RF heating
- Supercritical fluids (e.g CO2)
- Biotechnology

9
CHAPTER THREE
Thermal EOR Methods for Heavy Oils
Thermal enhanced oil recovery involves the use of heat in order to decrease the
viscosity of oil, thus increasing its mobility. Based on this statement, Thermal EOR
methods can be broadly categorized. Hence, steam stimulation, steam drive, hot
water injection, in-situ combustion, steam assisted gravity drainage and electro-
thermal methods can be a part of this group. As of this wide range, only some
notable thermal recovery mechanisms are mentioned in this chapter.
3.1 Steam Assisted Gravity Drainage (SAGD)
Steam assisted gravity drainage is a type of thermal heavy oil recovery methods. It
is constructed by drilling a pair of parallel wells, injector and producer. Initially a
200-2000 ft. deep well is drilled vertically down into the formation until the oil
sands is reached, then drilling changes direction horizontally for about 1000-3000
ft. inside the oil sand bearing formation. Then, for setting up the injector well the
same operation is repeated approximately 15 ft. above and parallel to the producing
well.
Injecting steam slowly and developing a “steam chamber „‟ gives SAGD a
considerable stability due to lack of any pressure-caused instabilities such as
conning, fracturing and channeling.

10
Once the steam chamber expands and hits the upper barrier, lateral expansion will
be the only way for growing the chamber. Butler et al. (1981) proposed a model
which provided an analytical solution for SAGD when the steam chamber has
reached at the top of oil sand layer.
The following figure shows the proposed model for SAGD process:
Figure 3.1 proposed model for SAGD, Butler 1981
3.1.1 Features of SAGD
The SAGD process has special features such as 11
:
- Large production rates obtainable by gravity via using horizontal wells
- Use of gravity as the primary force to displace oil
- Flow of heated oil directly to the producing well without having to displace
uncontacted oil
- Almost immediate oil production response
- High recovery efficiency ( up to 70-75% in some instances)
- Low sensitivity to heterogeneities like small shale interval

11
- Low cumulative SOR due to large potential injection/production rates
limiting the heat losses.
- In reservoirs with thin pay zones, bottom aquifers, high water saturation and
in shaly formation SAGD meets different limitations.
3.1.2 Factors affecting on SAGD performance
3.1.2.1 Lower SOR at lower operating pressure
Because natural gas is a basic element in SAGD process, increasing its price will
negatively affect that process. Hence there is an ongoing effort to reduce the
energy dependence. A proposed theory is to operate at lower pressure which yields
some benefits 11
. At the lower operating pressure the operating temperature inside
the reservoir is lower and so the sand matrix is heated to a lower temperature hence
there would be lower steam oil ratio. However, in this condition the production
rates are also lower.
3.1.2.2.1 Lower operating pressure SAGD example description
To present the effect of reduced operating pressure on SAGD process, a simulation
study has been carried out for a typical Athabasca reservoir. (12):
Pay zone thickness Average porosity Kv/Kh Soi
25m 28% 0.5 75%
Table 3.1 Properties for a generic Athabasca reservoir

12
If the SAGD operation started at a lower pressure from the beginning it would take
a great time to develop the steam chamber and the production rate continues to
decline.
Figure 3.2 Effect of Lowered pressure injections on production rate.
3.1.2.3 Use of solvents
Use of additives for mobility control in the steam flood projects is well known.
However, it may serve its applicability in SAGD, too. Components of the
hydrocarbon solvents based on their PVT behavior, may penetrate into immobile
bitumen beyond the thermal boundary layer. This provides additional decrease in

13
viscosity due to dilution with higher hydrocarbons in that zone.
Figure 3.3 Enhancement of SAGD using hydrocarbon additives (obtained from Nasr et.al,
Suncor Energy Inc.)
The cost of the solvent and availability of that are the two significant factors which
dominate commercial scale projects. It has been observed that the advantage
gained in field operations is higher than that of simulation studies. As diluent is
added to bitumen for pipeline transportation, it is worthwhile to inject the same
amount of diluent into the reservoir to enhance the recovery process.
3.1.2.4 Geo-mechanical effects on SAGD
Inside the developing chamber, the relatively elevated pressure and temperature
cause shear failure within the surrounding formation. As a result the increase in
porosity, permeability and mobility inside the chamber will alter its initial

14
properties. Anticipating the boundary of growing chamber is a key empowering
operators on the orientation and spacing of their wells.
SAGD imposes high pressures and temperatures on the reservoir, which then has a
geo-mechanical response. Geo-mechanics tests the behavior of rock formations
under existing and imposed stress condition. Typically, the SAGD process is used
in unconsolidated sandstone reservoirs with very heavy oil or bitumen. In situ
viscosities can exceed 5,000,000 cP under reservoir conditions13
.
The oil sands are unique type of rock material for two reasons: First, the bitumen is
essentially a solid under ambient conditions and second, the sands are not loosely
packed. Oil sands, by definition have little to no cementation. As such, their
strength is totally dependent upon grain to grain contact. These contacts are
maintained by the effective confining stress. Any reduction in the confining stress
will result in a reduction in strength. Since the SAGD process increases the
formation fluid pressure, it reduces the effective stress and weakens the oil sand.
The primary driving forces to cause shear during SAGD process are the existing
rock stresses. In reservoirs with high differential stresses, the rock is already
cracked to the failure envelope, thus requiring less injection pressure to cause the
rock to fail. In western Canada, due to the thrust regime of the Rocky Mountain
orogeny, reservoir rocks have high differential stresses. In this case, horizontal
stresses perpendicular to the Rocky Mountains axis are very high and will exceed
the vertical stress for SAGD processes which operate only in shallower depths 13.

15
3.2 Cyclic Steam Stimulation (CSS)
Cyclic steam stimulation also known as cyclic steaming, steam soak or huff & puff
is another steam-based thermal enhanced oil recovery method. It was discovered in
the Mene Grande field in Venezuela in 1959 when steam broke out of a casing in
steam injection operation (16)
. Previously, this well had no production; however,
after it was blown down, rates of 100-200 bbl. /d were gained.
3.2.1 CSS mechanism
CSS is fundamentally a single well operation, though after some time
communication between the wells is developed and the process becomes more
advanced. In CSS, steam is injected into the well at the highest possible rate (to
minimize heat losses) for several weeks. The injected steam heats the rock and the
fluid around the wellbore. It penetrates and fingers through the formation due to
gravity segregation, preferential injection into high permeability strata, and adverse
viscosity ratio. Steam injection is usually expressed as equivalent water barrels.
In steam injection, steam is continuously injected based on a fixed well pattern of
injection wells while the fluids are produced from another well. In CSS however,
steam is injected and produced from the same well. CSS provides thermal energy
in the vicinity of the wellbore, using the steam as the heat transfer medium and
allowing the rock to act as a heat exchanger for short-term storage of injected
energy.
Each CSS cycle is made up of three steps: First the steam injection stage known as
huff. Second stage is letting the steam to distribute through the zone while the well
is shut for a short time which is called soaking period. In final step, the well is put
back on production while extracting the oil and condensed injected steam.

16
CSS is the most successful EOR method, and is usually the first stage in
steamflood development. Though, we need to imply that the ultimate oil recovery
may be considerably less than that of steamflood1.
Figure 3.4 huff, soak and puff in CSS
3.2.2 Role of natural reservoir energy on CSS
CSS Heats the reservoir rock around the wellbore and permits this region to remain
at an elevated temperature for long periods of time. Reservoir natural energy plays
a key role in a successful CSS project. Reservoir energy maybe available in the
form of solution gas drive, aquifer drive, gravity drainage and compaction.
A CSS project is first examined by the reservoir depletion geometry. Imagine a
heavy oil reservoir with the following rock and fluid properties:
17
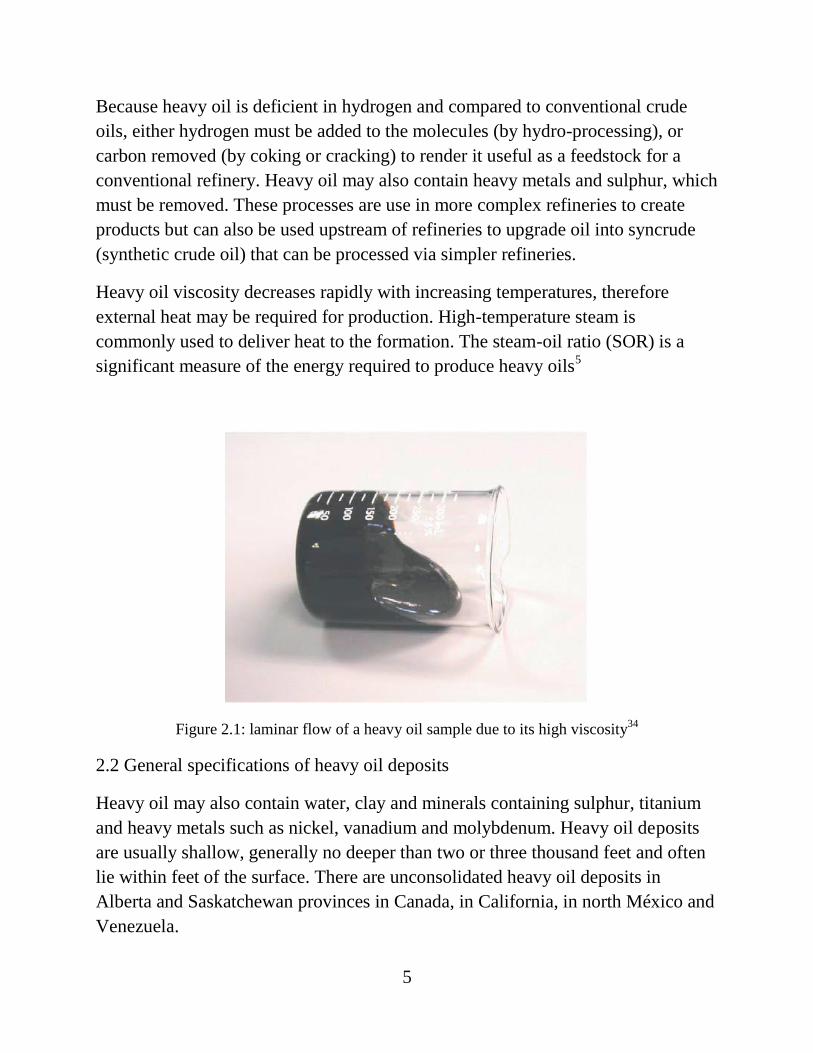
Table 3.2 – Reservoir properties for estimation of CSS effect on production data
Thickness, ft. 100
Permeability, md 3
Well spacing, acres 10
Oil Viscosity at reservoir temperature, cP 1000
Reservoir pressure, psi 500
Initial FVF, bbl/STB 1.1
Wellbore radius, ft. 0.5
Backpressure in pressure well, psi 100
The flow rate, qoc , can be estimated considering that there is sufficient energy to
maintain the reservoir pressure of 500 psi at external radius defined by:
re = 2( / )(43,560 / )A ft acre 3-1
where:
re = effective drainage radius
A = well spacing (10 acres)
The oil production rate when the wellbore pressure is maintained at Pw is given
below:
Qoc = 7.08 ( )
ln( / )
oc e w
oc oc e w
k h p p
B r r
3-2
The initial flow rate of this reservoir, at the initial pressure of 500 psi and viscosity
at reservoir temperature of 1,000 cP is calculated as:
Qoc = (7.08)(3.0 )(100 .)(500 100)
(1.1 / )(1,000 ) ln(372 / 5)
darcies ft psi
bbl STB cP
= 116.5 STB/D 3-3

18
As the reservoir is depleted, the reservoir pressure falls and the production rate
declines. For example, when the effective reservoir pressure at the boundary is 50
psi and the bottomhole pressure (BHP) in the production well is maintained at 10
psi, the production rate will be:
Qoh = 116.6 [(50-10) / (500-100)] = 11.7 STB/D 3-4
Now, imagine the effects of heating a small region around the wellbore by
injecting steam. We assume that the steam zone moves radially from the injection
well and is located at rh , as depicted in the following figure. The steam zone is at
Ts , and the region beyond the steam zone is at Tr .If the fluid flow is radial,
incompressible and at steady state, the pressure drop between re and rw is given by
equation 3-5 . When the volumetric flow rate at the reservoir condition is equal in
heated and cold zone, qohBoh = qocBoc
Figure 3.5 Hot and cold regions surrounding a production well after steam injection to radius
rh28
.

19
pe – pw = ln( / ) ln( / )7.08 7.07
oh oh oh o oc och w e h
oh oc
q B q Br r r r
k h k h
3-5
Thus flow rate is calculated as:
Qo = 7.08 ( )
ln( / ) ln( / )
e w
oh ocoh h w e h
oh o
h p p
B r r r rk k
3-6
The impact of increasing the temperature to Ts for the radius rh can be determined
if the steam zone is assumed to be 50 ft. in radius and te oil viscosity is 2 cP at the
steam temperature. Then:
Qo = [7.08(100 ft. ) (50-10)psi]
÷ [(1.1 bbl/STB) (2cP) / 3 darcies] [ln (50/0.5) ]
+ [(1.1 bbl/STB)(1,000 cP) / 3 darcies] [ln (372/50) ]
= 28,328 / (3.37+735.8)
= 38.3 STB/D.
In this example heating the wellbore for a distance of 50 ft. led to an increase in
flow rate from 11.7 to 38.3 STB/D, a factor of approximately three.
If steam stimulation were applied before the reservoir energy was depleted, the
initial production rate after the soak period would be:
Qo = 38.3 [(500-100) / (50-10)] = 383.3 STB/D
This illustrates that the response to CSS is determined largely by the natural
reservoir energy. This model however, does not account for temperature decline of
heated zone with time.

20
3.2.3 Boberg-Lantz model to account for heat losses17
The second important factor in the response of steam stimulated wells is the
removal of skin. Considering a radial flow model in the next figure which contains
a damaged zone radius rs and permeability ks we conclude ks < k.
Figure 3.6 Radial flow model28
We also assume steady radial flow in each segment so that the pressure drop
across the region between rw and re is given by:
pe-pw = ln( / ) ln( / )7.08 7.07
oh oh oh oh oc ocd w h d
d oh
q B q Br r r r
k h k h

21
+ ln( / )7.08
oc oc oce h
oc
q Br r
k h
3-7
Determining the skin factor for the heated reservoir as Sh :
Sh = [(koh/kd) - 1] ln (rd / rw) 3-8
And rearranging gives:
pe – pw = ln /
7.08
o oh oh h h w
oh oh
q B s r r
h k k
+ ln( / )7.08
oh oc oce h
oc
q Br r
k h
Thus calculating the flow rate:
Qo =
7.08 ( )
ln / ln( / )
e w
oh ocoh h h w e h
oh oc
h p p
B s r r r rk k
3-9
Figure 3.7 Production response from a well in the duri field, Indonesia, shows wellbore damage
removal28

22
3.2.4 Dependence of stimulation ratio on the heated radius
Here we emphasis on the need of a large steam slug in recovery process of very
viscous oil formation by presenting a mathematical relation.
The equation for radial flow of oil in a porous medium is given by:
Qoc = 2 (1.127) ( )
ln
e w
eoc
w
kh p p
r
r
3-10
Where Pw is wellbore pressure, Pe external or boundary pressure, Re and Rw stand
for external radius and wellbore radius, respectively. The subscript “c” refers to
cold condition.
Now, if the formation is heated and stimulated by steam to a radial distance rh, such
that the oil viscosity is lowered to a value µoh, then the flow system consists of a
two-zone radial flow region and the stimulated oil production rate qoh is given by:
Qoh = 2 (1.127) ( )
(ln ) (ln )
e w
e hoc
h w
kh p p
r roh
r r
3-11
Therefore, the term “stimulation ratio” qoh/qoc is presented by:
ln ln
ln ln ln ln
oc e e
oh oh w w
h oc e oh h eoc
w oh h oc w h
r r
Q r r
r r r rQ
r r r r
3-12
If µoc is greater than µoh,

23
ln / lnoh e e
oc w h
Q r r
Q r r 3-13
In other words, the stimulation ratio depends only on the heated ratio. This
explains the need for a huge steam slug in a viscous heavy oil case.
3.2.5 Features of CSS
- Faster production response than steam flooding
- Lower initial capital costs
- Lower pressure operation
- Applying temperature effect, resulting in reduction of viscosity of crude oil
- The possible role of steam in expelling crude oil via dissolving in it.
3.2.5.1 Optimum reservoir properties for CSS
It is imaginary to present some solid criteria which can definitely guarantee the
success of a CSS project. However, a few rough guidelines can be offered, based
upon previous successful projects. Table 3.3 presents an example of such
guideline. It should be noted that these properties are in relation to other in-situ
parameters such as: shale barriers, aquifer and reservoir pressure.

24
Properties CSS Steam Drive
Formation thickness, ft. >30 >30
Depth, ft. >3000 >3000
Porosity, % >30 >30
Oil saturation, bbl./ac-ft. 1200 1200-1700
API gravity >15° 13-25°
Permeability, md 1000-2000 4000
Oil viscosity at reservoir condition <4000 <1000
Steam pressure <1400 <2500
Table 3.3 Reservoir selection criteria, CSS vs. steam drive1
3.2.6 Operating techniques and problems in CSS
In CSS, the injection period depends on the steam injectivity and cold oil viscosity.
Generally the volume oil extracted is proportional to the volume of steam injected.
The only exceptions occur when the initial Sor is low or there is a substantial
amount of original oil in place (OOIP) 14
. In California, the injected steam volume
is of the order of 10,000 barrels per cycle, injected about more than two weeks. In
Cold Lake, Alberta, where the oil viscosity is 10 to 20 times greater than that in
California, the steam volumes tend to be as large as 30,000 barrels or more which
is injected over a month1.
The “soak” period can vary from a few days to a week. In any case, mechanical
and operational there exists some considerations which necessitates a short
shutdown of steam injection. “soak” time can be minimized by leaving the pump
rods in the tubing during steam injection. With a short soak a considerable amount

25
of steam is initially produced. In CSS or/and steam injection after the well is put on
production, it may work decent for a few days. However, next to this period of
time, the well has to be pumped. In some cases (Lloydminster), lifting of the
stimulated oil may be a major operational problem due to high viscosity and sand
production problem. In this situation production may has to be terminated, when
the wellhead fluids temperature drops to a low value (about 100° F in Cold Lake)
at which crude oil is too viscous to be pumped efficiently.
3.2.6.1 Additives in CSS
Under special conditions, adding a small amount of a chemical or gas may improve
CSS performance. One example is injection of natural gas slugs with steam in Cold
Lake, Alberta. Pursley has proposed scaled model studies of CSS for a number of
additives consisting of CH4 , air, CO2 , solvents and water thickeners (15)
.
Substantial increases in recovery were noticed when using thickened water (3.8%
bentonite). Solvent used with steam did not effectively improved recovery.
Air, CO2 and CH4 injection lead to improve in CSS performance with lower water-
oil ratios and steam-oil ratios in both first and second cycle. Improvement for CO2
is less than that of air and CH4. Though, air did not cause spontaneous combustion
in laboratory studies, combustion did occur in the field test, causing mechanical
damage.
Methane as an additive was more successful. The injected gas-steam ratio was 20
scf/bbl of steam. The model results were in qualitative agreement with field results.
Injection of CH4 immediately after steam was more efficient than injection late in
the cycle. Variation of the gas-steam ratio showed that the optimum ratio was 100-
200 scf/bbl.

26
3.3 In-Situ Combustion
In-Situ combustion is a thermal EOR method which uses an oxygen containing gas
to be injected into the reservoir and form a combustion front that is propagated
through the oil bearing formation. This process can develop as long as oil/rock
combinations produce enough fuel to sustain the combustion front.
In this section we present the fundamental concepts of in situ combustion. When
both steam drive and in situ combustion are technically feasible, usually steam
drive is preferred. However, steam drive mechanism is limited to pressures of 2500
psi or less and depths of near 3000 ft. because of the wellbore heat losses. As a
result, in situ combustion is the only thermal recovery process that is potentially
useful for deep, high pressure reservoirs.
There are two basically distinct types of in situ combustion, forward combustion
and reverse combustion. In forward combustion the formation is ignited in the
vicinity of air injection well and the combustion front goes through. On the other
hand, reverse combustion initiates by air injection from injection well and forming
the combustion front. Shortly after the combustion front propagates toward the
producing well, air injection is stopped at the injection well and is shifted to the
production well; hence the combustion front will propagate reversely.
3.3.1 Mechanism of dry combustion
In situ combustion occurs when oxygen reacts with coke existing in pore space,
hence creating a self-sustained combustion front. Ignition may be induced through
electrical or gas igniters or may be spontaneous if crude oil has enough reactivity18
.
When the reservoir is relatively thin, the displacement process behaves like a
frontal-advance process with the temperature and saturation and saturation
distribution depicted in the following figure:

27
Figure 3.8- Temperature distribution and displacement zones in a dry combustion process19
.
A narrow combustion zone is formed where temperature may be very high. The
injected air is pre-heated to combustion temperature (650 to 1200° F) as it flows
through the rock behind the combustion zone. Combustion products, primarily
water (as water vapor) CO2, and CO flow ahead of the slowly moving (0.1 to 1.0
ft/D) front.
In a well-developed burning front, hot combustion gases strip light ends from the
crude oil flowing ahead of the front. Hydrocarbons stripped by the hot combustion
gases and water vapor condense to form a small steam plateau of hot water and
light hydrocarbon banks. The oil saturation that remains after steam stripping is
subjected to thermal cracking as the combustion front approaches. This residuum
becomes the fuel for the process. In general, no more than 5 to 6% of the oil is
consumed. Hydrocarbon products and other compounds released by the cracking
process join the combustion gases and are either absorbed by crude oil ahead of the
front or are produced in the effluent. In a dry forward combustion the rate of
frontal advance is controlled by fuel availability.

28
3.3.2 Displacement from combusted zone
Combustion stoichiometry may be used to estimate the volume of oil displace by
the moving combustion front, the volume of water produced and displaced by the
combustion process, the air/fuel ratio for the burned zone and the volume of
combustion gases produced. However, the rates of fluid production cannot be
predicted from it. The material balance dictates that the oil displaced equal the oil
initially present minus oil burned.
Vob = .VRb (Soi – SoF) (3.14)
Where
Vob is the oil displaced from the burned zone in cubic feet,
VRb bulk volume burned in cubic feet,
SoF oil saturation equivalent to fuel consumed, and
Soi initial oil saturation.
The equivalent oil saturation is given by:
SoF = mR / ρF 3.15
Where ρF is density of fuel, Ibm/ft3
The economics of in situ combustion is controlled by the cost of air compression.
The air/fuel ratio is a measure of the effectiveness of the combustion process and
can be calculated from the combustion stoichiometry. Considering only the burned
zone, the ratio of the air injected to oil displaced is given by:
FAOb = 5.615[a*R (Soi – SoF)](scf/bbl)
3.16
It is interesting to estimate FAOb for a field project where the parameters in the
above equation are known. Gates and Ramey20, 21
presented data for the South
Belridge thermal recovery project. The following values represent that project:
a*R = 385 scf/ft3

29
mR = 2.20 Ibm/ft3
R = 0.36
ρF = 343 Ibm/bbl
Soi = 0.60
From Eq. 3-15 SoF =0.10 . Substituting these values in Eq. 3-16 yields:
FAOb = 5.615[385/0.36 (0.60 – 0.10)](scf/bbl)
= 12, 010 scf/bbl
Stoichiometry shows the volume of oil displaced from the burned zone. There is no
information on how much of the displaced oil is produced. Combustion
stoichiometry does not account for oil that is displaced from adjacent regions that
are either heated by the combustion front or affected by the combustion gases. At
South Belridge the air /oil ratio for the entire project was 3,600 scf/bbl22
. Thus
other mechanisms such as gravity drainage made a significant contribution to the
air/oil ratio observed in the south Belridge project.
3.3.3 Mechanism of wet combustion
Dry in situ combustion generates a large amount of heat that is either stored in the
porous rock behind the combustion front or lost to the surroundings. A small
amount of energy in the hot rock behind the front is transported to the combustion
front by the injected air as it is preheated from the injection temperature to near
combustion temperature. A large amount of energy remains in this region because
the heat capacity of air is relatively small (0.2 Btu/lbm °F).Hence, a considerable
amount of energy will be lost to the surrounding formation.
Wet combustion improves the efficiency of forward combustion by simultaneous
or alternate injection of air and water during the combustion process. This process
is also known as combination of forward combustion and water (COFCAW). In
simultaneous injection of water and air, the water initially fills part of the region
behind the combustion front. As water saturation increase, the water is displaced
into the heated region where it is converted to superheated steam. The additional
steam created by water injection mixes with the combustion gases and volatile

30
hydrocarbons. Under ideal conditions, the enlarged condensation zone travels up to
three times faster than the combustion zone,23
thereby creating an extended region
of steam distillation ahead of the combustion front.
Dietz and Weijdema24
showed that under conditions of optimal wet combustion an
in situ steam drive is created and the air requirement is reduced to about one-third
of that required for dry combustion.
A small amount of unburned coke was found in the region behind the front. Thus,
the combustion front was able to advance without consuming all the coke.
Figure 3.9 - Optimal wet combustion24
In table 3.4 wet combustion test conditions of Parrish and Craig23 over a wide
range of crude oil properties is shown. Also summary of displacement results is
presented in table 3.5.

31
Run Crude Source Oil
Gravity (°API)
Oil Viscosity
(°API)
Stage of Depletion
Oil Saturation
Water Saturation
Gas Saturation
Injected Air/Water (scf/bbl)
1 Rocky
Mountains 38.9 3.6 Waterflooded 24 42.8 33.2 2,522
2 Rocky
Mountains 13.5 29,000
Non-Waterflooded
71.2 0 22.8 2,435
3 Rocky
Mountains 13.5 29,000
Non-Waterflooded
68 0 32 1,505
4 West Texas 30.5 5.7 Non-
Waterflooded 61.2 22.6 16.2 1,680
5 Rocky
Mountains 25.2 28.8
Non-Waterflooded
79 0 21 1,636
6 West Texas 19.9 60 Waterflooded 75.3 8.2 16.5 1,077
7 Rocky
Mountains 18.4 67.2 Waterflooded 41.7 29.8 28.7 1,458
8 U.S. Gulf Coast 29.2 3.8 Waterflooded 29 28.6 42.4 1,660
9 U.S. Gulf Coast 35.2 2 Waterflooded 30 23.1 46.9 2,750
10 Rocky
Mountains 19.2 244
Non-Waterflooded
54.8 23.6 21.6 1,385
11 West Texas 40.9 3.5 Non-
Waterflooded 43.5 31.8 24.7 2,430
Table 3.4 – Summary of COFCAW test conditions23
Run Oil Gravity
(°API) Injected
At Combustion
Zone Oil Burned (%PV)
Total Unrecovered
Oil (%PV)
Oil Recovery
(%OIP)
Injected Air to Produced Oil
(scf/bbl)
1 38.9 2,522 6,011 4.39 8.49 64.6 11,730
2 13.5 2,435 4,875 5.61 8.57 87.9 6,020
3 13.5 1,505 2,360 4.54 8.95 84.4 5,040
4 30.5 1,680 2,997 4.49 5.33 91.4 3,380
5 25.2 1,636 2,885 4.32 5.09 93.8 4,100
6 19.9 1,077 1,499 3.6 6.97 90.9 3,360
7 18.4 1,458 2,650 6 7.92 81 10,900
8 29.2 1,660 2,670 4.01 4.38 84.9 8,240
9 35.2 2,750 5,820 1.59 1.71 94.3 3,500
10 19.2 1,385 1,710 3.84 4.23 92.3 1,870
11 40.9 2,430 4,430 3.37 3.95 90.9 4,340
Table 3.5– Summary of COFCAW test results23

32
CHAPTER FOUR
Non-Thermal EOR Methods for Heavy Oils
Non-thermal EOR methods make use of other energies rather than thermal energy
to recover crude oil. They can be implemented when thermal methods are not
applicable either due to economic reasons or infeasibility of infrastructure needed
by thermal methods. Also crude oil viscosity, reservoir rock and fluid properties,
depth of formation, availability of surface equipment and properties of chemicals if
applied in a non-thermal EOR process, would be the options which determine how
to design a non-thermal EOR operation.
Non-thermal EOR methods in most cases use chemical processes to decrease oil
viscosity or increase viscosity of displacing fluid. Some of these methods are
polymer flooding, carbon dioxide injection, miscible and immiscible gas
displacement and some solvent based recovery methods such as vapor extraction
(VAPEX). With respect to conditions of oil recovery operations some non-thermal
processes other than chemical methods, may be applied such as water flooding or
cold heavy oil production with sand (CHOPS).
4.1 Cold Heavy Oil Production with Sand (CHOPS)
CHOPS is a primary recovery technique based on production of sand in order to
improve oil recovery. It is widely used as a primary production in unconsolidated
sand stone. The reason is production of sand from unconsolidated formations
produces „‟wormholes‟‟ which ease oil flow to the surface by creating liquefied
zones around the borehole surrounded by areas of high permeability.

33
In CHOPS, vertical wells are drilled into the desired zone and sand is produced by
using special screens and pre-drilled liners. Here, instead of blocking sand ingress
by gravel packs or screens, sand is encouraged to enter the well by aggressive
perforation.
In this method if screens are installed to block sand, oil production will notoriously
drop. Production from CHOPS method over conventional primary method is 10-20
times more efficient (>100 b/d instead of 5-10 b/d) 8.
The common specifications of CHOPS well are:
- When a new well is completed, initial sand influx is large, usually as high as 10-
40% of the volume of the gas-free produced liquids and solids
- Continuous gas influx produces a product at the surface that is controlled by
methane and foams
- The oil production rate peaks to a maximum amount after some months of
production, and then slowly decays due to depletion of reservoir energy.
- A good work over can only has a limited effect on oil and sand production rate.
This effect is mainly dominated by the first cycle,
Typically, in CHOPS the drilled wells produce high amounts of sand initially;
often more than 25% by volume of liquid, however, after some weeks or months
this declines to 0.5-5% sand.
The simultaneous production of sand and oil leads to several upcoming
consequences. CHOPS produces a huge quantities of oily sand along with saline
water, water-oily clay emulsions, slops, tank bottom sludge and solid-fluid
mixtures. Handling these wastes plus the massive volumes of produced sand will
add to operating costs. For planning a heavy oil project using CHOPS method,
consideration of these factors is essential.

34
4.1.1 Field Application of CHOPS
Up to now, massive sand influx for production of heavy oil has been implemented
only in unconsolidated sand reservoirs containing viscous oil (500 to 1500 cP),
almost exclusively in Canadian Heavy Oil Belt (CHOB). (Figure 2.1)
Figure 4.1 CHOB region
Since 1920`s which sand production was discovered in Lloydminster region in
Canada, it has been applied globally10
. In Dury field, Indonesia, for instance, heavy
oil is produced by thermal methods and also a large amount of sand production is
an ongoing production mechanism.

35
Another notable example of sand producing field is Luseland field in
Saskatchewan. Since 1984 about 30 vertical wells have always been on production
on 40-acre spacing27
.
The following figure is a plot of monthly oil and water rates in cubic meters per
month produced from the Luseland field from its inception to Dec 1998.
Figure 4.2 - Luseland field production history, 1982-199827
For the above figure four different phases are defined:
Phase I is the approximate 10 year initial period. The wells were completed with
conventional widely spaced, small perforation diameter perforation openings.
During this phase, small amounts of sand entered the well, probably 0.25% to 2%
by volume of produced liquids.
Phase II involved drilling and producing a set of six horizontal wells with slotted
liners or open-hole completions.

36
Phase III is the CHOPS phase for the Luseland field which started I late 1993 and
the initial number of wells recompleted to produce sand. This operations involved
re-perforation of the interval using large diameter entry pores (20-22 mm) and
more closely spaced charges, so that larger volumes of sand and oil could enter the
wellbore.
Phase IV started in the middle of 1990`s. This phase involved drilling additional
wells away from the center of the structure.
4.2 Waterflooding
At the reservoir conditions, the oil may contain dissolved solution gas; therefore
some oil is produced via solution gas drive mechanism. Here, waterflooding is
employed when the primary recovery is finished. In case of conventional oil
recovery, water and oil viscosity may be close thus having similar mobility ratio:
M = µd / µD 4.1
Or it can be expressed as:
M = D / d 4.2
Where
M = mobility ratio
µd = viscosity of displaced fluid
µD = viscosity of displacing fluid
D = mobility of displacing fluid
d = mobility of displaced fluid
Whereas due to adverse mobility ratio between heavy oil and water, waterflood
recoveries are known to be low for high viscosity heavy oil. Though in spite of

37
inefficiency of this process, in many heavy oil fields water flooding is still
commonly applied because it is relatively inexpensive and also operators have
enough experience designing waterfloods.
4.2.1 Instability of displacing front
In heavy oil waterflooding, water is displacing more viscous oil, thus the
displacing front may become unstable. In this case viscous fingers are said to have
formed. This will result in pre-mature breakthrough of water.
Figure 4.3: Viscous fingering. Photographs showing the development of viscous fingers resulting
from the displacement of oil by water in a Hele Shaw cell. Velocity is 1.8 times the critical one
(from Chuoke et al. 1959)
Peter and Flock25
identified the parameters which dominate the stability of system
such as displacement velocity, mobility ratio, system geometry and dimensions,
capillary and gravitational forces, wettability and permeability of the system. The
instability number defined by Peter and Flock25
for a horizontal single well system
is as follows:
Isr = 21
*
w
wor
M D
C k
4.3
Where:

38
= the injection velocity
µw = viscosity of water
D = diameter of core
= interfacial tension
Kwor = permeability to water at the irreducible oil saturation Sor
C* = wettability constant
C* has different valus for varying rock wettability, which indicates that the effect
of imbibition on the growth of viscous fingers is different in oil wet vs. water wet
porous media.
At the onset of wettability, Isr was found to be 2 or 13.56. When Isr < 13.56 the
displacement is stable, indicating that the viscous fingering will not grow. When
Isr > 13.56 the displacement is deemed fully unstable. In the transition zone
(13.56<Isr<1000) the flood is becoming increasingly unstable, and breakthrough
recovery decreases rapidly as Isr increases.
The behavior of heavy oil waterfloods is distinctively different. Due to the fact that
heavy oil is considerably more viscous than water, injection of less viscous fluid
with high mobility to recover heavy oil with limited mobility leads to viscous
fingering. Here the importance of polymer flooding to increase water viscosity is
posed. The recovery profile for a heavy oil waterflood is shown in figure 4.1.

39
Figure 4.4 – heavy oil recovery waterflooding profile
As it is obvious from the above figure, there`s no straight line relation between the
injected pore volume and oil recovery. Field application of waterflood in heavy oil
reservoirs will be restricted to small and thin or segmented reservoirs which poorly
perform if thermal enhanced oil recovery is applied26
.
4.3 Polymer flooding
In heavy oil waterflooding, the great viscosity difference between the injected
water and oil causes injected water to finger through the reservoir, forming
“viscous fingering” phenomena. As a consequence, heavy oil recovery was often
less than 20% (Meyer 2003). Thus polymer flooding is implemented to optimize
the water viscosity. According to Wang et al. 2002, polymer flood increased
recovery by 12 to 15 % in field applications.
4.3.1 Process description

40
There are countless chemicals which can be dissolved in water to decrease water
mobility in a reservoir, though all of them must be used in high concentration.
High molecular weight water soluble polymers in dilute concentrations (a few
hundred ppms) increase the viscosity of water greatly. In a polymer-augmented
waterflood, polymer is injected continuously at the initial polymer concentration
for a limited period.
Figure 4.5 – Injection schedule for a continuous polymer flood28
Reducing the polymer concentration systematically as more pore volume is
injected (as shown in figure 4.4) is the most cost effective method to conduct a
flood.
4.3.2 Chemical properties of polymers
Though there are numerous types of polymers which can alter water mobility, the
most commonly used polymers in EOR processes are polyacrylamides and
polysaccharides.
4.3.2.1 Polysaccharides

41
The polysaccharide or “biopolymer” typically used in EOR processes is xanthan
gum. This substance has a molecular weight of approximately 5 million29
. The
molecular structure of xanthan gum gives a degree of rigidity to the polymer chain
which provides excellent resistance to mechanical breakage. However it is highly
susceptible to bacterial action. In fact microbes are responsible for the formation as
well as the destruction of the polymer molecule. The chemical structure for the
polymer is depicted in the following figure:
Figure 4.6 – polymer chemical formula (after Jennings.1997)
4.3.2.2 Polyacrylamides
The polyacrylamide (PAM) molecule is made up of a very long chain of
acrylamide monometer molecule. The basic acrylamide unit has the following
formula:
When chemically combined to form the polymer chin the structure is as follows:
(after Jennings, 1977)

42
Because of competing mechanisms in the polymer formation, there is a wide range
of chin lengths. The average molecular weight of commercial polyacrylamides
range from approximately 1-10 million. The typical molecular weight distribution
follows the curve shown in figure 4.6:
Figure 4.7 – Typical molecular weight of polyacrylamides distribution (after willhite et al, 1977)
4.3.3 Advances in laboratory experiments
In 1977 an experiment on heavy oil polymer injection was done at Marathon oil
company (Knight and Rhudy 1997). In that experiment, polymer solution with
different polyacrylamides concentrations were injected into sand packs of Ottawa.
The permeability ranged from 3700 to 5900 mD and porosity was about 0.35. Also
two heavy oil samples were used; one from Wyoming with viscosity of 220 cP and
19.8° API and the other was very viscous synthetic oil with viscosity of 1140 cP.
For both samples, the mobility ratio with waterflood was as high as 30 .
Polymer injection could decrease the mobility ratio of the first sample to 0.34 and
3.2 for the second one.

43
Also in another research (Wassmuth et al. 2007b) displacement of three heavy oil
samples with polymer solution was analyzed. The procedure was to inject 0.5 PV
of water into a high permeability core until the water cut reached 90%. Next, 6 PV
of polymer solution was injected to the core, followed by 5 PV of water. The tested
polymer concentration was 1500 ppm, which produced viscosity of 18 cP for it.
The heavy oil viscosities and incremental recovery is listed in the following table:
Viscosity of heavy oil samples (cP) Incremental recovery
280 16%
1600 22%
780 23% Table 4.1 – incremental recovery gained by three heavy oil experiments (Wassmuth et al. 2007b)
The test result, schematically shown in the next figure shows how polymer flood
accelerates the recovery process:
Figure 4.8 – Comparison of polymer flood and waterflood on 1600 cP sample (Wassmuth et al.
2007b)

44
Another study in the University of Calgary (Wang and Dong 2009) shows that
polymer solution must exceed certain effective viscosity to achieve a tertiary
recovery of more than 10%. In this experiment heavy oil samples with viscosities
of 430 to 5500 cP were flooded with polymer solutions with effective viscosities of
3.6 to 359.4 cP. The result of this study can be seen in figure 4.8:
Figure 4.9 – Effect of polymer viscosity on oil recovery(Wang and Dong 2009)
4.4 Vapor Extraction (VAPEX)
In most cases, conventional EOR methods for heavy oil recovery cannot be
implemented due to the very high viscosity of crude oil. Also flooding techniques
can have limited effect on recovery process of highly viscous (millions of mPa.s at
reservoir condition) crudes. However, the viscosity of such crude oils is a strong
function of temperature and decrease drastically with increase in temperature. This
is the basic principle of thermal recovery processes such as Cyclic Steam
Stimulation (CSS) and Steam Assisted Gravity Drainage (SAGD) which are more
notable among the thermal methods. Meanwhile, all of these thermal methods
suffer from energy inefficiencies with respect to heat losses to the underburden or
overburden formations. These energy losses can be avoided if a solvent is used to
extract the heavy oil in spite of steam30
.
45
4.4.1 History of VAPEX
Butler and Mokrys (1989) were the first to publish the idea of vaporized
hydrocarbons solvents in 1989. Just like as SAGD, pair of horizontal wells are
implemented for the recovery mechanism at which the producer well lays under
the injection well. In their experiment32
it was discussed that:
- As the process goes on, the bitumen drains to the production well containing
hot water and vapor solvents. The bitumen interacts with some water so
some vapor solvents are re-distilled
- The SAGD process may not neither be applicable in thin formations where
steam losses to the adjacent formations occures nor low permeability
carbonate reservoirs where the reservoir heat capacity per unit volume of
contacted oil is high
- The rate at which the recovery process occurs with a liquid solvent is
disappointingly low
- Molecular diffusivity is smaller than thermal diffusivity
- Smaller density difference exists between the diluted oil and the solvents
rather than heated oil and steam( VAPEX vs. SAGD)
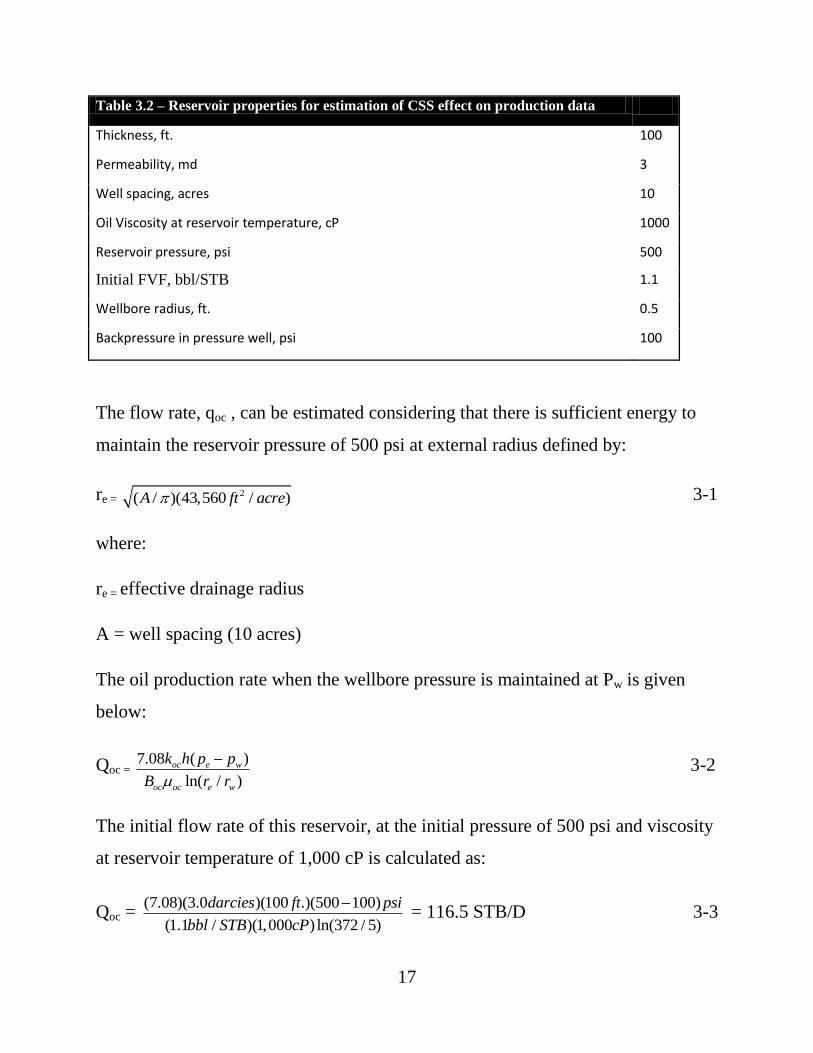
Figure 4.10 shows the mechanism of VAPEX32
.The essential features are as
follows:
Following hot water and propane injection in the reservoir, initially a vertical
solvent chamber is formed between the injector and the producer well. Within this
chamber, the solvent is recycled by evaporation from the diluted oil which is
heated by the hot water. The warm propane vapor then, rises counter-currently to
the draining water and increases its temperature as it comes in contact with hotter
water near the top of the reservoir. Then it moves to the further parts of the
chamber, dissolving in the cold undiluted reservoir oil.
The vapor chamber expands laterally. The oil-solvent interface becomes stabilized
by gravity. The drainage is controlled by molecular diffusion of solvent vapor into
the bitumen through the irregular, deviating pores of the matrix.

46
The function of the hot water is twofold: it heats the reservoir, lowering the
viscosity; this heating releases propane vapor from warm draining oil for reuse at
the top of the chamber.
Figure 4.10 illustration of VAPEX/Hot water process (Butler & Mokrys, 1991)
4.4.2 Introduction to VAPEX
Most of the heavy oils and bitumen contain a significant amount of asphaltenes,
often as much as 22% by weight. The main reason for high viscosity of these
crudes is the presence of asphaltenes. In VAPEX process, heavy oil is recovered
using a saturated hydrocarbon vapors under controlled conditions which leads to
separation of asphaltenes from heavy crude. With this process, vaporized
hydrocarbon solvents with low molecular weight are injected into the reservoir
through a horizontal injection well. The asphaltenes leave behind and precipitate
on the reservoir matrix, while the much lighter oil is recovered 31
.
The concept of VAPEX is similar to that of SAGD, except solvent is injected
instead of steam. Separation between the injector and producer well in VAPEX
process is dictated by mobility of the oil at reservoir conditions. In a relatively

47
mobile heavy oil reservoir, the injector can be placed near the top of the reservoir.
Whereas in a heavy oil reservoir the pairs of horizontal wells should be close
enough to produce the early communication between them.
Hydrocarbon solvents may cause deasphalting and viscosity reduction, if their
concentration is enough. This in-situ upgraded crude oil has better quality either
for transportation or refining. On the contrary, the possibility of permeability
reduction (plugging) due to asphalt deposition is a concern which is involved in
VAPEX process.
Using a vaporized rather than liquid solvent, produces higher driving force for
gravity drainage, because of higher density difference between heavy oil and
solvent vapor. At a specific temperature, the solubility of a vaporized solvent is
near maximum of its vapor pressure. So, the solvent pressure should be as close as
possible to its vapor pressure at reservoir temperature. In field practice, to prevent
solvent liquefaction at any point at the reservoir, the pressure should be lower than
the solvent‟s vapor pressure at the prevailing temperature. So, the significance of
reservoir pressure and temperature in selection of solvent is highlighted.
There are several significant features for the VAPEX process which make it
somehow unique. First, no heat loss is occurred because it is done in reservoir
temperature. The energy requirements for a VAPEX project are estimated to be
approximately 3% of that for a SAGD process (Upreti et al.2007). Second, some
fraction of the injected solvent is recoverable in the separation facility (Butler et
al.1995). Third, VAPEX is much more environment-friendly than thermal projects
In literature, three different types for VAPEX is proposed (James et al.2007),
namely: conventional, warm and hybrid. In conventional VAPEX, only the mass
transfer of solvent into oil will determine the effectiveness of the process. In warm
VAPEX, the solvent is heated before injection into the heavy oil. This will result in
earlier communication between the injector and the producer wells (James et
al.2007). In hybrid VAPEX, the hot steam and the solvent are co-injected to the
reservoir. This co-injection results in drastic reduction of steam requirements for a
conventional SAGD process and also greater solvent recovery compared to a
conventional VAPEX process ( Butler and Mokrys 1991).

48
4.4.3 Diffusion and dispersion of propane in vapor extraction of heavy oil
Solvent diffusion and dispersion is a significant factor affecting the field design of
VAPEX process. Some studies were done in past to measure propane diffusion
coefficient in heavy oils. Hayduk et al. (1973) measured the diffusivities of
propane in dilute solutions of n-butanol and n-paraffins of hexane, heptane, octane
and hexadecane at different temperatures using the steady state capillary cell
method.
Das and Butler (1996) used a Hele-shaw cell to obtain empirical correlations for
the diffusivities of propane in Peace River bitumen as a function of propane-
bitumen mixture viscosity, which is a function of propane concentration. They
showed that propane diffusivity increased with its concentration in bitumen. From
zero to unit volume fraction of propane, it is estimated to increase from 0.2×10⁻⁹
to
0.9×10⁻⁸
m2/s.
Tharanivasan et al. (2006) determined the diffusion efficiencies of propane in
heavy oil for three different boundary conditions at the propane-crude oil interface.
They used a constant diffusion model developed with an analytical solution and
optimized to history match the results of other authors.
Lim et al. (1996) used Cold Lake oil sand physical model with sand porosity of
0.328 and permeability of 80 Darcy to produce bitumen by horizontal well cyclic
propane recovery process. The experiments was conducted at 33° C and 0.83-1.0
MPa. Effective diffusion coeeficient of propane in heavy oil was estimated using
the analytical model for Butler and Mokrys (1989) by assuming a constant
diffusion coefficient over the solubility range. They concluded that the effective
diffusivity of propane was in the range of 2.7×10⁻⁸
to 7.5×10⁻⁸
m2/s.
Das (2005) investigated the sensitivity and effectiveness of the prediction of oil
production rates using different orders of magnitude of diffusion and dispersion
coefficiencies of propane in a two dimensional simulation model. He reported that
in VAPEX process, the solvent does not have the opportunity to penetrate very far
inside the bitumen. As soon as it reaches enough mobility, it drains down and the
chance of creation a concentration gradient will disappear.

49
As discussed above, studies in the literature assumed a uniform value for propane
dispersion coefficient and overlooked the concentration dependence of
dispersion.However, constant values can be assumed in cases of dilute solutions,
not in the case when a light hydrocarbon diffuses into heavy oil to reach an average
concentration of 0.3 to 0.4 mass fraction. Therefore, the determined propane
dispersion values may not represent the dispersion phenomena occurring in
VAPEX and can lead to unrealistic results. Table 4.1 shows the timeline of studies
on the determination of propane dispersion/effective diffusivity in VAPEX.
Heavy Oil Viscosity Operating
Conditions
Dispersion/Effective
Diffusivity (m2/s)
Reference
Cold Lake 80,000 cP @ 25°C T=33°C
P=0.83-1.0
MPa
Deff = 2.7 ×10⁻⁸
to
7.5 ×10⁻⁸
Lim et al.(1996)
Athabasca 70,000 cP @ 23°C T=22°C
P=0.76MPa
Deff = 1.85 ×10⁻⁹
µ-0.9
Ramakrishnan
(2003)
Lindbergh 10,000 cP @ 21°C T=21°C
P=0.85MPa
Dconv = 0.8 ×10⁻⁶
Nghiem et
al.(2001)
Athabasca 40,000 cP @ 8°C T=17°C
Dnet = 1.53 ×10⁻⁶
to
1.18 ×10⁻⁹
Maini and
Kramar (2003)
Bitumen N/A N/A D = 10-5
to 10-9
Das (2005)
Table 4.2: Timeline of studies on the determination of propane dispersion/effective diffusivity in
vapor extraction of heavy oil.
4.4.4 Incorporation of a non-condensable gas in VAPEX process
Over time, it was trying to develop the performance of vapor extraction process.
Recently the application of CO2 has been noticed. The use of carbon dioxide in
vapor extraction process brings some positive results such as higher solubility into
the heavy oil and the ability to be sequestrated so as to protect the environment. In
this section, the result of a simulation using CMG simulator33
on performance of
VAPEX process is presented when different solvent mixtures, including
hydrocarbon gases and CO2 are injected.

50
It was earlier mentioned that liquefaction of solvent makes the process less
effective (Badamchi-Zadeh et al. 2008). Keeping the propane in vapor phase
throughout the injection process is possible if a non-condensable gas is added to it.
Mixing a non-condensable gas to the propane increases the dew-point of the
pressure significantly. Usually propane as a base is mixed by methane, ethane,
butane, nitrogen or carbon dioxide.
In that simulation33
the reservoir properties were selected so as to represent a
typical heavy oil reservoir in Western Canada. The data were not collected from
any specific reservoir. The Computer Modeling Group‟s GEM module was used in
that work to evaluate the performance of carbon dioxide-based VAPEX process.
To model a horizontal well pair, a rectangular reservoir with Cartesian grids was
used. The well length in the VAPEX process can range anywhere from 700 to 1000
meters. A width of 130 meters was selected to include in the drainage area of a
well pair during the VAPEX operations in this work.
Table 4.2 shows the reservoir properties specified to the simulation model. The
porosity and permeability values chosen here are quite close to those of some
reservoir rocks in Western Canada (especially in Saskatchewan), Hemaca and
Cerro Negro field in Venezuela, Draugen field in Norway and etc.
Table 4.3 Reservoir properties used for simulation33
Properties Quantities
Porosity (%) 30
Permeability I,j,k (mD) 4000
Temperature (°C) 22
Initial Pressure (kPa) 3700
Length(m) 1000
Height(m) 10
Width(m) 130
Initial Oil Saturation 0.82

51
Also figure 4-10 shows a 3D representation of the reservoir model in vertical cross
section. Once the reservoir model was built and the array properties were assigned
for each layer, the fluid model was imported to the GEM module from CMG‟s Win
Prop module.
Figure 4.11: 3D representation of the reservoir model in simulation33
The conclusions obtained from this research express that:
- Replacement a portion of the methane in the solvent with CO2 resulted in
equal or greater recovery factors in the majority of the conducted
simulations.
- Addition of CO2 to the solvent is more beneficial in higher pressures. The
performance of the solvents containing CO2 was greater at a reservoir
pressure of 5700 kPa than at 3700 kPa.

52
- Reservoir temperature notably affected the VAPEX process. A temperature
increase of only 5 °C could increase oil recovery factor over 3% on average.
Also solubility of solvent in higher temperatures is greater.
- Due to the homogeneous property of the reservoir and the moderate
viscosity of the oil used in simulation, there was a relatively large spacing
between the injector and producer well (6-7 m). The greatest oil recovery
factors were achieved in this zone.

53
CHAPTER FIVE
Conclusions, Discussions and Recommendations
This chapter presents the results obtained by this thesis, discussions related to the
subject and the author‟s recommendations for further research in this field.
5.1 Conclusions
Chapter three discussed the thermal methods for recovery of heavy oil. First, the
SAGD mechanism was outlined. Steam quality, depth of formation, SOR ratio,
operating pressure, price of burning fuel, probable use of solvents and the geo-
mechanical effects were shown to affect the SAGD process. As an example for the
geo-mechanical effect on SAGD mechanism, it was discussed that horizontal
stresses perpendicular to the Rocky Mountains axis are very high and will exceed
the vertical stress for SAGD processes. Thus by choosing SAGD for the recovery
mechanism, reservoir characterization, geological properties and depth must be
considered.
Following SAGD, the Cyclic Steam Stimulation (CSS) mechanism was described.
The effects of heat loss, amount of steam injected during “huff” period and the
natural energy of reservoir are the significant parameters affecting the outcome of
a CSS process. Also it was mathematically proved that the stimulation ratio
depends only on the heated ratio. This implies a grand steam slug in case of extra
heavy oil.
The last section of chapter three covers the in-situ combustion process. It was
stated that due to the possible heat loss in steam injection (up to depth of 3000ft.);

54
in-situ combustion is applicable in relatively greater depths. It was observed that
this mechanism is depended on the air or oxygen injection capability, the ability of
operators to control the movement and propagation of the displacing front, the
air/fuel ratio.
Chapter four presenting the non-thermal methods begins with the CHOPS
mechanism. The huge amount of sand influx in some reservoirs, especially in the
Canadian Heavy Oil Belt (CHOB), makes this process the dominant choice of
operators for extracting “oil sands”. CHOPS also provide different challenges such
as corrosion, separation of oil/sand and waste treatment.
Next to CHOPS, waterflooding is discussed. It is concluded that waterflooding
cannot considerably affect the recovery mechanism due to the “viscous fingering”
phenomena. Thus a stronger displacing front may be formed. This links the
discussion to the next recovery method, polymer flooding. The concentration of
polymer slug, polymer loss and its cost mainly determine the success or failure of a
polymer flood operation.
The final section of chapter four outlines the vapor extraction process (VAPEX). It
is a relatively new concept providing some challenges and benefits. It can be
applied where use of thermal methods is facing limitation. Hence, not using the
thermal energy will yield energy saving and cost reduction. On the other hand,
heavy oil recovery through VAPEX has shown to be low and requires new
engineering designs to improve.
5.2 Discussions
This part compares the results obtained by the thesis.
Growth of communities and facilitation of less-developed regions along with the
development of industry makes the world more and more dependent on energy
resources. Today Fossil fuels are the dominant source of energy supply. Petroleum
is undoubtedly the most applicable type of fossil fuel. Conventional crude oils are
a valuable source of energy and the global reserves will run out of that someday.
Here the importance of heavy oil deposits is highlighted. Bitumen and heavy oil
global reserves are more than 6 billion barrels.
55
In the US, some 440 billion barrels of oil in place have been found to date,yet the
estimated ultimate recovery is only 145 billion barrels, or about one-third of that
discovered. Throughout the world, a resource close to 2.0 trillion barrels of oil can
be classified as unrecoverable by existing technologies.
So, the thermal and non-thermal methods proposed for heavy oil recovery in the
industry, though had improved the recover factor but, still need to be promoted and
may replace with newer technologies to meet the industry needs.
5.3 Recommendations for future research
Heavy oil and Bitumen deposits around the world, in spite of being similar in
nature and chemical compositions, may have a somehow different property and
characteristics. For example in Athabasca region which contains 1.7 trillion barrels
of bitumen in place, oil sands are produced due to large sand influx, the
Venezuelan heavy oil and bitumen is also characterized by its high viscosity, also
heavy oil in Middle East like Iran and Kuwait have properties rather than that in
Canada or Venezuela.
Also in addition to geological characteristics, the input energy for the recovery
process must be carefully analyzed to have the minimum loss and the maximum
recovery. The use of heat in form of steam has shown to be successful in practice
but the steam facility, piping and instrumentation design, water quality and heat
loss may introduce some challenges. Not only in steam injection, but also in other
methods the input energy is a matter of consideration.
With respect to geological conditions, it is recommended that renewable energies
play the role of initial energy source for heavy oil recovery. Use of renewable
energies will yield some positive consequences such as reducing the costs,
protecting the environment and providing a sustainable source of energy as an
input for thermal and non-thermal recovery of heavy oil. An example of such
resource is the Concentrated Solar Power (CSP) technology. This technology is
used in Western US generate solar thermal electric power. As we know steam is
fed into the turbine for electricity generation in a power plant.

56
In a probable application of CPS technology in heavy oil recovery, the SAGD
mechanism may be improved. The steam requirement for a SAGD project is
provided by boiler. The boiler consumes natural gas to boil water, and thus the
steam is sent to the injection well. Here, the CPS technology may replace the boiler
by heating the water via parabolic troughs. It is recommended that a more detailed
study concerning the use of CPS technology to improve SAGD mechanism to be
done.

57
List of References:
1. Farouq, A. 1997. Practical heavy oil recovery. Edmonton, Alberta, Canada:
Monterey Resources Inc., Bakersfield, CA.
2. Brian Clark, 2007. Heavy Oil, Extra-Heavy Oil and Bitumen unconventional
Oil. National Petroleum Council. Schlumberger Limited.
3. Dusseault.M, MBDC Inc, March 2002. Cold Heavy Oil Production with Sand in
the Canadian Heavy Oil Industry
4. Moore, S.W.; Solomon, B.J. Preliminary Results of Core Drilling and Other
Geologic Studies of Paleogene Oil Shale-Bearing Deposits Near Elko, Nevada. In
Proceedings of the 15th Annual Oil Shale Symposium Proceedings, Golden, CO,
April 27-30, 1982; Gary, J.H., Ed.; pp 69-78.
5. Canada‟s Oil Sands Opportunities and Challenges to 2015: an Update, June
2006,NationalEnergyBoardhttp://www.nebone.gc.ca/energy/EnergyReports/EMA
OilSandsOpportunitiesChallenges2015_2006/EMAOilSandsOpportunities2015Can
ada2006_e.pdf
6. Ophus, K. Removal of Hydrocarbons from Particulate Solids. International
Patent Application number: PCT/CA2004/001826, April 20, 2004.
7. Effect of Drainage Height and Grain Size on Production Rates in the Vapex
Process: Experimental Study, Ali Yazdani J., SPE, and Brij B. Maini, SPE, U. of
Calgary
8. Dusseault, M.B. (June 12–14, 2001). "Comparing Venezuelan and Canadian
Heavy Oil and Tar Sands" (PDF). Calgary, Canada: Canadian International
Petroleum Conference. Retrieved 2008-05-05.
9. Satter,A.Thakur,G. 1994, Integrated Petroleum Reservoir Management, A Team
Approach. Tulsa, Oklahoma : Penn Well Publishing Company
10. www.bordercity.ca

58
11. Edmunds, N. R.: "The Case for SAGD: Theory and Practice of Heavy Oil and
Bitumen Recovery", Paper 50 presented at the SPE/CIM/CANMET International
Conference on Recent Advances in Horizontal Well Applications, Calgary, March
20-23, 1994.
12. Improving the performance of SAGD . S. Das, SPE, ConocoPhilips
13. Geomechanical Effects on the SAGD Process.Patrick M. Collins, PS-
CIM/CHOA/SPE, Petroleum Geomechanics Inc.
14.Towson, D.E. and Boberg, T.C.: “Gravity Drainage in Thermally Stimulated
Wells”, J.Can. Pet. Tech, 1967
15. Pursley, S.A.: “Experimental Studies of Thermal Recovery Processes”,
presented at the Heavy Oil Symposium, Maracaibo, 1974.
16.De Haan, H.J. and van Lookeren, J : “ Early results of the first large-scale steam
soak project in the Tia Juana field, Western Venezuela,” JPT (1969) 101-110,
Trans, AIME, 246.
17. Boberg, T.C. and Lantz, R.B. Jr.:” Calculation of the production rate of a
thermally stimulated well”, JPT 1996, Trans., AIME, 237.
18. Tadema, H.J and Weijdema, J. :” spontaneous ignition in oil sands,” Oil & Gas
J. 1970
19. Moss J.T and White, T.D.: “High temperature thermal techniques for
stimulating oil recovery”, JPT 1965.
20. Gates, C.F and Ramey, H.J. Jr. “ Field results of South Belridge thermal
recovery experiment,” Trans AIME 1958
21. Gates, C.F and Ramey, H.J. Jr. “ A method for engineering in situ combustion
oil recovery projects” JPT 1980
22.Ramey, H.J et al.: “ Case history of South Belridge, California in situ
combustion oil recovery” paper SPE 24200 presented at the 1992 SPE/DOE
Enhanced Oil Recovery Symposum, Tulsa.
59
23. Parrish, D.R and Craig, F.F. Jr,: “Laboratory study of a combination of forward
combustion and waterfloodinf-The COFCAW process,” JPT 1969, AIME, 246.
24.Dietz, D.N. and Weijdema, J.: “ Wet and partially quenched combustion,” JPT
1968; Trans., AIME, 243.
25. PETERS, E.J. and FLOCK, D.L., The Onset of Instability During Two-Phase
Immiscible Displacement in Porous Media; SPE Journal, 249 – 258, April 1981.
26. Heavy Oil Waterflooding: Effects of Flow Rate and Oil Viscosity A. MAI
University of Calgary, TIPM Laboratory .A. KANTZAS University of Calgary,
TIPM Laboratory
27. Cold Heavy Oil Production with Sand in the Canadian Heavy Oil Industry
For Alberta Department of Energy March 2002 by Maurice B. Dusseault MBDC
Inc.
28. Green, Don W. G. Paul Willhite. 1998, Enhanced oil recovery. SPE text book
series vol. 6. Richardson Texas.
29. Van pollen, H.K. and assiciates.1980. Fundamentals of enhanced oil recovery.
PennWell Books. Tulsa, Oklahama
30. Full Scale Vapex Process- Climate Change Advantage and Economic
Consequences, R.W Luhning, S.K. Das, L.J. Fisher, J. Bakker, J. Grabowski, J.R.
Engleman, S. Wong, L.A. Sullivan, H.A. Boyle, JCPT Feb 2003 Vol. 42 No.2.
31. Vapex: An Efficient Process for the Recovery of Heavy Oil and Bitumen, S. K.
Das, SPE Journal No 50941 Sep 1998.
32. A new process (VAPEX) for recovering heavy oils using hot water and
hydrocarbon vapour, Roger M. BUTLER and IGOR J.MOKRYS, The university
of Calgary, Alberta
33. The evaluation of CO2-based vapour extraction (VAPEX) process
for heavy-oil recovery. Farshid Torabi • Benyamin Yadali Jamaloei •
Blair M. Stengler • Drew E. Jackson. 2012
34. Energy Technology Perspectives 2006, Scenarios and Strategies to 2050,
International Energy Agency, 2006, p. 265-267

60
35. “Canadian Oil Sands: a Heavy Hitter”, J. Perdue, Harts E&P, April 4, 2003,
http://www.eandpnet.com/articles/4/2003
“The Canadian Oil Sands Opportunities and Challenges”, Feb. 2006, 36.
GStringham, Canadian Association of Petroleum
Producers.http://www.capp.ca/raw.asp?x=1&dt=PDF&dn=97372

61
Appendix A
Thermal Conductivity of Oil Reservoir Materials
Unconsolidated Oil Sands
The conductivity of oil sand mixtures must fall in the range of the conductivities of
the individual components-sand water, oil and gas. These conductivities at120ºF
are approximately as follows: Material Thermal Conductivity
(W/m °C) Sand 2.85 to 7.7 Water 0.64 Oil 0.093 Air 0.024
The thermal conductivity of the sand grains depends upon their composition.
In particular, quartz has a much higher thermal conductivity than most other sand
grains, and, as a result, the average conductivity is largely determined by the quartz
content.
An extensive listing of the conductivities of a wide range of minerals is given by
Cermak (1967) and by Cermak and Ryback (1982); abstracted values are given
next.
Material Thermal Conductivity at Room Temperature
(W/m °C) Quartz 7.69 Chert 4.53 Flint 3.71 Vitrous silica Calcite Dolomite Felspars
1.36 3.57 5.50 2.3 – 2.5
(Cermak and Rybach 1982)
Somerton Keese, and Chu (1974) found that the average thermal conductivity of
the sand grain material can be estimated by using the following equation:
Khs = 2.86 + 4.85 W/m ºC
where G is the volume fraction of quartz in the solid.

62
Comparison of Measured Thermal Conductivity of Tar Sand with Prediction
from Somerton's Formula
Scott and Seto (1986) have reported measurements of the thermal conductivity of
oil and water saturated core samples of Athabasca tar sand using both steady-state
and transient heating methods.
The sample they used had the following properties:
Porosity 0.35
Quartz content of sand 0.97
Water saturation 0.267
Oil saturation 0.733
Somerton's formulas would predict:
Khs = 2.86 + 4.85 × 0.97 = 7.56 W/m ºC
and
Khs = 1.273 – 2.25 × 0.35 + 0.390 × 7.56√0.267 = 2.01 W/m ºC
Setting Sw = 0 and to 1 gives
Kh dry = 0.49 W/m ºC
and
Kh wet = 3.43 W/m ºC
Scott and Seto's measurements are compared to these predictions in the following
table.
Material Predicted Steady State Transient
(W/m °C) Dry 0.49 0.43 0.44
Oil Saturated 2.01 2.0 Water Saturated 3.43 4.03 3.47

63
Consolidated Porous Rocks
The thermal conductivities of consolidated porous rocks are higher than those of
unconsolidated sands because of the continuous nature of the rock matrix. Also,
consolidated rocks generally have lower porosities than sands, and their
conductivity is less influenced by the nature of the pore fluids the thermal
conductivities of a large number of sandstone materials have been measured by
Cermak (1967) .His measurements of the thermal conductivities of dried
sandstones are shown as function of porosity in the following Figure. Although the
data are scattered, there is a trend for the thermal conductivity to decrease, as
might be expected, with increasing porosity
Thermal Conductivity of Dry Sandstone (Cermak 1967)

To contact the author please use the following e‐mail address:
Amir Kazemi
Science & Research branch, Islamic Azad University, Petroleum Dept.