
Bridging the gap in the financing of intangibles to support ...
50
Bridging the gap in the financing of intangibles to support productivity: Background paper An OECD contribution to the G20 Italian Presidency 2021 2021
-
Upload
khangminh22 -
Category
Documents
-
view
1 -
download
0
Transcript of Bridging the gap in the financing of intangibles to support ...

Bridging the gap in the financing of intangibles to support productivity: Background paper
An OECD contribution to the G20 Italian Presidency 2021
2021


This document was prepared by the Organisation for Economic Co-operation and Development as an input for the discussions in the Framework Working Group in 2021 (under the G20 Italian Presidency). The opinions expressed and arguments employed herein do not necessarily reflect the official views of OECD member countries or of the G-20 members. This document and any map included herein are without prejudice to the status of or sovereignty over any territory, to the delimitation of international frontiers and boundaries and to the name of any territory, city or area. Please cite this publication as: OECD (2021), “Bridging the gap in the financing of intangibles to support productivity: Background paper”, OECD Publishing, Paris. © OECD (2021) The use of this work, whether digital or print, is governed by the Terms and Conditions to be found at http://www.oecd.org/termsandconditions.

2
Table of contents
Bridging the gap in the financing of intangibles to support productivity: Background paper 4
1. Introduction 4
2. Intangible assets financing gap 7
2.1. Intangible assets financing gaps and their impact on productivity 7 2.2. The COVID-19 outbreak amplifies the benefits of intangible investment while
exacerbating financing challenges 11
3. Policies to close the intangible financing gap 13
3.1. Government financing for a knowledge-based economy 13 3.2. Financial markets for a knowledge-based economy 19 3.3. Bank financing for a knowledge-based economy 24
4. Conclusion 32
References 34
Annex A. A new methodology to extend the estimation of intangible investment to a wider range of countries 42
Annex B. Additional figures 44
Annex C. Lessons from venture capital successful experiences 45
Annex D. Crowdfunding and Blockchain technologies: a complementary source of finance for start-ups? 47
Figures
Figure 1. Intangible assets gross fixed capital formation varies across G20 countries and over time 5 Figure 2. The challenge of financing intangibles 8 Figure 3. Financial development benefits productivity more strongly in intangible-intensive industries 9 Figure 4. Easing financial constraints is more beneficial for firm productivity in intangible-intensive sectors 10 Figure 5. Financial development allows productive firms to grow faster, but more so in intangible-intensive
sectors 10 Figure 6. The impact of COVID-19 along the intangible intensity dimension 11 Figure 7. Deep equity markets benefit especially intangible-intensive sectors 19 Figure 8. The number of listing decreases while market capitalisation rises 22 Figure 9. Venture capital markets and countries’ intangible investment 23 Figure 10. Firms operating in intangible-intensive sectors rely less on debt financing 24 Figure 11. Collateral availability along the intangible intensity dimension and its impact on the finance-
productivity nexus 25

3
Figure 12. Intangible-intensive sectors benefit most from sound insolvency regimes 29 Figure 13. Intangible-intensive sectors benefit most from banks’ access to in-depth credit information 30 Figure 14. Policies to close the financing gap in intangible assets: a summary 33 Figure A.1. A new intangible investment series 43 Figure B.1. Intangible intensity by sector 44 Figure B.2. Intellectual property rights and countries’ intangible investment 44
Boxes
Box 1. Related economic challenges 7 Box 2. Easing barriers to firms investment in job training 16 Box 3. IP backed loans: country-specific experiences 27 Box 4. Accounting rules and evaluation methods for intangible investment 31
4
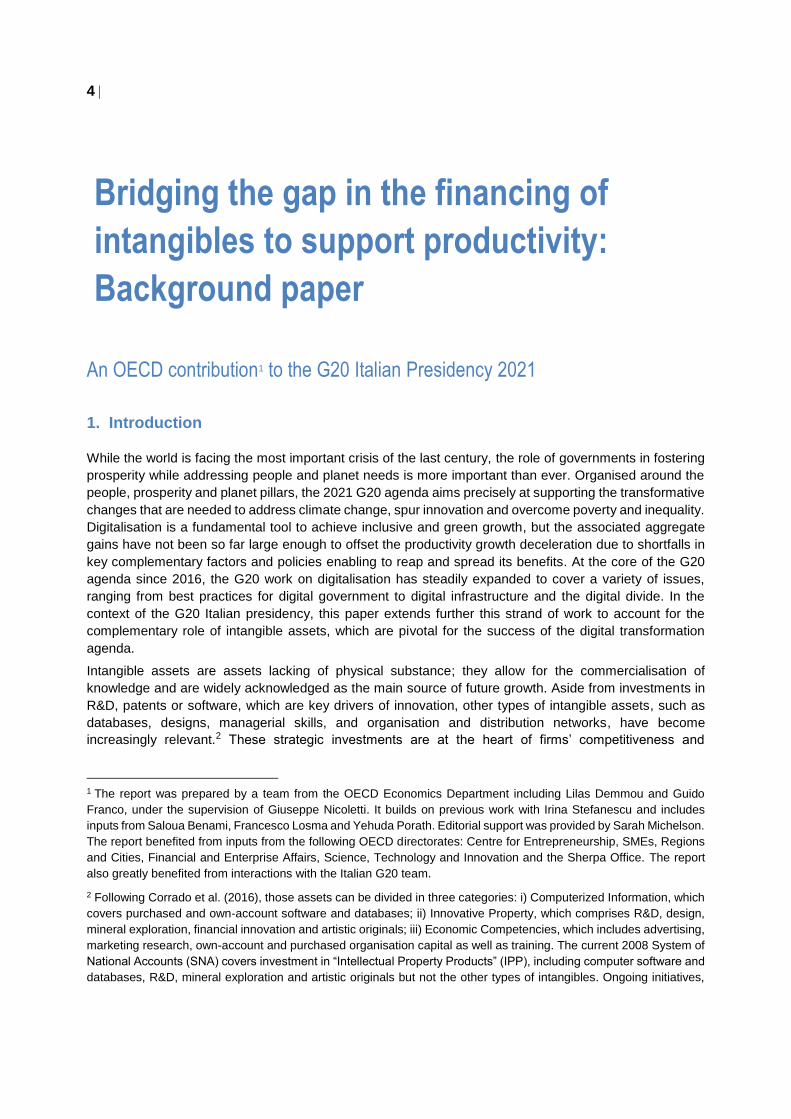
An OECD contribution1 to the G20 Italian Presidency 2021
1. Introduction
While the world is facing the most important crisis of the last century, the role of governments in fostering
prosperity while addressing people and planet needs is more important than ever. Organised around the
people, prosperity and planet pillars, the 2021 G20 agenda aims precisely at supporting the transformative
changes that are needed to address climate change, spur innovation and overcome poverty and inequality.
Digitalisation is a fundamental tool to achieve inclusive and green growth, but the associated aggregate
gains have not been so far large enough to offset the productivity growth deceleration due to shortfalls in
key complementary factors and policies enabling to reap and spread its benefits. At the core of the G20
agenda since 2016, the G20 work on digitalisation has steadily expanded to cover a variety of issues,
ranging from best practices for digital government to digital infrastructure and the digital divide. In the
context of the G20 Italian presidency, this paper extends further this strand of work to account for the
complementary role of intangible assets, which are pivotal for the success of the digital transformation
agenda.
Intangible assets are assets lacking of physical substance; they allow for the commercialisation of
knowledge and are widely acknowledged as the main source of future growth. Aside from investments in
R&D, patents or software, which are key drivers of innovation, other types of intangible assets, such as
databases, designs, managerial skills, and organisation and distribution networks, have become
increasingly relevant.2 These strategic investments are at the heart of firms’ competitiveness and
1 The report was prepared by a team from the OECD Economics Department including Lilas Demmou and Guido
Franco, under the supervision of Giuseppe Nicoletti. It builds on previous work with Irina Stefanescu and includes
inputs from Saloua Benami, Francesco Losma and Yehuda Porath. Editorial support was provided by Sarah Michelson.
The report benefited from inputs from the following OECD directorates: Centre for Entrepreneurship, SMEs, Regions
and Cities, Financial and Enterprise Affairs, Science, Technology and Innovation and the Sherpa Office. The report
also greatly benefited from interactions with the Italian G20 team.
2 Following Corrado et al. (2016), those assets can be divided in three categories: i) Computerized Information, which
covers purchased and own-account software and databases; ii) Innovative Property, which comprises R&D, design,
mineral exploration, financial innovation and artistic originals; iii) Economic Competencies, which includes advertising,
marketing research, own-account and purchased organisation capital as well as training. The current 2008 System of
National Accounts (SNA) covers investment in “Intellectual Property Products” (IPP), including computer software and
databases, R&D, mineral exploration and artistic originals but not the other types of intangibles. Ongoing initiatives,
Bridging the gap in the financing of
intangibles to support productivity:
Background paper
5
productivity, largely due to their complementarity with digital technologies, which carry the potential to
enhance innovation and increase the demand for high-skilled workers and managerial competencies.
Intangible assets also have the potential to increase the resilience of economies to large shocks exploiting
the flexibility that the use of digital technologies provides (e.g., via teleworking arrangements and swift
reorganisation of productive activities). As a result, the shift in the composition of investment toward
intangible assets has the potential to reverse the productivity growth slowdown observed in G20
economies and to foster the recovery following the COVID-19 shock.
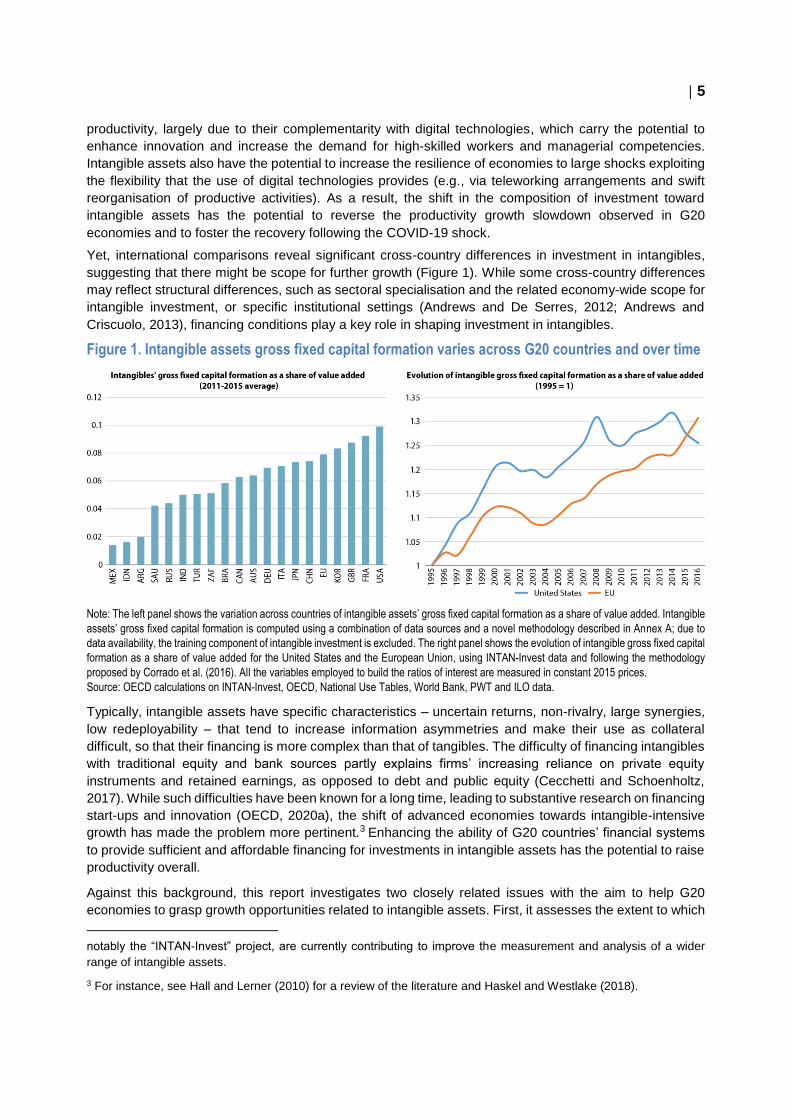
Yet, international comparisons reveal significant cross-country differences in investment in intangibles,
suggesting that there might be scope for further growth (Figure 1). While some cross-country differences
may reflect structural differences, such as sectoral specialisation and the related economy-wide scope for
intangible investment, or specific institutional settings (Andrews and De Serres, 2012; Andrews and
Criscuolo, 2013), financing conditions play a key role in shaping investment in intangibles.
Figure 1. Intangible assets gross fixed capital formation varies across G20 countries and over time
Note: The left panel shows the variation across countries of intangible assets’ gross fixed capital formation as a share of value added. Intangible
assets’ gross fixed capital formation is computed using a combination of data sources and a novel methodology described in Annex A; due to
data availability, the training component of intangible investment is excluded. The right panel shows the evolution of intangible gross fixed capital
formation as a share of value added for the United States and the European Union, using INTAN-Invest data and following the methodology
proposed by Corrado et al. (2016). All the variables employed to build the ratios of interest are measured in constant 2015 prices.
Source: OECD calculations on INTAN-Invest, OECD, National Use Tables, World Bank, PWT and ILO data.
Typically, intangible assets have specific characteristics – uncertain returns, non-rivalry, large synergies,
low redeployability – that tend to increase information asymmetries and make their use as collateral
difficult, so that their financing is more complex than that of tangibles. The difficulty of financing intangibles
with traditional equity and bank sources partly explains firms’ increasing reliance on private equity
instruments and retained earnings, as opposed to debt and public equity (Cecchetti and Schoenholtz,
2017). While such difficulties have been known for a long time, leading to substantive research on financing
start-ups and innovation (OECD, 2020a), the shift of advanced economies towards intangible-intensive
growth has made the problem more pertinent.3 Enhancing the ability of G20 countries’ financial systems
to provide sufficient and affordable financing for investments in intangible assets has the potential to raise
productivity overall.
Against this background, this report investigates two closely related issues with the aim to help G20
economies to grasp growth opportunities related to intangible assets. First, it assesses the extent to which
notably the “INTAN-Invest” project, are currently contributing to improve the measurement and analysis of a wider
range of intangible assets.
3 For instance, see Hall and Lerner (2010) for a review of the literature and Haskel and Westlake (2018).

6
financing barriers affecting firms in intangible-intensive sectors undermine their productivity performance,
and examines whether the COVID-19 outbreak has dampened or magnified the challenges related to
intangibles financing (OECD, 2020b). Second, it discusses the wide range of policies that could contribute
to ease access to finance for intangible-intensive firms and more generally to broaden the uptake of
intangible investment in the whole corporate sector, possibly leading to stronger productivity growth in G20
economies. Financial frictions that hold back intangible investment may also create challenges other than
productivity for policy makers, not explicitly investigated in the paper (Box 1).
The main findings indicate that easing financing barriers is particularly beneficial for productivity in sectors
that rely more intensively on intangible assets, as firm-level productivity in intangible-intensive sectors is
boosted and the ability of the most successful firms in these sectors to expand is enhanced, indirectly
pointing to the existence of a “financing gap” due to financial frictions. The potential impact of the COVID-
19 crisis is ambiguous. On the one side, consistent with the diverse ability to rely on innovative technologies
and teleworking arrangements, as well as with their tendency to rely on internal funds, intangible-intensive
sectors are predicted to be better positioned to weather the crisis compared to traditional sectors,
confirming that intangible capital is critical to strengthen firms’ resilience. On the other side, intangible-
intensive firms may face even stronger constraints following the depletion of cash and equity buffers to
countervail the decline in sales, weakening potentially the strength of the recovery if intangible investment
significantly slows down in the aftermath of the shock.
Recognizing cross-country differences in the structure of financial systems, the report focuses on the three
main sources of external finance available to firms - government support, equity financing and bank credit-
and identifies policy-levers that authorities could exploit to make each source of finance more supportive
of intangible investment. As intangible assets are often complementary in production and their most
appropriate financing sources may differ, a cross-cutting approach to financial market reform could be
useful to unlock the potential of these assets. The following set of policy measures is particularly relevant:
Intangible-friendly COVID-19 related support. If well designed and directed, the large COVID-19
related fiscal stimulus packages could accelerate the shift towards a knowledge-based economy
while fostering the recovery. Indeed, the provision of loans and loan guarantees, the development
of schemes featuring equity-type capital injections and the preservation of direct public support to
innovative businesses could contribute to attenuate the disruptions caused by the COVID-19
outbreak and ease the frictions hampering intangibles investment.
Standard innovation policies that would benefit investment in intangibles. The development of
venture capital markets, which are an important source of finance for start-ups and intangible-
intensive firms at early stages of their life-cycle, and a fine-tuning of government direct and indirect
support of high growth SMEs could further ease the financing frictions faced by innovative firms.
Financial market framework policies. Progressing on the European Capital Market Union, reducing
the preference to use debt over equity, easing access to IPOs, ensuring that the structure of equity
markets is supportive of the provision of patient and engaged capital, and enhancing stock market
liquidity and financial literacy could spur both the demand and supply of equity with beneficial
effects on the ability of firms to finance intangible-intensive projects, as equity investors are more
willing than banks to take risks even without strong collateral.
Policies to widen financing options for investment in intangibles. Ensuring efficient liquidation of
intangibles and providing incentives to bank credit backed by intangibles could increase their
collateral value and ease access to bank finance. At the same time, better tailoring financial reports
and accounting standards to the specific features of intangibles would enable both banks and
equity investors to make better informed decisions when allocating resources. Moreover, the
expansion of well-designed R&D tax incentives and government funding to other types of
intangibles might also be considered for assets displaying positive externalities (e.g.,
organisational capital and workers’ training).

7
Box 1. Related economic challenges
The increased relevance of intangible assets combined with the financing gap that limits intangible
investment may generate additional economic challenges.
A competition challenge. The rise of intangibles occurred simultaneously with the increase in industry
concentration (Bajgar et al., 2019) and the widening of the productivity gap between frontier and laggard
firms (Andrews et al., 2016), potentially leading to the risk of undesired “winner takes all” dynamics in
digital sectors. Indeed, the difficulties that intangible-intensive SMEs and start-ups face in accessing
external capital and financing innovative projects could severely impair their ability to enter the market,
grow, and compete with incumbents (Berlingieri et al., 2020).
A financial stability challenge. The shift of G20 economies toward intangibles may also have
incentivised banks to reallocate their portfolios from commercial loans to real estate lending (Dell’Ariccia
et al., 2017), increasing macro-stability risks and the relative size of low productivity sectors in the
economy.4 This tendency has been further strengthened by the tighter prudential regulation
implemented in the aftermath of the financial crisis, according to which the amount of reserves banks
are required to keep depends on the type of loan they hold on their balance sheets -- loans secured
against intangibles are considered riskier and, thus, require holding relatively more reserves to back
them.
A monetary challenge. The increasing share of investment devoted to intangibles and the relatively
small portion of it that is financed by bank lending potentially weakens monetary policy transmission
channels, as investment is less responsive to changes in interest rates (Crouzet and Eberly, 2019).
A wage dispersion challenge. The economies of scale related to intangible capital are at the heart of
the success of “superstar firms”. This trend may relate to the decline in the labour share if a larger
fraction of output is produced by more productive firms with higher profits (Autor et al., 2019, Schwellnus
et al., 2018) and to the rising inequality among workers if superstar firms also pay consistently higher
wages and/or if they cluster in thriving cities (Haskel and Westlake, 2018).
The report proceeds as follows. Section 2 examines the empirical evidence on the existence of an
intangibles assets’ financing gap and its productivity impact, as well as specific challenges for intangible
investment in the context of the COVID-19 crisis. Section 3 discusses policy solutions to make government
financing, financial markets and the banking sector more suited to fit the needs of an intangible-based
economy. Section 4 concludes and summarizes the main policy areas for action.
2. Intangible assets financing gap
2.1. Intangible assets financing gaps and their impact on productivity
Intangible assets have specific characteristics that make their financing more difficult than that of tangibles
(Figure 2):
Asymmetry of information between investors and innovators. External investors have often
difficulties to evaluate the quality of and the risks associated with the projects of innovative
businesses, making the return on investment and the valuation of assets highly uncertain.
Furthermore, many innovative practices could be easily imitated by competitors or appropriated by
the financier (i.e. they are non-rival knowledge); it follows that intangible-intensive firms are
4 For instance, in the United States, the surge of firms’ intangible investment could explain up to 20% of this reallocation
over the 1977-2010 period (Dell’Ariccia et al., 2017).

8
reluctant to reveal their innovative ideas to capital market participants, further increasing the
opacity of information surrounding these projects.
Low pledgeability of intangibles as collateral. Financial intermediaries usually require collateral to
compensate for the lack of information and the related risks, as low quality borrowers are less
willing to pledge assets to signal their creditworthiness. However, intangible assets are more
difficult to pledge as collateral when searching for external capital. Compared to tangible assets,
their valuation is more volatile and at least certain categories of intangibles tend to be firm-specific
(i.e., they have low transferability). Therefore, intangible assets are harder to redeploy and have a
significantly lower liquidation value, reducing the share debtors can capture in case of default.
Indivisibility of large initial investments in intangibles. The complementarity among the various
types of intangible assets, and between tangible and intangible capital, implies that large initial
investments are needed to achieve intangibles’ full potential and many companies lack sufficient
internal resources to sustain such sizeable fixed and often irreversible costs. For instance, to fully
reap the benefits from digitalisation, firms often have to reorganize their processes, and improve
their management practices and workers skills (Sorbe et al., 2019). High information asymmetry
and low collateralisation make the divergence between the internal and external costs of capital
particularly large for intangible assets. The necessity to rely heavily on internal finance could hence
be an important obstacle to innovation, especially for small and medium sized enterprises, which
often cannot access equity markets.
Figure 2. The challenge of financing intangibles
Source: OECD.
In light of these specific features, access to finance is likely to play a critical role in shaping productivity
outcomes. Given the strong productive potential of intangible assets, the aggregate productivity benefits
arising from improving financial conditions are potentially larger in intangible-intensive sectors than
elsewhere in the economy. The OECD has explored this conjecture by investigating the impact of easing
financing frictions on productivity conditional on sector-level intangible intensity, using both sector and firm-
level cross-country data.5
5 Sectoral intangible intensity is computed following Demmou et al. (2019) and is reported in Figure B1. The economic
weight of intangible-intensive sectors is sizeable: the share of employment in these sectors could reach up to 70% of

9
Results at the sectoral level confirm that intangible-intensive sectors benefit relatively more from financial
development than other more traditional sectors. Figure 3 shows the excess increase in productivity that
a country would experience in intangible-intensive sectors when moving from a given level of financial
development to the highest observed level. The magnitude of the excess productivity benefit is not
negligible: the simulation implies a productivity improvement that is approximately 9% larger in intangible-
intensive sectors compared to traditional ones for low financial development countries and around 4%
larger for countries starting from an average financial system development.
Figure 3. Financial development benefits productivity more strongly in intangible-intensive industries
Productivity gains (in high relative to low intangible-intensive sectors) from moving to the highest level of financial
development
Note: Based on OECD regression analysis (Demmou et al., 2019; Demmou and Franco, 2021), the figure shows the differential productivity
increase in intangible-intensive sectors compared to traditional sectors following an increase in financial development to the highest level
according to the IMF index (average value of the index during the sample period; benchmark country: USA). The estimation is carried over the
1990-2015 period.
Source: OECD calculations on STAN, Compustat and IMF data.
Two channels can drive these aggregate findings. First, a stronger improvement of productivity at the firm
level (i.e. a within-firm effect), if easing financing frictions boosts firms’ productivity more in sectors
intensive in intangible assets. Second, an improvement in the efficiency of the allocation of resources (i.e.
a between-firm effect), if easing financing frictions boosts aggregate productivity by allowing the most
productive firms within each industry to grow and gain market shares, especially in intangible-intensive
industries.
The within firm channel operates via the ability of firms to finance their innovative projects and thus increase
their productivity, either by improving the quality of their products or the efficiency of their production
processes. Limited internal funds and/or constraints on external financing could impair the implementation
of firms’ productivity-enhancing strategies, particularly in intangible-intensive sectors, due to the additional
difficulty to finance intangibles. The empirical analysis confirms that the productivity of firms in intangible-
intensive sectors benefits relatively more from sound financial conditions (Figure 4). The magnitude of the
effects is sizeable: reducing financial constraints from a high to a low level explains 14.4% of the change
in productivity in firms operating in high intangible-intensive sectors, against 11% in traditional ones.
the total employment in manufacturing and non-financial business services industries (OECD calculations based on
OECD-STAN data).

10
Figure 4. Easing financial constraints is more beneficial for firm productivity in intangible-intensive sectors
Effect on productivity of moving from a high to a low level of financial constraints
Note: Based on OECD regression analysis (Demmou et al., 2020; Demmou and Franco, 2021), the figure shows the portion of the variation in
productivity explained by moving from a high (75th percentile in the distribution of firms’ financial constraints) to a low (25th percentile) level of
financial constraints. The estimation is carried over the 1995-2015 period.
Source: OECD calculations on Orbis and Compustat data.
The between-firm channel operates via the ability of the most productive firms to attract more resources
and gain larger market shares than the least productive ones. Financial conditions are a critical factor that
may influence this process. OECD empirical analysis shows that a well-developed financial system
reinforces the link between productivity performance and firm growth (in terms of number of employees),
and that this virtuous impact of financial development on labour reallocation across firms is larger in
intangible-intensive sectors than in more traditional sectors (Figure 5). For instance, moving from a low to
the highest level of financial development could increase the contribution of productivity performance to
firm-level employment growth by 60% in intangible-intensive sectors and by 40% in traditional ones.
Figure 5. Financial development allows productive firms to grow faster, but more so in intangible-intensive sectors
Increase in the contribution of productivity performance to firm-level employment growth from moving to the highest
level of financial development
Note: Based on OECD regression analysis (Demmou and Franco, 2021), the figure shows the extent to which moving from a low to the highest
level of financial development reinforces the link between productivity performance and firm-level employment growth. The estimation is carried
over the 1995-2015 period.
Source: OECD calculations on Orbis, Compustat and IMF data.

11
2.2. The COVID-19 outbreak amplifies the benefits of intangible investment while
exacerbating financing challenges
The COVID-19 outbreak generates new opportunities to harness intangible assets potential, but also
increases the challenges related to their financing. On the one side, due to their organisational and financial
characteristics, intangible-intensive firms tend to be more resilient to shocks like the COVID-19. On the
other side, the same factors at the heart of this resilience could become a source of difficulties during the
recovery, slowing down intangible-investment in the aftermath of the crisis, leading to the premature exit
of potentially viable innovative firms and reducing market contestability following lower entry rates.
2.2.1. Intangible-intensive firms are better positioned to weather the COVID shock…
OECD analysis (Demmou et al., 2021) predicts that intangible-intensive sectors are better positioned to
weather the crisis compared to traditional sectors (Figure 6).6 First, consistent with the diverse ability to
rely on innovative technologies, firms operating in intangible-intensive sectors faced on average a less
severe sales shock, so that they are estimated to experience a slightly lower decline in profitability and a
relatively smaller portion of those firms is expected to report losses. This is because such technologies
allow a better and quicker adaptation to the new social distancing norms that are likely to prevail in the
short to medium term and facilitate the reorganisation of supply chains that have been disrupted by the
crisis. Second, intangible-intensive firms tend to rely prevalently on internal funds to finance investment
and thus to be less leveraged and to hold larger cash and equity buffers; as a result, they are better placed
to service their debt and have a lower probability of becoming distressed during the COVID-19 crisis.
Figure 6. The impact of COVID-19 along the intangible intensity dimension
Note: Based on the accounting framework developed in Demmou et al. (2021), the figure shows the predicted impact of the COVID-19 outbreak
one year after the implementation of the first confinement measures on both high and low intangible-intensive sectors. The left panel reports the
percentage of firms experiencing losses, while the right panel the percentage of distressed firms (i.e., firms whose book value of equity is
predicted to turn negative). Notice that the sample is restricted ex-ante to firms having both positive profits and book value of equity in the 2018
reference year and that, for the sake of exposition, the y-axis scale varies among panels.
Source: OECD calculations on Orbis and Compustat data.
6 The figure reports average results and hence does not reflect the heterogeneity that might exist within group of
sectors (e.g. certain high intangible intensity industries, like aircraft manufacturers, have been vulnerable to the shock).

12
2.2.2. ...but challenges related to the financing and the growth of intangibles might be
heightened in the aftermath of the crisis
The risk of a slowdown in intangible investment
The evidence presented above suggests that intangible-intensive firms could be relatively more resilient
to the COVID-19 shock. Yet, this stronger resilience could also come at the price of a subsequent slow-
down of their investment path due to increased financing constraints. As firms are using their cash reserves
to cover operating expenses during the confinement and post-confinement period, and given the difficulty
to finance intangibles through traditional external sources, they may have to reduce critical investments
until they buffer again enough financial resources – a process that might take time given the reduced profit
streams and uncertainty around future sales.
The COVID-19 shock may also lead to a change in the composition of investment. Financially-constrained
firms may prioritize investment in pledgeable assets to offset the tightening of financial conditions, resulting
in an even stronger cut-back of intangible investment (Munro and Lamb, 2020; Paunov and Planes-
Satorra, 2020). This tilting towards tangible investment may be even more widespread for at least two
reasons. First, intangible investment is often irreversible, takes more time to translate into sales compared
to physical capital and has more uncertain returns, so that it appears particularly unappealing in the current
context.7 For instance, business investment in R&D tends historically to move in parallel to GDP,
corroborating that economic downturns have a global negative impact on innovation investments (Paunov,
2012). The other potentially aggravating factor is linked to the necessarily loose monetary policy
implemented to contrast financial markets turmoil, which may favour a reallocation of resources towards
collateralized tangible-intensive firms; indeed, while a low level of interest rates encourage investments
across the board, intangible-intensive firms would be relatively disadvantaged due to the low collateral
value of their assets and the higher difficulties to accumulate savings in a low interest rate environment
(Caggese and Perez-Orive, 2019).
The risk of a premature exit of distressed but potentially viable intangible-intensive firms
Despite higher resilience, the share of otherwise viable firms turning distressed remains sizeable in
intangible-intensive sectors. The premature exit from the market of those firms could have permanent
consequences on economic growth, as the economic costs of business failures might be particularly high
for these firms. First, intangible assets like buyer-supplier trust, lender-borrower relationships,
organisational effectiveness, employee-firm relations would require large sunk investments and time to be
re-built if destroyed by the crisis. Second, the liquidation value of intangible capital tends to be low,
especially for intangible assets which are firm-specific and hence not easy to be transferred.
An additional source of financial distress for companies heavily relying on purchased intangibles could
stem from a large write down of the value of these assets. Indeed, indefinite-lived intangible assets
and Goodwill, which usually reflects intangible capital not captured by accounting numbers in M&A activity,
are not amortised regularly and the widespread disruptions following the COVID-19 shock could have
created a gap between the original book value and their market value. Such situation would further
decrease earnings and subsequently equity capital, weakening even further intangible-intensive firms
ability to remain in the market and invest during the recovery.
7 For instance, Barrero et al. (2017) and Bansal et al. (2019) provide evidence that R&D investments are highly
sensitive to uncertainty; Barrero et al. (2020) stresses that the same may hold for other types of intangible capital.

13
The risk of lower market contestability/competition
COVID-19 related disruptions also generate a challenge with respect to the entry of new intangible-
intensive start-ups and its potential impact on the competitive environment. The uncertain economic
environment is expected to strongly reduce entry rates, hinting at the risk of a potential “lost generation” of
companies.8 A collapse of enterprise births could have long-lasting effects on innovation and aggregate
employment, as new entrants tend to bring disproportionately more new products or processes to the
market, make more intensive use of intangible capital and increase competition and market contestability.
Moreover, the shock could also induce a rise in the strategic acquisition of distressed companies, a
phenomenon already observed in the aftermath of the Great Financial Crisis. While being acquired can
often be the optimal solution for innovative entrants which do not find it convenient to go public, an increase
in M&A activity may have unintended effects on the competitive environment and business dynamism,
especially in an intangible-based economy characterized by strong network effects.
3. Policies to close the intangible financing gap
The available evidence highlights that the global shift towards intangible-intensive growth in G20
economies creates new financing challenges for firms, which are likely to have been exacerbated by the
COVID-19 shock. In particular, the specific financing frictions faced by intangible-intensive firms imply that
they might not be able to exploit their growth opportunities in full, and the higher cost of capital might deter
the entry of new innovative firms. This section discusses policies that could contribute to closing the
resulting financing gap by improving the provision of three sources of financing for firms: state financial
support to knowledge activities, equity-based and bank-based financing.
3.1. Government financing for a knowledge-based economy
Governments finance a portion of business sector investment in intangibles, either directly through
transfers, grants and loans or indirectly through tax incentives. Government support schemes can help
reduce the gap in the financing of intangible assets by allowing companies to invest in innovative activities
with potentially relevant economy-wide positive spillovers. Moreover, following the COVID-19 outbreak and
the strong fiscal stimulus packages adopted to counteract the economic consequences of the pandemic,
governments could play an even broader role in facilitating intangibles financing and the shift towards a
knowledge based economy.
3.1.1. Government support in normal time
Government indirect support to innovation
R&D tax incentive schemes are a common tool widely used by G20 governments to support innovation.9
Overall, they relax financial constraints affecting intangible investment (OECD, 2020c), by reducing its cost
for the eligible company and thus fostering within-firm productivity. Indeed, R&D tax incentives have a
stronger productivity impact in sectors dependent on external finance, on financially constrained firms as
well as on small and young companies with previously relatively low levels of R&D investment (Kasahara
8 For instance, firm creation in March and April 2020 dropped by 70% in Portugal, 46% in Hungary, 54% in France
and 57% in Turkey compared to the same months of the prior year (Calvino et al., 2020). Similarly, 20 000 new
companies were missing in Italy due to the COVID-19 shock, when comparing the first half of 2020 with the same
period of 2019 (Formai et al., 2020).
9 R&D tax incentives can provide relief to the input to the innovation process (i.e. expenditures incurred by firms) or to
the output (i.e. to the returns from the R&D investment). This section focuses on the former.

14
et al., 2014: Kobayashi, 2014, OECD, 2021a). Yet, their effects on business dynamism and the efficient
allocation of resources across firms are less clear. The reduction in financing constraints at the firm level
allows to enlarge the pool of companies contributing to intangible production (Castellacci and Lie, 2015).
But the extent of tax subsidies that firms obtain and their distribution across firm types is highly dependent
on the design of R&D tax incentives (Appelt, et al. 2019, OECD, 2021b). Credits could disproportionately
favour large incumbents, slowing down the reallocation process and resulting in weaker business
dynamism in R&D-intensive sectors (Bravo-Biosca, Criscuolo and Menon, 2013; Appelt et al., 2016, OECD
2020h).
The appropriate design of R&D tax schemes could make them more suited to help innovative and
intangible-intensive SMEs close the financing gap in intangibles. As even young and dynamic SMEs often
have relatively low profits, especially at the early stage of their life-cycle, credits tend to be ineffective when
limited to tax income liabilities, so it is critical to ensure they can be carried forward (i.e. the unused part of
the tax credit to be applied to tax liabilities in future years), refunded (i.e. the unused part of the credit is
directly payable to the company) or redeemed against payroll and social security contributions (Appelt et
al., 2016). In particular, refundability tends to have a stronger impact on R&D private investments
compared to carry-over (Poschel, 2019), as the effectiveness of the latter is impaired by the time lag
between the innovation-related expenses and the exploitation of the benefits related to the tax credit, which
may be even more relevant than the generosity of the credit (Elschner et al., 2009).10 Moreover, it is worth
noticing that the simple provision of more generous R&D tax credits based on firms’ size, which is applied
in several G20 countries to offset the implicit relative advantage large incumbents may have, might lower
incentives to grow, with detrimental aggregate productivity effects.
Whether current expenditures-based tax incentives schemes should be expanded to cover a wider range
of intangible assets is still a pending question. Indeed, currently, tax incentives largely target only R&D-
related expenditures (e.g., labor expenses for R&D personnel, the acquisition of software used for R&D,
licenses and IP rights for R&D; OECD, 2019a). Extending the schemes does not come without challenges
(OECD, 2021a). First, it might be difficult to implement, given the difficulty to monitor the eligible spending
and the risk of inappropriate classification of expenses in order to take advantage of the tax credit. For
instance, the classification of indirect costs of R&D (not eligible for the tax credit) as R&D might have led
to significant tax advantages in the U.S. (Laplante et al., 2019). Second, such extension could give rise to
tax planning opportunities and generates BEPS risk (e.g. marketing expenses or advertising can be
relocated easily from one subsidiary of the firm to another). Third, tax incentives may also lead to significant
deadweight losses if they subsidize activities that would have taken place also absent the incentives.
Finally, the extent to which such an extension is desirable depends on the type of asset. With respect to
intangible assets which do not display large positive externalities (e.g. marketing and advertising), and
which might even be engaged by the firm in order to create barriers to entry, ensuring the conditions for
financing by the financial markets seems a better option than subsidizing those expenditures. In contrast,
investment in the economic competencies of workers (in particular lifelong training, apprenticeships and
managerial skills), which display high social returns, could theoretically be considered as relevant.11
Government direct support to intangible investment
Direct government support for innovation can play an important role, often complementary to tax
incentives, in reducing the financing gap in intangibles, and especially so with respect to young firms
10 Yet, while carry-forward options are frequently available, it is less the case of refundable options. For instance, only
14 out of the 30 OECD countries that provided tax support for R&D in 2017 offered refundable tax credits or equivalent
incentives. See OECD, 2020h for details.
11 The range of public policies aimed at strengthening skills training is large and goes beyond the scope of this paper.
A detailed discussion of these policies is available, for instance, in Bassanini et al. (2007) and McCall et al. (2016).

15
lacking alternative financing sources (Hottenrott and Lopes-Bento, 2014; Mateut, 2018). Direct funding for
R&D can come in several forms: grants directly to the company, loans from a government agency (often
with conditions as to when they must be repaid and/or forgiven), government loan guarantees (see below
the section on banking), and government support to start-up firms (OECD, 2019b, OECD, 2021a). In
addition to providing funds, government support entails a positive certification effect. To be selected, firms
go through an official evaluation, which involves information disclosure reducing the information
asymmetries faced by traditional financial intermediaries.12 The design of the support is again key to ensure
its effectiveness. In particular, beneficiary firms should be targeted on the basis of their age and growth
potential, reducing the risk of simply picking winners which would have been successful even without the
support (Berlingieri et al., 2020).
An important advantage of direct government funding is the possibility to widen the range of intangibles
investments that are supported, a feature which is notably relevant in light of the complementarity among
the various types of intangibles. Beyond financing R&D, governments may provide direct fund to support
young firms with respect to the assessment of the technical feasibility of their innovative projects, to ensure
the conditions for commercialisation and access to consulting services, as well as to train entrepreneurs
who may lack market and commercial expertise. Finally, fostering collaboration across firms is another
way to ease SMEs financing constraints. In fact, given the complementarity among the various types of
intangible assets, the development of partnership agreements allows to mutualise the high initial fixed
costs and to benefit from knowledge spillovers. Clusters and business incubators help to create further
opportunities for such partnership and collaborative research between intangible-intensive firms (OECD,
2019c).
Government support to skills formation
The increasingly knowledge-based nature of the economy implies substantial changes in firms’
organisational structures and thus in the skills workers are required to have, making support to investments
in job training even more appealing. Indeed, about half of the EU Member States have already established
tax incentives in the corporate income tax for education and training.13 Among several potential schemes,
the most common are a tax allowance for education or training expenditures, a tax credit against relevant
spending or a tax exemption for income accrued by specific groups such as apprentices (CEDEFOP, 2009;
Torres, 2012; OECD, 2017a). An alternative option consists in favouring the establishment of Employment
Funds. In this setting, firms pay mandatory fees to the fund, which creates rights to finance employee
training, creating incentives to involve their workers in training to recoup their investment. Contributions to
the fund are settled according to firms’ characteristics (e.g. size), so that a kind of mutualisation mechanism
helps SMEs to upgrade their worker skills, with potentially broader positive consequences. Box 2 provides
a more detailed overview of the instruments governments could use to ease barriers to firms investment
in training.14
Targeted programs to advance management and leadership skills are also critical to guide SMEs through
the transition to an intangible, digitalised economy and the subsequent changes in businesses processes.
12 Supporting this narrative, based on an analysis of approved and denied subsidy requests from a sample of Belgian
SMEs, Meuleman and De Maeseneire (2012) show that obtaining support for R&D investment results in better access
to long-term debt and more equity financing.
13 Noteworthy, even in the absence of tax allowances or tax credits, education and training expenditures are treated
as an expense from an accounting point of view and thus are typically deducted immediately, which would constitute
already a more generous tax treatment compared to other capital investments.
14 Though beyond the scope of this paper, it is worth mentioning that an adequate supply and quality of training
programmes is key to ensure their effectiveness; for instance, tripartite commissions (workers, employers,
governments) could help to develop relevant training courses and guarantee minimum quality standards.

16
Sound managerial practices are associated with a more efficient diffusion of digital technologies (Andrews
et al., 2018) and higher productivity (Bloom et al., 2017). While governments cannot directly affect firms’
managerial performance, they can act as a catalyst by investing in networks to enable small businesses
to learn from each other and from world-leading firms. For instance, the United Kingdom is providing funds
to incentivise exchanges between mentors from frontier companies and SMEs, and launched a “Small
Business Leadership Programme” to grant small business leaders access to leadership training, building
on existing world class training programmes (UK Government, 2019). Moreover, governments could
encourage the adoption of good managerial practices in public administrations and government-owned
enterprises, with potential spillovers reaching the private sectors, and ensure product markets remain
competitive, hence providing firms with the right incentives to improve managerial performances.
An increasing demand for innovation would also require a steady increase in human capital supply, going
beyond on-the-job training and the upskilling of the current workforce. Governments’ action could be
organised along three main areas. First, policy makers should aim at reducing barriers impeding talented
but disadvantaged individuals to become innovators. As a matter of fact, there is large evidence that
students from disadvantaged backgrounds tend to underperform their peers with more favourable socio-
economic conditions, irrespective of innate abilities, and that disadvantaged schools have fewer resources
both in terms of educational staff and material; increased school quality and closing regional divides could
hence provide large benefits, and especially so in the aftermath of an asymmetric shock such as the
COVID-19 outbreak. Second, fostering the expansion university programs to increase training in science,
technology, engineering and mathematics (STEM) could increase both the quantity and quality of inventors
as well as the diffusion of an effective use of digital technologies (Bloom et al., 2019). Third, striving for a
better labour market inclusion of women and migrants could also turn out to be an effective innovation
policy by potentially increasing the pool of skilled workers and, as a result, also decreasing innovation
costs due to lower equilibrium wages.
Box 2. Easing barriers to firms investment in job training
Human capital accumulation goes beyond education and investment in lifelong training and managerial
skills is increasingly important to adapt workers skills to technological change. However, it is often not
easy to finance, and adults learning and training programs receive much less funding then other
education areas; for instance, in OECD countries, governments contribute for less than one fourth to
adult learning expenditures and employers bear almost half of the cost (OECD, 2019d). Governments
could use a wide range of instruments to reduce financial barriers and overcome market failures
generating an inefficient under-provision of on-the-job training, incentivising firms to upgrade their
workforce skills.
The most commonly used tools are subsidies and tax incentives, which could help reducing the direct
costs of training. They could take various forms. For instance, firms offering training to their workers will
have lower social contributions to be paid in Spain, while they could obtain tax credit rights in Argentina
or a compensation between 50% and 100% of training costs in Estonia (with a maximum cap and also
depending on worker characteristics). Subsidies and tax incentives could also decrease the indirect
costs of training for firms, and in particular wage payments during training periods. For instance, the
Credito di Imposta Formazione 4.0 program in Italy is based on a tax incentive that covers 40% of wage
payments (with a maximum cap) for the whole duration of specific types of training; similarly, the Jinzai
Kaihatsu Shien Joseikin in Japan is an example of a subsidy to reimburse wage expenses during
training, and its size varies depending on firms’ size and the type of training.
A set of complementary policies could reduce the opportunity costs related to training as well as
potential liquidity constraints. While not widely used, job rotation schemes, which help finding a
replacement worker for the duration of the training, could be particularly useful to support SMEs in

17
reducing the damages from foregone production. Similarly, firms may not be willing to train workers if
unsure to gather the benefits of training and the inclusion of payback clauses in training arrangements
(e.g. firms can recover part of the investment if a worker leaves soon after training) could mitigate these
concerns. Moreover, due to limited access to external financing, SMEs may face tight financing
constraints pushing for a delay or omission of workers training, and targeted government loans could
provide the necessary bridge financing. For instance, in Korea, firms could obtain a loan covering 90%
of the expenses related to training facilities.
Further, governments could incentivise firms to set resources aside for future training by contributing to
pooled training levies or funds. Such incentives could involve levy-grant schemes, in which firms
contributing to the funds are incentivised to undertake the training themselves through grants larger
than initial contributions (e.g. France, Italy, Korea), or levy-exemption schemes, in which the cost of
training is deducted from tax payments (e.g. Australia, Canada and the United Kingdom). Alternatively,
the fund could be structured as a simpler revenues generating scheme and governments use the funds
to provide general training to employees (e.g. SENAI scheme in Brazil). In this occurrence, training
rights may also be fully attached to the worker and disembodied from the firm. For instance, in France
the personal training account scheme (CPF, Compte personnel de formation) allows workers to carry
those rights to another firm when they change jobs. Against the threat of labour poaching, such a
provision might be more favourable to job mobility and the efficiency of labour allocation compared to
the use of contractual arrangements that prevent workers from moving to a competitor or to a framework
in which training rights are limited to the current employment position (OECD, 2019a).
Source: OECD (2019d), “Getting Skills Right: Future-Ready Adult Learning Systems”, Getting Skills Right, OECD Publishing, Paris.
3.1.2. Government support in COVID-19 time
Governments’ swift reaction has been decisive to help firms dealing with the disruptions associated with
the COVID-19 outbreak (OECD, 2020b; OECD, 2020d). Policies that help to preserve continuity of firms’
operations, such as the widespread and temporary support measures implemented by governments in the
form of wage subsidies, loans, grants and debt and tax deferrals, have been critical to address the
immediate liquidity needs and avoid the destruction of productive capital that would follow the liquidation
of otherwise viable businesses. The prospect of the availability of a vaccine in 2021 has contributed to
progressively shift policy makers’ focus from the emergency to the recovery. The large fiscal needs call for
cost-effective spending and an evolution towards more targeted support once the outlook improves. If well
directed, current COVID-19 related government support, which facilitates financing through a variety of
sources (e.g., loan guarantees, equity-type instruments), could contribute to ease these frictions and
become an opportunity to accelerate the shift towards a knowledge-based economy.
Government loan, grant and loan guarantee programmes play a key role in addressing liquidity shortages,
but it is unclear whether they have the potential to support investment in intangibles, in particular by
dampening “the tyranny of collateral”. On the one side, many lending programmes – particularly those
directed towards SMEs – rely on banks to allocate funds and require them to take on additional credit risk
(OECD, 2020b; OECD, 2020e). This might be particularly damaging for intangible-intensive firms, which
tend to rely on unsecured loans associated with higher risk for banks. On the other side, several
programmes permit banks to retain only a small portion of credit risk exposure through loan government-
backed guarantees. Such guarantees could (at least partially) substitute for collateral availability and help
to reduce the gap existing between loans secured by tangible assets and unsecured loans. For instance,
under the new ECB’s collateral easing measures framework, national Central Banks can accept as

18
collateral loans distributed to small and medium-sized enterprises (SMEs) that benefit from government
guarantee schemes (De Guindos and Schnabel, 2020).15
Several countries have also developed support schemes featuring equity-type capital injections, which
could be particularly beneficial in supporting the activity of intangible-intensive firms facing credit
constraints, given the inherent advantage of equity financing for innovation. To limit governance issues,
such support could take the form of preferred stocks that provide higher priority when it comes to dividends,
but limited rights in terms of voting, mitigating the resistance of shareholders that do not wish to dilute their
ownership. Moreover, given the difficulties for the government to manage a large number of small equity
claims, quasi-equity type of financing that do not require a close monitoring of supported companies might
be better suited for SMEs (Blanchard et al., 2020). Also, it is important to ensure that these measures are
state-contingent and include mechanisms to incentivise all parties to wind down support when economic
conditions improve (OECD, 2020f; OECD, 2020g).16
Some countries have already taken actions to countervail the observed decline in angel investors and
venture capital activity, which could further impair SMEs innovative potential (Paunov and Planes-Satorra,
2020; OECD, 2021a).17 For example, France set-up a EUR 4 billion fund to support start-up liquidity,
Germany has announced a tailored start-up aid programme, expanding and facilitating venture capital
financing, and the United Kingdom has announced a co-financing fund for innovative companies facing
financial difficulties (Calvino et al., 2020). Another potential policy option consists in increasing tax
deductions for individuals investing in start-ups (Formai et al., 2020).
To avoid a scale down in innovative activities during the pandemic, direct public support to business
investment warrants to be preserved. Indeed, there is evidence that these support schemes are more
effective when they are stable over time, as firms tend to hesitate to invest in additional R&D if they are
uncertain of the durability of government support (UNCTAD, 2020). In the short-term, digital adoption by
SMEs may require a specific attention. While digitalisation could favour the efficient implementation of
remote work policies and speed up the recovery, financing constraints plaguing small and young firms
reduce their ability to weather the crisis and undertake such investments. To mitigate those barriers to
invest in digital technologies, several countries have established support to ease the adoption of new
processes (e.g. use of selling tools, digital communications, adjusting production facilities to respond to
current market shortages) (Paunov and Planes-Satorra, 2020).18 Along similar lines, offering financing
facilities for SMEs and start-ups to engage in investment in skills, e.g. through online training, becomes an
even more relevant policy priority to prevent skills depreciation and reduce the scarring effects of the crisis.
Overall, government support plays a pivotal role in addressing the market failures related to intangibles
financing and thus contributes to foster an intangible-oriented, fast and sustainable recovery from the
COVID-19 outbreak while building resilience with respect to new shocks. However, private financing
remains the best option for assets which do not display positive externalities and governments can act
15 However, one drawback of loan guarantees schemes is that it contributes to increase firms leverage which could
lead some of them in a situation of debt overhang (Demmou et al., 2021). This risk may remain lower for intangible-
intensive firms given their lower leverage ratios.
16 For a detailed discussion on advantages and disadvantages of government equity injections during the COVID-19
see OECD (2020f).
17 For instance, venture capital (VC) investments in new companies declined by 60% in China and 5644% in Ireland
in the first quarter of 2020 compared to the first quarter of 2019. Early-stage seed investments fell over the same
period by 86% in China and 38% in the United States in March and April 2020 (Paunov and Planes-Satorra, 2020).
18 For instance, Enterprise Ireland provides vouchers and grants for companies to acquire training or advisory services
related to the continued operation of their businesses during the current pandemic and to strengthen businesses’ use
of the internet as an effective channel for business development.

19
indirectly by establishing the conditions to ease the financing of intangible assets by equity investors and
banks.
3.2. Financial markets for a knowledge-based economy
Equity investors, who take a broader view on companies’ growth opportunities and are relatively more
willing to take risks, are the main suitable source of financing for intangibles (Brown et al., 2012; Hsu et
al., 2014; Acharya and Xu, 2017). Several policy actions could contribute to better align financial markets
with the needs of the knowledge economy. First, it is critical to establish the appropriate set of framework
conditions allowing the deepening of equity markets where they are still underdeveloped and ensuring that
the structure of equity markets is supportive of the provision of patient and engaged capital. Second, the
development of venture capital markets, which are the most natural source of finance for start-ups and
intangible-intensive firms at early stages of their life-cycle.
3.2.1. Framework policies to develop equity markets
Increasing the size of equity markets
Equity market is still underdeveloped in several G20 countries, with potential negative consequences for
intangible investment and productivity. Overall, simulations based on OECD empirical analysis confirm
that the size of the equity market matters for productivity dynamics, especially in intangible-intensive
sectors. More specifically, a one standard deviation increase in the market capitalisation to GDP ratio (or
in the stock value traded over GDP ratio) – approximately equivalent to moving from Portuguese to
Australian equity market characteristics – implies an increase in productivity that is 2.5% (2.2%) higher in
intangible-intensive sectors than in traditional ones (Figure 7).
Figure 7. Deep equity markets benefit especially intangible-intensive sectors
Productivity gains (in high relative to low intangible-intensive sectors) from improving the size of equity markets
Note: Based on OECD regression analysis (Demmou et al., 2019; Demmou and Franco, 2021), the figure shows the differential productivity
increase in intangible-intensive sectors compared to traditional sectors following a one standard deviation increase in either market capitalisation
to GDP or stock market traded value to GDP ratios (World Bank). The estimation is carried over the 1990-2015 period.
Source: OECD calculations based on STAN, Compustat and World Bank data.
A potential barrier to the development of equity markets arises from the fact that several countries have
established tax systems which favour debt financing over equity financing by allowing interest payment
deductibility. This tax bias in favour of debt creates distortions in companies’ financing choices, leading to
a relatively lower demand for equity finance and to a potential misallocation of resources. Currently, given

20
the low interest rates, the value of interest rate deductions is low, reducing the tax bias towards debt.
However, the tax bias would rise with higher interest rates, and addressing it could spur the development
of equity markets, increasing their size, and reducing financing constraints on intangibles investment
(Nassr and Wehinger, 2016).19 Several G20 and OECD countries are tackling the issue, and three main
options have been implemented or are under discussion: the complete removal of interest payment
deductibility by developing a comprehensive business income tax; the introduction of a limit on the amount
of debt eligible for tax deductions (e.g., Germany and Italy); and the allowance of a deduction on returns
on equity (e.g. Belgium, Italy, Latvia and Portugal) reducing the tax wedge between the two sources of
financing. Importantly, these types of tax reforms require strong international coordination, in light of tax
planning arrangements used by multinationals (especially intangible-intensive ones). Past and upcoming
work by the OECD on Base Erosion and Profit Shifting is already providing directions for action in this area
(OECD, 2015b).
The low levels of stock market turnover and the relatively low level of financial literacy in certain countries
could be other complementary explanations for their under-sized equity markets (Dlugosch et al., 2020).
Low stock market liquidity makes it difficult for both domestic and foreign investors to participate in equity
markets, limiting the supply of equity funds. Similarly, higher financial literacy may also affect the demand
of equity capital (Van Rooij et al., 2011; Boschmans and Pissareva, 2017). For instance, an increased
awareness of the various equity instruments, such as the issuance of preferred shares, would allow
entrepreneurs to obtain the additional financing they need without fearing to lose control of the company.
Besides the small size and liquidity of most of their capital markets, European countries also face specific
challenges with respect to the strong segmentation along national boundaries. Progress on the Capital
Market Union (CMU) agenda would deepen financial integration and ease access to equity financing.
Equity investors’ home bias would be reduced (Darvas and Schoenmaker, 2017) and companies located
in countries where equity markets are less developed (e.g. South and Eastern Europe) would have higher
financing opportunities. Furthermore, a unified capital market would improve the transparency,
comparability, and reliability of the information provided by firms to financial bodies, increasing external
investors’ confidence (Verón and Wolff, 2016), thereby attracting a wider range of investors and increasing
the resources available to European innovative firms.20
Harnessing the potential of long-term equity investors
There is a large heterogeneity across different types of equity holders, and their ability to support
investment in intangibles may vary with their characteristics. The nature of intangible assets requires
investors who can devote the resources necessary to collect detailed information on firms, spread risk over
a diversified portfolio, and patiently invest in the most promising ones. These features are broadly
associated with the business model of institutional investors, hinting that their increasing ownership shares
in the last decades may have made the financial market more suited to support an intangible-based
economy.21 However, institutional investors are heterogeneous: pension plans and banks are typically
long-term oriented while the opposite holds for mutual funds or hedge-funds, whose short term horizon
may pressure managers to focus on immediate returns, reducing innovation investments (Lee, 2005,
19 In fact, as debt financing tends not to be well suited for intangible investment, firms strongly relying on intangibles
would be relatively disadvantaged in obtaining funds for their innovative projects, while sizeable resources are diverted
towards non-profitable investments that become possible thanks to the implicit subsidy (Fatica et al., 2013).
20 The varying nature of insolvency regulation could also act as a barrier towards the objective of a unified capital
market (Bhatia et al., 2019). A first step to converge towards a minimum EU standard has been taken with the Directive
on Restructuring and Insolvency.
21 For instance, Aghion et al. (2013) and Brossard et al. (2013) provide causal evidence that ownership by institutional
investors tends to increase both the amount and the productivity of R&D expenditure.
21
Davies et al., 2014). Furthermore, the concomitant expansion of passive (e.g. index-linked) investment
strategies may lead to an increase in equity holders’ time horizon and risk diversification, but at the cost of
reducing monitoring and information-enhancing research, with uncertain effects on innovation. Finally, the
rise of common ownership by institutional owners across competing companies within industries may entail
positive effects with respect to the market failures related to intangibles non-rival nature and hence spur
intangible investment: even if spillovers to competitors are predicted to be high, these investors would also
benefit from the advantages obtained by competitor firms in light of their cross-holdings (Haskel and
Westlake, 2018).22
Policy makers could increase the availability of patient, engaged and productive capital either by favouring
the relative expansion of specific innovation-friendly investors or by altering equity holders’ incentives. The
reduction of specific regulations limiting pension and insurance funds’ ability to invest in equity (while
establishing an efficient risk monitoring system) could contribute to rebalancing capital supply towards
long-term investments. Similarly, a revision of accounting and disclosure rules with respect to the reporting
of intangible investment on the balance sheet would allow investors taking more informed decisions; for
instance, the capitalisation of intangible expenses could contribute to reduce the impact of short-termism
on the financing of intangibles, as managers would not be tempted to cut intangible costs to meet market
expectations with respect to profit objectives.23 Additional possible policy levers are a preferential tax
treatment for capital gains arising from long term investment, which has already been established in some
G20 countries, and the granting of more voting rights to owners holding shares for a relatively longer period
or actively engaged in companies’ governance.24
Reviving initial public offerings (IPOs) for SMEs
Recent trends in capital markets worldwide suggest that equity markets are providing decreasing
resources to SMEs: while the overall capitalisation of equity markets has been rising, the number of IPOs
and the number of listed companies have declined in several countries (Figure 8). Capitalisation is
becoming increasingly concentrated in large firms and the majority of businesses do not raise equity at all.
Given the high costs to be incurred in order to go public, high-growth and innovative small firms often have
little or no access to equity markets, precluding them from accessing an important source of external
financing.
22 However, potential anti-competitive outcomes could offset these benefits (Azar et al., 2018) and need to be closely
monitored by Competition Agencies.
23 The revision of accounting and disclosure rules is more extensively discussed in section 3.3.2.
24 Receipt of such grants or the extent of the preferential tax treatment may be also conditioned on other characteristics,
such as holdings’ size, in order to incentivize engagement in the governance of the firm.

22
Figure 8. The number of listing decreases while market capitalisation rises
Note: The left y-axis shows the overall market capitalisation of OECD countries listed domestic companies, in current USD. The right y-axis
shows the number of listed companies in OECD countries. Both values are taken at the end of the reference year.
Source: OECD calculations based on World Bank data.
The shift towards a knowledge economy may have further impaired the attractiveness of traditional public
equity for intangible-intensive companies. Private equity is increasingly perceived as an efficient tool to
foster innovation (Cecchetti and Schoenholtz, 2017) and takeovers are soaring (Bajgar et al., 2018). SMEs
and innovative entrants, not having the resources and size to take advantage of intangibles
complementarities, lack the strength to compete in an economy dominated by relatively few giant firms
and more often consider being acquired as an optimal solution, also reinforcing the potential “winner-takes-
all” dynamics connected to intangible capital and thus creating new challenges for Competition Agencies.25
Easing access to IPOs by reducing administrative burdens and costs can partially offset the size bias
affecting equity markets and provide intangible-intensive SMEs a viable alternative to buyout; moreover, it
would also foster early-stage financing by widening the range of exit options for venture capital investors.
For instance, the Prospectus Regulation adopted in the European Union, which streamlines listing
requirements for small enterprises (EPRS, 2019), is a first step in this direction. Furthermore, an
improvement in the reporting of intangible assets could play a relevant role in reducing the information
asymmetries that induce capital providers to focus on blue chips.
3.2.2. Venture capital: the best-suited source of financing for innovation, but not a
panacea
Venture capitalists play a key role in bridging the financing gap of young innovative firms, and the global
shift towards an intangible-based economy further increases their relevance. In line with this, Figure 9
provides evidence of a positive correlation between either venture capital supply or overall venture capital
attractiveness and intangible investment.
25 For instance, Galston and Hendrikson (2018) argue that antitrust enforcers should not only take into account
acquisition of targets which have high revenues or employment, but also of relatively smaller firms that are potentially
important for competition from a dynamic perspective, because of the data they own or their growth potential.

23
Figure 9. Venture capital markets and countries’ intangible investment
Note: The figure shows the correlation between intangible assets gross fixed capital formation and venture capital development. Intangible
assets’ gross fixed capital formation is computed using a combination of data sources and a novel methodology described in Annex A; due to
data availability, the training component of intangible investment is excluded. Venture capital development is proxied by venture capital
investment as a share of GDP (OECD) in the right panel and by a broader measure of venture capital attractiveness (IESE Business School
and EMLYON Business School) in the left panel. Due to data availability, variables in the right (left) panel are averaged over the 2011-2015
(2014-2015) period. The USA are excluded from the right panel for readability, as their extremely high VC to GDP ratio would impede a clear
visualisation of graph; their inclusion, however, would further strengthen the correlation.
Source: OECD calculations on OECD, National Use Tables, World Bank, PWT, ILO, IESE Business School and EMLYON Business School
data.
The positive impact of venture capital (VC) on the financing of intangible investment and productivity is
expected to work through several channels. First, a deep VC market internalizes start-ups’ highly risky
profile and lack of track records; in fact, the provision of funds by stage is particularly suited for start-up
firms strongly relying on intangibles, as it allows investors to closely follow and update their knowledge on
the potential of the project, delaying follow-on investment until information is revealed, and thus reducing
uncertainty (Haskel and Westlake, 2018). Second, the intense scrutiny performed by venture capitalists
allows them to select the firms with the highest growth potential and entails positive consequences from
an allocative efficiency perspective, as they offer opportunities for the implementation of new ideas and
radical innovations which would not be otherwise funded. Furthermore, VC acts as a signal that allows
other financial intermediaries to invest; the certification effect of being backed by VC attenuates asymmetry
of information and increases the probability that institutional equity holders invest in the company
(Jeppsson, 2018). Most advanced economies have implemented multi-pronged policies to nurture their
VC ecosystems. However, despite progress, achievements have often fallen short of objectives, as
highlighted by the relatively small number of successful programs (Annex C).
While venture capital markets grow under specific conditions which are often difficult to reproduce, there
is still a set of policy levers that authorities could use to foster their development and exploit their potential.
Direct government intervention in the VC market has been found to be beneficial, especially when the
industry is at its infant stage (Lerner, 2010). Currently, most advanced economies have progressively
shifted towards a model based on co-investment funds and funds-of-funds that seek to leverage private
investment, as government funding is most effective when disciplined by private VC management, given
that it strengthens commercial objectives and knowledge of the sector (Wilson, 2015). Indeed, successful
venture capital companies are generally highly specialized in specific sectors, reinforcing the idea that a
deep knowledge of the market is critical to invest optimally and guide start-ups in their early stages. Several
G20 countries are also using tax incentives to promote venture capital markets and business angel lending
(OECD, 2016). Tax relief on capital gains, special provisions concerning the roll over or carry forward of
capital gains and losses, as well as a preferential tax treatment (e.g., tax deductions) for seed financing,
appear valuable options, though the efficacy of these tax supports for venture capital is mixed, as they
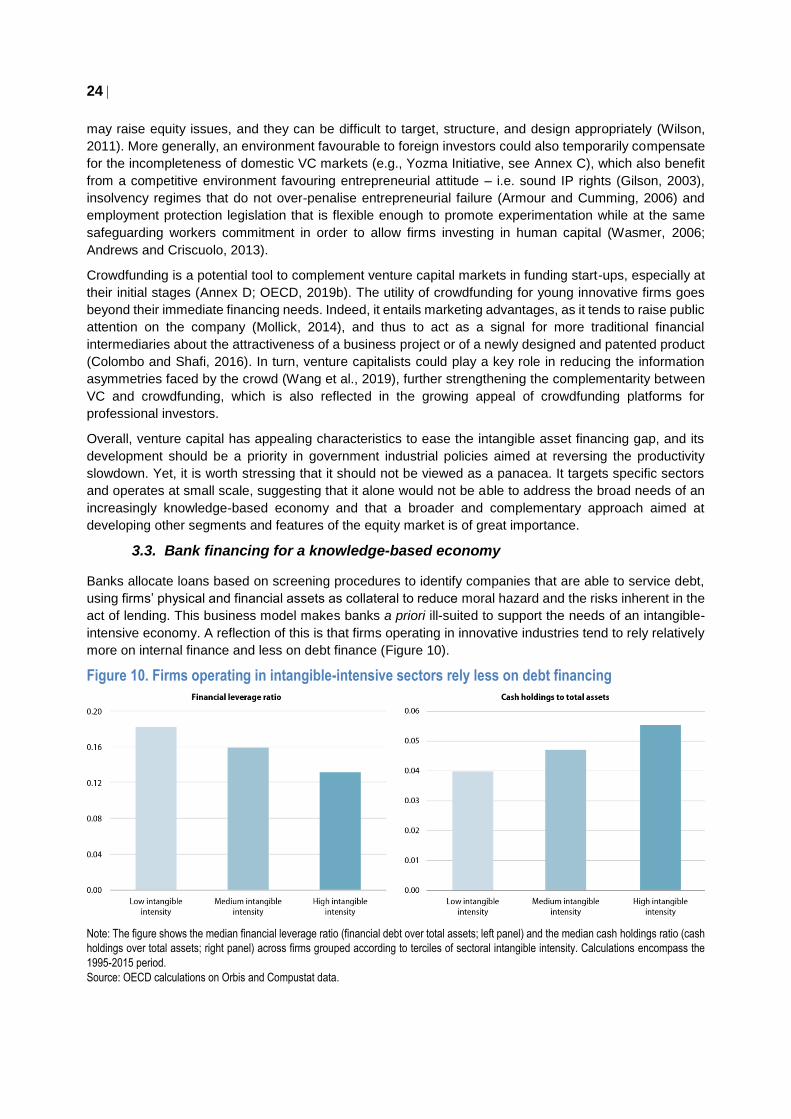
24
may raise equity issues, and they can be difficult to target, structure, and design appropriately (Wilson,
2011). More generally, an environment favourable to foreign investors could also temporarily compensate
for the incompleteness of domestic VC markets (e.g., Yozma Initiative, see Annex C), which also benefit
from a competitive environment favouring entrepreneurial attitude – i.e. sound IP rights (Gilson, 2003),
insolvency regimes that do not over-penalise entrepreneurial failure (Armour and Cumming, 2006) and
employment protection legislation that is flexible enough to promote experimentation while at the same
safeguarding workers commitment in order to allow firms investing in human capital (Wasmer, 2006;
Andrews and Criscuolo, 2013).
Crowdfunding is a potential tool to complement venture capital markets in funding start-ups, especially at
their initial stages (Annex D; OECD, 2019b). The utility of crowdfunding for young innovative firms goes
beyond their immediate financing needs. Indeed, it entails marketing advantages, as it tends to raise public
attention on the company (Mollick, 2014), and thus to act as a signal for more traditional financial
intermediaries about the attractiveness of a business project or of a newly designed and patented product
(Colombo and Shafi, 2016). In turn, venture capitalists could play a key role in reducing the information
asymmetries faced by the crowd (Wang et al., 2019), further strengthening the complementarity between
VC and crowdfunding, which is also reflected in the growing appeal of crowdfunding platforms for
professional investors.
Overall, venture capital has appealing characteristics to ease the intangible asset financing gap, and its
development should be a priority in government industrial policies aimed at reversing the productivity
slowdown. Yet, it is worth stressing that it should not be viewed as a panacea. It targets specific sectors
and operates at small scale, suggesting that it alone would not be able to address the broad needs of an
increasingly knowledge-based economy and that a broader and complementary approach aimed at
developing other segments and features of the equity market is of great importance.
3.3. Bank financing for a knowledge-based economy
Banks allocate loans based on screening procedures to identify companies that are able to service debt,
using firms’ physical and financial assets as collateral to reduce moral hazard and the risks inherent in the
act of lending. This business model makes banks a priori ill-suited to support the needs of an intangible-
intensive economy. A reflection of this is that firms operating in innovative industries tend to rely relatively
more on internal finance and less on debt finance (Figure 10).
Figure 10. Firms operating in intangible-intensive sectors rely less on debt financing
Note: The figure shows the median financial leverage ratio (financial debt over total assets; left panel) and the median cash holdings ratio (cash
holdings over total assets; right panel) across firms grouped according to terciles of sectoral intangible intensity. Calculations encompass the
1995-2015 period.
Source: OECD calculations on Orbis and Compustat data.

25
Still, the potential for banks to finance intangible investments could be raised by considering a range of
policy actions. Specifically, measures to increase the pledgeability of intangible assets as collateral and
reduce information asymmetries between banks and intangible-intensive firms could help reduce the gap
between internal and external financing that plagues investment decisions of innovative firms, with
potential benefits for productivity.
3.3.1. Encouraging the redeployability of intangible assets
Use of intellectual property rights and IP-backed loans
Firms in intangible-intensive sectors have fewer tangible assets to be used as collateral (Figure 11, left
panel), and increasing collateral availability could benefit productivity by enabling innovative firms to
access bank finance. Indeed, when the productivity effect of financing frictions is conditioned on the
availability of collateral, the differential between high and low intangible-intensive sectors tends to vanish
for highly collateralized firms (Figure 11, right panel).
Figure 11. Collateral availability along the intangible intensity dimension and its impact on the finance-productivity nexus
Note: The left panel shows the median tangible assets over total assets ratio across firms grouped according to terciles of sectoral intangible intensity.
Based on OECD regression analysis (Demmou et al., 2020; Demmou and Franco, 2021), the right panel presents the productivity effect of relaxing
financing constraints for firms with different availability of collateral, distinguishing between high and low intangible-intensive sectors. Collateral availability
at the firm level is proxied by the ratio of tangible fixed assets to total assets. Calculations encompass the 1995-2015 period.
Source: OECD calculations on Orbis and Compustat data.
The pledgeability of intellectual property rights (IPR) has already opened new funding channels for
intangible-intensive firms.26 First, assets protected by IPR -- such as patents, trademarks, copyrights and
design rights – can serve as collateral when searching for bank financing (Amable et al., 2010). Second,
innovative firms can use the cash flow streams deriving from licensing or royalties to secure loans (Brassell
and King, 2013). Moreover, IPR may also serve as a signalling mechanism for small and young companies
to reveal the quality of the firm’s management, and its technological capabilities, easing the access to
various alternative sources of finance (Francis et al., 2012; Robb and Robinson, 2014).27
26 As indirectly reflected by the positive correlation between sound IPR and intangible investment (Figure B.2).
27 For instance, start-ups with IP-backed loans tend to raise more equity capital than those without (Hochberg et al.,
2018). Along similar lines, recent causal evidence suggests that start-ups “winning the patent lottery” by drawing more
lenient examiners have better access to bank and VC finance (Farre-Mensa et al., 2020).

26
While the pledgeability of IPR is increasing in G20 countries, small and medium-sized enterprises do not
face the same opportunities as large firms in exploiting IP-backed loans, despite greater financing needs.
SMEs find it harder to protect their intellectual property via patenting, as they often face relevant capacity
constraints: for instance, applying for patents requires the payment of specific fees and regular
communication with patent officers enforcing deadlines, which are generally better handled by expensive
patent consultants (OECD, 2011; Johnson et al., 2018). Furthermore, evidence from the U.S. suggests
that IP-backed loans primarily benefit well-established companies with a great deal of reputational capital,
even though banks tend to impose higher loan spreads and apply stricter credit standards when granting
such loans (Loumioti, 2012).
Policy interventions aimed at increasing the use of IP-backed loans should take these patterns into account
and provide specific support to SMEs (OECD, 2011, OECD 2015a). For example, public authorities may
establish programmes such as state guarantees linked to either the enterprise or the asset, subsidies
granted through development banks, and a combination of the two, aimed at strengthening private sector
engagement (Box 3). These programs contribute to expanding the availability of IP-backed lending for
financially-constrained firms by reducing bank-firm information asymmetries and substituting for the lack
of tangible collateral characterizing the initial stage of the firms’ life-cycle. Further, they also provide
temporary support to banks, allowing them to eventually write down losses generated during the learning
period necessary to build knowledge on the use of IP-backed loans (Brassell and Boshmans, 2019).28
However, to enhance their effectiveness, policy makers need to ensure that resources are allocated only
to high-potential SMEs and to take into account potential moral hazard issues arising from state guarantees
(Ono et al., 2013; D’Ignazio and Menon, 2013).29 A portion of the risk should remain allocated to banks
and the temporary nature of the support should be clearly codified.30
Prudential regulation might create an additional barrier to the development of loans secured against
intangibles. IP-backed loans are perceived as riskier and do not contribute to the calculation of banks’
regulatory capital. As a consequence, banks have lower incentives to issue such loans and the cost of
capital for intangible-intensive firms increases, leading to a reallocation of banks’ portfolios from
commercial loans to real estate lending (Dell’Ariccia et al., 2017). Revising Basel III regulation to account
for the new financing needs of corporations, while ensuring financial stability, is likely to be a long and
complex process, also requiring international cooperation. Meanwhile, an alternative could be to allow
banks to transfer part of the risk from their balance sheets to those of insurance companies, which can
take a broader economic view on risks under Solvency II regulation. This requires establishing a legal
framework allowing banks and insurance companies to collaborate in backing IP-backed loans, a direction
currently investigated, for instance, by the British Business Bank (British Business Bank, 2018).
28 Supporting this narrative, recent research suggests that state guarantees and co-funding programmes can be
effective at increasing SMEs access to finance, reducing the cost of funding (OECD, 2017b), and in some case
improving long-run productivity (Bertoni et al., 2018).
29 For instance, there is evidence that firms participating in state guarantees programs have a higher probability of
default in subsequent years compared to their peers (D’Ignazio and Menon, 2013).
30 A recent UK reform of guarantee schemes in this direction has proven to be successful (Allinson et al., 2013).

27
Box 3. IP backed loans: country-specific experiences
In the U.S. the rise of IP backed loans has been largely underpinned by unregulated lenders in
the private sector – i.e. investment banks – that did not face the same regulatory constraints as
commercial banks for valuing KBC as collateral (OECD, 2015a). The share of secured
syndicated loans collateralised by intangibles in total secured loans has risen from 11% to 24%
in the 1997-2005 period (Loumioti, 2012).
France – The French public investment bank Bpifrance provides uncollateralized loans and
bank loan guarantees to SMEs to support their digitalisation. Investment in intangibles is
supported, including intellectual property and software.
Germany - Germany has introduced specific debt-based instruments. The Bavaria Digital
initiative provides digital SMEs with loans on favourable terms for a total amount of up to EUR
1 million. In order to reach many SMEs, the application process was streamlined to reduce the
administrative burden, and parts of the application cost are covered by a non-refundable grant
from the State of Bavaria.
In China the active market for IP-backed financing relies on massive government support,
involving in particular the State Intellectual Property Office (SIPO) and the Ministry of Finance.
Chinese banks are encouraged to establish in-house evaluation methods and separate lines of
credit for intangible-backed loans. A number of funds based in areas with concentrations of
highly innovative SMEs have been established with the goal of favouring local IP-backed credit
(Brassell and Boshmans, 2019).
In South Korea, the Korea Development Bank (KDB) plays a pivotal role thanks to the “Techno
Banking” initiative which included: a) IP Purchase Loans that can be used by new ventures to
purchase Intellectual Property; b) IP Mortgage Loans; and c) Technology IP Commercialisation
finance. The KDB also offers a fund for distressed IPs to increase their recovery in case of loan
default. The Korean government also enacted a series of credit guarantee programs to support
intangible-backed financing, and an insurance scheme for SMEs (OECD, 2015).
In 2014, Singapore established a legal framework to authorize IP backed loans through the IP
Financing Scheme, (IPFS) relying on a panel of qualified valuers approved by the Intellectual
Property Office of Singapore (IPOS) to certify the value of the patent combined with a system
of sharing risk with the lending bank, the Government partially underwriting the loan (OECD,
2015; APEC, 2018).
Establishing the conditions for an efficient IP market
Strictly related to the use of IP as collateral, strengthening the liquidity of the IP market would improve the
chances of matching sellers and buyers as well as of establishing the right valuation in case of bankruptcy
(Roth, 2008; OECD, 2015b). This in turn could increase incentives for bank lending. Available evidence
suggests that firms’ borrowing tends to increase when the secondary market for patents becomes more
liquid, and the more so for start-ups owning relatively more re-deployable (less firm-specific) patents
(Hochberg et al., 2018; Serrano and Ziedonis, 2018).31
Despite the development of various IP market places and intermediaries, the IP market lacks transparency
and liquidity, and remains fragmented (Harhoff, 2009; Terroir, 2014). For instance, most IP deals are
31 However, the effect dissipates for highly firm specific patents. To get a glance of the magnitude of the effects, the
authors show that, at the mean “redeployability” value, a one percentage point increase in patent trading is associated
with an increase in the predicted debt rate of 1.10 percentage points, or 15 percent of the average annual debt rate in
the sample.

28
negotiated in a bilateral (licensing) or closed (auction) environment, making it difficult to assess the value
of a patent and to establish good matching between buyers and sellers (Andrews and De Serres, 2012).
The expansion of companies specializing in the assertion of patents, i.e. specializing in the collection of
patent license fees while not creating IP themselves (Non Practising Entities), can also be potentially
damaging for bank financing of innovation, as the systematic use of lawsuits to collect damages increases
the uncertainty around the value of the assets (Eisenberg and Ziedonis, 2010).32 Increasing the reliability
of IP markets by raising the quality of patents or disclosing knowledge information, promoting IP
infrastructure and creating sovereign patent funds are all relevant domestic policies to support the
development of IP markets and thus reduce the uncertainty for lenders on whether they would be able to
liquidate assets at the appropriate value in case of failure (OECD 2015b).
Differences in IPR legislation and enforcement across jurisdictions creates additional uncertainty for the
innovator and thereby the lender, undermining the reliability of using intangibles as collateral for banks,
and potentially affecting firms’ investments in intangibles. For instance, uneven levels of national patent
protection across EU members and the lack of a uniform enforcement system create a risk of parallel
litigation with possibly divergent outcomes (EPO, 2017).33 It follows that harmonisation of patent protection
enforcement across countries could contribute to better access to bank finance for intangible-intensive
firms and promote trade in high-IP industries in Europe and elsewhere.
Reviewing insolvency regimes
Well-designed insolvency frameworks may facilitate access to credit for high-productivity firms and the
orderly restructuring or exit of low productivity ones. The ability to scale operations down rapidly in case of
failure, releasing resources to other, more productive firms, contributes positively to aggregate productivity
performance via the reallocation channel (Adalet McGowan and Andrews, 2017). International
comparisons reveal large differences across countries in the design of insolvency regimes, with the
evolution of indicator’s values from 2010 to 2016 hinting that recent reforms enhanced policy design (Adalet
McGowan and Andrews, 2018).
These effects on productivity can be expected to be stronger in intangible-intensive industries, as the risk
of failure is greater there due to the prevalence of innovative projects. Indeed, empirical evidence based
on OECD analysis shows that productivity gains from moving to the regime with the lowest barriers to
efficient corporate restructuring increase with a sector’s intensity in intangible assets (Figure 12).
Therefore, improving insolvency regimes is a priority area in increasingly knowledge-based economies.
Moreover, the liquidation of intangible assets can be susceptible to a relatively quick and significant value
erosion, posing additional challenges for insolvency design.34 It follows that specific arrangements are
required to increase creditors’ chances of recovering the outstanding debt and improve the efficiency of
insolvency processes. First, given the complementarity between the various types of intangible assets
(Hotchkiss et al., 2008), liquidation should be carried out in bundles, so as to avoid the reduction in value
associated with the loss of synergies across the various assets. Second, the peculiarities of intangibles
require also retaining the associated skilled people to maximize the liquidation value. However, these
arrangements imply a close collaboration and trust between the failing firm and its creditors, which may
result in long proceedings, increasing uncertainty. In this context, SMEs may find it hard to bear the cost
32 However, they could also deepen the market for ideas by acting as patent brokers (Hagiu and Yoffie, 2011).
33 For example, computer software is relatively easy to patent in the United States, while in Europe there is a clear
distinction between programs that represent a technological innovation, which can be protected with a patent, and
those that are non- technological and thus non-patentable (Jarboe and Ellis, 2010).
34 The quick erosion of the intangibles’ value when Kodak filed for bankruptcy is illustrative of this issue: eleven months
before Kodak filed for bankruptcy, a portion of its patent portfolio was valued as high as $4.5 billion, but those assets
were eventually sold for only $94 million (Johnson et al, 2018).

29
of dispute resolution mechanisms related to intangibles due to their lower administrative capacity, and
targeted support might be needed -- for instance, informal out-of-court procedures, which typically avoid
the procedural complexities and timelines of court proceedings, are often associated with better outcomes
for SMEs (World Bank, 2018).
Figure 12. Intangible-intensive sectors benefit most from sound insolvency regimes
Productivity gains (in high relative to low intangible-intensive sectors) from moving to the regime best suited to
reduce barriers to corporate restructuring
Note: Based on OECD regression analysis (Demmou et al., 2019; Demmou and Franco, 2021), the figure shows the differential productivity
increase in intangible-intensive sectors compared to traditional sectors following an increase in insolvency regime soundness to the highest
level according to the World Bank index latest year (2019). The estimation is carried over the 2007-2015 period due to data availability.
Source: OECD calculations based on STAN, Compustat and World Bank data.
3.3.2. Policies to reduce firm-bank information asymmetries
A critical step to increase the confidence of banks and financial agents when investing in innovative
companies consists of reducing the information gap characterizing intangible assets. The availability of
historical credit information is one of the external elements used by banks to assess the probability that a
firm will repay debt. It allows a better screening of firms’ health, reducing moral hazard, and contributing to
a better allocation of resources. Evidence drawn from OECD empirical analysis confirms that the more
access banks have to in-depth information on firms’ credit history, the more financial constraints are
relaxed with a positive productivity effect, with the impact being larger in intangible-intensive sectors
relative to other sectors (Figure 13).

30
Figure 13. Intangible-intensive sectors benefit most from banks’ access to in-depth credit information
Productivity gains (in high relative to low intangible-intensive sectors) from moving to the highest level of credit
information depth
Note: Based on OECD regression analysis (Demmou et al., 2019; Demmou and Franco, 2021), the figure shows the differential productivity
increase in intangible-intensive sectors compared to traditional sectors following an increase in the depth of credit information to the highest
level according to the World Bank index latest year in the sample (2014). The estimation is carried over the 2007-2014 period due to data
availability.
Source: OECD calculations based on STAN, Compustat and World Bank data.
In the absence of credit records, past bank-firm links and IPRs signalling firms’ quality, banks often use
two other sources of information to assess the financial health of firms and decide whether to grant credit:
balance sheet information and financial reports. However, current accounting rules do not allow intangibles
created internally by the firm to be listed on the balance sheet, while disclosure rules on intangibles are
not yet well established and no consensus exists on the valuation method. As a result, financial and
accounting reports tend to become increasingly less relevant at providing accurate pictures of intangible-
intensive firms (Lev, 2018, OECD 2012).
Improving valuation standards for intangible assets
The increased relevance of intangibles has generated a wide debate on potential changes in accounting
rules. However, as of yet there is no consensus on the most efficient way to proceed and many types of
intangibles are still treated as simple expenses (Brassel and Boschmans, 2019). The full recognition of
intangibles on balance sheets is not a trivial exercise, in light of the inherent contradiction between certain
accounting principles and the properties of intangibles -- for instance the requirement that investment
should achieve commercial and precisely identifiable returns (Box 4).
The existence of several competing methods for valuing intangibles generates further uncertainty and
requires the setting of internationally homogeneous rules, while current valuations performed by consulting
firms and experts do not rely on standard definitions (Box 4; OECD, 2012). Several institutional initiatives
have been taken recently to reduce the opacity of intangible investment and these should be pursued,
such as the consultation launched by the UK financial reporting council (FRC, 2019). In 2019 the
International Valuation Standards Council (IVSC) published new global guidelines for valuing intangibles
in a comprehensive way.

31
Box 4. Accounting rules and evaluation methods for intangible investment
Accounting rules
The disclosure of information regarding intangible assets varies depending on accounting standards
firms use.
Under the General Accepted Accounting Principles (GAAP) rules, US-based firms cannot capitalize
intangibles development costs in light of uncertainty of their future income stream, their complex
measurement, and the difficulties in perfectly matching costs and revenues. Hence, limited information
about intangible investments is disclosed to the market.
On the contrary, firms required to draft their financial statements under the International Financial
Reporting Standards (IFRS), such as European listed companies, have to capitalize intangibles-related
investments (under the IAS 38 principles) if some criteria are met. More precisely, the IAS rule makes
the distinction between the research and development parts of R&D. On the one hand, the former is
too uncertain and therefore all research-related investments must be considered as costs. On the other
hand, development costs entail a higher probability of becoming a source of revenues, and therefore
can be capitalized subject to criteria based on:
the technical feasibility of the product under development;
the intention and availability of financial resources to complete its development;
the ability of the firm to use or sell the product;
the ability to specify how the product will generate future economic benefits;
the ability to reliably measure the expenditures to develop the product.
Valuation methods
Different valuation methods are used to report intangibles, without consensus on the best approach:
The cost method considers the value that would have been present on a company’s balance
sheet if the assets in question were tangible. However, it can be very difficult to isolate the costs
relating to a specific group of assets with precision.
The income approach relies on estimates of expected extra future benefits associated with the
use of the assets. A risk-weight method is used to calculate discounted cash flows. However, it
is not well-suited to assets with a high risk of failure (implying zero revenues), and the evaluation
is more uncertain for young businesses with less-established cash flows.
The market comparison approach is based on a comparison with sales of similar assets. This
approach is the most appropriate way to identify the market value, but it is strongly limited by
the lack of liquidity of IP markets.
The technical obsolescence of intangibles is also very specific and heterogeneous across assets and
adds an additional layer of complication. In some cases depreciation can be faster than for tangibles
(as currently suggested for R&D), while in others the value of intangible assets may increase over time
(for instance in case of network effects).
Fostering financial disclosure
While changes in accounting rules might take time to materialize, a simpler way to reduce information
asymmetries with respect to intangibles is to improve firms’ corporate disclosure by providing a qualitative
but standardised description of intangible asset holdings. It is still debated whether disclosure is effective
for firms relying heavily on intangibles, as the non-rival nature of knowledge assets exposes these
companies to the risk of being imitated, offsetting at least some of the benefits from a reduction in financing

32
frictions (Andrews and De Serres, 2012; Andrews and Criscuolo, 2013). Nonetheless, evidence tends to
support the idea that the benefits are larger than the costs, with an efficient IPR system playing a
complementary role in reducing imitation by competitors.
Overall, R&D expenditure as a share of value added appears to grow faster in countries with higher-quality
corporate disclosure to shareholders (Carlin and Mayer, 2013) and companies tend to voluntary disclose
more information on R&D expenses when they have the possibility to do so (Chen et al., 2017). In turn,
greater corporate disclosure is associated with a lower spread for innovative firms (Bonsall et al., 2017)
and a more efficient allocation of capital towards the most promising projects, as investors rely on detailed
information to back their decisions (Verrecchia, 200; Beyer et al., 2010). Recent studies also show that
R&D disclosure could substitute for other information on borrowers that usually stems from tight bank-firm
relationship (Saidi and Zaldokas, 2016), and this effect is expected to be stronger when the narrative
information is easily readable for banks (Hofman and Kleimeier, 2019).35
4. Conclusion
Financing intangible investment raises specific challenges that often impede to fully exploit the growth and
resilience opportunities associated with these assets. The ability of many firms, particularly young and
small, to invest in these assets is limited and generates a financing gap, i.e. the volume of investment in
intangible assets is lower than what would be desirable from a social perspective. Such a financing gap
could be further amplified in the aftermath of the COVID-19 outbreak, as intangible-intensive firms have
depleted their cash and equity buffers to weather the crisis, significantly reducing their main sources of
financing for future intangible investment.
The G20 could play a critical role in identifying the best policy mix to meet intangibles financing challenges.
The policy discussion stresses the complementarity among different potential sources of financing --
government support, equity markets and bank loans – and provides a menu of targeted policies to unlock
the productivity and the resilience potential of intangibles. Figure 14 summarizes the main policy objectives
(green boxes) and areas for action (white boxes). The policy discussion conveys three main insights:
The critical role of intangible capital for the recovery and for building resilience of G20 economies
calls for a continuation of swift government actions to ease intangible-intensive sectors’ access to
various source of finance through different support mechanisms (e.g. loan guarantees and equity-
type instruments).
The public financing of innovation, often aimed at reducing the investment gap in innovative
activities, could be further fine-tuned to play a bigger role at relaxing financing constraints faced by
intangible-intensive firms, notably start-ups and SMEs. Government support for expenditures on
other (non-R&D related) types of intangible assets showing positive externalities, e.g. skill
formation, could also be considered subject to design considerations and evaluations to ensure
value-for-money.
In many G20 countries access to equity finance is still limited, pointing to the necessity to deepen
equity markets when they are underdeveloped (e.g. by progressing on the European Capital
Market Union, reducing the preference to use debt over equity, easing access to IPOs) and to
ensure that their structure is well-suited for intangible-intensive firms (e.g., by reducing specific
regulations that limit long-term oriented institutions’ ability to invest in equity and establishing the
conditions for an active venture capital market).
35 Financial disclosure plays a specific role also in equity markets, as it reduces principal-agent issues, which are
particularly intense for intangibles (OECD, 2012) and strengthens managerial incentives to invest (Roychowdhury et
al., 2019).

33
There is room to further exploit the potential of the banking sector to finance codified and
transferable intangibles. Measures aimed at reducing asymmetry of information (e.g. improving
accounting standards) and intangibles’ collateralisation (e.g., IP backed loans), as well as ensuring
efficient liquidation of intangibles (e.g., revision of insolvency procedures and development of IP
markets) are key to encourage banks to enhance their lending toward intangible-intensive firms.
Figure 14. Policies to close the financing gap in intangible assets: a summary
Source: OECD.

34
References
Acharya, V. and Z. Xu, (2017), “Financial Dependence and Innovation: The Case of Public versus
Private Firms”, Journal of Financial Economics, 124(2): 223-243.
Adalet McGowan, M. and D. Andrews, (2018), "Design of Insolvency Regimes across Countries", OECD
Economics Department Working Papers No. 1504.
Adalet McGowan, M., D. Andrews and V. Millot, (2017), "Insolvency Regimes, Zombie Firms and Capital
Reallocation", OECD Economics Department Working Papers No. 1399.
Agrawal, A., C. Catalini and A. Goldfarb, (2011), “The Geography of Crowdfunding”, NBER Working
Papers No 16820.
Aghion, P., J. Van Reenen and L. Zingales, (2013), "Innovation and Institutional Ownership", American
Economic Review, 103(1): 277-304.
Ahlers, G., D. J. Cumming, C. Guenther and D. Schweizer, (2015), “Signaling in Equity Crowdfunding”,
Entrepreneurship Theory and Practice, Forthcoming.
Allinson, G. F., P. Robson and I. Stone, (2013), “Economic Evaluation of the Enterprise Finance
Guarantee (EFG) Scheme”, Department for Business, Innovation and Skills Project Report.
Amable, B., J. B. Chatelain and K. Ralf, (2010), "Patents as Collateral", Journal of Economic Dynamics
and Control, 34(6): 1092-1104.
Andrews, D. and C. Criscuolo, (2013), "Knowledge-Based Capital, Innovation and Resource
Allocation", OECD Economics Department Working Papers No. 1046.
Andrews, D., C. Criscuolo and P. Gal, (2016), “The Best versus the Rest: The Global Productivity
Slowdown, Divergence across Firms and the Role of Public Policy”, OECD Productivity Working
Paper No. 5.
Andrews, D. and A. De Serres, (2012), “Intangible assets, Resource Allocation and Growth: A
Framework for Analysis”, OECD Economics Department Working Paper No. 989.
Andrews, D., G. Nicoletti and C. Timiliotis, (2018), “Digital technology diffusion: A matter of capabilities,
incentives or both?”, OECD Economics Department Working Papers, No. 1476
APEC, (2018), Best Practices on Intellectual Property (IP) Valuation and Financing in APEC.
Appelt, S., M. Bajgar, C. Criscuolo and F. Galindo-Rueda, (2016), “R&D Tax Incentives: Evidence on
Design, Incidence and Impacts”, OECD Science, Technology and Industry Policy Papers, No. 32,
OECD Publishing.
Appelt, S., F. Galindo-Rueda and A. González Cabral, (2019), "Measuring R&D tax support: Findings
from the new OECD R&D Tax Incentives Database", OECD Science, Technology and Industry
Working Papers, No. 2019/06, OECD Publishing, Paris.
Armour J., D. Cumming, (2006), “The Legislative Road to Silicon Valley”, Oxford Economic Papers,
58(4): 596-635.
Autor, D., D. Dorn, L. F. Katz, C. Patterson and J. Van Reenen, (2019), “The Fall of the Labor Share and
the Rise of Superstar Firms”, Quarterly Journal of Economics, Forthcoming.

35
Avnimelech, G. and M. Teubal, (2006), “Creating Venture Capital Industries That Co-evolve with High
Tech: Insights from an Extended Industry Life Cycle Perspective of the Israeli Experience”, Research
Policy, 35: 1477-1498.
Azar, J., M. C. Schmalz and I. Tecu, (2018), “Anticompetitive Effects of Common Ownership”, Journal of
Finance, 73(4): 1513–1565.
Baygan, G., (2003), “Venture Capital Policies in Israel”, OECD Science, Technology and Industry
Working Papers 2003/03.
Bajgar, M., G. Berlingieri, S. Calligaris, C. Criscuolo and J. Timmis, (2019), "Industry Concentration in
Europe and North America", OECD Productivity Working Papers No. 18.
Bajgar M, C. Criscuolo and J. Timmis, (2018), “Mergers & Acquisitions: Implications for Innovation and
Competition in the Digital Economy”, OECD note, DSTI/CIIE(2018)6.
Bansal, R., M. M. Croce, W. Liao, and S. Rosen, (2019), “Uncertainty-Induced Reallocations and
Growth”, NBER Working Paper No. 26248.
Barrero, J.M., N. Bloom and S.J. Davis, (2020), “COVID-19 Is Also a Reallocation Shock”, NBER
Working Paper No. 27137.
Barrero, J.M., N. Bloom and I. Wright, (2017), “Short and Long Run Uncertainty”, NBER Working Paper
No. 23676.
Bassanini, A., A. Booth, G. Brunello, M. De Paola and E. Leuven, (2007), “Workplace Training in
Europe”, in Brunello, Garibaldi and Wasmer (Eds.), Education and Training in Europe, Oxford
University Press, Oxford.
Belleflamme, P., T. Lambert and A. Schwienbacher, (2014), “Crowdfunding: Tapping the Right Crowd”,
Journal of Business Venturing, 29(5): 585-609.
Berlingieri, G., S. Calligaris, C. Criscuolo and R. Verlhac (2020), “Laggard firms, technology diffusion and
its structural and policy determinants”, OECD Science, Technology and Industry Policy Papers, No.
86.
Bertoni, F., M. G. Colombo and A. Quas, (2018), “The Effects of EU-Funded Guarantee Instruments on
the Performance of Small and Medium Enterprises: Evidence from France”, EIF Working Paper No.
2018/52.
Beyer, A., D. A. Cohen, T. Z. Lys and B. R. Walther, (2010), “The Financial Reporting Environment:
Review of the Recent Literature”, Journal of Accounting and Economics, 50(2-3): 296-343.
Bhatia, A. V., S. Mitra, A. Weber, S. Aiyar, L. A. de Almeida, C. Cuervo, A. O Santos and T.
Gudmundsson, (2019), “A Capital Market Union for Europe”, Staff Discussion Notes No. 19/07.
Blanchard, O., T. Philippon and J. Pisani-Ferry, (2020), “A New Policy Toolkit Is Needed as Countries
Exit COVID-19 Lockdowns”, Peterson Institute for International Economics Policy Brief, N. 20-8.
Bloom, N., E. Brynjolfsson, L. Foster, R.S. Jarmin, M. Patnaik, I. Saporta-Eksten and J. Van Reenen
(2017), “What Drives Differences in Management?”, NBER Working Paper No. 23300.
Bloom, N., J. Van Reenen and H. Williams, (2019), “A Toolkit of Policies to Promote Innovation”, Journal
of Economic Perspectives, 33 (3): 163-84.
Bonsall, S. B., A. J. Leone, B. P. Miller and K. Rennekamp, (2017). “A Plain English Measure of Financial
Reporting Readability”, Journal of Accounting and Economics, 63(2): 329–357.
Boschmans, K. and L. Pissareva, (2017), “Fostering Markets for SME Finance”, OECD SME and
Entrepreneurship Papers No. 6.
Brassell, M. and K. Boschmans, (2019), "Fostering the Use of Intangibles to Strengthen SME Access to
Finance", OECD SME and Entrepreneurship Papers No. 12.
Brassell, M. and K. King, (2013), “Banking on IP?: The Role of Intellectual Property and Intangible Assets
in Facilitating Business Finance”, The Intellectual Property Office of the United Kingdom.

36
Bravo-Biosca, A., C. Criscuolo and C. Menon, (2013), “What Drives the Dynamics of Business Growth?”,
OECD Science, Technology and Industry Policy Papers No. 1.
British Business Bank, (2018), “Using IP to Access Growth Funding”, Intellectual Property Office Report.
Brossard, O., S. Lavigne and M. E. Sakinç, (2013), “Ownership Structures and R&D in Europe: the Good
Institutional Investors, the Bad and Ugly Impatient Shareholders”, Industrial and Corporate Change,
22(4): 1031–1068.
Brown, J. R., G. Martinsson and B.C. Petersen, (2012), “Do Financing Constraints Matter for R&D”,
European Economic Review, 56(8).
Caggese, A. and A. Perez-Orive, (2019), “Capital Misallocation and Secular Stagnation”, Barcelona GSE
Working Paper No. 1056.
Calvino, F., C. Criscuolo and R. Verlhac, (2020), “Start-ups in the Time of COVID-19: Facing the
Challenges, Seizing the Opportunities”, VoxEU.org.
Carlin, W. and C. Mayer, (2003), “Finance, Investment, and Growth”, Journal of Financial Economics,
69(1): 191-226.
Castellacci, F. and C. M. Lie, (2015), "Do the Effects of R&D Tax Credits Vary across Industries? A
Meta-regression Analysis", Research Policy, 44: 819-832.
Cecchetti, S. G. and K. L. Schoenholtz, (2017), “Treasury Round II: The Capital Markets Report”, Money,
Banking and Financial Markets.
CEDEFOP, (2009), Using Tax Incentives to Promote Education and Training, Cedefop panorama series.
Chen, W., (2017), “Cross-Country Income Differences Revisited: Accounting for the Role of Intangible
Capital”, Review of Income and Wealth, 64: 626-648.
Chen, E., I. Gavious and B. Lev, (2017), “The Positive Externalities of IFRS R&D Capitalization:
Enhanced Voluntary Disclosure”, Review of Accounting Studies, 22(2): 677-714.
Colombo, M. G. and K. Shafi, (2016), “Does Crowdfunding Help Firms Obtain Venture Capital and Angel
Finance?”, ENTFIN Conference, Lyon.
Corrado, C., J. Haskel, C. Jona-Lasinio and M. Iommi, (2016), “Intangible Investment in the EU and US
before and since the Great Recession and its Contribution to Productivity Growth”, The EIB Working
Papers 2016/08, European Central Bank.
Crouzet, N. and J. Eberly. (2019), "Understanding Weak Capital Investment: the Role of Market
Concentration and Intangibles", NBER Working Paper No. 25869.
Darvas, Z. and D. Schoenmaker, (2017), “Institutional Investors and Home Bias in Europe’s Capital
Markets Union”, Working Paper Issue 2, Bruegel.
Davies, R., A. G. Haldane, M. Nielsen, and S. Pezzini, (2014), “Measuring the Costs of Short-Termism”,
Journal of Financial Stability, (12): 16–25.
De Fontenay, C. and E. Carmel, (2004), “Israel’s Silicon Wadi: The Forces behind Cluster Formation”, In:
C. De Fontenay and E. Carmel, Building High-Tech Clusters: Silicon Valley and Beyond.
De Guindos, L. and I. Schnabel (2020), “Improving Funding Conditions for the Real Economy during the
COVID-19 Crisis: The ECB’s Collateral Easing Measures”, The ECB Blog.
Dell'Ariccia G., D. Kadyrzhanova, C. Minoiu and L. Ratnovski, (2017), "Bank Lending in the Knowledge
Economy", IMF Working Papers 17/234.
Demmou L., S. Calligaris, G. Franco, D. Dlugosch, M. Adalet McGowan and S. Sakha, (2021),
“Insolvency and Debt Overhang Following the COVID-19 Outbreak: Assessment of Risks and Policy
Responses”, OECD Economics Department Working Papers No. 1651.
Demmou, L. and G. Franco, (2021), “Mind the Financing Gap: Enhancing the Contribution of Intangible
Assets to Productivity”, Forthcoming OECD Economics Department Working Papers.

37
Demmou, L., G. Franco and I. Stefanescu, (2020), “Productivity and Finance: the Intangible Assets
Channel - a Firm Level Analysis”, OECD Economics Department Working Papers No. 1596.
Demmou, L., I. Stefanescu and A. Arquié, (2019), “Productivity Growth and Finance: the Role of
Intangible Assets - a Sector Level Analysis”, OECD Economics Department Working Papers No.
1547.
D'Ignazio, A. and C. Menon, (2013), "The Causal Effect of Credit Guarantees for SMEs: Evidence from
Italy," Temi di discussione (Economic working papers) 900, Bank of Italy, Economic Research and
International Relations Area.
Dlugosch, D., R. Gonenc, E. J. Kim and A. Paciorek, (2020), "Firming up the Capital Base of the Austrian
Business Sector - Consolidating Austria’s Business Sector Strengths and its Social Role in the Face
of New Challenges", OECD Economics Department Working Papers No. 1595.
Eisenberg, R. and R. Ziedonis, (2010), “Markets for Patents”, Research Conference, Technology
Academics Policy.
Elschner, C., C. Ernst, G. Licht and C. Spengel, (2009), "What the Design of an R&D Tax Incentive Tells
about Its Effectiveness: A Simulation of R&D Tax Incentives in the European Union", The Journal of
Technology Transfer, 36(3): 233–256.
EPO, (2017), “Patents, Trade and Foreign Direct Investment in the European Union”, European Patent
Office.
EPRS, (2019), “Enabling SMEs' Access to Capital Markets”, European Parliament Briefing Note.
Farre-Mensa, J., D. Hedge and A. Ljungqvist, (2020), “What Is a Patent Worth? Evidence from the U.S.
Patent “Lottery”, The Journal of Finance, forthcoming.
Fatica, S., T. Hemmelgarn and G. Nicodème, (2013), “The Debt-Equity Tax Bias: Consequences and
Solutions”, Reflets et perspectives de la vie économique, LII (1) : 5-18.
Formai, S., F. Lotti, F. Manaresi and F. Scoccianti, (2020), “Così il COVID ha contagiato
l’imprenditorialità”, Lavoce.info.
Francis, B., L. Hasan, Y. Huang and Z. Sharma, (2012), “Do Banks Value Innovation? Evidence from US
Firms”, Financial Management, 41(1): 159–185.
FRC, (2019), Business Reporting of Intangibles: Realistic Proposals. Financial Reporting Council.
Galston, W. A. and C. Hendrickson, (2018), “A Policy at Peace with Itself: Antitrust Remedies for Our
Concentrated, Uncompetitive Economy”, Report, Governance Studies, Brookings.
Gilson, R. J., (2003), “Engineering a Venture Capital Market: Lessons from the American Experience”,
Stanford Law Review Vol. 55.
Grilli, L. and S. Murtinu, (2012), “Government, Venture Capital and the Growth of European High-Tech
Start-Ups: A Firm-Level Panel Data Analysis”, SSRN Electronic Journal.
Hagiu, A. and D. Yoffie, (2011), “Intermediaries for the IP Market”, Harvard Business School Working
Papers No. 12-023.
Hall, B. H. and J. Lerner, (2010), “The Financing of R&D and Innovation”, Handbook of the Economics of
Innovation, 1: 609–639.
Harhoff, D., (2009), "The Role of Patents and Licenses in Securing External Finance for Innovation." EIB
Papers, 14(2): 74-97.
Haskel, J. and S. Westlake, (2018), Capitalism without Capital: The Rise of the Intangible Economy,
Princeton University Press.
Hochberg, Y. V., C. J. Serrano and R. H. Ziedonis, (2018), “Patent Collateral, Investor Commitment, and
the Market for Venture Lending”, Journal of Financial Economics, 130(1): 74-94.
Hofman, A.O. and S. Kleimeir (2019), “Financial Disclosure Readability and Innovative Firms' Cost of
Debt”, International Review of Finance, 1-15.

38
Hornuf, L. and A. Schwienbacher, (2017), “Should Securities Regulation Promote Equity
Crowdfunding?”, Small Business Economics, 49(3): 579-593.
Hotchkiss, E. S., K. John, R. M. Mooradian and K. S. Thorburn, (2008), “Bankruptcy and the Resolution
of Financial Distress”, Handbook of Empirical Corporate Finance, 2: 2-22.
Hottenrott, H. and C. Lopes-Bento, (2014), “(International) R&D Collaboration and SMEs: The
Effectiveness of Targeted Public R&D Support Schemes”, Research Policy, 43(6): 1055-1066.
Howell, S. T., (2017), "Financing Innovation: Evidence from R&D Grants", American Economic Review,
107(4): 1136-64.
Hsu, P. H., X. Tian and Y. Xu, (2014), “Financial Development and Innovation: Cross-Country Evidence”,
Journal of Financial Economics, 112(1).
Jarboe, K. and I. Ellis, (2010), “Intangible Assets Innovative Financing for Innovation”, Issues in science
and technology, 26: 75-80.
Jeppsson, H., (2018), “Initial Public Offerings, Subscription Precommitments and Venture Capital
Participation”, Journal of Corporate Finance, 50: 650-668.
Johnson, D., J. Pichinson and M. Pichinson, (2018), “Monetizing Intangible Assets in Insolvency:
Protecting and Maximizing IA Value Before it Slips Away”, abfjournal.
Kasahara, H., K. Shimotsu and M. Suzuki, (2014), "Does an R&D Tax Credit Affect R&D Expenditure?
The Japanese R&D Tax Credit Reform in 2003", Journal of the Japanese and International
Economies, 31(C): 72-97.
Kobayashi, Y., (2014), “Effect of R&D Tax Credits for SMEs in Japan: A Microeconometric Analysis
Focused on Liquidity Constraints”, Small Business Economics, 42(2): 311-327.
Laplante, S. K., H. A. Skaife, L. A. Swenson and D. D. Wangerin, (2019), “Limits of Tax Regulation:
Evidence from Strategic R&D Classification and the R&D Tax Credit”, Journal of Accounting and
Public Policy, 38(2): 89-105.
Lee, P. M., (2005), “A Comparison of Ownership Structures and Innovations of US and Japanese Firms”,
Managerial and Decision Economics.
Lee, J., T. Li and D. Shin, (2018), “The Wisdom of Crowds and Information Cascades in FinTech:
Evidence from Initial Coin Offerings”, mimeo, Warrington College of Business and Princeton
University.
Lerner, J., (1999), "The Government as Venture Capitalist: The Long-Run Effects of the SBIR Program",
Journal of Business, 72: 285–318.
Lerner, J., (2010), “The Future of Public Efforts to Boost Entrepreneurship and Venture Capital”, Small
Business Economics, 35(3): 255–264.
Lev B., (2018), “The Deteriorating Usefulness of Financial Report Information and How to Reverse It”,
Accounting and Business Research, 48(5): 465-493.
Loumioti, M., (2012), “The Use of Intangible Assets as Loan Collateral”, SSRN Electronic Journal.
Luukkonen, T., (2006), “Venture Capital Industry in Finland: Country Report for the Venture Fun Project”,
ETLA Discussion Papers 1003.
Mateut, S., (2018), “Subsidies, Financial Constraints, and Firm Innovative Activities in Emerging
Economies”. Small Business Economics, 50:131–162.
McCall, B., J. Smith and C. Wunsch, (2016), “Government-Sponsored Vocational Education for Adults”,
Handbook of the Economics of Education, Elsevier B.V., 5:479-652.
Meuleman, M. and W. De Maeseneire, (2012), “Do R&D Subsidies Affect SMEs’ Access to External
Financing?” Research Policy, 41(3): 580-591.
Mollick, E., (2014), “The Dynamics of Crowdfunding: An Exploratory Study”, Journal of Business
Venturing, 29: 1–16.

39
Munro, D. and C. Lamb, (2020), “Financing the Intangible Shift”, Brookfield Institute for Innovation +
Entrepreneurship Commentary.
Nassr, I. K. and G. Wehinger, (2016), “Opportunities and Limitations of Public Equity Markets for SMEs”,
OECD Journal: Financial Market Trends, Vol. 2015/1.
O'Dair, M. and R. Owen, (2019), “Financing new Creative Enterprise through Blockchain Technology:
Opportunities and Policy Implications”, Strategic Change, 28: 9-17.
OECD, (1997), Government Venture Capital for Technology-Based Firms, OECD/GD(97)201.
OECD, (2011), Intellectual Assets and Innovation: The SME Dimension, OECD Studies on SMEs and
Entrepreneurship, OECD Publishing.
OECD, (2012), Corporate Reporting of Intangible Assets: A Progress Report, OECD Publishing.
OECD, (2015a), New Approaches to SME and Entrepreneurship Financing: Broadening the Range of
Instruments, OECD Publishing.
OECD, (2015b), Enquiries into Intellectual Property’s Economic Impact, OECD Publishing.
OECD, (2016), "The role of business angel investments in SME finance", in Financing SMEs and
Entrepreneurs 2016: An OECD Scoreboard, OECD Publishing.
OECD, (2017a), “Taxation and Skills”, OECD Tax Policy Studies, No. 24, OECD Publishing,
Paris.OECD, (2017b), Evaluating Publicly Supported Credit Guarantee Programmes for SMEs,
OECD Publishing. OECD, (2019a), Individual Learning Accounts: Panacea or Pandora's Box?, OECD
Publishing.
OECD (2019b), OECD SME and Entrepreneurship Outlook 2019, OECD Publishing, Paris.
OECD, (2019c), Strengthening SMEs and Entrepreneurship for Productivity and Inclusive Growth, OECD
2018 Ministerial Conference on SMEs, OECD Publishing.
OECD (2019d), “Getting Skills Right: Future-Ready Adult Learning Systems”, Getting Skills Right, OECD
Publishing, Paris.
OECD (2020a), Financing SMEs and Entrepreneurs 2020: An OECD Scoreboard, OECD Publishing,
Paris.
OECD (2020b), "The impact of COVID-19 on SME financing: A special edition of the OECD Financing
SMEs and Entrepreneurs Scoreboard", OECD SME and Entrepreneurship Papers, No. 22, OECD
Publishing, Paris.
OECD, (2020c), “The Effects of R&D Tax Incentives and their Role in the Innovation Policy Mix: Findings
from the OECD microBeRD Project, 2016-19”, OECD Science, Technology and Industry Policy
Papers, No. 92.
OECD, (2020d), “Corporate sector vulnerabilities during the COVID-19 outbreak: Assessment and policy
responses”, Tackling Coronavirus Series.
OECD (2020e), “Issue Note 3: Assessment of Government Crisis Programmes to Support Businesses”,
OECD Economic Outlook, Volume 2020 Issue 1, OECD publishing
OECD, (2020f), “The COVID-19 Crisis and State Ownership in the Economy: Issues and Policy
Considerations”, Tackling Coronavirus Series.
OECD, (2020g), “Supporting Businesses in Financial Distress to Avoid Insolvency during the COVID-19
Crisis”, Tackling Coronavirus Series.
OECD, (2020h), Corporate Tax Statistics database, https://oe.cd/corporate-tax-stats.
OECD, (2021a), “OECD Science, Technology and Innovation Outlook 2021: Times of Crisis and
Opportunity”, OECD Publishing, Paris.
OECD, (2021b), R&D Tax Incentive Database, http://oe.cd/rdtax.
Ono, A., I. Uesugi and Y. Yasuda, (2013), “Are Lending Relationships Beneficial or Harmful for Public

40
Credit Guarantees? Evidence from Japan's Emergency Credit Guarantee Program”, Journal of
Financial Stability, 9:151-167.
Owen, R, C. Mason, (2019), “Emerging Trends in Government Venture Capital Policies in Smaller
Peripheral Economies: Lessons from Finland, New Zealand, and Estonia”, Strategic Change, 28: 83–
93.
Paunov, C., (2012), “The Global Crisis and Firms’ Investments in Innovation”, Research Policy, 41(1):
24-35.
Paunov, C. and S. Planes-Satorra, (2020), “Science, Technology and Innovation in Times of COVID-19
and Policy Responses: Preliminary Overview in June 2020”, OECD Conference Report.
Pöschel, C., (2019), “Incentive Effects of R&D Tax Incentives - A Meta-regression Analysis Focusing on
R&D Policy Designs”, arqus Discussion Paper No. 243.
Robb, A. M. and D. Robinson, (2014), “The Capital Structure Decisions of New Firms”, Review of
Financial Studies, 27(1): 153-179.
Roth, A. E., (2008), “What Have We Learned From Market Design?", Economic Journal, 118: 285-310.
Roychowdhury, S., N. Shroff and R. S. Verdi, (2019), “The Effects of Financial Reporting and Disclosure
on Corporate Investment: A Review”, Journal of Accounting & Economics, Forthcoming.
Saidi, F. and A. Zaldokas, (2016), "Patents as Substitutes for Relationships", CEPR Discussion Papers
No. 11580.
Schwellnus, C., M. Pak, P.A. Pionnier and E. Crivellaro, (2018), “Labour share developments over the
past two decades: The role of technological progress, globalisation and “winner-takes-most”
dynamics”, OECD Economics Department Working Papers, No. 1503.
Schwienbacher, A. and B. Larralde, (2012), “Crowdfunding of Small Entrepreneurial Ventures”. In:
Cumming, D., Ed., The Oxford Handbook of Entrepreneurial Finance, Chapter 13, Oxford University
Press, Oxford.
Sehra, A., P. Smith and P Gomes, (2017), “Economics of Initial Coin Offerings”.
Serrano, C. J. and R. H. Ziedonis, (2018), “How Redeployable are Patent Assets? Evidence from Failed
Startups”, NBER Working Paper No. w24526.
Sorbe, S., P. Gal, G. Nicoletti and C. Timiliotis, (2019), "Digital Dividend: Policies to Harness the
Productivity Potential of Digital Technologies", OECD Economic Policy Papers No. 26.
Terroir, P., (2014), “Rebalancing the Patent Economy”, Intellectual Asset Management, 71.
Torres, C., (2012), "Taxes and Investment in Skills", OECD Taxation Working Papers, No. 13, OECD
Publishing, Paris.
UNCTAD, (2020), “The Need to Protect Science, Technology and Innovation Funding During and After
the COVID-19 Crisis”, Policy Brief No. 80.
UK Government, (2019), “Business Productivity Review”, Industrial Strategy.
Van Rooij, M., A. Lusardi and R. Alessie, (2011), “Financial Literacy and Stock Market Participation”,
Journal of Financial Economics, 101(2): 449-472.
Véron, N. and G. B. Wolff, (2016), “Capital Markets Union: A Vision for the Long Term”, Journal of
Financial Regulation, 2(1): 130–153.
Verrecchia, R. E., (2001), “Essays on Disclosure”, Journal of Accounting and Economics, 32(1-3): 97-
180.
Wang, W., A. Mahmood, C. Sismeiro and N. Vulkan, (2019), "The Evolution of Equity Crowdfunding:
Insights from Co-Investments of Angels and the Crowd", Research Policy, 48(8): 1-11.
Wasmer, E., (2006), “The Economics of Prozac (Do Employees Really Gain from Strong Employment
Protection?)”, CEPR Discussion Paper No. 5991.

41
WEF, (2014), “The Competitiveness Repository. Finland - The VIGO Venture Accelerator Programme”.
Wilson, K. E., (2011), “Financing High-Growth Firms: The Role of Angel Investors”, SSRN Electronic
Journal.
Wilson, K. E., (2015), “Policy Lessons from Financing Innovative Firms”, OECD Science, Technology
and Industry Policy Papers No. 24.
World Bank, (2018), “Saving Entrepreneurs, Saving Enterprises: Proposals on the Treatment of MSME
Insolvency”, World Bank Group.

42
Annex A. A new methodology to extend the
estimation of intangible investment to a wider
range of countries
The measurement of intangible investment at the country level is often constrained due to data availability,
in particular with respect to organisational capital. The OECD is developing a new methodology to extend
its measurement to a wider range of countries, including emerging G20 economies. The methodology
builds on Corrado et al. (2016), who provide estimates for a set of advanced economies, and it is adjusted
to fit data availability also following insights from Chen (2017).
The new OECD measure encompasses the 2011-2015 period and allows to distinguish investment in
“Intellectual Property Products” from other types of intangible investment – i.e., “Design, Brand Equity and
Purchased Organisation Capital” (e.g., “New Intangibles”) as well as “Own Account Organizational
Capital”.36 Figure A.1 reports the new series for intangible investment (and its components) over value
added.
Intellectual Property Products
The estimation of investment in Intellectual Property Products (IPP) is standard and based on national
accounts data on gross fixed capital formation, obtained either from OECD statistics or from countries’
official National Accounts statistics.
Design, Brand Equity and Purchased Organisation Capital (New Intangibles)
Following Corrado et al. (2016), Use Tables at purchasers’ price (either from the OECD or from National
Statistics) are used to retrieve economies’ intermediate consumption of three products: i) management
consultancy services that are used to proxy expenditures on “Purchased Organisation Capital” (POC); ii)
architectural and engineering services, technical testing and analysis services that are used to proxy
expenditures on “Design”; iii) advertising and market research services that are used to proxy expenditures
on “Brand Equity”. Next, to obtain the investment in “Design, Brand Equity and Purchased Organisation
Capital”, these expenditures are capitalised using a weighted average (across assets types) of the
capitalization factors estimated in Corrado et al. (2016).
For some countries, however, the Use Table at purchasers’ price reports only a broader category of
expenditures, i.e. the intermediate consumption of “Professional, Scientific and Technical services” (PTS).
Given that the three above-mentioned products represent a sizeable component of PTS, their value is
estimated as follows. First, the ratio of the value of intermediate consumption of the specific products over
the value of the use of all PTS products is computed when detailed data are available. Second, the yearly
36 For China, the calculations rely on inputs from Mrs Janet Hao, senior economist at the Conference Board. The
methodology used is close to the one presented in the next paragraphs, but not perfectly overlapping due to data
specific features.

43
median across countries of the ratio is calculated. Third, the year-specific ratio factor is multiplied by PTS
expenditures to proxy for expenditures “Design, Brand Equity and Purchased Organisation Capital”.37
Own-Account Organization Capital
An expenditure approach similar in spirit to the methodology developed by Chen (2017) is adopted to
estimate the own-account component of organization capital (OOC), computed as the capitalized value
(e.g., 20%) of managers’ compensation. Managers’ compensation at the country-year level is obtained as
the product of the number of managers by managers’ average wage. The number of managers is extracted
from the ILO Employment by sex and occupation dataset. The main source for managers’ wage data is
the ILO Mean nominal monthly earnings of employees by sex and occupation dataset. For countries with
incomplete data series over time, missing values are imputed, assuming that the ratio of the number of
managers over the total labour force or the ratio of managers’ wage over the average wage of workers is
the same as in the closest year with available data.38
Figure A.1. A new intangible investment series
Note: The figure shows the variation across countries of intangible assets’ gross fixed capital formation as a share of value added, disaggregating
the three components of intangible investment. Due to data availability, the training component of intangible investment is excluded.
Source: OECD calculations on OECD, National Use Tables, World Bank, PWT and ILO data.
37 An additional preliminary step is required to obtain an estimate for countries lacking a comparable Use Table at
purchasers’ price. In this occurrence, the intermediate consumption of PTS from OECD Input-Output Tables (IOTs) is
used, scaled with an appropriate adjustment factor linking IOTs and Use Tables.
38 Notice that for India and Japan data on managers’ compensation are not available and are imputed exploiting the
median ratio between managers’ wage and workers’ wage in the sample as well as country-specific information on
workers’ wage.

44
Annex B. Additional figures
Figure B.1. Intangible intensity by sector
Note: The figure reports sectoral intangible intensity computed on the basis of Compustat data U.S. listed firms. Intangible intensity is measured
as the sum of intangible assets over the sum of total assets over the 1990 to 2006 period for each U.S. listed firm with available data in
Compustat; firm level estimates are aggregated at sector level by taking the median-firm intangible intensity ratio of each sector.
Source: Demmou et al. (2019).
Figure B.2. Intellectual property rights and countries’ intangible investment
Note: The figure shows the correlation between intangible assets gross fixed capital formation and intellectual property rights protection.
Intangible assets’ gross fixed capital formation is computed using a combination of data sources and a novel methodology described in Annex
A; due to data availability, the training component of intangible investment is excluded. The intellectual property rights protection series is
obtained from World Bank data. Both series are averaged over the 2011-2015 period.
Source: OECD calculations on OECD, National Use Tables, World Bank, PWT and ILO data.

45
Annex C. Lessons from venture capital
successful experiences
Israel
The government has been a catalyst of the venture capital industry with the establishment of the Yozma
program, which allocated the right set of incentives to all the market participants (Gilson, 2003). The Yozma
Venture Capital Ltd., publicly owned and worth 100 million US $, acted as follows:
It helped promising firms to attract foreign investment by committing US$ 8 million every US $20
million provided by the private investors, which had the chance to re-purchase the publicly held
capital at a fixed rate after 5 years. Foreign entities were also granted a series of tax incentives
and looser regulation (Baygan, 2003).
It established a business relationship with leading academic institutions and technology incubators,
as well as a club (Yozma III CEO Club) which allowed senior managers and successful
entrepreneurs to meet and exchange knowledge.
Consistent with the idea that when the government engages directly in venture capital activity
achieves lower outcomes compared to private venture capitalists or co-funded investments
managed by privates, it relied on international partners for all investment decisions, and never
engaged directly (Lerner, 2010; Grilli and Murtinu, 2012).
It favoured the development of complementary entities, aimed at training small firm’s management,
assessing domestic and international markets, advising and financing smart scientists and
entrepreneurs (Baygan, 2003).
The risk-taking culture characterizing Israelis, the extensive stock of high quality human capital, the
leadership and organisational skills as well as network relationships developed when serving in the military
forces, and the strong links with U.S. investors are the main idiosyncratic demand factors that matched the
increasing supply of venture capital (OECD, 1997; de Fontenay and Carmel, 2004; Avnimelech and
Teubal, 2006).
United States
The purpose of the Small Business Innovation Research (SBIR) program was to complement, rather than
substitute, private investment, given that the US venture capital market was already well established and
effective in 1980s. The Small Business Innovation Development Act (1982) obliged eleven large federal
agencies involved in external research financing to allocate a small percentage of their budget to small,
domestic and independent firms. The program was organized through subsequent “Phases”. Phase I
award was simply intended to help entrepreneurs determine the feasibility of their projects. The federal
agency then selected only the most promising start-ups and awarded them with a more significant Phase
II grant, aimed at assisting entrepreneurs in the development of their business plans. The agency did not
receive any equity or participation in exchange, but the awardee had to provide a report documenting the
technology under development (OECD, 1997; Lerner, 1999).

46
Overall, the program achieved its objectives. Howell (2017) finds that venture capitalists are more inclined
to invest in grant recipient firms, the awardees will produce more patents and revenues, and that this effect
is magnified for financially constrained firms. In line with this, Lerner (1999) shows that firm enrolled in the
SBIR program grew significantly more in terms of sales and employees compared to their peers during the
period 1985-1995; yet, the positive effect was limited to firms located in counties with solid venture capital
activity, emphasizing the complementarity between private and public financing. Further, again according
to Howell (2017), the effectiveness of the program has been largely due to the reduction in uncertainty
associated with Phase I, which allowed companies to undertake ex-ante more research on the viability of
their idea and better define their business project through a small grant.
Finland
The history dates back to 1967, when the Bank of Finland became the main shareholder of the first Finnish
VC fund named Sponsor, which was followed in the same year by another government-started fund called
SITRA. The initial public stimulus did not achieve its objectives and hence the government implemented
several complementary measures:
It allowed the adoption of the Limited Partnership legal status, which attracted foreign investors
(Luukkonen, 2006; Owen and Mason, 2019).
It established catalyzing centers linked to North America and Asia, and created programs aimed at
assisting entrepreneurs in evaluating the value and readiness of their projects.
It enacted an accelerator program called Vigo designed to bridge the gap between early stage
innovative firms and international finance (WEF, 2014), and promoted the merge of three
universities in the Helsinki area in order to create the Aalto University as an hub of innovation and
entrepreneurial culture
It developed the the Nasdaq First North Growth Market, explicitly designed for small growing
companies, allowed a viable exit strategy for venture capital investors.
It established a new fund backed by Tekes, the Finnish Funding Agency for Technology and
Innovation, with the goal of assisting start-ups and invest together with foreign venture capitalists
(Owen and Mason, 2019).

47
Annex D. Crowdfunding and Blockchain
technologies: a complementary source of finance
for start-ups?
Opposite to venture capital, crowdfunding consists in the commitment of a small amount of money by a
large group of financially unsophisticated individuals via the use of open on-line platforms. Platforms
provide the infrastructure for the transaction, leading therefore to complete financial disintermediation of
investment (Schwienbacher and Larralde, 2012; Belleflamme et al., 2014; OECD, 2015a). In addition to
financing undertaken by not-for-profits organisations (i.e., the patronage model), crowdfunding
arrangements can take three forms. First, the reward-based model, according to which investors receive
a reward for their commitment either in the form of donation or of preferential access to and prices for the
new product. Second, the lending model, which resembles pee-to-peer lending: investors receive just a
promise of repayment after a predefined period of time of the capital loaned plus some interests. Third, the
equity model, in which investors receive a share of the company and become effectively shareholders.
Specific legal frameworks have been developed to support the equity model, an example being the 2012
Jumpstart Our Business Startups Act (JOBS Act), which allows entrepreneurs and small business owners
to sell limited amount of equity in their companies to a large number of investors and companies not to
disclose financial statements if they have less than 1000 shareholders.
The rate of success of these initiatives, as well as the procedures that help entrepreneurs raising money
for their projects and the best crowdfunding model to finance innovation, are not yet fully investigated.
However, there is preliminary evidence on specific characteristics the legal framework and involved firms
should have to increase the probability of success. Hornuf and Schwienbacher (2017) show that a too
strong investment protection (i.e., restrictive exemptions to costly prospectus drafting and high registration
requirements) reduces the amount of money raised. Mollick (2014) finds that crowdfunding platforms
manage to consistently reduce information asymmetries. With respect to companies exploiting the
crowdfunding equity model, Ahlers et al. (2015) suggest that retaining equity and disclosing information
about the business model to the “crowd” is interpreted as a positive signal. More generally, Agrawal et al.
(2011) find that, even though crowd-funders may be geographically dispersed, geographical proximity still
plays a relevant role as local investors tend to participate at earlier stages.
Blockchain technologies also have the potential to play a role in firm funding in the future, though both their
uses and the study of such uses are in early stages. O’Dair and Owen (2019) suggest that Blockchain is
being used by many new music ventures as a means of raising capital through crowdfunding in various
ways. One common method is using Blockchain to issue and sell “tokens’’ (cryptocurrency), some of which
can be used for services or community participation, and others which have no utility beyond showing fan
engagement with the company or artist (Sehra et al., 2017). The certification by independent online
analysts can both lead to successful initial tokens sales, and predict long-run token performance in the
secondary market, an expression of the “wisdom of the crowds” (Lee et al., 2018). These examples show
that Blockchain is already being used to loosen financial constraints for entrepreneurs through
crowdfunding and independent certification, and to enable ventures that would not otherwise have formed.