Bribery and corruption: their relationships with re
169
BIROn - Birkbeck Institutional Research Online Enabling Open Access to Birkbeck’s Research Degree output Bribery and corruption: their relationships with re- source constraints, innovation and OFDI https://eprints.bbk.ac.uk/id/eprint/45853/ Version: Full Version Citation: Zhong, Chong (2021) Bribery and corruption: their relation- ships with resource constraints, innovation and OFDI. [Thesis] (Unpub- lished) c 2020 The Author(s) All material available through BIROn is protected by intellectual property law, including copy- right law. Any use made of the contents should comply with the relevant law. Deposit Guide Contact: email
-
Upload
khangminh22 -
Category
Documents
-
view
0 -
download
0
Transcript of Bribery and corruption: their relationships with re

BIROn - Birkbeck Institutional Research Online
Enabling Open Access to Birkbeck’s Research Degree output
Bribery and corruption: their relationships with re-source constraints, innovation and OFDI
https://eprints.bbk.ac.uk/id/eprint/45853/
Version: Full Version
Citation: Zhong, Chong (2021) Bribery and corruption: their relation-ships with resource constraints, innovation and OFDI. [Thesis] (Unpub-lished)
c© 2020 The Author(s)
All material available through BIROn is protected by intellectual property law, including copy-right law.Any use made of the contents should comply with the relevant law.
Deposit GuideContact: email

BRIBERYAND CORRUPTION:
THEIR RELATIONSHIPS WITH RESOURCE CONSTRAINTS, INNOVATION
AND OFDI
By
Chong ZHONG
Being
Thesis submitted in partial fulfillment for the award of Doctor of Philosophy (PhD)
Degree in Management
At
The Department of Management, School of Business, Economics, and Informatics (BEI),
Birkbeck, University of London
Supervisor(s):
Principal: Professor Xiaming LIU
(Birkbeck, University of London, UK)
Secondary: Professor Jue WANG
(Southwestern University of Finance and Economics, China)
MARCH 2021

i
DELARATION
I hereby certify that this thesis is my original work. It has neither been previously
accepted for the award of any degree nor being concurrently submitted for any other
degree.
Chong ZHONG
MARCH 2021

ii
ACKNOWLEDGEMENTS
Undertaking the PhD program has been an amazing life experience for me. It would not be
possible to complete this journey without the guidance and support from many people.
I would like to first give special thanks to my supervisor Prof. Xiaming Liu for the invaluable
professional and personal support he has given me. Without his guidance and encouragement,
this thesis would not have been completed in time.
Many thanks to Prof. Jue Wang, my supervisor at Southwestern University of Finance and
Economics (SWUFE) in China, for accepting my PhD application and then changing my life
direction when I was at the lowest point in my 20s.
I am grateful for the funding received through the China Scholarship Council (CSC) and
Birkbeck-SWUFE PhD Scholar’s Award.
I also thank Dr. Gang Wu, for his generous share of data about OFDI from China. Thanks to
Dr. Bo Peng and Dr. Fredrick Guy for their suggestions in annual reviews, and all the fellows
in our PhD group for their support and encouragement.
I am also very grateful to all those at the Graduate Office in Business, Economics and
Informatics (BEI), especially Ms. Zoe Woodroffe who was always helpful.
I would also like to say a heartfelt thank you to all my family members, especially my late
grandfather, Prof. Yuquan Zhong. My thoughts of him inspired me to start this journey in the
first place.

iii
TABLE OF CONTENTS
DELARATION.......................................................................................................................................................... i
ACKNOWLEDGEMENTS......................................................................................................................................ii
TABLE OF CONTENTS.........................................................................................................................................iii
LIST OF TABLES.................................................................................................................................................... vLIST OF FIGURES................................................................................................................................................. vi
CHAPTER ONE Introduction.................................................................................................................................. 1
1.1 Background of the Thesis...............................................................................................................................1
1.2 Research Questions of the Thesis...................................................................................................................2
1.3 Theories in the Thesis.....................................................................................................................................4
1.4 Linkage and Summary of the Thesis..............................................................................................................71.5 Research Methodology.................................................................................................................................10
1.5.1 Philosophical Underpinning................................................................................................................. 10
1.5.2 (Post-) positivism, Falsification and Deduction................................................................................... 11
1.5.3 Methodology and Method.................................................................................................................... 13
1.6 Potential Contributions of the Thesis........................................................................................................... 16
1.7 Organization of the Thesis........................................................................................................................... 18Reference............................................................................................................................................................19
CHAPTER TWO Power Imbalance and Supply-side Bribery: A Resource Dependence Explanation..................20
Abstract.............................................................................................................................................................. 20
2.1 Introduction.................................................................................................................................................. 21
2.2 Theory and Hypotheses................................................................................................................................24
2.2.1 Power Imbalance and Resource Constraints........................................................................................ 242.2.2 Managerial Discretion and Bribery...................................................................................................... 26
2.3 Method......................................................................................................................................................... 35
2.3.1 Assumption...........................................................................................................................................35
2.3.2 Sample.................................................................................................................................................. 36
2.3.3 Variables............................................................................................................................................... 38
2.4 Analysis and Results.................................................................................................................................... 422.4.1 Results.................................................................................................................................................. 42
2.4.2 Robustness Check and Additional Analyses........................................................................................ 48
2.5 Discussion and Conclusion.......................................................................................................................... 53
2.5.1 Theoretical Contributions.....................................................................................................................54
2.5.2 Practical Implications........................................................................................................................... 57
2.5.3 Limitations and Future Research Directions........................................................................................ 57Reference............................................................................................................................................................59
CHAPTER THREE Innovative Strategy and Illegal Behavior in Emerging Economies.......................................67
Abstract.............................................................................................................................................................. 67
3.1 Introduction.................................................................................................................................................. 68
3.2 Theory and Hypotheses................................................................................................................................72
3.2.1 The Cycle of Previous Strategies, Negative Feedback and Behavioral Changes.................................72
iv
3.2.2 How to Anticipate the Feedback of a Strategy? The Role of Environment......................................... 73
3.2.3 R&D Investment and Bribery in Emerging Economies....................................................................... 75
3.2.4 The Moderating Role of Learning........................................................................................................78
3.2.5 Alternative Mechanism: The Lens through General Strain Theory..................................................... 79
3.3 Method......................................................................................................................................................... 843.3.1 Sample.................................................................................................................................................. 84
3.3.2 Variables and Measurement..................................................................................................................84
3.4 Analysis and Results.................................................................................................................................... 87
3.4.1 Results.................................................................................................................................................. 87
3.4.2 Robustness Check and Additional Analyses........................................................................................ 93
3.5 Discussion and Conclusion........................................................................................................................ 1023.5.1 Theoretical Contribution.................................................................................................................... 102
3.5.2 Practical Implications......................................................................................................................... 104
3.5.3 Limitations and Future Research Directions...................................................................................... 105
Reference..........................................................................................................................................................106
CHAPTER FOUR China’s Anticorruption Campaign and OFDI:An Integrated View of Institutional Complexity
and Dynamics........................................................................................................................................................112Abstract............................................................................................................................................................ 112
4.1 Introduction................................................................................................................................................ 113
4.2 Theory and Hypotheses.............................................................................................................................. 116
4.2.1 Institutional Complexity behind OFDI Decision in China.................................................................116
4.2.2 Anticorruption Campaign and Institutional Dynamics.......................................................................119
4.2.3 POEs’ Response to the Anticorruption Campaign..............................................................................1224.2.4 The Mechanism of the Anticorruption Campaign..............................................................................125
4.3 Method....................................................................................................................................................... 129
4.3.1 Data.................................................................................................................................................... 129
4.3.2 Empirical Model.................................................................................................................................132
4.4 Analysis and Results.................................................................................................................................. 133
4.4.1 Main results........................................................................................................................................ 1334.4.2 Validity of DID...................................................................................................................................134
4.4.3 Other Robustness Checks...................................................................................................................140
4.4.4 Mechanism Test: Triple Differences...................................................................................................142
4.5 Discussion and Conclusion........................................................................................................................ 145
4.5.1 Theoretical Contributions...................................................................................................................145
4.5.2 Practical Implications......................................................................................................................... 1474.5.3 Limitations and Future Research Directions...................................................................................... 147
Reference..........................................................................................................................................................149
CHAPTER FIVE Discussion and Conclusion......................................................................................................154
5.1 Conclusions................................................................................................................................................ 154
5.2 Theoretical Contributions...........................................................................................................................156
5.3 Practical Implications.................................................................................................................................1585.4 Limitations and Future Research Directions..............................................................................................160
v
LIST OF TABLES
Table 1.1 ................................................................................................................................................................6
Table 1.2................................................................................................................................................................15
Table 1.3................................................................................................................................................................16Table 2.1................................................................................................................................................................39
Table 2.2................................................................................................................................................................43
Table 2.3................................................................................................................................................................44
Table 2.4................................................................................................................................................................50
Table 2.5................................................................................................................................................................53
Table 3.1................................................................................................................................................................88Table 3.2................................................................................................................................................................89
Table 3.3................................................................................................................................................................94
Table 3.4................................................................................................................................................................96
Table 3.5................................................................................................................................................................98
Table 3.6................................................................................................................................................................99
Table 3.7..............................................................................................................................................................101Table 4.1..............................................................................................................................................................131
Table 4.2..............................................................................................................................................................134
Table 4.3..............................................................................................................................................................138
Table 4.4..............................................................................................................................................................141
Table 4.5..............................................................................................................................................................142
Table 4.6..............................................................................................................................................................144Table 5.1..............................................................................................................................................................155

vi
LIST OF FIGURES
Figure 1.1................................................................................................................................................................ 9
Figure 1.2.............................................................................................................................................................. 10
Figure 2.1.............................................................................................................................................................. 35Figure 2.2.............................................................................................................................................................. 46
Figure 2.3.............................................................................................................................................................. 47
Figure 3.1.............................................................................................................................................................. 83
Figure 3.2.............................................................................................................................................................. 91
Figure 3.3.............................................................................................................................................................. 92
Figure 3.4.............................................................................................................................................................. 92Figure 4.1............................................................................................................................................................ 135
Figure 4.2............................................................................................................................................................ 137
Figure 4.3............................................................................................................................................................ 139

1
CHAPTER ONE
Introduction
1.1 Background of the Thesis
The historical and geographical pervasiveness of bribery and corruption has generated a lot of
interest in their determinants, consequences, and how to control them (see reviews in Bahoo,
Alon, and Paltrinieri, 2020; Cuervo-Cazurra, 2016). The widely acknowledged definition of
corruption is “the misuse of public power” (Svensson, 2005), whereas it can be analyzed from
either the “demand-side” (receive bribes) or the “supply-side” (give bribes). On the
supply-side, bribery will be seen as the non-market strategy to solve problems, while on the
demand-side, most literature explores the influence of corrupt environment on firms’ behavior
or performance. Therefore, the analysis of bribery and corruption refers to two aspects: firms’
strategy of bribery and environment of corruption.
Traditionally, bribery is viewed as an unethical behavior since it is used to pursue private
advantages over public benefits. Scholars believe that corruption is a kind of issue that should
be eliminated completely since it erodes fairness and justice, and lowers economic growth
(Mauro, 1995). However, from firms’ perspective, the function of bribery is complex. Some
researchers take a more pragmatist viewpoint about bribery, arguing that bribery experience is
a kind of competitive advantage in a corrupt country (Cuervo-Cazurra and Genc, 2008), or a
tool to reduce transaction costs and facilitate operation (Krammer, 2019). The debate about
whether corruption “sands the wheel” or “greases the wheel” continues, but the motivation of
taking bribes as a strategy has not been explored enough, especially when the related factors

2
from different layers are a lot. On the other side, although the extant literature views the
corrupt environment as detrimental for firms or the economy as a whole, how the corrupt
environment will influence firms’ specific strategies has received little attention.
1.2 Research Questions of the Thesis
As explained above, bribery is a non-market strategy used by a firm to solve problems.
However, it is unclear how this strategy interacts with its business environment where
government can play an active role in business and where corruption can be pervasive, and
how this interaction is related to the firm’s other strategies such as innovation and outward
foreign direct investment (OFDI). As a result, my general research question is: what are the
relationships between a firm’s strategies such as bribery, innovation and OFDI and its
business environment such as government behavior and corruption? Given my focus, this
grand research question can be divided into the following three specific questions:
1. How does a specific actor (i.e. government) in the environment influence firms’ decision to
bribe; in other words, why do firms take bribery as a non-market strategy when government
imposes constraints on firms?
2. How does firms’ strategy (innovation) trigger bribery as a problemistic search under a
specific environment (e.g., an emerging market)?
3. How does the change of corrupt level in the environment influence firms’ strategy (OFDI)?
First, most studies of supply-side bribery undertake an assumption that managers are forced
or at least reluctant to pay bribes to government officials who have the discretion to deal with
some problems firms concern. However, this assumption may not always be correct, and

3
firms may volunteer to do so. Besides, other studies about managers’ incentives to offer a
bribe by focusing on specific benefits firms can derive from bribery, such as obtaining
government contracts or gaining advantages over competitors, while I try to discuss a more
generalized situation referring to the asymmetric power relationship between firms and
government. I would like to study whether bribery can be used as a non-market strategy by
managers to counterbalance their power relationship with governments, especially when other
legal political ways cannot be utilized. In other words, I attempt to discuss a baseline
relationship between firms and government in paper 1 (Chapter 2).
Second, the relationship between innovation and bribery has drawn scholars’ attention
recently, whereas the empirical evidence is not consistent with what we observe in reality. On
the one hand, corruption impedes innovation since it discourages constructive investments.
On the other hand, the related literature reveals that the introduction of new products in
developing countries will cause more bribes since innovative firms are vulnerable (Krammer,
2019). These two arguments together suggest that the innovation ranking of a nation can be
improved if it is stuck in a corrupt situation. But the reality is reverse for some emerging
economies such as China, Vietnam, and Thailand. I try to solve this puzzle in paper 2
(Chapter 3).
Third, although the corruption of a nation changes over time, few studies pay attention to the
effect of corruption control. In the limited literature, the focus is on anticorruption laws of
developed countries, while the endeavor of combating corruption from the developing world
receives less attention. In the international business (IB) area, studies have proven that less

4
corrupt countries will attract more FDI, but the effect of anticorruption on OFDI has not been
explored yet. In paper 3 (Chapter 4), I use a recent anticorruption campaign in China to
examine its influence on private-owned enterprises (POEs)’ OFDI decisions.
1.3 Theories in the Thesis
In this thesis, I go beyond traditional research that provides a consistent theoretical framework
throughout. Instead, I study the topic of bribery and corruption from a multi-perspective and
extend not only my understanding of the topic itself but also my understanding of related
theories by analyzing bribery and corruption (see Table 1.1). In paper 1 (Chapter 2), I use
resource dependence theory to discuss how a specific actor (government) influences firms’
strategy to bribe. Based on the sociological perspective, resource dependence theory provides
a theoretical framework about how the context influences organizational behavior. The
context can be analyzed in a specific way, which is suitable to answer question 1: how does a
specific actor (i.e. government) in the environment influence firms’ decision to bribe, as it is
one of the leading and well-equipped theories that have discussed the basic relationship
between firms and government regarding the power relations (Cuervo-Cazurra, 2016). In turn,
through linking the legal and illegal non-market strategy, I extend the application of resource
dependence theory from explaining corporate political activities to illegal actions such as
bribery. In paper 2 (Chapter 3), I capture a recent research trend that firms tend to view
bribery as a problemistic search to deal with negative feedback (Mishina et al., 2010; Xu,
Zhou, and Du, 2019) to answer research question 2: how does firms’ strategy (innovation)
trigger bribery as a problemistic search under a specific environment (emerging markets). The

5
behavioral theory of the firm emphasizes that the environment condition is a critical factor
that will influence firms’ decision-making with an examination of the internal operation of the
firm. Different from question 1, I look into the relationship between two strategies
(innovation and bribery) considering the influence of environment (emerging markets) as a
holistic context, and how the environment affects firms’ internal decision processes. The
behavioral theory of the firm is not a traditional theory to understand bribery or corruption
embedded in the relationship between firms and government like paper 1. However, it is
instrumental to understand bribery from the perspective of the firm when the assumption that
firms are rational and act according to the measurement of costs is relaxed. On the other hand,
by extending the definition of negative feedback and borrowing ideas from the general strain
theory in sociology, I attempt to improve the theoretical argument of the behavior theory of
the firm. Finally, I discuss the topic of corruption control in paper 3 (Chapter 4) by using a
widely used theoretical scaffold – institutional theory to answer question 3: how does a
specific factor (corrupt change) in the environment influence firms’ strategy (OFDI).
Institutional theory is quite popular to examine how firms adapt to the environment for
legitimacy or efficiency to survive or prosper. In this paper, I would like to use institutional
theory to investigate how the change of corrupt level in the environment will influence the
firms’ internationalized strategy (i.e. OFDI). I explicitly differentiate between the two sources
of institutional theory from the sociological and economic point of view, and then integrate
them under a unified theoretical framework of institutional dynamics and institutional
complexity.

6
Table 1.1
Theories and their Applications in the Thesis表格 0.1
Chapter Theory Founders and ProponentsDisciplinary
BasisCore Logic Central Argument Application to Bribery Analysis
Chapter 2ResourceDependence
Theory
Pfeffer and Salancik, 1978 Sociology PowerResource constraints impose apower imbalance between parties.
Firms supply bribes to counterbalance theirinferior position with a government which
controls critical resources firms need.
Chapter 3
Behavior
Theory of
the Firm
Cyert and March, 1968 EconomicsBounded
Rationality
Firms take strategies with bounded
rationality caused by information
asymmetry and individual
preferences.
Firms use bribery as the problemistic
search to deal with the anticipated negative
feedback of a previous strategy.
Chapter 4Institutional
Theory
North, 1990 Economics EfficiencyInstitutional arrangements increase
or decrease transaction costs.
Decreasing domestic transaction costs, the
anticorruption campaign slows down OFDI
driven by institutional escapism under the
circumstance that the “go global” policy
promotes OFDI.
DiMaggio and Powell,
1983; Scott, 1995; Oliver,1991
Sociology Legitimacy
Individuals will behave
isomorphically to gain legitimacyunder institutional pressure.

7
1.4 Linkage and Summary of the Thesis
Since I try to explore the relationships between a firm’s strategies (i.e. bribery, innovation and
OFDI) and its business environment (i.e. government behavior and corruption) from
multi-facets, the three papers aiming to answer three specific questions outlined in section 1.2
are linked by three levels of bribery/corruption data: individual-level, firm-level and
provincial level as shown in Figure 1.1.
Paper 1: The determinants of bribery from the perspective of a firm as the supply-side; and its
relationship with corporate political activities such as lobbies and political ties are proven by
the individual-level data from World Value Survey.
In paper 1 (Chapter 2), I adopt a resource dependence perspective to explore the supply-side
bribery, arguing that managers are motivated to use illegal non-market strategies to
counterbalance their position confronting resource constraints imposed by government.
However, if the channel of legal tactics is at play, the positive relationship between resource
constraints and bribery will be mitigated since firms can use legal non-market strategies to
achieve the same goals. What kind of strategy will be taken is determined by resource slack
firms have.
Paper 2: Bribery as a firm’s problemistic search under the pressure of anticipated negative
performance, and its relationship with innovation in developing countries supported by the
data of firm-level from World Bank Enterprises Survey.
In paper 2 (Chapter 3), I find that investing in R&D will result in bribery in developing
countries where unfavorable factors diminish expected returns. It confirms that the

8
discrepancy between the expectation of innovation and the estimation of its actual
achievement is a source of illegal behavior. However, a firm’s experience of R&D output will
mitigate its tendency to bribe since it has accumulated relevant knowledge. In addition, to
extend the boundary of the behavior theory of a firm (BTOF), I borrow ideas from the general
strain theory (GST) in sociology, which identifies two other mechanisms of illegal behavior of
organizations: the discrepancy between aspirations and expectations; and the discrepancy
between fair outcomes and unfair outcomes.
Paper 3: The influence of combating corruption in the home country on a firm’s OFDI
decision. Anticorruption data are from the provincial level.
In paper 3 (Chapter 4), I argue that while institutional support promotes aggregate OFDI from
China, the recent anticorruption campaign negatively affects private enterprises’ OFDI as it
mitigates the motivation of institutional escapism. The anticorruption campaign plays the role
in slowing down OFDI through decreasing domestic transaction costs by improving financing
efficiency and breaking down local protectionism. Based on the perspective from institutional
complexity and dynamics, I explore how a change in one facet of institutions influences joint
institutional forces and hence a firm’s OFDI decision.

9
Figure 1.1 Framework of the Thesis
图 1
Bribery Corruption
Innovation
OFDIFinancial development
Local protectionism
Aspirational strain
Unfair strain
Regulative efficiency
Political rights
Firms’ strategies Environment characters
Individual level
Firm level
Provincial level
Empirical levelChapter
2RDT
4IT
3BTOF
Questions
How a specific actor(government) in theenvironment influencefirms’ decision to bribe.
How a specific factor(corrupt level) in theenvironment influencefirms’ specific strategy
(OFDI)
How a firms’ strategy(innovation) trigger bribe
under a specificenvironment (emerging
markets).direct effect
moderate effect

10
1.5 Research Methodology
As this thesis incorporates three papers with a format suitable for publication in peer review
journals, each of the papers includes a method section which shows details of the empirical
techniques in terms of data collection, analysis, and results. Here, I present the fundamental
philosophical/theoretical underpinning of the methods, as well as the summary of all the
specific techniques used in this thesis. The procedure of discussion follows the Figure 1.1.
Figure 1.2
Four Elements of Research Methodology
图 0- 2
1.5.1 Philosophical Underpinning
The philosophical underpinning of methods is an overall guidance of research that determines
how research problems can be solved and whether research objectives can be achieved. The
research design, including data source, data collection, data analysis, and data interpretation,
is fundamentally predetermined by researchers’ assumption about their attitude towards the
world, and in what way they explore the world (O'leary, 2004). In other words, ontology
related to the nature of reality or being, and epistemology concerning how the reality can be

11
uncovered, jointly decide the specific approach used in research. If someone believes that
reality or knowledge exists outside human consciousness, such researchers hold the realist
ontology, and normally epistemology of objectivism in which the reality can be investigated
through objective procedures will be adopted. On the other hand, if someone thinks that there
is no objective truth or object does not make any contribution to the generation of meaning,
the epistemological assumption about how to do research may follow the guidance of
constructivism or subjectivism (Crotty, 1998). Thus, the specific methodology I chose will be
largely influenced by my ontological assumption about what is and the epistemology
assumption about how we know what we know.
1.5.2 (Post-) positivism, Falsification and Deduction
Based on different philosophical underpinnings, theoretical perspectives behind the specific
research approach can be categorized into (post-) positivism, constructivism, interpretivism,
postmodernism, and so on. In this research, I adopt the perspective of (post-) positivism that
offers “unambiguous and accurate knowledge of the world” (Crotty, 1998: 18) since I believe
that bribery is an objective phenomenon that can be studied through proper scientific
procedures. Following the requirements of (post-) positivism, two points toned to be
emphasized: 1) social facts, 2) value-free.
First, in chapter 2, I measure managers’ justification about bribery in scores, whereas
managers’ perception or attitude towards an ethical issue is normally considered to be
subjective. Why can I measure a subjective answer with objective scores, and then these
scores represent a reality of a nation? It refers to a concept called social facts. Durkheim

12
(1982) defined social facts as ways of acting, thinking, and feeling that transcend the
individual, and thus exist independently apart from people’s consciousness. Social values,
cultural norms, and ethical issues are collectively objective realities and should be researched
empirically. Consistent with this argument, I can measure the level of bribery perception in a
nation by asking people’s subjective feelings about the justification of bribery as long as the
sampling is representative according to the statistical principle. In chapter 3, the
measurements of aspirational strain and unfair strain of a nation are based on the same
theoretical perspective.
Second, I take a neutral position to the possibility that firms take bribery as a strategy.
According to (post-) positivism, the meaning of reality can only be explained or discovered
rather than created as not only the nature of being is objective, but also the way we know
things is value-neutral. Guba and Lincoln (1994: 108) state that “a ‘real’ reality is assumed,
the posture of the knower must be one of objective detachment or value freedom to be able to
discover ‘how things really are’ and ‘how things really work’”. Even though researchers will
inevitably put personal judgment on theoretical assumptions or interpretations of results, we
need to be aware of this issue that is not advocated under the guidance of (post-) positivism
and should try to avoid it as far as possible.
During the development of positivism, how we know the knowledge and meaning has been
evolved from verification to falsification. Wittgenstein proposes that there is no knowledge or
meaning unless it can be verified by experience through our senses. This notion called
“verification” was embraced by the Vienna Circle at the first beginning but challenged by

13
some scientists who met the opposite situation in natural science. From a positivist point of
view, statements cannot be accepted as facts or meaningful unless the empirical observation
verified them. But in reality, many theories exist and are commonly accepted which have not
been directly observed or tested at all.
Popper (1934) then points out the weakness of verification and logical fault of induction that
no matter how numerous examples of corrections are given, we cannot confirm a certain
conclusion. Instead of providing empirical evidence of right, the key point of science is to
prove it wrong. Falsification believes that we can only accept a theory to some extent if a
theory cannot be rejected empirically. Therefore, the standard procedures of deduction are
widely used in the current academic field, and are followed by all three papers in this thesis as
well: 1) proposing a theory; 2) giving hypothesis from the theory; 3) testing hypothesis by
empirical data, and trying to prove it wrong. I prefer to accept the notion of falsification and
logic of deduction since “this is a less arrogant form of positivism. It is one that talks of
probability rather than certainty, claims a certain level of objectivity rather than absolute
objectivity, and seeks to approximate the truth rather than aspiring to grasp it in its totality or
essence (Crotty, 1998: 29)”.
1.5.3 Methodology and Method
From the view of (post-) positivism, quantitative methodologies in terms of survey research
and quasi-experimental research are suitable for the acquisition of knowledge, while whether
knowledge we obtain is accurate or not largely relies on research design. Table 1.2 provides
some indicators of “good research” based on the requirement of (post-) positivism.

14
This thesis aims to explore the relationship between a firm’s strategy and environment,
focusing on bribery and corruption. I conduct my research under a paradigm that stems from
positivism. Under this research paradigm, theories offer the basis of explanation and allow the
prediction of a particular relationship. Interpretation consists of establishing causal relations
between variables and linking them to a deductive theory (Collis and Hussey, 2009: Business
Research, p. 56). This research paradigm is appropriate as relevant theories have been
identified in 1.3 to address the three sub-research questions.
Following this philosophical framework that guides how scientific research should be
conducted, the appropriate methodologies include experimental studies, survey,
cross-sectional studies and longitudinal studies (Collis and Hussey, 2009: Business Research,
p. 74). As in the case of theory applications of this thesis, to address different research
questions different data and research methods are required.
In Chapter 2, in order to explore the question: how does a specific actor (i.e. government) in
the environment influence firms’ decision to bribe, I use the sample from World Value Survey
and utilized the appropriate data analysis method – Tobit regression, and instrumental
variables to deal with endogeneity issues. In Chapter 3, I use the sample World Bank
Enterprises Survey to explore the question: how does firms’ strategy (innovation) trigger
bribery as a problemistic search under a specific environment (e.g., an emerging market). The
shortcoming of these databases is that the questions are set in advance, and might not be the
same as the research questions I would explore. In Chapter 4, I use the full sample of Chinese
OFDI from the Ministry of Commence rather than subsamples such as information of listed

15
firms for similar reasons. But this choice of database sacrifices the analysis about the
firm-level heterogeneity. The validity of conclusions refers to the detailed methods and
techniques, which will be discussed in each paper.
Table 1.2
Indicators for “Good” Research, O'leary (2004)表格 0.2
Positivist Indicators Post-Positivist Indicators
Have subjectivities been managed?
Objectivity – conclusions based on observablephenomena; not influenced by emotions, personal
prejudices, or subjectivities
Neutrality – subjectivities recognized and negotiated ina manner that attempts to avoid biasing
results/conclusions
Subjectivity with transparency – acceptance anddisclosure of subjective positioning and how it might
impact on the research process, including conclusions
drawn
Are methods approached with consistency?
Reliability – concerned with internal consistency, i.e.whether data/results collected, measured, or
generated are the same under repeated trails
Dependability – accepted that reliability in studies of thesocial may not be possible, but attests that methods are
systematic, well-documented, and designed to account
for research subjectivities
Has “true essence” been captured?
Validity – concerned with truth value; i.e. whetherconclusions are “correct”. Also considers whether
methods, approached and techniques actually relate
to what is being explored
Authenticity – concerned with truth value whilerecognizing that multiple truths may exist. Also
concerned with describing the deep structure of
experience/phenomenon in a manner that is “true” to the
experience.
Are findings applicable outside the immediate frame of reference?
Generalizability – whether findings and/orconclusions from a sample, setting, or group are
directly applicable to a larger population, a different
setting, or to another group
Transferability – whether findings and/or conclusionsfrom a sample, setting, or group lead to lessons learned
that may be germane to a larger population, a different
setting, or to another group
Can the research be verified?
Reproducibility – concerned with whetherresults/conclusions would be supported if the same
methodology was used in a different study with the
Auditability – accepts the importance of the researchcontext and therefore seeks full explication of methods
to allow others to see how and why the researchers

16
same/similar context arrived at the conclusions
Source: O’Leary (2004). The essential guide to doing research. London: Sage, p(58).
Table 1.3 summarizes the specific techniques I used in this study. The additional analysis is
implemented to deal with the problem of endogeneity to ensure the soundness of my research
and make the outcomes convincing.
Table 1.3
The Analysis Methods in the Study表格 0.3
Chapter Data Source Time Type of Data Main Analysis Additional Analysis
Chapter 2
World Value Survey;
The Heritage Foundation;
The Freedom House
2010-
2014
Cross-sectional
dataTobit regression Instrumental Variables
Chapter 3
World Bank Enterprises
Survey;World Value Survey
2006-
2017
Cross-sectional
data
Logistic
regression
Propensity Score
Matching;Instrumental Variables
Chapter 4
Ministry of Commerce;
The Annual Report of
People’s Procuratorate
2008-
2015Panel data
Difference-in-
DifferenceTriple Differences
1.6 Potential Contributions of the Thesis
The thesis intends to make theoretical and practical contributions to the existing literature.
From the theoretical perspective, Chapter 2 relates firms’ motivation of bribery to their
imbalanced-power position to government, which has implied that the phenomenon of bribery
cannot be completely resolved as long as government still provides resources or services that
firms need. While this illegal, non-market strategy may be used to counterbalance firms’
power relationship with government, firms can also seek to change through legal, non-market
strategies such as lobby or corporate political activities if the democratic channel is at play.
17
Thus, based on resource dependence theory, I construct a theoretical framework to explain
firms’ non-market strategy no matter it is illegal or legal. In Chapter 3, I extend the definition
of negative feedback from the ex post actual outcomes to ex ante evaluation, and examine the
function of anticipated negative feedback of innovative strategy on the problemistic search of
bribery. In Chapter 4, I integrate the perspectives of institutional complexity and institutional
dynamics to explore how one facet of institutions change will influence firms’ OFDI
decisions under the circumstance of fragmented and contending institutional pressures. As for
the practical implications, the study has the potential to influence government policy of
anticorruption especially in emerging markets. For managers, bribery may be viewed as an
illegal but legitimate way to counterbalance inferior positions, seeking for problemistic search
or decreasing transaction cost in order to survive and prosper. Thus, the findings suggest that
policymakers should design policies or arrange institutions considering their relationships
with firms and markets more comprehensively to mitigate the tension which may result in
bribery unintentionally.
In all, the conclusions of three papers indicate that the external environment conditions will
influence firms’ decision to bribe, whether it is a direct effect (paper 1) or just as a context
(paper 2); the control of corruption in the environment, on the other hand, will also
profoundly influence firms’ other strategies such as OFDI (paper 3). More importantly, the
thesis shows that different theoretical underpinnings are required to analyse the topic of
bribery and corruption for different relationships and at different levels. This further proves
the complexity of the topic and confirms a need of broadening our vision and deepening our
18
thoughts about the interaction of a firm’s strategy (such as bribery, innovation and OFDI) and
its environment (such as government behavior and corruption).
1.7 Organization of the Thesis
The study is organized as follows: Chapter 1 introduces the background of the research, the
aims and summary of the three papers, methodology, and significance of this thesis. Chapters
2, 3, and 4 present three individual papers related to the topic of bribery and corruption
respectively, each of which includes an introduction, theoretical articulation, hypothesis
development, method, empirical results, and conclusion. Chapter 5 discusses the overall
findings, conclusions, and suggestions for further research.

19
Reference
Bahoo, S., Alon, I., & Paltrinieri, A. 2020. Corruption in international business: A review and
research agenda. International Business Review, 29(4): 101660.
Crotty, M. F. 1998. The foundations of social research: Meaning and perspective in the
research process: Sage.
Cuervo-Cazurra, A. 2016. Corruption in international business. Journal of World Business,
51(1): 35-49.
Cuervo-Cazurra, A. & Genc, M. 2008. Transforming disadvantages into advantages:
developing-country MNEs in the least developed countries. Journal of international
business studies, 39(6): 957-979.
Durkheim, E. 1982. Rules for the explanation of social facts, The rules of sociological method:
Springer.
Guba, E. G. & Lincoln, Y. S. 1994. Competing paradigms in qualitative research. Handbook
of qualitative research, 2(163-194): 105.
Krammer, S. M. 2019. Greasing the wheels of change: Bribery, institutions, and new product
introductions in emerging markets. Journal of Management, 45(5): 1889-1926.
Mauro, P. 1995. Corruption and growth. The quarterly journal of economics, 110(3): 681-712.
Mishina, Y., Dykes, B. J., Block, E. S., & Pollock, T. G. 2010. Why “good” firms do bad
things: The effects of high aspirations, high expectations, and prominence on the
incidence of corporate illegality. Academy of Management Journal, 53(4): 701-722.
O'leary, Z. 2004. The essential guide to doing research: Sage.
Popper, K. 1934. Scientific method. Popper selections, 133: 142.
Svensson, J. 2005. Eight questions about corruption. Journal of economic perspectives, 19(3):
19-42.
Xu, D., Zhou, K. Z., & Du, F. 2019. Deviant versus aspirational risk taking: The effects of
performance feedback on bribery expenditure and R&D intensity. Academy of
Management Journal, 62(4): 1226-1251.

20
CHAPTER TWO
Power Imbalance and Supply-side Bribery: A Resource Dependence Explanation
Abstract
The pervasiveness of bribery has generated much interest in its causes, and our current
understanding is limited to the demand side of corrupt government officials based on the logic
of the institutional theory. Different from the existing literature, this paper adopts a resource
dependence perspective to explore the supply side of bribery, arguing that managers are
motivated to use illegal non-market strategies to counterbalance their position confronting to
resource constraints. In addition, if the channel of legal tactics is at play, the positive
relationship between resource constraints and bribery will be mitigated. Specifically, utilizing
data from the World Value Survey covering 18,223 managers from 55 countries across 4 years,
I find that the regulatory efficiency of a nation has a negative effect on managers’ willingness
to justify bribery. Strong political rights of a nation strengthen the above negative relationship,
but this effect is less significant if managers work in the private sector. I intend to contribute
to the existing literature by offering a more subtle perspective that accounts for the possibility
that bribery can be an active strategy to overcome resource constraints imposed by power
imbalance.
21
2.1 Introduction
The determinants of bribery have long been studied in the disciplines of economics, political
sciences and sociology. In the field of management, to date, cross-national analysis has used
institutional theory almost exclusively (Cuervo-Cazurra, 2006; Spencer and Gomez, 2011; Yi,
Teng, and Meng, 2018). Following the logic of legitimacy, the existing research explicitly
postulates that organizations need to conform to social norms and legitimize their activities in
order to survive or adapt to the external pressure (DiMaggio and Powell, 1991). Therefore,
bribes will be paid reluctantly in countries with high corrupt levels (Cuervo-Cazurra, 2008;
Luo, 2005). In other words, in countries where there is a high demand by corrupt government
officials for bribes, firms respond by paying high bribes. However, this demand side approach
does not fully depict the motivations behind bribery (Lee and Weng, 2013; Martin et al.,
2007). In contrast to the bribery demanded by officials, the bribery initiated by business
managers has received little attention in the literature. A study of “supply-side” motivations
for bribery is important as it can reveal different theoretical mechanisms and practical
implications from the existing “demand side” approach.
In reality, the bribery initiated by firms is prevalent. For instance, Pfizer, a leading
multinational enterprise in the pharmaceutical industry, has been found to give bribes to
doctors to prescribe more drugs not only in China and Russia but also in the United States and
Europe over the period of a decade. Some well-known companies including Enron,
Volkswagen and HealthSouth were sanctioned for bribing officials in their home countries.
Moreover, empirical evidence reveals that prominent, high-performing firms are more likely

22
to engage into misconducts including bribery to maintain their expected performance or status,
regardless of whether they operate in the developed or developing countries (Jeong and Siegel,
2018; Krishnan and Kozhikode, 2015; Mishina et al., 2010). This indicates that it is a
universal phenomenon that bribes can be supplied purposefully by business managers, and it
can be used as a strategy to seek favors for firms. Despite prior research on consequences of
active bribery such as on export (Lee and Weng, 2013) or innovation (Krammer, 2019), the
determinants of “supply-side” bribery on cross-national analysis are less clear and have not
been uncovered by a consistent theory.
To explore this issue, I propose to use an alternative perspective, resource dependence theory
(RDT), to explain why managers may initiate bribery. RDT is an instrumental theoretical
scaffold to understand non-market strategies such as lobbying (Oliver, 1991; Suchman, 1995)
and political contributions (Holburn and Vanden Bergh, 2014). The core of RDT is that if A's
power over B comes from the resource dependence from B on A, then B will use various
strategies to balance their power relationship in order to get rid of the resource constraint
imposed by A (Pfeffer and Salancik, 2003). Following this logic, I argue that the power
imbalance between governments and firms will incentivize managers to counterbalance their
relationship by non-market ways, whether it is legal or illegal. Bribery initiated by managers
can be viewed as one kind of tactics that the power-disadvantaged party will take in order to
restructure their power position and acquire resources (Casciaro and Piskorski, 2005).
Different from the prevailing wisdom that institutional pressures will force one’s adaption to
the external environment, RDT emphasizes on the discretionary role of management, which

23
implies that managers’ active bribery can be viewed as their effort to manipulate the external
conditions (Baucus and Near, 1991; Luo, 2005; Meznar and Nigh, 1995; Schweitzer, Ordóñez,
and Douma, 2004; Spencer and Gomez, 2011).
To deepen our understanding of non-market strategies and incorporate illegal and legal
possibilities, I consider a key contingency: political rights. Political rights manifest the
feasibility of influencing government activities and acquiring resources through a political,
democratic channel. Integrating legal and illegal strategic considerations, I propose that
bribery is less likely to be chosen as a strategy when managers are able to alter their resource
dependency on government through a non-market but legal way. However, the choice
between the two types of non-market strategies is not widely discussed in the literature. Some
studies mentioned lightly that firms may be frequently involved in illicit, nontransparent
transfers than engaged in legal non-market strategies such as lobbying due to relatively higher
costs of the latter strategies (Birhanu, Gambardella, and Valentini, 2016). Thus, I further point
out that the moderating effect of political rights is less obvious for managers who work in the
private sector because of a lack of resource slack (Bourgeois III and Singh, 1983; Stan, Peng,
and Bruton, 2014).
I believe that my arguments and findings contribute to academic literature in several ways.
First, I develop an explanation of bribery from managers’ supply side that rounds out the
institutional perspective dominating in the relevant literature. Unlike prior research focusing
on officials’ demanding and viewing bribery as a reluctant action of managers, I offer a more
subtle perspective that accounts for the possibility that bribery can be an active strategy to

24
overcome resource constraints imposed by power imbalance. Second, I extend resource
dependence theory that has insofar been only applied to explain corporate political activities.
Specifically, I offer a new framework in which I can consider legal and illegal non-market
strategies simultaneously, and point out conditions upon which a particular type of strategy is
chosen. Third, in the empirical part, I argue that previous research has failed to measure
supply-side bribery by eliminating the effect from the demand-side. Utilizing individual-level
data to capture managers’ motivation to bribe, I manage to keep theoretical and empirical
consistency in this research.
2.2 Theory and Hypotheses
2.2.1 Power Imbalance and Resource Constraints
Bribery has been associated with government corruption in many studies (Ades and Di Tella,
1999; Djankov et al., 2002; Shleifer and Vishny, 1993; Treisman, 2007). In the field of
cross-national analysis, it is conventionally to acknowledge the concept that government
corrupt and misusing public authority leads to the prevalence of bribery (Cuervo-Cazurra,
2016). Government officials are more likely to demand bribes for their own benefits where
legal and judicial systems are underdeveloped. Hence, individuals and firms have to pay
grease in exchange for operational convenience (Krammer, 2019).
However, according to resource dependence theory, the problem does not always reside in one
side. It may be caused by the asymmetric interdependence embedded in the dynamic
relationships (Emerson, 1962; Jacobs, 1974; Pfeffer and Salancik, 2003). There are two
parties involved in bribery: bribee and briber. Insufficient studies on motivations of the

25
“supply-side” of bribery make the picture incomplete (Lee and Weng, 2013). From a firm’s
perspective, it is reasonable for a profitable organization to acquire resources with various
methods in the best interest of the firm and its shareholders. On the other hand, acting as the
gate keeper for access to some crucial resources in terms of government contracts, market
access permissions and industrial policies, government will intuitively become the target of
some firms and individuals (Hillman, Keim, and Schuler, 2004).
The relationship between firms and government is imbalanced or asymmetric. Specifically,
firms are sources of information for government to formulate public policies, and collect
revenues for government election and daily function. Government also relies on firms for
employment, technique innovation, economic growth and other national welfare (Shaffer,
1995). On the other hand, firms cannot be well operated without public utilities such as
electric power (Pfeffer and Salancik, 2003), licensing enacted by the authorities (Bertrand et
al., 2007), government contracts (Pfeffer, 1972), and industrial policies which can shape the
market profoundly (Holburn and Vanden Bergh, 2014). However, the interdependence
between these two entities is not in an equal position.
Pfeffer and Salancik (2003) indicate that the dependence from government to firms could be
categorized in the sphere of outcome interdependence and symbiotic relationship: the
achievement of the government relies on the performance of firms and both of them can be
better off or worse off simultaneously. Conversely, the dependence from firms to the
government may step into the definition of behavior interdependence and competitive
relationship. For instance, a trade policy such as deduction in tariff may benefit the holistic

26
welfare but damage some specific industries or firms in terms of relative competitive
disadvantage or insufficiency of resource endowment (Dunning, 1977); the bargaining power
of firms will diminish when the government is nearly the only buyer in the market for a
specific industry (e.g. defense industry). Thereby, the relationship between a government and
an individual firm is asymmetric rather than balanced since the two conditions of asymmetric
interdependence are met: first, the resources furnished by the government are crucial for
business operation from industrial policies to government purchasing; second, the discretion
over resources is concentrated on the government, and there are few alternatives or even no
substitutes within a nation (Emerson, 1962; Pfeffer and Salancik, 2003).
Previous studies suggest that the resource constraints imposed by the stronger party, such as
governmental power, cannot be solved by market strategies, but may be overcome by
non-market strategies such as lobbying (Oliver, 1991; Suchman, 1995) or political
contributions (Holburn and Vanden Bergh, 2014). Following this logic, I suspect that illegal
non-market strategies such as offering bribes in exchange for resources from government can
also be explained by a similar motivation (Lee and Weng, 2013; Martin et al., 2007; Spencer
and Gomez, 2011). Therefore, in this study, I propose that managers in a nation where
resource constraints are severely imposed by problematic dependence on government have a
greater tendency to bribe.
2.2.2 Managerial Discretion and Bribery
I argue that managers can modify or create an environment more favorable to firms given the
resource constraints imposed by the external pressure of government in the line with resource

27
dependence theory (Pfeffer and Salancik, 2003).
Managers in a less power-advantaged position and experiencing resource constraints imposed
by the imbalanced power face a high level of uncertainty. The more asymmetric dependence
between them, the higher motivation from the less powerful party to restructure the
dependency by engaging in constraint deconstruction with power-advantaged organizations to
reduce uncertainty (Casciaro and Piskorski, 2005). In this study, the relationship between a
government and individual firms is not equally important to each organizations, making the
dependence asymmetrically. Resource constraints imposed by the dominant power are more
likely to be mitigated through non-market actions (i.e. engaging in lobbying or corruption) in
the interest of firms (Husted, 1999; Schuler, Rehbein, and Cramer, 2002; Staw and
Szwajkowski, 1975). Consequently, the involvement in political activities (Hillman et al.,
2004) or even risky behavior such as bribing officials (Djankov et al., 2002; Lee and Weng,
2013) to decrease the imbalanced dependence on government may be seen as a strategic
choice to alter the external environment.
Compared to non-market but legal actions such as lobbying, bribery, in spite of the nature of
illegality, builds access to resources from a government prudently and timely, and gets rid of
free-riding problems stemming from the collective action theory (Hillman et al., 2004; Olson,
1965; Schuler, 1996). Some studies even claim that illicit strategies are more attractive than
legal, non-market strategies (Birhanu et al., 2016; Hellman, Jones, and Kaufmann, 2003). In a
nutshell, it is a managerial discretion that offering bribery to achieve the goals of management
such as economic efficiency of firms (Szwajkowski, 1985).

28
Regulatory efficiency as a reflection of government power
Government power can be reflected in many aspects as a government can act as a policy
maker (e.g. making policies) and a customer (e.g. purchasing products). But in the literature,
there is an overlooked, though fundamentally important, role of government as a supplier of
public services that could be viewed as a concrete reflection of government power. The speed
and quality of public services are determined by government. Government provides public
services often considering the holistic social welfare rather than only “client-orientated”. For
example, managers may think public services are valuable when the approval procedure is
efficient, while government may think it is necessary to take time to censor all potential
damages. Or when the procedure is unfairly delayed, managers are unable to solve the
problem since the governmental power has already predetermined the process.
As a benevolent social planner, taking time to give market access or permit license
applications through scrutiny is the responsibility of a government (Banerjee, 1997).
Government acts as a necessary external monitor to prevent market failure such as providing
unqualified goods or services for customers (Montiel, Husted, and Christmann, 2012).
However, the benefits emanating from a moderate regulatory process may be seen as a kind of
resource impediment from the perspective of managers. Bertrand et al. (2007) elaborate the
relationship between regulatory efficiency and bribery from an experiment about allocation of
drivers’ licenses in India. The result shows that the bureaucratic process will induce
individuals to pay direct bribes in order to acquire needed licenses or public resources
smoothly and efficiently. Olken and Barron (2009) conduct a survey about bribes paid by

29
truck drivers to government officials at checkpoints and weigh stations on the roads to and
from the Province of Aceh, Indonesia. The investigation reveals that illegal payments are
positively related to the number of regulatory processes, and the level of corruption is
determined by the elasticity of demand for public services. In other words, if a service is
necessary and basic, a driver has a strong incentive to supply a bribe. Djankov et al. (2002)
directly prove that the high intensity of entry regulation raises the level of corruption, and
paying bribes in exchange for release from the regulation is efficient. Looking into more
general regulations from receiving public services to paying taxes, the empirical results from
Svensson (1999) also support the above statements. Different from the proposition that “an
important reason why many of these permits and regulations exist is probably to give officials
the power to deny them and to collect bribes in return for providing the permit (Shleifer and
Vishny, 1993: 601)”, Banerjee (1997) illustrates that government bureaucracies are associated
with corruption even if the government is a welfare-oriented constituency.
Although the literature above articulates the relationship between regulations and corruption,
the assumption is limited within the officials’ requirement for bribes, totally ignoring
managers’ proactive motivations. Hence, I argue that the function of governmental regulations
can be viewed from the supply perspective: the heavier the regulations with respect to doing
business and the higher the inefficiency of providing public services especially for the basic
ones, the stronger the managers’ incentive to “get things done” and get rid of asymmetric
dependence through illegal bribery.
From the viewpoint of resource dependence theory, in brief, efficient provision of public
30
services is a crucial resource for business operation in a country. Since government is nearly
the only supplier of this kind of resources, the power imbalance between the government and
firms determines that bribery may be viewed as an attractive tool or strategy to speed up these
regulatory processes and overcome resource constraints (Lee and Weng, 2013; Martin et al.,
2007). The rationale is that firms that bribe are more likely to build or secure advantageous
positions in markets (Mishina et al., 2010), while firms that do not bribe may be less
advantaged facing market competition. I define regulatory efficiency as the speed of
regulatory process in terms of starting up and closing off business, and providing other public
services. I argue that heavy regulations of doing business will incentivize managers to “get
things done” and get rid of asymmetric dependence through illegal bribery.
Hypothesis 1: Regulatory efficiency of a nation has a negative effect on managers’
motivation to bribe.
Political rights as a moderator (two-way interaction)
Political rights manifest one aspect of political democracy of a nation in terms of creating a
channel for firms or individuals to restrict governmental power and mitigate asymmetric
dependence through multivariate political means such as lobbying and political contributions
in the non-market arena (Hillman et al., 2004; Shaffer, 1995). Pfeffer and Salancik (2003: 9)
believe that a strong democratic arrangement provides individuals with “viable political
power for expressing and realizing their desires for economic well-being”. As theoretically
proposed by Hillman and Hitt (1999) and empirically shown by Schuler et al. (2002), firms
actively engage in a variety of political tactics to build access to public policies and deal with

31
environmental uncertainty regarding government, especially when they are dependent much
on government regulations. Schuler (1996) also suggests that U.S. steel firms tend to
influence the government trade policy to impede foreign competitors’ access to the domestic
market access through legal petition filing and congressional testimony, and Bonardi (2004)
further points out that in many industries, using political strategies and seeking favorable
regulatory outcomes, firms manage to deregulate for their expansion and upregulate to
constrain rivals’ competition. Moreover, these legal non-market strategies improve firms’
performance both within domestic competition (Bonardi, Holburn, and Vanden Bergh, 2006)
and facing foreigners’ challenges (Marsh, 1998). However, there is an implicit prerequisite:
the channel of altering the political environment or changing government regulations in the
form of legitimacy does actually exist. In other words, non-market but legal strategies can
only be realized in a nation equipped with high-quality political rights, while a lack of
political rights amplifies the effect of regulatory inefficiency on managers’ willingness of
using illegal activities.
The moderating effect of democracy on the relationship between corruption and entry
regulations has already been noticed by Djankov et al. (2002), but hasn’t been articulated or
exemplified in the logic of power. Hence, I argue that the political rights of a nation may
moderate the influence of regulatory efficiency on managers’ willingness to engage in illegal
activities. Fortifying political rights will influence managers’ potential choice confronting
regulatory inefficiency, further reducing the attractiveness of bribery as a non-market strategy
or as the only way to alter the asymmetric dependence on government when governmental

32
regulations are inefficient.
It is important to note that the above analysis makes clear the availability of non-market
alternatives of altering dependence on government, but does not implies that there must be a
substitute relationship between legal and illegal strategies. On the contrary, they may
complement each other in some specific situations. Legal, non-market strategies are
expensive, time-consuming and full of risk of failure or free-rider problems (Olson, 1965),
but they can change the regulatory environment legitimately. On the other hand, illegal
activities can overcome the shortage of lobbying or political contributions, and solve
problems in a private, timely way while bearing the risk of exposure and accompanying
punishment. Regardless of ethical critiques, their ultimate purposes may be the same, but
managers’ potential choices may be contingent on the nature of specific circumstances or
issues (Getz, 1991). Mahon (1993) argues that several types of non-market behaviors may be
acted simultaneously to achieve policy goals. Similarly, Hillman and Hitt (1999) indicate that
an integration of a variety of political tactics is possible in order to pursue the same outcomes.
Therefore, I cannot assert that the good quality of political rights will directly decrease
managers’ willingness to justify bribery. Lacking legal channels to deal with the problematic
dependence on administration is a necessary but not sufficient condition for firms to use illicit
ways to build access to resources provided by governments. What is certain, however, is that
if the mechanisms of political rights of a nation are weak, managers’ willingness to justify
bribery will not decrease since the motivation to overcome regulatory inefficiency is still
there and there are no legal alternatives they can choose.

33
Hypothesis 2: Strong political rights of a nation strengthen the negative effect of regulatory
efficiency on managers’willingness to justify bribery.
Private sector as a moderator (three-way interaction)
The availability of resources may affect managers’ choice between legal and illegal activities,
and the resource slack is more important for implementing political non-market strategies
than bribery since the former requires a large quantity of resources both from internal
supports and external ties (Bourgeois III and Singh, 1983; Keim and Baysinger, 1988; Singh,
1986). Consecutive empirical papers have proven that hypothesis. Lenway and Rehbein (1991)
indicate that firms with higher return on assets are more likely to engage into corporate
political strategy. Meznar and Nigh (1995) and Schuler et al. (2002) further point out that
there is a positive relationship between size of companies and engagement of political
activities. Just as Pfeffer and Salancik (2003: 267) say, “only a few have enough resources
and scale to attempt to alter their contexts in a significant fashion”. Thus, the moderating
effect of political rights presenting the possibility to manipulate the environment through legal
non-market strategies might be less functional for managers who cannot have access to a large
quantity of resources.
In addition to the size or financial position of a firm, the nature of ownership has recently
been recognized as an important silent factor of decision-making (Okhmatovskiy, 2010; Zhou,
Gao, and Zhao, 2017). Accordingly, I suspect managers working in the private sector will be
less influenced by the moderating effect of political rights, since privately-owned enterprises
(POEs) pursue effective use of resources, and hence have less resource slack than state-owned

34
enterprises (SOEs) (Stan et al., 2014). SOEs are located predominantly in some emerging
economies such as China and Russia, and they control many crucial resources in specific
industries such as energy, transport and utilities. Such SOEs also exist in developed countries
as the wish of governments (Goldeng, Grünfeld, and Benito, 2008). These giant entities have
access to resources ranging from low-interest-rate loans (Song, Storesletten, and Zilibotti,
2011) to political ties (Okhmatovskiy, 2010). Conversely, POEs, especially those small and
medium ones, are in the inferior position in terms of financial resources (Beck,
Demirguc-Kunt, and Maksimovic, 2005) and innovation investment (Zhou et al., 2017). Even
in a nation with strong political rights, costly political strategies do not seem to be an
affordable choice for most managers working for POEs. Therefore, I propose that compared
to managers servicing in the public sector such as SOEs, managers who work in the private
sector are less likely to use political means empowered by political rights of a nation to
overcome the resource constraints imposed by governmental power.
Hypothesis 3: Working in the private sector mitigates the moderating effect of political rights
on the relationship between regulatory efficiency and managers’willingness to justify bribery.

35
Figure 2.1
Theoretical Framework
图 0- 1
2.3 Method
2.3.1 Assumption
Given the issue I focus on and the data I have collected, I am unable to identify the levels of
managers and industries where these managers operate. Hence, to be consistent with the
perspective of cross-national analysis, I assume that managers in a nation have a relatively
homogenous attitude towards unethical or even illegal activities under similar external
pressures (Jones, 1995). Thus, I employ organizational-level resource dependence theory to
develop hypotheses using both the country-level and individual-level constructs. This is
consistent with the existing analytical methods (Cullen, Parboteeah, and Hoegl, 2004;
McEvily, Sutcliffe, and Marcus, 1994), and this methodological approach is also my response
to the call for multilevel dependence research (Hillman, Withers, and Collins, 2009). In
addition, I agree that the justification of whether a manager is in a position of power is
superfluous (Szwajkowski, 1985). The definition here would not distinguish between top
managers and other levels of managers, because compared to employees the title of manager
has already been empowered by the right to supervise others and can reflect the attitude to

36
alter the environment in a discretionary, managerial way (Coleman, 1987; Szwajkowski,
1985).
2.3.2 Sample
The World Values Survey (WVS) has conducted regular surveys about individuals’ values
across almost 100 countries using a common questionnaire since 1981. Due to national
representativeness and consistent technical standards widely acknowledged by social
scientists, data from these surveys have been used in prior academic research (Bénabou,
Ticchi, and Vindigni, 2015; Cullen et al., 2004). The sample for current study stems from the
newest wave 6 covering 55 countries with 18,223 managers between 2010 and 2014. The
survey by its nature is a cross-sectional dataset. Compared to other data sources in the
research field of bribery or corruption, this survey data set has a few advantages for statistical
and theoretical soundness.
First, compared to other indices based on the respondents’ actual experience about corruption
and bribery, such as the World Business Environment Survey (WBES) from the World Bank,
data from the WVS mitigates the statistical bias caused by nonresponse and false response to
some extent. The WVS reports 2 items for nonresponse: no answer and don’t know answer.
The two items together consist of 0.85% only of the total number of respondents (157 out of
18,380), far less than other experience-based surveys. In regard to the problem of false
response, the question of bribery from WVS is embedded in a battery of
non-political-sensitive questions ranging from “will you justify avoiding a fare on public
transport” to “will you justify parents beating children”, mitigating the problem associated

37
with the self-defensive mechanism (Jensen, Li, and Rahman, 2010). The question about
justification of bribery is straightforward, intuitional, and does not need to recall any specific
experience or knowledge, avoiding the problems such as “inaccurate or selective memory,
fear of reprisals by authorities (Treisman, 2007)” and thus making the answer more reliable
(Carmines and Stimson, 1980). Meanwhile, the question about attitude rather than actual
engagement of bribery may not damage the personal reputation, making it more likely to
reflect the genuine beliefs (Azfar and Murrell, 2009). Theoretically, consistent with my
research question focused on the supply part of bribery, I argue that the bribery-related index
only from managers without the confounding factors from the demand part, i.e., government
officials, is more reasonable. Hence, the measurement from “to what extent are you willing to
justify someone accepting a bribe in the course of their duties” can more precisely describe
the target than the question such as “what percentage of total annual sales pay in informal
payments or gifts to public officials”, because the actual “price” of bribe has already been
“negotiated” by both parties.
Second, compared to other country-level perception indices, such as the Corruption
Perceptions Index (CPI) from the Transparency International (TI), the data from the
individual level can give us more space to construct and test hypotheses from a multilevel
perspective, overcoming the shortage of aggregate nature of country-level data (Svensson,
1999). In addition, the comprehensive index covers too many questions and themes, and
makes “skeptics wonder what exactly the average is measuring, and suggest that selecting
specific components to match the particular problem at hand makes more sense that using an

38
index (Treisman, 2007: 215)”. Moreover, Razafindrakoto and Roubaud (2010) prove that, in
terms of a topic about corruption or bribery, there is no significant correlation between what
experts, specialists or scholars estimated and what households or the public actually believed
or experienced across eight African countries. Absorbing opinions from western experts,
country-level perception indices may not be instrumental for this study. The WVS data
overcomes this shortage.
To test my hypotheses, I merge the datasets with the business freedom index from the
Heritage Foundation; associational and organizational rights index from the Freedom House;
and other country level indices, such as GDP growth, export and foreign direct investment
inflows from World Development Indicators from the World Bank. The final sample consists
of 18,223 managers across 55 economies for 4 years. Table 2.1 presents a brief summary of
the sample distribution by economies including 13 developed economies, 5 emerging
economies, and rest of them are developing economies spreading over America, Europe, Asia,
Africa and Oceania.
2.3.3 Variables
Dependent variable To measure managers’ willingness to see bribery as a strategy, I draw a
specific question reported in the WVS about managers’ justification of bribery in terms of
someone’s duties. The variable is measured on a ten-point Likert-type scale from response 1
“never justifiable” to 10 “always justifiable”.

39
Table 2.1
Sample Distribution
Country/Area Freq. Percent Country/Area Freq. Percent Country/Area Freq. Percent Country/Area Freq. Percent
Algeria 163 0.89 Germany 489 2.68 New Zealand 404 2.22 Sweden 366 2.01
Azerbaijan 180 0.99 Ghana 357 1.96 Nigeria 379 2.08 Thailand 371 2.04
Argentina 175 0.96 Hong Kong 391 2.15 Pakistan 250 1.37 Trinidad and Tobago 350 1.92
Australia 591 3.24 India 449 2.46 Peru 210 1.15 Tunisia 125 0.69
Bahrain 295 1.62 Japan 798 4.38 Philippines 273 1.50 Turkey 342 1.88
Armenia 259 1.42 Kazakhstan 236 1.30 Poland 154 0.85 Ukraine 294 1.61
Brazil 340 1.87 Jordan 249 1.37 Qatar 456 2.50 Egypt 174 0.95
Belarus 344 1.89 South Korea 270 1.48 Romania 323 1.77 United States 687 3.77
Chile 183 1.00 Kuwait 307 1.68 Russia 326 1.79 Uruguay 202 1.11
China 251 1.38 Kyrgyzstan 291 1.60 Rwanda 459 2.52 Yemen 89 0.49
Colombia 452 2.48 Lebanon 235 1.29 Singapore 683 3.75 Total 18,223 100
Cyprus 232 1.27 Malaysia 515 2.83 Slovenia 362 1.99
Ecuador 101 0.55 Mexico 394 2.16 South Africa 298 1.64
Estonia 638 3.50 Morocco 76 0.42 Zimbabwe 316 1.73
Georgia 205 1.12 Netherlands 643 3.53 Spain 221 1.21
表格 0.1

40
Independent variables
With a different perspective from previous studies (Yi et al., 2018), I argue that business
freedom derived from the Heritage Foundation is a proper index to measure regulatory
efficiency rather than institutional arrangement. According to the methodology published on
the Foundation’s official website, the quantitative score stems from an array of factors that
affect regulation efficiency based on 13 sub-factors in terms of starting a business, obtaining a
license, closing a business and getting electricity. None of them refers to counter-corruption
laws, enforceability of laws against bribery or any other ways which are seen as the root of
explanation ability of neo-institutional theory (Cuervo-Cazurra, 2016). Since the
measurement is about how many procedures and how much time and cost spent on the
regulatory process, it can be better seen as the opportunity cost of doing business in a nation.
In other words, it reflects the administrative efficiency of a government. The score of business
freedom is from 0 to 100, and a higher score indicates a more effective business environment.
In terms of robustness checks, I use cost, time and procedure of starting up a business to
substitute for the aggregate index of regulatory efficiency and reveal more details about this
relationship.
Moderators
Political Rights. The Freedom House publishes a series of indices yearly to indicate the
democratic situation of a country in many aspects from political rights to civil liberties. I
choose one sub-category index named “associational and organizational rights” as a proxy
index. It consists of 3 aspects: (1) is there freedom of assembly, demonstration, and open

41
public discussion; (2) is there freedom for nongovernmental organizations, including interest
groups, foundations, etc.; (3) is there effective collective bargaining; are there free
professional and other private organizations without government interference. The score of
this index is from 0 to 12, with a higher score indicating a stronger power of organizations
confronting to government.
Sector. This variable is coded as 1 if managers work in a private, profitable business or
industry. Working in any organization controlled or influenced by government such as a
public institution or state-ownership enterprise (SOE) is categorized as 0.
Control variables
Benchmark: competitive motivation. Previous research has proven that competitive motivation
is an important variable positively related to an individual’s attitude to bribery (McKendall
and Wagner III, 1999) or a firm’s incidence of illegal actions (Mishina et al., 2010). Therefore,
I control for the variable of competitive motivation reflected by a manager’s achievement and
materialism orientation. The first item is “being very successful is important to this person; to
have people recognize one’s achievement”. The second is “it is important to this person to be
rich; to have a lot of money and expensive things”. The scale is from 1: very much like me to
6: not at all like me. Scores are recoded so that a higher score means higher competitive
motivation.
Other control variables. As the hypotheses are from individual and national characters, I
control for a comprehensive series of variables from both individual-level and country-level. I
include demographic information of a manager such as age (continuous variable above 18

42
years old), gender (category variable 0 for male and 1 for female), marital status (binary
variable 1 for married or living together, and 0 for single, divorced, or widowed) and
educational level (The answer ranges from 1: “no formal education” to 9: “University-level
education, with degree”) from the WVS. At the country-level, GDP growth (annual growth
rate), export and foreign investment inflows (measured as the percentage of to GDP) are also
controlled for. I also partial-out the effect of time by controlling for the dummy variable of
years.
2.4 Analysis and Results
2.4.1 Results
Table 2.2 shows the means, standard deviations, and correlation matrix for all variables.
According to the sample distribution, the average age of managers is about 45 years old, most
of managers are men, married, and with some proper education. The variance inflation factor
(VIF) is calculated from 1.03 to 1.80, which is far below the criteria value of 10, confirming
that multicollinearity is not a major concern in my analysis.
Since about 70% of managers choose “never justifiable about bribery”, the dependent variable
is left censored at 1. Hence, I argue that an estimation of a Tobit model rather than OLS is
more appropriate, and this approach is consistent with previous research (Breen et al., 2017;
Wiersema and Bowen, 2009). The year effects of all the models are fixed by the respective
year dummy variables.

43
Table 2.2
Descriptive Statistics and Correlation Matrix表格 0.2
Variables Mean Std. Dev. 1 2 3 4 5 6 7 8 9 10 11
1 Bribery 1.88 1.83
2 Regulatory efficiency 74.37 16.20 -0.16*
3 Political rights 8.02 3.64 -0.08* 0.23*
4 Sector 0.64 0.48 0.02* 0.05* 0.14*
5 Age 45.18 15.70 -0.13* 0.18* 0.24* -0.14*
6 Gender 0.62 0.49 0.03* -0.05* -0.01 0.07* 0.04*
7 Marital 0.71 0.46 -0.02* 0.01 0.001 -0.02* 0.15* 0.10*
8 Education 6.51 2.25 -0.05* 0.17* 0.002 -0.16* -0.08* -0.07* -0.01
9 Competitive motivation 3.64 1.22 0.11* -0.26* -0.30* -0.02* -0.26* 0.08* -0.01 -0.04*
10 GDP 4.29 3.72 0.06* -0.22* -0.42* -0.08* -0.19* -0.03* -0.00 0.00 0.22*
11 Export 51.27 44.99 0.02* 0.35* -0.15* -0.03* -0.01 -0.06* -0.01 0.02* 0.01 -0.05*
12 FDI inflow 4.71 8.81 0.00 0.19* -0.07* -0.02* 0.04* -0.04* -0.02* 0.00 -0.08* -0.06* 0.57*
N=18,223. * shows significance at the 0.05 level.

44
Table 2.3
The Results from Tobit Regression
Variables Model 1 Model 2 Model 3
H1: Regulatory efficiency -0.035*** -0.000 0.010
(0.003) (0.007) (0.011)
H2: Regulatory efficiency × Political rights -0.004*** -0.006***
(0.001) (0.001)H3: Regulatory efficiency × Political rights × Sector 0.003*
(0.002)
Political rights -0.043*** 0.270*** 0.438***
(0.013) (0.059) (0.098)
Sector 0.376*** 0.346*** 1.654*
(0.091) (0.091) (0.966)Regulatory efficiency× Sector -0.015
(0.013)
Political rights × Sector -0.257**
(0.119)
Age -0.040*** -0.038*** -0.038***
(0.003) (0.003) (0.003)Gender 0.307*** 0.321*** 0.323***
(0.085) (0.085) (0.086)
Marital -0.023 -0.015 -0.008
(0.091) (0.091) (0.091)
Education -0.068*** -0.054*** -0.053***
(0.019) (0.019) (0.019)Compete motivation 0.187*** 0.185*** 0.184***
(0.038) (0.038) (0.038)
GDP 0.070*** 0.064*** 0.066***
(0.015) (0.014) (0.014)
Export 0.008*** 0.007*** 0.007***
(0.001) (0.001) (0.001)FDI -0.007 -0.008 -0.008
(0.006) (0.006) (0.006)
Constant 2.311*** -0.340 -1.157
(0.365) (0.602) (0.860)
Observations 18,223 18,223 18,223
Pseudo R-squared 0.0239 0.0246 0.0248
*** p<0.01, ** p<0.05, * p<0.1
Robust standard errors in parentheses. Year fixed effects are included and not shown.
表格 0.3

45
Hypothesis 1 predicts that high regulatory efficiency will be negatively related to managers’
willingness to justify bribery. Consistent with this assertion, the coefficient of regulatory
efficiency is negative (β=-0.035, p=0.000) in Model 2, so that hypothesis 1 is supported. In
terms of the marginal effect, when the regulatory efficiency increases by 1 unit, the
percentage decrease in the probability of justifying bribery is 1.06 percent.
Hypothesis 2 predicts that the negative relationship between regulatory efficiency and
managers’ willingness to justify bribery will be stronger in a nation with higher political rights.
This hypothesis is supported by the result in Model 3 since the coefficient of the interaction
item between regulatory efficiency and political rights is negative ( β=-0.004, p=0.000 ). In
terms of economic magnitude, when political rights takes its mean minus one standard
deviation and the regulatory efficiency increases by 1 unit, the probability of justifying
bribery will decrease by 0.56 percent. However, when political rights takes its mean plus one
standard deviation and the regulatory efficiency increases by 1 unit, the probability of
justifying bribery will decrease by 1.41 percent.
It is argued that the interaction effect of nonlinear models may not be truly reflected by the
coefficients (Ai and Norton, 2003; Wiersema and Bowen, 2009). Following previous studies,
I plot the predicted probability that managers justify bribery against the regulatory efficiency
at low political rights (solid line; the mean minus one standard deviation) and high political
rights (dash line; the mean plus one standard deviation) to better demonstrate the interaction
effect of regulatory efficiency and political rights (Figure 2.2). Figure 2.2 shows that, as
regulatory efficiency of a nation increases, the likelihood of managers’ justification of bribery

46
decreases, and it decreases faster for countries with strong political rights than for those with
weak political rights. In other words, political rights will strengthen the negative effect of
regulatory efficiency on managers’ justification of bribery.
Figure 2.2
Interaction of Regulatory Efficiency and Political Rights (two-way)
图 0- 2
Hypothesis 3 predicts that the moderating effect of political rights on the relationship between
regulatory efficiency and managers’ attitude to bribery would be weak when managers work
in the private sector. As Table 2.2 presents, the three-way interaction of regulatory efficiency
with political rights and the private sector in Model 3 has a positive effect (β=0.003, p=0.052).
Since the p-value is slightly larger than 0.05, the interpretation of hypothesis 3 should be
cautious. In terms of marginal effects, for the private sector, when political rights takes its
mean minus one standard deviation and the regulatory efficiency increases by 1 unit, the

47
percentage decrease in the probability of justifying bribery is 0.62 percent; when political
rights takes its mean plus one standard deviation and the regulatory efficiency increases by 1
unit, the percentage decrease in the probability of justifying bribery is 1.25 percent. However,
for the public sector, when political rights takes its mean minus one standard deviation and
the regulatory efficiency increases by 1 unit, the percentage decrease in the probability of
justifying bribery is 0.48 percent; when political rights takes its mean plus one standard
deviation and the regulatory efficiency increases by 1 unit, the percentage decrease in the
probability of justifying bribery is 1.72 percent.
Figure 2.3
Interaction of Regulatory Efficiency, Political Rights and Sector (three-way)
图 0- 3

48
I further plot the three-way interaction effects in Figure 2.3, which displays the effect of
regulatory efficiency on managers’ willingness to justify bribery at different levels of political
rights for the public and private sector respectively. It shows that the effect of political rights
will enhance the negative relationship between regulatory efficiency and managers’ attitude to
bribery for both private and public sectors, but that effect will be slightly weaker for managers
who work in the private sector. The result is consistent with my prediction.
With regard to the control variables, managers’ age indicates that an older manager is less
likely to engage in bribery. Compared to male managers, female managers are less likely to
justify bribery. This result may reveal the risk aversion of female and is consistent with
previous studies (Breen et al., 2017; Swamy et al., 2001). Managers’ educational level
negatively and competitive motivation positively affect managers’ justification of bribery.
Meanwhile, GDP growth and export are positively related to managers’ willingness to justify
bribery.
2.4.2 Robustness Check and Additional Analyses
2.4.2.1 Multilevel analysis and different independent variables
Since some country-level variables are included in my modeling and data is nested within
countries, I think the multilevel model should be applied as a robustness check. In addition,
there might be a concern about the measurement of regulatory efficiency as it is an aggregate
index that might cause conceptual confusion. To remedy the above problems, I collect data
about the cost, time and procedure of starting up a business in a nation to reveal more details
about the relationship between regulatory efficiency and managers’ willingness to justify
49
bribery. Multilevel analysis would help us to see if there are important country differences in
managers’ values and attitudes towards bribery in terms of regulatory efficiency.
The results in Table 2.4 demonstrate that hypothesis 1 is supported. First, there are country
differences in managers’ attitudes towards bribery in terms of regulatory efficiency since the
coefficient is negative ( β=-0.012, p=0.050 ). For economic magnitude, when the regulatory
efficiency increases by 1 unit, the probability of justifying bribery decreases by 1.20 percent.
This marginal effect is very close to the result from the tobit regression in Table 2.3 (1.06
percent).
Second, as the sub-indices of regulatory efficiency, I think the time and procedure of starting
up a business are more representative of regulation efficiency. Hence, it should influence
managers’ attitude to bribery more than the cost of staring up a business.
As the result, the cost of starting up a business is not significant (Model 2 in Table 2.4), while
the time and procedures of starting up business are significant (Model 3 and 4 in Table 2.4). In
terms of economic magnitude, when the time of staring up a business increases by 1 day, the
probability of justifying bribery increases by 1.10 percent; when the procedure of staring up a
business increases by 1, the probability of justifying bribery increases dramatically by up to
6.80 percent. The evidence strongly supports the main hypothesis that regulatory efficiency is
negatively related to the managers’ willingness to justify bribery.

50
Table 2.4
The Results of Different Independent Variables
Variables Model 1 Model 2 Model 3 Model 4
Independent variables: Regulatory Efficiency
Startup cost 0.009*** -0.000
(0.002) (0.003)
Startup time 0.026*** 0.017***(0.002) (0.004)
Startup procedure 0.179*** 0.129***
(0.018) (0.021)
Controls
Political rights -0.050*** -0.049*** -0.049*** -0.047***
(0.014) (0.013) (0.013) (0.013)Sector 0.321*** 0.314*** 0.365*** 0.339***
(0.092) (0.091) (0.091) (0.091)
Age -0.042*** -0.041*** -0.041*** -0.040***
(0.003) (0.003) (0.003) (0.003)
Gender 0.322*** 0.335*** 0.291*** 0.305***
(0.086) (0.085) (0.086) (0.085)Marital -0.010 -0.005 -0.034 -0.023
(0.091) (0.091) (0.091) (0.090)
Education -0.087*** -0.090*** -0.075*** -0.077***
(0.019) (0.019) (0.019) (0.019)
Competitive motivation 0.218*** 0.219*** 0.214*** 0.211***
(0.038) (0.038) (0.038) (0.038)GDP 0.104*** 0.112*** 0.094*** 0.097***
(0.015) (0.015) (0.014) (0.015)
Export 0.004*** 0.006*** 0.008*** 0.008***
(0.001) (0.001) (0.001) (0.001)
FDI -0.003 -0.003 0.004 0.002
(0.006) (0.006) (0.006) (0.006)Constant 0.291 -0.558 -1.620*** -1.693***
(0.328) (0.341) (0.381) (0.383)
Observations 18,223 18,223 18,223 18,223
Pseudo R-squared 0.0216 0.0236 0.0238 0.0247
*** p<0.01, ** p<0.05, * p<0.1
Robust standard errors in parentheses. Year fixed effects are included and not shown.
表格 0.4

51
2.4.2.2 Testing for endogeneity: instrumental variable
As the empirical results come from survey data, possible endogeneity problems should be
tested to reinforce our confidence in the reliability and validity of the results. An endogeneity
problem arises when some factors that are related to the dependent variable (y) are also
related to the independent variable (x), but those factors are not controlled in the existing
model (Reference?). Therefore, the most common source of endogeneity is omitted variables,
while other sources of endogeneity such as simultaneity (reverse causality), measurement
error and self-selections are also important. In this paper, the most likely source of
endogeneity is omitted variables as the level of key variables (x and y) are at different levels
(individual and country level), while the variables I can control for in the model are limited.
To address endogenous concerns in the research as raised by Bascle (2008); Hamilton and
Nickerson (2003), I use two-stage least squares (2SLS) to test whether the main variable has
any endogenous problem and circumvent bias with instrumental variables. This 2SLS
approach is advocated by Semadeni, Withers, and Trevis Certo (2014), and it is especially
effective when there are multi-sources of endogeneity (Certo et al., 2016). To implement this
approach, I use urban population (% of total population) and Internet users (per 100 persons)
of a nation as the instrumental variables. I expect the concentration of population needs an
improvement of regulatory efficiency, and the use of the Internet offers technological
possibilities for higher regulation efficiency. At the same time, it is not clear whether the two
factors would impact the likelihood of managers’ justification about bribery.
Table 2.5 reports the first- and second-stage of 2SLS and the comparison with the original

52
OLS test. Both instruments are significantly positive (Urban population: β=0.115, p=0.000 ;
Internet users: β=0.241, p=0.000 ) in the first stage. The partial R-square is 0.1914 and the
partial F-statistic is highly significant (p<0.001), indicating that the instruments are not weak
(Stock, Wright, and Yogo, 2002). Further, more than one instrument is normally needed to test
the over-identity restriction to identify the exogenous assumption of instruments (Larcker and
Rusticus, 2010; Semadeni et al., 2014). Since the Sargan and Basmann tests failed to reject
the null hypothesis that the instruments are uncorrelated with the disturbance term in the
second-stage model (p=0.2366; p=0.2368), I can be confident about the results from this
2SLS model.
Table 2.5
Two-stage Least Squares Estimation
2SLS OLS
First-stage Second-stage
Variables Regulatory efficiency Bribery Bribery
Regulatory efficiency -0.027*** -0.014***
(0.002) (0.001)
Instruments
Urban population 0.115***(0.006)
Internet access 0.241***
(0.007)
Controls
Political rights 0.016 0.016*** 0.010**
(0.030) (0.005) (0.004)Sector 1.121*** 0.080*** 0.066**
(0.185) (0.029) (0.029)
Age 0.033*** -0.008*** -0.009***
(0.006) (0.001) (0.001)
Gender -0.616*** 0.090*** 0.098***
(0.177) (0.028) (0.028)Marital 0.294 -0.027 -0.026
(0.188) (0.030) (0.030)

53
Education 0.416*** -0.002 -0.013**
(0.040) (0.007) (0.006)
Competitive motivation -0.802*** 0.032** 0.049***
(0.077) (0.013) (0.012)
GDP -0.512*** 0.014** 0.027***(0.032) (0.005) (0.005)
Export 0.068*** 0.005*** 0.003***
(0.003) (0.000) (0.000)
FDI -0.104*** -0.005** -0.004*
(0.012) (0.002) (0.002)
Constant 53.50*** 3.505*** 3.068***(0.875) (0.225) (0.117)
Observations 18,223 18,223 18,223
Diagnostics for Instrumental VariablesPartial R-squared 0.191
Partial F-statistic 2154.97 (p = 0.000)
Over-identifying restriction Sargan 1.400 (p = 0.237) Basmann 1.399 (p = 0.237)Endogenous test Durbin 33.161 (p = 0.000) Wu-Hausman 33.191 (p = 0.000)
*** p<0.01, ** p<0.05, * p<0.1Standard errors in parentheses. Year fixed effects are included and not shown.
表格 0.5
The second column of Table 2.5 shows the result for the second-stage estimation, where the
coefficient on regulatory efficiency (key independent variable in this study) is negative
( β=-0.027, p=0.000 ), providing strong support for hypothesis 1. The Durbin-Wu-Hausman
test rejects the null hypothesis of exogeneity, so that the result from 2SLS is more valid than
OLS. Comparing the results from 2SLS and OLS (the last column), I find out that the true
magnitude of regulatory efficiency should be about twice larger than the OLS result. Hence,
this finding provides additional and strong evidence that the likelihood of managers’
justification of bribery will increase while the regulatory efficiency decreases.
2.5 Discussion and Conclusion
In this study, I have applied insights from resource dependence theory to demonstrate that, in

54
spite of ethical critiques, managers may view bribery as an attractive strategy to acquire
resources from the government (Lee and Weng, 2013; Martin et al., 2007). I argue that the
power imbalanced relationship between government and firms is the main reason why
managers justify bribery since it can alter or create more favorable external environment for
firms. This kind of power imbalanced relationship can be reflected in many aspects, such as
government purchasing or industrial policies. In this research, I examine the aspect of public
services supplier, and the result is consistent with previous literature. Further, democracy may
mitigate this effect. I find empirical support for the notion that great political rights of a nation
strengthen the negative effect of regulatory efficiency on managers’ willingness to justify
bribery, particularly for managers working in the public sector given the lack of resource
slack in the private sector. These findings contribute to the extant literature in five ways.
2.5.1 Theoretical Contributions
First, I provide a more subtle perspective on how to understand bribery. Prior studies have
focused largely on the demand side, seeing bribery as a passive way to adapt to the external
environment, and criticizing officials’ demanding and governments’ corruption. In the
empirical literature, most studies fail to distinguish between the demand and supply side of
bribery, leading to inconclusive results. Following my observation of the reality and careful
reading of the literature, I posit that managers will view bribery as a strategy to acquire
resources and then seek unfair competitive advantages when they problematically depend on
their governments. This focus allows me to take a more nuanced approach to examining the
relationship between governmental intervention in markets and individuals’ risk-seeking

55
behaviors.
Second, I contribute to the study of non-market strategies and expand it to an illegal context.
Despite calling for an integrated consideration of both market and non-market strategies
(Baron, 1995; Holburn and Vanden Bergh, 2014), existing research has not paid much
attention to the connection between illegal and legal non-market strategies. My study tries to
synthesize them into a single theoretical framework and suggests that, when there is an
effective channel for legal non-market means, managers are less likely to see bribery as a
potential strategic choice confronting regulatory inefficiency. Thus, my results offer an
important implication for the discussion about the determinants of alternative choice of
non-market strategies.
Third, I contribute to resource dependence theory in terms of new application. Resource
dependence theory has been proven to be an instrumental theory to interpret themes both in
the field of market strategy such as mergers and joint ventures (Casciaro and Piskorski, 2005)
and non-market strategy especially for corporate political activities (Hillman and Hitt, 1999;
Hillman et al., 2004; Schuler et al., 2002). However, the research of illegal strategy has not
been specially analyzed. According to my theorizing, illegal activities can be viewed as a
potential choice for managing external uncertainty. Bribery is a kind of tacit agreement to deal
with asymmetric dependence on government and overcome resource constraints stemming
from the power imbalance. In addition, resource dependence theory has been looking into
interactions between firms and government by examining the governmental role as a customer
(such as government purchasing) or a market shaper (such as a policy maker). However,
56
government as a supplier of public services is overlooked in the literature about the impact of
government on firms’ operations and managers’ potential choice of illegal activities. My study
manages to fill this gap and expand my understanding in a holistic view about governmental
multi-roles.
Forth, this study challenges the dominant perspective of using institutional theory to
understand bribery. In recent years, it has become fashionable for research about bribery to
apply institutional theory following the logic of legitimacy (Cuervo-Cazurra, 2008; Zoogah,
Peng, and Woldu, 2015). However, this prevalent wisdom has met two difficulties when
institutions are used to explain bribery. First, it is difficult to point out which institution would
be the most relevant (Xu and Meyer, 2013a). Second, although there is enthusiastic support to
the argument that actors can shape institutions (Kostova and Zaheer, 1999; North, 1991;
Oliver, 1997), there is still a lack of solid theory and statistical evidence about how managers’
non-market strategy affects their business environment. In my study, these two difficulties are
overcome explicitly via the new application of resource dependence theory.
Fifth, I add to the literature about the relationship between democracy and bribery or
corruption. It is often believed that there may exist a negative relationship between democracy
and corruption as the result of transparency and justice principles of the procedure, or strong
supervision by public opinions (Treisman, 2007). However, there is a lack of theoretical
discussion in a managerial logic. Through this study, I contribute to the topic by illustrating
how democracy (reflected as the political rights in this study) provides a legal non-market
channel for managers to alter the environment predetermined by the government and hence

57
mitigate their potential choice of bribery.
2.5.2 Practical Implications
My results also offer some practical implications for both regulators and managers.
Conventional academic literature about bribery or corruption puts responsibility on the
governmental accountability and tends to view clean government to be a solution for bribery,
but ignores the importance of the functioning of efficient business environments. My findings
suggest that reducing time and procedure of setting up or closing off business, and providing
basic public services effectively are a feasible way to reduce corruption by mitigating
managers’ willingness to bribe. I believe it is especially crucial for the developing world.
Besides, the results show that building the democratic channel to respond to firms’ demand
will mitigate the possibility of firms’ bribery. Although the asymmetric power relations may
not be reversed, providing more efficient administrative services and improving institutional
quality can reduce the possibility to bribe since these efforts can alleviate resource constraints
firms confront and decrease transaction costs firms operate with. Firms or individuals should
have legitimate channels to express their views about public affairs and solve problems in the
non-market or governmental arena. By doing so they may have less motivation to engage in
illegal non-market activities.
Although the thesis proves that bribery can be used as an illegal non-market strategy to
counterbalance their power disadvantage position, which does not imply that bribery is a
justifiable way to acquire resources in a healthy society. Now that lobbying or other corporate
political activities have a similar function of bribery but legally and acceptably, it may be

58
smart to invest in political activities at the early stage and cultivate political connections to
deal with the inevitable challenge from the asymmetry dependence of the government.
2.5.3 Limitations and Future Research Directions
Although the resource dependence perspective provides a general explanation of managerial
discretion about bribery by altering external dependence on government, my analysis is
performed at the country and individual level, and has not shed lights at the firm or industry
level. Future research might consider firm or industry heterogeneity. For example, asymmetric
dependence on government can vary across industries. Also, asymmetric dependence might
be more crucial for start-up businesses than incumbents (Baron et al., 2018; Gurses and
Ozcan, 2015).
Moreover, I posit that resource slack will influence managers’ choice about legal political
strategies or illegal bribery strategies. I use the ownership structure to prove that idea, but
there might exist more suitable indexes to measure resource slack. Meanwhile, based on my
findings, I conclude that SOEs have more resource than POEs, and that the moderating effect
of political rights will be stronger for SOEs. However, some other possible means to
overcome resource constraints haven’t been considered in this study. For example, POEs
could alter the relationship with government via forming business groups (Guillen, 2000), or
building political ties with government officials to acquire scarce resources (Li, Poppo, and
Zhou, 2008). I hope that further research could continue to explore various means of
non-market strategies and their intriguing interactions.
59
Reference
Ai, C. & Norton, E. C. 2003. Interaction terms in logit and probit models. Economics letters,
80(1): 123-129.
Azfar, O. & Murrell, P. 2009. Identifying reticent respondents: assessing the quality of survey
data on corruption and values. Economic Development and Cultural Change, 57(2):
387-411.
Banerjee, A. V. 1997. A theory of misgovernance. The Quarterly Journal of Economics,
112(4): 1289-1332.
Baron, D. P. 1995. Integrated strategy: Market and nonmarket components. California
Management Review, 37(2): 47-65.
Baron, R. A., Tang, J., Tang, Z., & Zhang, Y. 2018. Bribes as entrepreneurial actions: Why
underdog entrepreneurs feel compelled to use them. Journal of Business Venturing, 33(6):
679-690.
Bascle, G. 2008. Controlling for endogeneity with instrumental variables in strategic
management research. Strategic organization, 6(3): 285-327.
Baucus, M. S. & Near, J. P. 1991. Can illegal corporate behavior be predicted? An event
history analysis. Academy of Management Journal, 34(1): 9-36.
Beck, T., Demirguc-Kunt, A., & Maksimovic, V. 2005. Financial and Legal Constraints to
Growth: Does Firm Size Matter? The Journal of Finance, 60(1): 137-177.
Bénabou, R., Ticchi, D., & Vindigni, A. 2015. Religion and innovation. American Economic
Review, 105(5): 346-351.
Bertrand, M., Djankov, S., Hanna, R., & Mullainathan, S. 2007. Obtaining a driver's license in
India: an experimental approach to studying corruption. The Quarterly Journal of
Economics, 122(4): 1639-1676.
Birhanu, A. G., Gambardella, A., & Valentini, G. 2016. Bribery and investment: Firm‐level
evidence from A frica and L atin A merica. Strategic management journal, 37(9):
1865-1877.
Bonardi, J.-P., Holburn, G. L., & Vanden Bergh, R. G. 2006. Nonmarket strategy performance:

60
Evidence from US electric utilities. Academy of Management Journal, 49(6): 1209-1228.
Bonardi, J. P. 2004. Global and political strategies in deregulated industries: The asymmetric
behaviors of former monopolies. Strategic Management Journal, 25(2): 101-120.
Bourgeois III, L. J. & Singh, J. V. 1983. Organizational Slack and Political Behavior Among
Top Management Teams. Paper presented at Academy of Management Proceedings.
Breen, M., Gillanders, R., McNulty, G., & Suzuki, A. 2017. Gender and corruption in
business. The Journal of Development Studies, 53(9): 1486-1501.
Carmines, E. G. & Stimson, J. A. 1980. The two faces of issue voting. American Political
Science Review, 74(1): 78-91.
Casciaro, T. & Piskorski, M. J. 2005. Power imbalance, mutual dependence, and constraint
absorption: A closer look at resource dependence theory. Administrative Science
Quarterly, 50(2): 167-199.
Certo, S. T., Busenbark, J. R., Woo, H.-s., & Semadeni, M. 2016. Sample selection bias and
Heckman models in strategic management research. Strategic Management Journal,
37(13): 2639-2657.
Cuervo-Cazurra, A. 2016. Corruption in international business. Journal of World Business,
51(1): 35-49.
Cuervo-Cazurra, A. 2008. The effectiveness of laws against bribery abroad. Journal of
International Business Studies, 39(4): 634-651.
Cuervo-Cazurra, A. 2006. Who cares about corruption? Journal of International Business
Studies, 37(6): 807-822.
Cullen, J. B., Parboteeah, K. P., & Hoegl, M. 2004. Cross-national differences in managers'
willingness to justify ethically suspect behaviors: A test of institutional anomie theory.
Academy of Management Journal, 47(3): 411-421.
DiMaggio, P. J. & Powell, W. W. 1991. The new institutionalism in organizational analysis:
University of Chicago Press Chicago, IL.
Djankov, S., La Porta, R., Lopez-de-Silanes, F., & Shleifer, A. 2002. The regulation of entry.
The Quarterly Journal of Economics, 117(1): 1-37.

61
Dunning, J. H. 1977. Trade, location of economic activity and the MNE: A search for an
eclectic approach, The international allocation of economic activity: Springer.
Emerson, R. M. 1962. Power-dependence relations. American Sociological Review: 31-41.
Getz, K. A. 1991. Selecting corporate political tactics. Paper presented at Academy of
Management Proceedings.
Goldeng, E., Grünfeld, L. A., & Benito, G. R. G. 2008. The Performance Differential between
Private and State Owned Enterprises: The Roles of Ownership, Management and Market
Structure. Journal of Management Studies, 45(7): 1244-1273.
Guillen, M. F. 2000. Business groups in emerging economies: A resource-based view.
academy of Management Journal, 43(3): 362-380.
Gurses, K. & Ozcan, P. 2015. Entrepreneurship in regulated markets: framing contests and
collective action to introduce pay TV in the US. Academy of Management Journal, 58(6):
1709-1739.
Hamilton, B. H. & Nickerson, J. A. 2003. Correcting for Endogeneity in Strategic
Management Research. Strategic Organization, 1(1): 51-78.
Hellman, J. S., Jones, G., & Kaufmann, D. 2003. Seize the state, seize the day: state capture
and influence in transition economies. Journal of comparative economics, 31(4):
751-773.
Hillman, A. J. & Hitt, M. A. 1999. Corporate political strategy formulation: A model of
approach, participation, and strategy decisions. Academy of Management Review, 24(4):
825-842.
Hillman, A. J., Keim, G. D., & Schuler, D. 2004. Corporate political activity: A review and
research agenda. Journal of Management, 30(6): 837-857.
Holburn, G. L. & Vanden Bergh, R. G. 2014. Integrated market and nonmarket strategies:
Political campaign contributions around merger and acquisition events in the energy
sector. Strategic Management Journal, 35(3): 450-460.
Husted, B. W. 1999. Wealth, culture, and corruption. Journal of International Business
Studies, 30(2): 339-359.

62
Jacobs, D. 1974. Dependency and vulnerability: An exchange approach to the control of
organizations. Administrative science quarterly: 45-59.
Jensen, N. M., Li, Q., & Rahman, A. 2010. Understanding corruption and firm responses in
cross-national firm-level surveys. Journal of International Business Studies, 41(9):
1481-1504.
Jeong, Y. & Siegel, J. I. 2018. Threat of falling high status and corporate bribery: Evidence
from the revealed accounting records of two South Korean presidents. Strategic
Management Journal, 39(4): 1083-1111.
Keim, G. & Baysinger, B. 1988. The Efficacy of Business Political Activity: Competitive
Considerations in a Principal-Agent Context. Journal of Management, 14(2): 163-180.
Kostova, T. & Zaheer, S. 1999. Organizational legitimacy under conditions of complexity:
The case of the multinational enterprise. Academy of Management Review, 24(1): 64-81.
Krammer, S. M. 2019. Greasing the wheels of change: Bribery, institutions, and new product
introductions in Emerging Markets. Journal of Management, 45(5): 1889-1926.
Krishnan, R. & Kozhikode, R. K. 2015. Status and corporate illegality: Illegal loan recovery
practices of commercial banks in India. Academy of Management Journal, 58(5):
1287-1312.
Larcker, D. F. & Rusticus, T. O. 2010. On the use of instrumental variables in accounting
research. Journal of accounting and economics, 49(3): 186-205.
Lee, S. H. & Weng, D. H. 2013. Does bribery in the home country promote or dampen firm
exports? Strategic Management Journal, 34(12): 1472-1487.
Lenway, S. A. & Rehbein, K. 1991. Leaders, Followers, and Free Riders: An Empirical Test
of Variation in Corporate Political Involvement. Academy of Management Journal, 34(4):
893-905.
Li, J. J., Poppo, L., & Zhou, K. Z. 2008. Do managerial ties in China always produce value?
Competition, uncertainty, and domestic vs. foreign firms. Strategic Management Journal,
29(4): 383-400.
Luo, Y. 2005. An organizational perspective of corruption. Management and Organization

63
Review, 1(1): 119-154.
Mahon, J. F. 1993. Shaping issues/manufacturing agents: Corporate political sculpting. SAGE
FOCUS EDITIONS, 163: 187-187.
Marsh, S. J. 1998. Creating barriers for foreign competitors: a study of the impact of
anti‐dumping actions on the performance of US firms. Strategic Management Journal,
19(1): 25-37.
Martin, K. D., Cullen, J. B., Johnson, J. L., & Parboteeah, K. P. 2007. Deciding to bribe: A
cross-level analysis of firm and home country influences on bribery activity. Academy of
Management Journal, 50(6): 1401-1422.
McKendall, M. A. & Wagner III, J. A. 1999. Motive, opportunity, choice, and corporate
illegality. Organization Science, 8(6): 624-647.
Meznar, M. B. & Nigh, D. 1995. Buffer or bridge? Environmental and organizational
determinants of public affairs activities in American firms. Academy of Management
Journal, 38(4): 975-996.
Mishina, Y., Dykes, B. J., Block, E. S., & Pollock, T. G. 2010. Why “good” firms do bad
things: The effects of high aspirations, high expectations, and prominence on the
incidence of corporate illegality. Academy of Management Journal, 53(4): 701-722.
Montiel, I., Husted, B. W., & Christmann, P. 2012. Using private management standard
certification to reduce information asymmetries in corrupt environments. Strategic
Management Journal, 33(9): 1103-1113.
North, D. C. 1991. Institutions. Journal of Economic Perspectives, 5(1): 97-112.
Okhmatovskiy, I. 2010. Performance Implications of Ties to the Government and SOEs: A
Political Embeddedness Perspective. Journal of Management Studies, 47(6): 1020-1047.
Oliver, C. 1991. Strategic responses to institutional processes. Academy of Management
Review, 16(1): 145-179.
Oliver, C. 1997. Sustainable competitive advantage: Combining institutional and
resource-based views. Strategic management journal: 697-713.
Olken, B. A. & Barron, P. 2009. The simple economics of extortion: evidence from trucking

64
in Aceh. Journal of Political Economy, 117(3): 417-452.
Olson, M. 1965. The logic of collective action: Public goods and the theory of groups:
Cambridge, MA: Harvard University Press.
Pfeffer, J. 1972. Interorganizational influence and managerial attitudes. Academy of
Management Journal, 15(3): 317-330.
Pfeffer, J. & Salancik, G. R. 2003. The external control of organizations: A resource
dependence perspective: Stanford University Press.
Razafindrakoto, M. & Roubaud, F. 2010. Are international databases on corruption reliable? A
comparison of expert opinion surveys and household surveys in sub-Saharan Africa.
World Development, 38(8): 1057-1069.
Schuler, D. A. 1996. Corporate political strategy and foreign competition: The case of the
steel industry. Academy of Management Journal, 39(3): 720-737.
Schuler, D. A., Rehbein, K., & Cramer, R. D. 2002. Pursuing strategic advantage through
political means: A multivariate approach. Academy of Management Journal, 45(4):
659-672.
Schweitzer, M. E., Ordóñez, L., & Douma, B. 2004. Goal setting as a motivator of unethical
behavior. Academy of Management Journal, 47(3): 422-432.
Semadeni, M., Withers, M. C., & Trevis Certo, S. 2014. The perils of endogeneity and
instrumental variables in strategy research: Understanding through simulations. Strategic
Management Journal, 35(7): 1070-1079.
Shaffer, B. 1995. Firm-level responses to government regulation: Theoretical and research
approaches. Journal of Management, 21(3): 495-514.
Shleifer, A. & Vishny, R. W. 1993. Corruption. The Quarterly Journal of Economics, 108(3):
599-617.
Singh, J. V. 1986. Performance, Slack, and Risk Taking in Organizational Decision Making.
Academy of Management Journal, 29(3): 562-585.
Song, Z., Storesletten, K., & Zilibotti, F. 2011. Growing Like China. American Economic
Review, 101(1): 196-233.
65
Spencer, J. & Gomez, C. 2011. MNEs and corruption: the impact of national institutions and
subsidiary strategy. Strategic Management Journal, 32(3): 280-300.
Stan, C. V., Peng, M. W., & Bruton, G. D. 2014. Slack and the performance of state-owned
enterprises. Asia Pacific Journal of Management, 31(2): 473-495.
Staw, B. M. & Szwajkowski, E. 1975. The scarcity-munificence component of organizational
environments and the commission of illegal acts. Administrative Science Quarterly:
345-354.
Stock, J. H., Wright, J. H., & Yogo, M. 2002. A Survey of Weak Instruments and Weak
Identification in Generalized Method of Moments. Journal of Business & Economic
Statistics, 20(4): 518-529.
Suchman, M. C. 1995. Managing legitimacy: Strategic and institutional approaches. Academy
of Management Review, 20(3): 571-610.
Svensson, J. 1999. Who must pay bribes and how much? Evidence from a cross-section of
firms: The World Bank.
Swamy, A., Knack, S., Lee, Y., & Azfar, O. 2001. Gender and corruption. Journal of
Development Economics, 64(1): 25-55.
Szwajkowski, E. 1985. Organizational illegality: Theoretical integration and illustrative
application. Academy of Management Review, 10(3): 558-567.
Treisman, D. 2007. What have we learned about the causes of corruption from ten years of
cross-national empirical research? Annual Review of Political Science, 10: 211-244.
Wiersema, M. F. & Bowen, H. P. 2009. The use of limited dependent variable techniques in
strategy research: Issues and methods. Strategic Management Journal, 30(6): 679-692.
Xu, D. & Meyer, K. E. 2013. Linking Theory and Context: ‘Strategy Research in Emerging
Economies’ after Wright et al. (2005). Journal of Management Studies, 50(7):
1322-1346.
Yi, J., Teng, D., & Meng, S. 2018. Foreign ownership and bribery: Agency and institutional
perspectives. International Business Review, 27(1): 34-45.
Zhou, K. Z., Gao, G. Y., & Zhao, H. 2017. State Ownership and Firm Innovation in China: An
66
Integrated View of Institutional and Efficiency Logics. Administrative Science Quarterly,
62(2): 375-404.
Zoogah, D. B., Peng, M. W., & Woldu, H. 2015. Institutions, Resources, and Organizational
Effectiveness in Africa. Academy of Management Perspectives, 29(1): 7-31.

67
CHAPTER THREE
Innovative Strategy and Illegal Behavior in Emerging Economies
Abstract
Why might an innovative strategy trigger illegal behavior? This study proposes that firms will
resort to problemistic search according to the anticipated negative feedback of a strategy
rather than actual outcomes. Using data from the World Bank Enterprises Survey, I find that
investing in R&D will lead to bribery in developing countries where unfavorable factors will
diminish the expected returns, confirming that the discrepancy between the expectation of
innovation and the estimation of its actual achievement is a source of illegal behavior. To
extend the boundary of the behavior theory of the firm (BTOF), I borrow ideas from the
general strain theory (GST), which identifies the other two mechanisms of illegal behavior of
organizations: the discrepancy between aspirations and expectations; and the discrepancy
between fair outcomes and unfair outcomes. The results support the hypotheses that
aspirational strain and unfair strain intensify the positive relationship between R&D input and
bribery. However, when a firm has the experience of R&D output, it will mitigate a firm’s
tendency to bribe since it has accumulated the relevant knowledge. My intended contribution
is to extend the focus of research from behavior changes after the exact negative feedback to
behavioral changes based on the anticipated negative feedback. Shedding lights on a
sociological theory, I enrich the definition of negative feedback that not only drives from the
discrepancy between expectation and actual outcomes, but also stems from the discrepancy
between aspiration and expectation, fair outcomes and unfair outcomes.

68
3.1 Introduction
Firms take strategies for the purpose of improving performance or building competitive
advantages, and then receive feedback on those strategies intertwined within the environment.
This feedback shapes firms’ reactions and future behaviors in a dynamic cycle (Eggers and
Suh, 2019). Behavioral theory suggests that with bounded rationality, firms will be motivated
to take problemistic search for solutions when performance feedback is below a particular
aspiration level (Argote and Greve, 2007; Cyert and March, 1968; Simon, 2013). This theory
has received increasing attention from empirical studies, especially those on firms’
illegitimate or illegal behaviors as responses to negative feedback (Bromiley, 1991; Mishina
et al., 2010; Xu et al., 2019).
Despite a wealth of fruitful investigations, the extant research has mostly focused on the
change of behavior after exact negative feedback or a specific failure to achieve the prior
expectation. However, in reality, behavioral changes are commonly initiated under chronic
and underlying performance pressure before a sudden frustration or explicit recorded
feedback (Cyert and March, 1968; Simon, 2013). Therefore, in this research, I emphasize that
firms can change behaviors in accordance with a kind of potential, anticipated performance
feedback triggered by a previous strategy and its interaction with the environment, instead of
a specific, physical reference point compared with the historic performance. To prove this
postulation, I investigate the situation where firms take the strategy of investing in R&D in
emerging economies. I propose that firms will be more likely to use illegal bribery as a
problemistic search because the anticipated feedback of the R&D strategy can be negative in
the environment with “institutional voids” such as a lack of continuous capital support (Xu
and Meyer, 2013b; Zheng et al., 2013), inadequate legal and judicial systems (Peng et al.,
2017), and high uncertainty and volatility (Santangelo and Meyer, 2011). The situation
molded by firms’ strategy and the specific environmental factors leads to negative anticipated

69
feedback, and then firms are motivated to initiate risk-taking behavior to deal with the
potential possibility of not meeting expectations before the actual result of their strategy
realizes.
Moreover, to provide new insights into the relationship between ex ante strategy and ex post
behavior, I draw on the lens of general strain theory (GST) from sociology to extend the
boundary of the behavior theory of the firm (BTOF), and investigate how one strategy taken
previously will influence the subsequent behavioral change under the different types of strains.
The GST suggests that the negative effect from external relationships creates pressure, and
may lead individuals to make use of illegitimate channels or illegal means to achieve their
original goals (Cloward and Lloyd; Cohen, 1955; Merton, 1938). Specifically, when the
external conditions prevent individuals from achieving positively valued goals, illegal means
will be motivated by three kinds of strain: 1) the disjunction between aspirations and
expectations; 2) the disjunction between expectations and actual achievements; and 3) the
disjunction between fair outcomes and actual outcomes (Agnew, 1992, 2001). The extant
literature on the relationship between negative feedback and illegal behavior falls into the
sphere of the second category (Mishina et al., 2010; Xu et al., 2019). The other two categories
of the strain, which may lead to illegal corporate behavior, have not been articulated in the
theoretical mechanisms of the BTOF. I propose that the strain of aspiration and that of
unfairness will amplify the positive relationship between R&D investment and bribery.
In addition to the theoretical gap above, the relationship between innovation and bribery
presented in the literature is not consistent with what we observe in reality. Bribery or
corruption is conventionally believed to play a negative role on innovation as this kind of
illegal plunder increases transaction costs and discourages constructive investments
(Mahagaonkar, 2008; Murphy, Shleifer, and Vishny, 1993; Starosta de Waldemar, 2011;
Veracierto, 2008). On the other hand, previous literature demonstrates that the introduction of

70
new products or development of new product line in emerging economies will cause more
bribes since innovative firms are vulnerable and easily become preys of corrupt governments
(Ayyagari, Demirgüç-Kunt, and Maksimovic, 2014; Krammer, 2019; Murphy et al., 1993).
Integrating the two viewpoints, these studies imply that the relationship between corruption
and innovation can be a vicious cycle, leading to a long-term, low-level innovativeness and
competitiveness in emerging economies if corruption cannot be significantly curbed. In reality,
however, some emerging economies have evolved into innovative dynamos rather than
dinosaurs for the last decade or so without significant improvement of business environments.
For instance, the ranking of innovation index of China in 2009 was 43, with 67 on innovation
input and 31 on innovation output; while its ranking in 2019 was 14, with 26 on innovation
input and 5 on innovation output (Global innovation index, 2009; 2019). In contrast, the
ranking of corruption index of China dropped from 79 in 2009 to 87 in 2018 (International
Transparency, 2009; 2018). Vietnam, Thailand, and some other emerging economies have
been experiencing similar changes.
To resolve the inconsistency between the literature and reality, I theorize in this paper that the
mechanisms of innovation input and output pertain to different facets of innovation impact on
bribery. Accordingly, I argue that the mixed empirical evidence reported in the literature can
be caused by the use of different innovation indices. For instance, Le (2017) finds that firms
with a radical innovative change will be less likely to pay bribes, but incremental innovation
such as enhancing current products associates with a high probability of bribery; and there is
no evidence showing that process innovation will affect the motivation of informal payments.
Substituting the innovation proxy variable “introducing a new product” for “upgrading an
existing product”, Krammer (2019) finds that the existing positive relationship between
innovation and bribery disappears. Ayyagari et al. (2014) show that not all specific indices of
innovation output have a significant association with bribery. A logical speculation is that the
71
nature and extent of the association of firms’ innovation with illegal bribery vary with the
nature of risk: innovation input is more likely to trigger problemistic search such as illegal
bribery given the high uncertainty of this kind of investment; while the learning experience
from innovation output, such as launching new products successfully, may alleviate the
pressure of negative anticipated feedback from the innovation input, and then decrease the
possibility of using risk-taking behavior as a response to the previous strategy.
Whereas prior studies emphasize on benefits of initiating innovation, especially for its most
advanced form – R&D activities, this study draws attention to the burden of doing R&D in
emerging economies, and its detrimental effect on organizational actions. My study
contributes to the literature in the following ways. First, I propose that the feedback on R&D
investment can be anticipated once a firm takes a strategy in a specific environment, and the
action can be changed immediately, instead of using the ex post feedback such as a specific
reference point or accounting records. I believe this proposition is closer to the reality and
hence the BTOF can be generalized. Second, I extend the mechanism boundary in terms of
the trigger of organizational behavioral changes. Enlightening from the GST in sociology, I
propose that the discrepancy between aspirations and expectations, and that between fair and
unfair outcomes will produce a similar behavioral response as caused by the discrepancy
between expectations and actual achievements delineated in the BTOF. I demonstrate that the
other two categories of discrepancy will amply the relationship between R&D input and
bribery. Third, I distinguish the mechanism of innovation input from innovation output on
bribery, and prove that the accumulated learning experience (R&D output) can reduce the
possibility of engaging in bribery for innovative firms. All the above helps us to tease out the
actual relationship between innovation and bribery, and solve the puzzle of inconsistency
between the literature and practice.
72
3.2 Theory and Hypotheses
3.2.1 The Cycle of Previous Strategies, Negative Feedback and Behavioral Changes
Negative feedback may trigger dichotomic risk-taking reactions. The positive actions include
innovation (Chen and Miller, 2007; Eggers and Kaul, 2018; Greve, 2003; Joseph and Gaba,
2015; O'Brien and David, 2014), acquisition and expansion (Audia and Greve, 2006; Cho et
al., 2016; Iyer and Miller, 2008; Kim, Finkelstein, and Haleblian, 2015; Ref and Shapira,
2017), and organizational changes (Kacperczyk, Beckman, and Moliterno, 2015), whereas
negative ones mainly refer to using illegal behaviors as problemistic search (Harris and
Bromiley, 2007; Mishina et al., 2010; Xu et al., 2019). Recently, scholars have noticed that
the inconsistent directions of organizational changes towards negative feedback are imputable
to the ignorance of resource constraint. The scenario of falling seems unable to sustain
positive activities, which are resource-consuming rather than resource-slack (Kuusela, Keil,
and Maula, 2017). Therefore, the positive direction of actions may be less likely to be
undertaken in response to the negative feedback since the resource that firms can operate
declines due to performance shortfalls; while negative feedback is more likely to be a trigger
of negative actions, such as bribery, to solve problems myopically (Xu et al., 2019).
Consistent with the BTOF, another stream of literature explores behavioral changes caused by
the negative feedback drawing from a specific strategy, and argues that organizations are
adaptive systems which can update their behaviors according to the feedback on the prior
actions (Cyert and March, 1968; Simon, 2013). For instance, using a dataset of medical
devices, Maslach (2016) finds that when novel innovations fail, future innovative activities
will be suppressed. Eggers and Suh (2019) prove that the failure on new product development
may trigger three different types of behavioral responses: retreat, local search and distant
search upon the different conditions. Simply put, “some decisions are irrevocable in the sense
that they create a new situation which, in turn, influences the decision that follow them"

73
(Simon, 1947: 76). In other words, when the goal setting by a specific strategy is not achieved,
the firm will have an incentive to divert to a negative, myopic action to solve the problem
accordingly. In all, the cycle of previous strategy, feedback and behavioral changes appears in
order. In addition, if the feedback stemming from previous strategy is negative, the
subsequent behavior is more likely to be negative such as illegal bribery.
In this decision-making process, I argue that firms may take actions immediately when they
anticipate that the outcome of a specific strategy may not meet expectations in reality, rather
than only respond after negative feedback emerges, such as an explicit failure presented in
accounting reports. March and Simon (1958: 13) delineate this phenomenon clearly: “much of
the behavior I observe in organizations is ‘intuitive’ in the sense that it occurs immediately
upon recognition of a situation”,and “ (situations) without any apparent interval of search,
problem-solving, or choice are not rare.”(March and Simon, 1958: 163) The citations have
two implications. First, firms can recognize situations and anticipate outcomes, and then take
actions before the explicit appearance of failure defined by the actual performance below
aspirations. Second, the recognition and anticipation are often based on imperfect information
and limited alternatives. Therefore, the problemistic search triggered instantly is an outcome
of bounded rationality rather than an optimal result (Cyert and March, 1968). As long as the
desire to avoid the consequences of loss has been strengthened, subsequent behavioral
changes will be undertaken in order to reduce uncertainty drawing from the previous strategy
(Kahneman and Tversky, 1979), regardless of whether the accurate evaluation about
consequences has been done. Therefore, in practice, I may only observe previous strategies
and subsequent behavioral changes, while the mechanism of anticipated feedback is subsistent
but unobservable.
3.2.2 How to Anticipate the Feedback of a Strategy? The Role of Environment
The original BTOF suggests that decision-makers’ anticipations, expectations and evaluations
74
which are conventionally seen as the factors influencing behavioral changes are largely
determined by the environment and how firms interpret it (Cyert and March, 1968). In other
words, the external environment cannot be simply seen as an exogenous variable, but it is
embedded in the decision-making process. As March and Simon (1958: 160) present, “the
organizational and social environment in which the decision maker finds himself determines
what consequences he will anticipate, what ones he will not; what alternatives he will
consider, what ones he will ignore.” This argument emphasizes the importance of
environments in anticipating feedback as elements in an environment may facilitate or impede
the achievement of a specific strategy. Following the environment evaluation, a firm will
estimate whether achievements will be above or below the original goals setting by strategies.
If the anticipation of achievements is not satisfactory, the problemistic search may be taken in
response to the negative anticipated feedback.
Moreover, the direction of anticipated feedback is associated with not only the environment
statically, but more importantly the interaction between the strategy and the environment.
“The elements of the definition of the situation are not ‘given’… (the situations) are
themselves the outcome of psychological and sociological processes, including the chooser's
own activities and the activities of others in his environment” (March and Simon, 1958: 160).
Here, the definition of the situation can be seen as a proxy of anticipated feedback resulting
from the previous strategy intertwined with the environmental factors, rather than the nature
of the environment itself. For instance, the absence of proper regulations is conventionally
viewed as an environmental defect, which obstructs firms’ operations and squeezes the
growing opportunity of a formal economy (Iriyama, Kishore, and Talukdar, 2016). However,
it is precisely the lack of formal institutions such as delay in legislation that stimulates the
emergence of new forms of businesses and enables innovative enterprises such as Uber and
Airbnb to boom in the first instance. This kind of “institutional voids” gives some start-ups

75
chances to survive in the name of legitimacy among legal crevices (Webb et al., 2009).
Therefore, the anticipated feedback actually is profoundly shaped by the discrepancy between
the strategy and the environment. It seems that if the strategy complies with the environment,
the situation they create will be minimally stressful, and hence the problemistic search will
hardly occur. On the contrary, if the previous action of a firm mismatches the environment, no
matter how justified the action is, the situation the firm molds will lead to negative anticipated
feedback, and will be more likely to trigger myopic problem-solving activities. This
discrepancy between the goals set by the previous strategy and the performance restrained by
the environment is the fundamental motivation of problemistic search (Argote and Greve,
2007).
3.2.3 R&D Investment and Bribery in Emerging Economies
To prove the theoretical argument above, I purposely investigate an extreme situation where
firms take the strategy of investing in research and development (R&D) of new products in
emerging economies. I propose that this long-term investment in R&D will cause huge strain
of negative anticipated feedback given that the environment firms are embedded in is far from
favorable and mismatched the strategy to some extent. Under this condition problemistic
search such as illegal bribery may happen.
Investing in R&D for the purpose of introducing new products or technologies is a core
innovative activity. Once innovative projects succeed, firms can benefit from barriers of
imitation and building sustainable competitive advantages (Teece, 2009; Teece, Pisano, and
Shuen, 1997). However, the expected high return of this kind of strategy implies huge risk
and uncertainty firms confront especially at the early stage of investment (Katila and Ahuja,
2002). Particularly in developing countries, firms hardly commit to R&D investment as it
involves in long-term, slow accumulation of capital (Murphy et al., 1993). Therefore, the
literature in terms of investigating innovative activities in developing countries is always
76
extended the sphere of innovation to fringe activities such as signing joint ventures with
foreign partners or obtaining new licensing agreements, rather than focused on R&D activities
(Acemoglu, Aghion, and Zilibotti, 2006; Ayyagari, Demirgüç-Kunt, and Maksimovic, 2011;
Schumpeter, 1942; Segerstrom, 1991). But recently, scholars have gradually noticed that
R&D activities are growing in emerging economies (Steinberg et al., 2018; Zhou et al., 2017),
where local markets are accelerating and cost of R&D is relatively advantageous (Chan, 2014;
Von Zedtwitz et al., 2007).
Although prior research has proposed several explanations of why firms engage in R&D in
emerging economies (Krammer, 2019; Zhou et al., 2017), yet relatively little is known about
detrimental consequences of a firm’s innovative strategy for the organization embedded in the
environment characterized by “institutional voids”. The lack of necessary institutions can lead
to an unstable and inefficient business climate (Khanna and Palepu, 1997; Khanna and Rivkin,
2001). Hence, scholars argue that the research on enterprise strategies in emerging economies
should be contextually specific (Hoskisson et al., 2000; Meyer and Peng, 2005; Wright et al.,
2005), and extant theories need to be reassessed and extended in order to confront this
strategic challenges (Xu and Meyer, 2013b).
As discussed before, whether an environment boosts or impedes a specific strategy and hence
leads to positive or negative anticipated feedback is determined by the interaction between the
strategy and the environment. Therefore, I suspect that the environmental characters of
emerging economies will lead to negative anticipated feedback on R&D investment in the
following ways. First, an innovative program normally requires substantial capital support for
many years before a new product can be successfully launched and superior profits realized
(Chang and Hsieh, 2011). Given government intervention in emerging economy capital
markets, it is quite hard for firms without official endorsements to obtain loans from the
banking system smoothly and continuously (Zheng et al., 2013). Meanwhile, raising funds

77
from stock markets or private investors is rare compared with developed countries, which
casts the shadow over new product launch and anticipated feedback on R&D strategy. Second,
the deficiency of legislation in terms of intellectual property rights and inefficient
enforcement of the related laws in emerging markets are widely noticed in the literature (Peng
et al., 2017). Once a firm decides to invest in R&D, these institutional deficiencies will affect
the firm’s future performance profoundly. If the property rights cannot be well protected from
being imitated by competitors, the anticipated profits extracting from this innovative strategy
will be eroded, and their ambition of improving competitive advantages through innovation
will be frustrated. Third, institutional changes are prevalent in emerging economies (Cuervo
‐ Cazurra and Genc, 2011; Santangelo and Meyer, 2011). The volatility in terms of
subversion of authorities, instability of regulatory institutions and capricious governance
structures increases firms’ costs (Xu and Meyer, 2013b). The anticipated result of a long-term
strategy like investing in R&D in this uncertain environment will not be optimistic.
Risk-taking behavior like bribery as a response to negative feedback has been reported in the
literature (Mishina et al., 2010; Xu et al., 2019). In line with this analysis, I propose that the
likelihood of resorting to illegal bribery will increase as a response to negative anticipated
feedback stemming from the R&D strategy implemented in emerging economies. As a
short-term oriented and problem driven risk-taking activity, bribery can help “grease the
wheel ” in order to reduce transaction costs and then improve anticipated feedback from
innovation activities (Krammer, 2019; Li, 2020). In sum, the unstable and high uncertain
characters of emerging economies make firms more fragile once they take R&D strategy.
Hence, I propose the situation molded by firms’ strategy of investing in R&D in emerging
economies may trigger negative anticipated feedback and hence illegal bribery immediately.
Hypothesis 1: A firm’s R&D input has a positive effect on its bribery in emerging economies.

78
3.2.4 The Moderating Role of Learning
Organizational learning as another important research direction of the BTOF suggests that the
prior experience of a firm’s activities can be captured and memorized, and this knowledge
accumulated can affect organizational performance later (Argote and Greve, 2007). Empirical
evidence shows that the relationship between experience and performance is positive since
practice and repetitions enhance efficiency (Argote, 2011).
Specifically, several studies have examined the relationship between a firm’s experience and
its innovation performance such as new product introductions (Moorman and Miner, 1997;
Mulotte, 2014; Nerkar and Roberts, 2004). Investigating 92 new product development
projects from 396 firms, Moorman and Miner (1997) find that organizational memory
increases both the performance and creativity of new products. Nerkar and Roberts (2004)
show that in the pharmaceutical industry, the experience in terms of technological knowledge
and product markets help firms realize high initial sales levels of their new product offerings.
In the aircraft industry, Mulotte (2014) finds that three different modes of new product
introduction such as internal developments, joint development and licensing are able to
benefit from the experiential learning in spite of the different marginal performance benefits
of experience.
In general, the above studies have observed a positive relationship between experience and
performance, which implies that firms are more sophisticated about evaluating the
environment and its impact on their innovative strategy when they have experience of success.
Since organizations are inclined to interpret the status in quo through their previous
experience (Haleblian, Kim & Rajagopalan, 2006), firms that have successfully launched new
products will be more able to manage performance expectations compared with those still
learning the knowledge about how to adapt to the discrepancy between innovative ambitions
and the deficient environment. Thus, the pressure of negative anticipated feedback of R&D

79
strategy in the context of emerging markets will be reduced by the organizational experience,
and the positive relationship between the strategy of R&D investment and illegal bribery will
be mitigated if a firm has been engaged in innovative activities and had innovation output.
Hypothesis 2: Innovation output negatively moderates the effect of R&D input on bribery in
emerging economies.
3.2.5 Alternative Mechanism: The Lens through General Strain Theory
The BTOF has been used as a theoretical framework for articulating the mechanism of
corporate illegal behavior when organizations are under the pressure of performance shortfalls
(Mishina et al., 2010; Xu et al., 2019). Meanwhile, the pressure stemming from the
discrepancy between expectations and actual achievements is merely one kind of strain which
may lead to deviant behaviors or economic crimes in line with a renowned sociological theory
– the general strain theory. Thus, in order to extend the boundary of the BTOF and provide
more nuanced theoretical implications, I advance my research by theory borrowing and
bringing ideas from this sociological theory to explain organizational behaviors. I argue that
organizational behaviors, especially illegal ones, can be triggered by three different kinds of
mechanism, instead of the only pressure of performance shortfalls the BTOF has articulated.
The strain theory provides the theoretical roots of the general strain theory (Agnew, 1992).
Merton (1938) observes that the institutional arrangements which refrain individuals from
achieving socially accepted goals with legitimate means will lead to crimes, especially
materialistic and economic ones. In other words, the economic crime is the result of the strain,
which can be defined as a tension between positive individual goals and negative external
conditions.
In formulating the general strain theory, Agnew (2001) argues that there are three specific
types of strain under the sphere of the failure to achieve positively valued goals. The first type

80
is the disjunction between expectations and actual achievements, which is also the concrete
measurement long elaborated in the BTOF. In particular, the expectations based on an
existential reference drives from the comparisons with the individuals’ past experience and
their counterparts’ performance. Most relevant empirical literature falls under this category
(Xu et al., 2019). The second type is the disjunction between aspirations and expectations,
which emerges when legitimate means cannot realize ideal goals. This is the classic definition
of strain from Merton, and the aspiration he emphasizes on is something utopian, but
acknowledged and encouraged by society. The third type is the disjunction between the fair
outcome and actual outcome that is quite different from the above two. It claims that if the
ratio of outcomes and inputs is unequal and underrewarded, individuals will suffer strain from
injustice no matter what the outcomes actually are (Hegtvedt, 1990). Individuals expect “that
certain distributive justice rules will be followed, and rules specifying how resources should
be allocated” (Agnew (1992: 53).
Compared to the articulation of the BTOF, I recognize that the related literature in
management only emphasizes on the first strain (discrepancy between expectations and actual
performance), but ignores the effect of last two categories (discrepancy between aspiration
and expectation; and discrepancy between fair outcomes and actual outcomes) on deviant
behaviors firms may take. However, in reality, these two types of strain can play important
roles in the relationship between firms’ innovative strategy and deviant or even illegal
behaviors.
Firms that decide to invest in R&D may have the ambition to change the world or benefit
human beings beyond the pure economic consideration (such as Xspace). The aspirational
level that innovative activities attempt to achieve is profoundly determined by the social value
and external pressure such as whether the culture can tolerate failures, or how much the
business environment emphasizes on success, especially economic or material ones (Cullen et

81
al., 2004; Martin et al., 2007). Whereas pragmatic expectations which can be statistically
measured by the past performance or the performance of competitors, the definition of
aspiration from the GST is quite utopian but is the fundamental motivation in progress of
human beings and the core stimulus of innovation. No matter what expectations that firms
calculate, the higher aspirational pressure the firms confront in society, the higher strain
stemming from the discrepancy between the utopian aspiration and pragmatic expectation.
Compared to developed markets which have been moving towards more abstract and less
materialistic goals (Burroughs and Rindfleisch, 2002), the extant literature has shown that the
materialism and achievement are still prevalent in emerging markets (Sharma, 2011; Wong
and Ahuvia, 1998). Hence, when firms invest in R&D in emerging economies characterized
with high material achievements, the high aspiration embedded in social values will amplify
the positive relationship between R&D input and bribery.
Hypothesis 3: The strain of aspiration positively moderates the effect of R&D input on
bribery in emerging economies.
As for the discrepancy between fair outcomes and actual outcomes, this strain derives from
the concept of equity. Taking a specific strategy referring to a variety of inputs, organizations
expect the allocation of inputs will be distributed following a justice rule so that the outcomes
produced can be fairly compared to those achieved by other actors in the market. Once they
notice that the output/input ratios is not equal to others, the organization will feel distressful,
and then may take actions to deal with this strain no matter whether the output is positive or
negative (Agnew, 1992).
Institutional voids in terms of shallow capital markets, ineffective legal enforcement, and
other political risks seriously impede a firm’s ability to invest in innovative projects such as
R&D activities (Yang, Sun, and Yang, 2015). However, these defects will be significantly

82
mitigated if the firm can get connections with the government (Musacchio, Lazzarini, and
Aguilera, 2015). For instance, Kotabe, Jiang, and Murray (2017) present that
emerging-market firms enhance their capability to acquire resource through political
networking, and then facilitate innovative activities. Zhou et al. (2017) prove that the state
ownership enables firms to obtain access to more resources with low costs to invest in R&D
activities. In general, government intervention actually distorts resources allocation in many
emerging countries (Hoskisson et al., 2000; Peng, 2003). Therefore, I propose that if firms
operating in an environment characterized with a discriminative principle of resource
allocation, the strain of unfairness will strengthen the positive relationship between R&D
input and bribery.
Hypothesis 4: The strain of unfairness positively moderates the effect of R&D input on
bribery in emerging economies.

83
Figure 3.1
Theoretical Framework
图 0- 1

84
3.3 Method
3.3.1 Sample
I use data from the Enterprise Survey (ES) conducted by the World Bank in developing
countries. This database contains detailed information of private firms covering a broad range
of business operation in terms of bribery, innovation, firms’ characters (age, size, etc.),
performance, etc. The ES following a rigorous methodology is stratified by geographic
location, firm size and the two-digital International Standard Industrial Classification code.
The results yielded by this database are representative, and research in international business
often uses it as a reliable resource (Jensen et al., 2010). Given the uniform, comparable
methodology across all countries and years has been implemented since 2006, I employ this
firm-level data from 2006 to 2017. I exclude firms in the service and retail industries, and
restrict my data to manufacturing firms only.
3.3.2 Variables and Measurement
Dependent variable.
The ES database uses many questions to capture the different aspects of corruption. However,
absorbing the critics from the previous research (Razafindrakoto and Roubaud, 2010), I
deliberately avoid adopting very specific questions which may incur problems such as
“inaccurate or selective memory, fear of reprisals by authorities, etc.” (Treisman, 2007: 216).
Instead, the questions roughly referring to bribery may be more proper in this study. I measure
a firm’s bribery in two ways. First, I use a dummy variable to indicate whether a firm is
involved in bribery from the question named bribery incidence. 1 means that a firm

85
experienced at least one bribe payment in the last 12 months; 0 means a firm never paid any
bribes. Second, I use a continuous variable, bribery depth, to measure the percentage of
instances where a firm is either expected or requested to provide a gift or informal payment
during solicitations for public services, licenses or permits. I exclude the respondents who
think the corruption is the biggest obstacle or the major problem of doing business in their
country given that the bribery I define in the theory is an active behavioral change to the
pressure rather than a reluctant response to corrupt officials.
Independent variable.
I measure the innovation input from the question “during the last fiscal year, did this
establishment spend on formal research and development activities, either in-house or
contracted with other companies, excluding market research surveys?” This dummy variable
indicates whether a firm invests into R&D activities or not.
Moderators.
The innovation output is measured by the question “during the last three years, has this
establishment introduced new or significantly improved products or services?” 1 means the
firm has had innovation output; otherwise the indictor is 0.
To capture the aspirational pressure and unfair strain at the country level, I aggregate the
individuals’ data from the World Value Survey (WVS) in wave 6 from two variables. The first
one is “being very successful is important to this person; to have people recognize one’s
achievement”. The scale is from 1: very much like me to 6: not at all like me. Scores are
recoded so that a high score means high aspiration pressure. Then, I calculate the

86
measurement of aspirational strain at the country level using the formula below. First, I
calculate the percentage of respondents in a country at each scale ( �����������
). Second, I multiply
the score minus the benchmark, which is 1, i.e., �� − 1 . Finally, I sum all of them to get a
final indictor presenting the aspirational strain for each country. Logarithm is necessary as the
score is too large.
������������� ������ = log [��=6
1���
��������� �� − 1 ] (3.1)
The second one is “to what extent, do you agree: 1- in the long run, hard work usually brings
a better life to 10 - hard work dose not generally bring success — it’s more a matter of luck
and connections”. The higher the score, the higher unfair strain people undertake. As above, I
calculate the measurement of unfair strain at the country level using the following formula:
������� ������ = log [��=10
1���
��������� �� − 1 ] (3.2)
More proxy variables in the robustness checks will be discussed in the next section.
Control variables.
I control for a set of firm-level variables that may influence a firm’s decision on R&D input
and control for firms’ heterogeneity. First, I control for firm size in terms of the number of
permanent and temporary workers. The number of temporary workers is adjusted for the
number of months of their employment. Second, I control for the firm age, i.e., the number of
years elapsed since a firm was established. Third, I control for the ownership. 1 means the
firm is 100% foreign-owned; otherwise it is 0. Fourth, I control for export (dummy variable: 1
when at least 10 percent of a firm’s annual sales is derived from direct exports, otherwise 0) to

87
capture possible differences between domestic-market and export-oriented firms. Fifth, I
control for firm performance using real annual sales growth, which is measured as the
percentage change in sales between the last completed fiscal year and previous one, and all
sales values are deflated to 2009 using each country’s GDP deflator. Finally, I control for
public to measure whether a firm is a public company or not, and top managers’ working
experience in the same industry. Besides, I include the year, country and industry fixed effects
dummy variables in all the regression models to account for the within-group variation over
time, and mitigate the potential bias caused by omitted variables.
3.4 Analysis and Results
3.4.1 Results
Table 3.1 shows the means, standard deviations, and correlation matrix for all the variables.
The correlations among variables suggest that multicollinearity is not a major problem, as
confirmed by the variance of inflation factor (VIF) ranging from 1.02 to 1.25, which is far
below the criteria value of 10.
Table 3.2 demonstrates the estimation results for the impact of innovation input on firms’
bribery. Since the measurement of firms’ bribery is a dummy variable, I use logistic
regression. The year, country and industry effects are fixed by the respective dummy variables
in models 1 and 2; while the country effects are not included in models 3, 4 and 5 because the
moderators of strains are at the country-level.

88
Table 3.1
Descriptive Statistics and Correlation Matrix表格 0.1
Variables Mean Std.Dev. 1 2 3 4 5 6 7 8 9 10 11 12
1 Bribery 0.181 0.385 1.000
2 R&D input 0.344 0.475 0.068* 1.000
3 Innovation output 0.49 0.500 0.025* 0.393* 1.000
4 Aspirational strain 7.685 0.370 0.071* -0.115* -0.158* 1.000
5 Unfair strain 7.079 0.515 0.047* 0.095* 0.068* 0.197* 1.000
6 Size 2.006 0.774 -0.016* 0.226* 0.143* -0.052* 0.003 1.000
7 Age 23.057 17.678 -0.049* 0.098* 0.093* -0.223* -0.098* 0.206* 1.000
8 Ownership 0.095 0.293 -0.020* 0.071* 0.067* -0.067* -0.103* 0.188* 0.062* 1.000
9 Exporter 0.221 0.415 -0.015 0.158* 0.098* -0.088* -0.067* 0.295* 0.103* 0.230* 1.000
10 Performance 1.106 25.131 -0.016* 0.089* 0.072* -0.030* 0.047* 0.047* -0.041* 0.016* 0.032* 1.000
11 Public 0.049 0.215 -0.007 0.059* 0.021* -0.022* -0.073* 0.129* 0.120* 0.104* 0.084* -0.008 1.000
12 Experience 19.907 11.564 -0.067* 0.050* 0.070* -0.188* -0.218* 0.075* 0.326* -0.027* 0.069* -0.010 0.015 1.000
* shows significance at the .05 level

89
Table 3.2Results from Logistic Regression
表格 0.2
Model 1 Model 2 Model 3 Model 4 Model 5
Variables Bribery incidence (dummy variable)
R&D input 0.630*** 0.751*** 0.569*** 0.555*** 0.714***
(0.048) (0.074) (0.049) (0.050) (0.073)
R&D input × Innovation output -0.271*** -0.254***
(0.093) (0.092)R&D input × Aspirational strain 0.569*** 0.468***
(0.116) (0.119)
R&D input × Unfair strain 0.258*** 0.157*
(0.085) (0.086)
Innovation output 0.234*** 0.160*** 0.165*** 0.251***
(0.059) (0.046) (0.046) (0.057)Aspirational strain -0.155** -0.072 -0.141*
(0.076) (0.074) (0.077)
Unfair strain -0.616*** -0.601*** -0.606***
(0.070) (0.071) (0.070)
Size -0.043 -0.053* -0.069** -0.064** -0.069**
(0.030) (0.030) (0.029) (0.029) (0.029)Age -0.003** -0.003** -0.005*** -0.005*** -0.005***
(0.001) (0.001) (0.001) (0.001) (0.001)
Ownership -0.004 -0.010 -0.026 -0.025 -0.024
(0.080) (0.080) (0.078) (0.078) (0.078)
Exporter -0.038 -0.039 -0.042 -0.045 -0.042
(0.058) (0.058) (0.056) (0.056) (0.056)Performance -0.000 -0.000 -0.001 -0.001 -0.001
(0.001) (0.001) (0.001) (0.001) (0.001)
Public 0.015 0.018 0.038 0.048 0.047
(0.101) (0.101) (0.100) (0.100) (0.100)
Experience 0.001 0.001 -0.002 -0.001 -0.001
(0.002) (0.002) (0.002) (0.002) (0.002)Constant -3.543*** -3.661*** 3.915*** 3.182*** 3.694***
(0.592) (0.594) (0.819) (0.808) (0.821)
Year fixed effects Yes Yes Yes Yes Yes
Country fixed effects Yes Yes No No No
Industry fixed effects Yes Yes Yes Yes Yes
Observations 17,085 17,085 17,201 17,201 17,201Pseudo R-squared 0.0896 0.0906 0.0576 0.0569 0.0583
Robust standard errors in parentheses. *** p<0.01, ** p<0.05, * p<0.1

90
Table 3.2 contains the estimation results from the logistic regression both with and without
the dummy variable of bribery. Hypothesis 1 predicts that innovation input (R&D) will exert a
positive effect on firms’ bribery. Consistent with this assertion, the coefficient of innovation
input is positive and significant ( β=0.627, p=0.000 ) in Model 1. In terms of the marginal
effect, when firms invest in R&D, the likelihood of their engaging into bribery increases
8.13%.
I also report the moderating effects in terms of innovation output, aspirational strain and
unfair strain (Model 2, 3 and 4). Hypothesis 2 predicts that the positive relationship between
R&D investment and firms’ bribery will be mitigated by the experience of launching new
products. My finding confirms that the interaction between R&D input and R&D output
exerts a negative effect on firms’ bribery in Model 2 ( β=-0.271, p=0.004 ), in support of
hypothesis 2.
Hypothesis 3 predicts that the positive relationship between R&D investment and a firm’s
bribery incidence will be amplified with high aspirational strain of a nation. This hypothesis is
supported by the result in Model 3 since the coefficient of the interaction item between R&D
input and aspirational strain is positive and significant (β=0.569, p=0.000).
Hypothesis 4 predicts that the strain of unfairness will strengthen the positive relationship
between innovation input and bribery. Since the coefficient of the interaction between R&D
input and unfair strain is significantly positive (β=0.258, p=0.002) in Model 4, hypothesis 4 is
supported.
It is argued that the interaction effect of a nonlinear model may not be truly reflected by the

91
coefficients and the interpretation of coefficients, and should be combined with the graph (Ai
and Norton, 2003; Wiersema and Bowen, 2009). Therefore, I further plot the moderating
effects in terms of innovation output (Figure 3.2), aspirational strain (Figure 3.3) and unfair
strain (Figure 3.4). I display the effect of innovation input on bribery in a firm with and
without innovation output experience respectively in Figure 3.2. It shows that innovation
output will suppress the firm’s bribery when it invests in R&D activities. Figures 3.3 and 3.4
exhibit the effects of innovation input on bribery when firms operate in a nation with different
levels of aspirational strain and unfair strain. Consistent with my predictions, the marginal
effects of innovation input on a firm’s bribery becomes stronger when the aspirational strain
and unfair strain increase. Hence, hypotheses 3 and 4 are supported.
Figure 3.2
The Interaction Between Innovation Input and
Output
图 0- 2

92
Figure 3.3
The Interaction Between Innovation Input andAspirational Strain
图 0- 3
Figure 3.4
The Interaction Between Innovation Input and Unfair Strain
图 0- 4

93
3.4.2 Robustness Check and Additional Analyses
3.4.2.1 Propensity Score Matching
Given the sensitive nature of bribery, non-response rates of corrupt questions are normally
quite high. Accordingly, the selection bias is an inevitable problem for any research based on
the ES database. To mitigate this problem, I employ the technique called propensity score
matching, which “mimics some of the particular characteristics of a randomized controlled
trial” (Austin, 2011: 399). To implement this approach, I run a logistic regression to control
for observable preexisting traits that can influence the decision of engaging into R&D input.
Simply put, the independent variables in this first-stage model are all the control variables
used before. Then, I use this model to create a propensity-matching of firms with similar
circumstances, where firms engaged into R&D input are called treatment firms, and those not
engaged into R&D are control firms. The dealing process is based on one-to-one matching
without replacement, and I fix the distance (caliper width equals to 0.05 times) between the
treatment firms and control firms to ensure the matched observations are similar.
Table 3.3 provides descriptive statistics by R&D input, with and without propensity score
matching, and difference-in-means test for the propensity-matched sample. Given that there
are no longer any statistically significant differences in the control variables across the
treatment firms and control firms in the post-matched sample, it seems that the matched
sample has achieved the covariate balance. The difference-in-means test for bribery incidence
in the post-matched sample reveals that the firms with R&D input are more likely to engage
into bribery compared to the firms without R&D input. This is consistent with the results in

94
Table 3.2, and providing additional support for the main hypothesis. As for the marginal effect,
under the similar economic circumstances, the rate of bribery incidence of the firms with
R&D input is 7.7 percent higher than that of the firms without R&D input (19.2-12.7). This
indicates a 55.39 percent increase in the bribery incidence from the baseline rate of bribery for
the control firms.
Table 3.3
Results from Propensity Score Matching
Pre-match Post-match
R&D
input
No R&D
input
Difference in
means
R&D
input
No R&D
input
Difference in
means
Variables Mean Mean %bias p-value Mean Mean %bias p-value
Bribery 0.216 0.162 13.9 0.000 0.216 0.139 19.7 0.000
Size 2.248 1.879 49.3 0.000 2.247 2.248 -0.1 0.971
Age 25.459 21.855 19.8 0.000 25.444 25.188 1.4 0.477
Ownership 0.124 0.079 14.7 0.000 0.124 0.131 -2.4 0.240
Exporter 0.311 0.174 32.4 0.000 0.310 0.308 0.4 0.826
Performance 4.174 -0.512 19.1 0.000 4.158 3.847 1.3 0.470
Public 0.066 0.038 12.4 0.000 0.065 0.067 -0.6 0.780
Experience 20.720 19.549 10.1 0.000 20.714 20.623 0.8 0.670
N 5,911 11,211 5,911 5,911
Year, country and industry effects are fixed but not shown here.
表格 0.3
3.4.2.2 Testing for reserve causality
Given the cross-sectional nature of dataset, I cannot use traditional methods such as lagging
explanatory variables to reduce the possibility of reverse causality. To remedy this concern, I
propose that a proper instrument variable should be employed to limit this potential bias.
Following (Ai and Norton, 2003; Wiersema and Bowen, 2009), I use two-stage least squares
(2SLS) to test whether the main variable has any endogenous problem including reverse

95
causality, and circumvent bias with instrumental variables. To implement this approach, I use
the innovative efficiency ration of a nation as the instrumental variable. This index is
published by the World Intellectual Property Organization annually, and shows how much
innovation output a given country is getting for its input. I expect that firms will be more
likely to invest in R&D activities when the efficiency of innovation is high in a given country.
In the developing world, the top five countries are China, Turkey, Vietnam, Ukraine and
Bulgaria, and their world rankings are 3, 9, 10, 11 and 15 respectively in 2017. At the same
time, it is not clear whether the efficiency of innovation of a country would impact a firm’s
illegal actions.
Given that the original regression is non-linear, I use command “ivprobit” in STATA to
calculate the results for the two stages (Table 3.4). First, the instrumental variable is
significantly positive for the independent variable (β=0.297, p=0.000). The F-statistic is 36.70
and larger than 10, which shows the proposed instrument is a valid determinant of innovation
input. Then, the result of Wald exogeneity test ( p=0.000 ) rejects the null hypothesis that
innovation input is exogenous, which means the result of the second stage (Column 2) is valid.
Finally, I run the command “weakiv” to do weak-identification-robust inference. Given that
the Anderson-Rubin test and Wald test are highly significant (p=0.000), the weak instrument
problem is not present in my estimations. Hence, I can be confident about the results, as
reverse causality is not a major issue which would change the prediction of hypothesis.

96
Table 3.4
Two-stage Least Squares Estimation表格 0.4
IV-probit
First-stage Second-stage
Variables Innovation input Bribery incidence
Innovation input 8.066**
(3.23)
Instrument variableEfficiency ratio 0.297***
(12.80)
Control variablesSize 0.102*** -0.669**
(23.37) (-3.14)
Age 0.001*** -0.002
(3.67) (-0.66)
Ownership -0.011 -0.030
(-0.79) (-0.23)
Exporter 0.091*** -0.894**
(9.82) (-2.98)
Performance 0.001*** -0.005**
(8.60) (-2.64)
Public 0.027 -0.617*
(1.47) (-2.27)
Experience -0.001*** -0.001(-3.74) (-0.32)
_cons -0.186*** -2.243*
(-8.72) (-2.46)
N 18219 11783
F-test 36.70
Adjust R2 0.1473
Weak instrument testsAnderson-Rubin test chi2 = 52.09 p= 0.000Wald test chi2 = 10.41 p= 0.000
Exogeneity testWald test of exogeneity chi2 = 47.03 p= 0.000
t statistics in parentheses* p < 0.05, ** p < 0.01, *** p < 0.001Year, country and industry effects are fixed but not shown here.

97
3.4.2.3 Subsamples and other instruments
Subsamples. Since I aim to capture the active rather than passive bribery of firms, I exclude
the respondents who believe that the corruption is the biggest obstacle or a major constraint of
doing business in this country. I examine whether my results remain the same if I focus on the
active bribery of firms. I obtain highly consistent results for all the hypotheses in this
subsample (Table 3.5). Besides, the coefficient of innovation input in Model 1 is much higher
than that from the original logistic regression (Model 1 in Table 3.2), and I can assert that
there is strong evidence supporting hypothesis 1.
Bribery depth and tobit regression. The ES database allows me to measure bribery in terms of
the percentage of instances where a firm is either expected or requested to provide a gift or
informal payment during solicitations for public services, licenses or permits. As this
continuous variable is left censored at 0, I also use tobit regression to estimate the model. I
find that all the hypotheses are supported as the directions and significant levels of the
coefficients remain the same (Table 3.6)

98
Table 3.5 Results from Subsamples表格 0.5
Model 1 Model 2 Model 3 Model 4 Model 5
Variables Bribery incidence (dummy variable)
R&D input 0.816*** 0.929*** 0.753*** 0.712*** 0.853***
(0.068) (0.098) (0.070) (0.074) (0.101)
R&D input× Innovation output -0.265** -0.252*
(0.128) (0.129)R&D input ×Aspirational strain 0.541*** 0.380**
(0.178) (0.181)
R&D input ×Unfair strain 0.420*** 0.340**
(0.136) (0.137)
Innovation output 0.187** 0.080 0.088 0.186**
(0.085) (0.066) (0.066) (0.085)Aspirational strain 0.150 0.056 0.144 0.082
(0.118) (0.124) (0.119) (0.125)
Unfair strain -0.548*** -0.562*** -0.536*** -0.547***
(0.116) (0.114) (0.116) (0.114)
Size -0.125*** -0.133*** -0.132*** -0.127*** -0.131***
(0.043) (0.042) (0.042) (0.042) (0.042)Age -0.003 -0.005** -0.005** -0.005** -0.005**
(0.002) (0.002) (0.002) (0.002) (0.002)
Ownership 0.010 -0.029 -0.023 -0.013 -0.014
(0.115) (0.112) (0.112) (0.112) (0.112)
Exporter 0.025 0.003 0.006 0.004 0.007
(0.084) (0.081) (0.081) (0.081) (0.081)Performance -0.001 -0.002* -0.002* -0.002 -0.002*
(0.001) (0.001) (0.001) (0.001) (0.001)
Public 0.016 0.096 0.095 0.114 0.117
(0.141) (0.140) (0.140) (0.140) (0.140)
Experience -0.003 -0.006* -0.007** -0.006* -0.006*
(0.003) (0.003) (0.003) (0.003) (0.003)Constant -4.259*** 0.981 1.900 1.056 1.572
(0.864) (1.280) (1.318) (1.280) (1.316)
Year fixed effects Yes Yes Yes Yes Yes
Country fixed effects Yes Yes No No No
Industry fixed effects Yes Yes Yes Yes Yes
Observations 9,702 9,811 9,811 9,811 9,811Pseudo R-squared 0.108 0.0790 0.0795 0.0796 0.0806
Robust standard errors in parentheses. *** p<0.01, ** p<0.05, * p<0.1

99
Table 3.6 Results from Tobit Regression表格 0.6
Model 1 Model 2 Model 3 Model 4 Model 5
Variables Bribery depth (continuous variable)
R&D input 0.345*** 0.446*** 0.322*** 0.312*** 0.428***
(0.028) (0.045) (0.030) (0.030) (0.045)
R&D input × Innovation output -0.204*** -0.179***
(0.057) (0.057)R&D input × Aspirational strain 0.373*** 0.314***
(0.071) (0.074)
R&D input × Unfair strain 0.152*** 0.079
(0.053) (0.055)
Innovation output 0.162*** 0.092*** 0.094*** 0.152***
(0.036) (0.029) (0.029) (0.036)Aspirational strain -0.039 -0.082* -0.041 -0.077*
(0.045) (0.047) (0.045) (0.047)
Unfair strain -0.380*** -0.383*** -0.369*** -0.376***
(0.041) (0.040) (0.041) (0.040)
Size -0.036** -0.048*** -0.048*** -0.045** -0.048***
(0.018) (0.018) (0.018) (0.018) (0.018)Age -0.002** -0.003*** -0.003*** -0.003*** -0.003***
(0.001) (0.001) (0.001) (0.001) (0.001)
Ownership -0.011 -0.033 -0.028 -0.027 -0.028
(0.047) (0.048) (0.048) (0.048) (0.048)
Exporter -0.025 -0.035 -0.029 -0.033 -0.029
(0.034) (0.034) (0.034) (0.034) (0.034)Performance -0.000 -0.001 -0.001 -0.001 -0.001
(0.000) (0.001) (0.001) (0.001) (0.001)
Public 0.010 0.027 0.027 0.032 0.032
(0.061) (0.062) (0.062) (0.062) (0.062)
Experience 0.001 -0.001 -0.001 -0.001 -0.001
-0.036** (0.001) (0.001) (0.001) (0.001)Constant -1.909*** 1.954*** 2.345*** 1.939*** 2.228***
(0.326) (0.495) (0.498) (0.494) (0.499)
Year fixed effects Yes Yes Yes Yes Yes
Country fixed effects Yes Yes No No No
Industry fixed effects Yes Yes Yes Yes Yes
Observations 17,203 17,203 17,203 17,203 17,203Pseudo R-squared 0.0773 0.0486 0.0491 0.0483 0.0497
Robust standard errors in parentheses. *** p<0.01, ** p<0.05, * p<0.1

100
Alternative instruments for moderators. I use the answer to the question “during the last three
years, has this establishment introduced any new or significantly improved process” to
substitute the index of innovation output. The proxy variable for the aspirational strain is “it is
important to this person to be rich; to have a lot of money and expensive things”. The scale is
from 1: very much like me to 6: not at all like me. Scores are recoded so that a higher score
means higher aspirational strain in terms of being rich. Since all the argument of unfairness in
the theoretical part is based on the different ownership between private-owned and
state-owned, the proxy variable of unfair strain is “to what extant, do you agree: 1- private
ownership of business and industry should be increased to 10- government ownership of
business and industry should be increased”. Scores are recoded so that a high score means
high unfair feeling about ownership. As indicated in Table 3.7, the hypotheses are supported
except hypothesis 2. It seems that learning experience is not as important for incremental
innovation as t for radical innovative investments. Different domains of innovative experience
may draw different results, which still consists with the previous literature (Eggers and Suh,
2019; Le, 2017)

101
Table 3.7 Results from Other Instruments for Moderators表格 0.7
Model 1 Model 2 Model 3 Model 4 Model 5
Variables Bribery incidence (dummy variable)
R&D input 0.630*** 0.499*** 0.489*** 0.471*** 0.496***
(0.048) (0.092) (0.049) (0.051) (0.090)
R&D input × Innovation output 0.074 -0.033
(0.104) (0.103)R&D input ×Aspirational strain 0.466*** 0.293***
(0.071) (0.097)
R&D input × Unfair strain 0.756*** 0.425***
(0.115) (0.156)
Innovation output 0.218*** 0.285*** 0.290*** 0.297***
(0.058) (0.048) (0.048) (0.056)Aspirational strain 0.006 0.059 0.033
(0.089) (0.090) (0.090)
Unfair strain -0.287*** -0.371*** -0.331***
(0.087) (0.090) (0.091)
Size -0.043 -0.053* -0.066** -0.065** -0.066**
(0.030) (0.030) (0.029) (0.029) (0.029)Age -0.003** -0.003** -0.004*** -0.004*** -0.004***
(0.001) (0.001) (0.001) (0.001) (0.001)
Ownership -0.004 0.004 -0.003 0.002 0.001
(0.080) (0.080) (0.078) (0.078) (0.078)
Exporter -0.038 -0.040 -0.055 -0.052 -0.053
(0.058) (0.058) (0.056) (0.056) (0.056)Performance -0.000 -0.001 -0.001* -0.001 -0.001*
(0.001) (0.001) (0.001) (0.001) (0.001)
Public 0.015 0.002 0.038 0.053 0.046
(0.101) (0.101) (0.100) (0.100) (0.100)
Experience 0.001 0.001 -0.001 -0.001 -0.001
(0.002) (0.002) (0.002) (0.002) (0.002)Constant -3.543*** -3.619*** 0.566 0.786 0.702
(0.592) (0.595) (0.859) (0.863) (0.864)
Year fixed effects Yes Yes Yes Yes Yes
Country fixed effects Yes Yes No No No
Industry fixed effects Yes Yes Yes Yes Yes
Observations 17,085 17,033 17,150 17,150 17,150Pseudo R-squared 0.0896 0.0912 0.0556 0.0554 0.0560
Robust standard errors in parentheses. *** p<0.01, ** p<0.05, * p<0.1

102
3.5 Discussion and Conclusion
This study seeks to untangle whether firms take a deviant risk-taking action under the
pressure of anticipated negative feedback triggered by a previous strategy without explicit,
observable performance shortfalls, and how the environmental context plays the role in the
process of decision-making. Guided by the BTOF, I find that innovative firms are more likely
to resort to illegal bribery in the emerging markets characterized with institutional voids as the
anticipated feedback of investing in R&D tends to be negative. I also find that the possession
of relevant experience (i.e. R&D output) enables firms to alleviate the motivation to deal with
problems via (or by using) bribery. In addition, I extend the theoretical model by explaining
deviant behaviors from the insights of GST, and indirectly prove that, in line with the BTOF,
the other two categories of pressure, strain of aspiration and unfairness, play a similar role to
that of expectations in explaining the innovation – bribery relationship. My study contributes
to theory development and management practices in the following ways.
3.5.1 Theoretical Contribution
First, I analyze the reason of organizational behavior changes by focusing on firms’ potential
and dynamic anticipation, rather than explicit and concrete performance records. This focus
allows me to take a more nuanced and practical approach to examining the relationship
between R&D investment and bribery, using BTOF to explain why firms originally intending
to build long-term competitive advantages may divert towards an illegal, risk-taking solution.
The prior BTOF-based studies use the explicit performance feedback as the only predictor of
problemistic search, assuming that the decision-making process and behavioral changes are
based on a strict comparison between expectations and the recorded performance. However,
the core of BTOF is the concept of bounded rationality, which emphasizes on non-optimal
decisions made by an organization in accordance with the limited information and bias
preferences. Cyert and March (1968) also point out that it is the evidence of bounded

103
rationality that will be demonstrated by no obvious time interval between previous strategies
and subsequent responses due to the unconscious reaction rather than the prudent evaluation.
The cycle of strategy – feedback – reaction actually is dynamic. It would be too late for firms
to react until the concrete performance results are available. Hence, once a strategy is
formulated, a firm will consistently monitor the fit between the strategy and business
environment, and adjust actions based on its anticipations. As a result, I often observe the
relationship between strategy and reaction, while the feedback which draws from the previous
strategy and determines the subsequent response is only anticipated and unobservable. My
research highlights this possibility and provides a clear explanation of anticipated feedback,
and extends the boundary of performance feedback defined by the previous empirical studies.
Second, I offer and empirically test the behavioral mechanism pertaining to a specific context
– emerging markets in my study. Whereas prior research shows their attention to institutional
arrangements through deploying moderating effects (Krammer, 2019; Xu et al., 2019), I
believe that the environment should be viewed as an paramount factor and discussed as the
direct mechanism in the relationship between R&D strategy and bribery. Given the
delineation of the BTOF, the external environment is an important force which can be
endogenized to be an impartible decision-making process, rather than just an exogenous
factor which only magnifies or shrinks the existing relationship. Therefore, my study tests the
theoretical framework by deliberately setting the context in emerging economies in order to
investigate the underlying effect of the environment on firms’ anticipated feedback and
process of decision-making.
Third, I contribute to the literature about the antecedents of deviant behaviors or illegal
actions by testing other two kinds of strain described in the GST from sociology. I prove that
the discrepancy between expectations and actual achievements is not only the mechanism for
problemistic search, but also one category of pressure which may trigger economic crimes

104
such as bribery. Although I have not explored this aspect further, integrating views from the
different disciplines can broaden our horizon and deepen our understanding of illegal
behavior such as bribery.
3.5.2 Practical Implications
My results also provide some practical implications. Bribery is a prevalent phenomenon in
many countries, which seriously undermines innovation and economic growth (Anokhin and
Schulze, 2009; Cuervo-Cazurra, 2016; Murphy et al., 1993). How to detect and prevent this
problem thus is a tough but critical task for policy-makers and regulators. My findings
suggest that innovative firms actually are vulnerable as they confront the pressure of
launching new products and exerting profit to improve performance, and then have high
tendency to bribe in emerging economies. Hence, governments should pay close attention to
innovative firms even they are conventionally viewed as a kind of long-term oriented, creative
organizations. Regulators and investors should also pay attention to younger and smaller
firms, as they are likely to resort to bribery when aspirational and unfair strain amplified by
the environment (the coefficients of firms’ age and size are significantly negative). Whereas
some prior studies find that innovation output will lead to bribery or corruption (Ayyagari et
al., 2014; Krammer, 2019), my research brings us back to a neutral position on innovation.
Engaging in R&D activities may push firms to go astray when investments themselves are too
risky, but having innovative experience such as successfully launching R&D outputs will
restrain firms’ tendency to bribe according to my evidence. To policy-makers and investors,
therefore, the possibility to bribe should be evaluated in different phases of innovation, which
may help restore the public’s confidence in innovative firms and judge their innovative
activities fairly.
Although I have not directly argued and proven the influence of environment on bribery, I still
believe that sound institutions are the fundamental pillars for a clean society. An efficient

105
capital market, strong judiciary system and stable political environment are essential for all
kinds of business including innovative activities. The lower the motivation for firms to search
problem solution, the lower the possibility of bribery being triggered by the previous strategy.
Moreover, I remind policy-makers of noticing the role of informal institutions in bribery. The
risk of bribery will increase when a society is obsessed with success and materialism, or
undermines the fairness and justice (Ai and Norton, 2003). Hence, government should pay
more attention to and help improve this climate of the whole society.
3.5.3 Limitations and Future Research Directions
Although I propose that unfavorable environments would decrease the anticipated negative
feedback of innovation and then induce firms’ decisions to engage in bribery, I are unable to
observe directly this cognitive process. Unfortunately, the data available for us cannot provide
information on the decision-making process I theorized. This difficulty is expected when I
designed my research since secondary data would not completely fit my needs. Future
research should continue to explore this issue to differentiate more explicit mechanisms.
Second, although I examine the moderating effect of innovation output on alleviation of
pressure to bribe, there may be benefits to exploring other knowledge or capabilities firms
obtain or build to resist on the myopic solution to deal with anticipated performance falling.
Finally, my finding implies that the external environment has a complex relationship with
illegal behavior from both formal and informal aspects. Future research should continue to
examine mechanisms in which a particular one affects firms’ behavior changes.

106
Reference
Acemoglu D, Aghion P, Zilibotti F. 2006. Distance to frontier, selection, and economic growth.
Journal of the European Economic association 4(1): 37-74.
Agnew R. 1992. Foundation for a general strain theory of crime and delinquency.
Criminology 30(1): 47-88.
Agnew R. 2001. Building on the foundation of general strain theory: Specifying the types of
strain most likely to lead to crime and delinquency. Journal of research in crime and
delinquency 38(4): 319-361.
Ai C, Norton EC. 2003. Interaction terms in logit and probit models. Economics letters 80(1):
123-129.
Anokhin S, Schulze WS. 2009. Entrepreneurship, innovation, and corruption. Journal of
business venturing 24(5): 465-476.
Argote L. 2011. Organizational learning research: Past, present and future. Management
learning 42(4): 439-446.
Argote L, Greve HR. 2007. A behavioral theory of the firm—40 years and counting:
Introduction and impact. Organization science 18(3): 337-349.
Audia PG, Greve HR. 2006. Less likely to fail: Low performance, firm size, and factory
expansion in the shipbuilding industry.Management science 52(1): 83-94.
Austin PC. 2011. An introduction to propensity score methods for reducing the effects of
confounding in observational studies. Multivariate behavioral research 46(3): 399-424.
Ayyagari M, Demirgüç-Kunt A, Maksimovic V. 2011. Firm innovation in emerging markets:
The role of finance, governance, and competition. Journal of Financial and Quantitative
Analysis 46(6): 1545-1580.
Ayyagari M, Demirgüç-Kunt A, Maksimovic V. 2014. Bribe payments and innovation in
developing countries: Are innovating firms disproportionately affected? Journal of
Financial and Quantitative Analysis 49(1): 51-75.
Bromiley P. 1991. Testing a causal model of corporate risk taking and performance. Academy
of Management journal 34(1): 37-59.
Burroughs JE, Rindfleisch A. 2002. Materialism and well-being: A conflicting values
perspective. Journal of Consumer research 29(3): 348-370.
Chan AL-C. 2014. Innovation efficiency and asymmetric timeliness of earnings: Evidence
from an emerging market. International Review of Financial Analysis 32: 132-142.
Chang WS, Hsieh JJ. 2011. Intellectual capital and value creation-is innovation capital a

107
missing link? International Journal of Business and Management 6(2): 3.
Chen WR, Miller KD. 2007. Situational and institutional determinants of firms' R&D search
intensity. Strategic Management Journal 28(4): 369-381.
Cho SY, Arthurs JD, Townsend DM, Miller DR, Barden JQ. 2016. Performance deviations
and acquisition premiums: The impact of CEO celebrity on managerial risk‐taking.
Strategic Management Journal 37(13): 2677-2694.
Cloward RA, Lloyd E. Ohlin. 1960. Delinquency and opportunity: A theory of delinquent
gangs: A17.
Cohen AK. 1955. Delinquent boys; The culture of the gang.
Cuervo-Cazurra A. 2016. Corruption in international business. Journal of World Business
51(1): 35-49.
Cuervo‐Cazurra A, Genc ME. 2011. Obligating, pressuring, and supporting dimensions of
the environment and the non‐market advantages of developing‐country multinational
companies. Journal of management studies 48(2): 441-455.
Cullen JB, Parboteeah KP, Hoegl M. 2004. Cross-national differences in managers'
willingness to justify ethically suspect behaviors: A test of institutional anomie theory.
Academy of Management Journal 47(3): 411-421.
Cyert RM, March JG. 1968. A behavioral theory of the firm. Englewood Cliffs, NJ 2(4):
169-187.
Eggers J, Kaul A. 2018. Motivation and ability? A behavioral perspective on the pursuit of
radical invention in multi-technology incumbents. Academy of Management Journal
61(1): 67-93.
Eggers J, Suh J-H. 2019. Experience and behavior: How negative feedback in new versus
experienced domains affects firm action and subsequent performance. Academy of
Management Journal 62(2): 309-334.
Greve HR. 2003. A behavioral theory of R&D expenditures and innovations: Evidence from
shipbuilding. Academy of management journal 46(6): 685-702.
Haleblian J, Kim J-Y, Rajagopalan N. 2006. The influence of acquisition experience and
performance on acquisition behavior: Evidence from the US commercial banking
industry. Academy of management journal 49(2): 357-370.
Harris J, Bromiley P. 2007. Incentives to cheat: The influence of executive compensation and
firm performance on financial misrepresentation. Organization Science 18(3): 350-367.
Hegtvedt KA. 1990. The effects of relationship structure on emotional responses to inequity.

108
Social Psychology Quarterly: 214-228.
Hoskisson RE, Eden L, Lau CM, Wright M. 2000. Strategy in emerging economies. Academy
of management journal 43(3): 249-267.
Iriyama A, Kishore R, Talukdar D. 2016. Playing dirty or building capability? Corruption and
HR training as competitive actions to threats from informal and foreign firm rivals.
Strategic Management Journal 37(10): 2152-2173.
Iyer DN, Miller KD. 2008. Performance feedback, slack, and the timing of acquisitions.
Academy of Management Journal 51(4): 808-822.
Jensen NM, Li Q, Rahman A. 2010. Understanding corruption and firm responses in
cross-national firm-level surveys. Journal of International Business Studies 41(9):
1481-1504.
Joseph J, Gaba V. 2015. The fog of feedback: Ambiguity and firm responses to multiple
aspiration levels. Strategic Management Journal 36(13): 1960-1978.
Kacperczyk A, Beckman CM, Moliterno TP. 2015. Disentangling risk and change: Internal
and external social comparison in the mutual fund industry. Administrative Science
Quarterly 60(2): 228-262.
Kahneman D, Tversky A. 1979. Prospect Theory: An Analysis of Decision under Risk.
Econometrica 47(2): 263-292.
Katila R, Ahuja G. 2002. Something old, something new: A longitudinal study of search
behavior and new product introduction. Academy of management journal 45(6):
1183-1194.
Khanna T, Palepu K. 1997. Why focused strategies may be wrong for emerging markets.
Harvard business review 75: 41-54.
Khanna T, Rivkin JW. 2001. Estimating the performance effects of business groups in
emerging markets. Strategic management journal 22(1): 45-74.
Kim J-Y, Finkelstein S, Haleblian J. 2015. All aspirations are not created equal: The
differential effects of historical and social aspirations on acquisition behavior. Academy
of Management Journal 58(5): 1361-1388.
Kotabe M, Jiang CX, Murray JY. 2017. Examining the complementary effect of political
networking capability with absorptive capacity on the innovative performance of
emerging-market firms. Journal of management 43(4): 1131-1156.
Krammer SM. 2019. Greasing the wheels of change: Bribery, institutions, and new product
introductions in emerging markets. Journal of Management 45(5): 1889-1926.
Kuusela P, Keil T, Maula M. 2017. Driven by aspirations, but in what direction? Performance
109
shortfalls, slack resources, and resource‐consuming vs. resource‐freeing
organizational change. Strategic management journal 38(5): 1101-1120.
Le STK. Year. Innovation and bribery-an analysis of informal payment determinants. In
Proceedings of the Academy of Management Proceedings.
Li C. 2020. Enhancing or inhibiting: The impact of investment in political ties on the link
between firm innovation and productivity. International Business Review 29(2): 101636.
Mahagaonkar P. 2008. Corruption and innovation: a grease or sand relationship? , Jena
economic research papers.
March HA, Simon JG. 1958. Organizations.
Martin KD, Cullen JB, Johnson JL, Parboteeah KP. 2007. Deciding to bribe: A cross-level
analysis of firm and home country influences on bribery activity. Academy of
Management Journal 50(6): 1401-1422.
Maslach D. 2016. Change and persistence with failed technological innovation. Strategic
Management Journal 37(4): 714-723.
Merton RK. 1938. Social structure and anomie. American sociological review 3(5): 672-682.
Meyer KE, Peng MW. 2005. Probing theoretically into Central and Eastern Europe:
Transactions, resources, and institutions. Journal of international business studies 36(6):
600-621.
Mishina Y, Dykes BJ, Block ES, Pollock TG. 2010. Why “good” firms do bad things: The
effects of high aspirations, high expectations, and prominence on the incidence of
corporate illegality. Academy of Management Journal 53(4): 701-722.
Moorman C, Miner AS. 1997. The impact of organizational memory on new product
performance and creativity. Journal of marketing research 34(1): 91-106.
Mulotte L. 2014. Do experience effects vary across governance modes? Evidence from new
product introduction in the global aircraft industry, 1948–2000. Organization Science
25(3): 757-775.
Murphy KM, Shleifer A, Vishny RW. 1993. Why is rent-seeking so costly to growth? The
American Economic Review 83(2): 409-414.
Musacchio A, Lazzarini SG, Aguilera RV. 2015. New varieties of state capitalism: Strategic
and governance implications. Academy of Management Perspectives 29(1): 115-131.
Nerkar A, Roberts PW. 2004. Technological and product‐market experience and the success
of new product introductions in the pharmaceutical industry. Strategic Management
Journal 25(8‐9): 779-799.

110
O'Brien JP, David P. 2014. Reciprocity and R&D search: Applying the behavioral theory of
the firm to a communitarian context. Strategic Management Journal 35(4): 550-565.
Peng MW. 2003. Institutional transitions and strategic choices. Academy of management
review 28(2): 275-296.
Peng MW, Ahlstrom D, Carraher SM, Shi WS. 2017. An institution-based view of global IPR
History. Journal of International Business Studies 48(7): 893-907.
Razafindrakoto M, Roubaud F. 2010. Are international databases on corruption reliable? A
comparison of expert opinion surveys and household surveys in sub-Saharan Africa.
World Development 38(8): 1057-1069.
Ref O, Shapira Z. 2017. Entering new markets: The effect of performance feedback near
aspiration and well below and above it. Strategic Management Journal 38(7):
1416-1434.
Santangelo GD, Meyer KE. 2011. Extending the internationalization process model: Increases
and decreases of MNE commitment in emerging economies. Journal of International
Business Studies 42(7): 894-909.
Schumpeter J. 1942. Creative destruction. Capitalism, socialism and democracy 825: 82-85.
Segerstrom PS. 1991. Innovation, imitation, and economic growth. Journal of political
economy 99(4): 807-827.
Sharma P. 2011. Country of origin effects in developed and emerging markets: Exploring the
contrasting roles of materialism and value consciousness. Journal of International
Business Studies 42(2): 285-306.
Simon H. 1947. Administrative behavior; a study of decision-making processes in
administrative organization.
Simon HA. 2013. Administrative behavior. Simon and Schuster.
Starosta de Waldemar F. 2011. New products and corruption: evidence from Indian firms,
Université Panthéon-Sorbonne (Paris 1), Centre d'Economie de la Sorbonne.
Steinberg PJ, Procher V, Urbig D, Volkmann CK. Year. Multinational companies’ strategies
for R&D internationalization: Emerging versus advanced economies. In Proceedings of
the Academy of Management Proceedings.
Teece DJ. 2009. Dynamic capabilities and strategic management: Organizing for innovation
and growth. Oxford University Press on Demand.
Teece DJ, Pisano G, Shuen A. 1997. Dynamic capabilities and strategic management.
Strategic management journal 18(7): 509-533.
Treisman D. 2007. What have we learned about the causes of corruption from ten years of

111
cross-national empirical research? Annual Review of Political Science 10: 211-244.
Veracierto M. 2008. Corruption and innovation. Economic Perspectives 32(1).
Von Zedtwitz M, Ikeda T, Gong L, Carpenter R, Hämäläinen S. 2007. Managing foreign R&D
in China. Research-Technology Management 50(3): 19-27.
Webb JW, Tihanyi L, Ireland RD, Sirmon DG. 2009. You say illegal, I say legitimate:
Entrepreneurship in the informal economy. Academy of Management Review 34(3):
492-510.
Wiersema MF, Bowen HP. 2009. The use of limited dependent variable techniques in strategy
research: Issues and methods. Strategic Management Journal 30(6): 679-692.
Wong NY, Ahuvia AC. 1998. Personal taste and family face: Luxury consumption in
Confucian and Western societies. Psychology & Marketing 15(5): 423-441.
Wright M, Filatotchev I, Hoskisson RE, Peng MW. 2005. Strategy research in emerging
economies: Challenging the conventional wisdom. Journal of management studies 42(1):
1-33.
Xu D, Meyer KE. 2013. Linking theory and context:‘Strategy research in emerging
economies’ after Wright et al.(2005). Journal of management studies 50(7): 1322-1346.
Xu D, Zhou KZ, Du F. 2019. Deviant versus aspirational risk taking: The effects of
performance feedback on bribery expenditure and R&D intensity. Academy of
Management Journal 62(4): 1226-1251.
Yang X, Sun SL, Yang H. 2015. Market-based reforms, synchronization and product
innovation. Industrial Marketing Management 50: 30-39.
Zheng X, El Ghoul S, Guedhami O, Kwok CC. 2013. Collectivism and corruption in bank
lending. Journal of International Business Studies 44(4): 363-390.
Zhou KZ, Gao GY, Zhao H. 2017. State ownership and firm innovation in China: An
integrated view of institutional and efficiency logics. Administrative Science Quarterly
62(2): 375-404.

112
CHAPTER FOUR
China’s Anticorruption Campaign and OFDI:
An Integrated View of Institutional Complexity and Dynamics
Abstract
While research on the determinants of firm internationalization from emerging markets
increasingly recognizes the influence of government as a significant institutional force, little
attention has been paid to the fact that institutional pressures can be fragmented and
institutional logics on firms’ OFDI strategy can be contending. There are two institutional
explanations for China’s booming OFDI over the last decade: institutional support and
institutional escapism, based on external legitimacy and internal efficiency. Given
institutional complexity and dynamics, how a change in one facet of institutions influences
joint institutional forces and hence firms’ OFDI decisions largely unknown. In this study I
argue that while institutional support remains promoting aggregate OFDI from China, the
recent anticorruption campaign negatively affects private enterprises’ OFDI as it mitigates the
escapism motivation. The anticorruption campaign plays the role in impeding OFDI through
the mechanisms of improving financing efficiency and breaking down local protectionism.
My intended contribution is to integrate the perspective of institutional complexity and
institutional dynamics. Using the recent anticorruption campaign in China as an exogenous
shock, I test how change one facet of institutions radically influences the firms’ OFDI
decisions under the co-existed institutional logics with different directed forces.

113
4.1 Introduction
While research on the determinants of firm internationalization from emerging markets
increasingly recognizes the influence of government as a significant institutional force, little
attention has been paid to the fact that institutional pressures can be fragmented and
institutional logics behind firm behavior can be contending. For instance, there are two
institutional explanations for China’s booming OFDI over the last decade: institutional
support and institutional escapism. The former acknowledges that government promotion can
facilitate firm internationalization (Luo, Xue, and Han, 2010); while the latter focuses on
environmental deficiencies that force firms to invest abroad to seek better institutions (Boisot
and Meyer, 2008). These contending logics co-exist, but they happen to influence OFDI in the
same direction. Given institutional complexity and institutional dynamics, how a change in
one facet of institutions influences joint institutional forces and hence firm
internationalization largely remains unknown.
To fill this gap, I develop a theoretical framework to examine how a change of institutional
complexity that is defined as fragmented and contending institutional logics behind different
policies (Greenwood et al., 2011), affects firms’ OFDI behavior. Conforming to the logic of
legitimacy, Chinese firms invest overseas to respond to the “go-global” policy in which the
government supports firm internationalization via favorable institutional arrangements (Luo et
al., 2010; Oliver, 1991). This trend has remained for many years. However, in line of the logic
of efficiency, a change in another facet in institutions that improves institutional quality will
alleviate the motivation of investing abroad according to institutional escapism. How do firms

114
respond to a change of this institutional complexity? I utilize a recent anticorruption campaign
in China as a quasi-natural experiment to examine whether the improvement of institutional
quality will restrain OFDI tendency motivated by institutional escapism when the institutional
support under the “go-global” policy remains unchanged.
Greenwood et al. (2011) propose that a firm’s attributes such as its organizational position in
the environment and ownership type will influence its experience of tension about
institutional complexity, and then determine its response to the incompatible institutional
demands. In line with this argument, private ownership enterprises (POEs), as a less
legitimate group of organizations in China, are more sensitive to the logic of internal
efficiency than external legitimacy. Then, I propose that POEs are more likely to respond to
the institutional change caused by the anticorruption campaign rather than insist on their
OFDI trajectory shaped by the go-global policy, because “organizations located at the
‘periphery’ are more motivated to deviate from established practices” (Greenwood et al., 2011:
339). In addition, I propose that the anticorruption campaign reduces the domestic operation
cost, and then undermines the motivation of institutional escapism through improving
financing efficiency and breaking down local protectionism. Using difference-in-difference
method and triple differences method, I prove the above hypotheses.
The present study offers the following contributions to the existing literature. My first
intended contribution is to integrate the perspectives of institutional complexity and
institutional dynamics. I show how a radical institutional change (anticorruption campaign)
can lead to an unintended consequence in the opposite direction to the goal of the original

115
policy (go-global policy). Given contending institutional logics behind a firm’s behavior, a
change of one facet of institutions can influence the direction of a specific institutional logic,
and therefore the firm’s experience of institutional complexity and its responses to the
institutional change. Although prior research observes that firms may balance conflicting
institutional pressure between external legitimacy and internal efficiency (Luo, Wang, and
Zhang, 2017), my study incorporates the concept of institutional change by combining both
institutional complexity and institutional dynamics perspectives. I find that with an
improvement on institutional quality and alleviation of institutional escapism, the
anticorruption campaign slows down the pace of firms’ OFDI as POEs are more sensitive to
the logic of efficiency more than that of legitimacy.
The second intended contribution is to better specify the relationship between home country
institutional change and firms’ internationalization strategy, by examining a particular kind of
MNE activity (OFDI) as a response to a particular kind of institutional change (an
anti-corruption campaign). Conceptualizing institutions in terms of overall “quality” or the
“distance” and scoring the measurement of institutions enriches empirical research, but the
link between theoretical concepts and empirical indicators remains relatively thin (Jackson
and Deeg, 2019) or even incorrect (Cui, 2016). My study attempts to remedy this problem by
utilizing a specific event: an anticorruption campaign, which improves institutional conditions,
to reversely prove that the underlying motivations and mechanisms of POEs’ OFDI are
related to institutional change.
Third, I intend to contribute to the literature about corruption. Although the level of

116
corruption changes over time (Tanzi, 1998), “highly corrupt countries reforming and reducing
it, and countries relatively free of corruption becoming corrupt” (Cuervo-Cazurra, 2016: 41),
few studies reach the theme of corruption control, and estimate the economic effect of this
action. Different from the work of Cuervo-Cazurra (2006, 2008) on the Foreign Corrupt
Practices Act which is a legal arm of advanced countries against bribery abroad (host
countries), the research about the influence of building an integrity and clean government in a
home country on firms’ behavioral change has been untouched yet. In addition, problems with
measuring corruption, such as subjective bias of perceptive corruption (Jeong and Weiner,
2012; Treisman, 2007) and high non-response rate about sensitive bribery questions (Jensen et
al., 2010) impede further research in this field. In this study, open, official records of the
Chinese anticorruption campaign allow us to reveal a precise prediction about the relationship
between the change of (anti) corruption in a home country and firms’ motivation of
internationalization.
Forth, I manage to present a more holistic picture of the relationship between an
anticorruption campaign and OFDI decisions by testing the mechanism of alleviating the
pressure of institutional escapism: improving financing efficiency and breaking down local
protectionism. I suggest that clarifying the mechanism both theoretically and empirically will
make my argument more convincing.
4.2 Theory and Hypotheses
4.2.1 Institutional Complexity behind OFDI Decision in China
Scholars have recognized that institutional factors are critical for firm internationalization

117
from emerging markets (Peng, Wang, and Jiang, 2008; Wright et al., 2005). Luo and Tung
(2007) propose the springboard perspective in which the purpose of outward investment is to
acquire strategic resources and reduce institutional constraints at home. Peng et al. (2009)
argue that the institution-based view sustains the “strategy tripod” framework for the
explanation of firms’ international strategy. Meyer and Peng (2016) suggest that analysis
about emerging markets should advance the research agenda about institutional paradigm.
These institutional studies of firms’ international strategy reflect the fact that lacking
advantages in terms of technology, branding or managerial capabilities, emerging market
firms’ motivation of internationalization is fundamentally different from developed market
firms, and government plays a significant role in firm internationalization (Wang et al., 2012).
Thus, how home country institutions affect OFDI decisions gradually becomes the focus of
this line of research (Cuervo-Cazurra et al., 2018). Some studies observe that the co-existence
of institutional support and institutional escapism increases OFDI from China, although the
influence of the latter is unintended (Li and Ding, 2017). As institutions are complex and
dynamic, whether and how a change of government policy influences the holistic picture of
institutional environment and then determines firms’ OFDI decisions remains unknown.
Institutional support refers to the government policy designed purposively to facilitate
international expansion of domestic firms. For instance, the Chinese government designs the
institutional arrangements to promote OFDI even through domestic firms may not possess
advantages for international competition (Yan et al., 2018). In order to encourage firms’
internationalization, the Chinese government initiated the “go-global” policy in 2001, and

118
implemented a series of policy instruments including streamlining administrative procedures,
and providing financial support with low interest rate and favorable exchange rate (Luo et al.,
2010). The Ministry of Commerce also helps firms acquire host country information, gain
access to business opportunities through bilateral investment negotiations, and even alleviate
political risks through inter-government relationships (Wang et al., 2012). In turn, firms tend
to conform to the isomorphic institutional pressure to internationalize their business because
of their resource dependence, and then gain legitimacy of operation following instructions of
the government through investing abroad in response to the national strategy (Cui and Jiang,
2012).
Institutional escapism, on the other hand, emphasizes the unfavorable environment in the
home country that impedes their operation in the domestic market, and then unintentionally
leads to firms invest aboard to seek better institutions (Witt and Lewin, 2007). Characterized
with the institutional weaknesses in terms of lack of continuous capital support, inadequate
legal and judicial systems, and high uncertainty and volatility (Santangelo and Meyer, 2011;
Xu and Meyer, 2013b), OFDI from emerging markets can be viewed as a passive strategy to
circumvent market imperfections based on cost-benefit analysis. For instance, Boisot and
Meyer (2008) point out that in China, government interference and local protectionism limit
firms to exploit economic benefits since the fragmented markets increase the transaction and
operation costs across the nation. The lack of protection of intellectual property rights leads to
a fiercely competitive market in which firms have to compete on lower prices and profits
(Child and Rodrigues, 2005), and drives firms to move to a less uncertain environment (Luo

119
et al., 2011). Underdeveloped stock market and inefficient loan market make the cost of
financing too high (Morck, Yeung, and Zhao, 2008), and a large number of firms have to raise
capital outside China. Consequently, taking the strategy of internationalization, firms escape
their home country as a response to the institutional deficiencies and low domestic efficiency.
Therefore, the dramatic increase of OFDI from China over the last decade is more likely a
coincidence of these two contending institutional forces: institutional support and institutional
escapism. The underlying logics of the institutions – external legitimacy and internal
efficiency – are mutually compatible by accident. As institutions are complex and dynamic,
when an exogenous shock such as an anticorruption campaign changes the function of one
facet of institutions, challenges and tensions for firms are inevitably generated. However, how
firms respond to the change under the circumstance of institutional complexity has not been
studied.
4.2.2 Anticorruption Campaign and Institutional Dynamics
Corruption is a severe and prevalent problem in Chinese society since 1978. It is viewed as a
cost to embrace the market economy when the regime has not yet established a proper
institution to prevent public power from extracting interest from the private sector (Keliher
and Wu, 2016). Despite repeated crackdowns over years, the effort of eradicating corruption
has been criticized as “half-hearted and ineffectual” since the anticorruption campaign was a
kind of routinized policy that is more likely to deter low- but not high-level corruption from
senior cadres in China (Wedeman, 2005). Frustrated with long-lasting corruption, the masses
even yearn for “a populist leader to come to the rescue” and a Mao-style political campaign,

120
i.e., a radical, revolutionary change in order to impede massive corruption and build a clean
regime (Li, 2001: 584). To some extent, the new anticorruption campaign initiated by Xi
Jinping in 2012 was a response to this call, reflecting a dynamic institutional change from
both formal and informal aspects.
First, the enforcement of punishment for corruption was strong and astonishing. This
campaign targeted both “tigers” (senior officials) and “flies” (junior officials). Since the 18th
Plenum of the Communist Party of China (CPC) in 2012, over 400
provincial/ministerial-level officials have been investigated for corruption and bribery, while
only about 30 senior officials were investigated from 2003 to 2012. Wedeman (2005)
indicates that four out of five cases were closed without criminal penalties in the 1990s. In
contrast, from 2012 to 2015, over 90% of those investigations were transferred to judicial
proceedings and over 90% of the concluded cases were prosecuted and convicted (Deng,
2018). In this campaign, a member of the Political Bureau Standing Committee (PBSC), Zhou
Yongkang, was sentenced to life in prison for abuse of power and accepting bribes. He was
the first member of PBSC who went to jail due to corruption in the history of the CPC. This
action overturned the unwritten rule of “PBSC immunity”. This is a radical change in decades.
Other corrupt senior officials were also expelled from the party and faced up to life sentence
including Xu Caihou and Guo Boxiong, the generals and vice chairmen of the Central
Military Commission; Lin Jihua, the chief of the General Office of the CPC; Su Rong, the
vice chairman of the Political Consultative Conference; Sun Zhengcai, the member of the
Politburo of the CPC.

121
Second, the establishment of the National Supervision Committee (NSC) indicates the
fundamental institutional reform of China’s anticorruption system (Deng, 2018).
Anticorruption routine duties used to be carried out within a “dual-track” system in which the
party’s Discipline Inspection Committee (DICs) was responsible for investigating corrupt
members of the CPC, while prosecutors investigated ordinary corruption cases under the
judicial system. However, this “dual-track” system was substantively controlled by local
leaders, and a significant percentage of cases were dropped or penalties were mitigated. As a
result, there was a suspicion that investigated officials were protected by their bosses
(Wedeman, 2005). This institutional weakness is viewed as the underlying reason for failing
to crack down corruption (Manion, 2004). The NSC, on the other hand, merges the power
from DICs and prosecutors, and becomes the sole agency to coordinate a systematic reform
nationwide. Aiming at avoiding the interference of local party leaders and building a
long-term anticorruption institution, the NSC absorbs funds, staff, and equipment from local
agencies, forming more centralized and autonomous power. This is a tipping point reversing
the decentralized process in China over the past four decades (Deng, 2018).
Third, the abovementioned formal institutional changes are coupled with an endeavor of
transforming the political culture (Keliher and Wu, 2016). The breeding ground of corruption
is embedded in daily practice, such as red-envelope, gift-giving, excessive banqueting or
extravagant wedding. It is sometimes quite hard to distinguish the norm of interpersonal
communication from the illegal corruption in the purpose of cultivating political nepotism, as
Chinese society is characterized with guanxi (Luo, 2005, 2008). It is for this reason that Zhou

122
Yongkang was charged for accepting bribes of only about $118,000, but his family is worth
more than billions by an estimation (Keliher and Wu, 2016: 7). Given this, the anticorruption
campaign emphasizes the reform of moral discipline simultaneously, making enormous clear
regulations, such as an Eight-Point Regulation for official conduct, to rebuild political norms
and moral standards for members of CPC, government officials, and even whole society. After
implementation of anticorruption campaign, luxury goods imports have experienced a
substantial reduction (Qian and Wen, 2015). The stock market has responded positively
towards the Eight-Point Regulation, suggesting that the market acknowledges the function of
anticorruption campaign and adds value to domestic firms overall (Lin et al., 2016).
In all, the recent anticorruption campaign reflects a relatively substantial, comprehensive
improvement of institutional quality, which decreases the transaction cost of domestic
operation and then enhances the effect of the institutional logic of efficiency. On the other
hand, promoting OFDI is still the priority of “go-global” policy, and institutional support
remains the same. The tension between sustaining the external legitimacy via investing
aboard and conforming to the improvement of internal efficiency via staying at home emerges
along with the change of one facet of institutional complexity. The previous plausibly
compatible institutional demands are substituted by the contending or even conflicting
direction of institutional pressures. How firms respond to the change of institutional
complexity caused by the anticorruption campaign has remained to be examined.
4.2.3 POEs’ Response to the Anticorruption Campaign
How do firms respond to the change of institutional complexity? (Greenwood et al., 2011)

123
argue that the characters of firms, such as ownership or their position in the organizational
field, will affect the way firms experience institutional complexity and make them particularly
sensitive to certain logics than others, and then determine their response to the institutional
change.
Different from most research on SOEs, I focus on the response of privately owned firms
(POEs), which are less legitimate and more peripheral organizations in the Chinese context.
For POEs, the tension between the logic of legitimacy and logic of efficiency will be severer,
since following efficiency is its intrinsic requirement but attaining legitimacy is a requisite
condition especially in China.
I posit that the anticorruption campaign plays a negative role in POEs’ OFDI tendency while
the absolute amount of OFDI still increases. First, due to a lack of direct institutional linkage
with the government, POEs are less likely to conform to coercive pressure from the
“go-global” policy. The Chinese government maintains economic control through ownership
(Dickson, 2003). Government-controlled firms rely on bureaucratic mandates to have access
to resources, whereas POEs are subject to market forces (Ferri and Liu, 2010). Thus POEs,
owned by the private rather than the public, have relative discretion to respond to the
improvement of efficiency resulted from the anticorruption campaign instead of answering
the call by the national strategy. Second, POEs have long been subject to systematical
discriminatory policies with regard to access to capital, natural resources, and some specific
industries domestically (Kolstad and Wiig, 2012; Sutherland and Ning, 2011). As for the
international aspect, POEs were prohibited to invest abroad before 2004. And this unfair

124
policy was not completely revoked until 2007. Thus, the government expectation of POEs to
support government priorities such as promoting OFDI has been lower, which mitigates the
influence of institutional logic of legitimacy. Third, even the government policy targets all
kinds of firms, POEs are more peripheral to the organizational field (Greenwood et al., 2011)
and hence less visible compared with SOEs. Therefore, it is more difficult for the government
to monitor and scrutinize POEs. Compared with state-owned enterprises, OFDI from POEs is
lower in both quantity and quality. The non-response to the “go-global” policy can be less
easily detected. In all, I believe that POEs are more sensitive to the institutional logic of
efficiency than that of legitimacy, and more willing to adjust OFDI strategy according to the
change made by the anticorruption campaign.
Although the internal efficiency consideration dominates the way POEs experience the
institutional complexity, the logic of legitimacy still matters. Complying with government
policies is an exemplary manner in order to obtain the legitimacy attaching with resource
benefits (Oliver and Holzinger, 2008). In China, firms purposively build political or
managerial ties with the government especially during economic transitions (Haveman et al.,
2017), and firms’ performance was indeed improved from the linkage (Sheng, Zhou, and Li,
2011). Therefore, I propose that, while POEs continue to increase OFDI to respond to the
logic of legitimacy from institutional support, the anticorruption campaign will slow down the
pace of their OFDI given the logic of efficiency. The anticorruption campaign improves
domestic business environment and reduces POEs’motivation of institutional escapism.
Hypothesis 1: The anticorruption campaign has a negative effect on POEs’OFDI.

125
4.2.4 The Mechanism of the Anticorruption Campaign
I propose that the anticorruption campaign has a negative effect on POEs’ OFDI through the
mechanism of improving institutional quality and decreasing the transaction cost. I identify
two aspects that the anticorruption campaign is able to mitigate the institutional weaknesses
and then increase the efficiency of operation in the domestic market: improving the financing
efficiency and diminishing local protectionism.
Financing efficiency
Having access to capital with a low-interest rate is critical for firms’ smooth operation, while
an underdeveloped capital market impedes normal financing. This institutional weakness is
long viewed as an important reason which drives firms to escape their home countries,
whereas corruption is an obstacle to improve the efficiency of capital allocation and financial
marketization. First, corruption decreases banks’ willingness to offer loans in general as the
possibility of default on capital, and interest repayment is high in a corrupt environment. (La
Porta et al., 1997). Weill (2011) and De Carvalho (2009) prove that corruption prevents firms
from obtaining bank loans using the data of Russia and Brazil respectively. Second, some
studies have found that in China, firms, especially POEs, have to bribe bank officials for
short-term loan (Cai, Fang, and Xu, 2011; Chen, Liu, and Su, 2013), which increases the cost
of financing. Moreover, although bribery may grease the wheel in the short term, corruption
still diminishes firms’ ability to acquire long-term bank credit (Fan, Titman, and Twite, 2012),
which fundamentally hurts firms’ operation. Therefore, Chinese POEs suffer either the

126
shortage of capital or predation from corrupt officials. As a result, POEs tend to escape from
their home country for a better institutional environment.
The existing research has shown that the current anticorruption campaign has a significant
effect on improving the financial environment. Li, Wang, and Zhou (2018) find that the
anticorruption campaign reallocates bank loans from SOEs to POEs since the capital
allocation is more driven by economic efficiency rather than administrative interference. In
addition, POEs gain more bank loans after the shock of anticorruption campaign for both
long-term and short-term debt. Using data of Chinese listed firms, Xu and Yano (2017)
conclude that the anticorruption campaign affects positively financing and investing
innovation since the strong anticorruption action makes firms more likely to obtain long-term
debt. Tao (2020) shows that bank loan loss provisions in the Chinese banking system decrease
dramatically because the anticorruption campaign reduces financial risk in general. Kim, Li,
and Tarzia (2018) observe that the stock market responded positively to the announcement of
the anticorruption campaign overall. Ding et al. (2020) further prove that the returns of this
announcement are significantly lower for SOEs than POEs. Therefore, I can conclude that the
anticorruption campaign does improve the financing efficiency, particularly for POEs.
Financial marketization is an instrumental measurement of the degree of difficulty firms
finance within a specific environment. Given that China’s financial marketization varies
largely by regions, some provinces suffer more financing inefficiency than others. Hence,
firms in different provinces will have different experiences about the anticorruption campaign
in terms of financing efficiency improvement, and therefore have difference degrees of

127
willingness to make OFDI. Firms operating in provinces with a high level of financial
marketization will benefits less from the financing efficiency improvement through the
anticorruption campaign than those located in provinces with a low level of financial
marketization. Therefore, I predict that firms located in provinces with an initial low level of
financial marketization are more likely to decrease their OFDI compared with those in
provinces with an initial high level of financial marketization.
Hypothesis 2: The lower the initial level of financial marketization, the more negative the
relationship between the anti-corruption campaign and POEs’OFDI.
Local protectionism
As an important part of its economic reform initiated in 1978, China’s regional
decentralization was viewed as an engine of economic growth via provincial competition
(Qian and Roland, 1998). However, regional decentralization was also seen as the root of
local protectionism (Bai et al., 2004). Imposing a variety of interregional barriers to trade
(Young, 2000), implementing discriminatory policies to protect indigenous market and
interests (Bai, Tao, and Tong, 2008), and preventing the movement of factors of production
(Naughton, 2003), the local governments distorted the resource allocation, fragmented the
domestic market and damaged the social welfare. For instance, using data from China’s
automobile market, Barwick, Cao, and Li (2017) find that through direct subsidies and tax
incentives, protectionists successfully promote local brands of automobiles, but the choice
distortion resulted in 18.7 billion yuan of consumer welfare loss, equaling 40% of the total
subsidies. Under the threat of local protectionism and without an administrative unified

128
domestic market, the transaction and operation costs were quite high. When the costs of
overcoming local protectionism exceed the costs of doing business across international
borders, POEs tend to invest abroad (Boisot and Meyer, 2008; Wei, Clegg, and Ma, 2015).
The source of local protectionism comes from three aspects: criteria of promoting officials,
rent seeking behavior of local officials, and ineffective regulations from the central
government (Barwick et al., 2017). Criticized as an instrument of recentralizing political
power for the new leadership (Deng, 2018), the anticorruption campaign alleviates the source
of local protectionism unintentionally. First, the evaluation of promoting officials changes
from GDP growth to personal cleanness and loyalty. To some extent, the pressure of pushing
local economic performance through implementing local protectionism has been mitigated.
Second, with highly scrutinized officials’ property and daily activities, local government
officials are difficult to derive private benefits ranging from acquiring jobs for their relatives
to accepting bribes. It undermines the local officials’ selfish motivation to continue giving
preferential treatments to local firms. Third, compared with the self-benefit local governments,
the central government is “relatively long-term orientation and concern with the interests of
the country as a whole” (Luo et al., 2017: 324). Concentrating the power from local
governments to the central government, the anticorruption campaign makes the regulation of
the central government more effective, and restrains the power of local governments to
impose local protectionism. Thus, I posit that the more severe local protectionism of a
province, the greater shock the province would experience from the anticorruption campaign.
Firms located in such a province would be less likely to make OFDI decisions since the

129
unnecessary cost of doing business from local protectionism is decreased.
Hypothesis 3: The greater the local protectionism of a province, the more negative the
relationship between the anti-corruption campaign and POEs’OFDI.
4.3 Method
4.3.1 Data
OFDI. I collected OFDI data from the Ministry of Commerce of China from 2008 to 2015.
This database contains the subsidiary name, host country, name of the parent company and its
location. In order to identify the POEs from other ownership firms, I manually searched the
parent companies one by one from Qichacha, an officially authorized website providing firm
ownership information. I exclude some OFDI projects for two reasons. First, the direct
investments to Hong Kong, Macau and Taiwan were excluded because they are officially
parts of China’s sovereign territory. Second, the investments to tax havens such as British
Virgin Islands, the Cayman Islands and Bermuda Islands were excluded. I aggregated the
OFDI project numbers within a province to a specific destination (country) for each year, and
the final dataset includes 13,780 OFDI projects of POEs from 31 provinces to 169 countries.
Anticorruption Campaign. I collect data about anticorruption by scrutinizing the Annual
Report of the People’s Procuratorate for each province from 2008 to 2015. The report
contains the information about how many officials are investigated for corruption and bribery
within this year. I calculated the average changes in the number of investigated corrupt
officials each province before and after 2012, and identified the treatment provinces if the
degree of change was above the median to represent provinces suffering a high shock from

130
the anticorruption campaign (ACC); otherwise the provinces fell into the control group which
experienced a low shock from the anticorruption campaign. Equation 1 shows how I
constructed of the dummy variable of anticorruption campaign, and Table 4.1 shows the
distribution of the treatment and control groups.
ACCchange = 1 - 20122015ACCnumber�
20082011ACCnumber�
> median, ACC = 1≤ median, ACC = 0 (4.1)
Institutional quality. The National Economic Research Institution (NERI) complies an array
of indices to measure the institutional development at the provincial level. However, the two
sub-indices I are interested, financial marketization to indicate the financing efficiency of a
province and product marketization to indicate the local protectionism of a province, are
published every two years. Hence I used the ranking information to identify the treatment and
control groups for a triple-difference analysis, and more details will be discussed in the next
section.

131
Table 4.1
Sample Distribution and Statistic Description表格 0.1
Panel A: Sample DistributionProvince OFDI ACC Autonomous region MunicipalityBeijing 1,106 0 BeijingTianjin 274 0 TianjinHunan 475 0Ningxia 50 0 NingxiaJiangsu 1,568 0Shandong 1,594 0Zhejiang 2,170 0Liaoning 645 0Guizhou 26 0Chongqing 142 0 ChongqingHainan 60 0Guangxi 199 0 GuangxiHenan 270 0Anhui 233 0
Shanghai 747 0 ShanghaiFujian 355 0Jiangxi 165 1Qinghai 40 1Sichuan 366 1Shaanxi 110 1Hubei 218 1
Heilongjiang 369 1Gansu 53 1Xinjiang 288 1 XinjiangYunnan 320 1Heibei 344 1
Guangdong 1,031 1Jilin 234 1
Neimenggu 237 1 NeimengguXizang 9 1 XizangShanxi 82 1
Panel B: Descriptive StatisticsVariables Observation Mean Std.Dev.OFDI 13,780 20.007 36.567Anticorruption 13,780 1483.1 785.228GDP 13,780 10.876 0.441Trade 13,780 3.186 2.953FDI 13,780 2.683 2.312Population 13,780 4.491 2.293Education 13,780 0.155 0.152

132
Control variables. I also controlled for several variables that may influence OFDI at the
provincial level. I controlled for GDP with a logarithm transformation of the GDP per capita;
Trade with the value of trade as a share of GDP; FDI with the value of foreign direct
investment as a share of GDP; Population with natural population growth rate; Education as
the percentage of population with college degree or above. I also controlled for the effects of
year, province, country and year*country for different kinds of heterogeneity.
4.3.2 Empirical Model
Difference-in-Difference. I used the difference-in-difference strategy to compare changes in
the numbers of OFDI projects for provinces that were differentially affected by the ACC.
Specifically, I intended to examine whether POEs slowed down OFDI when the provinces in
which they were located experienced a greater shock of the anticorruption campaign. This
yields a basic regression equation of the following form:
OFDIpdt = α + βACCp × postt + γXpt + δp + θdt + μpdt (4.2)
Where p indicates provinces, d indicates destinations (countries) and t indicates years. OFDI
is the total number of OFDI projects for province p to country d in year t. ACC is a dummy
variable which equals 1 if the change of ACC before and after 2012 is above the median,
otherwise it is 0. Post equals 1 for years ranging from 2012 to 2015, and 0 for years before
2012. X is a vector of control variables; δ indicates the province fixed effects; θ indicates
country, year and country*year fixed effects; μ is the error term. The coefficient β on
ACC×post is the DID estimator which captures the average changes in the numbers of OFDI

133
in the ACC-high-shock provinces (the treatment provinces) relative to the contemporaneous
changes in ACC-low-shock provinces (the control provinces).
4.4 Analysis and Results
4.4.1 Main results
The main results are presented in Table 4.2. In all regressions, the dependent variable is the
changes in numbers of OFDI four years after compared to four years before treatment. In
Model 1, the regression includes ACC×post as an explanatory variable, and the year, country,
year*country fixed effects which control for all the heterogeneities in term of investment
destination. In Model 2, I also include province fixed effects to control for the provincial
characters that do not change over time. In Model 4, I further control for some time-vary
province-level variables such as GDP per capita, trade, FDI, population and education that
may influence provincial OFDI. For each specification, the coefficient is negative and
statistically significant, which supports Hypothesis 1. More precisely, in the four years
following the implementation of the anticorruption campaign, POEs located in the high-shock
provinces slowed down their OFDI by about 3 investments on average. While this effect may
seem modest in absolute terms, the coefficient implies that POEs’ OFDI in the high-shock
provinces decreased by about 15% compared to POEs’ OFDI in the low-shock provinces
since the average number of OFDI within a province to a destination per year was 20.

134
Table 4.2
Main Results from DID表格 0.2
Variables Model 1 Model 2 Model 3
ACC × post -8.710*** -5.543*** -2.887***(-13.13) (-7.55) (-4.43)
GDP 2.247
(0.52)
Trade -13.610***
(-28.99)
FDI 11.959***(18.18)
Population -0.357
(-0.98)
Education -1.525
(-1.49)
Constant 22.101*** 21.450*** 9.528(94.31) (100.55) (0.20)
Province FE NO YES YES
Year FE YES YES YES
Country FE YES YES YES
Country*year FE YES YES YES
Observations 13,563 13,563 13,563
Adjusted R-squared 0.636 0.721 0.757
Robust t-statistics in parentheses
*** p<0.01, ** p<0.05, * p<0.
4.4.2 Validity of DID
Parallel trend test 1: The DID method is based on the assumption that there is no systematic
difference between the treatment and control groups before a policy is implemented.
Otherwise, the difference in the numbers of OFDI between the treatment and control groups
after the implementation of ACC may be driven by a pre-existing trend. To illustrate the

135
validity of my identification strategy, I plot time trends of OFDI for the high-ACC-shock
provinces (treatment group) and low-ACC-shock provinces (control group) in Figure 4.1. It is
clear that in the pre-ACC period (2008-2011), there was no apparent difference in the
numbers of OFDI between the two groups, which conforms to the DID identifying
assumption and alleviates the concern that the result is not valid.
Meanwhile, after 2012, the treated provinces increased their OFDI substantially less than the
provinces in the control group. The consistency in timing between the divergence in OFDI
and ACC implementation suggests that the ACC did slow down POEs’ OFDI.
Figure 4.1
Parallel Trend Test 1
图 0- 1

136
Parallel trend test 2: In my main DID regression model, I used a time dummy variable post
to separate the pre-ACC and post-ACC accession periods. The estimator β yields the average
treatment effect, which compares the OFDI between the treatment and control groups in their
average differences between the two periods. The defect of this approach is that the
year-by-year changes cannot be shown. Hence, I have extended the original estimation
equation in which the interaction term ACC×post is replaced by a series of interaction terms
between ACC and each year dummies. This test allows the coefficient βt to vary across the
treatment and control groups from 2009 to 2015, using 2008 as the baseline year:
OFDIpdt = α + βtACCp × postt + γXpt + δp + θdt + μpdt (4.3)
In Figure 4.2, I plot the differences for the coefficients of ACC×post between the treatment
and control groups with the corresponding 95 percent confidence level. It still reveals no
systematic difference in the pre-trend for the treatment and control groups. The difference of
the coefficients in 2014 and 2015 are negative and significant (the coefficient of 2013 is just
on the 95% significant level), suggesting that POEs begin to slow down their OFDI decisions
in one year after the implementation of the ACC.

137
Figure 4.2
Parallel Trend Test 2图 0- 2
Placebo test 1: pre-ACC
I conducted my first placebo test to examine the effect of ACC on OFDI in the per-ACC
period. As I discuss before, the assumption of DID is that there is no systematic difference in
the changes of OFDI before 2012. In other words, because ACC did not change much before
2012, I should not expect any significant effect of ACC on OFDI before 2012. Otherwise,
there may exist some underlying confounding factors that drive changes of OFDI. For the
robustness, I have used 2009, 2010, and 2011 as the pseudo years of policy implementation
and run DID regressions without expectation for significant effects of DID. The estimators of
DID in years 2009, 2010, 2011 are represented in Table 4.3. None of the effects of ACC×post
in pseudo years is statistically significant at the 95% confidence level, Hence, I can rule out

138
the possibility that some underlying but unobservable factors drive the changes of OFDI.
Table 4.3
Placebo Test 1 of DID表格 0.3
Variables 2009 2010 2011
ACC × post -0.194 -0.555 -1.241*
(-0.29) (-0.82) (-1.78)
GDP 15.737*** 15.445*** 14.914***
(13.90) (14.23) (14.14)
Trade -0.197 -0.151 -0.071
(-1.38) (-1.08) (-0.52)FDI 1.346*** 1.308*** 1.248***
(7.72) (7.50) (7.21)
Population 0.831*** 0.813*** 0.781***
(5.90) (5.78) (5.56)
Education 7.062*** 7.090*** 7.267***
(4.36) (4.38) (4.48)Constant -158.617*** -155.333*** -149.382***
(-12.78) (-13.06) (-12.93)
Province FE YES YES YES
Country FE YES YES YES
Year FE YES YES YESCountry*year YES YES YES
Observations 13,563 13,563 13,563
Adjust R-squared 0.665 0.665 0.665
Robust t-statistics in parentheses
*** p<0.01, ** p<0.05, * p<0.1
Placebo test 2: random selection of the treatment provinces
Although I have controlled for some variables that may influence the dependent variable
OFDI, the possibility that omitted variables at the provincial level may still exist. Toward this
end, I have randomly selected 16 provinces to construct a pseudo treatment group (the rest of
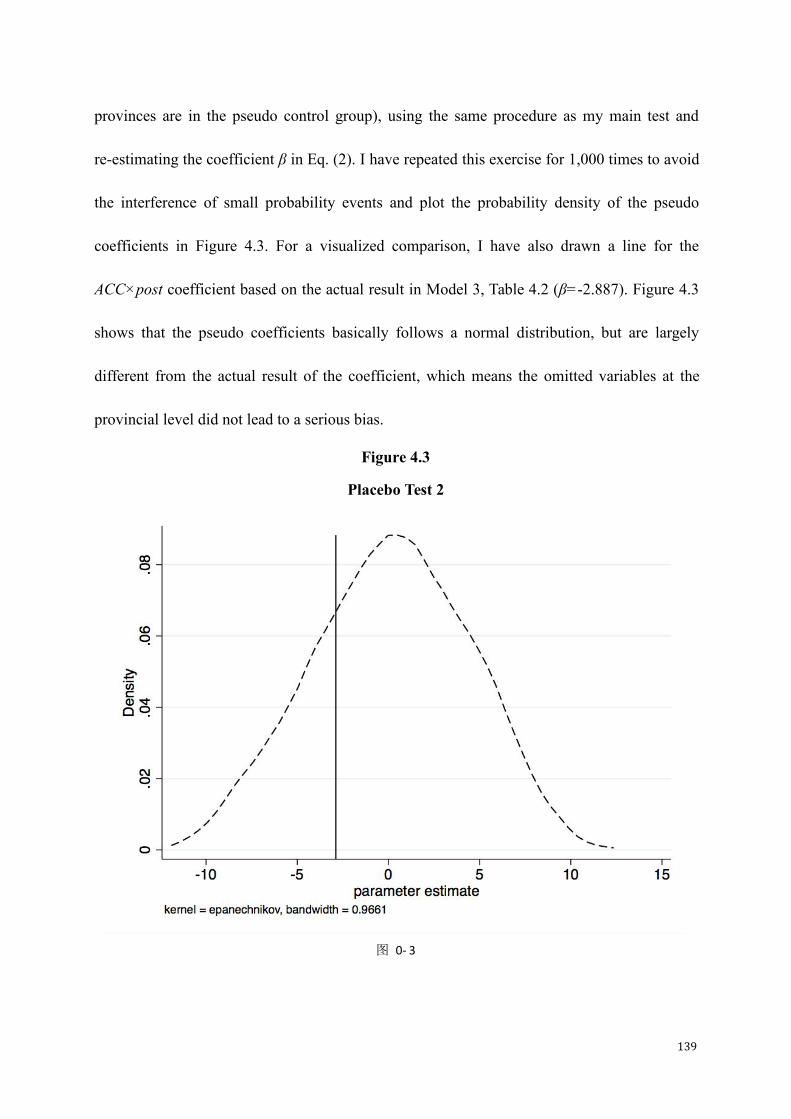
139
provinces are in the pseudo control group), using the same procedure as my main test and
re-estimating the coefficient β in Eq. (2). I have repeated this exercise for 1,000 times to avoid
the interference of small probability events and plot the probability density of the pseudo
coefficients in Figure 4.3. For a visualized comparison, I have also drawn a line for the
ACC×post coefficient based on the actual result in Model 3, Table 4.2 (β=-2.887). Figure 4.3
shows that the pseudo coefficients basically follows a normal distribution, but are largely
different from the actual result of the coefficient, which means the omitted variables at the
provincial level did not lead to a serious bias.
Figure 4.3
Placebo Test 2
图 0- 3

140
4.4.3 Other Robustness Checks
I perform several robustness checks to address potential concerns. First, I use two different
indices to re-allocate the treatment and control groups. The one is measured by the average
changes in the proportion of officials investigated for corrupt in the total number of officials
within a province. The other one is measured by the average changes in the numbers of
corrupt officials at or above Chuji, which is a position commonly considered as a key point on
the ladder of political power. The results are shown in Table 4.4, and the coefficients of DID
are still negative and significant in all models.
Second, I exclude some provinces for two political reasons. I exclude five regional
autonomies for ethnic minorities (Ningxia, Guangxi, Xinjiang, Neimenggu and Xizang, see
Table 4.1) where the minority nationalities dominate the population absolutely, and the
function of nationwide policy may be distorted by the special demographic and political
characteristics. The results are shown in Model 3, Table 4.5. Then, I exclude four
municipalities directly under the Central Government (Beijing, Tianjin, Shanghai and
Chongqing), and the results are shown in Model 6, Table 4.5. All the results are still consistent
with hypothesis 1.

141
Table 4.4
Robustness Check 1: Different Cut-offs
Variables Model 1 Model 2 Model 3 Model 4 Model 5 Model 6
Proposition Chuji
ACC × post -9.898*** -5.171*** -5.593*** -5.728*** -2.425*** -6.144***
(-16.88) (-8.22) (-9.67) (-9.87) (-4.08) (-9.40)
GDP -1.726 8.522*(-0.40) (1.88)
Trade -13.613*** -14.246***
(-28.93) (-28.67)
FDI 12.022*** 11.333***
(18.20) (17.85)
Population -0.368 -1.014***(-1.01) (-2.69)
Education -1.956** -1.907*
(-2.01) (-1.88)
Constant 22.825*** 21.624*** 53.530 21.947*** 21.003*** -50.873
(88.60) (95.13) (1.14) (81.56) (88.60) (-1.03)
Province FE NO YES YES NO YES YES
Year FE YES YES YES YES YES YES
Country FE YES YES YES YES YES YES
Country*year FE YES YES YES YES YES YES
Observations 13,563 13,563 13,563 13,563 13,563 13,563Adjusted R-squared 0.639 0.721 0.757 0.632 0.720 0.758
Robust t-statistics in parentheses
*** p<0.01, ** p<0.05, * p<0.
表格 0.4

142
Table 4.5
Robustness Check 2: Subsamples
Variables Model 1 Model 2 Model 3 Model 4 Model 5 Model 6
Exclude autonomous regions Exclude municipalities
ACC × post -9.086*** -5.467*** -3.304*** -6.422*** -3.547*** -2.687***
(-13.24) (-7.17) (-4.87) (-10.37) (-5.04) (-4.22)
GDP 3.324 -8.779*(0.73) (-1.84)
Trade -13.622*** -11.133***
(-28.93) (-23.74)
FDI 12.015*** 4.688***
(18.41) (10.56)
Population -0.372 1.831***(-1.00) (4.76)
Education -1.847* 0.657
(-1.75) (0.26)
Constant 22.715*** 22.035*** -0.953 19.167*** 18.459*** 126.434**
(96.74) (103.73) (-0.02) (86.75) (84.06) (2.45)
Province FE NO YES YES NO YES YES
Year FE YES YES YES YES YES YES
Country FE YES YES YES YES YES YES
Country*year FE YES YES YES YES YES YES
Observations 12,771 12,771 12,771 11,289 11,289 11,289Adjusted R-squared 0.653 0.736 0.771 0.615 0.711 0.735
Robust t-statistics in parentheses
*** p<0.01, ** p<0.05, * p<0.
表格 0.5
4.4.4 Mechanism Test: Triple Differences
In order to examine whether the anticorruption campaign slow down the OFDI through the
mechanism of improving the institutional environment, I adopt the triple differences method.
Comparing to the provinces with a better institutional basis, I posit that POEs in provinces
with less developed institutions will further slow down their OFDI as the anticorruption

143
campaign leads to relatively more institutional quality improvement in these provinces. Hence,
the triple differences equation is below:
OFDIpdt = α + ρACCp × postt × institutionp + η1ACCp × postt
+ η2ACCp × institutionp + η3postt × institutionp
+ γXpt + δp + θdt + μpdt
(4.4)
where institution is a dummy variable representing the provincial institutional quality before
the ACC was implemented. I have identified 10 provinces with the worst rankings on
institutional indices in terms of finance marketization and product marketization in 2012 as
the treatment group and their value equals 1. The remaining 21 provinces fall into the control
group automatically and their value equal 0. The coefficient ρ on ACC×post×institution is the
triple differences estimator, which captures the effect of the ACC on OFDI from provinces
with less developed institutions compared to that on OFDI in provinces with better
institutions.
As table 4.6 shows, the estimator of triple differences in terms of financial marketization in
Model 2 has a significantly negative effect, as does the estimator of triple differences in terms
of product marketization in Model 4. Thus both hypotheses 2 and 3 are supported. The results
indicate that the effect of the ACC on OFDI varies across provinces given the different
institutional bases: comparing with the provinces with better institutions, the ACC play a
more profound role in the provinces with less developed institutions through improving
efficiency of resource allocation (financial marketization) and decreasing distortion of the
local protectionism (product marketization).

144
Table 4.6
Results from Triple Differences表格 0.6
Variables Model 1 Model 2 Model 3 Model 4
ACC × post × financial marketization -23.078*** -7.908***
(-10.02) (-3.90)ACC × post × product marketization -30.493*** -8.026***
(-12.82) (-3.96)
ACC × post -1.759** -1.778*** -2.187*** -2.780***
(-2.50) (-2.71) (-2.94) (-4.13)
Post × financial marketization 13.434*** 5.865***
(9.89) (5.77)Post × product marketization 26.148*** 12.175***
(16.48) (10.24)
ACC × financial marketization Omitted (collinear with the fixed effects)
ACC × product marketization Omitted (collinear with the fixed effects)
GDP 1.836 3.915
(0.43) (0.90)Trade -13.465*** -13.342***
(-28.79) (-28.50)
FDI 11.482*** 10.882***
(17.93) (17.26)
Population -0.444 -0.403
(-1.21) (-1.10)Education 0.077 2.710***
(0.08) (3.03)
Constant 19.881*** 14.282 19.070*** -8.124
(89.73) (0.30) (91.44) (-0.17)
Province FE YES YES YES YESYear FE YES YES YES YES
Country FE YES YES YES YES
Country*year FE YES YES YES YES
Observations 13,563 13,563 13,563 13,563
Adjusted R-squared 0.724 0.757 0.727 0.758
Robust t-statistics in parentheses*** p<0.01, ** p<0.05, * p<0.

145
4.5 Discussion and Conclusion
In this study, I examine the effect of the anticorruption campaign on POEs’ OFDI to
demonstrate that a radical change of institution may result in an unintended consequence
since institutional pressures can be fragmented and contending. I argue that the anticorruption
campaign plays a negative role in firms’ international strategy given the alleviation of
institutional escapism and improvement of the home country institutions. Further, this
negative effect is more profound in provinces with originally less developed local financial
market and more local protectionism as the anticorruption campaign leads to relatively more
institutional quality improvement there. These findings offer some theoretical, empirical, and
practical contributions.
4.5.1 Theoretical Contributions
First, I contribute to the literature on institutional theory by integrating the perspectives of
institutional complexity and institutional dynamics to examine how a change of one facet of
institutions will influence firms’ experience and behavior. By using the method of
difference-in-difference, I can test the causality of a radical change and its effect on firms’
internationalization strategy. I use the recent strong anticorruption campaign in China as the
setting to examine how the political reform would affect firms’ OFDI decision. This allows
me to focus on a specific institutional facet and take a more nuanced approach to examine the
relationship between institutional changes (improvement) and POEs’ internationalization
strategy (OFDI). My results show this prediction that the anticorruption campaign, as a
welcome political reform to crack down corruption, slows down POEs’ tendency to invest

146
abroad despite that promoting OFDI is the primary goal of the “go-global” policy. This
unintended consequence of the anticorruption campaign reflects the disequilibrium from the
effect of multidimensional, discontinuous institutional changes.
Further, there are two potential explanations for the dramatic increase of Chinese OFDI from
a home country perspective in the related literature: institutional support and institutional
escapism. Given the strong determination of the Chinese government for promoting firms’
internationalization, academic attention tends to focus on institutional support, especially for
SOEs’ internationalization. However, I argue that whereas government intervention through
the “go-global” policy has been at play, less-legitimate POEs are more likely to be influenced
by market forces.
The results show that the anticorruption campaign mitigates institutional weaknesses for
POEs, and in return POEs re-direct their OFDI trajectory as the effect of institutional
escapism outweighs institutional support in this specific situation. It reminds us that the
institutional environment is complex, fragmented, or even contending, and the more nuanced
the research context I examine, the more accurate prediction I can make.
Finally, I contribute to the literature on corruption control and its effect on firm behavior by
discussing the mechanisms through which some firms benefit more from the anticorruption
campaign than others. I find that for Chinese POEs, the main reason for OFDI is to seek
efficient operations, low transaction costs, and less-controlled product markets. Once the
anticorruption action of a country can release the pressure of two factors: financing
inefficiency and local protectionism, the tendency of investing overseas will decline.

147
These findings suggest that future research in this area should pay more attention to how
corruption control will affects firms’ decision-making of internationalization.
4.5.2 Practical Implications
For managers in a complex environment, a crucial point for firms’ survival and prosper is to
respond to institutional demands. As the underlying logics of institutions are different even
opposite, firms need to identify them correctly and change firms’ strategies accordingly. The
dynamic and complex institutional logics require managers to evaluate and search for the
optimal point that can balance various external demands. For government, there are three
implications. First, policy-makers should be aware that policies they make may have
unintended effects on firms. Policies need to be coordinated in a more macro-perspective.
Otherwise, unintentional consequences may occur. Second, unlike other literature that proves
that corruption deters economic growth or innovations, this research confirms that an
anticorruption campaign can improve the efficiency of the domestic market and enthusiasm
for domestic investment. Capital flight is rampant in many developing countries, and deters
societal development since substantial domestic investment is an important source of
economic growth and employment. However, firms tend to escape from poor institutions to
seek more resources to support their operations. My study proves that a strong endeavor to
crack down on corruption helps to prevent capital flight. Third, although some governments
of emerging economies are keen to promote domestic firms’ participation in international
competition because it may leverage firm capability, policymakers should notice that this kind
of effort may result in an institutional disequilibrium, where the firm behavioral pattern can

148
be easily deviant from the original intention of the policy once market forces are at play.
4.5.3 Limitations and Future Research Directions
I use an anticorruption campaign as an example of discontinuous institutional change in order
to examine the influence of home country institutional improvement on firm
internationalization strategy. My study suggests several future research directions. First, as
firm-level information is unavailable, my empirical test is limited on the province-level and
fails to examine the heterogeneity of firms, albeit the data is the full sample of Chinese OFDI.
Scholars may try to use different sources of data to re-check the results. Second, the
institutional underpinnings of SOEs and POEs are different as I have implied in the
theoretical framework. To keep the study concise, and emphasize the function of the nuanced
context setting on firm behavior, I only focus on POEs’ reaction to this political reform. SOEs’
response to the institutional change may be very different since the structure of SOEs in
China is more complex than POEs. Future research may continue to explore this important
issue, and differentiate different institutional pressures not only for firms with different
ownership but also for different kinds of SOEs. Third, although I examined the moderating
effects of financing efficiency and local protectionism, other mechanisms in a firm’s
institutional motivation to initiate OFDI may need to be explored, in order to fully flesh out
the influence of (anti) corruption.

149
Reference
Bai C-E, Du Y, Tao Z, Tong SY. 2004. Local protectionism and regional specialization:
evidence from China's industries. Journal of international economics 63(2): 397-417.
Bai C-E, Tao Z, Tong YS. 2008. Bureaucratic integration and regional specialization in China.
China Economic Review 19(2): 308-319.
Barwick PJ, Cao S, Li S. 2017. Local protectionism, market structure, and social welfare:
China's automobile market, National Bureau of Economic Research.
Boisot M, Meyer MW. 2008. Which way through the open door? Reflections on the
internationalization of Chinese firms. Management and Organization Review 4(3): 349-365.
Cai H, Fang H, Xu LC. 2011. Eat, drink, firms, government: An investigation of corruption
from the entertainment and travel costs of Chinese firms. The Journal of Law and Economics
54(1): 55-78.
Chen Y, Liu M, Su J. 2013. Greasing the wheels of bank lending: Evidence from private firms
in China. Journal of Banking & Finance 37(7): 2533-2545.
Child J, Rodrigues SB. 2005. The internationalization of Chinese firms: a case for theoretical
extension? 1. Management and organization review 1(3): 381-410.
Cuervo-Cazurra A. 2006. Who cares about corruption? Journal of international business
studies 37(6): 807-822.
Cuervo-Cazurra A. 2008. The effectiveness of laws against bribery abroad. Journal of
International Business Studies 39(4): 634-651.
Cuervo-Cazurra A. 2016. Corruption in international business. Journal of World Business
51(1): 35-49.
Cuervo-Cazurra A, Luo Y, Ramamurti R, Ang SH. 2018. The impact of the home country on
internationalization, Elsevier.
Cui L. 2016. The primacy of institutional explanation of Chinese outward FDI: Is it
understated or overstated? Management and Organization Review 12(3): 457-467.
Cui L, Jiang F. 2012. State ownership effect on firms' FDI ownership decisions under
institutional pressure: A study of Chinese outward-investing firms. Journal of international

150
business studies 43(3): 264-284.
De Carvalho AG. 2009. The effect of institutions on the external financing of Brazilian firms.
Revista Brasileira de Finanças 7(1): 1-27.
Deng J. 2018. The National Supervision Commission: A new anti-corruption model in China.
International Journal of Law, Crime and Justice 52: 58-73.
Dickson BJ. 2003. Red capitalists in China: The party, private entrepreneurs, and prospects
for political change. Cambridge University Press.
Ding H, Fang H, Lin S, Shi K. 2020. Equilibrium consequences of corruption on firms:
Evidence from china’s anti-corruption campaign, National Bureau of Economic Research.
Fan JP, Titman S, Twite G. 2012. An international comparison of capital structure and debt
maturity choices. Journal of Financial and quantitative Analysis 47(1): 23-56.
Ferri G, Liu L-G. 2010. Honor thy creditors beforan thy shareholders: Are the profits of
Chinese state-owned enterprises real? Asian Economic Papers 9(3): 50-71.
Greenwood R, Raynard M, Kodeih F, Micelotta ER, Lounsbury M. 2011. Institutional
complexity and organizational responses. Academy of Management annals 5(1): 317-371.
Haveman HA, Jia N, Shi J, Wang Y. 2017. The dynamics of political embeddedness in China.
Administrative Science Quarterly 62(1): 67-104.
Jackson G, Deeg R. 2019. Comparing capitalisms and taking institutional context seriously.
Journal of International Business Studies 50(1): 4-19.
Jensen NM, Li Q, Rahman A. 2010. Understanding corruption and firm responses in
cross-national firm-level surveys. Journal of International Business Studies 41(9): 1481-1504.
Jeong Y, Weiner RJ. 2012. Who bribes? Evidence from the United Nations' oil‐for‐food
program. Strategic Management Journal 33(12): 1363-1383.
Keliher M, Wu H. 2016. Corruption, anticorruption, and the transformation of political culture
in contemporary China. The Journal of Asian Studies: 5-18.
Kim DS, Li Y, Tarzia D. 2018. Value of corruption in China: Evidence from anti-corruption
investigation. Economics Letters 164: 112-116.
Kolstad I, Wiig A. 2012. What determines Chinese outward FDI? Journal of World Business

151
47(1): 26-34.
La Porta R, Lopez‐de‐Silanes F, Shleifer A, Vishny RW. 1997. Legal determinants of
external finance. The journal of finance 52(3): 1131-1150.
Li B, Wang Z, Zhou H. 2018. China’s anti-corruption campaign and credit reallocation from
SOEs to non-SOEs. PBCSF-NIFR Research Paper(17-01).
Li F, Ding D. 2017. The dual effects of home country institutions on the internationalization
of private firms in emerging markets. Multinational Business Review.
Li L. 2001. Support for anti-corruption campaigns in rural China. Journal of Contemporary
China 10(29): 573-586.
Lin C, Morck R, Yeung B, Zhao X. 2016. What do we learn from stock price reactions to
China’s first announcement of anti-corruption reforms? , National Bureau of Economic
Research.
Luo XR, Wang D, Zhang J. 2017. Whose call to answer: Institutional complexity and firms’
CSR reporting. Academy of management journal 60(1): 321-344.
Luo Y. 2005. An organizational perspective of corruption. Management and Organization
Review 1(1): 119-154.
Luo Y. 2008. The changing Chinese culture and business behavior: The perspective of
intertwinement between guanxi and corruption. International Business Review 17(2):
188-193.
Luo Y, Tung RL. 2007. International expansion of emerging market enterprises: A
springboard perspective. Journal of International Business Studies 38(4): 481-498.
Luo Y, Xue Q, Han B. 2010. How emerging market governments promote outward FDI:
Experience from China. Journal of world business 45(1): 68-79.
Luo Y, Zhao H, Wang Y, Xi Y. 2011. Venturing abroad by emerging market enterprises.
Management International Review 51(4): 433.
Manion M. 2004. Lessons for Mainland China from anti-corruption reform in Hong Kong.
China Review: 81-97.
Meyer KE, Peng MW. 2016. Theoretical foundations of emerging economy business research.

152
Journal of International Business Studies 47(1): 3-22.
Morck R, Yeung B, Zhao M. 2008. Perspectives on China's outward foreign direct investment.
Journal of International Business Studies 39(3): 337-350.
Naughton B. 2003. How much can regional integration do to unify China’s markets? How far
across the river: 204-232.
Oliver C. 1991. Strategic responses to institutional processes. Academy of management review
16(1): 145-179.
Oliver C, Holzinger I. 2008. The effectiveness of strategic political management: A dynamic
capabilities framework. Academy of Management Review 33(2): 496-520.
Peng MW, Sun SL, Pinkham B, Chen H. 2009. The institution-based view as a third leg for a
strategy tripod. Academy of Management Perspectives 23(3): 63-81.
Peng MW, Wang DY, Jiang Y. 2008. An institution-based view of international business
strategy: A focus on emerging economies. Journal of international business studies 39(5):
920-936.
Qian N, Wen J. 2015. Xi Jinping’s Anti-Corruption Campaign and the Import of Luxury
Goods in China, Working Paper, Yale University.
Qian Y, Roland G. 1998. Federalism and the soft budget constraint. American economic
review: 1143-1162.
Santangelo GD, Meyer KE. 2011. Extending the internationalization process model: Increases
and decreases of MNE commitment in emerging economies. Journal of International
Business Studies 42(7): 894-909.
Sheng S, Zhou KZ, Li JJ. 2011. The effects of business and political ties on firm performance:
Evidence from China. Journal of Marketing 75(1): 1-15.
Sutherland D, Ning L. 2011. Exploring ‘onward-journey’ODI strategies in China's private
sector businesses. Journal of Chinese Economic and Business Studies 9(1): 43-65.
Tanzi V. 1998. Corruption and the budget: Problems and solutions. In Economics of
corruption. Springer.
Tao Y. 2020. China’s anti-corruption campaign and bank loan loss provisions: Evidence from

153
a quasi-natural experiment. Economics Letters 196: 109505.
Treisman D. 2007. What have we learned about the causes of corruption from ten years of
cross-national empirical research? Annual Review of Political Science 10: 211-244.
Wang C, Hong J, Kafouros M, Wright M. 2012. Exploring the role of government
involvement in outward FDI from emerging economies. Journal of International Business
Studies 43(7): 655-676.
Wedeman A. 2005. Anticorruption Campaigns and the Intensification of Corruption in China.
Journal of Contemporary China 14(42): 93-116.
Wei T, Clegg J, Ma L. 2015. The conscious and unconscious facilitating role of the Chinese
government in shaping the internationalization of Chinese MNCs. International Business
Review 24(2): 331-343.
Weill L. 2011. How corruption affects bank lending in Russia. Economic systems 35(2):
230-243.
Witt MA, Lewin AY. 2007. Outward foreign direct investment as escape response to home
country institutional constraints. Journal of International business studies 38(4): 579-594.
Wright M, Filatotchev I, Hoskisson RE, Peng MW. 2005. Strategy research in emerging
economies: Challenging the conventional wisdom. Journal of management studies 42(1):
1-33.
Xu D, Meyer KE. 2013. Linking theory and context:‘Strategy research in emerging
economies’ after Wright et al.(2005). Journal of management studies 50(7): 1322-1346.
Xu G, Yano G. 2017. How does anti-corruption affect corporate innovation? Evidence from
recent anti-corruption efforts in China. Journal of Comparative Economics 45(3): 498-519.
Yan ZJ, Zhu JC, Fan D, Kalfadellis P. 2018. An institutional work view toward the
internationalization of emerging market firms. Journal of World Business 53(5): 682-694.
Young A. 2000. The razor's edge: Distortions and incremental reform in the People's Republic
of China. The Quarterly Journal of Economics 115(4): 1091-1135.

154
CHAPTER FIVE
Discussion and Conclusion
5.1 Conclusions
This thesis attempts to explore the relationship between a firm’s strategies such as bribery,
innovation and OFDI and its business environment such as government behavior and
corruption. The three specific papers are developed to address this topic at the individual-,
firm-, and provincial-level. This thesis holds a slightly different position compared with the
conventional academic literature about bribery or corruption which focuses on governmental
responsibility and views the accountability of government as the ultimate solution for this
issue. In turn, I look into the determinants of bribery from a firm's perspective (Chapter 2 and
3), and explore how government endeavor of combating corruption influence firms’ strategy
of internationalization (Chapter 4).
In Chapter 2, I have answered question 1: how does a specific actor (i.e. government) in the
environment influence firms’ decision to bribe; in other words, why do firms use bribery as a
non-market strategy when governments imposes constraints on firms? I have used resource
dependence theory to explore the influence of asymmetric power relationship between firms
and governments on managers’ willingness to justify bribery. The findings show that
regulatory efficiency has a negative effect on managers’ tendency to bribe, and this
relationship will be strengthened in a nation with strong political rights. Managers who work
in private firms will be more likely to implement illegal rather than legal means to deal with
resource constraints imposed by governments.

155
The purpose of Chapter 3 is to explore how firms’ strategy (innovation) triggers bribery as a
problemistic search under a specific environment (emerging markets). I have examined the
relationship between innovation and bribery under the theoretical framework of behavior
theory of the firm. The findings reveal that R&D input will lead to firms’ bribery in emerging
economies, whereas R&D output will alleviate the positive relationship between innovation
input and bribery. Also, aspirational strain and unfair strain of a nation will strengthen the
relationship between R&D input and bribery since general strain theory suggests that firms
may use illegal means to achieve goals prevented by negative external conditions.
In Chapter 4, I attempt to investigate how the change of corrupt level in the environment
influences firms’ internationalization strategy (OFDI). Using the recent anticorruption
campaign in China as a quasi-natural experiment, I find that corruption control in the home
country can restrain POEs’ OFDI tendency driven by institutional escapism, while
institutional support such as the “go global” policy maintains an aggregate increase in OFDI.
The negative effect of the anticorruption campaign on POEs’ OFDI is based on the
mechanism of improving financing and breaking down the local protectionism.
The summary of hypotheses in each Chapter is shown in Table 5.1. The empirical data from
the individual-, firm- and provincial- support all the respective hypotheses.
Table 5.1
The Summary of Hypotheses in the Thesis表格 0.1
Chapter Hypotheses
Chapter 2Hypothesis 1: Regulatory efficiency of a nation has a negative effect on managers’ motivation
to bribe.

156
Hypothesis 2: Strong political rights of a nation strengthen the negative effect of regulatory
efficiency on managers’ willingness to justify bribery.
Hypothesis 3:Working in the private sector mitigates the moderating effect of political rights
on the relationship between regulatory efficiency and managers’ willingness to justify bribery.
Chapter 3
Hypothesis 1:A firm’s R&D input has a positive effect on its bribery in emerging economies.
Hypothesis 2: Innovation output negatively moderates the effect of R&D input on bribery in
emerging economies.
Hypothesis 3: The strain of aspiration positively moderates the effect of R&D input on
bribery in emerging economies.
Hypothesis 4: The strain of unfairness positively moderates the effect of R&D input on
bribery in emerging economies.
Chapter 4
Hypothesis 1: The anticorruption campaign has a negative effect on POEs’ OFDI.
Hypothesis 2: The lower the initial level of financial marketization, the more negative the
relationship between the anti-corruption campaign and POEs’ OFDI.
Hypothesis 3: The greater the local protectionism of a province, the more negative the
relationship between the anti-corruption campaign and POEs’ OFDI.
5.2 Theoretical Contributions
I examine the three specific research questions based on different theoretical perspectives
(resource dependence theory, the behavioral theory of the firm, institutional theory), and my
theoretical contributions include a new application of theory (Chapter 2), an extension of the
boundary of a theory (Chapter 3), and an integration of two perspectives of a theory (Chapter
4).
In Chapter 2, I have provided a more subtle perspective to understand bribery and posited that
managers will view bribery as a strategy to acquire resources and then seek unfair competitive
advantages when they problematically depend on their governments. Thus, as long as the
power imbalance exists between an entity providing resources and firms, managers tend to
bribe regardless of whether the environment is accountable or transparent. With the

157
assumption that bribery can be viewed as an illegal non-market strategy, this thesis
synthesizes illegal and legal non-market strategies into a uniform theoretical framework,
which offers a nuanced perspective about the determinants of the choice of non-market
strategies and expands the application of resource dependence theory.
In Chapter 3, I have used the behavioral theory of the firm to explain why firms originally
intending to build long-term competitive advantages may divert towards an illegal, risk-taking
solution such as bribery, and extended the signal of bribery behavior from actual performance
feedback to anticipated performance estimation, which generalizes the BTOF in a more
realistic way. Borrowing ideas from the GST, I have identified two mechanisms – aspirational
strain and unfair strain of a nation, which can be used to intensify firms’ bribery tendency
when they invest in R&D in emerging markets. These two mechanisms, which have similar
functions as negative feedback, extend the boundary of BTOF.
In Chapter 4, through investigating the influence of anticorruption campaign in China on
POEs’ internationalized strategy, I have successfully integrated the perspectives of
institutional complexity and institutional dynamics, and examined the function of opposite
institutional logics under the different government policies. I find that the motivation of OFDI
is a combination of institutional escapism and institutional support. As the anticorruption
campaign improves the institutional quality in terms of easing financing and breaking down
local protectionism, the motivation of institutional escapism will be alleviated while the
institutional support remain the same. Then, firms will redirect their OFDI behavior in
response to the change of this complex institutional environment.

158
5.3 Practical Implications
The three papers have not only made different theoretical contributions, but also provided
practical implications for both managers/firms and policy-makers/governments.
5.3.1 managerial implications
In Chapter 2, I have confirmed that bribery can be used as an illegal non-market strategy to
counterbalance their power disadvantage position, which does not imply that bribery is a
justifiable way to acquire resources in a healthy society. Now that lobbying and other
corporate political activities have a similar function to bribery, but are legal and acceptable, it
may be smart to invest in political activities at the early stage and cultivate political
connections to deal with the inevitable challenge from the asymmetry dependence of the
government.
In Chapter 3, I have investigated the situation that the anticipated negative feedback triggers
bribery. The implication for managers in this study is that expectation management is
important to prevent problemistic searches such as bribery. Although in reality, information is
asymmetric and a decision-making process is far from rational, the more accurate evaluation
of the environment firms approaches, the less likely firms will use bribery to deal with
negative feedback.
In all, from a firms’ point of view, it might be reasonable that bribery can grease the wheel in
a short term to some extent, such as alleviating the resource constraints imposed by
government, or mitigating an instant pressure stemming from anticipated performance
shortfalls. However, as a myopic solution, bribery cannot build actual comparative advantages

159
in the long run. For instance, in Chapter 3, I prove that accumulating innovative acknowledge
will decrease firms’ tendency to bribe when firms confront a risk of failure caused by an
unfavorable environment. In other words, the core competitive advantage for firms is their
capability to launch a new product rather than resorting to illegal means to avoid risks by
chance. Thus, firms should never account for survival and prosperity through bribery.
5.3.2 Policy-maker implications
Despite emphasizing accountability or transparency, this thesis demonstrates that
governments should focus on cultivating friendly and efficient environments to curb
corruption. In Chapter 2, the results show that building democratic channels to respond to
firms’ demand will mitigate the possibility of firms’ bribery. Although asymmetric power
relations may not be reversed, providing more efficient administrative services and improving
institutional quality can reduce the possibility of bribery since these efforts can alleviate
resource constraints firms confront and decrease transaction costs firms operate with. In
Chapter 3, institutional deficiencies of emerging markets are the endogenous factors
underlying firms’ decision-making process of bribery. Besides the improvement of formal
institutions, the endeavor of addressing inequality of society and social value of materialistic
help to release the pressure of corruption.
On the other hand, the conclusion of Chapter 4 shows that an anticorruption campaign
influences POEs’ internationalization strategy and reduces firms’ willingness to escape the
home country. Additionally, the effect of the anticorruption campaign will be more apparent if
high-level corrupt officials are cracked down. Government should take action seriously in
160
terms of combating corruption. Otherwise, the positive effect of an anticorruption effort will
not be so evident.
5.4 Limitations and Future Research Directions
Although the thesis is a piece of synthetic research that attempts to extend the understanding
of bribery and corruption from multiple sources of data and theoretical perspectives, there are
limitations from both sides.
First, I suppose that bribery is one kind of firms’ strategy with the implication that bribery can
be viewed as an active, supply-side. Although I am devoted to teasing out the different
theoretical underpinnings behind the demand-side and supply-side bribery, the empirical data
cannot be precisely measured for the existing database. For instance, in Chapter 2, I claimed
that compared to the data of bribery collected by the World Bank, the question “will you
justify bribery” from the World Value Survey is more suitable for measuring the active bribe.
However, I cannot assert that this measurement fully excludes the influence of confronting
demand from government officials. The empirical results are far from perfect, while I believe
the effort I made allows the existing literature to notice the different mechanisms between
demand and supply-side bribery and have a better understanding of the related topics. Future
research may work in this direction.
Second, I have not yet covered all the theories that can help us to explore the topic of bribery
and corruption. For instance, whereas resource dependence theory provides the baseline for
analyzing the relationship between firms and government, agency theory can also explain
corrupt relationships between two parties categorized by the agent and the principal. Viewing

161
engagement of bribery and experience in a corrupt environment as a competitive advantage,
the resource-based view offers the argument that firms can operate smoothly or have better
performance when they have corrupt knowledge. Therefore, the focus of research about
determinants and consequences of bribery and corruption varies along with underlying
theories researchers choose. The more perspectives we provide, the deeper understanding of
this topic we have, and the more possibility we can ultimately control to at least minimize the
damage of corruption. In addition, I limit our research sphere in public bribery which only
consists of one aspect of the fact. Private bribery, on the other hand, is important but
overlooked in the extant literature. Therefore, I call for more rigorous empirical research
about private as well as public bribery with either a qualitative or quantitative method,
although data collection can be a difficult endeavor.