Brewing the Future: Oregon State University
69
How Craft Beer is Transforming the Way We Think About Hops & Hop Flavor Thomas H. Shellhammer Oregon State University Department of Food Science and Technology
-
Upload
khangminh22 -
Category
Documents
-
view
0 -
download
0
Transcript of Brewing the Future: Oregon State University

How Craft Beer is Transforming the Way We Think About Hops & Hop FlavorThomas H. Shellhammer
Oregon State University
Department of Food Science and Technology
The elements of this talk
• What is craft beer?
• How has craft beer affected the brewing supply chain
• Hop-forward beers are changing how we evaluate hop flavor
• Non-volatile components increase in number and complexity
• Controlling hop aroma – the new holy grail.

Principle Components Concentration (%w/w)
Cellulose-lignins 40.0 - 50.0
Protein 15.0
Alpha acids 2.0 - 17.0
Beta acids 2.0 - 10.0
Water 8.0 - 12.0
Minerals 8.0
Polyphenols and tannins 3.0 - 6.0
Lipids and fatty acids 1.0 - 5.0
Hop oil 0.5 - 3.0
Monosaccharides 2.0
Pectins 2.0
Amino acids 0.1
European Brewery Convention Hops and Hop Products, Manual of Good Practice;
Getranke - Fachverlag Hans Carl: Nurnberg, Germany, 1997.
Chemical Composition of Hops
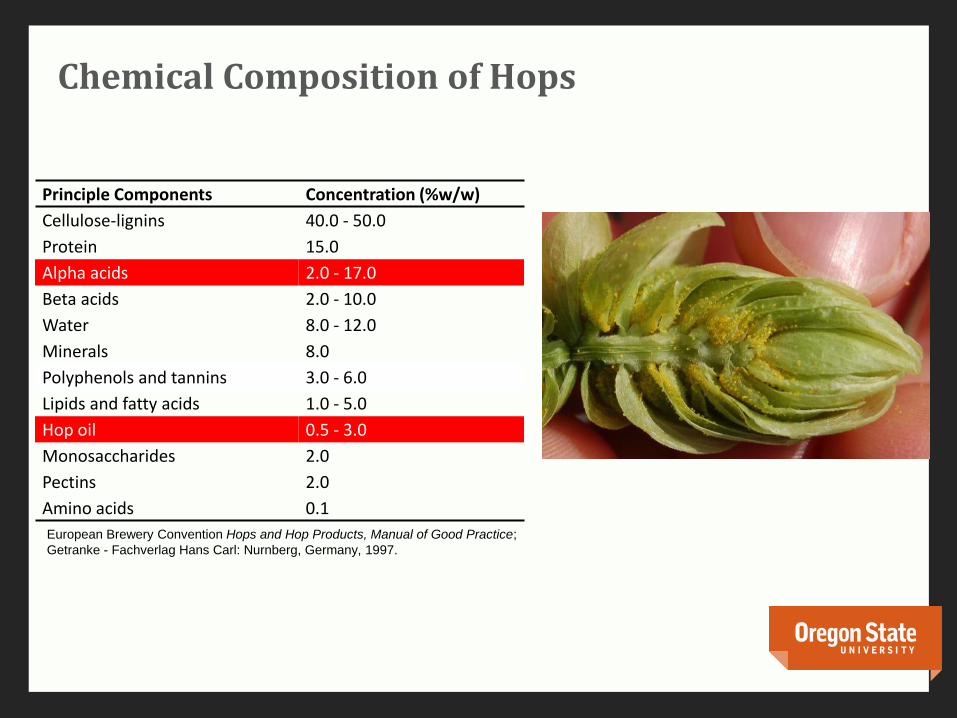

Global beer and hops production
Barth Haas Report 2014

Traditional view of global hops supply vs demand
Barth Haas Report 2014

What is craft beer?

Market segments as defined by the Brewers Association
Microbreweries• Brew less than 15,000 BBL per year
Brewpub• Restaurant-brewery with >25% of beer sold on site
Regional brewery• 15,000 – 6 Million BBL per year
Regional Craft Brewery• A regional brewery producing >50% all malt beer or adjuncts used to
enhance and not lighten flavor.
Craft Beer• “Small” – less than 6 million BBl
• Independent (at least 75% independently owned)
• Traditional

U.S. Brewing – Large vs small brewers
0
20000000
40000000
60000000
80000000
100000000
120000000
ABI MillerCoors Yuengling Boston BeerCo.
Sierra NevadaBrewing Co.
New BelgiumBrewing Co.
Gambrinus LagunitasBrewing Co.
DeschutesBrewery
An
nu
al U
.S. P
rod
uct
ion
(U
S B
bl)

U.S. Brewing – Large vs small brewers
0
500,000
1,000,000
1,500,000
2,000,000
2,500,000
Boston Beer Co. Sierra NevadaBrewing Co.
New BelgiumBrewing Co.
Gambrinus Lagunitas BrewingCo.
Deschutes Brewery
An
nu
al U
S P
rod
uct
ion
(U
S B
bl)

http://www.brewersassociation.org/statistics/number-of-breweries/
Number of breweries, 1870 – PresentTremendous growth in U.S. as a result of craft brewery startups

Brewpubs/Microbreweries drive growth of craft
http://www.brewersassociation.org/statistics/number-of-breweries/

https://www.brewersassociation.org/statistics/national-beer-sales-production-data/

Long term trends in craft brewing
Chuck Skypeck, Brewers Association

U.S. craft beer growth, 2001 - 2013
Chris Swersey, Brewers Association

Craft beer is growing…but overall U.S. beer growth is flat
Chris Swersey, Brewers Association

U.S. Craft brewers are using more and more hops
Adapted from Brewers Association
400
450
500
550
600
650
700
750
2008 2010 2012 2014 2016
Ho
p u
sag
e (
g/h
L)
Year
Hop usage (g/hL)

U.S. Craft brewers are using more and more hops
Adapted from Brewers Association
0
100
200
300
400
500
600
700
800
2008 2010 2012 2014 2016
Ho
p u
sag
e (
g/h
L)
Year
Hop usage (g/hL)

U.S. Craft brewers are using more and more hops
Adapted from Brewers Association
0
1000
2000
3000
4000
5000
6000
7000
8000
9000
2008 2010 2012 2014 2016
Ho
p u
sag
e (
g/h
L)
Year
Hop usage (g/hL)

How is this growth impacting farming?

U.S. aroma hop acreage has increased significantly
Chris Swersey, Brewers Association

-50%
0%
50%
100%
150%
200%
250%
% Acreage Change '12-'13: Craft Hops vs CTZ
Where is growth in U.S. hop varieties?

U.S. farmers are investing and growing

U.S. farmers are investing and growing

U.S. farmers are investing and growing

How does the growth in demand impact breeding?

Hops breeding takes time and enormous effort
Year 1: Parental selection and crossing
• Based on breeding objectives
Year 2: Early selection
• Start 40,000
• 10% selection rate
• End 4000
Years 3,4,5: Intermediate selection
• Start 4,000
• 1% selection rate
• End 40
Years 6,7,8:Advanced selection
• Start 40
• 3% selection rate
• End 1.2
Years 9,10,11:Elite Trials
• Overall rate: 0.005%
• Start 2
• Selection rate: ?
Year 11+: Commercialization
Jason Perrault, Select Botanicals Group
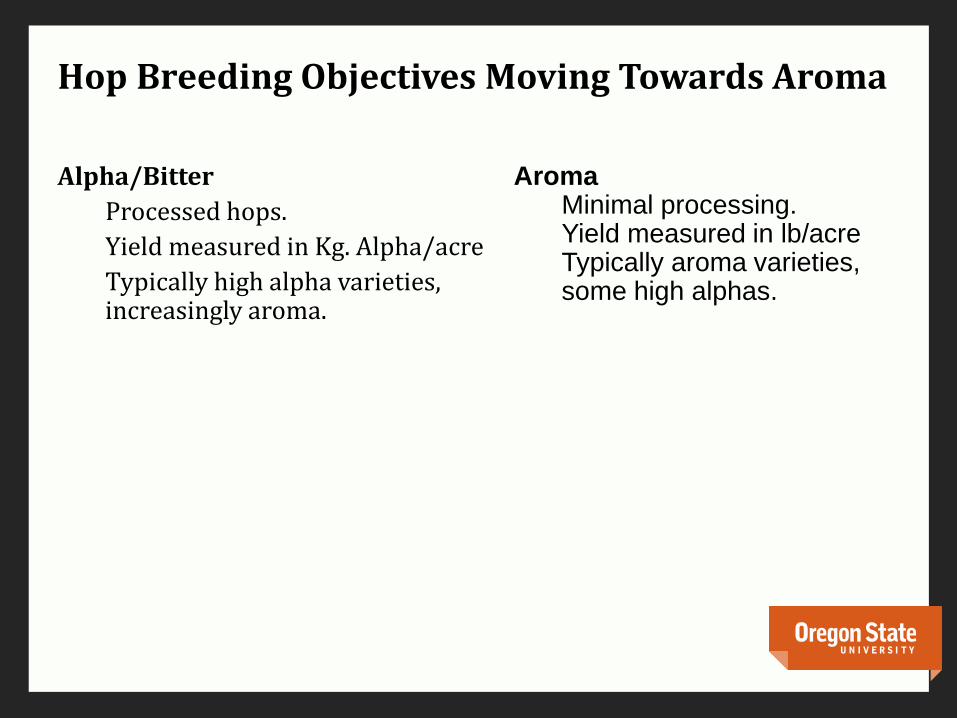
Hop Breeding Objectives Moving Towards Aroma
Alpha/Bitter
Processed hops.
Yield measured in Kg. Alpha/acre
Typically high alpha varieties, increasingly aroma.
AromaMinimal processing.Yield measured in lb/acreTypically aroma varieties, some high alphas.

Brewers’ flavor expectations of hop varietiesPCA of responses – D1 vs. D2
Cascade
Citra
Amarillo
Simcoe®
Summit
Chinook
Nelson Sauvin
(CTZ) Columbus/Tomahawk/Ze
us
Ahtanum
Herkules
Hallertau Taurus
Millenium
Styrian Golding
Apollo
Nugget
Galena
Palisade® Willamette
Perle (US origin)
Northern Brewer
Spalt Select Hallertau Tradition
Tettnanger
Brewer's Gold
Hallertau MittleFreuh
Saaz
Perle (German origin)
East Kent Golding
Magnum
Cluster
Spalter
Fuggle
Floral
FruityTropical fruit
CitrusHerbal
Spicy
GrassyWoody
Onion/Garlic
Musty
LeatherTobacco
-2
-1
0
1
2
3
4
5
-6 -5 -4 -3 -2 -1 0 1 2 3 4 5 6
D2 (
20.8
6 %
)
D1 (32.90 %)
Biplot (axes D1 and D2: 53.76 %)after Varimax rotation

Nels
on
Sa
uvin
Am
arillo
Ca
sca
de
Citra
Ah
tan
um
Pa
lisa
de
®
Will
am
ette
He
rku
les
Sim
co
e®
Ch
ino
ok
Halle
rta
u T
au
rus
Pe
rle
(U
S o
rigin
)
Halle
rta
u T
rad
itio
n
Pe
rle
(G
erm
an
origin
)
Halle
rta
u M
ittle
Fre
uh
Sp
alt S
ele
ct
Te
ttn
an
ge
r
Sty
ria
n G
old
ing
Sa
az
Su
mm
it
CT
Z
Ap
ollo
Mill
en
ium
Ea
st K
en
t G
old
ing
Fu
ggle
Sp
alte
r
Ma
gn
um
Clu
ste
r
Ga
len
a
Bre
we
r's G
old
Nugge
t
No
rth
ern
Bre
we
r
0
20
40
60
80
100
120
Dis
sim
ila
rity
Cluster analysis yields 4 groups

Group characteristics and varieties
Group Floral FruityTropical
fruit Citrus Herbal Spicy Grassy WoodyOnion/Gar
lic Musty Leather Tobacco
1 2.847 3.292 2.843 3.653 1.673 1.766 1.298 0.526 0.461 0.252 0.200 0.183
2 2.565 1.881 1.128 1.933 2.622 2.461 1.825 1.245 0.696 0.416 0.388 0.418
3 2.078 2.112 1.918 2.665 2.138 2.199 2.011 1.417 2.769 1.237 0.489 0.503
4 2.063 1.480 0.725 1.391 2.280 2.147 1.891 1.513 0.637 0.779 0.633 0.604
Group 1 Group 2 Group 3 Group 4Citrus Herbal Grassy WoodyFruity Spicy Onion TobaccoFloral Floral Musty Leather
Cascade Simcoe® Summit Millennium Citra Chinook CTZ Nugget
Amarillo Ahtanum Apollo Galena
Nelson Sauvin Herkules Northern Brewer Hallertau Taurus Brewer's Gold
Styrian Golding East Kent Golding Palisade® Magnum
Willamette Cluster
Perle (US origin) Spalter
Spalt Select Fuggle
Hallertau Tradition
Tettnanger Hallertau MittleFreuh
Saaz Perle (German origin)

Brewers’ flavor expectations of hop varietiesPCA of responses – D1 vs. D2
Cascade
Citra
Amarillo
Simcoe®
Summit
Chinook
Nelson Sauvin
(CTZ) Columbus/Tomahawk/Ze
us
Ahtanum
Herkules
Hallertau Taurus
Millenium
Styrian Golding
Apollo
Nugget
Galena
Palisade® Willamette
Perle (US origin)
Northern Brewer
Spalt Select Hallertau Tradition
Tettnanger
Brewer's Gold
Hallertau MittleFreuh
Saaz
Perle (German origin)
East Kent Golding
Magnum
Cluster
Spalter
Fuggle
Floral
Fruity
Tropical fruitCitrusHerbal
Spicy
GrassyWoody
Onion/Garlic
Musty
LeatherTobacco
-2
-1
0
1
2
3
4
5
-6 -5 -4 -3 -2 -1 0 1 2 3 4 5 6
D2 (
20.8
6 %
)
D1 (32.90 %)
Biplot (axes D1 and D2: 53.76 %)after Varimax rotation

-50%
0%
50%
100%
150%
200%
250%
% Acreage Change '12-'13: Craft Hops vs CTZ
Where is growth in U.S. hop varieties?
How does the growth craft beer impact how we think about and measure hop flavor?

Hop-forward beers are created using late and dry hopping and unique varieties
CC
V
Kettle Whirlpool
• Factors
• Hopping Regime (Kettle, Whirlpool, Dry-hop)
• Hop Cultivar (Simcoe, Hallertau Mittlefrueh)
• Yeast (ale vs lager)
• Response
• Chemical (Volatiles)
• Sensory (Descriptive Analysis)
60 minute boil ~100 °C, 10
min18°C, 48 hours
Daniel Sharp, 2014

Hopping regime and hop variety interact
Daniel Sharp, 2014

Craft brewers’ top brands are hop-forward
0
500,000
1,000,000
1,500,000
2,000,000
2,500,000
Boston Beer Co. Sierra NevadaBrewing Co.
New BelgiumBrewing Co.
Gambrinus Lagunitas BrewingCo.
Deschutes Brewery
An
nu
al U
S P
rod
uct
ion
(U
S B
bl)

Principle Components Concentration (%w/w)
Cellulose-lignins 40.0 - 50.0
Protein 15.0
Alpha acids 2.0 - 17.0
Beta acids 2.0 - 10.0
Water 8.0 - 12.0
Minerals 8.0
Polyphenols and tannins 3.0 - 6.0
Lipids and fatty acids 1.0 - 5.0
Hop oil 0.5 - 3.0
Monosaccharides 2.0
Pectins 2.0
Amino acids 0.1
European Brewery Convention Hops and Hop Products, Manual of Good Practice;
Getranke - Fachverlag Hans Carl: Nurnberg, Germany, 1997.
Chemical Composition of Hops

Thermal isomerization of alpha acids produces iso-alpha acid bitterness
Low solubility
Low bitterness
High solubility
High bitterness

Iso-a acids

Before HPLC there was counter current extraction or separation
Link

Counter current extraction

Liquid-Liquid extraction of bitter compounds from beer
Strong Acid
Adds excess hydrogen ions to solution – protonating all carboxylic acid functional
groups
3 N Hydrochloric Acid
Non-Polar SolventWhen functional groups are
protonated at a lower pH molecules decrease in polarity
2,2,4 trimethylpentane
+
BeerBitter compounds
Iso alpha acidsOxidized hop acids
PolyphenolsNon-bitter compounds
Alpha acids
+
The IBU Analysis

Measure the absorbance at 275 nm
Absorbance @275 x 50 = Bittering Units
1 BU ≠ 1 ppm iso-alpha acid
The IBU Analysis

BU correlates with bitterness and iso-alpha acids concentrations at low hopping levels

0.0
2.0
4.0
6.0
8.0
10.0
12.0
14.0
16.0
0.0 2.0 4.0 6.0 8.0 10.0 12.0 14.0
Bit
tern
ess
Un
its
Iso-alpha acids (ppm) via HPLC
Correlation between total IAA & IBU

Lightly kettle hopped beer

0.0
1.0
2.0
3.0
4.0
5.0
6.0
7.0
0.0
2.0
4.0
6.0
8.0
10.0
12.0
14.0
16.0
0.0 2.0 4.0 6.0 8.0 10.0 12.0 14.0
Sen
sory
Bit
tern
ess
Bit
tern
ess
Un
its
Iso-alpha acids (ppm) via HPLC
Sensory bitterness tracks BU/IAA
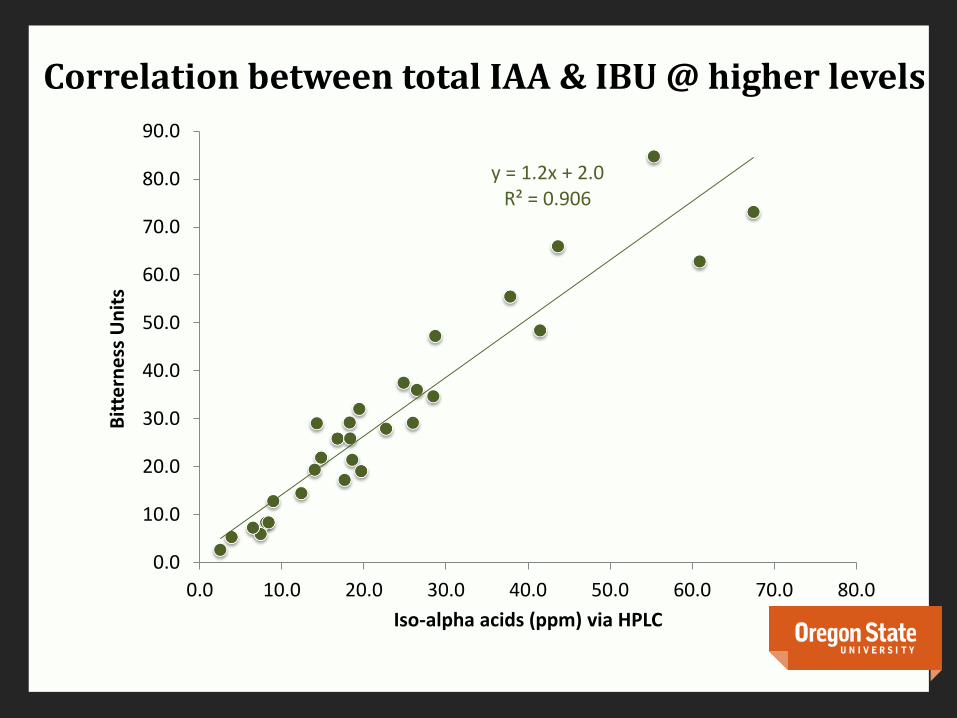
y = 1.2x + 2.0R² = 0.906
0.0
10.0
20.0
30.0
40.0
50.0
60.0
70.0
80.0
90.0
0.0 10.0 20.0 30.0 40.0 50.0 60.0 70.0 80.0
Bit
tern
ess
Un
its
Iso-alpha acids (ppm) via HPLC
Correlation between total IAA & IBU @ higher levels

y = 1.2x + 2.0R² = 0.906
0.0
10.0
20.0
30.0
40.0
50.0
60.0
70.0
80.0
90.0
0.0 10.0 20.0 30.0 40.0 50.0 60.0 70.0 80.0
Bit
tern
ess
Un
its
Iso-alpha acids (ppm) via HPLC
Correlation between total IAA & IBU

0.0
2.0
4.0
6.0
8.0
10.0
12.0
14.0
0.0
10.0
20.0
30.0
40.0
50.0
60.0
70.0
80.0
90.0
0.0 10.0 20.0 30.0 40.0 50.0 60.0 70.0 80.0
Sen
sory
Bit
tern
ess
Bit
tern
ess
Un
its
Iso-alpha acids (ppm) via HPLC
Sensory bitterness does not track BU/IAA

Heavily dry-hopped beer

a b c
de
f
g
h
i
j
a. (+)-catechin
b. (-)-epicatechin
c. (-)-epigallocatechin
d. Procyanidin B3
e. Prodelphinidin B3
f. Procyanidin C2
g. quercetin
h. kaempferol
i. xanthohumol
j. isoxanthohumol
Another potential source of bitterness – hop polyphenols
Extraordinarily diverse group of
compounds found in all plant material.
Characterized by a number of aromatic
rings with numerous substituted
hydroxyl
groups.
Polyphenols are highly reactive,
easily oxidized and polymerized
into high MW tannins.

a and b acid oxidation
a acid - Humulone b acid - LupuloneIso-a-acid
iso humulone

a and b acid oxidation
Oxidized alpha acid
Humulinone
Oxidized beta acid
Hulupone
a acid - Humulone b acid - Lupulone
Oxidation
Iso-a-acid
iso humulone

a and b acid oxidation
Oxidized alpha acid
Humulinone
Oxidized beta acid
Hulupone
a acid - Humulone b acid - Lupulone
Oxidation
Iso-a-acid
iso humulone
Algazzali, 2014

10 Lagers
4 Amber-Reds
4 Pale Ales
4 IPAs
5 of 10
humulinones
4 of 4
4 of 4
4 of 4
hulupones
0 of 10
2 of 4
2 of 4
3 of 4
17 7
Commercial beer survey
22
Algazzali, 2014

Commercial beer survey
humulinonesaverage (mg/L)
huluponesaverage (mg/L)
Lagers (10) 1.3 (0 - 4.4) 0.0
Amber/Red (4) 14.4 (1.7 - 39.9) 2.0 (0 - 6.8)
Pale Ale (4) 8.2 (3.0 - 12.9) 0.8 (0 - 1.7)
IPA (4)20.7 (11.7 -
27.9)
1.8 (11.7 -
27.9)
Algazzali, 2014

62.5
21.6
39.9
6.8
0
10
20
30
40
50
60
70
BU iso-α-acid(ppm)
humulinone(ppm)
hulupone(ppm)
Example: Amber-Red 2
Algazzali, 2014

62.5
21.626.0
5.6
0
10
20
30
40
50
60
70
BU iso-α-acid(bitterness)
humulinone(bitterness)
hulupone(bitterness)
41%49%
10%
Example: Amber-Red 2
Algazzali, 2014
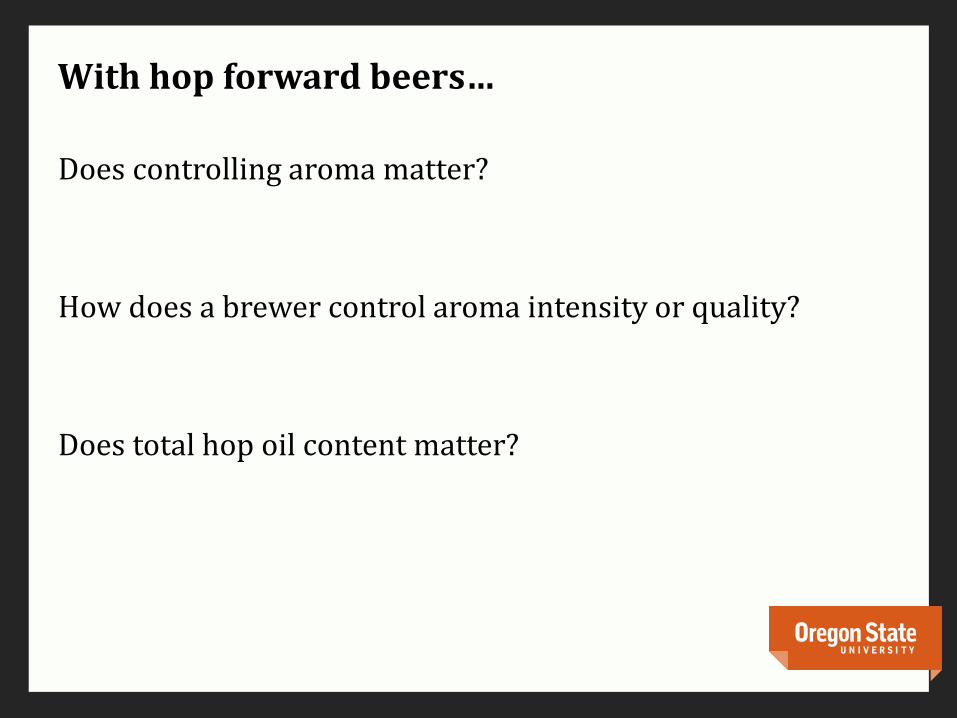
With hop forward beers…
Does controlling aroma matter?
How does a brewer control aroma intensity or quality?
Does total hop oil content matter?

Conceptual approach – does oil amount matter
Primary Factors:
• Oil Content (15 unique oil contents)
• Oil Composition
Secondary Factors:
• Region (Washington, Oregon)
• Location (WA – 2) (OR – 2)
• Farm (WA – 3) (OR – 2)
• Harvest Dates (Aug 14 – Sept 22)
• Kiln Type, Time, Temperature
R2
C1
1 lb/barrel
ControlWhole Cone Cascade
OregonWashington
Farm 1 Farm 2 Farm 1 Farm 2
1 2 3 n
Farm 3
Vollmer, 2015

Cascade Hops with varying total oil content
0.0
0.5
1.0
1.5
2.0
2.52
27
2_1
22
92
_1
30
00
_1
30
00
_2
24
34
_1
23
97
_1
24
71
_1
30
08
_1
23
80
_1
23
16
_1
26
05
_1
30
34
_1
24
18
_1
22
95
_1
24
32
_1
23
56
_1
24
06
_1
25
80
_1
26
10
_1
26
34
_1
33
05
_1
33
05
_2
24
14
_1
26
78
_1
30
56
_2
31
28
_1
31
28
_2
30
56
_1
Tota
l Oil
Co
nte
nt
(ml/
10
0g)
Lot ID
OSU Total Oil Content
Vollmer, 2015

Cascade Hops with varying total oil content
5.00
6.00
7.00
8.00
9.00
10.00
0.0
0.5
1.0
1.5
2.0
2.5
22
72
_1
22
92
_1
30
00
_1
30
00
_2
24
34
_1
23
97
_1
24
71
_1
30
08
_1
23
80
_1
23
16
_1
26
05
_1
30
34
_1
24
18
_1
22
95
_1
24
32
_1
23
56
_1
24
06
_1
25
80
_1
26
10
_1
26
34
_1
33
05
_1
33
05
_2
24
14
_1
26
78
_1
30
56
_2
31
28
_1
31
28
_2
30
56
_1
Ove
rall
Ho
p A
rom
a In
ten
sity
Tota
l Oil
Co
nte
nt
(ml/
10
0g)
Lot ID
OSU Total Oil Content OHAI
Vollmer, 2015

The “usual suspects” may not matter
Vollmer, 2015
y = 74.3x + 235.3R² = 0.031
0
200
400
600
800
1000
1200
1400
1600
1800
5 6 7 8 9 10
mg/
10
0g
of
ho
ps
OHAI
Myrcene
y = -0.46x + 10.737R² = 0.019
0
2
4
6
8
10
12
14
16
5 6 7 8 9 10
OHAI
Linalool
Conclusion
• Beware of brewing dogma
• Challenge conventional wisdom with science
• Adapt

Acknowledgements
Victor Algazzali
Jeff Clawson
Daniel Sharp
Dan Vollmer
Philip Wietstock