Breeding Ecology of American Kestrels on the Llano Estacado ...
57
Breeding Ecology of American Kestrels on the Llano Estacado of Texas by Shea D’Lynne Mullican, B.S. A Thesis in Wildlife, Aquatic, and Wildlands Science and Management Submitted to the Graduate Faculty of Texas Tech University in Partial Fulfillment of the Requirements for the Degree of MASTER OF SCIENCE Approved Dr. Clint Boal Chair of Committee Dr. Warren Conway Dr. Richard Stevens Mark Sheridan Dean of the Graduate School December, 2018
-
Upload
khangminh22 -
Category
Documents
-
view
0 -
download
0
Transcript of Breeding Ecology of American Kestrels on the Llano Estacado ...
Breeding Ecology of American Kestrels on the Llano Estacado of Texas
by
Shea D’Lynne Mullican, B.S.
A Thesis
in
Wildlife, Aquatic, and Wildlands Science and Management
Submitted to the Graduate Faculty
of Texas Tech University in
Partial Fulfillment of
the Requirements for
the Degree of
MASTER OF SCIENCE
Approved
Dr. Clint Boal
Chair of Committee
Dr. Warren Conway
Dr. Richard Stevens
Mark Sheridan
Dean of the Graduate School
December, 2018

Copyright 2018, Shea Mullican

Texas Tech University, Shea Mullican, December 2018
ii
ACKNOWLEDGMENTS
There are many wonderful people, without whom, none of this research would
have been possible. To my advisor, Dr. Clint Boal: thank you for your expertise,
guidance, constructive criticism, incredible patience, and life lessons. I would like to
thank my committee members, Dr. Warren Conway and Dr. Richard Stevens, for their
reassurance, direction, and sincerity when working with me. I would like to thank the
research technicians who assisted me in the field including Grant Kilcrease, Sarah
Whitson, Jovaan Rue, Madeleine Thornley, and Jonathan McClellan. Many thanks to the
volunteers who graciously spent countless hours reviewing kestrel video footage: Stephen
Kielius, Maggie Meier, Jennifer Long, and Casper Mackenzie. I would also like to thank
Byron Buckley for his friendship over the years and always coming to my aid when I
needed it. Most of all, I’d like to thank my loving husband, Tyrel Mullican, for his
tolerance, hugs, daily encouragement, and electrical know-how.
Sandia National Labs and the Texas Tech University National Wind Institute
provided the funding for this research. The Association of Natural Resource Scientists at
Texas Tech University (hereafter TTU), the Department of Natural Resources
Management at TTU, and the TTU Graduate School provided travel funds for
conferences.
Texas Tech University, Shea Mullican, December 2018
iii
TABLE OF CONTENTS
ACKNOWLEDGMENTS... ............................................................................................... ii
LIST OF TABLES ............................................................................................................. iv
LIST OF FIGURES .............................................................................................................v
I. AMERICAN KESTREL NESTING ECOLOGY ON THE LLANO
ESTACADO
Introduction ..................................................................................................................... 1
Methods........................................................................................................................... 3
Study Area ................................................................................................................... 3
Field Methods .............................................................................................................. 7
Results ............................................................................................................................. 9
Discussion ..................................................................................................................... 14
Literature Cited ............................................................................................................. 19
II. ADULT SURVIVAL AND FIDELITY ESTIMATES OF AMERICAN KESTRELS
NESTING IN ARTIFICIAL NEST BOXES IN LUBBOCK COUNTY TEXAS
Introduction ................................................................................................................... 32
Methods ......................................................................................................................... 34
Study Area ................................................................................................................. 34
Field Methods ............................................................................................................ 38
Analysis ..................................................................................................................... 38
Results ........................................................................................................................... 40
Adult Survival ........................................................................................................... 40
Mate Fidelity.............................................................................................................. 40
Site Fidelity................................................................................................................ 40
Discussion ..................................................................................................................... 41
Literature Cited ............................................................................................................. 44

Texas Tech University, Shea Mullican, December 2018
iv
LIST OF TABLES
1.1. Occupancy of nest boxes and number of nest attempts by American kestrels in
Lubbock Co., TX from 2013-2018. ........................................................................... 22
1.2. Comparison of nest attempts, clutch size, brood size, fledglings/brood, nest
success, and sex ratio among early and late nesting attempts by American
kestrels nesting in nest boxes in Lubbock County, TX from 2013–2018. ............... 23
1.3. Comparison of nest initiation dates between years of American kestrels nesting
in nest boxes in Lubbock County, TX from 2013–2018. .......................................... 24
1.4. Examination of nest initiation phenology of marked adult kestrels that were
captured in consecutive years in Lubbock, County, TX from 2015 to 2017. ............ 25
1.5. S(clutch) was chosen as the best fit model from 15 originally created to assess
American kestrel nest survival from nest data in Lubbock County, TX from
2013−2018. S(clutch) had the lowest AICc value while the next best model
S(constant) had an AICc value of 114.592. ............................................................... 26
1.6. Comparison of American kestrel productivity among published studies. ................. 27
2.1. Adult kestrel age classes based on capture-recapture/resight data in Lubbock
County, TX from 2013−2018. The majority of banded birds were only caught
once. The oldest birds breeding within the nest box program are at least 5 years
old. ............................................................................................................................. 47
2.2. Status of American Kestrels nesting in successive years with marked mates in
nest boxes in Lubbock County, TX from 2013–2018. ............................................. 48
2.3. Number of years that male and female American kestrels demonstrated site
fidelity by using nest boxes within 20 active territories in consecutive years in
Lubbock County, TX from 2013−2018. .................................................................... 49

Texas Tech University, Shea Mullican, December 2018
v
LIST OF FIGURES
1.1. Location of the study area in relation to the Llano Estacado. .................................... 28
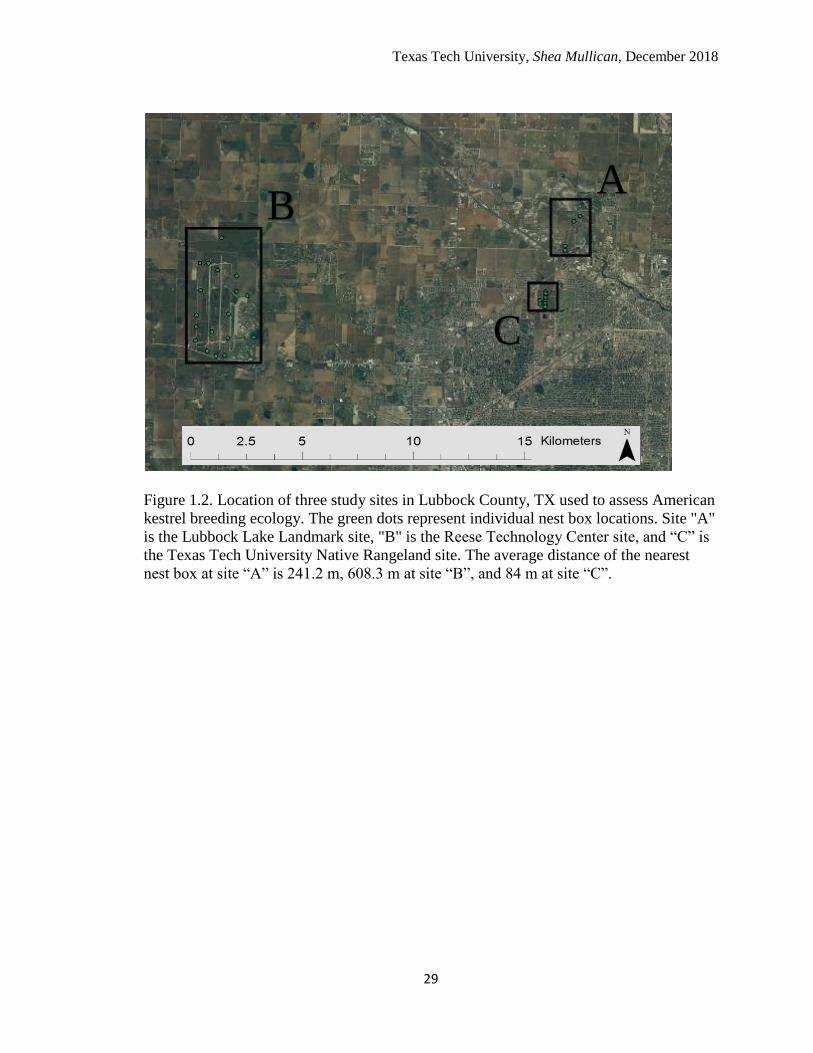
1.2. Location of three study sites in Lubbock County, TX used to assess American
kestrel breeding ecology. The green dots represent individual nest box
locations. Site "A" is the Lubbock Lake Landmark site, "B" is the Reese
Technology Center site, and “C” is the Texas Tech University Native
Rangeland site. The average distance of the nearest nest box at site “A” is
241.2 m, 608.3 m at site “B”, and 84 m at site “C”. .................................................. 29
1.3. Daily Survival Rates (DSR) modelled in Program MARK from American
kestrel nest data in Lubbock County, TX from 2013−2018. The model,
S(clutch), demonstrated that larger clutch sizes have higher daily survival
rates. The error bars represent the standard error associated with each estimate. ..... 30
1.4. Nest survival modelled in Program MARK from American kestrel nest data in
Lubbock County, TX from 2013−2018. The model, S(clutch), demonstrated
that larger clutch sizes are more likely to survive the nesting period. The error
bars represent the 95% confidence intervals associated with each nest survival
estimate. ..................................................................................................................... 31
2.1. Location of the study area in relation to the Llano Estacado. .................................... 50
2.2. Location of three study sites in Lubbock County, TX used to assess American
kestrel breeding ecology. The green dots represent individual nest box
locations. Site "A" is the Lubbock Lake Landmark site, "B" is the Reese
Technology Center site, and “C” is the Texas Tech University Native
Rangeland site. The average distance of the nearest nest box at site “A” is
241.2 m, 608.3 m at site “B”, and 84 m at site “C”. .................................................. 51
Texas Tech University, Shea Mullican, December 2018
1
CHAPTER I
AMERICAN KESTREL NESTING ECOLOGY IN THE LLANO ESTACADO
INTRODUCTION
As a colorful and charismatic raptor, American kestrels (Falco sparverius) easily
catch the interest of both scientists and the birding community. The American kestrel
(hereafter, kestrel) is North America’s smallest falcon and is considered the most
numerous and widespread falcon on the continent (Smallwood and Bird 2002). Kestrels
have a wide geographic distribution and can also be found in Central and South America.
This falcon, like many raptors, displays reversed sexual size dimorphism, with the female
being approximately 10% heavier than males (Smallwood and Bird 2002). As a
secondary cavity nester, kestrels will nest in cavities excavated by woodpeckers or take
advantage of natural cavities within trees (Smith et al. 1972). Suitable nesting cavities
limit the breeding range of kestrels, but the expansion of woody species has allowed
kestrels to expand their breeding range into the Great Plains which provided exceptional
hunting opportunities (Smallwood and Bird 2002). The placement of artificial nest boxes
also provide kestrels breeding season access to habitat that they may otherwise not
occupy (Smallwood and Bird 2002).
Populations of kestrels have been declining over the last few decades in North
America. It is estimated that kestrel populations in North America are declining by 47%
based on collective data from nest box monitoring programs, USGS Breeding Bird
Surveys, Christmas Bird Counts, and raptor migration counts from 1966 to 2010
(American Kestrel Partnership, hereafter AKP, 2018; Farmer and Smith 2009;
Smallwood et al. 2009). Research has yet to identify a definite cause for the declines, but
Texas Tech University, Shea Mullican, December 2018
2
it is most likely a combination of biological and ecological factors such as landscape
changes leading to increased human-caused stress in disturbed areas (Strasser and Heath
2013), climate change (Steenhof and Peterson 2009), chemical exposure (Mitra et al.
2011), loss of suitable nesting habitat, competition for nesting cavities, and disease
(Smallwood and Bird 2002). The shortgrass prairie on the High Plains, once experiencing
kestrel population growth, now has an uncertain population trend (Bird Conservation
region 18; AKP 2015; AKP 2018; North American Bird Conservation Initiative 2016).
Despite the conservation concern for the species, few studies have been conducted on the
kestrel population in the High Plains.
Aspects of kestrel ecology can easily be studied through nest box monitoring
programs as nest boxes enable researchers to closely examine changes in reproduction
and population size over time. Thus, nest box monitoring programs can be an important
component in understanding overall population trends that have been observed in the past
decades across North America. Linner (2014) reported a year-round average kestrel
density of 2.5 birds/km2 in Lubbock and Hockley counties, Texas. Kestrel populations in
areas with nest box programs, however, are likely artificially elevated above what would
be normal for the area. For example, 32 kestrel nest boxes were erected in 2013, centered
on the Reese Technology Center in Lubbock County, Texas, as part of a long-term
monitoring project (Linner 2014). In May 2017, the breeding kestrel density on the Reese
Technology Center was approximately 5 birds/km2 (unpub. data).
Despite nest box programs artificially increasing local populations, they still
allow assessment of population parameters, such as reproductive success and survival
within the area. Productivity and survival are contributing factors to understanding
Texas Tech University, Shea Mullican, December 2018
3
overall population trends. According to the American Kestrel Partnership (2016), the next
closest nest box program to that in Lubbock TX is outside of Dallas, >480 km east, which
suggests that nest boxes are not driving regional population trends. More likely, the
presence of kestrels in the region are influenced by anthropogenic structures and
agroforestry practices that provide nesting and or roosting locations and hunting perches.
Therefore, a study of kestrels using a relatively small number of nest boxes is likely an
accurate representation of kestrel populations trends in the Southern High Plains of
Texas.
I conducted research to better understand the nesting ecology of American
kestrels in the Llano Estacado region of the Southern High Plains of Texas. My
objectives were to determine reproductive parameters of nesting success, productivity,
and nesting phenology of the local population, and compare the results with those
reported in the literature for other populations.
METHODS
Study Area
The Llano Estacado, also referred to as the Southern High Plains, is considered
the southern tip of the larger Great Plains (Figure 1.1). The Llano Estacado is in
Northeast New Mexico and the panhandle of Texas, which lies within the Bird
Conservation Region 18 (North American Bird Conservation Initiative 2016). The area is
characterized by high flat land that lies between the Caprock Canyon to the east in Texas
and Mescalero Ridge to the west in New Mexico (Leatherwood 2010). While the
southern portion lacks a distinct physical boundary, the Johnson Creek branch of the
Colorado River is considered the lower extent of the Llano Estacado (Leatherwood
Texas Tech University, Shea Mullican, December 2018
4
2010). The southern ridge of the Canadian River valley delineates the north border
(Leatherwood 2010).
My study area is Lubbock County, TX which is centrally located within the Llano
Estacado; it is an area of relatively level land with 0-3% of gentle slopes at an elevation
varying around 975 m (Soil Survey Staff 2015). Lubbock County has a semiarid climate
with an average annual precipitation of 467.6 mm, the majority of which occurs between
May and October (Graves 2010). The maximum summer temperature in July averages
33.3° C and the minimum winter temperatures average -3.9° C in January (Graves 2010).
Lubbock County is part of the southern shortgrass prairie in the High Plains,
characterized as a short and mixed grass prairie composed primarily of blue grama
(Bouteloua gracilis) and buffalograss (Bouteloua dactyloides), and dotted with numerous
playas and few shrubs (Diamond 2010; Graves 2010).
Compared to its historic prairie state, the Llano Estacado is now a very different
ecosystem (Leatherwood 2010). Anthropogenic development of the landscape, both
urbanization and agricultural development, altered the vegetative community from
historic continuous prairie to the fragmented landscape of primarily irrigated cropland
and urban housing (Diamond 2010). Today, the majority of land in Lubbock County is
cropland, dispersed farmhouses, and small towns and cities. Cropland accounted for
approximately 73% of landcover in Lubbock County (1715 km2 of 2333 km2 total)
(USDA 2012), which is known for producing cotton, despite occasional droughts (Graves
2010). Of the total cropland acreage in 2012, 48.5% were cotton fields (205,581 acres of
423,830 total cropland acres; USDA 2012). Additionally, fire suppression allowed woody
species, such as oak (Quercus spp.), cedar (Juniperus spp.), elm (Ulmus spp.), and
Texas Tech University, Shea Mullican, December 2018
5
mesquite (Prosopis spp.), to expand their distributions and invade parts of the High
Plains (Leatherwood 2010). The expansion of these woody species allowed secondary
cavity nesters, such as the American kestrel, to also expand their breeding range
(Smallwood and Bird 2002).
My study area consists of three sites, the Lubbock Lake Historic Landmark, the
Reese Technology Center, and the Texas Tech Native Rangeland (Figure 1.2). All of the
sites are classified as rangeland ecological sites of differing transitional stages (Soil
Survey Staff 2015). Transitional stages refer to the seral stages of succession which is
described as a gradient for the three sites. Within these three sites, nest boxes were placed
in remnant native prairie communities that are bordered by asphalt roads/highways,
runways, farmlands, golf courses, or urban neighborhoods. All three sites have different
amounts of prairie coneflower (Ratibida columnifera) and other annual forbs, cacti
(Opuntia spp.), honey mesquite (Prosopis glandulosa), elm, yucca (Yucca spp.), and
native grasses. The study sites support numerous wildlife species of interest and concern
such as the Texas horned lizard (Phrynosoma cornutum), black-tailed prairie dog
(Cynomys ludovicianus), burrowing owl (Athene cunicularia), prairie falcon (Falco
mexicanus), and ferruginous hawk (Buteo regalis) (Texas Parks and Wildlife Department
2016).
The Lubbock Lake Historic Landmark (Figure 1.2; hereafter, Lubbock Lake) is a
136 ha area in central Lubbock County. The site is primarily managed as an
archaeological and educational center. Of the three sites, Lubbock Lake most closely
resembles a pre-European native prairie ecosystem. Lubbock Lake has several hiking
trails scattered throughout the property with varying topography and is similar to the

Texas Tech University, Shea Mullican, December 2018
6
Reese Technology Center site with a primarily shortgrass/blue grama dominant
vegetation community with some woody species present. Lubbock Lake is open to the
public so this site experiences low to moderate levels of human activity on the trails
throughout the year.
The largest study site is the Reese Technology Center (Figure 1.2; hereafter
RTC), a decommissioned United States Air Force base on the west side of Lubbock
County, TX. The RTC has >700 ha with the majority of the vegetation classified as a
shortgrass/blue grama dominant vegetation community (Soil Survey Staff 2015). The
RTC falls in between Lubbock Lake and the Texas Tech Native Rangeland in terms of
seral stages of succession. Concrete runways, one industrial sized turbine and three scaled
wind turbines, playas, and black-tailed prairie dog colonies are present within the
landscape. The RTC experiences daily amounts of manufacturing and machinery activity
mostly due to Zachary and Forterra, an electrical manufacturing company and a water-
related infrastructure manufacturer, respectively. Most of this activity occurs on the
perimeter of RTC.
The Texas Tech Native Rangeland (Figure 1.2; hereafter, Rangeland) is 55 ha in
central Lubbock County. The site encompasses a playa and is comprised of dense honey
mesquite shrubs, broom snakeweed (Gutierrezia sarothrae), threeawn (Aristida spp.),
Russian thistle (Salsola kali), ragweed (Ambrosia spp.), and gramas (Bouteloua spp.)
(Soil Survey Staff 2015; S. Mullican pers. obs.). The Rangeland study site can be
described as a remnant native prairie that has been suppressed of fire and intensely
invaded by mesquite. The density of mesquite and abundance of threeawn, can be used as
an indicator of poor quality rangelands (Stubbendieck 2011). The Rangeland is the most
Texas Tech University, Shea Mullican, December 2018
7
degraded ecosystem of the three sites. Graduate and undergraduate students at Texas
Tech University conduct research at the Rangeland site, but it is not open to the public.
Field Methods
I used a total of 29 nest boxes that were distributed among the three study sites:
the RTC site has 17 nest boxes, there are 8 are on the Rangeland site, and 4 are on
Lubbock Lake. I considered a nest attempt as initiated when one egg had been laid. I
recorded initiation date, clutch size, brood size, sex ratio, and number of fledglings for all
nests, when possible. Nest boxes were checked every two weeks for possible initiation of
nests starting in March of each year from 2013–2018. A 10-foot ladder was used to
access nest boxes. Once the breeding season was underway, I increased nest check
frequency as more eggs were laid and began to hatch. I defined brood size as the number
of chicks that successfully hatched per nest attempt. Nests were then checked every 5-7
days until the oldest chick reached 14 days old. I used a photographic key to age chicks
(Klucsarits and Rusbuldt 2007). Once the oldest chick reached 14 days of age, I increased
nest check frequency to every 3-5 days. The increased frequency of nest checks was
needed to ensure that the chicks were aged accurately. Once the youngest chick reached
18 days old, the entire brood (18 – 22 days old) was hand-captured from the nest box and
each nestling was banded on its right leg with a USGS numeric aluminum leg band.
Procedures followed the AICUC protocol #16034-04 and TTU AICUC SOP 043. I
recorded sex ratio of broods during banding as kestrels are also dimorphic in plumage as
nestlings. I considered a nesting attempt as successful when at least one chick in a brood
reached 80% of fledging age (Steenhof and Newton 2007); this is approximately 24 days
old for American kestrels. This method of determining nest success is an acceptable
Texas Tech University, Shea Mullican, December 2018
8
standard for raptor ecologists, as it is the age after which mortality is lowest for nestlings
prior to leaving the nest (Steenhof and Newton 2007). Nest failures occurred when eggs
did not hatch or if chicks did not survive to fledging age. The number of fledglings was
defined as the number of nestlings per nest attempt that reached 24 days old (80% of
fledging age).
I determined box occupancy rate as the proportion of all nest boxes available in a
given year to the number of boxes that were used (counting any box with 2 nest attempts
in a single season only once). Incubation periods average about 30 days (Bird and Palmer
1988), and female kestrels lay a single egg every other day and incubation usually starts
when the penultimate egg is laid (Bird and Palmer 1988). Thus, I estimated initiation as
30 days prior to the hatching date, plus 3, 5, 7, 9, or 11 days for clutch sizes of 2, 3, 4, 5,
or 6, respectively. I calculated nest initiations by back-dating of the oldest chick, either at
hatching day (if observed) or at the age when the oldest chick was banded, in addition to
the incubation and egg laying period. I calculated the range, median, and average nest
initiation dates across and within each year. Nest initiation, clutch size, brood size,
number of nests, and number of fledglings were averaged over the entire year (including
first and second nesting attempts) for known-fate nests only, unless otherwise stated.
Means were reported with one standard deviation, unless otherwise stated. I defined early
nesting attempts as those that were initiated between March 5th and April 30th. I defined
late nesting attempts as those that were initiated between May 1st and June 30th,
regardless of whether it was an individual’s “first” or “second” nest. Second broods
(including true double-broods) were rarely observed and were not specified in my
analyses as it wasn’t possible to verify every “second” nest as a true second nesting
Texas Tech University, Shea Mullican, December 2018
9
attempt. Although some adult kestrels were marked, it was difficult in subsequent years
to recapture or resight previously captured adults.
I used JMP Pro (SAS Institute 2015) for Microsoft Windows to examine means of
clutch size, brood size, number of fledglings per successful nest, and initiation date.
Analysis of Variance (ANOVA) was initially used to test for significance in reported
means. I used Tukey-Kramer HSD to test where these differences occurred in the
reported means.
I modeled daily nest survival rates (DSR) in Program MARK with clutch size,
precipitation, maximum temperature, nest initiation date, year, and study site as possible
covariates. The average maximum temperature for the two months a nest existed, along
with sum of precipitation, were gathered online from the National Oceanic and
Atmospheric Administration (hereafter, NOAA). Kestrels are altricial, meaning that the
chicks require parental care before they can leave the nest. Nest success for altricial
species occurs when at least one offspring from the brood fledges. Therefore, I
considered the “nestling period” for analysis in Program MARK to include both the egg
and nestling stage: which is approximately 60 days for kestrels. I calculated the
probability of a nest surviving (initiation to completion) by raising the daily survival rate
(hereafter, DSR) to the nestling period.
RESULTS
Kestrel nest box occupancy rates were assessed from 2013 to 2018, during which
there were between 29 and 32 nest boxes available to kestrels depending on year (Table
1.1). Occupancy steadily increased over the first five breeding seasons, with a maximum
Texas Tech University, Shea Mullican, December 2018
10
of 73% of 30 nest boxes occupied in 2017. Nest box occupancy in 2018 decreased to
48% (Table 1.1).
The number of nesting attempts increased over the first five years as well, with 2
attempts in 2013, 9 in 2014, 18 in 2015, 19 in 2016, 25 in 2017, and 14 in 2018 (Table
1.2). Eighty-seven of 98 nesting attempts recorded from 2013 to 2018 have known-fates
(Table 1.2). Reproductive estimates varied among years (Table 1.2). Additionally, clutch
size, brood size, and number of fledglings per brood were typically greater for early
nesting attempts than late nesting attempts in 2014 to 2017 (Table 1.2); there was only
one late nest attempt in 2018 and it failed during incubation. Hatching success varied
among years, but was lowest in 2015 at 65% and greatest in 2016 at 89%. Hatching
success from 2013 through 2018 averaged 75.7% with 342 of 452 eggs hatching. Clutch
size averaged 4.8 eggs ± 0.8 (mode = 5) and brood size averaged 4.1 ± 1.2 chicks (mode
= 5). There were no differences in mean clutch size (F5,78 = 0.47, P = 0.792) or brood size
(F5,78 = 1.18, P = 0.325) of all known-fate nests among years.
When examining reproduction on the basis of early and late nest attempts, I found
the average clutch sizes were larger (F1, 80 = 8.69, P = 0.004) among the 64 early nesting
attempts (4.95 ± 0.09 SE) than the 18 late nesting attempts (4.39 ± 0.17 SE). Average
brood sizes were not larger (F1, 80 = 2.30, P = 0.133) among the 64 early nesting attempts
(4.14 ± 0.15 SE) than the 18 late nesting attempts (3.67 ± 0.28 SE). However, average
number of fledglings per successful nest was greater (F1, 71 = 4.95, P = 0.029) among the
58 early nesting attempts (3.48 ± 0.17 SE) than the 15 late nesting attempts (2.67 ± 0.33
SE) for which data were available.

Texas Tech University, Shea Mullican, December 2018
11
Of the 342 nestlings, 244 reached 80% of the fledging age (24 days of age or
older) with successful nests averaging 3.3 ± 1.3 fledglings (mode = 3; Table 1.2). There
were differences in mean fledglings per successful nest among years (F5,69 = 4.7798, P =
0.0008). Post hoc Tukey-Kramer HSD tests indicated that the mean number of fledglings
per successful nest was less in 2013 (1.0 ± 0.84 SE) than in 2017 (4.0 ± 0.26 SE, P =
0.0138) and 2018 (3.82 ± 0.36 SE, P = 0.0344). The mean number of fledglings per
successful nest was greater in 2017 (4.0 ± 0.26 SE) than in 2015 (2.6 ± 0.31 SE, P =
0.0111). Observed nest success slightly varied among nesting attempts and between year
(Table 1.2); 75 of 87 (86.2%) total nest attempts were successful (Table 1.2).
I was unable to backdate 11 of the 95 nests due to nest failure occurring in the egg
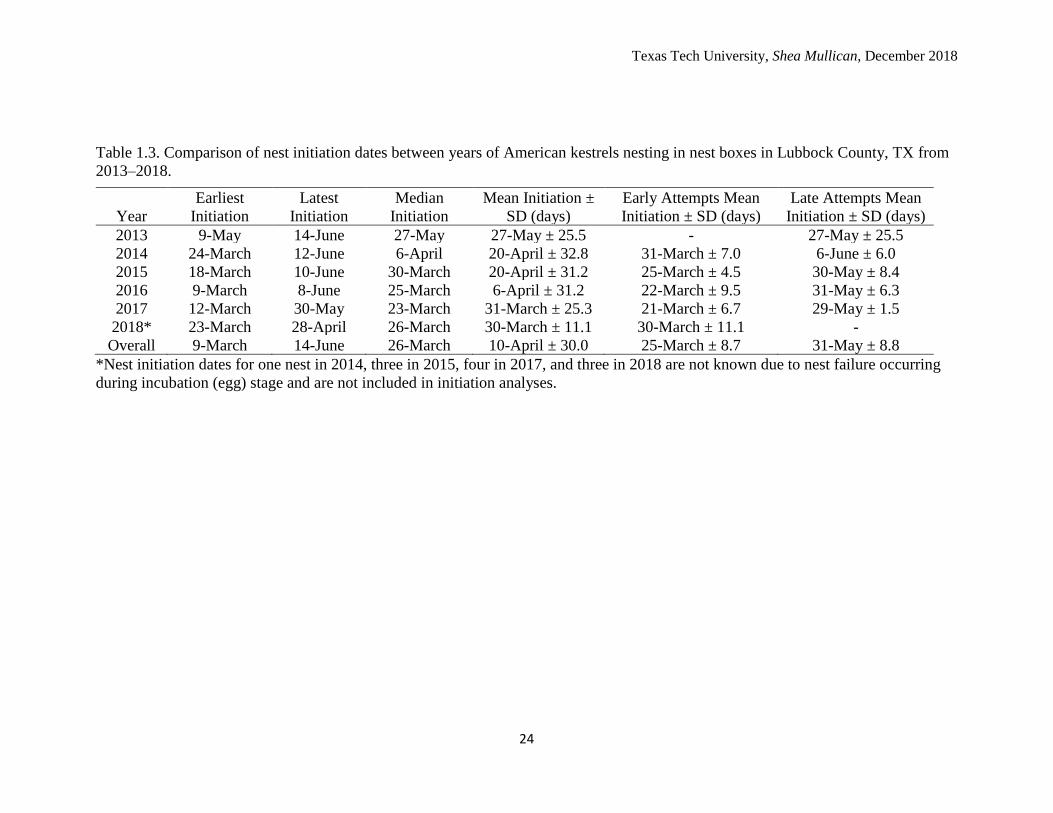
stage. Across the six breeding seasons, the median nest initiation date was March 26th
while the nest initiation date averaged April 10th (Table 1.3). There were two main peaks
each breeding year that corresponded with early and late season nests: March 16−March
31st and May 16−May 31st, respectively. Only two nests were initiated between April
16−May 15th. With the exception of 2018 breeding season, mean nest initiation dates
occurred earlier each year by a few days up to two weeks earlier (Table 1.3). There were
differences in initiation dates of all nests among years (F5,78 = 2.63, P = 0.029), but post
hoc tests failed to indicate where those differences occurred.
When assessing nest initiation on the basis of early and late attempts, there were
differences in the means of initiation dates for early nests among years (F4,59 = 3.27, P =
0.017), but post hoc tests failed to determine where those differences occurred. There
were no differences in the means of late nests between years (F4,15 = 0.46, P = 0.761).
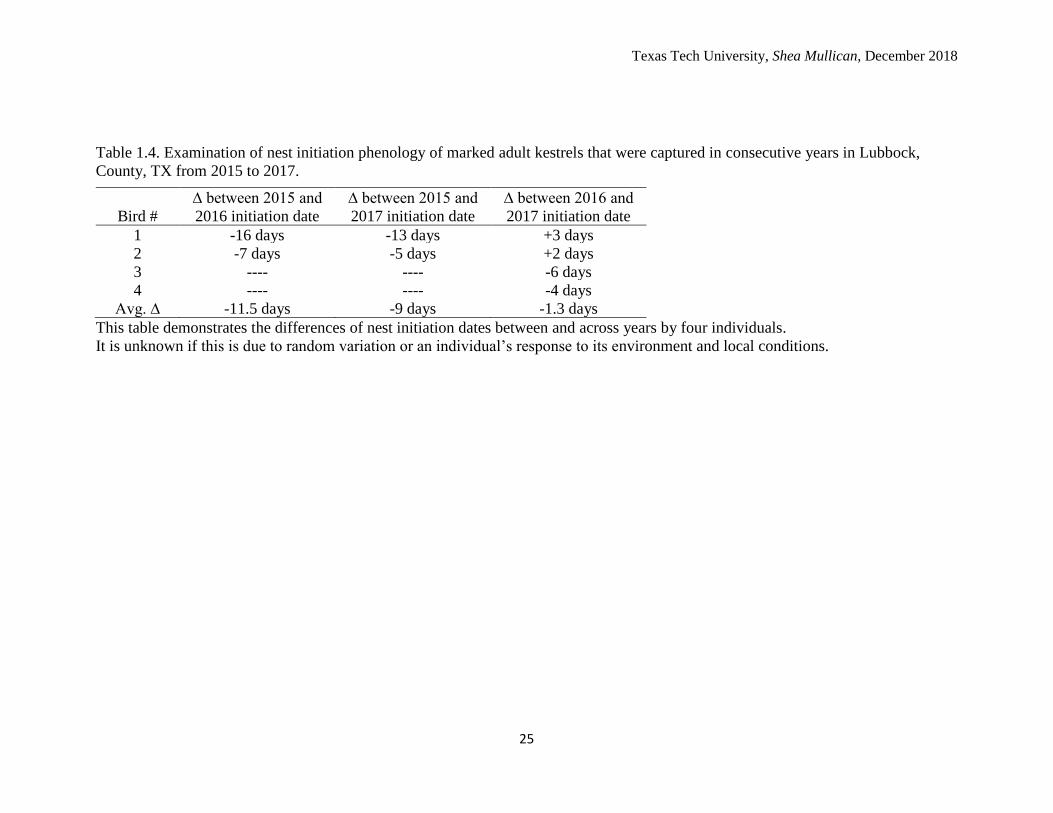
Although my data are qualitative, it also appears age and/or experience may influence

Texas Tech University, Shea Mullican, December 2018
12
initiation of nesting. Of the 4 adult kestrels I was able to identify or capture in
consecutive years, all birds initiated nests earlier than the original year the individual was
captured (Table 1.4).
I modelled daily survival for 87 known-fate nest attempts. There were 11 nests
that failed during the egg stage and, therefore, initiation dates were unattainable. Instead,
a value was substituted for initiation dates for the eleven nests. The value entered was the
mean initiation date of the early or late nests for the year that the failure occurred. This
method was altered for a late attempt that occurred between June 11-July 15 in 2018. The
only late nest of 2018 was initiated months after the other nests, as a result, the mean of
initiation dates was not an acceptable substitute. For the single late attempt of 2018, June
28th was chosen because it is the equal difference between the date the nest was found
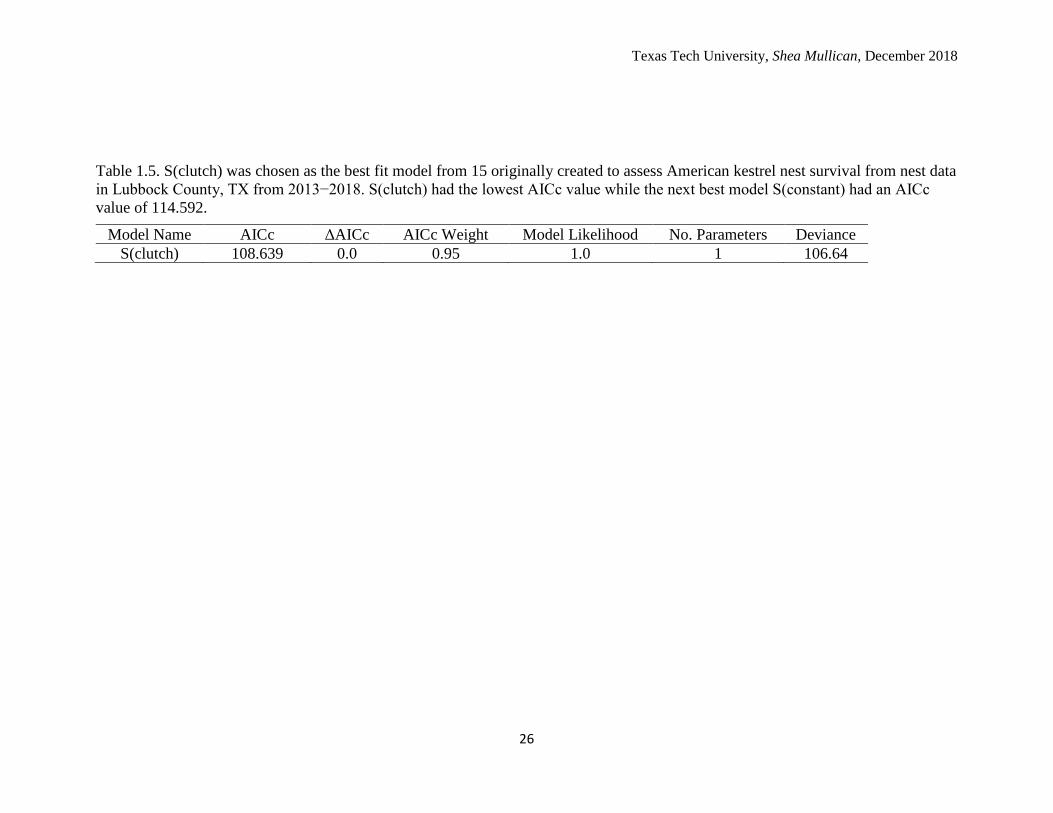
(July 15) and the previous nest box check (June 11). I created 15 original models for
analysis, but only 1 model fit the data well (Table 1.5). The covariates that did not fit the
data included: initiation date, year, and study site. I was unable to test precipitation and
temperature in any model, due to convergence issues and questionable beta values. I was
unable to pinpoint an acceptable range of when the nests failed. For example, many nests
that failed during the egg stage were not recorded as failed until after 30 days of the
initial nest discovery. This created obvious, large dips in DSR that likely did not match
reality.
The best fit model was time constrained with clutch size as a covariate. The next
best fit model had a time constraint with no covariates. However, prior to adding the
2018 nest data, the best fit model included clutch size and precipitation as covariates
indicating that high precipitation amounts resulted in lower survival. I was unable to test

Texas Tech University, Shea Mullican, December 2018
13
this further upon adding the 2018 nest data due to convergence issues. DSR for the
average clutch size (4.8) was estimated at 0.99767. For a 60-day nesting period, this
translated to a nest survival estimate of 86.9% (0.9976760). The modelled DSR estimates
of the best fit model, S(.)+clutch, demonstrated that larger clutch sizes resulted in greater
nest survival (Figure 1.3). Thus, modelled nest survival (DSR raised to the nesting period
of 60 days) was greater in nests with larger clutches (Figure 1.4).
Additionally, I examined DSR and nest survival in Program MARK by using
2014−2018 early attempts only. This allowed for a time model to be created without
convergence issues or nonsensical standard errors. The time model demonstrated a near-
constant DSR of 1.0. The only changes in DSR in the time model were from day 47−52
and day 57 in the study; DSR on these days were estimated, depending on the day,
between 0.9910171−0.9743362. These days coordinated with nest failures that were
observed in the field for early nest attempt in 2014−2018. When using early attempts
only, the competing models became S(T+clutch+precipitation+temp) and
S(T+clutch+precipitation) and S(T+clutch). After model averaging the competing
models, DSR was lowest on day 47 (0.98533 ± 0.01483 SE), day 48 (0.99258 ± 0.00068
SE), day 52 (0.93576 ± 0.03750 SE), and day 57 (0.98060 ± 0.01989 SE). All other days,
DSR was estimated at 1.0. Nest survival was modelled at approximately 89.7% but
confidence intervals estimated it between 54.8%−100%. There is model uncertainty
associated with the competing models due to each model carrying 25-50% of the AICc
weight and model likelihood estimated at 44% for the least competing model,
S(T+clutch). In addition to model uncertainty, there is also variation associated with
model averaging to produce daily DSR estimates. Each model contributes variation to the
Texas Tech University, Shea Mullican, December 2018
14
total variation associated with each DSR estimate. Model variation ranged from 0-88%
which means the three models, after averaging, accounted for 0-88% of the variation
associated with DSR and nest survival.
DISCUSSION
There is a general lack of information about American kestrel populations
breeding, migrating, and wintering in the Southern High Plains of Texas. Early survey
work was primarily based on road surveys conducted across the Southern Great Plains
(Allan and Sime 1943). More recently, the model-estimated average abundance of
American kestrels counted per BBS route per year, indicated an uncertain trend for the
kestrel population within the shortgrass prairie (AKP 2018). Elsewhere, kestrel
populations across the nation appear to be declining (Smallwood et al. 2009; AKP 2018).
It is challenging to evaluate why a population is stable, increasing, or decreasing without
first examining the complex processes that drive demographics. The factors involved in
population dynamics are births, deaths, immigration, and emigration. Although I was
unable to study immigration and emigration of kestrels within my study area, I was able
to examine reproductive efforts.
Nest box occupancy and number of nesting attempts increased every year from
2013−2017, but decreased in 2018. An abrupt increase in occupancy rates initially
follows the introduction of nest boxes to an area (Hamerstrom et al. 1973; Smallwood
and Collopy 2009). This is indicative of otherwise suitable habitat being limited by a
critical resource. In this case, nest sites were limiting and once that resource limitation is
alleviated (e.g., nest boxes), the kestrel population responds positively. The reduced
number of nesting attempts made in 2018 is likely a reflection of local environmental
Texas Tech University, Shea Mullican, December 2018
15
conditions. During the three months prior to the 2018 breeding season, Lubbock, TX
received only 0.5 mm of precipitation while in previous years winter precipitation ranged
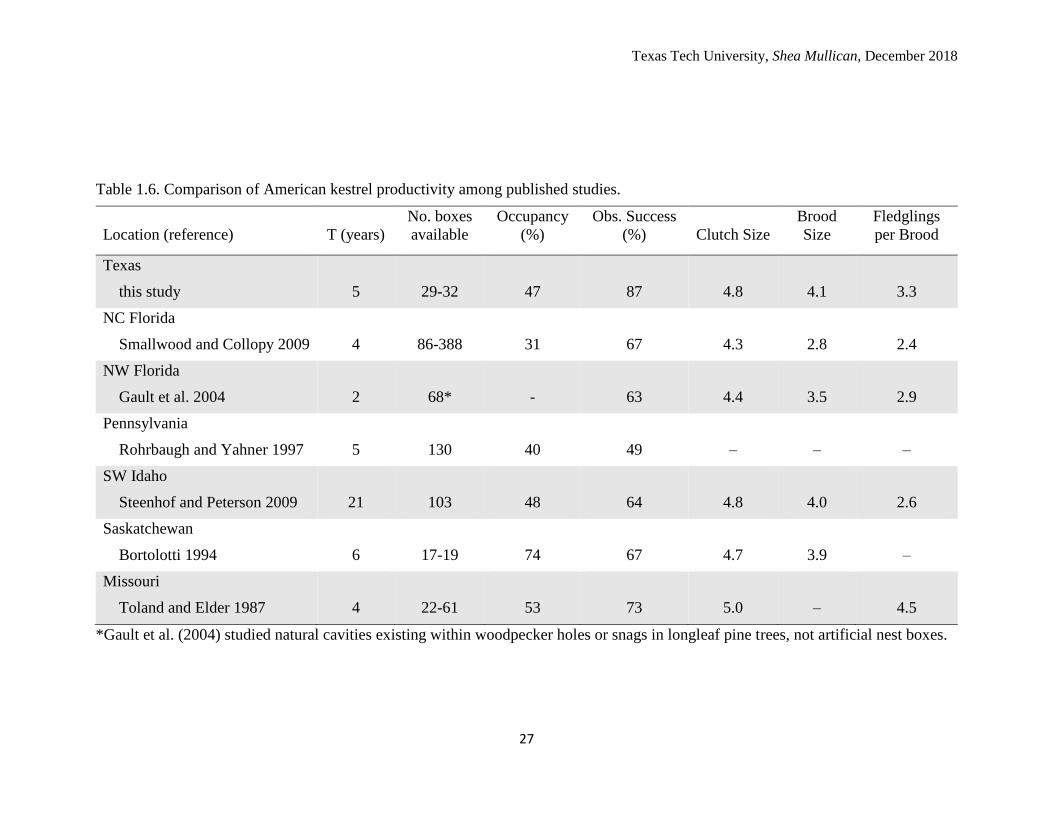
from 19–86.6 mm (NOAA 2018). The average occupancy rate over the six breeding
seasons (47%) is similar to other nest box studies conducted in North America (Table
1.6). As expected, early nesting attempts had greater clutch sizes, brood sizes, and
number of fledglings compared to late nesting attempts; this was consistent with the
pattern of seasonal decline in clutch sizes that has been observed elsewhere (Sockman
and Schwabl 2001). Mean clutch size, brood size, and number of fledglings per
successful nest were greater than means reported for resident kestrel populations in
Florida (Smallwood and Collopy 2009; Gault et al. 2004; Table 1.6). Several kestrels
breeding in nest boxes within my study area are residents as they are re-sighted multiple
times on their territory throughout the winter (S. Mullican pers. obs.). Thus, I
hypothesized that productivity parameters would be more similar to other resident kestrel
populations. This was not the case as productivity parameters of mean clutch size, brood
size, and number of fledglings per successful nest were more similar to those of kestrels
breeding in higher latitudes such as Missouri, Idaho, and Saskatchewan (Toland and
Elder 1987; Steenhof and Peterson 2009; Bortolotti 1994). However, my observed nest
success (87%) was highest in this study (Table 1.6). The best fit DSR model indicated
nest survival was 86.9% which is consistent with the observed nest success (86.2%). This
would suggest that the model fits the data well.
The high nest success in my study area is likely due to a combination of several
factors: climate, individual age and experience, and residency status. A relatively mild
winter climate on the Llano Estacado may benefit adult kestrels by allowing females to

Texas Tech University, Shea Mullican, December 2018
16
build greater fat reserves to efficiently produce eggs and initiate nesting earlier. Bortolotti
and Wiebe (1993) found that small-bodied females had higher hatching failures
indicating that body size relative to egg size may contribute to greater nest success. Age
and previous nesting experience of adult pairs likely influences productivity as well.
Young birds lack experience in reproduction (e.g., incubation of eggs), survival, and
foraging efficiently. In comparison, older birds may have the advantage of experience,
but may lack the capability of producing viable eggs/sperm. Birds resident to the area
likely have an advantage over migrant birds due to familiarity with potential predators or
risk areas, mates, territory, and local climate. Resident kestrels in Oregon nested almost a
month earlier than most of the migrant kestrels (Henny and Brady 1994).
Chicks that fledge earlier than others can take advantage of learning to be a young
kestrel without competition from other juveniles. The post-fledging dependence period is
a period in which recent fledglings are dependent upon their parents for food while
attempting to learn how to fly, land, navigate, hunt, avoid risks, etc. Fledglings within a
brood will compete with each other for food deliveries from adults and will likely
compete against fledglings from outside their brood as well, given that prey availability
and abundance is limited (S. Mullican pers. obs.).
Nest initiations in my study ranged from March 9th to June 14th and averaged
April 10th. These dates are similar to a kestrel population in southwestern Idaho which
initiated nests between March 14th through July 7th and averaged April 28th (Steenhof and
Peterson 2009). Steenhof and Peterson (2009) hypothesized that progressively warmer
winters allowed kestrels to forego migration which possibly led them to nest earlier.
Kestrels in northwest Florida initiated nests from March 22nd through June 23rd (Gault et
Texas Tech University, Shea Mullican, December 2018
17
al. 2004). In central Missouri, average nest initiation (in 1982) was April 1st (Toland and
Elder 1987). Nest initiations in my study area appear to be very similar to kestrels
breeding elsewhere in North America. And like Steenhof and Peterson (2009), we did not
find winter temperatures or spring precipitation to significantly influence nest initiation
dates. However, individual kestrels may respond differently to their environment and
experiences. I found that two kestrels caught in 2016 initiated nests 7-16 days earlier than
the initial year (2015) they were first caught. However, the two individuals did not
continue to nest earlier in 2017, but nested 2-3 days later than initiation in 2016. This
could be due to random variation or individual response to mate availability, prey
abundance or availability, or local weather patterns. A much larger sample size and
higher capture rate would be needed to examine this theory further.
Early nest attempts averaged 25 March, 15 days earlier than the overall average.
This difference could be a result of having partial migrants within the local breeding
population. It is possible that birds returning from more southern latitudes, such as South
TX or Mexico, stopped migration in my study area for favorable habitat and joined the
“local” breeding population. This would support the theory that resident birds in my
study area may initiate breeding earlier in comparison to migrants.
Nest survival, based on the average clutch size of 4.8, was 86.9% for the best fit
model created in Program MARK. The modelled nest survival matches the observed nest
success (86.2%). Surprisingly, the best fit model only included clutch size as a covariate
while weather covariates did not fit the data. Food availability often influences the
reproduction of avian species (Stearns 1992). Prey availability for American kestrels may
be directly affected by weather conditions such as extreme drought, flooding, or
Texas Tech University, Shea Mullican, December 2018
18
temperatures. I was unable to account for such events in my models, but many prey
species of kestrels will become inactive and seek shelter during unfavorable conditions,
thereby becoming unavailable to the kestrels. Likewise, a raptor that becomes drenched
will have a hard time thermoregulating and difficulty hunting. Dawson and Bortolotti
(2000) also found that nest success was affected by inclement weather (either cold, rainy
days or hot, dry days).
Improvements to this line of research can be made as more data become available.
First, temperature and precipitation at each study site should be taken for better precision
of local conditions. It is common for one side of Lubbock Co. to get heavy rain while the
other side receives none. Additionally, an ibutton could be placed inside of the nest box
to provide insight to the conditions that eggs are exposed to while inside of the nest box.
Second, I believe it is important to determine whether eggs are fertile, infertile, or
experienced embryonic death. Wiebe (1996) reported infertile egg and embryo death as
the two main causes of partial hatching failure in American kestrel clutches. Determining
egg fertility and local environmental conditions may better explain nest failures and
abandonments. It will also help to create better models in Program MARK that could
potentially allow productivity predictions for climate change scenarios.
Texas Tech University, Shea Mullican, December 2018
19
LITERATURE CITED
Allan, P. F., and P. R. Sime. 1943. A hawk census on Texas panhandle highways. The
Wilson Bulletin 55:29-39.
American Kestrel Partnership [AKP]. 2015. Declines of American kestrel populations.
http://kestrel.peregrinefund.org/kestrel-decline. Accessed 12 Sept 2015.
American Kestrel Partnership [AKP]. 2016. By the numbers.
http://kestrel.peregrinefund.org/index.php?action=map. Accessed 21 Aug 2016.
American Kestrel Partnership [AKP]. 2018. Declines of American kestrel populations.
http://kestrel.peregrinefund.org/index.php?action=map. Accessed 9 Sept 2018.
Bird, D. M. and R. S. Palmer. 1988. American kestrel. Pages 253−290 in R. S. Palmer,
editor. Handbook of North American birds II, vol. 5. Yale University Press, New
Haven, Connecticut, USA.
Bortolotti, G. R. 1994. Effect of nest-box size on nest-site preference and reproduction in
American Kestrels. Journal of Raptor Research 28:127−133.
Bortolotti, G. R., and K. L. Wiebe. 1993. Incubation behaviour and hatching patterns in
the American kestrel Falco sparverius. Ornis Scandinavica 24:41−47.
Dawson, R. D., and G. R. Bortolotti. 2000. Reproductive success of American kestrels:
the role of prey abundance and weather. Condor 102:814−822.
Diamond, D. D. 2010. Grasslands. Handbook of Texas Online. Texas State Historical
Association. https://www.tshaonline.org/handbook/online/articles/ryl02.
Accessed 16 Aug 2016.
Farmer, C. J., and J. P. Smith. 2009. Migration monitoring indicates widespread declines
of American kestrels (Falco sparverius) in North America. Journal of Raptor
Research 43:263–273.
Gault, K. E., J. R. Walters, J. Tomcho Jr., L. F. Phillips Jr., and A. Butler. 2004. Nest
success of southeastern American Kestrels associated with Red-cockaded
Woodpeckers in old-growth longleaf pine habitat in northwest Florida.
Southeastern Naturalist 3:191-204.
Graves, L. L. 2010. Lubbock County. Handbook of Texas Online. Texas State Historical
Association. https://www.tshaonline.org/handbook/online/articles/ryl02.
Accessed 11 Aug 2016.
Hamerstrom, F., F. N. Hamerstrom, and J. Hart. 1973. Nest boxes: an effective
management tool for kestrels. Journal of Wildlife Management 37:400−403.

Texas Tech University, Shea Mullican, December 2018
20
Henny, C. J., & G. L. Brady. 1994. Partial migration and wintering localities of American
Kestrels nesting in the Pacific Northwest. Northwestern Naturalist 75:37−43.
Klucsarits, J. R., and J. J. Rusbuldt. 2007. A photographic timeline of Hawk Mountain
Sanctuary’s American kestrel nestlings. Zip publishing. Columbus, Ohio, U.S.A.
Leatherwood, A. 2010. Llano Estacado. Handbook of Texas Online. Texas State
Historical Association.
https://www.tshaonline.org/handbook/online/articles/ryl02. Accessed 11 Aug
2016.
Linner, K. M. 2014. Assessing the influence of wind turbines and land-use on mortality
risk of avian species on the Llano Estacado with emphasis on birds of prey.
Thesis, Texas Tech University, Lubbock, USA.
Mitra, A., C. Chatterjee, and F. B. Mandal. 2011. Synthetic chemical pesticides and their
effects on birds. Research Journal of Environmental Toxicology 5:81–96.
National Oceanic and Atmospheric Administration [NOAA]. 2018. National Centers for
Environmental information, Climate at a Glance: City Time Series.
https://www.ncdc.noaa.gov/cag/. Accessed 17 Sept 2018
North American Bird Conservation Initiative. “Bird Conservation Regions Map.” 2016.
http://nabci-us.org/resources/bird-conservation-regions-map/#bcr18. Accessed 13
May 2017.
SAS. 2015. JMP®, Version 12. SAS Institute Inc., Cary, NC, 1989-2007.
Smallwood, J. A., and D. M. Bird. 2002. American kestrel (Falco sparverius). Account
602 in A. Poole, editor. The birds of North America. Cornell Lab of Ornithology,
Ithaca, New York, USA.
Smallwood, J. A. and M. W. Collopy. 2009. Southeastern American Kestrels respond to
an increase in the availability of nest cavities in north-central Florida. Journal of
Raptor Research 43:291-300.
Smallwood, J. A., M. F. Causey, D. H. Mossop, J. R. Klucsarits, B. Robertson, S.
Robertson, J. Mason, M. J. Maurer, R. J. Melvin, R. D. and Dawson. 2009. Why
are American kestrel (Falco sparverius) populations declining in North America?
Evidence from nest-box programs. Journal of Raptor Research 43:274–282.
Smith, D. G., C. R. Wilson, and H. H. Frost. 1972. The Biology of the American Kestrel
in Central Utah. Southwestern Naturalist 17:73–83.
Texas Tech University, Shea Mullican, December 2018
21
Sockman, K. W., and H. Schwabl. 2001. Covariation of clutch size, laying date, and
incubation tendency in the American Kestrel. Condor 103:570−578.
Soil Survey Staff, Natural Resources Conservation Service, United States Department of
Agriculture. 2015. Web Soil Survey. http://websoilsurvey.nrcs.usda.gov/.
Accessed 11 Aug 2016.
Stearns, S. C. 1992. The evolution of life histories. Oxford University Press, Oxford,
England.
Steenhof, K. and I. Newton. 2007. Assessing nesting success and productivity. Pages
181–191 in D. M. Bird and K. L. Bildstein, editors. Raptor research and
management techniques. Hancock House Publishers, Surrey, Canada.
Steenhof, K., and B. E. Peterson. 2009. American kestrel reproduction in southwestern
Idaho: annual variation and long-term trends. Journal of Raptor Research 43:283–
290.
Strasser, E. H., and J. A. Heath. 2013. Reproductive failure of a human-tolerant species,
the American kestrel, is associated with stress and human disturbance. Journal of
Applied Ecology 50:912–919.
Stubbendieck, J., S. L. Hatch, and N. M. Bryan. 2011. North American wildland plants: a
field guide. University of Nebraska Press.
Texas Parks and Wildlife Department [TPWD], Wildlife Division, Diversity and Habitat
Assessment Programs. 2016. TPWD county lists of protected species and species
of greatest conservation need. Lubbock County. Revised January 5, 2016.
Accessed 16 Aug 2016. http://tpwd.texas.gov/gis/rtest/.
Toland, B. R., and W. H. Elder. 1987. Influence of nest-box placement and density on
abundance and productivity of American kestrels in central Missouri. Wilson
Bulletin 99:712–717.
USDA. 2012. Census of Agriculture – County Data. National Agriculture Statistics
Service 252–284. Accessed 21 Aug 2016.
http://www.agcensus.usda.gov/Publications/2012/Full_Report/Volume_1,_Chapte
r_2_County_Level/Texas/st48_2_001_001.pdf.
Wiebe, K. L. 1996. The insurance-egg hypothesis and extra reproductive value of the
last-laid eggs in Clutches of American kestrels. The Auk 113:258−261.

Texas Tech University, Shea Mullican, December 2018
22
Table 1.1. Occupancy of nest boxes and number of nest attempts by American kestrels in Lubbock Co., TX from 2013–2018.
*3 of the 97 nests were included in occupancy rates but were censored from further analyze due to
human error and honeybee interference.
Year No. available
boxes
No. occupied
boxes Occupancy rate No. nest attempts*
2013 32 4 13% 4
2014 30 9 30% 11
2015 30 19 63% 22
2016 30 17 57% 22
2017 30 22 73% 25
2018 29 14 48% 14

Texas Tech University, Shea Mullican, December 2018
23
Table 1.2. Comparison of nest attempts, clutch size, brood size, fledglings/brood, nest success, and sex ratio among early and late
nesting attempts by American kestrels nesting in nest boxes in Lubbock County, TX from 2013–2018.
Year Attempt Total nest
attempts
Clutch size
Mean ± SD (n)
Brood size
Mean ± SD (n)
Fledglings/ brood
Mean ± SD (n)
Nest
success
Sex ratio at
banding M:F
2013 late 2 4.5 ± 0.7 (2) 4.5 ± 0.7 (2) 1.0 ± 0.0 (2) 100% 3:5
2014 early 8 5.0 ± 0.5 (8) 3.7 ± 1.0 (7) 3.3 ± 0.5 (6) 86% 18:8
late 3 3.7 ± 0.6 (3) 3.3 ± 0.6 (3) 2.0 ± 1.5 (2) 100% 5:5
both 11 4.6 ± 0.8 (11) 3.6 ± 0.8 (10) 2.8 ± 1.0 (8) 89% 23:13
2015 early 14 5.1 ± 0.6 (14) 3.5 ± 1.5 (11) 2.7 ± 1.2 (10) 77% 28:11
late 7 4.9 ± 0.7 (7) 4.1 ± 0.9 (7) 2.4 ± 1.1 (5) 100% 15:12
both 21 5.0 ± 0.7 (21) 3.8 ± 1.3 (18) 2.6 ± 1.0 (15) 83% 43:23
2016 early 17 4.9 ± 1.0 (17) 4.6 ± 1.3 (17) 3.2 ± 1.5 (13) 93% 29:39
late 5 4.4 ± 0.9 (5) 3.0 ± 1.6 (5) 2.4 ± 1.1 (5) 100% 9:6
both 22 4.8 ± 1.0 (22) 4.2 ± 1.5 (22) 3.0 ± 1.5 (18) 95% 38:45
2017 early 19 4.8 ± 0.7 (19) 4.3 ± 1.0 (18) 4.0 ± 1.2 (18) 95% 33:40
late 6 3.7 ± 1.4 (6) 4.0 ± 0.0 (3) 4.0 ± 0.0 (3) 50% 7:5
both 25 4.6 ± 0.9 (25) 4.3 ± 0.9 (21) 4.0 ± 1.1 (21) 84% 40:45
2018 early 13 4.9 ± 0.3 (13) 4.2 ± 0.9 (11) 3.8 ± 1.3 (11) 85% 27:19
late 1 5 ± 0.0 (1) − − 0% −
both 14 4.9 ± 0.3 (14) 4.2 ± 0.9 (11) 3.8 ± 1.3 (11) 79% 27:19
Overall early 71 4.9 ± 0.7 (71) 4.2 ± 1.2 (64) 3.5 ± 1.3 (58) 88% 135:117
late 24 4.2 ± 1.1 (24) 3.8 ± 1.1 (20) 2.5 ± 1.2 (17) 81% 39:33
both 95 4.8 ± 0.8 (95) 4.1 ± 1.2 (84) 3.3 ± 1.3 (75) 86% 174:150
Texas Tech University, Shea Mullican, December 2018
24
Table 1.3. Comparison of nest initiation dates between years of American kestrels nesting in nest boxes in Lubbock County, TX from
2013–2018.
Year
Earliest
Initiation
Latest
Initiation
Median
Initiation
Mean Initiation ±
SD (days)
Early Attempts Mean
Initiation ± SD (days)
Late Attempts Mean
Initiation ± SD (days)
2013 9-May 14-June 27-May 27-May ± 25.5 - 27-May ± 25.5
2014 24-March 12-June 6-April 20-April ± 32.8 31-March ± 7.0 6-June ± 6.0
2015 18-March 10-June 30-March 20-April ± 31.2 25-March ± 4.5 30-May ± 8.4
2016 9-March 8-June 25-March 6-April ± 31.2 22-March ± 9.5 31-May ± 6.3
2017 12-March 30-May 23-March 31-March ± 25.3 21-March ± 6.7 29-May ± 1.5
2018* 23-March 28-April 26-March 30-March ± 11.1 30-March ± 11.1 -
Overall 9-March 14-June 26-March 10-April ± 30.0 25-March ± 8.7 31-May ± 8.8
*Nest initiation dates for one nest in 2014, three in 2015, four in 2017, and three in 2018 are not known due to nest failure occurring
during incubation (egg) stage and are not included in initiation analyses.
Texas Tech University, Shea Mullican, December 2018
25
Table 1.4. Examination of nest initiation phenology of marked adult kestrels that were captured in consecutive years in Lubbock,
County, TX from 2015 to 2017.
Bird #
∆ between 2015 and
2016 initiation date
∆ between 2015 and
2017 initiation date
∆ between 2016 and
2017 initiation date
1 -16 days -13 days +3 days
2 -7 days -5 days +2 days
3 ---- ---- -6 days
4 ---- ---- -4 days
Avg. ∆ -11.5 days -9 days -1.3 days
This table demonstrates the differences of nest initiation dates between and across years by four individuals.
It is unknown if this is due to random variation or an individual’s response to its environment and local conditions.
Texas Tech University, Shea Mullican, December 2018
26
Table 1.5. S(clutch) was chosen as the best fit model from 15 originally created to assess American kestrel nest survival from nest data
in Lubbock County, TX from 2013−2018. S(clutch) had the lowest AICc value while the next best model S(constant) had an AICc
value of 114.592.
Model Name AICc ΔAICc AICc Weight Model Likelihood No. Parameters Deviance
S(clutch) 108.639 0.0 0.95 1.0 1 106.64
Texas Tech University, Shea Mullican, December 2018
27
Table 1.6. Comparison of American kestrel productivity among published studies.
Location (reference)
T (years)
No. boxes
available
Occupancy
(%)
Obs. Success
(%)
Clutch Size
Brood
Size
Fledglings
per Brood
Texas
this study
5
29-32
47
87
4.8
4.1
3.3
NC Florida
Smallwood and Collopy 2009
4
86-388
31
67
4.3
2.8
2.4
NW Florida
Gault et al. 2004
2
68*
-
63
4.4
3.5
2.9
Pennsylvania
Rohrbaugh and Yahner 1997
5
130
40
49
–
–
–
SW Idaho
Steenhof and Peterson 2009
21
103
48
64
4.8
4.0
2.6
Saskatchewan
Bortolotti 1994
6
17-19
74
67
4.7
3.9
–
Missouri
Toland and Elder 1987
4
22-61
53
73
5.0
–
4.5
*Gault et al. (2004) studied natural cavities existing within woodpecker holes or snags in longleaf pine trees, not artificial nest boxes.

Texas Tech University, Shea Mullican, December 2018
28
Figure 1.1. Location of the study area in relation to the Llano Estacado.
Texas Tech University, Shea Mullican, December 2018
29
Figure 1.2. Location of three study sites in Lubbock County, TX used to assess American
kestrel breeding ecology. The green dots represent individual nest box locations. Site "A"
is the Lubbock Lake Landmark site, "B" is the Reese Technology Center site, and “C” is
the Texas Tech University Native Rangeland site. The average distance of the nearest
nest box at site “A” is 241.2 m, 608.3 m at site “B”, and 84 m at site “C”.
A B
C

Texas Tech University, Shea Mullican, December 2018
30
Figure 1.3. Daily Survival Rates (DSR) modelled in Program MARK from American
kestrel nest data in Lubbock County, TX from 2013−2018. The model, S(clutch),
demonstrated that larger clutch sizes have higher daily survival rates. The error bars
represent the standard error associated with each estimate.

Texas Tech University, Shea Mullican, December 2018
31
Figure 1.4. Nest survival modelled in Program MARK from American kestrel nest data in
Lubbock County, TX from 2013−2018. The model, S(clutch), demonstrated that larger
clutch sizes are more likely to survive the nesting period. The error bars represent the
95% confidence intervals associated with each nest survival estimate.
Texas Tech University, Shea Mullican, December 2018
32
CHAPTER II
ADULT SURVIVAL AND FIDELITY ESTIMATES OF AMERICAN KESTRELS
NESTING IN ARTIFICIAL NEST BOXES IN LUBBOCK COUNTY TEXAS
INTRODUCTION
American kestrels (Falco sparverius) are a numerous and widespread falcon
species found across North America (Smallwood and Bird 2002). Populations of
American kestrels (hereafter, kestrels) have been declining over the last few decades. It is
estimated that kestrel populations in North America are declining by 47% based on
collective data from nest box monitoring programs, USGS Breeding Bird Surveys,
Christmas Bird Counts, and raptor migration counts from 1966 to 2010 (American
Kestrel Partnership, hereafter AKP, 2018; Farmer and Smith 2009; Smallwood et al.
2009). Research has yet to identify a definite cause for the declines, but it is most likely a
combination of biological and ecological factors such as landscape changes leading to
increased human-caused stress in disturbed areas (Strasser and Heath 2013), climate
change (Steenhof and Peterson 2009a), chemical exposure (Mitra et al. 2011), loss of
suitable nesting habitat, competition for nesting cavities, and disease (Smallwood and
Bird 2002). Based on abundance estimates from Christmas Bird Counts, kestrels
occupying the shortgrass prairie on the High Plains were once suspected of experiencing
population growth, but now population trends are uncertain (Bird Conservation region
18; AKP 2015; AKP 2018; North American Bird Conservation Initiative 2016). Despite
the nationwide downward trend and considerable need for information, few studies have
been conducted on the kestrel population in the Southern High Plains. A better
understanding of survival could inform us to localized population patterns.
Texas Tech University, Shea Mullican, December 2018
33
Surprisingly, there are very few survival estimates that have been published for
American kestrels. Adult survival rates of kestrels in Florida were recently estimated to
be 75% for males and 74% for females, as derived from mark-recapture events
(Hinnebusch et al. 2010). Other studies have used band recoveries from dead birds or
nest-site occupancies to estimate mortality and survival rates for kestrels (Roest 1957;
Henny 1972). Roest (1957) reported an average annual survival rate of 43% based on
band recoveries over six years from 150 adult and juvenile birds. Henny (1972) used
nest-site occupancy to evaluate annual mortality rates and reported an annual adult
survival rate of 55%. Annual adult female survival, modelled from mark-recapture data
(n=113) in southeast Florida, was estimated at 39% (95% C.I. 29.0-51.0; Brown and
Collopy 2013). Low survival during the juvenile life stage may be causing kestrel
populations to decline in regions across North America (Stupik et al. 2015). By using
radiotelemetry, Stupik et al. (2015) estimated a daily survival rate of 0.27 for kestrel
fledglings in Connecticut, through the Kaplan-Meier procedure, for the period of post-
fledging up to the onset of migration. Estimates from Henny (1972) found that hatch-year
survival rate of kestrels is 31%. Brown and Collopy (2013) used mark-recapture data to
estimate annual post-fledging survival of juvenile kestrels at 8.2% (95% C.I.: 2.6-20.0).
Roest (1957) reported a mean life expectancy of 1 year and 2 months for juveniles and an
expected mean lifespan for adults of 2 years and 3 months. However, American kestrels
in captivity can live up to 14-17 years, with a mean life expectancy of 5 years and 2
months (Roest 1957; Bird and Palmer 1988).
Survival may be influenced by mate fidelity and/or nest fidelity. Differing levels
of both mate and site fidelity, have been reported in American kestrels. Steenhof and

Texas Tech University, Shea Mullican, December 2018
34
Peterson (2009b) reported a female American kestrel used the same nest box for five
consecutive years and a male that used one for six consecutive years, clearly
demonstrating nest box fidelity among some individuals. However, low nest box fidelity
rates of 13−23% were reported in Idaho (Steenhof and Peterson 2009b). Of 143
individually marked males in Idaho, 28% stayed with their previous mate in successive
years. Of 113 individually marked females in Idaho, 37% stayed with their previous mate
in successive years (Steenhof and Peterson 2009b). Kestrels in other areas likely engage
in some level of fidelity to territories, nest boxes, and mates. High or low rates of fidelity
could play a substantive role in survival and population trends of kestrels in the Southern
High Plains.
I conducted research to better understand the ecology of kestrels in the Llano
Estacado region of the Southern High Plains of Texas. My objectives were to estimate
rates of American kestrel mate and site fidelity and to estimate annual adult survival of
kestrels that bred in nest boxes within my study area.
METHODS
Study Area
The Llano Estacado, also referred to as the Southern High Plains, is considered
the southern tip of the larger Great Plains (Figure 2.1). The Llano Estacado is in
Northeast New Mexico and the panhandle of Texas, which lies within the Bird
Conservation Region 18 (North American Bird Conservation Initiative 2016). The area is
characterized by high flat land that lies between the Caprock Canyon to the east in Texas
and Mescalero Ridge to the west in New Mexico (Leatherwood 2010). While the
southern portion lacks a distinct physical boundary, the Johnson Creek branch of the
Colorado River is considered the lower extent of the Llano Estacado (Leatherwood

Texas Tech University, Shea Mullican, December 2018
35
2010). The southern ridge of the Canadian River valley delineates the north border
(Leatherwood 2010).
My study area is Lubbock County, TX which lies within the Llano Estacado; it is
an area of relatively level land with 0-3% of gentle slopes at an elevation varying around
975 m (Soil Survey Staff 2015). Lubbock County has a semiarid climate with an average
annual precipitation of 467.6 mm, the majority of which occurs between May and
October (Graves 2010). The maximum summer temperature in July averages 33.3° C and
the minimum winter temperatures average -3.9° C in January (Graves 2010). Lubbock
County, TX is part of the southern shortgrass prairie in the High Plains, characterized as a
short and mixed grass prairie composed primarily of blue grama (Bouteloua gracilis) and
buffalograss (Bouteloua dactyloides), and dotted with numerous playas and few shrubs
(Diamond 2010; Graves 2010).
Compared to its historic prairie state, the High Plains of Texas is now a very
different ecosystem (Leatherwood 2010). Anthropogenic development, both urbanization
and agricultural development, of the landscape altered the vegetative community from
historic continuous prairie to the fragmented landscape of primarily irrigated cropland
and urban housing (Diamond 2010). Today, the majority of land in the county is
cropland, dispersed farmhouses, and small towns and cities. In 2012, cropland accounted
for approximately 73% of landcover in Lubbock County (1715 km2 of 2333 km2 total)
(USDA 2012). Lubbock County, TX is known for producing cotton, despite occasional
droughts (Graves 2010). Of the total cropland in 2012, 48.5% were cotton fields (832
km2 of 1,715 total cropland km2; USDA 2012). Additionally, fire suppression allowed
woody species, such as oak (Quercus spp.), cedar (Juniperus spp.), elm (Ulmus spp.), and

Texas Tech University, Shea Mullican, December 2018
36
mesquite (Prosopis spp.), to expand their distributions and invade parts of the High
Plains (Leatherwood 2010). The expansion of these woody species allowed secondary
cavity nesters, such as the American kestrel, to also expand their breeding range
(Smallwood and Bird 2002).
My study area consists of three sites, the Lubbock Lake Historic Landmark, the
Reese Technology Center, and the Texas Tech Native Rangeland (Figure 2.2). All of the
sites are classified as rangeland ecological sites of differing transitional stages (Soil
Survey Staff 2015). Transitional stages refer to the seral stages of succession which is
described as a gradient for the three sites. Within these three sites, nest boxes were placed
in remnant native prairie communities that are bordered by asphalt roads/highways,
runways, farmlands, golf courses, or urban neighborhoods. All three sites have different
amounts of prairie coneflower (Ratibida columnifera) and other annual forbs, cacti
(Opuntia spp.), honey mesquite (Prosopis glandulosa), elm, yucca (Yucca spp.), and
native grasses. The study sites support numerous wildlife species of interest and concern
such as the Texas horned lizard (Phrynosoma cornutum), black-tailed prairie dog
(Cynomys ludovicianus), burrowing owl (Athene cunicularia), prairie falcon (Falco
mexicanus), and ferruginous hawk (Buteo regalis) (Texas Parks and Wildlife Department
2016).
The Lubbock Lake Historic Landmark (Figure 2.2; hereafter, Lubbock Lake) is a
136 ha area in central Lubbock County. The site is primarily managed as an
archaeological and educational center. Of the three sites, Lubbock Lake most closely
resembles a pre-European native prairie ecosystem. Lubbock Lake has several hiking
trails scattered throughout the property with varying topography and is similar to the
Texas Tech University, Shea Mullican, December 2018
37
Reese Technology Center site with a primarily shortgrass/blue grama dominant
vegetation community with some woody species present. Lubbock Lake is open to the
public so this site experiences low to moderate levels of human activity on the trails
throughout the year.
The largest study site is the Reese Technology Center (Figure 2.2; hereafter
RTC), a decommissioned United States Air Force base on the west side of Lubbock
County, TX. The RTC has >700 ha with the majority of the vegetation classified as a
shortgrass/blue grama dominant vegetation community (Soil Survey Staff 2015). The
RTC falls in between Lubbock Lake and the Texas Tech Native Rangeland in terms of
seral stages of succession. Concrete runways, one industrial sized turbine and three scaled
wind turbines, playas, and black-tailed prairie dog colonies are present within the
landscape. The RTC experiences daily amounts of manufacturing and machinery activity
mostly due to Zachary and Forterra, an electrical manufacturing company and a water-
related infrastructure manufacturer, respectively. Most of this activity occurs on the
perimeter of RTC.
The Texas Tech Native Rangeland (Figure 2.2; hereafter, Rangeland) is 55 ha in
central Lubbock County. The site encompasses a playa and is comprised of dense honey
mesquite shrubs, broom snakeweed (Gutierrezia sarothrae), threeawn (Aristida spp.),
Russian thistle (Salsola kali), ragweed (Ambrosia spp.), and gramas (Bouteloua spp.)
(Soil Survey Staff 2015; S. Mullican pers. obs.). The Rangeland study site can be
described as a remnant native prairie that has been suppressed of fire and intensely
invaded by mesquite. The density of mesquite and abundance of threeawn, can be used as
an indicator of poor quality rangelands (Stubbendieck 2011). The Rangeland is the most

Texas Tech University, Shea Mullican, December 2018
38
degraded ecosystem of the three sites. Graduate and undergraduate students at Texas
Tech University conduct research at the Rangeland site, but it is not open to the public.
Field Methods
Survival rate analyses require individuals to be identifiable at different
encounters. For American kestrels, this necessitates capturing and marking them with
unique bands. To trap adult kestrels during the breeding season, I set a bal-chatri (double
walled) trap with a mouse (Mus musculus) lure near the target bird associated with a nest
box (Bloom et al. 2007). Immediately after the bird was caught, I removed it from the
nooses and processed it. Occasionally, adult kestrels were captured inside their respective
nest box during periods of incubation or brooding of offspring. In all cases, unbanded
kestrels received a USGS numeric aluminum leg band and three coil-style plastic color
leg bands (black, blue, light green, medium green, red, white, and/or yellow). All color
bands were sealed using a soldering iron to prevent band loss (Nisbet 1991). Each
breeding pair of kestrels received a unique color band combination based on year-specific
color bands. Since kestrels are sexually dimorphic, the same color combination could be
used on a male and a female. To the extent possible, each banded breeding pair received
the same color band combination. This allowed for the maximum number of color
combinations to be used each year. Additionally, measurements of wing chord, tail chord,
tarsus width and depth, hallux length, and weight were collected from each adult kestrel.
Procedures followed the AICUC protocol #16034-04 and TTU AICUC SOP 043.
Analysis
Annual adult survival, X, was estimated by reformulating an existing daily
survival equation (Conroy and Carroll 2009)
Texas Tech University, Shea Mullican, December 2018
39
𝑋 = (𝑌
𝑁)
1𝑍⁄
where X is the minimum annual adult survival rate, N is the total number of individuals
banded, Y is the minimum number of individuals that survived more than one year, and Z
is the average minimum age at last recapture.
I calculated a naïve estimation of mate fidelity for both male and female kestrels,
as the proportion of individuals nesting with the same mate divided by the total of banded
birds and birds who were banded but their mate was unknown. Site fidelity of males and
females were calculated based on methods described in Tschopp et al. (2018). I
bootstrapped my sample size 100 times to minimize error associated with small sample
sizes. I then averaged the larger sample and proceeded calculating site fidelity using the
index, IH4 (Tschopp et al. 2018).
𝐼𝐻4 = 2
1𝐼𝑇 +
1𝐼𝑡
Occurrence (IO) is the sum of recapture events per individual divided by the total number
of recapture occasions over the sampling period. Permanence (IT) is the proportion of
time between capture and last recapture (Fi), over the entire time spent sampling (F).
𝐼𝑇 =𝐹𝑖
𝐹
Periodicity (It) is the return of an individual and is stated as the ratio between IO and IT.
𝐼𝑡 =𝐼𝑂
𝐼𝑇
Texas Tech University, Shea Mullican, December 2018
40
RESULTS
Adult Survival
From 2013−2018, a Texas Tech University research team captured and banded 46
adult kestrels. Females were more likely to be recaptured than males in subsequent years
due to the greater inclination to be inside the nest box incubating eggs or brooding
nestlings. Twenty-five of the 46 adult kestrels were only caught in a single year (Table
2.1); however, 21 individuals were captured in multiple years. The average minimum age
at last recapture was 2.67 ± 0.97 (1 SD). Annual adult survival was estimated at a rate of
74.5%.
Mate Fidelity
The majority of the 46 adult individuals captured in this study were only detected
nesting in a single event (Table 2.2). However, 21 individuals were recaptured or
resighted in multiple years. Mate fidelity was higher among males (33.3%) than females
(21.4%; Table 2.2). Unfortunately, this calculation does not include pairs from nest boxes
that were never caught. As a result, the fidelity rates I report likely do not reflect the true
overall fidelity rates of the total breeding population.
Site Fidelity
I observed 21 individual kestrels using the same nest box (or territory) in
consecutive years (Table 2.3). One female in my study area used the same nest box for 5
consecutive years (Table 2.3). According to the IH4 index, site fidelity did not appear to
be significantly influenced by sex. Site fidelity for females was estimated at 39.68 ±
0.001 (1 SD) and site fidelity for males was estimated at 39.44 ± 0.002 (1SD). When
fidelity histories of both sexes are calculated together, the estimated site fidelity was
39.70 ± 0.001 (1 SD).

Texas Tech University, Shea Mullican, December 2018
41
DISCUSSION
There are few adult survival studies of American kestrels with which to compare
my results. I calculated annual adult survival to be approximately 74.5% without
differentiation between sexes. This is likely a naïve estimate of adult survival due to the
low total sample size and low numbers of recaptures. However, this is only five years of
data and it is likely that future estimates using the same method or, if sample sizes
eventually allow, a Cormack-Jolly-Seber approach, can be calculated with much stronger
support. Even though my estimated annual survival should be viewed within context of
sample size, it still closely resembles the results of Hinnebusch et al. (2010) who used 14
years of capture-recapture data from a southeast Florida population to estimate survival
(74% for female kestrels and 75% for male kestrels). In contrast, my adult kestrel
survival estimate is much higher than the 43% (Roest 1957) and 55% (Henny 1972)
reported from earlier studies. Higher adult survival within my study area may be a
combination of several factors: climate, individual age and experience, and wintering
strategy. My study area has a semiarid, temperate climate that rarely sees multiple days of
extreme, inclement weather. Roest (1957) concluded that kestrels who survived their first
winter had a higher probability of surviving the oncoming years. It is tempting to
conclude that the individuals who were only seen in one year probably dispersed from the
study area or died. However, overall capture success of kestrels nesting within my study
area was low (roughly 22-56% depending on the year). Based on this knowledge, I
cannot infer whether these individuals died, dispersed, or simply went undetected. In
order to make stronger inferences based on the capture-recapture data, it is imperative to
increase capture efforts and success in the future.
Texas Tech University, Shea Mullican, December 2018
42
I recorded 2 instances (out of 244 fledglings) in which locally produced male
kestrels were recruited into the local breeding population in the summer following their
year of hatching. Juvenile survival (or hatch-year survival) is a critical life stage in
raptors and this has gone largely unstudied in the literature (Roest 1957; Henny 1972;
Brown and Collopy 2013; Stupik et al. 2015). My data are too sparse to draw meaningful
conclusions other than local recruitment does occur. Banded birds from other regions,
such as Idaho or New Mexico, were not recaptured or resighted during the study period.
My estimate of mate fidelity (33.3% males and 21.4% females) is relatively
similar to rates reported by Steenhof and Peterson (28% males and 37% females; 2009b).
However, my estimates suggest that males demonstrate slightly higher mate retention
than those reported by Steenhof and Peterson (2009b). This could be a result of low
capture success and low sample size, bias toward female captures, or undetected sex-
specific differences in survival in my study or others. Low mate fidelity is likely
associated with migratory populations while high mate fidelity is associated with resident
populations (Steenhof and Peterson 2009b). Given my mate fidelity rate of 21-33%,
inferences can be made that the kestrel population in my study area is partially migratory.
I did not find any evidence of differences in site fidelity between the sexes in my
nest box program. This rate is slightly higher than site fidelity rates of 23% for males and
13% for females reported by Steenhof and Peterson (2009b). To my knowledge, there are
no other American kestrel studies that have examined site fidelity using banded
individuals in a long-term data set. Kestrels are short-lived raptors and demonstrate
varying levels of nest site fidelity. Yet, site fidelity is usually associated with longer-lived
birds (Hestbeck et al. 1991; Choudhury 1995). Site fidelity rates shown by kestrels in my

Texas Tech University, Shea Mullican, December 2018
43
study area are likely a result of past reproductive history, age and experience of the
individual, winter strategy, a relatively stable climate, and habitat quality. Many
individuals that nested within my study area were also observed in the following winters.
My population is at the very least, partially migratory, given the number of residents seen
through the winter (S. Mullican pers. obs.). This winter strategy may allow higher
retention of both nest sites and mates due to familiarity with territories, environmental
conditions, and risk areas.

Texas Tech University, Shea Mullican, December 2018
44
LITERATURE CITED
American Kestrel Partnership [AKP]. 2015. Declines of American kestrel populations.
http://kestrel.peregrinefund.org/kestrel-decline. Accessed 21 Aug 2016.
American Kestrel Partnership [AKP]. 2018. Declines of American kestrel populations.
http://kestrel.peregrinefund.org/index.php?action=map. Accessed 9 Sept 2018.
Bloom, P. H., W. S. Clark, and J. W. Kidd. 2007. Capture Techniques. Pages 193−219 in
D. M Bird and K. L. Bildstein, editors. Raptor Research and Management
Techniques, Hancock House Publishers, Surrey, Canada.
Bird, D. M. and R. S. Palmer. 1988. American Kestrel. Pages 253-290 in R. S. Palmer,
editor. Handbook of North American birds. Vol. 5: diurnal raptors. Pt. 2. Yale
University Press, Connecticut.
Brown, J. L. and M. W. Collopy. 2013. Immigration stabilizes a population of threatened
cavity‐nesting raptors despite possibility of nest box imprinting. Journal of Avian
Biology 44:141–148.
Choudhury, S. 1995. Divorce in birds: a review of the hypotheses. Animal Behaviour
50:413–429.
Conroy, M. J., and J. P. Carroll. 2009. Estimation of survival from radiotelemetry,
nesting success studies, and age distributions. Pages 173−177 in Quantitative
Conservation of Vertebrates. Wiley-Blackwell, West Sussex, UK.
Diamond, D. D. 2010. Grasslands. Handbook of Texas Online. Texas State Historical
Association. https://www.tshaonline.org/handbook/online/articles/ryl02. Accessed
16 Aug 2016.
Farmer, C. J., and J. P. Smith. 2009. Migration monitoring indicates widespread declines
of American kestrels (Falco sparverius) in North America. Journal of Raptor
Research 43:263–273.
Graves, L. L. 2010. Lubbock County. Handbook of Texas Online. Texas State Historical
Association. https://www.tshaonline.org/handbook/online/articles/ryl02. Accessed
11 Aug 2016.
Henny, C. J. 1972. An analysis of the population dynamics of selected avian species-with
special references to changes during the current modern pesticide era. U.S. Fish
and Wildlife Service, Washington, D.C.
Hestbeck, J. B., J. D. Nichols, and R. A. Malecki. 1991. Estimates of movement and site
fidelity using mark‐resight data of wintering Canada geese. Ecology 72:523−533.

Texas Tech University, Shea Mullican, December 2018
45
Hinnebusch, D. M., J.-F. Therrien, M-A. Valiquette, B. Robertson, S. Robertson, and K.
L. Bildstein. 2010. Survival, site fidelity, and population trends of American
kestrels wintering in southwestern Florida. Wilson Journal of Ornithology
122:475–483.
Leatherwood, A. 2010. Llano Estacado. Handbook of Texas Online. Texas State
Historical Association. https://www.tshaonline.org/handbook/online/articles/ryl02
Accessed 11 Aug 2016.
Mitra, A., C. Chatterjee, and F. B. Mandal. 2011. Synthetic chemical pesticides and their
effects on birds. Research Journal of Environmental Toxicology 5:81–96.
Nisbet, I. C. T. 1991. Problems with darvic color-bands on Common Terns: band losses
and foot injuries. North American Bird Bander 16:61–63.
North American Bird Conservation Initiative [NABCI]. “Bird Conservation Regions
Map.” 2016. http://nabci-us.org/resources/bird-conservation-regions-map/#bcr18.
Accessed 13 May 2017.
Roest, A. I. 1957. Notes on the American Sparrow Hawk. Auk 74:1–19.
Smallwood, J. A., and D. M. Bird. 2002. American kestrel (Falco sparverius). Account
602 in A. Poole, editor. The birds of North America. Cornell Lab of Ornithology,
Ithaca, New York, USA.
Smallwood, J. A., M. F. Causey, D. H. Mossop, J. R. Klucsarits, B. Robertson, S.
Robertson, J. Mason, M. J. Maurer, R. J. Melvin, R. D. and Dawson. 2009. Why
are American kestrel (Falco sparverius) populations declining in North America?
Evidence from nest-box programs. Journal of Raptor Research 43:274–282.
Soil Survey Staff, Natural Resources Conservation Service, United States Department of
Agriculture. 2015. Web Soil Survey. http://websoilsurvey.nrcs.usda.gov/.
Accessed 11 Aug 2016.
Steenhof, K., and B. E. Peterson. 2009a. American kestrel reproduction in southwestern
Idaho: annual variation and long-term trends. Journal of Raptor Research 43:283–
290.
Steenhof, K., and B. E. Peterson. 2009b. Site fidelity, mate fidelity, and breeding
dispersal in American kestrels. Wilson Journal of Ornithology 121:12–21.
Strasser, E. H., and J. A. Heath. 2013. Reproductive failure of a human-tolerant species,
the American kestrel, is associated with stress and human disturbance. Journal of
Applied Ecology 50:912–919.
Texas Tech University, Shea Mullican, December 2018
46
Stubbendieck, J., S. L. Hatch, and N. M. Bryan. 2011. North American wildland plants: a
field guide. University of Nebraska Press.
Stupik, A. E., T. Sayers, M. Huang, T. A. Rittenhouse, and C. D. Rittenhouse. 2015.
Survival and movements of post-fledging American kestrels hatched from nest
boxes. Northeastern Naturalist 22:20–31.
Texas Parks and Wildlife Department [TPWD], Wildlife Division, Diversity and Habitat
Assessment Programs. 2016. TPWD county lists of protected species and species
of greatest conservation need. Lubbock County. Revised January 5, 2016.
Accessed 16 Aug 2016. http://tpwd.texas.gov/gis/rtest/
Tschopp, A., M. A. Ferrari, E. A. Crespo, and M. A. Coscarella. 2018. Development of a
site fidelity index based on population capture-recapture data. PeerJ 6: e4782.
https://doi.org/10.7717/peerj.4782
USDA. 2012. Census of Agriculture – County Data. National Agriculture Statistics
Service 252–284. Accessed 21 Aug 2016.
http://www.agcensus.usda.gov/Publications/2012/Full_Report/Volume_1,_Chapte
r_2_County_Level/Texas/st48_2_001_001.pdf.
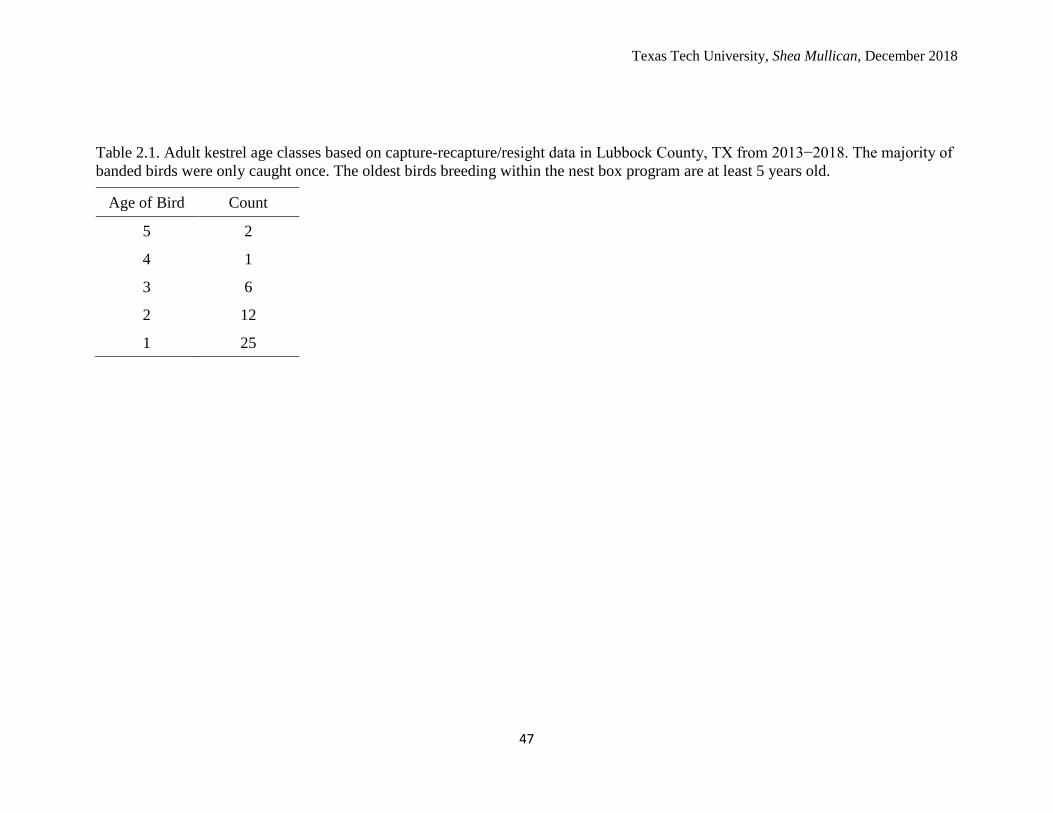
Texas Tech University, Shea Mullican, December 2018
47
Table 2.1. Adult kestrel age classes based on capture-recapture/resight data in Lubbock County, TX from 2013−2018. The majority of
banded birds were only caught once. The oldest birds breeding within the nest box program are at least 5 years old.
Age of Bird Count
5 2
4 1
3 6
2 12
1 25

Texas Tech University, Shea Mullican, December 2018
48
Table 2.2. Status of American Kestrels nesting in successive years with marked mates in nest boxes in Lubbock County, TX from
2013–2018.
Males Females n % n %
Same box, same mate 6 33.3 6 21.4
Same box, different mate
Mate still alive* 0 − 0 −
Status of former mate unknown 2 11.1 7 25
Individuals who only nested 1 year 10 55.5 15 53.6
Totals 18
28
*We did not detect any evidence of mate divorce occurring in our study area.

Texas Tech University, Shea Mullican, December 2018
49
Table 2.3. Number of years that male and female American kestrels demonstrated site fidelity by using nest boxes within 20 active
territories in consecutive years in Lubbock County, TX from 2013−2018.
No. Years Male Female Total
1 10 15 25
2 4 8 12
3 4 2 6
4 0 2 1
5 0 1 2
Total 18 28 46
*Fidelity is only demonstrated when a kestrel uses the same nest box(es) in more than a single year. Several kestrels are assumed to
have an alternate nest box within its territory.

Texas Tech University, Shea Mullican, December 2018
50
Figure 2.1. Location of the study area in relation to the Llano Estacado.
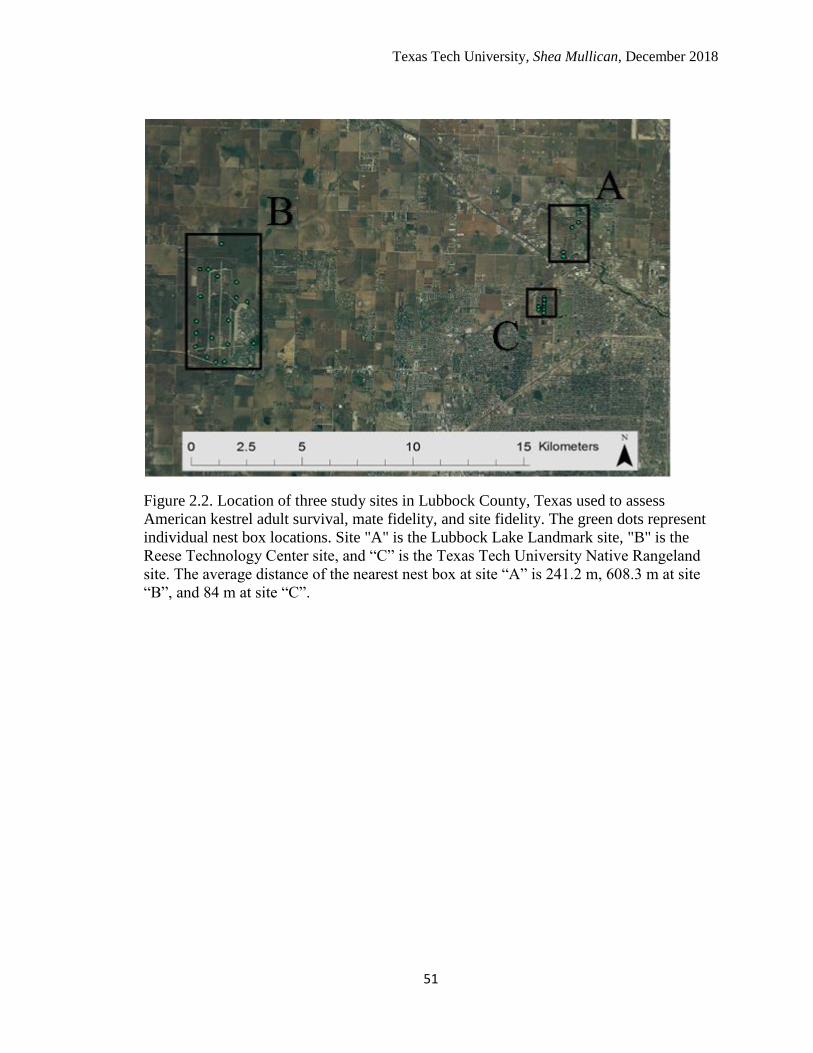
Texas Tech University, Shea Mullican, December 2018
51
Figure 2.2. Location of three study sites in Lubbock County, Texas used to assess
American kestrel adult survival, mate fidelity, and site fidelity. The green dots represent
individual nest box locations. Site "A" is the Lubbock Lake Landmark site, "B" is the
Reese Technology Center site, and “C” is the Texas Tech University Native Rangeland
site. The average distance of the nearest nest box at site “A” is 241.2 m, 608.3 m at site
“B”, and 84 m at site “C”.