Breaking the Trend - Visoning and Backcasting for Transport ...
96
Breaking the Trend Visioning and Backcasting for Transport in India & Delhi ( VIBAT INDIA & DELHI) Halcrow Group Ltd in association with Sharad Saxena and Professor David Banister (Oxford University, Transport Studies Unit) Asian Development Bank Scoping Report (Final Draft) May 2008
-
Upload
khangminh22 -
Category
Documents
-
view
0 -
download
0
Transcript of Breaking the Trend - Visoning and Backcasting for Transport ...
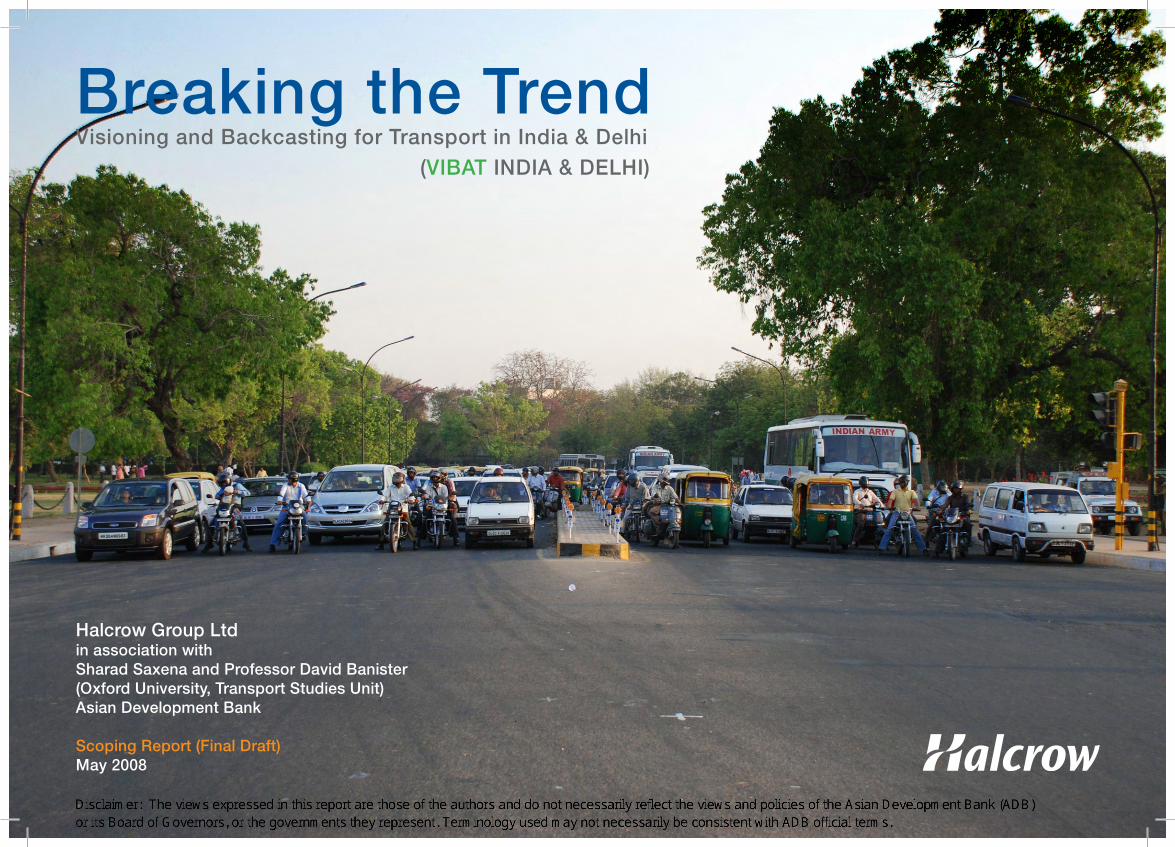
Breaking the TrendVisioning and Backcasting for Transport in India & Delhi (VIBAT INDIA & DELHI)
Halcrow Group Ltd in association with Sharad Saxena and Professor David Banister (Oxford University, Transport Studies Unit)Asian Development Bank
Scoping Report (Final Draft)May 2008
R08
Text Box
Disclaimer: The views expressed in this report are those of the authors and do not necessarily reflect the views and policies of the Asian Development Bank (ADB) or its Board of Governors, or the governments they represent. Terminology used may not necessarily be consistent with ADB official terms.
VIBATINDIA&DELHI
Breaking the Trend Visioning and Backcasting for Transport in India & Delhi (VIBATINDIA&DELHI)
Halcrow Group Ltd in association with Sharad Saxena and Professor David Banister (Oxford University, Transport Studies Unit)
Scoping Report May 2008
Asian Development Bank
www.vibat.org www.halcrow.com www.tsu.ox.ac.uk www.adb.org

VIBATINDIA&DELHI
2
Executive Summary
1. Context The dramatic projected rise in greenhouse gas (GHG) emissions from Asian [and wider] cities poses a major challenge for the world. Population growth, increased urbanisation, the rise of megacities, increased average incomes and consumption mean that travel demand is rising rapidly. The supply of transport funding and infrastructure to meet these challenges lags behind the growth in demand.
Trend-breaking futures are required to help mitigate and adapt to the impacts of global warming. This scoping study considers the role of the transport sector in reducing carbon dioxide (CO2) emissions in Asia. It tests the applicability of a visioning and backcasting study approach, using case studies at the national (India) and city scale (Delhi).
2. Study Approach The study approach involves the following steps:
Stage 1: baseline and targets – understanding of baseline traffic growth and CO2 emissions, and the development of a business as usual (BAU) projection to 2030 and appropriate target emissions for the transport sector;
Stage 2: images of the future – these are developed to comply with the desirable targets. Each takes a different emphasis – technological and behavioural;
Stage 3: policy packages and pathways – initial scenario testing is carried out to test the likely impacts of the different images of the future against headline CO2 targets.
3. Baseline, Projections and Targets From the 1980s to the present day, India has experienced a rapid rise in cross-sectoral CO2 emissions. India is currently the world’s fourth largest fossil fuel CO2 emitting country. Since 1990 CO2 emissions have doubled. Per capita emissions remain low at 0.34 metric tons of carbon equivalent (tC) (relative to 5.61 tC in the US and 2.6 tC in the UK).
GHG and CO2 emission data is however very poor in India. The baseline position and future projections are all uncertain. From the available data, the transport sector produces around 10% of India’s total CO2 emissions. Road transport contributes to 95% of this. A BAU projection has been developed for India and Delhi using the Long Range Energy Alternatives Planning (LEAP) software. Passenger road transport CO2 emissions in India are projected to rise from around 20 MtC in 2004 to 235 MtC in 2030. Growth is also experienced in Delhi, from around 1.3 MtC in 2004 to 7.5 MtC in 2030. Much of this is driven by rapid mobility growth, including rises in vehicle ownership and use.
Despite these BAU projections, much can be done to reduce transport CO2 emissions. No governmental targets, however, have been adopted for reducing projected transport CO2 emissions in India and/or Delhi. This study suggests a 1 tC target for cross-sectoral emissions, based on a Global Commons Institute-type contract and convergence regime. This is very ambitious, yet provides a “stretch” target for policy making. This equates to a target for the transport sector of 0.15 tC per capita (and 95 MtC in aggregate) in India and 0.25 tC per capita (and 2.9 MtC in aggregate) in Delhi.
4. Images of the Future There are a huge potential range of trajectories for India and Delhi to follow in terms of future transport strategy. Two archetypical images of the future are developed to illustrate two possibilities. These are defined as:

VIBATINDIA&DELHI
3
Scenario 1: “Perpetual Motion” – illustrating a strong and very successful push on technological innovation. A series of technological policy packages, including low emission vehicles and alternative fuels, are implemented to help reduce transport CO2 emissions;
Scenario 2: “Optimised Balance” – illustrating a balance of effort across technological and behavioural policy packages. This still relies on some technological change, but assumes less success (and potentially greater realism) in implementation. There is a strong and complementary behavioural change perspective. Policy packages include pricing, parking supply, urban planning and softer measures (awareness raising, travel planning).
5. Initial Scenario Testing Initial scenario testing has been carried out to assess whether the backcasting methodology and LEAP modelling framework is applicable to the Indian context. The tests are carried out for each image of the future and at the India and Delhi scales.
Under Scenario 1 “Perpetual Motion” Technological Change - transport CO2 emissions in India are projected to fall relative to the BAU projection. By 2030, passenger transport CO2 emissions are at around 0.09 tC per capita and 125 MtC in aggregate in India and 0.18 tC per capita and 4.7 MtC in Delhi. Much of this reduction, relative to the BAU projection, is driven by a successful transition to a technology-led society. Hybrid technologies and alternative fuels are delivered to the mass market. Traffic demand and growth is unaffected - car ownership increases, traffic grows and dominates in terms of mode share. Trip lengths also increase. The targets of 0.067 tC passenger transport emissions in India (0.15 tC transport emissions) and 0.11 tC passenger transport emissions in Delhi (0.25 tC transport emissions) are not met.
CO2 Emissions (Passenger Road) by Scenario
Under Scenario 2 “Optimised Balance” Behavioural Change - transport CO2 emissions in India are projected to fall relative to the BAU and Technological Change projections. By 2030, passenger transport per capita CO2 emissions are at around 0.07 tC per capita and 97 MtC in aggregate in India and 0.12 tC per capita and 3.3 MtC in Delhi. Much of this additional reduction, relative to the BAU and Technological Change projections, is driven by a wider range of intervention, with a greater balance of technological and behavioural change. Hybrid technologies and alternative fuels are delivered to the mass market, but to more modest levels than envisaged in Scenario 1. Forecast traffic growth is limited by an emphasis on behavioural change – pricing, parking supply, urban planning and softer measures are important here. The targets of 0.067 tC passenger transport emissions in India (0.15 tC transport emissions) and 0.11 tC
2030 Passenger Road Emissions
2004
BAU Technological Change
Behavioural Change
Target
Transport CO2 Emissions Per Capita (tC)
India 0.02 0.17 0.09 0.07 0.067 passenger road (0.15 – all
domestic transport)
Delhi 0.09 0.29 0.18 0.12 0.11 passenger road (0.25 – all domestic
transport)
Transport CO2 Emissions Aggregate (MtC)
India 20.5 235 125 97 95
Delhi 1.4 7.6 4.7 3.3 2.9

VIBATINDIA&DELHI
4
passenger transport emissions in Delhi (0.25 tC transport emissions) are almost achieved.
6. Synthesis and Conclusions This scoping study has demonstrated that the backcasting methodology is well suited to the Asian context. It provides a framework to test likely trend-breaking futures and a target against which to monitor progress. The use of a wide range of policy packages is also important in moving decision making in transport planning away from individual, uncoordinated and poorly integrated projects.
A number of important issues have emerged. The successful implementation of vehicle efficiencies and alternative fuels at the mass market scale is critical. There are clear opportunities in encouraging low emission, small size and low price vehicle technology, potentially using lean burn technology. Financial incentives may be required here – including linking vehicle import duty to emissions in the short term. Some technological policy measures appear to be more limited in potential as they undergo closer examination (e.g. biofuels, where there are strong concerns over lifecycle impacts and food supply issues).
The potential CO2 reduction gains from technological change are likely to be offset by the projected rapid growth in traffic. Behavioural change becomes important – aimed at reducing the projected growth in travel, particularly car-based travel. Some behavioural change policy areas appear to be very important, but are underplayed in policy terms. These include pricing regimes (perhaps via a carbon tax or fuel duty); urban structure, as an important enabler of carbon efficient travel (public transport, walking and cycling and short distance trips); investment in a range of alternatives to the private car; and softer measures, such as improved awareness of sustainable travel options (travel planning).
The analysis reported in this scoping study is, of course, an initial exploration of the issues. More detailed work is required. This includes a more thorough review of potential policy mechanisms and priorities at the local level. Sensitivities and assumptions are also very important – a minor change to assumptions can make very large differences to reported results. A more detailed examination would consider different levels of application for different policy packages, sensitivities by key variables (fuel efficiency, occupancy, distance travelled, oil price changes) and issues such as policy package synergies, rebound effects, lock in potential and cost-benefit analysis. These issues are likely to be considered best using a transport and carbon simulation tool such as is being developed in the VIBAT London study. This simulation tool could be applied in different contexts.
The backcasting study approach could usefully be tested for applicability in a different national context to India. The method could then potentially be used as the basis for a pan-Asian study involving a number of more detailed city, regional and/or city case studies.
To conclude, the BAU projections for transport in India and Asia are extremely challenging. It is generally accepted that trend-based futures are unsustainable. Scenario building and backcasting offer one means by which trend-breaking futures can be analysed. Institutional and funding issues will remain difficult; however this only reinforces the need for a strategic, forward-looking, progressive, coordinated and integrated policy approach, delivered at the pan-Asian, national and city scales. This should include a very wide range of context-specific, technological and behavioural policy interventions. This study has demonstrated that even in countries that are experiencing severe pressures for very substantive increases in travel demand, over a relatively short time period, it is possible to explore the means by which low energy and carbon futures can be addressed. This opportunity must be taken.

VIBATINDIA&DELHI
5
Contents
Executive Summary
1 Introduction 9 1.1 Context 9 1.2 Projections for Exponential Carbon Emission Growth 9 1.3 A Backcasting Methodology 11 1.4 Approach to the Study 13 1.5 Structure of the Report 15
2 Key Socio-Demographic and Travel Trends 16 2.1 Introduction 16 2.2 India 16 2.3 Delhi 22 2.4 Summary of the Key Trends 27
3 Baseline and BAU Projections 28 3.1 Baseline CO2 Emissions for India 28 3.2 Transport’s Sectoral Share 31 3.3 Previous Projective Studies 31 3.4 A Baseline and Business as Usual Projection 33
4 Targets for the Transport Sector 38 4.1 Contraction and Convergence 38 4.2 India - 0.15 tC per Capita and 95 MtC 39 4.3 Delhi - 0.25 tC per Capita and 2.9 MtC 40 4.4 Conclusions 41

VIBATINDIA&DELHI
6
5 Images of the Future 42 5.1 Likely Strategic Futures 42 5.2 Scenario 1: “Perpetual Motion” 42 5.3 Scenario 2: “Optimised Balance” 44 5.4 Policy Measures and Packages 45
6 Initial Scenario Testing 55 6.1 Introduction 55 6.2 Scenario 1 “Perpetual Motion” Assumptions 55 6.3 Scenario 2 “Optimum Balance” Assumptions 56 6.4 Comparing Scenarios 1 and 2 58 6.5 Conclusions, Synergies and Rebound Effects 61
7 Conclusions 62
Annex 1. Selected References 65
Annex 2. Methodology for Developing the Baseline 68
Annex 3. Long List of Policy Measures 76
Annex 4. Local Pollutants 79

VIBATINDIA&DELHI
7
List of Figures
Figure 1. The Backcasting Framework 12 Figure 2. The Study Approach 14 Figure 3. India’s Urban Population – Baseline and Future Projections 16 Figure 4. India -Total Number of Vehicles 17 Figure 5. Motorisation & Urbanisation Trends for India 18 Figure 6. Car Ownership per 1000 People 18 Figure 7. Growth of Motor Vehicles in India 19 Figure 8. India - Vehicle Market Share 2006-2007 19 Figure 9. Fuel Prices in India – Gasoline and Diesel 20 Figure 10. Delhi - Population Projections 22 Figure 11. India – Growth in per Capita Income 23 Figure 12. Delhi Metro - Completed Lines (2008) 24 Figure 13. Delhi and Relative Population Densities 25 Figure 14. India’s Carbon Emissions Trends 28 Figure 15. Relative Global CO2 Emissions 30 Figure 16. Transport’s Sectoral Emissions 31 Figure 17. Sectoral Transport Emissions 32 Figure 18. BAU Mobility Projections – India 34 Figure 19. BAU CO2 Emission Projections - India 34 Figure 20. BAU Vehicle Demand Projections - Delhi 35 Figure 21. BAU Vehicle Sales Projections – Delhi 35 Figure 22. BAU Growth in Vehicle Kilometres – Delhi 36 Figure 23. BAU Mode Share – Delhi 36 Figure 24. BAU Projected CO2 Emissions – Delhi 37 Figure 25. Contract and Convergence (GCI) 38 Figure 26. India’s BAU and Target Emissions 39 Figure 27. Delhi’s BAU and Target Emissions 40 Figure 28. Projected Sales of Hybrid Cars 55 Figure 29. Behavioural Change Scenario versus BAU 57 Figure 30. CO2 Emissions by Scenario (India) 59 Figure 31. CO2 Emissions by Scenario and Mode (India) 59 Figure 32. CO2 Emissions by Scenario (Delhi) 60 Figure 33. CO2 Emissions by Scenario and Mode (Delhi) 60 Figure 34. India – Stock Profile 70 Figure 35. Existing Stock Vintage Profile 70

VIBATINDIA&DELHI
8
Figure 36. Sales Projections 72 Figure 37. Survival Profile for Cars 72 Figure 38. Assumed Utilisation Profile of Vehicles 73 Figure 39. Dieselization of Vehicular Fleet 74 Figure 40. Trend of Particulate Emissions in Delhi 82 Figure 41. Sulphur Dioxide Levels in Delhi 82 Figure 42. NOx Emission Levels in Delhi 83
List of Tables
Table 1. Car Ownership per 1000 People 18 Table 2. Delhi Metro – Completed Line Lengths (2008) 24 Table 3. Relative Global CO2 Emissions (2004) 29 Table 4. Projected Vehicle, Fuel Consumption and Carbon Emissions in India (ADB) 31 Table 5. Projected Land Based Passenger Transport CO2 Emissions in India (IITK) 32 Table 6. Projected Transport CO2 Emissions in India (IEA) 32 Table 7. BAU Vehicle Population Projections (Million) – India 33 Table 8. Passenger Road Transport Targets for India and Delhi 41 Table 9. Scenario 1 Key Characteristics 43 Table 10. Scenario 2 Key Characteristics 44 Table 11. CO2 Emission Profile for Selected Vehicles 46 Table 12. CO2 Emissions and Fuel Efficiency – Technological Change Scenario 56 Table 13. Vehicle Ownership and Mobility 57 Table 14. CO2 Emissions per Capita by Scenario 58 Table 15. Energy Demand by Scenario 58 Table 16. Total Number of Registered Motor Vehicles in India (1951-2004) 69 Table 17. Sales of Cars in India 71 Table 18. Sales of Two Wheelers 71 Table 19. Vehicle Fuel Types and Efficiencies 73 Table 20. Annual Distance Travelled and Occupancy 73 Table 22. European Emission Norms for Gasoline Cars 79 Table 23. Indian Emission Standards (4-Wheel Vehicles) 79 Table 24. Two-Wheeler Emission Norms 80 Table 25. Three Wheeler Emissions Norms 81

VIBATINDIA&DELHI
9
1 Introduction 1.1 Context
The Halcrow Group has been commissioned by the Asian Development Bank (ADB) to consider the issue of transport and global warming in India. The study seeks to develop and test a method, using visioning and backcasting techniques, which is applicable to Asia. The study uses India (representing the national level) and Delhi (city level) as case studies.
The study team is as outlined below:
Dr Robin Hickman, Halcrow Group (Project Manager)
Sharad Saxena (Lead Researcher)
Professor David Banister (Transport Studies Unit, Oxford University) provides comments on the work. Jamie Leather (Asian Development Bank) provides project management and technical inputs from the client side.
1.2 Projections for Exponential Carbon Emission Growth An overwhelming body of scientific evidence now clearly indicates that climate change is a serious and urgent issue. The Earth’s climate is rapidly changing, mainly as a result of increases in greenhouse gases (GHG)1 caused by human activities. The
1 GHGs include a range of gases including carbon dioxide (CO2), methane, nitrous
oxide and three groups of fluorinated gases (sulfur hexafluoride, hydrofluorocarbons
Intergovernmental Panel on Climate Change (IPCC, 2007) estimates that “Most of the observed increase in global average temperatures since the mid-20th century is very likely due to the observed increase in anthropogenic GHG concentrations.”
Climate change is now perceived as a serious global threat and it demands an urgent and far-reaching response. The concentration of atmospheric carbon dioxide (CO2) has increased from a pre-industrial value of about 280 ppm to 379 ppm in 2005 (IPCC, 2007), with projections of global concentrations rising to 550ppm by 2050 at current trends, or rising to 550-700ppm by 2050, and 650-1200ppm by 2100, without future intervention. A “sustainable” level of concentrations is seen as around 450ppm (or lower – some estimates are as low as 400ppm, or even 350ppm – below present levels).
Emissions from transport are one of the most serious and rapidly growing problems. The transport sector is responsible for almost 25% of global CO2 emissions (IISD, 2004). Transport emissions are growing at approximately 2.1% per year worldwide, and 3.5% per year in developing countries (IEA, 2002). These growth rates make the transport sector the fastest growing source of GHG emissions.
and perfluorocarbons). There are additional greenhouse gases, but the above are
those subject to the Kyoto Protocol. This study concentrates on CO2 emissions.
VIBATINDIA&DELHI
10
The Kyoto Protocol2 (1997) seeks to achieve "stabilization of GHG concentrations in the atmosphere at a level that would prevent dangerous anthropogenic interference with the climate system." The UK Kyoto commitment, for example, is a 12.5% reduction in six GHG below 1990 levels over the period 2008-2012. In India no target reduction has been agreed; India ratified the Kyoto Protocol [along with Brazil, China, etc.] but have no obligation beyond monitoring and reporting emissions. The Protocol expires in 2012 and negotiations are ongoing for a replacement agreement.
The Stern Review (HM Treasury, 2006) was an important recent publication, considering the economic dimensions of climate change. It suggests there is still time to avoid the worst impacts of climate change, but only if we take strong action now.
Stern suggests that if we don’t act, the overall costs and risks of climate change will be equivalent to losing at least 5% of global GDP each year, for now and in future years. The estimates of damage could rise to 20% of GDP or more. In contrast the costs of action, to avoid the worst impacts of climate change, will cost less at around 1% or less of global GDP each year.
2 As of June 2007, 175 Parties have ratified the Protocol. Of these, 36 countries and
the EEC are required to reduce greenhouse gas emissions below levels specified for
each of them in the treaty (representing 62% of emissions from Annex I countries).
Notable non-signatories include the United States and Australia. The Protocol
includes "flexible mechanisms" which allow Annex I economies to meet their
greenhouse gas emission limitation by purchasing GHG emission reductions from
elsewhere.
Domestic travel demand, and internationally (shipping and air-based), is projected to rise exponentially in India. Investments in the sector tend to be ad-hoc and/or focused on isolated projects. The traditional transport planning “predict and provide” approach certainly does not help here. An extrapolation of current trends and projected traffic growth will be very difficult to equate with CO2 emission reduction objectives and, indeed, wider quality of life objectives.
The ADB (2006) has previously considered the role of the transport sector in reducing GHG emissions, including the development of action plans. The ADB is now seeking to develop a policy framework for a strategic and coordinated response to reducing CO2 emissions in the transport sector.
CO2 Emissions Measurement
Carbon dioxide emissions are usually measured in tonnes of carbon (tC) or million tonnes of carbon (MtC). Occasionally tonnes of carbon dioxide (tCO2) are used.
One tonne = 1,000 kg
One tonne of carbon = 3.67 tCO2 (44/12)
VIBATINDIA&DELHI
11
Measurement of Transport Emissions
End Users: include an estimated share of upstream emissions from power stations and refineries allocated back to the sectors using the electricity or fuel (sometimes referred to as ‘well to wheel’). For the transport sector this adds around 20% to the total CO2 produced from the tailpipe or source. End user emissions therefore give a more complete picture, however are more difficult (and uncertain) to measure than source user emissions.
Source Users: presented as tailpipe emissions only. Emissions are therefore allocated according to where the fuel (e.g. coal, gas, oil, petrol etc.) is consumed. There is no allocation of emissions arising from fuel refining or electricity generation to the transport sector; this is allocated to the energy sector.
Note: For data reasons, the report uses source users / tail pipe emissions only.
1.3 A Backcasting Methodology The analysis in this study develops a visioning and backcasting approach. This is the first attempt to apply such an approach in the Asian context. Backcasting has previously been widely used in Scandinavian research, over the last 20 years, and also in a number of pan-European projects, such the Environmentally Sustainable Transport (EST) study (OECD, 2000), the EU Possum study (Banister et al., 2000), the VIBAT-UK study (Hickman and Banister, 2007) and VIBAT-London study (Hickman and Banister, 2007-08)3.
3 For more information in the VIBAT studies see www.vibat.org
Backcasting is a technique that is often referred to as the “opposite” to forecasting. It involves identification of a particular future scenario(s) and tracing pathways of progress and implementation back to the present. The term backcasting was first introduced by Robinson (1982) to analyse future energy options in terms of how desirable futures could be attained. The major distinguishing characteristic is: “a concern, not with what futures are likely to happen, but with how desirable futures can be attained. It is thus explicitly normative, involving working backwards from a particular desirable end point to the present in order to determine the physical suitability of that future and what policy measures would be required to reach that point.” (Robinson, 1990)
The backcasting approach is ideally suited to use in the Asian sustainable transport context. The increasing level of greenhouse gas emissions from Asian cities poses an incredible challenge for the whole world. Trend-breaking futures (and analysis) are required – hence the applicability of backcasting as an approach. The challenge for this scoping study is to provide evidence to help plan for the future development of society and to react positively to what we understand as current trends.

VIBATINDIA&DELHI
12
Figure 1. The Backcasting Framework

VIBATINDIA&DELHI
13
1.4 Approach to the Study The work stages for this scoping study are as outlined below and in Figure 1.2.
Stage 1: Baseline and Targets
The first stage is to identify social, demographic and transport trends at the national and city level. Relationships are drawn with energy consumption, mode share and environmental emissions. A business as usual (BAU) projection is developed for travel (passenger transport) and CO2 emissions, in India and the city of Delhi, to 2030. This allows an assessment of the potential scale of problem facing India in terms of CO2 emissions growth.
Targets are also set for 2030 in terms of reaching a more sustainable level of CO2 emissions from the transport sector. This stage therefore establishes a baseline and targets within which the visions of the future can be constructed. This stage produces the main quantitative baseline for the project.
Stage 2: Images of the Future
Images of the future are developed to comply with the desirable targets. These images will be possible solutions to the perceived problems and designed to initiate discussion; each alternative image taking a different emphasis – technological and behavioural. An inventory of potential policy measures and packages is also developed. These consist of policy levers which have potential to reduce transport CO2 emissions.
Stage 3: Policy Packages and Pathways
The final part of the study tests the visioning and backcasting methodology, using the LEAP modelling framework, to assess the likely CO2 emission pathways under the two images of the future.
A workshop was held at the Asian Development Bank in Delhi in March 2008 to discuss the structure of the work and initial findings. More in-depth data gathering meetings were also held at organisations such as the Society for Indian Automobile Manufacturers (SIAM), the Indian Institute of Technology, the Centre for Science and Environment (CSE) and the Bureau of Energy Efficiency (BEE).
Due to the scoping/explorative nature of the study, there was no formal interaction with the Indian Government regarding the potential policy packages and their likely levels of application, acceptability, etc. Ideally a more detailed assessment would include a detailed discussion with Government officials concerning policy packages available, potential levels of application, cost and benefits appraisal and implementation pathways.
Potential further work stages could involve further scenario testing and simulation and appraisal.

VIBATINDIA&DELHI
14
Figure 2. The Study Approach

VIBATINDIA&DELHI
15
1.5 Structure of the Report This scoping report is structured as follows:
Section 2: Key Socio-Demographic and Travel Trends
Section 3: Baseline and BAU Projections
Section 4: Targets for the Transport Sector
Section 5: Images of the Future and Available Policy Packages
Section 6: Initial Scenario Testing
Section 7: Conclusions and Next Steps
VIBATINDIA&DELHI
16
2 Key Socio-Demographic and Travel Trends
2.1 Introduction A brief overview of socio-demographic and travel trends are given below, for India and Delhi. This provides some context for the later development of the baseline and projections of future travel and CO2 emissions.
2.2 India
Population
The population of India stood at 1.027 billion as of March 2001 (Banthia, 2001). While the decadal growth of the country as a whole has declined marginally from 23.9% (1981–1991) to 21.3% (1991–2001), the pace of urbanisation in India has been increasing rapidly. The future urban population growth in India is expected to drive increasing motorisation and have serious consequences for traffic growth, urban road congestion and CO2 emissions as well as wider sustainability and quality of life issues.
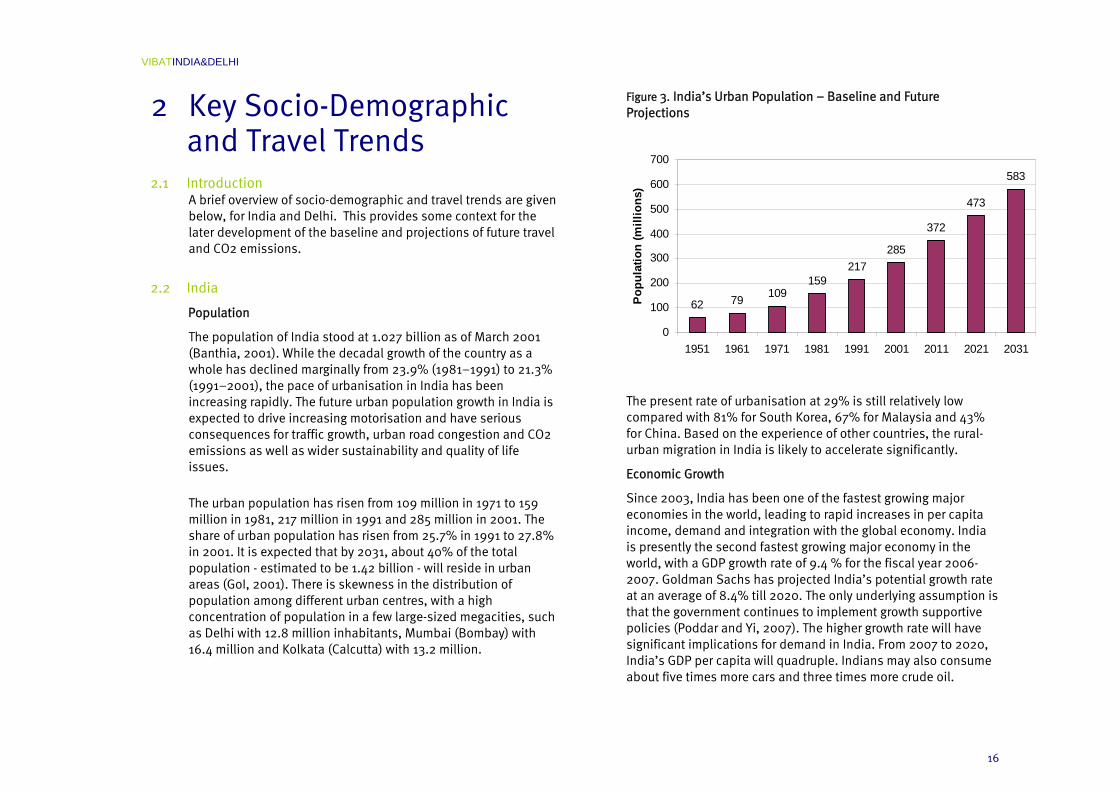
The urban population has risen from 109 million in 1971 to 159 million in 1981, 217 million in 1991 and 285 million in 2001. The share of urban population has risen from 25.7% in 1991 to 27.8% in 2001. It is expected that by 2031, about 40% of the total population - estimated to be 1.42 billion - will reside in urban areas (GoI, 2001). There is skewness in the distribution of population among different urban centres, with a high concentration of population in a few large-sized megacities, such as Delhi with 12.8 million inhabitants, Mumbai (Bombay) with 16.4 million and Kolkata (Calcutta) with 13.2 million.
Figure 3. India’s Urban Population – Baseline and Future Projections
The present rate of urbanisation at 29% is still relatively low compared with 81% for South Korea, 67% for Malaysia and 43% for China. Based on the experience of other countries, the rural-urban migration in India is likely to accelerate significantly.
Economic Growth
Since 2003, India has been one of the fastest growing major economies in the world, leading to rapid increases in per capita income, demand and integration with the global economy. India is presently the second fastest growing major economy in the world, with a GDP growth rate of 9.4 % for the fiscal year 2006-2007. Goldman Sachs has projected India’s potential growth rate at an average of 8.4% till 2020. The only underlying assumption is that the government continues to implement growth supportive policies (Poddar and Yi, 2007). The higher growth rate will have significant implications for demand in India. From 2007 to 2020, India’s GDP per capita will quadruple. Indians may also consume about five times more cars and three times more crude oil.
62 79 109159
217
372
473
285
583
0
100
200
300
400
500
600
700
1951 1961 1971 1981 1991 2001 2011 2021 2031
Popu
latio
n (m
illio
ns)

VIBATINDIA&DELHI
17
Key Transport Trends for India
Rapidly Increasing Motorisation
India has experienced a high level of motorisation over the last three or so decades but particularly since the 1980s. The national motor vehicle fleet increased from only 1.8 million in 1970 to around 21 million in 1980 and to around 49 million in 2000. As in other rapidly industrialising low-income countries, motor vehicle activity has been largely concentrated in the major cities.
Motorisation and Urbanisation
The rate of motorisation inextricably links to urbanisation. While urban population has increased by 50% during 1990–2004, the number of registered motor vehicles (RMVs) has risen by nearly 400 %.
Rapid motorisation can also be attributed to rising per-capita income, higher aspiration levels of customers, price reductions, and new models-variants launched by auto manufacturers, increased credit options (including lower monthly instalments due to stable interest rates and higher value purchases), and recent excise duty cuts in small-sized cars.
Figure 4. India -Total Number of Vehicles
Source: Ministry of Road Transport (2007)
The Indian transport sector has passed through three distinct phases:
1. Tight government control and licensing until 1983;
2. Partial liberalisation in 1983 and 1984 that led to increased foreign investment and proliferation of two-wheelers and light commercial vehicles (LCVs);
3. Sweeping liberal economic reforms through the 1990s that sustained foreign investment and increased vehicle sales.
Increased vehicles sales are expected to continue in the future as per capita incomes rise. At present the number of passenger cars for every 1000 people in India is relatively low when compared to the developed economies.
21,374
1,865
48,857
0
10,000
20,000
30,000
40,000
50,000
60,000
70,000
80,000
1951
1961
1971
1981
1991
1996
1997
1998
1999
2000
2001
2002
2003
2004
Tota
l Veh
icle
s (in
'000
)

VIBATINDIA&DELHI
18
Figure 5. Motorisation & Urbanisation Trends for India
Figure 6. Car Ownership per 1000 People
Table 1. Car Ownership per 1000 People
Note: Data for Thailand’s motor vehicle population has been derived from Segment Y estimates (previous consultancy work for the ADB).
An 8 % annual increase in India’s Gross National Income (GNI) would raise it to 4,586 per capita by 2030. This would be very close to Malaysia’s current GNI per capita. Hence one estimate of India’s passenger cars numbers and total vehicle numbers in 2030 can be based on Malaysia’s current level of motorisation. There is however, also the issue of creating the requisite infrastructure to support the increase in vehicle numbers. Delhi’s road network has increased nearly three times – from 8,380 km in 1971-1972 to 30,923 km in 2006-2007 (a factor of 3.7). But during the same period, vehicle numbers have also increased by 24 times (Government of India, 2008).
Cities like Delhi already have over 1,922 km of road length per 100 km2 area in 2001-02 as compared to the national average of 75 km
Country
Passengers cars/1000
pop
Total vehicles/1000
pop GNI per capita
India 8 12 620
China 10 15 1,500
Sri Lanka 13 42 1,010
Thailand 35 276 2,490
Korea 218 302 14,000
Malaysia 225 272 4,520
Japan 441 586 37,050
United Kingdom 451 510 33,630
United States 465 808 41,440
8 10 13
218 225
441 451 465
050
100150200250300350400450500
India Sri Lanka Malaysia UnitedKingdom
Pass
enge
r car
s pe
r 100
0 pe
ople
Urban Population
Motor vehicles
050
100150200250300350400450
1990
1992
1994
1996
1998
2000
2002
2004
Inde
x 19
90=1
00

VIBATINDIA&DELHI
19
per 100 km2 area (Government of India, 2008). The infrastructure constraint could well prove to be a key factor which would limit the overall numbers of vehicles on roads in Delhi and other Indian cities.
Figure 7. Growth of Motor Vehicles in India
Source: Ministry of Road Transport (2007)
Two Wheelers
Two-wheel vehicles are the dominant mode of private road transport in India. They account for more than three-quarters of the total registered vehicle population and have exhibited the highest average annual growth rate - 14.5% between 1980 and 2003. Cars, jeeps, and taxis taken together have grown at an average annual growth rate of 9.5% during this period; whereas the population of registered buses has increased at an average annual growth rate of 7.5% over the same period.
Figure 8. India - Vehicle Market Share 2006-2007
Source: SIAM (2008)
The two wheeler segment has also gone through considerable change. Scooters have lost ground and now constitute 14 % of total two wheelers. Very small size vehicles like mopeds have fallen below 5%. The share of motorcycles has consistently increased - in 2005 the share of motorcycles was around 80 %.
Low Cost Cars
India has taken the lead in redesigning the car for buyers who might otherwise be able to afford only a motorcycle. The emergence of “low cost cars” appears to be the single most important trend in the Indian automotive industry.
The first of these low cost cars - the Tata Nano - is scheduled for launch in the second half of 2008. Designed by Tata Motors (India’s largest automobile company) and priced at 2,500 dollars, the Nano is expected to be at least 50 % cheaper than any other car available on the market. Low cost cars, priced close to the
05,000
10,00015,00020,00025,00030,00035,00040,00045,00050,000
1951
1971
1991
1997
1999
2001
2003
Year
Num
ber o
f veh
icle
s
Tw o Wheelers
Cars, Jeeps and Taxis
Buses
Goods VehiclesOthers
Three wheelers
4%
Passenger vehicles
14%
Two wheelers77%
Commercial vehicles
5%
VIBATINDIA&DELHI
20
high-end two-wheeler, will make it easier for two wheeler buyers to migrate to cars. Recent surveys suggest that low budget cars may take away nearly 25 % of the two wheeler market (Roychowdhury, 2007). Besides Tata Motors, another Indian company, Bajaj Auto, has also announced plans to launch an ultra low cost car in collaboration with Renault.
In 2008, the Tata motor company has also acquired the two high end brands, Jaguar and Land Rover, from the Ford Motor company. This acquisition will ensure that the company emerges as a diversified player in the automobile sector. Higher cost vehicles can directly be marketed and sold to the Indian market.
Preference for SUVs
In Indian cities, SUVs are increasingly being preferred as private transport vehicles owing to the benefits of more space and comfort as well as the greater protection and safety they are perceived to give to the passengers. Moreover a high end SUV tends to be viewed as a status symbol, which significantly enhances its value to the buyer. From a practical standpoint, SUVs are better equipped to handle poor road conditions. From an environmental perspective, SUVs have a poor fuel economy rate compared to smaller cars and therefore tend to increase GHG emissions. Even hybrid SUVS emit higher than fleet average g/km of CO2.
Diesel versus Gasoline
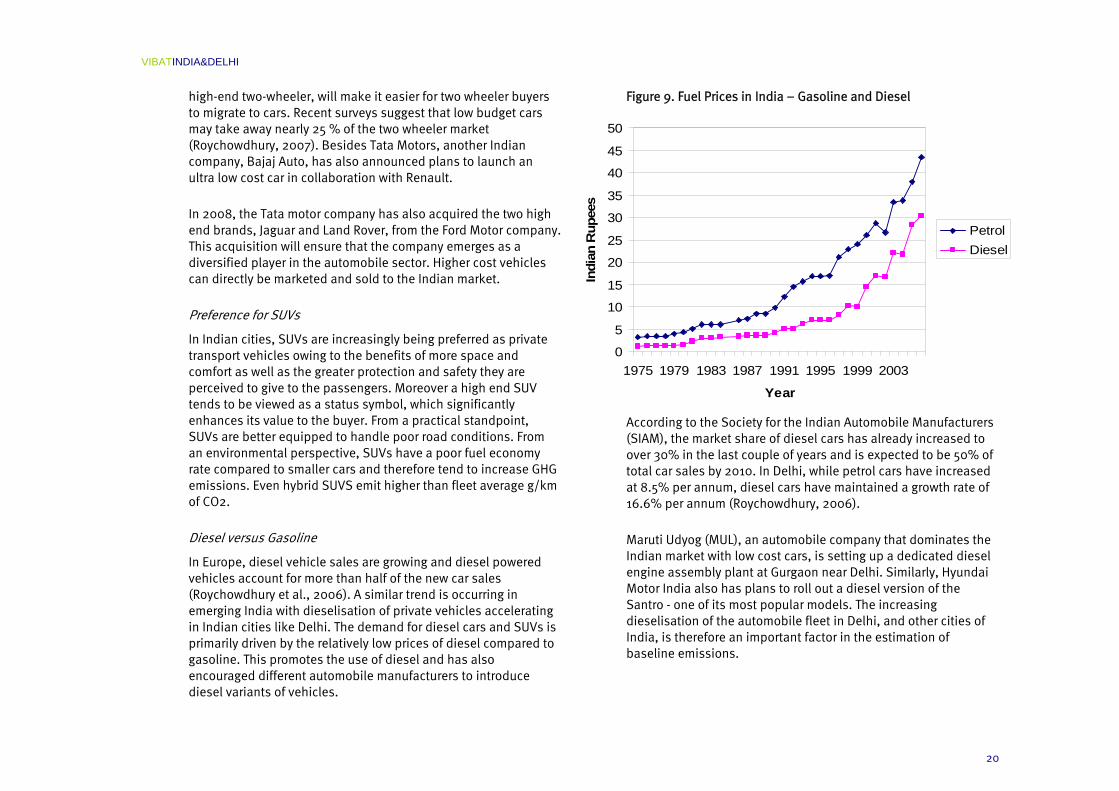
In Europe, diesel vehicle sales are growing and diesel powered vehicles account for more than half of the new car sales (Roychowdhury et al., 2006). A similar trend is occurring in emerging India with dieselisation of private vehicles accelerating in Indian cities like Delhi. The demand for diesel cars and SUVs is primarily driven by the relatively low prices of diesel compared to gasoline. This promotes the use of diesel and has also encouraged different automobile manufacturers to introduce diesel variants of vehicles.
Figure 9. Fuel Prices in India – Gasoline and Diesel
According to the Society for the Indian Automobile Manufacturers (SIAM), the market share of diesel cars has already increased to over 30% in the last couple of years and is expected to be 50% of total car sales by 2010. In Delhi, while petrol cars have increased at 8.5% per annum, diesel cars have maintained a growth rate of 16.6% per annum (Roychowdhury, 2006).
Maruti Udyog (MUL), an automobile company that dominates the Indian market with low cost cars, is setting up a dedicated diesel engine assembly plant at Gurgaon near Delhi. Similarly, Hyundai Motor India also has plans to roll out a diesel version of the Santro - one of its most popular models. The increasing dieselisation of the automobile fleet in Delhi, and other cities of India, is therefore an important factor in the estimation of baseline emissions.
0
5
10
15
20
25
30
35
40
45
50
1975 1979 1983 1987 1991 1995 1999 2003
Year
Indi
an R
upee
s
PetrolDiesel
VIBATINDIA&DELHI
21
Fuel Economy Standards
The rapid increase in vehicle numbers and the distances travelled underline the need to improve the fuel economy of vehicles. However, most emerging Asian nations, with the exception of China, have not implemented fuel economy standards. In 2003, the Government of India’s Auto Fuel Policy recommended that "Declaration of fuel economy standards by automobile manufacturers should be made mandatory. Manufacturers should publish the fuel economy standards (km/litre or km/kg) for each model in the documents that are supplied with each vehicle. In the case of heavy-duty vehicles, fuel efficiency will be reported in terms of g/kWh at present. Subsequently, after establishing test procedure on heavy-duty chassis dynamometer, reporting may be done in km/litre.” Essentially the policy required the car industry in India to comply with voluntary fuel efficiency standards (Mashelkar et al., 2002). Reports suggest that car manufacturers have however failed to commit to this voluntary scheme. Consumers are not provided with clear fuel efficiency data on each model sold. The introduction of mandatory minimum limits with penalties for manufacturers not achieving the target values is therefore urgently needed.
A recent policy announcement by the Government of India states that mandatory fuel-efficiency norms for automobiles are likely to be enforced in India within two years (TOI, 2007). The Government of India intends to develop mandatory fuel-efficiency standards for all classes and types of vehicles, including cars, scooters, bikes, trucks, buses and three-wheelers. The Bureau of Energy Efficiency (BEE) has been nominated as the statutory authority that will implement the fuel economy standards in India.
In Asia, China is leading the way in setting fuel economy standards. These standards based on the weight of the vehicles, are being implemented in two phases (the first in 2005-2006 and the second in 2008) with separate standards for manual and automatic transmissions. Each vehicle sold in China will be required to meet the standard for its weight class individually. The
standards classify vehicles into 16 weight classes, ranging from 16 km/litre in 2005 to 18.23 km/litre in 2008 for the lightest vehicles. China’s efforts for regulating fuel economy for each vehicle and in different size class is considered one of the most progressive efforts to reduce fuel consumption.
Non-Motorised Transport
As in most developing countries, a high proportion of travel in Indian cities is by walking and through non-motorised transport (NMT). Pedestrians and non-motorised vehicle (NMV) users together form the largest group of road users. Most of India’s urban poor can’t afford even the low fares of public transport and hence are forced to travel long distances on foot or by bicycle (Pucher et al., 2005). The share of NMT at peak hours varies from 30% - 70%. 15 - 35 % of all trips in Indian cities are made by bicycles. The share tends to be higher in medium- and small-sized cities (Tiwari, 1999).
Transport investment continues to ignore the needs of this segment and infrastructure development in road expansion actually makes the environment more hostile to their needs (Pucher et al.). For instance in Delhi, bicycles have been consistently losing their share to two wheelers since 1957. According to older estimates, while the share of motorised two wheelers increased from 1% in 1957 to 17.6 % in 1994 in Delhi, the share of bicycle trips dropped from 36 % to just 6.6 % (Mohan, 1997).
In the city of Delhi, capital investment in the recent years has been directed mainly towards the construction of expressways and grade separated intersections. Investments which promote motorisation may impose disproportionate social and environmental costs on the poor. Increased motorisation has resulted in higher levels of fatalities. While all road users are vulnerable to road accidents, statistics for Delhi reveal that pedestrians, two-wheeler riders and bus commuters comprise 80% of fatalities. Motor-vehicle occupants comprise a small

VIBATINDIA&DELHI
22
minority (Mohan and Bawa, 1985). The World Bank estimates that nearly half of traffic fatalities are pedestrians.
A hostile traffic environment has been slowly edging out bicycles, cycle rickshaws and other non motorised modes from the roads. Transport investment continues to ignore the needs of this segment of travel.
Public Transport Systems
The rapid growth of motorisation in most Indian cities has caused the relative share of public transport to decline. The increasingly congested roadways have further slowed down buses, increased bus operating costs and further discouraged public transport use. Buses form the most dominant part of the public transport system providing nearly 90 % of the total public transport share in Indian cities (Pucher et al., 2004). However, a large number of cities do not have adequate public transport services. Only eight of the 35 cities that have a population exceeding one million have dedicated bus services, or have formed city bus undertakings. In Delhi, Bangalore and Kolkata, the services provided by the city bus undertakings are supplemented by private operators based on route licenses.
A large number of passenger trips are conducted on informal buses and para transit vehicles. These large numbers of informally operated vehicles are often inadequately maintained. They are operated in a disorganised manner and the process of competing for passengers often is highly disruptive to the flow of traffic and results in significant amounts of both global and local pollutants.
In India, the demand for public transport services continues to increase, mainly due to the burgeoning growth of India’s cities both in terms of population and land area. However the poor quality of public transport services coupled with rising incomes amongst India’s upper and middle classes has ensured that
public transport is growing at a far lower rate than private transport. Public transport’s modal share is steadily decreasing.
2.3 Delhi
Population of Delhi
The city of Delhi has grown rapidly in area, density and population. Its spatial area has expanded fifteen fold since 1911. In 1991, 29 new towns were annexed, increasing the area from 445 to 1,483 sqkms.
The population of Delhi has increased from 1.7 million in 1951 to over 13 million in the year 2000. Population projections are that Delhi will reach 22 million by 2020 (Bose and Sperling, 2001). Extrapolating the existing trends mean that the population will exceed 26 million people by 2030.
Figure 10. Delhi - Population Projections
26
14
22
0
5
10
15
20
25
30
1991 1996 2001 2006 2011 2016 2021 2026
Popu
latio
n (m
illio
ns)
VIBATINDIA&DELHI
23
Income Growth
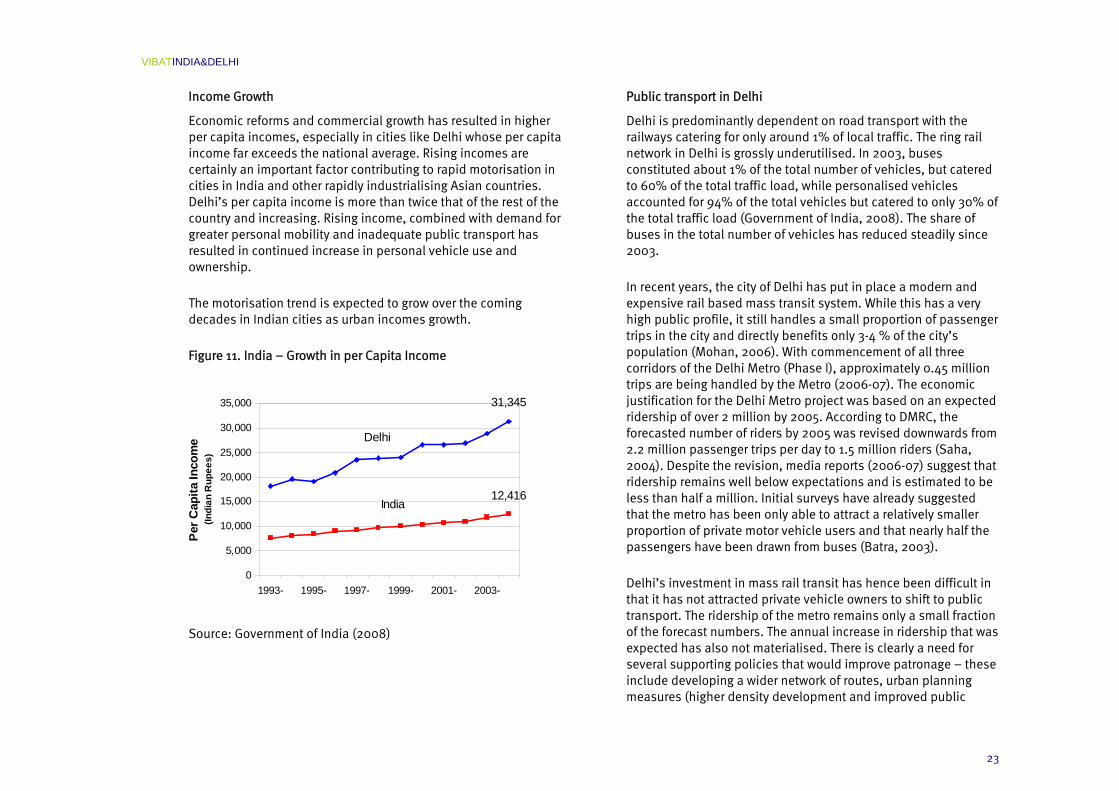
Economic reforms and commercial growth has resulted in higher per capita incomes, especially in cities like Delhi whose per capita income far exceeds the national average. Rising incomes are certainly an important factor contributing to rapid motorisation in cities in India and other rapidly industrialising Asian countries. Delhi’s per capita income is more than twice that of the rest of the country and increasing. Rising income, combined with demand for greater personal mobility and inadequate public transport has resulted in continued increase in personal vehicle use and ownership.
The motorisation trend is expected to grow over the coming decades in Indian cities as urban incomes growth.
Figure 11. India – Growth in per Capita Income
Source: Government of India (2008)
Public transport in Delhi
Delhi is predominantly dependent on road transport with the railways catering for only around 1% of local traffic. The ring rail network in Delhi is grossly underutilised. In 2003, buses constituted about 1% of the total number of vehicles, but catered to 60% of the total traffic load, while personalised vehicles accounted for 94% of the total vehicles but catered to only 30% of the total traffic load (Government of India, 2008). The share of buses in the total number of vehicles has reduced steadily since 2003.
In recent years, the city of Delhi has put in place a modern and expensive rail based mass transit system. While this has a very high public profile, it still handles a small proportion of passenger trips in the city and directly benefits only 3-4 % of the city’s population (Mohan, 2006). With commencement of all three corridors of the Delhi Metro (Phase I), approximately 0.45 million trips are being handled by the Metro (2006-07). The economic justification for the Delhi Metro project was based on an expected ridership of over 2 million by 2005. According to DMRC, the forecasted number of riders by 2005 was revised downwards from 2.2 million passenger trips per day to 1.5 million riders (Saha, 2004). Despite the revision, media reports (2006-07) suggest that ridership remains well below expectations and is estimated to be less than half a million. Initial surveys have already suggested that the metro has been only able to attract a relatively smaller proportion of private motor vehicle users and that nearly half the passengers have been drawn from buses (Batra, 2003).
Delhi’s investment in mass rail transit has hence been difficult in that it has not attracted private vehicle owners to shift to public transport. The ridership of the metro remains only a small fraction of the forecast numbers. The annual increase in ridership that was expected has also not materialised. There is clearly a need for several supporting policies that would improve patronage – these include developing a wider network of routes, urban planning measures (higher density development and improved public
31,345
Delhi
India12,416
0
5,000
10,000
15,000
20,000
25,000
30,000
35,000
1993- 1995- 1997- 1999- 2001- 2003-
Per C
apita
Inco
me
(Indi
an R
upee
s)

VIBATINDIA&DELHI
24
realm around interchanges) and integrated transport measures (a bus feeder system that supports use of the Metro system) . In the Business as Usual scenario discussed later, the mode of share of the Metro has been assumed to be low; less than 1 % of total passenger kilometres.
Figure 12. Delhi Metro - Completed Lines (2008)
Table 2. Delhi Metro – Completed Line Lengths (2008)
Section Length (km)
1. Delhi University –Central Section 11
2. Shahdara-Rithala 22
3. Indraprastha-Barakhambha Road, Dwarka
26
4. Dwarka sub-city (Dwarka-Dwarka Sector VI
7
Current Total 65
Complete Project (2010) 186
The cost of the first phase of the project, originally estimated to cost Rs.4,860 crore (April 1996 prices), was later revised and completed by March 2006 at an estimated cost of 10,571 crore ($2.6 billion)4 . There are important lessons to be learnt therefore in the development of mega transport projects such as the Delhi Metro. These types of major public transport projects are critical in megacities such as Delhi, however their delivery needs to be well planned and well integrated with other transport planning and urban planning issues.
Bus rapid transit (BRT) can be a more cost effective mass transit solution for large, sprawling urban areas. BRT has been implemented successfully in several cities around the world. For example, Seoul in South Korea successfully launched a BRT system in 2004. This has reduced travel times on the BRT corridor by a factor of five and has led to 11% increase in public transport use and reduced traffic accidents by 27% in its first year of operation (Litman, 2007). Where it is effectively implemented, BRT can significantly improve transit service and increase transit ridership, particularly under congested urban conditions, although there is still debate as to how BRT compares with rail transit service.
The city of Delhi has started to implement a BRT project over certain corridors and has recently commenced operations on one
4 Assuming that 1$ is equal to Rs.40
Line 1: Completed 2004
Line 2: Completed 2005
Line 3: Completed 2005
Central Business District (CBD) of Delhi

VIBATINDIA&DELHI
25
section. The system has met with strong criticism from different groups partly owing to the accidents that have occurred, due to poor enforcement, unclear signage and very little public outreach. There is also a need to integrate the BRT corridors with other transport modes in Delhi, particularly with the metro rail system.
Benchmarking Delhi’s Position
It is useful to compare Delhi’s position against other countries using certain demographic and travel indicators (Figures 13-14). For example:
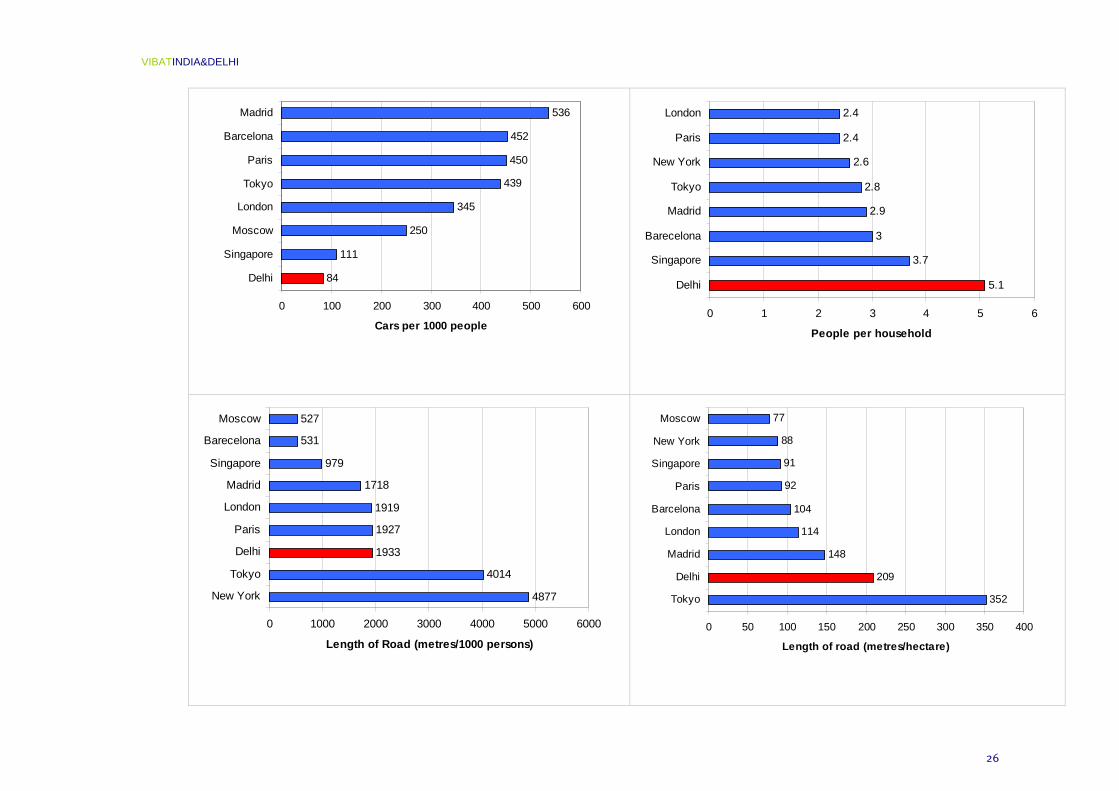
Density of population (defined as number of persons living per sq. kilometre): according to the 2001 census, the density of population in Delhi was estimated as 9,300 persons per km2 relative to 6,352 persons per km2 in 1991 (Government of India, 2008). Density of population at the India national level has been estimated as 324 persons per km2 in 2001. The density of population in Delhi is the highest among all states and unions in India.
Household size: Delhi has a high average number of persons per household at over 5. London and Paris, for example, have smaller average households at around 2.4 inhabitants. Low average persons per household tend to be associated with higher income levels, hence longer travel distances and greater car mode share.
Vehicle ownership: Delhi has one of the highest car ownership levels in the country. However when compared to other cities of the developed countries, it can be seen that the car ownership is still low.
Road network: Delhi has a road network of 30,923 kms in 2006-2007. Assuming the population of Delhi as approximately 16 million in the same year, the road length per 1,000 people works out to 1,933 metres. This
is high even compared to the cities in the developed world.
Figure 13. Delhi and Relative Population Densities
Note: Data for Delhi is based on the figures provided by Department of Transport, Delhi. Data for other cities is based on the report on World Cities (CfIT, 2005).
The urbanised area is a better measure of the built up area, i.e. represents metropolitan area without agricultural land, forest, large parks and bodies of water.
8387
4438
645
7974
845 916
46122386
9294
19,710
8,585
14,626
4,762
9,353 8,768
13,957
5,907
1,804
0
5000
10000
15000
20000
25000
Barcelona Madrid New York Singapore Delhi
Pop/
Km
sq.
Metropolitan areaUrbanized area
VIBATINDIA&DELHI
26
84
111
250
345
439
450
452
536
0 100 200 300 400 500 600
Delhi
Singapore
Moscow
London
Tokyo
Paris
Barcelona
Madrid
Cars per 1000 people
5.1
3.7
3
2.9
2.8
2.6
2.4
2.4
0 1 2 3 4 5 6
Delhi
Singapore
Barecelona
Madrid
Tokyo
New York
Paris
London
People per household
4877
4014
1933
1927
1919
1718
979
531
527
0 1000 2000 3000 4000 5000 6000
New York
Tokyo
Delhi
Paris
London
Madrid
Singapore
Barecelona
Moscow
Length of Road (metres/1000 persons)
352
209
148
114
104
92
91
88
77
0 50 100 150 200 250 300 350 400
Tokyo
Delhi
Madrid
London
Barcelona
Paris
Singapore
New York
Moscow
Length of road (metres/hectare)
VIBATINDIA&DELHI
27
2.4 Summary of the Key Trends The most important trends in India are therefore of rapid population growth, increasing urbanisation, growing per capita incomes and rising motorisation. As Indian cities grow in population, they are also sprawling outwards. The lack of effective urban planning strategy or control is resulting in low density development which is associated with an increase in the number and length of trips. For most Indians this forces an increased reliance on motorised transport. Cars and motorcycles are increasingly necessary to get around.
Public transport is impossible to deliver effectively with such a dispersed urban structure. The result is that public transport services are usually unsatisfactory. The bus service in most cities tends to be slow, unreliable and overcrowded, compelling many middle class Indians to shift to private transport. Moreover rising incomes among the Indian middle and upper classes have made cars and motorcycle ownership increasingly affordable. In the years to come, the following trends are expected to gain momentum:
Rapid increase in private vehicle ownership;
Decrease in modal share of public transport;
Reduction in the trips made by non-motorised modes (walking and cycling).
The motorisation trend itself is dominated by the following preferences amongst consumers:
High specification cars, including SUVs;
Diesel 4 wheelers;
Motorcycles in the two wheeler segment.
Finally, the launch of the low cost car market is likely to be a significant milestone in India’s motorisation. The basic Nano is aimed at people in India looking to buy their first car and has the potential to revolutionise the modal choices of millions of people. Many of these trends are working against carbon efficiency in the transport sector.
VIBATINDIA&DELHI
28
3 Baseline and BAU Projections
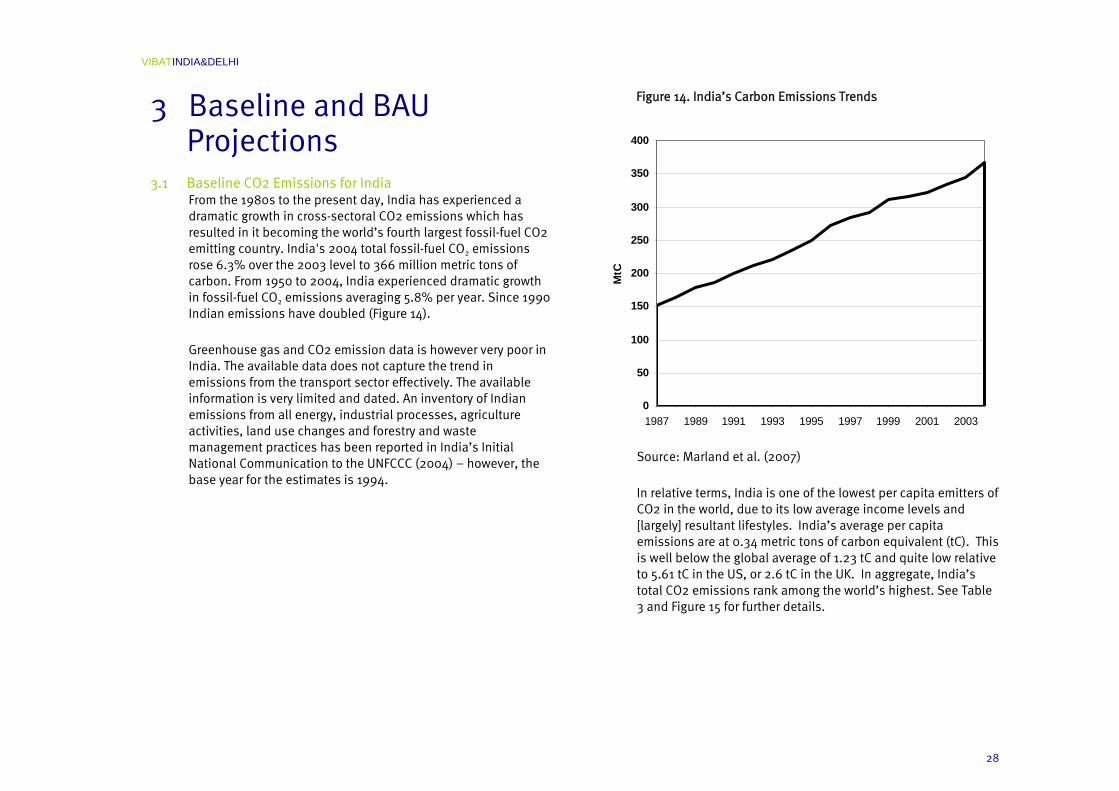
3.1 Baseline CO2 Emissions for India From the 1980s to the present day, India has experienced a dramatic growth in cross-sectoral CO2 emissions which has resulted in it becoming the world’s fourth largest fossil-fuel CO2 emitting country. India's 2004 total fossil-fuel CO2 emissions rose 6.3% over the 2003 level to 366 million metric tons of carbon. From 1950 to 2004, India experienced dramatic growth in fossil-fuel CO2 emissions averaging 5.8% per year. Since 1990 Indian emissions have doubled (Figure 14).
Greenhouse gas and CO2 emission data is however very poor in India. The available data does not capture the trend in emissions from the transport sector effectively. The available information is very limited and dated. An inventory of Indian emissions from all energy, industrial processes, agriculture activities, land use changes and forestry and waste management practices has been reported in India’s Initial National Communication to the UNFCCC (2004) – however, the base year for the estimates is 1994.
Figure 14. India’s Carbon Emissions Trends
Source: Marland et al. (2007)
In relative terms, India is one of the lowest per capita emitters of CO2 in the world, due to its low average income levels and [largely] resultant lifestyles. India’s average per capita emissions are at 0.34 metric tons of carbon equivalent (tC). This is well below the global average of 1.23 tC and quite low relative to 5.61 tC in the US, or 2.6 tC in the UK. In aggregate, India’s total CO2 emissions rank among the world’s highest. See Table 3 and Figure 15 for further details.
0
50
100
150
200
250
300
350
400
1987 1989 1991 1993 1995 1997 1999 2001 2003
MtC

VIBATINDIA&DELHI
29
Table 3. Relative Global CO2 Emissions (2004)
Country Aggregate CO2
emissions (million
metric tons of CO2)
Aggregate CO2
emissions (million
metric tons of Carbon)
Per capita CO2
emissions (metric tons
of CO2)
Per capita CO2
emissions (metric tons of Carbon)
United States
6,056 1,650 20.59 5.61
China 5,015 1,367 3.85 1.05
Russian Federation
1,527 416 10.61 2.89
India 1,344 366 1.25 0.34
Japan 1,259 343 9.87 2.69
UK 577 157 9.55 2.60
Australia 407 111 20.24 5.51
Brazil 361 98 1.94 0.53
Argentina 147 40 3.71 1.01
United Arab Emirates
138 38 33.73 9.19
World 28,192 7682 4.37 1.19
Source: Marland et al (2007) and United Nations (2005)
As in all South Asian and South-East Asian countries, India's growing transport sector, which relies on fossil fuels, is a key contributor to CO2 emissions. This is largely due to the vehicle population. In India this is growing at 15 % per annum, whereas in many developed countries the rate is 1-4 %.
VIBATINDIA&DELHI
30
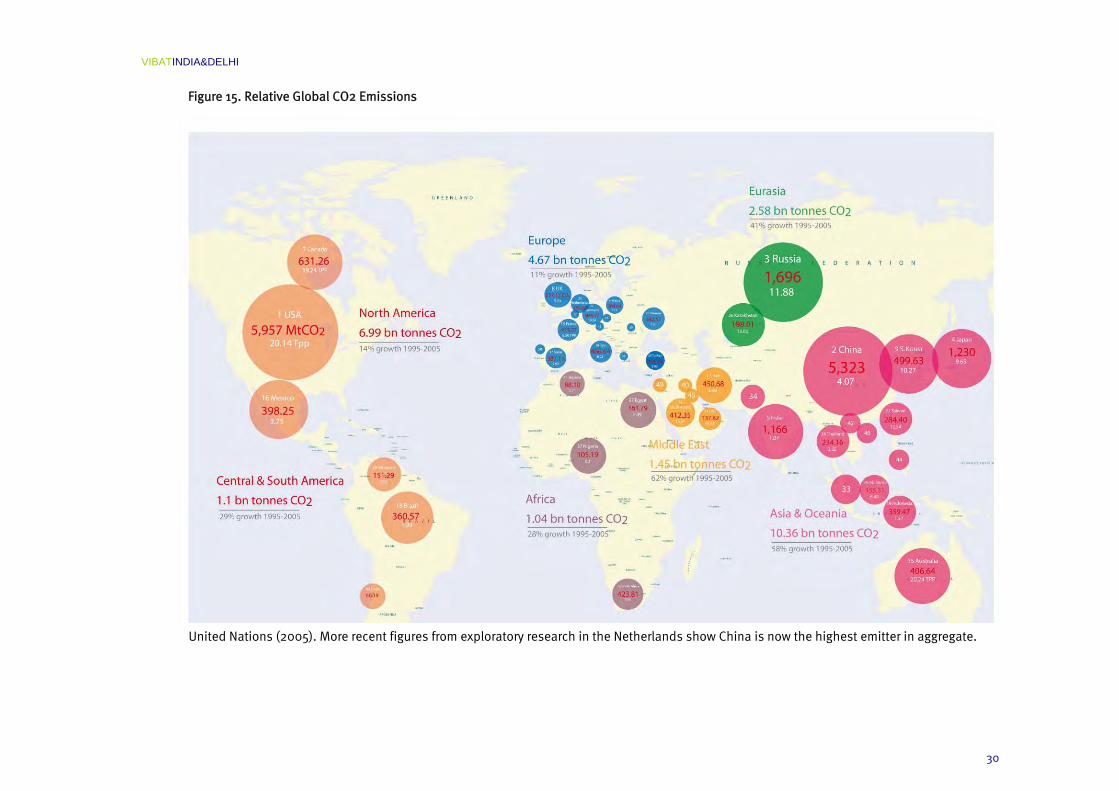
Figure 15. Relative Global CO2 Emissions
United Nations (2005). More recent figures from exploratory research in the Netherlands show China is now the highest emitter in aggregate.
VIBATINDIA&DELHI
31
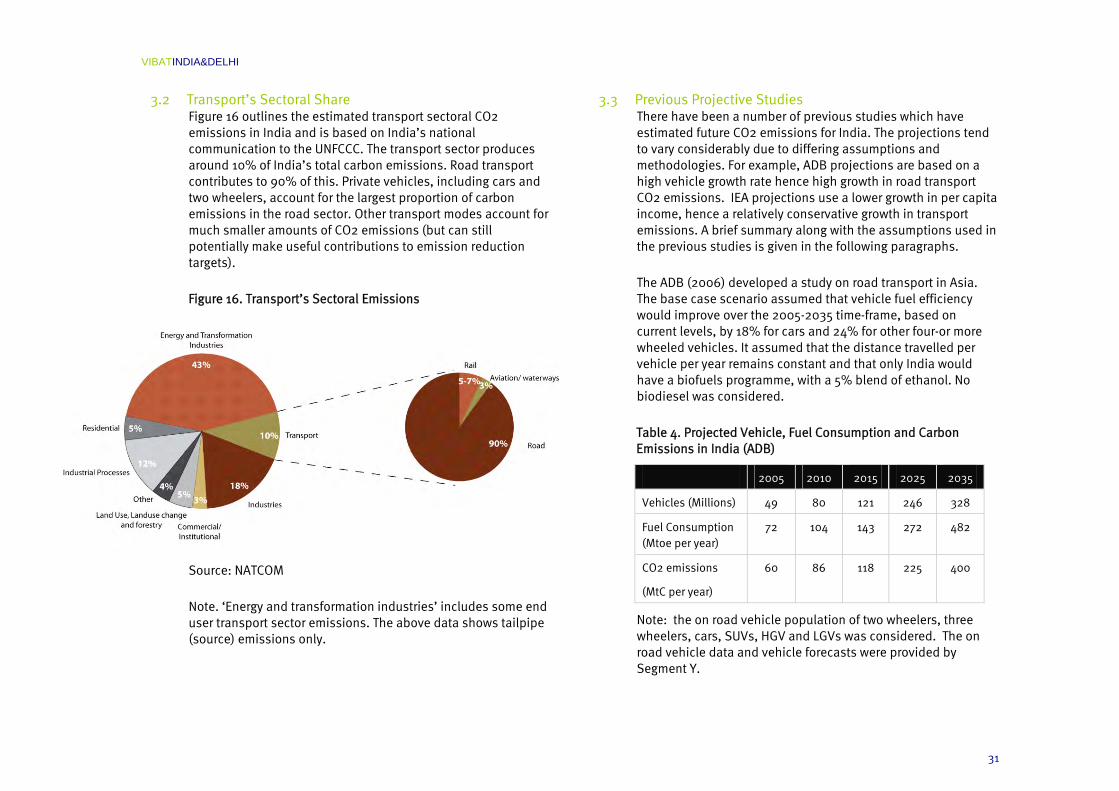
3.2 Transport’s Sectoral Share Figure 16 outlines the estimated transport sectoral CO2 emissions in India and is based on India’s national communication to the UNFCCC. The transport sector produces around 10% of India’s total carbon emissions. Road transport contributes to 90% of this. Private vehicles, including cars and two wheelers, account for the largest proportion of carbon emissions in the road sector. Other transport modes account for much smaller amounts of CO2 emissions (but can still potentially make useful contributions to emission reduction targets).
Figure 16. Transport’s Sectoral Emissions
Source: NATCOM
Note. ‘Energy and transformation industries’ includes some end user transport sector emissions. The above data shows tailpipe (source) emissions only.
3.3 Previous Projective Studies There have been a number of previous studies which have estimated future CO2 emissions for India. The projections tend to vary considerably due to differing assumptions and methodologies. For example, ADB projections are based on a high vehicle growth rate hence high growth in road transport CO2 emissions. IEA projections use a lower growth in per capita income, hence a relatively conservative growth in transport emissions. A brief summary along with the assumptions used in the previous studies is given in the following paragraphs.
The ADB (2006) developed a study on road transport in Asia. The base case scenario assumed that vehicle fuel efficiency would improve over the 2005-2035 time-frame, based on current levels, by 18% for cars and 24% for other four-or more wheeled vehicles. It assumed that the distance travelled per vehicle per year remains constant and that only India would have a biofuels programme, with a 5% blend of ethanol. No biodiesel was considered.
Table 4. Projected Vehicle, Fuel Consumption and Carbon Emissions in India (ADB)
2005 2010 2015 2025 2035
Vehicles (Millions) 49 80 121 246 328
Fuel Consumption (Mtoe per year)
72 104 143 272 482
CO2 emissions
(MtC per year)
60 86 118 225 400
Note: the on road vehicle population of two wheelers, three wheelers, cars, SUVs, HGV and LGVs was considered. The on road vehicle data and vehicle forecasts were provided by Segment Y.

VIBATINDIA&DELHI
32
An earlier study by the Indian Institute of Technology, Kanpur (IITK, Singh, 2006) used a slightly different methodology to estimate the baseline scenario for energy and emissions. This study focused on land based passenger transportation in India up to 2020-2021. In the Business As Usual (BAU) scenario, the 2020–2021 CO2 intensities of all ground transport modes, except rail, are assumed to remain at 2000–2001 levels. The study uses per capita GDP as the main explanatory variable to project future passenger mobility in India. Passenger mobility is expected to increase slowly at the lowest income levels, and then more rapidly as income rises and finally slow down as saturation is approached. The graph of passenger mobility per capita against GDP per capita is therefore expected to look like an S-shaped curve. The study concludes that the level of CO2 emissions from passenger transportation in India will increase at the rate of around 7% per year from 2000–2001 to 2020–2021.
Table 5. Projected Land Based Passenger Transport CO2 Emissions in India (IITK)
2000-01 2020-21 2030
CO2 emissions, MtC per year
20 93 183*
Source: (IITK, Singh, 2006)
Note: Private and para transit modes (car, two wheelers and auto rickshaw), bus and rail emissions have been considered. Emissions for 2030 have been extrapolated assuming a growth rate of 7 %.
The International Energy Agency (IEA, 2004) has also developed a reference case scenario for India. This indicates a lower potential level of growth in the transport sector. The research assumes that transport emissions are approximately 9% of the total CO2 emissions and that this proportion remains broadly constant over time.
Table 6. Projected Transport CO2 Emissions in India (IEA)
2002 2010 2020 2030
Transport CO2 emissions MtC per year
26 32 43 55
Total CO2 emissions (MtC per year)
277 344 467 614
Figure 17. Sectoral Transport Emissions
IEA (2004)
This study projects that India’s road transport carbon emissions would reach 235 MtC by 2030. This is relative to ADB’s previous estimate of 400 MtC which included freight and projected to 2035. This study does not include emissions from freight road transport and projects to 2030.
9.25 9.42 9.16 8.92
0
2
4
6
8
10
12
14
2002 2010 2020 2030
Tran
spor
t em
issi
ons
as %
of T
otal
emis
sion
s

VIBATINDIA&DELHI
33
3.4 A Baseline and Business as Usual Projection From the range of previous estimated baselines and projections available we can see there remains some considerable uncertainty in terms of robust data. [The consolation here, in terms of considering policy levers available to reduce transport CO2 emissions, is that all projections imply a very large growth in transport CO2 emissions – hence the exact baseline will not greatly alter the policy prescription or the need to move quickly in implementation].
This study develops a business as usual (BAU) projection based on the previous work available and by extrapolating existing growth rates and trends. The baseline and projections within this scoping study have been developed using the Long Range Energy Alternatives Planning (LEAP) software5, as developed by the Stockholm Environment Institute (SEI). LEAP can be used to develop transport energy demand and CO2 emission scenarios. It requires a local database to populate the LEAP framework software. Annex 2 provides a background note on the use of LEAP.
India
Vehicle Ownership
Vehicle ownership in India is expected to dramatically increase. The growth rates are projected to be sustained in the short term and then gradually reduce as the vehicle ownership rates match those of the other wealthier nations in Asia.
5 See www.energycommunity.org. As developed by SEI, Boston, US.
Table 7. BAU Vehicle Population Projections (Million) – India
2004 2010 2015 2020 2025 2030
Cars 7.1 12.5 24.1 49.5 92.7 152
SUVs 0.6 2.5 5.5 10.5 19.5 34.2
Two Wheelers
42.6 81.8 136 195 238 261
Three wheelers
2.4 4.6 6.8 9.2 11.6 14
Bus 0.8 1.2 1.5 1.8 2.1 2.4
Total 53.4 103 174 266 364 464
Mobility
Mobility (calculated as the distance every vehicle is driven multiplied by the number of people per vehicle or the occupancy) is projected to significantly increase by 2030 relative to present levels.
Occupancy rates are assumed to stay constant in the BAU scenario. Overall mobility levels rise significantly by the year 2030. Per capita mobility rises from a little over 3,000 kilometres to 8,500 kilometres. Automobile mobility increases the most, rising nearly five times relative to present levels.

VIBATINDIA&DELHI
34
Figure 18. BAU Mobility Projections – India
Fuel Consumption
The BAU scenario assumes that there is no improvement in the fuel economies of vehicles and no introduction of biofuels into the fuel mix. Thus BAU generates an energy demand forecast increase of ten times - to 1400 million tonnes of oil equivalent. The rising demand for energy is driven by rising vehicle numbers as well as the higher usage of cars and SUVs. The rising demand is expected to create energy security challenges for India as there are limited oil and gas resources. India already imports 70% of its crude oil requirement from the middle-east and other countries.
CO2 Emissions
The BAU scenario from passenger on road vehicles estimates that CO2 emissions will increase from present levels to 860 MtCO2 (235 MtC).
The significant growth in CO2 emissions is driven by the rapid motorisation projection. In the BAU scenario it is also assumed that that the distance travelled per vehicle increases at the rate of 1% per annum for cars and two wheelers and 2% for SUVs.
Figure 19. BAU CO2 Emission Projections - India
0
2000
4000
6000
8000
10000
2004 2030
per c
apita
pas
seng
er k
m
BusThree wheelersTwo WheelersSUVsCars
CarsSUVsTwo WheelersThree wheelersBus
Environmental Results: Global warming potential C eq
2004 2006 2008 2010 2012 2014 2016 2018 2020 2022 2024 2026 2028 2030
Mill
ion
Met
ric T
onne
s
230
220
210
200
190
180
170
160
150
140
130
120
110
100
90
80
70
60
50
40
30
20
10
0
VIBATINDIA&DELHI
35
Delhi
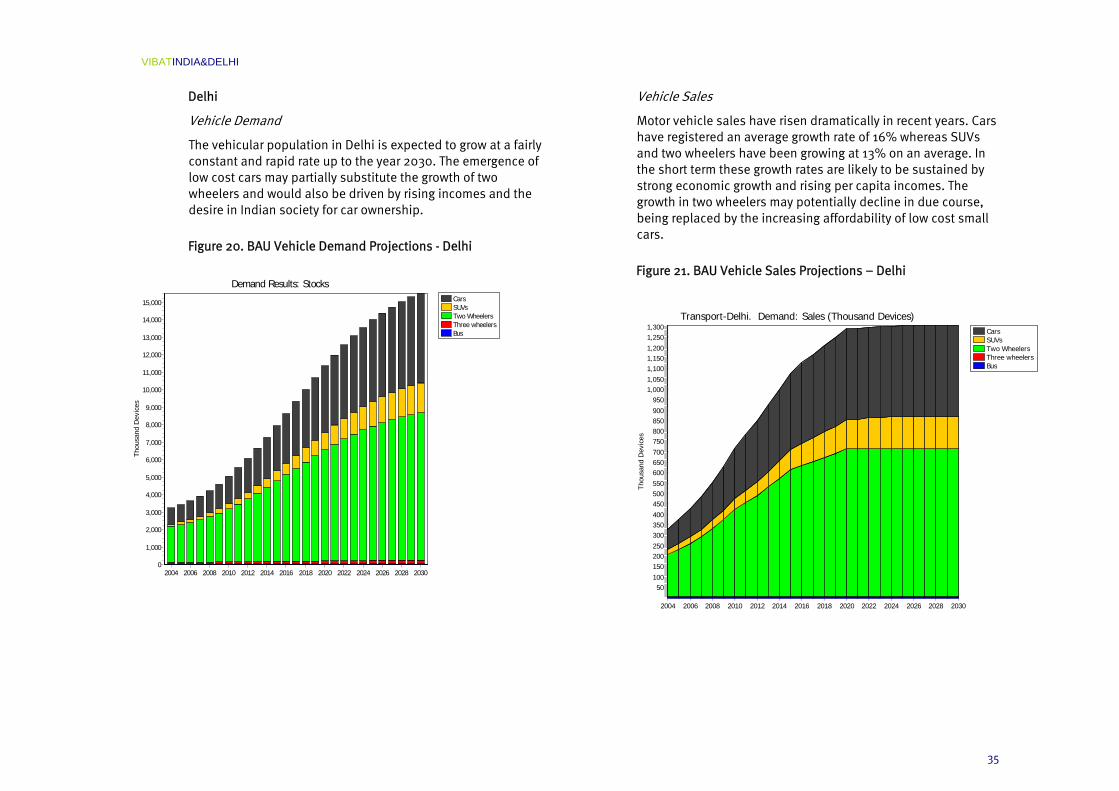
Vehicle Demand
The vehicular population in Delhi is expected to grow at a fairly constant and rapid rate up to the year 2030. The emergence of low cost cars may partially substitute the growth of two wheelers and would also be driven by rising incomes and the desire in Indian society for car ownership.
Figure 20. BAU Vehicle Demand Projections - Delhi
Vehicle Sales
Motor vehicle sales have risen dramatically in recent years. Cars have registered an average growth rate of 16% whereas SUVs and two wheelers have been growing at 13% on an average. In the short term these growth rates are likely to be sustained by strong economic growth and rising per capita incomes. The growth in two wheelers may potentially decline in due course, being replaced by the increasing affordability of low cost small cars.
Figure 21. BAU Vehicle Sales Projections – Delhi
CarsSUVsTwo WheelersThree wheelersBus
Transport-Delhi. Demand: Sales (Thousand Devices)
2004 2006 2008 2010 2012 2014 2016 2018 2020 2022 2024 2026 2028 2030
Thou
sand
Dev
ices
1,3001,2501,2001,1501,1001,0501,000
95090085080075070065060055050045040035030025020015010050
CarsSUVsTwo WheelersThree wheelersBus
Demand Results: Stocks
2004 2006 2008 2010 2012 2014 2016 2018 2020 2022 2024 2026 2028 2030
Thou
sand
Dev
ices
15,000
14,000
13,000
12,000
11,000
10,000
9,000
8,000
7,000
6,000
5,000
4,000
3,000
2,000
1,000
0
VIBATINDIA&DELHI
36
Historically, motorised two wheelers have been the dominant motorised mode. They have several advantages over other modes: they require very little parking space, are very manoeuvrable, even in congested traffic conditions, and are inexpensive relative to the car. However, in the future, as discussed previously, low cost cars, rising incomes and easily accessible credit may make small cars more popular. The growth rate of private vehicles is expected to level off once ownership levels reach that of the western world.
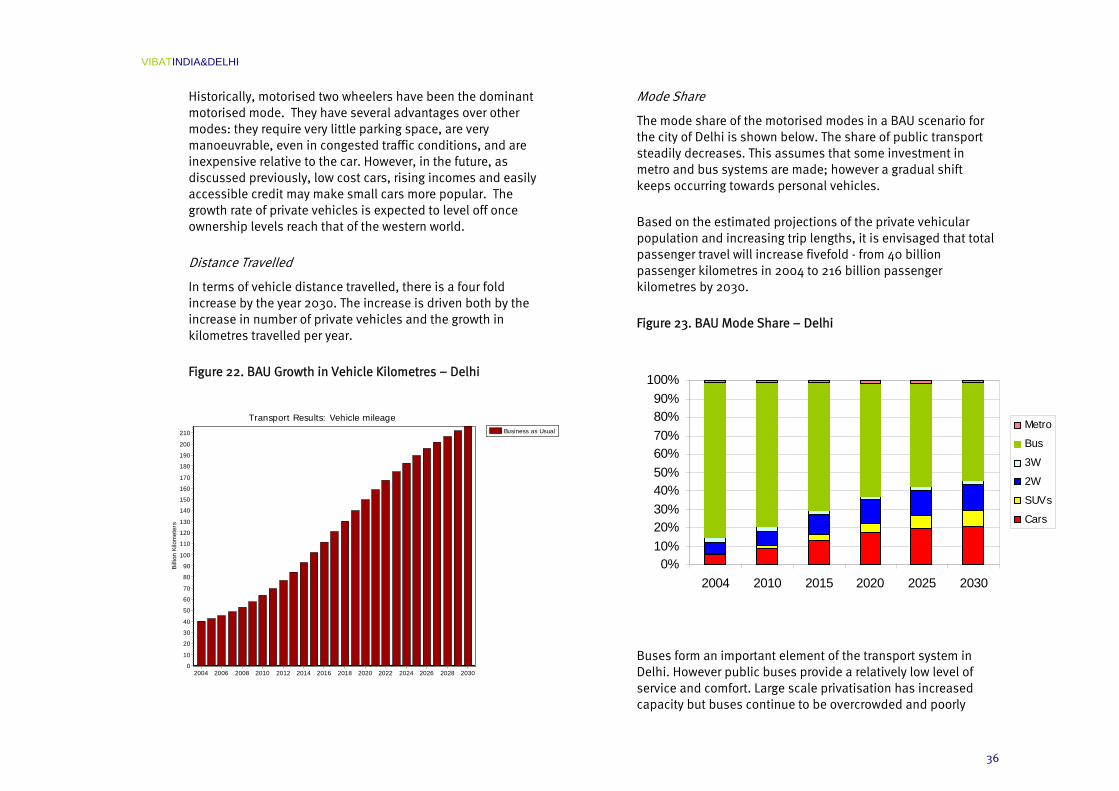
Distance Travelled
In terms of vehicle distance travelled, there is a four fold increase by the year 2030. The increase is driven both by the increase in number of private vehicles and the growth in kilometres travelled per year.
Figure 22. BAU Growth in Vehicle Kilometres – Delhi
Mode Share
The mode share of the motorised modes in a BAU scenario for the city of Delhi is shown below. The share of public transport steadily decreases. This assumes that some investment in metro and bus systems are made; however a gradual shift keeps occurring towards personal vehicles.
Based on the estimated projections of the private vehicular population and increasing trip lengths, it is envisaged that total passenger travel will increase fivefold - from 40 billion passenger kilometres in 2004 to 216 billion passenger kilometres by 2030.
Figure 23. BAU Mode Share – Delhi
Buses form an important element of the transport system in Delhi. However public buses provide a relatively low level of service and comfort. Large scale privatisation has increased capacity but buses continue to be overcrowded and poorly
Business as Usual
Transport Results: Vehicle mileage
2004 2006 2008 2010 2012 2014 2016 2018 2020 2022 2024 2026 2028 2030
Billi
on K
ilom
eter
s
210
200
190
180
170
160
150
140
130
120
110
100
90
80
70
60
50
40
30
20
10
0
0%10%20%30%40%50%60%70%80%90%
100%
2004 2010 2015 2020 2025 2030
Metro
Bus
3W
2W
SUVs
Cars

VIBATINDIA&DELHI
37
maintained. Also under a BAU scenario, buses receive no preferential treatment in terms of dedicated lanes or traffic management in Delhi. The low quality of service is expected to continue and hence result in a gradual reduction in the modal share of buses amongst the motorised modes.
CO2 Emissions
The BAU projection for CO2 emissions is based on the assumptions highlighted earlier, hence is an extrapolation of observed and emerging trends. No major new policy initiatives or public investments are considered. An increasing number of private vehicles in Delhi results in more than a three fold increase in CO2 emissions from passenger transport.
While such a dramatic increase can be expected in CO2 emissions in a BAU scenario, there is much that can be done to slow the growth in emissions. The discussion that follows will consider targets that can be applied to the India and Delhi contexts and also develop future images of the future which have the potential to alter the rapid growth trajectory of CO2 emissions.
Figure 24. BAU Projected CO2 Emissions – Delhi
CarsSUVsTwo WheelersThree wheelersBus
Environmental Results: Global warming potential C eq
2004 2006 2008 2010 2012 2014 2016 2018 2020 2022 2024 2026 2028 2030
Mill
ion
Met
ric T
onne
s
7.5
7.0
6.5
6.0
5.5
5.0
4.5
4.0
3.5
3.0
2.5
2.0
1.5
1.0
0.5
0.0

VIBATINDIA&DELHI
38
4 Targets for the Transport Sector
4.1 Contraction and Convergence Despite the seriousness of India’s projected growth in CO2 emissions and the perceived difficulties in breaking BAU trends, no serious attempt has been made to formulate targets for India’s (or Delhi’s) future transport sectoral emissions. Although starting from a low per capita base (much lower than the so-called developed countries) there is still a requirement to contribute to global CO2 emission reduction aspirations. There is also an opportunity for India to demonstrate global leadership here – to show how a low carbon economy can be developed alongside rapid economic growth.
The Global Commons Institute (2000) has devised a GHG abatement methodology based on equitable shares. This is known as ‘contraction and convergence’ (see Figure 25). The method shows a future budget of suggested CO2 emission entitlements, broadly consistent with an outcome of CO2 concentrations in the atmosphere of 450 ppm by 2100. Step 1 is that individual country emissions ‘contract’ to reduced levels; Step 2 involves a ‘convergence’ to achieve globally equitable shares per capita.
Figure 25. Contraction and Convergence (GCI)
Amended from GCI (2000)
VIBATINDIA&DELHI
39
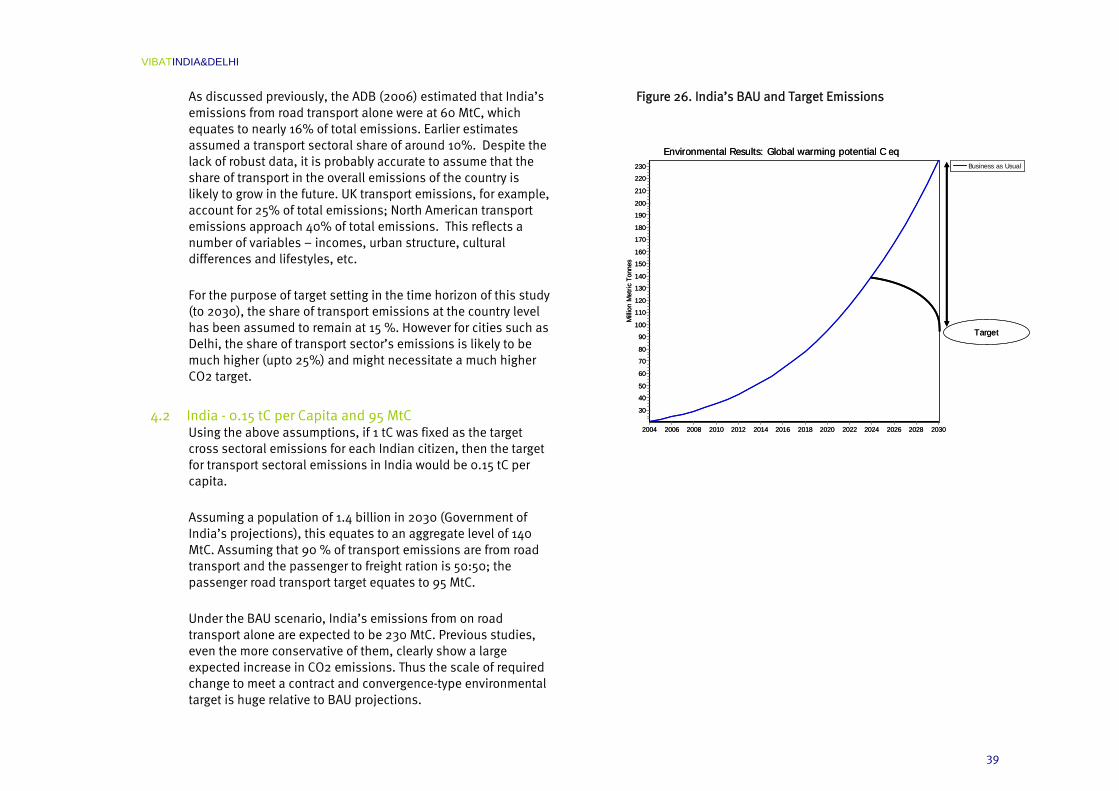
As discussed previously, the ADB (2006) estimated that India’s emissions from road transport alone were at 60 MtC, which equates to nearly 16% of total emissions. Earlier estimates assumed a transport sectoral share of around 10%. Despite the lack of robust data, it is probably accurate to assume that the share of transport in the overall emissions of the country is likely to grow in the future. UK transport emissions, for example, account for 25% of total emissions; North American transport emissions approach 40% of total emissions. This reflects a number of variables – incomes, urban structure, cultural differences and lifestyles, etc.
For the purpose of target setting in the time horizon of this study (to 2030), the share of transport emissions at the country level has been assumed to remain at 15 %. However for cities such as Delhi, the share of transport sector’s emissions is likely to be much higher (upto 25%) and might necessitate a much higher CO2 target.
4.2 India - 0.15 tC per Capita and 95 MtC Using the above assumptions, if 1 tC was fixed as the target cross sectoral emissions for each Indian citizen, then the target for transport sectoral emissions in India would be 0.15 tC per capita.
Assuming a population of 1.4 billion in 2030 (Government of India’s projections), this equates to an aggregate level of 140 MtC. Assuming that 90 % of transport emissions are from road transport and the passenger to freight ration is 50:50; the passenger road transport target equates to 95 MtC.
Under the BAU scenario, India’s emissions from on road transport alone are expected to be 230 MtC. Previous studies, even the more conservative of them, clearly show a large expected increase in CO2 emissions. Thus the scale of required change to meet a contract and convergence-type environmental target is huge relative to BAU projections.
Figure 26. India’s BAU and Target Emissions
Business as Usual
Environmental Results: Global warming potential C eq
2004 2006 2008 2010 2012 2014 2016 2018 2020 2022 2024 2026 2028 2030
Mill
ion
Met
ric T
onne
s
230
220
210
200
190
180
170
160
150
140
130
120
110
100
90
80
70
60
50
40
30
Target
Business as Usual
Environmental Results: Global warming potential C eq
2004 2006 2008 2010 2012 2014 2016 2018 2020 2022 2024 2026 2028 2030
Mill
ion
Met
ric T
onne
s
230
220
210
200
190
180
170
160
150
140
130
120
110
100
90
80
70
60
50
40
30
Target
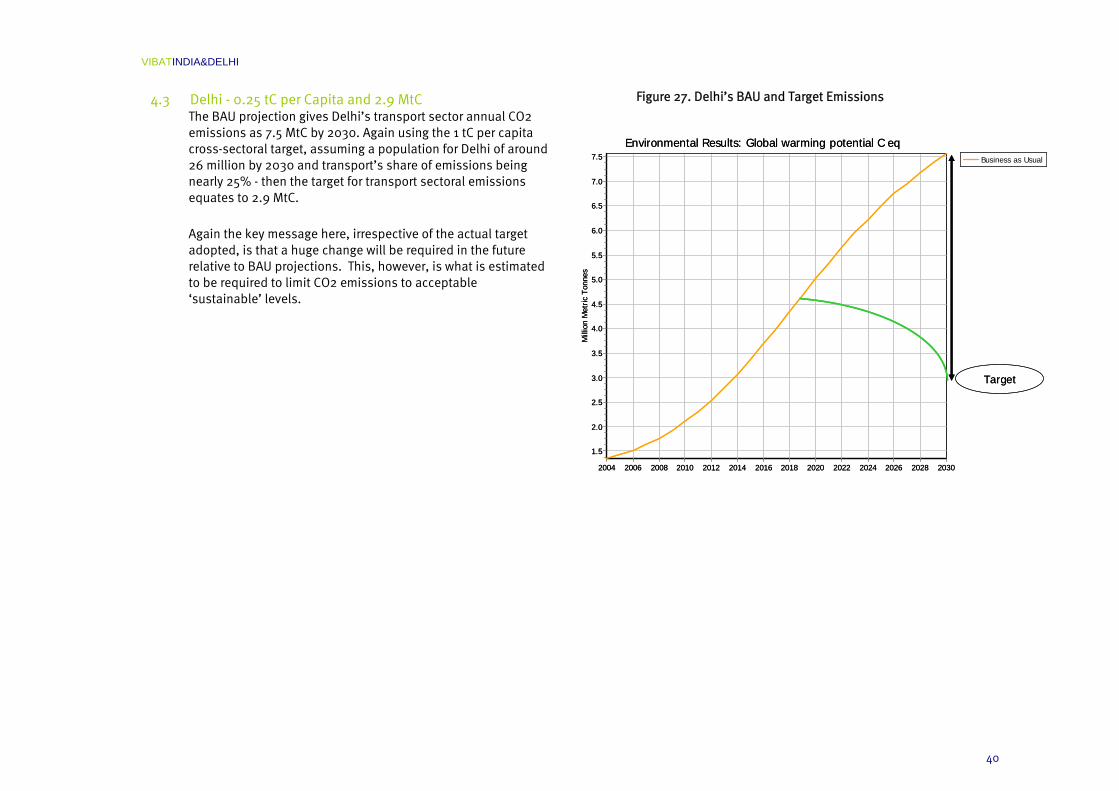
VIBATINDIA&DELHI
40
4.3 Delhi - 0.25 tC per Capita and 2.9 MtC The BAU projection gives Delhi’s transport sector annual CO2 emissions as 7.5 MtC by 2030. Again using the 1 tC per capita cross-sectoral target, assuming a population for Delhi of around 26 million by 2030 and transport’s share of emissions being nearly 25% - then the target for transport sectoral emissions equates to 2.9 MtC.
Again the key message here, irrespective of the actual target adopted, is that a huge change will be required in the future relative to BAU projections. This, however, is what is estimated to be required to limit CO2 emissions to acceptable ‘sustainable’ levels.
Figure 27. Delhi’s BAU and Target Emissions
Business as Usual
Environmental Results: Global warming potential C eq
2004 2006 2008 2010 2012 2014 2016 2018 2020 2022 2024 2026 2028 2030
Mill
ion
Met
ric T
onne
s
7.5
7.0
6.5
6.0
5.5
5.0
4.5
4.0
3.5
3.0
2.5
2.0
1.5
Target
Business as Usual
Environmental Results: Global warming potential C eq
2004 2006 2008 2010 2012 2014 2016 2018 2020 2022 2024 2026 2028 2030
Mill
ion
Met
ric T
onne
s
7.5
7.0
6.5
6.0
5.5
5.0
4.5
4.0
3.5
3.0
2.5
2.0
1.5
Target

VIBATINDIA&DELHI
41
4.4 Conclusions India, in some respects, is in an enviable position in terms of meeting likely future CO2 reduction targets. The country and its cities are moving from a very low per capita base; hence there is much scope to move to a carbon efficient way of life before oil-based consumerism and behaviour takes hold and becomes entrenched. The likelihood is that the high emitting countries (the US, Canada, some Middle Eastern countries, and Europe) are going to experience the most difficulties in achieving cuts in CO2 emissions. This should not mean that India delays action. The opportunity is there to show the world what a low carbon society looks like and that it is compatible with a higher quality of life than present day levels.
Table 8 illustrates the target setting process that has been adopted and the various assumptions made. The assumptions can be altered to reflect different perceptions or sensitivities.
Table 8. Passenger Road Transport Targets for India and Delhi
Even if the contract and convergence regime proves too idealistic (and unimplementable), then even a 2 tC per capita target for India would be very difficult to achieve. The logical position here is therefore to adopt a 1 tC target as the “stretch target” and monitor progress against this. Progress should also be appraised against a basket of indicators, including CO2 emissions, but also wider sustainability (environmental, social and economic) aspirations and quality of life goals. It would not be wise to achieve CO2 reduction targets at the cost of quality of life goals.
VIBATINDIA&DELHI
42
5 Images of the Future 5.1 Likely Strategic Futures
There are a huge range of future trajectories for India’s and Delhi’s future transport strategy and likely impacts in terms of CO2 emissions. Within this scoping study, we consider two likely potential futures as archetypical “images of the future”.
There are many available technologies and behaviour change strategies that have the potential to reduce CO2 emissions within the transport sector. These can have different impacts over the short, medium and long terms. These strategies are used to build the images of the future. Two different scenarios are developed to move towards the policy targets. These scenarios are possible solutions to perceived problems and are designed to initiate discussion. Each scenario takes on a different emphasis:
Scenario 1: “Perpetual Motion” (Strong Technological Change) – this scenario is based on a very strong and successful push on technological innovation. It includes many technologically innovative policy levers - all aimed at reducing transport sectoral emissions. Policy measures include low emission vehicles, alternative fuels and potentially some information and communication technologies (ICT) which can help reduce emissions.
Scenario 2: “Optimised Balance” (Realistic Technological and Behaviour Change) – this scenario assumes a greater balance of effort across technological and behavioural policy packages. It still relies on some technological change, but assumes a less successful implementation trajectory. The scenario assumes a strong, complementary behavioural change perspective. Policy measures include pricing, urban planning policies, etc.
5.2 Scenario 1: “Perpetual Motion” The low carbon technology image assumes that private vehicular traffic continues to grow with trip lengths increasing and occupancy levels remaining the same. The reduction in emissions is a result of a radical introduction of low carbon technologies that reduce emissions without restricting the rise in travel. These technologies include the following:
Hybrid vehicle technology for cars and SUVs – this technology can significantly lower the average emissions profile of the car stock. In the Indian context, this technology is still novel and expensive, but globally hybrid cars are available [they are not yet marketed at competitive prices or sold on a mass scale]. This scenario assumes a rapidly rising share of hybrid vehicle sales.
Improved fuel economy standards – the motor vehicles (four wheel or more) being sold in India today are not particularly fuel efficient by international standards. This is partly owing to the lack of a regulatory standard in the country. This scenario assumes the imposition of stringent mandatory standards which would gradually be improved over time.
Electric two wheelers – this technology can be highly beneficial for reducing CO2 emissions (as well as local air pollutants like particulates).
Biofuels – this scenario assumes a rising share of biofuels in the fuel mix for all vehicles. The blend of biofuels in both diesel and petrol will rise gradually, reaching a level of 30% by the year 2030. The Government of India has already introduced a programme of 5% ethanol in petrol and this scenario assumes that the programme would be developed further, along the lines of Brazil and Europe.

VIBATINDIA&DELHI
43
An important issue, if considering well-to-wheel emissions (rather than tailpipe), is the electricity generating mix for India. Since this is likely to be dominated by coal, electric two wheelers (and other vehicles) are not actually a very effective CO2 mitigation strategy unless alternative fuelled electricity becomes more predominant in future years. In this scenario, a low share of 10% of sales has been assumed, along with the premise that the electricity for powering these vehicles will be generated through renewables.
Table 9. Scenario 1 Key Characteristics
Indicator or Measure Characteristics of Change Headline Indicators
Transport CO2 emissions aspiration CO2 emissions are reduced through technological change; mobility is not affected Annual vehicle usage increases at 2% for cars, SUVs and 2 wheelers
Personal travel
Private vehicle occupancy levels remain constant Car ownership increases, car based lifestyles and saturation of ownership
Cars and SUV stock increases 8 per 1000 people to 133 per 1000 people
Car ownership/mode share
Lock in to cars and 2 wheelers dependency
Technological Change Smaller cars like the Nano are dominant
Hybrid cars have an increasing proportion of sales rising to 50% of car sales by 2030 Fuel economy of cars is steadily improved
Vehicle technologies
Electric two wheelers form 10% of the sales amongst two wheelers Electricity for charging 2 wheelers
generated through renewables
Vehicle fuels Alternate fuel blends (biofuels) are used in increasing proportions, rising to 30% by 2030
Behavioural Change
Personal travel behaviour Limited investment and mode shifts to public transport, cycling and walking. Increased car dependent lifestyles
Urban planning Continued urban sprawl. Little strategic thought behind integration of land use planning and transport
Soft factors Low take up of car sharing and travel planning. Teleshopping, flexible working etc. remain marginal activities
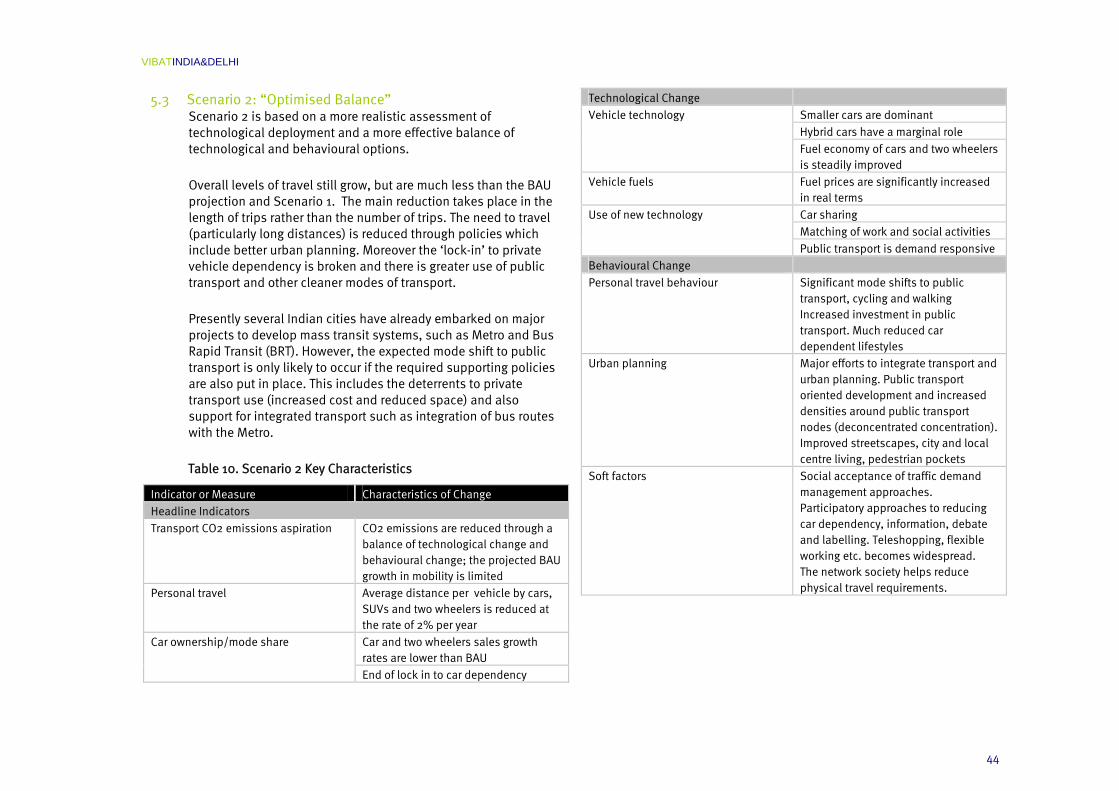
VIBATINDIA&DELHI
44
5.3 Scenario 2: “Optimised Balance” Scenario 2 is based on a more realistic assessment of technological deployment and a more effective balance of technological and behavioural options.
Overall levels of travel still grow, but are much less than the BAU projection and Scenario 1. The main reduction takes place in the length of trips rather than the number of trips. The need to travel (particularly long distances) is reduced through policies which include better urban planning. Moreover the ‘lock-in’ to private vehicle dependency is broken and there is greater use of public transport and other cleaner modes of transport.
Presently several Indian cities have already embarked on major projects to develop mass transit systems, such as Metro and Bus Rapid Transit (BRT). However, the expected mode shift to public transport is only likely to occur if the required supporting policies are also put in place. This includes the deterrents to private transport use (increased cost and reduced space) and also support for integrated transport such as integration of bus routes with the Metro.
Table 10. Scenario 2 Key Characteristics
Indicator or Measure Characteristics of Change Headline Indicators
Transport CO2 emissions aspiration CO2 emissions are reduced through a balance of technological change and behavioural change; the projected BAU growth in mobility is limited
Personal travel Average distance per vehicle by cars, SUVs and two wheelers is reduced at the rate of 2% per year
Car and two wheelers sales growth rates are lower than BAU
Car ownership/mode share
End of lock in to car dependency
Technological Change
Smaller cars are dominant Hybrid cars have a marginal role
Vehicle technology
Fuel economy of cars and two wheelers is steadily improved
Vehicle fuels Fuel prices are significantly increased in real terms
Car sharing Matching of work and social activities
Use of new technology
Public transport is demand responsive Behavioural Change
Personal travel behaviour Significant mode shifts to public transport, cycling and walking Increased investment in public transport. Much reduced car dependent lifestyles
Urban planning Major efforts to integrate transport and urban planning. Public transport oriented development and increased densities around public transport nodes (deconcentrated concentration). Improved streetscapes, city and local centre living, pedestrian pockets
Soft factors Social acceptance of traffic demand management approaches. Participatory approaches to reducing car dependency, information, debate and labelling. Teleshopping, flexible working etc. becomes widespread. The network society helps reduce physical travel requirements.
VIBATINDIA&DELHI
45
5.4 Policy Measures and Packages There are a range of policy measures available to help achieve the images of the future and move towards emissions targets. Policy measures are also most likely to be effective when bundled together into policy packages, each of which consists of several policy measures.
A long list of potential policy measures that are available to reduce CO2 emissions are given in the Annex. Example policy packages are given below. More analysis is required as to the likely make up and effectiveness of these in the Indian context. This should also include the cost and time estimates needed to develop each package and this could form part of a larger, more detailed study. Since this was a limited scoping study, no detailed discussion was held with policy makers and government officials in order to ascertain the efficacy of these policy packages in the Indian context. Policy packages and impacts will also vary by city/region and hence different cities in India may require a different set of policy packages. The description below simply gives an initial indication of likely coverage and potential. [Note. Not all of these policy packages have been reflected in the scenario testing that follows in the next chapter].
Policy Package 1: Low Emission Vehicles
This policy package aims to substantially improve the efficiency of vehicles by reducing fuel consumption and consequently CO2 emissions. Presently, hybrid vehicles have significantly lower emissions than conventional internal combustion vehicles. Hence one possibility is to give sufficient encouragement and support for the introduction of hybrid vehicles, so that by 2030 a high proportion (around 90 %) of sales are of hybrid vehicles. These hybrid vehicles could be powered by diesel or petrol, or even alternative fuels.
There are several technology options that have the potential to neutralise or minimise the effect of increasing volumes of
vehicular traffic on emissions. Hybrid vehicles combine a small internal combustion engine with an electric motor and battery to reduce fuel consumption and tailpipe emissions. Energy lost during braking can also be captured and returned to the battery in a process called “regenerative braking”. Unlike other electric vehicles, hybrids have the distinct advantage that they do not need to be “plugged-in” to the electric supply. They also have a much larger range – with the ability to run on the diesel or petrol engine. Hybrid engines hence operate more efficiently and produce fewer emissions than conventional engines. The Toyota Prius, for example, emits 104 g/km, compared to a petrol comparator which would emit around 150-180 g/km depending on specification.
The Honda Company plans to introduce a hybrid version of its Civic Sedan in India. Because of the low volume of these cars, Honda makes its hybrid cars only in Japan (Ramakrishnan, 2007). Therefore under the present Indian policy regime, with import duties on cars of over 100%, hybrid cars will remain relatively expensive. The high import duty would mean that a hybrid Civic would cost twice as much as a petrol engine Civic does (even if they were produced at the same basic cost). Hence in the short run, hybrids are unlikely to achieve a significant share of the market, unless the Government policy is changed to support hybrids through lower duties and other incentives. An early incentive might be to link import tax levels to emissions, i.e. low emission vehicles are subject to less import tax.
An Indian company, Mahindra Industries will be launching a hybrid version of its popular SUV in 2008-2009. Apart from cars and SUVs, some Indian companies are also working on introducing hybrids in other vehicle types. For example, TVS is currently working on a prototype three-wheeler with hybrid propulsion, Ashok Leyland has built a range extender hybrid truck prototype and Bajaj Auto is working on a hybrid three wheeler.
The motor industry would favour government support in a variety of forms in order to make hybrid technology a commercially viable

VIBATINDIA&DELHI
46
option and for attracting more players for investing in this technology (SIAM, 2008). Government support could be in terms of purchase subsidy to consumer; exemption, or reduction in excise duty on vehicles and its components; exemption or reduction in customs duty on imported components; or exemption from sales tax and road tax. The Government could also consider mandating use of hybrid vehicles in regions, certain cities or parts of cities. In the 2008-2009 budget, the Indian Finance Minister has proposed that excise duty on hybrid cars will be lowered to 14% from the current 24%. This is small step in making hybrid cars more viable in India. The CO2 emission profile of some popular cars and SUVs available in India is given below.
Lean burn technologies6 offer large potential in India, particularly with the current small car sizes on the market. Acceleration and performance is lost in lean burn engines, but this may be less of an issue with the use of smaller cars in congested Indian cities.
6 An engine in a traditional vehicle is sized for providing the power desired for
acceleration, but usually operates well below this point in normal steady-speed
operation. Ordinarily, the power is cut by partially closing the throttle. However,
the extra work done in pumping air through the throttle reduces efficiency. If the
fuel/air ratio is reduced, then lower power can be achieved with the throttle closer
to fully open, and the efficiency during normal driving (below the maximum torque
capability of the engine) can be higher. Lean burn mode is therefore a way to
reduce the usual throttling losses.
Table 11. CO2 Emission Profile for Selected Vehicles
Cost Passenger Car Model Emissions (gCO2/km) Rs (1000) $
Available in India
Mitsubishi Lancer (Diesel) 2.0l
118 865 21,625
Hyundai Santro 1.1l 134 348 8,700
Maruti (Euro 2) 800cc 141 219 5,475
Ford Ikon Diesel 1.6l 147 587 14,675
Indica Diesel (Euro 2) 1.4l 149 410 10,250
Maruti Zen (Euro 2) 1.0l 150 338 8,450
Mitsubishi Lancer 1.46l 153 766 19,150
Indica (Euro 2) Petrol 1.4l 155 355 8,875
Hyundai Accent 1.6l 159 650 16,250
Honda Siel EXI 1.3l 181 688 17,200
Ford Ikon Petrol 1.3l 181 511 12,775
Opel Corsa 1.4l 193 461 11,525
Toyota Qualis Euro 2 2.4l 199 770 19,250
Mercedes E240 1.8l 256 4,000 100,000
Wider Market (e.g. European)
G-Wiz AC Electric 0 584 14,598
Toyota Prius, Petrol Electric Hybrid, 1.5l
104 1,600 40,000
Honda Civic, Petrol Electric Hybrid, 1.3l
109 1,520 38,000
Vauxhall Corsa, Diesel, 1.3l DTi
115 752 18,810
Ford Focus, Petrol, 1.6l. 162 1,600 40,000
Lexus Petrol Hybrid SUV, RX 400h
191 3,621 90,516
BMW 3-series, Petrol, 2.0l 196 2,002 50,040

VIBATINDIA&DELHI
47
Cost Passenger Car Model Emissions (gCO2/km) Rs (1000) $
Land Rover Discovery, Petrol, 4.4l
354 3,520 88,000
Ferrari Superamerica 499 15,280 382,000
Note. European models use UK prices.
Diesel cars account for approximately 30% of the sales presently and this is expected to rise to 50% by 2010. The rising share of diesel vehicles can make a contribution to lowering CO2 emissions. The benefits however may be offset by higher particulate emissions unless the pollutants are filtered by efficient catalytic converters and other technologies.
Electric vehicles would also play a small but significant role in certain areas. These vehicles would be small and very clean. Ideally the energy source for the electricity would have to come from renewable sources in order to reduce the CO2 content of the electricity.
In India there is only one electric two wheeler model available for sale. The Bangalore based company Ekovehicles is marketing these vehicles but there is no support yet from the government to encourage rapid commercialization of this technology.
This is a technology which has found an expanding market in China. China has reached nearly one million electric two wheelers, including electric bikes, in 2005. The exponential increase in the sales of electric bikes in China is a result of legislation banning gasoline-fuelled scooters and bicycles in several major Chinese cities.
Main Measures
Strong incentives to the automobile industry to increase the availability of hybrid cars;
Research and development into hybrid technology in order to commence indigenous production of hybrid cars and SUVs;
Initiate a system of vehicle taxation based on the emissions profile of cars;
Raise awareness regarding emission profiles and start the labelling of vehicles;

VIBATINDIA&DELHI
48
Honda Civic - Hybrid Mahindra – a Hybrid SUV
Tata Indica – a typical small car in India Electric two wheelers
VIBATINDIA&DELHI
49
Policy Package 2: Alternative Fuels
This package is complementary to policy package 1 (low emission vehicles) and is designed to reduce the carbon content of the fuels being used. It includes the use of biofuels and renewables. There are many possible alternative fuels on the market, many of which have lower carbon content than petrol and diesel. Below we consider the two with most potential in India:
Ethanol: an alcohol, can be produced by the fermentation of sugar cane.
Biodiesel: produced by reacting vegetable or animal fats with methanol or ethanol to produce a lower viscosity fuel that is similar in physical characteristics to diesel.
Ethanol and biodiesel reduced CO2 emissions per litre by 20-50% compared with petrol and diesel on a well-to-wheels basis. Biodiesel can be blended with diesel and ethanol with petrol. A higher proportion of blending may necessitate some minor modifications to engines and fuel systems.
In 2003 a policy directive from the Government of India, stated that petrol sold in the nine states of India should introduce a 5% blend of ethanol. The impetus for ethanol blending in petrol came from concerns regarding energy security and the political need to support local farmers. Unreliable supplies and fluctuating prices however, affected the programme. The steep procurement prices, driven partly by a poor sugarcane crop in 2004, compelled some oil companies to import cheaper ethanol in order to meet the mandatory government requirement. At the present time, the future of the programme is uncertain and its future success hinges on developing alternate sources of ethanol.
In India, another biofuel (biodiesel) is being considered as a substitute to petro diesel. Biodiesel is mostly produced from natural vegetable oils. In Europe, rapeseed oil is used, whereas in the US soya is more popular, and in South East Asia palm oil.
India is the world’s largest importer of edible oil and imports represent about 55% of India’s edible oil consumption and about half the value of its total agricultural imports (Dohlman et al, 2003). Hence, unlike the US or Europe, it cannot use edible oil to produce biodiesel. In India biodiesel can only be produced from non-edible oil sources. Moreover only those plants are suitable which can be grown on non-cropped marginal or wastelands. There are as many as 75 identified plants which contain 30% or more oil and which can be exploited for producing biodiesel (Azam et al., 2005).
International experience suggests that mass market implementation of biofuels is difficult. There is considerable controversy over lifecycle CO2 emissions (the CO2 emitted through the use of fertilisers, in the transport of fuels and in the emissions of nitrous oxides offsets the CO2 reduction potential of the biofuel), and also the potential land take (mass market application would require vast amounts of land take, with potential knock on impacts for soil erosion, biodiversity, deforestation and food supply shortages). Second generation biofuels may prove more effective in the long run, these include non-food crops such as waste biomass, synthetic biofuels (from plastics) and shrubs (Jatropha).Third generation biofuels include algae fuel, potentially generated using alga culture and algae farms. Again, moving beyond nice supply is likely to be difficult.
In India, a particular plant species called Jatropha curcas is particularly favoured by Indian agricultural scientists as the ideal crop for producing biodiesel in India. Jatropha curcas is a drought resistant species which is widely cultivated in the tropics as a living fence (Henning, 2005). Jatropha can thrive under a variety of geo-climatic conditions, and has a low gestation period and high seed yield. Jatropha's ability to grow on marginal, waste or arid land and produce energy crops without displacing food crops is perhaps of most potential importance to developing countries such as India.

VIBATINDIA&DELHI
50
Main Measures
Research and development into the most appropriate alternative fuels for use in India
Strong incentives to the automobile industry to increase the use of alternative fuels
Development of appropriate fuelling facilities
Tax incentives to encourage purchase of clean vehicles with alternative fuel technology
Policy Package 3: Pricing Regimes
Increasing the price of car-based travel in India would be difficult to implement in social/equity terms. However this policy lever is one of the ways in which decision making can be influenced and behaviour change achieved. The congestion charge in London and carbon tax in British Colombia, Canada, are examples of making petrol, car-based travel more unattractive. Ideally pricing is linked to the emissions profile of the vehicle – this might include both CO2 emissions and local pollutants. The charging could feasibly also be related to usage/occupancy.
The combination of emissions pricing and the available of clean vehicles should provide the incentives to people to switch to cleaner vehicles and also reduce unnecessary car-based travel.
This policy package has not been considered in the modelling carried out in this scoping study (there are issues with price elasticities here which would require further work in the Indian context).
Policy Package 4: Public Transport
Public transport is a key policy package in providing an alternative, more carbon efficient means of travel. In India, most public transport services are of poor quality - crowded, undependable, slow and inconvenient, uncoordinated and often dangerous. Several Indian cities already have plans for extensive investment in the public transport system. Delhi, for example, is building a Metro and bus rapid transit.
Main Measures
Public transport investment in new routes and network capacity - National Rail, Metro/Underground, light transit, tram and bus, including more efficient vehicles;
New innovative forms of demand responsive public transport technology and services;
Fare level changes and other wider measures to increase patronage (information and marketing).
Policy Package 5: Walking and Cycling
Non motorised transport is an integral element of urban transport in Indian cities. More than 50% of the city residents cannot afford any other mode of transport unless heavily subsidised. Despite this, investment for pedestrian and cycling infrastructure is traditionally low relative to other modes. The streets of Indian cities need to be made more amenable, attractive and safe in design terms to encourage pedestrian and cycle use.
Major deterrents to cycling include unhealthy, unpleasant and dangerous traffic conditions; unsuitable road design and a lack of secure cycle parking. Conditions must be improved to ensure that routes are fit for cycling – safe, convenient and pleasant.
VIBATINDIA&DELHI
51
Main Measures
Improved walking and cycling facilities – to encourage more walking and cycling, incentives are required for people to modify their journey patterns and to make shorter trips by making sure facilities (shops, schools, post offices and banks) are close to where people live. Micro level policies such as maintenance policies for walking routes, ensuring pavements are in good state of repair and removing street clutter, obstructions, etc. are also important.
Policy Package 6: Integrated Urban Planning
Urban spatial structure, at the strategic and local scales, can be extremely influential in determining the main characteristics of travel – the numbers of trips made, journey lengths and mode share. Urban structure thus provides the basic rationale for travel (and consequently CO2 emissions), alongside wider influences such as socio-economic and attitudinal/cultural characteristics.
Despite this, urban planning is often underplayed as a tool in traffic demand management strategies. This package aims at improving the urban design such that dependence on private vehicles is reduced. Effective land use planning helps to create mixed use areas, better conditions for walking, cycling and public transport.
Main Measures
Strategic urban planning and design focused on reducing the need to travel;
Public transport orientated development, high density clusters around interchanges, decentralised concentration in larger cities, mixed uses, neighbourhood services;
Upgrading of local urban facilities, amenities and recreational areas;
Environmental zones reserved for clean vehicles;
Improved conditions for walking, cycling and public transport use, with integration between modes and street design.
Policy Package 7: Information and Communication Technologies (ICT)
Broadband communication now allows many activities to be carried out electronically, potentially replacing the need for physical travel. It is likely that most households/workplaces/public spaces in urban India will have access to the high speed internet over the next couple of decades. This offers substantial potential for fundamentally changing the way in which many activities are carried out. The likelihood is that travel behaviour will adapt (with more and hugely changed interaction) rather than simple substitution effects. The aggregate CO2 reduction potential is therefore likely to be minimal. The development of a network society (Castells, 2000) is likely to massively change communication and interaction.
Main Measures
Encouragement of the use of the internet and mobile technology to help reduce travel frequency and distance;
Involvement of industry in looking at ways to use the technology creatively to reduce the overall level of transport activity;
Awareness raising campaigns to inform users about the potential benefits.

VIBATINDIA&DELHI
52
This policy package has not been considered in the modelling carried out in this scoping study.
Policy Package 8: Soft Measures
Soft measures typically involve interventions that influence travel demand such as travel plans (workplace, school, residential and other), personalised travel plans, car clubs and car sharing schemes, home shopping and travel awareness campaigns. Cairns et al (2004) have carried out some analysis on the likely impacts of these measures in the UK.
Workplace travel plans, for example, are typically a package of measures put in place by an employer to encourage more sustainable travel and less private vehicle use, particularly less single occupancy car use. Travel plans primarily aim to address the commuting habits of employees, although many also incorporate measures aimed at travel during the course of work, including business and delivery travel, and also travel by patients, students, shoppers, tourists, or other visitors to the employer’s site. Travel plans work best when combined with infrastructure measures, support and advice and information.
A school travel plan performs a similar role, but for a different location. It encompasses all the issues relevant to journeys to and from the school and includes concerns about safety and health, and proposals for ways to make improvements. School travel plans result in recommendations for small-scale engineering works (e.g. pedestrian crossing, cycle lanes, cycle parking etc) and softer measures (‘walking bus’ and increased public transport services).
A critical point is the need for supportive hard infrastructure measures, including investment in public transport, walking and cycling. There may be difficulties in “locking in” the benefits of traffic reduction – induced traffic may result in some people choosing to drive more. Hence, as in all the policy packages, a combined strategy is most effective.
There may also be issues in terms of mass market take up. Those who are most receptive to behavioural change, e.g. the “environmentally aware”, are likely to be attracted to these types of initiatives. There is also likely to be a cohort of people, e.g. the “car dependents”, who will not be attracted by these initiatives.
Main Measures
Soft measures – including travel plans, car clubs, information about public transport.
This policy package has not been considered in the modelling carried out in this scoping study.
Policy Package 9: Ecological Driving and Slower Speeds
Much of conventional thinking in transport is designed to speed traffic up as congestion and delay are seen as “wasted” time, resulting in loss of time that could be productively used on other activities. Much of the current appraisal process for major transport projects is based on time savings potential. More recently, it has been demonstrated that lower speed limits, and less lane switching, can allow traffic to flow more smoothly, thereby increasing capacity. In the UK, for example, there has also been a clear move towards lowering speed limits in residential areas (home zones) and in other locations (e.g. around schools), where priority has been reallocated to people. Lower speed limits can have major safety benefits.
Driving style also impacts on CO2 emissions. An innovative driving programme in the Netherlands promotes driving styles that help reduce emissions. The following techniques are advised:
Driving at moderate speeds (e.g. in the 30 to 80 kph range);

VIBATINDIA&DELHI
53
Avoiding excessive acceleration and harsh braking;
Observing motorway speed limits;
Starting the engine without using the accelerator;
Changing up through the gears at relatively low engine revolutions;
Driving in the highest comfortable gear at any given speed;
Controlled use of the accelerator.
Main Measures
Slower speed limits on arterial/radial routes;
Ecological driving skills.
This policy package has not been considered in the modelling carried out in this scoping study.
Policy Package 10: Long Distance Travel Substitution
There is potential for some CO2 emission reduction impacts by the substitution of long distance travel (air and car-based) by more fuel efficient modes. This includes high speed train (HST) networks and long distance coach.
Rail has the potential to offer a serious alternative to air travel over distances of around 300-500km. The considerable potential brought by HST on a limited number of routes, together with faster services on existing infrastructure, technical harmonisation, organisational cooperation and strongly improved conditions for competition, means that there is considerable scope for long-
distance rail-air substitution and even co-operation. Europe is a good example here in developing a long distance HST network as a competitor to the short haul air market. There are few such plans in India as yet – the Indian Ministry of Railway’s is considering the Delhi-Amritsar route as the first potential HST corridor in India and is being advised by the French National railways (SNCF). This policy package has not been considered in the modelling carried out in this scoping study.
Policy Package 11: Freight Transport
The freight sector has a major role to play in helping to reduce transport sector CO2 emissions. There are a number of ways to reduce freight CO2 emissions – improve load factors, reduce empty running, change mode and improve fuel efficiency. McKinnon (2007) gives a good overview of the UK situation. This policy package has not been considered in the modelling carried out in this scoping study. The study considers only passenger transport.
Policy Package 12: Air Travel Reduction
The rapid increase in domestic and international air travel within India (and across the world), including passenger and air freight transport, causes particular concern for CO2 emissions. The share of air transport is still low in terms of emissions, but growth rates are much above those of other modes. Also air transport is operating with a type of 'extraterritorial' status, being exempted from taxes that in national contexts are often charged to other modes.
Long range air leisure travel and freight transport are growing at a high speed on the basis of the present cost situation. As increasingly important economic structures are relying on cheap air transport, attempts to internalise at least a part of the considerable externalities will become increasingly difficult (yet important) in future years. Individuals are also becoming used to the availability of relatively inexpensive, long and short-haul flights.
VIBATINDIA&DELHI
54
Main Measures
Air travel substitutions: including tax on air and fuel, linking airports with the rail network to allow substitution of air by rail, demonstration of teleconferencing facilities, promotion of local destinations for leisure and tourist travel.
This policy package has not been considered in the modelling carried out in this scoping study. The study considers only passenger domestic travel.

VIBATINDIA&DELHI
55
6 Initial Scenario Testing 6.1 Introduction
Initial scenario testing has been carried in this scoping study, mainly to test whether the backcasting methodology and LEAP modelling framework is applicable and useable in the Indian (and wider Asian) context, at the national and city scales.
The scenario testing is carried out for both images of the future, and at the Indian and Delhi scales.
6.2 Scenario 1 “Perpetual Motion” Assumptions Scenario 1 “Perpetual Motion” Technological Change is driven by the economy making a successful transition to a technology-led society. It is assumed that there is a rapid infusion of new technology, strongly supported by government policies.
The main aim of transport and technological innovation policy is to achieve the required CO2 emissions target with a minimum of change in terms of traffic growth and behaviour. Car traffic grows and dominates in terms of modal share, with trip lengths increasing and occupancy levels remaining the same. The main changes are in hybrid technology and alternative fuel penetration. Average fuel economy reduces markedly so that the total emissions from the passenger vehicle stock reduces by nearly 30% in 2030 when compared to the BAU scenario.
The technological focus thus reduces emission markedly relative to the projected BAU. The results illustrate, however, that much of the technological gain is offset by the projected increase in travel. To achieve a stringent target such as 0.15 tC per capita/95 MtC in India and 0.25 MtC/2.9 MtC in Delhi in the transport sector requires more than a technological focus.
The assumptions within the scenario testing are that hybrid technology is steadily introduced over the next 25 years so that by 2030 50 % of all-new cars and SUVs sales are hybrid.
Figure 28. Projected Sales of Hybrid Cars
Hybrid technology is also further improved in order to provide higher fuel economy and lower CO2 emissions. A similar effort is made with conventional internal combustions engines also resulting in significant improvements in fuel efficiency and reduction in CO2 emissions. There is also considerable investment in alternative fuels to reduce the CO2 emissions of conventional vehicles and also of the non-electric parts of the hybrids.
Two wheelers continue to form a large part of the private vehicle fleet but the gasoline two wheelers are gradually replaced with electric two wheelers. The electricity for powering these vehicles is generated through renewable sources like solar PV.
Inter na l com bus tio n engineHybrid
Tran sport-De lh i. Cars: S ales Share (% sh are)
2004 2006 2008 2010 2012 2014 2016 2018 2020 2022 2024 2026 2028 2030
% s
hare
1 00
95
90
85
80
75
70
65
60
55
50
45
40
35
30
25
20
15
10
5
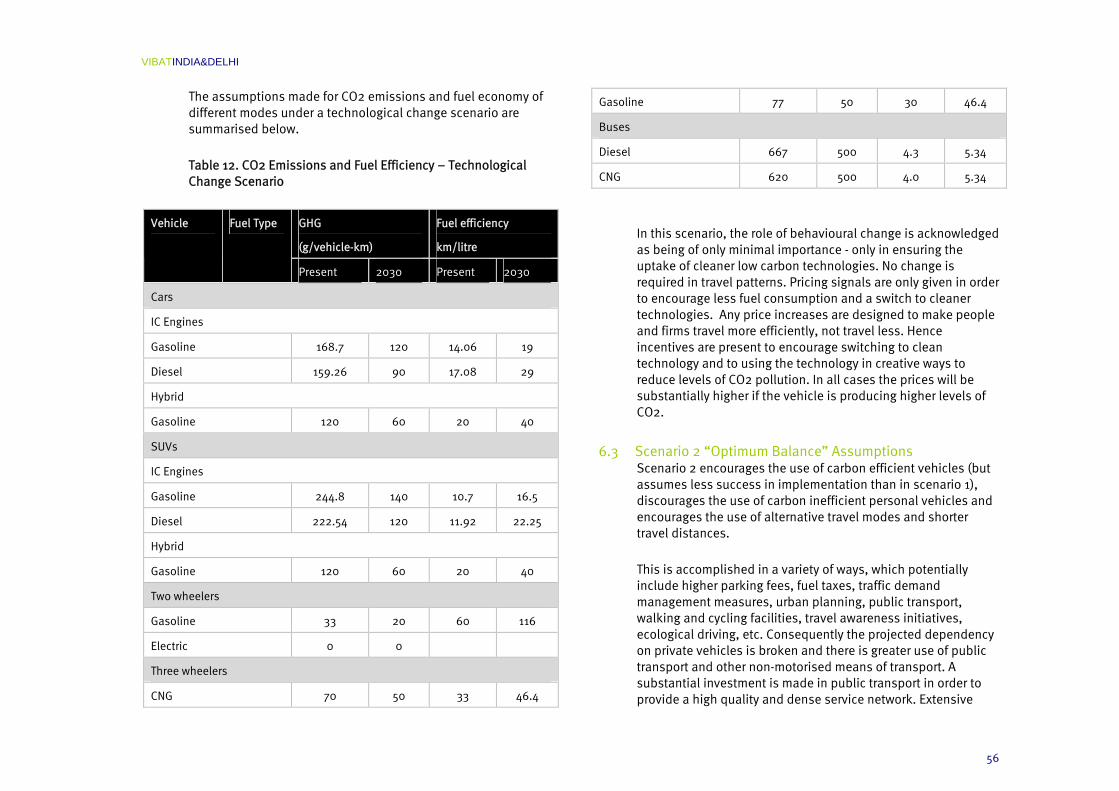
VIBATINDIA&DELHI
56
The assumptions made for CO2 emissions and fuel economy of different modes under a technological change scenario are summarised below.
Table 12. CO2 Emissions and Fuel Efficiency – Technological Change Scenario
GHG
(g/vehicle-km)
Fuel efficiency
km/litre
Vehicle Fuel Type
Present 2030 Present 2030
Cars
IC Engines
Gasoline 168.7 120 14.06 19
Diesel 159.26 90 17.08 29
Hybrid
Gasoline 120 60 20 40
SUVs
IC Engines
Gasoline 244.8 140 10.7 16.5
Diesel 222.54 120 11.92 22.25
Hybrid
Gasoline 120 60 20 40
Two wheelers
Gasoline 33 20 60 116
Electric 0 0
Three wheelers
CNG 70 50 33 46.4
Gasoline 77 50 30 46.4
Buses
Diesel 667 500 4.3 5.34
CNG 620 500 4.0 5.34
In this scenario, the role of behavioural change is acknowledged as being of only minimal importance - only in ensuring the uptake of cleaner low carbon technologies. No change is required in travel patterns. Pricing signals are only given in order to encourage less fuel consumption and a switch to cleaner technologies. Any price increases are designed to make people and firms travel more efficiently, not travel less. Hence incentives are present to encourage switching to clean technology and to using the technology in creative ways to reduce levels of CO2 pollution. In all cases the prices will be substantially higher if the vehicle is producing higher levels of CO2.
6.3 Scenario 2 “Optimum Balance” Assumptions Scenario 2 encourages the use of carbon efficient vehicles (but assumes less success in implementation than in scenario 1), discourages the use of carbon inefficient personal vehicles and encourages the use of alternative travel modes and shorter travel distances.
This is accomplished in a variety of ways, which potentially include higher parking fees, fuel taxes, traffic demand management measures, urban planning, public transport, walking and cycling facilities, travel awareness initiatives, ecological driving, etc. Consequently the projected dependency on private vehicles is broken and there is greater use of public transport and other non-motorised means of transport. A substantial investment is made in public transport in order to provide a high quality and dense service network. Extensive

VIBATINDIA&DELHI
57
areas are set-aside for pedestrians and a comprehensive cycle network developed to encourage substantial growth in clean travel.
The main reduction does not take place in the number of trips made but in the length of trips. The desire for less travel is a result of greater awareness of environmental issues, increase in the cost of driving, and supply of infrastructure for modes other than cars. This includes building and maintaining sidewalks, bicycle lanes and rail and bus infrastructure. Unlike the previous image, there is less dependence on technological solutions, but motorised vehicles do become cleaner over the period.
There is a significant shift to public transport. Traffic demand management is accepted by the public as being necessary to achieve environmental targets and is perceived as helping to reduce the impact of private vehicles and improve the quality of life in cities.
Table 13. Vehicle Ownership and Mobility
Mode 2004 2010 2015 2020 2025 2030
Cars 7.1 12.5 24.1 49.5 92.7 145
SUVs 0.6 2.5 5.5 10.5 19.5 28.9
Two Wheelers
42.6 81.8 136 186 216 231
Three Wheelers
2.4 4.6 6.8 9.2 11.6 14
Bus 0.8 1.1 1.3 1.6 1.9 2.3
Total 53.4 102 174 257 342 421
Unit: vehicles/1000 people
Figure 29. Behavioural Change Scenario versus BAU
Business as UsualBehaviour
Demand Results: Stocks
2004 2006 2008 2010 2012 2014 2016 2018 2020 2022 2024 2026 2028 2030
Mill
ion
Dev
ices
460
440
420
400
380
360
340
320
300
280
260
240
220
200
180
160
140
120
100
80
60
Business as UsualBehaviour
Transport Results: Vehicle mileage
2004 2006 2008 2010 2012 2014 2016 2018 2020 2022 2024 2026 2028 2030
Billi
on K
ilom
eter
s
7,000
6,500
6,000
5,500
5,000
4,500
4,000
3,500
3,000
2,500
2,000
1,500
1,000
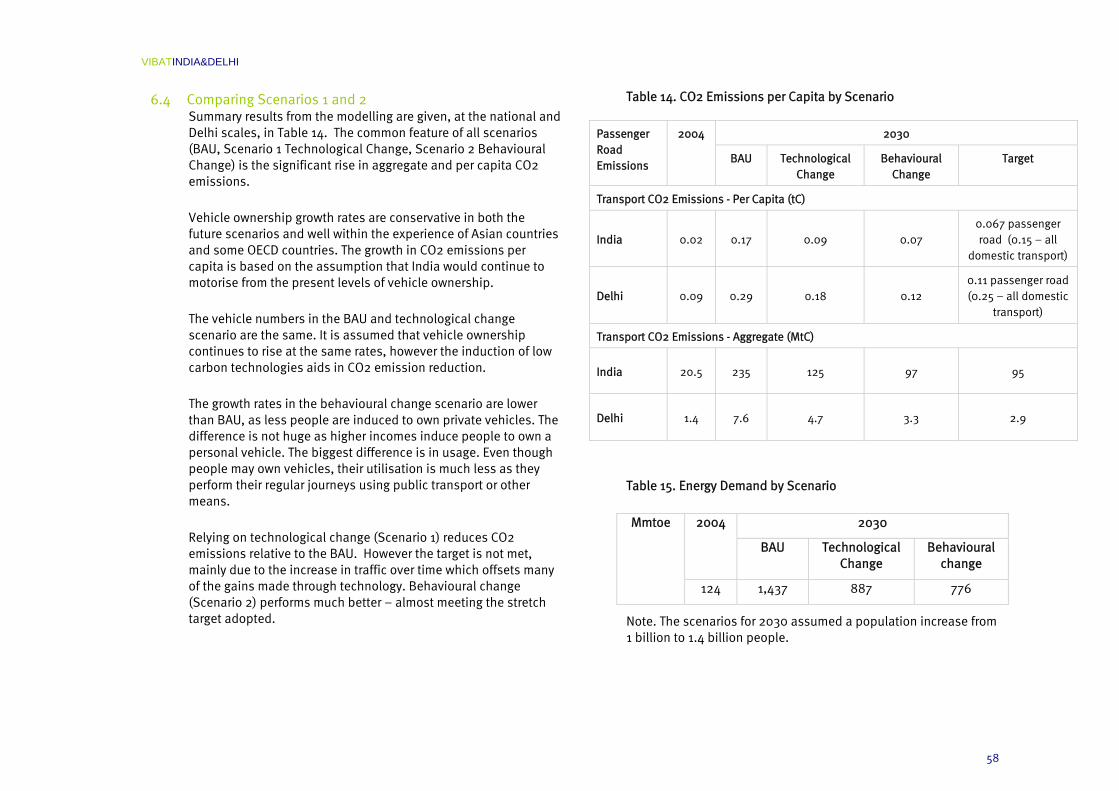
VIBATINDIA&DELHI
58
6.4 Comparing Scenarios 1 and 2 Summary results from the modelling are given, at the national and Delhi scales, in Table 14. The common feature of all scenarios (BAU, Scenario 1 Technological Change, Scenario 2 Behavioural Change) is the significant rise in aggregate and per capita CO2 emissions.
Vehicle ownership growth rates are conservative in both the future scenarios and well within the experience of Asian countries and some OECD countries. The growth in CO2 emissions per capita is based on the assumption that India would continue to motorise from the present levels of vehicle ownership.
The vehicle numbers in the BAU and technological change scenario are the same. It is assumed that vehicle ownership continues to rise at the same rates, however the induction of low carbon technologies aids in CO2 emission reduction.
The growth rates in the behavioural change scenario are lower than BAU, as less people are induced to own private vehicles. The difference is not huge as higher incomes induce people to own a personal vehicle. The biggest difference is in usage. Even though people may own vehicles, their utilisation is much less as they perform their regular journeys using public transport or other means.
Relying on technological change (Scenario 1) reduces CO2 emissions relative to the BAU. However the target is not met, mainly due to the increase in traffic over time which offsets many of the gains made through technology. Behavioural change (Scenario 2) performs much better – almost meeting the stretch target adopted.
Table 14. CO2 Emissions per Capita by Scenario
Table 15. Energy Demand by Scenario
2030 2004
BAU Technological Change
Behavioural change
Mmtoe
124 1,437 887 776
Note. The scenarios for 2030 assumed a population increase from 1 billion to 1.4 billion people.
2030 Passenger Road Emissions
2004
BAU Technological Change
Behavioural Change
Target
Transport CO2 Emissions - Per Capita (tC)
India 0.02 0.17 0.09 0.07 0.067 passenger road (0.15 – all
domestic transport)
Delhi 0.09 0.29 0.18 0.12 0.11 passenger road (0.25 – all domestic
transport)
Transport CO2 Emissions - Aggregate (MtC)
India 20.5 235 125 97 95
Delhi 1.4 7.6 4.7 3.3 2.9

VIBATINDIA&DELHI
59
Figure 30. CO2 Emissions by Scenario (India) Figure 31. CO2 Emissions by Scenario and Mode (India)

VIBATINDIA&DELHI
60
Figure 32. CO2 Emissions by Scenario (Delhi) Figure 33. CO2 Emissions by Scenario and Mode (Delhi)

VIBATINDIA&DELHI
61
6.5 Conclusions, Synergies and Rebound Effects Initial scenario testing has demonstrated that the backcasting approach and LEAP modelling framework are useable and applicable in India, at a range of scales.
The analysis demonstrates that the two images developed to achieve the CO2 emissions target for 2030 are likely to offer very different futures in terms of resultant CO2 emissions. The desired target is unlikely to be attained through the technological change scenario even through this image includes very ambitious technological innovations. Scenario 2 delivers the better results in terms of CO2 emissions.
Both scenarios are likely to be subject to rebound effects, synergies, snowball effects and unintended impacts. For example, any improvements in the energy efficiency of the vehicular stock can result in higher usage – a result of the ‘rebound effect’. To prevent this from happening there is a need to combine the technological improvements with requisite inducements for behaviour change, such that the benefits are ‘locked in’ and not lost due to higher consumption patterns.
A more detailed assessment in India [and elsewhere] would consider a wider range of potential policy packages and different levels of applicability, quantify the likely CO2 reduction potential of each policy package, all this would be differential according to context. Synergies and rebound effects can also be considered. This level of complexity may be best delivered using a simulation model as being delivered in the VIBAT London project (the transport and carbon simulator, TC-SIM) – this allows the direct comparison of likely impacts of a range of policy packages in terms of CO2 emission reduction (see www.vibat.org).
The modelling above is also based on an assumption of successful implementation of policy measures. This is not likely to be the case in practice, so careful interpretation is required of modelling results.
It may be useful to test this methodology again in other contexts in Asia, possibly in China, again to demonstrate the applicability of the methodology and the availability of data. More detailed analysis could then follow, based on a more thorough/lengthy analysis using a series of Asian case studies. The appraisal of impacts should be multi-criteria based (including CO2 emissions, but also wider sustainability and quality of life goals)
VIBATINDIA&DELHI
62
7 Conclusions
The issues relating to climate change have risen high up on the political agenda across the world, including in developing countries such as India. However the transport sector is struggling to make a contribution to emission reduction objectives. In most countries transport’s impacts are far greater than the current level of political interest would suggest.
In India and the rest of Asia, the BAU projection for carbon-based traffic growth is clearly unsustainable. This study attempts to provide a new way forward for strategic decision making in the transport planning field. It puts forward the backcasting approach as a useful methodology to help strategise, and ultimately deliver, carbon efficiency in the transport sector. The following tasks have been undertaken in this study:
Establishing baseline forecasts for India and Delhi up to the target year (2030) from available secondary data. (This included an assessment of the quality and range of available information);
The preparation of strategic transport sector CO2 emissions targets at the national and city level. This included defining a c0ncept for appropriate levels of transport emissions per capita applicable to India and Delhi;
The development of a series of different but challenging future visions and scenarios that move towards the proposed targets, capturing both the environmental drivers for CO2 reduction and wider sustainability objectives;
The preparation of an inventory of policy measures that would be appropriate for implementation over the time period (2008-2030), either individually or in combination;
Initial scenario testing using the LEAP modelling framework.
This scoping study has demonstrated that there is much potential in backcasting in terms of raising the level of interest and debate in the understanding of transport and CO2 reduction. The study has added to the usual backcasting process by providing an initial estimate of the likely CO2 reduction contribution of different policy packages towards the required targets. This proved to be a very useful addition in explaining the likely scales of change. Some of the policy measures may seem too ambitious or overly optimistic in terms of level of application. Nevertheless, cities in other developing countries have shown that enormous progress can be made in dealing with urban transport problems through radical changes in transport policies. Moreover, the increasing severity of India’s urban transport crisis may provide the widespread political support needed for the required innovation in policy intervention needed to curb local and global emissions.
India has the opportunity to demonstrate global thought leadership in sustainable transport planning, showing how carbon efficient travel can be encouraged alongside rapid economic growth. This opportunity must be grasped.
This report has been produced by the study authors under a contract with the ADB (TA-6261). Any views expressed are from the authors and are not necessarily those of the ADB.
Many thanks to Dr Dinesh Mohan (Indian Institute of Technology, IIT), Dr Ajay Mathur (Director General Bureau of Energy Efficiency, BEE), Dilip Chenoy, K. K. Gandhi and A. Ganguli (Society of Indian
VIBATINDIA&DELHI
63
Automobile Manufacturers, SIAM), Anumita Roychowdhury-(Centre for Science and Environment, CSE) for providing very interesting and useful discussion/comment on transport and climate change issues in a series of exploratory meetings in Delhi in March 2008.

VIBATINDIA&DELHI
64
Annexes Annex 1. Selected References
Annex 2. Methodology for Developing the Baseline
Annex 3. Long List of Policy Measures Available to Reduce CO2 Emissions
Annex 4. Local Pollutants

VIBATINDIA&DELHI
65
Annex 1. Selected References ADB (2006) Energy Efficiency and Climate Change Considerations for on road transport in Asia Asian Development Bank Publication No. 110406
Akerman, J. and Hojer, M. (2006) How much transport can the climate stand? Sweden on a sustainable part in 2050, Energy Policy, 34, pp. 1944-1957
Anable, J. and Bristow, A. (2007) Transport and Climate Change: Supporting Document to the CfIT Report Commission for Integrated Transport London
Banister, D. (2005) Unsustainable transport, Spon, London
Banister, D., Stead, D., Steen, P., Akerman, J., Dreborg, K., Nijkamp, P. and Schleicher-Tappeser, R. (2000) European Transport Policy and Sustainable Mobility, Spon, London
Banthia, J. (2001) Census of India, 2001., Controller of Publications
Batra, A. (2003) Women find the metro safe, Express India, http://cities.expressindia.com/fullstory.php?newsid=68438
Bose, R. and Sperling, D. (2001) Transportation in Developing Countries: Greenhouse Gas Scenarios for Delhi, India University of California, Davis UCD-ITS-REP-01-13
Bows, A. and Anderson, K. L. (2007) Policy clash: Can projected aviation growth be reconciled with the UK Government's 60% carbon reduction target?, Transport Policy, 14, pp. 103-110
Cairns, S., Sloman, L., Newson, C., Anable, J., Kirkbride, A. and Goodwin, P. (2004) Smarter Choices: Changing the Way We Travel Stationery Office London
Castells, M. (2000) The Rise of the Network Society. The Information Age: Economy, Society and culture, Blackwell
CfIT, MVA and Kenworthy, J. (2005) World Cities Research- Final Report on World Cities. Commission for Integrated Transport
CfIT (2007) Transport and Climate Change Commission for Integrated Transport London
Defra (2006) Climate Change-the UK Programme Department for the Environment, Food and Rural Affairs London
Dreborg, K. (1996) The Essence of Backcasting, Futures, 28(9), pp. 813-828
Geurs, K. and B, v. W. (2004) Backcasting as a Tool for Sustainable Transport Policy Making: The Environmentally Sustainable Transport Study in the Netherlands, European Journal of Transport Infrastructure Research, 4(1), pp. 47-69
Global Commons Institute and Meyer, A. (2000) Contraction and Convergence: The Global Solution to Climate Change, Totnes: Green Books http://www.gci.org.uk/
Goodwin, P. (1997) Solving Congestion Inaugural Lecture for the Professorship of Transport Policy, Centre for Transport Studies, UCL
Government of India (2003) Auto Fuel Policy Ministry of Petroleum and Natural Gas, Government of India
Government of India (2008) Economic Survey of Delhi 2007-2008 Planning Department, Government of National Capital Territory of Delhi
Hickman, R. and Banister, D. (2006a) How to Design a More Sustainable and Fairer Build Environment, IEE Proceedings Intelligent Transport Systems, Vol.153, pp. 276-290
Hickman, R. and Banister, D. (2006b) Visioning and Backcasting for UK Transport Policy (VIBAT) Department of Transport London www.vibat.org
Hickman, R. and Banister, D. (2007a) Looking over the horizon: Transport and reduced CO2 emissions in the UK by 2030, Transport Policy, 14, pp. 377-387

VIBATINDIA&DELHI
66
Hickman, R. and Banister, D. (2007b) Transport and reduced energy consumption: what role can urban planning play? Transport Studies Unit, Oxford University Centre for the Environment Ref.1026
Hirsch, R. L. (2005) Peaking of World Oil Production: Impacts, Mitigation and Risk Management
Houghton, J. (2004) Global Warming: The Complete Briefing, Cambridge University Press
IEA (2002) World Energy Outlook International Energy Agency Paris
IEA (2004) World Energy Outlook International Energy Agency Paris
IISD (2004) Transportation and Greenhouse Gas Emissions: Exploring Opportunities for the Clean Development Mechanism in Chile International Institute of Sustainable Development
IPCC (2007) The IPCC Fourth Assessment Report on Climate Change Intergovernmental Panel on Climate Change Geneva
IRF (2004) International Road Federation Database www.irfnet.org
Litman, T. (2007) Win Win emission Reduction Strategies Victoria Transport Policy Institute, Canada
Marland, G., Boden, T. and Andres, B. (2007) Global, Regional and National Fossil Fuel CO2 emissions Carbon Dioxide Information Analysis Centre, Oak Ridge National Laboratory, U S Department of Energy, Oak Ridge, USA
Mashelkar, R. A., Biswas, D. K., Krishnan, N. R., Mathur, O. P., Natrajan, R., Niyati, K. P., Shukla, P. R., Singh, D. V. and Singhal, S. (2002) Report of the expert committee on auto fuel policy Ministry of Petroleum and Natural Gas, Government of India New Delhi
Ministry of Road Transport and Highways (2007) Motor Transport Statistics Government of India, New Delhi www.morth.nic.in
Mohan, D. (1997) Delhi on the move Indian Institute of Technology
Mohan, D. (2006) Squandering public funds for a handful of people, Business Standard, New Delhi
Mohan, D. and Bawa, P. (1985) An analysis of road traffic fatalities in Delhi, India., Accid Anal Prev, 17(1), pp. 33-45
Newman, P. W. G. and Kenworthy, J. R. (1999) Sustainability and Cities: Overcoming Automobile Dependence, Island Press, California
OECD (2000) Environmentally Sustainable Transport. Futures, Strategies and Best Practice. Synthesis Report. OECD Paris
Poddar, T. and Yi, E. (2007) In BRIC's and Beyond(Ed, Goldman Sachs).
Pucher, J., Korattyswaroopam, N. and Ittyerah, N. (2004) The Crisis of Public Transport in India: Overwhelming Needs but Limited Resources, Journal of Public Transportation, 7(3), pp. 95–113
Pucher, J., Korattyswaropam, N., Mittal, N. and Ittyerah, N. (2005) Urban transport crisis in India, Transport Policy, 12(3), pp. 185-198
Robinson (1982) Energy Backcasting: A proposed method of policy analysis, Energy Policy, 10(4), pp. 337-344
Robinson (1990) Futures Under Glass: A Recipe for People Who Hate to Predict, Futures, 22(8), pp. 820-842
Roychowdhury, A., Chattopadhyaya, V., Shah, C. and Chandola, P. (2006) The Leapfrog Factor - Clearing the air in asian cities, Centre for Science and Environment, New Delhi
SACTRA, T. (1994) Roads and the Generation of Traffic (1994), HMSO ISBN 0, 11(551613), p. 1
Saha, M. (2004) Metro rail will be a cheap mode of transportation, Project Monitor, http://www.projectsmonitor.com/detailnews.asp?newsid=7734
SIAM (2007) Emission Norms Society of Indian Automobile Manufacturers www.siamindia.com
VIBATINDIA&DELHI
67
SIAM (2008) Automobile Industry Statistics of India Society of Indian Automobile Association New Delhi http:\\www.siamindia.com
Singh, S. K. (2006) Future mobility in India: Implications for energy demand and CO2 emission, Transport Policy, 13(5), pp. 398-412
Times of India (2007) Rs 1 lakh car is already being tested: Tata, Times of India, New Delhi
Tiwari, G. (1999) Towards a sustainable urban transport system: planning for non-motorized vehicles in cities, Transport and Communications Bulletin for Asia and the Pacific, 68, pp. 49-66

VIBATINDIA&DELHI
68
Annex 2. Methodology for Developing the Baseline LEAP Software
The baseline and projections within this scoping study have been developed using the Long Range Energy Alternatives Planning (LEAP) software (www.energycommunity.org), as developed by the Stockholm Environment Institute (SEI), Boston, US. LEAP can be used to develop transport energy demand and CO2 emission scenarios. It requires a local database to populate the LEAP framework software. The software has been run by Sharad Saxena, a PhD researcher based in India.
The central concept of LEAP is an end use driven scenario analysis. In this approach, the computer system is used to analyze the current energy scene and to simulate alternative energy futures along with environmental emissions under a range of user defined assumptions.
A key benefit of LEAP is its low initial data requirements. Modelling tools that rely on optimization tend to have high initial data requirements because they require that all technologies are fully defined both in terms of both their operating characteristics and their costs. By contrast, because LEAP relies on simpler principles, and because many aspects of LEAP are optional, its initial data requirements can be relatively low. LEAP’s adaptable data structures are well suited to an iterative analytical approach: one in which the user starts by rapidly creating an initial analysis that is as simple as possible. In later iterations the user adds complexity only where data is available and where the added detail provides further useful insights into the questions being addressed in the analysis.
The LEAP framework is disaggregated in a hierarchical tree structure of four levels: sector, sub-sector, end-use and device.
The energy intensity values along with the type of fuel used in each device are required in order to estimate the energy requirements of sector, sub-sector and end-use level. The emission factors of different pollutants in the TED module are linked to the device level to appraise the environmental emissions from the energy utilization during the planning horizon.
This study considers only road transport due to its high proportion in total energy consumed in the transport sector. The energy demand can be estimated by using the volume of traffic in terms of vehicle kilometres. The number of vehicles should be projected and then multiplied with the average distance per year to appraise the vehicle kilometre per year. The energy demand in the road transport sector is formulated as function of the number of vehicles, the annual average mileage (i.e. annual distance travelled per vehicle.) and fuel economy (e.g. litres per km).
In the baseline scenario, projections for future sales of vehicles are entered along with future levels of fuel economy, vehicle mileage and environmental loadings of the newly added vehicles. Other lifecycle profiles are used to describe how mileage, fuel economy and environmental loadings change as vehicles age. LEAP then calculates the stock average values for fuel economy, mileage and environmental loadings across all vintages and hence, ultimately, the overall level of energy consumption and environmental loadings.
Existing Stocks and Future Sales - Number of On Road Vehicles
There is no precise data of the “on road” number of cars, SUVs and two-wheelers. Only the numbers of ‘registered’ vehicles are available. The registration data for all vehicle types in India as provided by the Ministry of Road, Government of India is given in Table.
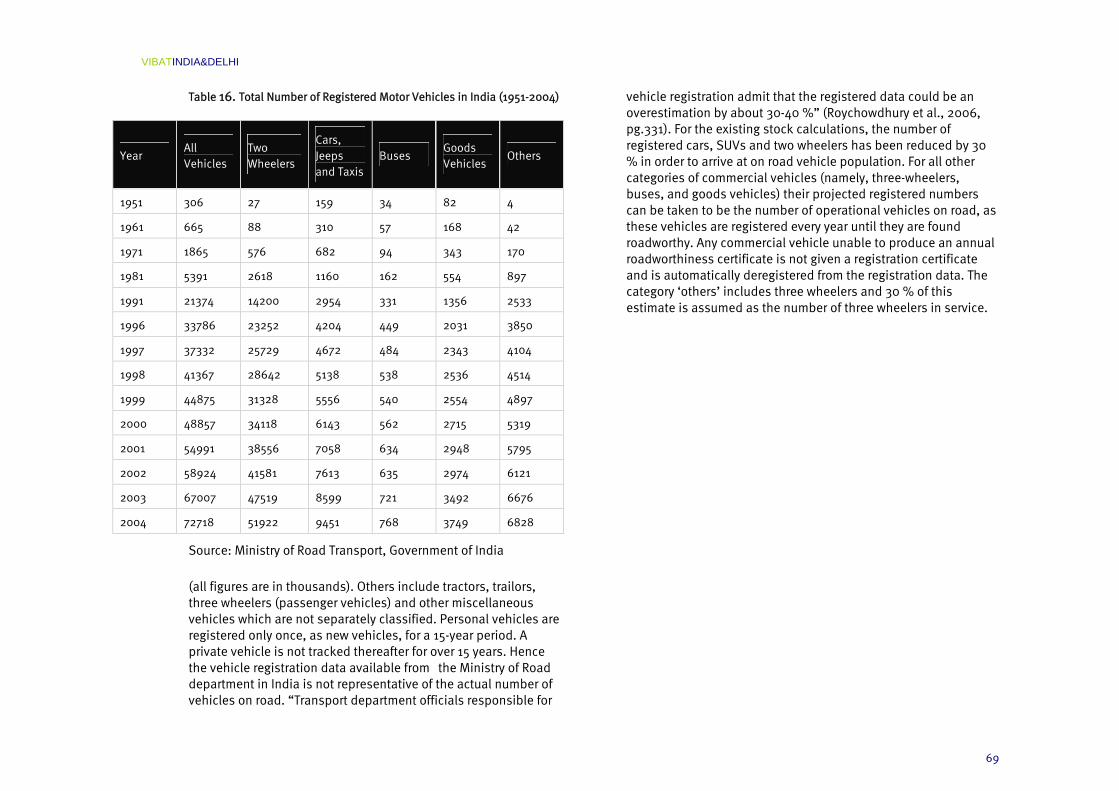
VIBATINDIA&DELHI
69
Table 16. Total Number of Registered Motor Vehicles in India (1951-2004)
Source: Ministry of Road Transport, Government of India
(all figures are in thousands). Others include tractors, trailors, three wheelers (passenger vehicles) and other miscellaneous vehicles which are not separately classified. Personal vehicles are registered only once, as new vehicles, for a 15-year period. A private vehicle is not tracked thereafter for over 15 years. Hence the vehicle registration data available from the Ministry of Road department in India is not representative of the actual number of vehicles on road. “Transport department officials responsible for
vehicle registration admit that the registered data could be an overestimation by about 30-40 %” (Roychowdhury et al., 2006, pg.331). For the existing stock calculations, the number of registered cars, SUVs and two wheelers has been reduced by 30 % in order to arrive at on road vehicle population. For all other categories of commercial vehicles (namely, three-wheelers, buses, and goods vehicles) their projected registered numbers can be taken to be the number of operational vehicles on road, as these vehicles are registered every year until they are found roadworthy. Any commercial vehicle unable to produce an annual roadworthiness certificate is not given a registration certificate and is automatically deregistered from the registration data. The category ‘others’ includes three wheelers and 30 % of this estimate is assumed as the number of three wheelers in service.
Year All Vehicles
Two Wheelers
Cars, Jeeps and Taxis
Buses Goods Vehicles
Others
1951 306 27 159 34 82 4
1961 665 88 310 57 168 42
1971 1865 576 682 94 343 170
1981 5391 2618 1160 162 554 897
1991 21374 14200 2954 331 1356 2533
1996 33786 23252 4204 449 2031 3850
1997 37332 25729 4672 484 2343 4104
1998 41367 28642 5138 538 2536 4514
1999 44875 31328 5556 540 2554 4897
2000 48857 34118 6143 562 2715 5319
2001 54991 38556 7058 634 2948 5795
2002 58924 41581 7613 635 2974 6121
2003 67007 47519 8599 721 3492 6676
2004 72718 51922 9451 768 3749 6828
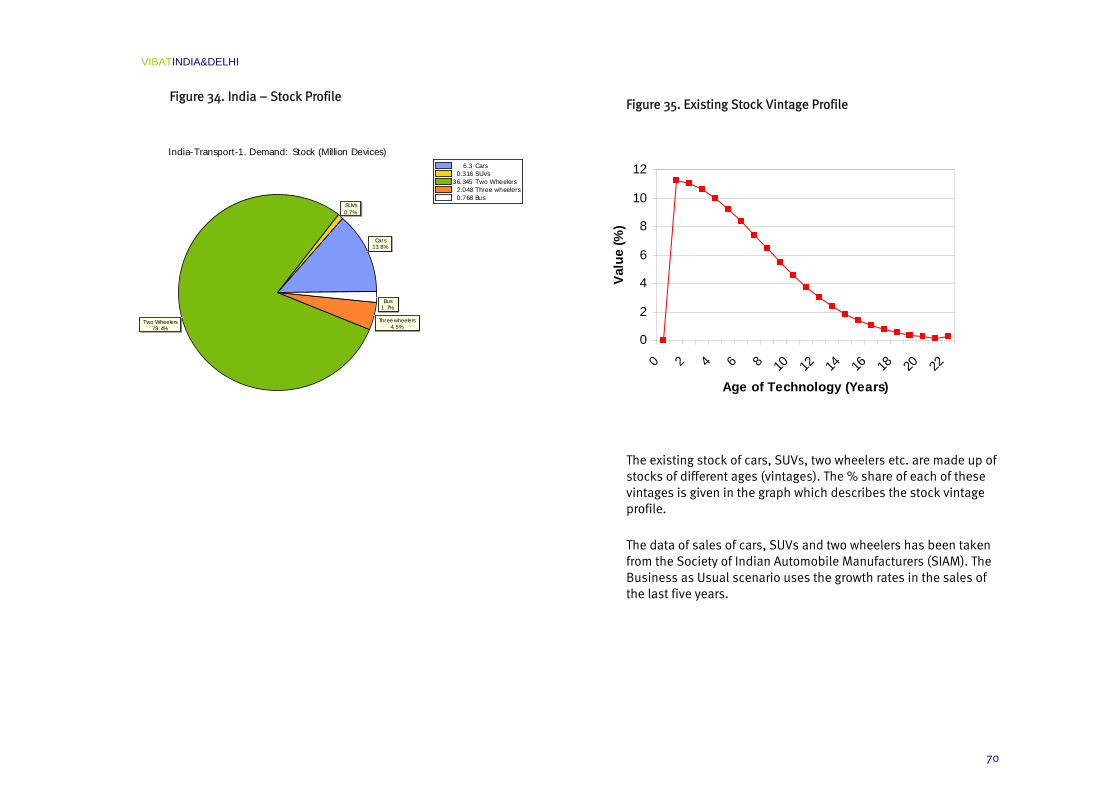
VIBATINDIA&DELHI
70
Figure 34. India – Stock Profile
Figure 35. Existing Stock Vintage Profile
The existing stock of cars, SUVs, two wheelers etc. are made up of stocks of different ages (vintages). The % share of each of these vintages is given in the graph which describes the stock vintage profile.
The data of sales of cars, SUVs and two wheelers has been taken from the Society of Indian Automobile Manufacturers (SIAM). The Business as Usual scenario uses the growth rates in the sales of the last five years.
6.3 Cars0.316 SUVs
36.345 Two Wheelers2.048 Three wheelers0.768 Bus
India-Transport-1. Demand: Stock (Million Devices)
Cars13.8%
SUVs0.7%
Two Wheelers79.4%
Three wheelers4.5%
Bus1.7%
0
2
4
6
8
10
12
0 2 4 6 8 10 12 14 16 18 20 22
Age of Technology (Years)
Valu
e (%
)

VIBATINDIA&DELHI
71
Table 17. Sales of Cars in India
Year Passenger Cars
Utility Vehicles
MPVs Total Passenger Vehicles
2001-2002 509,088 104253 61775 675,116
2002-2003 541,491 113620 52087 707,198
2003-2004 696,153 146388 59555 902,096
2004-2005 820,179 176360 65033 1,061,572
2005-2006 882,208 194502 66366 1,143,076
2006-2007 1,076,408 220199 83091 1,379,698
Note. Average growth rate of passenger cars is 16%. Utility vehicles and MPVs can both be classified as SUVs and have an average growth rate of 13%
Table 18. Sales of Two Wheelers
Year Scooters Motorcycles Mopeds Electric 2 Wheelers
Total 2 Wheelers
2001-2002 908268 2887194 408263 0 4203725
2002-2003 825648 3647493 338985 0 4812126
2003-2004 886295 4170445 307509 0 5364249
2004-2005 922428 4964753 322584 0 6209765
2005-2006 909051 5810599 332741 0 7052391
2006-2007 940673 6553664 355870 7341 7857548
Note. Average growth rate per year is 13 %. Electric two wheelers have made a beginning only in 2006-07. The existing growth rates are extrapolated up to the year 2030. It is assumed that the sales will level off after the year 2020.

VIBATINDIA&DELHI
72
Figure 36. Sales Projections
Note. The number of vehicles sold in each year, will gradually be retired from the vehicle stock (taken off-road). A survival profile describing this retirement of vehicle can be represented by an exponential function of the following type:
St = St-1. et.0.02
Where S is the fraction of surviving vehicles, t is the age in years of the vehicle
The survival profile for cars is shown opposite.
Figure 37. Survival Profile for Cars
Fuel Economy of Vehicles
The fuel economy of a vehicle is assumed to stay constant as a vehicle’s age increases in the baseline scenario. However in other scenarios, the implementation of fuel economy norms and improvement in the fuel economy is considered.
For instance the Low Carbon Technology scenario – the fuel economy is assumed to improve upto the year 2030
C a r sS U V sT w o W h e e le r sT h r e e w h e e le r sB u s
I n d ia - T r a n sp o r t - 1 . D e m a n d : S a le s (M i llio n D e v ic e s )
2 0 0 4 2 0 0 6 2 0 0 8 2 0 1 0 2 0 1 2 2 0 1 4 2 0 1 6 2 0 1 8 2 0 2 0 2 0 2 2 2 0 2 4 2 0 2 6 2 0 2 8 2 0 3 0
Mil
lio
n D
ev
ice
s
2 7 .0
2 6 .02 5 .02 4 .02 3 .02 2 .02 1 .0
2 0 .01 9 .01 8 .0
1 7 .01 6 .0
1 5 .01 4 .01 3 .01 2 .0
1 1 .01 0 .0
9 . 0
8 . 07 . 0
6 . 05 . 04 . 03 . 0
2 . 01 . 0
0
10
20
30
40
50
60
70
80
90
100
0 2 4 6 8 10 12 14 16 18 20 22 24
Age of the vehicle (years)
Valu
e(%
)

VIBATINDIA&DELHI
73
Table 19. Vehicle Fuel Types and Efficiencies
Fuel efficiency
km/litre
Vehicle Fuel Type
Present 2030
Gasoline 14.06 19 Cars
Diesel 17.08 29
Gasoline 10.7 16.5 SUVs
Diesel 11.92 22.25
Two wheelers Gasoline 60 116
Buses Diesel 4.3 5.34
Utilisation
There is virtually no data on mobility and vehicle use in India. The assumptions for utilization have been made based on previous studies and consultations with experts. New vehicles are assumed to be driven slightly more in their first year of service and it is assumed that their utilization decreases gradually as their age increases. The decrease in driving is represented by an exponential function with a constant parameter -0.002.
Figure 38. Assumed Utilisation Profile of Vehicles
The assumption for the annual distance travelled by newly added vehicles and the occupancy is as follows:
Table 20. Annual Distance Travelled and Occupancy
Mileage Occupancy
Cars 15,000 2.1
SUVs 15,000 2.1
Two wheelers 10,000 1.5
Three wheelers 25,000 1.5
Buses 70,000 40
Note. For Cars, SUVS and two wheelers this distance is expected to increase annually at the rate of 2 % annually until the year 2030 in a Business as Usual scenario.
0102030405060708090
100
1 3 5 7 9 11 13 15 17 19 21 23 25
Age of vehicle
Dis
tanc
e Tr
avel
led
(%)

VIBATINDIA&DELHI
74
Identifying Vehicle Types by Fuel Category
Figure 39. Dieselization of Vehicular Fleet
India is experiencing a surge in diesel cars and SUVs driven by the low diesel prices. Experts have already predicted that market share of diesel cars and SUVs shall be approximately 50 % by 2010. The dieselization of the vehicular fleet has the potential to lower carbon emissions but increase local pollutants like particulates. The current policy the Indian Government of subsidizing diesel however, ensures that there is a growing demand for diesel vehicles owing to its lower operating costs. Owing to environmental concerns, the policy is under review and the future share of diesel vehicles is difficult to estimate.
Much like the rest of the country, Delhi has also seen a surge in diesel cars and SUVs. This is driven by the low diesel prices. The commercial vehicles viz. buses and three wheelers have all been converted to compressed natural gas (CNG). The buses earlier used diesel and the three wheelers used gasoline. As natural gas contains small amounts of carbon and more hydrogen than other liquid fuels like diesel and gasoline, therefore less CO2 is
produced for the same amount of energy consumed. However diesel engines are more efficiency than natural gas or petrol ones. Therefore the CO2 reduction is lower when switching a vehicle from diesel to natural gas than when switching it from petrol to natural gas (Roychowdhury et al., 2006, pg.266).
Emission Factors – CO2
Carbon dioxide emissions from vehicles are dependent on the type of fuel used and the efficiency (fuel economy) of the vehicle. Therefore they can be estimated in terms of emissions per unit of energy consumed. The measurement units used are grams of CO2 per litre of fuel consumed.
Emission Factors- Local Pollutants
In the LEAP model, global, regional and local pollutants have also been considered. These are Nitrogen Oxides (NOx) which contributes to acidification or ‘acid rain’ and more local pollutants like Particulate matter i.e. particles of size less than 10 microns (PM10) or less than 2.5 microns (PM2.5) which contribute to respiratory problems.
Local air pollutants are much more dependent on the type of control technology used in the vehicle, and also tend to be regulated by the Government at certain levels. For this reason, these emission factors tend to be specified per vehicle-km travelled. The units used are grams of pollutant per vehicle-Km travelled. Since emissions of these pollutants depend critically on the performance of the catalytic converter or other control technology used in the vehicle, they can also be expected increase per vehicle-mile quite substantially as the vehicle gets older. For this reason, in addition to specifying the emission factors for new vehicles, there is also a need to specify degradation factors for each pollutant that specify how emissions increase, as vehicles get older.
0102030405060708090
100
2004 2007 2010 2013 2016 2019 2022 2025 2028
% share of diesel cars % share of petrol cars

VIBATINDIA&DELHI
75
Baseline Forecast
The baseline forecasts or a business-as-usual (BAU) case for India and the city of Delhi has been generated using the above mentioned LEAP software. Baseline forecast is defined as the best estimate of demand of transport fuels and corresponding emissions, in the future, given current trends in travel demand of people and goods.
Baseline forecast assumes a continued progression of growth of on-road vehicles at present trends and changes in modal split pattern, penetration of improved technologies, and cleaner and alternative fuels with progressively stringent tailpipe emission standards of new vehicles as per the current set of policy measures. Baseline case, however, assumes no dramatic or significant changes in energy consumption or environmental policies.
Assumptions regarding transport trends in India and Delhi
The Business as Usual (BAU) scenario projects fuel use and emissions into the future under the assumption that no radical new policies shall be introduced which reduce fuel use and emissions. The prevailing trends are expected to continue.
It is assumed that the following trends continue upto the target year 2030:
The sales of vehicles continue to grow until a saturation level is reached;
The sales of diesel cars and SUVs exceeds that of gasoline owing the price differential and higher subsidy for diesel;
The SUV sales growth rate is higher than the sales growth rate of cars;
Two wheelers growth slows down as people shift to low priced cars;
Hybrid vehicles growth remains a very small fraction of the overall sales;
In the absence of fuel economy standards, the fuel economy of vehicles remains unchanged;
Apart from the already approved emission standards, no new emissions standards are imposed. Hence after the Euro IV standards are implemented in 2010, no new standards are imposed up to 2030.

VIBATINDIA&DELHI
76
Annex 3. Long List of Policy Measures An initial long list of policy measures available to help reduce CO2 emissions is given below.
Potential Timescale of Implementation
Measure
Short Term
Medium Term
Long Term
Low emission vehicles/ Alternative Fuels
Introduction of fuel efficiency standards
Support for hybrid vehicles
Standards for emissions, noise and safety
Fuel quality standards and alternative fuels
Efficiency improvement of materials and energy (e.g. factor 4)
Vehicle test cycles
Enforcement and monitoring
Pricing
Road pricing – congestion or environmental basis
Road tolls for freight
High occupancy vehicle (HOV) pricing
Fuel tax/escalators
Vehicle purchase tax
Car ownership tax
Parking tariffs/pricing
Parking restrictions/controls
Excise tax for aircraft fuel
Potential Timescale of Implementation
Measure
Short Term
Medium Term
Long Term
Airport charges
Air travel restrictions/rations
Public Transport
Improvement of public transport - bus, guided bus and LRT, ultra light rail, palletisation
Increased rail capacity and high speed trains (HST)
Public transport subsidy (investment)
Deregulation/regulation
Fare integration and schedule co-ordination
Intermodality
Traveller information
Bus service improvement
Park and ride
Rail freight facilities
Walking and cycle facilities
Cycle/public transport integration
Cycle parking
Shuttle services
Small wheeled public transport/paratransit
Demand responsive services
Taxi services
Priorities for bus, tram and high occupancy vehicles (HOV)
Segregated rights of way for public transport
Walking and Cycling
Pedestrianisation

VIBATINDIA&DELHI
77
Potential Timescale of Implementation
Measure
Short Term
Medium Term
Long Term
Pedestrian and cycle friendly developments
Pedestrian priority and road space
Cycle priority and road space
Direct routes for walking, cycling relative to the car/2 wheelers
Urban Planning
Integrated planning
Regional development policies, strategic planning
Compact cities
Decentralised concentration and polycentricity
Mixed use
Zoning regulations
Public transport orientated development (PTOD)
Smart growth
New urbanism
Clustered land use/location efficient development
Access to transport services
Pedestrian and cycle friendly developments
Car free districts
Car free or low car housing
Low emission zones
Pedestrianisation
Fiscal incentives for relocation in designated areas
Relocation of activities
Potential Timescale of Implementation
Measure
Short Term
Medium Term
Long Term
Green belts, development restrictions
Regeneration of decaying areas (city centre, inner city, waterfront, suburban)
Housing renewal, improvements to neighbourhood quality and facilities
Car and cycle parking standards for new development
Information and Telecommunications and Technology
Teleworking/telecommuting/teleconferencing
Teleshopping/telebanking/telecottages
Telematics, informatics available locally
Infrastructure technology
Multipurpose personal communications
Broadband, Wi-fi, smartdust and other technological developments
Travel Plans
Travel information
Transport chaining awareness
Personalised travel planning, travel blending
Commute trip reduction programmes
School travel planning
Ecological Driving
Lower speed limits and enforcement
Casualty reduction targets (zero objective)
Long Distance Travel Substitution/ Air Travel reduction
Increased rail capacity and high speed trains (HST)
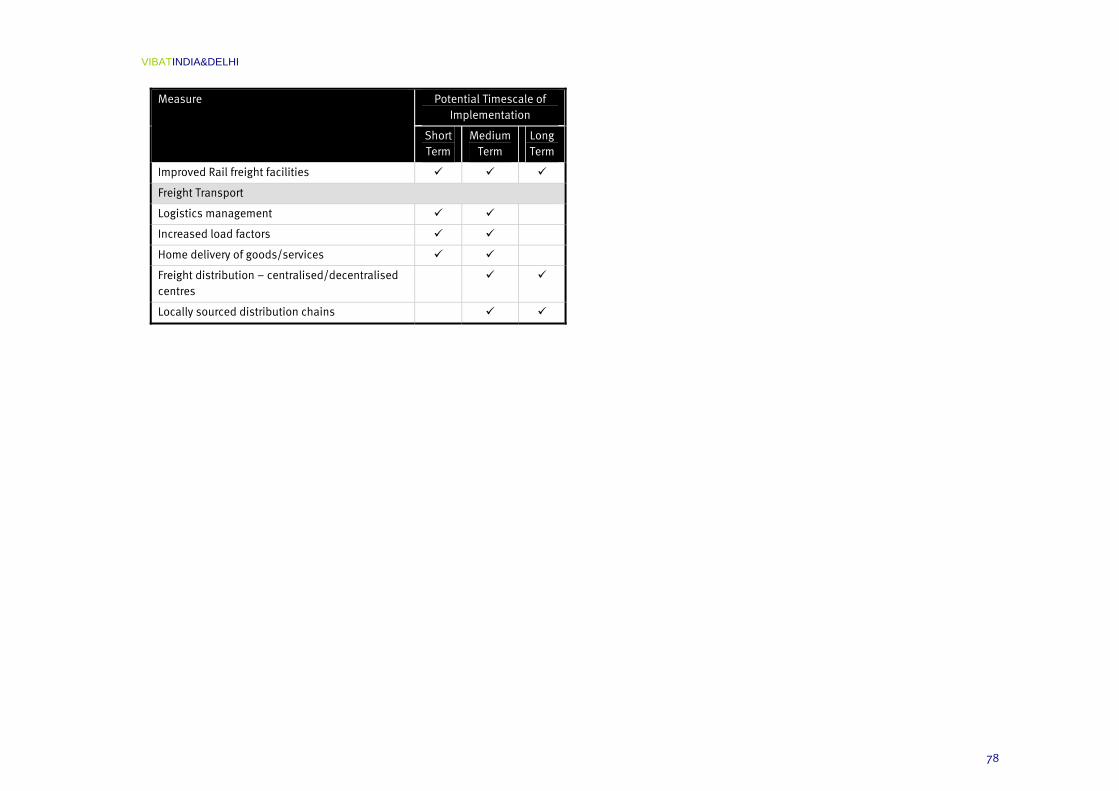
VIBATINDIA&DELHI
78
Potential Timescale of Implementation
Measure
Short Term
Medium Term
Long Term
Improved Rail freight facilities
Freight Transport
Logistics management
Increased load factors
Home delivery of goods/services
Freight distribution – centralised/decentralised centres
Locally sourced distribution chains

VIBATINDIA&DELHI
79
Annex 4. Local Pollutants The first Indian emission regulations were idle emission limits, which became effective in 1989. These idle emission regulations were soon replaced by mass emission limits for both gasoline (1991) and diesel (1992) vehicles, which were gradually tightened during the 1990’s. Since the year 2000, India has started adopting European emission and fuel regulations for four-wheeled light-duty and for heavy-duty vehicles. (See table 5.1).
Table 21. European Emission Norms for Gasoline Cars
Note. European Commission’s draft Euro V norms have proposed PM standards for lean-burn gasoline direct injection engines. India’s own emission regulations still apply to two- and three-wheeled vehicles. As per India’s National Auto Fuel Policy a phased program for introducing Euro 2 - 4 emission and fuel regulations by 2010 has been proposed. The implementation schedule of the EU emission standards in India is summarized in the table.
Table 22. Indian Emission Standards (4-Wheel Vehicles)
Standard Reference Date Region
India 2000 Euro 1 2000 Nationwide
2001 NCR*, Mumbai, Kolkata, Chennai
2003.04 NCR*, 10 Cities†
Bharat Stage II Euro 2
2005.04 Nationwide
2005.04 NCR*, 10 Cities† Bharat Stage III Euro 3
2010.04 Nationwide
Bharat Stage IV Euro 4 2010.04 NCR*, 10 Cities†
* National Capital Region (Delhi)
† Mumbai, Kolkata, Chennai, Bangalore, Hyderabad, Ahmedabad, Pune, Surat, Kanpur and Agra
Source: SIAM (2007); Government of India (2003)
The above standards apply to all new 4-wheel vehicles sold and registered in the respective regions. As can be seen from the table, the some of the major cities of India viz. Delhi, Mumbai, Kolkata, Chennai, Banagalore, Hyderabad and Ahmedabad have had Euro III standards since 2005. Non-compliant vehicles cannot be sold in these cities, but new standards do not apply to vehicles already on the roads. These cities would also implement the Euro IV equivalent norms from 2010.
The rest of the country is on Euro II equivalent emission norms from April 1st 2005 and it is proposed that Euro III equivalent emission norms will be implemented by 2010.
Euro Levels Year CO HC HC+NOx NOx PM
Euro II 1996 2.2 - 0.50 -
Euro III 2000 2.3 0.2 - 0.15
Euro IV 2005 1.0 0.1 - 0.08
Euro V 1.0 0.075 - 0.06 0.005*

VIBATINDIA&DELHI
80
Emission Standards for Two Wheelers
India enforced its first set of mass emissions standards in 1991. Since then the standards for two-wheelers have been revised and tightened thrice – in 1996, 2000 and 2005. India does not follow European norms for these vehicles. It has its own emission regulations called Bharat Stage (BS) standards. Indian norms are measured on the Indian driving cycle that is much more heavily weighted towards lower speed and load, especially when compared to the European cycle. The 2000 emission norms for two/three wheelers are called Bharat Stage I and the subsequent norms of 2005 are called BS II.
Table 23. Two-Wheeler Emission Norms
Standards CO
(gm/km)
HC + NOx
(gm/km)
April 1996 4.5 3.6
Bharat Stage I
(April 2000)
2.0 2.0
Bharat Stage II
(April 2005)
1.5 1.5
Bharat Stage III
2008
1.0 1.0
Since the two wheeler industry targets the low to middle classes in India, therefore it designs the products for higher fuel economy and low power. Four stroke engines are more fuel efficient than two stroke engines. Data available from ARAI for the model year 2000 shows that two stroke two-wheelers in India have an average fuel efficiency of 64.27 km/litre compared to 74.72 km/litre in four stroke two wheelers. As a result, four stroke
engines emit less CO2 as well. ARAI data shows the following average data for the CO2 emissions from two wheelers:
Two wheelers with two-stroke engines emit - 31.27 gm/km of CO2
Two wheelers with four-stroke engines emit - 28.93 gm/km of CO2
In general, four-stroke two-wheelers are about 10-20 % more efficient than two-stroke vehicles. The two wheeler technology in India has developed significantly after the year 2000. Prior to that, the emission norms were so lax that these could easily be met with design changes in the conventional carbureted two-stroke engines. More serious changes began to occur after the enforcement of Bharat Stage I emission norms that needed significant reduction in emissions.
In the year 1999, a possible ban on two stroke two-wheelers was also considered in Delhi. The Environmental Pollution (Prevention and Control) Authority (EPCA) has included such a proposal in its recommendations to the Supreme Court of India. The main contention was that automobile manufacturers were either switching their production to four-stroke design or fitting catalytic converters in two stroke engines. However due to the very short life of catalytic converters, emissions could rise to levels well beyond the limit during the life of the vehicle. Therefore the proposal was that the sale of two-wheelers with two-stroke engines should be restrained in the city of Delhi. This proposal was not pursued as the manufacturers have voluntarily switched to four-stroke engines and nearly 70 % of the two wheeler production today is comprised of four-stroke two-wheelers.
The Indian two wheeler fleet is also seeing a shift towards four stroke engines that is likely to improve the fuel economy.
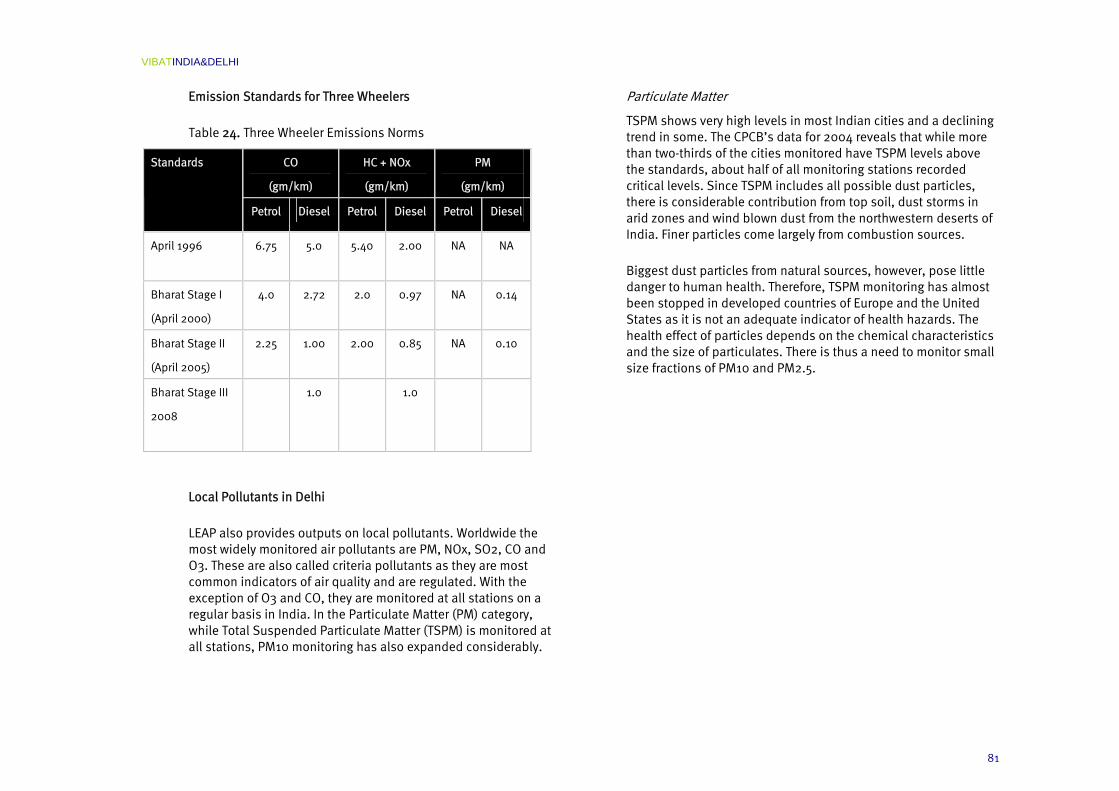
VIBATINDIA&DELHI
81
Emission Standards for Three Wheelers
Table 24. Three Wheeler Emissions Norms
CO
(gm/km)
HC + NOx
(gm/km)
PM
(gm/km)
Standards
Petrol Diesel Petrol Diesel Petrol Diesel
April 1996 6.75 5.0 5.40 2.00 NA NA
Bharat Stage I
(April 2000)
4.0 2.72 2.0 0.97 NA 0.14
Bharat Stage II
(April 2005)
2.25 1.00 2.00 0.85 NA 0.10
Bharat Stage III
2008
1.0 1.0
Local Pollutants in Delhi
LEAP also provides outputs on local pollutants. Worldwide the most widely monitored air pollutants are PM, NOx, SO2, CO and O3. These are also called criteria pollutants as they are most common indicators of air quality and are regulated. With the exception of O3 and CO, they are monitored at all stations on a regular basis in India. In the Particulate Matter (PM) category, while Total Suspended Particulate Matter (TSPM) is monitored at all stations, PM10 monitoring has also expanded considerably.
Particulate Matter
TSPM shows very high levels in most Indian cities and a declining trend in some. The CPCB’s data for 2004 reveals that while more than two-thirds of the cities monitored have TSPM levels above the standards, about half of all monitoring stations recorded critical levels. Since TSPM includes all possible dust particles, there is considerable contribution from top soil, dust storms in arid zones and wind blown dust from the northwestern deserts of India. Finer particles come largely from combustion sources.
Biggest dust particles from natural sources, however, pose little danger to human health. Therefore, TSPM monitoring has almost been stopped in developed countries of Europe and the United States as it is not an adequate indicator of health hazards. The health effect of particles depends on the chemical characteristics and the size of particulates. There is thus a need to monitor small size fractions of PM10 and PM2.5.
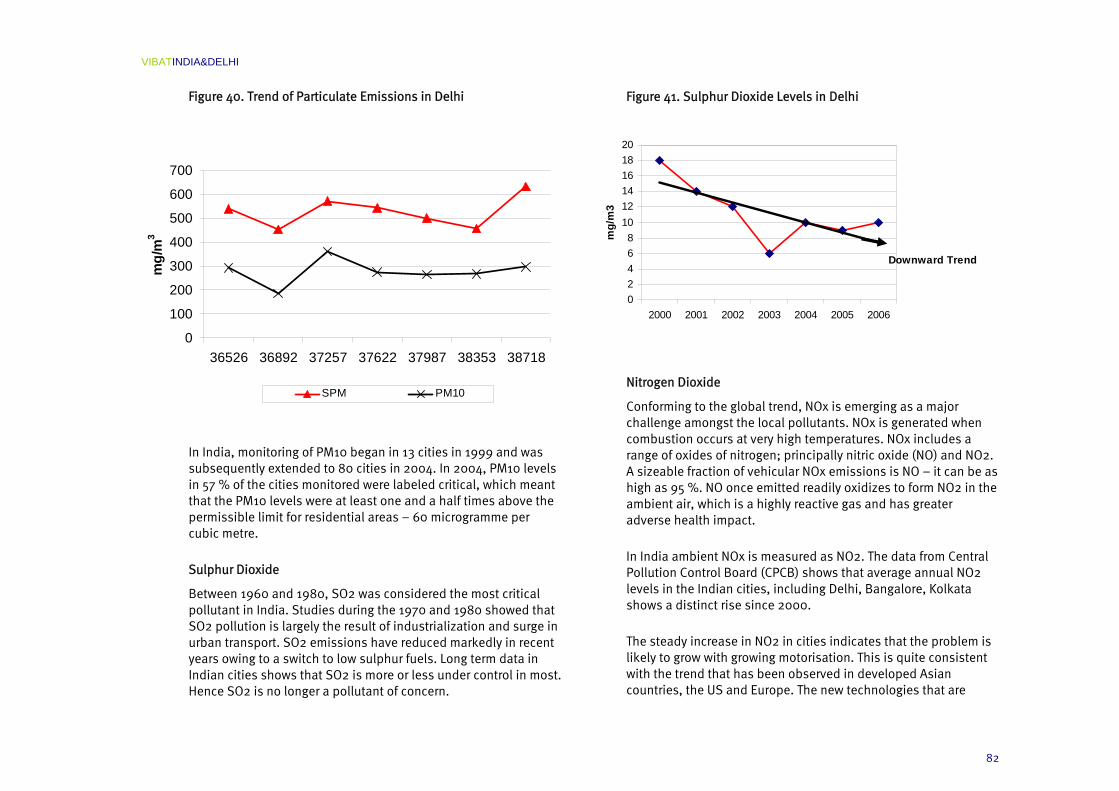
VIBATINDIA&DELHI
82
Figure 40. Trend of Particulate Emissions in Delhi
In India, monitoring of PM10 began in 13 cities in 1999 and was subsequently extended to 80 cities in 2004. In 2004, PM10 levels in 57 % of the cities monitored were labeled critical, which meant that the PM10 levels were at least one and a half times above the permissible limit for residential areas – 60 microgramme per cubic metre.
Sulphur Dioxide
Between 1960 and 1980, SO2 was considered the most critical pollutant in India. Studies during the 1970 and 1980 showed that SO2 pollution is largely the result of industrialization and surge in urban transport. SO2 emissions have reduced markedly in recent years owing to a switch to low sulphur fuels. Long term data in Indian cities shows that SO2 is more or less under control in most. Hence SO2 is no longer a pollutant of concern.
Figure 41. Sulphur Dioxide Levels in Delhi
Nitrogen Dioxide
Conforming to the global trend, NOx is emerging as a major challenge amongst the local pollutants. NOx is generated when combustion occurs at very high temperatures. NOx includes a range of oxides of nitrogen; principally nitric oxide (NO) and NO2. A sizeable fraction of vehicular NOx emissions is NO – it can be as high as 95 %. NO once emitted readily oxidizes to form NO2 in the ambient air, which is a highly reactive gas and has greater adverse health impact.
In India ambient NOx is measured as NO2. The data from Central Pollution Control Board (CPCB) shows that average annual NO2 levels in the Indian cities, including Delhi, Bangalore, Kolkata shows a distinct rise since 2000.
The steady increase in NO2 in cities indicates that the problem is likely to grow with growing motorisation. This is quite consistent with the trend that has been observed in developed Asian countries, the US and Europe. The new technologies that are
0
100
200
300
400
500
600
700
36526 36892 37257 37622 37987 38353 38718
mg/
m3
SPM PM10
02468
101214161820
2000 2001 2002 2003 2004 2005 2006
mg/
m3
Downward Trend
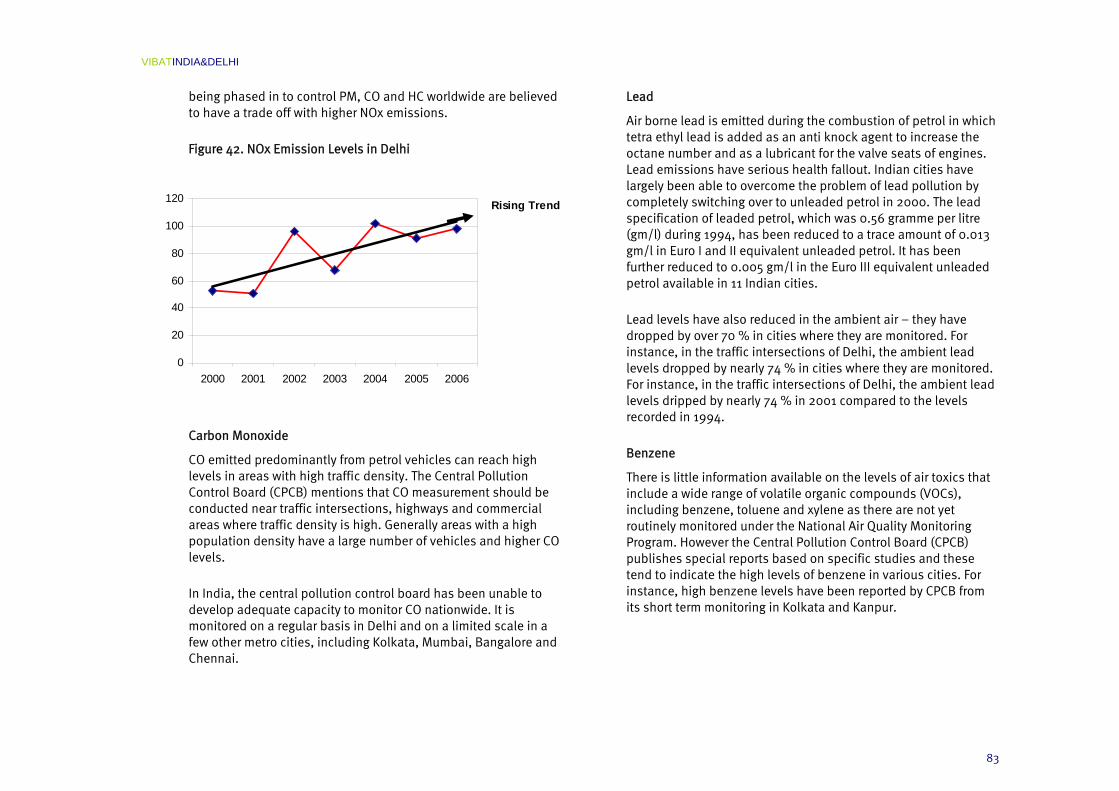
VIBATINDIA&DELHI
83
being phased in to control PM, CO and HC worldwide are believed to have a trade off with higher NOx emissions.
Figure 42. NOx Emission Levels in Delhi
Carbon Monoxide
CO emitted predominantly from petrol vehicles can reach high levels in areas with high traffic density. The Central Pollution Control Board (CPCB) mentions that CO measurement should be conducted near traffic intersections, highways and commercial areas where traffic density is high. Generally areas with a high population density have a large number of vehicles and higher CO levels.
In India, the central pollution control board has been unable to develop adequate capacity to monitor CO nationwide. It is monitored on a regular basis in Delhi and on a limited scale in a few other metro cities, including Kolkata, Mumbai, Bangalore and Chennai.
Lead
Air borne lead is emitted during the combustion of petrol in which tetra ethyl lead is added as an anti knock agent to increase the octane number and as a lubricant for the valve seats of engines. Lead emissions have serious health fallout. Indian cities have largely been able to overcome the problem of lead pollution by completely switching over to unleaded petrol in 2000. The lead specification of leaded petrol, which was 0.56 gramme per litre (gm/l) during 1994, has been reduced to a trace amount of 0.013 gm/l in Euro I and II equivalent unleaded petrol. It has been further reduced to 0.005 gm/l in the Euro III equivalent unleaded petrol available in 11 Indian cities.
Lead levels have also reduced in the ambient air – they have dropped by over 70 % in cities where they are monitored. For instance, in the traffic intersections of Delhi, the ambient lead levels dropped by nearly 74 % in cities where they are monitored. For instance, in the traffic intersections of Delhi, the ambient lead levels dripped by nearly 74 % in 2001 compared to the levels recorded in 1994.
Benzene
There is little information available on the levels of air toxics that include a wide range of volatile organic compounds (VOCs), including benzene, toluene and xylene as there are not yet routinely monitored under the National Air Quality Monitoring Program. However the Central Pollution Control Board (CPCB) publishes special reports based on specific studies and these tend to indicate the high levels of benzene in various cities. For instance, high benzene levels have been reported by CPCB from its short term monitoring in Kolkata and Kanpur.
0
20
40
60
80
100
120
2000 2001 2002 2003 2004 2005 2006
Rising Trend