Seed System Innovations in the Semi-Arid Tropics ... - GOV.UK
• • •
Publisher:
Carlos III University of Madrid. Figuerola Institute of Social Sciences History
www.uc3m.es/if
Series:
Working Papers in Economic History
ISSN: 2341-2542
Electronic version of these working paper series available on:
http://hdl.handle.net/10016/16
This work is licensed under a Creative Commons Attribution-NonCommercial-
NoDerivatives 4.0 International License.
1
Brazilian export growth and divergence in the tropics during the nineteenth century
Christopher David Absell1
Antonio Tena-Junguito2
Abstract. The objective of this paper is to reappraise both the accuracy of the official export statistics and the conventional narrative of Brazilian export growth during the period immediately following independence. We undertake an accuracy test of the official values of Brazilian export statistics and find evidence of considerable under-valuation. Once corrected, during the post-independence decades (1821-1849) Brazil’s current exports represented a larger share of its economy and its constant growth is found to be more dynamic than any other period of the nineteenth century. We posit that this dynamism was related to an exogenous institutional shock in the form of British West Indies slave emancipation that afforded Brazil a competitive advantage.
Keywords. Brazil, trade accuracy, export growth, American tropical exports, nineteenth century
JEL Classification: F14, N76
1 Departamento de Ciencias Sociales, Universidad Carlos III de Madrid, [email protected]. 2 Departamento de Ciencias Sociales, Instituto Figuerola de Historia y Ciencias Sociales, Universidad Carlos III de Madrid, [email protected].
2
Brazilian export growth and divergence in the tropics during the nineteenth century
Christopher David Absell (Universidad Carlos III de Madrid)
Antonio Tena-Junguito (Universidad Carlos III de Madrid)
Abstract. The objective of this paper is to reappraise both the accuracy of the official export statistics and the conventional narrative of Brazilian export growth during the period immediately following independence. We undertake an accuracy test of the official values of Brazilian export statistics and find evidence of considerable under-valuation. Once corrected, during the post-independence decades (1821-1849) Brazil’s current exports represented a larger share of its economy and its constant growth is found to be more dynamic than any other period of the nineteenth century. We posit that this dynamism was related to an exogenous institutional shock in the form of British West Indies slave emancipation that afforded Brazil a competitive advantage.
'The great desideratum of every student of national finance and economy must be a thorough and trustworthy compilation of the respective statistics, that, embracing a long period, will afford a safe basis on which to found deductions, without which all conclusions are little better than mere speculations.' J. P. Wileman3
Brazil's export sector is the focal point of much of the country's economic historiography. It
has been described as the motor of the Brazilian economy during the nineteenth century.4 For better
or for worse, the export sector was the principal source of the productivity growth of the Brazilian
economy. It was the magnet for the first waves of foreign capital investment, the initiator of railway
expansion, and an important contributor to the government's coffers.5 Furthermore, it defined
Brazil's role in the world economy as a member of the primary product producing periphery during
the first globalisation. For these reasons, much of the economic history of the country has been
dedicated to the export sector, covering almost every conceivable aspect of its development. The
3 J. P. Wileman, Brazilian Exchange: the study of an inconvertible currency, (Buenos Aires: Galli Bros., 1896), p. 129. 4 See Nathaniel H. Leff, 'Tropical Trade and Development in the Nineteenth Century: The Brazilian Experience,' Journal of Political Economy, 81: 3 (May-June, 1973), p. 690. 5 Marcelo de Paiva Abreu and Luiz Aranha Correa do Lago, 'Property rights and the fiscal and financial systems in Brazil: colonial heritage and the imperial period,' in Michael D. Bordo and Roberto Cortés-Conde (eds.), Transferring Wealth and Power from the Old to the New World: Monetary and Fiscal Institutions in the 17th through the 19th centuries, (Cambridge: Cambridge University Press, 2001), pp. 327-377; Nathaniel H. Leff, 'Economic Development in Brazil, 1821-1913,' in Stephen Haber (ed.), How Latin America Fell Behind: Essays on the Economic Histories of Brazil and Mexico, 1800-1914, (Stanford: Stanford University Press, 1997), p. 35.
3
country's export performance is a defining aspect of this history. Much of the historiography of this
export performance has been based on an analysis of official Brazilian export statistics. Until now,
however, the accuracy of these statistics has not been verified to a satisfactory extent. The objective
of this paper is therefore to test the official Brazilian export statistics for their accuracy, utilising a
methodology that has proven fruitful in other case studies. As we shall see, the official values of
Brazilian export statistics demonstrate a bias that distorts our understanding of Brazil's export
performance during the first half of the nineteenth century. When reappraised and put into
comparative perspective, it becomes apparent that Brazilian export growth during the post-
independence decades was more dynamic than any other period of the nineteenth century.
These conclusions do not sit well with the conventional narrative of this period. Traditionally,
economic historians have focused on the second half of the century, when Brazil entered a 'novo
equilíbrio econômico' in which coffee in the south-east was the principal protagonist in the growth
of the quantum and value of the country's exports. During the period from independence to mid-
century, according to the conventional narrative, Brazil remained a stagnant, 'sleeping giant.'6
Although the process of independence was not overwhelmingly detrimental to export growth, the
first few decades of independence were described as being anything but dynamic. As classic studies
by Caio Prado Júnior and Celso Furtado both indicated, this was largely due to the demise of the
eighteenth century gold rush and the stagnation and decadence of the previously dominant sugar
and cotton export industries in the north-east of the country. Furthermore, according to this
narrative, export growth was impeded by other factors including seemingly insurmountable internal
trade costs, political and institutional instability, technological backwardness and the profound
scarcity of factors of production.7
6 Teresa A. Meade, A Brief History of Brazil, 2nd Edition, (New York: Infobase, 2010), p. 89; Werner Baer, The Brazilian Economy: Growth and Development, 5th Edition, (Connecticut: Praeger, 2001), pp. 16-18; Albert Fishlow, 'Brazilian Development in Long-Term Perspective,' The American Economic Review, 70: 2 (May, 1980), p. 102; Paulo Nogueira Batista Jr., 'Política tarifária britânica e evolução das exportações brasileiras na primeira metade do século XIX,' Revista Brasileira de Economia, 34: 2 (1980), p. 204. 7 Caio Prado Júnior, História Econômica do Brasil, 38a edição, (São Paulo: Editora Brasiliense, 1990). pp. 192-204;
4
This traditional narrative has been taken to task by much of the empirical work on the
Brazilian economy during this period. Amongst the first scholars to seriously '...check the relevance
of the stylised facts...' was Nathaniel Leff, who argued that the second half of the century was not as
dynamic as previous descriptive studies had claimed.8 Furthermore, Leff's calculations revealed that
export growth during the post-independence period was in fact more dynamic that the second half
of the century.9 Leff was primarily concerned with overall income growth, however, and his
conclusions emphasised the importance of the regional disparity in export growth and its impact on
the country's long-run income distribution.10 What's more, his conclusions were based on the
official trade statistics and, given Leff's recognition of the limitations of these statistics, were thus
tentative. Leff's work has been complemented by a growing revisionist literature that, as we shall
see in the following section, paints a more dynamic picture of the post-independence Brazilian
economy.
Here we confront the conventional perception of Brazil through an analysis of the country's
corrected export series. The paper is structured as follows. The next section outlines the revisionist
narrative of early Brazilian economic dynamism. The second section concerns the accuracy and
reconstruction of Brazil's export statistics. The third section reappraises the country's export
performance. Concentrating on the post-independence period, we then place this performance in
comparative perspective and provide an empirical basis for the revisionist narrative. Based on an
examination of the empirical evidence regarding comparative growth rates and export market shares
in the tropical Americas, we posit that the abolition of slavery in the British West Indies provided
Celso Furtado, Formación económica del Brasil, (México D. F.: Fondo de Cultura Económica, 1962) pp. 113-123. On the decline of gold and the cotton and sugar industries in the eighteenth century, see Roberto Cockrane Simonsen, Historia económica do Brasil: (1500-1820): curso professado na escola livre de sociología e politica de São Paulo, (São Paulo: Companhia Editora Nacional, 1957). 8 Nathaniel H. Leff, 'A Technique for Estimating Income Trends from Currency Data and an Application to Nineteenth-Century Brazil,' Review of Income and Wealth, 18: 4 (1972), p. 363. Leff used on data on the currency stock, together with official export statistics, to estimate the long-run trend of income growth. 2.7 percent from independence to 1869, 2.1 percent from 1869 to 1894, and 4.3 percent 1995 to 1913. 9 Leff, 'Tropical Trade and Development in the Nineteenth Century,' Table 4, p. 683. 10 Nathaniel H. Leff, Economic Development and Regional Inequality: Origins of the Brazilian Case,' The Quarterly Journal of Economics, 86: 2 (May, 1972), pp. 243-262.
5
Brazil a competitive advantage that incentivised producers to expand the country's factor
endowment through the large scale importation of slaves and the expansion of the agricultural
frontier. The final section concludes.
The revisionist narrative of early Brazilian economic dynamism
Our results notwithstanding, there are other indications that Brazil's post-independence
economy was much more dynamic than conventionally thought. Using alternative indicators of
economic dynamism, an emerging revisionist strand of the literature has recast the Brazilian
experience in a more dynamic and geographically disparate light. To begin with, being relatively
free of the political and institutional instability conventionally associated with the process of
independence, Brazil has served as an exception to the lost decades argument. As Leandro Prados
de la Escosura noted, in the context of Latin American independence, Brazil provided '… a
counterpoint of stability and gradual institutional transition while opening up to international
commodity and factor markets.'11 Unlike most of Spanish America, imperial collapse did not come
with the baggage of balkanisation or anti-trade policy that characterised other countries of the
region. Independence, in the Brazilian sense, was transition rather than revolution.12 Furthermore,
Brazil did not experience the institutional turmoil derived from slave abolition until much later in
11 Leandro Prados de la Escosura, 'Lost Decades? Economic Performance in Post-Independence Latin America,' Journal of Latin American Studies, 41 (2009), p. 281. Also see Robert H. Bates, John H. Coatsworth, and Jeffrey G. Williamson, 'Lost Decades: Postindependence Performance in Latin America and Africa,' The Journal of Economic History, 67: 4 (December 2007), p. 921; Alan Dye, 'The Institutional Framework,' in Victor Bulmer-Thomas, John Coatsworth, and Roberto Cortés Conde, eds., The Cambridge Economic History of Latin America. Volume II: The Long Twentieth Century. (Cambridge: Cambridge University Press, 2006). Although independence has been recognised as a costly process in terms of the temporary loss of fiscal sovereignty due to the payment of indemnities to Portugal and the continuation of a tariff agreement with Great Britain, this was offset by preferential access to the markets of its principal trading partners. On the fiscal impact of independence, see Paiva Abreu and Correa do Lago, 'Property rights and the fiscal and financial systems in Brazil,' pp. 338-340. For the case of Great Britain see Alan K. Manchester, British Preeminence in Brazil, its Rise and Decline: A study in European Expansion, (Chapel Hill: University of North Carolina Press, 1933), pp. 70-98. United States import duties for coffee also declined considerably during the decades following independence, dropping from five cents a pound in 1814 to exemption after 1832. See Steven Topik, 'The World Coffee Market in the Eighteenth And Nineteenth Centuries, from Colonial To National Regimes,' London School of Economics, Department of Economic History, Working Papers of the Global Economic History Network, No. 04/04, 2004, p. 23. 12 However, Brazil was by no means immune from border disputes or secessionist revolts during the post-independence period. See Victor Bulmer-Thomas, The Economic History of Latin America since Independence, (Cambridge: Cambridge University Press, 2003), p. 20.
6
the century and only after suffering from a prolonged series of restrictions to its Atlantic slave trade.
While Brazil remained relatively free of the domestic institutional shocks associated with
independence, institutional change plays an important role in the narrative of Brazil's early
dynamism. As a number of scholars have argued, the external conditions for the expansion of
Brazil's export economy were especially propitious during the post-independence decades. On the
demand side, the consumption of Brazil's commodities in the industrialising core steadily expanded
across the century. On the supply side, the hangover of the Haitian Revolution and the institutional
shock of slave emancipation in the British West Indies in 1833 effectively opened room for more
competitive tropical agricultural producers.13 The export economies of those countries that
remained slave plantation economies, such as Brazil, Cuba, Puerto Rico, and the Southern slave
plantations of the United States expanded rapidly during the same period.14
Indications of this expansion and the accompanying economic dynamism are present in the
revisionist literature. The work of numerous scholars on the slave trade has revealed the prodigious
numbers of slave arrivals during the post-independence period. The Atlantic slave trade, in the
words of Herbert Klein and Francisco Vidal Luna, '...reached its peak in the third decade of the
nineteenth century.'15 Brazil was at the centre of this trade, drawing the major part of slave
importations during the period between independence and the abolition of the Brazilian slave trade
in 1850.16 During the period from 1821 to 1830, more slaves were imported into Brazilian ports
than any other destination during any decade in the recorded history of the Atlantic slave trade.17
13 The slave trade was abolished by Great Britain in 1807. It wasn't until 1833 with the Slave Abolition Act that full emancipation occurred. 14 Leff, 'Tropical trade and development in the nineteenth century,' pp. 684-686; Herbert S. Klein and Francisco Vidal Luna, Slavery in Brazil, (Cambridge: Cambridge University Press, 2010); Victor Bulmer-Thomas, The Economic History of the Caribbean since the Napoleonic Wars, (Cambridge: Cambridge University Press, 2012), pp. 41-45, 169-178; Batista Jr., ' Política tarifária britânica e evolução das exportações brasileiras,' pp. 215-223; On the British West Indies, see R. B. Sheridan, 'The West Indian sugar crisis and British slave emancipation, 1830-1833,' Journal of Economic History, 21 (1961), pp. 539-551; L. J. Ragatz, The Fall of the Planter Class in the British Caribbean, 1763-1833, (New York: Octagon Books, 1963); J. R. Ward, 'The Profitability of Sugar Planting in the British West Indies, 1650-1834,' The Economic History Review, 31: 2 (May, 1978), pp. 197-213. 15 Klein and Vidal Luna, Slavery in Brazil, p. 74. 16 ibid., pp. 78-79; Luiz Aranha Corrêa do Lago, 'O surgimento da escravidão e a transição para o trabalho livre no Brasil: um modelo teórico simples e uma visão de longo prazo,' Revista Brasiliera de Economia, 42: 4 (1988), p. 329. 17 See Herbert S. Klein, The Atlantic slave trade, (Cambridge: Cambridge University Press, 1999), pp. 210-211,
7
While the anti-slave trade law of 1831, the product of unyielding political pressure from the British,
curtailed importations for a number of years, the illicit trade continued and expanded considerably
after 1837 until final abolition in 1850.18 Although the ports and, after 1831, clandestine
disembarkation sites in the south-east received the largest share of imports, a similar trend is
observed in the north-east, effectively feeding the expansion of sugar plantations.19 The demand for
labour was apparently so high that a considerable rise in slave prices – which began in the late
1820s, seemingly in anticipation of abolition – did not curtail importations.20 After 1850 and the
closure of the slave trade, an internal redistribution of the slave population from the north-east to
the south-east took place, until eventual abolition and government subsidised immigration later in
the century.21
The unprecedented demand for labour and its long-run appreciative price trend after 1830,
coupled with the land-intensive nature of Brazil's export industries, implies a concurrent expansion
of the agricultural frontier. To be sure, the country possessed a relatively superior endowment of
fertile land in the south-east that – due to climatic conditions – favoured the cultivation of coffee.22
In the north-eastern regions – particularly around the Recôncavo in Bahia but also in Pernambuco –
appendix Table A.2, which gives the following figures for Brazil (in thousands of slaves):1801-1810: 241.3, 1811-1820: 327.7, 1821-1830: 431.4, 1831-1840: 334.3, 1841-1850: 378.4, 1851-1860: 6.4. 18 Leslie Bethell, The Abolition of the Brazilian Slave Trade: Britain, Brazil and the Slave Trade Question, (Cambridge: Cambridge University Press, 1970), chapters 3, 12 and appendix. 19 Klein and Vidal Luna, Slavery in Brazil, p. 153. For Bahia see Bert Jude Barickman, A Bahian Counterpoint: Sugar, Tobacco, Cassava, and Slavery in the Recôncavo, 1780-1860, (Stanford: Stanford University Press, 1998), p. 137; Stuart B. Schwartz, Sugar Plantations in the Formation of Brazilian Society: Bahia, 1550-1835, (Cambridge: Cambridge University Press, 1985), p. 343. For Pernambuco, see J. H. Galloway, 'The Sugar Industry of Pernambuco during the Nineteenth Century,' Annals of the Association of American Geographers, 58: 2 (June, 1968), pp. 285-303. 20 On slave prices in Bahia, see Barickman, A Bahian Counterpoint, p. 139. For long-run slave price trends in Minas Gerais and Rio de Janeiro, see Klein and Vidal Luna, Slavery in Brazil, pp. 98-299. For a comparison with Cuba, see David Eltis, Economic Growth and the Ending of the Transatlantic Slave Trade, (Oxford: Oxford University Press, 1987), Appendix C. 21 On the internal slave trade: Herbert S. Klein, 'The Internal Slave Trade in Nineteenth-Century Brazil: A Study of Slave Importations into Rio de Janeiro in 1852', The Hispanic American Historical Review, 51: 4 (Nov., 1971), pp. 567-585. On abolition see Robert Edgar Conrad, The Destruction of Brazilian Slavery, 1850-1888, (University of California Press: California, 1972); Bethell, The Abolition of the Brazilian slave trade; Klein and Vidal Luna, Slavery in Brazil, chapter 10. On immigration see Nathaniel H. Leff, 'Economic Retardation in Nineteenth-Century Brazil,' The Economic History Review, 25: 3 (Aug., 1972), p. 494. 22 Stanley J. Stein, Vassouras, a Brazilian Coffee County, 1850-1900: The Roles of Planter and Slave in a Plantation Society, (Princeton: Princeton University Press, 1985); Antonio Delfim Netto, O problema do café no Brasil, (São Paulo: Instituto de Pesquisas Econômicas, 1981); Warren Dean, With Broadax and Firebrand: The Destruction of the Brazilian Atlantic Forest, (California: University of California Press, 1995).
8
large swathes of uncultivated land allowed for the gradual expansion of sugar, tobacco and cocoa
plantations.23 Moreover, there are clear indications of frontier expansion during the decades
following independence. The years from 1830 to 1834 recorded the highest number of new sugar
engenho registrations in Bahia during the nineteenth century.24 There are also indications of a
similar trend in the number of fazendas in the south-east.25 From independence until 1850 there
were effectively no institutional barriers to the definition of land rights. Besides the pre-existing
land titles (sesmarias) granted by the Crown before independence, the definition of property rights
during the first three decades of the independent Empire was achieved through informal occupation
(posse). While the ambiguous nature of property rights frequently resulted in conflict, there were
few institutional impediments to the expansion of cultivation, particularly by the more powerful
‘large scale squatters.’26 The Land Law (Lei de Terras) of 1850 recognised all previously claimed
posses and sesmarias but prohibited the informal occupation of land, instead only allowing for
acquisition through purchase.27
This frontier expansion, however, was hindered by a number of factors. The lack of
institutionalisation that applied to property rights in land also applied to the financial system. There
was a significant scarcity of private financial institutions before mid-century. In the absence of such
institutions, planters were in large part beholden to the services of intermediaries (comissarios) for
credit. 28 Inheritance, marriage and personal loans from non-bank lenders were other informal ways
23 For Bahia, see Barickman, A Bahian Counterpoint, chapter 5. For Pernambuco, Galloway, 'The Sugar Industry in Pernambuco.' 24 Barickman, A Bahian Counterpoint, p. 36; for the number of mills in Pernambuco, see Peter L. Eisenberg, The Sugar Industry in Pernambuco: Modernization without Change, 1840-1910, (California: University of California Press, 1974), Appendix 3. 25 For the case of São Paulo, see Francisco Vidal Luna and Herbert S. Klein, Slavery and the Economy of São Paulo, 1750-1850, (Stanford: Stanford University Press, 2003), pp. 56-57. 26 Paiva Abreu and Correa do Lago, 'Property rights and the fiscal and financial systems in Brazil,' p. 327. 27 Lee J. Alston, Gary D. Libecap, and Bernardo Mueller, Titles, Conflict, and Land Use: The Development of Property Rights and Land Reform on the Brazilian Amazon Frontier, (Michigan: University of Michigan Press, 1999), p. 35; Marcelo de Paiva Abreu and Luiz Aranha Correa do Lago, 'A economia brasileira no Império, 1822-1889,' in Marcelo de Paiva Abreu (ed.), A Ordem do Progresso, Edição Atualizada: Dois Séculos De Política Econômica No Brasil, (Rio de Janeiro: Elsevier, 2014); Warren Dean, 'Latifundia and Land Policy in Nineteenth-Century Brazil,' The Hispanic American Historical Review, 51: 4 (Nov., 1971), pp. 606-625. 28 In the case of sugar, see Eisenberg, Sugar Industry in Pernambuco, pp. 63-67: for coffee see Stein, Vassouras, pp. 17-20.
9
of obtaining credit. Given the speculative nature of much of this borrowing and the lack of a
regulatory framework, the cost of borrowing during this period was generally quite high.29 Despite
the lack of financial institutionalisation, indicators of non-bank financial transactions show steady
growth during the decades following independence.30 Furthermore, Zephyr Frank's work on wealth
holding in the south east has shown that, rather than remaining stagnant, mean wealth grew over the
four decades after independence. Frank's examination of the credit market in São João del-Rei in
the state of Minas Gerais during the post-independence period revealed a 'vast informal credit
market' associated with the domestic and export economy.31
Another important factor was unfavourable geography and a high incidence of transport costs.
Infrastructure was rudimentary at best; before the introduction of rail, the common mode of
transport was the mule. Such costs affected not only the profit margin of producers but also the
productivity of plantations. In the case of coffee, Herbert Klein estimated that one-third of a
fazenda's slave labour force was dedicated to the transportation of coffee sacks to market.32 Thus
the expansion of the agricultural frontier was limited until the development of the rail network that
took place after the 1860s.33 In fact, like many economies in Latin America, investment in transport
infrastructure was largely driven by the demands of the planters.34 Construction did not begin until
1852 and continued during the final half of the nineteenth century, effectively generating large 29 Joseph Ryan, 'Credit where Credit is Due: Lending and Borrowing in Rio de Janeiro, 1802--1900,' unpubl. PhD diss., UCLA, 2007; Eisenberg, quoting 1875 report by the Commissões da Fazenda e Especial: 'The interest rate in some provinces ranges from 7 percent to 12 percent, and in other from 18 percent to 24 percent, and in still other from 48 percent to 72 percent.' Eisenberg, Sugar Industry in Pernambuco, p. 63. 30 Ryan, 'Credit where credit is due,' p. 88. 31 Zephyr Frank, 'Wealth Holding in Southeastern Brazil, 1815–60,' Hispanic American Historical Review 85: 2 (2005), pp. 242-246. For the case of Minas Gerais, see Amilcar Martins Filho and Roberto B. Martins, 'Slavery in a Nonexport Economy: Nineteenth-Century Minas Gerais Revisited,' Hispanic American Historical Review, 63: 3 (Aug., 1983), pp. 537-568; Laird W. Bergad, Slavery and the Demographic and Economic History of Minas Gerais, Brazil, 1720-1888 (Cambridge: Cambridge University Press, 1999). 32 Herbert S. Klein, 'The Supply of Mules to Central Brazil: The Sorocaba Market, 1825-1880,' Agricultural History, 64: 4 (Fall 1990), pp. 1-25. 33 For the expansion of the railway and associated social savings costs see William R. Summerhill, 'Big Social Savings in a Small Laggard Economy: Railroad-Led Growth in Brazil,' The Journal of Economic History, 65: 1 (Mar., 2005), pp. 74-75. 34 William R. Summerhill, 'The Development of Infrastructure,' in Victor Bulmer-Thomas, John Coatsworth and Roberto Cortes-Conde (eds.), The Cambridge Economic History of Latin America: Volume 2, The Long Twentieth Century, (Cambridge: Cambridge University Press, 2006), pp. 293-328. For the case of Cuba, see Oscar Zanetti and Alejandro García, Sugar and Railroads: A Cuban History 1837-1959, (Chapel Hill: University of North Carolina Press, 1998).
10
social savings for freight services and providing an impetus to the development of the domestic
market.35 Despite the lack of infrastructure and associated transport costs, however, it is evident that
the supply of traditional modes of transportation increased alongside the expansion of export
industries. According to Klein's estimates, the average arrival of mules to the Sorocaba market in
the state of São Paulo doubled during the 1830s and showed a steadily increasing trend until the
1870s.36 Aida Lavalle and Carlos Suprinyak observed similar tendencies in Rio Negro and
Itapetininga, respectively.37
Here we seek to provide a solid empirical basis for the revisionist narrative of Brazilian export
dynamism during the post-independence decades. Before doing so, however, a thorough analysis
and reconstruction of the Brazilian export series is necessary.
The reconstruction of Brazil's export statistics
Foreign trade statistics are perhaps unique in the statistical universe for being a useful case of
double accounting: the quantity and value of imported and exported commodities appear in records
of differing nationalities. This allows for a comparison of these records in order to ascertain the
accuracy of origin or destination statistical sources. Unfortunately, at least for the period under
examination, there existed no homogeneous international classification system regulating foreign
trade statistics. The absence of such regulation engendered a debate regarding the reliability of these
statistics.38 Oskar Morgenstern's observation that 'Writers on all phases of foreign trade will have to
assume the burden of proof that the figures on commodity movements are good enough...'39 has
35 William R. Summerhill, Order against progress: government, foreign investment and railroads in Brazil 1854-1913, (Stanford: Stanford University Press, 2003). 36 Klein, 'Supply of mules,' pp. 9-10. 37 Aida Mansani Lavalle, Análise quantitativa das tropas passadas no registro do Rio Negro (1830-1854). 1974. Tese (Livre Docência) – UFPR, Curitiba; Carlos Eduardo Suprinyak, Tropas em marcha: o mercado de animais de carga no centro-sul do Brasil imperial (São Paulo: Annablume, 2008), Chapter 2. 38 The pessimistic perspective is most eloquently articulated in Oskar Morgenstern, On the Accuracy of Economic Observations, (Princeton: Princeton University Press, 1963); for the optimistic perspective, see Giovanni Federico and Antonio Tena-Junguito. 'On the Accuracy of Foreign Trade Statistics (1909-1935): Morgenstern Revisited,' Explorations in Economic History, 28 (1991), pp. 259-273. 39 Morgenstern, On the Accuracy of Economic Observations, p. 180.
11
since led to a substantial amount of quantitative soul-searching by economic historians and students
of international trade. Although D. C. M. Platt was slightly less pessimistic about Latin American
trade statistics, his conclusions were still disheartening.40 Over the last few years the countries of
Latin America and the Caribbean have been subjected to an audit of their historical foreign trade
statistics.41 Much of this work has contradicted Morgenstern and Platt's pessimistic view of the
reliability of these statistics.
The accuracy of Brazil's historical foreign trade statistics, while being included in a number of
these studies, has not been conclusively evaluated. Certainly a number of scholars have recognised
and attempted to correct the limitations of these statistics. This work includes the correction of the
inclusion of bullion in the official series of exports and imports42 and the examination of the
accuracy of the official value of exports.43 These studies, however, have only focused on certain
periods, and have not definitively addressed problems involving the value and destination of official
export statistics. Here we focus primarily on the accuracy of the official values.
During the period under study, the official values of exports were fixed by the pauta semanal,
a price schedule issued on a weekly basis by a government committee in consultation with local
commodity brokers and commercial associations. The average weekly market prices of each
commodity included in the nomenclature of the pauta were 'verified' in the market before being
40 D. C. M. Platt, 'Problems in the Interpretation of Foreign Trade Statistics before 1914,' Journal of Latin American Studies, 3: 2 (1971), pp. 119-130. 41 For example, see Sandra Kuntz Ficker, 'Nuevas series del comercio exterior de México, 1870–1929,' Revista de Historia Económica/Journal of Iberian and Latin American Economic History, 20 (2002), pp. 213-270; Maria del Mar Rubio and Mauricio Folchi, 'On the Accuracy of Latin American Trade Statistics: a Nonparametric Test for 1925,' Universitat Pompeu Fabra. Departament d'Economia i Empresa Working Paper, 2005; Anna Carreras-Marín and Marc Badia-Miró, 'La fiabilidad de la asignación geográfica en las estadísticas de comercio exterior: América Latina y el Caribe (1908–1930),' Revista de Historia Económica/Journal of Iberian and Latin American Economic History, 26: 3 (2008), pp. 355-373; Antonio Tena-Junguito and Henry Willebald, 'On the accuracy of export growth in Argentina, 1870-1913,' Economic History of Developing Regions, 28: 1 (2013), pp. 28-68; Nicolás Bonino-Gayoso, Antonio Tena-Junguito and Henry Willebald, 'Uruguay and the First Globalization. On the accuracy of export performance, 1870-1913,' Working Papers in Economic History, WP 15-01, Carlos III University of Madrid. Figuerola Institute of Social Sciences History, 2015. 42 Luiz Aranha Correa do Lago, 'Balança comercial, balanço de pagamentos e meio circulante no Brasil no Segundo Império: uma nota para uma revisão,' Revista Brasileira de Economia, 36: 4 (1982), pp. 489-508; O comércio exterior do Brasil no Segundo Império: uma reavaliação (Rio de Janeiro: Fundação Getulio Vargas, 1986); Gustavo Henrique Barroso Franco, 'O balanço de pagamentos do Brasil, 1870-1896: novas estimativas,' Texto para Discussão No. 201. Departamento de Economia PUC-Rio, 1988.
12
published and sent to the Ministry of Finance, provincial customs houses and major periodicals.44
Export duties were collected at the port of shipment by applying the values listed in the pauta to the
quantities given in the manifests of the ocean going vessels.45 Until the end of the nineteenth
century the values used to calculate export statistics were those fixed by the pauta.46 Any bias in the
official price schedule would thus be reflected in the statistics. In 1900, after publishing his
landmark study of 1896, Brazilian Exchange: The Study of an Inconvertible Currency, the British
civil engineer J. P. Wileman was contracted by the Brazilian Ministry of Finance to assist in the
modernisation of the state's statistical apparatus and the creation of the Serviço de Estatística
Comercial.47 From 1901 onwards, the official trade statistics were published annually by the
Serviço in a publication that would assume the title Comércio Exterior do Brasil. The values listed
in this publication were calculated using the market price given at the port of departure.48 These
values included export duties and other transaction costs (such as the cost of cartage, packing and
loading) but not freight, insurance or landing costs.49
Due to the reliance upon official values for the calculation of export statistics during the
nineteenth century, the veracity of these values was sensitive to the fiscal exigencies of the
government, the influence of the brokers and commercial associations and the competencies of the
statistical apparatus of the state.50 Apart from the recognition of the possible inaccuracy of the
44 Brazil, Regulamento das Alfandegas e Mesas de Rendas, (Rio de Janeiro: Typographia Nacional, 1866), p. 242. 45 Brazil, Commercio Exterior do Brasil, 1910 a 1914, Vol. 1, (Rio de Janeiro: Directoria de Estatistica Commercial, 1915), p. XXI. 46 Wileman, Brazilian Exchange, p. 83. 47 Franco, 'O balanço de pagamentos do Brasil,' p. 2. 48 Although occasionally reference was made to the pauta. For example see Brazil, Importação e Exportação, Movimento maritimo, cambial e do café da Republica dos Estados Unidos do Brazil, (Rio de Janeiro: Imprensa Nacional, 1905), pp. 208-209. 49 Brazil, Commercio Exterior do Brasil, 1910 a 1914, Vol. 1, p. XXI. 50 While it is outside the purview of this paper to provide a comprehensive explanation for the bias shown in the official statistics, it is possible to offer a number of conjectures. One reason for the bias may be the influence of commercial associations. As Eugene Ridings observed, it was in the interest of export lobbies to reduce as much as possible the elasticity of the official price schedule with relation to ascending price movements in order to avoid an increased tax burden. If prices were descending, however, they would lobby for the frequent adjustment of official prices in order to avoid paying more taxes. See Eugene Ridings, Business interest groups in nineteenth-century Brazil. (Cambridge: Cambridge University Press), 1994, p. 199. Another possibility might be associated with exchange rate movements. Here we assess the accuracy of the official series in sterling prices, principally due to its use in the literature for comparative purposes. The pauta, however, was defined in terms of mil-réis prices. The sterling value depended on the
13
official values of Brazilian export statistics,51 however, the veracity of these values has been the
subject of little attention in the literature. Wileman included in Brazilian Exchange an examination
of the accuracy of official valuations for the period 1861 to 1888. He concluded that the official
statistics were marginally under-valued.52 Wileman assumed somewhat arbitrarily that trade and
transaction costs accounted for 15 per cent of the official value which included '...all expenditure
from date of purchase to delivery on board...' but excluded the cost of freight rates.53 This
assumption is difficult to sustain for the periods preceding (when freights weighed heavily on total
export value) and succeeding (when export duties for certain commodities sometimes exceeded 15
per cent) Wileman's study.
Here we confirm and extend Wileman's findings by way of the construction of a price accuracy
index for Brazilian exports during the period 1821 to 1913. Following the methodology commonly
employed in the literature to test for price accuracy,54 we collect the prices55 of a representative
sample of export commodities including cacao, coffee, cotton, hides, rubber and sugar. These prices
are then contrasted with their corresponding international prices.56
trend of the mil-réis values of the official series and the réis-sterling exchange rate. Any observed covariance between the mil-réis and sterling values of the official series would thus be explained by movements in the exchange rate. Effectively, the periods that demonstrate the greatest degree of under-valuation (such as the 1830s and 1890s) are those that also demonstrate the greatest covariance between the mil-réis and sterling values of the official series. These exchange rate movements were principally driven by variations in the income derived from coffee export revenues. For an analysis of the determinants of the exchange rate in Brazil during the nineteenth century, see Eliana A. Cardoso, 'Exchange rates in nineteenthcentury Brazil: An econometric model,' The Journal of Development Studies, 19: 2 (1983), pp. 170-178; Gustavo Henrique Barroso Franco, Reforma Monetária e Instabilidade Durante a Transição Republicana. (Rio de Janeiro: BNDES, 1987). 51 Franco, 'O balanço de pagamentos do Brasil,' p. 2; 'Setor Externo,' in Estatísticas Históricas do Brasil, Series Econômicas, Demográficas e Sociais de 1550 a 1988, 2a edição. (Rio de Janeiro: IBGE, 1990), p. 561. 52 Summarising his conclusions over three periods, Wileman estimated the ratio of local to foreign valuations as 97 per cent for the period 1865 to 1878, 88.3 per cent for the period 1879 to 1886, and 98 per cent for the period 1886 to 1888. Wileman's sample of trading partners included Great Britain, France, Belgium, Germany (Hamburg), the United States, Portugal, Austria, Uruguay and Argentina. To the total valuation of imports from Brazil to these countries was added 10 per cent for 'unspecified countries' and 15 per cent was subtracted to cover the freight factor. See Wileman, Brazilian Exchange, pp. 122-123. 53 ibid. p. 124. 54 Federico and Tena-Junguito, 'On the Accuracy of Foreign Trade Statistics;' Tena-Junguito and Willebald, 'On the accuracy of export growth in Argentina;' Antonio Tena-Junguito, Las estadísticas históricas del comercio internacional (1890-1960): fiabilidad y comparabilidad, (Madrid: Banco de España, Estudios de Historia Económica, no. 24, 1992). 55 This 'price,' as well as those derived from the U.K. import statistics, is effectively the computed unit value; that is, total value over total quantity. We take the official prices of these commodities from Brazil, Anuário Estatístico do Brasil de 1939/1940, (Rio de Janeiro: IBGE, 1941), pp. 1374-1378. 56 Tobacco and herva mate, while also occupying lesser but still important portions of Brazil's exports, have been dropped due to the absence of data on international prices. Even in the absence of these commodities, the sample covers
14
As a proxy for the average level of international prices, we have used two sources. For the
period 1850 to 1913, we use the prices derived from the United Kingdom's import statistics. We
assume that the latter reflect the international price of these commodities, an assumption that is
supported by a comparison of the U.K. data with Augustus Sauerbeck's series of international prices
of selected commodities.57 The period before 1850 is more problematic due to the absence of a
common point of reference such as the Sauerbeck series.58 In order to confirm the accuracy of this
period and achieve the most representative series possible, we have constructed a weighted average
of prices from different origins to the U.K. and Philadelphia for the commodities in the sample.59
An important consideration when choosing which price series to include in the weighted average is
the quality of the commodity in question. Coffee is a particularly difficult commodity in this regard
as quality is largely dependent upon the singular characteristics of each producer.60 To account for
this somewhat heterogeneous nature, we have included a wide range of series. Sugar, however, is a
different story. The majority of Brazilian exports of cane sugar during this period were of the
muscovado variety.61 We have thus excluded other qualities, such as white or beet varieties, from
the sugar series. While it is impossible to perfectly homogenise each weighted average by quality
given the limited information available, we have taken the utmost care to include only the price
an average of 88 per cent of the value of exports during the period in question, ranging from a minimum of 66.6 per cent in 1844/45 and a maximum of 93.9 per cent in 1895 according to official statistics. 57 The correlation coefficients of the selected commodities during the period 1854-1912 are as follows: coffee = 0.91, sugar =0.98, cotton = 0.99, hides = 0.84. 58 Import price data records of UK, France, and Belgium were valued at fixed prices respectively until 1854, 1847 and 1846 respectively. This implies that the use of these records to revaluate Brazil's official valuation are not useful and justifies the use of the international price series used here. 59 As weights we use the distribution of each origin in the sum of the quantum of exports of all origin countries for each commodity. For this period we are obliged to drop rubber from the sample due to the lack of international price data. This is not such a problem, however, as rubber occupied a marginal portion of Brazil's total exports. 60 See Steven Topik, 'The World Coffee Market in the Eighteenth and Nineteenth Centuries,' pp. 5-6. An additional consideration is the quality of Brazilian coffee included in the export statistics. These statistics do not disaggregate by quality. Prior to the 1890s, the nomenclature ranged from “superior” to “segunda ordinaria.” The prices of the qualities ranged from 6$950 to 2$200 per 10 kilograms in 1878. The official mil-réis unit value for 10 kilograms quoted in the Anuario Estatistico of 1939/40 is 4$555. In the early 1890s, the nomenclature used to classify Brazilian exports of coffee changed to reflect those qualities listed in the New York market. This nomenclature ranged from N. 4 to N. 9 in descending order of quality. The prices ranged from 8$6 to 15$1 per 10 kilograms in 1891, while the official statistic for this year is 8$814. The official unit values for 1878 and 1891 thus correspond with the quality “segunda boa” and its equivalent in the revised nomenclature, N. 6. See Retrospecto Commercial, various years. 61 For the period 1910 to 1913 it accounted for 57.73 per cent of total sugar exports. Brazil, Commercio Exterior do Brasil, 1910 a 1914, Vol. 1, pp. 72-75.
15
series of certain qualities that, where possible, reflect those qualities exported from Brazil.
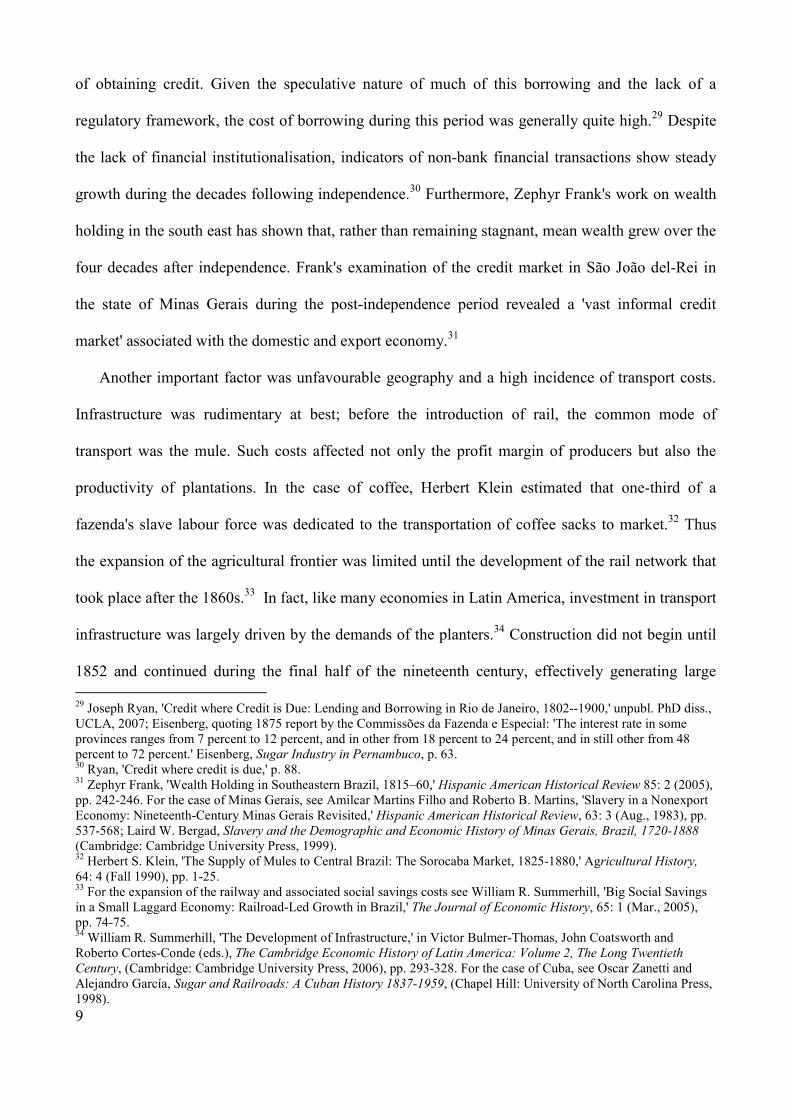
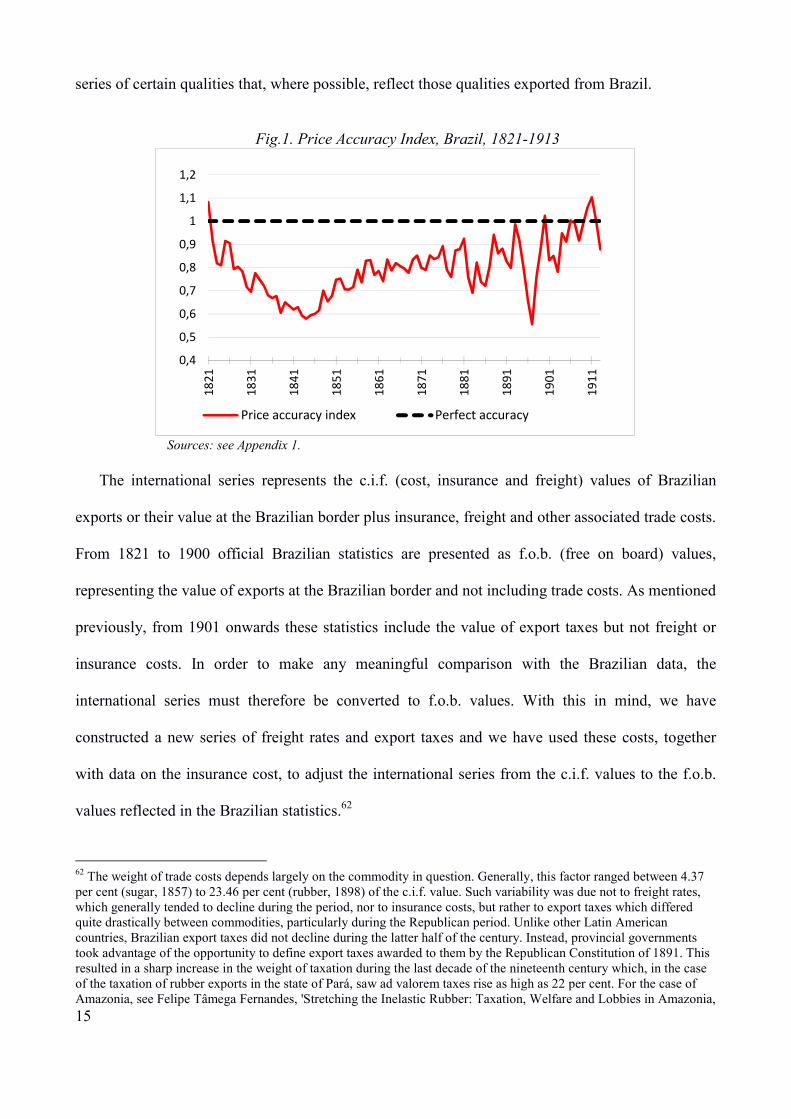
Fig.1. Price Accuracy Index, Brazil, 1821-1913
Sources: see Appendix 1. The international series represents the c.i.f. (cost, insurance and freight) values of Brazilian
exports or their value at the Brazilian border plus insurance, freight and other associated trade costs.
From 1821 to 1900 official Brazilian statistics are presented as f.o.b. (free on board) values,
representing the value of exports at the Brazilian border and not including trade costs. As mentioned
previously, from 1901 onwards these statistics include the value of export taxes but not freight or
insurance costs. In order to make any meaningful comparison with the Brazilian data, the
international series must therefore be converted to f.o.b. values. With this in mind, we have
constructed a new series of freight rates and export taxes and we have used these costs, together
with data on the insurance cost, to adjust the international series from the c.i.f. values to the f.o.b.
values reflected in the Brazilian statistics.62
62 The weight of trade costs depends largely on the commodity in question. Generally, this factor ranged between 4.37 per cent (sugar, 1857) to 23.46 per cent (rubber, 1898) of the c.i.f. value. Such variability was due not to freight rates, which generally tended to decline during the period, nor to insurance costs, but rather to export taxes which differed quite drastically between commodities, particularly during the Republican period. Unlike other Latin American countries, Brazilian export taxes did not decline during the latter half of the century. Instead, provincial governments took advantage of the opportunity to define export taxes awarded to them by the Republican Constitution of 1891. This resulted in a sharp increase in the weight of taxation during the last decade of the nineteenth century which, in the case of the taxation of rubber exports in the state of Pará, saw ad valorem taxes rise as high as 22 per cent. For the case of Amazonia, see Felipe Tâmega Fernandes, 'Stretching the Inelastic Rubber: Taxation, Welfare and Lobbies in Amazonia,
0,4
0,5
0,6
0,7
0,8
0,9
1
1,1
1,2
18
21
18
31
18
41
18
51
18
61
18
71
18
81
18
91
19
01
19
11
Price accuracy index Perfect accuracy
16
Figure 1 shows the general price accuracy index of the commodity sample for the years 1821
to 1913. If perfectly accurate, the adjusted international series should reflect the official Brazilian
f.o.b. export values. However the index clearly confirms Wileman's findings of under-valuation.
This under-valuation is particularly acute during the first half of the century. Furthermore, as
predicted, the series tends towards perfect accuracy after the institution of the Serviço de Estatística
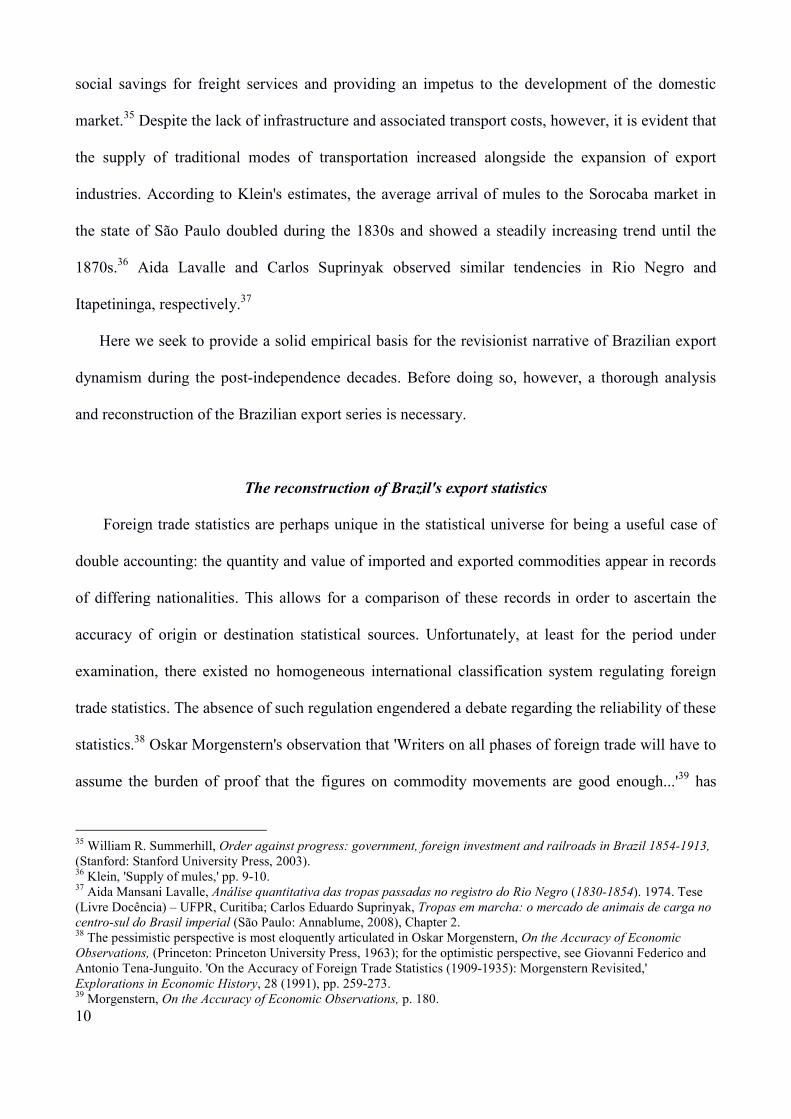
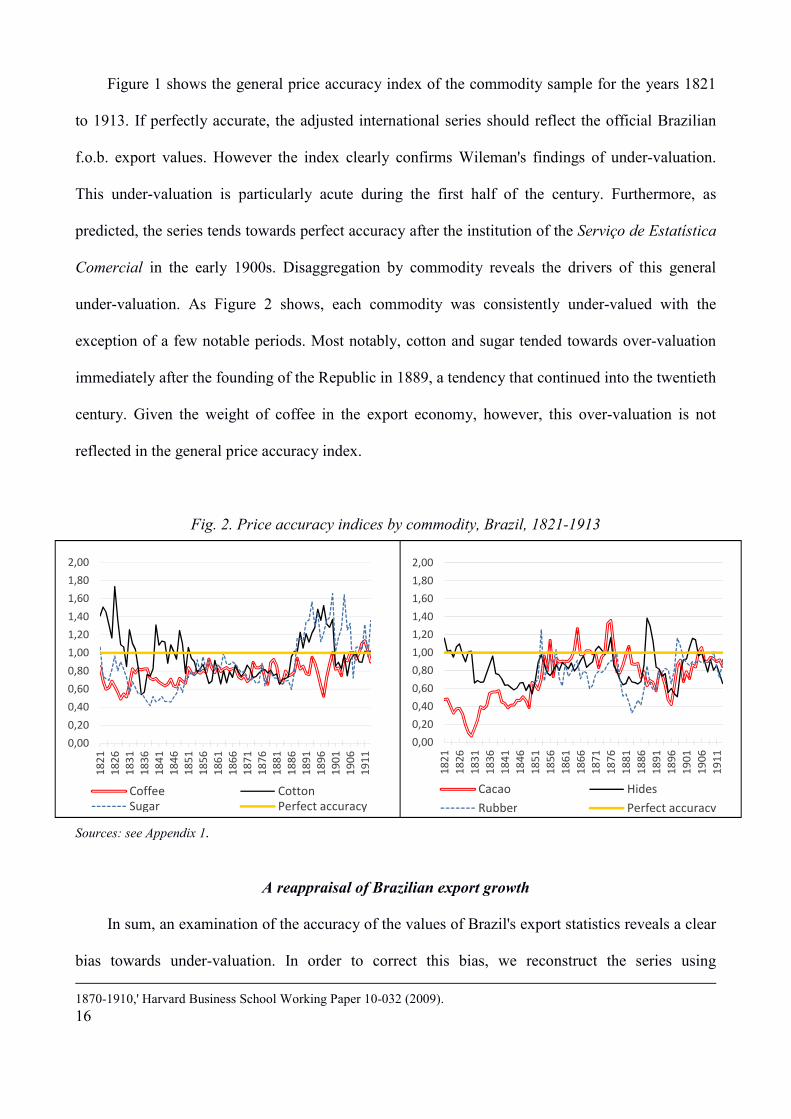
Comercial in the early 1900s. Disaggregation by commodity reveals the drivers of this general
under-valuation. As Figure 2 shows, each commodity was consistently under-valued with the
exception of a few notable periods. Most notably, cotton and sugar tended towards over-valuation
immediately after the founding of the Republic in 1889, a tendency that continued into the twentieth
century. Given the weight of coffee in the export economy, however, this over-valuation is not
reflected in the general price accuracy index.
Fig. 2. Price accuracy indices by commodity, Brazil, 1821-1913
Sources: see Appendix 1.
A reappraisal of Brazilian export growth
In sum, an examination of the accuracy of the values of Brazil's export statistics reveals a clear
bias towards under-valuation. In order to correct this bias, we reconstruct the series using 1870-1910,' Harvard Business School Working Paper 10-032 (2009).
0,00
0,20
0,40
0,60
0,80
1,00
1,20
1,40
1,60
1,80
2,00
18
21
18
26
18
31
18
36
18
41
18
46
18
51
18
56
18
61
18
66
18
71
18
76
18
81
18
86
18
91
18
96
19
01
19
06
19
11
Coffee Cotton
Sugar Perfect accuracy
0,00
0,20
0,40
0,60
0,80
1,00
1,20
1,40
1,60
1,80
2,00
18
21
18
26
18
31
18
36
18
41
18
46
18
51
18
56
18
61
18
66
18
71
18
76
18
81
18
86
18
91
18
96
19
01
19
06
19
11
Cacao Hides
Rubber Perfect accuracy
17
international prices. During the period under consideration the commodity structure of Brazil's
exports changed considerably. Although coffee played a leading role in the export sector from 1831
onwards, four other commodities also maintained substantial shares during different periods: cotton
(1821-1837, 1862-1874), hides (1821-1832, 1844-1846), sugar (1821-1885) and rubber (1886-
1913).63 Given the long-run nature of the study and the changes in Brazil's composition of exports it
is important to utilise a methodology that provides a balanced representation of the historical trend.
We thus elaborate a Fisher export price index using the corrected prices of the commodities in the
sample. This index is used to deflate the series from current to constant prices, from which the
growth rates are calculated. We compare the new growth rates to those calculated using a number of
other export price indices based on the official unit values. The first is a Fisher export price index
for the period from 1850 to 1913 which was elaborated by Reinaldo Gonçalves using the unit values
given in the official Brazilian statistics.64 Furthermore, we compare the reconstructed series to a
second export price index commonly used in the literature on export growth constructed by
Christopher Blattman, Jason Hwang and Jeffrey Williamson (hereinafter BHW) using the same
commodity sample and spanning the period from 1860 to 1913.65
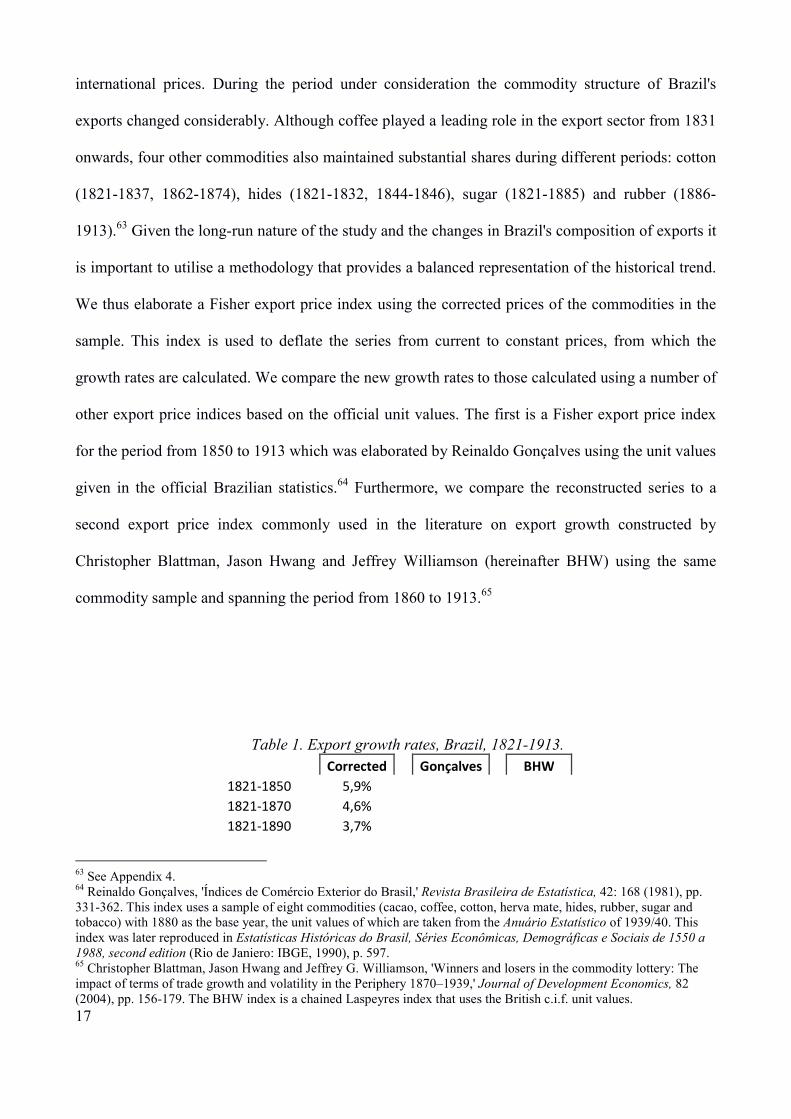
Table 1. Export growth rates, Brazil, 1821-1913.
Corrected
Gonçalves
BHW
1821-1850
5,9%
1821-1870
4,6%
1821-1890
3,7%
63 See Appendix 4. 64 Reinaldo Gonçalves, 'Índices de Comércio Exterior do Brasil,' Revista Brasileira de Estatística, 42: 168 (1981), pp. 331-362. This index uses a sample of eight commodities (cacao, coffee, cotton, herva mate, hides, rubber, sugar and tobacco) with 1880 as the base year, the unit values of which are taken from the Anuário Estatístico of 1939/40. This index was later reproduced in Estatísticas Históricas do Brasil, Séries Econômicas, Demográficas e Sociais de 1550 a 1988, second edition (Rio de Janiero: IBGE, 1990), p. 597. 65 Christopher Blattman, Jason Hwang and Jeffrey G. Williamson, 'Winners and losers in the commodity lottery: The impact of terms of trade growth and volatility in the Periphery 1870–1939,' Journal of Development Economics, 82 (2004), pp. 156-179. The BHW index is a chained Laspeyres index that uses the British c.i.f. unit values.
18
1821-1913
3,7%
1850-1870
2,8%
2,4%
1850-1890
2,3%
2,3%
1850-1913
2,8%
2,9%
1870-1890
1,3%
1,9%
0,9%
1870-1913
2,8%
3,1%
3,2%
1890-1913
4,3%
4,2%
5,3% Sources: see Appendices 1 and 2.
Table 1 displays the growth rates of exports derived from the new series at constant prices
alongside the official, Gonçalves and BHW series. We present both medium- and long-time periods
beginning from 1821, 1850 and 1870 in order to capture the changes in the composition of exports.
The two decades prior to the series represented here were characterised by considerable price
volatility, due in large part to the effect of the Napoleonic Wars. After 1818, however, the prices of
Brazil's principal export commodities began a gradual descent that ended in the 1830s.66 Although
quantum data for Brazilian exports after the end of the Portuguese trade monopoly in 1808 are
difficult to come by, descriptive evidence suggests that liberalisation had a positive impact on
Brazil's export industries during the decade prior to independence despite falling international
prices.67 As can be seen in Table 1, the period from 1821 to 1913 is not particularly exceptional,
with growth rates of the corrected series for the period from mid-century onwards lying between the
official and Gonçalves series and the dynamism of the BHW series. The period from 1821 to 1849,
however, reveals a much more dynamic panorama. Exports grew faster than any other period of the
nineteenth century at a rate of 5.9 per cent per annum. Further disaggregation of this period into
decades is even more revealing. The export growth of this period to a large degree took place during
66 Based on the elaboration of a chained Laspeyres-Fisher export price index, adjusted for trade costs, calculated from data on sugar, coffee, cotton, hides, and tobacco prices from Bezanson and Gayer et al. Prices rose rapidly from the beginning of hostilities until the French loss in the Battle of Trafalgar in 1805, fell consistently before rising again during the hostilities between the United Kingdom and the United States. For the economic impact of the Napoleonic Wars, see Bulmer Thomas, Economic History of the Caribbean, p. 78; Kevin O'Rourke, 'The worldwide economic impact of the French Revolutionary and Napoleonic Wars, 1793-1815,' Journal of Global History, 1, (2006), pp. 123-149. 67 Leslie Bethell, Brazil: empire and republic, 1822-1930, (Cambridge: Cambridge University Press, 1989), p. 6-7; Jose Luis Cardoso, 1808: o ano zero d autonoma economica do Brasil, in Pedro de Avillez (ed.), Rio de Janeiro, Capital do Imperio Portugues (1808-1821), (Parede: Tribuna a Historia, 2010), p. 120; Bergad, Slavery and the demographic and economic history of Minas Gerais, Chapter 2.
19
the decade immediately following independence.
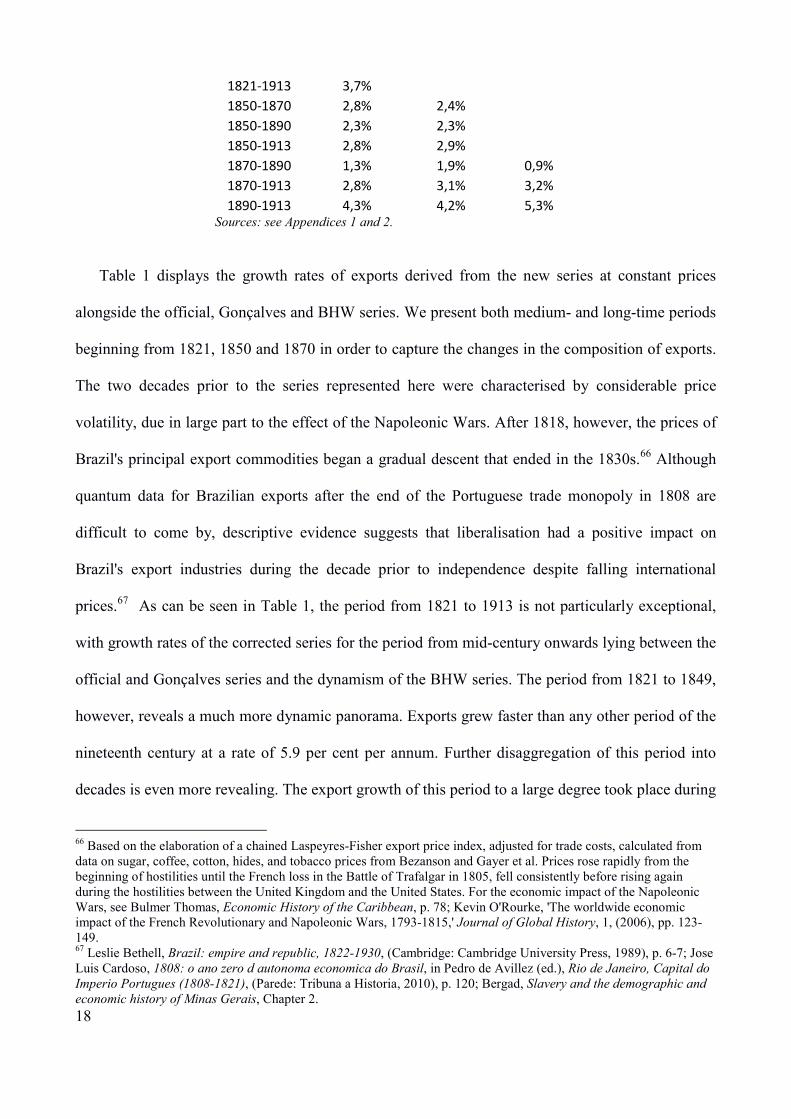
Table 2. Volume and prices commodity growth rates. Brazil, 1821-1913
1821-50 1850-70 1870-90
1890-
1913
1870-
1913
1821-
1913
1850-
1913
volume
Cacao 5.00% 0.66% 1.69% 7.10% 4.48% 3.71% 3.24%
Coffee 9.72% 2.98% 2.03% 4.34% 3.19% 5.09% 3.08%
Cotton 1.26% 5.60% -6.52% 4.90% -0.38% 1.38% 1.46%
Hides 2.37% 1.62% -0.24% 3.36% 1.65% 1.83% 1.61%
Rubber -- 7.70% 6.02% 3.88% 4.76% -- 5.58%
Sugar 4.57% 0.13% 0.28% -14.62% -7.53% -2.06% -5.06%
prices
Cacao -1.48% 1.43% 2.93% 0.24% 1.45% -0.01% 1.42%
Coffee -4.48% 0.46% 2.26% -0.81% 0.60% -0.69% 0.55%
Cotton -2.67% 2.06% -2.89% 1.10% -0.73% -0.02% 0.14%
Hides -1.64% -0.39% -1.05% 4.80% 2.04% 0.71% 1.26%
Rubber -- 3.75% 0.94% 0.41% 0.64% -- 1.58%
Sugar -0.73% -0.13% -3.11% -0.79% -1.82% -1.29% -1.27%
Sources: see Appendices 1 and 2.
Disaggregation by commodity reveals the drivers of this initial dynamism. Table 2 displays the
growth rates of the value of Brazil's principal export commodities in constant prices. Coffee was the
principal protagonist of this period, exhibiting a growth rate in its sterling value of 9.7 per cent per
annum. Sugar, although showing considerably less dynamism at 4.6 per cent per annum, was far
from the stagnation and decadence that would characterise its experience in the latter half of the
century. On the other hand, cotton, which had occupied such a central role in the export growth of
the north-east during the late eighteenth century, was clearly showing signs of stagnation at 1.3 per
cent per annum. It must be noted that the unparalleled growth of sugar and coffee occurred during a
period in which international prices were generally declining.
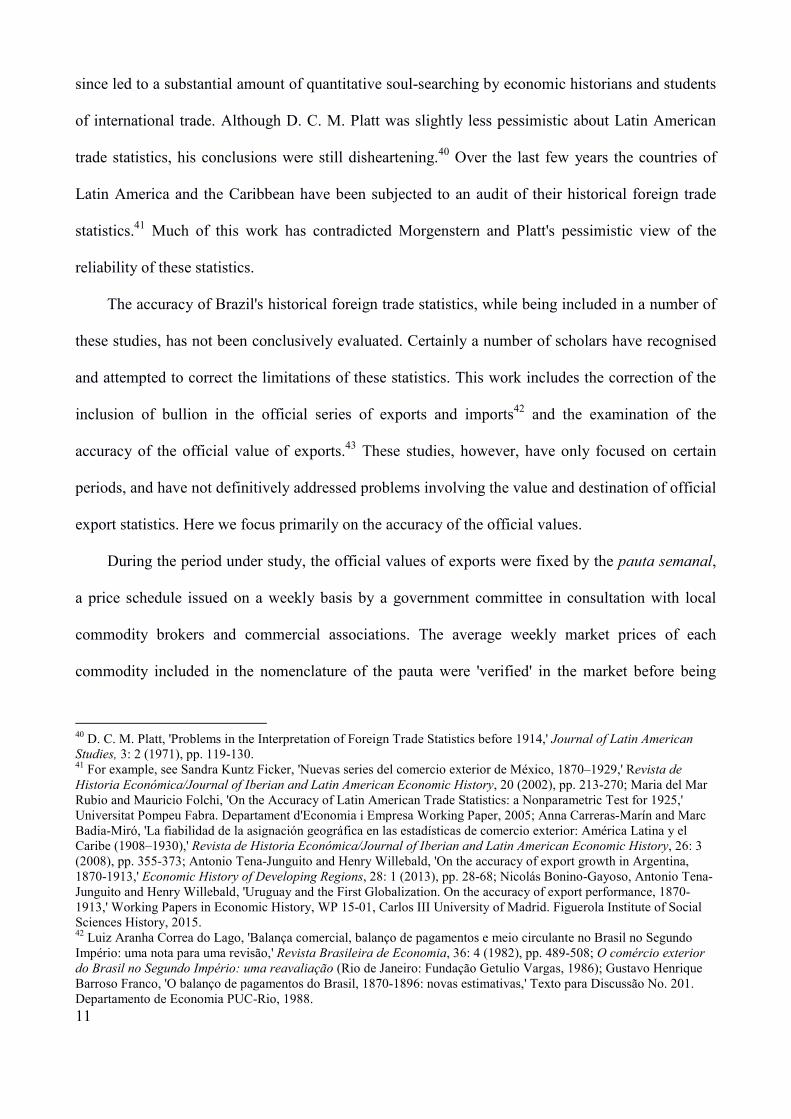
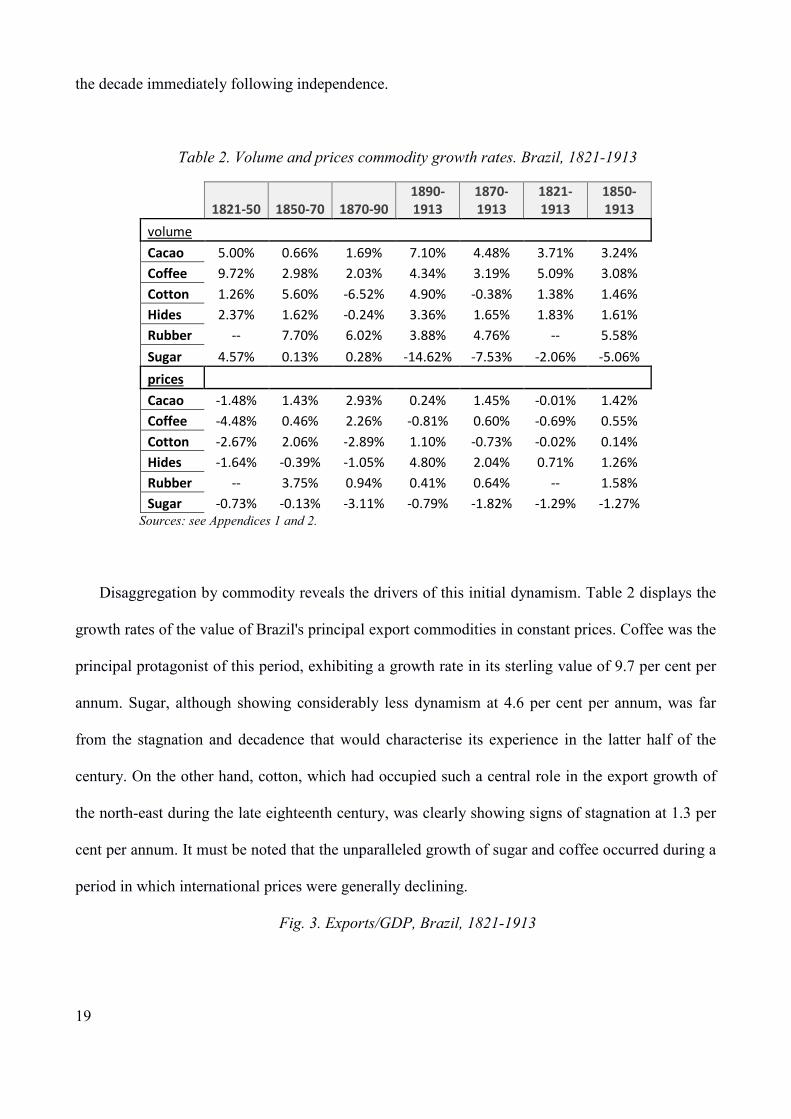
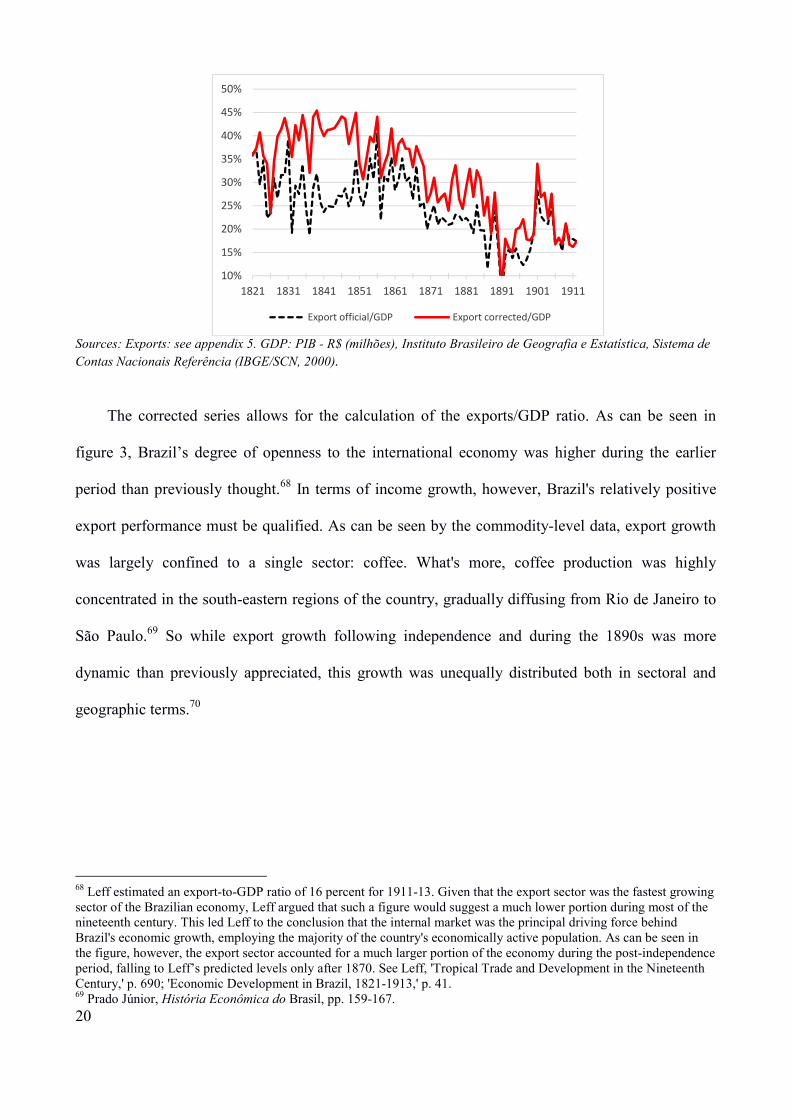
Fig. 3. Exports/GDP, Brazil, 1821-1913
20
Sources: Exports: see appendix 5. GDP: PIB - R$ (milhões), Instituto Brasileiro de Geografia e Estatística, Sistema de Contas Nacionais Referência (IBGE/SCN, 2000).
The corrected series allows for the calculation of the exports/GDP ratio. As can be seen in
figure 3, Brazil’s degree of openness to the international economy was higher during the earlier
period than previously thought.68 In terms of income growth, however, Brazil's relatively positive
export performance must be qualified. As can be seen by the commodity-level data, export growth
was largely confined to a single sector: coffee. What's more, coffee production was highly
concentrated in the south-eastern regions of the country, gradually diffusing from Rio de Janeiro to
São Paulo.69 So while export growth following independence and during the 1890s was more
dynamic than previously appreciated, this growth was unequally distributed both in sectoral and
geographic terms.70
68 Leff estimated an export-to-GDP ratio of 16 percent for 1911-13. Given that the export sector was the fastest growing sector of the Brazilian economy, Leff argued that such a figure would suggest a much lower portion during most of the nineteenth century. This led Leff to the conclusion that the internal market was the principal driving force behind Brazil's economic growth, employing the majority of the country's economically active population. As can be seen in the figure, however, the export sector accounted for a much larger portion of the economy during the post-independence period, falling to Leff’s predicted levels only after 1870. See Leff, 'Tropical Trade and Development in the Nineteenth Century,' p. 690; 'Economic Development in Brazil, 1821-1913,' p. 41. 69 Prado Júnior, História Econômica do Brasil, pp. 159-167.
10%
15%
20%
25%
30%
35%
40%
45%
50%
1821 1831 1841 1851 1861 1871 1881 1891 1901 1911
Export official/GDP Export corrected/GDP
21
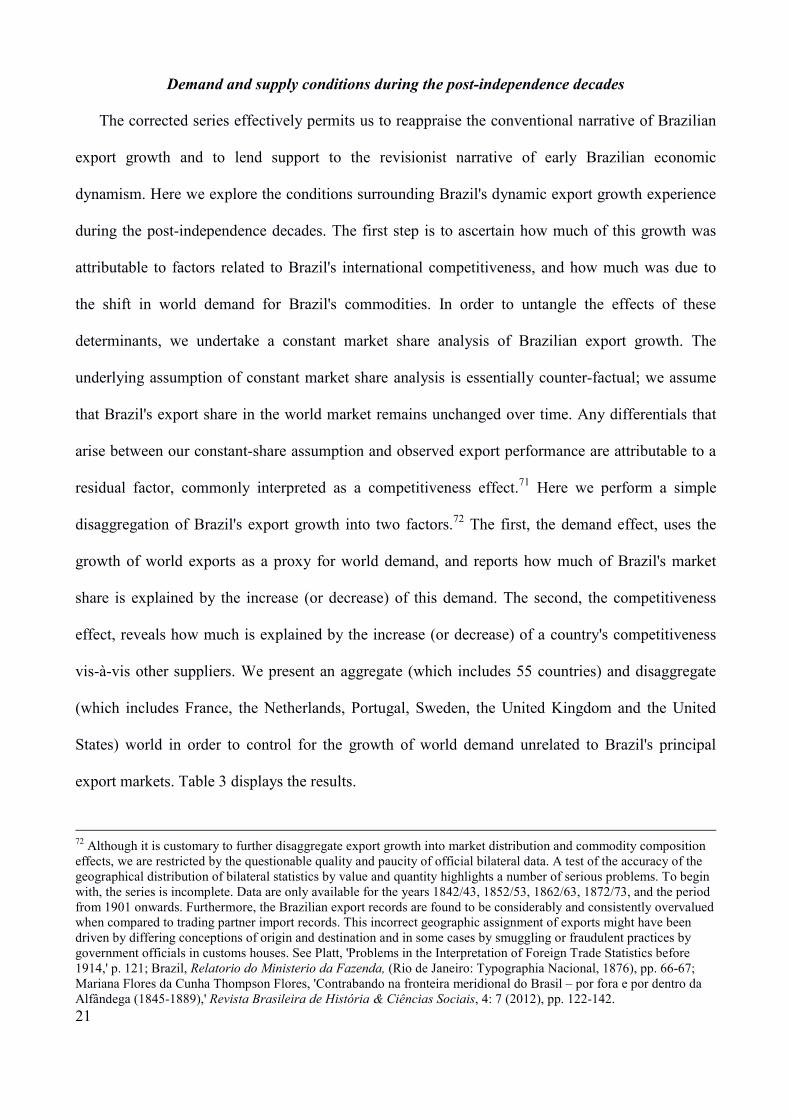
Demand and supply conditions during the post-independence decades
The corrected series effectively permits us to reappraise the conventional narrative of Brazilian
export growth and to lend support to the revisionist narrative of early Brazilian economic
dynamism. Here we explore the conditions surrounding Brazil's dynamic export growth experience
during the post-independence decades. The first step is to ascertain how much of this growth was
attributable to factors related to Brazil's international competitiveness, and how much was due to
the shift in world demand for Brazil's commodities. In order to untangle the effects of these
determinants, we undertake a constant market share analysis of Brazilian export growth. The
underlying assumption of constant market share analysis is essentially counter-factual; we assume
that Brazil's export share in the world market remains unchanged over time. Any differentials that
arise between our constant-share assumption and observed export performance are attributable to a
residual factor, commonly interpreted as a competitiveness effect.71 Here we perform a simple
disaggregation of Brazil's export growth into two factors.72 The first, the demand effect, uses the
growth of world exports as a proxy for world demand, and reports how much of Brazil's market
share is explained by the increase (or decrease) of this demand. The second, the competitiveness
effect, reveals how much is explained by the increase (or decrease) of a country's competitiveness
vis-à-vis other suppliers. We present an aggregate (which includes 55 countries) and disaggregate
(which includes France, the Netherlands, Portugal, Sweden, the United Kingdom and the United
States) world in order to control for the growth of world demand unrelated to Brazil's principal
export markets. Table 3 displays the results.
72 Although it is customary to further disaggregate export growth into market distribution and commodity composition effects, we are restricted by the questionable quality and paucity of official bilateral data. A test of the accuracy of the geographical distribution of bilateral statistics by value and quantity highlights a number of serious problems. To begin with, the series is incomplete. Data are only available for the years 1842/43, 1852/53, 1862/63, 1872/73, and the period from 1901 onwards. Furthermore, the Brazilian export records are found to be considerably and consistently overvalued when compared to trading partner import records. This incorrect geographic assignment of exports might have been driven by differing conceptions of origin and destination and in some cases by smuggling or fraudulent practices by government officials in customs houses. See Platt, 'Problems in the Interpretation of Foreign Trade Statistics before 1914,' p. 121; Brazil, Relatorio do Ministerio da Fazenda, (Rio de Janeiro: Typographia Nacional, 1876), pp. 66-67; Mariana Flores da Cunha Thompson Flores, 'Contrabando na fronteira meridional do Brasil – por fora e por dentro da Alfândega (1845-1889),' Revista Brasileira de História & Ciências Sociais, 4: 7 (2012), pp. 122-142.
22
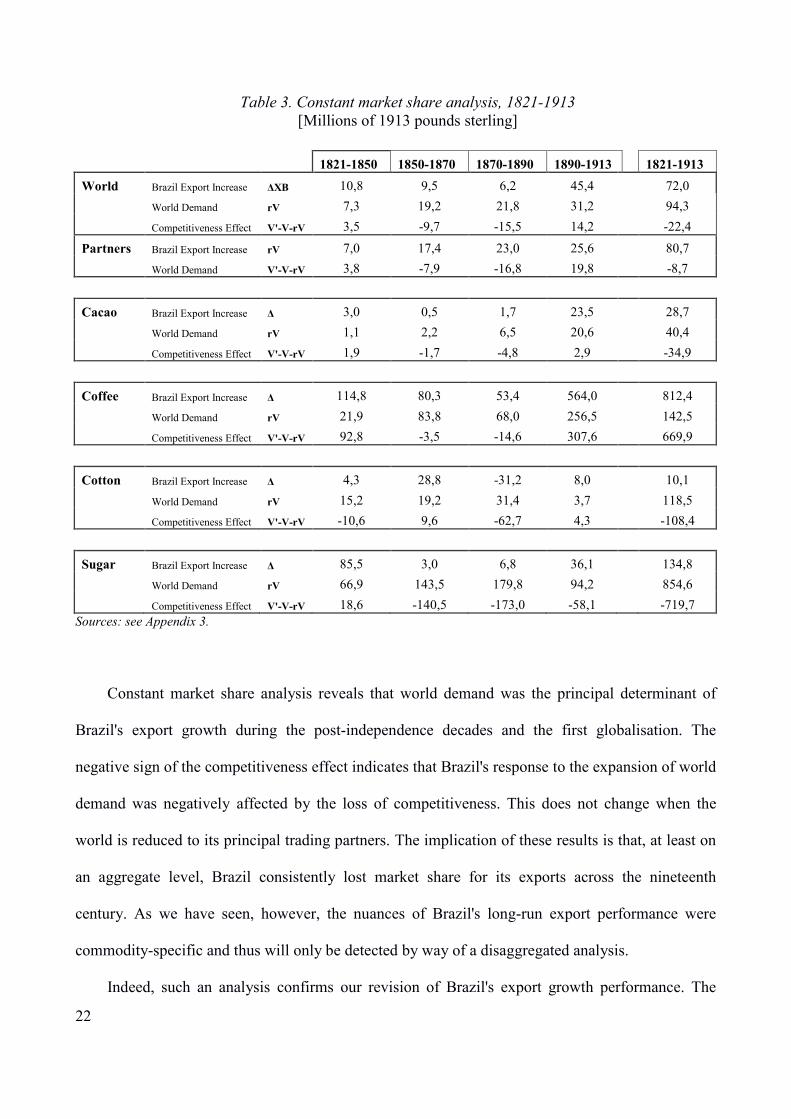
Table 3. Constant market share analysis, 1821-1913
[Millions of 1913 pounds sterling]
1821-1850 1850-1870 1870-1890 1890-1913 1821-1913 World Brazil Export Increase ∆XB 10,8 9,5 6,2 45,4 72,0 World Demand rV 7,3 19,2 21,8 31,2 94,3 Competitiveness Effect V'-V-rV 3,5 -9,7 -15,5 14,2 -22,4
Partners Brazil Export Increase rV 7,0 17,4 23,0 25,6 80,7 World Demand V'-V-rV 3,8 -7,9 -16,8 19,8 -8,7
Cacao Brazil Export Increase ∆ 3,0 0,5 1,7 23,5 28,7 World Demand rV 1,1 2,2 6,5 20,6 40,4 Competitiveness Effect V'-V-rV 1,9 -1,7 -4,8 2,9 -34,9
Coffee Brazil Export Increase ∆ 114,8 80,3 53,4 564,0 812,4 World Demand rV 21,9 83,8 68,0 256,5 142,5 Competitiveness Effect V'-V-rV 92,8 -3,5 -14,6 307,6 669,9
Cotton Brazil Export Increase ∆ 4,3 28,8 -31,2 8,0 10,1 World Demand rV 15,2 19,2 31,4 3,7 118,5 Competitiveness Effect V'-V-rV -10,6 9,6 -62,7 4,3 -108,4
Sugar Brazil Export Increase ∆ 85,5 3,0 6,8 36,1 134,8 World Demand rV 66,9 143,5 179,8 94,2 854,6 Competitiveness Effect V'-V-rV 18,6 -140,5 -173,0 -58,1 -719,7
Sources: see Appendix 3.
Constant market share analysis reveals that world demand was the principal determinant of
Brazil's export growth during the post-independence decades and the first globalisation. The
negative sign of the competitiveness effect indicates that Brazil's response to the expansion of world
demand was negatively affected by the loss of competitiveness. This does not change when the
world is reduced to its principal trading partners. The implication of these results is that, at least on
an aggregate level, Brazil consistently lost market share for its exports across the nineteenth
century. As we have seen, however, the nuances of Brazil's long-run export performance were
commodity-specific and thus will only be detected by way of a disaggregated analysis.
Indeed, such an analysis confirms our revision of Brazil's export growth performance. The
23
initial dynamism was driven principally by the relative gains of competitiveness of the coffee
sector. From mid-century this competitiveness disappeared only to return during the period 1890-
1913, perhaps due to the influence of government intervention. In the case of Brazil's other
principal export commodities, we observe a different tendency. Sugar expanded faster than world
demand in the initial period, due in part to increased competitiveness. After 1850, however, Brazil's
sugar export sector lost competitiveness and growing international demand for the commodity
buoyed the observed export growth. Cacao evinced a similar tendency. While cotton gained a
competitive advantage due to the institutional shock of the American Civil War and its effect on
Southern Big Cotton, this advantage was largely ephemeral, and in the long-run the sector lost
competitiveness over the century. In short, the rapid expansion of world demand for Brazil's
products, coupled with an increase in competitiveness for coffee and, initially, for sugar and cacao,
determined the observed export growth pattern.
Brazilian dynamism and divergence in the tropics
As the various indicators of the revisionist narrative tell us, the circumstances afforded Brazil
by the turmoil of other tropical agricultural producers in the region stimulated a voracious appetite
for slave labour which, when combined with the expansion of the agricultural frontier, drove the
observed initial dynamism of export growth. Here we explore Brazil's export performance from a
comparative perspective and examine the empirical evidence supporting this narrative.
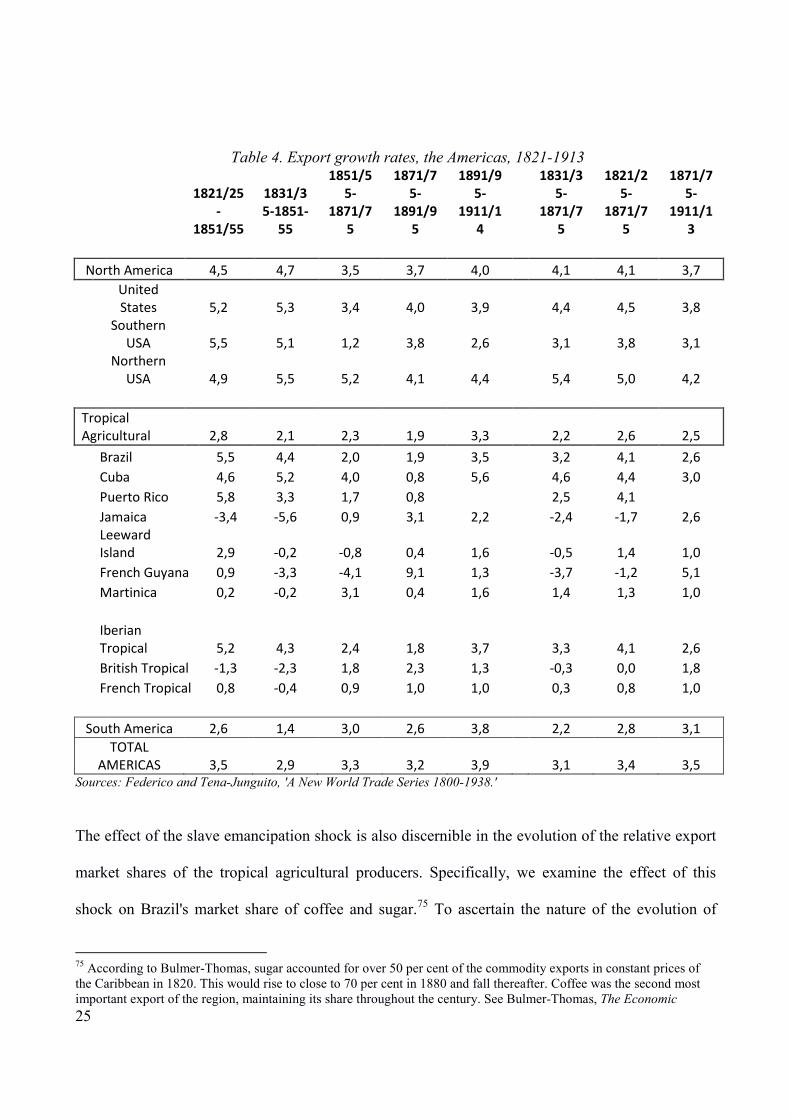
Such a comparison is offered in Table 4, showing the export growth rates for the Americas
during the nineteenth century based on the World Trade series constructed by Giovanni Federico
and Antonio Tena-Junguito.73 These export growth figures confirm Brazil's dynamic export
performance during the post-independence years. Brazilian export growth from independence to
mid-century more than doubled the South American average and was comparable to that of the 73 Giovanni Federico and Antonio Tena-Junguito, 'A New World Trade Series 1800-1938, (2015 unpublished document) and 'The American Divergence. Independence versus Emancipation in Latin American and the Caribbean 1820-1870,' Paper presented in CLADHE IV July 23th- 25th 2014, Bogotá.
24
United States. Despite the regional disparities in export growth derived from the success of coffee
in the south-east and the relative failure of cotton and, to a lesser extent, sugar in the north-east, it is
clear that the country's overall rate of export growth was comparatively quite high. The table
includes the British and French colonies of the West Indies and the Guianas, as well as the Spanish
Caribbean (Santo Domingo, Puerto Rico and Cuba), Spanish Central America (Guatemala,
Honduras, Costa Rica, Nicaragua y Panama) and, of course, Brazil. Amongst this group can be
found most of Brazil's principal coffee- and sugar-producing competitors.74 While the export
growth of this region generally stagnated over the century, disaggregation by country reveals the
effects of the institutional shock of slave emancipation. During the first half of the nineteenth
century these tropical agricultural producers would be torn between countervailing tendencies. On
the one hand, Cuba (which became increasingly specialised in sugar production), Puerto Rico and
Brazil showed high export growth rates, comparable only to North America on a continental level.
On the other hand, the other tropical agricultural producing countries experienced a (in some cases
violent) contraction of exports. The British tropical colonies experienced the most severe
contraction, Jamaica being the extreme case. The export economies of the French tropical colonies,
particularly French Guyana, also contracted. It is clear, therefore, that there was considerable
divergence in the export performance of the tropical agricultural producers during the post-
independence decades and that this divergence corresponded with the profound institutional
changes taking place in the labour markets of the British West Indies.
74 Another Asian competitor and Dutch colony, Java, would also occupy a leading role in the international coffee (and later, rubber) market, although it is not included here for geographical reasons.
25
Table 4. Export growth rates, the Americas, 1821-1913
1821/25
-
1851/55
1831/3
5-1851-
55
1851/5
5-
1871/7
5
1871/7
5-
1891/9
5
1891/9
5-
1911/1
4
1831/3
5-
1871/7
5
1821/2
5-
1871/7
5
1871/7
5-
1911/1
3
North America 4,5 4,7 3,5 3,7 4,0
4,1 4,1 3,7
United
States 5,2 5,3 3,4 4,0 3,9
4,4 4,5 3,8
Southern
USA 5,5 5,1 1,2 3,8 2,6
3,1 3,8 3,1
Northern
USA 4,9 5,5 5,2 4,1 4,4
5,4 5,0 4,2
Tropical
Agricultural 2,8 2,1 2,3 1,9 3,3
2,2 2,6 2,5
Brazil 5,5 4,4 2,0 1,9 3,5
3,2 4,1 2,6
Cuba 4,6 5,2 4,0 0,8 5,6
4,6 4,4 3,0
Puerto Rico 5,8 3,3 1,7 0,8
2,5 4,1
Jamaica -3,4 -5,6 0,9 3,1 2,2
-2,4 -1,7 2,6
Leeward
Island 2,9 -0,2 -0,8 0,4 1,6
-0,5 1,4 1,0
French Guyana 0,9 -3,3 -4,1 9,1 1,3
-3,7 -1,2 5,1
Martinica 0,2 -0,2 3,1 0,4 1,6
1,4 1,3 1,0
Iberian
Tropical 5,2 4,3 2,4 1,8 3,7
3,3 4,1 2,6
British Tropical -1,3 -2,3 1,8 2,3 1,3
-0,3 0,0 1,8
French Tropical 0,8 -0,4 0,9 1,0 1,0
0,3 0,8 1,0
South America 2,6 1,4 3,0 2,6 3,8
2,2 2,8 3,1
TOTAL
AMERICAS 3,5 2,9 3,3 3,2 3,9
3,1 3,4 3,5
Sources: Federico and Tena-Junguito, 'A New World Trade Series 1800-1938.'
The effect of the slave emancipation shock is also discernible in the evolution of the relative export
market shares of the tropical agricultural producers. Specifically, we examine the effect of this
shock on Brazil's market share of coffee and sugar.75 To ascertain the nature of the evolution of
75 According to Bulmer-Thomas, sugar accounted for over 50 per cent of the commodity exports in constant prices of the Caribbean in 1820. This would rise to close to 70 per cent in 1880 and fall thereafter. Coffee was the second most important export of the region, maintaining its share throughout the century. See Bulmer-Thomas, The Economic
26
Brazil's market share of world coffee exports, we take a sample of the principal coffee exporting
countries for which there are data available from around the time of Brazil's independence, and
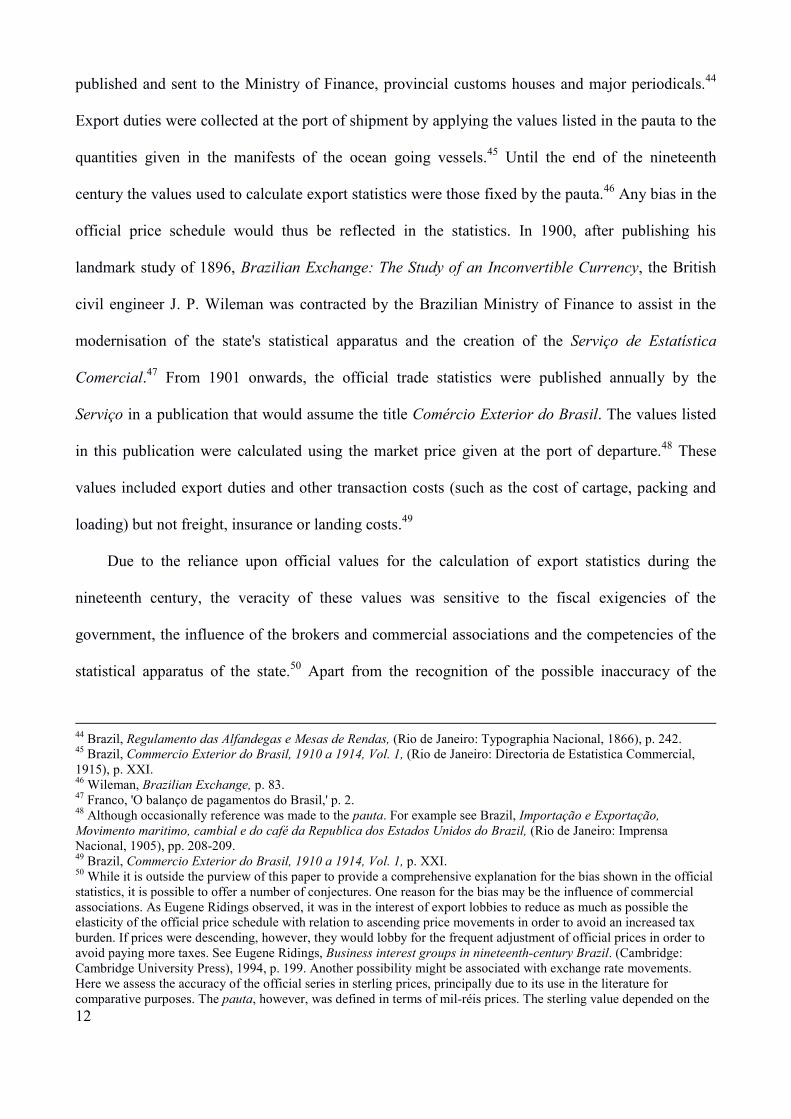
calculate their relative shares of the world market.76 The results can be seen in figure 4. It is clear
that Brazil's market share of coffee gradually widened over the nineteenth century at the expense of
all of its major competitors. Furthermore, it is evident that most of this market share was gained
before 1850. The effect of the slave abolition shock of the 1830s on the British colonies impacted
considerably on their market shares. British Jamaica moved from being the fourth largest exporter
to holding a relatively minuscule share by the end of the 1830s. After the Napoleonic Wars many
French Caribbean coffee-exporting colonies suffered an involution. Indeed, many of the French
colonies all but disappeared from the market by the 1850s. The only competitor that did not
experience a considerable reduction of its market share during the post-independence decades was
Java. Like certain Spanish colonies of the Caribbean, Java was not subjected to the institutional
shocks associated with independence or slave abolition.77 Thus it also responded to the competitive
advantage afforded by the slave abolition shock by expanding its market share of coffee during the
post-independence decades. Javanese expansion was brought to a halt, however, by the spread of
Hemileia vastatrix, a coffee-leaf blight that would devastate Javanese and other Asian and African
producers late in the century, effectively permitting Brazil to consolidate its world market share.78
History of the Caribbean, Figures 5.2 and 5.2. 76 This sample includes Cuba, Guadalupe, Haiti, Indonesia (Java), Jamaica, Martinique, and Suriname. Together with Brazil this sample represented 81.63 per cent of the quantum of world exports in the period 1851-1855. Unfortunately, data for total world exports is only available from 1851-1855 onwards, calculated by five-year averages. To provide estimates for the decades up until mid-century, we assume that our sample represents 80 per cent of world exports during the period 1823-1850, and estimate world exports based on the sum of the sample countries. This is by no means an unrealistic assumption. At the beginning of the nineteenth century nearly all coffee exported to the world market was apparently produced by European colonies, including, most notably, the ex-colony of Haiti (previously Saint Domingue), the world's leading coffee exporter at the turn of the nineteenth century, followed by other French colonies such as Martinique, Dominica, Guadalupe, the Dutch and British colonies in the Guianas and Jamaica. Once estimated, we use the world exports estimate to calculate five-year average country shares. On the world market for coffee, see Topik, 'The World Coffee Market in the Eighteenth and Nineteenth Centuries,' p. 16. 77 In fact, Java was not a slave plantation economy, although coffee cultivation was imposed upon the peasantry by a strict system of state control. See M. R. Fernando, 'Coffee cultivation in Java, 1830-1917,' in William Gervase Clarence-Smith and Steven Topik (eds.), The Global Coffee Economy in Africa, Asia, and Latin America, 1500–1989. (Cambridge: Cambridge University Press, 2003), pp. 157-158. 78 William Gervase Clarence-Smith, 'The Coffee Crisis in Asia, Africa, and the Pacific, 1870–1914,' in William Gervase Clarence-Smith and Steven Topik (eds.), The Global Coffee Economy in Africa, Asia, and Latin America, 1500–1989,
27
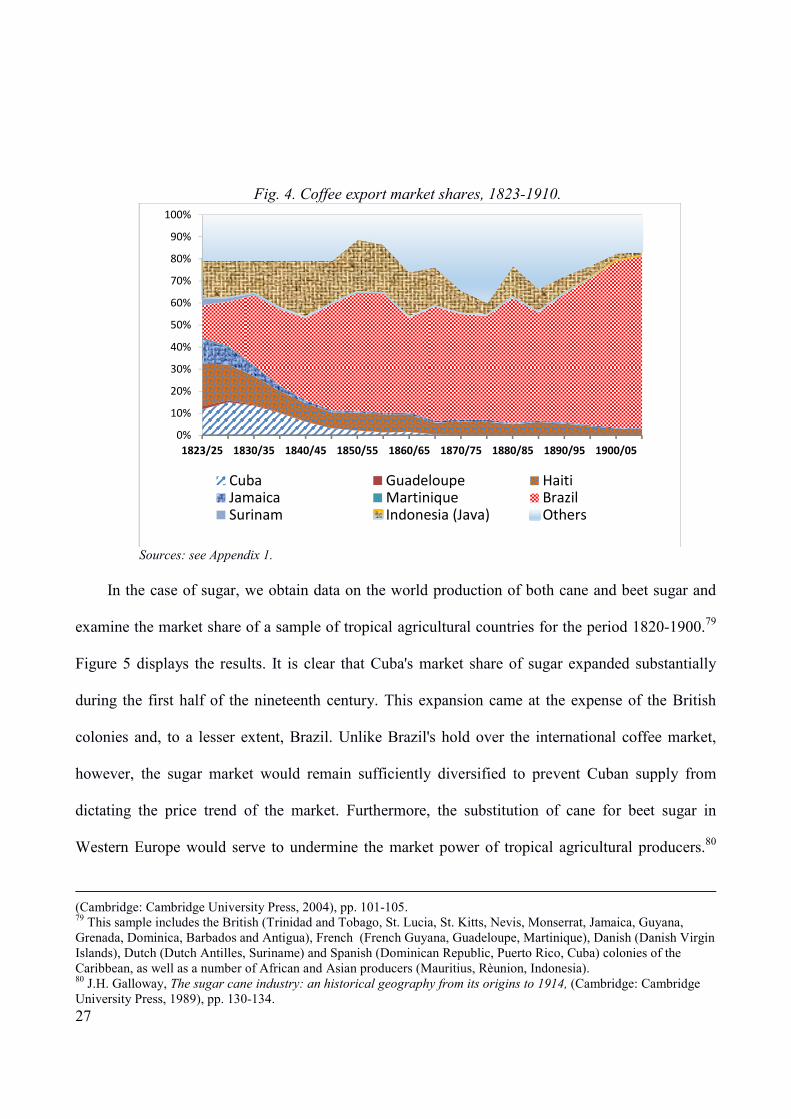
Fig. 4. Coffee export market shares, 1823-1910.
Sources: see Appendix 1.
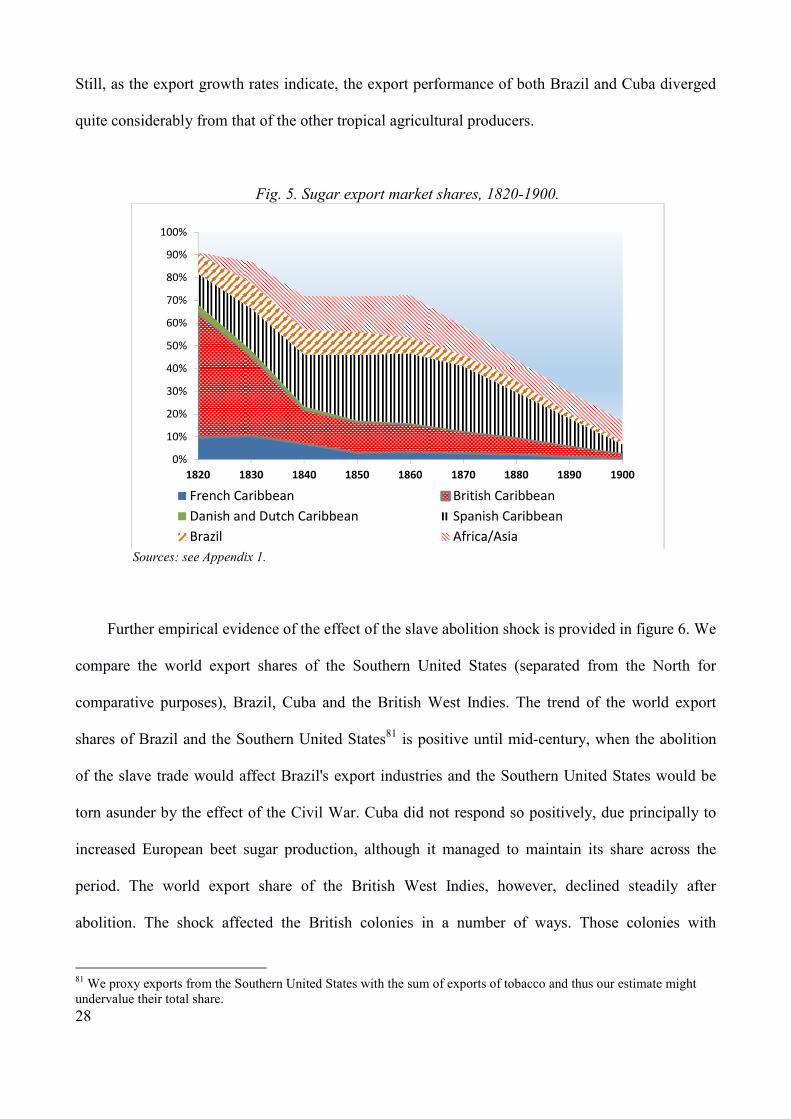
In the case of sugar, we obtain data on the world production of both cane and beet sugar and
examine the market share of a sample of tropical agricultural countries for the period 1820-1900.79
Figure 5 displays the results. It is clear that Cuba's market share of sugar expanded substantially
during the first half of the nineteenth century. This expansion came at the expense of the British
colonies and, to a lesser extent, Brazil. Unlike Brazil's hold over the international coffee market,
however, the sugar market would remain sufficiently diversified to prevent Cuban supply from
dictating the price trend of the market. Furthermore, the substitution of cane for beet sugar in
Western Europe would serve to undermine the market power of tropical agricultural producers.80
(Cambridge: Cambridge University Press, 2004), pp. 101-105. 79 This sample includes the British (Trinidad and Tobago, St. Lucia, St. Kitts, Nevis, Monserrat, Jamaica, Guyana, Grenada, Dominica, Barbados and Antigua), French (French Guyana, Guadeloupe, Martinique), Danish (Danish Virgin Islands), Dutch (Dutch Antilles, Suriname) and Spanish (Dominican Republic, Puerto Rico, Cuba) colonies of the Caribbean, as well as a number of African and Asian producers (Mauritius, Rèunion, Indonesia). 80 J.H. Galloway, The sugar cane industry: an historical geography from its origins to 1914, (Cambridge: Cambridge University Press, 1989), pp. 130-134.
0%
10%
20%
30%
40%
50%
60%
70%
80%
90%
100%
1823/25 1830/35 1840/45 1850/55 1860/65 1870/75 1880/85 1890/95 1900/05
Cuba Guadeloupe HaitiJamaica Martinique BrazilSurinam Indonesia (Java) Others
28
Still, as the export growth rates indicate, the export performance of both Brazil and Cuba diverged
quite considerably from that of the other tropical agricultural producers.
Fig. 5. Sugar export market shares, 1820-1900.
Sources: see Appendix 1.
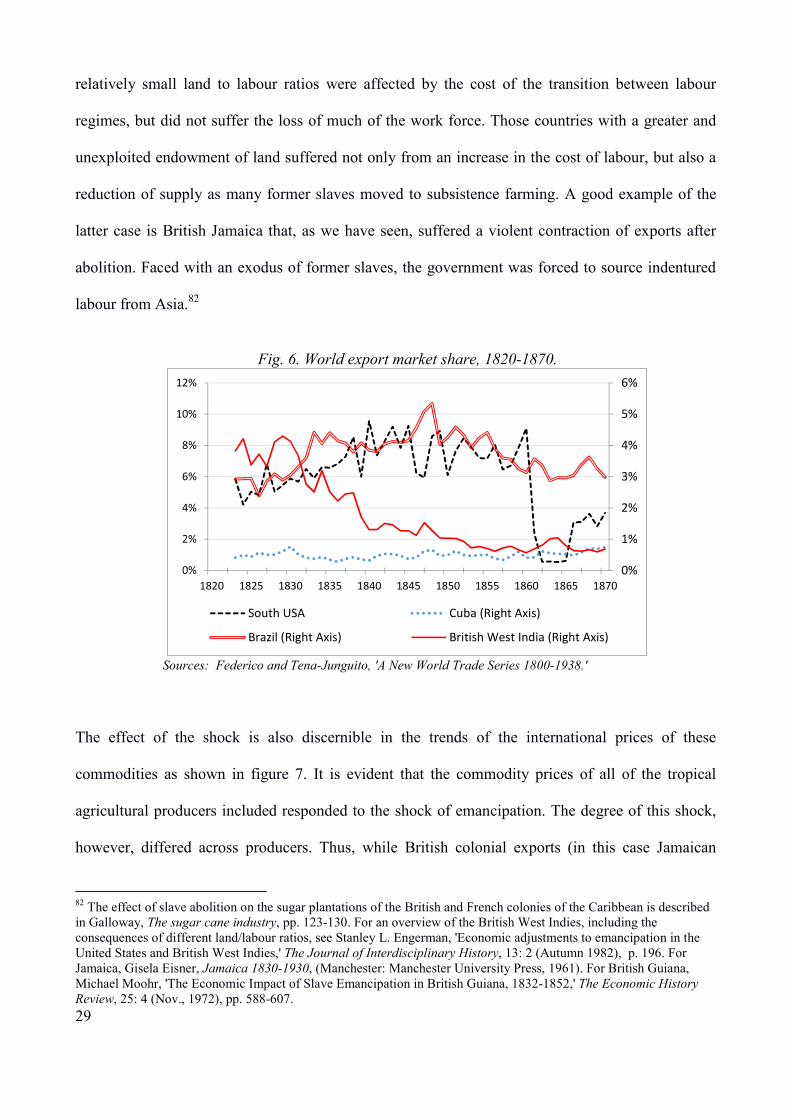
Further empirical evidence of the effect of the slave abolition shock is provided in figure 6. We
compare the world export shares of the Southern United States (separated from the North for
comparative purposes), Brazil, Cuba and the British West Indies. The trend of the world export
shares of Brazil and the Southern United States81 is positive until mid-century, when the abolition
of the slave trade would affect Brazil's export industries and the Southern United States would be
torn asunder by the effect of the Civil War. Cuba did not respond so positively, due principally to
increased European beet sugar production, although it managed to maintain its share across the
period. The world export share of the British West Indies, however, declined steadily after
abolition. The shock affected the British colonies in a number of ways. Those colonies with
81 We proxy exports from the Southern United States with the sum of exports of tobacco and thus our estimate might undervalue their total share.
0%
10%
20%
30%
40%
50%
60%
70%
80%
90%
100%
1820 1830 1840 1850 1860 1870 1880 1890 1900
French Caribbean British Caribbean
Danish and Dutch Caribbean Spanish Caribbean
Brazil Africa/Asia
29
relatively small land to labour ratios were affected by the cost of the transition between labour
regimes, but did not suffer the loss of much of the work force. Those countries with a greater and
unexploited endowment of land suffered not only from an increase in the cost of labour, but also a
reduction of supply as many former slaves moved to subsistence farming. A good example of the
latter case is British Jamaica that, as we have seen, suffered a violent contraction of exports after
abolition. Faced with an exodus of former slaves, the government was forced to source indentured
labour from Asia.82
Fig. 6. World export market share, 1820-1870.
Sources: Federico and Tena-Junguito, 'A New World Trade Series 1800-1938.'
The effect of the shock is also discernible in the trends of the international prices of these
commodities as shown in figure 7. It is evident that the commodity prices of all of the tropical
agricultural producers included responded to the shock of emancipation. The degree of this shock,
however, differed across producers. Thus, while British colonial exports (in this case Jamaican
82 The effect of slave abolition on the sugar plantations of the British and French colonies of the Caribbean is described in Galloway, The sugar cane industry, pp. 123-130. For an overview of the British West Indies, including the consequences of different land/labour ratios, see Stanley L. Engerman, 'Economic adjustments to emancipation in the United States and British West Indies,' The Journal of Interdisciplinary History, 13: 2 (Autumn 1982), p. 196. For Jamaica, Gisela Eisner, Jamaica 1830-1930, (Manchester: Manchester University Press, 1961). For British Guiana, Michael Moohr, 'The Economic Impact of Slave Emancipation in British Guiana, 1832-1852,' The Economic History Review, 25: 4 (Nov., 1972), pp. 588-607.
0%
1%
2%
3%
4%
5%
6%
0%
2%
4%
6%
8%
10%
12%
1820 1825 1830 1835 1840 1845 1850 1855 1860 1865 1870
South USA Cuba (Right Axis)
Brazil (Right Axis) British West India (Right Axis)
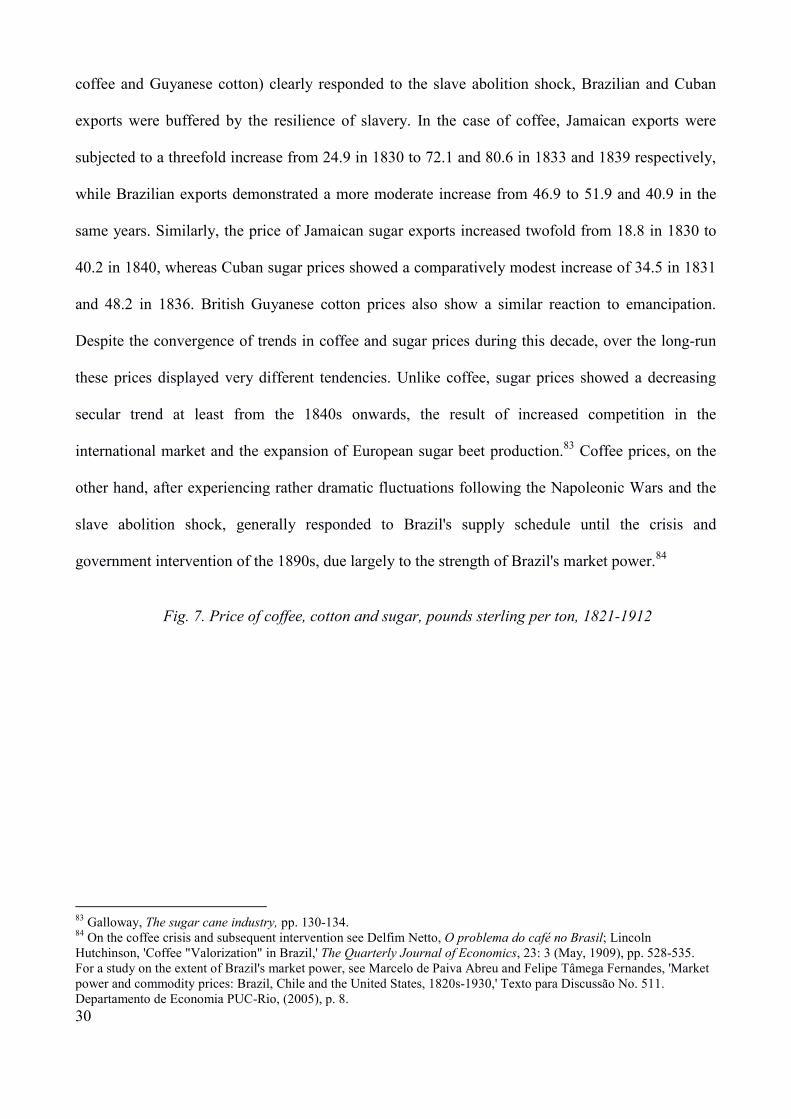
30
coffee and Guyanese cotton) clearly responded to the slave abolition shock, Brazilian and Cuban
exports were buffered by the resilience of slavery. In the case of coffee, Jamaican exports were
subjected to a threefold increase from 24.9 in 1830 to 72.1 and 80.6 in 1833 and 1839 respectively,
while Brazilian exports demonstrated a more moderate increase from 46.9 to 51.9 and 40.9 in the
same years. Similarly, the price of Jamaican sugar exports increased twofold from 18.8 in 1830 to
40.2 in 1840, whereas Cuban sugar prices showed a comparatively modest increase of 34.5 in 1831
and 48.2 in 1836. British Guyanese cotton prices also show a similar reaction to emancipation.
Despite the convergence of trends in coffee and sugar prices during this decade, over the long-run
these prices displayed very different tendencies. Unlike coffee, sugar prices showed a decreasing
secular trend at least from the 1840s onwards, the result of increased competition in the
international market and the expansion of European sugar beet production.83 Coffee prices, on the
other hand, after experiencing rather dramatic fluctuations following the Napoleonic Wars and the
slave abolition shock, generally responded to Brazil's supply schedule until the crisis and
government intervention of the 1890s, due largely to the strength of Brazil's market power.84
Fig. 7. Price of coffee, cotton and sugar, pounds sterling per ton, 1821-1912
83 Galloway, The sugar cane industry, pp. 130-134. 84 On the coffee crisis and subsequent intervention see Delfim Netto, O problema do café no Brasil; Lincoln Hutchinson, 'Coffee "Valorization" in Brazil,' The Quarterly Journal of Economics, 23: 3 (May, 1909), pp. 528-535. For a study on the extent of Brazil's market power, see Marcelo de Paiva Abreu and Felipe Tâmega Fernandes, 'Market power and commodity prices: Brazil, Chile and the United States, 1820s-1930,' Texto para Discussão No. 511. Departamento de Economia PUC-Rio, (2005), p. 8.
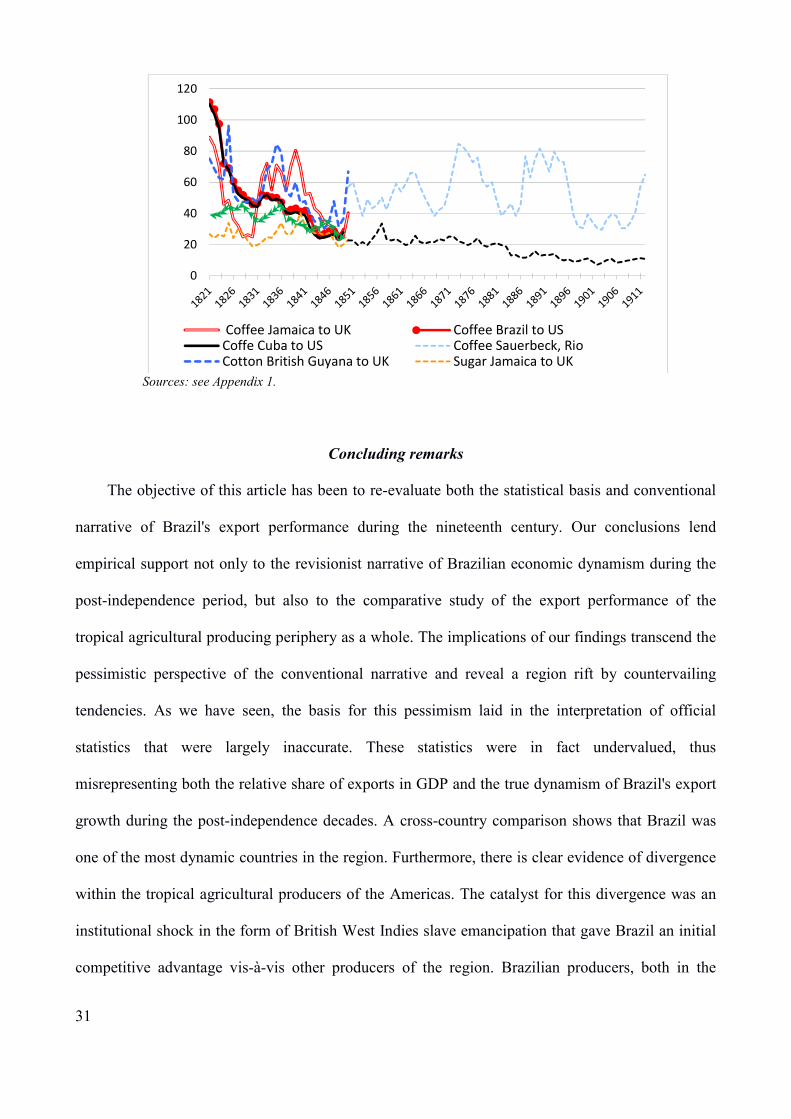
31
Sources: see Appendix 1.
Concluding remarks
The objective of this article has been to re-evaluate both the statistical basis and conventional
narrative of Brazil's export performance during the nineteenth century. Our conclusions lend
empirical support not only to the revisionist narrative of Brazilian economic dynamism during the
post-independence period, but also to the comparative study of the export performance of the
tropical agricultural producing periphery as a whole. The implications of our findings transcend the
pessimistic perspective of the conventional narrative and reveal a region rift by countervailing
tendencies. As we have seen, the basis for this pessimism laid in the interpretation of official
statistics that were largely inaccurate. These statistics were in fact undervalued, thus
misrepresenting both the relative share of exports in GDP and the true dynamism of Brazil's export
growth during the post-independence decades. A cross-country comparison shows that Brazil was
one of the most dynamic countries in the region. Furthermore, there is clear evidence of divergence
within the tropical agricultural producers of the Americas. The catalyst for this divergence was an
institutional shock in the form of British West Indies slave emancipation that gave Brazil an initial
competitive advantage vis-à-vis other producers of the region. Brazilian producers, both in the
0
20
40
60
80
100
120
Coffee Jamaica to UK Coffee Brazil to USCoffe Cuba to US Coffee Sauerbeck, RioCotton British Guyana to UK Sugar Jamaica to UK
32
north-east and south-east, responded to the incentives provided by the shock by expanding both the
agricultural frontier and imported slave labour. Output expanded rapidly and Brazil increased its
market share.
The implications of our findings also suggest a reappraisal of the arguments propounded by the
lost decades literature. Emphasis must be placed not only on the importance and relevance of a
comparative perspective, but also upon the ways in which divergent economic experiences were
interrelated. In the case of Brazil, the focus on the exceptional nature of independence has
overlooked the importance of the impact of exogenous institutional shocks on the country's export
performance. Only by adopting a regional comparative perspective do we comprehend that the story
of Brazil's exceptional post-independence export performance was a story of institutional shocks.
Together these conclusions indicate a direction for future research. To begin with, the
divergence that took place in the tropics during the post-independence decades is deserving of more
attention. Further study of the mechanisms underlying this divergence will surely help to understand
not only the diversity of short-run economic outcomes but also the long-run development trends of
these countries. In respect to Brazilian economic historiography, greater attention should be paid to
the post-independence decades in order to further elucidate the drivers and subtleties of the
country's dynamic export performance. Finally, an examination of the long-run impact of this
period on both export performance and regional income growth would provide a greater
understanding of Brazil's economic development during the nineteenth century.
33
Appendices
Appendix 1: Price accuracy index The price accuracy index for Brazilian exports takes the form
����� = ∑ ��∗�����∗�������� where PAIit is the price accuracy index of country i at time t, Pij the unit value of commodity j in country i at time t, Pmj the unit value of commodity j in country m at time t, and Qij the quantity in metric tons of commodity j in country i at time t. The results are given in the text. Data for Pij and Qij come from Brazil, Anuário Estatístico do Brasil de 1939/1940, pp. 1374-1378. Data sources for Pmj are listed as follows: 1821-1849: We have computed a weighted average of the monthly prices from different origins to the United Kingdom and Philadelphia. As weights we use the distribution of each origin in a sample of total quantum exports. Price data for the United Kingdom comes from A. D. Gayer, W. W. Rostow, and A. J. Schwartz, Microfilmed Supplement to Volumes I and II of The Growth and Fluctuation of the British Economy 1790-1850, (Oxford: Clarendon Press, 1953). Data from Philadelphia from Anne Bezanson, Robert D. Gray and Miriam Hussey, Wholesale prices in Philadelphia, 1784-1861, (Philadelphia: University of Pennsylvania Press, 1936-37). Coffee: Prices: Cuba, St. Domingo, Brazil Rio 7 and Java to Philadelphia and Jamaica Ordinary to the United Kingdom. Quantities: exports, Mario Samper and Radin Fernando, ‘Appendix: Historical Statistics of Coffee Production and Trade from 1700 to 1960,’ in William Gervase Clarence-Smith and Steven Topik (eds.), The Global Coffee Economy in Africa, Asia, and Latin America, 1500–1989. (Cambridge: Cambridge University Press, 2004), pp. 411-463, Tables A12,
34
A13, A14, A15. Sugar: Prices: Jamaica Brown to the United Kingdom, Cuba Brown and Muscovado to Philadelphia. Quantities: exports, Victor Bulmer-Thomas, The Economic History of the Caribbean, Table A10; world production, Manuel Moreno Fraginals, El ingenio: Complejo económico social cubano del azúcar, (Havana: Editorial de Ciencias Sociales, 1978). Hides: Prices: Buenos Aires to the United Kingdom, Buenos Aires Ox hides to Philadelphia. We have taken the arithmetic average of the two series. Cotton: Prices: Guyana Raw (Berbice or Demerara) to the United Kingdom, Middling Uplands from the United States to the United Kingdom, from M. B. Hammond, The cotton industry; an essay in American economic history, (New York: Macmillan, 1897), p. 898. Quantities: exports, Bulmer-Thomas, The Economic History of the Caribbean, Table A10; exports, Hammond, The cotton industry, p. 898; world production, Harry Hammond, 'Production and Consumption of Cotton in bales of 400 lb. weight by the countries contributing to the world's supply and demand for a series of years from 1790 to 1895,' in The Cotton Plant: its history, botany, chemistry, culture, enemies and uses, (Washington: Government Printing Office, 1896), p. 42, Plate II. Cocoa: Prices: Granada to the United Kingdom, Caracas to Philadelphia, “Island” (includes Guayaquil, St. Domingo, Caracas and Trinidad) to Philadelphia. Quantities: William Gervase Clarence-Smith, Cocoa & Chocolate, 1765-1914, (London: Routledge, 2000), Appendix 2. 1850-1853: As computed values are not listed in the official British statistics for this period, we have taken the prices for four commodities (sugar, hides, coffee, cotton) from Augustus Sauerbeck, ‘Prices of Commodities and the Precious Metals,’ Journal of the Statistical Society of London, 49: 3, (1886), pp. 581-648, and multiplied them by the quantities from the British series. 1850 quantities come from United Kingdom, British produce and manufactures. Accounts of exports to and imports from the British West India colonies, the East Indies, Ceylon, China, & c., for the seven years ending 5 January 1853; also the number of ships that have entered and cleared for the above places during each year of the period, (House of Commons Parliamentary Papers, 1854), pp. 20-21. Cacao and rubber prices for the period 1850-1853 are taken as the average cacao price during the period 1847-1851 and the average price for Caoutchouc in 1850, respectively. These figures are taken from B. Poole, Statistics of British Commerce: Being a Compendium of the Productions, Manufactures, Imports, and Exports, of the United Kingdom, (London: McCorquodale and Co, 1852), pp. 52, 75. 1854-1913: Imports from Brazil to the United Kingdom, taken from United Kingdom, Annual statement of the trade of the United Kingdom with foreign countries and British possessions, (House of Commons Parliamentary Papers, various years). As mentioned in the text, from these international prices we deduct export duties, freight rates, and insurance costs. The data sources for these trade costs are as follows: Export duties: Given the diverse nature of the origins of the international price series for the period 1821-1849, we have deducted an “additional” trade cost - which does not include freight or insurance costs - equivalent to the Brazilian export tax. This additional cost falls in the range of 1 to 7 per cent of the value of exports. For the Imperial period, we have used the effective duty on exports (the ratio between the total quantity of export duties collected and the total value of exports) in an attempt to
35
obviate the problems associated with the application of the official ad valorem rates to the pauta. During the Republican period the issue is somewhat more complicated. The Republican Constitution devolved the right to earn export duties to the regional governments. The size of the export duty on a single commodity could thus differ across regions; for example, the export duty on cacao from Bahia in 1913 was 14 per cent while that from Pará was 6 per cent. Where possible, we use the duties applied by the principal exporting regions, as these duties would have fallen heaviest on the values of exports. Thus it must be kept in mind that the rate used for the calculation of the price accuracy index is most likely under-valued by a number of percentage points. Cacao: 1821-1869: Brazil, Finanças, Quadros synopticos da receita e despeza do Brasil, Periodo de 1822 a 1913, (Rio de Janeiro: Typographia do Ministerio da Agricultura, 1914), pp. 14-17; 1870-1871: Brazil, Estatistica do Commercio Maritimo do Brazil do Exercicio de 1871-1872, 2.a
Parte, Commercio Geral, (Rio de Janeiro: Typographia Nacional, 1878), pp. 220-221; 1881-1913: Pará, Mensagem dirigida em 1 de agosto de 1915 ao Congreso Legislativo do Pará pelo Dr. Enéas Martins, (Belém: Imprensa Official do Estado do Pará, 1915) p. 91. The years 1872 to 1880 have been assumed using the general trend of national duties. Coffee: 1821-1849: Brazil, Finanças, pp. 14-17; 1850-1890: Annex ‘Impostos de exportação, 1850-1930’ from Abreu and Fernandes, 'Market power and commodity prices,' available from http://www.economia.puc-rio.br/mpabreu/projeto%20cnpq.html; 1891-1913: São Paulo, Annuario Estatistico de São Paulo 1913, (São Paulo: Typographia do Diario Official, 1915), p. 124. Cotton: 1821-1869: Brazil, Finanças, pp. 14-17; 1870-1881: Pernambuco, Projecto de receita provincial organisado por ordem do exm. sr. desembargador José Manoel de Freitas, dignissimo presidente desta provincia, pelo administrador do Consulado Provincial, bacharel Francisco Amynthas de Carvalho Moura, (Pernambuco: Typographia de Manoel Figueiroa de Faria and Filhos, 1884), Mapa 5; 1881-1886: Rio de Janeiro, Mappas estatisticos do commercio e navegação do Porto do Rio de Janeiro, (Rio de Janeiro: Typographia da Alfandega, various years); 1891-1899: Rio Grande do Norte, Mensagem dirigida ao Congresso Constituinte do Estado do Rio Grande do Norte, (Typographia do Rio Grande do Norte, various years); 1902-1913: Pernambuco, Mensagem do Governador do Estado, (Recife: Typgraphia do Diario de Pernambuco, various years). The years 1883, 1887 to 1890, 1899 to 1901, 1905 to 1907 have been assumed using the general trend of national and regional duties. Hides: 1821-1869: Brazil, Finanças, pp. 14-17; 1870-1882: Pernambuco, Projecto de receita, Mapa 5; 1884-1888: Rio de Janeiro, Mappas estatisticos; 1900-1906: Pará, Mensagem dirigida em 7 de Setembro de 1911 ao Congresso Legislativo do Pará pelo Dr. João Antonio Luiz Coelho, (Belém: Imprensa Official do Estado do Pará, 1911), pp. 233-234; 1890-1891, 1907-1913: Bahia, Mensagem apresentada a Assembléa Geral Legislativa do Estado da Bahia, (Bahia: Typographia do Diario da Bahia, various years). The years 1883, 1889, 1892 to 1899 have been assumed using the general trend of national and regional duties. Rubber: 1850-1869: Brazil, Finanças, pp. 14-17; 1870-1871: Brazil, Estatistica do Commercio Maritimo, pp. 234-235; 1878-1884: Rio de Janeiro, Mappas estatisticos; 1885-1913: Pará, Mensagem dirigida em 1 de agosto, p. 91. The years 1875 to 1877, 1883 have been assumed using the general trend of national duties. Sugar: 1821-1869: Brazil, Finanças, pp. 14-17; 1870-1871: Brazil, Estatistica do Commercio Maritimo, pp. 218-219; 1884-1887: Rio de Janeiro, Mappas estatisticos; 1870-1882, 1902-1904, 1908-1913: Pernambuco, Mensagem do Governador do Estado. The years 1883, 1888 to 1901,
36
1905 to 1907 have been assumed using the general trend of national and regional duties. Freight rates: Cacao: We use the freight rates for coffee. Coffee: 1821-1847: Paul Schöller, ‘L'évolution séculaire des taux de fret et d'assurance maritimes 1819-1940,’ Bulletin de l'Institut de Recherches Économiques et Sociales, 17: 5 (1951), pp. 519-557. Rio de Janeiro to Antwerp, “bulky” freight index, interpolated for the periods 1831-1841 and 1843-1848 to extend backwards Klovland's 1848 figure. 1848-1856: J. T. Klovland, ‘A Repeat Sailings Index of Ocean Freight Rates for the 1850s,’ Discussion paper SAM 40 2006, Department of Economics, Norwegian School of Economics and Business Administration, 2006. Rio de Janeiro to the British Channel. 1857-1875, 1877-1878: C. Knick Harley, ‘Coal Exports and British Shipping, 1850-1913,’ Explorations in Economic History, 26 (1989), pp. 311-338. Rio to Britain. 1876: we take the arithmetic mean of monthly rates from Rio de Janeiro to the British Channel as found in the Retrospectivo Commercial (various years) of the Jornal do Commercio (various years). 1879-1892: we take the arithmetic mean of monthly freight rates from Rio de Janeiro to London as found in the Retrospectivo Commercial of the Jornal do Commercio. 1893-1897: we extend the series using the East Latin American nominal freight index for grain from Saif I. Shah Mohammed and Jeffrey G. Williamson, ‘Freight rates and productivity gains in British tramp shipping 1869–1950,’ Explorations in Economic History, 41 (2004), pp. 172–203. 1898-1913: we take the arithmetic mean of monthly freight rates from Rio de Janeiro and Santos to London as found in Wileman's Brazilian Review (various years). Cotton: 1821-1849: C. Knick Harley, ‘Ocean Freight Rates and Productivity, 1740-1913: The Primacy of Mechanical Invention Reaffirmed,’ The Journal of Economic History, 48: 4 (1988), pp. 851-876. New Orleans to Liverpool. The period 1821-1824 has been interpolated using the 1820 and 1825 values. 1850-1868: Schöller, 'L'évolution séculaire.' Rio de Janeiro to Antwerp, “light” freight index. 1869-1877: we extend the series backwards using the East North American nominal freight index of grain from Mohammed and Williamson, 'Freight rates and productivity gains.' 1878-1897: we extend the series backwards using the North American Gulf Coast cotton nominal freight index of cotton from Mohammed and Williamson, 'Freight rates and productivity gains.' 1885: we cover this year using the East Latin American nominal freight index of grain from Mohammed and Williamson, 'Freight rates and productivity gains.' 1898-1913: we take the arithmetic mean of monthly freight rates from Pernambuco to Liverpool as found in Wileman's Brazilian Review. Hides: 1821-1847: Schöller, 'L'évolution séculaire.' Rio de Janeiro to Antwerp, “bulky” freight index, interpolated for the periods 1831-1841 and 1843-1848 to match Klovland's 1848 figure. 1848-1861: Klovland, 'A Repeat Sailings Index.' Rio-Grande to the United Kingdom. 1862-1868: we have extended Klovland's series using Schöller's Rio de Janeiro to Antwerp, “bulky” freight index. 1869: we take the arithmetic mean of 1868 and 1870. 1870-1872: we take the arithmetic mean of the minimum and maximum rates from Rio Grande do Sul to the United Kingdom from E. A. V. Angier, Fifty year' freights, (London: Fairplay, 1920). 1874, 1876-1892: we take the arithmetic mean of monthly rates from Rio de Janeiro to the British Channel as found in the Retrospectivo Commercial of the Jornal do Commercio. These rates are not explicitly denoted as Hides (Couros) until 1891. 1875: Harley, 'Coal Exports and British Shipping,' coffee, Rio to Britain.
37
1893-1897: we extend the series using the East Latin American nominal freight index of grain from Mohammed and Williamson, 'Freight rates and productivity gains.' 1898-1900, 1902-1903: we take the arithmetic mean of monthly freight rates from Rio de Janeiro to the British Channel as found in Wileman's Brazilian Review. 1901: we take the arithmetic mean of 1900 and 1902. 1904-1913: we extend using the East Latin American nominal freight index of grain from Mohammed and Williamson, 'Freight rates and productivity gains.' Rubber: We use the freight rates for coffee. Sugar: 1821-1868: Schöller, 'L'évolution séculaire.' Rio de Janeiro to Antwerp, “bulky” freight index, interpolated for the periods 1831-1841 and 1843-1850. 1869-1897: we extend the series backwards using the East Latin American nominal freight index of grain from Mohammed and Williamson, 'Freight rates and productivity gains.' 1898-1913: we take the arithmetic mean of monthly freight rates from Pernambuco to Liverpool as found in Wileman's Brazilian Review.
Insurance: Schöller, 'L'évolution séculaire,' Statistical appendix. We use the insurance quotes for Brazil from 1821-1867 and for Rio de la Plata from 1880-1910. The intervening period, 1868-1879, has been interpolated.
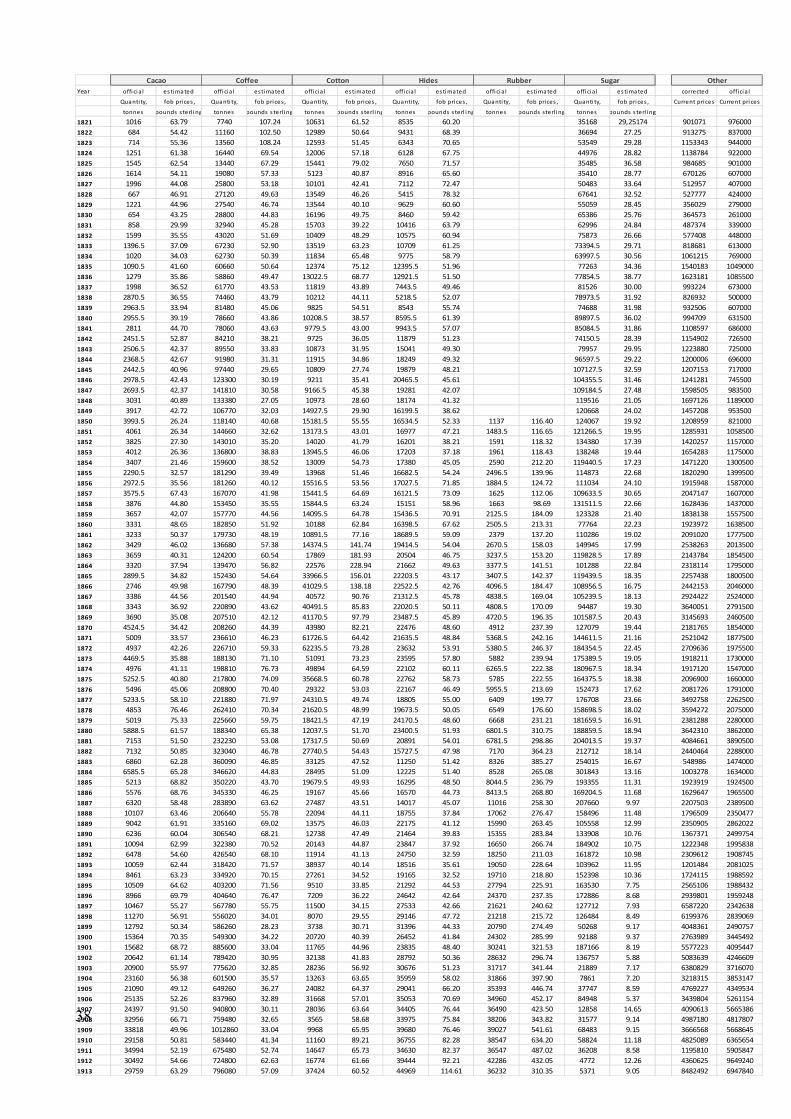
38
Year offi cia l es timated offi cia l estimated offi cia l es timated offi cia l es timated offi cia l estimated offi cia l es timated corrected officia l
Quanti ty, fob pri ces , Quanti ty, fob pri ces, Quanti ty, fob prices , Quanti ty, fob pri ces, Quanti ty, fob prices , Quanti ty, fob pri ces, Current prices Current pri ces
tonnes pounds sterl ing tonnes pounds s terl ing tonnes pounds sterl ing tonnes pounds s terl ing tonnes pounds sterl ing tonnes pounds s terl ing
1821 1016 63.79 7740 107.24 10631 61.52 8535 60.20 35168 29,25174 901071 976000
1822 684 54.42 11160 102.50 12989 50.64 9431 68.39 36694 27.25 913275 837000
1823 714 55.36 13560 108.24 12593 51.45 6343 70.65 53549 29.28 1153343 944000
1824 1251 61.38 16440 69.54 12006 57.18 6128 67.75 44976 28.82 1138784 922000
1825 1545 62.54 13440 67.29 15441 79.02 7650 71.57 35485 36.58 984685 901000
1826 1614 54.11 19080 57.33 5123 40.87 8916 65.60 35410 28.77 670126 607000
1827 1996 44.08 25800 53.18 10101 42.41 7112 72.47 50483 33.64 512957 407000
1828 667 46.91 27120 49.63 13549 46.26 5415 78.32 67641 32.52 527777 424000
1829 1221 44.96 27540 46.74 13544 40.10 9629 60.60 55059 28.45 356029 279000
1830 654 43.25 28800 44.83 16196 49.75 8460 59.42 65386 25.76 364573 261000
1831 858 29.99 32940 45.28 15703 39.22 10416 63.79 62996 24.84 487374 339000
1832 1599 35.55 43020 51.69 10409 48.29 10575 60.94 75873 26.66 577408 448000
1833 1396.5 37.09 67230 52.90 13519 63.23 10709 61.25 73394.5 29.71 818681 613000
1834 1020 34.03 62730 50.39 11834 65.48 9775 58.79 63997.5 30.56 1061215 769000
1835 1090.5 41.60 60660 50.64 12374 75.12 12395.5 51.96 77263 34.36 1540183 1049000
1836 1279 35.86 58860 49.47 13022.5 68.77 12921.5 51.50 77854.5 38.77 1623181 1085500
1837 1998 36.52 61770 43.53 11819 43.89 7443.5 49.46 81526 30.00 993224 673000
1838 2870.5 36.55 74460 43.79 10212 44.11 5218.5 52.07 78973.5 31.92 826932 500000
1839 2963.5 33.94 81480 45.06 9825 54.51 8543 55.74 74688 31.98 932506 607000
1840 2955.5 39.19 78660 43.86 10208.5 38.57 8595.5 61.39 89897.5 36.02 994709 631500
1841 2811 44.70 78060 43.63 9779.5 43.00 9943.5 57.07 85084.5 31.86 1108597 686000
1842 2451.5 52.87 84210 38.21 9725 36.05 11879 51.23 74150.5 28.39 1154902 726500
1843 2506.5 42.37 89550 33.83 10873 31.95 15041 49.30 79957 29.95 1223880 725000
1844 2368.5 42.67 91980 31.31 11915 34.86 18249 49.32 96597.5 29.22 1200006 696000
1845 2442.5 40.96 97440 29.65 10809 27.74 19879 48.21 107127.5 32.59 1207153 717000
1846 2978.5 42.43 123300 30.19 9211 35.41 20465.5 45.61 104355.5 31.46 1241281 745500
1847 2693.5 42.37 141810 30.58 9166.5 45.38 19281 42.07 109184.5 27.48 1598505 983500
1848 3031 40.89 133380 27.05 10973 28.60 18174 41.32 119516 21.05 1697126 1189000
1849 3917 42.72 106770 32.03 14927.5 29.90 16199.5 38.62 120668 24.02 1457208 953500
1850 3993.5 26.24 118140 40.68 15181.5 55.55 16534.5 52.33 1137 116.40 124067 19.92 1208959 821000
1851 4061 26.34 144660 32.62 13173.5 43.01 16977 47.21 1483.5 116.65 121266.5 19.95 1285931 1058500
1852 3825 27.30 143010 35.20 14020 41.79 16201 38.21 1591 118.32 134380 17.39 1420257 1157000
1853 4012 26.36 136800 38.83 13945.5 46.06 17203 37.18 1961 118.43 138248 19.44 1654283 1175000
1854 3407 21.46 159600 38.52 13009 54.73 17380 45.05 2590 212.20 119440.5 17.23 1471220 1300500
1855 2290.5 32.57 181290 39.49 13968 51.46 16682.5 54.24 2496.5 139.96 114873 22.68 1820290 1399500
1856 2972.5 35.56 181260 40.12 15516.5 53.56 17027.5 71.85 1884.5 124.72 111034 24.10 1915948 1587000
1857 3575.5 67.43 167070 41.98 15441.5 64.69 16121.5 73.09 1625 112.06 109633.5 30.65 2047147 1607000
1858 3876 44.80 153450 35.55 15844.5 63.24 15151 58.96 1663 98.69 131511.5 22.66 1628436 1437000
1859 3657 42.07 157770 44.56 14095.5 64.78 15436.5 70.91 2125.5 184.09 123328 21.40 1838138 1557500
1860 3331 48.65 182850 51.92 10188 62.84 16398.5 67.62 2505.5 213.31 77764 22.23 1923972 1638500
1861 3233 50.37 179730 48.19 10891.5 77.16 18689.5 59.09 2379 137.20 110286 19.02 2091020 1777500
1862 3429 46.02 136680 57.38 14374.5 141.74 19414.5 54.04 2670.5 158.03 149945 17.99 2538263 2013500
1863 3659 40.31 124200 60.54 17869 181.93 20504 46.75 3237.5 153.20 119828.5 17.89 2143784 1854500
1864 3320 37.94 139470 56.82 22576 228.94 21662 49.63 3377.5 141.51 101288 22.84 2318114 1795000
1865 2899.5 34.82 152430 54.64 33966.5 156.01 22203.5 43.17 3407.5 142.37 119439.5 18.35 2257438 1800500
1866 2746 49.98 167790 48.39 41029.5 138.18 22522.5 42.76 4096.5 184.47 108956.5 16.75 2442153 2046000
1867 3386 44.56 201540 44.94 40572 90.76 21312.5 45.78 4838.5 169.04 105239.5 18.13 2924422 2524000
1868 3343 36.92 220890 43.62 40491.5 85.83 22020.5 50.11 4808.5 170.09 94487 19.30 3640051 2791500
1869 3690 35.08 207510 42.12 41170.5 97.79 23487.5 45.89 4720.5 196.35 101587.5 20.43 3145693 2460500
1870 4524.5 34.42 208260 44.39 43980 82.21 22476 48.60 4912 237.39 127079 19.44 2181765 1854000
1871 5009 33.57 236610 46.23 61726.5 64.42 21635.5 48.84 5368.5 242.16 144611.5 21.16 2521042 1877500
1872 4937 42.26 226710 59.33 62235.5 73.28 23632 53.91 5380.5 246.37 184354.5 22.45 2709636 1975500
1873 4469.5 35.88 188130 71.10 51091 73.23 23595 57.80 5882 239.94 175389.5 19.05 1918211 1730000
1874 4976 41.11 198810 76.73 49894 64.59 22102 60.11 6265.5 222.38 180967.5 18.34 1917120 1547000
1875 5252.5 40.80 217800 74.09 35668.5 60.78 22762 58.73 5785 222.55 164375.5 18.38 2096900 1660000
1876 5496 45.06 208800 70.40 29322 53.03 22167 46.49 5955.5 213.69 152473 17.62 2081726 1791000
1877 5233.5 58.10 221880 71.97 24310.5 49.74 18805 55.00 6409 199.77 176708 23.66 3492758 2262500
1878 4853 76.46 262410 70.34 21620.5 48.99 19673.5 50.05 6549 176.60 158698.5 18.02 3594272 2075000
1879 5019 75.33 225660 59.75 18421.5 47.19 24170.5 48.60 6668 231.21 181659.5 16.91 2381288 2280000
1880 5888.5 61.57 188340 65.38 12037.5 51.70 23400.5 51.93 6801.5 310.75 188859.5 18.94 3642310 3862000
1881 7153 51.50 232230 53.08 17317.5 50.69 20891 54.01 6781.5 298.86 204013.5 19.37 4084661 3890500
1882 7132 50.85 323040 46.78 27740.5 54.43 15727.5 47.98 7170 364.23 212712 18.14 2440464 2288000
1883 6860 62.28 360090 46.85 33125 47.52 11250 51.42 8326 385.27 254015 16.67 548986 1474000
1884 6585.5 65.28 346620 44.83 28495 51.09 12225 51.40 8528 265.08 301843 13.16 1003278 1634000
1885 5213 68.82 350220 43.70 19679.5 49.93 16295 48.50 8044.5 236.79 193355 11.31 1923919 1924500
1886 5576 68.76 345330 46.25 19167 45.66 16570 44.73 8413.5 268.80 169204.5 11.68 1629647 1965500
1887 6320 58.48 283890 63.62 27487 43.51 14017 45.07 11016 258.30 207660 9.97 2207503 2389500
1888 10107 63.46 206640 55.78 22094 44.11 18755 37.84 17062 276.47 158496 11.48 1796509 2350477
1889 9042 61.91 335160 69.02 13575 46.03 22175 41.12 15990 263.45 105558 12.99 2350905 2862022
1890 6236 60.04 306540 68.21 12738 47.49 21464 39.83 15355 283.84 133908 10.76 1367371 2499754
1891 10094 62.99 322380 70.52 20143 44.87 23847 37.92 16650 266.74 184902 10.75 1222348 1995838
1892 6478 54.60 426540 68.10 11914 41.13 24750 32.59 18250 211.03 161872 10.98 2309612 1908745
1893 10059 62.44 318420 71.57 38937 40.14 18516 35.61 19050 228.64 103962 11.95 1201484 2081025
1894 8461 63.23 334920 70.15 27261 34.52 19165 32.52 19710 218.80 152398 10.36 1724115 1988592
1895 10509 64.62 403200 71.56 9510 33.85 21292 44.53 27794 225.91 163530 7.75 2565106 1988432
1896 8966 69.79 404640 76.47 7209 36.22 24642 42.64 24370 237.35 172886 8.68 2939801 1959248
1897 10467 55.27 567780 55.75 11500 34.15 27533 42.66 21621 240.62 127712 7.93 6587220 2342638
1898 11270 56.91 556020 34.01 8070 29.55 29146 47.72 21218 215.72 126484 8.49 6199376 2839069
1899 12792 50.34 586260 28.23 3738 30.71 31396 44.33 20790 274.49 50268 9.17 4048361 2490757
1900 15364 70.35 549300 34.22 20720 40.39 26452 41.84 24302 285.99 92188 9.37 2763989 3445492
1901 15682 68.72 885600 33.04 11765 44.96 23835 48.40 30241 321.53 187166 8.19 5577223 4095447
1902 20642 61.14 789420 30.95 32138 41.83 28792 50.36 28632 296.74 136757 5.88 5083639 4246609
1903 20900 55.97 775620 32.85 28236 56.92 30676 51.23 31717 341.44 21889 7.17 6380829 3716070
1904 23160 56.38 601500 35.57 13263 63.65 35959 58.02 31866 397.90 7861 7.20 3218315 3853147
1905 21090 49.12 649260 36.27 24082 64.37 29041 66.20 35393 446.74 37747 8.59 4769227 4349534
1906 25135 52.26 837960 32.89 31668 57.01 35053 70.69 34960 452.17 84948 5.37 3439804 5261154
1907 24397 91.50 940800 30.11 28036 63.64 34405 76.44 36490 423.50 12858 14.65 4090613 5665386
1908 32956 66.71 759480 32.65 3565 58.68 33975 75.84 38206 343.82 31577 9.14 4987180 4817807
1909 33818 49.96 1012860 33.04 9968 65.95 39680 76.46 39027 541.61 68483 9.15 3666568 5668645
1910 29158 50.81 583440 41.34 11160 89.21 36755 82.28 38547 634.20 58824 11.18 4825089 6365654
1911 34994 52.19 675480 52.74 14647 65.73 34630 82.37 36547 487.02 36208 8.58 1195810 5905847
1912 30492 54.66 724800 62.63 16774 61.66 39444 92.21 42286 432.05 4772 12.26 4360625 9649240
1913 29759 63.29 796080 57.09 37424 60.52 44969 114.61 36232 310.35 5371 9.05 8482492 6947840
OtherCacao Coffee Cotton Hides Rubber Sugar
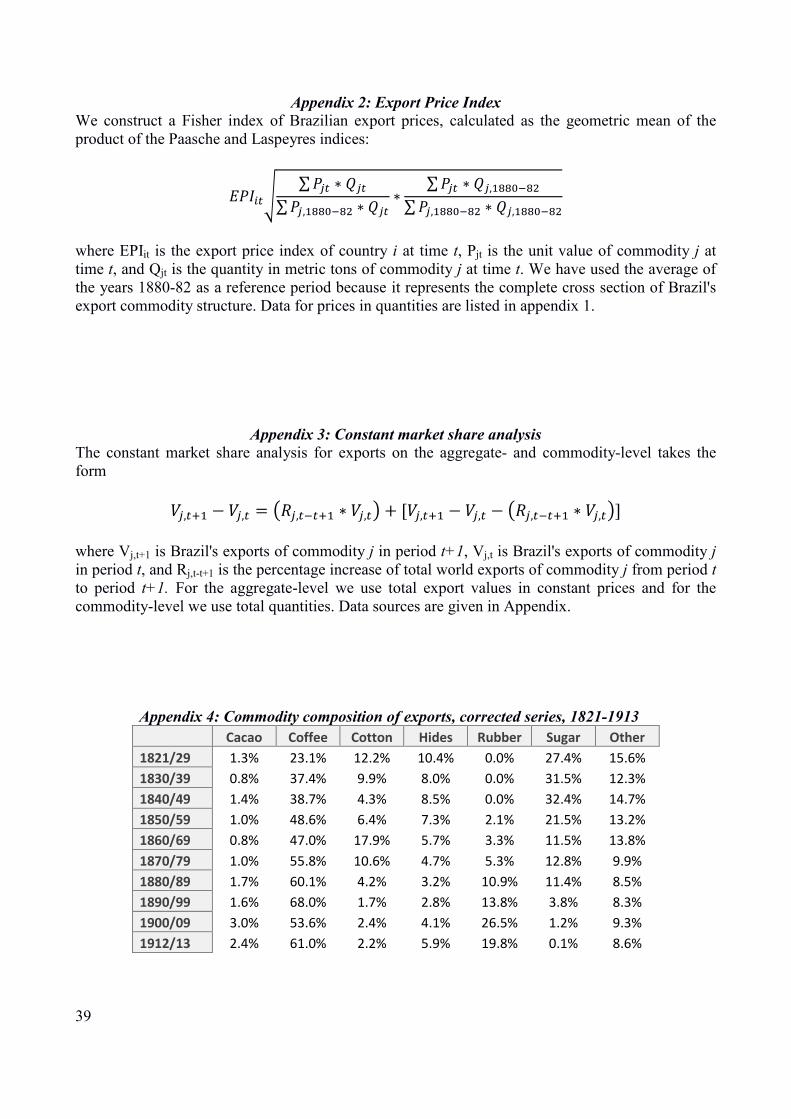
39
Appendix 2: Export Price Index
We construct a Fisher index of Brazilian export prices, calculated as the geometric mean of the product of the Paasche and Laspeyres indices:
������ ∑��� ∗ ���∑��,������� ∗ ��� ∗∑��� ∗ ��,�������∑��,������� ∗ ��,�������
where EPIit is the export price index of country i at time t, Pjt is the unit value of commodity j at time t, and Qjt is the quantity in metric tons of commodity j at time t. We have used the average of the years 1880-82 as a reference period because it represents the complete cross section of Brazil's export commodity structure. Data for prices in quantities are listed in appendix 1.
Appendix 3: Constant market share analysis The constant market share analysis for exports on the aggregate- and commodity-level takes the form ��,��� − ��,� = !�,����� ∗ ��,�" + [��,��� − ��,� − !�,����� ∗ ��,�"]
where Vj,t+1 is Brazil's exports of commodity j in period t+1, Vj,t is Brazil's exports of commodity j in period t, and Rj,t-t+1 is the percentage increase of total world exports of commodity j from period t to period t+1. For the aggregate-level we use total export values in constant prices and for the commodity-level we use total quantities. Data sources are given in Appendix.
Appendix 4: Commodity composition of exports, corrected series, 1821-1913 Cacao Coffee Cotton Hides Rubber Sugar Other
1821/29 1.3% 23.1% 12.2% 10.4% 0.0% 27.4% 15.6%
1830/39 0.8% 37.4% 9.9% 8.0% 0.0% 31.5% 12.3%
1840/49 1.4% 38.7% 4.3% 8.5% 0.0% 32.4% 14.7%
1850/59 1.0% 48.6% 6.4% 7.3% 2.1% 21.5% 13.2%
1860/69 0.8% 47.0% 17.9% 5.7% 3.3% 11.5% 13.8%
1870/79 1.0% 55.8% 10.6% 4.7% 5.3% 12.8% 9.9%
1880/89 1.7% 60.1% 4.2% 3.2% 10.9% 11.4% 8.5%
1890/99 1.6% 68.0% 1.7% 2.8% 13.8% 3.8% 8.3%
1900/09 3.0% 53.6% 2.4% 4.1% 26.5% 1.2% 9.3%
1912/13 2.4% 61.0% 2.2% 5.9% 19.8% 0.1% 8.6%
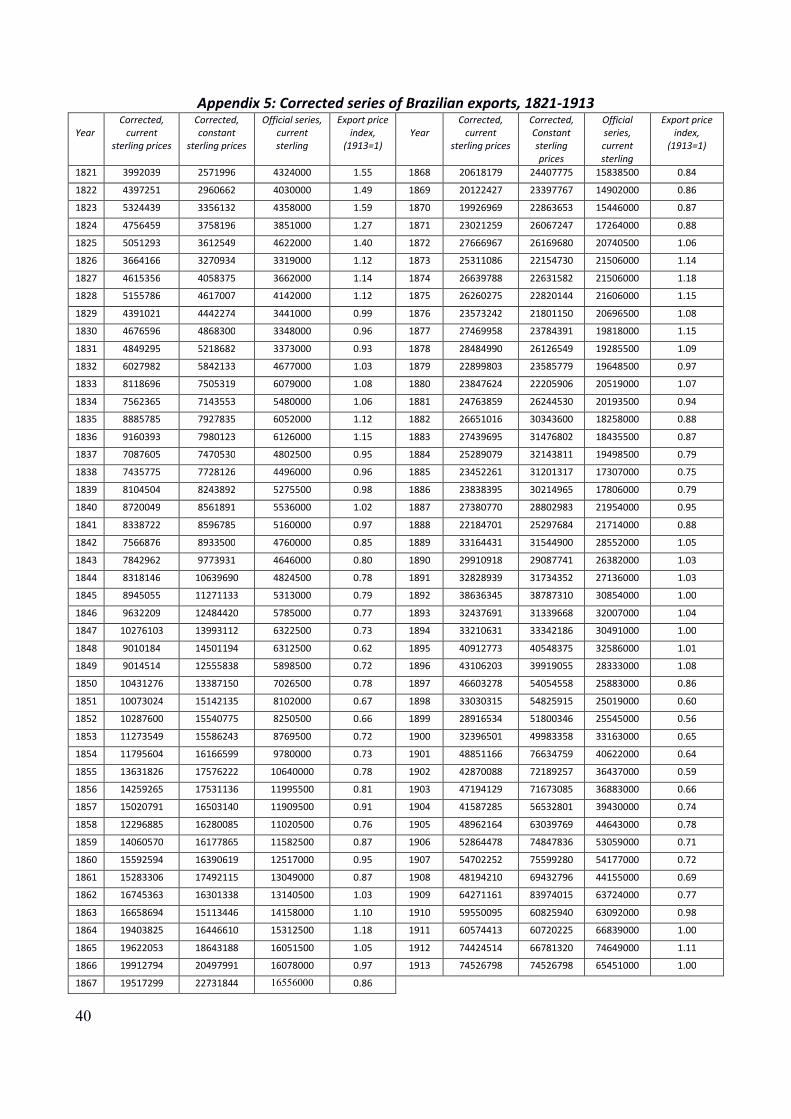
40
Appendix 5: Corrected series of Brazilian exports, 1821-1913
Year
Corrected,
current
sterling prices
Corrected,
constant
sterling prices
Official series,
current
sterling
Export price
index,
(1913=1)
Year
Corrected,
current
sterling prices
Corrected,
Constant
sterling
prices
Official
series,
current
sterling
Export price
index,
(1913=1)
1821 3992039 2571996 4324000 1.55 1868 20618179 24407775 15838500 0.84
1822 4397251 2960662 4030000 1.49 1869 20122427 23397767 14902000 0.86
1823 5324439 3356132 4358000 1.59 1870 19926969 22863653 15446000 0.87
1824 4756459 3758196 3851000 1.27 1871 23021259 26067247 17264000 0.88
1825 5051293 3612549 4622000 1.40 1872 27666967 26169680 20740500 1.06
1826 3664166 3270934 3319000 1.12 1873 25311086 22154730 21506000 1.14
1827 4615356 4058375 3662000 1.14 1874 26639788 22631582 21506000 1.18
1828 5155786 4617007 4142000 1.12 1875 26260275 22820144 21606000 1.15
1829 4391021 4442274 3441000 0.99 1876 23573242 21801150 20696500 1.08
1830 4676596 4868300 3348000 0.96 1877 27469958 23784391 19818000 1.15
1831 4849295 5218682 3373000 0.93 1878 28484990 26126549 19285500 1.09
1832 6027982 5842133 4677000 1.03 1879 22899803 23585779 19648500 0.97
1833 8118696 7505319 6079000 1.08 1880 23847624 22205906 20519000 1.07
1834 7562365 7143553 5480000 1.06 1881 24763859 26244530 20193500 0.94
1835 8885785 7927835 6052000 1.12 1882 26651016 30343600 18258000 0.88
1836 9160393 7980123 6126000 1.15 1883 27439695 31476802 18435500 0.87
1837 7087605 7470530 4802500 0.95 1884 25289079 32143811 19498500 0.79
1838 7435775 7728126 4496000 0.96 1885 23452261 31201317 17307000 0.75
1839 8104504 8243892 5275500 0.98 1886 23838395 30214965 17806000 0.79
1840 8720049 8561891 5536000 1.02 1887 27380770 28802983 21954000 0.95
1841 8338722 8596785 5160000 0.97 1888 22184701 25297684 21714000 0.88
1842 7566876 8933500 4760000 0.85 1889 33164431 31544900 28552000 1.05
1843 7842962 9773931 4646000 0.80 1890 29910918 29087741 26382000 1.03
1844 8318146 10639690 4824500 0.78 1891 32828939 31734352 27136000 1.03
1845 8945055 11271133 5313000 0.79 1892 38636345 38787310 30854000 1.00
1846 9632209 12484420 5785000 0.77 1893 32437691 31339668 32007000 1.04
1847 10276103 13993112 6322500 0.73 1894 33210631 33342186 30491000 1.00
1848 9010184 14501194 6312500 0.62 1895 40912773 40548375 32586000 1.01
1849 9014514 12555838 5898500 0.72 1896 43106203 39919055 28333000 1.08
1850 10431276 13387150 7026500 0.78 1897 46603278 54054558 25883000 0.86
1851 10073024 15142135 8102000 0.67 1898 33030315 54825915 25019000 0.60
1852 10287600 15540775 8250500 0.66 1899 28916534 51800346 25545000 0.56
1853 11273549 15586243 8769500 0.72 1900 32396501 49983358 33163000 0.65
1854 11795604 16166599 9780000 0.73 1901 48851166 76634759 40622000 0.64
1855 13631826 17576222 10640000 0.78 1902 42870088 72189257 36437000 0.59
1856 14259265 17531136 11995500 0.81 1903 47194129 71673085 36883000 0.66
1857 15020791 16503140 11909500 0.91 1904 41587285 56532801 39430000 0.74
1858 12296885 16280085 11020500 0.76 1905 48962164 63039769 44643000 0.78
1859 14060570 16177865 11582500 0.87 1906 52864478 74847836 53059000 0.71
1860 15592594 16390619 12517000 0.95 1907 54702252 75599280 54177000 0.72
1861 15283306 17492115 13049000 0.87 1908 48194210 69432796 44155000 0.69
1862 16745363 16301338 13140500 1.03 1909 64271161 83974015 63724000 0.77
1863 16658694 15113446 14158000 1.10 1910 59550095 60825940 63092000 0.98
1864 19403825 16446610 15312500 1.18 1911 60574413 60720225 66839000 1.00
1865 19622053 18643188 16051500 1.05 1912 74424514 66781320 74649000 1.11
1866 19912794 20497991 16078000 0.97 1913 74526798 74526798 65451000 1.00
1867 19517299 22731844 16556000 0.86

41
Copyright © 2022 FDOKUMEN