Boyaa Interactive International Limited 博雅互動國際有限公司
33
– 1 – Hong Kong Exchanges and Clearing Limited and The Stock Exchange of Hong Kong Limited take no responsibility for the contents of this announcement, make no representation as to its accuracy or completeness and expressly disclaim any liability whatsoever for any loss howsoever arising from or in reliance upon the whole or any part of the contents of this announcement. Boyaa Interactive International Limited 博雅互動國際有限公司 (Incorporated in the Cayman Islands with limited liability) (Stock Code: 0434) FIRST QUARTERLY RESULTS ANNOUNCEMENT FOR THE THREE MONTHS ENDED 31 MARCH 2020 FINANCIAL HIGHLIGHTS For the three months ended 31 March Year-on-Year Change* For the year ended 31 December 2019 2020 2019 RMB’000 RMB’000 % RMB’000 (unaudited) (unaudited) (audited) Revenue 93,083 80,204 16.1 323,816 – Web-based games 36,846 35,810 2.9 141,840 – Mobile games 56,237 44,394 26.7 181,976 Gross profit 65,198 55,217 18.1 221,164 Profit attributable to owners of the Company 11,903 40,079 (70.3) 33,760 Non-IFRS adjusted net profit (unaudited)*** 11,903 40,364 (70.5) 34,233
-
Upload
khangminh22 -
Category
Documents
-
view
1 -
download
0
Transcript of Boyaa Interactive International Limited 博雅互動國際有限公司

– 1 –
Hong Kong Exchanges and Clearing Limited and The Stock Exchange of Hong Kong Limited
take no responsibility for the contents of this announcement, make no representation as to
its accuracy or completeness and expressly disclaim any liability whatsoever for any loss
howsoever arising from or in reliance upon the whole or any part of the contents of this
announcement.
Boyaa Interactive International Limited博雅互動國際有限公司
(Incorporated in the Cayman Islands with limited liability)
(Stock Code: 0434)
FIRST QUARTERLY RESULTS ANNOUNCEMENTFOR THE THREE MONTHS ENDED 31 MARCH 2020
FINANCIAL HIGHLIGHTS
For the three months ended 31 March Year-on-Year
Change*
For the year
ended
31 December
20192020 2019
RMB’000 RMB’000 % RMB’000
(unaudited) (unaudited) (audited)
Revenue 93,083 80,204 16.1 323,816
– Web-based games 36,846 35,810 2.9 141,840
– Mobile games 56,237 44,394 26.7 181,976
Gross profit 65,198 55,217 18.1 221,164
Profit attributable to
owners of the Company 11,903 40,079 (70.3) 33,760
Non-IFRS adjusted net
profit (unaudited)*** 11,903 40,364 (70.5) 34,233

– 2 –
REVENUE BY GAMES
For the three months ended 31 March Year-on-Year
Change*%
2020 2019RMB’000 RMB’000
(unaudited) (unaudited)
Texas Hold’em Series 61,728 58,903 4.8Other Card and Board***** 31,355 21,301 47.2
Total 93,083 80,204 16.1
REVENUE BY LANGUAGE VERSIONS OF GAMES
For the three months ended 31 March Year-on-Year
Change*%
2020 2019RMB’000 RMB’000
(unaudited) (unaudited)
Simplified Chinese 14,967 12,260 22.1Other languages 78,116 67,944 15.0
Total 93,083 80,204 16.1
OPERATIONAL HIGHLIGHTS
For the three months ended Year-on-Year
Change*%
Quarter-on-Quarter
Change**%
31 March 2020
31 December 2019
31 March 2019
(unaudited) (unaudited) (unaudited)
Paying Players (in thousands) 431 334 484 (11.0) 29.0• Web-based games 10 13 17 (41.2) (23.1)• Mobile games 421 321 467 (9.9) 31.2
Daily Active Users (“DAUs”) (in thousands)**** 2,548 2,561 2,634 (3.3) (0.5)• Web-based games 129 207 192 (32.8) (37.7)• Mobile games 2,419 2,354 2,442 (0.9) 2.8
Monthly Active Users (“MAUs”) (in thousands)**** 7,838 7,149 8,286 (5.4) 9.6• Web-based games 440 536 608 (27.6) (17.9)• Mobile games 7,398 6,613 7,678 (3.6) 11.9

– 3 –
For the three months ended Year-on-Year
Change*%
Quarter-on-Quarter
Change**%
31 March 2020
31 December 2019
31 March 2019
(unaudited) (unaudited) (unaudited)
Average Revenue Per Paying User (“ARPPU”) for Texas Hold’em Series (in RMB)• Web-based games 1,363.6 960.4 744.8 83.1 42.0• Mobile games 129.7 135.0 124.5 4.2 (3.9)
ARPPU for Other Card and Board (in RMB)• Web-based games 9.3 18.0 20.3 (54.2) (48.3)• Mobile games 29.3 26.4 17.5 67.4 11.0
* Year-on-Year Change % represents a comparison between the current reporting period and the
corresponding period last year.
** Quarter-on-Quarter Change % represents a comparison between the quarter ended 31 March 2020 and
the immediately preceding quarter.
*** Non-IFRS adjusted net profit was derived from the net profit for the period excluding share-based
compensation expenses.
**** The numbers of DAUs and MAUs shown above are calculated based on the number of active players in
the last calendar month of the relevant reporting period.
***** The categories of “Fight the landlord”and “Others” set out in the summary in the previous quarterly
results announcement are combined and referred to as “Other Card and Board” above.
The board of directors (the “Board”) of Boyaa Interactive International Limited (the
“Company” or “we” or “our” or “us”) is pleased to announce the unaudited consolidated
results of the Company and its subsidiaries (the “Group” or “we” or “our” or “us”) for the three
months ended 31 March 2020 (the “Reporting Period”) (the “First Quarterly Results”). The
First Quarterly Results have been reviewed by ZHONGHUI ANDA CPA Limited, the auditor
of the Company, in accordance with Hong Kong Standard on Review Engagements 2410
“Review of interim financial information performed by the independent auditor of the entity”
issued by Hong Kong Institute of Certified Public Accountants, and by the audit committee of
the Company. This announcement is made pursuant to Rule 13.09 of the Rules Governing the
Listing of Securities on The Stock Exchange of Hong Kong Limited (the “Listing Rules”) and
the Inside Information Provisions under Part XIVA of the Securities and Futures Ordinance
(Cap. 571 of the Laws of Hong Kong).

– 4 –
BUSINESS OVERVIEW AND OUTLOOK
In terms of financial performance, we recorded a revenue of approximately RMB93.1 million
for the first quarter of 2020, representing a year-on-year increase of approximately 16.1%
compared to the same period in 2019 and a quarter-to-quarter increase of approximately
18.9% compared to the fourth quarter of 2019. The increase in our revenue was mainly
attributable to the increased time spent and spending of users on the online gaming products
of the Group due to (i) the preventive measures and social distancing policies imposed by
the relevant government authorities to combat the COVID-19 pandemic (the “COVID-19 Pandemic”) in the People’s Republic of China (the “PRC” or “China”), Hong Kong, Taiwan
and other overseas countries; and (ii) the online operational activities held by the Company.
We recorded an unaudited non-IFRS adjusted net profit of approximately RMB11.9 million
in the first quarter of 2020, representing a year-on-year decrease of approximately 70.5%
compared to the same period in 2019, which was mainly attributable to the decrease in fair
value of our financial assets such as equity investment partnerships due to the economic
downturn and market factors caused by the COVID-19 Pandemic and the increase in exchange
loss due to fluctuation in exchange rates in the global financial market. Excluding the impact
of non-operating one-off factors such as the changes in the fair value of financial assets
including equity investment partnerships, the year-on-year unaudited non-IFRS adjusted
net profit in the first quarter of 2020 basically remained stable compared to the first quarter
of 2019. However, it represented a quarter-to-quarter increase of approximately 124.6%
compared to the fourth quarter of 2019, and the significant increase was mainly attributable
to the underperformance of the unaudited non-IFRS net profit in the fourth quarter of 2019
due to the impact of non-operating one-off factors such as the decrease in the fair value of
financial assets including equity investment partnerships. As a result, the unaudited non-IFRS
adjusted net profit in the fourth quarter of 2019 has dropped significantly resulting in a larger
quarter-on-quarter growth in the first quarter of 2020. Excluding the impact of those non-
operating one-off factors. Such as the changes in fair value of financial assets including equity
investment partnerships, the unaudited non-IFRS adjusted net profit for the first quarter of 2020
represented a quarter-to-quarter increase of 39.0%, mainly due to the increase in revenue.
In terms of the operating data performance, we recorded an increase in the number of paying
players and users during the first quarter of 2020 as compared to the fourth quarter of 2019. In
particular, the number of paying players increased by 29.0% from approximately 0.33 million
in the fourth quarter of 2019 to approximately 0.43 million in the first quarter of 2020. The
number of DAUs decreased by 0.5% from approximately 2.6 million in the fourth quarter of
2019 to 2.5 million in the first quarter of 2020. The number of MAUs increased by 9.6% from
approximately 7.1 million in the fourth quarter of 2019 to approximately 7.8 million in the first
quarter of 2020. The ARPPU grew in Texas Hold’em web-based games and the mobile versions
of other card and board games.

– 5 –
The Company will continue to conduct more intensive market surveys, launch innovative game
rules, explore various operation modes for card and board games at home and abroad, improve
the experience of our game players, remain dedicated to product refinement and operation
diversification, ramp up the quality of our games in an all-rounded manner, and spare no effort
to build our brand for online and offline match series. On top of consolidating our existing
market, more efforts will be made to further expand our overseas market as well as other chess
and card games business, so as to offset the impact arising from the Policy Risk Factor. The
Company will strictly comply with various laws and regulations of the PRC, develop high-
quality puzzle games and matches, and continue with its journey to forge a century-old brand
for chess and card games.
MANAGEMENT DISCUSSION AND ANALYSIS
Revenue
Our revenue for the three months ended 31 March 2020 amounted to approximately RMB93.1
million, representing a year-on-year increase of 16.1% from approximately RMB80.2 million
recorded for the same period of 2019. The year-on-year increase was primarily due to the
increased time spent and spending of users on the online gaming products of the Group due
to the preventive measures and social distancing policies imposed by the relevant government
authorities to combat the COVID-19 Pandemic in China, Hong Kong, Taiwan and other
overseas countries, and the online operational activities held by the Group.
Cost of revenue
Our cost of revenue for the three months ended 31 March 2020 amounted to approximately
RMB27.9 million, representing a year-on-year increase of 11.6% from approximately RMB25.0
million recorded for the same period in 2019. The year-on-year increase was primarily due to
the increase in commission charges by platforms and third party payment vendors.
Gross profit and gross profit margin
As a result of the foregoing, our gross profit for the three months ended 31 March 2020
amounted to approximately RMB65.2 million, representing a year-on-year increase of 18.1%
from approximately RMB55.2 million recorded for the same period in 2019.
Our gross profit margin were approximately 70.0% and 68.8%, respectively, for the three
months ended 31 March 2020 and the same period in 2019.

– 6 –
Selling and marketing expenses
Our selling and marketing expenses for the three months ended 31 March 2020 amounted
to approximately RMB5.1 million, representing a year-on-year increase of 16.4% from
approximately RMB4.3 million recorded for the same period in 2019. The year-on-year
increase was mainly attributable to the increase in advertising and promotional activities
expenses.
Administrative expenses
Our administrative expenses for the three months ended 31 March 2020 amounted to
approximately RMB27.9 million, representing a year-on-year increase of 8.5% from
approximately RMB25.7 million recorded for the same period in 2019. The year-on-year
increase was mainly attributable to the increase in professional service expenses.
Other (losses)/gains – net
For the three months ended 31 March 2020, we recorded other losses (net) of approximately
RMB19.0 million, compared to other gains (net) of approximately RMB17.4 million recorded
for the same period in 2019. The other (losses)/gains – net primarily consisted of fair value
changes on investment at fair value through profit or loss and dividend income relating to the
non-quoted investments in equity investment partnerships and certain wealth management
products we purchased, and government subsidies.
Finance income – net
Our finance income – net for the three months ended 31 March 2020 was approximately
RMB5.4 million, compared to approximately RMB4.9 million recorded for the same period of
2019. The year-on-year change was primarily due to increase in interest income as compared to
the same period of 2019.

– 7 –
Share of result of associates
We held investments in five associates, namely Shenzhen Fanhou Technology Co., Ltd. (深圳市飯後科技有限公司), Shenzhen HuifuWorld Network Technology Co., Ltd. (深圳市匯富天下網絡科技有限公司), Shenzhen Easething Technology Co., Ltd. (深圳市易新科技有限公司), Shenzhen Jisiwei Intelligent Technology Co., Ltd. (深圳市極思維智能科技有限公司) and
Allin Network Technology Co., Ltd. (上海傲英網絡科技有限公司) and its subsidiaries as at 31
March 2020 (31 December 2019: five), all of which were online game or internet technology
companies. We recorded a share of loss of associates of approximately RMB0.6 million for the
three months ended 31 March 2020, compared to a share of loss of associates of approximately
RMB0.2 million recorded for the same period in 2019.
Income tax expense
Our income tax expense for the three months ended 31 March 2020 was approximately RMB6.2
million, representing a decrease of 15.0% from approximately RMB7.3 million recorded for the
three months ended 31 March 2019. The effective tax rate were 34.2% and 15.4%, respectively,
for the three months ended 31 March 2020 and the same period in 2019.
Profit attributable to owners of the company
As a result of the foregoing, our profit attributable to owners of the Company for the three
months ended 31 March 2020 amounted to approximately RMB11.9 million, representing
year-on-year decrease of 70.3%, from the profit attributable to owners of the Company of
approximately RMB40.1 million recorded for the same period in 2019.
Non-IFRS Measure – Adjusted net profit
To supplement our consolidated financial statements which are presented in accordance with
IFRS, we also use unaudited non-IFRS adjusted net profit as an additional financial measure to
evaluate our financial performance by eliminating the impact of items that we do not consider
indicative of the performance of our business. The term “adjusted net profit” is not defined
under IFRS. Other companies in the industry the Group operates in may calculate such non-
IFRS item differently from the Group. The use of adjusted net profit has material limitations as
an analytical tool, as adjusted net profit does not include all items that impact our net profit for
the Reporting Period and should not be considered in isolation or as a substitute for analysis of
the Group’s results as reported under IFRS.

– 8 –
Our unaudited non-IFRS adjusted net profit for the three months ended 31 March 2020 of
approximately RMB11.9 million, as compared to our unaudited non-IFRS adjusted net profit
for the three months ended 31 March 2019 of approximately RMB40.4 million derived
from our unaudited profit for the three months ended 31 March 2019 excluding share-based
compensation expenses of approximately RMB0.07 million, RMB0.08 million and RMB0.14
million included in cost of revenue, selling and marketing expenses and administrative
expenses, respectively.
Cash and cash equivalents
As at 31 March 2020, we had cash and cash equivalents of approximately RMB491.2 million
(31 December 2019: approximately RMB487.3 million), which primarily consisted of cash at
bank and in hand and short-term bank deposits, which were mainly denominated in Renminbi
(as to 60.8%), US dollars (as to 22.8%) and other currencies (as to 16.4%). We currently do not
hedge transactions undertaken in foreign currencies. Due to our persistent efforts in managing
our exposure to foreign currencies through constant monitoring to limit as much as possible the
amount of foreign currencies held by us, fluctuations in currency exchange rates do not have
any material adverse impact on our financial results.
Equity investment at fair value through other comprehensive income
We accounted for equity investments at fair values through other comprehensive income at their
respective fair values. As at 31 March 2020, the fair value of our unlisted and listed investments
classified as equity investments at fair value through other comprehensive income amounted to
approximately RMB35.8 million (31 December 2019: approximately RMB45.2 million). These
equity investments at fair value through other comprehensive income mainly consisted of both
listed and unlisted equity securities, which are mainly represented by our equity investment in
Dalian Zeus Entertainment Co., Ltd. (Shenzhen Stock Exchange: 002354), Xiaomi Corporation
(Hong Kong Stock Exchange: 1810) and Qudian Inc. (New York Stock Exchange: QD).
We consider that, none of the other unlisted and listed investments classified as equity
investments at fair value through other comprehensive income in our investment portfolio is
a significant investment as none of such investments has a carrying amount that accounts for
more than 5.0% of our total assets as at 31 March 2020.

– 9 –
Investments at fair value through profit or loss
As at 31 March 2020, we also recorded investments at fair value through profit or loss
amounted to approximately RMB876.1 million (31 December 2019: approximately RMB997.4
million), which consisted of non-quoted investments in asset management plans, equity
investment partnerships and wealth management products. As at 31 March 2020, the fair
values of the investments in asset management plans were determined by discount cash flows
model; the fair values of the investments in equity investment partnerships were determined by
discount cash flows model; and the fair values of investments in wealth management products,
which have an initial term ranging from immediate to 360 days, were determined based on the
estimated rate of return of investments. For the three months ended 31 March 2020, we recorded
fair value losses on investments at fair value through profit or loss of approximately RMB13.9
million (fair value gains for the three months ended 31 March 2019: approximately RMB6.9
million).
The investments in wealth management products under investments at fair value through profit
or loss were made in line with our treasury and investment policies, after taking into account,
among others, the level of risk, return on investment, liquidity and the term to maturity.
Generally, the Company has in the past selected wealth management products that are principal
guaranteed and relatively low risk products. Prior to making an investment, the Company had
also ensured that there remains sufficient working capital for the Company’s business needs
even after the investments in wealth management products. During the three months ended 31
March 2020, each of the investments made by the Company does not constitute a notifiable
transaction or a connected transaction of the Company under the Listing Rules. As agreed
with the financial institutions, the underlying investment portfolio of the wealth management
products of the Company were primarily represented by inter-bank loan market instruments
and exchange traded fixed-income financial instruments, such as inter-bank loans, government
bonds, central bank bills and similar products, which were highly liquid with a relatively short
term of maturity, and which were considered to akin to placing deposits with banks whilst
enabling the Group to earn an attractive rate of return.

– 10 –
On 28 December 2016, the Group, through Shenzhen Dong Fang Bo Ya Technology Co.,
Limited (深圳市東方博雅科技有限公司), established a limited partnership namely Jiaxing
Boyaa ChunLei Equity Investments Limited Partnership Enterprise (“Jiaxing Boyaa”) with
Shanghai Tailai Tianji Asset Management Co., Limited (上海泰來天濟資產管理有限公司). During the three months ended 31 March 2020, the Group’s accumulated contribution
of RMB300.0 million represented 99.0% of the total capital contribution of Jiaxing Boyaa.
The fair value of the investment in Jiaxing Boyaa as at 31 March 2020 was approximately
RMB256.7 million. Jiaxing Boyaa is established for carrying out equity investments, venture
capital investments and investments in securities, subject to certain investment restrictions. We
will continue to closely monitor the performance of Jiaxing Boyaa on an on-going basis.
On 25 October 2018, the Group, through Boyaa On-line Game Development (Shenzhen)
Co., Ltd* (博雅網絡遊戲開發(深圳)有限公司 ), had subscribed for two RMB wealth
management products issued by Industrial and Commercial Bank of China at the amount
of RMB200.0 million and RMB128.5 million, respectively (the “Wealth Management Products”). As at 31 March 2020, the fair value of the two Wealth Management Products
were approximately RMB210.0 million and RMB134.0 million, respectively. The Wealth
Management Products were assessed by the Company as very low-risk products. As at 31
March 2020, the bank accounts which holds the Wealth Management Products had been frozen.
For details as to the circumstance leading to the freezing of the accounts, please refer to the
announcements of the Company dated 1 September 2019, 13 December 2019, 3 January 2020
and 6 January 2020.
Save for our capital investment in Jiaxing Boyaa as a limited partnership and the subscription
of the Wealth Management Products, no other single investment that was designated as
investments at fair value through profit or loss in our investment portfolio has a carrying
amount that accounts for more than 5.0% of our total assets as at 31 March 2020.

– 11 –
Borrowings
During the three months ended 31 March 2020, we did not have any short-term bank
borrowings and we had no outstanding, utilized or unutilized banking facilities.
Capital expenditures
For the three months ended 31 March 2020, our total capital expenditures amounted to
approximately RMB2.2 million (for the three months ended 31 March 2019: Nil). The
capital expenditure mainly included purchasing equipment and leasehold improvements of
approximately RMB2.2 million, which was funded by using our cash flows generated from our
operations.
Pledge/charge of the Group’s assets
As at 31 March 2020, the Group did not have any pledged or charged assets.

– 12 –
FINANCIAL INFORMATION
CONDENSED CONSOLIDATED STATEMENT OF PROFIT OR LOSS AND OTHER COMPREHENSIVE INCOMEFOR THE THREE MONTHS ENDED 31 MARCH 2020
Three months ended 31 March
2020 2019Notes RMB’000 RMB’000
(unaudited) (unaudited)
Revenue 4 93,083 80,204Cost of revenue (27,885) (24,987)
Gross profit 65,198 55,217Other (losses)/gains, net 5 (18,974) 17,438Selling and marketing expenses (5,059) (4,347)Administrative expenses (27,922) (25,726)
Operating profit 13,243 42,582Finance income 6 5,565 5,156Finance costs 7 (159) (212)Share of losses of associates (568) (179)
Profit before income tax 18,081 47,347Income tax expense 8 (6,178) (7,268)
Profit for the period attributable to owners of the Company 9 11,903 40,079
Other comprehensive expenses:Items that will not be reclassified to profit or loss:Changes in fair value of equity investments at fair
value through other comprehensive income (9,367) 1,204Exchange differences on translating foreign operations 1,241 (1,358)Item that may be reclassified to profit or loss:Exchange differences on translating foreign operations 4,448 (7,691)
Other comprehensive expenses for the period, net of tax (3,678) (7,845)
Total comprehensive income for the period attributable to owners of the Company 8,225 32,234
– 13 –
Three months ended 31 March
2020 2019Notes RMB’000 RMB’000
(unaudited) (unaudited)
Earnings per share (RMB cents) 11– Basic 1.80 5.98
– Diluted 1.80 5.98
CONDENSED CONSOLIDATED STATEMENT OF PROFIT OR LOSS AND OTHER COMPREHENSIVE INCOME (CONTINUED)FOR THE THREE MONTHS ENDED 31 MARCH 2020

– 14 –
CONDENSED CONSOLIDATED STATEMENT OF FINANCIAL POSITIONAS AT 31 MARCH 2020
31 March2020
31 December2019
Notes RMB’000 RMB’000(unaudited) (audited)
ASSETSNon-current assetsProperty, plant and equipment 12 41,621 41,792Right-of-use assets 9,284 10,426Intangible assets 106 213Investments in associates 12,195 12,793Equity investments at fair value through other
comprehensive income 13 35,798 45,165Investments at fair value through profit or loss 14 474,600 495,012Prepayments, deposits and other receivables 35,720 37,860Deferred tax assets 23,315 23,713
632,639 666,974
Current assetsTrade receivables 15 22,265 18,001Prepayments, deposits and other receivables 48,427 41,922Investments at fair value through profit or loss 14 401,490 502,347Restricted bank deposits 16 288,965 288,394Term deposits 521,475 388,216Bank and cash balances 491,163 487,301
1,773,785 1,726,181
Total assets 2,406,424 2,393,155
EQUITY AND LIABILITIESEquityShare capital 18 234 234Reserves 2,116,657 2,110,009
Total equity 2,116,891 2,110,243

– 15 –
31 March2020
31 December2019
Notes RMB’000 RMB’000(unaudited) (audited)
LiabilitiesNon-current liabilitiesLease liabilities 4,784 5,127Deferred tax liabilities 6,585 7,696
11,369 12,823
Current liabilitiesTrade and other payables 17 72,496 72,057Contract liabilities 19,624 18,100Lease liabilities 4,538 4,896Current tax liabilities 181,506 175,036
278,164 270,089
Total liabilities 289,533 282,912
Total equity and liabilities 2,406,424 2,393,155
Net current assets 1,495,621 1,456,092
Total assets less current liabilities 2,128,260 2,123,066
CONDENSED CONSOLIDATED STATEMENT OF FINANCIAL POSITION (CONTINUED)AS AT 31 MARCH 2020

– 16 –
CONDENSED CONSOLIDATED STATEMENT OF CHANGES IN EQUITYFOR THE THREE MONTHS ENDED 31 MARCH 2020
(Unaudited) Attributable to owners of the Company
Sharecapital
Sharepremium
Repurchasedshares
Sharesheld for
RSUscheme
Capitalreserve
Foreigncurrency
translationreserve
Statutoryreserve
Share-based
paymentsreserve
Otherreserve
Retainedprofits Total
RMB’000 RMB’000 RMB’000 RMB’000 RMB’000 RMB’000 RMB’000 RMB’000 RMB’000 RMB’000 RMB’000
At 1 January 2019 235 543,721 (2,060) (14) 2,000 13,479 28,474 84,032 (215,509) 1,810,676 2,265,034
Total comprehensive (expenses)/income for the period – – – – – (9,049) – – 1,204 40,079 32,234
Share-based payments– value of employee services – – – – – – – 285 – – 285– exercise and lapse of
share options and RSUs – 303 – – – – – (303) – – –
Changes in equity for the period – 303 – – – (9,049) – (18) 1,204 40,079 32,519
At 31 March 2019 235 544,024 (2,060) (14) 2,000 4,430 28,474 84,014 (214,305) 1,850,755 2,297,553
At 1 January 2020 234 380,970 (4,864) (14) 2,000 24,490 33,990 80,721 (246,204) 1,838,920 2,110,243
Total comprehensiveincome/(expenses) for the period – – – – – 5,689 – – (9,367) 11,903 8,225
Repurchase of ordinary shares – – (1,577) – – – – – – – (1,577)Share-based payments
– exercise and lapse of share options and RSUs – 863 – – – – – (863) – – –
Changes in equity for the period – 863 (1,577) – – 5,689 – (863) (9,367) 11,903 6,648
At 31 March 2020 234 381,833 (6,441) (14) 2,000 30,179 33,990 79,858 (255,571) 1,850,823 2,116,891

– 17 –
CONDENSED CONSOLIDATED STATEMENT OF CASH FLOWSFOR THE THREE MONTHS ENDED 31 MARCH 2020
Three months ended 31 March
2020 2019RMB’000 RMB’000
(unaudited) (unaudited)
Cash flows from operating activitiesCash generated from operating activities 28,851 21,113Income tax paid (5,300) (6,607)Lease interests paid (159) –
Net cash generated from operating activities 23,392 14,506
Cash flows from investing activitiesPlacement of term deposits with original maturities over
three months (467,944) (367,350)Proceeds from maturity of term deposits with original
maturities over three months 335,573 217,992Interest received 5,565 4,854Purchases of investments at fair value through profit or loss (150,135) (354,547)Proceeds from settlements of investments
at fair value through profit or loss 257,953 490,000Purchases of property, plant and equipment (2,175) –Proceeds from disposals of property, plant and equipment 16 –
Net cash used in investing activities (21,147) (9,051)
Cash flows from financing activitiesRepayment of lease liabilities (902) (859)Repurchase of ordinary shares (1,577) –
Net cash used in financing activities (2,479) (859)
Net (decrease)/increase in cash and cash equivalents (234) 4,596Effect of foreign exchange rate changes 4,096 (2,344)Cash and cash equivalents at beginning of the period 487,301 390,350
Cash and cash equivalents at end of the period 491,163 392,602
Analysis of cash and cash equivalentsBank and cash balances 491,163 392,602
– 18 –
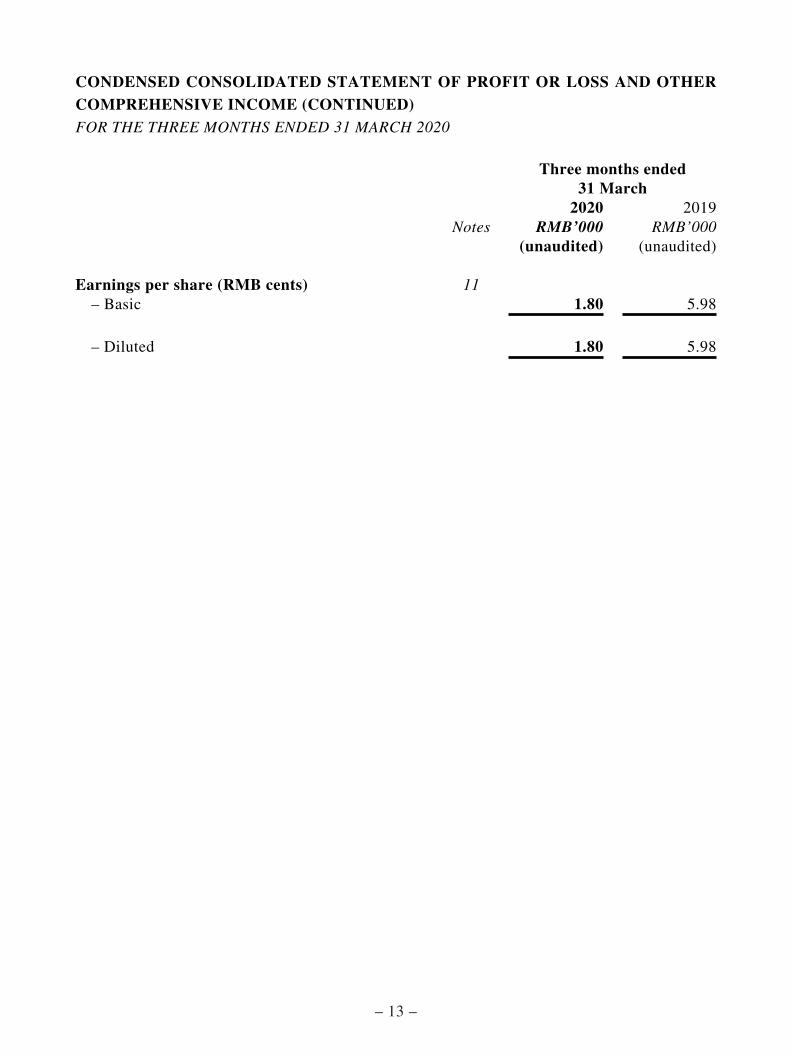
NOTES TO THE CONDENSED CONSOLIDATED FINANCIAL STATEMENTSFOR THE THREE MONTHS ENDED 31 MARCH 2020
1. GENERAL INFORMATION
Boyaa Interactive International Limited (the “Company”) was incorporated in the Cayman Islands. The
address of its registered office is P.O. Box 309, Ugland House, Grand Cayman, KY1-1104, Cayman Islands.
The address of its principal place of business in Hong Kong is 14/F., Golden Centre, 188 Des Voeux Road
Central, Hong Kong. The address of its headquarters is 8/F, Block E1, International E Town, TCL Industry
Park, 1001 Zhong Shan Yuan Road, Nanshan District, Shenzhen, the People’s Republic of China (the
“PRC”). The Company’s shares are listed on the Main Board of The Stock Exchange of Hong Kong Limited
(the “Stock Exchange”).
The condensed consolidated financial statements are presented in Renminbi (the “RMB”), which is the
Company’s presentation currency and the functional currency of the principal operating subsidiaries of the
Group.
The Company acts as an investment holding company. The principal activities of the Group are the
development and operation of online games and provision of advisory services.
2. BASIS OF PREPARATION
These condensed consolidated financial statements have been prepared in accordance with International
Accounting Standard 34 “Interim Financial Reporting” issued by the International Accounting Standards
Board and the applicable disclosures required by the Rules Governing the Listing of Securities on the Stock
Exchange.
These condensed consolidated financial statements should be read in conjunction with the 2019 annual
financial statements. The accounting policies and methods of computation used in the preparation of
these condensed consolidated financial statements are consistent with those used in the annual financial
statements for the year ended 31 December 2019.
3. ADOPTION OF NEW AND REVISED INTERNATIONAL FINANCIAL REPORTING STANDARDS
In the current period, the Company and its subsidiaries (the “Group”) has adopted all the new and revised
International Financial Reporting Standards (“IFRSs”) issued by the International Accounting Standards
Board that are relevant to its operations and effective for its accounting year beginning on 1 January
2020. IFRSs comprise International Financial Reporting Standards (“IFRS”); International Accounting
Standards; and Interpretations. The adoption of these new and revised IFRSs did not result in significant
changes to the Group’s accounting policies, presentation of the Group’s consolidated financial statements
and amounts reported for the current period and prior years.
The Group has not applied the new and revised IFRSs that have been issued but are not yet effective. The
Group has already commenced an assessment of the impact of these new and revised IFRSs but is not yet
in a position to state whether these new and revised IFRSs would have a material impact on its results of
operations and financial position.

– 19 –
4. REVENUE AND SEGMENT INFORMATION
Three months ended 31 March2020 2019
RMB’000 RMB’000
(unaudited) (unaudited)
Web-based games 36,846 35,810
Mobile games 56,237 44,394
Revenue from contracts with customers 93,083 80,204
Disaggregation of revenue from contracts with customers:
Timing of revenue recognition
Three months ended 31 March2020 2019
RMB’000 RMB’000
(unaudited) (unaudited)
At a point of time 93,083 80,204
The directors of the Company consider that the Group’s operations are operated and managed as a single
segment. The directors of the Company, being the chief operating decision maker of the Group, review the
operating results of the Group as a whole when making decisions about resource allocations and assessing
performances. Hence it is determined that the Group has only one operating segment. Accordingly no
segment information is presented.
The Group offers its games in various language versions in order to enable game players to play the games
in different geographical locations. The Group’s operations are substantially located in the PRC (including
Hong Kong). A breakdown of revenue derived from different languages versions of the Group’s games is as
follows:
Three months ended 31 March2020 2019
RMB’000 RMB’000
(unaudited) (unaudited)
Simplified Chinese 14,967 12,260
Other languages 78,116 67,944
93,083 80,204
No revenue is derived from any individual game player which amounted for over 10% of the Group’s total
revenue (for the three months ended 31 March 2019: nil).
– 20 –
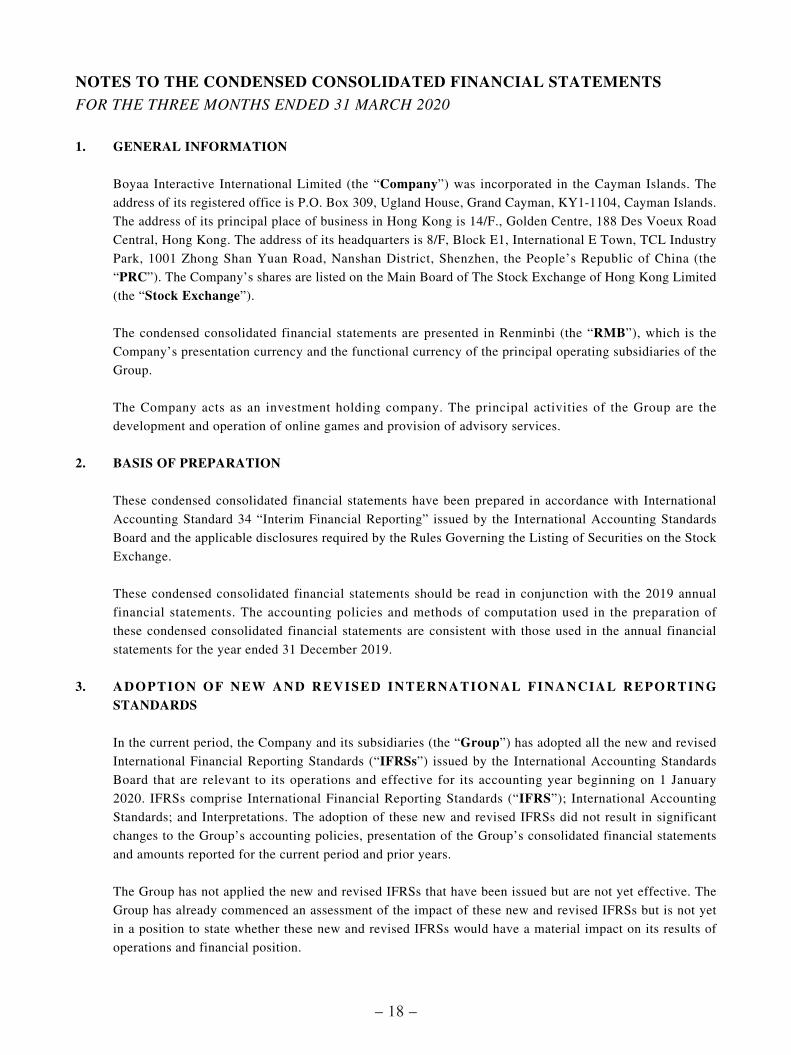
The Group’s non-current assets other than deferred tax assets, investments at fair value through profit or
loss and equity investments at fair value through other comprehensive income were located as follows:
31 March 2020
31 December
2019
RMB’000 RMB’000
(unaudited) (audited)
Mainland China 74,515 86,002
Other locations 24,411 17,082
98,926 103,084
5. OTHER (LOSSES)/GAINS, NET
Three months ended 31 March2020 2019
RMB’000 RMB’000
(unaudited) (unaudited)
Loss on disposals of property, plant and equipment – (333)
Government subsidies and tax rebates (note) 542 7,452
Net foreign exchange (losses)/gains (5,619) 3,382
Fair value changes on investments at fair value through profit or loss (13,884) 6,937
Others (13) –
(18,974) 17,438
Note:
Government subsidies represented various industry-specific subsidies granted by the government
authorities to subsidise the research and development costs incurred by the Group during the course of its
business.
– 21 –
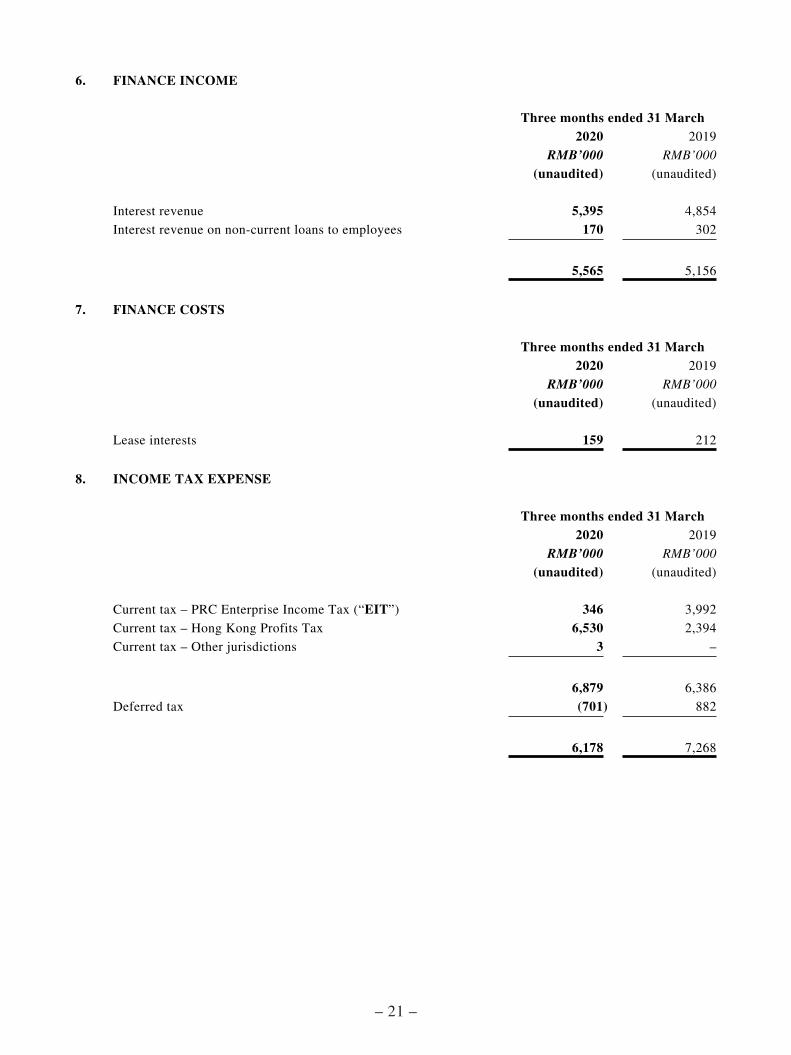
6. FINANCE INCOME
Three months ended 31 March2020 2019
RMB’000 RMB’000
(unaudited) (unaudited)
Interest revenue 5,395 4,854
Interest revenue on non-current loans to employees 170 302
5,565 5,156
7. FINANCE COSTS
Three months ended 31 March2020 2019
RMB’000 RMB’000
(unaudited) (unaudited)
Lease interests 159 212
8. INCOME TAX EXPENSE
Three months ended 31 March2020 2019
RMB’000 RMB’000
(unaudited) (unaudited)
Current tax – PRC Enterprise Income Tax (“EIT”) 346 3,992
Current tax – Hong Kong Profits Tax 6,530 2,394
Current tax – Other jurisdictions 3 –
6,879 6,386
Deferred tax (701) 882
6,178 7,268

– 22 –
(a) EIT
The income tax provision of the Group in respect of operations in the PRC has been calculated at the
tax rate of 25% on the estimated assessable profits for the three months ended 31 March 2020 and
2019, based on the existing legislation, interpretations and practices in respect thereof.
Shenzhen Dong Fang Bo Ya Technology Co., Limited has successfully renewed its “High and New
Technology Enterprise” (“HNTE”) qualification under PRC Enterprise Income Tax Law (“EIT Law”) during the year ended 31 December 2018 and as a result, Shenzhen Dong Fang Bo Ya
Technology Co., Limited enjoy a preferential tax rate of 15% from 1 January 2018 to 31 December
2020. Therefore, the applicable tax rate for Shenzhen Dong Fang Bo Ya Technology Co., Limited
was 15% (2019: 15%) for the three months ended 31 March 2020.
Boyaa On-line Game Development (Shenzhen) Co., Limited has successfully renewed its HNTE
qualification under EIT Law during the year ended 31 December 2019 and as a result, Boyaa On-
line Game Development (Shenzhen) Co., Limited enjoy a preferential tax rate of 15% from 1 January
2019 to 31 December 2021. Therefore, the applicable tax rate for Boyaa On-line Game Development
(Shenzhen) Co., Limited was 15% (2019: 15%) for the three months ended 31 March 2020.
According to policies promulgated by the State Tax Bureau of the PRC and effective from 2008
onwards, enterprises engaged in research and development activities are entitled to claim 175%
(2019: 175%) of the research and development expenses so incurred in a year as tax deductible
expenses in determining its tax assessable profits for that year (“Super Deduction”). Shenzhen
Dong Fang Bo Ya Technology Co., Limited and Boyaa On-line Game Development (Shenzhen) Co.,
Limited had claimed such Super Deduction in ascertaining its tax assessable profits for the three
months ended 31 March 2020 and 2019.
(b) PRC withholding tax (“WHT”)
According to the applicable PRC tax regulations, dividends distributed by a company established
in the PRC to a foreign investor with respect to profits derived after 1 January 2008 are generally
subject to a 10% WHT. If a foreign investor incorporated in Hong Kong meets the conditions and
requirements under the double taxation treaty arrangement entered into between the PRC and Hong
Kong, the relevant withholding tax rate will be reduced from 10% to 5%.
As at 31 March 2020, the retained earnings of the Group’s PRC subsidiaries not yet remitted to
holding companies incorporated outside of the PRC, for which no deferred income tax liability had
been provided, were RMB1,118,316,000 (31 December 2019: RMB1,118,398,000). Such earnings
are expected to be retained by the PRC subsidiaries for reinvestment purposes and would not be
remitted to their foreign investor in the foreseeable future based on the management’s estimation of
overseas funding requirements.
(c) Hong Kong Profits Tax
Hong Kong Profits Tax has been provided at the rate of 8.25% on assessable profits up to
HK$2,000,000 and 16.5% on any part of assessable profits over HK$2,000,000 for the three months
ended 31 March 2020 and 2019.

– 23 –
9. PROFIT FOR THE PERIOD
The Group’s profit for the period is stated after charging/(crediting) the following:
Three months ended 31 March2020 2019
RMB’000 RMB’000
(unaudited) (unaudited)
Amortisation of intangible assets
– included in cost of revenue 107 264
– included in selling and marketing expenses – 11
– included in administrative expenses – 3
107 278
Depreciation 3,817 2,250
Research and development expenditure
– included in staff costs 12,011 12,545
– included in depreciation 96 383
– included in other administrative expenses 2,032 1,578
14,139 14,506
Reversal of loss allowance provision for trade receivables (1,571) (177)
Reversal of loss allowance provision for loans to employees (41) –
Staff costs including directors’ emoluments
– Wages, salaries and bonuses 16,118 18,497
– Retirement benefit scheme contributions 1,594 883
– Share-based payments – 285
17,712 19,665
10. DIVIDENDS
The board (the “Board”) of directors of the Company has resloved not to declare a dividend for the three
months ended 31 March 2020 (for the three months ended 31 March 2019: nil).

– 24 –
11. EARNINGS PER SHARE
The calculation of the basic and diluted earnings per share is based on the following:
Three months ended 31 March2020 2019
RMB’000 RMB’000
(unaudited) (unaudited)
EarningsEarnings for the purpose of basic and diluted earnings per share 11,903 40,079
Number of shares (’000)Weighted average number of ordinary shares for the purpose of
basic earnings per share 662,054 669,670
Effect of dilutive potential ordinary shares arising from RSUs – 312
Effect of dilutive potential ordinary shares arising from share options 1 25
Weighted average number of ordinary shares for the purpose of
diluted earnings per share 662,055 670,007
12. PROPERTY, PLANT AND EQUIPMENT
During the three months ended 31 March 2020, the Group acquired property, plant and equipment of
approximately RMB2,175,000 (for the three months ended 31 March 2019: nil).
13. EQUITY INVESTMENTS AT FAIR VALUE THROUGH OTHER COMPREHENSIVE INCOME
31 March 2020
31 December
2019
RMB’000 RMB’000
(unaudited) (audited)
Equity securities, at fair value
– Listed in PRC - Dalian Zeus Entertainment Co., Limited 14,358 19,100
– Listed in Hong Kong - Xiaomi Corporation 16,216 16,416
– Listed in USA - Qudian Inc. 2,807 7,232
33,381 42,748
– Unlisted equity securities in PRC 1,518 1,518
– Unlisted preference shares of private companies 899 899
Total equity investments at fair value through other comprehensive
income, analysed as non-current assets 35,798 45,165
– 25 –
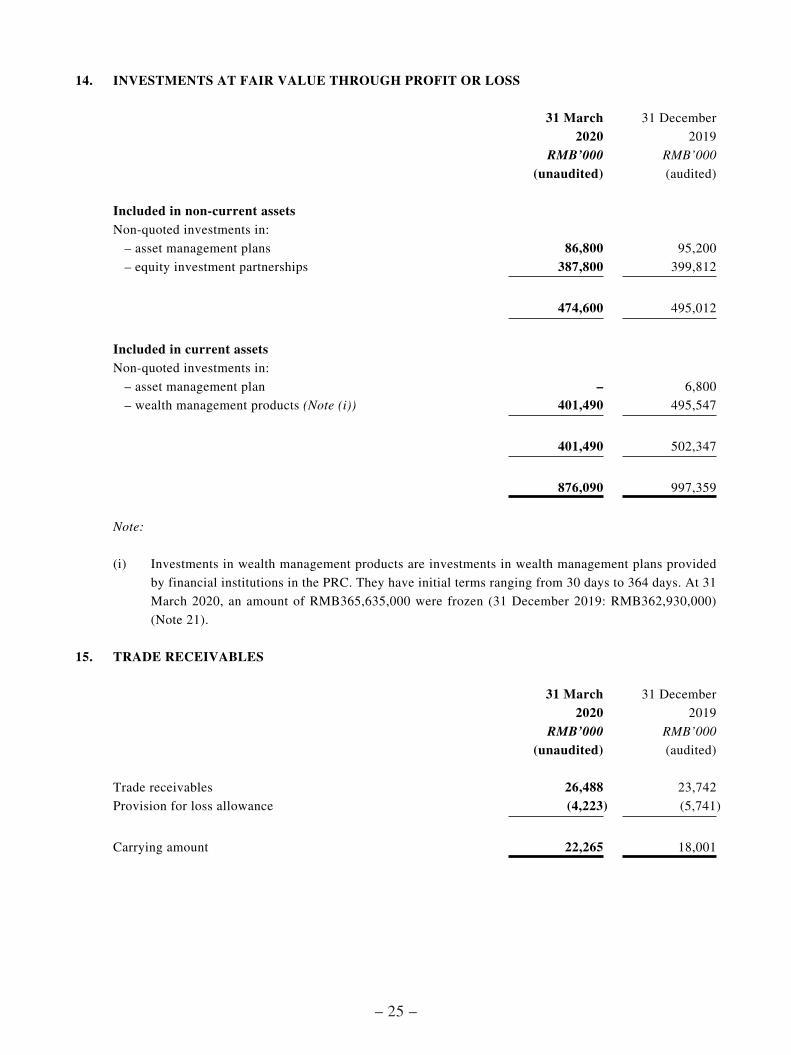
14. INVESTMENTS AT FAIR VALUE THROUGH PROFIT OR LOSS
31 March 2020
31 December
2019
RMB’000 RMB’000
(unaudited) (audited)
Included in non-current assetsNon-quoted investments in:
– asset management plans 86,800 95,200
– equity investment partnerships 387,800 399,812
474,600 495,012
Included in current assetsNon-quoted investments in:
– asset management plan – 6,800
– wealth management products (Note (i)) 401,490 495,547
401,490 502,347
876,090 997,359
Note:
(i) Investments in wealth management products are investments in wealth management plans provided
by financial institutions in the PRC. They have initial terms ranging from 30 days to 364 days. At 31
March 2020, an amount of RMB365,635,000 were frozen (31 December 2019: RMB362,930,000)
(Note 21).
15. TRADE RECEIVABLES
31 March 2020
31 December
2019
RMB’000 RMB’000
(unaudited) (audited)
Trade receivables 26,488 23,742
Provision for loss allowance (4,223) (5,741)
Carrying amount 22,265 18,001

– 26 –
The aging analysis of trade receivables, based on recognition date of the trade receivables, net of allowance,
is as follows:
31 March 2020
31 December
2019
RMB’000 RMB’000
(unaudited) (audited)
0 to 30 days 13,776 16,949
31 to 60 days 6,171 240
61 to 90 days – 157
91 to 180 days 1,811 173
181 to 360 days 132 264
Over 360 days 375 218
22,265 18,001
16. RESTRICTED BANK DEPOSITS
The Group’s restricted bank deposits represented deposits that were frozen (note 21).
17. TRADE AND OTHER PAYABLES
31 March 2020
31 December
2019
RMB’000 RMB’000
(unaudited) (audited)
Trade payables 1,308 879
Other tax payables 42,749 43,215
Accrued expenses 6,538 5,906
Accrued commissions charges by platforms 13,961 13,854
Accrued advertising expenses 2,215 1,908
Salary and staff welfare payables 5,460 5,087
Others 265 1,208
72,496 72,057

– 27 –
The aging analysis of trade payables, based on recognition date of trade payables, is as follows:
31 March 2020
31 December
2019
RMB’000 RMB’000
(unaudited) (audited)
0 to 30 days 221 219
31 to 90 days 267 262
91 to 180 days 392 92
181 to 365 days 92 –
Over 365 days 336 306
1,308 879
18. SHARE CAPITAL
The total authorised share capital of the Company comprises 2,000,000,000 (2019: 2,000,000,000 ordinary
shares) ordinary shares with par value of USD0.00005 (2019: USD0.00005 per share) per share.
Number ofordinary
shares
Nominalvalue of
ordinaryshares
Equivalentnominalvalue of
ordinaryshares
USD’000 RMB’000
Issued and fully paid:
At 1 January 2019 (audited) 724,583,301 36 235
Cancellation of ordinary shares (2,832,000) – (1)
At 31 December 2019 and 1 January 2020
(audited) and 31 March 2020 (unaudited) 721,751,301 36 234

– 28 –
19. SHARE-BASED PAYMENTS
(a) Share options
On 7 January 2011, the Board of the Company approved the establishment of a share option scheme
(“Pre-IPO Share Option Scheme”) with the objective to recognise and reward the contribution of
eligible directors and employees to the growth and development of the Group. The contractual life of
all options under Pre-IPO Share Option Scheme is eight years from the grant date.
On 23 October 2013, the Board of the Company approved the establishment of a share option scheme
(“Post-IPO Share Option Scheme”) with the objective to recognise and reward the contribution of
eligible directors and employees to the growth and development of the Group. The contractual life of
all options under Post-IPO Share Option Scheme is ten years from the grant date.
Details of the share options outstanding during the period are as follows:
Number of share optionsFor the period ended 31 March
2020 2019
(unaudited) (unaudited)
Outstanding at the beginning of the period 7,311,427 8,323,315
Lapsed during the period (2,749) (11,888)
Outstanding at the end of the period 7,308,678 8,311,427
Exercisable at the end of the period 7,308,678 8,311,427
No options were exercised during the period ended 31 March 2020 and 2019.
Details of the exercise prices and the respective numbers of share options which remained
outstanding as at 31 March 2020 and 2019 are as follows:
Exercise price Number of share options
Original
currency
Equivalent
to HK$
For the period ended 31 March
2020 2019
Expiry date (unaudited) (unaudited)
31 January 2019 USD0.05 0.388 – –
1 March 2020 USD0.10 0.775 – 2,749
30 June 2020 USD0.15 1.163 66,249 66,249
6 September 2025 HK$3.108 3.108 7,242,429 8,242,429
7,308,678 8,311,427
– 29 –
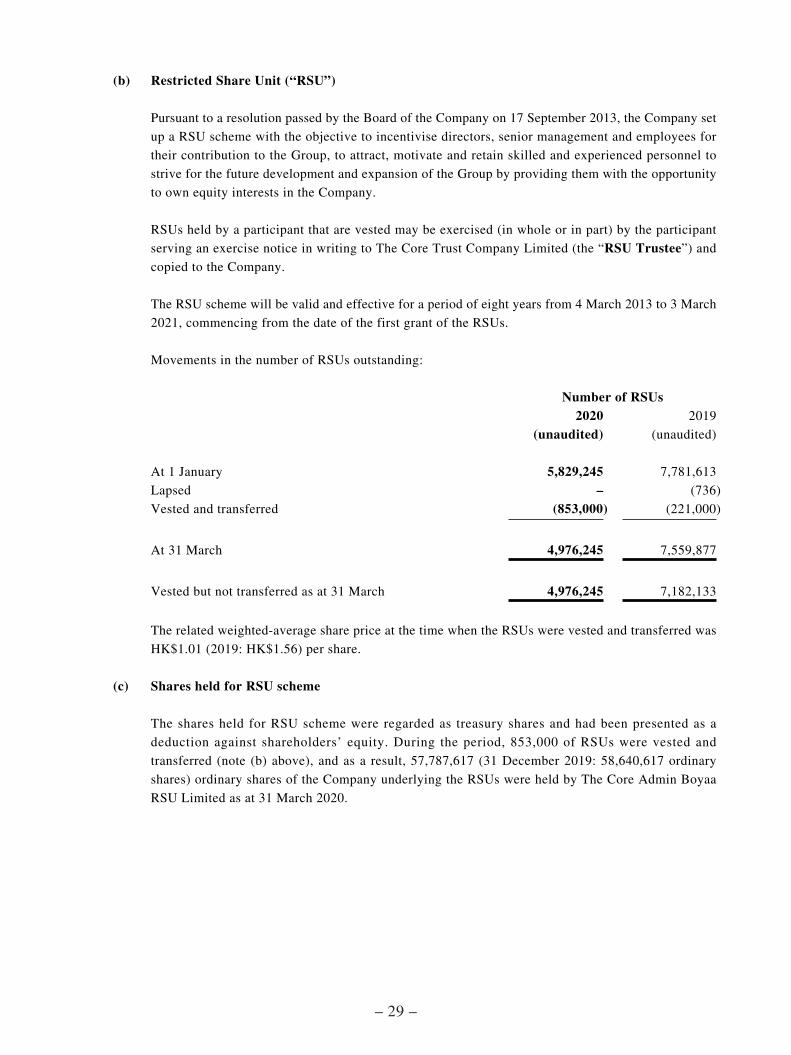
(b) Restricted Share Unit (“RSU”)
Pursuant to a resolution passed by the Board of the Company on 17 September 2013, the Company set
up a RSU scheme with the objective to incentivise directors, senior management and employees for
their contribution to the Group, to attract, motivate and retain skilled and experienced personnel to
strive for the future development and expansion of the Group by providing them with the opportunity
to own equity interests in the Company.
RSUs held by a participant that are vested may be exercised (in whole or in part) by the participant
serving an exercise notice in writing to The Core Trust Company Limited (the “RSU Trustee”) and
copied to the Company.
The RSU scheme will be valid and effective for a period of eight years from 4 March 2013 to 3 March
2021, commencing from the date of the first grant of the RSUs.
Movements in the number of RSUs outstanding:
Number of RSUs2020 2019
(unaudited) (unaudited)
At 1 January 5,829,245 7,781,613
Lapsed – (736)
Vested and transferred (853,000) (221,000)
At 31 March 4,976,245 7,559,877
Vested but not transferred as at 31 March 4,976,245 7,182,133
The related weighted-average share price at the time when the RSUs were vested and transferred was
HK$1.01 (2019: HK$1.56) per share.
(c) Shares held for RSU scheme
The shares held for RSU scheme were regarded as treasury shares and had been presented as a
deduction against shareholders’ equity. During the period, 853,000 of RSUs were vested and
transferred (note (b) above), and as a result, 57,787,617 (31 December 2019: 58,640,617 ordinary
shares) ordinary shares of the Company underlying the RSUs were held by The Core Admin Boyaa
RSU Limited as at 31 March 2020.

– 30 –
20. RELATED PARTY TRANSACTIONS
In addition to those related party transactions and balances disclosed elsewhere in the consolidated financial
statements, the Group had the following transactions and balances with its related parties during the period:
31 March 2020
31 December
2019
RMB’000 RMB’000
(unaudited) (audited)
Amount due from a director included in other receivables 657 657
Amount due from a related party included in other receivables 2,003 2,003
The amount due from a director, from a related party and to an associate are unsecured, interest-free and
repayable on demand.
21. MATERIAL EVENTS
In March 2019, the Company has come to the attention that it was not able to continue to use the idle cash
reserves in its individual bank accounts (the “Relevant Idle Cash Reserves”) for fixed-term deposits or
wealth management (the “Incident”). At 31 March 2020, the Group’s investments at fair value through
profit or loss of approximately RMB366 million and cash and cash equivalents of approximately RMB289
million were frozen.
At the relevant time, the Company considered that the Incident may be implicated as a result of the Case
(as defined below) involving individual Employees (as defined below), as such, the Company has engaged
its PRC legal advisers (the “PRC Legal Advisers”) to advise on this matter. Upon engagement of the
PRC Legal Advisers, the PRC Legal Advisers have submitted applications to the relevant PRC court and
procuratorate on behalf of the Company in relation to the Incident, including an application to utilize the
Relevant Idle Cash Reserves.
Upon advice of the PRC Legal Advisers, the Company filed another application (the “Application”) to
the relevant PRC court on 21 August 2019 seeking to utilize the Relevant Idle Cash Reserves for wealth
management. On 27 August 2019, the Company received a reply (the “Reply”) from the relevant PRC court
that the Relevant Idle Cash Reserves were frozen due to a prosecution (the “Case”) made by the relevant
PRC judicial authority against its individual current or former employees (the “Employees”) for their
alleged illegal activities conducted through one of the Company’s onshore online gaming platforms (the
“Alleged Crime”). Therefore, the Application was rejected. As advised by the PRC Legal Advisers, if the
relevant PRC judicial authority finds that the Employees are guilty of the Alleged Crime and some or all of
the Relevant Idle Cash Reserves contain income generated as a result of such conduct, such income may be
confiscated.
– 31 –
On 27 December 2019, the Intermediate People’s Court of Chengde City, Hebei Province (the “Trial Court”) delivered the judgment in relation to the Case (the “Judgment”). The Trial Court held that the
Employees are guilty of the Alleged Crime and ordered an amount of approximately RMB943 million to be
paid to the state treasury (the “Judgment Amount”).
The Company is not a party to the Case. As at the date of this announcement, none of the Company, its
directors and its senior management had been subject to any prosecution or investigation by the relevant
PRC judicial authorities in relation to the Alleged Crime. In addition, the Company had not received any
notification from any relevant PRC judicial authority in relation to the Judgment Sum and so far as the
Company is aware, the other bank accounts had not been frozen by the relevant PRC judicial authorities.
The Company is discussing with its PRC Legal Advisers as to the next step forward in relation to the
Judgment, including the possibility to take appropriate legal actions as to the Judgment Amount to protect
the interests of the Company and its shareholders. As advised by the PRC Legal Advisers, as at the date of
this announcement, one of the Employees had applied for appeal against the Judgment and therefore, the
Judgment will not be enforceable and the Trial Court will not order the Judgment Amount to be paid until
the judgment from the appeal hearing has been handed down. As at the date of this announcement, the date
of the appeal hearing has not been fixed.
In light of the fact that (i) the Company, its directors and senior management had not been subject to any
prosecution by the relevant PRC judicial authority in relation to the Alleged Crime as at the date of this
announcement; (ii) the Relevant Idle Cash Reserves of the Company are only used for the purpose of
investing in fixed-term deposits and wealth management products, which is the Company’s general practice;
(iii) the Company has sufficient cash reserves available in the other bank accounts for its day-to-day
operations; (iv) the Company does not have any loan borrowing as at the date of this announcement; and (v)
as at 31 March 2020, the Group recorded current assets in the sum of approximately RMB1.77 billion, the
Judgment Amount accounted for approximately 53.3% of the then Group’s current assets, the Board is of the
view that the Judgment would not have any material adverse impact on the business, operation and financial
conditions of the Group.

– 32 –
RECONCILIATION FROM UNAUDITED NET PROFIT TO UNAUDITED NON-IFRS ADJUSTED NET PROFITFOR THE THREE MONTHS ENDED 31 MARCH 2020
For the three months ended Year-on-Year Change*
Quarter-on-Quarter
Change**
31 March 2020
31 December 2019
31 March 2019
RMB’000 RMB’000 RMB’000 % %(unaudited) (unaudited) (unaudited)
Revenue 93,083 78,313 80,204 16.1 18.9Cost of revenue (27,885) (25,897) (24,987) 11.6 7.7
Gross profit 65,198 52,416 55,217 18.1 24.4Selling and marketing expenses (5,059) (5,728) (4,347) 16.4 (11.7)Administrative expenses (27,922) (31,109) (25,726) 8.5 (10.2)Other gains/(loss) – net (18,974) (69,803) 17,438 (208.8) 72.8
Operating profit/(loss) 13,243 (54,224) 42,582 (68.9) 124.4Finance income – net 5,406 6,963 4,944 9.3 (22.4)Share of (loss)/profit of associates (568) (3,620) (179) (217.3) 84.3
Profit/(Loss) before income tax 18,081 (50,881) 47,347 (61.8) 135.5Income tax (expenses)/credit (6,178) 2,573 (7,268) 15.0 (340.1)
Profit for the period 11,903 (48,308) 40,079 (70.3) 124.6
Non-IFRS Adjustment (unaudited)Share-based compensation expense
included in cost of revenue – – 68 (100.0) –Share-based compensation expense
included in selling and marketing expenses – – 75 (100.0) –
Share-based compensation expense included in administrative expenses – 1 142 (100.0) (100.0)
Non-IFRS adjusted net profit (unaudited) 11,903 (48,307) 40,364 (70.5) 124.6
* Year-on-Year Change % represents a comparison between the current reporting period and the
corresponding period last year.
** Quarter-on-Quarter Change % represents a comparison between the quarter ended 31 March 2020 and the
immediately preceding quarter.

– 33 –
EXTRACT OF INDEPENDENT AUDITOR’S REVIEW REPORT
The following is an extract of the independent auditor’s report on Review of Interim Condensed Consolidated Financial Information of the Group for the three months ended 31 March 2020:
“BASIS FOR QUALIFIED CONCLUSION
We were unable to obtain sufficient appropriate evidence to satisfy ourselves as to the recoverability of frozen investments at fair value through profit or loss and restricted bank deposits of RMB365,635,000 and RMB288,965,000 as at 31 March 2020 respectively and RMB362,930,000 and RMB288,394,000 as at 31 December 2019 respectively. Given the scope limitation, there were no other satisfactory procedures that we could perform to determine whether any adjustments to the carrying amounts of frozen investments at fair value through profit or loss and restricted bank deposits as at 31 March 2020 and 31 December 2019 were necessary.
QUALIFIED CONCLUSION
Based on our review, except for the possible effects of the matter described in the Basis for Qualified Conclusion section of our report, nothing has come to our attention that causes us to believe that the interim financial information is not prepared, in all material respects, in accordance with International Accounting Standard 34 “Interim Financial Reporting”.”
For further details in relation to the Qualified Conclusion, please refer to the Section headed “Details of the Qualified Opinion and its Potential Impact” of the annual report of the Company dated 8 June 2020.
The Board wishes to remind investors and shareholders that the above financial information is based on the Group’s unaudited management accounts. Investors are cautioned not to unduly rely on such information and are advised to exercise caution when dealing in the securities of the Company.
By order of the Board ofBoyaa Interactive International Limited
Dai ZhikangChairman and Executive Director
Hong Kong, 24 June 2020
As at the date of this announcement, the executive directors of the Company are Mr. Dai Zhikang and Ms. Tao Ying; the independent non-executive directors of the Company are Mr. Cheung Ngai Lam, Mr. Choi Hon Keung Simon and Mr. Sun Zihua.


![(2014) 上海大学博物馆艺术邀请展作品集 [Invitational Art Exhibition at the Museum of Shanghai University]](https://static.fdokumen.com/doc/165x107/6333da4128cb31ef600d73db/2014-invitational-art-exhibition.jpg)