Book of abstract (pdf) - | Knowledge for policy
135
-
Upload
khangminh22 -
Category
Documents
-
view
9 -
download
0
Transcript of Book of abstract (pdf) - | Knowledge for policy


This publication is a report by the Joint Research Centre (JRC), the European Commission’s science and knowledge service. It aims to provide evidence-based scientific support to the European policymaking process. The scientific output expressed does not imply a policy position of the European Commission. Neither the European Commission nor any person acting on behalf of the Commission is responsible for the use that might be made of this publication. For information on the methodology and quality underlying the data used in this publication for which the source is neither Eurostat nor other Commission services, users should contact the referenced source. The designations employed and the presentation of material on the maps do not imply the expression of any opinion whatsoever on the part of the European Union concerning the legal status of any country, territory, city or area or of its authorities, or concerning the delimitation of its frontiers or boundaries.
EU Science Hub https://ec.europa.eu/jrc
JRC127150
Ispra: European Commission, 2021
© European Union, 2021
The reuse policy of the European Commission is implemented by the Commission Decision 2011/833/EU of 12 December 2011 on the reuse of Commission documents (OJ L 330, 14.12.2011, p. 39). Except otherwise noted, the reuse of this document is authorised under the Creative Commons Attribution 4.0 International (CC BY 4.0) licence (https://creativecommons.org/licenses/by/4.0/). This means that reuse is allowed provided appropriate credit is given and any changes are indicated. For any use or reproduction of photos or other material that is not owned by the EU, permission must be sought directly from the copyright holders.
All content © European Union 2021
i
Contents
Keynote 1 22 November 09:30 – 10:50 ...................................................................................................................................................1
Modelling for the emergency: the Earth4All experience ..................................................................................................................... 2
Session 1 : Ensuring model quality 22 November 11:00 – 12:45 ........................................................................................4
Increasing model transparency, quality and coherence by deploying tested modules ................................................... 5
The Need for a Systematic and Iterated Comparison of Different Policy Models ............................................................. 6
Algorithmic bias in machine learning models: detection and avoidance in policy applications ................................. 7
Policy analysis of the transformation of the EU’s agricultural sector: A review of model capabilities and an outlook for future research. .................................................................................................................................................................................. 9
Advanced climate predictions in the polar regions: Key results from the APPLICATE project ................................................................................................................................................................................................... 10
Towards an integrated perspective: improving the links between the energy system and economy-wide model.................................................................................................................................................................................. 11
Session 2 : Transparency of models and their use 22 November 13:30 – 14:50 .............................................. 15
All for one and one for all – Considerations about holistic challenges of sustainability analysis ......................... 16
Global land-use impacts of EU’s future bioeconomy: An econometric input-output approach ................................ 17
The International Soil Modelling Consortium – Bridging soil modelling to policy and society .................................. 18
The Euro Area's pandemic recession: A DSGE-based interpretation.......................................................................................... 19
Beyond the results of models: additional purposes for modelling in the policy process ............................................. 20
Contributed session 1: Co-design of modelling-based services for climate change adaptation related policy support under the EU DestinE Initiative 22 November 14:50 -16:20 ...................................... 22
Introduction .................................................................................................................................................................................................................... 23
Adaptation modelling and the new EU Adaptation Strategy .......................................................................................................... 23
Enhancing the European Adaptation Platform Climate-ADAPT to support Digital Twin on Climate Change Adaptation ...................................................................................................................................................................................................................... 24
Twinning and Global Environment Monitoring: The Example of Water – A Pathway of Opportunity Bridging from Data to Actionable Forecasting on Relevant Scales ................................................................................................................ 25
Modelling Approaches and Co-design at National Level ................................................................................................................... 27
Digital Twins for Safe and Sustainable Delta Development in a Changing Climate – A Perspective on the Destination Earth Initiative................................................................................................................................................................................... 27
Keynote 2: Economic models and the COVID-19 pandemic 23 November 09:30 – 10:50 .......................... 30
Economic models and the COVID-19 pandemic ..................................................................................................................................... 31
Session 3 : Scenarios and data 23 November 11:00 – 12:45.............................................................................................. 32
Modelling markets of bio-based chemical products with BioMAT .............................................................................................. 33
Modelling food waste and loss in a computable general equilibrium framework ............................................................ 34
Combining ecosystem and biodiversity models for air pollution impact assessment ................................................... 38
Transdisciplinary modelling for the identification of sustainable grassland management strategies under climate change ............................................................................................................................................................................................................ 39
Socio-economic impacts of ambitious GHG reduction targets: Combining input-output data with energy technology representation .................................................................................................................................................................................... 41
Long-term economic impacts of coastal floods in Europe .............................................................................................................. 41
ii
Keynote 3: Modelling tools for policy support in (real) time of crisis 24 November 09:30 – 10:50 ............................................................................................................................................................................. 43
Modelling tools for policy support in (real) time of crisis ............................................................................................................... 44
Session 4 : Modelling complex systems for policy 24 November 11:00 – 12:45 ............................................... 45
Effects of the Border Tax Adjustment in the EU until 2030 ........................................................................................................... 46
Quantifying Spillovers of Next Generation EU Investment .............................................................................................................. 47
Agent-based modeling for ex-ante policy evaluation: The establishment of Renewable Energy Communities ................................................................................................................................................................................................ 48
Co-dynamics of climate policy stringency and public support ...................................................................................................... 50
Digital Twins for Cities and Regions: Global Challenges, Regional Initiatives, European Approaches .................. 51
Machine learning for regional crop yield forecasting in Europe ................................................................................................... 55
Session 5 : Assessing and communicating uncertainty in model results 24 November 13:30 – 14:50 ............................................................................................................................................................................. 56
Net-zero emission targets for major emitting countries consistent with the Paris Agreement .............................. 57
Investigating optimal allocation of green recovery funds in the EU ......................................................................................... 58
Extreme events in the coastal zone – a multidisciplinary approach for better Preparedness .................................. 60
Operationalisation of well-being. A Benefit of the Doubt model for Dutch municipalities ......................................... 61
Biogeochemical model ensembles for policy-support in agriculture ........................................................................................ 62
Contributed session 2: Modelling for the Banking Union 24 November 14:50 – 16:20 ............................... 64
SYMBOL: a modelling tool to evaluate banking-related policy options ................................................................................... 65
Modelling the effectiveness and efficiency of crisis management safety nets ................................................................ 65
Recoupment capacity of the European banking sector to the Single Resolution Fund and the Common Backstop ........................................................................................................................................................................................................................... 66
Session 6 : Multidisciplinary approaches, integrated assessment and model linkages 25 November 09:30 – 10:50 ............................................................................................................................................................................. 68
Guiding the mitigation of epidemics with reinforcement learning ............................................................................................. 69
Bridging Ecosystem Services Accounts to General Equilibrium models: the case of invasive alien species from INCA to GTAP .................................................................................................................................................................................................... 70
An Integrated Modelling System to evaluate health and environmental impacts from air pollution in Italy ................................................................................................................................................................................................................................ 71
An integrated modelling framework to assess carbon emissions and removals in the European Agriculture, Forestry and Land Use sectors ............................................................................................................................................... 72
The use of an integrated modelling approach (CGE, sectoral) to support developing long-term climate strategies up to 2050.............................................................................................................................................................................................. 74
Session 7 : Using model related evidence for policy: processes and experiences 25 November 11:00 – 12:45 .............................................................................................................................................................................. 76
Enhancing the DIONE cost model in support of Car and Van CO2 Standards for the Fit for 55 package ........ 77
Fossil fuels subsidy removal and the EU Green Deal policy mix design ................................................................................. 78
Innovative models to estimate COVID-19 Impact on International Trade............................................................................. 80
Environmental, economic and distributional implications of gradual energy tax reform in the EU ...................... 81
Environmental economic modelling and EU Marine and Water Framework Directives ................................................. 82
Expanding the frontiers of computational toxicology: a regulatory perspective ............................................................... 83
iii
Contributed session 3: Climate change adaptation modelling as a key support tool for evidence-based policies in a time of planetary crisis 25 November 14:50 – 16:20 ............................................................... 84
Modelling as a support tool for addressing the prerogatives of climate adaptation policy – insights from the preparation of the new EU Strategy on Adaptation to Climate Change and from the study on Adaptation modelling ......................................................................................................................................................................................................................... 85
Macroeconomic implications of climate change in the EU: a country and sub national assessment (COACCH project) .............................................................................................................................................................................................................................. 85
Climate services for better informed adaptation choices. Case application, performance and outlooks (CLARA project) ............................................................................................................................................................................................................ 86
Climate impacts and adaptation in Europe (JRC PESETA IV project) ......................................................................................... 87
Poster session 26 November 11:00 – 12:45 ...................................................................................................................................... 90
Integrating diverse model results into decision support for good environmental status and blue growth .................................................................................................................................................................................................................... 91
Facilitating the verification of large scale models ................................................................................................................................ 92
Testing as a core element of Quality Management in policy relevant simulation models ......................................... 94
Taxing income or consumption: macroeconomic and distributional effects for Italy ..................................................... 95
Modelling future scenarios: A vector-based CA model for simulating urban land use change ................................ 96
Developing Multi-regional TIMES-Ireland Model to Support Energy Policy Making: Impacts of Monetary Incentives on Market Uptake of Electric Vehicles .................................................................................................................................. 98
Communicating the value of occupational safety and health to policy makers: estimation of the costs of work-related injuries and diseases ................................................................................................................................................................. 99
Where does the EU Cohesion Policy produce its impact? Simulations with a Regional Dynamic General Equilibrium Model ................................................................................................................................................................................................... 101
Machine Learning algorithms and environmental decision support systems: a new approach for air quality decision planning .................................................................................................................................................................... 101
Scenarios for sustainable future in 2050- using system dynamics to enhance foresight for better policy insight ............................................................................................................................................................................................................................. 102
E3ME-FTT-GENIE: model description, update and results ............................................................................................................. 105
The Application of SDM in Regional Foresight. Results of the POLIRURAL Project ........................................................ 106
Agricultural policy behavioural, ecological and socio-economic modelling: From case studies to European scale.................................................................................................................................................................................................... 108
Session 8 : Combination of qualitative and quantitative methods 26 November 13:30 – 14:50 .......................................................................................................................................................................... 110
Territorial Impact Assessment – modelling evidence for better EU legislation ............................................................... 111
ETF’s Foresight Approach to the Future of Work/Skills in Specific Economic Sectors ................................................. 112
Modelling stakeholder-perceived system interactions to explore policy opportunities for coastal environment improvement ................................................................................................................................................................................ 114
Policy modelling for scoping alternative pathways for sustainable and profitable agriculture in Europe ....................................................................................................................................................................................................................... 114
Scenario planning: ISPRA’s first experience with circular economy ....................................................................................... 116
Session 9 : Communication and visualisation of model results 26 November 14:50 – 16:20 .......................................................................................................................................................................... 118
Co-producing model literacy for sustainability ................................................................................................................................... 119
Land-use modelling exercises using LUISETTA to foster a debate on urbanization pathways ........................... 120

iv
Introducing the ReSET (Restarting Economy in Support of Environment, through Technology) Policy Support System ........................................................................................................................................................................................ 123
Using hydrological model to support regional water policies: Co-creation of Dynamic Adaptive Policy Pathways for water resources in climate change scenarios for a Mediterranean
region (Algarve-Portugal) ................................................................................................................................................................................ 123
Informing Ireland’s carbon budgets with the TIMES-Ireland energy system model ................................................... 124
Contributed session 4: Highlights from the EU Open Data Days: how open data can support policy-making 26 November 16:30 – 18:00 ..................................................................................................................................... 126
Introduction ............................................................................................................................................................................................................... 127

1
Keynote 1
22 November
09:30 – 10:50
2
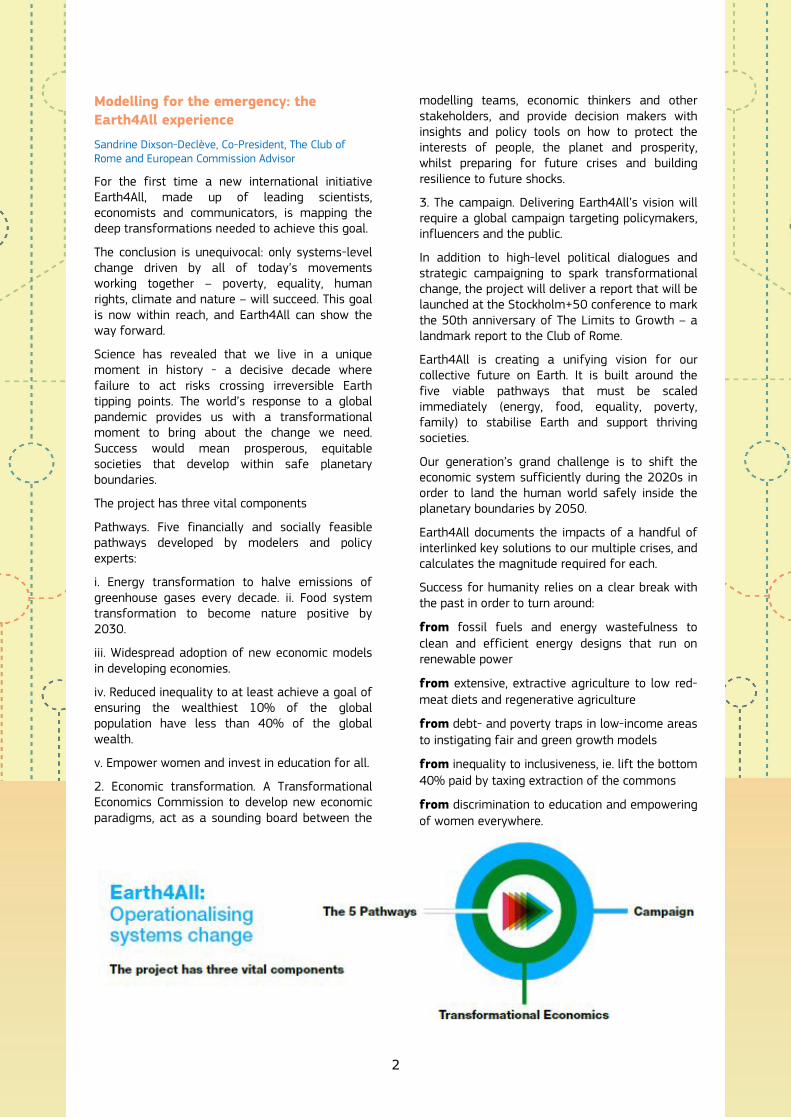
Modelling for the emergency: the Earth4All experience
Sandrine Dixson-Declève, Co-President, The Club of Rome and European Commission Advisor
For the first time a new international initiative Earth4All, made up of leading scientists, economists and communicators, is mapping the deep transformations needed to achieve this goal.
The conclusion is unequivocal: only systems-level change driven by all of today’s movements working together – poverty, equality, human rights, climate and nature – will succeed. This goal is now within reach, and Earth4All can show the way forward.
Science has revealed that we live in a unique moment in history - a decisive decade where failure to act risks crossing irreversible Earth tipping points. The world’s response to a global pandemic provides us with a transformational moment to bring about the change we need. Success would mean prosperous, equitable societies that develop within safe planetary boundaries.
The project has three vital components
Pathways. Five financially and socially feasible pathways developed by modelers and policy experts:
i. Energy transformation to halve emissions ofgreenhouse gases every decade. ii. Food systemtransformation to become nature positive by2030.
iii. Widespread adoption of new economic modelsin developing economies.
iv. Reduced inequality to at least achieve a goal ofensuring the wealthiest 10% of the globalpopulation have less than 40% of the globalwealth.
v. Empower women and invest in education for all.
2. Economic transformation. A TransformationalEconomics Commission to develop new economicparadigms, act as a sounding board between the
modelling teams, economic thinkers and other stakeholders, and provide decision makers with insights and policy tools on how to protect the interests of people, the planet and prosperity, whilst preparing for future crises and building resilience to future shocks.
3. The campaign. Delivering Earth4All’s vision willrequire a global campaign targeting policymakers,influencers and the public.
In addition to high-level political dialogues and strategic campaigning to spark transformational change, the project will deliver a report that will be launched at the Stockholm+50 conference to mark the 50th anniversary of The Limits to Growth – a landmark report to the Club of Rome.
Earth4All is creating a unifying vision for our collective future on Earth. It is built around the five viable pathways that must be scaled immediately (energy, food, equality, poverty, family) to stabilise Earth and support thriving societies.
Our generation’s grand challenge is to shift the economic system sufficiently during the 2020s in order to land the human world safely inside the planetary boundaries by 2050.
Earth4All documents the impacts of a handful of interlinked key solutions to our multiple crises, and calculates the magnitude required for each.
Success for humanity relies on a clear break with the past in order to turn around:
from fossil fuels and energy wastefulness to clean and efficient energy designs that run on renewable power
from extensive, extractive agriculture to low red-meat diets and regenerative agriculture
from debt- and poverty traps in low-income areas to instigating fair and green growth models
from inequality to inclusiveness, ie. lift the bottom 40% paid by taxing extraction of the commons
from discrimination to education and empowering of women everywhere.

3
Our key findings are that we need:
A. a shift in mindset from extractive to circulatoryin both monetary and material cycles by applyinginsights from living systems, and …
B. to apply the idea and reality of the commons torestructure economic instruments which can beadded quickly to the current toolkit.
since …
1. current trends will not lead to wellbeing formost-of-the-world
2. nothing less than all of the above fiveturnarounds are necessary this decade
3. collective and common governance by an active,confident state is needed,
4. bold and new funding mechanisms where therich countries support the low-income countriesare crucial for everyone’s wellbeing, and that
5. achieving the key turnarounds at speed requiressharing the benefits, bottom-up participation andlocal adaptation.

2
Session 1
Ensuring model quality
22 November
11:00 – 12:45

5
Increasing model transparency, quality and coherence by deploying tested modules
Wolfgang Britz, Institute for Food and Resource Economics, University Bonn Marijke Kuiper, Wageningen Economic Research Katarzyna Zawalińska, Institute of Rural and Agricultural Development, Polish Academy of Sciences Luca Salvatici, Department of Economics, Roma Tre University
The EU funded BATMODEL project (Better Agricultural Trade Modelling for Policy Analysis, https://batmodel.org) aims at improving trade models currently used in policymaking. By developing new and extending existing solutions to capture changes in international agri-food trade and their impacts, BATMODEL targets both partial and computable general equilibrium (CGE) models. Distinctive for BATMODEL is its emphasis on providing access to improvements developed within a particular model to other modelling teams inside and beyond the project by deploying tested modules. Open access to these modules along with clear rules for documentation and coding shall increase both transparency and implementation quality. This supports adherence to impact assessment guidelines as part of the EU’s better regulation efforts. It also fosters cooperation between modelling teams by facilitating the exchange of model developments. This allows teams to build on each other’s advancements, spreading the benefits well beyond the teams and the lifetime of the BATMODEL project. This paper presents the approach planned in BATMODEL with a discussion of pros and cons as a concrete example of a way to improve transparency and software quality of models widely used in policy design and assessments.
The idea of a modular implementation of economic models is not new. For instance, the two CGE modelling platforms MAGNET (Woltjer and Kuiper, 2014) realized in GEMPACK, and CGEBox (Britz and Van der Mensbrugghe 2018) coded in GAMS, give flexibility in configuring a CGE model for a specific application. The same holds, to a lesser degree, for the partial equilibrium model CAPRI (Britz and Witzke 2014). But these three models are still closed systems. Their exchangeable code blocks for various model components (production, demand, trade etc.) are compatible within each model, but not across models. BATMODEL aims to open up to code exchanges beyond such closed shop flexibility.
The modular implementation strategy followed in BATMODEL addresses shortcomings of how the code for economic models is currently developed. Either complete new developments are favoured over stepwise improvements, or when existing models are extended, efforts are not shared
across modelling teams (Britz et al. 2021). This results in differences in software implementation (declaration of variables and equations for simulation, loading required data and parameters, defining parameters for benchmarking, perform post-model reporting for such building blocks, etc.) even in case of identical methodological choices.
Generic software engineering development focuses on software build upon re-usable granular code blocks (objects, functions) with clearly defined interfaces (inputs, outputs). Such units of code can be tested mostly independent from each other and are often combined into “libraries” of functions or objects which jointly cover the functionality required for groups of tasks Software engineering mostly combines existing, well tested and documented code pieces into a new project avoiding recoding of basic functionalities already available in libraries (with all the possibilities for conceptual or implementation errors).
Such “libraries”, e.g. to model bi-lateral trade (with a choice between Armington, Krugman, Melitz, MRIO, spatial equilibrium by market) are not available for economic modelling. Instead of libraries whole models are distributed, including the desired enhancement alongside or often intertwined with a myriad of other model features. Even if under open source access inclusion of the desired extension into another model is allowed, it is far from a simple copy-and-paste exercise. To take over the software codes which declare the equations and variables, read the related data and parameter, perform the benchmarking, set starting values and potentially bounds for endogenous variables, one needs to analyse most probably the complete model code as related statements are likely scattered, typically over multiple files. Integrating the desired extension into another model will at best require renames and other adjustments due to non-harmonized name-spacing, code structuring and other model-specific features. At worst it may involve disentangling the desired extension from other model features resulting in a full rewrite of the code hampering comparison to the original.
To improve here, BATMODEL adapts established practises of generic software engineering to the specifics of economic modelling. Accordingly, the deployment of modules in BATMODEL is based on clear documentation and coding guidelines, available for GAMS and GEMPACK (the two software packages used for partial equilibrium and CGE models). The documentation guidelines stipulate, for instance, that the methodology must be presented in mathematical notation, and define standards to document interfaces with the rest of the model. This means that parameter and data requirements as well as driving variables (inputs) as well as updated variables (outputs) are clearly defined, specifying their units. Equally, code for

6
benchmarking must be made available, also comprising tests for data and parameters. Specific coding guidelines shall guarantee that the software can be easily understood and maintained by a third party, for instance, due to clear name spacing, structuring and in-line documentation.
These guidelines are not developed from scratch but draw on existing documentations of economic models and their best practices. They are revised and extended in the cross-model cooperation allowed by the BATMODEL Project. Supported by a dedicated topic or content focussed work package, a model enhancement is developed by at least one team as the first version of a module. Through a dedicated work package on module testing and deployment, each new module will be linked to at least one additional model. Generally, each module will be realized both in GEMPACK and GAMS to assure the broadest possible access for the wider modelling community. A challenge to deploying modules is establishing an interface with the codes of already existing models. Furthermore, integration testing is necessary to ensure proper functioning as new modules may interact with existing code of a different model in unexpected ways which could be cause for revisions of the original model.
The BATMODEL approaches shall stimulate a wide discussion in the community of economic modellers on the pros and cons of concerted action to develop shared modular code, which could ultimately lead to libraries from which models could be configured. To develop institutional solution for such enhanced cooperation is challenging, but there are large benefits to be reaped in terms of cost savings and higher transparency.
References
Britz, W., & Witze, P. (2014). CAPRI model documentation, version 2014. University Bonn, https://www.capri-model.org/docs/CAPRI_documentation.pdf
Britz, W., Ciaian, P., Gocht, A., Kanellopoulos, A., Kremmydas, D., Müller, M., Petsakos, A., Reidsma, P. (2021): A design for a generic and modular bio-economic farm model, Agricultural Systems 191(June 2021): 103133
Britz, W., van der Mensbrugghe, D. . (2018): CGEBox: A Flexible, Modular and Extendable Framework for CGE Analysis in GAMS, Journal of Global Economic Analysis 3(2): 106-176
Woltjer, G., Kuiper, M., 2014. The MAGNET Model: Module Description. LEI-Wageningen UR.http://www.wageningenur.nl/nl/Publicatie-details.htm?publicationId=publication-way-343535383037
The Need for a Systematic and Iterated Comparison of Different Policy Models
Mike Bithell, Department of Geography, Cambridge University Edmund Chattoe-Brown, School of Media, Communication and Sociology, University of Leicester Bruce Edmonds, Centre for Policy Modelling, Manchester Metropolitan University
Why Single Models are not Reliable for Informing Policy
In the early 1990s, a moratorium was put on all cod fishing off Newfoundland and Labrador. The cod were declared commercially extinct and around 30,000 people lost their jobs as a result. The Harris Commission’s report into the causes of this collapse said that modellers “…failed to recognize the statistical inadequacies in their bulk biomass model…” and that they had concerns that “…weaknesses in scientific management and the peer review process permitted this to happen.” The scientists and policymakers had become committed to a particular description of reality. As a result, their model was inadequate and this was not picked up. In this case, the policy modelling had contributed to the disaster due to the narrowness of their modelling – it had made things worse (see account in 0).
Early in 2020, Neil Fergusson and his team used a complex model to simulate the spread of COVID19 under a range of scenarios, forecasting 100,000s of deaths in the UK if policies to reduce its spread were not enacted. This model was not the sole basis of the subsequent policy change in the UK, since this was consistent with other mathematical models as well as the unfolding events in Italy. The model was hurriedly adapted from a model developed 13+ years previously concerning influenza. The model was criticized because many people did not like the policy conclusions drawn, but more pertinently due to the fact that the code, “thousands of lines of undocumented C”, was not publicly available, and so had not been critiqued and checked by other researchers (see account in 0).
It is easy for modellers to (a) see the world through their model, developing a myopic view of the world (the effect of “Kuhnian Spectacles”) and (b) to not fully understand their own models 0.
Learning from Examples of Model Intercomparison
Thus, the question arises about the reliability of such models for policy purposes. How can policy actors rely on models that they cannot personally understand? Model comparison projects (MIP), such as those in the climate community give some clues (for an account of these see 0). MIPs have many advantages, including: (a) they allow

7
modellers to build on the past rather than re-inventing the wheel, (b) encourages the independent reproduction and analysis of existing models resulting in their being better understood, (c) help to determine which kinds of models arebetter for which aspects of problems or whatkinds of situation they are applicable in, (d) acontinuously updated and refined base of modelshelps build credibility and (e) form a more credibleand robust basis from which to inform policy.Establishing an agreed framework for the exerciseand then running MIPs is not easy, and requiressustained effort but can be grown over time,helping to ensure consistency even if individualmodels come and go. Other domains may not beas ready as that of climate change but MIPs canhelp a field mature and to provide a more usefuland understood tool to inform policy.
Developing Policy Model Intercomparison as Standard Policy Modelling Practice
If there had been model comparison exercises concerning the North Atlantic fisheries – systematically comparing a variety of models – the accepted assumptions might have been questioned more and its collapse prevented. If Neil Fergusson had made his code available in 2006 when he published his paper, then the code might have been critiqued and improved by a community of interested researchers over many years. This would have improved the code, making such models more defensible. Such a community of practice might have resulted in reliable models that were: ready for a new pandemic, adapted to be relevant to the policy issues and thus able to help the UK government to react more quickly to events (thus preventing many deaths). As a community of policy modellers, we need to get our act together on important issues – to get out of our bunkers where we are dealing with only single models – to systematically and iteratively compare models, in order to provide a more reliable basis for policy. Reproducing models is the first, most necessary step 0, but for robustness, reliability and depth one needs to compare a diversity of models about the same phenomena in a structured manner.
References
[1] Aodha, L. & Edmonds, B. Some pitfalls to beware whenapplying models to issues of policy relevance. In Edmonds, B. &Meyer, R. (eds.) Simulating Social Complexity - a handbook, 2ndedition. Springer, 801-822 (2017). https://doi.org/10.1007/978-3-319-66948-9_29
[2] Bithell, M. & Edmonds, B. The Systematic Comparison ofAgent-Based Policy Models - It's time we got our act together!Review of Artificial Societies and Social Simulation, 11th May2021 (2020). https://rofasss.org/2021/05/11/SystComp
[3] Chattoe-Brown, & al. Reproduction as a Means of EvaluatingPolicy Models: A Case Study of a COVID-19 Simulation.medRxiv 01.29.21250743 (2021);https://doi.org/10.1101/2021.01.29.21250743
[4] Edmonds, B. & Hales, D. Replication, Replication andReplication - Some Hard Lessons from Model Alignment.Journal of Artificial Societies and Social Simulation 6(4):11.(2003) http://jasss.soc.surrey.ac.uk/6/4/11.html
[5] Squazzoni, F. & al. 'Computational Models That MatterDuring a Global Pandemic Outbreak: A Call to Action' Journal ofArtificial Societies and Social Simulation 23(2):10 (2020)http://jasss.soc.surrey.ac.uk/23/2/10.html.
Algorithmic bias in machine learning models: detection and avoidance in policy applications
María Vega Gonzalo, Panayotis Christidis, Joint Research Centre, European Commission
Introduction
The increasing use of machine learning models as support tools for modelling human behaviour and designing efficient policies has raised significant concerns as regards potentially unfair model-based decisions that rely on gender, age, ethnicity, nationality, income, education or other socio-economic and demographic data.
Algorithmic bias occurs when models commit systematic errors in their predictions due to the biased data they were trained on. The unfairness in the data is likely to reflect already existing discriminatory beliefs in society, by underrepresenting or misrepresenting specific socio–economic groups. Therefore, being able to detect and mitigate this problem is key to ensure that machine learning models - and all type of models - provide reliable evidence that can be used for policy making.
In the particular case of models for policy making, the presence of algorithmic bias leads to systematic errors on the predicted choice or assigned group of each individual, or the misinterpretation of the drivers of an individual’s choices. These errors in turn might lead to the deployment of inefficient or even discriminatory policies. The aim of this work is to assess the existence of such systematics errors, to gain understanding on which features of the model are liable and to implement the appropriate changes to mitigate the bias.
Data and methods
We demonstrate the impact of algorithmic bias and explore the best practices to address it using three different representative supervised learning models of varying levels of complexity.
The first model is COMPAS, a well-known example of a biased classifier, which has been shown to treat African Americans unfairly, assigning them a higher probability of recidivism than other demographic groups based solely on the ethnicity (Jeff Larson et al., 2016). The second example is a
8
stated-preference model that predicts mobility choices using an EU-wide survey. Socio-economic variables have a high impact on this model’s accuracy. The third is a revealed choice model using data from an online trip planner in Beijing, China. It is an example of modern, real time algorithms that are based on Big Data. Even though the variables containing personal data have been masked and normalized (i.e. the correspondence of each variable to a specific group or user characteristic is not visible), the model is still subject to bias.
We performed a series of tests on the three models. We calculated a set of parity indicators in order to compare the accuracy of the model for all the socio–economic groups considered in each model. These indicators allow to evaluate if the ratio of erroneous predictions is the same for all groups or if - on the contrary - it disfavours individuals with specific features. The main tests concern the parity in the results (false positive, false negative, accuracy, specificity) and the marginal contribution of each group in the model results. The decision on which specific tests should be used to analyse the impact of the bias in each of the models has been made on the basis of the specific nature of the model and the protected group that is affected by the bias (Hardt et al., 2016).
The main source of unfairness observed is the difference in the base rates and the correlation between the outcome variable and the protected features. The proposed solutions to mitigate the resulting bias are mainly focused on the data pre–processing phase, comprising a checklist of solutions that include changes in data sampling, feature engineering or transformations of the statistical distribution of the outcome variable. The pre–processing treatments are complemented with an algorithm selection, aiming to find a combination of mitigation bias measures that provides an optimal trade-off between fairness and accuracy (Miron et al., 2021) (Rodriguez et al., 2019).
Main findings and recommendations
Using socio-economic and demographic variables in advanced models for policy support is probably inevitable. Detailed data on user characteristics and choices are crucial for the quality of a model and provide value for policy analysis. It is nevertheless important that model developers and users ensure that the use of sensitive data does not lead to conclusions and decisions based on the misuse of this information.
The methodology we propose can detect the existence of bias in a model’s algorithm, evaluate its impact on the model accuracy and implement
measures to mitigate its impact. This approach improves model transparency and provides an objective assessment of model fairness. It has been found that even when the specific groups that are being disfavoured are not characterized by a discriminatory feature (e.g. students), analysing the accuracy of the model for different groups provides information on how suitable is the model for the non–standard individual.
Consequently, the extent to which this lack of accuracy for specific groups may ultimately prevent researchers and policy makers from deploying policies that maximize common good has been assessed considering the specific purpose of the model.
Additionally, uncovering hidden biases and putting them in relation with specific characteristics of the training data, allows to understand how the current data acquisition methodologies fail to gather a fully reliable picture of the groups or decisions are being modelled. These findings contribute to progressively develop new data gathering procedures to minimize the collection of biased data or build models that account for it.
References
Hardt, M., Price, E., & Srebro, N. (2016). Equality of Opportunity in Supervised Learning. Proceedings of the 30th International Conference on Neural Information Processing Systems, 3323-3331.
Jeff Larson, Mattu, S., Kirchner, L., & Angwin, J. (2016, mayo 23). How We Analyzed the COMPAS Recidivism Algorithm. ProPublica. https://www.propublica.org/article/how-we-analyzed-the-compas-recidivismalgorithm
Miron, M., Tolan, S., Gómez, E., & Castillo, C. (2021). Evaluating causes bias in juvenile criminal recidivism. Artificial Intelligence and Law, 29(2), 111-147. https://doi.org/10.1007/s10506-020-09268-y
Rodriguez, L., Salimi, B., Ping, H., Stoyanovich, J., & Howe, B. (2019). MobilityMirror: Bias-Adjusted Transportation Datasets. In J. Oliveira, C. M. Farias, E. Pacitti, & G. Fortino (Eds.), Big Social Data andUrban Computing (pp. 18-39). SpringerInternational Publishing.

9
Policy analysis of the transformation of the EU’s agricultural sector: A review of model capabilities and an outlook for future research
Arndt Feuerbacher, Christine Wieck, University of Hohenheim
Calls to transform the agricultural sector of the European Union (EU) have been rising amid the looming biodiversity and climate change crisis (Pe'er et al., 2020; Pe'er et al., 2019). The longlasting trilogue negotiations showed the difficulty of finding common ground for a reformed and greener Common Agricultural Policy (CAP) which incorporates adequate incentives for the provision of non-monetized ecosystem services by farmers. Yet, the vision laid out by the EU’s Green Deal and the Farm-to-Fork and Biodiversity Strategy are clear and much more ambitious (European Commission, 2020): the EU’s future agricultural production systems EU have to become more climate and biodiversity friendly. Interestingly though, many of the proposed changes such as the strong reduction in agrochemical use, reduction in antimicrobials, increased sustainability in the food processing industry, or the expansion of organic agriculture, are blind spots when it comes to the existing methods of impact assessment (Cañas, 2020). The only efforts so far to assess the impacts of the Farm-to-Fork strategy has been undertaken by Beckman et al. (2020), who however had to rely on a range of simplified assumptions (Zimmer, 2020).
Ex-ante impact assessments of policies are commonly conducted applying deductive simulation models which greatly vary with reference to spatial scale, sectoral coverage and the depiction of human behavior and bio-physical process. These simulation models are usually quantitative mathematical models, which have become instrumental tools to understand complex systems such as socio-ecological systems (Brown and Rounsevell, 2021; Drechsler, 2020). This is also why their use is widespread to analyze the impacts of agricultural policies (Reidsma et al., 2018; Renwick et al., 2013).
The objective of this study is to review how the existing model capabilities of the most common simulation models used for agricultural policy analysis match the policy agenda of the EU’s Green Deal with specific reference to the Farm-to-Fork strategy. We focus on three types of simulation models: a) single farm or multi agent-based models like FARMIS (Offermann et al., 2009) or AgriPoliS (Happe et al., 2006) simulating agricultural supply changes for the whole EU or (parts of) EU member states; b) partial equilibrium models like CAPRI (Britz and Witzke, 2014) and ESIM (Choi et al., 2019) covering both the supply
and demand side of the EU’s agricultural sector; and c) economy-wide models with either EU or global coverage such as GTAP (Hertel, 1997) or MAGNET (Burrell et al., 2012).
Using the Scopus database, we analyse the existing literature of model applications published between 2000 and 2020. The review focuses on the following three questions: 1) What has been the dominant focus of past model applications?; 2) To what extent do the model capabilities cover the modelling requirements of future policy changes as stipulated by the EU green deal? and 3) Based on the findings of 1) and 2) how can future research and model development address the existing knowledge gaps based on the comparative advantages of the analysed models.
References
Beckman, J., Ivanic, M., Jelliffe, L.J., Baquedano, F.G., Scott, S.G., 2020. Economic and food security impacts of agricultural input reduction under the European Union Green Deal’s Farm to Fork and Biodiversity Strategies. Economic Brief 30, U.S. Department of Agriculture, Economic Research Service. https://www.ers.usda.gov/webdocs/publications/99741/eb-30.pdf?v=863.3 (accessed 8 April 2021).
Britz, W., Witzke, P., 2014. CAPRI model documentation 2014, Bonn, Germany. https://www.capri-model.org/docs/capri_documentation.pdf (accessed 5 February 2020).
Brown, C., Rounsevell, M., 2021. How can social–ecological system models simulate the emergence of social–ecological crises? People and Nature 3, 88–103. https://doi.org/10.1002/pan3.10167.
Burrell, A., Hubertus Gay, S., Kavallari, A., 2012. The compatibility of EU biofuel policies with global sustainability and the WTO. The World Economy 35, 784–798. https://doi.org/10.1111/j.1467-9701.2011.01430.x.
Cañas, J., 2020. Parliamentary questions: Impact assessment of the farm-to-fork strategy in the single market. https://www.europarl.europa.eu/doceo/document/E-9-2020-006796_EN.pdf (accessed 14 April 2021).
Choi, H.S., Grethe, H., Entenmann, S.K., Wiesmeth, M., Blesl, M., Wagner, M., 2019. Potential trade-offs of employing perennial biomass crops for the bioeconomy in the EU by 2050: Impacts on agricultural markets in the EU and the world. GCB Bioenergy 11, 483–504. https://doi.org/10.1111/gcbb.12596.
Drechsler, M., 2020. Model-based integration of ecology and socio-economics for the management of biodiversity and ecosystem services: State of the art, diversity and current trends. Environmental Modelling & Software 134, 104892. https://doi.org/10.1016/j.envsoft.2020.104892.
European Commission, 2020. A Farm to Fork Strategy for a fair, healthy and environmentally-friendly food system. European Commission, Brussels, Belgium. https://eur-lex.europa.eu/resource.html?uri=cellar:ea0f9f73-9ab2-11ea-9d2d-01aa75ed71a1.0001.02/DOC_1&format=PDF.
Happe, K., Kellermann, K., Balmann, A., 2006. Agent-based analysis of agricultural policies: an illustration of the agricultural policy simulator AgriPoliS, its adaptation and behavior. Ecology and Society 11. https://doi.org/10.5751/ES-01741-110149.
Hertel, T.W., 1997. Global trade analysis: modeling and applications. Cambridge Univ. Press.
Offermann, F., Nieberg, H., Zander, K., 2009. Dependency of organic farms on direct payments in selected EU member

10
states: Today and tomorrow. Food Policy 34, 273–279. https://doi.org/10.1016/j.foodpol.2009.03.002.
Pe'er, G., Bonn, A., Bruelheide, H., Dieker, P., Eisenhauer, N., Feindt, P.H., Hagedorn, G., Hansjürgens, B., Herzon, I., Lomba, Â., Marquard, E., Moreira, F., Nitsch, H., Oppermann, R., Perino, A., Röder, N., Schleyer, C., Schindler, S., Wolf, C., Zinngrebe, Y., Lakner, S., 2020. Action needed for the EU Common Agricultural Policy to address sustainability challenges. People and nature (Hoboken, N.J.) 2, 305–316. https://doi.org/10.1002/pan3.10080.
Pe'er, G., Zinngrebe, Y., Moreira, F., Sirami, C., Schindler, S., Müller, R., Bontzorlos, V., Clough, D., Bezák, P., Bonn, A., Hansjürgens, B., Lomba, A., Möckel, S., Passoni, G., Schleyer, C., Schmidt, J., Lakner, S., 2019. A greener path for the EU Common Agricultural Policy. Science (New York, N.Y.) 365, 449–451. https://doi.org/10.1126/science.aax3146.
Reidsma, P., Janssen, S., Jansen, J., van Ittersum, M.K., 2018. On the development and use of farm models for policy impact assessment in the European Union – A review. Agricultural Systems 159, 111–125. https://doi.org/10.1016/j.agsy.2017.10.012.
Renwick, A., Jansson, T., Verburg, P.H., Revoredo-Giha, C., Britz, W., Gocht, A., McCracken, D., 2013. Policy reform and agricultural land abandonment in the EU. Land Use Policy 30, 446–457. https://doi.org/10.1016/j.landusepol.2012.04.005.
Zimmer, Y., 2020. EU Farm to Fork Strategy: How reasonable is the turmoil predicted by USDA? http://capreform.eu/eu-farm-to-fork-strategy-how-reasonable-is-the-turmoil-predicted-by-usda/
Advanced climate predictions in the polar regions: Key results from the APPLICATE project
Thomas Jung, Alfred Wegener Institute Helmholtz Center for Polar and Marine Research and APPLICATE Consortium
The weather and climate of the Arctic have been changing rapidly, with profound transformations projected to continue. These changes provide opportunities, such as new, shorter shipping lanes between Europe and East Asia; at the same time, however they expose society to major risks, such as environmental hazards associated with increased human activities in the Arctic. Climate change also poses major challenges for indigenous communities who are facing changes in predictive weather capacity based on traditional knowledge. Furthermore, anthropogenic climate change is amplified in the Arctic with possible impact on the weather and climate in mid-latitudes, including potential changes in extreme events in Europe.
Between November 2016 and April 2021, the EU-funded project APPLICATE (https://applicate-h2020.eu/) has developed enhanced predictive capacity for weather and climate in the Arctic and beyond and made important steps towards determining the influence of Arctic climate change on Northern Hemisphere mid-latitudes. APPLICATE has brought together experts from academia,
research institutions and operational forecasting centres working on several fronts helping to improve stakeholders’ capacity to adapt to climate change through a comprehensive analysis of the latest generation of climate models (CMIP6), which will contribute to the sixth IPCC assessment report (AR6). APPLICATE also improved the trustworthiness of climate change projections through an improved representation of important Arctic processes in next generation climate models. Furthermore, APPLICATE has contributed to narrowing the uncertainty of climate change projections by exploiting the concept of emergent constraints, leading to a greater adaptation capacity. Finally, APPLICATE has also provided evidence-based recommendations for the future of the Arctic observing system to maximize predictive skill.
There is very large uncertainty in current climate projections of how extreme weather events (such as storms, floods and droughts) will change in the future, and the rate of Arctic sea ice loss. Increasing the fidelity of weather and climate models is essential to increasing confidence in their forecasts and projections. Results have identified ways forward in terms of constraining climate projections (for example, emergent constraints on Arctic Amplification have been identified). The evaluation of weather and climate models has also identified areas that will require sustained investment (such as Arctic ocean circulation biases and weather forecasts of land surface temperature in the High Arctic) to enable further improvements.
Developments applied to CMIP6 coupled climate models have highlighted some promising avenues for the future development of climate models as well as some areas in which to concentrate future development. For example, the improved connection of the sea ice with the ocean and atmosphere can have implications for the wider circulation of the ocean and atmosphere. The model developments made in APPLICATE are in the process of being pulled into major model codes used in Europe and more widely around the world.
Changes in mid-latitude atmosphere and ocean circulation affect many sectors of society including water management, agriculture, energy supply and demand, insurance, transport, health and tourism. APPLICATE results help to understand and quantify future circulation changes which allow having improved climate predictions enabling planners to make informed decisions. Particularly, results show that transient eddy feedback is underestimated in all of the models analysed. Fixing this error could yield improved climate predictions. We also show potentially important changes in ocean circulation and

11
provide guidance on the design of future experiments.
Important decisions regarding a range of activities in the Arctic (navigation, observations) can be made objectively thanks to the use of numerical model outputs. Further results from numerical experiments suggest that the uptake of Arctic observations can improve predictions from a few days to seasons ahead both in the Arctic and mid-latitudes. The quantification of a correct initialization of the impact of sea ice thickness on the short/medium term predictability will inform the modelling community on the relevance of the assimilation of sea ice thickness data. Activities in APPLICATE have been instrumental to get the numerical weather prediction (NWP) and climate prediction communities closer together and to further demonstrate the need for parallel and synergistic investment in observation and coupled prediction systems.
The use of physically-based metrics to subselect large ensembles of seasonal and decadal forecasts has shown promising potential to improve the predictive capacity over the continental areas, for which so far the predictive skill is very limited in particular at decadal timescales. This is a step forwards towards the development of better climate services over regions of high societal relevance and, in combination with the significant advances in NWP can eventually enable better informed strategic planning and decision making from daily to decadal timescales. All prototype NWP systems in APPLICATE, testing a different developments, have shown important improvements expected to
strengthen the predictive capacity of Arctic European operational forecasts.
APPLICATE has developed two policy briefs, which can be directly inform policy makers about the latest project findings and their impact on research and society. Topics tackled include the optimal location of sea-ice sampling sites to inform Polar Observational Networks and the linkages between Arctic climate change and mid-latitudes. Additionally, four case studies have been developed to raise awareness of climate change in the Arctic and also the links with weather and environmental phenomena occurring in places far from the Arctic, such as droughts and wildfires.
APPLICATE has established strong relations with operational centres, research institutes and stakeholders, and facilitated the promotion of European scientific excellence on an international stage. This can influence the agenda-setting of research institutions through a spillover effect that exposes a higher number of policy-makers to polar research and its importance. The collaboration with external projects has led to very impactful results (e.g. YOPP dataset, PAMIP) that will greatly affect the scientific and operational community and contribute to the creation of a wide knowledge base. The interaction with other European and international activities (e.g. interaction with the EU-Polar Cluster, including projects doing research in both poles) also set an important base for future collaborations and expand the reach of APPLICATE results to a wider audience while increasing awareness towards Arctic–mid-latitudes linkages and polar prediction.
Towards an integrated perspective: improving the links between the energy system and economy-wide model
Kimon Keramidas, Antonio Soria Ramirez, Jacques Despres, Burkhard Schade, Ana Diaz Vazquez, Stephane Tchung-Ming, Andreas Schmitz, Krzysztof Wojtowicz, Toon Vandyck, Rafael Garaffa, Andrea Diaz Rincon, Matthias Weitzel, Florian Fosse, Peter Russ, Joint Research Centre, European Commission.
The integration of economic and energy models is not new (EMF, 1977) and has been vastly discussed in the scientific literature – Bauer et al. (2008); Riekkola et al. (2013); and Andersen et al. (2019) to cite a few studies – often requiring good judgement and expertise on what information to link and how to link it to achieve consistency across models.

12
This paper builds on the most updated version of the modelling suite used in the European Commission's energy and climate policy assessments. The modelling suite includes the impacts on the energy system, transport, agriculture, forestry and land use; and macro-economy with multiple sectors, employment and
social welfare. This paper focuses on the links between the economy and the energy system that are represented in the upper boxes of Figure 1, with particular attention to the integration between the JRC-GEM-E3 and the POLES-JRC models.
Figure 1. Modelling toolbox (model names at the bottom of each box) Source: Weitzel et al. (2019)
The JRC-GEM-E3 is a multi-regional, multi-sectoral, recursive dynamic Computable General Equilibrium (CGE) model with a consistent macro-economic framework that is extensively used as a tool of policy analysis and impact assessment. The model is particularly valuable in capturing the effects of the transformation of the energy system and of climate-related policies over the macroeconomic aggregates. The
JRC-GEM-E3 is also a valuable tool in providing the distributional aspects of long-term structural adjustments in the economy (Capros et al., 2013).
The POLES-JRC model is a global partial equilibrium simulation model of the energy sector,
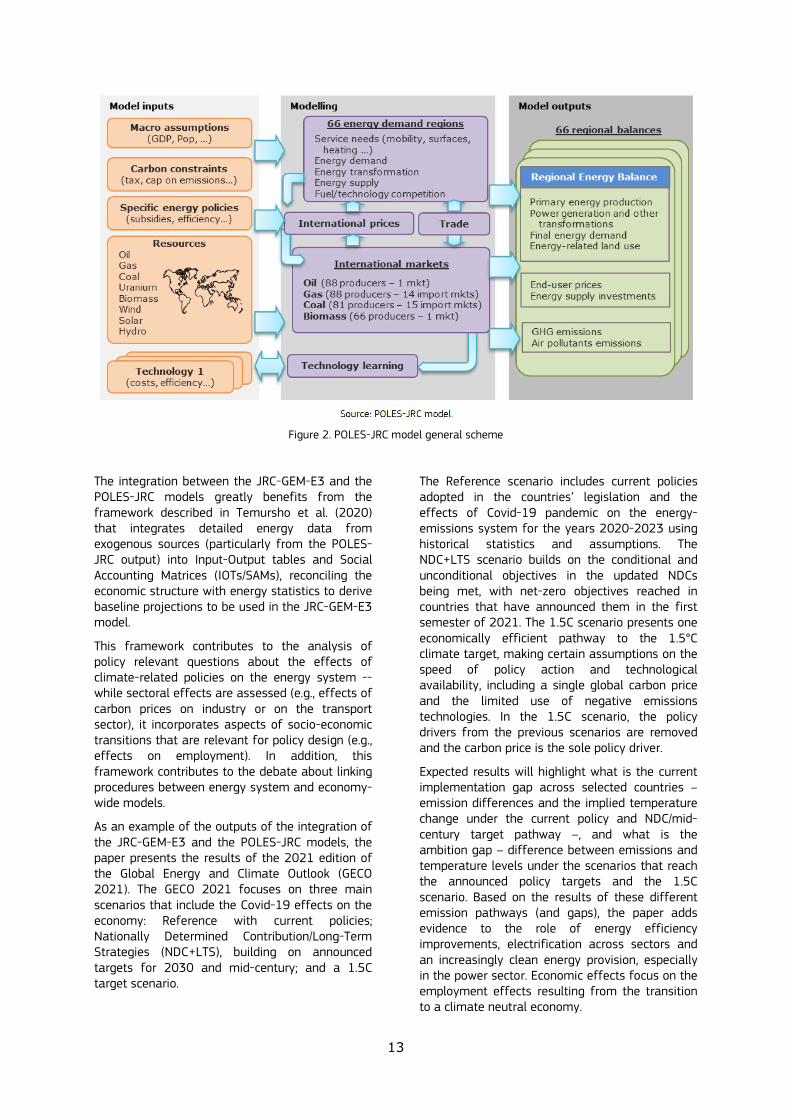
covering a wide range of activities from upstream production to final user demand, in a yearly recursive framework. Endogenous international energy prices and lagged adjustments of supply and demand allow for describing full development pathways by world region over 2070. The model provides full energy and emission balances for 66 countries and regions worldwide, including an explicit representation of OECD and G20 countries, 14 fuel supply branches and 15 final demand sectors. Figure 2 shows POLES-JRC general scheme, while Després, Keramidas, Schmitz, Kitous, & Schade (2018) provide a comprehensive description of the model.
13
Figure 2. POLES-JRC model general scheme
The integration between the JRC-GEM-E3 and the POLES-JRC models greatly benefits from the framework described in Temursho et al. (2020) that integrates detailed energy data from exogenous sources (particularly from the POLES-JRC output) into Input-Output tables and Social Accounting Matrices (IOTs/SAMs), reconciling the economic structure with energy statistics to derive baseline projections to be used in the JRC-GEM-E3 model.
This framework contributes to the analysis of policy relevant questions about the effects of climate-related policies on the energy system -- while sectoral effects are assessed (e.g., effects of carbon prices on industry or on the transport sector), it incorporates aspects of socio-economic transitions that are relevant for policy design (e.g., effects on employment). In addition, this framework contributes to the debate about linking procedures between energy system and economy-wide models.
As an example of the outputs of the integration of the JRC-GEM-E3 and the POLES-JRC models, the paper presents the results of the 2021 edition of the Global Energy and Climate Outlook (GECO 2021). The GECO 2021 focuses on three main scenarios that include the Covid-19 effects on the economy: Reference with current policies; Nationally Determined Contribution/Long-Term Strategies (NDC+LTS), building on announced targets for 2030 and mid-century; and a 1.5C target scenario.
The Reference scenario includes current policies adopted in the countries’ legislation and the effects of Covid-19 pandemic on the energy-emissions system for the years 2020-2023 using historical statistics and assumptions. The NDC+LTS scenario builds on the conditional and unconditional objectives in the updated NDCs being met, with net-zero objectives reached in countries that have announced them in the first semester of 2021. The 1.5C scenario presents one economically efficient pathway to the 1.5°C climate target, making certain assumptions on the speed of policy action and technological availability, including a single global carbon price and the limited use of negative emissions technologies. In the 1.5C scenario, the policy drivers from the previous scenarios are removed and the carbon price is the sole policy driver.
Expected results will highlight what is the current implementation gap across selected countries – emission differences and the implied temperature change under the current policy and NDC/mid-century target pathway –, and what is the ambition gap – difference between emissions and temperature levels under the scenarios that reach the announced policy targets and the 1.5C scenario. Based on the results of these different emission pathways (and gaps), the paper adds evidence to the role of energy efficiency improvements, electrification across sectors and an increasingly clean energy provision, especially in the power sector. Economic effects focus on the employment effects resulting from the transition to a climate neutral economy.
14
Finally, the paper discusses key policies and sector strategies for countries/regions, focusing on the main emitters. The assessment covers the effects of climate policies at the national scale and their contribution to the global stocktake, including the immediate effects of the Covid-19 pandemic and projected changes brought about by a set of behaviour changes and policy measures focused on low-carbon recovery.
References
Keramidas, K., Tchung-Ming, S., Diaz-Vazquez, A. R., Weitzel, M., Vandyck, T., Després, J., Soria-Ramirez, A. (2018). Global Energy and Climate Outlook 2018: Sectoral mitigation options towards a low-emissions economy – Global context to the EU strategy for long-term greenhouse gas emissions reduction. Tech. rep., Publications Office of the European Union, Luxembourg. doi:10.2760/67475
European Commission. Communication from the Commission to the European Parliament, the Council, the European Economic and Social Committee and the Committee of the Regions. Stepping up Europe’s 2030 climate ambition -- The 2030 Climate target plan. Investing in a climate-neutral future for the benefit of our people. COM(2020) 562 final. Brussels, 17.9.2020
Weitzel, M., Vandyck, T., Keramidas, K. et al. Model-based assessments for long-term climate strategies. Nature Climate
Change, v.9, 345–347 (2019). https://doi.org/10.1038/s41558-019-0453-5
Capros, Pantelis, Denise Van Regemorter, Leonidas Paroussos, P. Karkatsoulis, C. Fragkiadakis, Stella Tsani, I. Charalampidis,Tamas Revesz, M. Perry, and J. Abrell. GEM-E3 modeldocumentation. JRC Scientific and Policy Reports 26034(2013).
A. K. Riekkola, C. Berg, E. O. Ahlgren, and P. Sderholm, Challenges in Soft-Linking: The Case of EMEC and TIMES-Sweden, Working Papers 133, National Institute of Economic Research, Dec. 2013.
N. Bauer, O. Edenhofer, and S. Kypreos. Linking energy systemand macroeconomic growth models," ComputationalManagement Science, vol. 5, no. 1-2, pp. 95-117, 2008.
K. S. Andersen, L. B. Termansen, M. Gargiulo, and B. P. O. Gallachoirc. Bridging the gap using energy services: Demonstrating a novel framework for soft linking top-down and bottom-up models, Energy, vol. 169, pp. 277-293, 2019.
Energy Modelling Forum. Energy and the economy. Techical Report. Energy Modeling Forum, September 1977.
Temursho, Umed, Manuel Alejandro Cardenete, Krzysztof Wojtowicz, L. Rey Los Santos, Matthias Weitzel, Toon Vandyck, and Bert Saveyn. Projecting input-output tables for model baselines. No. JRC120513. Joint Research Centre (Seville site), 2020.

2
.
Session 2
Transparency of models
and their use
22 November
13:30 – 14:50
16
All for one and one for all – Considerations about holistic challenges of sustainability analysis
Robert M’barek, Kirsten Boysen-Urban, Joint Research Centre, European Commission George Philippidis, Aragonese Foundation for Research & Development (ARAID) Hans van Meijl, Wageningen University and Research
Challenges for model-based sustainability analysis
Evidence-based policy-making increasingly requires scientific support with modelling tools, even more so in the context of complex and interlinked challenges, such as the Sustainable Development Goals. Europe’s new growth strategy, the Green Deal, is an integral part of the European Commission’s strategy to implement sustainability objectives, including the SDGs. It acknowledges also that ‘drivers of climate change and biodiversity loss are global and are not limited by national borders’. With a view to the global food system, the Farm to Fork strategy highlights the EU’s objective to reduce its contribution to global deforestation and forest degradation.
There are different approaches to address sustainability from stand-alone models covering parts or the whole economy, to model frameworks combining different tools. While there is no ‘one-size-fits-all’ model, and sustainability issues deserve appropriate sectoral details for individual policies, a systemic approach can provide an initial broad analysis, pinpointing the main impacts, winners and losers, covering a wide range of sustainability indicators. In this contribution we discuss an ex-ante global simulation model which provides insights into the synergies and trade-offs in scenarios where several policy instruments and other drivers are operating simultaneously, while representing a broad of sustainability indicators.
Model development for sustainability
The MAGNET model is a neoclassical multi-region, multi-commodity computable general equilibrium (CGE) economic simulation model and has an established pedigree in a number of high-profile forward-looking studies for international and intergovernmental organisations. Since 2017, sustainability indicators are successively included through the development of MAGNET SDG Insights Module, embedding more than 60 official and supporting indicators from several external databases, covering 12 of the 17 SDGs for all countries and regions. Lately, the MAGNET model has been selected by UN DESA (2020) as an outstanding SDG Good Practice. In 2021 footprints for land, water, energy and emissions have been included, improving the understanding of transboundary environmental impacts, for
instance through food consumption (Philippidis et al. 2021). The model is listed as well in MIDAS, the EC Modelling Inventory and Knowledge Management System, as one of the 35 models used for impact assessments since 2017.
In the following section, examples of latest applications are briefly described.
Recent examples of model use for policy analysis
Key objectives of the Green Deal are the implementation of the Paris Agreement and preserving Biodiversity while maintaining economic stability and reducing inequality. The impacts of reaching the 1.5 degree objective on a broad array of SDG indicators have been analysed in M’barek et al. (2019) and Philippidis et al. (2020).
The sustainability implications arising from the adoption of recommended daily nutrition requirements inspired by the ‘Lancet’ reference diet has been examined in Philippidis et al. (2021). To measure sustainability, changes in ‘virtual’ requirements and associated tier footprints for irrigation (blue) water, agricultural land and greenhouse gas emissions (GHG) are calculated.
An example for a multi-model effort is described in the forthcoming Nature Scientific Reports (Follador et al., 2021), where impacts of the EU bioeconomy on third countries with the potential environmental impacts in Brazil of EU biofuel demand to 2030 are showcased by combining MAGNET with the land use model of Brazil OTIMIZAGRO.
Concluding remarks
Within a single coherent closed global system, the presented economy-wide global simulation model reconciles multiple market drivers with finite resource, technology and sustainability conditions. In this way, the implications of different pathways of human development, in terms of price effects and resource reallocations, are fully internalised within the model. Thus, this approach is designed to identify potential synergetic (‘win-win’) outcomes, which are needed more than ever to keep up with the challenge of implementing the UN 2030 Agenda. Currently different avenues of addressing sustainability are followed.
As stand-alone applications (“one for all”), the focus is now geared towards EU Member States and the implementation of policies and strategies related to the food system. This includes the assessment of food waste targets in the Farm to Fork strategy, a balanced diets, as well as the implementation of the recently agreed CAP reform. A specific challenge for MAGNET and other

17
modelling tools are the social indicators, also on a further disaggregated level.
In combination with other modelling tools (“all for one”), MAGNET is currently applied in sustainability studies on soil erosion, and bioeconomy scenarios.
References (by year)
M’barek, R., Philippidis, G., Ronzon, T. (2019), ‘Alternative Global Transition Pathways to 2050: Prospects for the Bioeconomy - An application of the MAGNET model with SDG insights’, EUR 29862, Luxembourg: Publications Office of the European Union, 2019, ISBN 978-92-76-11335-5, DOI:10.2760/594847, JRC118064.
Philippidis, G., Shutes, L., M’barek, R., Ronzon, T., Tabeau, A., Van Meijl, H. (2020), ‘Snakes and ladders: World development pathways’ synergies and trade-offs through the lens of the Sustainable Development Goals’, Journal of Cleaner Production, Volume 267. https://doi.org/10.1016/j.jclepro.2020.122147
M’barek, R., Philippidis, G. (2020), Modular Applied GeNeral Equilibrium Tool (MAGNET): Global simulation model for policy coherence modelling with SDG coverage. In: United Nations (2020), SDG Good Practices - A compilation of success stories and lessons learned in SDG implementation; https://sdgs.un.org/sites/default/files/2020-11/SDG%20Good%20Practices%20Publication%202020.pdf
M’barek, R., Philippidis, G., Ronzon, T. (2021), The omnipresence of transboundary effects: A global, systemic, model based approach for analysing the SDGs. In: OECD/EC-JRC (2021), Understanding the Spillovers and Transboundary Impacts of Public Policies: Implementing the 2030 Agenda for More Resilient Societies, OECD Publishing, Paris, https://doi.org/10.1787/862c0db7-en
Philippidis, G., Hugo Ferrer-Pérez, Pilar Gracia-de-Rentería, Robert M'barek, Ana Isabel Sanjuán López (2021), Eating your greens: a global sustainability assessment, Resources, Conservation and Recycling, Volume 168, 2021, 105460, ISSN 0921-3449, https://doi.org/10.1016/j.resconrec.2021.105460
Global land-use impacts of EU’s future bioeconomy: An econometric input-output approach
Johannes Többen (1,2), Saskia Reuschel (1), Lara Ahmann (1), Martin Distelkamp (1), Christian Lutz (1) (1) Gesellschaft für Wirtschaftliche Strukturforschung(GWS) mbH, Osnabrück, Germany(2) Social Metabolism & Impacts, Potsdam Institute forClimate Impact Research, Potsdam, Germany
The EU has ambiguous targets for the development of a bioeconomy that ensures sufficient production of high-quality foods. At the same time, it is expected that the future bioeconomy contributes to the EU’s competitiveness, generates new jobs, reduces dependency on fossil fuels imports and supports climate protection goals though biofuels and bio-based materials. However, the EU is already among the largest importers of agricultural products and it is feared that the expansion of the bioeconomy in Europe
will impact food security and further drive land use change elsewhere in the world.
Here we link the global energy –environment– economy model GINFORS-E (https://web.jrc.ec.europa.eu/policy-model-inventory/#factsheet/model/1123) to an econometric model of biomass production, consumption, and trade for 28 crops and livestock products based on FAO data. The core of the global agriculture model constitutes a structural gravity model of trade in fashion of Anderson & van Wincoop (2003), where bilateral trade flows between a pair of countries are modelled as a function of the exporter’s competitiveness, the importer’s market attractiveness, as well as monetary and non-monetary bilateral trade barriers. For a specific crop, the exporter’s competitiveness depends on its yield per hectare relative to the global average as well as on the input-price index. Market attractiveness is a function of a countries’ demand for crops and livestock products, which is determined in a multistage budgeting process separately for biomass used for food, feed, energy and material.
For the design of the scenarios up to 2050, we combine assumptions from FAO - Agriculture in 2050 regarding the future development of yields, livestock productivity and inputs into agriculture with assumptions regarding the future use of bioenergy and shares of biomass as a feedstock in the chemical industry from IEA - Energy Technology Perspectives. Within this frame we assume three different development pathways for the EU’s bioeconomy. The first assumes that biomass is primarily used for energetic purposes and here specifically for heating and transportation, whereas the second assumes a focus on the use of biomass as feedstock in the chemical industry. The third scenario assumes both types of applications grow strongly. We examine to what extend these distinct developments of the European bioeconomy lead to increased demand and thus put additional pressure on land use change in other world regions.
References Anderson, J. E., and E. van Wincoop. "Gravity with gravitas: A solution to the border puzzle." American economic review 93.1 (2003): 170-192.
18
The International Soil Modelling Consortium – Bridging soil modelling to policy and society
Martine van der Ploeg, Wageningen University, the Netherlands Harry Vereecken, Forschungszentrum Jülich Germany Jan Vanderborght, Forschungszentrum Jülich Germany Michael Young, University of Texas, USA Ana Tarquis, Universidad Politécnica de Madrid, Spain Roland Baatz, Forschungszentrum Jülich, Germany Teamrat Ghezzehei, University of California, Merced, USA
The 2017 Report of the EU Soil Thematic Strategy identified a gap between science, policymaking, and society. The strategy to overcome this gap requires measures for exchange, integration, and dissemination of knowledge on maintaining soil ecosystem functioning. It urges for a concept to promote, integrate, and strengthen soil-related data availability and model capacity so that stakeholders and the broader public can better understand soil and soil processes' status and importance.
Strengthening soil-related data availability and model capacity is particularly relevant; any assessment report on e.g. environmental fate of pesticides or soil erosion is based on model results. This also holds for the greenhouse gas emission protocol every state has to deliver, in which management of soil carbon plays an important role. The quality of these assessments strongly depend on the quality of the input data and our understanding and ability to describe processes and relationships related to soil. Also, as another example, the quality of ground- and surface water is a topic in which models are being used for reporting success or failure of measures to reduce nitrogen loads to groundwater and the design of other mitigation strategies. Subsidies to farmers for certain practices that are meant to safeguard soil functions and services or carbon credits (which farmers may sell on the market) are also based on model simulations. As such, all risk assessment of soil contamination and soil remediation thresholds use simulation models in one way or another. Therefore, a critical aspect of model use for policy formulation is that the model results are trusted by stakeholders. This means that the models should correctly describe or include relevant processes, and use appropriate properties as input, while considering the variability and uncertainty in these inputs. At the same time, stakeholders need to understand that scientific understanding and model development are ongoing and iterative, which bring about innovation in data collection and analyses.
The International Soil Modelling Consortium (ISMC) brings together the experience and expertise of researchers in the field of soil and land surface
modelling, soil ecosystem functions and services, socio-economic methods for resource evaluation, and knowledge and data sharing data with related earth system science disciplines. As such, ISMC could play a role in e.g. setting standards on data quality and key input data; defining scenarios and test conditions; quantifying model uncertainty and the information needed to quantify model uncertainty. ISMC delivers a platform to test models and to test/provide data sources and model input. As such, a relevant question is: How complex should a soil model be for use in policy support? And related: What kind of soil information, data and data quality is necessary at which spatial and temporal resolution to inform models to be used in policy support?
The challenge of assessing soil functions, integrity, and related optimal land management is complex as the scope is broadened to include soil-biosphere and land-atmosphere interactions and feedback (Seneviratne et al. 2010). This challenge emphasizes the need to develop climate-smart agricultural production systems, among other land use options. Management strategies need to be developed that combine real-time monitoring of key soil state variables with forecasting systems for soil-plant systems from field to farm to region scales, and that will enable stakeholders to make timely decisions based on science and rationality. Also, on non-arable lands, challenges emerge related to post-fire restoration, logging, soil loss and erosion, land-use conversion (e.g., urbanization, energy development, and other built environment activities), thawing permafrost, and drying wetlands. A diverse suite of models to simulate soil system functions has emerged in response to this challenge. Several reviews (Arora 2002; Seneviratne et al. 2010; Vereecken et al. 2016; Vereecken et al. 2019) described the progress in and challenges for this interdisciplinary modelling community. On the one hand, these reviews highlight progress made in terms of numerical approaches and data integration, expansion in process complexity and spatial resolution, and dealing with heterogeneity and uncertainty. On the other hand, the reviews point to limitations in model performance, challenges in integration, such as multiple feedback processes that are often not represented in numerical models, and unsolved issues when upscaling processes and predictions with the aim of capturing ecosystem responses and interactions with climatic, environmental, and society, as they evolve.
ISMC’s efforts combine a modeling platform (https://soil-modeling.org/resources-links/model-portal), a data portal (https://soil-modeling.org/resources-links/data-portal), and working groups to advance understanding of the process in and between soils and other

19
components of the terrestrial biosphere. As examples, the Global Soil Carbon Modelling working group is examining carbon storage potential in agricultural soils, and the Soil thermal Properties working group is improving descriptions of thermal soil properties, and related global parameter sets, for land surface models.
The important policy measures in which ISMC can participate, considering the transparency of models and their use for policy support, are the Green Deal and therein the European Climate Law (becoming climate neutral in 2050). The European Climate Law includes “an ambitious 2030 climate target of at least 55% reduction in net emissions of greenhouse gases compared to 1990, with clarity on the contribution of emission reductions and removals,” and “recognition of the need to enhance the EU's carbon sink through a more ambitious LULUCF regulation.” Such LULUCF Regulation prescribe Member States a “no net debit” obligation.
In these policy measures a significant missing puzzle piece is creating information from model results, in a form that decision makers can understand and use. As ISMC is a modelling consortium, and not as focused on broader science communications, ISMC is looking for what policy makers need and the forms in which they need it. Which information is needed to implement policies and monitor their effectiveness? Do they need information on emerging concerns? Are model outcomes prepared in a way they can be shared with communities? ISMC wants to connect the model platforms to the interested parties (policy makers and the public) by synthesizing the output. In this way, the data, models and the information they produce become integral to the decisions being discussed and the policies being implemented.
The Euro Area's pandemic recession: A DSGE-based interpretation
Roberta Cardani (1), Olga Croitorov (1), Massimo Giovannini (1), Philipp Pfeiffer (2), Marco Ratto (1), Lukas Vogel (2) (1) Joint Research Centre, European Commission(2) DG Economic and Financial Affairs, EuropeanCommission
As in other parts of the world, the COVID-19 pandemic has inflicted damage to the European economy that is unprecedented for peacetime. The economic fallout has multiple faces and spans different markets. Supply constraints (lockdowns and social distancing) have led to a contraction of demand in contact-intensive sectors (`forced savings') and in aggregate demand (e.g. Barrero et
al. (2020); Guerrieri et al. (2020)). Private consumption and world trade have collapsed, and liquidity squeezes and heightened uncertainty have caused tensions in financial markets.
Governments have, at the same time, implemented exceptional fiscal stabilisation packages.
This paper offers an economic interpretation of the COVID-19 shock through the lens of a structural macro-economic model, focusing on the euro area (EA).
The approach disentangles the various factors (lockdown and precautionary savings, investment risk, trade exposure, fiscal policy) and quantifies their respective importance for economic activity since the beginning of the pandemics. To the best of our knowledge, we are among the first to present an economic characterisation of the pandemic shock through the lens of an estimated DSGE model for the EA.
The analysis uses the European Commission's Global Multi-Country model (Albonico et al. (2019) (Since autumn 2015, the GM model is regularly employed in the EC's institutional forecast to understand the drivers of the evolution of euro area macro-economic variables, providing also input for the EC Spring and Autumn Forecast reports.) and focuses on shock decompositions (SDs) for economic activity, which displays the the shocks necessary to fit the rich set of data used for model estimation. The fact that shocks in 2020 have been extremely large by historical standards poses a challenge for the estimation of models with stochastic disturbances. We overcome the problem by including (novel) one-off `COVID-19' shocks into the model, which characterise forced savings, generated by social distancing requirements and the closure of non-essential services, and large amounts of labour hoarding, which accounts for the gap between hours paid and hours worked, mimicking short-time work schemes. In the baseline version, the identification of the pandemic shocks exploits the fact that we know the timing of the COVID-19 pandemic, i.e. no shock before 2020, similarly to Lenza and Primiceri (2020). This translates into a model with a subset of shocks displaying exogenous deterministic hetereskedasticity. Lifting the identifying restriction, however, reproduces a very similar shock profile. The model also features liquidity-constrained firms for which investment cannot exceed the (falling) gross operating surplus.
The model-based shock decomposition of real GDP shows that domestic savings shocks have been a key driver of the EA economy's quarterly growth profile in 2020, initially the short-lived 'forced savings', but more and more also

20
persistent savings shocks, reflecting precautionary motives or the fact that restrictions to private demand have become more entrenched as the duration of the pandemic increased. Comparison with a model variant without the COVID-specific extensions also demonstrates the gain in terms of model fit.
Our paper is related to Chen et al. (2020), who show that the NY FED's DSGE model augmented by (supply and demand) COVID shocks, interprets the COVID-19 recession as a demand shock to the US economy. Kollmann (2021) argues (for annual data) that in a stylized New Keynesian model an aggregate supply shock is the main driver of the sharp GDP contraction in the EA during the pandemic, whereas both aggregate demand and supply changes matters for the relative stability of inflation.
References
Albonico, A., L. Calais, R. Cardani, O. Croitorov, F. Ferroni, M. Giovannini, S. Hohberger, B. Pataracchia, F. Pericoli, P. Pfei er, R. Raciborski, M. Ratto, W. Roeger, and L. Vogel (2019). The Global Multi-Country Model (GM): An estimated DSGE model for euro area countries. Working Papers 102, European Economy Discussion Papers.
Barrero, J. M., N. Bloom, and S. J. Davis (2020). Covid-19 is also a reallocation shock. Technical report, National Bureau of Economic Research.
Chen, W., M. D. Negro, S. Goyal, and A. Johnson (2020). the New York Fed DSGE Model Forecast|December 2020. Liberty Street Economics December 23, Federal Reserve Bank of New York.
Guerrieri, V., G. Lorenzoni, L. Straub, and I. Werning (2020). Macroeconomic implications of covid-19: Can negative supply shocks cause demand shortages? Technical report, National Bureau of Economic Research.
Kollmann, R. (2021). The Macroeconomics of Epidemics. ECARES working paper 2021-12, European Center for Advanced Research in Economics and Statistics.
Lenza, M. and G. E. Primiceri (2020). How to estimate a var after March 2020. Technical report, National Bureau of Economic Research.
Beyond the results of models: additional purposes for modelling in the policy process
Melchior A., Utrecht University, Ministry of Economic Affairs and Climate Policy and Ministry of Agriculture, Nature and Food Quality, The Netherlands
Modelling for policy is a challenging process. In order to be effective in the policy environment more than a good scientific method is needed. One of the reasons is that within the policy world other things are valued than in the academic world, as discussed in (1). One of the things that can help modellers is to explicitly think and communicate about model purposes (2) and how these fit within the policy process.
During our work on models with policy developers in the Netherlands we found that we as modellers are limiting ourselves in thinking about the purposes of our models. Often we would be faced with vague questions, such as “how do we structure our thinking about the world in such a way that we can devise a useful policy theory?”, “How do we get a grip on things?” or “what is the question that we as policy developers have to answer?”. These questions have no clear boundaries, definitions or desired outcomes. We found in these cases that the creation of a model in itself is already a concrete result, without looking at the outcomes of a simulation. The model helps policy developers to understand the (level of) complexity, know where to invest more ‘policy development’ resources, ask the right questions and communicate this with others.
This seems to be especially the case when we use Agent Based Modelling (ABM). ABM enables us to model and talk about agents (e.g. people, companies, etc), their interactions and their behaviour in an way that is understandable by non-modellers. When using ABM to support policy developers we saw a lot of value in the process of creating a model and the model as-is instead of focussing on the purpose of the outcomes of the model.
The vagueness of questions is also related to the phase in the policy process where modellers are involved. In early phases of the policy process questions revolved around understanding the societal issue and policy problem whilst finding a direction for possible solutions. One example of this is a recent case study on the transition to electric vehicles in the Netherlands. In this case study we identified various indicators that can indicate the progress of this transition to provide better insights to the policy developers. We explicitly did not find or propose a policy to improve the transition. Finding a (set of) policy(s) that does this is a question for later in the policy process.
Based on these insights we propose a number of additional purposes for modelling in a policy development context:
1. To gain a better understanding of thecomplexity, a better understanding of thesystem.
2. To improve alignment in shared world viewsbetween stakeholders.
3. To give policy developers clear next steps forthe policy process. These steps are explicitlynot “enact this and this policy”.
This also leads to a number of principles that an ABM should adhere to in order to serve its purpose in our context of policy development.
21
1. Acceptance is more important thancorrectness or validity.Acceptance is needed to have real impact onthe policy process. For this one needs tofocus on the things that are considereduseful for the policy process. Correctness andvalidity become more important at laterstages in the policy process.
2. It is not about finding The answer, it is aboutfinding valuable insights. In earlier phase of the policy process policydevelopers are looking for valuable insights,for example how the problem domain worksand what the important questions are thatthey need to answer.
3. Stakeholders are taken into account duringdevelopment.In (1) we found that the work of Dutch policydevelopers best fits the Advocacy CoalitionFramework (ACF) (3). In ACF stakeholdermanagement and forming coalitions areexplicit steps in the policy process. As such,one needs to take the stakeholders and theinteraction with them into account for thepolicy process. This to create things like buy-in and a sense of ownership of the model.This is different from using stakeholders tomake sure the model or simulation is correct.
4. Creates value without empirical evidence.Often empirical evidence is lacking orunsuitable for the challenges at hand. So weneed to think of ways to provide valuewithout relying on data.
5. Communicated in an understandable way.The phenomena that we create ABM's for areusually big and complex. In order to serve itspurpose the ABM needs to be communicatedin such a way that policy developers canunderstand the model and not just the result.
6. Explicitly state what the ABM or other modeldoes and doesn't do.Policy developers are used to receivingacademic reports that tell them whichpolicies to pursue or not. So we need toexplicitly state that we will not be providingthem such insights, together with the thingsthat we will do so they know what to expect.
It is important to also mention some caveats. Within the EU we have various different policy development cultures. As such, when one uses the purposes and principles it is important to take the policy culture into account. For example, in our Dutch policy context the spirit of the “polder model” approach is often used in the policy process.
Another, but related, point is that to be involved in earlier phases of the policy process the relationship between modellers and policy developers needs to be improved. Modellers can generally help policy developers before they themselves realize it. This will most likely require a more pro-active attitude from both sides.
To conclude we reiterate our key point: the results and outcomes of a model are but one useful aspect of modelling. The process of making a model and the structure a model provides are also, if not more, valuable depending on the policy process phase.
References
1. A closer look at dutch policy development. Melchior,Alexander, Dignum, Frank and Ruiz, Marcela. Cham : SpringerInternational Publishing, 2021. Advances in Social Simulation.pp. 383-395.
2. Different modelling purposes. Edmonds, B., et al. 2019,Journal of Artificial Societies and Social Simulation, Vol. 22(3)6.
3. Themes and variations: Taking stock of the advocacycoalition framework. Weible, C.M., Sabatier, P.A. and McQueen,K. 2009, Policy Studies Journal, Vol. 37(1), pp. 121-140.

16
Contributed session 1
Co-design of modelling-based services for climate change
adaptation related policy support under the EU DestinE Initiative
22 November
14:50 – 16:20

23
Destination Earth (DestinE) (https://ec.europa.eu/digital-single-market/en/destination-earth-destine) is a major EU initiative to allow policymakers to directly gauge how environmental challenges, e.g. climate change, will impact society and how society could react to effectively increase resilience. It is not only about monitoring/projection of pressures/impacts, but also about empowering users to actively develop adaptation measures/indicators based on open models/data. However, even best modelling is worthless if users are not empowered to co-design with developers. The Session focuses on presenting main policy user expectations at global/EU/MS/local levels on DestinE, experiences in co-design and initial ideas by the key DestinE developers on possibilities/capacities needed for effective co-design.
Chairs:
Christian Kirchsteiger, DG CNECT, European Commission
Blaž Kurnik, European Environment Agency (EEA)
Peter Bauer, European Centre for Medium-Range Weather Forecasts (ECMWF)
Adaptation modelling and the new EU Adaptation Strategy
Claus Kondrup, DG Climate Action, European Commission
The new EU Strategy on adaptation to climate change, which the European Commission adopted on 24 February 2021, underlines the need to act now. It reiterates the European Green Deal that the green transformation is an opportunity and that failure to act has a huge cost. The vision is a climate-resilient society and economy by 2050. The European Climate Law is the foundation for increased ambition and policy coherence on adaptation.
The strategy highlights the need for:
• smarter adaptation through improvingknowledge and managing uncertainty,anchoring decisions in the latest science, betterdata on climate-related risk and losses, furthersharing of knowledge through notably Climate-ADAPT;
• more systemic adaptation through supportingpolicy development at all levels and sectors,improving adaptation strategies and plans,fostering local and individual and justresilience, integrating climate resilience innational fiscal frameworks, promoting nature-based adaptation solutions;
• faster adaptation by speeding up adaptation,accelerate the rollout of solutions, closerintegration with the EU research programme“Horizon Europe” and notably the Mission onadaptation to climate change and societaltransformation, reducing climate-risk throughe.g. the climate proofing of infrastructure andclosing the climate protection gap, as well asensuring the availability and sustainability offreshwater;
• stepping up international action for climateresilience through, for instance, increasingsupport for international climate resilience andpreparedness, scaling up international financeto build climate resilience, and strengthenglobal engagement and exchanges onadaptation.
The Council Conclusions strongly welcomes the new EU Adaptation Strategy and endorses its long-term vision of a climate-resilient Union by 2050. The Council emphasises the need for better data for assessing climate risk and supports informed decision-making through strengthened data collection, data representation and climate change scenarios, etc.
The European Commission has completed a study on adaptation modelling, i.e. the technical, financial, economic and non-monetary analysis and modelling of climate change hazards, risks, impacts, vulnerability and adaptation – with the overall objective to support better-informed decision-making. The findings, which among other include a comprehensive overview of data, tools and methods have been published, and will for instance contribute to further research work (e.g. under the adaptation mission of Horizon Europe).
The presentation will focus on the selected aspects of adaptation modelling in the context of the new EU Adaptation Strategy and its implementation.
References
EU Strategy on Adaptation to Climate Change – Published on 24 February 2021:
Communication: https://eur-lex.europa.eu/legal-content/EN/TXT/?uri=COM:2021:82:FIN
Press release: https://ec.europa.eu/commission/presscorner/detail/en/IP_21_663 (all EU languages)

24
Q & A: https://ec.europa.eu/commission/presscorner/detail/en/QANDA_21_664 (all EU languages)
EU Adaptation Strategy: https://ec.europa.eu/clima/sites/clima/files/adaptation/what/docs/eu_strategy_2021.pdf
Film: https://audiovisual.ec.europa.eu/en/video/I-201845 (all EU languages)
Press conference with EVP Frans Timmermans (recording): https://audiovisual.ec.europa.eu/en/video/I-202216
Background studies: https://ec.europa.eu/clima/policies/adaptation/what_en#tab-0-2
Webinar 25-26 February 2021:https://www.youtube.com/playlist?list=PLqj_l70M-izDyxjFwQjLb5zjGRCRj3maX and https://www.cmcc.it/eu-climate-adaptation-strategy-2021
Council Conclusions:
Conclusions: https://data.consilium.europa.eu/doc/document/ST-9419-2021-INIT/en/pdf
Press release 10/6/21: https://www.consilium.europa.eu/en/press/press-releases/2021/06/10/council-endorses-new-eu-strategy-on-adaptation-to-climate-change/
Main results 10/6/21: https://www.consilium.europa.eu/en/meetings/env/2021/06/10/?utm_source=dsms-auto&utm_medium=email&utm_campaign=Environment+Council
Adaptation Modelling – Main Reports – Published on 24 February 2021:
Climate Adaptation Models and Tools – Main Report – Comprehensive desk review: https://op.europa.eu/en/publication-detail/-/publication/9383d16e-7651-11eb-9ac9-01aa75ed71a1
Climate Adaptation Models and Tools – Annexes – Comprehensive desk review: https://op.europa.eu/en/publication-detail/-/publication/cfa86c26-764e-11eb-9ac9-01aa75ed71a1
Climate Adaptation Models and Tools – Summary – Comprehensive desk review: https://op.europa.eu/en/publication-detail/-/publication/2f9d12cd-7656-11eb-9ac9-01aa75ed71a1
Recommended approach to analysis and modelling: https://op.europa.eu/en/publication-detail/-/publication/190face7-7654-11eb-9ac9-01aa75ed71a1
Report on use cases and rapid analysis: https://op.europa.eu/en/publication-detail/-/publication/ca870a9a-7654-11eb-9ac9-01aa75ed71a1
24 cases of rapid analysis: https://op.europa.eu/en/publication-detail/-/publication/db6d4882-7652-11eb-9ac9-01aa75ed71a1
Enhancing the European Adaptation Platform Climate-ADAPT to support Digital Twin on Climate Change Adaptation.
Blaž Kurnik, European Environment Agency (EEA)
Linking the ambitions of the European Green Deal and the European Unition (EU) Digital Agenda, offers a unique opportunity to embed connections between these aspects in the European Environment Agency (EEA) activities, while contributing to the implementation of these and other related policy initiatives. EEA contributes and plan to increase its contribution to the digital agenda and green data with its assessment and data collection to support implementation of relevant EU adaptation policies and initiatives in particular supporting the actions under the new EU strategy on adaptation to climate change and the Mission on adaptation and societal transition. In this respect the Destination Earth initiative plays an important role and acts as link between key adaptation policies and climate data. Therefore, added value of the Destination Earth and its Digital Twin on climate change adaptation is to bring together climate data and climate models outputs with sets of socioeconomic and environmental data to support decision making at various governance levels using an innovative and user driven approach delivered by the European Climate Adaptation platform (Climate – ADAPT).
Climate-ADAPT is a joint effort of the European Commission (DG Climate Action) and the EEA. Climate-ADAPT supports Europe in adapting to climate change. Climate-ADAPT facilitates access to data and information on ongoing and projected climate changes in Europe; current and future vulnerability of regions and sectors; European Union, national and transnational adaptation strategies and actions; adaptation options, including at the sub-national scale; illustrative examples of implementing those options; and various tools that support adaptation planning. Furthermore, it is a well-established knowledge platform, valued as a trusted source of information at all governance levels in Europe, and with a wide outreach. As for local level adaptation, the Urban Adaptation Support Tool is managed jointly with the Covenant of Mayors for Climate and Energy and offers adaptation planning guidance to the Covenant of Mayors signatories and other local authorities. The Urban Adaptation Map Viewer provides an overview of the current and future climate hazards facing the European cities, the vulnerability of the cities and their adaptive capacity. The European Health and Climate Observatory provides knowledge on health related adaptation knowledge and measures. Climate-ADAPT can support developments of the digital twin by providing link to sources of
25
collected and reported information on national adaptation, on loss and damage data caused by weather and climate extremes, adaptation measures and level of implementation in sectors.
Both Climate-ADAPT as a source of adaptation information and the European Climate and Health observatory can significantly contribute to the developments of Destination Earth and its digital twin on adaptation and can serve as a link between data and policy and practitioners needs.
The digital twin can also support the EEA policy relevant assessments and indicators, in particular the developments climate change vulnerability and adaptation indicators. EEA publishes regular assessments and indicators on climate hazards such as droughts, floods, forest fires and sea level rise during the 21st century and beyond based on the most recent climate data and prepares readymade visualisation of those hazards to support decision making. EEA has prepared various visualisations of the hazards (such as Climate Change Impacts maps) by compiling various sources of data. In future these products could be as well based on Destination Earth (DestinE) outputs and the Copernicus Climate Change Service (C3S) products.
EEA publishes regular information on vulnerability of countries, region or cities to climate-related hazards, i.e. assessing how badly the countries, regions or cities would be affected in the event of flooding, heatwave or other extreme weather – is not just related to the concentration of assets and infrastructure, but first and foremost stems from the vulnerability of their inhabitants.
Vulnerability to climate change hazards is complex and understanding it may require data from a variety of sources, including census data, health records or social care recipients’ lists. These data are usually not in a shape and format to be included into vulnerability assessments. Moreover, many times these data need to be gap filled by modelled data. In future the digital twin will play key role in providing access to harmonised and gap filled data on vulnerability of the society to climate hazards by combining of high resolution measured and modelled data on current and social and economic developments. The key added value of the digital twin on climate change adaptation is to improve the access and quality of harmonised measurements and projections on all aspect of climate including physical climate change and the socio economic developments, in particular:
• improved modelling framework on adaptationresponse in particular assessing howadaptation (will) increase(s) the societal andenvironmental resilience to climate change;
• development of datasets for improvedadaptation metrics e.g. development of newadaptation indicators;
• better estimation of the costs of climate andweather extremes and costs of inaction toadapt;
• improved sectoral focus (such as agriculture,infrastructure, …) by providing tailored made(e.g. bias corrected) datasets to supportsectoral modelling and by inclusion oftechnical adaptation measures;
• offering interfaces to modelling in otherknowledge areas such as biodiversity tosupport systemic assessments and scenarios;
• development of harmonised adaptationindicators to support policy implementation(e.g. in particular supporting implementation ofthe future Climate law).
Twinning and Global Environment Monitoring: The Example of Water – A Pathway of Opportunity Bridging from Data to Actionable Forecasting on Relevant Scales
Hartwig Kremer, UN Environment Programme, Georg Teutsch, Helmholtz Centre for Environmental Research – UFZ
The United Nations Environment Programme (UNEP) is promoting digital transformation as an internal and external means to achieve the environmental goals of the SDGs. Digitalizing and modernizing global environmental monitoring and flagship thematic and integrated assessments, including data visualization and distribution are milestones in this readiness process. The goal is to engage with and empower governments, policymakers, academia, the private sector and citizens by generating and making available high-quality data, models, scenario and forecast services. Building this bridge between data, interpretation and engagement at scale will be pivotal to foster action on the environmental dimension of equitable, sustainable development across sectors. Leveraging the advancements of digital transformation means engaging with societal actors, building collective intelligence and integrating environmental and social data, metrics, and norms into algorithms and SMART applications. Ultimately, this will support transitions to a digital green economy and accelerate global action on climate, nature and pollution by 2030.
Against this background UNEP recently positioned itself in a partnership proposal with Destination
26
Earth (DestinE), where cooperation would be anchored to the “Annex to the Memorandum of Understanding between the European Union and the United Nations Environment Programme for the period 2021-2025” and its implementation. Laid out in this partnership proposal are UNEP’s three key environmental data applications/services that have direct relevance for the DestinE initiative of the European Commission. These are a) the Global Environment Monitoring System/s (GEMS), b) the Earth Stress Monitor (STRATA) and c) theWorld Environment Situation Room (WESR).
The goal of GEMS is to harness big data, cloud computing and AI to automate the observation and monitoring of thematic data, including water, air and ocean using a combination of earth observation, modelling and ground monitoring stations. DestinE would power UNEP’s applications through infrastructure, data, and analytics capacity. GEMS will support this data environment and engage with the World Water Quality Alliance (WWQA) modelling and EO groups to feed into assessments and actionable services at scale, i.e., to further improve monitoring capabilities for water, air, oceans etc. Partnering with efforts towards digital twinning will boost capacity serving as a trusted provider of thematic environmental data and inform short to medium term scenarios and forecast for sectoral action. To date, e.g. GEMS/Water operates a global in-situ database through the GEMStat portal (www.gemstat.org). Piloting the combination of this knowledge with a hydrological digital twin, would complement GEMS services in providing quality-assured, open environmental data, analyses and participatory processes to governments and sectoral stakeholders.
Due to their fundamental nature GEMS and the World Water Quality Alliance together with the World Water Quality Assessment in collaboration with UFZ and partners, could leverage digital twinning in terms of both environmental extremes and information on gradual processes triggered by climate and land-use changes and incorporate them into adaption pathways.
Specifically, we seek to develop a digital twin for freshwater as a starting point for restoring and enhancing ecosystem conditions, thereby improving biodiversity and provisioning of ecosystem services under threat. This represents an unprecedented opportunity to bring digitalization to benefit in a space where data is abundant yet reported only intermittently, and to focus on a natural resource receiving growing attention as a critical service and variable across SDGs, in view to health, condition of our ecosystems, economy and for society.
Twinning water flux is put in context for the purpose on preserving water resources for human
demands, restoring ecosystems and thereby maintaining and improving biodiversity. The scope would be to look at the complete hydrological cycle and essential hydrological variables. Soil moisture and surface water flows as one of these essential climate variables are taken as a starting point and demonstration case. Given the magnitude and duration of drought hazards are steadily increasing, continent-wide platforms that provide quasi real-time information on the current state of soil moisture and water flow are urgently needed to make appropriate decisions and implement mitigation measures for a range of economic and societal sectors. The hydrological variables under consideration will then be expanded to water temperatures, water quality and other core set indicators for up-to-date state-of-the-environment reporting.
This digital twin would provide a view of water in the value chain as well as a view of the state of water bodies in the future and, most importantly, facilitate the development of solutions to address the causes and pressures leading to ecosystem degradation. Moreover, it would contribute to a comprehensive understanding of water management, which is important since managing the water system helps to respond to climate change adaptation. Finally, this would provide an improved view on water in 1. Time - pathways and trajectories 2. Data flows - potentials to enhance the level of information we have, as well as improve timeliness of data, as well as use data density in Europe to work in data scarce areas.
Spatial and sectoral quantification of the impact of changing drivers including climatic extreme events is required if adequate management strategies are to be adopted and shall trigger robust decision making. Latest high-resolution climate and hydro-ecological models provide a continuous “zoom” from continental to local scale. With sub-seasonal to multi-decadal resolution they allow analysis of robust, quantitative scenarios of essential hydrological variables enabling concrete courses of action at regional, national or supra-national governance levels. Enhanced mapping, modelling and scalable forecasting would be operational outputs. In parallel, GEMS may strengthen DestinE’s applications providing improved global freshwater data and assessments. Those are vital for EU Member States as well as the global community to evaluate progress regarding the implementation of policy frameworks such as the SDGs, the European Green Deal and its supporting strategies, e.g. the Farm to Fork, Forest and biodiversity strategies as well as other global and regional multilateral environmental agreements.

27
Modelling Approaches and Co-design at National Level
Markus Leitner, Environment Agency Austria (EAA)
New regional climate scenarios – Klimaszenarien für Österreich (ÖKS15) projections – for Austria and its nine provincial states have been available since autumn 2016. The scenarios are based on 13 EURO-CORDEX (Coordinated Downscaling Experiment - European Domain https://www.euro-cordex.net/) models, a 12.5km x 12.5 km grid, and use two greenhouse gas scenarios:
• Scenario - Representative ConcentrationPathway (RCP) 8.5 reflects “business as usual”– i.e. unchecked greenhouse gas emission, sothat by 2100 there is a 3 times higherconcentration than today.
• Scenario RCP4.5 shows a future in which, after2040, global greenhouse gas emissions havesuccessfully been reduced and by 2080 havediminished to about half today’s level. In orderto fulfil the obligations of the world climateagreement, however, even the RCP4.5 pathwould still have to be significantly undercut.
The ÖKS15 data provide comprehensive, high-resolution and error-corrected information on climate change on a homogeneous basis for entire Austria for the first time. Their analysis delivers climate projections until the end of the 21st century and provides good insights into the expected effects of climate change in Austria. The climate projections provide information for the near future (2021–2050) and for the distant future (2071–2100) compared to the 1971–2000 period.
Factsheets for all nine federal states with more detailed information on projected climate elements and climate indices are available.
Models will only ever be approximations of reality and can never take into account all influencing factors. Model calculations for the global climate – and (especially) for regional climates – thus involve high levels of uncertainty; in addition, feedback effects have not yet been considered. Uncertainty in the assumptions also rises as the scenarios project further into the future. Nevertheless, the various models clearly indicate a potential range of climatic changes to be expected. Within this range, appropriate adaptation measures are needed that allow flexible re-adjustments and take existing uncertainties into account.
Via the project Climate Change Impact Maps for Austrian Regions Strategies for climate change adaptation (CLIMAMAP) climate change impact maps (incl. communication of uncertainties) were designed. These maps support municipalities in
understanding climate change impacts, in building capacities and in implementing adaptation measures. Co-developing the impact maps with the end-users ensures that information needs of municipalities are met.
Experiences and examples of the applicability of these maps for adaptation planning and implementation will be shared with the audience.
Digital Twins for Safe and Sustainable Delta Development in a Changing Climate – A Perspective on the Destination Earth Initiative
Femke C. Vossepoel, Neelke Doorn, Nick C. van de Giesen, Arnold W. Heemink, Rolf W. Hut, Sebastiaan N. Jonkman, Caroline A. Katsman, Mark van Koningsveld, Stef Lhermitte, Herman W.J. Russchenberg, A. Pier Siebesma, Susan C. Steele-Dunne, Riccardo Taormina, Philip J. Vardon, Jazmin Zatarain Salazar, Delft University of Technology
Digital twins form a means for scientists, policymakers and industry to engage with society and extract the best value from existing data to understand and interact with system Earth. We expect DestinE to deliver expert solutions to societal problems on the one hand and to deliver support for co-creation of ready-to-use tools on the other hand. Delft University of Technology (TU Delft) has experience with both.
The co-creation of several tools for decision support ensures safety and sustainability of the Dutch delta in a changing climate, such as a digital twin of the Rhine-Meuse delta to monitor saltwater intrusions [1], and a digital twin of the Rotterdam port and delta system to test how future (climate and urban) stresses and interventions can affect the system [2]. Particularly, these examples advance exploratory uses in developing awareness, system understanding and decision-making capacity. They form the basis of decision-support tools co-developed with the end users.
DestinE would be most effective if the resulting tools are modular and usable, enabling stakeholders to swap datasets and models, or even alter the simulated state without being specialised experts. The success of DestinE depends on its ability to tie together the different parts of the Earth system with seamless data assimilation that incorporates real-time incoming data sources and balances the uncertainties of all components to build relevant decision-support systems.
Use case with co-design of decision-support tools: An example of a decision-support tool is the

28
eWaterCycle [3] platform, co-designed with the hydrological community, who are the real users of the platform, and research software engineers. Ongoing research uses output from the European Flood Awareness System (EFAS) project as part of a collaboration with European Centre for Medium-Range Weather Forecasting (ECMWF). In the short term, the platform supports government decisions on risk management and risk communication. These include the closing and opening of locks, restrictions on the extraction of groundwater which require accurate predictions of seasonal variability as well as major floods, drought management plans and tariff structures. We also investigate current and future flood risk and adaptation of the Dutch delta [4], including grey and nature-based solutions. High-resolution data (incl. subsoil conditions, and real time deformations) is needed to understand the reliability of defences and the possibilities for adaptation. In the case of flood threats, scenario-driven risk assessments will be key for quick decision making about temporary structural measures, the most vulnerable parts of critical infra systems and the most safe evacuation routes.
Use cases with integration of Earth system observations and dynamic models: The integration of subsurface data and dynamic models simulating geothermal energy systems is part of the DAPwell [5], a Living Lab being developed with industrial partners at the TU Delft campus which includes state-of-the-art equipment to monitor and evaluate the use of geothermal energy and address the scientific challenges. It also provides the TU Delft campus and the municipality of Delft with sustainable energy. The project is used as a source of data and a case study for other national research programmes via a transnational access programme, evaluating the use of geothermal energy. ]Specifically, the DAPwell will contribute to the European innovative training network EASYGO [6 and the sharing of data will be realised via the European Plate Observing System (EPOS) facilities, where co-creation of data-driven tools is ongoing.
Another use case of a data-assimilation scheme developed by TU Delft is a framework to constrain land surface models with remote sensing data which is co-designed with developers at the Dutch eScience Center and Meteo-France. Artificial intelligence serves to relate states of a land surface model to Advanced Scatterometer (ASCAT) geo-located radar backscatter [7] and dynamic vegetation parameters as a step towards assimilating these new data. In the mid-term, we aim to extend this to direct collaboration with ECMWF land assimilation for numerical weather
prediction. An additional use case merges satellite data and climate models to estimate the impact of ice-sheet stability on sea-level rise, in close collaboration with the European Space Agency. Through this project, TU Delft contributes to the European research project “Protect” [8].
Use cases with advanced modelling for decision support: In the infrastructural domain, a digital twin is being used to find the optimal water way through the use of digital twins in the SmartPort [9] project, an initiative of SmartPort and itspartners Deltares and TU Delft, involvingWitteveen+Bos and inland shipping entrepreneursin the co-design. This digital twin fairway corridormimics the interaction between ships, rivers, andinfrastructure, such as bridges and locks. In thisway, the consequences of climate change areidentified, which by translating the impactassessment to concrete measures can guaranteereliable, sustainable, and future-proof freighttransport over water.
As part of the Resilient Delta Initiative [10], TU Delft and partners Erasmus University Rotterdam and Erasmus MC collaborate with the Port of Rotterdam and the Municipality of Rotterdam to find technology-driven solutions to the societal issues related to current transitions. The initiative embeds new ideas and practices in society from the start. A digital twin of the Rotterdam delta is being developed to find smart and resilient solutions for long-term climate adaptation.
Tools and data sets for monitoring and forecasting of the weather in support of these use cases are being developed by TU Delft in the nationwide observatory “Ruisdael”, in collaboration with other universities and the national institutes KNMI and RIVM. The ambition of this large-scale infrastructural project is to explore opportunities and challenges for monitoring and forecasting weather and air quality over the Dutch delta at the 100-metre scale. The Ruisdael Observatory isclosely linked to a number of European researchprojects and infrastructures: Aerosol, Clouds andTrace Gases Research Infrastructure (ACTRIS) formonitoring clouds, aerosols and trace gases,Research Infrastructures Services Reinforcing AirQuality Monitoring Capacities in European Urban &Industrial AreaS (RI-URBANS) on monitoring ofurban air quality and public health, IntergatedCarbon Observation System (ICOS) on monitoringof greenhouse gases, as well as the PilotApplication in Urban Landscapes towardsintegrated city observatories for greenhouse gases(PAUL) city network and the Sustainable Access toAtmospheric Research Facilities (ATMO-ACCESS)program.

29
Co-design: Building on our extensive experience with the co-design of integrated Earth-system simulators for decision support, TU Delft is eager to engage with the DestinE developers in the co-design of digital twins, providing an invaluable tool for policymakers dealing with risk management and communication.
References
1 https://www.tudelft.nl/en/2019/citg/guaranteeing-freshwater-with-a-virtual-delta.
2 http://digishape.nl/
3 https://www.ewatercycle.org/
4 project All Risk https://kbase.ncr-web.org/all-risk/
5 Delft Aardwarmte Project (DAP) https://geothermiedelft.nl/
6 https://easygo-itn.eu/
7 https://www.tudelft.nl/2019/citg/nso-funds-earth-observation-projects-from-susan-steele-dunne-and-stef-lhermitte
8 https://protect-slr.eu/
9 https://smartport.nl/en/extreme-climate-conditions-form-a-strong-foundation-for-digital-twin/
10 http://resilientdelta.org/

24
Keynote 2
23 November
09:30 – 10:50

31
Economic models and the COVID-19 pandemic
Loriana Pelizzon, Head of the department "Financial Markets" and coordinator of Gender Equality at the Leibniz Institute for Financial Research SAFE; Professor of Economics at the Ca’ Foscari University of Venice and CEPR research Fellow
The COVID-19 pandemic has challenged economists to provide to policy makers models and decision tools. The COVID-19 crisis has uncovered big gaps in knowledge. Indeed, ppandemics hardly played a role in modern studies of economics. The COVID-19 crisis is not just “another” large-scale shock.
To take economic decisions it was imperative to address contingent questions such as: Will it end in few quarters? Will there be recurring waves? Seasonality? Will it be intermittent for few years? What would be the impact in terms of death but also from the economic and financial point of view? What should be the most appropriated policy measures?
What economist are usually doing to address these questions is to look to the past. However, we do not have events in the “recent past” that could help us to address these questions.
For this reason, economists face the need to embed the canonical SIR (susceptible, infected, and recovered) model into macroeconomic models. The key challenge was to characterize the interaction between economic decisions and epidemics. Individual behavior is at the core of the economy and the impact on the demand was one of the economic aspects that need to be predicted for policy makers and several models have been proposed for this.
Moreover, we have observed the development of models that helped to understand the inter-action between epidemics and economic activity. The key challenge was to consider the dynamic implications across sectors and provide adequate predictions given that sectors differ in their epidemiological parameters and ability to work from home. The difficulty was also the attempt to model both aggregate and local shocks due to the transmission rates as well as the possibility of developing a vaccine.
“Suppression” measures (isolation, quarantine, etc.) seems from the beginning necessary to
contain spread and buy time so as not to run out of hospital beds. But this creates the paradox of the Pandemic Response: the better the response, the harder the economic hit. The challenging decision about mitigation policies and economic costs should be based on a cost-benefit analysis, that is balancing the economic costs against the health benefits. This decision needs to be supported by economic analysis performed on reliable microeconomic data and several attempts have been made on this regard.
The impact of the COVID-19 pandemic on householders and firms and the associated uncertainty, caused disruptions in many financial markets. However, the large interventions by central banks and then by governments have allowed them to rebound quickly. On this regards the COVID-19 crisis has highlighted the presence of relevant frictions in the financial system and its fragility, that so far seems to be addressed only by monetary or fiscal policies. Events during March 2020 highlighted the fragility of Treasury and corporate bond markets more broadly. Given the importance of Treasury securities as safe assets in global financial markets and the relevance of corporate bond markets for the funding of firms, improving the resilience of these markets is essential. However, even if the COVID-19 shock affected all countries around the world, issues in the treasury markets haves been observed only in some sovereign bond markets and not in others. This indicates on one side the limited resilience of financial markets and on the other the need to model these frictions in macrofinance models. This evidence has also raised the need to better understand how to implement macroprudential policies and the role of central banks as market makers of last resorts.
Finally, a significant effort has been devoted to assessing the impact of the COVID-19 pandemic on banks. The significant capital buffer that banks have been forced to build up after the global financial crisis has indicated in the first simulations that the banking sector was largely resilient. On the other side the large deposit inflows and the public support provided to householders and non-financial firms contributed to this resilience. However, microfinance models are still needed to investigate direct and indirect effect (such as bank zombification) that the COVID-19 pandemic might generate in the banking sector.

32
Session 3
Scenarios and data
23 November
11:00 – 12:45

33
Modelling markets of bio-based chemical products with BioMAT
Myrna van Leeuwen, Ana Rosa Gonzalez-Martinez, Wageningen Economic Research, Netherlands Viktoriya Sturm, Petra Salamon, Thünen Institute of Market Analysis, Germany
The activities on which this abstract is based are financed through the H2020 project BioMonitor (Grant Agreement No N°773297). Further information on the project is available at: https://biomonitor.eu/
The updated EU Bioeconomy Strategy (European Commission, 2018) aims to develop a sustainable bioeconomy for Europe and addresses the competing use of biological resources, encompassing multiple sectors and policies to achieve policy coherence and synergies. To guide policy making, knowledge and foresight capacities are needed, including quantitative models. The review of existing modelling capacities reveals that one of the most significant gaps is the pure coverage of the emerging bio-based products, i.e. chemicals, which are currently predominantly produced using non-renewable and fossil resources in existing models (Lovrić et al, 2020).
To address this gap in modelling capacities we develop a multi-regional partial equilibrium model named BioMAT (Bio-based MATerials), a new consistent framework for modelling value chains of bio-based materials in the EU and its Member States. BioMAT aims to provide a proper representation of bio-based commodity markets, tracking feedstock and bio-based material flows in its recent history, projecting their future developments and reflecting the influence of demand and supply drivers and the policy framework. BioMAT is developed within the frame of the Biomonitor project and focuses currently mainly on bio-based products produced within the complex chemical sector (NACE C20).
The key source of inspiration by development of BioMAT was the experience gained by modelling the agro-food value chains in AGMEMOD (Agriculture Member State Modelling) (https://agmemod.eu/). Fig. 1 shows the bio-based value chains that will be covered by BioMAT.
Figure 1: Bio-based value chains to be covered in BioMAT (Version V1) Source: Reproduced from BioMonitor project deliverables (forthcoming)
When building the database for BioMAT, we try to exploit official statistics as much as possible. The ProdCom statistics of Eurostat include more than 550 codes within the chemical sector (NACE C20), each covering one or several chemical products. As chemical products are in general diverse and/or processed as composites and have different
positions in the value chain, it is impossible to make market models for each individual product. For that reason, the individual products, all with a specific ProdCom code, are clustered to product application groups. Current BioMAT database covers 9 applications: 7 semi-final categories such as “paper and paperboard”, “surfactants”,
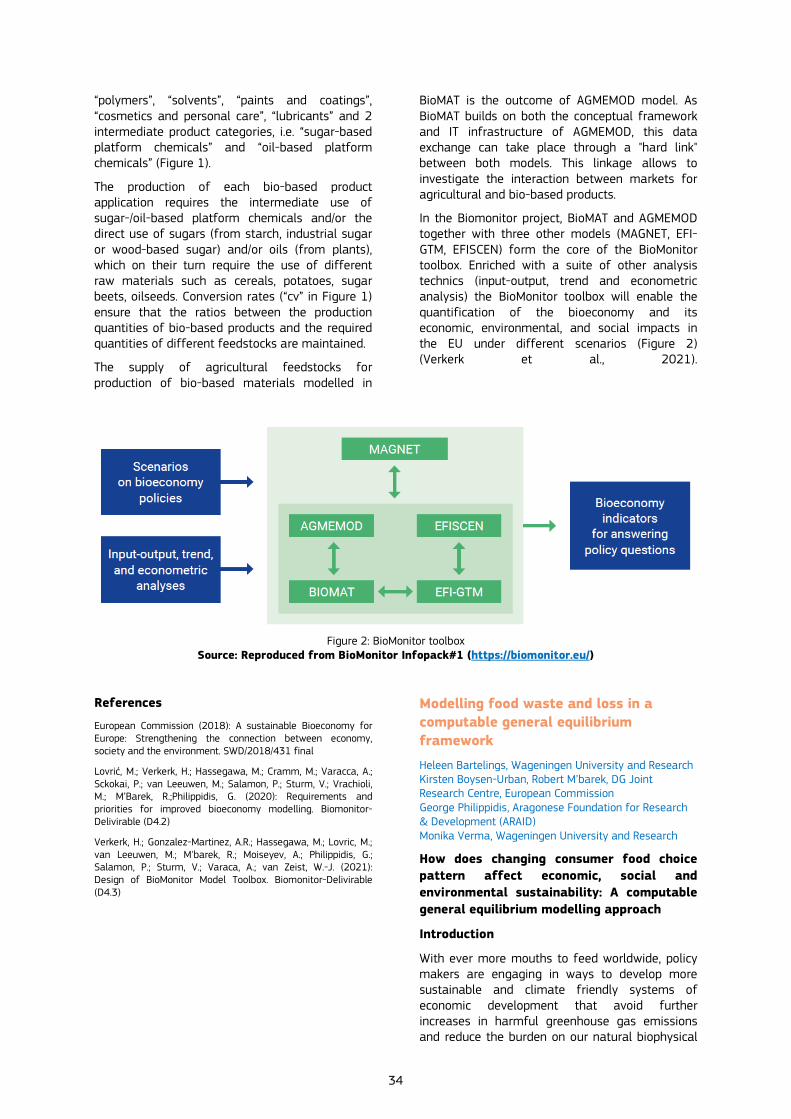
34
“polymers”, “solvents”, “paints and coatings”, “cosmetics and personal care”, “lubricants” and 2 intermediate product categories, i.e. “sugar-based platform chemicals” and “oil-based platform chemicals” (Figure 1).
The production of each bio-based product application requires the intermediate use of sugar-/oil-based platform chemicals and/or the direct use of sugars (from starch, industrial sugar or wood-based sugar) and/or oils (from plants), which on their turn require the use of different raw materials such as cereals, potatoes, sugar beets, oilseeds. Conversion rates (“cv” in Figure 1) ensure that the ratios between the production quantities of bio-based products and the required quantities of different feedstocks are maintained.
The supply of agricultural feedstocks for production of bio-based materials modelled in
BioMAT is the outcome of AGMEMOD model. As BioMAT builds on both the conceptual framework and IT infrastructure of AGMEMOD, this data exchange can take place through a "hard link" between both models. This linkage allows to investigate the interaction between markets for agricultural and bio-based products.
In the Biomonitor project, BioMAT and AGMEMOD together with three other models (MAGNET, EFI-GTM, EFISCEN) form the core of the BioMonitor toolbox. Enriched with a suite of other analysis technics (input-output, trend and econometric analysis) the BioMonitor toolbox will enable the quantification of the bioeconomy and its economic, environmental, and social impacts in the EU under different scenarios (Figure 2) (Verkerk et al., 2021).
Figure 2: BioMonitor toolbox Source: Reproduced from BioMonitor Infopack#1 (https://biomonitor.eu/)
References
European Commission (2018): A sustainable Bioeconomy for Europe: Strengthening the connection between economy, society and the environment. SWD/2018/431 final
Lovrić, M.; Verkerk, H.; Hassegawa, M.; Cramm, M.; Varacca, A.; Sckokai, P.; van Leeuwen, M.; Salamon, P.; Sturm, V.; Vrachioli, M.; M’Barek, R.;Philippidis, G. (2020): Requirements and priorities for improved bioeconomy modelling. Biomonitor-Delivirable (D4.2)
Verkerk, H.; Gonzalez-Martinez, A.R.; Hassegawa, M.; Lovric, M.; van Leeuwen, M.; M'barek, R.; Moiseyev, A.; Philippidis, G.; Salamon, P.; Sturm, V.; Varaca, A.; van Zeist, W.-J. (2021): Design of BioMonitor Model Toolbox. Biomonitor-Delivirable (D4.3)
Modelling food waste and loss in a computable general equilibrium framework
Heleen Bartelings, Wageningen University and Research Kirsten Boysen-Urban, Robert M’barek, DG Joint Research Centre, European Commission George Philippidis, Aragonese Foundation for Research & Development (ARAID) Monika Verma, Wageningen University and Research
How does changing consumer food choice pattern affect economic, social and environmental sustainability: A computable general equilibrium modelling approach
Introduction
With ever more mouths to feed worldwide, policy makers are engaging in ways to develop more sustainable and climate friendly systems of economic development that avoid further increases in harmful greenhouse gas emissions and reduce the burden on our natural biophysical
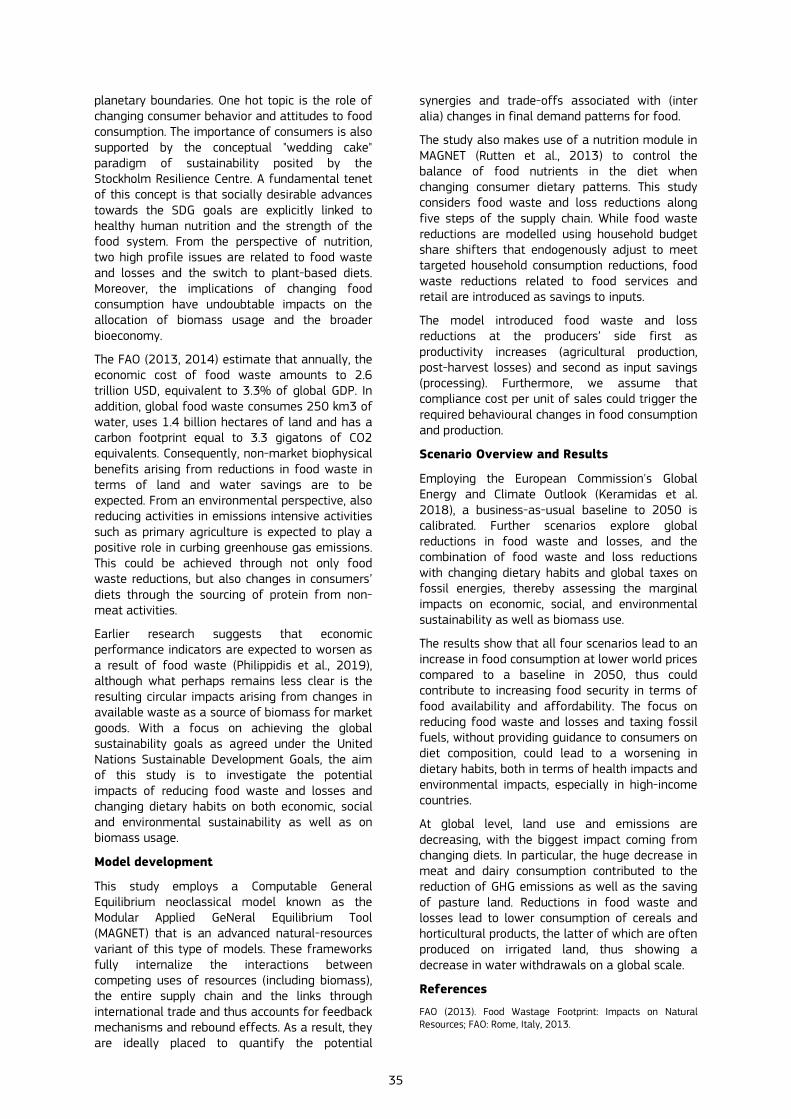
35
planetary boundaries. One hot topic is the role of changing consumer behavior and attitudes to food consumption. The importance of consumers is also supported by the conceptual "wedding cake" paradigm of sustainability posited by the Stockholm Resilience Centre. A fundamental tenet of this concept is that socially desirable advances towards the SDG goals are explicitly linked to healthy human nutrition and the strength of the food system. From the perspective of nutrition, two high profile issues are related to food waste and losses and the switch to plant-based diets. Moreover, the implications of changing food consumption have undoubtable impacts on the allocation of biomass usage and the broader bioeconomy.
The FAO (2013, 2014) estimate that annually, the economic cost of food waste amounts to 2.6 trillion USD, equivalent to 3.3% of global GDP. In addition, global food waste consumes 250 km3 of water, uses 1.4 billion hectares of land and has a carbon footprint equal to 3.3 gigatons of CO2 equivalents. Consequently, non-market biophysical benefits arising from reductions in food waste in terms of land and water savings are to be expected. From an environmental perspective, also reducing activities in emissions intensive activities such as primary agriculture is expected to play a positive role in curbing greenhouse gas emissions. This could be achieved through not only food waste reductions, but also changes in consumers’ diets through the sourcing of protein from non-meat activities.
Earlier research suggests that economic performance indicators are expected to worsen as a result of food waste (Philippidis et al., 2019), although what perhaps remains less clear is the resulting circular impacts arising from changes in available waste as a source of biomass for market goods. With a focus on achieving the global sustainability goals as agreed under the United Nations Sustainable Development Goals, the aim of this study is to investigate the potential impacts of reducing food waste and losses and changing dietary habits on both economic, social and environmental sustainability as well as on biomass usage.
Model development
This study employs a Computable General Equilibrium neoclassical model known as the Modular Applied GeNeral Equilibrium Tool (MAGNET) that is an advanced natural-resources variant of this type of models. These frameworks fully internalize the interactions between competing uses of resources (including biomass), the entire supply chain and the links through international trade and thus accounts for feedback mechanisms and rebound effects. As a result, they are ideally placed to quantify the potential
synergies and trade-offs associated with (inter alia) changes in final demand patterns for food.
The study also makes use of a nutrition module in MAGNET (Rutten et al., 2013) to control the balance of food nutrients in the diet when changing consumer dietary patterns. This study considers food waste and loss reductions along five steps of the supply chain. While food waste reductions are modelled using household budget share shifters that endogenously adjust to meet targeted household consumption reductions, food waste reductions related to food services and retail are introduced as savings to inputs.
The model introduced food waste and loss reductions at the producers’ side first as productivity increases (agricultural production, post-harvest losses) and second as input savings (processing). Furthermore, we assume that compliance cost per unit of sales could trigger the required behavioural changes in food consumption and production.
Scenario Overview and Results
Employing the European Commission's Global Energy and Climate Outlook (Keramidas et al. 2018), a business-as-usual baseline to 2050 is calibrated. Further scenarios explore global reductions in food waste and losses, and the combination of food waste and loss reductions with changing dietary habits and global taxes on fossil energies, thereby assessing the marginal impacts on economic, social, and environmental sustainability as well as biomass use.
The results show that all four scenarios lead to an increase in food consumption at lower world prices compared to a baseline in 2050, thus could contribute to increasing food security in terms of food availability and affordability. The focus on reducing food waste and losses and taxing fossil fuels, without providing guidance to consumers on diet composition, could lead to a worsening in dietary habits, both in terms of health impacts and environmental impacts, especially in high-income countries.
At global level, land use and emissions are decreasing, with the biggest impact coming from changing diets. In particular, the huge decrease in meat and dairy consumption contributed to the reduction of GHG emissions as well as the saving of pasture land. Reductions in food waste and losses lead to lower consumption of cereals and horticultural products, the latter of which are often produced on irrigated land, thus showing a decrease in water withdrawals on a global scale.
References
FAO (2013). Food Wastage Footprint: Impacts on Natural Resources; FAO: Rome, Italy, 2013.

36
FAO (2014). Food Wastage Footprint. Full-cost Accounting: FAO: Rome, Italy, 2014
Keramidas, K., Tchung-Ming, S., Diaz-Vazquez, A. R., Weitzel, M., Vandyck, T., Després, J., Schmitz, A., Rey Los Santos, L., Wojtowicz, K., Schade, B., Saveyn, B., and A. Soria-Ramirez (2018): Global Energy and Climate Outlook 2018: Sectoral mitigation options towards a low-emissions economy – Global context to the EU strategy for long-term greenhouse gas emissions reduction, EUR 29462 EN, Publications Office of the European Union, Luxembourg, 2018, ISBN 978-92-79-97462-5, doi:10.2760/67475, JRC113446.
Philippidis, G., Sartori, M., Ferrari, E. and R. M'barek (2019): Waste not, want not: A bioeconomic assessment of household food waste reductions in the EU, Resources, Conservation & Recycling, 146, pp514-522.
Philippidis, G., Hugo Ferrer-Pérez, Pilar Gracia-de-Rentería, Robert M'barek, Ana Isabel Sanjuán López (2021), Eating your greens: a global sustainability assessment, Resources, Conservation and Recycling, Volume 168, 2021, 105460, ISSN 0921-3449, https://doi.org/10.1016/j.resconrec.2021.105460
Rutten M. M., Tabeau A. A. and F. E. Godeshalk (2013b): A New Methodology for Incorporating Nutrition Indicators in Economy-Wide Scenario Analyses. (FOODSECURE technical paper; No. 1). The
Hague: FOODSECURE project office LEI Wageningen UR (University & Research centre). http://edepot.wur.nl/292724.
Waste management and circular economy: Building a CGE framework
Introduction
In the EU between 118 and 138 million tons of bio-waste are produced every year, of which about 88 million tons are municipal waste. It is projected to increase on average by 15% by 2030. The reuse, recycling and use of bio-waste for materials, chemicals, energy and animal feed can contribute to more sustainable, efficient and
integrated bio-based economy. Finding a sustainable way of dealing with especially municipal solid waste is a challenge. According to the Waste Framework Directive (2008/98/EC) a sound waste management system must following the so-called “waste hierarchy” (art 4(1)): Prevention, Preparing for re-use, Recycling, Other recovery, Disposal.
The implementation of waste in CGE models is not yet a default option. In Rutten et al. (2013), food waste reduction by consumers is incorporated via a taste shifter, assuming that households who reduce their food waste need to consume less food to maintain the same utility level as before. However to analyze the use of municipal solid waste within the bio-economy and to explore the possibilities of a truly circular system further steps are needed. In this paper we adjust the Computable General Equilibrium neoclassical model known as the Modular Applied GeNeral Equilibrium Tool (MAGNET) to include municipal solid waste from cradle to grave by focusing on all different steps from waste generation, to collection to treatment and reuse of recovered materials.
Model development
Municipal solid waste is introduced in the MAGNET model as a margin commodity which is produced by households and is linked to consumption of products. Consumption of a commodity can lead to one or more of the 5 types of waste. Depending on the type of waste generated different collection and treatment options are available. Figure 1 gives the schematic implementation of waste generation and treatment in the model.
Figure 1 Demand structure for waste collection and management services in MAGNET
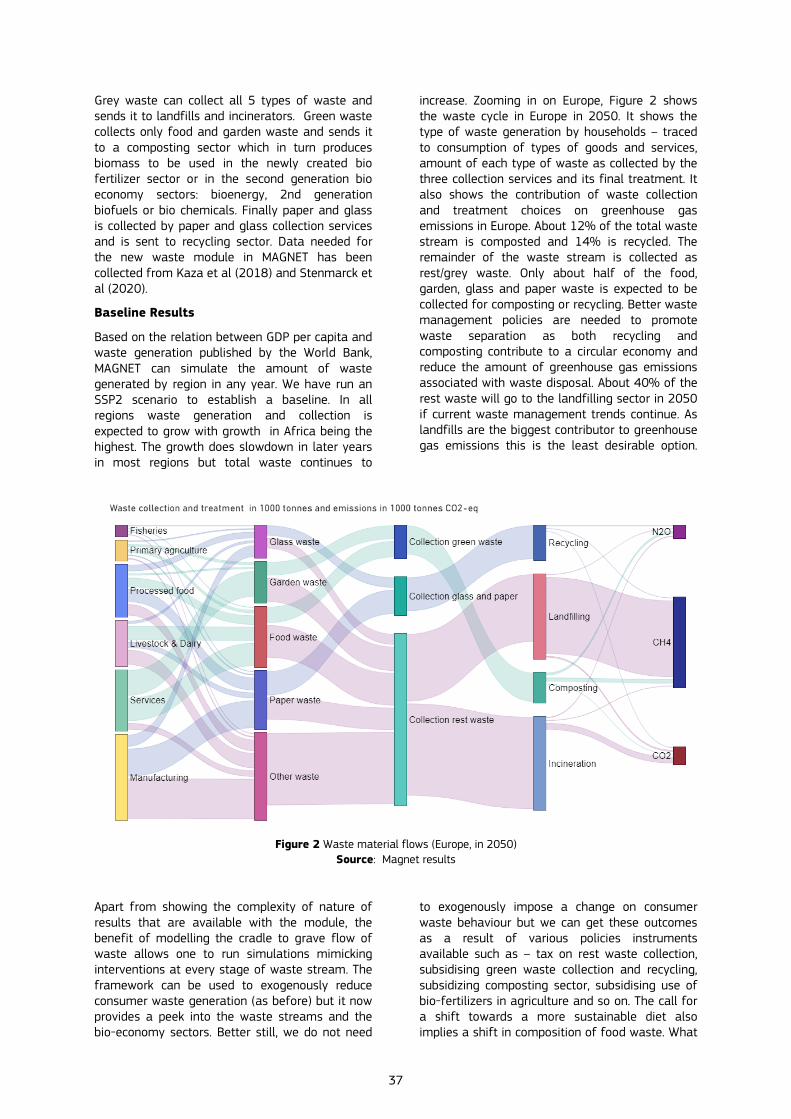
37
Grey waste can collect all 5 types of waste and sends it to landfills and incinerators. Green waste collects only food and garden waste and sends it to a composting sector which in turn produces biomass to be used in the newly created bio fertilizer sector or in the second generation bio economy sectors: bioenergy, 2nd generation biofuels or bio chemicals. Finally paper and glass is collected by paper and glass collection services and is sent to recycling sector. Data needed for the new waste module in MAGNET has been collected from Kaza et al (2018) and Stenmarck et al (2020).
Baseline Results
Based on the relation between GDP per capita and waste generation published by the World Bank, MAGNET can simulate the amount of waste generated by region in any year. We have run an SSP2 scenario to establish a baseline. In all regions waste generation and collection is expected to grow with growth in Africa being the highest. The growth does slowdown in later years in most regions but total waste continues to
increase. Zooming in on Europe, Figure 2 shows the waste cycle in Europe in 2050. It shows the type of waste generation by households – traced to consumption of types of goods and services, amount of each type of waste as collected by the three collection services and its final treatment. It also shows the contribution of waste collection and treatment choices on greenhouse gas emissions in Europe. About 12% of the total waste stream is composted and 14% is recycled. The remainder of the waste stream is collected as rest/grey waste. Only about half of the food, garden, glass and paper waste is expected to be collected for composting or recycling. Better waste management policies are needed to promote waste separation as both recycling and composting contribute to a circular economy and reduce the amount of greenhouse gas emissions associated with waste disposal. About 40% of the rest waste will go to the landfilling sector in 2050 if current waste management trends continue. As landfills are the biggest contributor to greenhouse gas emissions this is the least desirable option.
Figure 2 Waste material flows (Europe, in 2050) Source: Magnet results
Apart from showing the complexity of nature of results that are available with the module, the benefit of modelling the cradle to grave flow of waste allows one to run simulations mimicking interventions at every stage of waste stream. The framework can be used to exogenously reduce consumer waste generation (as before) but it now provides a peek into the waste streams and the bio-economy sectors. Better still, we do not need
to exogenously impose a change on consumer waste behaviour but we can get these outcomes as a result of various policies instruments available such as – tax on rest waste collection, subsidising green waste collection and recycling, subsidizing composting sector, subsidising use of bio-fertilizers in agriculture and so on. The call for a shift towards a more sustainable diet also implies a shift in composition of food waste. What

38
this means for emissions, biobased sectors and trade-offs in SDG terms can be evaluated using this framework.
References
Kaza, Silpa; Yao, Lisa C.; Bhada-Tata, Perinaz; Van Woerden, Frank. (2018) What a Waste 2.0 : A Global Snapshot of Solid Waste Management to 2050. Urban Development;. Washington, DC: World Bank
Stenmarck, A. C. Jensen T. Quested, G. Moates (2020) Estimates of European food waste levels. Report Fusions project.
Rutten, M., Nowicki, P., Bogaardt, M.J. & Aramyan, L. (2013). Reducing food waste by households and in retail in the EU. Wageningen, The Netherlands: LEI Report 2013-035, LEI Wageningen UR (University and Research Centre). http://edepot.wur.nl/290135
Combining ecosystem and biodiversity models for air pollution impact assessment
Thomas, Dirnböck, Environment Agency Austria Maria Holmberg, Martin Forsius, Finnish Environment Institute Maximilian Posch, International Institute for Applied Systems Analysis (IIASA)
Anthropogenic emissions of nitrogen (N) and sulphur (S) compounds and their long-range transport have caused interacting and widespread impacts on ecosystems and biodiversity. The accomplished decrease in S emissions is one of the great “success stories” in environmental protection. However, N deposition effects are still widespread in Europe so that reducing emissions to achieve reasonable success with legislations such as the EU National Emission Ceilings Directive is pivotal. The predominantly used concept to account for air pollution effects in ecosystems are critical loads (CLs), which represent the maximum deposition an ecosystem can endure without long-term harmful effects. Testing this concept with real-world data from long-term ecosystem monitoring stations and, subsequently, further developing the related methods is a key task of the various working groups related to the UNECE Air Convention (Convention on Long-range Transboundary Air Pollution, CLRTAP). In a series of studies, we fed emission and climate scenario data into coupled soil-plant impact models to estimate likely successes of current policy regulations and to derive recommendations towards the use of CLs. The studied forest sites, which are part of
Convention’s monitoring networks and the European Research Infrastructure eLTER, covered a large gradient of deposition loads, climatic conditions and sensitivity to deposition impacts of ecosystems in Europe.
The long-term data confirmed the positive effects of emission reduction measures on forest ecosystems in Europe. The main trends were a decrease in the S and N deposition to ecosystem and, consequently, lower N contamination in the runoff water of forested catchments [1]. Notwithstanding these successes, the model-based impact scenarios give a mixed picture. Future soil conditions regarding acidity, buffer capacity, and nutrient status will likely further improve under projected decreases in S and N deposition and current climate conditions [2]. In contrast, our scenarios also show that additional reductions in N emissions than currently legislated would be needed to allow recovery of forest plant vegetation from effects of N deposition during the coming decades [3]. These studies clearly provided evidence on the link between the deposition exceedance of CLs and empirical impacts [4]. Bridging concepts such as critical loads based on empirical data and models were essential for the understanding and scientific legitimacy of the policy measures developed under CLRTAP.
References
1. Vuorenmaa, J.; Augustaitis, A.; Beudert, B.; Bochenek, W.;Clarke, N.; Wit, H.A. de; Dirnböck, T.; Frey, J.; Hakola, H.;Kleemola, S.; et al. Long-term changes (1990–2015) in theatmospheric deposition and runoff water chemistry ofsulphate, inorganic nitrogen and acidity for forestedcatchments in Europe in relation to changes in emissions andhydrometeorological conditions. Science of The TotalEnvironment 2018, 625, 1129–1145,doi:10.1016/j.scitotenv.2017.12.245.
2. Holmberg, M.; Aherne, J.; Austnes, K.; Beloica, J.; Marco, A. de;Dirnböck, T.; Fornasier, M.F.; Goergen, K.; Futter, M.; Lindroos, A.-J.; et al. Modelling study of soil C, N and pH response to airpollution and climate change using European LTER siteobservations. Science of The Total Environment 2018, 640-641, 387–399, doi:10.1016/j.scitotenv.2018.05.299.
3. Dirnböck, T.; Pröll, G.; Austnes, K.; Beloica, J.; Beudert, B.;Canullo, R.; Marco, A. de; Fornasier, M.F.; Futter, M.; Georgen, K.;et al. Currently legislated decreases in nitrogen deposition willyield only limited plant species recovery in European forests.Environmental Research Letters 2018, 13, 125010, doi:10.1088/1748-9326/aaf26b.
4. Forsius, M.; Posch, M.; Holmberg, M.; Vuorenmaa, J.;Kleemola, S.; Augustaitis, A.; Beudert, B.; Bochenek, W.; Clarke,N.; Wit, H.A. de; et al. Assessing critical load exceedances andecosystem impacts of anthropogenic nitrogen and sulphurdeposition at unmanaged forested catchments in Europe. TheScience of the Total Environment 2021, 753, 141791,doi:10.1016/j.scitotenv.2020.141791.

39
Transdisciplinary modelling for the identification of sustainable grassland management strategies under climate change
Andrea Kaim, University of Bayreuth, Professorship of Ecological Services Carolin Boos, Karlsruhe Institute of Technology, Institute for Meteorology and Climate Research Thomas M. Schmitt, University of Bayreuth, Professorship of Ecological Services Ralf Kiese, Karlsruhe Institute of Technology, Institute for Meteorology and Climate Research, Thomas Koellner, University of Bayreuth, Professorship of Ecological Services
Introduction
Grasslands cover more than a third of the European Union’s (EU) agriculturally used area. Next to being a hotspot for biodiversity, they provide important ecosystem services (ES), e.g. fodder production, carbon sequestration, erosion regulation or recreation. However, grassland ecosystems are threatened due to land-use intensification, land abandonment, and conversion to cropland. Additionally, the impact of climate change on the productivity of grasslands may be positive (e.g. warming of colder areas) as well as negative (e.g. droughts in warmer areas).
Although in the EU, grassland conversion is generally forbidden and the German fertilization ordinance limits the application of organic fertilizers to 170 kgN/ha, still, one of the main challenges is the identification of sustainable grassland management strategies that guarantee the long-term provisioning of important ES under climate change. In this context, it is necessary to consider both biophysical interrelations and factors that influence human behaviour, i.e. those that drive farmer’s decisions on grassland fertilization management. The project SUSALPS (Sustainable use of alpine and pre-alpine grassland soils in a changing climate) addresses this problem by developing a transdisciplinary model that accounts for biophysical as well as socioeconomic factors simulating the effect of climate change and organic N fertilization on ES.
Methods
For this purpose, two sub-models – an agent-based socioeconomic model and a bio-geochemical model – were coupled. The agent-based model calculates the amount of available organic fertilizer based on cattle numbers, and the field-specific N requirement using remote sensing data on cutting events and soil data. Following restrictions, e.g. due to the German fertilization ordinance, water/nature protection zones and agri-environmental schemes, organic fertilizer is distributed on the fields according to their individual N requirements (Fig. 1). The model also includes simple rules for trading organic fertilizer among neighbouring farms. The amount of applied fertilizer and cutting regimes serve as input for the bio-geochemical model (LandscapeDNDC), which determines their effect on selected biophysical variables (e.g. yield, C/N dynamics, N losses) that can be translated into ES performances (e.g. fodder production, carbon sequestration, water quality regulation). In a multi-year run under different climate scenarios, these outputs again affect management decisions (e.g. reduction/increase of cutting events, changes in cattle numbers). Further, modelling output includes estimations of achieved economic yields based on contribution margins for grassland.
Results & Discussion
The model has been applied to a (pre-)alpine case study in Southern Bavaria, Germany (Fig. 1) – an area with a large proportion of permanent grasslands that are mainly used for dairy production. First results show that for the status quo, N requirement of modelled grasslands does not exceed the maximum allowed amount of organic fertilization (i.e. 170 kgN/ha) and can be covered by available organic fertilizer from cattle farming. However, due to climate change, grassland productivity increases in specific areas opening up the potential of careful intensification and allowing the reduction of management intensity at other sites.

40
Figure 1: The Ammer area in southern Bavaria, Germany (left map) serves as case study. Preliminary results (right map, anonymized) show the distribution of organic fertilizer per ha field area for cropland (crop.) and modelled grassland
(grass)
Although the model has been refined based on expert interviews, the representation of cattle grazing needs to be improved which is one of the objectives of the next project phase. Further, the calculation of contribution margins can only be considered as a rough approximation since fluctuations in future world market prices are unknown. Nevertheless, since they serve only as output variable, their calculation does not have any influence on other modelling results.
Conclusion & Outlook
The model can be used to analyse the effect of different scenarios (e.g. climate, high/low management intensity) on grassland ES. Additionally, innovative policy measures could be tested (e.g. changes in the fertilization ordinance, extension of protection zones). By explicitly taking into account ES that go beyond a pure analysis of food production (i.e. agricultural yield) and factors that influence farmer’s decision-making, the model follows a more holistic approach. Together with the strong focus on stakeholder integration,
this can help identifying policy-relevant management options that are suitable for real-world implementation. Further, it provides an example of how a socioeconomic agent-based model can be coupled with biophysical models in order to consider the multiple facets of land management within a single modelling framework.
We will apply the model to two more study areas in Bavaria with increasing level of management intensity and different landscape characteristics (i.e. lower altitudes, higher share of cropland). The representation of this landscape gradient will serve to draw conclusions about regionally adapted grassland management practices.
Next to further model refinement, we are planning to conduct a stakeholder workshop for the validation of the model and the identification of potential policy measures based on modelling results. The results of the project will be synthesized in policy briefs and a decision-support tool for farmers in terms of an application which will also help communicating modelling results.

41
Socio-economic impacts of ambitious GHG reduction targets: Combining input-output data with energy technology representation
Christian Lutz, Maximilian Banning, Lisa Becker, Markus Flaute, Gesellschaft für Wirtschaftliche Strukturforschung (GWS) mbH, Osnabrück, Germany
GINFORS-E (https://web.jrc.ec.europa.eu/policy-model-inventory/#factsheet/model/1123) is a global model that it is designed for assessments of economic, energy, climate and environmental policies up to the year 2050. It is a bilateral world trade model based on OECD data, which consistently and coherently models exports and imports of 25 goods groups for 64 countries and one ‘rest of the world' region. All EU-27 countries, additional European economies and international major trade partners are explicitly modeled. It incorporates a macro-model, consisting of exports and imports, other core components of final demand (private and public sector consumption and investment), markets for goods and the labour market, for each country. The models are also divided into 36 goods categories in accordance with the latest OECD internationally harmonised input-output (IO) tables. For every country OECD bilateral trade data on industry level is linked to the IO tables. GINFORS_E is a macroeconometric model, which builds on Post-Keynesian theory. Many parameters used in the model equations are econometrically estimated based on time-series data. Agents have myopic expectations and follow behavioural routines of the past. Markets are not assumed to be cleared. The model solves annually.
Each national model is linked to an energy model, which determines energy conversion, energy generation and final demand for energy for 19 energy sources disaggregated by economic sector based on IEA energy balances. Energy-related CO2 emissions are linked to energy use. The model considers technological trends and price dependencies. One module maps agriculture in detail.
The model is enlarged by explicit information on 14 different energy technologies such as PV, wind, E-mobility and hydrogen, that can reduce GHGemissions, in a project funded by the GermanMinistry of Economic Affairs and Energy. The ideais to better represent intermediate inputs andvalue added related to these energy technologies.This representation builds on a literature review ofenergy technology reports such as IEA EnergyTechnology Perspectives (2020a), JRC, EC (2020)and IRENA, and collection of data on the coststructures of these energy technologies (see e.g.O’Sullivan, Edler 2020) and expecteddevelopments over time.
Two scenarios are calculated with the GINFORS-E model with and without this additional energy technology information. The first is an NDC scenario as a baseline, in which major economies as EU, US and China reach their Nationally Determined GHG reduction targets until 2030 as reported to UNFCCC until summer 2020. The second scenarios build on the Sustainable Development Scenario of the IEA (2020b) World energy Outlook, that ensures to meet the 2° target. Various policy measures are simplified by means of carbon prices, which are uniform for different groups of countries.
By comparing the socio-economic impacts of the more ambitious 2° target scenarios with the respective baselines in 2030, we show the differences due to explicit technology modelling. Results focus on GDP and labor market effects but can also look at changes on the industry level regarding production, prices, international trade, and jobs. Explicit technology coverage will improve modelling of energy and climate mitigation policies.
References
European Commission (2020): Clean energy transition – technologies and innovations. Commission staff working document, SWD(2020) 953 final, Brussels.
International Energy Agency (2020a): Energy Technology Perspectives 2020, Paris.
International Energy Agency (2020b): World Energy Outlook 2020, Paris.
O’Sullivan, M. & Edler, D. (2020): Gross Employment Effects in the Renewable Energy Industry in Germany – An Input-Output Analysis from 2000 to 2018. Sustainability 12(15), 6163. https://doi.org/10.3390/su12156163
Long-term economic impacts of coastal floods in Europe
Ignazio Mongelli, Juan-Carlos Ciscar, Michalis Vousdoukas, Luc Feyen, Antonio, Soria, Joint Research Centre, European Commission
Storm surges and coastal inundations are among the most threatening climate change hazards. Europe is a highly exposed region because of its 68,000 km of coasts, where around 40% of the overall population live. A recent study indicate that by mid-century the recurrence intervals for large disruptive events could become increasingly shorter (Vousdoukas 2017).
The direct consequences of larger and more frequent inundations, like for example damages to physical assets, will generate economic impacts well beyond the initial direct losses, as they affect the drivers of economic growth, like the dynamic process of physical assets accumulation, which ultimately relies on the financial resources
42
available for investments. Therefore, in addition to the market value of the direct lost or damaged assets, a complete assessment of the economic losses of inundations should also include the value of the production lost due to a lower availability of capital per worker and how this interferes with the dynamic process of economic growth.
We analyse the long-term economic implications of the loss of physical assets, damage to residential properties and forgone agriculture production, caused by the sea level rise related inundations occurring along the European coastline. These economic losses, which are projected for a high emissions scenario (RCP8.5), are then analysed with a Solow-type growth model aligned to the official demographic and economic projections available for the EU Member States until 2100 (Solow, 1956; European Commission, 2017). The model has also been extended with a sort of rule of thumb to determine whether a particular country has a sufficient capacity of recovery and reconstruction after being hit by a severe sea level rise event. A baseline scenario, where the recovery capacity is kept unlimited, is compared with a scenario where the recovery/reconstruction capability is calibrated on the basis of available information on previous flood related economic loss occurred in Europe. Moreover, we account for the possibility that the productive assets replaced after the inundation embody a newer technology and, therefore, boost the overall economy’s productivity.
The model is used to analyse six scenarios that differ mainly by the way the damages to residential properties are repaired: either via consumption, which are referred to as the Consumption scenarios, or by reduction in savings, i.e. the Savings scenarios.
In the Consumption scenario we assume that all damages to building are repaired without increasing the overall expenditure level, but with a reshuffling of the consumption between the various consumption categories. On the contrary, in the scenarios named Savings, the damages to buildings are repaired with an increase of the level of overall consumption, financed with a decrease in savings. While in the Consumption scenario the households’ welfare level (identified as the consumption level minus the reparation expenses) is directly affected, in the Savings scenario the level of welfare remains unchanged (as overall consumption is constant), but with lower financial resources available for the renovation and deployment of the existing stock of physical assets for the production process. Four additional scenarios are derived by making different assumptions about the reconstruction process and the technology embodied in the new installed assets. In particular, we assume that each euro spent for reconstruction upgrade the level of productivity of the economy to the European frontier, i.e. best three performing countries. Moreover, because of institutional rigidities or logistic difficulties the amount of investments that can be mobilised for the replacement of the damaged productive assets are not unlimited, but equal to 0.03% of total investments.
Our estimates indicate that the overall economic loss for EU countries plus UK and Norway could reach around 0.56% of GDP in the worst-case scenario, compared to the baseline. For what concerns welfare, the largest losses are estimated to be around 0.11% of GDP in 2080.

43
Keynote 3
24 November
09:30 – 10:50
44
Modelling tools for policy support in (real) time of crisis
Alain de Serres, Deputy Director, Policy Studies Branch, OECD Economics Department
Over the past several years, OECD research on the sources of the widespread productivity slowdown has highlighted the importance of analysing firm-level performance to fully understand the dynamics of productivity and the main channels through which policies can affect aggregate outcome. As an illustration, the research has revealed that one factor behind the slowdown has been the growing gap in the productivity performance between firms at the global frontier (top 5% of firms at the global level) versus the rest of the firms. The high degree of heterogeneity in performance across firms -- even within narrowly defined industries -- also means that the efficiency of reallocation from low- to high-productivity firms potentially has a large impact on aggregate productivity growth, along with within-firm productivity growth and business dynamism (entry and exit). The extent to which resource reallocation across firms is productivity-enhancing depends in turn on the strength of market competition and selection, which can both vary across countries according to differences in policy settings and other structural characteristics.
Against this background, the COVID-19 crisis has potentially strong implications for the strength of the link between reallocation and productivity given the nature and amplitude of the shock as well as the policy response. The reallocation process could in this case have either cleansing or scarring effects. Under the cleansing hypothesis, recessions foster productivity by accelerating the Schumpeterian process of creative-destruction and by granting an advantage to the most efficient firms. In the context of COVID-19, high-productivity firms – due for instance to their superior managerial practices – could more effectively accommodate teleworking and adapt
their business models to social distancing, enabling them to capitalise on new growth opportunities and expand at the expense of low productive firms. Under the scarring hypothesis, the pandemic was a health shock that was truly exogenous to pre-crisis firm performance and the collapse in mobility that followed – a function of both fear and arbitrary lockdowns – affected all firms, regardless of their productivity. In such a case, financial constraints and fragilities at the time the shock hit, rather than productivity, drives firms’ growth and exit, distorting market selection and generating a “counter-productive”destruction.
The presentation will focus on two approaches recently taken at the OECD to provide timely evidence on the impact of COVID-19 on the strength of the reallocation-productivity link and the role of policy support measures such as loan guarantees and job retention schemes. One, indirect approach, is based on simulations of an accounting model, which combines a large cross-country firm-level dataset providing balance-sheet data on firms worldwide just prior to the pandemic, with a detailed sectoral shock to proxy the decline in economic activity associated with the COVID-19 outbreak. A second, more direct approach, takes advantage of the growing availability of real time data to explore how workforce adjustments (and firm exit) since early 2020 are connected to firm-level labour productivity, controlling for differences in the shock across regions, industries and relevant firm-level characteristics. The two approaches allow for shedding light on the productivity-enhancing impact of reallocation before and after COVID-19, and on the benefits and risks associated with some of the main policy measures used to support businesses at the onset of the crisis. The presentation will highlight limitations of the respective approaches and the scope for more sophisticated models to address some of the questions.
.
45
Session 4
Modelling complex systems for policy
24 November
11:00 – 12:45
46
Effects of the Border Tax Adjustment in the EU until 2030
Maciej Pyrka, Jakub Boratyński, Izabela Tobiasz, Robert Jeszke, The National Centre for Emissions Management (KOBiZE)
With relation increasing EU climate policy ambition and to raising the EU GHG emission reduction targets by 2030 to 55% compared with the 1990 level and also to attain climate neutrality by 2050, consideration should be given to the implementation of new measures to protect the EU sectors against loss of competitiveness and carbon leakage such as CBAM (Carbon Border Adjustment Mechanism).
The analysis used the GHG55 scenario assuming that the GHG emission reduction target will grow to 55% in 2030 compared with the 1990 level and the BTA (border tax adjustment) scenario assuming the implementation of a GHG emissions-related border tax adjustment for products imported into the EU. The border tax adjustment covers the imports into the EU from the EU ETS sectors. The implementation of the border tax adjustment would cause an increase in the prices of products imported from the countries outside the EU in the sectors covered by the adjustment and,
at the same time, a decline in the value of imports.
The analysis was prepared as part of the LIFE Climate CAKE PL project (title of the analysis: The effects of the implementation of the border tax adjustment in the context of more stringent EU climate policy until 2030), the computable general equilibrium (CGE) model, which enables the assessment of the effects of implementing such a mechanism on the economies of the EU countries. The CGE model called CREAM (Carbon Regulation Emission Assessment Model) in its static version was used to analyse the effects of the introduction of the border tax adjustment. This model is a global, multi-sectoral tool with 35 regions (21 Member States and the region of the Baltic States) and 31 sectors (10 of which are sectors covered by the EU ETS scheme). Greenhouse gas emissions are modelled at high detail. Emissions originating from fuel combustion and process emissions are modelled separately. Likewise, uses and supplies of major fossil fuels are modelled explicitly. The model also contains information on the supply of emission allowances on the EU ETS market. For non-ETS sectors, annual national reduction paths have been set to achieve emission reduction targets.
The parameters of the CGE model of key importance for the assessment of the effects of the introduction of the border tax adjustment were the substitution elasticities which describe: (1) the
degree to which the national production can substitute for imported goods, and (2) the degree to which the products imported from different sources (countries) can be substituted for. In the CREAM model, the elasticities were adopted from the GEM-E3 model.
The results of the analysis indicate an increase in the prices of imports into the EU. According to the projection, the prices of imported goods in the sectors covered by the border tax adjustment would be higher by about 1.6% on average in 2030. An increase in the prices of imported goods to the EU would cause a change in the value of imports by about -3.4% in the sectors covered by the border tax adjustment. The changes in imports to the EU would be the largest in the sector of ferrous metals, by -11.6%. Although imports would grow in some of the sectors which are not covered by the border tax adjustment (e.g. manufacturing); however, in overall terms, the total change in imports into the EU from the other regions of the world would be about – 0.5% and it will be fairly differentiated among EU Member States.
As the result of an increase in the prices of goods manufactured in the EU, the prices of goods exported from the EU to the other regions of the world will grow. The prices of export goods in the sectors covered by the border tax adjustment would grow by about 2%. The increase would be the largest in the sector of ferrous metals, by 0.4%. The value of exports from the EU in the sectors covered by the border tax adjustment would be -1.1%. The introduction of the border tax adjustment would also cause an increase in the output in the sectors covered by that adjustment by 0.4%.
An exception would be sector of ferrous metals in Bulgaria and the Baltic States, where the output would noticeably change by about -2%. Results also demonstrate that the change of the location of production and the intensity of trade between the EU and the other regions caused by the implementation of the border tax adjustment contribute to reducing the global emissions by about 24 Mt CO2eq. Moreover, according to the projection, the additional effort to be taken in 2030 in the EU by all the sectors covered by the EU ETS (after the GHG emission reduction target has been raised to 55%) will amount to about 200 Mt CO2.
The border tax adjustment is a form of protection of industry in the EU area and in the longer term it may lead to less effective use of resources (capital and labour). Taking this into account, a thesis can be put forth that a different form of action to prevent carbon leakage, e.g. one based on the promotion and development of other ETS
47
schemes outside the EU could bring better effects in the long run.
Results of the analysis were used to support public consultation of the European Commission about CBAM (Contribution ID: 6b870e04-420b-4647-8511-623c30775984), which included the most suitable CBAM design and also sectors that should be covered by the CBAM in the pilot phase. Additionally, The EU Recovery Plan foresees that a carbon border adjustment mechanism could bring additional revenues ranging from about EUR 5 billion to EUR 14 billion. According to our analysis– it was estimated around EUR 7.61 billion (USD 10.6 billion) in constant 2011 prices. Furthermore CAKE results also contributed to the position paper of Polish government about implementation of CBAM and also appeared in the public debate about CBAM Additionally, all assumptions and methodology were shown in the report and presented at many international and national conferences.
Quantifying Spillovers of Next Generation EU Investment
Philipp Pfeiffer, Janos Varga, Jan in ‘t Veld, DG Economic and Financial Affairs, European Commission
An unprecedented macroeconomic policy package: The economic fallout of COVID-19 has changed the macroeconomic landscape profoundly. In addition to national stabilisation measures, EU-wide policy has responded with an unprecedented macroeconomic package combining reforms and large-scale public investment. This package, Next Generation EU (NGEU), is at the heart of the EU response to the coronavirus crisis. Financed by issuing a common debt, it is worth up to €750 billion (in 2018 prices; 5.4% of EU GDP in 2019), of which €390 billion will be in the form of grants and the rest in the form of loans.
In macroeconomic terms, NGEU’s investment stimulus is a unique coordinated fiscal expansion across the EU. Thus, fiscal spillovers are central for the assessment of its macro effects. However, economic analysis and policy commentaries often focus on effects in a given country without considering the beneficial effects of investment plans in the other Member States. The national Recovery and Resilience Plans (RRPs), submitted to the European Commission, only assess the domestic impact of the national plans and exclude cross border spillover effects. While warranted for the national RRPs, this perspective overlooks potentially large spillovers given the strong trade linkages in the EU and the euro area. Similarly, the debate on the cross-country allocation of NGEU
predominantly focussed on national envelopes, not the broader macroeconomic impacts. In particular, it has often ignored cross border spillover effects, which, in deeply integrated European economies, can be substantial. The need for a large model capturing spillover effects with detailed trade structures also brings about methodological challenges.
Modelling approach: Our paper’s goal is to shed light on these policy issues. The starting point of our analysis is the Commission’s QUEST model. We extend this model along three dimensions. First, public investment dynamics in our model account for implementation and time-to-build delays, e.g. related to contracting time, planning horizons and construction time. Second, we embed this augmented model into a multi-country structure designed for spillover analysis. Rich trade linkages and financial markets connect each of the 27 EU Member States and the rest of the world. In particular, a detailed empirical trade matrix covering both goods and services trade explicitly accounts for bilateral trade linkages of all regions. Unlike most models, which counterfactually include only trade in final goods, we explicitly model trade in intermediate inputs. This approach helps to account for highly integrated cross border value chains. Finally, we extend the fiscal part with the main stylised features of NGEU: grant allocations, favourable loan conditions and new debt issued by the EU. As a result, our analysis combines attractive features of a dynamic model for fiscal policy analysis with detailed cross border linkages, typically only exploited in static input-output analysis.
Key results: We apply this novel framework to quantify the macroeconomic spillover of NGEU investments, a key aspect in the ongoing policy debate. Our main finding is that macroeconomic spillovers are at the heart of NGEU’s large macroeconomic impact. For a fast spending scenario, we find that real GDP in the EU-27 can be around 1.5% higher than without NGEU investments. Importantly, spillover effects of foreign-induced demand and exchange rate effects account for around one third of the total impact. A simple aggregation of individual effects of the national investment plans would thus substantially underestimate the growth effects of NGEU. Additional model simulations help deal with the considerable uncertainty surrounding the macroeconomic effects of NGEU. For example, we quantify alternative assumptions on the productivity effects of the investment stimulus, the monetary policy reaction, and the speed of disbursement of the EU funds.
Decomposing GDP effects into direct effects and spillovers also reveals strikingly different patterns across MS. For small open economies with smaller
48
grant allocations, spillover effects account for the bulk of the GDP impact. In some cases, such as Luxemburg and Ireland, positive spillovers explain almost all the total impact. Even for larger economies with deep trade integration, such as Germany, spillover accounts for more than half of the GDP effect. By contrast, given their larger NGEU allocations and rather closed economies, domestic effects typically dominate in countries such as Bulgaria, Croatia, Greece and Italy.
Policy relevance: The detailed simulation results for each MS have appeared in the Commission’s assessment of national RRPs and informed policymakers and citizens. At the same time, the rigorous spillover analysis with a state-of-the-art model puts the gains from economic coordination at the centre stage, contributing to the broader debate on one of the most important economic programmes in the EU’s history.
Agent-based modeling for ex-ante policy evaluation: The establishment of Renewable Energy Communities
Giulia Chersoni, Eurac Research, Institute for Renewable Energy and Department of Economics and Statistics, University of Turin
Background
The Clean Energy for all Europeans Package puts citizens at the centre of the Energy Union, urging them to actively take part in the clean energy transition. In this context, Renewable Energy Communities (RECs) can drive the energy system transformation from the bottom-up, entailing new roles for local communities in the ownership and governance of the energy system (Van Der Schoor et al., 2016).
The REDII Directive [1] empowers RECs to produce, consume, store, and sell renewable energy (RE). They can help to bridge the RE investment gap to meet the global climate objectives, making it easier to attract private investments, supporting RE deployment and acceptance, increasing the flexibility and security of the market, and creating socio-economic benefits for the community (IRENA, 2021). However, in the development phase, RECs are more vulnerable to regulatory risks due to ineffective and uncertain policy support schemes (Flor et al., 2014), and their profitability is affected by the electricity market related characteristics.
Enabling policy mechanisms should take into account the specific requirements for local participation, to design ad-hoc regulatory, financing and administrative solutions. In the policy design stage, models for ex-ante policy
assessment help to shed light on the dynamics and uncertainties involved (Van Daalen et al., 2002). They can function as tools to allow policymakers to explore different policies in virtual `laboratories' and generate an understanding of the policy domain (Gilbert et al., 2018). Complex systems modelling can be used in policy design processes, highlighting the uncertainties related to human behaviors (Arthur, 2021), and the framing assumptions used (Stirling, 2010). The complex system approach leads to probabilistic statement about the trajectories that the system might follow, instead of predictions, avoiding the over-reliance on average and most likely outcomes (Jager and Edmonds, 2015).
Method
An agent-based model (Tesfatsion and Judd, 2006) is developed to simulate the establishment of a REC in the form of an energy cooperative, which allows individuals to share the costs, risks and responsibilities of capital-intensive RE projects in a democratic way, ensuring ownership and control of their energy assets (Caramizaru and Uihlein, 2020). Private consumers may decide to jointly invest and own a large-scale PV plant, to locally consume and share the produced electricity. The analysis leaves aside the aspect of complete autarky, assuming grid connection, and storage.
The model studies a population of heterogeneous agents that at the beginning of the simulation act as consumers satisfying their demand for energy through a general provider and that can decide to jointly contribute to finance the RE investment in their neighboring area This second option requires a cooperation effort among households in order to form a coalition of consumers (Pasimeni and Ciarli, 2018). The driving force of REC establishment is the individual interest to reach a higher utility and a cost reduction in terms of reduced electricity bills, reduced network connection fee, and remuneration of the surplus injected into the grid. To collectively invent in a REC individuals interact by word-of-mouth information sharing, which depends on the structure of neighboring relationship.
The sequential game of coalition formation starts with a random number of agents that act as eco-innovators, needed for the uptake of the diffusion process (Rogers, 2010), the driving forces for the establishment of RECs (Sperling, 2017). Agents become aware of the opportunity to make the common investment when contacted by an eco-innovator, but can form new links only when their level of awareness reaches a minimum threshold, which increases with the share of agents joining the community project (Faber et al., 2010). Agents' behavior is affected by other decisions, and the

49
network structure evolves over time allowing the formation of new links.
Individuals decide to invest or not in the community project if their utility in coalition (i.e. electricity from REC) is higher then the one obtain in isolation (i.e electricity from general provider). The utility levels depend on individual consumption profile, individual income, electricity prices and cost of electricity bill. To finance the community investment agents choose the individual contribution that maximise their utility in coalition. The common investment is financed if the sum of monetary contributions cover REC investment cost.
Once a REC is established, the way in which the financial gains are shared impacts the stability of the project in the long-run. The model analyzes and tests RECs stability using the marginal allocation rule, which gives a share of the whole value of PV generation proportional to each member marginal contribution: households consuming during PV production generates more value as they increase self-consumption levels and therefore will receive more then the others (Tounquet, 2019).
The representation of key dynamic mechanisms in the system evolution, along with explicit representation of one or more policy interventions in the different REC development stages, allows the use of the model for ex-ante policy evaluation. This is implemented by changing the parameters of the model and observing the relative outcomes, which can aid the design of policy interventions in different ways (Hammond, 2015). It permits to understand intended and unintended consequences of the interventions, to detect unnoticed opportunities by identifying leverage points induced by small shifts generated by the policy intervention (i.e. tipping points), to identify potential trade-offs or synergies between multiple policy interventions, and to elucidate how an intervention might be scaled, its effects on different contexts, or its play out in the long term. The model is not built to make point predictions, but serves to explore what might happen under a range of possible potential scenarios (Gilbert et al., 2018).
Conclusions
The aim of the present study is to develop an agent-based model to simulate the different stages for RECs establishment and to test different policy interventions for their uptake around the EU. The heterogeneity of the socio-economic and cultural conditions in each MSs entails different barriers for the engagement of citizens (Massey et al., 2018). To account for this variability, the model can be calibrated using different empirical variables (Van Daalen et al.,
2002). To increase the model usability an interactive user interface might be developed to allow policy makers to experiment with and learn from different model settings, enabling to use the model for scenario development. The use of sound modeling principles (Grimm et al., 2005), adequate calibration and validation techniques will ensure the model replicability.
References
[1] European Union. DIRECTIVE (EU) 2018/2001 OF THEEUROPEAN PARLIAMENT AND OF THE COUNCIL of 11December 2018 on the promotion of the use of energy fromrenewable sources (recast) (Text with EEA relevance). 2018https://eur-lex.europa.eu/legal-content/EN/TXT/PDF/?uri=CELEX:32018L2001&from=EN
Arthur, W. B. (2021). Foundations of complexity economics. Nature Reviews Physics, 3(2):136{145.
Caramizaru, A. and Uihlein, A. (2020). Energy communities: an overview of energy and social innovation. Publications Offce of the European Union.
Faber, A., Valente, M., and Janssen, P. (2010). Exploring domestic micro-cogeneration in the Netherlands: an agent-based demand model for technology diffusion. Energy Policy, 38(6):2763{2775.
Flor, A., Rick, B., Niki, F., Sanne, A., Philip, B., Jesse, H., Geerte, P., Bonno, P., Daniel, S., and Julia, W. (2014). The (self) governance of community energy: Challenges & prospects. Dutch Research Institute for Transitions (DRIFT).
Gilbert, N., Ahrweiler, P., Barbrook-Johnson, P., Narasimhan, K. P., and Wilkinson, H. (2018). Computational modelling of public policy: Reflections on practice. Journal of Artificial Societies and Social Simulation, 21(1).
Grimm, V., Revilla, E., Berger, U., Jeltsch, F., Mooij, W. M., Railsback, S. F., Thulke, H.-H., Weiner, J., Wiegand, T., and DeAngelis, D. L. (2005). Pattern-oriented modeling of agent-based complex systems: lessons from ecology. science, 310(5750):987{991.
Hammond, R. A. (2015). Considerations and best practices in agent-based modeling to inform policy. In Assessing the use of agent-based models for tobacco regulation. National Academies Press (US).
IRENA (2021). Renewable Capacity Statistics 2021. International Renewable Energy Agency (IRENA).
Jager, W. and Edmonds, B. (2015). Policy making and modelling in a complex world. In Policy practice and digital science, pages 57{73. Springer.
Massey, B., Verma, P., and Khadem, S. (2018). Citizen engagement as a business model for smart energy communities. In 2018 5th International Symposium on Environment-Friendly Energies and Applications (EFEA), pages 1{6. IEEE.
Pasimeni, F. and Ciarli, T. (2018). Diffusion of shared goods in consumer coalitions. an agent-based model. An Agent-Based Model (December 2018). SWPS, 24.
Rogers, E. M. (2010). Diffusion of innovations. Simon and Schuster.
Sperling, K. (2017). How does a pioneer community energy project succeed in practice? the case of the samsø renewable energy island. Renewable and Sustainable Energy Reviews, 71:884{897.
Stirling, A. (2010). Keep it complex. Nature, 468(7327):1029{1031.

50
Tesfatsion, L. and Judd, K. L. (2006). Handbook of computational economics: agent-based computational economics. Elsevier.
Tounquet, F. (2019). Energy communities in the European Union. ASSET Project.
Van Daalen, C. E., Dresen, L., and Janssen, M. A. (2002). The roles of computer models in the environmental policy life cycle. Environmental Science & Policy, 5(3):221{231.
Van Der Schoor, T., Van Lente, H., Scholtens, B., and Peine, A. (2016). Challenging obduracy: How local communities transform the energy system. Energy Research & Social Science, 13:94{105.
Co-dynamics of climate policy stringency and public support
Théo Konc, Stefan Drews, Ivan Savin, Jeroen C.J.M. van den Bergh, Institute of Environmental Science and Technology, UAB, Barcelona, Spain
To mitigate climate change, countries need to implement stringent policies. So far, these policies have proven to be difficult to implement. An important reason is that public support for climate policies is weak (Anderson et al., 2017; Klenert et al., 2018), and moreover tends to decrease with stringency (Beiser-McGrath and Bernauer, 2019). Public opinion affects the feasibility of effective climate policy in various ways: through general elections, illustrated by a repeal of carbon pricing in Australia (Crowley, 2017); through direct referenda, illustrated by rejections of carbon taxes in Washington State (USA) (Reed et al., 2019); and through social movements, illustrated by the 2018 Yellow Vest protests in France against a fuel tax with a carbon component (Douenne and Fabre, 2020).
To achieve sufficiently strong policies that can count on critical public support, we propose a new approach. It treats climate policy design as dynamic and endogenous on policy support. The idea is that a policy can be implemented only if public support for the current design exceeds a critical threshold. Our approach deviates from the conventional economic approach to identify optimal policy trajectories in that welfare impact is not the dominant criterion but only one among several factors that influence policy design (Hänsel et al., 2020; Goulder, 2020). Once policymakers have committed to a climate mitigation goal, their objective is no longer to maximize welfare but to implement effective policies under acceptability constraints, as failing to meet the targets may have legal repercussions or harm a country's international reputation.
We develop a model of the interconnection between public opinion and climate policy
stringency and study the political feasibility of (1) carbon taxation with several revenue use options and (2) efficiency standards. To this end, we combine a general equilibrium model derived from the climate economics literature (Klenert et al., 2018b; Jacobs and van der Ploeg, 2019) with an agent-based model (GE-ABM) to capture the social interactions that underlie opinion dynamics regarding policy support. In each period, the (change in) stringency of the policy depends on the prevailing public opinion, giving rise to interactive dynamics of policy support and policy design. Here we model public opinion as depending on policy performance in terms of economic, environmental and equity impacts. This choice is motivated by earlier empirical studies showing that public acceptability of carbon taxes is mediated by perceptions of effectiveness and fairness (Maestre-Andrés et al., 2019). The model is used to study which policy trajectories and revenue uses allow achieving a predetermined mitigation target while ensuring sufficient public support over time.
While several papers recognize that support for climate policy is dependent on dynamic factors (Drews and Bergh, 2016; Bergquist et al., 2020; Sommer et al., 2020; Douenne and Fabre, 2020), this has not translated into studies that systematically investigate co-dynamics of policy design and support. This is understandable as it requires an integration of policy design, economic impact assessment and public-support analysis, which tend to be studied in separate disciplines. Our GE-ABM allows to represent the labour and goods market in a tractable way while identifying economic impacts on heterogeneous households and providing detailed information about individual support for the policy (Castro et al., 2020; Niamir et al., 2020). This presents a novel approach that enriches the literature on policy acceptability, which traditionally relies on survey and experimental methods (Carattini et al., 2018; Maestre-Andrés et al., 2021; Bechtel et al., 2020; Savin et al., 2020). In addition, we assume that households require a minimal consumption level of the high-carbon good, reflecting the empirical regularity that low-income households spend a larger share of their income on carbon-intensive subsistence goods (Klenert and Mattauch, 2016; Oswald et al., 2020). As a result, carbon taxes absent of revenue recycling, as well as efficiency standards, have regressive distributional impacts, i.e. they place a relatively high burden on low-income households (Levinson, 2018; Pizer andSexton, 2019). However, the use of carbon-taxrevenues can compensate for regressive effects(Grainger and Kolstad, 2010; Klenert andMattauch, 2016; Goulder et al., 2019; Aubert andChiroleu-Assouline, 2019), which has been shownto critically affect public opinion (Beiser-McGrath
51
and Bernauer, 2019; Savin et al., 2020). For this reason, we devote attention to different revenue uses in our analysis and show that the impact of regressive distributional effects on policy acceptability is closely linked to the features of the social network in which agents interact.
Our paper further contributes to the literature studying the interaction between public policy and behavioural economics approaches. Following research in behavioral economics showing that the social environment affects agents' decisions (Elster, 1989; Bowles, 1998; Mailath and Postlewaite, 2010; Hoff and Stiglitz, 2016; Konc and Savin, 2019), we study the role of social influence for the acceptability and implementation of desirable policy instruments. Our model reflects that peer interactions play a significant role to shape political opinion and voting decisions (Bond et al., 2012; Muchnik et al., 2013). We integrate these insights in our study and model the acceptability of climate policies as dependent on the political opinion of socially influenced agents.
Our results indicate that carbon taxation is more likely to achieve a stronger public support than efficiency standards. Unlike standards, carbon taxation generates revenue that can increase public support if it is used to reduce inequality. We argue that because agents are resistant to change their opinion, climate policies should be designed to ensure a high support during the first periods of implementation. We further show that social interactions help generating support for policies that are beneficial for well-connected individuals. Finally, we demonstrate that a higher income inequality has an ambiguous effect on support for progressive climate policies. On the one hand, higher income inequality implies that redistributive policies will have a more positive distributional effect, hence increasing the support for such policies. On the other hand, given that social influence tends to increase with income, higher income inequality means that richer agents increase their influence on the opinion of other agents. Since high-income earners do not benefit from progressive climate policies, income inequality can diminish support for policies with progressive distributional impacts.
Digital Twins for Cities and Regions: Global Challenges, Regional Initiatives, European Approaches
Leyla Kern, High-Performance Computing Center Stuttgart (HLRS), Germany Fabian Dembski, HLRS and Research Professor at Tallinn University of Technology, Estonia Uwe Wössner, HLRS
Models, simulations and other digital tools are becoming increasingly important in a time of rapid change. Europe, its member states are facing complex global challenges that demand strategic and solidarity-based action. This is also in the context of anthropogenic climate change and the COVID-19 pandemic (Klüsener et al. 2020).
Digitalisation has been greatly accelerated by these current crises. While innovation cycles have ever shorter intervals, there are enormous opportunities at the level of planning regulations, processes and methods at local, state and transnational levels of EU members that need to be seized.
Digital twins of cities and regions are tools that can be particularly helpful in this context. They can best be characterised as containers for models, data, algorithms and simulations that describe their physical counterparts and their properties and behaviour in the real world (Dembski et al., 2019). They enable comprehensive data exchange and, through the implementation of high-performance computing (HPC) and other technologies, provide the opportunity to improve processes through simulations and analyses and to integrate data in near real-time and thus also provide forecasts. To achieve goals, digital twins enable iterative evaluation of measures throughout the planning and implementation phase and beyond.
The High-Performance Computing Center Stuttgart is involved in numerous Digital Twin projects and in this context focuses not only on ecological, climatic and functional aspects but also on societal, social, economic and cultural perspectives. Together with Tallinn University of Technology (TalTech), Academy of Architecture and Urban Studies, standardisation initiatives for new layers in digital twins are being targeted. HLRS is involved as a cooperation partner of the pilot project GreenTwins (TalTech and Aalto University within the FinEst Twins Smart City Centre of Excellence).

52
Figure 1: Left: Digital Twin for participatory processes in VR (Kieferle Benk / Hildesheim); Right: Simulation of seasonal change shows effects of the environment to the urban atmosphere (Lauri Lemmenlehti/ GreenTwins)
In current projects and EU Centers of Excellence, such as OpenForecast, GreenTwins and ChEESE, we focus on developing digital planning tools to support the resilience of future cities and regions in the face of global challenges. To this goal, the forecasting of future scenarios and actions is essential, but at the same time highly complex and computationally intensive. This is achieved through simulation, agent-based modelling and algorithms. In this context, highperformance computing, machine learning and - in the near future – quantum computing can support these processes.
Within the project Open Forecast (EU 1566884), high-resolution air quality simulations were developed to predict concentrations of air
pollutants and integrate them into a digital twin of the metropolitan region of Stuttgart, Germany. The forecasting was enabled by processing open data with HPC simulations (Kern et al., 2021).
The GreenTwins pilot (2014-2020.4.01.20-0289) aims at developing sustainable urban solutions. Applied to the use cases of Tallinn and Helsinki, representation of vegetation in urban digital twins is investigated, to combine forecasting of vegetation and visual details in urban ecosystems.
Within the scope of ChEESE (EU 823844), a new Center of Excellence is established to prepare codes for exascale supercomputing in the field of Solid Earth. Computational seismology, earthquake monitoring and tsunami simulations are considered to reach this goal.
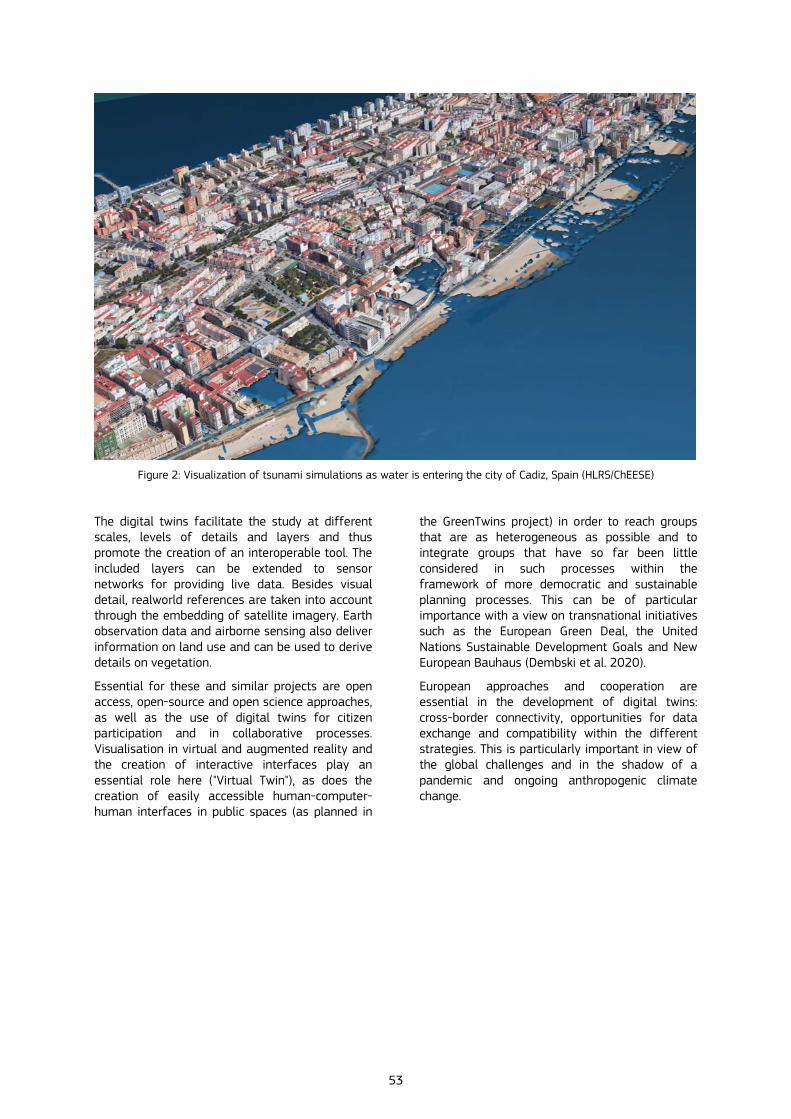
53
Figure 2: Visualization of tsunami simulations as water is entering the city of Cadiz, Spain (HLRS/ChEESE)
The digital twins facilitate the study at different scales, levels of details and layers and thus promote the creation of an interoperable tool. The included layers can be extended to sensor networks for providing live data. Besides visual detail, realworld references are taken into account through the embedding of satellite imagery. Earth observation data and airborne sensing also deliver information on land use and can be used to derive details on vegetation.
Essential for these and similar projects are open access, open-source and open science approaches, as well as the use of digital twins for citizen participation and in collaborative processes. Visualisation in virtual and augmented reality and the creation of interactive interfaces play an essential role here ("Virtual Twin"), as does the creation of easily accessible human-computer-human interfaces in public spaces (as planned in
the GreenTwins project) in order to reach groups that are as heterogeneous as possible and to integrate groups that have so far been little considered in such processes within the framework of more democratic and sustainable planning processes. This can be of particular importance with a view on transnational initiatives such as the European Green Deal, the United Nations Sustainable Development Goals and New European Bauhaus (Dembski et al. 2020).
European approaches and cooperation are essential in the development of digital twins: cross-border connectivity, opportunities for data exchange and compatibility within the different strategies. This is particularly important in view of the global challenges and in the shadow of a pandemic and ongoing anthropogenic climate change.

54
Figure 3: Visualization of the Digital Twin of Stuttgart, explored by a user in a CAVE. Sensor measurements and simulations forecast for particulate matter are shown (HLRS/ Open Forecast)
European approaches, cross-disciplinary collaborations and participation will coin future policy support as they are fundamental to address urgent global challenges as pandemics and climate goals. Digital twins can be used as a basis for this goal.
They act as a platform for data exchange, ensuring interoperability and accessibility. In this context, the provision of open data is key to enable freely accessible solutions. Our examples demonstrate that digital twins leverage evidence-based, predictive approaches and their application across scales.
Representation in VR provides an interface that supports the inclusion of citizens and policymakers on the same level. The presented examples indicate potential also on a larger scale, considering states and even connecting individual models to trans-national solutions. By starting from local policies, European approaches can be established to tackle global challenges.
References
Kern L, Schwitalla T, Bingert S, Wössner U, Dembski F (2021) Digital Twins for Air Quality Assessment in Urban Regions, Symposium on Simulation for Architecture and Urban Design, Online
Dembski, F., Wössner, U., Letzgus, M. (2019): The Digital Twin – Tackling Urban Challenges with Models, Spatial Analysis and Numerical Simulations in Immersive Virtual Environments; eCAADe and SIGraDi 2019 Conference: Architecture in the Age of the 4th Industrial Revolution, September 11-13, 2019; In conference proceedings, Porto
Klüsener, S., Schneider, R., Rosenbaum-Feldbrügge, M., Dudel, C., Loichinger, E., Sander, N., Backhaus, A., Del Fava, E., Esins, J., Fischer, M, Grabenhenrich, L., Grigoriev, P., Grow, A., Hilton, J, Koller, B., Myrskylä, M., Scalone, F., Wolkewitz, M., Zagheni, E., Resch, M.M. (2020): Forecasting intensive care unit demand during the COVID-19 pandemic: A spatial age-structured microsimulation model doi:https://doi.org/10.1101/2020.12.23.20248761
Dembski, F.; Wössner, U.; Letzgus, M.; Ruddat, M.; Yamu, C. Urban Digital Twins for Smart Cities and Citizens: The Case Study of Herrenberg, Germany. Sustainability 2020, 12, 2307. https://doi.org/10.3390/su12062307
Links
Open-Forecast: https://open-forecast.eu/en/
GreenTwins pilot: https://www.arcgis.com/apps/webappviewer/index.html?id=3debcccdaa5f480aaf8685abb711b736
ChEESE: https://cheese-coe.eu/

55
Machine learning for regional crop yield forecasting in Europe
Dilli Paudel (1), Hendrik Boogaard (1), Allard de Wit (1), Marijn van der Velde (2), Martin Claverie (2), Luigi Nisini (2), Sander Janssen (1), Sjoukje Osinga (1), Ioannis Athanasiadis (1) (1) Wageningen University and Research(2) Joint Research Centre, European Commission
To provide information on expected crop production levels, the European Commission’s Joint Research Centre (JRC) forecasts crop yields across all European Union (EU) Member States (MS). These forecasts are done at the national level. Here we propose a crop yield forecasting approach for multiple spatial levels based on regional crop yield forecasts from machine learning. Machine learning, with its data-driven approach, can leverage larger data sizes and capture nonlinear relationships between predictors and yield at regional level. Statistical crop yield forecasts rely on predictors aggregated from smaller spatial units. In developing regional models, information is preserved at a finer spatial detail compared to national models, and this should allow to establish relationships between predictors and yields with more explanatory power. In addition, regional forecasts provide added value and insights to stakeholders on regional differences within a country, which could otherwise compensate each other at national level.
We designed a generic machine learning workflow to demonstrate the benefits of regional crop yield forecasting in Europe. Input data included crop simulation model outputs, weather observations and remote sensing indicators. Features or predictors were designed from these inputs based on agronomic principles of crop growth and development. Yield statistics from Eurostat were used as ground truth to train models and crop areas were used to aggregate forecasts from regional level to national level.
To evaluate the quality and usefulness of regional forecasts, we predicted crop yields for 35 case studies, including nine countries (Bulgaria, Germany, Spain, France, Hungary, Italy, the Netherlands, Poland, Romania) that are major producers of six crops (soft wheat, spring barley, sunflower, grain maize, sugar beets and potatoes).
Machine learning models at regional level had lower normalized root mean squared errors (NRMSE) than a linear trend model as early as 120 days before harvest. Similarly, for instances that show cancelling effects of spatial differences, machine learning forecasts had a lower uncertainty than the trend model. Based on yield classes covering 20% intervals between minimum and maximum yields for each country, machine learning forecasted yield classes matched the reported yield classes quite well for an average harvest, but less so for two extreme harvests. In the case of potatoes (2013), an average harvest, forecasted yield classes matched reported ones in ~71% of the regions, and the rest were mostly off by one class. For extreme harvests (grain maize (2015) and soft wheat (2016)), the match percentage was closer to ~50%, with around ~41% off by one class. Furthermore, regional machine learning forecasts aggregated to national level had lower NRMSEs than forecasts from the MARS Crop Yield Forecasting System (MCYFS) in 25 out of 35 cases 120 days before harvest and 22 out of 35 cases 60 days before harvest. The machine learning forecasts aggregated at national level were thus comparable MCYFS forecasts.
Our machine learning models have room for improvement, especially during extreme years. In the future, improved data quality, new predictors and longer regional yield time series at regional level could further improve the performance of the machine learning models. Importantly, while the MCYFS forecasts rely on analyst expertise, the machine learning approach is fully automated. Both approaches are complementary with their own pros and cons, and this work demonstrates the benefits of combining agronomic expertise with machine learning for operational policy support.
In conclusion, this is a step towards crop yield forecasting at higher spatial resolutions. Regional crop yield forecasts from machine learning and aggregated national forecasts provide a consistent forecasting method across spatial levels, and insights from regional differences can complement and support policy decisions related to agricultural markets. It also contributes to the vision of deploying a digital Earth twin for the green transition to support policy in Europe.
56
Session 5
Assessing and communicating uncertainty in model results
24 November
13:30 – 14:50
57
Net-zero emission targets for major emitting countries consistent with the Paris Agreement
Heleen L. van Soest (1,2), Michel G. J. den Elzen (1), Detlef P. van Vuuren (1,2) (1) PBL Netherlands Environmental Assessment Agency(2) Copernicus Institute of Sustainable Development,Utrecht University
Summary
Over 100 countries have set or are considering net-zero emissions targets. However, most of the information on emissions neutrality is provided for the global level. Here, we look at national-level neutrality-years based on globally cost-effective 1.5 °C and 2 °C scenarios from IAMs. These results indicate that net-zero GHG emissions in Brazil and the USA are reached a decade earlier, and in India and Indonesia later, than the global average. CCS and afforestation capacity, income, and non-CO2 emissions share affect the variance in phase-out years across countries. The results depend on choices like accounting of land-use emissions and equity approach.
Introduction
In the 2015 Paris Climate Agreement [1], Parties agreed to “[…] achieve a balance between anthropogenic emissions by sources and removals by sinks of greenhouse gases in the second half of this century.” (Article 4) [1]. This can be defined as greenhouse gas (GHG) emissions neutrality [2].
So far, studies on GHG and carbon neutrality have mostly focused on the global level. However, because more than 100 national governments have set or are considering net-zero emissions targets, it is more policy-relevant to look at the implications at the national level. Therefore, we use a set of scenarios by integrated assessment models that represent major emitting countries individually to analyse national neutrality targets for major emitting countries. We focus on the phase-out year for CO2 and GHG emissions in scenarios consistent with Paris Agreement temperature targets, the influence of methodological choices and equity approach, and the key factors that could determine the differences between countries. We present detailed information for ten countries based on the CD-LINKS database [3].
Methods
The analysis presented here uses the scenario projections of the six models from a multi-model study [3], [4] using the same protocol for reaching a cost-optimal pathway to adhere to global carbon budgets of 1000 and 400 GtCO2 for the 2011–2100 period, allowing temporal overshoot. In the
scenarios, cost-optimal mitigation was assumed to start in 2020. Up to 2020, it was assumed that only existing policies were implemented (historical data up to 2020 was not yet available when these scenarios were developed between 2016 and 2018). Non-CO2 emissions were taxed with the same carbon price as that of CO2 in the cost-optimal scenarios.
Emissions pathways for the ten countries were linearly extrapolated to 2200 based on the 2050–2100 trajectory, in order to estimate phase-out years beyond 2100 where needed.
Results
In cost-optimal scenarios, Brazil, the USA (CO2 and all GHGs) and Japan (GHG only) are projected to have an earlier phase-out year than the global average. In contrast, India and Indonesia typically have a late phase-out year. For China, the EU, and Russia, the phase-out year is typically near the global average. For several countries, the position versus the global average is different for CO2 and all GHGs and the specific climate target.
When harmonising the model projections towards the countries’ reported net land-use emissions estimates in their greenhouse gas inventories, net zero GHG emissions are projected to be reached earlier in all countries except Brazil. The difference between inventory data and the model output for net land use emissions is caused by a systematic difference in definition of anthropogenic land sources and sinks. As a result, inventory data are lower in all countries except Brazil. The differences between these data sources are relatively large for China, India, and the USA. When allocating negative emissions from biomass with CCS (BECCS) to the biomass-producing country instead of the carbon-storing country, phase-out years are earlier in Brazil, Indonesia, Canada, India and Russia, but later in the EU, Japan and Turkey. Updating global warming potentials from IPCC AR4 to IPCC AR5 values does not significantly affect phase-out years. Applying equity approaches rather than a cost-optimal allocation of mitigation effort would imply earlier phase-out years for many of the countries studied here, but later phase-out years for Brazil and other countries with lower per capita emissions or developing economies (e.g. Indonesia, though with larger uncertainty). Mitigation potential and especially the potential for negative emissions are dominant factors determining when a country can reach net zero emissions. Future CCS and afforestation capacity, as well as the current shares of transport emissions, non-CO2 emissions, and GDP per capita, have the strongest relationship with phase-out years (negative for the former three, positive for the latter two).
58
Discussion and conclusions
We focused on the outcomes of cost-optimal scenarios. In reality, national targets might also be based on equity principles [5]. The IAM results indicate mitigation measures that countries should implement domestically under a globally cost-optimal distribution. These results do not answer the question of how these measures are funded, and how much effort or finance each country is providing. It does mean, however, that policymakers should not simply use the phase-out years presented here to set national targets. This study can be seen as a first step to inform such target setting, but national models or other tools will need to be applied to fully incorporate relevant domestic circumstances. That will need to include the country’s perspective of a national contribution to the global mitigation effort also reflecting equity considerations, as well as account for the outcome of negotiations on Article 6 and ITMOs.
Another critical point is that the scenarios were created in the period 2016–2018. This implies that cost-optimal policies were assumed to be implemented from 2020 onwards. This means that in some countries (e.g. Brazil) the political reality is not likely to lead to the pathways as described in the models. On the other hand, many other countries have now adopted or announced net zero emissions targets. China’s announced 2060 carbon neutrality goal, the EU’s 2050 net-zero GHG goal, Japan’s announced 2050 net-zero GHG goal, and the USA’s tentative 2050 net-zero GHG emissions goal are all in line with the models’ domestic cost-optimal mitigation pathways for 2 °C and 1.5 °C and in some cases are even more ambitious (e.g. rely less on negative emissions). Canada’s foreseen 2050 net-zero emissions goal does not specify whether it would apply to all GHG or CO2 only, but both would need to be phased out slightly earlier than 2050 to be in line with the models’ cost-optimal 1.5 °C scenarios. Either way, the specification of target coverage is important.
Our findings show that in order to meet these targets, countries should pay special attention to enhancing the capacity to realise negative emissions; clearly specify the land-use emissions accounting and related data; agree on the accounting of negative emissions from BECCS; and clarify their approach to equity and the use of ITMOs.
References
1 UNFCCC. Paris Agreement: Decision 1/CP.17 - UNFCCC document FCCC/CP/2015/L.9/Rev.1, <http://unfccc.int/resource/docs/2015/cop21/eng/l09r01.pdf>UNFCCC (2015).
2 Matthews, J. B. R.Annex I: Glossary in Global Warming of 1.5°C. An IPCC Special Report on the impacts of global warming
of 1.5°C above pre-industrial levels and related global greenhouse gas emission pathways, in the context of strengthening the global response to the threat of climate change, sustainable development, and efforts to eradicate poverty (eds V. Masson-Delmotte et al.) (IPCC, 2018).
3 CD-LINKS project. CD-LINKS scenario database, <https://db1.ene.iiasa.ac.at/CDLINKSDB>IIASA (2018).
4 McCollum, D. L. et al. Energy investment needs for fulfilling the Paris Agreement and achieving the Sustainable Development Goals. Nature Energy 3, 589-599 (2018).
5 Robiou du Pont, Y. et al. Equitable mitigation to achieve the Paris Agreement goals. Nature Clim. Change 7, 38-43 (2017).
Investigating optimal allocation of green recovery funds in the EU
Alexandros Nikas (1), Dirk-Jan Van de Ven (2), Aikaterini Forouli (1), Konstantinos Koasidis (1), Shivika Mittal (3), Sara Giarola (3), Ajay Gambhir (3), Alexandre C. Koberle (3), Alessandro Chiodi (4), Gabriele Cassetti (4), Maurizio Gargiulo (4), Sigit Perdana (5), Marc Vielle (5), Themistoklis Koutsellis (1), Haris Doukas (1) (1) National Technical University of Athens(2) Basque Centre for Climate Change(3) Imperial College London(4) E4SMA s.r.l., Italy(5) École polytechnique fédérale de Lausanne,Switzerland
Question: The pandemic had dramatic economic consequences in the EU: despite significant public interventions, more than 1.8 million jobs were lost between September 2019 and September 2020. As fiscal stimulus measures have been and continue to be announced, policymakers can ensure that the short-term stimulus points the economic recovery in a sustainable direction in the long term; in doing so, they must consider the trade-off between these goals. Here, we investigate this trade-off between short-term economic gains, in the form of new energy-sector jobs, and long-term CO2 emission reductions from fiscal stimulus packages, in the EU-27 plus the UK, compared to a current policy baseline (Nikas et al., 2021).
Methodology: We draw from the Recovery and Resilience Facility (RRF), of which about €200 billion will be used to support the green transition. Considering that 29% of this green pillar is expected to be channeled into clean energy projects, excluding related infrastructure investments (e.g., storage), and accounting for a small share of the transport budget for biofuels as well as the UK fiscal plan, we select a maximum budget of €80 billion. We draw from observed employment implications of energy projects (Rutovitz et al., 2015; Pai et al., 2021) and latest available insights into possible synthesis of green recovery-related funds and projects. We combine the Global Change Analysis Model (GCAM) (Calvin
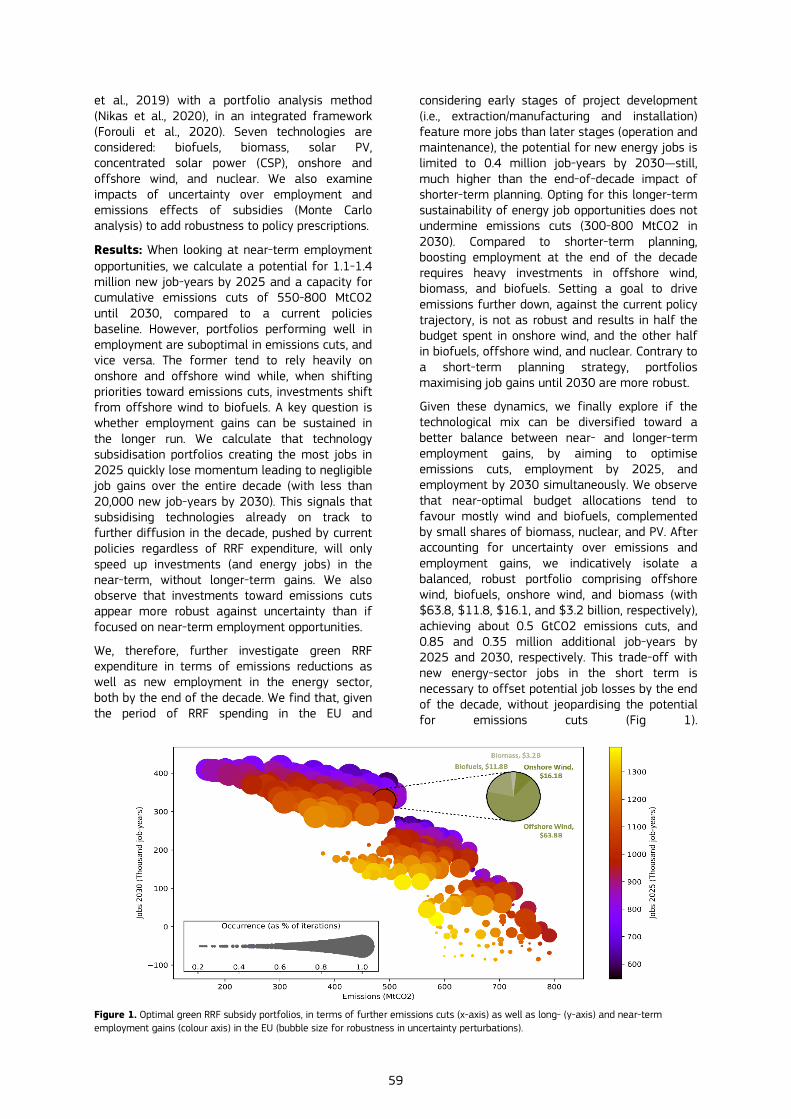
59
et al., 2019) with a portfolio analysis method (Nikas et al., 2020), in an integrated framework (Forouli et al., 2020). Seven technologies are considered: biofuels, biomass, solar PV, concentrated solar power (CSP), onshore and offshore wind, and nuclear. We also examine impacts of uncertainty over employment and emissions effects of subsidies (Monte Carlo analysis) to add robustness to policy prescriptions.
Results: When looking at near-term employment opportunities, we calculate a potential for 1.1-1.4 million new job-years by 2025 and a capacity for cumulative emissions cuts of 550-800 MtCO2 until 2030, compared to a current policies baseline. However, portfolios performing well in employment are suboptimal in emissions cuts, and vice versa. The former tend to rely heavily on onshore and offshore wind while, when shifting priorities toward emissions cuts, investments shift from offshore wind to biofuels. A key question is whether employment gains can be sustained in the longer run. We calculate that technology subsidisation portfolios creating the most jobs in 2025 quickly lose momentum leading to negligible job gains over the entire decade (with less than 20,000 new job-years by 2030). This signals that subsidising technologies already on track to further diffusion in the decade, pushed by current policies regardless of RRF expenditure, will only speed up investments (and energy jobs) in the near-term, without longer-term gains. We also observe that investments toward emissions cuts appear more robust against uncertainty than if focused on near-term employment opportunities.
We, therefore, further investigate green RRF expenditure in terms of emissions reductions as well as new employment in the energy sector, both by the end of the decade. We find that, given the period of RRF spending in the EU and
considering early stages of project development (i.e., extraction/manufacturing and installation) feature more jobs than later stages (operation and maintenance), the potential for new energy jobs is limited to 0.4 million job-years by 2030—still, much higher than the end-of-decade impact of shorter-term planning. Opting for this longer-term sustainability of energy job opportunities does not undermine emissions cuts (300-800 MtCO2 in 2030). Compared to shorter-term planning, boosting employment at the end of the decade requires heavy investments in offshore wind, biomass, and biofuels. Setting a goal to drive emissions further down, against the current policy trajectory, is not as robust and results in half the budget spent in onshore wind, and the other half in biofuels, offshore wind, and nuclear. Contrary to a short-term planning strategy, portfolios maximising job gains until 2030 are more robust.
Given these dynamics, we finally explore if the technological mix can be diversified toward a better balance between near- and longer-term employment gains, by aiming to optimise emissions cuts, employment by 2025, and employment by 2030 simultaneously. We observe that near-optimal budget allocations tend to favour mostly wind and biofuels, complemented by small shares of biomass, nuclear, and PV. After accounting for uncertainty over emissions and employment gains, we indicatively isolate a balanced, robust portfolio comprising offshore wind, biofuels, onshore wind, and biomass (with $63.8, $11.8, $16.1, and $3.2 billion, respectively), achieving about 0.5 GtCO2 emissions cuts, and 0.85 and 0.35 million additional job-years by 2025 and 2030, respectively. This trade-off with new energy-sector jobs in the short term is necessary to offset potential job losses by the end of the decade, without jeopardising the potential for emissions cuts (Fig 1).
Figure 1. Optimal green RRF subsidy portfolios, in terms of further emissions cuts (x-axis) as well as long- (y-axis) and near-term employment gains (colour axis) in the EU (bubble size for robustness in uncertainty perturbations).

60
Implications for model development and use in support to policy: Going well beyond the use and output of a single integrated assessment model, we soft-link different types of disciplines and models to answer a question of timely policy relevance. Building this research entirely on policy needs, we co-create the current policy baseline with policy and other stakeholders (Nikas et al., 2021). After setting out to explore trade-offs between near-term employment and long-term emissions gains, our findings motivate us to expand the study and capture strategies with longer-term positive employment impacts. The revealed dynamics of the modelling study then justify expanding analysis to add both time horizons in the optimisation process. Stress-testing findings against large uncertainty helps to underpin analysis with robustness, aiming to provide better confidence over the policy prescriptions.
Acknowledgement: The work was supported by the H2020 European Commission Project “PARIS REINFORCE” under Grant Agreement No. 820846. The sole responsibility for the paper content lies with the authors; the paper does not necessarily reflect the opinions of the EC.
References
Calvin, K., Patel, P., Clarke, L., Asrar, G., Bond-Lamberty, B., Cui, R. Y., ... & Wise, M. (2019). GCAM v5. 1: representing thelinkages between energy, water, land, climate, and economicsystems. Geoscientific Model Development, 12(2), 677-698.
Forouli, A., Nikas, A., Van de Ven, D. J., Sampedro, J., & Doukas, H. (2020). A multiple-uncertainty analysis framework forintegrated assessment modelling of several sustainabledevelopment goals. Environmental Modelling & Software, 131,104795.
Giarola, S., Mittal, S., Vielle, M., Perdana, S., Campagnolo, L., Delpiazzo, E., ... & van de Ven, D. J. (2021). Challenges in the harmonisation of global integrated assessment models: A comprehensive methodology to reduce model response heterogeneity. Science of The Total Environment, 783, 146861.
Nikas, A., Elia, A., Boitier, B., Koasidis, K., Doukas, H., Cassetti, G., …, & Chiodi, A. (2021). Where is the EU headed given its current climate policy? A stakeholder-driven model inter-comparison. Science of the Total Environment, 793, 148549.
Nikas, A., Fountoulakis, A., Forouli, A., & Doukas, H. (2020). A robust augmented ε-constraint method (AUGMECON-R) for finding exact solutions of multi-objective linear programming problems. Operational Research. In press.
Pai, S., Emmerling, J., Drouet, L., Zerriffi, H., & Jewell, J. (2021). Energy sector employment implications of keeping global warming well below 2oC. One Earth. In press (July 2021).
Rutovitz, J., Dominish, E., & Downes, J. (2015). Calculating global energy sector jobs: 2015 methodology update. Prepared for Greenpeace International by the Institute for Sustainable Futures, University of Technology Sydney
Extreme events in the coastal zone – a multidisciplinary approach for better Preparedness
Anna Rutgersson (1), Martin Drews (2), Kirsten Halsnæs (2), Pasha Karami (3), Johanna Mård (1), Erik Nilsson (1) (1) Department of Earth Sciences, Uppsala University,Uppsala, Sweden(2) Department of Technology, Management andEconomics, Technical University of Denmark, Kgs.Lyngby, Denmark(3) Swedish Meteorological and Hydrological Institute,Norrköping, Sweden
Costs of natural disasters and weather-related accidents can be enormous, both in terms of death toll and economic costs. According to the European Environment Agency, increases in the frequency and/or magnitude of extreme events such as floods, droughts, windstorms or heatwaves will be among the most important consequences of climate change.
The coastal zone is a focus area for human activities, high population densities, large urban areas, transport and critical infrastructure. It is a complex area in the climate system, a dynamic interaction between land, sea and atmosphere takes place, e.g., large gradients in time and space of geophysical parameters result in mesoscale circulation systems in the atmosphere and ocean that interact with the dynamics of the larger scales. Flooding is a natural consequence of the coastal zone dynamics and a main driver of high impact events. The severity of flood events depends on several factors: the total water level, the topography of the terrain (the flood plains), and the exposure of socio-economic values. In addition, when storm surges and heavy precipitation (and in turn river run-off) occur concurrently impacts on coastal areas can be much greater than the effects in isolation. The likelihood of the joint occurrence of multiple phenomena is largely unknown, and therefore the associated risk is uncharted. To mitigate these potential high impact events, improved knowledge on the probability of these compound events under current and climate change conditions, understanding the processes driving them and including the information into risk analyses (and ultimately design processes) is essential. Model ensembles represent the most common tool for sampling the uncertainty in the case of numerical weather prediction and climate models and are increasingly explored in terms of producing probabilistic forecasts/climate projections. Thus, such forecasts generally have a lower forecast error than a deterministic forecast as the averaging of the ensemble members filters out less predictable parts of the forecast. Conversely, the use of ensembles and more generally systematic approaches to assess uncertainties in

61
connection with, e.g. hydrological and economic models, needs further evaluations.
We selected one Swedish coastal urban area (the city of Halmstad) as a case study and for method development. An integrated modelling linking a global and a regional climate model, a detailed physical impact model and a socio-economic impact model. Key aspects of each component are a more detailed and accurate (better representation) of features relevant for coastal extremes and decision making on climate change adaptation. By using a system of single-model ensembles the uncertainties of the resulting extreme estimates are estimated.
Operationalisation of well-being. A Benefit of the Doubt model for Dutch municipalities
Mark Thissen, Jeroen Content, PBL Netherlands Environmental Assessment Agency
Well-being is on the top of the political agenda in Europe since the beyond-GDP discussion (Stiglitz et al., 2009; Constanza et al., 2009; Fleurbaey, 2009; Jones & Klenow, 2016) and the OECD better than life initiative (2014). Although there has been a large body of literature on the conceptualisation of well-being, its operationalisation is hampered by disagreement on the way different aspects contribute to wellbeing and as a consequence there exists no unit of well-being. This makes it impossible to develop a composite indicator for wellbeing that encompasses all the aspects of well-being and limits any theoretically sound operationalisation of the concept.
Well-being is comprised of all elements that people consider of value. Any operationalisation of well-being derived from traditional welfare theory, or the more recent capabilities approach (Sen, 1985) is therefore based on different aspects of life and the value people give to these aspects. These aspects are mostly present in their immediate vicinity where people live, work, recreate, learn and enjoy the environment and nature. People choose their home and work location based on their personal preferences and well-being can therefore only be analysed on a low spatial scale such as a municipality.
In this exploratory study, we develop a new approach to analyse regional differences in people's preferences and its implications for differences in regional well-being. This approach is derived from the Benefit of the Doubt model (BoD). The BoD model has been earlier suggested and used for the analysis of wellbeing (Cherchye,
2007; Decanq & Lugo, 2013), but it lacks the tools for proper analysis at a low spatial scale. We therefore extended the model to properly take regional interaction on a low spatial scale into account.
The model is applied to the case of the Netherlands. The current research’ focus is on model development with proper test statistics, so we choose our model scope pragmatically. Although the model is limited to the Dutch case, the main insights from the model depend on mechanisms of spatial interaction and can be easily extrapolated to the European context. Similarly, our recommendations for policy are just as well applicable to European policy makers as they are to Dutch policy makers.
Model and reliability of results
The BoD-model is based on linear optimisation where it is assumed that the well-being in a region is comprised of different aspect that are measured by several indicators in the region and their value. In addition, each region is given the benefit of the doubt: each region’s preferences are such that the maximum well-being in the region is obtained. To limit the degrees of freedom and prevent every region from becoming a winner (Bristow, 2005) several additional constraints have been applied: A Robin Hood or Hoover Equality Restriction to prevent the distribution of the valuation for an indicator to become larger than the distribution in the indicator itself, Zipf’s law to limit the relative size in valuation of the different aspects and constraints based on additional information on social values taken from the European Social Survey. Spatial interaction is introduced into the model by use of spatial weight matrices commonly used in spatial econometrics.
Using a newly developed bootstrap method, we can deal with heteroskedasticity and apply a simple student’s t-test to omit unreliable factors from the analysis. Furthermore, this allows us to introduce a new pseudo-R-squared statistic to analyse the reliability of the model, which is needed due to the ordinal nature of the results. We found that our model is very reliable with a pseudo R-squared of 94 percent at a reliability level of 10 percent. This represents a maximum error of plus or minus 10 places in a ranking of 355 municipalities.
Results
We find that the most prosperous Dutch municipalities are affluent suburban municipalities that "borrow" positive aspects such as the possibility of work, creativity and recreation of the big cities, while they do not have to deal with typical negative aspects of big cities such as insecurity and pollution. Although people living in a
62
large city may borrow environmental aspects in neighbouring municipalities, they cannot fully compensate for the negative city-aspects such as pollution and insecurity. As a result well-being is lower in the large city than in its surrounding suburban municipalities.
The Randstad metropolitan area in the centre of the Netherlands is a concentration of municipalities close to each other where the sum is clearly more than its parts. The municipalities in the Randstad borrow many positive characteristics from neighbouring regions, further increasing the well-being of its inhabitants. The variation in in municipalities allows regions to optimally profit from each other’s characteristics
Rural areas have less access to employment and the degree of recreation and creative professions present in the major cities. Even if we take into account regional differences in preferences, this difference is so large that well-being in these regions always lags behind.
Policy implications
Differences in well-being are widely seen as an important reason for policy intervention. It is important to take regional characteristics, regional preferences and regional interaction into account when designing policies to strengthen well-being. Particular attention should be paid to missing aspects of well-being and the possibility of obtaining these aspects by, for instance, improved infrastructural connections to other municipalities.
Interregional cooperation is of prime importance in increasing the well-being, especially among municipalities with different characteristics. Similar regions have less to gain from interregional cooperation although they can learn from similar regions in other parts of the country.
References
Bristow, G. (2005). Everyone's a ‘winner’: problematising the discourse of regional competitiveness. Journal of economic geography, 5(3), 285-304.
Cherchye, L., Moesen, W., Rogge, N., & Van Puyenbroeck, T. (2007). An introduction to ‘benefit of the doubt’composite indicators. Social indicators research, 82(1), 111-145.
Costanza, R., Hart, M., Talberth, J., & Posner, S. (2009). Beyond GDP: The need for new measures of progress. The pardee papers.
Decancq, K., & Lugo, M. A. (2013). Weights in multidimensional indices of wellbeing: An overview. Econometric Reviews, 32(1), 7-34.
Biogeochemical model ensembles for policy-support in agriculture
Gianni Bellocchi, Université Clermont Auvergne, INRAE, VetAgro Sup, UREP, Clermont‐Ferrand Renáta Sándor, Centre for Agricultural Research, Agricultural Institute, Martonvásár, Hungary Roberta Farina, Research Centre for Agriculture and Environment, CREA – Council for Agricultural Research and Economics, Rome
Hypotheses about the contribution of agricultural management to carbon-nitrogen emissions and its adaptation to global changes can be tested via process-based biogeochemical models, which allow understanding, diagnosing and forecasting complex interactions in support of policies. For instance, agricultural systems could be simulated with these models and ranked by emission intensity, while assessing options for improving agricultural productivity and reducing emissions under current and future scenarios. These models take the approach of simulating underlying biogeochemical processes, such as plant photosynthesis and respiration, using mathematical equations that determine the allocation of carbon from atmospheric CO2 into biomass down to the soil organic matter. A relatively complete suite of biogeochemical processes (e.g. plant growth, organic matter decomposition, fermentation, ammonia volatilisation, nitrification and denitrification) is generally embedded in these models, enabling computation of transport and transformations in plant–soil ecosystems. Interacting sub-models are designed to describe carbon-nitrogen and water cycles for targeted ecosystems, thus any changes in the environmental factors collectively affect a group of biogeochemical reactions. In a policy perspective, international model inter-comparison exercises have shown the potential of process-based biogeochemical model ensembles to jointly estimate agricultural productivity and fluxes and stocks of nitrogen and carbon in agricultural soils. Ehrhardt et al. (2018) and Sándor et al. (2020) applied the ensemble modelling approach to estimate agricultural production and nitrogen and carbon emissions of arable crops and grasslands. With arable crops, our results show that the median of three‐model ensembles predicts significantly the ranking of observed emission intensities. Using multiple biogeochemical models, Sándor et al. (2018) and Fuchs et al. (2020) proved the effectiveness of low-intensity grazing, reduced nitrogen fertilisation and replacement of nitrogen fertilisers with symbiotically-fixed nitrogen in reducing emissions from grasslands. Farina et al. (2021) have addressed the ensemble modelling of soil carbon stocks in bare-fallow soils and Launay et al. (2021) estimated carbon storage potential and carbon-nitrogen emissions of French arable cropland using high-resolution
63
modelling in support of the ‘4 per mille Soils for Food Security and Climate’(https://www.4p1000.org).
The above studies were mostly coordinated by the Integrative Research Group of the Global Research Alliance (GRA) on agricultural greenhouse gases and were supported by research projects (e.g. CN‐MIP, Models4Pastures, MACSUR I and II, COMET‐Global and MAGGNET), which received funding by a multi-partner call on agricultural greenhouse gas research of the Joint Programming Initiative ‘FACCE’ through national financing bodies. Presenting a framework for interpretation of model performance and uncertainties, these studies achieved key progress in crop and grassland modelling by assessing in-depth model responses against climate and management drivers. They question the use of model ensembles for upscaling projections of agricultural productivity and carbon-nitrogen emissions from field scale to larger spatial units (i.e. gridded projections) as needed for Tier-3 national inventories. Beyond the evidence that ensembles of models perform better than individual models (with the multi‐model median of model outputs used as descriptor of the ensemble performance), multi-model inter-comparison studies have provided information on the minimum ensemble sizes (~10 models) and datasets (some plant measurements as calibration data) required to substantiate ensemble estimates and reduce uncertainties. From a policy perspective, this is critically important for the implementation of model ensembles to identify the extent to which management interventions influence carbon-nitrogen fluxes and stocks (e.g. yield‐scaled emissions where the carbon emitted per unit of marketable production is estimated) before promoting food security and climate policies that alter agricultural practices to meet prescribed benchmarks.
With increasing availability of data and computational resources, there are many opportunities for the agricultural modelling community to enrich its offering and to keep up with evolving methodologies, which would increase transparency of the underpinning science and modelling practice. Ongoing actions under the guidance of international initiatives (e.g. the European Joint Programme on Soil, https://projects.au.dk/ejpsoil, started in 2020) appear as an ideal arena to facilitate the exchange of information and to further explore
model developments and practice. In particular, the MACSUR Science-Policy Knowledge Forum (started in 2021), which builds on the ensemble modelling approaches already developed, holds the promise to create links between research and policy. In a result-oriented way, taking into account the mutual acculturation of stakeholders and aligning the agendas of scientists and policy-makers, the demand side for research-based information is expected to be matched against the supply side for model and assessment results (and other forms of knowledge generation) by an established procedure of science-based response to policy questions that proved operational in exemplary cases related to mitigation and adaptation measures, their impact, synergies and trade-offs. Overall, there is scope for collaboration between scientists and decision-makers to co-construct the demand, the criteria to be taken into account and the expected impacts, and to provide an optimised and realistic response. Crop and grassland models are now used to address broader issues than agricultural production. With respect to emission-related processes, the modelling community has provided evidence of what can reasonably be expected from the use of an ensemble of biogeochemical models, which calls for integration into operational, multi-model decision-support frameworks. In the medium term, the appropriation of model-based outcomes, especially at local level, should aim at guiding carbon- and nitrogen-smart farm choices and participating to agro-environmental policies thought and adapted to the territory.
References
Ehrhardt, F. et al., 2018. Assessing uncertainties in crop and pasture ensemble model simulations of productivity and N2O emissions. Global Change Biology 24, e603– e616.
Farina, R. et al., 2021. Ensemble modelling, uncertainty and robust predictions of organic carbon in long‐term bare‐fallow soils. Global Change Biology 27, 904-928.
Fuchs, K. et al., 2020. Evaluating the potential of legumes to mitigate N2O emissions from permanent grassland using process‐based models. Global Biogeochemical Cycles 34: e2020GB006561.
Launay, C. et al., 2021. Estimating the carbon storage potential and greenhouse gas emissions of French arable cropland using high‐resolution modeling. Global Change Biology 27, 1645-1661.
Sándor, R. et al., 2018. The use of biogeochemical models to evaluate mitigation of greenhouse gas emissions from managed grasslands. Science of the Total Environment 642, 292-306.
Sándor, R. et al., 2020. Ensemble modelling of carbon fluxes in grasslands and croplands. Field Crops Research 252: 107791.
64
Contributed Session 2
Modelling for the Banking Union
24 November
14:50 – 16:20

65
The EU has come a long way on the path to create a safer financial sector for the EU single market. The regulatory framework set up by the Commission to restore confidence in the financial sector after the events of 2009 helped to create a safer and sounder financial system meant to serve the real economy. Today, the European financial system is far better equipped, stable and integrated than it was before the financial crisis. Within this context, the use of models for policy evaluation has been a powerful tool that contributed to the production of evidence and to the identification of effective policy options for the revision of the regulatory framework
Chair: Francesca Di Girolamo, Joint Research Centre, European Commission
SYMBOL: a modelling tool to evaluate banking-related policy options
Mario Bellia, Marco Petracco Giudici, DG Joint Research Centre, European Commission
The JRC has been working to help policy makers in the identification of suitable measures to enhance the resilience of the European financial sector towards systemic events. Through its scientific approach, the JRC has provided quantitative analyses and analytical tools for assessing impacts of implementing legislations and monitoring responses, notably in the areas of capital and liquidity requirements, bank and non-bank recovery and resolution (bail-in) and deposit insurance. The contribution of modelling proved to be a powerful tool to identify effective policy options for the banking regulatory framework.
Starting from 2008, the JRC in cooperation with academia and DG FISMA (previously named DG MARKT) developed the SYMBOL model (Systemic Model of Banking Originated Losses) to simulate the onset and the impact of systemic banking crisis under a set of alternative policy interventions, based on actual bank balance sheet data and regulatory framework. The model starts by estimating the probabilities of a default of bank obligors as assessed by the country's banking system regulator, using in particular information on minimum capital requirement as declared on banks’ balance sheets. It then uses these estimates and the actual capital to evaluate the default risk of individual banks via Monte Carlo simulation. Finally, the model aggregates individual bank losses to estimate the distribution of losses for the banking system as a whole.
Notably, the SYMBOL model represents the main tool that the JRC applied to provide scientific evidence for studies and analyses exploring the banking sector in the EU. This model is in fact suitable for policy preparation and implementation and has been used to assess the impact of various regulatory initiatives in the realm of banking.
Originally, the model has been used to set the harmonized level of protection of EU citizens’ deposits. Once the Commission moved toward the ambitious regulatory reform agenda in response to the financial crisis, the JRC applied the model to
assess potential effects of selected measures for the banking sector, with particular emphasis on the role of higher capital requirements, bail-in-able liabilities, the creation of resolution funds and the strengthening of deposits insurance. Moreover, the model allows investigating the interactions among the various tools in place, aiming to assess which combinations of regulatory changes are the most efficient and effective.
Recently, the SYMBOL model provided indispensable support to the Commission to assess the difficulties that credit institutions face in fulfilling the minimum conditions to access resolution funds and the benefits of mutualisation of guarantees in a financial distress.
The presentation will focus on the main features of the model, notably the estimation of the implied obligor probability of default of each individual bank, the simulation of correlated losses in the system, the determination of bank failure, and the distribution of losses for the whole system.
Modelling the effectiveness and efficiency of crisis management safety nets
Marie Donnay, DG for Financial Stability, Financial Services and Capital Markets Union, European Commission
The protection of bank depositors and insurance policyholders is a core objective of crisis management in these two financial sectors and an integral part of the EU regulatory framework. In the banking sector, depositor confidence is pivotal to financial stability and, in the Banking Union in particular, a common deposit insurance would deliver a robust safety net conducive to equal treatment of depositors across the union and to further market integration with a potential for cross-border consolidation in the banking sector. In the insurance sector, an insurance guarantee scheme would provide a level playing field and strengthen policyholders trust in the single market for insurance.

66
These mechanisms need to be appropriately calibrated to ensure simultaneously effectiveness and efficiency, i.e. ensuring robustness in the available financial means to withstand crisis at the lowest possible cost for the industry. To this end, several quantitative techniques are used to estimate potential losses and subsequently funding needs.
In the case of the common guarantee scheme in the Banking Union (EDIS- European Deposit Insurance Scheme), the analysis focuses on the pooling effect of existing national Deposit Guarantee Scheme (DGSs), with a view to reduce the risk of losses for the sovereign when DGSs funds are exhausted. The losses are generated via the Systemic Model of Banking Originated Losses (SYMBOL), which simulates banks’ failure. Banks’ failures and potential losses for depositors to be covered by a pay-out event depend on their initial level of capital and the severity of the shock. Results are then aggregated at national or at Banking Union level.
The analysis is structured in two steps. In the first one, 100 000 banking crisis realizations are produced, where at least one bank in the sample fails. Failure happens with the depletion of a bank total regulatory capital. These cases trigger the DGS intervention to reimburse the amount of covered deposits of banks under liquidation. In the second step, it is checked for each simulation whether the concerned deposit insurance schemes could withstand the simulated crisis or experienced a shortfall, i.e. to what extent they would be able to provide coverage for the covered deposits of failed banks. The potential for the pooling effect of EDIS is tested for several scenarios of allocation of funds in the central fund, leading to various level of shortfalls (reduction of the likelihood of shortfalls) and possible efficiency gains (achieving the same robustness of the pooling mechanism with a lower ex ante funding).
In the case of the Insurance Guarantee Scheme (IGS), the Commission services estimate the losses affecting policyholders using the Credit Value-at-Risk (Vasicek-model) methodology in each Member State in a one-year time horizon. The order of magnitude of the estimated loss distributions is tested based on selected past failures in the EU that fall in a range between the 75% and the 99% percentile of the estimated loss distributions. The model allows to estimate policyholders' losses combining the effect of various elements, such as:
• the exposure at default (EAD);
• the probability of default (PD);
• the correlation of defaults between insurers(how probable is it that defaults happen at thesame time);
• the concentration of the insurance market(how many insurers dominate the market); and,
• the severity (Loss Given Default) of the lossesin case of default.
Subsequently, it allows for the estimation of the possible ex ante funding needs.
In both cases, the modelling approach behind offers a concrete opportunity to investigate credible scenarios and evaluate the effectiveness of policy solutions to improve the protection of depositors and policyholders.
Recoupment capacity of the European banking sector to the Single Resolution Fund and the Common Backstop
Miguel Carcano, Wouter Heynderickx, Single Resolution Board
The Common Backstop (CB) for the Single Resolution Fund (SRF) will be introduced at the beginning of 2022. The CB increases the firepower of the SRF, which can be used to intervene in case a large financial institution or multiple institutions fail within the Banking Union. The CB needs to be fiscally neutral over the medium term and therefore needs to assess the recoupment and repayment capacity of the banking sector. This repayment capacity will be jointly assessed between the Single Resolution Board (SRB) and European Stability Mechanism (ESM) in accordance with the political agreement, and for that reason a joint team was set up. The objective of this project is to assess whether the financial institutions within the banking union can pay enough ex-post and ex-ante contributions within the prescribed deadlines. The standard timeline to repay the common backstop is three years, but can be extended to five, while the regulation prescribes that the SRF needs to be replenished within six year. The total size of the SRF and the Common backstop depends on the growth of covered deposits. The SRF will amount at least to 1% of covered deposits in the Banking Union, and the CB is mirroring the size of the SRF. At the beginning of 2022, the size of the SRF will be around 52 bn EUR.
The recoupment capacity analysis consists of four building blocks: Analysis of contributions, the projections of profit and loss (P&L), contagion and the last block combines the other blocks into a final assessment.
67
The contribution analysis takes into account the different regulatory limits of the ex-ante and ex-post contributions at country level due to the compartmental structure of the SRF during the transitional period.
The P&L projections are conducted at consolidated level for the largest contributors to the SRF. For these institutions, there is an estimation of the different components of the P&L based on two economic scenarios: the baseline and the adverse as set by the European Systemic Risk Board (ESRB). Separate econometric estimations are run for Net Interest Income, Fee & Commission Income, Loan impairment charges and NPL ratios taking into account non-linearities and business model specificities. These estimates of the components above are combined with other P&L components, which are assumption based. In the last step, the forecasted P&L is added to the capital ratios.
In the contagion block, the model generates different level of shocks that are associated with different levels of contagion within the financial system. The size of the shocks depends on the selected parts of the loss distribution and its interaction with the Safety Net Cascade as prescribed in the Bank Recovery and Resolution Directive (BRRD). The contagion block is based on the Systemic Model of Banking Originated Losses
(SYMBOL model) and compared to the original model, the correlation matrix is calibrated on weekly stock price returns. To the extent that stock prices reflect correctly the direct and indirect linkages within the financial system, the contagion block incorporates these linkages. A distinction is made within the contagion losses that are subtracted from the banks’ capital levels. For defaulted banks, the excess capital is attributed on top of the minimum capital requirement, given that these institutions will be resolved. For banks that do not default, the generated losses are subtracted from the capital levels.
In the final assessment of the recoupment capacity analysis, the three previous blocks are combined and the impact of the ex-ante and ex-post contributions is given in terms of forecasted P&L, the capital buffer and capital levels for the two macro-economic scenarios and the defined contagion shocks.
Combining different types of models (e.g. stochastic model, econometrics, and macroeconomic forecasts) imposes some additional challenges in terms of integration. Nevertheless, it increases the understanding of questions relevant for policymakers such as the recoupment capacity of the financial institutions located in the Banking Union.

68
Session 6
Multidisciplinary approaches, integrated assessment and model
linkages
25 November
09:30 – 10:50
69
Guiding the mitigation of epidemics with reinforcement learning
Pieter Libin (1,2,3), Timothy Verstraeten (1,2), Niel Hens (3), Philippe Lemey (4), Ann Nowe (1) (1) AI lab, Vrije Universiteit Brussel(2) Acoustics and Vibration Research Group, VrijeUniversiteit Brussel(3) Data science institute, UHasselt University, Belgium(4) Rega Institute, KU Leuven, Belgium
Epidemics of infectious diseases are an important threat to public health and global economies. The most efficient way to combat epidemics is through prevention. To develop prevention strategies and to implement them as efficiently as possible, a good understanding of the complex dynamics that underlie these epidemics is essential. Epidemiological studies allow us to obtain insights in the history of such processes. However, to properly understand these processes, and to study emergency scenarios, epidemiological models are necessary. Such models enable us to make predictions and to study the effect of prevention strategies in simulation.
Nevertheless, the development of prevention strategies, which need to fulfil distinct criteria (i.a., prevalence, mortality, morbidity, cost), remains a challenging process.
For this reason, we develop new methods based on artificial intelligence to help decision makers to reduce the burden of infectious diseases. While these methods are applicable to a wide range of pathogens, we performed our experiments in the context of pandemic influenza. Contrary to seasonal influenza, influenza pandemics occur less frequently, but can cause a large pandemic, due to the fact that no (or little) immunity exists in the human population. Therefore, such viruses have the potential to kill millions of people worldwide. This setting is similar for other respiratory pandemic viruses, such as the SARS-CoV-2 virus that is currently causing a worldwide pandemic, highlighting the importance and relevance of our work.
Given the availability of an efficient therapeutic intervention option (e.g., vaccines) infectious diseases can be controlled effectively. However, there is a substantial number of pathogens, for which no vaccine is readily available. For example, in the case of pandemic influenza, or SARS-CoV-2 for that matter, the virus needs to be isolated before the production of a vaccine can start. Therefore, in case of an emerging epidemic, no vaccine will be available. In the absence of an efficient vaccine, other resources need to be allotted to contain an emerging epidemic, such as non-therapeutic measures (e.g., school closures to reduce social mixing, partial or full lockdowns) or therapeutic measures other than vaccines (e.g.,
antiviral drugs as a pre-prophylactic). Such measures clearly have limitations (e.g., schools cannot be closed indefinitely and antiviral influenza medication are only available in limited supply), therefore, it is important that such scarce resources will be optimally used.
To this end, we investigate the use of reinforcement learning methods to identify optimal prevention strategies, in an epidemiological model (i.e., a mathematical model that covers the population, the pathogen and preventive measures), to support policy makers with their decision making.
Reinforcement learning concerns an area in artificial intelligence, where an agent learns to behave optimally in an environment. To this end, the agent interacts with the environment (e.g., a video game), by performing actions (e.g., controlling a joystick). Each action has an effect on the environment's state, which the agent observes (e.g., the screen of the video game), together with the reward for executing that particular action (e.g., the immediate score received). By carefully observing how the state evolves and considering the rewards that follow upon executing actions, reinforcement learning algorithms will aim to optimize the long-term reward (e.g., to win the video game), thereby learning a policy that behaves optimally in said environment.
We investigate two distinct decision making problems. Firstly, we study the decision making problem where a number of possible prevention strategies has been defined by decision makers, who need to determine which of these strategies is most efficient. This decision is made by evaluating the prevention strategies in a complex and computationally demanding epidemiological model. To perform this evaluation efficiently, we investigate the use of algorithms in the field of reinforcement learning that are grounded in the Bayesian uncertainty framework. This approach enables us to learn faster and to quantify the uncertainty of the decisions. Secondly, we extend this approach such that we can learn adaptive strategies in an epidemiological model.
This means that, rather than comparing preventive strategies, we will attempt to learn which subsequent steps are necessary to act optimally, while considering the state of the epidemic. Since the state space of the epidemiological models that are necessary to investigate versatile prevention strategies is huge, we need to represent this space efficiently, in a way that reinforcement learning becomes feasible. To this end, we follow a deep reinforcement learning approach.
We evaluate both research trajectories in the context of pandemic influenza, and overall, our experiments show that reinforcement learning
70
techniques can be used to investigate mitigation strategies off-line to evaluate and come up with new mitigation protocols, and we are currently using these techniques to study mitigation measures in the context of the ongoing SARS-CoV-2 epidemic. Furthermore, we believe that there is a great potential to use reinforcement learning to support decision makers in a real-time fashion, which is especially important in the context of emerging infectious diseases.
Bridging Ecosystem Services Accounts to General Equilibrium models: the case of invasive alien species from INCA to GTAP
Alessandra La Notte, Joint Research Centre, European Commission Alexandra Marques, PBL Netherlands Environmental Assessment
When something changes in ecosystems and the services they provide, there are impacts in the economic sectors that depend on them. A way to create a direct linkage between ecological system and economic system would be facilitated if data structure and compilation principles of data and tools from both sides were coherent and compatible. Thanks to the System of integrated Environmental and Economic Accounts (SEEA) [1], environmental information is reported as satellite accounts wrt the core economic accounts. The Knowledge Innovation Project on an Integrated system of Natural Capital and ecosystem services Accounting (KIP INCA) [2] aims to develop a set of experimental accounts at the EU level, following the United Nations SEEA- Experimental Ecosystem Accounts. INCA develops modules on extend, condition and Ecosystem Services (ES) accounts. ES accounts are compiled in the accounting format of Supply and Use tables. ES accounts can thus facilitate the assessment of economic impacts generated by changes in ecosystems and their services. The illustration here proposed concerns invasive alien species, which affect the ES “pollination” that in turn has an economic impact on pollinator-dependent crops.
The context: the role of pollination and the invasion of the Asian Hornet
Pollinators provide a wide range of benefits to society: from food security to the maintenance of biodiversity. However, international focus on pollination services has been mostly driven by the benefits in terms of food products. In this context, understanding the relationships between pollination services and crop yield is crucial to quantify how changing pollinators' populations will affect food provision. Considering global crop markets, pollinated crops often record higher
prices than other crops “with the greatest benefits in southern and eastern Asia and Mediterranean Europe, owing to greater production of highly pollinator-dependent crops and higher market prices”.
Alien species are organisms outside their natural range across ecological barriers due to direct or indirect human action. In their new environment, some species can be become established, spread rapidly, and cause a significant negative impact on the ecology of their new location as well as serious economic and social consequences – so called “invasive alien species” (IAS). The Asian hornet (Vespa velutina nigrithorax) was accidentally introduced in Europe from Asia. It was first observed in south-western France in 2004 and has since rapidly spread to Spain, Portugal, Belgium, the Netherlands, Germany, Italy and the UK. The Asian hornet is listed as an IAS of EU concern in the frame of the EU Regulation 1143/2014 (IAS Regulation) which means that EU countries have to take actions to eradicate this species.
The ES accounting side
KIP INCA has developed supply and use tables for a number of ES, including “crop pollination”. Crop pollination potential is based on an indicator of habitat suitability to support wild insect pollinators. This indicator integrates two different models: expert-based model for solitary bees (computed with ESTIMAP toolbox) and a species distribution model for bumblebees, predicted with observed species records. Both models are based on land cover, climate data, and on the distance to semi-natural areas.
The list of regions affected by the Asian hornet is based on the spatial assessment of the actual flow. There are some regions where there are pollinator-dependent crops but not habitat suitable for pollination (ES unmet demand); there are regions with habitat suitable for pollinators but without pollinator-dependent crops. Both cases will not be considered in the economic impact assessment because although affected by Asian hornet invasion this is not playing a role in terms of reduction for some specific crops.
The impact of Asian hornet is assessed by applying a predation rate to the pollination service flow in those regions affected by IAS. Now two policy questions are possible. The first question is: how much income was missed due to the presence of the Asian hornet? To respond, we need to confront the total production of pollinator-dependent crops in the country and the Predation in affected countries. The second question is: what happens the Asian hornet extends its invasion to other regions within each country? In this case, we need to calculate the value of Predation in all the

71
other regions that are not currently affected, and then relate it to the total production.
The linkage with economic modelling
The following step is to bridge ES accounts with GTAP [3] variables to assess economic impacts driven by changes in ES flows. In the case of pollination, an external shock affects the ES use which in turns affect the SNA benefit which enters into the production system. This is possible thanks to ES accounts, which enable spatial quantification of ES flows for crops and regions and the changes in these flows. These changes will be used to “shock” (i.e. to apply a change in percentage terms to specific sectors in specific countries) the production for the sectors supplying those crops in the GTAP system.
Before using GTAP model and database, it is necessary to harmonize classifications and aggregations. First, we need to aggregate (i) the database in GTAP according to the specifications of this exercise, and (ii) the pollination accounts according to the GTAP classification. For this exercise, the drawback of GTAP database lies in the high aggregation of sectors, that in our case requires more processing to avoid overestimating. Once we have calculated the percentage of “missed gains” and “hypothetical loss” and set the database as just described, we choose the variables in the GTAP model to be shocked by those percentages. We need to consider changes in output (yield) everything else being equal. The two hypotheses are run, and results are presented for: Production (q0), Import prices (pms), Export quantity (qxs).
The purpose of this exercise is to bridge ES accounts to economic modelling. ES accounts are structured to be consistent with SNA that is in turn the source of data for economic modelling and analysis. Thanks to the rigorousness of the accounting framework, when the benefit of an ES is an SNA product, the linkage is straightforward, as shown in the example of invasive alien species.
Links
1 https://seea.un.org/ecosystem-accounting
2 https://ecosystem-accounts.jrc.ec.europa.eu/
3 https://www.gtap.agecon.purdue.edu/about/project.asp
An Integrated Modelling System to evaluate health and environmental impacts from air pollution in Italy
Ilaria D’Elia, Maurizio Gualtieri, Antonio Piersanti, Gabriele Zanini, ENEA, Italian National Agency for New Technologies, Energy and Sustainable Economic Development Emanuele Peschi, ISPRA, Italian Institute for Environmental Protection and Research Gregor Kiesewetter, Robert Sander, IIASA, International Institute for Applied Systems Analysis
The complexity of the interactions and feedbacks of human activities with/to the environment and the need to have integrated policies, such as the European Green Deal, the National Climate and Energy Integrated Plan and the Long Term Strategy, to tackle the resulting/emerging negative effects on air quality and climate require urgently the development of modelling tools that can apply holistic approaches to analyse the impacts of environmental stressors on health and other targets (such as vegetation and cultural heritage buildings).
Integrated models are a potent tool for assessing the potential effects of new policies and measures aiming at reducing air pollution and climate change and their relative impacts.
In Italy, we have developed an integrated modelling system, MINNI, supporting policymakers to design National and local Air Pollution Reduction Plans. MINNI is used to evaluate different sets of adopted measures in reducing emissions with respect to the attainment of both the Air Quality Standards and the National Emission Ceilings Directive targets. This system is based on the full run of the chemical transport model AMS-MINNI (Atmospheric Modelling System, Mircea et al., 2014; 2016) and on the GAINS-Italy model (D’Elia et al., 2009; Ciucci et al., 2016) that contains atmospheric transfer matrices, simplified source-receptor relationships that link emissions and concentrations/depositions. This integrated approach can be applied to assess the overall positive benefits (environmental, health and economic) determined by policies targeting air quality, energy and climate goals.
In a recent study (Piersanti et al., 2021), we evaluated at regional level the environmental benefits, the expected health impacts and the consequent economic benefits (reduced costs for dealing with the expected attributable cases) arising from the “With Measures (WM)” and “With Additional Measures (WAM)” scenarios elaborated in the first Italian National Air Pollution Control Programme (NAPCP), which integrates energy, climate and air-pollution policies. We showed that the WAM scenario leads to a significant reduction of air pollutant concentrations and mortality for
72
all the analysed pollutants which could determine an economical benefit equal to 2% of Italian 2010 GDP.
In our perspective, the avoided socioeconomic costs should be an additional driver for selecting the most appropriate control strategies integrating energy, climate and air pollution policies to reduce negative impacts.
The same modelling system was successfully deployed to understand the effect on emissions and air pollutant concentrations in Italy of the measures adopted during the first lockdown of COVID-19 pandemic (PULVIRUS project) and to assess the effect of nature-based solutions (urban forests) on climate and air quality in Mediterranean cities (Life+ VEG-GAP project). These projects tested the robustness of model responses for policy support, both on short term severe emission reductions and on long term air quality plans.
References
Ciucci, A., D'Elia, I., Wagner, F., Sander, R., Ciancarella, L., Zanini, G., Schöpp, W., 2016. Cost-effective reductions of PM2.5 concentrations and exposure in Italy. Atmospheric Environment, 140, 84-93, https://doi.org/10.1016/j.atmosenv.2016.05.049.
D'Elia, I., Bencardino, M., Ciancarella, L., Contaldi, M., Vialetto, G., 2009. Technical and Non-Technical Measures for air pollution emission reduction: The integrated assessment of the regional Air Quality Management Plans through the Italian national model. Atmospheric Environment, 43, 6182-6189, ISSN 1352-2310, http://dx.doi.org/10.1016/j.atmosenv.2009.09.003.
D'Elia, I., Piersanti, A., Briganti, G., Cappelletti, A., Ciancarella, L., Peschi, E., 2018. Evaluation of mitigation measures for air quality in Italy in 2020 and 2030. Atmospheric Pollution Research, 9, 977-988, http://dx.doi.org/10.1016/j.apr.2018.03.002.
Mircea, M., Ciancarella, L., Briganti, G., Calori, G., Cappelletti, A., Cionni, I., Costa, M., Cremona, G., D'Isidoro, M., Finardi, S., Pace, G., Piersanti, A., Righini, G., Silibello, C., Vitali, L., Zanini, G., 2014. Assessment of the AMS-MINNI system capabilities to predict air quality over Italy for the calendar year 2005. Atmospheric Environment, 84, 178–188, ISSN 1352-2310, http://dx.doi.org/10.1016/j.atmosenv.2013.11.006.
Mircea, M., Grigoras, G., D’Isidoro, M., Righini, G., Adani, M., Briganti, G., Ciancarella, L., Cappelletti, A., Calori, G., Cionni, I., Finardi, S., Larsen, B.R., Pace, G., Perrino, C., Piersanti, A., Silibello, C., Zanini, G., 2016. Impact of grid resolution on aerosol predictions: a case study over italy. Aerosol and Air Quality Research, 16, 1253–1267, https://doi.org/10.4209/aaqr.2015.02.0058.
Piersanti, A.; D’Elia, I.; Gualtieri, M.; Briganti, G.; Cappelletti, A.; Zanini, G.; Ciancarella, L. The Italian National Air Pollution Control Programme: Air Quality, Health Impact and Cost Assessment. Atmosphere 2021, 12, 196. https://doi.org/10.3390/atmos12020196
An integrated modelling framework to assess carbon emissions and removals in the European Agriculture, Forestry and Land Use sectors
Ana Luisa Barbosa, Ignacio Perez-Dominguez, Amarendra Sahoo, Sarah Mubareka, Viorel Blujdea, Giulia Fiorese, Roberto Pilli, Giacomo Grassi, Raffaele Salvucci, Joint Research Centre, European Commission Monika Kesting, Peter Witzke, EuroCARE Bonn GmbH, Germany Maarten Hilferlink, Object Vision BV, Amsterdam, The Netherlands
Abstract
Land use and forestry activities have been intensified and are expected to further expand to meet the future demand for materials, food, feed, and energy, but not without affecting their carbon footprint. The Agriculture, Forestry and Other Land Use (AFOLU) sectors can contribute to climate change mitigation goals, since they include activities that cause greenhouse gas emissions and removals. This study aims at refining and improving existing methodologies covering emissions and removals from these sectors in the EU. Different experiments are proposed within an integrated modelling framework to investigate the effects of the variation in one model output on downstream models. The proposed modeling framework aligns and links stand-alone models and facilitates the implementation of integrated policy scenarios towards climate neutrality.
Introduction
Land use and forestry activities have been intensified and are expected to further expand to meet the future demand for materials, food, feed and energy, but not without affecting the environment (Hurtt et al. 2020). Any additional biomass demand will have to be satisfied by either increasing the domestic production, better use of mobilized resources or through imports from third countries and the relative environmental impacts and spillovers that are still poorly understood (Fuchs, Brown, and Rounsevell 2020).
In the EU, Agriculture, Forestry and Other Land Use (AFOLU) related activities are a significant net source of greenhouse gas (GHG) emissions, with land use change and forestry being responsible for both emissions and removals of carbon dioxide (CO2). Agriculture represents a major source of methane (CH4) and nitrous oxide (N2O) emissions. A study by Strapasson et al. (2020) recognized the underrepresentation of land use as major option for carbon mitigation in EU policy and observed important long run mitigation impacts from reducing meat consumption as well as using efficient cropping techniques and re-allocating land to forests and soil carbon storage.

73
Objectives
The main objective of this study is to refine and improve the representation in existing methodologies of the AFOLU emissions and removals in the EU. More specifically, it attempts to develop a modelling framework integrating
different sectoral stand-alone models used at the JRC for policy impact assessment in the fields of agriculture, forestry, land use change and energy with a resolution at regional and national scale.
Methodology
Four models are considered within the proposed framework. First, the Common Agricultural Policy Regionalized Impact (CAPRI) modelling system is a widely used large-scale multi-commodity agricultural economic model (W. Britz and Witzke 2014). Second, the Land Use-based Integrated Sustainability Assessment modelling platform for Bioeconomy and Ecosystem Services (LUISA-BEES) is primarily used to assess land use change in the EU. This model’s origins, as they were developed for the European Commission in 2010, are described in Perez-Soba et al. (2010) and this Land allocation in the LUISA-BEES model is based on the Dyna-CLUE model (Verburg and Overmars 2009). Third, the Carbon Budget Model (CBM) is a stand-alone forestry model that simulates forest management and growth, and the ensuing carbon dynamics (Pilli et al. 2016). Finally, the Policy Oriented Tool for Energy and Climate Change Impact Assessment (POTEnCIA) model depicts a detailed EU energy system combining both techno-economic modules (Mantzos L et al., 2016).
As a ‘proof of integration’, we describe the improvement of the CAPRI land use function and harmonization of related database such as to be linked to the output from the LUISA-BEES model. The alignment of CAPRI and LUISA-BEES takes place on three areas: land uses areas projections, land use transitions and agricultural land rental costs.
The CBM model plays a strategic role as a data supplier assuming sustainable forestry practices. On the one side, it supplies CAPRI with forestry-related emission factors, i.e. an approach allowing direct estimation of the sink as function of the harvest. Factors are derived from the linear regression of the forest C sink estimated from CBM over the historical and three different scenarios of future amount of harvest, pooling together. On the other side, it informs POTEnCIA on the forest biomass that could potentially be available for energy purposes under applicable silvicultural practices. CThe current version works on the maximum amount of supply without decreasing the forest growing stock of the Forest Area Available for Wood Supply (FAWS).
The POTEnCIA model provides biomass (for energy use) consumption projections under different scenario assumptions to CBM and LUISA-BEES, besides integrating first generation biofuel supply
cost curves at Member State level based on CAPRI simulations (i.e. biodiesel and ethanol).
To test the proposed modelling framework, we propose a set of experiments to investigate how the variation in one model output can be attributed to variations of the output from another model. The tests will quantify and explore different paths assuming a decrease/increase in demand of biomass for energy and assess the resulting carbon sink and carbon emission.
Discussion
The proposed framework is not only to harmonize the databases and specifications of these stand-alone models, but also to facilitate the implementation of several integrated policy scenarios. The main elements that allow these four models to ‘communicate’ are forest sink, biomass demand, agricultural and forest land use allocation, food demand, land prices and forest dynamics. Beyond facilitating a novel integrated analysis of important policy questions, this exchange of information will improve the harmonization of model databases and results.
Several aspects of model integration are identified, key challenges are briefly described with respect to the problems they raise for constructing integrated modelling environment. Such a framework will facilitate and improve the capability of assessing GHG emissions and removals resulting from complex interactions between AFOLU sectors and facilitate the analysis of policy scenarios relevant for a sustainable and carbon-neutral European economy.
References
Fuchs, R., Brown, C., & Rounsevell, M. (2020). Europe’s Green Deal offshores environmental damage to other nations. In Nature. https://doi.org/10.1038/d41586-020-02991-1
Hurtt, G. C., Chini, L., Sahajpal, R., Frolking, S., Bodirsky, B. L., Calvin, K., Doelman, J. C., Fisk, J., Fujimori, S., Klein Goldewijk, K., Hasegawa, T., Havlik, P., Heinimann, A., Humpenöder, F., Jungclaus, J., Kaplan, J. O., Kennedy, J., Krisztin, T., Lawrence, D., … Zhang, X. (2020). Harmonization of global land use change and management for the period 850–2100 (LUH2) for CMIP6. Geoscientific Model Development, 13(11), 5425–5464. https://doi.org/10.5194/gmd-13-5425-2020
Mantzos L, Wiesenthal T, Kourti I, Matei N, Navajas Cawood E, Papafragkou A, Rózsai M, Russ H, & Soria Ramirez A. (2016). POTEnCIA model description - version 0.9. https://publications.jrc.ec.europa.eu/repository/handle/JRC100638
Perez-Soba, M., Verburg, P. H. , Koomen, E. , Hilfernik, M. , Benito, P. , Lesschen, J. P. , & Banse, M. et al. (2010). Land use modelling - implementation; Preserving and enhancing the
74
environmental benefits of land-user services. https://www.researchgate.net/publication/241851146_Land_use_modelling_-_implementation_Preserving_and_enhancing_the_environmental_benefits_of_land-user_services
Pilli, R., Grassi, G., Kurz, W. A., Moris, J. v., & Viñas, R. A. (2016). Modelling forest carbon stock changes as affected by harvest and natural disturbances. II. EU-level analysis. Carbon Balance and Management 2016 11:1, 11(1), 1–19. https://doi.org/10.1186/S13021-016-0059-4
Sahoo, A., Perez-Dominguez, I., Mubareka, S., Fiorese, G., Grassi, G., Pilli, R., Himics, M., Blujdea, V., Follador, M., & Neuwahl, F. (2021). No TitleImproved Modelling Framework for Assessing the Interaction between the Energy, Agriculture, Forestry and Land Use Change Sectors: Integrating the CAPRI, LUISA-BEES, CBM and POTEnCIA models.
Strapasson, A., Woods, J., Meessen, J., Mwabonje, O., Baudry, G., & Mbuk, K. (2020). EU land use futures: modelling food, bioenergy and carbon dynamics. Energy Strategy Reviews. https://doi.org/10.1016/j.esr.2020.100545
Verburg, P. H., & Overmars, K. P. (2009). Combining top-down and bottom-up dynamics in land use modeling: exploring the future of abandoned farmlands in Europe with the Dyna-CLUE model. Landscape Ecology, 24(9), 1167–1181. https://doi.org/10.1007/S10980-009-9355-7
W. Britz, & Witzke, P. (2014). CAPRI model documentation2014 : Table of Contents. http://www.capri-model.org/dokuwiki/doku.php?id=capri:capri_pub#pap
The use of an integrated modelling approach (CGE, sectoral) to support developing long-term climate strategies up to 2050
Jakub Boratyński, Robert Jeszke, Paweł Kobus, Maciej Pyrka, Wojciech Rabiega, Igor Tatarewicz, Adam Wąs, Jan Witajewski-Baltvilks, The National Centre for Emissions Management (KOBiZE)
Achieving climate neutrality requires fundamental changes in sectors of energy, transport, agriculture and industry. Sectoral level analysis can inform policy makers about sector abatement potentials at given point in time and signal to them what structural changes could be expected in each sector in short-, mid- and long-term.
However, sectoral analysis could be misguiding, if it is done in isolation because it ignores changes in prices and changes in demand for sectoral output that are induced by the mitigation effort in other sectors. One obvious example of inter-sectoral dependency is the additional demand for electricity induced by electrification of transport and industry. Another example, related to the previous one, is the change in mitigation costs in transport and industry after change in electricity price due to adoption of low-carbon options in the energy sector. Yet, another example is the change in the cost structure in the production of different agricultural commodities due to changes in sectoral outputs of other sectors. Perhaps, the
most important case of sectoral interlinkage within sectors covered by EU ETS is the dependence of the scope of changes in each sector on the price of emission allowance which is driven by demand for allowances in other sectors.
The inclusion of cross-sectoral linkages in modelling of mitigation pathways is necessary for delivering reliable and accurate projections to policymakers and sectoral stakeholders. Information on cross-sectoral effects allows to indicate the role of various mitigation options in different sectors. For instance, increase in price of electricity implies that firms will rely less on electrification and more on investment in energy-efficiency improvements compared to the projections that ignores the increase in price. As another example, steeply increasing abatement costs in the industry in 2040s imply higher prices of EU emission allowances and higher profitability and earlier adoption of Bioenergy with carbon capture and storage (BECCS) in the energy sector. Accurate projections of the demand for technologies are essential for policymakers because they inform them which technologies require accumulation of resources and competences in the nearest future. Furthermore, the analysis that integrates all the effects provides a more complete and internally consistent picture of the European transition in next thirty years.
In our study we integrate three sectoral models: energy, transport and agriculture, with a Computable General Equilibrium model of the global economy (d-PLACE) [1] to obtain projections of changes at the sectoral and macroeconomic level between 2020 and 2050 under climate neutrality target. Energy sector is covered using an energy system optimization model (MESSA) [2] that projects cost-minimizing path of technology deployment in the sector, capital requirement and production costs. Changes in the transport sector are modelled using the TR3E model [3] that simulates the choices of consumer and freight companies and delivers projections on diffusion of various types of vehicles and their fuel and electricity use. Agriculture is analysed with a partial equilibrium model (EPICA) [4] that predicts how profit-maximizing farms would change supply of a range of agricultural commodities in responses to climate policy, predicts changes in prices and consumers demand. Finally, the CGE model takes into account the possibilities of substitution between factors of production in all sectors of the economy, substitution between fuels, some explicit mitigation options in energy-intensive industries (CCS and hydrogen), demand by consumers and other industries and, most importantly, adjustments of all prices (including wages) in general equilibrium setting. Our analysis is concentrated on Poland up to 2050, although

75
we take into account changes in energy and transport sector in all major EU regions as well as intra-EU trade and trade with outside EU regions.
The individual models are separate tools that can be used independently. Their connection is based on sequential solving: in each iteration step, first CGE model is solved to provide information on price of emission allowances and prices and demand for commodities (including demand for energy). Next, this information is used by sectoral models to project changes in emissions and demand for inputs (e.g. demand for energy and hydrogen in transport sector). The output of sectoral models is used as an input in CGE model in the next iteration step. The iterations continue until convergence in prices is obtained. At each iteration information transferred between models covers the entire simulation time horizon (up to 2050), and all EU regions and EU ETS countries (except for the agricultural sector covering only Poland).
Prices of emission allowances in our model are equal to marginal abatement costs. The prices are determined separately for several emission markets: one price for all EU sectors covered by the EU ETS and one price in each region for all remaining non-ETS sectors (including transport and agriculture). The reduction targets for each of these markets were computed using the assumption that are consistent with most ambitious EU policy plans (whenever such were defined) and by extrapolating planned emission reductions (whenever plans for policies are missing).
Our analysis highlights the role of technologies such as BECCS, CCS in industry and hydrogen, which are critical for the transition in 2030s and 2040s. It also suggests very high costs (above 1000 EUR per tCO2eq) of abatement in non-ETS sectors, which are mostly due to relatively inelastic demand for agricultural products and an inertia of changes in the stock of vehicles in the transportation sector. If reduction in these sectors is achieved through introduction of a carbon price,
it could result in large change in prices for consumers leading, potentially, to social resistance against low-carbon transition. This last result highlights the need to design policies that could shield most vulnerable consumers.
In addition our analysis covers to the topic of transition costs for workers. Limiting the temperature rise below 1.5 degrees by the end of century would require a drop in global consumption of coal by 75% between 2010 and 2030, according to the projections of integrated assessment models. Given little change in coal consumption between 2010 and 2020, majority of the drop must be scheduled for the coming decade. Such massive drop in a short period of time implies that workers in the mining sector will lose jobs and need to look for another employment.
Workers in mining who are forced to move to other sectors will receive lower wages than they receive currently. Those workers possesses specific skills shaped by their experience, education and personal traits. The return to those skills differ between economic sectors. According to microeconomic theory, the ranking of those returns across sectors is revealed by workers’ current choices: if they decide to stay in that sector, it must be that it offers highest possible return given their skills. Moving to the sector of second choice involves lower return and hence lower wages. In our analysis we estimate this cost using a CGE framework.
Links
1 https://climatecake.ios.edu.pl/wp-content/uploads/2020/05/CAKE_d-PLACE_model_documentation-1.pdf
2 https://climatecake.ios.edu.pl/wp-content/uploads/2020/05/CAKE_MEESA_energy-model_documentation.pdf
3 https://climatecake.ios.edu.pl/wp-content/uploads/2020/05/CAKE_TR3E_documentation.pdf
4 https://climatecake.ios.edu.pl/wp-content/uploads/2020/12/CAKE_EPICA_model_documentation_.pdf

76
Session 7
Using model related evidence for policy: processes and experiences
25 November
11:00 – 12:45

77
Enhancing the DIONE cost model in support of Car and Van CO2 Standards for the Fit for 55 package
Jette Krause, Georgios Fontaras, Joint Research Centre, European Commission
The JRC’s DIONE cost model was developed to quantify the costs of reducing road vehicle CO2 emissions and energy consumption [1,2]. Such costs are calculated for vehicle users, manufacturers, and society. The present paper describes new model enhancements made to support the analytical work of the impact assessment performed to support DG CLIMA1 for the revision of the car and van post-2020 CO2 emission standards. The revision is part of the European Commission’s Fit for 55 package. In particular, the DIONE model was used to analyse net economic savings from societal and end-user perspectives and costs for automotive manufacturers resulting from different target levels and zero- and low emission vehicle (ZLEV)
1 The DIONE cost model was developed and previously employed to analyse economic impacts of the current regulations setting CO2 standards for light-duty vehicles (Regulation (EU) 2019/631) and heavy-duty vehicles (Regulation (EU) 2019/1242).
incentive options. To capture such options, the DIONE model had to be updated to consistently cover interactions across the different initiatives within the Fit for 55 package, and to reflect recent trends, as described below.
1) Update and extension of CO2emission/energy consumption reduction costcurves
The DIONE Cost Curve Model was run to update previous car and van cost curves. In particular, the recent decrease of battery costs was reflected, in line with the assumptions made in the EU Reference scenario 2020, by updating the cost curves for advanced electrified vehicles (including plug-in hybrid and range extended electrified vehicles, as well as battery electric vehicles). Cost curves for all powertrains, conventional as well as electrified, were extended up to the year 2050 (previously 2030). Indicative cost curves for lower medium battery electric cars are shown in Figure 12
2 The DIONE cost curves show the costs of energy consumption savings relative to a conventional 2013 new vehicle.
Figure 1: Energy Consumption Reduction Cost Curves compatible with EU REF2020 scenario, for lower medium battery electric cars. Source: JRC DIONE model

78
2) Extension of DIONE total cost ofownership calculations
In contrast to the previous impact assessments where DIONE was employed to calculate total costs of ownership (TCO) [3,4], the present analysis was carried out within the context of other initiatives for the EU energy system, which impact fuel and electricity prices, including (i) a strengthening of the EU emissions trading system (EU ETS), (ii) an emissions trading scheme for road transport and buildings, and (iii) an increased use of renewable fuels in road transport required under the Renewable Energy Directive (RED).
Therefore, it was necessary to adapt DIONE total cost of ownership calculations to reflect such interactions by using two energy and fuel price trajectories, namely a baseline reflecting the EU reference scenario 2020 trends, as well as an “all policies” price trajectory aligned with the settings of the MIX policy scenario developed for the Fit for 55 analytic work.
Two DIONE TCO output versions were calculated for the 2021 car and van CO2 standards impact assessment:
• One “car and van CO2 standards only” version,which takes into account the costs and savingsdue to the more stringent standards, but noimpacts from other policies within the Fit for55 package.
• One “all policies” version reflecting thecombined cost impacts of the Fit for 55package initiatives on vehicle users andsociety.
Further changes to the model include the extension of TCO calculations to the year 2040 (previously 2030), and the addition of the perspective of a third vehicle owner using the vehicle between its 10th and 15th life year. This perspective complemented the previously available perspectives of the first (vehicle life year 1-5) and second end-user (life year 6-10), andsociety (over vehicle lifetime).
Roughly thirty scenarios varying in vehicle fleet composition, target levels, settings for ZLEV mandates, Euro standard settings and fuel/energy price trajectories were run in support of the present car and van CO2 standards impact assessment. The final results are directly integrated into the analysis of economic impacts in the IA staff working document.
References
[1] Krause, J., Donati, A.V., Thiel, C. (2017), Light Duty VehicleCO2 Emission Reduction Cost Curves and Cost Assessment -the DIONE Model, EUR 28821 EN, Publications Office of theEuropean Union, Luxembourg, doi:10.2760/462088,JRC108725
[2] Krause, J., Donati, A.V. (2018), Heavy duty vehicle CO2emission reduction cost curves and cost assessment –enhancement of the DIONE model, EUR 29284 EN, PublicationsOffice of the European Union, Luxembourg,doi:10.2760/555936, JRC112013
[3] Commission Staff Working Document, Impact Assessment,Annexes. Accompanying the document “Proposal for aRegulation of the European Parliament and of the Councilsetting emission performance standards for new passengercars and for new light commercial vehicles as part of theUnion's integrated approach to reduce CO2 emissions fromlight-duty vehicles and amending Regulation (EC) No 715/2007(recast)”, SWD(2017) 650 final
[4] Commission Staff Working Document, Impact Assessment.Accompanying the document “Proposal for a Regulation of theEuropean Parliament and of the Council setting CO2 emissionperformance standards for new heavy duty vehicles”,SWD(2018) 185 final
Fossil fuels subsidy removal and the EU Green Deal policy mix design
Alessandro Antimiani, Directorate General for Trade, European Commission Valeria Costantini, Department of Economics, Roma Tre University Elena Paglialunga, Department of Economics, Politics, Society, University of Urbino
The European Union (EU) is a key player in the international climate negotiations and its efforts in achieving ambitious mitigation targets have been a driving factor in directing the bargaining process towards a global cooperative solution to prevent climate change, as clearly emerged during the Paris Agreement (PA) discussions. Given the attitude of EU institutions to anticipate compulsory obligations under the international treaties with voluntary measures designed to reduce the transaction costs, the recent climate and energy plan known as the EU Green Deal (EGD) represents an ambitious long-term strategy with the primary objective to ensure the complete decarbonisation of the EU by aligning investors and beneficiaries and achieve considerable societal gains (EC, 2019). Given that a sustainable economic growth is the underlying rationale of the EGD, the actions listed in the roadmap to make Europe the first climate-neutral continent by 2050 must be accompanied by complementary measures to assist the economic and industrial transformation.
Together with standard market-based instruments, as the carbon pricing mechanism already into force under the Emissions Trading Scheme (ETS), the EGD encompasses an investment strategy to sustain key economic sectors with high technological content and a radical shift from fossil fuels to renewable energy sources, according to the proposal for a “Sustainable Europe Investment Plan" (EC, 2020).
79
The effectiveness of such a complex policy mix that envisages the simultaneous functioning of several complementary measures is difficult to evaluate, given that multiple economic mechanisms as well as different sectors and agents are involved (Böhringer et al., 2016). The barriers for a successful transition toward a more sustainable pattern depend on the structural features of the economic system, but also on the potential contrasting effects that the multiple interventions planned may activate (Rosenow et al., 2017). Accordingly, policy optimality should be investigated with a broad analytical framework that allows capturing additional aspects such as coherence and consistency (Rogge and Reichardt, 2016). An optimal climate policy portfolio should include both carbon pricing and public support for CETs because the former can stimulate demand for low-emission technologies, their diffusion and adoption, while the latter can address knowledge-related market failures, thus providing enough incentives for radical innovation and backstop technologies in the long-term (Gerlagh et al., 2014). The recent development of the EU climate strategy has fully integrated the R&D support instrument within the policy portfolio in the form of the Innovation Fund (IF), created as a funding programme for the development of innovative low-carbon technologies to complement EU Members domestic investments (EC, 2019). These two elements of the EU climate policy have been formerly analysed in their effectiveness and efficacy, but the potential benefits coming from their simultaneous implementation have been rarely addressed. The aim of the present analysis is to fill this gap by proposing an empirical assessment of the interaction between the removal of fossil-fuel consumption subsidies and the public support to R&D activities for CETs development using a dynamic recursive Computable General Equilibrium (CGE) model. By comparing different combinations of instruments forming the climate policy, we provide a quantification of the cost effectiveness of alternative solutions associated to the more stringent EU decarbonisation pathway. An energy-economic dynamic CGE model is developed merging GTAP utilities for the energy sector and related greenhouse gas emissions. The model is used for simulating several policy scenarios starting from a business as usual case where the economic impacts related to the COVID-19 pandemic for 2020 are included. The instruments tested as part of the EU Green Deal are the removal of consumption subsidies to fossil fuels (Chepeliev and van der Mensbrugghe, 2020), a carbon price and the public support to clean energy technologies. Our results show that the best performances are obtained if the EGD is fully implemented, meaning that in addition to a properly functioning ETS, subsidies directed to
fossil fuels are completely phased out, and the revenues resulting from the carbon pricing together with the budget saving from the removed subsidies are devoted to foster CETs development through the Innovation Fund. In this way, the resulting policy mix allows the EU to achieve the environmental targets at the lower costs. The synergies arising from energy efficiency gains, the larger contribution of renewable sources and the reduction in fossil fuels consumption all contribute in reducing the cost of transition. When the three pillars are simultaneously included, we reach the most favourable condition also in terms of economic growth and register the highest GDP gain with respect to the BAU case. Additional positive effects can be highlighted by looking at the global externalities resulting from the implementation of the unilateral EU climate policy. Without an adequate support scheme for the development of CETs (or, in other terms, excluding the revenue recycling mechanism operating through the IF), the EU climate targets set under the Paris Agreement can be achieved only at the cost of increasing emissions elsewhere in the world. On the opposite, the positive indirect effects resulting from the implementation of the full EGD policy mix through trade-induced knowledge spillover will lead to a net carbon reduction at the world level. Developing countries might gain significant macro-economic benefits from this knowledge transfer effect, improving their technological capabilities and fostering the domestic deployment of green technologies to reduce their mitigation costs (Paroussos et al., 2019).
References
Böhringer, C., Keller, A., Bortolamedi, M., and Sey arth, A. R. (2016). Good things do not always come in threes: On the excess cost of overlapping regulation in EU climate policy. Energy Policy, 94:502{508.
Chepeliev, M. and van der Mensbrugghe, D. (2020). Global fossil-fuel subsidy reform and Paris Agreement. Energy Economics, 85:104598.
EC (2019). Communication from the Commission. The European Green Deal. COM(2019)640 final, European Commission, Bruxelles.
EC (2020). Communication from the Commission. Sustainable Europe Investment Plan - European Green Deal Investment Plan. COM(2020)21 final, European Commission, Bruxelles.
Gerlagh, R., Kverndokk, S., and Rosendahl, K. E. (2014). The optimal time path of clean energy R&D policy when patents have finite lifetime. Journal of Environmental Economics and Management, 67(1):2{19.
Rogge, K. S. and Reichardt, K. (2016). Policy mixes for sustainability transitions: An extended concept and framework for analysis. Research Policy, 45(8):1620{1635.
Rosenow, J., Kern, F., and Rogge, K. (2017). The need for comprehensive and well targeted instrument mixes to stimulate energy transitions: The case of energy efficiency policy. Energy Research & Social Science, 33:95{104.
80
Innovative models to estimate COVID-19 Impact on International Trade
Francesco Amato (1), Federico Brogi (1), Mauro Bruno (1), Erika Cerasti (1), Maria Serena Causo (1), Fabrizio De Fausti (1), Barbara Guardabascio (2), Paolo Pizzo (1), Monica Scannapieco (1), Diego Zardetto (1) (1) ISTAT(2) University of Perugia
Over the last years trade has grown remarkably, completely transforming the global economy. Today about one fourth of total global production is exported. International production, trade and investments are increasingly entangled in the global value chains (GVCs), with different stages of production and distribution processes being located across different countries. The advantage of this new economic organization is well known: firms gain economic advantages via foreign direct investments, i.e. by locating different production stages in different countries where production specialization or profitable job market offer major opportunities, or changing their production processes by outsourcing abroad.
At the beginning of 2020, China lockdown produced both trade and production slowdown at global level, together with the disruption in supply of important consumer goods needed for the emergency, as personal protective equipment, and medical devices. Later in 2020, while pandemic spread all around the world, the economic shock invested many production systems, while China quick recovery gave the country an even more central and strategic role in the GVC, as supplier of products mostly needed during the pandemic.
In this framework, it is extremely important for policy makers to have appropriate tools to analyse the evolving structure of GVC and develop strategies for reducing disruption risks or for finding new opportunities for re-allocation or creation of new connections in the production chain.
Methodology
We studied several methods to develop a complete set of tools for policy makers that allow to analyse international trade relations both at macro and micro level.
At macro level, social networks analysis techniques were used in order to investigate both the effect of shocks in transportation and the effects of relation disruptions on international trade of different classes of commodities. More in details, we exploit graph theory to model the structure of trade networks. We used “Monthly COMEXT data by Means of Transport” to build graphs representing international trade relations and use standard graph measures as economic indicators to characterize the relations structure.
Graphs and measures are built and provided according to several relevant trade dimensions, such as means of transport and product of interest; the resulting interactive tool allows to evaluate the impact of actions (i.e., political and economic decisions) on the relations network for scenario analysis and to evaluate and detect changes in the role of intermediate trade countries (graph nodes).
At micro level, by analysing google mobility data we provided a policy indicator representing the restriction imposed by COVID-19 pandemic. More in details, we performed a Principal Component Analysis to construct an indicator able to explain the level of restriction imposed by the selected country. The policy indicator, whose values belong to the interval [0,1], will be the main regressor to be included in an interrupted time series approach for estimating the effect of COVID-19 pandemic on import and export of a selected country.
We used an Interrupted time series model to estimate the quantitative COVID-19 effect on import and export by UE country, commercial partner and broad economic categories (BEC) classification that splits out products in the following categories: Food and Beverages, Industrial Supplies, Fuels and Lubricants, Capital Goods, Transport Equipment, Consumer Goods.
The main characteristic of an interrupted time series model is the possibility to study two different trends, one reflecting the state of things, and another one called counterfactual that helps us to answer the following crucial question: "what would have happened without COVID-19?". The distance between these two trends reflects the impact of COVID-19.
Data
Data sources on international trade in goods consist of both EU official statistics data and experimental statistical tables developed by Eurostat. EU trade data are freely available through COMEXT, the Eurostat dedicated data-warehouse, updated monthly.
Eurostat’s experimental statistical tables FIGARO are also exploited. FIGARO tables are inter-country supply, use, input-output tables, produced by Eurostat starting from official data using appropriate methods to estimate the globalized structure of production and marketing phenomena and provide, at the same time, a reconciliation of asymmetries observed in official trade data.
FIGARO tables are aggregated in terms of products and time (annual) and do not consider important trade dimensions as the mean of transport. Therefore, to exploit them, a new experimental data structure has been built from COMEXT detailed data and FIGARO tables.

81
Google COVID-19 Mobility Report data, available since the beginning of the pandemic, include 6 daily time series whose time span is since 15.2.2020 until today. These series provide the daily variations that show how visits to several places is changing in each geographic region since February 2020 due to the pandemic spread. The categories of places, useful to social distancing efforts, define mobility trends for: Grocery & pharmacy, Parks, Transit stations, Retail & recreation, Residential, Workplaces.
Results
Once, different graphs have been constructed, we get several centrality measures as output: Product spread (density of the graph), Vulnerability (1-indegree centrality), Exportation strength (outdegree centrality), Hubness (betweenness centrality).
At micro level, we get values for estimated monthly and cumulative effect (up to the latest available COMEXT month), nowcasting of the series using the available monthly Policy Indicator (following the latest COMEXT data) and forecasting up to an additional 6 months.
To complete these results, the models illustrated above are accessible in an open-source dashboard implemented as part of the Eurostat Big Data Hackaton 2021. The dashboard is built with microservices technology and its source codes are available on Github at the link https://github.com/istat-methodology/cosmopolitics.
Environmental, economic and distributional implications of gradual energy tax reform in the EU
Toon Vandyck (1), Marie Tamba (1), Ignacio Hidalgo Gonzalez (1), Sofia Maier (1), Luis Rey Los Santos (1), Mattia Ricci (1), Fabian Wagner (2), Krzyszof Wojtowicz (1), Matthias Weitzel (1) (1) Joint Research Centre, European Commission(2) International Institute for Applied Systems Analysis (IIASA)
Under the banner of the Green Deal, the EU is charting out the road to net climate neutrality by mid-century. As an intermediate milestone, policymakers have set the target to reduce greenhouse gas emissions by 55% by 2030 compared to 1990 levels. In order to reach this target, the European Commission is devising a comprehensive set of policy measures, also known as the ‘Fit for 55’ package, a proposal to be launched over the summer. This package will overhaul the existing climate and energy legislation of the EU and contains several policy
initiatives to further decrease emissions, among which a revision of the Energy Taxation Directive.
The Energy Taxation Directive (ETD) sets minimum levels of excise taxes on energy products across EU Member States, and as such can contribute to the functioning of the internal market and avoid a race-to-the-bottom in terms of energy taxation. However, the legislation is outdated and contains various loopholes in the form of rate reductions, exemptions and rebates. Importantly, this Directive is not aligned with (updated) climate ambitions, such that a revision can facilitate an efficient transition to a low-carbon economy. Ensuring the right price signals can guide current investment choices of households and industries, building infrastructure of which the longevity extends to 2030 and beyond. At the same time, any ETD reform will require unanimity of the Member States, and thus acceptability is a key concern for this policy initiative. Particularly, higher energy prices may raise public debate around the competitiveness of EU industry and the social implications. Therefore, research can play an important role in quantifying these impacts, enabling a fact-based societal debate on energy tax reforms and potential complementary measures.
Here, we provide a broad-based numerical assessment of the environmental, economic and distributional impacts of three scenarios to reform the Energy Taxation Directive that differ in terms of the tax base and rates. The first scenario studies the impact of a broadening of the scope while reforming the tax base to reflect the energy content of different energy carriers. The second and third scenarios incrementally add a CO2-based and an air pollution-based component to the tax rates, aiming to contribute to the Green Deal objectives of climate neutrality and zero air pollution. We quantify the resulting changes in greenhouse gas and air pollutant emissions, impacts on GDP, sector output and employment, and distributional consequences across household with different income levels.
To enable this analysis, we set up a modelling framework that improves and combines existing tools. First, we have refined the representation of excises on energy products in the JRC-GEM-E3 model. This requires tedious work on checking rates that are currently applied in EU Member States, as well as quantifying the out-of-scope energy volumes for industry using energy balances from EUROSTAT and JRC-IDEES, accounting for the various exemptions that are present in the current ETD. Next, we have extended the JRC-GEM-E3 model to cover air pollutant emissions on the basis of emission coefficients per energy use from the GAINS model. Finally, we have established a soft-link between
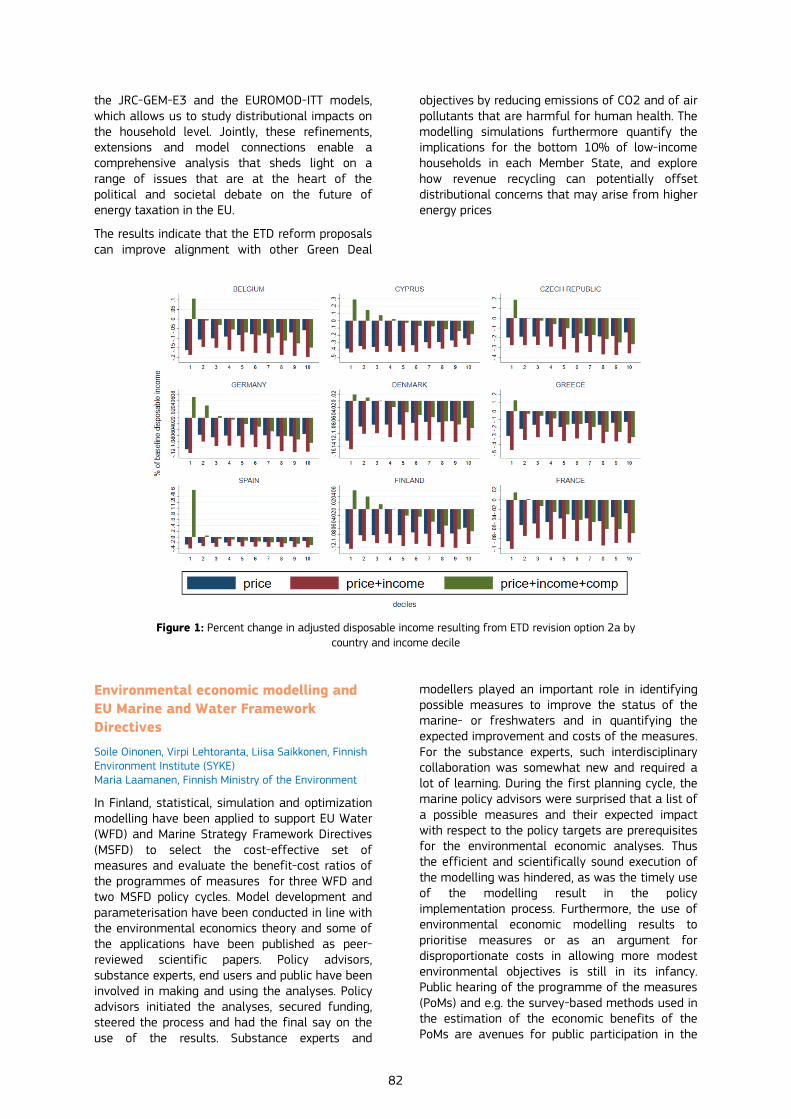
82
the JRC-GEM-E3 and the EUROMOD-ITT models, which allows us to study distributional impacts on the household level. Jointly, these refinements, extensions and model connections enable a comprehensive analysis that sheds light on a range of issues that are at the heart of the political and societal debate on the future of energy taxation in the EU.
The results indicate that the ETD reform proposals can improve alignment with other Green Deal
objectives by reducing emissions of CO2 and of air pollutants that are harmful for human health. The modelling simulations furthermore quantify the implications for the bottom 10% of low-income households in each Member State, and explore how revenue recycling can potentially offset distributional concerns that may arise from higher energy prices
Figure 1: Percent change in adjusted disposable income resulting from ETD revision option 2a by country and income decile
Environmental economic modelling and EU Marine and Water Framework Directives
Soile Oinonen, Virpi Lehtoranta, Liisa Saikkonen, Finnish Environment Institute (SYKE) Maria Laamanen, Finnish Ministry of the Environment
In Finland, statistical, simulation and optimization modelling have been applied to support EU Water (WFD) and Marine Strategy Framework Directives (MSFD) to select the cost-effective set of measures and evaluate the benefit-cost ratios of the programmes of measures for three WFD and two MSFD policy cycles. Model development and parameterisation have been conducted in line with the environmental economics theory and some of the applications have been published as peer-reviewed scientific papers. Policy advisors, substance experts, end users and public have been involved in making and using the analyses. Policy advisors initiated the analyses, secured funding, steered the process and had the final say on the use of the results. Substance experts and
modellers played an important role in identifying possible measures to improve the status of the marine- or freshwaters and in quantifying the expected improvement and costs of the measures. For the substance experts, such interdisciplinary collaboration was somewhat new and required a lot of learning. During the first planning cycle, the marine policy advisors were surprised that a list of a possible measures and their expected impact with respect to the policy targets are prerequisites for the environmental economic analyses. Thus the efficient and scientifically sound execution of the modelling was hindered, as was the timely use of the modelling result in the policy implementation process. Furthermore, the use of environmental economic modelling results to prioritise measures or as an argument for disproportionate costs in allowing more modest environmental objectives is still in its infancy. Public hearing of the programme of the measures (PoMs) and e.g. the survey-based methods used in the estimation of the economic benefits of the PoMs are avenues for public participation in the
83
policy implementation. However, the potential of the public participation is not fully realized. Based on our experiences in conducting economic and social analyses for the MSFD and WFD in Finland and for the Baltic Sea region in the HELCOM we propose several avenues for improving the modelling process and the real uptake of the modelling results as part of an iterative planning and policy implementation process. Integrating ecosystem accounting into the modelling process could be one avenue for identifying and assessing nexus hotspots of different directives and other policies, as well as for providing novel methods for economic analyses.
Expanding the frontiers of computational toxicology: a regulatory perspective
Alicia Paini, Andrew Worth, Joint Research Centre, European Commission
Computational toxicology is a fast developing field of science that integrates information and data from a variety of sources (e.g. biology, chemistry) to support the development of mathematical and computer-based models to better understand the exposure, fate and adverse health effects of chemicals. There is a need for a substantial change in the regulatory chemical risk assessment approach due to the demands for a reduction in animal testing the need to extrapolate the results from new technologies to human situation. There is thus an increased demand for computational toxicology methodologies due to these international regulatory needs. However, the uptake of these mathematical models is still minimal.
This can be attributed to lack of confidence in the application of these mathematical models and their simulations predictions. In order to increase the scientific confidence and regulatory application for decision-making of these approaches there is a need to [1], [2]: (1) characterise and report the models in a harmonised and transparent way; (2) ensure data quality and accessibility to parametrise, calibrate, and evaluate the model (following the FAIR principles and good laboratory practice); and (3) create a dialogue between developers and users.
Driven by good modelling practices, the Organisation for Economic Co-operation and Development (OECD) has published several guidance documents to increase acceptance and use of computational models in chemical risk assessment. The first series of guidance documents cover the (Quantitative) Structure-Activity Relationships (QSAR) domain [3]. To keep
QSAR applications on a solid scientific foundation, principles for QSAR models are articulated covering how to develop, validate and use these models for regulatory needs [4]. The second set of guidance is on the Characterisation, Validation and Reporting of Physiologically Based Kinetic (PBK) Models for Regulatory Purposes; with the goal of increasing confidence in the use of these models parameterised with data derived solely from in vitro and in silico methods. The document provides insights into how the data generated by such methods can be applied to construct PBK models and how these models can be validated. The use of scientifically valid QSAR and PBK models will allow chemical assessment to rely on the use of these approaches for toxicity prediction, rather than in vivo data derived from animal studies [5].
This presentation will highlight the current state and future perspective of computational toxicology in the regulatory assessment of chemicals. The focus will be on how the OECD principles and criteria capture the strengths, uncertainties and limitations of mathematical models, in an effort to establish a higher degree of confidence in the application of such models in a regulatory context.
References
1. Paini, A., Leonard, J.A., Kliment, T., Tan, YM., Worth, A. (2017)Investigating the state of physiologically based kineticmodelling practices and challenges associated with gainingregulatory acceptance of model applications. RegulatoryToxicology and Pharmacology. 90, 104-115,https://doi.org/10.1016/j.yrtph.2017.08.019.
2. Paini, A., Leonard, JA., Joossens, E., Bessems, J.G.M.,Desalegn, A., Dorne, J.L., Gosling, J.P., Heringa, M.B., Klaric, M.,Kliment, T., Kramer, N.I. Loizou, G., Louisse, J., Lumen, A.,Madden, J.C., Patterson, E.A., Proença, S., A. Punt, R.W. Setzer, N.Suciu, J. Troutman, M. Yoon, Worth, A., Tan Y.M. (2019) Nextgeneration physiologically based kinetic (NG-PBK) models insupport of regulatory decision making. 9, 61-72,https://doi.org/10.1016/j.comtox.2018.11.002.
3. OECD (2007) (Q)SARs: Guidance documents and reports;http://www.oecd.org/env/ehs/risk-assessment/guidancedocumentsandreportsrelatedtoqsars.htm
4. OECD (2004) The Report from the Expert Group on(Quantitative) Structure-Activity Relationships [(Q)SARs] on thePrinciples for the Validation of (Q)SARs.http://www.oecd.org/officialdocuments/publicdisplaydocumentpdf/?cote=env/jm/mono(2004)24&doclanguage=en
5. OECD (2021) Guidance document on the characterisation,validation and reporting of Physiologically Based Kinetic (PBK)models for regulatory purposes No. 331.https://www.oecd.org/chemicalsafety/risk-assessment/guidance-document-on-the-characterisation-validation-and-reporting-of-physiologically-based-kinetic-models-for-regulatory-purposes.pdf

84
Contributed Session 3
Climate change adaptation modelling as a key support tool for evidence-based policies in a time
of planetary crisis
25 November
14:50 – 16:20

85
The session will discuss the role of climate change adaptation modelling as a key tool for decision-makers at a time of accelerating impacts of global warmings. It will discuss the main lessons learnt and modelling challenges based on the experience by two Horizon 2020 funded R&I projects, COACCH and CLARA, and the PESETA IV study performed by European Commission’s Joint Research Center in view of improving the (adaptation) modelling tool-kit. It will also share the experiences from the application of modelling in the preparation of the new EU Adaptation Strategy together with the main findings of the Study on Adaptation Modelling performed by DG CLIMA.
Chair: Katarzyna Drabicka, Team Leader - Climate Team on both Mitigation and Adaptation Work Streams, Climate & Planetary Boundaries Unit, DG for Research and Innovation, European Commission
Modelling as a support tool for addressing the prerogatives of climate adaptation policy – insights from the preparation of the new EU Strategy on Adaptation to Climate Change and from the study on Adaptation modelling
Klaus Kondrup, senior expert on adaptation, DG CLIMA, European Commission
Macroeconomic implications of climate change in the EU: a country and sub national assessment (COACCH project)
Paul Watkiss, partner at Paul Watkiss Associates Ltd (PWA)
This contribution discusses the macroeconomic implications of climate change in the EU developing and applying an integrated assessment methodological approach. For the topic and the methodologies applied, it can offer an interesting support fitting many of the horizontal challenges the Conference aims to address.
Firstly, the exercise is highly multidisciplinary integrating economic models with process-based impact models connected by multiple coupling linkages. More specifically, it considers the economic consequences associated to 9 different climate-related impact sources: agriculture, forestry, fisheries, sea-level rise, riverine floods, transport, energy supply, energy demand, and labor productivity, in isolation and jointly. Information on physical impacts stems from sectoral impact assessments conducted under the COACCH (Co-designing the Assessment of Climate-CHange costs) Horizon 2020 project that provides input to the economic modelling evaluation.
Secondly, it offers a full range of new impact data analysing 9 different combinations of social economic development pathways (or Shared Social economic Pathways - SSPs) and climate
scenarios (or Representative concentration pathways - RCPs) applying state of the art impact and economic models. Particular element of interest is the sub-national characterization of the macroeconomic analysis. The computable general equilibrium model used details the EU into 138 territorial entities (using nomenclature of territorial units at NUTS1 or NUTS2 levels). This enables the identification of impact interactions and hot spots for climate change damages within EU countries.
Thirdly, it offers a comprehensive and transparent treatment of uncertainty. The 9 different combinations of social economic and climate scenarios are examined together with a “high”, “medium” and “low” impact characterization determined by the climate models used to perturb the impact models. Furthermore, given its relevance in a regional context, also alternative specifications of investment mobility across EU areas, “high” and “low”, are considered. The effect of different uncertainty sources and how much each contributes to the final result, is examined through a comprehensive analysis of variance that decompose across time and sources “what drives what”.
Finally, all our results are supported and communicated through an “on-line” scenario explorer, an interactive, and user-friendly tool, that is meant to guide non-experts through the wealth of data produced.
A flavour of our results. In the majority of EU regions climate change impacts can become larger than 1-2% of regional GDP already by mid-century. As expected, this is more evident in the “high impact case” and in scenarios with the stronger climate signal: RCP6.0 and RCP8.5. In the high investment mobility case impacts on GDP are exacerbated. Nonetheless, this result, even though partly moderated, is confirmed in the “low” and “medium impact” cases and in the low investment mobility case. In the “high impact case” there are regions, mostly located in southern, but also western European countries where the loss is close to or larger than 5%. The ampler difference
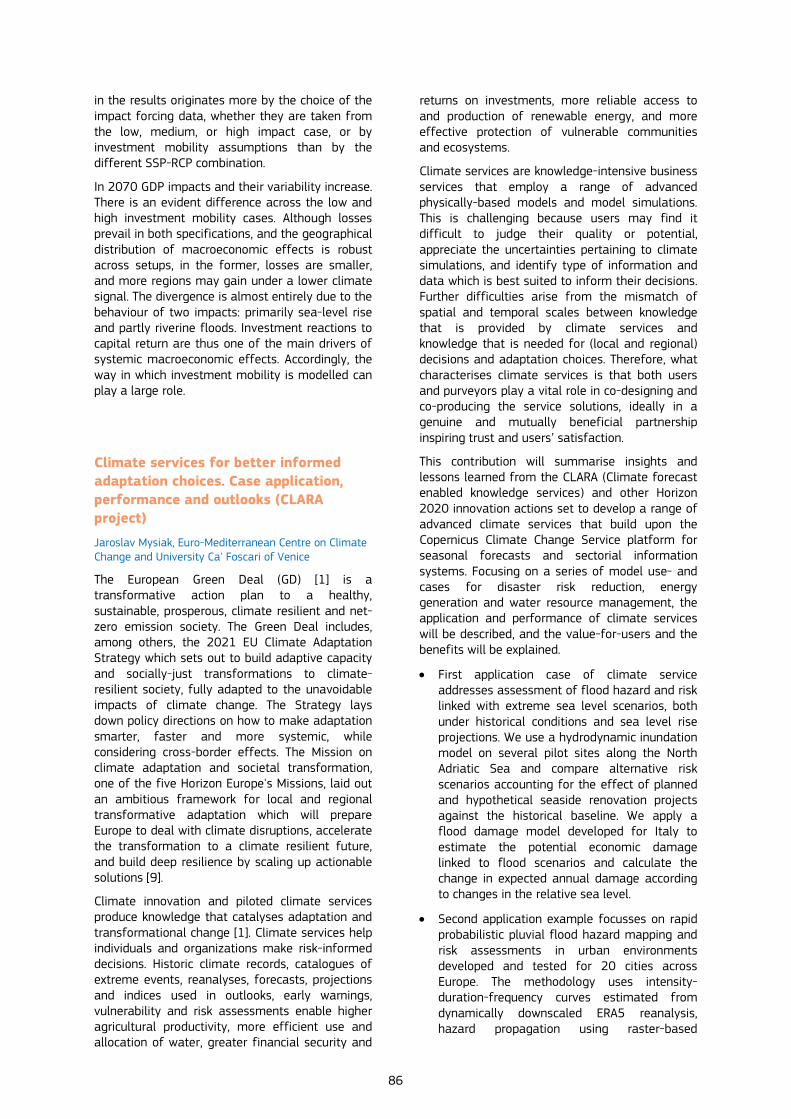
86
in the results originates more by the choice of the impact forcing data, whether they are taken from the low, medium, or high impact case, or by investment mobility assumptions than by the different SSP-RCP combination.
In 2070 GDP impacts and their variability increase. There is an evident difference across the low and high investment mobility cases. Although losses prevail in both specifications, and the geographical distribution of macroeconomic effects is robust across setups, in the former, losses are smaller, and more regions may gain under a lower climate signal. The divergence is almost entirely due to the behaviour of two impacts: primarily sea-level rise and partly riverine floods. Investment reactions to capital return are thus one of the main drivers of systemic macroeconomic effects. Accordingly, the way in which investment mobility is modelled can play a large role.
Climate services for better informed adaptation choices. Case application, performance and outlooks (CLARA project)
Jaroslav Mysiak, Euro-Mediterranean Centre on Climate Change and University Ca' Foscari of Venice
The European Green Deal (GD) [1] is a transformative action plan to a healthy, sustainable, prosperous, climate resilient and net-zero emission society. The Green Deal includes, among others, the 2021 EU Climate Adaptation Strategy which sets out to build adaptive capacity and socially-just transformations to climate-resilient society, fully adapted to the unavoidable impacts of climate change. The Strategy lays down policy directions on how to make adaptation smarter, faster and more systemic, while considering cross-border effects. The Mission on climate adaptation and societal transformation, one of the five Horizon Europe's Missions, laid out an ambitious framework for local and regional transformative adaptation which will prepare Europe to deal with climate disruptions, accelerate the transformation to a climate resilient future, and build deep resilience by scaling up actionable solutions [9].
Climate innovation and piloted climate services produce knowledge that catalyses adaptation and transformational change [1]. Climate services help individuals and organizations make risk-informed decisions. Historic climate records, catalogues of extreme events, reanalyses, forecasts, projections and indices used in outlooks, early warnings, vulnerability and risk assessments enable higher agricultural productivity, more efficient use and allocation of water, greater financial security and
returns on investments, more reliable access to and production of renewable energy, and more effective protection of vulnerable communities and ecosystems.
Climate services are knowledge-intensive business services that employ a range of advanced physically-based models and model simulations. This is challenging because users may find it difficult to judge their quality or potential, appreciate the uncertainties pertaining to climate simulations, and identify type of information and data which is best suited to inform their decisions. Further difficulties arise from the mismatch of spatial and temporal scales between knowledge that is provided by climate services and knowledge that is needed for (local and regional) decisions and adaptation choices. Therefore, what characterises climate services is that both users and purveyors play a vital role in co-designing and co-producing the service solutions, ideally in a genuine and mutually beneficial partnership inspiring trust and users’ satisfaction.
This contribution will summarise insights and lessons learned from the CLARA (Climate forecast enabled knowledge services) and other Horizon 2020 innovation actions set to develop a range of advanced climate services that build upon the Copernicus Climate Change Service platform for seasonal forecasts and sectorial information systems. Focusing on a series of model use- and cases for disaster risk reduction, energy generation and water resource management, the application and performance of climate services will be described, and the value-for-users and the benefits will be explained.
• First application case of climate serviceaddresses assessment of flood hazard and risklinked with extreme sea level scenarios, bothunder historical conditions and sea level riseprojections. We use a hydrodynamic inundationmodel on several pilot sites along the NorthAdriatic Sea and compare alternative riskscenarios accounting for the effect of plannedand hypothetical seaside renovation projectsagainst the historical baseline. We apply aflood damage model developed for Italy toestimate the potential economic damagelinked to flood scenarios and calculate thechange in expected annual damage accordingto changes in the relative sea level.
• Second application example focusses on rapidprobabilistic pluvial flood hazard mapping andrisk assessments in urban environmentsdeveloped and tested for 20 cities acrossEurope. The methodology uses intensity-duration-frequency curves estimated fromdynamically downscaled ERA5 reanalysis,hazard propagation using raster-based

87
inundation model, and damage and risk assessment using stage-damage models.
• Third application examples focuses on acombination of physically-based seasonalforecasts with various machine learningalgorithms (SVD, GP, LSTM, and RNN) tosupport operational choices in hydropowergeneration. We test the application of machinelearning techniques for forecasting seasonalriver discharges up to six months lead time forseveral catchments in Colombia, SouthAmerica. We use Copernicus seasonal climateforecasts. Each algorithm is trained over pastdecades datasets of recorded data, andforecast performances are validated andevaluated using separate test sets withreference to benchmarks (historical average ofdischarge values and simpler multiparametricregressions).
The above examples explain how climate risk models respond to local and regional knowledge requirements, and how models and model simulations are adapted to match these requirements and perceived and understood by users (i.e. local and regional decision and policy makers). We focus on the interactions between modellers and users of model-derived knowledge which make climate-science information salient (i.e., responsive to user context and demand), credible (i.e., of high quality and rigor) and legitimate (i.e., rooted in relationships of trust and respect).
References
1. Lourenço, T. C., Swart, R., Goosen, H. & Street, R. The rise ofdemand-driven climate services. Nat. Clim. Chang. 6, 13–14(2016).
2. Street, R. et al. A European research and innovationRoadmap for Climate Services. Eur. Comm. (2015).
3. WMO. Climate Services Introduction. Clim. Serv. Introd.(2015).
4. Vaughan, C. & Hewitt, C. Surveying Climate Services: WhatCan We Learn from a Bird’s-Eye View? Am. Meteorol. Soc.(2018) doi:10.1175/WCAS-D-17-0030.1.
5. Brasseur, G. P. & Gallardo, L. Earth ’ s Future Climateservices : Lessons learned and future prospects. Earth’s Futur.79–81 (2016) doi:10.1002/2015EF000338.Received.
6. Vaughan, C. & Dessai, S. Climate services for society: origins,institutional arrangements, and design elements for anevaluation framework. WIREs Clim Change. (2014).
7. Vaughan, C., Buja, L., Kruczkiewicz, A. & Goddard, L.Identifying research priorities to advance climate services. Clim.Serv. 4, 65–74 (2016).
Climate impacts and adaptation in Europe (JRC PESETA IV project)
Luc Feyen and Juan-Carlos Ciscar, Joint Research Centre, European Commission
Summary
The JRC PESETA IV study shows that ecosystems, people and economies in the EU will face major impacts from climate change if we do not urgently mitigate greenhouse gas emissions or adapt to climate change. The burden of climate change shows a clear north-south divide, with southern regions in Europe much more impacted. Limiting global warming to well below 2°C would considerably reduce climate change impacts in Europe. Adaptation to climate change would further minimize unavoidable impacts in a cost-effective manner. The presentation will summarise the main results and discuss further research activities.
Introduction
Climate change is one of the biggest threats for humanity, which can affect seriously people and nature. With the Green Deal for Europe the EU strives for keeping our planet healthy and aspires to become the first carbon-neutral continent in the world by 2050.
The primary purpose of the JRC PESETA IV study is to better understand the implications of climate change for the EU, and what policy can do about them’; in particular, what sectors and regions of the EU could be most affected and how mitigation and adaptation options can avoid the adverse effects of climate change. The project results have supported both EU mitigation and adaption policies (e.g. the new EU adaptation strategy of 2021). PESETA IV assesses the consequences of climate change for eleven climate impact categories: human mortality from heat and cold waves, windstorms, water resources, droughts, river flooding, coastal flooding, wildfires, habitat loss, forest ecosystems, agriculture and energy supply.
Methodology
The methodologies implemented in the project are of particular relevance to policy modelling because they provide high resolution in terms of impact areas, time and space; they are also based on an integrated approach, a challenging aspect when addressing complex societal problems like it is the case for climate change. The first point is of high significance because the project focuses on the details of what climate change mean for European citizens, in particular, where they live, even if subject to a high level of uncertainty.
In particular, the project uses a combination of process-based, empirical, and multi-commodity
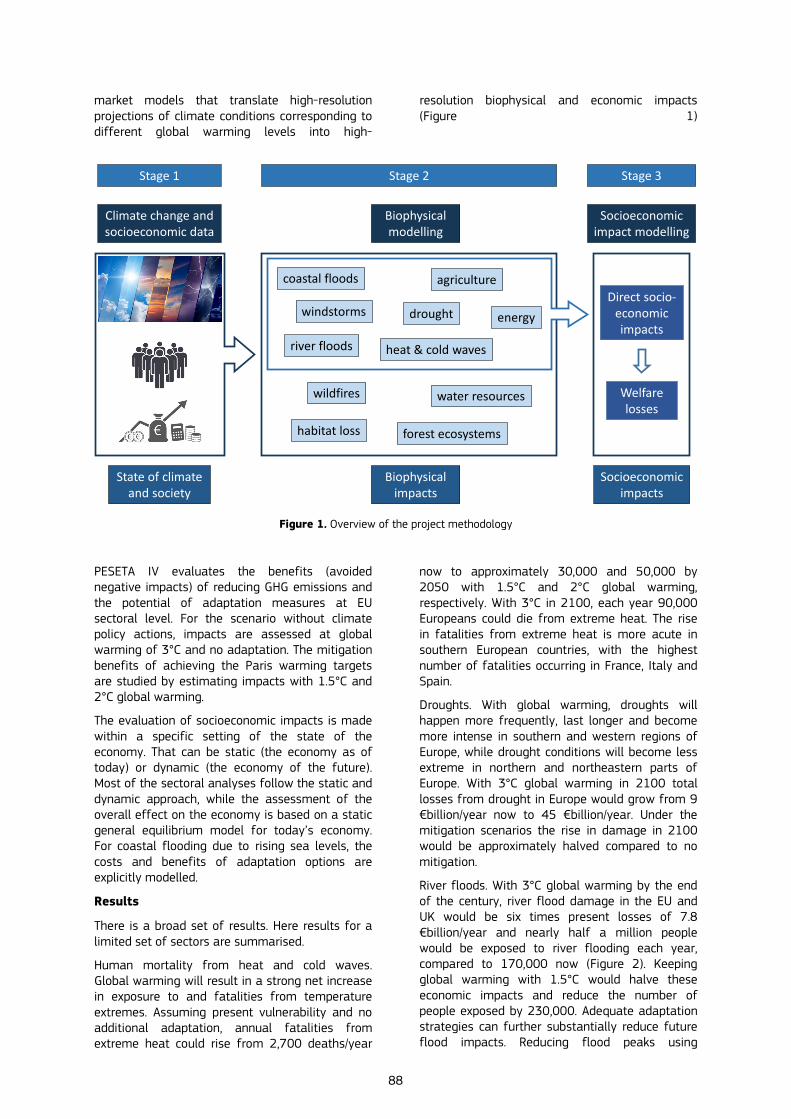
88
market models that translate high-resolution projections of climate conditions corresponding to different global warming levels into high-
resolution biophysical and economic impacts (Figure 1)
Figure 1. Overview of the project methodology
PESETA IV evaluates the benefits (avoided negative impacts) of reducing GHG emissions and the potential of adaptation measures at EU sectoral level. For the scenario without climate policy actions, impacts are assessed at global warming of 3°C and no adaptation. The mitigation benefits of achieving the Paris warming targets are studied by estimating impacts with 1.5°C and 2°C global warming.
The evaluation of socioeconomic impacts is made within a specific setting of the state of the economy. That can be static (the economy as of today) or dynamic (the economy of the future). Most of the sectoral analyses follow the static and dynamic approach, while the assessment of the overall effect on the economy is based on a static general equilibrium model for today’s economy. For coastal flooding due to rising sea levels, the costs and benefits of adaptation options are explicitly modelled.
Results
There is a broad set of results. Here results for a limited set of sectors are summarised.
Human mortality from heat and cold waves. Global warming will result in a strong net increase in exposure to and fatalities from temperature extremes. Assuming present vulnerability and no additional adaptation, annual fatalities from extreme heat could rise from 2,700 deaths/year
now to approximately 30,000 and 50,000 by 2050 with 1.5°C and 2°C global warming, respectively. With 3°C in 2100, each year 90,000 Europeans could die from extreme heat. The rise in fatalities from extreme heat is more acute in southern European countries, with the highest number of fatalities occurring in France, Italy and Spain.
Droughts. With global warming, droughts will happen more frequently, last longer and become more intense in southern and western regions of Europe, while drought conditions will become less extreme in northern and northeastern parts of Europe. With 3°C global warming in 2100 total losses from drought in Europe would grow from 9 €billion/year now to 45 €billion/year. Under the mitigation scenarios the rise in damage in 2100 would be approximately halved compared to no mitigation.
River floods. With 3°C global warming by the end of the century, river flood damage in the EU and UK would be six times present losses of 7.8 €billion/year and nearly half a million people would be exposed to river flooding each year, compared to 170,000 now (Figure 2). Keeping global warming with 1.5°C would halve these economic impacts and reduce the number of people exposed by 230,000. Adequate adaptation strategies can further substantially reduce future flood impacts. Reducing flood peaks using
agriculture
windstorms
wildfires
habitat loss forest ecosystems
Climate change and socioeconomic data
river floods
drought
heat & cold waves
energy
coastal floods
water resources
Biophysical modelling
Direct socio-economic impacts
Welfare losses
Socioeconomic impact modelling
State of climate and society
Biophysical impacts
Socioeconomic impacts
Stage 1 Stage 2 Stage 3

89
retention areas shows the strongest potential to lower direct impacts in a cost-efficient way. Implementing the optimal design for the 3°C
warming scenario would lower economic damage from flooding by 40 €billion/year (82% reduction) at the end of the century.
Figure 2. Annual flood damage and population exposed to river flooding for EU and UK in the present and by 2100 for different levels of global warming, with and without adaptation respectively.
Coastal floods. Extreme sea levels in Europe could rise by as much as one metre or more by the end of this century due to global warming. Without mitigation, annual economic damage in the EU and UK would grow to 239 €billion by 2100 and the population exposed to coastal flooding would reach 2.2 million. With moderate mitigation the damage would be reduced by half (to €111 billion/year) and the exposed population would be 1.4 million/year, still significantly greater than at present. Raising dykes would reduce damage and
the population affected by around 90% and 60% in 2100, respectively. The protected areas would be the urbanised and economically important areas, and cover about one fifth of the European coastline.
References
Feyen L., Ciscar J.C., Gosling S., Ibarreta D., Soria A. (editors) (2020). Climate change impacts and adaptation in Europe. JRC PESETA IV final report. EUR 30180EN, Publications Office of the European Union, Luxembourg, ISBN 978-92-76-18123-1, doi:10.2760/171121, JRC119178.
24
Today
7.8
1.5˚C
People exposed (1000/year) 252172
Damage (€ billion/year)
2100 - no adaptation
33
2˚C
338
48
3˚C
482
8.6
1.5˚C
92
2100 - adaptation
9.6
2˚C
100
8.6
3˚C
90

90
Poster Session
26 November
11:00 – 12:45

91
Integrating diverse model results into decision support for good environmental status and blue growth
Laura Uusitalo (1), Thorsten Blenckner (2), Riikka Puntila-Dodd (1), Annaliina Skyttä (1), Susanna Jernberg (1), Rudi Voss (3,4), Bärbel Müller-Karulis (5), Maciej T. Tomczak (5), Christian Möllmann (6), Heikki Peltonen (1) (1) Finnish Environment Institute(2) Stockholm Resilience Centre, Stockholm University(3) Christian-Albrechts-Universität zu Kiel(4) German Centre for Integrative Biodiversity Research(iDiv) Halle-Jena-Leipzig(5) Baltic Sea Centre, Stockholm University(6) Institute of Marine Ecosystem and Fishery Science,Universität Hamburg
Sustainable environmental management needs to consider multiple ecological and societal objectives simultaneously while accounting for the many uncertainties arising from natural variability, insufficient knowledge about the system’s behaviour leading to diverging model projections, and changing ecosystem. We demonstrate how a Bayesian network based decision support model can be used to summarize a large body of research and model projections about potential management alternatives and climate scenarios for the Baltic Sea. We demonstrate how this type of a model can act as an emulator and ensemble, integrating disciplines such as climatology, biogeochemistry, marine and fisheries ecology as well as economics. This decision support model includes explicit assessments of uncertainty in relation to climate scenarios and food web responses. This gives also an indication of the expected manageability of the system. The model allows simultaneous evaluation of environmental and economic goals, while illustrating the uncertainty of predictions, providing a holistic view of the management problem.
Ecosystem approach considers not only individual ecosystem components but also their interconnections, which introduces new and problematic uncertainties for both scientists and managers [1], [2]. Uncertainty stems from various sources, including both natural variation, the effects of multiple drivers, and the imperfect knowledge about the system [3]. Ecosystem models can be powerful tools for the prediction of the effects of management measures, as they allow experimenting with a variety of pressure scenarios and their individual and combined impacts on the ecosystem, but the uncertainty in predictions can be high [4], [5]. A key challenge for management of complex ecosystems is recognizing and addressing these uncertainties [6]. Decision making requires information about the uncertainties to consider the acceptable risk levels explicitly [7], [8].
Bayesian networks (BN) are a well-fitting tool for integrating ecosystem models operating on different scales, and by this supporting ecosystem managers in their decisions [9], [10] because of their ability to integrate knowledge and results from different sources. This makes them particularly useful for ecosystem modelling across sectors [11], [12]. BNs can be augmented with decision options and management goals, helping to find the best decisions, considering management target goals in relation to the system’s state and the uncertainties related to knowledge and the decision option [13]. BNs also allow for “what-if” type of scenario evaluations and diagnostic analysis [10] used to support multi-target evaluations on directive, operational, tactical, and strategic levels [9], [14]. BNs can be expanded and updated in a modular manner, allowing improvements in one part (e.g. a specific model) of the BN without needing to revise the whole BN, making them practical for many real-life management situations.
We present a BN decision support model for the Central Baltic Sea that integrates results from multiple models, studies and disciplines, and accounts for uncertainty stemming from multiple sources, such as model selection, model projections, and uncertain futures. The present case study focuses on a critical question in European marine management, namely, whether and under which circumstances and management decisions are we able to attain both blue growth (BG) and good environmental status (GES) according to the Marine Strategy Framework Directive (MSFD). In the Central Baltic Sea, the key GES components are the degree of eutrophication and the stock sizes of key commercially exploited fish species, while fishery targeting these species is economically of great importance. The BN integrates results from three climate models, two biogeochemical models, a biomass-dynamic food-web model, and a bioeconomic fishery model. Further, it explicitly evaluates the probabilities of reaching the environmental management goals GES for eutrophication and maximum sustainable yield (MSY) for fisheries, as well as economic outcomes of fishery, under different climatic and management scenarios. We discuss the approach and methodologies used to construct the BN, and assess under the different sources of uncertainty the probability of reaching the management goals of both blue growth and good environmental status simultaneously. We also present a web-based tool that gives an intuitive interface to the model results.
References
1 Levin, P. S. et al. PLoS Biol 7, e1000014 (2009)
2 Linke, S. et al. J. Risk Res. 17, 505–523 (2014)
3 Regan, H. M. et al. Ecol. Appl. 12, 618–628 (2002)

92
4 Bauer, B. et al. ICES J. Mar. Sci. 75, 1306–1317 (2018)
5 Melbourne-Thomas, J. et al. ICES J. Mar. Sci. 74, 2298–2308 (2017)
6 Udovyk, O. et al. Environ. Sci. Policy 29, 12–23 (2013)
7 Uusitalo, L. et al. Environ. Model. Softw. 63, 24–31 (2015)
8 van Beest, F. M. et al. Ambio (2020)
9 Barton, D. N. et al. Integr. Environ. Assess. Manag. 8, 418–29 (2012)
10 Kelly, R. A. et al. Environ. Model. Softw. 47, 159–181 (2013)
11 Haapasaari, P. et al. Ecol. Soc. 17, 6 (2012)
12 Levontin, P. et al. ICES J. Mar. Sci. 68, 632–638 (2011)
13 Uusitalo, L. Ecol. Model. 203, 312–318 (2007)
14 Sutherland, J. W. IEEE Trans. Syst. Man Cybern. SMC-13, 279–297 (1983)
Facilitating the verification of large scale models
Dimitrios Kremmydas, Athanasios Petsakos, Joint Research Centre, European Commission
The European Commission (EC) has increased the use of model outputs over the last years as evidence for policymaking. Additionally, EC is committed to sound and transparent use of evidence in the framework of the Better Regulation policy. For those reasons, the validation and verification of models used by the EC are critical for ensuring the trust of the policy makers to models.
The model paradigm presented in Figure 1 is useful for delineating these two notions. A model is composed of two parts: A conceptual model, which represents the simplification of the actual problem in mathematical/logical/etc. terms; Then, a computerized model, i.e., the implementation of the conceptual model in software terms.
Validation is the process of ensuring that the theories and the abstractions used to derive the conceptual model are adequate for the intended use of the model. Verification is the process of establishing that the computerized model (i.e., the software implementation) is an accurate representation of the conceptual model.
Figure 1: The model development process (source: Sargent, 2013)
The validation of the conceptual model is usually addressed adequately. In model manuals, or in peer-reviewed papers, a wealth of information is
given about the theoretical basis, the mathematical formulation or the general algorithm of a model. In contrast, little information

93
is usually provided for the computerized model itself.
Since the computerized model is part of the modeling chain, any coding error will compromise the whole model, irrespectively of the validity of the conceptual part. In the few cases that the source code is available, a reviewer can potentially perform the verification himself, although this requires devoting significant amount of time. Nevertheless, for large scale models, like the ones often employed by the EC, the computerized model is a complex software artifact which makes it costly for a third party to revise the code. For all these reasons, the verification of the model is equally important as the validation part for ensuring the overall model quality.
This paper contributes to the verification side of models used in the EC. More specifically, we discuss good practices on model development that facilitate the verification process (Table 1). This list is drawn from a literature review on the development of scientific software (Joppa et al., 2013; Kelly & Sanders, 2008; Wilson, 2016; Wilson et al., 2014). Then, we provide a concrete example of how verification based on those practices was applied in the IFM-CAP model1.
Relevance for policy development, assessment and implementation in the EU and/or in the Member States: Using the output of models as evidence for policy requires that the models are free of errors, not only in the conceptual level but also in the implementation one. The end users of the model do not possess the expert knowledge to assess the quality of the model’s code and consequently its reliability. However, if the model team develops the model based on best practices for scientific software, it minimizes the risk for coding errors and consequently increases the trust of the policy makers to the results of the model.
1 IFM-CAP is an economic optimization model of agricultural supply developed in JRC. It is designed for ex-ante assessment of the economic, social and environmental impacts of the Common Agricultural Policy (CAP)
Relevance of findings for the modelling community at large: We present good practices for the development and verification of large-scale models that can be potentially employed from other members of the modelling community.
Involvement of both modelers and policymakers: Policy makers and modelers can employ the good practices proposed in this paper for evaluating the overall quality of a model.
References
Joppa, L., McInerny, G. J., Harper, R., Salido, L., Takeda, K., O\textquoterightHara, K., Gavaghan, D. J., & Emmott, S. (2013). Troubling trends in scientific software use. Science, 340, 814–815.
Kelly, D., & Sanders, R. (2008). Assessing the quality of scientific software. In First International Workshop on Software Engineering for Computational Science and Engineering (May 2008), May. http://www.cse.msstate.edu/~SECSE08/Papers/Kelly.pdf%5Cnhttp://secse08.cs.ua.edu/Papers/Kelly.pdf
Sargent, R. G. (2013). Verification and validation of simulation models. Journal of Simulation, 7(1), 12–24. https://doi.org/10.1057/jos.2012.20
Wilson, G. (2016). Software Carpentry: Lessons learned. F1000Research, 3, 1–10. https://doi.org/10.12688/f1000research.3-62.v2
Wilson, G., Aruliah, D. A., Brown, C. T., Chue Hong, N. P., Davis, M., Guy, R. T., Haddock, S. H. D., Huff, K. D., Mitchell, I. M., Plumbley, M. D., Waugh, B., White, E. P., & Wilson, P. (2014). Best Practices for Scientific Computing. PLoS Biology, 12(1). https://doi.org/10.1371/journal.pbio.100174
Table 1. Summary of the verification steps
94
Testing as a core element of Quality Management in policy relevant simulation models
Wolfgang Britz, David Schäfer, Economic Modeling of Agricultural System group, University Bonn Torbjoern Jansson, Applied Analysis Group, AgriFood Economics Centre, Lund, Sweden
Research programs sponsor the development of economic models to foster evidence based policy making (cf. Podhora et al. 2013) and are central for policy impact assessments performed for the EU Commission (Listorti et al. 2020) and wider policy debates, such as seen from the article by Searchinger et al. (2008) on land use impacts of biofuel mandates. The awareness is growing that ethical norms in research are important, to foster knowledge and avoid errors, such as prohibitions against fabricating, falsifying, or misrepresenting research data which promote truth and minimize error (Resnik 2011). Such norms thus encompass good scientific practises to reduce errors, which in case of economic simulation models include their appropriate testing as discussed in this paper. Applied models are dynamic entities, requiring regular database updates or extensions to e.g. new EU candidate countries, as well as code changes to reflect changes in policies. This requires a quality management strategy fitting to different stages of a permanent development process.
Testing as a key part of quality management in software engineering draws on paradigms such as Test Driven Development (Beck, 2002). This focuses on granular testable structures such as objects or functions (Zolt, 2014 p. 97). Economic simulation models are mostly developed in Algebraic Modelling Systems that work in a sequential way, which requires adapted testing approaches. Furthermore, economic modellers are typically not software engineers by training, and writing, documenting and testing software code is only one of the many different tasks they perform. For a dedicated software engineer, the code is the main outcome. Modellers as scientist instead focus on the publication of papers or reports which is more indirectly improved by well tested code.
This paper discusses testing based on examples and experiences from two agricultural sector models. We classify types of tests that are relevant for policy relevant simulation models and provide illustrative examples of their implementation. We then proceed to discuss how these types of tests fit into a typical model life cycle.
The first type of tests refers to compilation as a fast “fail test” under different model configuration.
This becomes increasingly relevant as models move away from a “one size fits all approach” towards modularity, here understood as the possibility to exchange building blocks which describe system elements such as demand, production, trade, emissions and other externalities (cf. Britz et al. 2021). Such modularity gives the user the possibility to flexibly configure the model to the needs of a specific policy analysis. A code change in one module may provoke errors in others such that a potentially large number of relevant configurations need to be tested.
Runtime tests as the second type also assert that models can be applied to different databases and shocks, and under different configurations. These tests require also execution and thus take longer to run. Some of the testing is provided automatically by the software, such as error messages at division by zero. But this must be complemented by tests designed by the developer, to examine the data and raise sensible errors if essential data is missing or fundamental relations are violated. This can include tests for perfect benchmarking of a model.
Checks if results make sense provide the third type, here called outcome tests. Judging if a different outcome after a code or data change is an unexpected side-effect and/or implausible asks for an expert opinion. It must draw on domain knowledge and reflect model structure as well as current code developments. This renders this the most expensive test type. In the class of outcome tests, we also put tests for stability and thus of numerical results. This requires designing and implementing tests and procedures that evaluate to what extent outcomes can be replicated by a third party, potentially working with a different hardware and software environment. Reproducibility is central to provide trust in quantitative assessments.
How the different type of tests can be implemented from a technical and institutional viewpoint and systematically linked to a software version system is demonstrated based on the single farm-scale bio-economic model FarmDyn (Britz et al. 2014), reflecting modularity. This is complemented by examples on how instabilities may arise and how they are systematically measured in the CAPRI model (Britz and Witzke, 2014).
These different types of tests are suitable at different points in the model life-cycle. Compile and runtime tests should be integrated as early as possible during the development process, to avoid bugs or implausible results in later policy relevant applications, and to delegate the correction of errors to the coders which caused them. The later
95
in the development and application process errors are detected, the more costly is usually their correction. Furthermore, in the typical project financed model development, errors caused by, but undetected during a project’s lifetime will mean that related costs are carried by the wrong project. These tests should also stay active during model applications, to secure, for instance, complete and consistent input data.
A larger set of outcome tests as the third type might be too expensive to be applied at each code or data change. This holds especially for stability tests. We suggest, based on the experiences of FarmDyn and CAPRI, that extensive outcome testing is carried out within a stable release process. A stable release is a published model version that contains a well-defined list of tested features. The release never changes once published, and hence warrants a greater testing effort. Bug fixes or data updates that are found after the publication of a release are included in the subsequent one, but should be made continuously public to give users a chance to integrate them in their working copy.
Even if demonstrated for two models, only, the test approaches reflect the wider experience of the authors with other models such as Computable General Equilibrium or Agent Based Models and are applicable to other models as well. The aim of this paper is thus to motivate and document operational test approaches which have been successfully implemented in economic models, to foster testing in our community.
References
Beck, K. (2002) Test driven development: by example. Adison-Wesley. PDF retrieved from https://3lib.net/book/10999983/2405a7 on June 16, 2021.
Britz, W., Ciaian, P., Gocht, A., Kanellopoulos, A., Kremmydas, D., Müller, M., Petsakos, A., Reidsma, P. (2021): A design for a generic and modular bio-economic farm model, Agricultural Systems 191(June 2021): 103133
Britz, W., & Witze, P. (2014). CAPRI model documentation, version 2014. University Bonn, https://www.capri-model.org/docs/CAPRI_documentation.pdf
Britz W., Lengers, B., Kuhn, T. & Schäfer, D. (2016): A highly detailed template model for dynamic optimization of farms - FARMDYN, University of Bonn, Institute for Food and Resource Economics, Version September 2016, 147 pages.
Listorti, G., Basyte‐Ferrari, E., Acs, S., & Smits, P. (2020). Towards an Evidence‐Based and Integrated Policy Cycle in the EU: A Review of the Debate on the Better Regulation Agenda. JCMS: Journal of Common Market Studies, 58(6), 1558-1577
Podhora, A., Helming, K., Adenäuer, L., Heckelei, T., Kautto, P., Reidsma, P., Rennings, K., Turnpenny, J., Jansen, J. (2013): The policy-relevancy of impact assessment tools: Evaluating nine years of European research funding, Environmental Science & Policy 31: 85-95
Resnik, D.B., 2011. What is ethics in research & why is it important. National Institute of Health. US.
Searchinger, T., Heimlich, R., Houghton, R.A., Dong, F., Elobeid, A., Fabiosa, J., Tokgoz, S., Hayes, D. and Yu, T.H., 2008. Use of US croplands for biofuels increases greenhouse gases through emissions from land-use change. Science, 319(5867), pp.1238-1240
Zsolt, U. (2014) Software development processes and software quality assurance | Digital Textbook Library (tankonyvtar.hu). Retrieved June 16, 2021.https://regi.tankonyvtar.hu/en/tartalom/tamop412A/2011-0042_szoftverfejlesztesi_folyamatok_angol/index.html
Taxing income or consumption: macroeconomic and distributional effects for Italy
Diego d'Andria, Jason DeBacker, Richard W. Evans, Jonathan Pycroft, Magdalena Zachlod-Jelec
We study a set of tax reforms introducing a budget-neutral tax shift in Italy, from labour income to consumption taxes. Our approach combines microsimulation and macroeconomic models, which allows for a more extensive analysis of the trade-offs between equity and efficiency.
To this end we use a microsimulation model to provide the output with which to estimate the parameters of tax functions in an overlapping-generations computable general equilibrium model. In doing so we make marginal and average tax rates bivariate non-linear functions of capital income and labour income. The methodology allows to represent the non-linearities of the tax and social benefit system and interactions between capital and labour incomes. The linked macro model then simulates labour supply, consumption and savings in a dynamic setting, thus adding important behavioural effects to the microsimulation model which take into account general equilibrium mechanisms as well as life-cycle optimization choices.
Reform proposals of the tax and benefit system are often at the centre of political debates. Taxes affect incentives to work, save and consume, via changes in the relative prices. They can significantly modify the disposable income of households and thus address or exacerbate fairness concerns, as well as being necessary to fund public expenditure. Especially since the financial and economic crisis of 2008, governments face the necessity of boosting economic recovery and growth, while taking into account equity concerns and public budget constraints. When looking for a new design of the tax and benefit system that aims at enhancing both efficiency and equity, a consensus emerges to lower the tax burden on labour income. This is due to the fact that tax rates on labour income are high compared to the rates on consumption
96
and much of the empirical literature suggests that labour income taxation are associated more often with poorer aggregate economic performance, compared to consumption and property taxation.
While the idea of a reduction of labour income taxes via a tax shift onto other, supposedly more efficient tax types seems to enjoy widespread consensus among practitioners in Italy, it is not yet clear how such a reform should look like. A revenue-neutral reform that would reduce personal income tax rates and compensate lost revenues via an increase in consumption taxes (VAT and excise) can hardly preserve progressivity and will likely affect relevant groups of taxpayers differently. Alternatively, reductions in personal income tax can be achieved both by changing the tax rates or the no-tax zone (i.e., a minimum income level not subject to personal income tax), which also brings different impacts in terms of equity and of the distribution of work incentives across the income quantiles. Finally, such reforms may cause general-equilibrium and dynamic effects which should also be understood well and taken into account.
The contribution of this paper is to build an analysis of potential reforms in Italy which jointly accounts for general equilibrium effects, effects across time, heterogeneous taxpayers who are differentiated by age and income levels with high granularity and taking into account as much as possible the complex details of the real Italian tax and benefit system. By combining overlapping-generations macroeconomic model with a microsimulation model, we are able to overcome the limitations of the existing literature which either provides a purely microeconomic static analysis of reforms (thus disregarding any general-equilibrium or dynamic effect), or an analysis based on DSGE modelling techniques which is unable to account for the existence of many heterogeneous taxpayers and relies on stylized representations of the tax system (thus missing many of the complexities and subtle interactions of real-world tax and benefit systems).
Our first simulation is an equal reduction in PIT rates for all taxpayers compensated by a rise in consumption tax. Our results show that a tax shift made by cutting personal income tax rates might bring significant efficiency gains in Italy, with limited regressive effects notwithstanding the revenue-compensating increase in consumptions taxes. It is interesting to contrast this finding with a common objection to tax shift reforms. Without taking into account behavioural and general equilibrium effects, a cut in tax rates across the board, compensated by increases in VAT rates, would produce a regressive tax reform. However, our simulations suggest that, after accounting for
behavioural and general equilibrium effects, only a very small increase in inequality.
Our second simulation is a rise in the minimum income level not subject to personal income tax, again with the revenue loss compensated by a rise in consumption tax. This scenario does reduce inequality, though does so at some cost regarding aggregate GDP. Using our methodology, we are able to investigate the equity-efficiency trade-offs of different policy options.
Overall, we show that the approach used for modelling tax functions is powerful enough to capture the most important non-linearities of the actual tax code, together with the interaction effects between labour and capital incomes on both average and marginal tax rates. By applying the linked micro-macro model approach to study a policy reform that has been long proposed and discussed in the Italian context, we provide a fuller picture of potential policy outcomes.
Modelling future scenarios: A vector-based CA model for simulating urban land use change
Ramón Molinero-Parejo, Francisco Aguilera-Benavente, Montserrat Gómez-Delgado, Universidad de Alcalá Julio A. Soria-Lara, Universidad Politécnica de Madrid
Cities are evolving ever faster, and urban planning methods need to be updated accordingly. In order to adapt planning to the new demands of cities and population, a change in the traditional approach is required. Developing city models is a common task in the planning process, which until now has focused on reshaping the city on the basis of past events, with a lack of integration of social participation in the process. This research presents a model of urban land use change to simulate different future scenarios combining modelling with participatory approaches. Problems such as air pollution, uncontrolled urban sprawl, social segregation, traffic congestion, insecurity, environmental impacts, etc., are largely related to urban planning process as well as the lack of interaction between stakeholders involved.
Based on those important issues, the implementation of spatial tools, participatory approaches, and the use of future scenarios can help to contribute in the field of the future studies, by providing strategic future plans that covers a wide range of possible unexpected events (bubble housing, migrations, pandemics, etc.). In this way, scenario planning attempt to design future endpoint and the pathways to link the present and the futures.

97
However, it is important to point out that urban modelling and spatial analysis play an important role in the scenario planning process. These techniques allow exploring growth and change of urban areas, as well as their spatial representation and visualization.
Furthermore, it is well known that urban settlements, designed to accommodate the population and its activities, generate complex patterns due to the unpredictable human behaviour. To address this problem, a family of models oriented to simulate complex patterns by using simple rules has been widely applied. Cellular Automata (CA) constitute a mathematical model in which a spatial system (e.g., a city) evolves according to a discrete time (e.g., a year) step by step.
After presenting the challenges faced by the evolution of urban spaces and the different measures that can help to solve these problems, one question emerges: how is it possible to combine simulation models and participatory approaches to assist urban planning in the decision-making process? This research tries to answer this question by presenting a methodology where a set of techniques such as scenario planning, Public Participation Geographic Information System (PPGIS) and urban modelling bring together their skills to develop appropriate policy packages in the urban planning and decision-making process.
To test these ideas, an urban-industrial corridor in Madrid-Guadalajara (Spain) was selected as a case study. It consists of eleven municipalities with significant differences in their urban structure and dynamics.
In regards the methodology, first step was to develop future scenarios that would provide a vision of the distribution of land uses and the transport systems. Thus, a total of 129 population surveys were conducted among the population to try to find out what they thought the future would be like. Moreover, to achieve a wide range of possibilities and to break the linear thinking strongly influenced by past events, a series of improbable but plausible processes that could have relevant consequences on the evolution of the cities, called wild cards, were incorporated. As a result of this process, three narratives were obtained: (1) Non-motorised city centres, (2) Overpopulation, (3) High insecurity levels in urban areas.
After obtaining a description of disruptive future scenarios, we proceeded with their spatialization. To this end, a participatory mapping workshop was developed, where a dialogue and interaction space between stakeholders and experts was created in order to facilitate the integration of survey results into the scenario spatialization process. Preliminary maps of three disruptive scenarios for 2050 were obtained.
Finally, to analyse, evaluate and simulate all the information obtained from the participation process using Geographic Information Systems (GIS), a vector-based CA model was developed using Python programming language. This model follows traditional CA structure, which has been modified to reproduce disruptive future scenarios of urban development. The prototype model simulates five urban land uses (commercial and utilities, industrial, single-family residential, multi-family residential and mixed use), and allows to reproduce processes of growth (expansion, infill, dispersion), conversion, and loss (abandonment). In this case, each cell is represented by a cadastral parcel, while its status represents the current urban land use. Neighbourhood represents the spatial relationships between different urban land uses, based on distance and the intrinsic characteristics or suitability of the parcels. Accessibility and the legal planning framework are factors that the model also considers. The configuration of all these parameters is based on the information obtained and collected throughout the participatory process.
The results obtained consist of three scenarios integrating the future vision and knowledge of the population, the spatial and technical criteria of urban planning and transport experts and, finally, technical expertise in urban modelling. They show a clear agreement in urban patterns and growth trends with the scenarios described, and present important similarities to the maps obtained during the participatory mapping workshop.
In conclusion, this abstract introduces a new model prototype able to simulate exploratory future scenarios of urban land use change. For this purpose, modelling tasks are combined with participatory approaches, engaging population and expert in the field of urban planning to be part of the process. The spatial representation of future scenarios allows urban planning policies to adapt to new emerging land demands, to anticipate undesirable situations or to protect the environment from possible uncontrolled developments.
98
Developing Multi-regional TIMES-Ireland Model to Support Energy Policy Making: Impacts of Monetary Incentives on Market Uptake of Electric Vehicles
Vahid Aryanpur (1,2), Olexandr Balyk (1), Hannah Daly (1,2), Brian Ó Gallachóir (1,2), James Glynn (1,2,3) (1) Energy Policy and Modelling Group, MaREI Centre,University College Cork, Ireland(2) School of Engineering and Architecture, UniversityCollege Cork, Ireland(3) Center on Global Energy Policy, Columbia University,New York, USA
Introduction
The transport sector significantly relies on fossil fuels in Ireland and accounts for about one-fifth of its total emissions. Private cars dominate fuel consumption and CO2 emissions within this sector and accounted for just under 40% of transport energy use. The electrification of private cars is the key strategy to deliver the ambitious targets, and the government set a target of 840,000 passenger Electric Vehicles (EVs) on the road by 2030.
Energy Systems Optimization Models (ESOMs) can inform policymakers in determining optimal policies and least-cost pathways toward zero-carbon energy systems. In the absence of sub-national details, the national-scale ESOMs can be criticized for the aggregate treatment of spatial dynamics. Furthermore, their results for vehicle fleet mix are often questionable due to the limited representation of consumers’ behaviour.
To represent region-specific characteristics of transport technologies and infrastructures, the present study develops a multi-region transport sector inside the TIMES-Ireland Model (TIM). TIM is an ESOM that calculates the cost-optimal fuel and technology mix to meet future energy service demands for the entire Irish economy. This research proposes a region-specific hurdle rate to incorporate a more realistic representation of consumers’ preferences in vehicle purchasing decisions. Each region is characterized by a median household income. Thus, region-specific hurdle rates are defined based on the household median gross income in each region. While the system-wide TIM ensures decarbonization across the whole economy, this study seeks to quantify the impact of monetary incentives on the market uptake of EVs.
Methodology
The proposed methodology in this research aims at enabling a more realistic representation of transport decarbonization. TIMES (The Integrated MARKAL EFOM System) as partial equilibrium, linear optimization model is a core part of the study. The optimal solution is the minimization of
the total costs of the entire energy system discounted to a base year. A carbon constraint ensures emissions reduction across all supply- and demand-side sub-sectors except for the transport sector. Instead, the transport sector is controlled by hurdle rates and different policy measures. This method allows for knowing how policy measures impact transport decarbonization pathways while mitigation targets are guaranteed in other sectors. All energy flows, emissions and energy technology stocks are calibrated to SEAI’s 2018 energy balance. TIM covers Ireland’s energy system on a national scale, and for the transport sector, Ireland is divided into 26 sub-regions, and each sub-region is characterized by existing vehicle fleet, public transport availability, scrappage rate, annual mileage, vehicle fuel economy and the corresponding passenger and freight mobility demand.
The modelling horizon in TIM is 32 years (2018 to 2050). Annual time periods are defined until 2032, and longer 5-years periods are considered afterwards. All costs are based on 2018 Euros, and for economic assessments, a social discount rate of 4% has been used. The model database consists of more than 300 commodities, more than 2,000 specific technologies, and over 150 constraints control the model (see the details of the model in [1]).
TIMES models usually use a simplified constant lifetime for different vehicles, and thus, the vehicles are retired at the end of the lifetime. To improve the retirement profile both for existing and new vehicles, TIM is equipped with a realistic representation of the survival profile of car technologies. The survival rates are from the Irish CarSTOCK model [2].
Monetary incentives and scenario assumptions
VRT relief and purchase grant as the main monetary policy measures are analyzed in this study. VRT should be paid by consumers when a new car is registered for the first time in Ireland. The average VRT for private cars is 14% of the original vehicle price displayed by a dealer. All EVs receive VRT relief. This relief is up to €5,000 and €2,500 for BEVs and PHEVs, respectively. The relief is prepared until the end of 2021. Additionally, the government offers purchase grants of up to €5,000 for EVs purchased in Ireland. As a result, the combination of VRT relief and purchase grant can provide a maximum subsidy of €7,500 for PHEVs and €10,000 for BEVs.
Different scenarios are defined to explore the impacts of monetary incentives on the adoption of EVs. While the BAU scenario lacks any supportive policy, Monetary Incentive Removal (MIR)
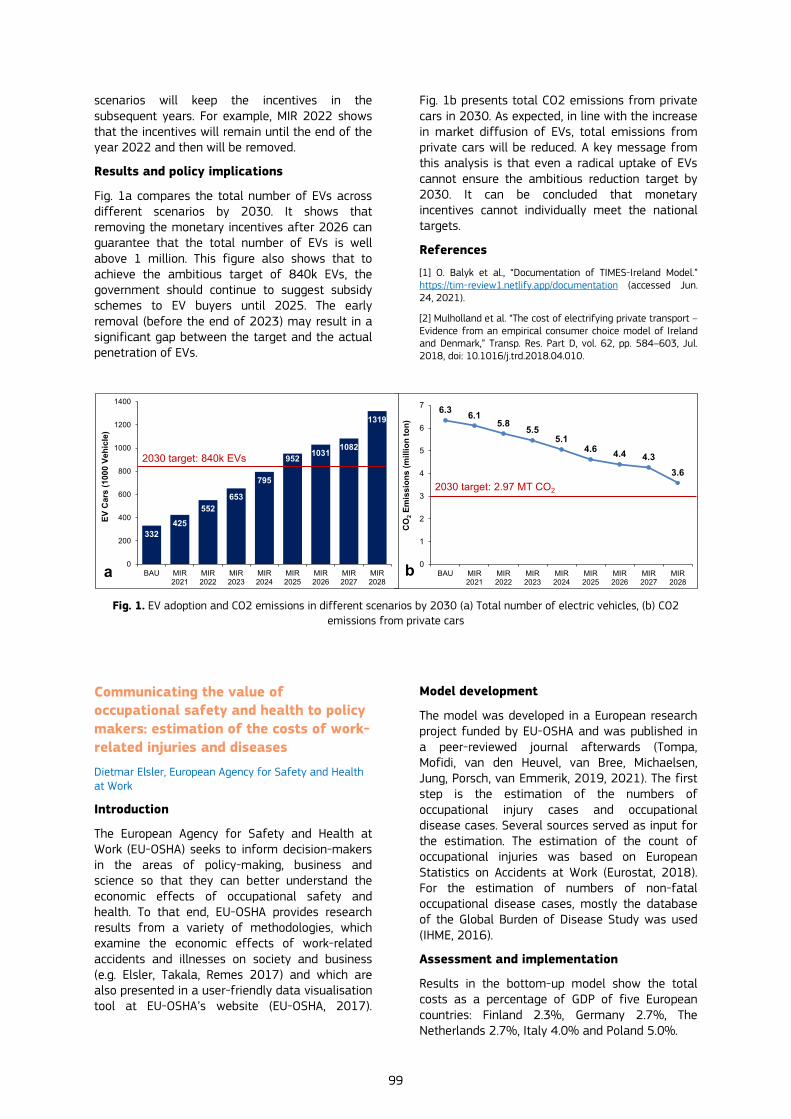
99
scenarios will keep the incentives in the subsequent years. For example, MIR 2022 shows that the incentives will remain until the end of the year 2022 and then will be removed.
Results and policy implications
Fig. 1a compares the total number of EVs across different scenarios by 2030. It shows that removing the monetary incentives after 2026 can guarantee that the total number of EVs is well above 1 million. This figure also shows that to achieve the ambitious target of 840k EVs, the government should continue to suggest subsidy schemes to EV buyers until 2025. The early removal (before the end of 2023) may result in a significant gap between the target and the actual penetration of EVs.
Fig. 1b presents total CO2 emissions from private cars in 2030. As expected, in line with the increase in market diffusion of EVs, total emissions from private cars will be reduced. A key message from this analysis is that even a radical uptake of EVs cannot ensure the ambitious reduction target by 2030. It can be concluded that monetary incentives cannot individually meet the national targets.
References
[1] O. Balyk et al., “Documentation of TIMES-Ireland Model.”https://tim-review1.netlify.app/documentation (accessed Jun.24, 2021).
[2] Mulholland et al. “The cost of electrifying private transport –Evidence from an empirical consumer choice model of Irelandand Denmark,” Transp. Res. Part D, vol. 62, pp. 584–603, Jul.2018, doi: 10.1016/j.trd.2018.04.010.
Fig. 1. EV adoption and CO2 emissions in different scenarios by 2030 (a) Total number of electric vehicles, (b) CO2 emissions from private cars
Communicating the value of occupational safety and health to policy makers: estimation of the costs of work-related injuries and diseases
Dietmar Elsler, European Agency for Safety and Health at Work
Introduction
The European Agency for Safety and Health at Work (EU-OSHA) seeks to inform decision-makers in the areas of policy-making, business and science so that they can better understand the economic effects of occupational safety and health. To that end, EU-OSHA provides research results from a variety of methodologies, which examine the economic effects of work-related accidents and illnesses on society and business (e.g. Elsler, Takala, Remes 2017) and which are also presented in a user-friendly data visualisation tool at EU-OSHA’s website (EU-OSHA, 2017).
Model development
The model was developed in a European research project funded by EU-OSHA and was published in a peer-reviewed journal afterwards (Tompa, Mofidi, van den Heuvel, van Bree, Michaelsen, Jung, Porsch, van Emmerik, 2019, 2021). The first step is the estimation of the numbers of occupational injury cases and occupational disease cases. Several sources served as input for the estimation. The estimation of the count of occupational injuries was based on European Statistics on Accidents at Work (Eurostat, 2018). For the estimation of numbers of non-fatal occupational disease cases, mostly the database of the Global Burden of Disease Study was used (IHME, 2016).
Assessment and implementation
Results in the bottom-up model show the total costs as a percentage of GDP of five European countries: Finland 2.3%, Germany 2.7%, The Netherlands 2.7%, Italy 4.0% and Poland 5.0%.
6.3 6.15.8 5.5
5.14.6 4.4 4.3
3.6
0
1
2
3
4
5
6
7
BAU MIR2021
MIR2022
MIR2023
MIR2024
MIR2025
MIR2026
MIR2027
MIR2028
CO
2Em
issi
ons
(mill
ion
ton)
332425
552653
795
952 1031 1082
1319
0
200
400
600
800
1000
1200
1400
BAU MIR2021
MIR2022
MIR2023
MIR2024
MIR2025
MIR2026
MIR2027
MIR2028
EV C
ars
(100
0 Ve
hicl
e)
2030 target: 840k EVs
2030 target: 2.97 MT CO2
a b
100
The three key stakeholders, namely the employer, worker and system/society, can stratify the total costs for each country. Across all five countries, workers bear the highest costs. The percentage ranges from a high of 79% for Poland, to a low of 61% for Germany. Employers are the second highest category for all countries. These range from a high of 22% for Finland, to a low of 1% for Poland. System/Societal costs bear the lowest proportion of the costs across the five countries, with a range of 19% at the high end for Germany and Poland, to a low of 10% for Poland.
In comparing the countries, we see that the economic burden of occupational injury and disease is relatively high in Poland and Italy, compared with Germany, Finland and the Netherlands. In Poland, at least part of this may be explained by the sector structure. The workforce in Poland consists of a relatively high number of people working in agriculture or industry. Although the percentage of people working in industry in Italy is above average, the explanation for the relatively high burden is less clear than in Poland. The relatively high burden is partly attributable to the number of DALYs lost to occupational lung cancer. The rich information of the project could be used for further analysis in order to find out, where the country differences really come from, e.g. higher per case costs in some countries could be a hint for longer return to work times after accidents or diseases. Therefore, a more detailed secondary analyses of the data would be needed, including the countries who did estimations following this model, such as Austria.
There is a need for better and more comparable data at European level, especially regarding work-related diseases. Probably better European labour force surveys could help to improve, because they could deliver at least comparable survey data in Europe. In this regard, the upcoming EU-OSHA exposure survey on carcinogens could deliver better data. From EU-level, standardised reporting guidelines or even directives for occupational disease reporting would be helpful.
Model use for policy development
Cost estimations in the policy area of Occupational Safety and Health (OSH) are a politically very sensitive issue. On the one hand, data quality and modelling still could be improved; on the other hand, there is the strong need for a kind of impact assessment at policy level. In addition to scientific accuracy, the acceptance of important stakeholders and policy makers is key for a successful impact of the estimation model developed.
Therefore, at the end of the research project in October 2019 EU-OSHA organised an expert meeting on the value of OSH, where leading OSH
experts from nearly all EU countries and representatives from ILO/WHO and ICOH looked at the findings of EU-OSHA’s project to estimate the costs of occupational injuries, diseases and deaths at European level.
Communication of the cost estimation findings to politicians and policy makers was regarded as a key element. In order to convince ministers and reach the mass media, the messages have to be very clear and simplified. It could be beneficial to better link OSH cost estimations with research of the environmental topics (climate change, pollution), as environmental topics enjoy much higher public attention. In order to raise public attention and influence the political agenda it was suggested to promote further the inclusion of work-related burden of disease and injury estimates in the indicator system for monitoring progress along the UN Sustainable Development Goals (including SDG 8, Decent Work and Economic Growth).
In the press conference of the recent launch of the European Commission’s new Strategic Framework on Health and Safety at Work (29 June 2021), both Commissioner Schmit and Executive Vice President Dombrovskis, highlighted that there is a strong economic case for a high level of worker protection and mentioned that work-related accidents and illnesses cost the EU economy over 3.3% of GDP annually.
Earlier to the new Strategic Framework the EU-OSHA cost estimation model had already impact on high-level policy documents, such as the official opinion on costs and benefits of OSH from the European Economic and Social Committee (2019). Further, the developed estimation model had influence on several national OSH policies, e.g. in 2020 the Austrian chamber of labor developed a national cost estimation following this research that had considerable impact in national media.
References
Elsler, D, Takala, J, Remes, J (2017). Kosten von arbeitsbedingten Unfällen und Erkrankungen im internationalen Vergleich. ASU – Arbeitsmedizin, Sozialmedizin, Umweltmedizin. ASU 10/2017, 760-765. Available at: https://www.asu-arbeitsmedizin.com/kosten-von-arbeitsbedingten-unfaellen-im-internationalen-vergleich/originalia-kosten-von
EU-OSHA (2017). The economics of occupational safety and health – the value of OSH to society. Available at: https://visualisation.osha.europa.eu/osh-costs#!/
EU-OSHA (2019). The value of occupational safety and health and the societal costs of work-related injuries and diseases. EU-OSHA (European Agency for Safety and Health at Work). Publications Office of the European Union, Luxembourg. https://osha.europa.eu/en/publications/value-occupational-safety-and-health-and-societal-costs-work-related-injuries-and/view
European Commission (2021). Occupational safety and health in a changing world of work. Available at: https://ec.europa.eu/commission/presscorner/detail/en/ip_21_3170

101
Eurostat (2018). Accidents at work statistics (ESAW). Fatal and non-fatal accidents at work, by sex, age groups, injury groups and NACE Rev. 2 economic sectors [hsw_mi07] (2015). Available at: http://appsso.eurostat.ec.europa.eu/nui/show.do?dataset=hsw_mi07&lang=en
European Economic and Social Committee (2019). Summary of the costs and benefits of Investments in occupational safety and health (OSH) (Exploratory opinion at the request of the Finnish Presidency). Available at:https://www.eesc.europa.eu/en/our-work/opinions-information-reports/opinions/summary-costs-and-benefits-investments-occupational-safety-and-health-osh-exploratory-opinion-request-finnish-presidency
IHME (Institute for Health Metrics and Evaluation) (2016). Rethinking development and health: Findings from the Global Burden of Disease Study. Seattle, WA: IHME. IHME Database. Available at: http://ghdx.healthdata.org/gbd-results-tool?params=gbd-api-2016-permalink/7193a516026f9a7df17cf73ea9ce3a5d
Tompa E., Mofidi A., van den Heuvel S., van Bree T., Michaelsen F., Jung Y., Porsch L., van Emmerik M. (2021) Economic burden of work injuries and diseases: a framework and application in five European Union countries. BMC Public Health 21, 49 (2021). https://doi.org/10.1186/s12889-020-10050-7
Where does the EU Cohesion Policy produce its impact? Simulations with a Regional Dynamic General Equilibrium Model
Philippe Monfort, DG for Regional and Urban Policy, European Commission Simone Salotti, Joint Research Centre, European Commission
Cohesion Policy is supposed to support convergence of EU countries and regions. Accordingly, it devotes most of its resources to the less developed regions. At the same time, the EU budget is largely financed by the contributions of the Member States, which is proportionate to their GNI. As a result, Cohesion Policy implies a transfer of resources from the richest to the poorest EU Member States and regions, which is an expression of the European solidarity.
A question keeps coming back in the discussions on how the benefits and the costs of the policy are shared among the Member States: what are the returns to the net contributors from the policy interventions in the net beneficiaries? Cohesion Policy is likely to produce important spatial spillovers, with the programmes implemented in a given region having an impact in the rest of the EU. This can considerably affect the costs-benefits balance of the policy. As a result, the net contribution or benefits of the Member States cannot be properly assessed by simply looking at the amounts they pour into, and receive from, the community budget.
In this paper, we use a spatial dynamic computable general equilibrium model called
RHOMOLO to analyse the spillovers associated to the EU Cohesion Policy for the 2007-2013 programming period. We particularly focus on the extent to which the benefits of the interventions implemented in the net beneficiaries spread out to the net contributors. The results of the modelling simulations suggest that in the medium to long run, there are substantial benefits originating in the regions targeted by the policy which spread to the rest of the EU, making the interventions beneficial even for the territories which contribute the most to the financing of the interventions themselves.
Our main findings are the following:
• Cohesion Policy programmes has a positiveand significant impact on the economies of theEU Member States and regions. The impact ishigher in the main beneficiaries but, in thelong-run, it is also positive in more developedcountries and regions in spite of the fact thatthey are net contributors to the policy.
• The impact is much higher in the poorestregions of the EU, suggesting that CohesionPolicy fulfils its objective of reducing regionaldisparities.
• Spill-overs account for a substantial share ofthe total impact of the policy. In the long-run,around 15% of the impact on EU GDP stemsfrom international spill-overs which meansthat Cohesion Policy is a positive sum gameand generates cross-fertilization of MemberStates economies. Spill-overs are particularlyimportant for the main contributors to thepolicy. In the long-run, more than 45% of theimpact in the countries not eligible to theCohesion Fund come from countries benefitingfrom this Fund. For some Member States, spill-overs constitute the main source of benefitsfrom Cohesion Policy.
Machine Learning algorithms and environmental decision support systems: a new approach for air quality decision planning
Alessandro Lotti, Maria Chiara Sole, ISPRA – Italian Institute for Environmental Protection and Research
In the last decades, environmental issues have increased weight within the public debate at national and international level, stimulating a dialogue which is transversal to the social, economic and environmental aspects. More recently, the European Green Deal has set the roadmap for boosting the efficient use of resources by moving to a clean, circular economy
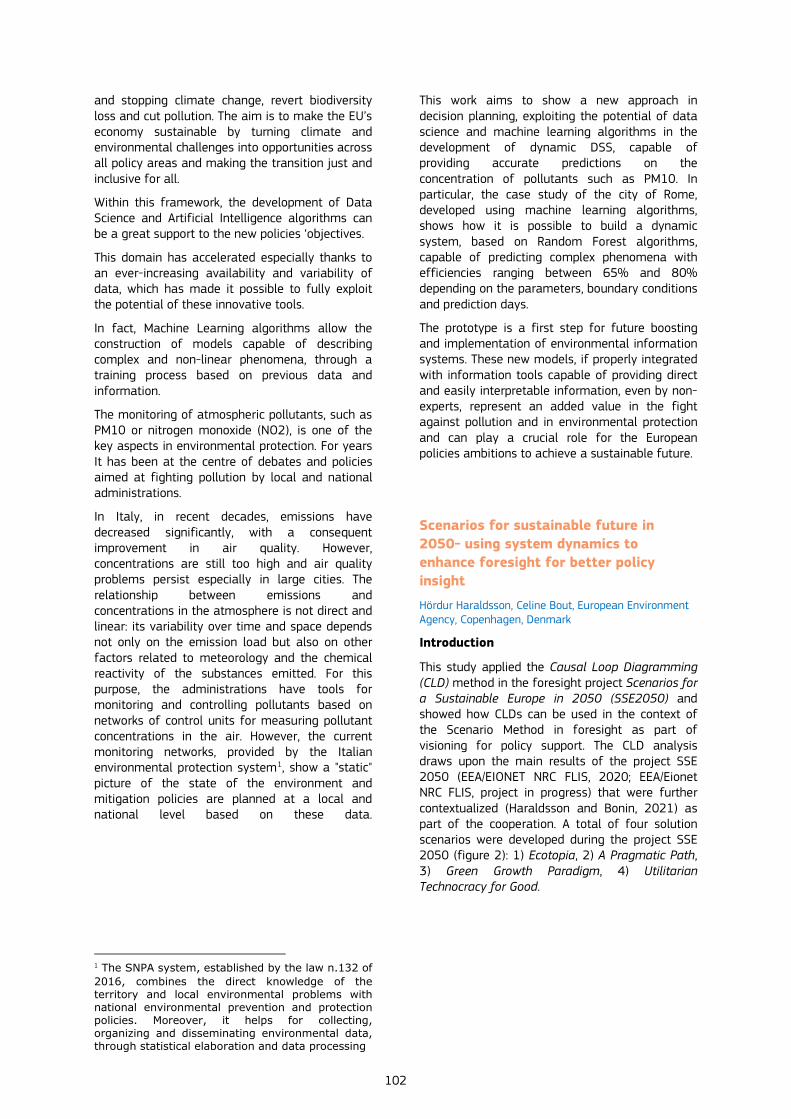
102
and stopping climate change, revert biodiversity loss and cut pollution. The aim is to make the EU’s economy sustainable by turning climate and environmental challenges into opportunities across all policy areas and making the transition just and inclusive for all.
Within this framework, the development of Data Science and Artificial Intelligence algorithms can be a great support to the new policies ‘objectives.
This domain has accelerated especially thanks to an ever-increasing availability and variability of data, which has made it possible to fully exploit the potential of these innovative tools.
In fact, Machine Learning algorithms allow the construction of models capable of describing complex and non-linear phenomena, through a training process based on previous data and information.
The monitoring of atmospheric pollutants, such as PM10 or nitrogen monoxide (NO2), is one of the key aspects in environmental protection. For years It has been at the centre of debates and policies aimed at fighting pollution by local and national administrations.
In Italy, in recent decades, emissions have decreased significantly, with a consequent improvement in air quality. However, concentrations are still too high and air quality problems persist especially in large cities. The relationship between emissions and concentrations in the atmosphere is not direct and linear: its variability over time and space depends not only on the emission load but also on other factors related to meteorology and the chemical reactivity of the substances emitted. For this purpose, the administrations have tools for monitoring and controlling pollutants based on networks of control units for measuring pollutant concentrations in the air. However, the current monitoring networks, provided by the Italian environmental protection system1, show a "static" picture of the state of the environment and mitigation policies are planned at a local and national level based on these data.
1 The SNPA system, established by the law n.132 of 2016, combines the direct knowledge of the territory and local environmental problems with national environmental prevention and protection policies. Moreover, it helps for collecting, organizing and disseminating environmental data, through statistical elaboration and data processing
This work aims to show a new approach in decision planning, exploiting the potential of data science and machine learning algorithms in the development of dynamic DSS, capable of providing accurate predictions on the concentration of pollutants such as PM10. In particular, the case study of the city of Rome, developed using machine learning algorithms, shows how it is possible to build a dynamic system, based on Random Forest algorithms, capable of predicting complex phenomena with efficiencies ranging between 65% and 80% depending on the parameters, boundary conditions and prediction days.
The prototype is a first step for future boosting and implementation of environmental information systems. These new models, if properly integrated with information tools capable of providing direct and easily interpretable information, even by non-experts, represent an added value in the fight against pollution and in environmental protection and can play a crucial role for the European policies ambitions to achieve a sustainable future.
Scenarios for sustainable future in 2050- using system dynamics to enhance foresight for better policy insight
Hördur Haraldsson, Celine Bout, European Environment Agency, Copenhagen, Denmark
Introduction
This study applied the Causal Loop Diagramming (CLD) method in the foresight project Scenarios for a Sustainable Europe in 2050 (SSE2050) and showed how CLDs can be used in the context of the Scenario Method in foresight as part of visioning for policy support. The CLD analysis draws upon the main results of the project SSE 2050 (EEA/EIONET NRC FLIS, 2020; EEA/Eionet NRC FLIS, project in progress) that were further contextualized (Haraldsson and Bonin, 2021) as part of the cooperation. A total of four solution scenarios were developed during the project SSE 2050 (figure 2): 1) Ecotopia, 2) A Pragmatic Path, 3) Green Growth Paradigm, 4) UtilitarianTechnocracy for Good.
103
Figure 1: The four solution scenarios
Application of combined approach of foresight scenario method and system dynamic modelling
The study applied a qualitative modelling by combining the Foresight Scenario method with the system dynamic modelling. The number of elements per scenario should be limited to about 15 to 20 to maintain overview and coherence. Foresight points to the direction where the proper framing should occur in space and time, and systems dynamics sets the rules on how the framing should be done in respect of space and time (ref conf paper). A key success factor was to find the appropriate level of detail that addressed the questions posed. The type of outcome coming from SSE 2050 project saw the use of the combined (explorative and descriptive) approach useful. This is because scenario narratives are framed with a set of conditions that “tell the story” of the situation picture in the distance future. The combined CLD approach explores the framing of the boundaries and descriptively identifies specific success and limiting feedback parameters that influence the scenario evolution, thus reflecting on the scenario objectives and what is required to maintain desired conditions. The questions posed for the scenarios were following:
• How can scenarios be framed without losingthe information in a simplified CLD?
• What are important cause and effectrelationships and feedback-loops identified?
• What are the success and limiting factors thatenable the scenario in its current form?
• What items need to be added to enablecontinuity/plausibility of the scenario?
• How is dynamic behaviour expressed in thescenarios?
• How is consumption and production and theirsubsystem (mobility, food, energy) expressedin each scenario?
• How do the scenario narrative connect togeneral aspects of sustainability of Europe andthe global drivers?
Added value of using CLD approach for the description of key factors of change in scenarios
The results show that the solution scenarios vary slightly in how the framing of system boundaries and the point of departure in the narratives are treated. Key factors identified through the analysis are either generic or highly specific, influencing the policy interpretation of the scenarios. This illustrates the necessity to be explicit in language description since factors derived for the CLDs need explicit language to connect better to policy measures. The solution scenarios tended to highlight reinforcing behaviour in the narratives and omit the description of limiting factors, therefore showing unlimited growth. This illustrates the main difference between the Scenario Method and the CLD approach. The narratives produced from the Scenario Method describe a situation picture of the desired state without going into details about how the scenarios work internally, whereas the CLD approach investigates how the makeup of the scenario is constructed through feedbacks. Reinforcing loops are temporary and limiting factors will ultimately constrain growth in all systems. It was therefore necessary to insert specific barriers/limitations to create balancing feedback loop behaviour within the scenarios.

104
Figure 2: CLD of a post-growth collaboration, Ecotopia
This study concludes the following for further work:
1. Framing the solution scenario narratives inspace and time by creating a dynamic storytelling.Adapting scenarios into CLDs supplements themain narrative with visual and dynamic version,thus increasing the potential audience reached bythe scenario. The dynamic characteristic is ofparticular interest thanks to the increased focuson implementing foresight within policymakingprocesses. Policymakers seek information that areconcise and centred onhttps://www.oecd.org/strategic-foresight/ourwork/OECD%20GFC%20Annual%20Meeting%20Report%202020.pdf their current focus(OECD, 2020), CLD provides such a flexibility,presenting the entire content of a scenarionarrative but giving the possibility to centre on agiven area.
2. Identifying challenges and shortfalls in thesolution scenario narratives that need to beaddressed to enhance robustness and reliability.The translation from narrative to CLD can oftenhighlight missing links and shortcoming within thenarrative, thus pointing out to areas where thenarrative could be strengthened. Due to theincreasing connectedness between the sectorsimpacting and defining sustainability levels,ensuring the comprehensiveness and robustnessof sustainability assessments is becomingincreasingly crucial. While narratives are importantto provide a richer context to a scenario, a parallelCLD process helps increasing robustness.
3. Stimulating the discussion on how externalsystems influence the scenario narratives, i.e.production and consumption systems (energy,food, mobility) as well as actions of Europe andthe goals and actions of other actors outsideEurope. The possibility to link a CLD with otherCLD systems such as energy, food and mobility
means that the dynamics within those systems can be implemented into each new scenario CLDs and by extension their narratives. This implementation can lead to further reflection on the impacts of those “external” systems on newly created scenarios, including systems that could appear as only mildly connected after preliminary and more qualitative observations. Furthermore, a broader connection to CLDs representing global or context scenarios.
4. Identify and integrating additional sustainabilityindicators into scenarios through the CLD buildingprocess. A scenario narrative can be reinforced viaits CLD process by connecting additional indicatorsand information to existing variables to showwhere policy comes into the feedback loop systemso as to strengthen the robustness of thesustainability assessment.
5. Link to Horizon Scanning by using HS PESTLE+.Explore structured horizon scanning with a CLDprocess with a scanning structure that ensures adynamic approach in terms of sectors, scales andtime distance. Signals and trends be transcribedinto CLD components and adapted into a narrativevia a qualitative scenario process.
References
Haraldsson, H.V., Bonin, D., 2021. Using systems approach to integrate Causal Loop Diagrams modelling in the foresight project Scenarios for a Sustainable Europe 2050 (No. 6975). Swedish EPA, Stockholm.https://www.researchgate.net/publication/350327646_Using_systems_approach_to_integrate_Causal_Loop_Diagrams_modelling_in_the_foresight_project_Scenarios_for_a_Sustainable_Europe_2050
OECD, 2020. Government Foresight Community- Annual Meeting Report 2020, Strategic foresight for future-ready public policy, held 12-14 October 2020, 68p https://www.oecd.org/strategic-foresight/ourwork/OECD%20GFC%20Annual%20Meeting%20Report%202020.pdf

105
E3ME-FTT-GENIE: model description, update and results
Femke Nijsse, Unnada Chewpreecha, Jean-Francois Mercure, Hector Pollitt, Yeliz Simsek, Pim Vercoulen
Introduction
In 2015, virtually all countries came together to adopt the Paris Agreement to limit global warming to well below 2 degrees. Since this historical moment, emissions have continued rising, but technological progress in clean technology such as solar PV and electric mobility has given rise to optimism too.
More progress is needed in various sectors (f.i. heat, freight, and steel), and policy makers need models that capture policy instruments which can accelerate innovation and cost declines. The impact of these transformations on socio-economic variables is a topic of research.
E3ME-FTT-GENIE (Mercure et al, 2018) is a model based on simulation instead of optimalisation. Recognising fundamental uncertainty with agents making decision errors and planning for uncertain outcomes with spare capacity, it is not possible to optimise decision-making. Another key aspect of the model is path-dependency. Noting empirical evidence showing that technological progress can be shaped by focused policy, included policies can for instance drive costs declines via learning-by-doing.
Model description
E3ME is the main macroeconomic part of the model and contains 70 regions, including all EU members individually. Each EU member has 70 sectors, while regions outside of the EU are modelled to a disaggregation of 43 sectors. The sectors are linked with input-output tables, while bilateral trade equations provide the linkage between regions. The model has considerable data requirements: each sector in each region requires a 45-year time series. The econometric estimation is based on co-integration and error-correction methods. It was initially developed through various research programmes of the European Commission.
The diffusion of technologies in sectors with significant innovation is not well modelled by econometric equations. This is because of self-reinforcing feedbacks within the system, whereby the adoption of a new technology is strongly
influenced by how much other agents have adopted it before. For instance, technologies are adopted when people learn about the experiences neighbours and friends. Furthermore, the industrial capacity of technologies to expand is larger for those that have captured a large market share already. These processes lead to the characteristic S-shaped diffusion curves. In these sectors, FutureTechnology Transformation (FTT) models use a setof differential equations which expresses theircompetition instead of econometric regression.
Competition is driven by perceived cost differentials, contained by system effects, and influenced by policies. Agents attempt to minimise costs but due to the inherent heterogeneous character of an assembly of agents this does not have to lead to a minimised (or “optimal”) system cost. Their heterogeneous behaviour stems from sub-optimal knowledge, different perceptions about costs, and different valuations of the future, which is reflected in the FTT framework.
Five FTT submodels have been developed: FTT:Power, FTT:Heat, FTT:Transport, FTT:Freight and FTT:Steel. These submodels are all calibrated with recent data on costs, learning and technology shares. FTT:Power is disaggregated into 24 power generation technologies. To ensure grid stability, we use a parameterization of a load-duration curve following Ueckert et al (2017). Energy storage costs are either attributed to variable resources or shared among power producers or consumers.
The climate system is simulated with GENIE, a climate model of intermediate complexity. It is soft-coupled to the other two models: affected by greenhouse emissions, but rising temperature do not themselves affect the economy. The climate response is quantified by running the model repeatedly, using a set of varying parameters, which each span an uncertainty band, so that the model provides a probabilistic temperature outcome corresponding to a set of policies.
Using a wide set of policy interventions in energy efficiency, regulation and carbon pricing, a scenario consistent with 1.5 C warming is constructed. Even in the baseline scenario, green technologies continue increasing. Kickstarts stimulate learning-by-doing in newer technologies, standards allow for improved efficiency and a carbon tax can level the playing field.
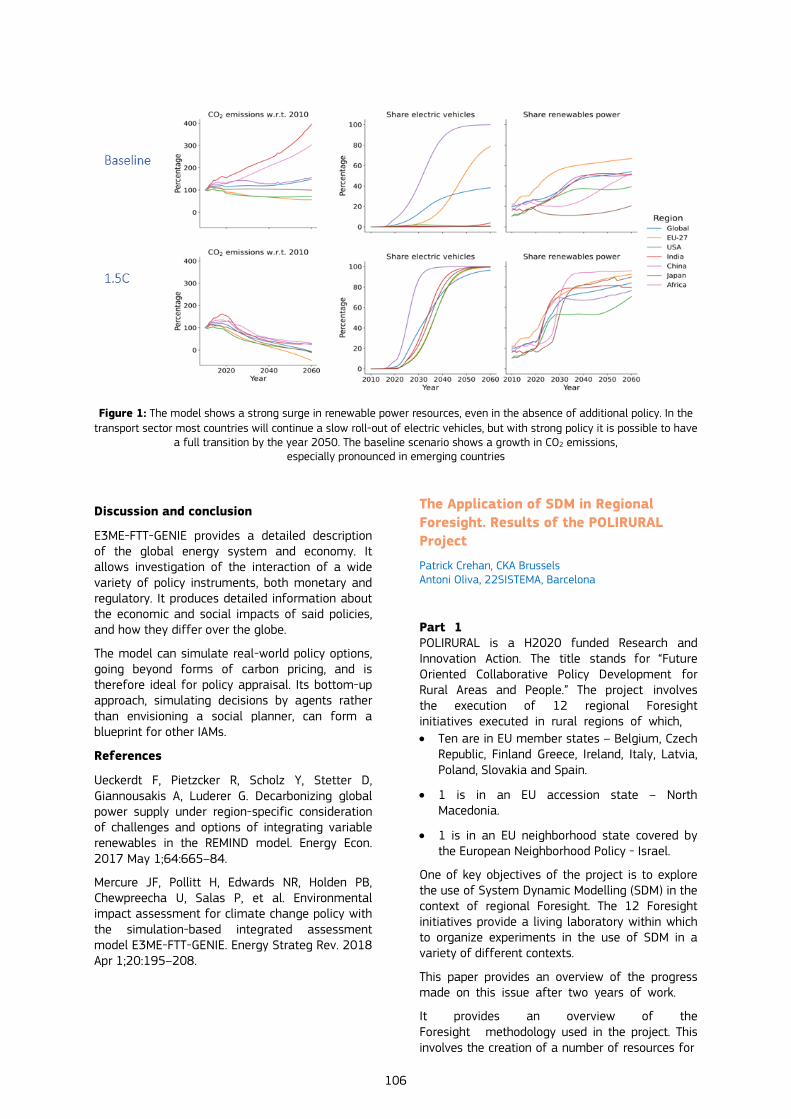
106
Figure 1: The model shows a strong surge in renewable power resources, even in the absence of additional policy. In the transport sector most countries will continue a slow roll-out of electric vehicles, but with strong policy it is possible to have
a full transition by the year 2050. The baseline scenario shows a growth in CO2 emissions, especially pronounced in emerging countries
Discussion and conclusion
E3ME-FTT-GENIE provides a detailed description of the global energy system and economy. It allows investigation of the interaction of a wide variety of policy instruments, both monetary and regulatory. It produces detailed information about the economic and social impacts of said policies, and how they differ over the globe.
The model can simulate real-world policy options, going beyond forms of carbon pricing, and is therefore ideal for policy appraisal. Its bottom-up approach, simulating decisions by agents rather than envisioning a social planner, can form a blueprint for other IAMs.
References
Ueckerdt F, Pietzcker R, Scholz Y, Stetter D, Giannousakis A, Luderer G. Decarbonizing global power supply under region-specific consideration of challenges and options of integrating variable renewables in the REMIND model. Energy Econ. 2017 May 1;64:665–84.
Mercure JF, Pollitt H, Edwards NR, Holden PB, Chewpreecha U, Salas P, et al. Environmental impact assessment for climate change policy with the simulation-based integrated assessment model E3ME-FTT-GENIE. Energy Strateg Rev. 2018 Apr 1;20:195–208.
The Application of SDM in Regional Foresight. Results of the POLIRURAL Project
Patrick Crehan, CKA Brussels Antoni Oliva, 22SISTEMA, Barcelona
Part 1POLIRURAL is a H2020 funded Research and Innovation Action. The title stands for “Future Oriented Collaborative Policy Development for Rural Areas and People.” The project involves the execution of 12 regional Foresight initiatives executed in rural regions of which, • Ten are in EU member states – Belgium, Czech
Republic, Finland Greece, Ireland, Italy, Latvia,Poland, Slovakia and Spain.
• 1 is in an EU accession state – NorthMacedonia.
• 1 is in an EU neighborhood state covered bythe European Neighborhood Policy - Israel.
One of key objectives of the project is to explore the use of System Dynamic Modelling (SDM) in the context of regional Foresight. The 12 Foresight initiatives provide a living laboratory within which to organize experiments in the use of SDM in a variety of different contexts.
This paper provides an overview of the progress made on this issue after two years of work.
It provides an overview of the Foresight methodology used in the project. This involves the creation of a number of resources for

107
use by the regional teams, to guarantee a basic level of shared process structure and orientation, in which to carry out the SDM experiments. These include
• A STEEPV inventory drivers of change
• A series of guides to Deep Dives on issues of general concern
o CAP Reform (with a focus on farm incomes)
o Biodiversity (and natural capital)
o The response to COVID (and resilience strategies)
o The Green Deal (and the path to Net Zero)
• An inventory of policy options (including about 40 options for financing)
Our initial idea was to use SDM to explore the role of drivers and their interaction, as part of the drivers’ analysis part of each regional Foresight process. This approach proved too difficult to implement at this stage, as part of an engagement strategy involving a diverse group of stakeholders, with varying levels of familiarity with economic development, modelling, and the dynamics of complex systems.
We looked at new and emerging models of sustainability. In particular models based on natural capital and natural capital accounting as well as the SDGs, and popular techniques for visualizing the SDGs such as the “wedding cake” model and the “doughnut model.”
In the end we decided to focus on the use of SDM to support the exploration of policy options through interactive stakeholder workshop, based on a three-layer model which features
• A top layer containing the KPIs related to thevision and challenges
• A middle layer that captures regional dynamicsthat impact the KPIs
• A bottom later containing the policy optionsthat will drive regional dynamics.
This led to the development of a general framework for setting up the model, and employing it as part of a Foresight initiative, to help stakeholders attain better insights into the policy measures and policy mixes, the intervention logic, how they interact with each other and how they impact the KPIs over time.
This paper describes this approach in detail and what we intend to achieve with this approach. A second paper will describe the progress made so far, the lessons learned from the concrete experiments now being run by the 12 regional Foresight teams of the POLIRURAL project.
Part 2
This work is being developed in the framework of the PoliRural project, a Research and Innovation Action belonging to the Horizon 2020 program under grant agreement No 818496.
The areas it refers mainly are 7. Combination of qualitative and quantitative methods; and 9. Using model related evidence for policy: processes and experiences.
PoliRural will provide a set of knowledge resources where rural population, researchers and policymakers come together to address common problems. Thus, decision makers at different levels will be better equipped to tackle existing and emerging rural challenges.
System Dynamics Modelling (SDM) is an important part of this set of knowledge, and it has the specific aim of building a common understanding of the whole rural ecosystem and envisioning possible scenarios combining drivers and policy options.
A template model was developed (editions 1, 2 & 3), combining bibliography research and consultation with pilot regions (12 pilot regions in Europe and Israel).
PoliRural SDM edition 3 is made up of 8 modules. Six of them cover the most relevant aspects of a rural ecosystem: Population, Education, Employment, Agriculture and Natural Capital. And the two remaining close the loop by defining rural attractiveness (for newcomers) and rural retention capacity (for current inhabitants of the rural areas).
PoliRural SDM ed. 3 has been tested with the twelve pilot regions and a soft adaptation and calibration process has been carried out when possible. The model has acted as a conversation starter among stakeholders, easing a common vision of the whole rural ecosystem, including complex dynamics affecting natural or social capital.
Despite lack of predictive power of the tool, because of the level of detail the project is working, SDM was able to capture complex dynamics linking rural attractiveness with e.g., variations in social and natural capital stocks. That’s why the presentation will be focussing on the test with pilots, the implications of adapting a template pre-existing model, possibilities, and disadvantages.
The discussion will focus on how the SDM exercise can contribute to the foresight exercise and beyond, and what are the problems faced and lessons learned so far.

108
The paper will include the following sections:
• Description of PoliRural SDM ed. 3
o Modules
o Main feedback loops
o Main assumptions and simplifications
• Testing the model
o Co-designing with stakeholders
o Information data sets
o Some initial results
• Next steps
o Projections for the end of PoliRural project
o Recommendations and possible future linesof work
This paper is the second part of the PoliRural contribution. The first one contains the overall approach and the three-layer model, developed in the framework of the project.
Agricultural policy behavioural, ecological and socio-economic modelling: From case studies to European scale
Guy Ziv, University of Leeds, UK Anna Cord, Technische Universität Dresden, Germany Michael Beckmann, Birgit Müller, Helmholtz-Zentrum for Environmental Research - UFZ, Germany Tomáš Václavík, Palacký University Olomouc, Czech Republic Cristina Domingo-Marimon, Centro de Investigacion Ecologica Y Aplicaciones Forestales, Spain James Bullock, Centre for Ecology and Hydrology, UK
To maintain economic stability and the livelihoods of European farmers, policy instruments and subsidies must be revised and accompanied by new indicators, including well-being, ecological quality, employment and equity, biodiversity conservation, and ecosystem services. Existing impact assessment models for agricultural policies, however, focus on narrow aspects of agricultural economics (such as income) and do not adequately account for the complexity of decisions made by farmers. The four-year H2020 RIA BESTMAP – Behavioural, Ecological and Socio-Economic Tools for Modelling Agricultural Policy - funded under RUR-04-2018, is developing a novel framework based on agent-based and biophysical models, to assess the adoption and impact of agri-environmental schemes (AES) that are part of Pillar II measures in the Common Agricultural Policy. The framework is operationalized by using existing georeferenced datasets on farm and field characteristics and is co-designed with EU
institutions, national, regional and local decision-makers, expert personnel and other researchers in five case study (CS) areas - Humber (UK), Mulde (DE), Catalonia (ES), South Moravia (CZ) and Bačka (RS) - to help develop a meta-modelling approach upscaled to large parts of Europe.
Farming System Archetypes (FSA) are a core component of BESTMAP modelling architecture. These concepts are based on the ideas of land systems science. An FSA is meant to describe a recurring pattern of land-use and management, farmer behaviour, and similar decisions and policy responses. The BESTMAP project aims to upscale (starting with case studies based on LPIS/IACS) to an EU-wide level, using the harmonized Farm Accountancy Data Network (FADN). There were few overlaps between public datasets at CS and EU scales, therefore FSA construction was limited to two dimensions: (a) farm specialization (general cropping, horticulture, permanent crops, livestock or other) and (b) economic farm size. Still, the harmonization between LPIS and FADN land-use categories was hampered by unclear definitions of land-use classes, e.g. in the case of permanent vs. temporary grasslands. Furthermore, LPIS data from national institutions was difficult to obtain, data sharing agreements were limited even within the consortium, and different data formats were used by different countries.
A noteworthy aspect of BESTMAP is the use of 124 semi-structured face-to-face interviews to identify key factors influencing farmers' decisions about AES (Jan-May 2020). The interview campaign was challenged by Covid-19, which forced the switch to a telephone/online format, but the sample size, from 14 (Mulde CS) to 47 (Catalonia CS), was sufficient for a qualitative study. As the interviews revealed, the most crucial factors that influence farmers' decision-making are economic aspects related to the overall business model of the farm, fit with established farm practices, and land characteristics. Financial factors are the main reasons for current and planned AES participation. Ecological concerns were of medium importance, as they were rarely cited as decisive reasons, neither motivating nor preventing AES participation. Finally, the importance of social aspects was indicated by the farmers as low, as these, in contrast to several other studies, were mentioned only in terms of improving public image.
Based on the insights obtained from the interviews, BESTMAP developed a prototype agent-based model to simulate the adoption of four selected AES schemes (field margins, cover crops, maintaining permanent grasslands, and arable to grassland conversion). To formalize empirically observed farmer behaviour into model rules, complex decision-making must be simplified
109
into clear cause-and-effect relationships. In our research, we found that following established behavioural theories (e.g. Theory of Planned Behaviour) is problematic: firstly, theories often consider only a few aspects of decision-making and fail to integrate the multiple influences that farmers face. In addition, theory formulation is lacking, and parameterization data are scarce. In order to address this gap, we are developing an empirically driven decision framework based on qualitative and quantitative results of the interview campaign. This evidence was distilled into a conceptual framework that consists of three steps. It considers (1) whether farmers are in general open to adopting specific AES, (2) which fields are appropriate for AES adoption, and (3) the final deliberation whether farmers adopt specific AES, which is driven primarily by economic factors, with social and ecological elements taken into account as well. A discrete choice experiment survey will be conducted in all CSs later this year, in order to parameterize the framework and capture regional differences more specifically.
Parallel to developing the agent-based models, BESTMAP worked on analysing the environmental and climatic impacts of AES adoption. It is well recognized that biophysical modelling at large spatial scales is challenging. While we aimed to use calibrated and validated models to simulate
all CS, it can be hard to find reliable data to validate a fixed set of ecosystem models. Scientists often solve this by studying certain processes in locations where they had access to specific primary or secondary data - an approach that cannot be used to assess trade-offs/synergies or upscale to the EU level. The BESTMAP project intended to address these issues by developing two harmonised geospatial databases, one for countries and one for Europe, and by carefully considering and communicating the assumptions BESTMAP modellers make along the way. Food production, carbon sequestration, water quality (nutrient retention), and biodiversity are all included in the BESTMAP model set. Multiple data sources (LPIS, biodiversity, biophysical, etc.) pose another challenge due to different spatial and temporal resolutions across CSs and the incompatibility of model results (e.g. available biodiversity data in CS had been collected using different monitoring strategies). Finally, understanding data sharing and data safety is critical when working with data supplied under strict guidelines from public institutions of Member States (LPIS) and the European Commission (FADN); it impacts both the skills required within the organisations with the data access agreement and dependencies across work packages, which is an important lesson for future projects under Horizon Europe.
110
Session 8
Combination of qualitative and quantitative methods
26 November
13:30 – 14:50
111
Territorial Impact Assessment – modelling evidence for better EU legislation
Bernd Schuh, Roland Gaugitsch, Austrian Institute for Regional Studies - OIR
This paper addresses the main area of “Using model related evidence for policy: processes and experiences”.
In one of its latest Communications1 the von der Leyen Commission has stated: we will improve analysis and reporting of some types of impact, in particular those relating to the green and digital transitions and their socially just and fair dimension2. We will pay greater attention to the gender equality dimension as well as equality for all3, to give it consistent consideration in all stages of policymaking. Territorial impact assessments4 and rural proofing5 will be strengthened, so that the needs and specificities of different EU territories are better taken into account, for instance of urban/rural areas, cross-border areas6 and outermost regions7 to facilitate a more symmetric recovery and cohesion across the Union.
The Better Regulation Guidelines8 as backbone of guiding EU level policy decision making states that the identification (“screening”) and assessment of the most significant impacts is a core task of every impact assessment. Given the need to
1 EU Commission (2021): Communication from the Commission to the European Parliament, the Council, the European and Social Committee and the Committee of the Regions: Better Regulation - Joining forces to make better laws; https://ec.europa.eu/info/files/better-regulation-joining-forces-make-better-laws_en 2 See Commission Communication, The European Pillar of Social Rights Action Plan, COM(2021) 102 final 3 In line with Article 8 and Article 10 TFEU. 4 Following up on Commission Communication, The principles of subsidiarity and proportionality: Strengthening their role in EU policymaking, COM(2018) 703: Territorial Impact Assessment Necessity Checks will be introduced as part of tools so that Commission services can identify when it is relevant to conduct territorial impacts assessments. 5 Commission Communication, The Future of Food and Farming, COM(2017) 713 final 6 Commission Communication , Boosting growth and cohesion in EU border regions COM(217)534 final 7 In its Communication: A stronger and renewed strategic partnership with the EU's outermost regions, COM(2017) 623 final, the Commission committed itself to ensuring that the concerns and interests of the outermost regions are taken into due consideration as relevant in impact assessments and policy evaluations. 8 EU Commission (2015): Better Regulation Guidelines; EU Staff Working Document (2015) 111
consider impacts across the economic, environmental and social pillars and their distribution in the territory, this screening is important to ensure that the subsequent assessment focuses in on the most important impacts for each specific case, in line with the principle of proportionate analysis. Once an initiative has been adopted and is applied it is also important to monitor and ultimately evaluate to see whether the impacts originally foreseen by the Impact Assessment actually materialise and to what extent.
Impact assessments and evaluations systematically consider territorial impacts when they are relevant and there are indications that they will be significant for different territories of the EU. The Commission committed 'to highlight the importance of screening and assessing territorial impacts in its proposals and accompanying explanatory memoranda9.
Territorial impact assessments (TIA) are looking into all thematic aspects of impact assessments (economic, social, environmental and governance aspects) by translating them into the territorial setting (regions).
One first step is to allow for more active engagement of local and regional authorities in consultation processes. This is an essential element of improving the quality of assessments of territorial impacts10. Local and regional authorities should help to identify such potential impacts in their consultation responses and feedback on roadmaps11.
The model for policy support in the field of Territorial Impact Assessments should therefore be able to meet these requirements – i.e. provide solid results of assessing policy effects on the territory and allow for transparent and participative decision making.
In this paper we will present a modelling approach commissioned by ESPON (European Spatial Observatory Network), which has been applied in several legislative processes of EU Impact Assessments (IA) and which is endorsed in the EU Better Regulation Guideline Toolbox 33 as recommended methodology within the IA process of EU legislation.
The model is embedded in a process-oriented approach and is linked to a web application12. Its purpose is to get a quick indication of the possible territorial impacts of policy options. With the
9 Ibid 10 EU Communication [COM(2018) 703 final 23.10.2018]: The principles of subsidiarity and proportionality: Strengthening their role in the EU's policymaking 11 Ibid 12 https://www.espon.eu/tools-maps/espon-tia-tool

112
ESPON TIA Tool one can assess policy impacts using a vulnerability approach. This approach uses three elements: exposure, sensitivity, and impact. The tool combines local/regional experts knowledge on the exposure13 of specific regions to the impacts gathered in a workshop with a set of statistical data describing the sensitivity14 of the EU regions to possible policy impacts.
The resulting maps visualise the impacts on the various territories and serve as input for discussion among the experts. The tool allows to do a TIA for Europe as a whole, but one can also focus on EU member states only or on cross-border regions, urban areas or make a composition of regions of his choice (i.e. rural, coastal etc). Its main advantage is the possibility to conduct a TIA with a reasonable time and resource frame and apply it in a horizontal way combining all thematic aspects of impact assessments (economic, social, environmental) by translating them into the territorial setting (regions). It may be used in the Inception Impact Assessment Phase as well as in the Impact Assessment phase of the legislative process of the EU
The paper will explain in detail the modelling components (i.e. the territorial information generated – the territorial sensitivity, the computation of exposure and the resulting territorial impact) and it will show the lessons learnt from the process and the number of applications in the EU legislative context.
ETF’s Foresight Approach to the Future of Work/Skills in Specific Economic Sectors
Riccardo Apreda, Riccardo Campolmi, Erre Quadro srl Terence Hogarth, University of Warwick Ummuhan Bardak, European Training Foundation
In the modern, global and highly competitive market, continuous innovation is a crucial aspect for many, if not all, economic sectors. In order to take advantage of new technologies however, it is necessary to have a workforce trained in their use with the competences to leverage their full potential. Combined technological developments may well lead to the emergence of entirely new
13 i.e. the potential strength and normative direction of the policy effect on the regions 14 i.e. the existing territorial condition of the region
professions and, in parallel, the obsolescence of existing occupations or skills. Monitoring and understanding evolving skills demand driven by new technologies is, accordingly, indispensable for the development of medium- and long-term economic and labour market strategies. This affects the decisions to be made by policy makers, employers, the education and training sector, and individuals.
In this abstract, an innovative methodological approach to support key actors in their medium-term decision making related to skills is described. It explores how drivers of change affect the skills needs within a specific sector in a specific country, how employers meet their training and recruitment goals, and provides insights into the workforce of the future and the skills it will require.
The methodology has been developed by the European Training Foundation (ETF) with the support of Erre Quadro srl and Fondazione Giacomo Brodolini. At the time of writing it has been applied to the agri-tech sector in Israel, the automotive sector in Turkey, and the agri-business in Morocco. Its application is currently being extended to six other countries and different sectors.
The innovative element of the methodology is the combination of different but complementary techniques designed to provide a detailed insight into future skill needs. Such combined approach is deployed in practice in four steps as follows.
The first step is to review the literature and statistical data available for the sector and country (e.g. that derived from studies looking at skill demand in a particular sector, allied to labour market data drawn from, for instance, labour force surveys).
The second step leverages the power of big data – i.e. data science techniques using computer-based analytics to process thousands of patents,scientific papers and policy reports for a sector.This is undertaken using bespoke text miningsoftware to extract emerging signals andcorrelations. Text mining helps identify bothtechnological and societal drivers.
A key element of the methodology is the extraction of the main innovative technologies which are likely to shape future skill demand. Figure 1a provides an example derived from the study of the agribusiness in Morocco.
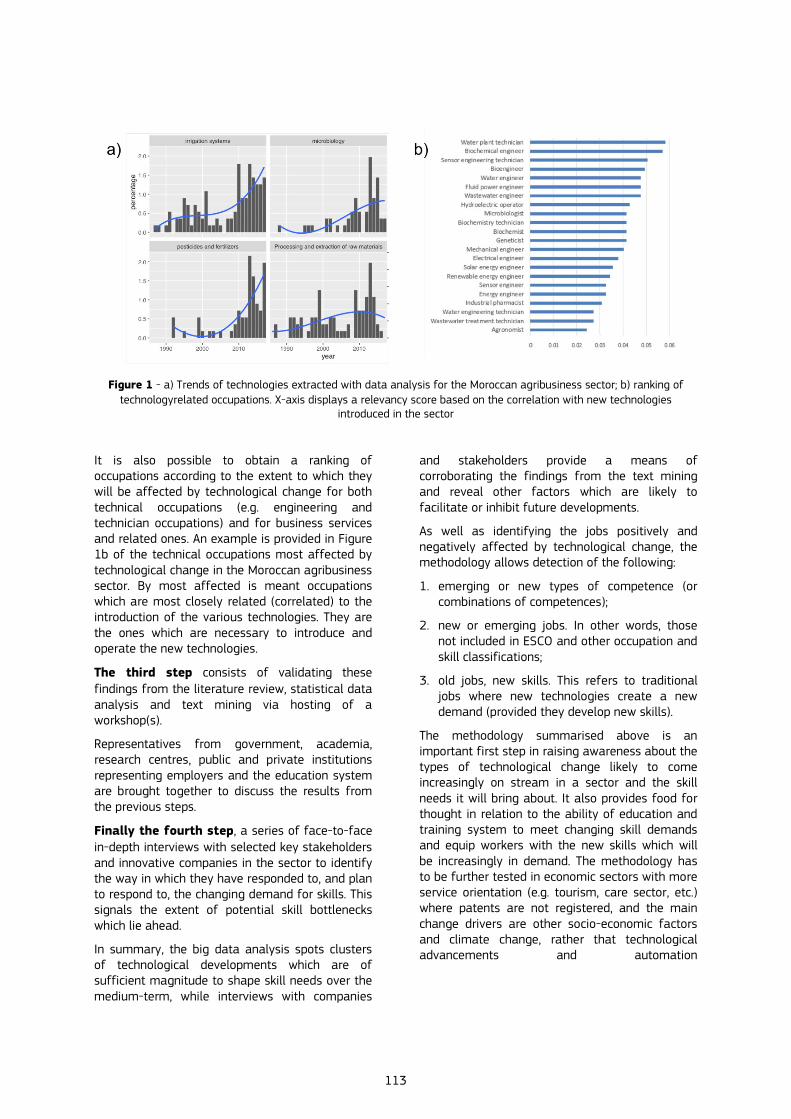
113
Figure 1 - a) Trends of technologies extracted with data analysis for the Moroccan agribusiness sector; b) ranking of technologyrelated occupations. X-axis displays a relevancy score based on the correlation with new technologies
introduced in the sector
It is also possible to obtain a ranking of occupations according to the extent to which they will be affected by technological change for both technical occupations (e.g. engineering and technician occupations) and for business services and related ones. An example is provided in Figure 1b of the technical occupations most affected by technological change in the Moroccan agribusiness sector. By most affected is meant occupations which are most closely related (correlated) to the introduction of the various technologies. They are the ones which are necessary to introduce and operate the new technologies.
The third step consists of validating these findings from the literature review, statistical data analysis and text mining via hosting of a workshop(s).
Representatives from government, academia, research centres, public and private institutions representing employers and the education system are brought together to discuss the results from the previous steps.
Finally the fourth step, a series of face-to-face in-depth interviews with selected key stakeholders and innovative companies in the sector to identify the way in which they have responded to, and plan to respond to, the changing demand for skills. This signals the extent of potential skill bottlenecks which lie ahead.
In summary, the big data analysis spots clusters of technological developments which are of sufficient magnitude to shape skill needs over the medium-term, while interviews with companies
and stakeholders provide a means of corroborating the findings from the text mining and reveal other factors which are likely to facilitate or inhibit future developments.
As well as identifying the jobs positively and negatively affected by technological change, the methodology allows detection of the following:
1. emerging or new types of competence (orcombinations of competences);
2. new or emerging jobs. In other words, thosenot included in ESCO and other occupation andskill classifications;
3. old jobs, new skills. This refers to traditionaljobs where new technologies create a newdemand (provided they develop new skills).
The methodology summarised above is an important first step in raising awareness about the types of technological change likely to come increasingly on stream in a sector and the skill needs it will bring about. It also provides food for thought in relation to the ability of education and training system to meet changing skill demands and equip workers with the new skills which will be increasingly in demand. The methodology has to be further tested in economic sectors with more service orientation (e.g. tourism, care sector, etc.) where patents are not registered, and the main change drivers are other socio-economic factors and climate change, rather that technological advancements and automation

114
Modelling stakeholder-perceived system interactions to explore policy opportunities for coastal environment improvement
Samaneh Seifollahi-Aghmiuni, Zahra Kalantari, Georgia Destouni, Dept. of Physical Geography, Stockholm University, Sweden
There is fragmented understanding of the interactions of environmental and socioeconomic systems, sectors and processes involved in coastal water quality evolution around the world. Environmental policies applying to the coastal environment also have either a land or a sea perspective. As such, the policies may be ill-adapted to support improvements of complex coastal environments that represent the interface of and link the land and sea systems. For instance, environmental regulations in the Baltic Sea region have not yet managed to sufficiently mitigate coastal eutrophication. To make policies relevant and effective, stakeholder perceptions of the environmental and socioeconomic interactions that determine the state of the coastal environment also need to be included in modelling for policy support. Such modelling approaches can facilitate knowledge integration and be a basis for synergistic efforts for coastal environment improvement. For such facilitation and for bridging the gap between land and sea policy perspectives on coastal environmental management, this study considers and models stakeholder-perceived environmental and socioeconomic interactions in a linked land-coast-sea system. To determine stakeholder perceptions of these interactions, multiple actors representing various inland, coastal, and marine sectors in the Swedish water management district Northern Baltic Proper have been engaged in a series of workshops to co-develop a system network diagram (SND) for the district’s land-coast-sea system. The co-developed SND is used in semi-quantitative modelling of coastal water quality behaviour under various human pressure and hydro-climatic conditions. Results show that synergistic multi-scale, transboundary and multi-actor measures are needed to improve coastal water quality, even locally. The measures also need to address the impacts of both currently active sources and legacy sources (accumulated over time from past-to-present inputs) of nutrients. A fully-quantitative systems dynamics (SD) model is further developed, based on the system behaviour insights gained from the semi-quantitative interaction modelling. This is used for scenario analysis that can support policy by determining effective nutrient management pathways for meeting coastal water quality challenges under various possible socioeconomic developments along with climatic change. Nutrient contributions
to coastal waters from different sectors in the study region are then quantified considering the water and nutrient exchanges among the sectors and the natural water environments throughout the linked land-coast-sea system. Scenario outcomes are analysed based on a set of key performance indicators for the coastal environment. Such results can guide the development of effective environmental policies for coastal water quality and ecosystem management in the studied Baltic system and other coastal areas around the world.
Policy modelling for scoping alternative pathways for sustainable and profitable agriculture in Europe
Hedwig van Delden, Roel Vanhout, Research Institute for Knowledge Systems, Maastricht, the Netherlands Luuk Fleskens, Jantiene Baartman, João Pedro Nunes, Lingtong Gai, Wageningen University, the Netherlands Iris Vanermen, Katholieke Universiteit Leuven, Belgium Guna Salputra, DG Joint Research Centre, European Commission Melanie Muro, Tugce Tugran, Milieu, Brussels, Belgium Jane Mills, Julie Ingram, Charlotte Chivers, University of Gloucestershire, Cheltenham, United Kingdom Lilian O’Sullivan, Teagasc, Crops, Environment and Land Use Programme, Wexford, Ireland Simone Verzandvoort, Rudi Hessel, Jan Peter Lesschen, Wageningen Environmental Research, the Netherlands
European agriculture faces a real challenge: it must reduce its negative environmental impacts but also remain competitive. A key area of concern is the ongoing degradation of agricultural soils, which is likely to increase further in the coming decades because of climate and socio-economic developments. While there are well-known agricultural management techniques that can help to improve soil quality, uptake of these techniques remains low in Europe - despite various policy incentives.
The SoilCare project studied the adoption of sustainable agricultural practices, in particular those related to improving soil quality. To do so, it looked at various scales (from local to European level) at the bio-physical, socio-economic, political, and technological factors impacting on adoption of these practices. Knowing that these factors will change and interact over time in complex ways, bringing inherent uncertainties with them, we carried out a foresight approach to deal with these complexities and future uncertainties.
We used a combination of qualitative and quantitative techniques in a multi-actor approach to develop scenarios for agricultural practices in Europe that are both sustainable and profitable. Based on interviews with stakeholders at
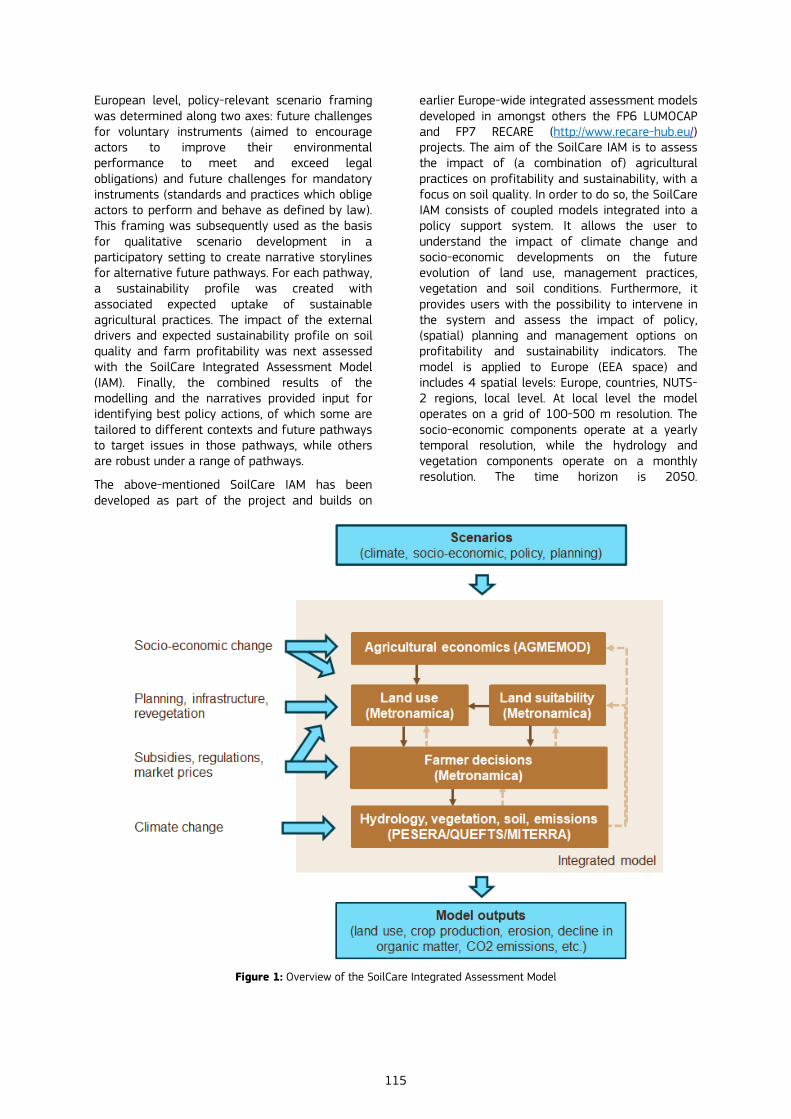
115
European level, policy-relevant scenario framing was determined along two axes: future challenges for voluntary instruments (aimed to encourage actors to improve their environmental performance to meet and exceed legal obligations) and future challenges for mandatory instruments (standards and practices which oblige actors to perform and behave as defined by law). This framing was subsequently used as the basis for qualitative scenario development in a participatory setting to create narrative storylines for alternative future pathways. For each pathway, a sustainability profile was created with associated expected uptake of sustainable agricultural practices. The impact of the external drivers and expected sustainability profile on soil quality and farm profitability was next assessed with the SoilCare Integrated Assessment Model (IAM). Finally, the combined results of the modelling and the narratives provided input for identifying best policy actions, of which some are tailored to different contexts and future pathways to target issues in those pathways, while others are robust under a range of pathways.
The above-mentioned SoilCare IAM has been developed as part of the project and builds on
earlier Europe-wide integrated assessment models developed in amongst others the FP6 LUMOCAP and FP7 RECARE (http://www.recare-hub.eu/) projects. The aim of the SoilCare IAM is to assess the impact of (a combination of) agricultural practices on profitability and sustainability, with a focus on soil quality. In order to do so, the SoilCare IAM consists of coupled models integrated into a policy support system. It allows the user to understand the impact of climate change and socio-economic developments on the future evolution of land use, management practices, vegetation and soil conditions. Furthermore, it provides users with the possibility to intervene in the system and assess the impact of policy, (spatial) planning and management options on profitability and sustainability indicators. The model is applied to Europe (EEA space) and includes 4 spatial levels: Europe, countries, NUTS-2 regions, local level. At local level the model operates on a grid of 100-500 m resolution. The socio-economic components operate at a yearly temporal resolution, while the hydrology and vegetation components operate on a monthly resolution. The time horizon is 2050.
Figure 1: Overview of the SoilCare Integrated Assessment Model

116
An overview of the SoilCare IAM is provided in Figure 1. In brown the individual model components and their interactions with other model components are shown. Solid brown arrows indicate the information flow in the current time step, dashed arrows the information used as input for the next time step. The top blue box illustrates the types of scenario drivers for which the impacts can be assessed and the blue box at the bottom the types of policy-relevant information provided. The blue arrows on the left-hand side indicate where in the integrated model the scenario drivers impact.
As can be seen from the figure, climate change and socio-economic developments are key drivers of the SoilCare IAM. Whereas climate change impacts on the hydrology and vegetation growth, the socio-economic developments result in changes in agricultural profitability and land use, which together with farmers’ decisions on land management provide a land use pattern with agricultural practices at grid-cell level. The biophysical models calculate the yield and the suitability of locations for land uses, crops and agricultural practices and this information feeds into the agricultural economics, land use and farmer decisions components. In this way, temporal changes to the soil quality and other biophysical conditions have an impact on the spatial distribution of future land use and management decisions. Using information on the cost of the practice, the yield and the crop price, the IAM makes a cost-benefit assessment at local level. Likewise, the inclusion of biophysical models allows the calculation of sustainability impacts of land management decisions on SOM, erosion, and emissions.
The combined participatory and modelling approach provides policy makers and other stakeholders with an enhanced understanding of the future uncertainties in the agricultural sector and related value chains that we are confronted with. Better understanding plausible future pathways helps to design actions that target specific developments or are robust across developments. The participatory scenario development enriches the future pathways, while the modelling facilitates systems thinking and enhances the understanding of the causal relationships in space and over time. In the assessment of actions, the modelling is able to calculate the expected impact of policy options under various conditions, while the participatory activities allow to incorporate those assessment criteria that cannot be modelled, especially related to the socio-cultural and political aspects.
The presentation will focus on the scenario and policy support process including the various participatory techniques used (interviews, in-
person workshop, webinar, online workshop), and will present the SoilCare IAM, the simulation results and their role in policy support.
Scenario planning: ISPRA’s first experience with circular economy
Sarah Badioli, Giovanni Finocchiaro, Cristina Frizza, Alessandra Galosi, Mariaconcetta Giunta, Renato Marra Campanale, Carlo Massaccesi, Michele Mincarini, Raffaele Morelli, Matteo Salomone, ISPRA – Italian Institute for Environmental Protection and Research, Italy
Introduction
Foresight is the disciplined exploration of alternative futures and, among others, it helps decision makers and policymakers to build adaptive capacity to make their systems more resilient to change by preparing for a diverse set of alternatives. It helps indeed to identify future directions, emerging technologies, new societal demands and challenges in order to try to anticipate future developments, disruptive events, risks and opportunities. In a forward approach it can be used to evaluate the impact of current policies and how they may combine with other developments, while in a backward approach it can be used to create an appropriate policy which allows to reach a specific fixed target [1].
Scenario planning and analysis is the most widely used futures research tool for helping decision makers and policymakers as the output of this analysis is a set of stories which represent a range of plausible futures. The general phases of a scenario process are the identification of the scenario field and the scope, analysis of the key factors and their projections, scenario development and choice of the strategic options. Many techniques can be used for scenario planning and the selection of the most suitable ones depends on data availability, topic complexity and the purpose of the study.
Purpose
The project illustrated in this abstract is focused on the challenge of foresight in those environmental realms where data or time series are missing, to explore alternative futures and pathways with a policy-oriented goal to assess EU sustainability objectives. The 2030 and 2050 targets and strategies of EU are focused mainly on energy framework and greenhouse gas emissions, so we are trying to create scenarios that take into consideration other environmental aspects.
Specifically, the project aims to create scenarios about circular economy as the European
117
commission underlined its importance presenting it as one of the main initiatives of the European Green Deal and creating a new Circular Economy Action Plan (CEAP) which requests improved metrics to monitor the progress towards circularity. It is underlined the necessity to connect the different environmental areas using monitoring to cover the interlinkages between circularity, zero pollution ambition and carbon neutrality. The choice to start working on possible circular economy scenarios also lies in the fact that the European Commission is encouraging Member States to adopt national strategies, plans and measures on it in the light of the ambitious objectives outlined in its new CEAP. Italy is already following up on the Commission's request searching for technical assistance to DG Reform for the drafting of the circular economy national strategy.
Moreover, as part of international activities, ISPRA has assumed a leadership role since the end of 2019 and together with the European Environment Agency coordinated the initiative "The Bellagio process: Monitoring progress in Europe's circular economy [2]". The goal of the process is to improve the monitoring of circular economy consolidating key principles and areas for future work. The Bellagio 2020 declaration provides the system that should be used to create a monitoring framework for circular economy policies integrating and connecting the existing statistics into a coherent system.
Methodology
The scenario process we used is made up of four phases: system analysis, key factors analysis, scenario development and communication.
In the first and the second step the system of interest is analysed and simplified identifying a set of key factors. This study used a fuzzy interpretive structural modeling (FISM) and a Fuzzy-MICMAC (FMICMAC) analysis to explore the inter-relationships and relative dominance of identified circular economy factors. FISM is an upgrade of Interpretive Structural Modeling (ISM [3]), a process that transforms unclear and poorly articulated models of systems into visible, well-defined models. At the final stage, the system is represented with a diagraph where each node interprets a specific element so that a clear picture can be portrayed in terms of the relationships among the elements. Briefly, at first a set of elements are chosen to represent the problem then their paired connections are studied. For each pair of factors, it is defined if there is a
connection and which is its direction; all the information is collected in a square matrix. Fuzzy sets theory was incorporated to further enhance the robustness of the proposed hierarchical model of the factors explaining, in addition to the direction of the relationship, qualitative considerations on a 0–1 scale [4]. On one side it is possible to create a hierarchy of the elements to identify the main driving forces by partitioning the matrix. On the other side, MICMAC (Matrice d’Impacts Croisés Multiplication Appliquée á un Classement) analysis uses the principle of the multiplication properties of matrices to describe the nature of the variables in terms of driving power and dependence power, considering direct and indirect connections. In conclusion, the two methods helped us explore the interactive relationship between and among the elements and classify the factors into four classes: autonomous, independent, dependent and linkage.
In the third step, scenarios are created using an enhanced Trend Impact Analysis (TIA), a forecasting method that permits to take into account how future events may change extrapolations of historical trends. The TIA is used to create projections of the factors that represent environmental impacts, while the factors which represent actions towards sustainability are used to choose future events. These key factors are chosen thanks to the output of the FISM, which highlight the most influential factors and how they are connected to the other factors.
In the fourth step the scenarios are interpreted and communicated to thematic experts, in order to collect their opinions and perfect the results.
The third phase of the process is still ongoing, but the results will be available in due time for the conference.
References
1 https://ec.europa.eu/info/research-and-innovation/strategy/support-policy-making/shaping-eu-research-and-innovation-policy/foresight_en
2 https://epanet.eea.europa.eu/reports-letters/monitoring-progress-in-europes-circular-economy
3 Sushil “Interpreting the Interpretive Structural Model” Global Journal of Flexible Systems Management (June 2012) 13(2):87–106 DOI 10.1007/s40171-012-0008-3
4 Sharma A, Abbas H, Siddiqui MQ (2021) “Modelling the inhibitors of cold supply chain using fuzzy interpretive structural modeling and fuzzy MICMAC analysis.” PLoS ONE 16(4): e0249046. https://doi.org/10.1371/journal.pone.0249046

118
Session 9
Communication and visualisation of model results
26 November
14:50 – 16:20
119
Co-producing model literacy for sustainability
Michiru Nagatsu, Tuuli Toivonen, Nina Janasik, Jussi Eronen, Kaisa Korhonen-Kurki, University of Helsinki Niko Soininen, University of Eastern Finland Tommi Ekholm, Finnish Meteorological Institute Riikka Paloniemi, Finnish Environment Institute Kirsi-Marja Lonkila, Ministry of the Environment, Finland Kaisa Välimäki, Forum for Environmental Information, Finland
How can science and governance communities better complement each other and ensure scientifically sound and socially inclusive decision-making for sustainability?
Scientific knowledge increasingly derives from scientific models, such as systemic models coupling climate and economic systems for national policy-making, species-distribution models for drafting laws on nature conservation, water quality models informing legal decisions concerning permitting of industrial operations, and spatial models for land-use planning. All these models draw on advanced mathematical, statistical and data-visualisation techniques to describe the present and predict the future, particularly the future outcomes of chosen societal decisions.
In this way, models do not only produce knowledge about complex systems, but they also frame societal decision-making, often implicitly suggesting certain intervention points. Because of this often unrecognized dual function of producing knowledge and action (which sociologists call the co-production of knowledge and governance), scientific models play a key role at the science-policy interfaces (SPIs).
Although the literature has identified various problems at SPIs in general (e.g. Dunn and Laing, 2017), no systematic approach has been developed to address challenges and potentials of the model-mediated SPIs. The linear view of SPIs suggests that modellers produce knowledge, which informs politicians and state officials, who then make value-based decisions. The linear view thus implies that the bottleneck is the knowledge asymmetry between the two communities: modellers don’t know enough about policy/politics, and decision makers don’t know enough about scientific models. While recognizing the importance of filling these knowledge gaps, we go beyond the linear view in proposing that the main leverage point at SPIs concerns a reflexive management of co-production of science and governance through modelling. We argue that strategies for effective mutual learning and synergy between the two communities (cf. Ruhl 2007; Ruhl et al. 2019) should be based on the common understanding of how their worldviews,
values and future visions of a good society shape and, at the same time, are shaped by decision-guiding models. Without such a reflexive approach, sophisticated sustainability models that are built on strong theory, rich data, powerful numerical algorithms and visualisation techniques have limited potential for guiding sustainable transitions, and may even misguide societal decision-making.
We specifically focus on two roles scientific models play in model-mediated co-production, drawing on science and technology studies: coordinator/mediator between the science and governance communities (“models as boundary objects”, e.g. White et al. 2010), and a platform on which to formulate and implement particular forms of governance (“models as performative objects” e.g. van Egmond & Zeiss 2010). However, there has been limited research on how these functions are facilitated or hindered by tacit understanding—based on intuition and experience—of how to build and use models (Willumsen & Ortuzar 1985).
We thus develop a framework within which to identify, improve and communicate this tacit knowledge and knowing about models, which we call model literacy. Our framework integrates two prominent approaches—the cognitive approach (‘mental models’) and the competence-based approach (‘communities of practice’)—to improve and institutionalize model literacy in both science and governance communities particularly at their interface. We draw on empirical studies of four types of governance processes and the corresponding modeling processes in Finland: (1) the national implementation of Sustainable Development Goals (SDGs); (2) designing the Nature Conservation Act, national Biodiversity Strategy and designing of present nature conservation programs, (3) legal decision-making, and (4) land-use planning. For this presentation, we focus on a legal case that exemplifies the lack of model literacy as an obstacle in SPIs (see the case below).
Our framework is innovative in its conception of model literacy as the reflexive and interactive capacities of the science and governance communities. We discuss how model literacy could be developed through innovative interventions that would ensure effective and inclusive science-governance interactions: (i) developing, testing and installing practices to systematically create synergy between sustainability science and governance through participatory modelling (e.g. modeling workshops and forums for sharing, framing and solving problems), and (ii) devising tools for model-based participatory governance (e.g. simulation games, maps and

120
visualisations). Although the cases are primarily drawn from Finland, we believe that the framework is useful for the European Union’s development of the effective science-policy interfaces for sustainability.
The case: The Supreme Administrative Court of Finland (2019:166) recently ruled against the pulp manufacturer Finnpulp, a company intending to make a 1,4 billion-euro investment into a new bioeconomy operation producing pulp and renewable energy from timber. The project required an environmental permit under the Environmental Protection Act of Finland (527/2014), and the legal question was whether the company was able to show convincingly that the project would not deteriorate the water quality of a nearby lake during the project’s 40–50 year timespan. To this end, the company had conducted an environmental impact assessment by using computer simulation models that sought to predict the aquatic impact of the project. The court rejected Finnpulp’s environmental permit application arguing that the models were unfit for purpose and contained significant uncertainties. The models were not able to meet the legal standard of certainty.
Some scientists criticised the decision for demanding unrealistic levels of integration (biodiversity coupled with hydrological and chemical changes) from the models on an unrealistic timespan (40–50 years into the future). The modellers would have needed more knowledge about the specific legal requirements for the project, and the court would have needed a more in-depth understanding of what the models can be expected to produce. We argue that the mismatch between the legal standard of certainty and inherent uncertainties of model-based inferences can be addressed by developing model literacy.
References
Dunn, G. & Laing, M. (2017). Policy-makers perspectives on credibility, relevance and legitimacy (CRELE). Environ Sci Policy 76: 146–152.
Ruhl, J.B. et al. (2019). Engaging policy in science writing: patterns and strategies. PloS One 14(8): e0220497.
Ruhl, J.B. (2007). Reconstructing the wall of virtue: Maxims for the co-evolution of environmental law and environmental science. Environ Law Rev 37(4), 1063–1082.
Van Egmond, S. & Zeiss, R. (2010) Modeling for policy: Science-based models as performative boundary objects for Dutch policy making. Sci Stud 23(1): 58–78.
White, D. D., et al. (2010). Credibility, salience, and legitimacy of boundary objects: water managers’ assessment of a simulation model in an immersive decision theater. Sci Public Policy 37(3): 219–232.
Willumsen, L. G., & de Dios Ortuzar, J. (1985). Intuition and models in transport management. Transpn Res A: General 19(1): 51–57
Land-use modelling exercises using LUISETTA to foster a debate on urbanization pathways
David Evers, Frank van Rijn, PBL Netherlands Environmental Assessment Agency
Achieving the European Union’s target of ‘zero net land take by 2050’ would entail a significant break with current practices (European Commission, 2011). According to Corine Land Cover data, approximately 180 ha was urbanized on a daily basis in the 2000-2018 period (EU plus CH, LI, IS and UK), although the pace appears to be slackening (Evers, 2020; Van Schie et al., 2020). If progress is to be made towards sustainable urbanization and efficient land use, local and regional policymakers will have to become more committed to this objective which, given socioeconomic imperatives and powerful financial incentives for converting land to urban use, is no easy task. It will be argued here that detailed land-use maps of future development can help facilitate the discussion necessary for garnering commitment.
We can consider urbanization a social construct since every hectare converted from rural to urban use is done so deliberately by human beings. This implies that collective action, namely policy, can control this development. Still, some key drivers, such as demographic and economic growth, are highly resistant to public intervention. In general, planning can direct where and how urbanization occurs rather than how much. While this might have limited value for ambitions such as ‘no net land take’, urban form has significant implications for sustainability (Jabareen, 2006). Diffuse urbanization (i.e. low-density, monofunctional, car-dependent developments with tree-structured road patterns, often called sprawl) not only creates a larger footprint per capita vis-à-vis compact development, it also creates more vehicle kilometres travelled, requires more infrastructure, and is harder to service with public transport (EEA & FOEN, 2016; Marshall & Garrick, 2012).
A morphological analysis revealed that the urban structure of Europe is highly diverse: most countries possess regions with compact, polycentric and diffuse urban (sub)structures1. Still, distinct territorial patterns are discernible within the main structure, such as relatively compact forms in southern Europe and more polycentric structures to the north. As the majority of the main structure is inherited from centuries of urban growth, the more dynamic substructure is more interesting from a policy standpoint. Diffuse
1 The main structure refers to the shape of the predominant urban form within a particular region (e.g. a large city or twin cities) and the substructure the remaining area.

121
substructures are overrepresented in Eastern Europe and dynamics in the 2000-2018 reveal
diffuse growth particularly in Poland (Van Schie et al., 2020).
Departing from the belief that planning policies and practices have a bearing on how urban substructures develop over time, we can posit that these can be employed to foster compact, polycentric or diffuse development. This comprises the basis for three scenarios drawn up for 2050 within the framework of the ESPON Sustainable Urbanization and land use Practices in European Regions (SUPER) project.
In order to engage policymakers and practitioners in a discussion on sustainable land use, it was decided to visualize the urbanization scenarios using detailed maps. These were produced using the LUISETTA land-allocation model (Jacobs-Crisioni et al., forthcoming) the open-source version of the LUISA model (Baranzelli et al., 2017; JRC, 2021) at a resolution of 1 ha. The model input departed from the idea, expressed above, that the main drivers are difficult to influence, and that the primary variables are social attitudes and policy orientations associated with the three urbanization modes. This allowed the main engine of the model, demand estimation, to be held relatively constant.
In the compact scenario, urbanization should occur in or near large cities at relatively high densities. The modifications were performed by inserting a heavily smoothed version of the urban areas on the basemap, which were given extra attractiveness. Given that density is not included in LUISETTA, a trial run produced counterintuitive results: rampant suburbanization. To account for this, demand for urban use was halved to simulate efficient development, producing better but not completely satisfactory results. In the polycentric scenario, urbanization occurs in midsize towns and near major public transportation nodes (transit-oriented development, TOD). Here, the same strategy was applied. In the diffuse scenario, urbanization takes place in villages and along rural roads at low densities. Interestingly, the ‘policy poor’ baseline scenario supplied in the LUISETTA model fit this scenario satisfactorily (which is in itself problematic given strong land-use planning traditions in many countries and regions). Figure 1 displays the model output for Luxembourg city

122
Figure 1: Luxembourg City in 2050 in the compact (left), polycentric (middle) and diffuse (right) scenarios in the ESPON SUPER project
The LUISETTA model produced high-resolution maps of the 2050 urban structure in the three scenarios, making it possible to zoom into any given area and illustrate exactly which regions would be urbanized (see Figure 2 where existing areas are displayed in pink and newly urbanized
areas in red). After the project team checked the maps for their own regions, the model input was adjusted slightly to enhance plausibility and rerun. The model also produced statistical information on population densities and net urban conversion, allowing goals such as European ‘land take’ targets and SDG goals to be incorporated into the discussion.
Figure 2
Rather than offering a prediction, the images are intended to provide room for a discussion among planners, politicians and the general public about the intrinsic value of certain sites and the consequences of planning choices and ideologies. To this end, several workshops with policymakers were scheduled in the spring of 2020 to discuss
the future of their regions. Unfortunately, all were cancelled due to the Covid-19 pandemic. A few online workshops were conducted (e.g. upper Austria, Lombardy), but the discussion was not as animated as would have been expected with a discussion around three poster-size maps at a physical meeting. Nevertheless, a Luxembourger
123
member of the project’s sounding board became so inspired by the scenario maps that they have been included in the country’s national spatial strategy.
References
Baranzelli, C., Batista e Silva, F., Diogo, V., Jacobs-Crisioni, C., Kavalov, B., Lavalle, C., Perpiña Castillo, C., Rosina, K., European Commission, Joint Research Centre, & Institute for Environment and Sustainability. (2017). The LUISA territorial reference scenario 2017: A technical description. http://dx.publications.europa.eu/10.2760/902121
EEA & FOEN. (2016). Urban sprawl in Europe. European Environment Agency and Swiss Federal Office for the Environment. http://bookshop.europa.eu/uri?target=EUB:NOTICE:THAL16010:EN:HTML
European Commission. (2011). Roadmap to a Resource Efficient Europe, 1067-8 final. European Commission.
Evers, D. (2020). ESPON SUPER Final Report—Main report. ESPON.
Jabareen, Y. R. (2006). Sustainable urban forms: Their typologies, models, and concepts. Journal of Planning Education and Research, 26(1), 38–52.
Jacobs-Crisioni, C., Lavalle, C., Baranzelli, C., & Perpiña Castillo, C. (forthcoming). Luisetta: A light version of the LUISAmodelling framework. Joint Research Centre.
JRC. (2021, April). Data and models for territorial impact assessment and policy evaluation: LUISA Territorial Modelling Platform.
Marshall, W. E., & Garrick, N. W. (2012). Community design and how much we drive. Journal of Transport and Land Use, 5(2). https://doi.org/10.5198/jtlu.v5i2.301
Van Schie, M., Evers, D., Ritsema van Eck, J., Schmidt-Seiwert, V., Hellings, A., Binot, R., & Kiel, L. (2020). ESPON SUPER Final Report Annex 1—Evidence on developments. ESPON.
Introducing the ReSET (Restarting Economy in Support of Environment, through Technology) Policy Support System
Mark Mulligan, Department of Geography, King’s College London Sophia Burke, AmbioTEK Community Interest Company, Essex, United Kingdom Hedwig van Delden, Research Institute for Knowledge Systems (RIKS) BV, Netherlands Caitlin Douglas, Department of Geography, King’s College London Raffaele Giordano, National Research Council - Water Research Institute, Italy Elena Lopez-Gunn, I-Catalist S.L., Madrid, Spain Albert Scrieciu, GeoEcoMar, Bucherest, Romania Miaojing Shi, Department of Computer Science, King’s College London Arnout van Soesbergen, Department of Geography, King’s College London
ReSET (Restarting Economy in Support of Environment, through Technology) is a research and development project supported by
Horizon2020 and focused on Future and Emerging Technologies (FET) in Environmental Intelligence. Through European case studies of active green and grey-green investments, we are deploying hardware and software technology to examine the environmental impacts of green and grey infrastructural investments in order to understand the most effective investments to support employment, environment and economy. ReSET is leveraging technological developments in spatial modelling, artificial intelligence and environmental sensing to better understand pathways to reset agricultural and urban development across Europe by working with the relevant stakeholders to develop and test more sustainable new ways of farming and of urban development. We will build an artificial intelligence-powered and advanced sensor-connected spatial green investment policy support system (the ReSET GI-PSS), for application anywhere in Europe. This represents a more technological, more integrated and more sophisticated approach to impact analysis and investment planning, compared with existing processes.
Using hydrological model to support regional water policies: Co-creation of Dynamic Adaptive Policy Pathways for water resources in climate change scenarios for a Mediterranean region (Algarve-Portugal)
Luís Filipe Dias (1), João Pedro Nunes (1), Bruno A. Aparício (1), Inês Morais (1), Ana Lúcia Fonseca (1), Amandine Valérie Pastor (1,2), Susana Marreiros (1), Sérgio Inácio (3), Joaquim Brandão Pires (3), Filipe Duarte Santos (1) (1) cE3c: Centre for Ecology, Evolution andEnvironmental Changes, Faculdade de Ciências daUniversidade de Lisboa, Portugal(2) LISAH, INRA, IRD, Montpellier SupAgro, UniversityMontpellier, France(3) AMAL, Comunidade Intermunicipal do Algarve,Portugal
Water availability is currently challenged by population growth, rapid urbanization, and growth of intensive farming, which leads to an increase in water demand for human consumption and agriculture. Climate change could enhance these issues by bringing shifts in the spatial and temporal variability of precipitation, as well as in the water need for plants due to changes in evapotranspiration related to the increase in air temperature. Those changes can act as an extra pressure factor on hydrological systems, particularly in regions which already have strong demands.

124
One of these regions is the Mediterranean area, recognized as a climate change hotspot, where agriculture accounts for up to 80 % of the current water consumption. Climate change adaptation strategies must be defined and implemented, requiring the integration of policymakers and stakeholders, to ensure that the plans are adjusted to local physical and social conditions, to guarantee the community’s sense of ownership regarding the proposals and to promote the involvement of the parties responsible for financing adaptation in the implementation phase. As many are not technical experts in water resources, the integration of modelling results requires innovative methodologies to ensure that knowledge gained from advanced hydrological methods can be effectively transmitted and put into practice.
These issues were addressed in the climate change adaptation plan for water resources in the Algarve region (southern Portugal), which was co-created between hydrologists and local stakeholders and policymakers, by using the Dynamic Adaptive Policy Pathways (DAAP) approach to synthetize the results from the Thornthwaite-Mather water balance model of future scenarios. The development of DAAPs was made in a total of 4 workshops that involved more than 50 participants in each session.
The DAAPs approach relies on the identification of adaptation tipping points, allowing for the selection of a set of adaptation options by timing and sequencing them, considering a pre-chosen objective. Because adaptation emerges as a process rather than simply as abrupt events separate from social and political processes, this approach is considered a useful tool to enlighten decision-makers regarding the intensity of future adaptations, and to build consensus among entities. Although this methodology has been applied in different adaptation contexts, there is a lack of studies and applications for drought and irrigation management.
Future scenarios were simulated from the present until 2100 using the hydrological model, with multiple models of climate scenarios RCP4.5 and RCP8.5. The results show an increase in water stress conditions, mainly in the RCP8.5 scenario. Future scenarios and potential adaptation options were discussed with the local policymakers (regional and municipal water managers) and water users (water utilities, farmers’ associations). An agreed-upon set of options was then simulated with the model to assess their effectiveness for adaptation. These results were used to design a DAAP specifically for the water sector in the Algarve.
Policymakers were then presented with the DAPP, combined with a cost assessment, and selected
the most suitable and politically reliable adaptation pathway until 2100. They did not consider the decrease in irrigation use to be socially desirable (transformative adaptation) and showed a preference for options such as promoting efficient water use and water retention landscapes, which are distributed and incremental adaptation, and wastewater recycling, which is costly to implement. Policymakers also considered a desalination plan as a last resort despite the high investment, to be applied when other options are not sufficient to maintain water stress below an acceptable threshold.
Thereby, the water resources adaptation plan was co-created, and it strongly reflected local desires and preferences, while ensuring that its effectiveness was assessed with the best available tools.
Informing Ireland’s carbon budgets with the TIMES-Ireland energy system model
Hannah E Daly, Olexandr Balyk, Andrew ZP Smith, MaREI Centre, Environmental Research Institute, University College Cork, Ireland
Introduction
The Irish government has legislated for a target of reducing greenhouse-gases (GHGs) by 51% between 2018 and 2030, one of the most ambitious near-term climate goals of any country, and “net-zero” goal for 2050. Ireland’s high share of GHGs from the agriculture sector, at 34% in 2019, compounds this challenge due to limited technology options for mitigation agriculture emissions, and will likely require a greater level of energy system decarbonisation. The legislation setting this target in place establishes a series of carbon budgets, limiting the cumulative GHGs which may be emitted over successive five-year periods beginning in 2021. An independent body, the Climate Change Advisory Council (CCAC), is tasked with recommending economy-wide carbon budgets and the government is to set sectoral decarbonisation ranges.
For the first six months of 2021, an advisory committee established by the CCAC has deliberated on the first two carbon budgets, spanning 2021-25 (Carbon Budget 1, or CB1) and 2026-30 (CB2), analysing the feasibility and impact of carbon budgets which meet the overall 51% reduction target for 2030, on factors including sectoral efforts, level of investment required and the scale of systems change required. This process has been informed by modelling conducted by the authors with the
125
TIMES-Ireland Model (TIM), an energy systems optimisation model.
This paper describes the TIM architecture, the engagement process between the modelling team and the CCAC and other policymakers and stakeholders, and results, which quantify the very rapid transformation required from the electricity, heat and transport systems to meet carbon budgets.
Model description
The TIM calculates the cost-optimal fuel and technology mix to meet future energy service demands in the transport, buildings, industry and agriculture sectors, while respecting constraints in GHGs, primary energy resources and feasible deployment rates. The TIM has been developed to take into account Ireland's unique energy system context, including a very high potential for offshore wind energy and the challenge of integrating this on a relatively isolated grid, a very ambitious decarbonisation target in the period to 2030, the policy need to inform five-year carbon budgets to meet policy targets, and the challenge of decarbonising heat in the context of low building stock thermal efficiency and high reliance on fossil fuels. To that end, model features of note include "future proofing" with flexible temporal and spatial definitions, with optional hourly time resolution in electricity generation and demand, unit commitment and capacity expansion features in power sector, residential and passenger transport models underpinned by detailed bottom-up sectoral models, cross-model harmonisation and soft-linking with demand and macro models. A working paper documenting the full model methodology, input data, software and assumptions is available [1].
Stakeholder engagement and scenario development
The principles of transparency and broad, iterative engagement with stakeholders and sectoral experts have underpinned the development and application of the TIM for informing carbon budgets. A web app detailing results has allowed for rapid analysis and results dissemination. A “beta” version of the model and results were circulated for a wide review process in March 2021 [2]. Following this, comments from the review were addressed and a second-order draft of results was disseminated to the CCAC in May 2021 [3]. These results have subsequently been used by other modelling teams to inform studies on the macro-economic and employment impacts of carbon budgets.
Three sets of scenario dimensions are modelled:
1. Decarbonisation trajectory to 2030 and relativeeffort required in CB1 and CB2;
2. The level of effort required from the energysector (given different levels of abatement ofagriculture emissions) to meet the overall 51%target;
3. The implications of alternative energy servicedemand pathways (including a Low EnergyDemand scenario) and assumptions on newtechnology and fuel deployment, namely theavailability of Carbon Capture and Storage (CCS)and level of offshore wind deployment, and thelevel of bioenergy and hydrogen import, by 2030.
Results & discussion
Results are available [4] charting the full scale of changes and investments needed for energy technologies and fuels across all supply and end-use sectors, given differing scenario dimensions. The scale of change required to meet the 2030 target is unprecedented and current action needs to be dramatically scaled up to meet the challenge in all sectors. Results indicate a very high marginal abatement cost due to near-term ambition, with business-as-usual demand projections, and the need for early energy technology retirements, including vehicles and heat boilers: Small additional decarbonisation efforts lead to much higher marginal cost, and lower abatement effort in agriculture pushes high costs to the energy system, making solution less feasible
Lower energy service demands make solution far easier and cheaper. Concentrated policy effort in planning, mobility and public education is needed to achieve this scenario. The availability of low-carbon electricity is a key bottleneck, indicating that policy efforts should prioritise efficient use of electricity and scaling up zero carbon electricity as quickly as possible. Availability of bioenergy is also a key sensitivity, with meeting the target contingent on fully using the sustainable domestic supply potential is necessary to meet the target
TIM shows that an integrated, whole-system approach is needed to understand interlinkages between sectors, prevent blind spots, and understand the most valuable route for limited resources and distributional impacts. Careful sensitivity analysis, and a multi-model analysis, can complement this system perspective.
Links
1 https://tim-review1.netlify.app/documentation/tim-documentation-paper.pdf
2 https://tim-review1.netlify.app/about
3 https://11-05-2021--meet-tim.netlify.app
4 https://11-05-2021--meet-tim.netlify.app
126
Contributed Session 4
Highlights from the EU Open Data Days: how open data can support
policy-making
26 November
16:30 – 18:00
127
Introduction
The EU public sector is one of the most data-intensive sectors, producing vast amounts of data. By sharing this data as open data, companies and citizens can use it to generate value for the society and the economy. Also for the public sector itself, this data is essential to support better policy making.
The Publications Office of the EU plays an active role in publishing open data. The first edition of the EU Open Data Days (23 – 25 November 2021) (https://op.europa.eu/en/web/euopendatadays) demonstrates the importance of open data as a key asset for digital transformation. European and global experts will share their work and experiences on open data and data visualisation, thus showing how these can bring added value for the EU public sector.
This session will highlight the main outcomes from the EU Open Data Days and explain how open data and data visualisation can be used to support policy-making.
Chair: Inmaculada Farfán Velasco, Knowledge Management, Open data reuse and innovation, Publications Office of the European Union
Presenters
Arnout Sabbe, Chief Executive Officer, geoFluxus
Rusne Sileryte, co-founder and Chief Technology Officer (CTO), geoFluxus
EU Datathon 2020 winning team under ‘European Green Deal'
Benjamin Wiederkehr. Managing Director of Interactive Things, Switzerland

XX-NA-XXXXX-EN
-N
GETTING IN TOUCH WITH THE EU
In person
All over the European Union there are hundreds of Europe Direct information centres. You can find the address of the centre nearest you at: https://europa.eu/european-union/contact_en
On the phone or by email
Europe Direct is a service that answers your questions about the European Union. You can contact this service:
- by freephone: 00 800 6 7 8 9 10 11 (certain operators may charge for these calls),
- at the following standard number: +32 22999696, or
- by electronic mail via: https://europa.eu/european-union/contact_en
FINDING INFORMATION ABOUT THE EU
Online
Information about the European Union in all the official languages of the EU is available on the Europa website at: https://europa.eu/european-union/index_en
EU publications You can download or order free and priced EU publications from EU Bookshop at: https://publications.europa.eu/en/publications. Multiple copies of free publications may be obtained by contacting Europe Direct or your local information centre (see https://europa.eu/european-union/contact_en).

JRC127150