Bone age determination in young children (newborn to 6 ...
17
Turkish Journal of Electrical Engineering and Computer Sciences Turkish Journal of Electrical Engineering and Computer Sciences Volume 24 Number 3 Article 71 1-1-2016 Bone age determination in young children (newborn to 6 years Bone age determination in young children (newborn to 6 years old) using support vector machines old) using support vector machines GÜR EMRE GÜRAKSIN HARUN UĞUZ ÖMER KAAN BAYKAN Follow this and additional works at: https://dctubitak.researchcommons.org/elektrik Part of the Computer Engineering Commons, Computer Sciences Commons, and the Electrical and Computer Engineering Commons Recommended Citation Recommended Citation GÜRAKSIN, GÜR EMRE; UĞUZ, HARUN; and BAYKAN, ÖMER KAAN (2016) "Bone age determination in young children (newborn to 6 years old) using support vector machines," Turkish Journal of Electrical Engineering and Computer Sciences: Vol. 24: No. 3, Article 71. https://doi.org/10.3906/elk-1305-271 Available at: https://dctubitak.researchcommons.org/elektrik/vol24/iss3/71 This Article is brought to you for free and open access by TÜBİTAK Academic Journals. It has been accepted for inclusion in Turkish Journal of Electrical Engineering and Computer Sciences by an authorized editor of TÜBİTAK Academic Journals.
-
Upload
khangminh22 -
Category
Documents
-
view
4 -
download
0
Transcript of Bone age determination in young children (newborn to 6 ...
Turkish Journal of Electrical Engineering and Computer Sciences Turkish Journal of Electrical Engineering and Computer Sciences
Volume 24 Number 3 Article 71
1-1-2016
Bone age determination in young children (newborn to 6 years Bone age determination in young children (newborn to 6 years
old) using support vector machines old) using support vector machines
GÜR EMRE GÜRAKSIN
HARUN UĞUZ
ÖMER KAAN BAYKAN
Follow this and additional works at: https://dctubitak.researchcommons.org/elektrik
Part of the Computer Engineering Commons, Computer Sciences Commons, and the Electrical and
Computer Engineering Commons
Recommended Citation Recommended Citation GÜRAKSIN, GÜR EMRE; UĞUZ, HARUN; and BAYKAN, ÖMER KAAN (2016) "Bone age determination in young children (newborn to 6 years old) using support vector machines," Turkish Journal of Electrical Engineering and Computer Sciences: Vol. 24: No. 3, Article 71. https://doi.org/10.3906/elk-1305-271 Available at: https://dctubitak.researchcommons.org/elektrik/vol24/iss3/71
This Article is brought to you for free and open access by TÜBİTAK Academic Journals. It has been accepted for inclusion in Turkish Journal of Electrical Engineering and Computer Sciences by an authorized editor of TÜBİTAK Academic Journals.
Turk J Elec Eng & Comp Sci
(2016) 24: 1693 – 1708
c⃝ TUBITAK
doi:10.3906/elk-1305-271
Turkish Journal of Electrical Engineering & Computer Sciences
http :// journa l s . tub i tak .gov . t r/e lektr ik/
Research Article
Bone age determination in young children (newborn to 6 years old) using support
vector machines
Gur Emre GURAKSIN1,∗, Harun UGUZ2, Omer Kaan BAYKAN2
1Department of Computer Engineering, Faculty of Engineering, Afyon Kocatepe University, Afyonkarahisar, Turkey2Department of Computer Engineering, Faculty of Engineering, Selcuk University, Konya, Turkey
Received: 31.05.2013 • Accepted/Published Online: 29.06.2014 • Final Version: 23.03.2016
Abstract:Bone age is assessed through a radiological analysis of the left-hand wrist and is then compared to chronological
age. A conflict between these two values indicates an abnormality in the development process of the skeleton. This
study, conducted on children aged between 0 and 6 years, proposes a computer-based diagnostic system to eliminate
the disadvantages of the methods used in bone age determination. For this purpose, primarily an image processing
procedure was applied to the X-ray images of the left-hand wrist of children from different ethnic groups aged between 0
and 6 years. A total of 9 features, corresponding to the carpal bones and distal epiphysis of the radius bone with some
physiological attributes of the children, were obtained. Then, by using gain ratio, the best 6 features were used for the
classification process. Next, the bone age determination process was performed with the obtained features with the help
of the support vector machine (SVM), naive Bayes, k-nearest neighborhood, and C4.5 algorithms. Finally, the features
used in the determination process and their effects on the accuracies were examined. The results of the designed system
showed that SVM method has a better achievement rate than the other methods at a rate of 72.82%. Additionally, in
this study, a new feature corresponding to the distance between the centers of gravity of the carpal bones was used for the
classification process, and the analysis of the related feature showed that there was a statistically significant difference
at P <0.05 between this feature and bones in children aged between 0 and 6 years.
Key words: Support vector machines, bone age, computer-aided diagnosis, image analyses, feature ranking
1. Introduction
The process of maturity assessment that allows the detection of genetic, hormonal, and developmental disorders
is one of the key issues in pediatrics. An individual’s maturity stage measurement depends on the occurrence
of a series of consecutive events over time. Again, it is expected that these events will take place as quickly
as possible. In this context, bone age has proved to be appropriate in the measurement of maturity stages [1].
Bone age determination is carried out through a comparison with normal subjects [2]. It is probable that there
is an alteration between bone age and chronological age. In other words, bone age may show an alteration of ±2 years from 4 years to puberty, ± 1 year from 2 to 4 years, and ± 6 months from 0 to 2 years of chronological
age [3]. According to Boyunaga [4], in order to claim that bone age has an abnormality, it should have a
difference of at least 2 standard deviations from the average.
Bone age is determined by radiological examinations of the left-hand wrist and is then compared to
chronological age. A conflict between these two values indicates an abnormality in the development process
∗Correspondence: [email protected]
1693
GURAKSIN et al./Turk J Elec Eng & Comp Sci
of the skeleton [5]. The criteria for the evaluation of X-ray films are the number and size of the secondary
ossification centers and the wrist bones for individuals aged between 0 and 6, whereas the criterion is the
unification degree of the epiphysis and diaphysis for individuals over the age of 6 [2].
There are two main methods for the determination of bone age. The first is the atlas matching method,
also known as the Greulich–Pyle (GP) method. This method is preferred by about 76% of pediatricians [6].
The GP atlas is composed of the standard hand-wrist bone maps that belong to the chronological age groups
[2]. This method is based on the visual comparison of the X-ray of the left-hand wrist with the X-ray samples
grouped in an atlas according to sex and age [7]. The hand atlas matching method is used universally due to its
advantages of simplicity and availability of multiple ossification centers for the evaluation of maturity. However,
this method may not provide accurate results [8]. The GP method is applied by an expert radiologist. Thus,
there can be some deviation depending on the observer [9]. Differences in experience levels between physicians
is one of the most important factors causing differences in diagnosis. Another disadvantage of this method is
that the application takes some time [6].
Another method used to determine bone age is the Tanner–Whitehouse (TW2) method, based on a
detailed analysis of the bones of the left hand [10]. This method is preferred by less than 20% of radiologists
[6]. The TW2 method uses a detailed analysis of individual bones of interest, leading to the determination of
their membership in one of several stages. Scores are derived from each bone stage and summed to compute
the assessment [11]. Unlike the GP method, the TW2 method has a modular structure, and this makes it more
suitable for automation. However, because of its computational complexity, it is often not preferred by experts
[10].
The evaluation of bone development is a complex task, since it may cause intraobserver and interobserver
differences and may also vary, depending on variations often observed in normal children. In addition, bone
development appears earlier both in certain ethnic groups and in the black race [4].
In this study, we proposed a semiautomatic computer-based diagnostic method to remove the disadvan-
tages of the GP and TW2 methods mentioned above and to support the experts. For this purpose, primarily
the image processing procedure was applied to the X-ray images of the left-hand wrist of children from differ-
ent ethnic groups aged between 0 and 6 years. A total of 9 features, corresponding to the carpal bones and
distal epiphysis of the radius bone with some physiological attributes of the children, were obtained. Then, by
using gain ratio, the best 6 features were used for the classification process. Distinctly in this study, a new
feature corresponding to the distance between the centers of the gravity of the carpal bones was used in the
classification process, and the performance of the feature’s accuracy to the system was examined. Next, the
bone age determination process was performed with the obtained features with the help of algorithms: support
vector machines (SVMs), naive Bayes, k-nearest neighborhood, and C4.5. Finally, the features used in the
determination process and their effects on the accuracies were examined.
2. Literature review
According to the literature, it is obvious that the carpal bones and distal epiphysis of the radius bone had proven
to be effective for bone age determination in young children, and several features related to the carpal bones
were used for the determination of bone age. In one of these studies, Hasaltın and Besdok [2] used areas of the
carpal bones as features. They studied 307 children from Turkey aged between 2 and 9 years. In their study,
when the manually marked carpal bone edges were given to the semiautomated system as inputs, radiological
bone age was taken as the output. In addition, chronological age and sex information were applied as well as
1694
GURAKSIN et al./Turk J Elec Eng & Comp Sci
carpal bones. Bone age determination was conducted by using artificial neural networks, and the performance
of different learning algorithms was compared. Another study performed by Zhang et al. [12] used the size,
eccentricity, and triangularity of the hamate and capitate carpal bones as the features of the fuzzy classification
system. They performed the study on 205 young children aged 0–7 years. In the image processing stage they
used certain processes that included background subtraction, anisotropic diffusion filtration, and Canny edge
detection. The developed system was automatic. As a result, the bone age determination of their system was
comparable to the readings within the mean difference of half a year by the two radiologists. In 2007, Hsieh et
al. [13] performed a bone age determination system for young children aged 2–10 years in Taiwan. In this study,
they used median filter, contrast enhancement, and thinning morphology in the image processing procedure.
The shape, area, and sequence of the carpal bones were used as features and classified by using Fisher, kNN,
backpropagation neural network (BPNN), and radial basis function neural network (RBFNN) methods. As a
result, BPNN and RBFNN showed a better performance. The correct rate was up to 90% within 1 year of
tolerance. In 2010, Hsieh et al. [10] performed a study on 550 left-hand digital images of children from Taiwan
aged 0.5–10.5 years. They used 5 geometric features of the carpals, including the bone area, area ratio, and the
bone contour of the carpals for bone age assessment. In order to analyze these features, principle component
analysis and statistical correlation combined with 3 different types of procedure were used to construct a growth
model of carpals. Eventually, the results of the three types of procedure with fuzzy rules managed to construct
a bone-age assessment system to identify the maturity of children. The study shows that the proposed model,
based on fuzzy rules, had an accuracy rate higher than 89% in Type-I and -II and higher than 87% in Type-III
within a tolerance of 1.5 years. In another study, Jantan et al. [14] extracted the widest distance between the
distal end and radius and the ratio between them. They used these features for the bone age determination by
using a fuzzy-based system. The correct rates of an error tolerance within 1.5 years of age are 63% and 57%
for both male and female children, respectively. In 2011, Somkantha et al. [15] applied an automatic bone age
determination system to 180 left-hand digital images between 0 and 6 years. They used image enhancement,
region of interest selection, and boundary extraction in the image-processing procedure. Then they extracted
the following 5 features: number of carpal bones, ratio of the total area of all carpal bones to the total area of
the capitate, ratio of the total area of all carpal bones to the total area of the hamate, ratio of the perimeter of
the capitate to the distance between the centroid of the capitate and the centroid of the hamate, and ratio of the
total area of all carpal bones to the square of the distance between the centroid of the capitate and the centroid
of the hamate. They used support vector regression and neural network regression for bone age determination.
As a result, support vector regression had better efficiency, with a mean error changing between approximately
0.5 and 1. In 1996, Al-Taani et al. [16] reported a classification approach based on a point distribution model
of 130 features. The system was tested by classifying two bones of the third finger, the distal and the middle
phalanx. In total, 120 images of 9 age classes were used for evaluation. The classification rates were 70.5% and
73.7%. In 2013, Harmsen et al. [17] presented a method for (semi)automatic bone age assessment. First they
extracted 14 epiphyseal regions from the radiographs, and for each region retained image features using image
retrieval in the medical application framework. Then they used these features to build a classifier model. In this
study, they combined a SVM with cross-correlation to a prototype image for each class. These prototypes were
obtained by choosing one random hand per class. They used 1097 hand radiographs of an age range between
0 and 19 years. The mean error in age prediction was 1.0 and 0.83 years for 5-NN and SVM, respectively.
The accuracy of the nominal- and real-valued SVM based on 6 prominent regions was found to be 91.57% and
96.16%, respectively, which is accepted for an age range of about 2 years.
1695
GURAKSIN et al./Turk J Elec Eng & Comp Sci
In this study, an image-processing procedure was applied on the left-hand wrist X-ray images of children
from different ethnic groups aged between 0 and 6 years. In the image processing stage, noise reduction,
brightness normalization, background subtraction, contrast enhancement, filtering, region of interest selection,
edge detection, morphological operators, segmentation, labeling, and feature extraction processes were carried
out, and a total of 9 features corresponding to the carpal bones and distal epiphysis of the radius bone with
some physiological attributes of the children were obtained. Then, by using gain ratio, the best 6 features were
used for the classification process. Later on, using the obtained features, a bone age determination process was
performed with the help of algorithms such as SVM, NB, kNN, and C4.5, and the performances of the methods
used for the determination process were compared. Distinctly, a new feature corresponding to the distance
between the centers of the gravity of carpal bones was used as a feature in the classification process, and the
performance of the mentioned feature’s accuracy to the system was examined.
3. Materials and methods
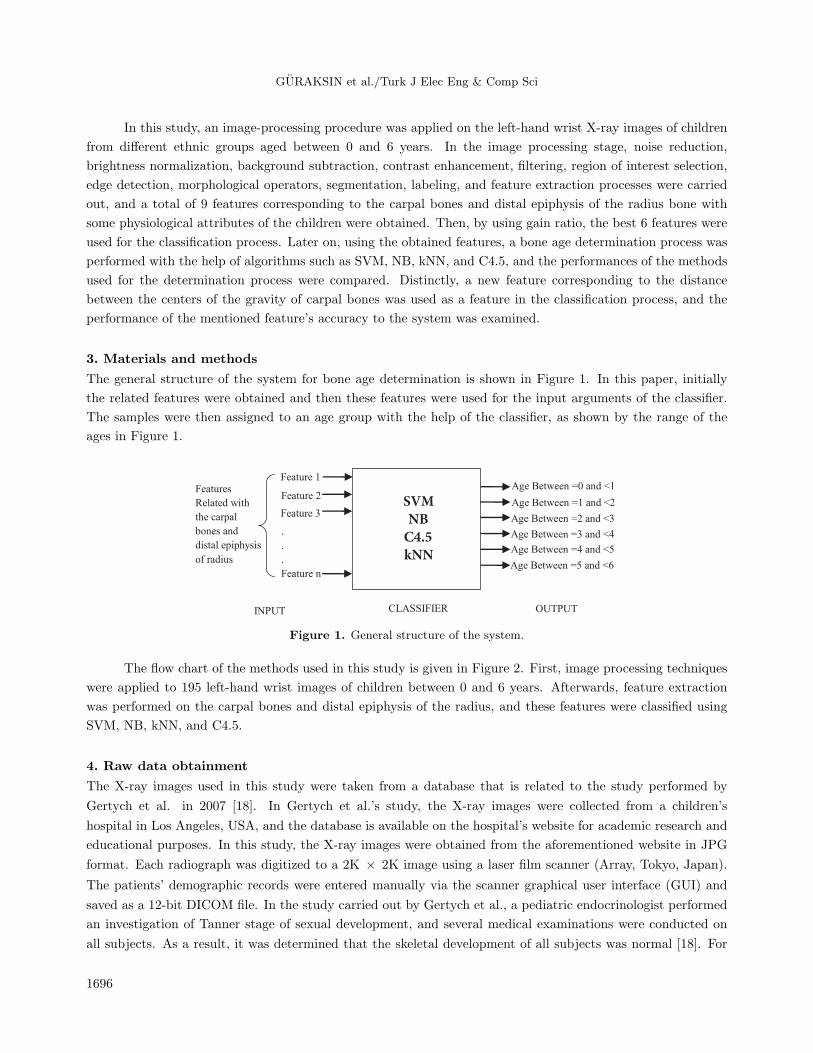
The general structure of the system for bone age determination is shown in Figure 1. In this paper, initially
the related features were obtained and then these features were used for the input arguments of the classifier.
The samples were then assigned to an age group with the help of the classifier, as shown by the range of the
ages in Figure 1.
Feature 1
Feature 2
Feature 3
.
.
.
Feature n
SVM
NB
C4.5
kNN
Age Between =0 and <1
Age Between =1 and <2
Age Between =2 and <3
Age Between =3 and <4
Age Between =4 and <5
Age Between =5 and <6
Features
Related with
the carpal
bones and
distal epiphysis
of radius
INPUT OUTPUT CLASSIFIER
Figure 1. General structure of the system.
The flow chart of the methods used in this study is given in Figure 2. First, image processing techniques
were applied to 195 left-hand wrist images of children between 0 and 6 years. Afterwards, feature extraction
was performed on the carpal bones and distal epiphysis of the radius, and these features were classified using
SVM, NB, kNN, and C4.5.
4. Raw data obtainment
The X-ray images used in this study were taken from a database that is related to the study performed by
Gertych et al. in 2007 [18]. In Gertych et al.’s study, the X-ray images were collected from a children’s
hospital in Los Angeles, USA, and the database is available on the hospital’s website for academic research and
educational purposes. In this study, the X-ray images were obtained from the aforementioned website in JPG
format. Each radiograph was digitized to a 2K × 2K image using a laser film scanner (Array, Tokyo, Japan).
The patients’ demographic records were entered manually via the scanner graphical user interface (GUI) and
saved as a 12-bit DICOM file. In the study carried out by Gertych et al., a pediatric endocrinologist performed
an investigation of Tanner stage of sexual development, and several medical examinations were conducted on
all subjects. As a result, it was determined that the skeletal development of all subjects was normal [18]. For
1696

GURAKSIN et al./Turk J Elec Eng & Comp Sci
this reason we used the chronological age of the subjects for the classification process. Among the data given
above, the study only focused on the X-ray images of 195 left-hand wrists of young children from 4 different
ethnic groups, whose ages ranged from 0 to 6. The distribution of the data used in our study is given in Table 1.
X-Ray Images
Image Processing
Procedure
Reducing the image noise
Normalizing Brightness
Background Subtraction
Contrast Enhancement
Filtering
Region of Interest Selection
Edge Detection
Morphological Operators
Segmentation
Feature
Extraction
Morphological features belonging to
carpal bones and the distal epiphysis
of the radius bone
Classification
Support Vector
Machines
Naive Bayes
k Nearest Neighborhood
C4.5
Figure 2. Flow chart of the method used.
Table 1. Data used according to age and race groups (ASF: Asian female children, ASM: Asian male children, AAF:
African-American female children, AAM: African-American male children, CAF: Caucasian female children, CAM:
Caucasian male children, HIF: Hispanic female children, HIM: Hispanic male children).
Age group ASF ASM AAF AAM CAF CAM HIF HIM Total0–1 1 2 3 5 2 3 0 4 201–2 4 4 5 5 3 5 5 4 352–3 5 5 4 5 4 3 5 4 353–4 5 5 4 5 3 3 5 5 354–5 4 5 4 5 5 5 3 4 355–6 4 3 7 3 4 2 8 4 35Total 23 24 27 28 21 21 26 25
195Race - total 47 55 42 51
5. Image-processing stage
In the determination of bone age, initially, there is a need to realize image-processing applications on left-
hand wrist X-ray images. It can be said that the processing consists of three stages: image preprocessing,
extraction of the region of interest, and feature extraction [19]. In this study, reducing image noise, normalizing
brightness, background subtraction, contrast enhancement, filtering, region of interest selection, edge detection,
morphological operators, segmentation, and labeling processes were carried out in the image preprocessing stage.
The features belonging to the carpal bones and the distal epiphysis of the radius bone were then extracted.
These stages and the methods used for image processing are described in detail in the following sections.
1697
GURAKSIN et al./Turk J Elec Eng & Comp Sci
6. Feature ranking with gain ratio
Ranking feature search methods evaluate single features using various metrics and assign a rank to each feature
based on the performance of the feature. Feature ranking is a useful method to gain knowledge about the data
used and to identify the relevant features. The ranking methods can filter the top features depending on the
metric and are based on a predefined subset size. The evaluation metrics are usually based on the statistical
properties of the features or the predictive potential of a feature. One of the popular metrics to evaluate
features is information gain (IG), measured according to the class to which it belongs [20]. Given entropy (E)
as a measure of impurity, it is possible to evaluate the efficiency of a feature with the classification of the training
data [21].
IG(S,A) = E(S)−∑
v∈V (A)
|Sv||S|
E(Sv) (1)
E(S) =∑c∈C
−|Sc||S|
log2|Sc||S|
(2)
IG measures the expected reduction of entropy caused by partitioning the examples according to attribute A .
In the equation given above, the symbol S is the item collection, and |S| is its cardinality; V (A) is the set of
all possible values for the attribute A ; Sv is the subset of S for which A has value v ; C is the class collection;
and Sc is the subset of S that includes the items belonging to class c [21].
Gain ratio (GR) is another metric-evaluating feature in decision tree induction that is based on the IG
metric. The GR eliminates the weakness that takes place in data sets with a large numbers of unique values,
which causes preference over other possibly better features with fewer values [20].
GR(S,A) =IG(S,A)
SI(S,A)(3)
SI(S,A) = −d∑
i=1
|Si||S|
log2|Si||S|
(4)
Si are d subsets of examples resulting from partitioning S by the d-valued feature A . In the above equation,
SI(S,A) indicates the split information value that represents the potential information generated by splitting
the training data set S into d partitions, corresponding to d outcomes on attribute A [21].
7. Support vector machines
SVM was first introduced by Vapnik in 1979. It was recommended by Vapnik once more in 1995 for regression
and classification. SVM is a supervised learning algorithm, which is recommended for classification and nonlinear
function approaches. More information about SVM can be obtained from Comak et al. [22] and Vapnik et al.
[23].
8. Naive Bayes
NB is the simplest form of Bayesian networks, where all attributes are independent given the value of the
class variable. The NB classifier greatly simplifies learning by assuming that features are independent given
1698
GURAKSIN et al./Turk J Elec Eng & Comp Sci
class. The NB method has proven itself to be effective in many practical applications such as text classification,
medical diagnostics, and performance management systems. More information related to NB can be obtained
from Zhang [24], Wang et al. [25], and Rish [26].
9. k-Nearest neighborhood algorithm
The kNN algorithm was developed by Dasarathy in 1991. The kNN algorithm, which is a machine learning
algorithm, reads a labeled training set and tries to classify unlabeled test sets. In order to classify a testing
article, it computes the distance between the article and all the training articles. More information about kNN
can be obtained from Hmeidi et al. [27] and Perrizo et al. [28].
10. C4.5 algorithm
The C4.5 algorithm, developed by Quinlan, is a widely used decision tree algorithm. A typical decision tree
consists of two stages. In the first stage, it is divided in each node and then develops. In the second phase,
because the tree can overfit the training data, the overfitted branches of the tree are removed. More information
related to the C4.5 algorithm can be obtained from He et al. [29], Uguz [30], and Sun et al. [31].
11. Application of the used method
This study consists of two parts: feature extraction and classification process. In the feature extraction stage,
we studied the X-ray images of 195 left-hand wrists belonging to 97 females and 98 males from 4 different ethnic
groups of young children aged between 0 and 6 years. In order to extract the features, a procedure of image
processing was carried out on X-ray images of the left-hand wrist, and features belonging to carpal bones and
the distal epiphysis of the radius bone were extracted. As a result of this action, a total of 4 features were gained,
and these features were the total area of carpal bones, the area of distal epiphysis of radius, distance between the
centers of gravity of the hamate and capitate carpal bones over the total major and minor axis of the hamate and
capitate carpal bones, and the number of carpal bones. Certain parameters, such as each individual’s height,
weight, trunk height, sex, and race, were also considered. The features obtained were classified so as to determine
bone age by using SVM, NB, kNN, and C4.5 methods. During the classification process, 10-fold cross-validation
procedures were applied. In 10-fold cross-validation, the original samples were randomly partitioned into 10 size
subsamples. Then a single subsample was retained to test the model, and the remaining 9 subsamples were used
as training data. This procedure was repeated 10 times. The image-processing procedure and the classification
procedures were carried out using MATLAB.
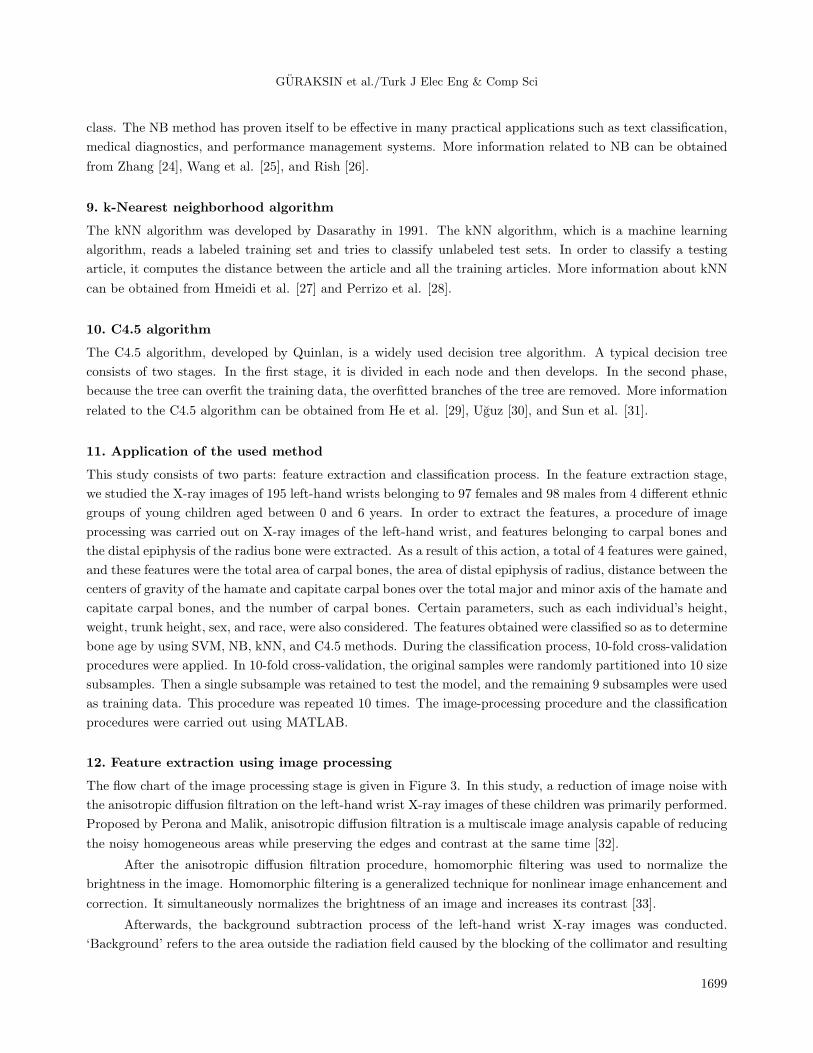
12. Feature extraction using image processing
The flow chart of the image processing stage is given in Figure 3. In this study, a reduction of image noise with
the anisotropic diffusion filtration on the left-hand wrist X-ray images of these children was primarily performed.
Proposed by Perona and Malik, anisotropic diffusion filtration is a multiscale image analysis capable of reducing
the noisy homogeneous areas while preserving the edges and contrast at the same time [32].
After the anisotropic diffusion filtration procedure, homomorphic filtering was used to normalize the
brightness in the image. Homomorphic filtering is a generalized technique for nonlinear image enhancement and
correction. It simultaneously normalizes the brightness of an image and increases its contrast [33].
Afterwards, the background subtraction process of the left-hand wrist X-ray images was conducted.
‘Background’ refers to the area outside the radiation field caused by the blocking of the collimator and resulting
1699
GURAKSIN et al./Turk J Elec Eng & Comp Sci
in white borders surrounding the radiation field. Its removal is important, because it reduces the amount of
unwanted light in images as well as almost transparent borders on the film during the soft copy display [34].
For this purpose, we used a morphological opening operation to estimate the background. The morphological
opening operation shows the effect of removing objects that cannot completely contain the structuring element.
After the morphological opening process, the estimated background is subtracted from the original image.
Contrast Limited Adaptive Histogram Equalization
Edge Detection Using by Canny Edge Detector
Morphological Operators (Dilation, Erosion)
Segmentation, Labeling
Feature Extraction
Anisotropic Diffusion Filtration
Homomorphic Filtering
Median Filtering
Region of Interest Selection
Background Subtraction by Using Morphological Opening
Figure 3. Image processing procedure.
When the background subtraction process was accomplished, a contrast enhancement process was carried
out. The contrast limited adaptive histogram equalization (CLAHE) method was used to conduct this process.
CLAHE is an adaptive contrast enhancement method in which the histogram is computed for the contextual
region of a pixel. The pixel’s intensity is thus transformed to a value within the display range that is proportional
to the pixel’s intensity rank in the local intensity histogram [35]. In this study, image details were enhanced by
improving the contrast with the CLAHE method.
After the contrast enhancement process was finished, a filtering operation was carried out using a median
filter. Median filtering is a fully suitable method for salt and pepper noise. This method is an example of a
nonlinear spatial filter. The median filter uses a 3 × 3 mask, and the output value is the median of the values
in the mask [36]. In this study, a median filter was used to eliminate the noise resembling the salt and pepper
noise in the image.
Following this process, the filtered image was displayed to the user, who had to select the region of the
bones concerned. Afterwards, the edge detection process was performed in the region of interest. Edge detection
is one of the most important processes in the computer vision field, and several different methods are also used
in edge detection. Among these methods, the Canny edge detector that we used for the edge detection process is
1700

GURAKSIN et al./Turk J Elec Eng & Comp Sci
one of the most popular methods. The popularity of the Canny edge detector can be attributed to its optimality
according to three criteria: good detection, good localization, and a single response to an edge [37].
At the end of the edge detection process, a closing morphological operator was used to enlarge the
boundaries of the foreground regions of the image. With the help of this process, the separated circles in
the images were joined. Immediately after the closing operation, the inside of the objects was filled using
morphological operators. At the end of these processes, several morphological operators, such as erosion and
the removal of small objects, were used for smoothing the images.
Finally, the objects were labeled by using connect component labeling, and the labeled image was
displayed to the user. Then the user has to select the relevant bones (carpal bones and the distal epiphysis of the
radius bone) manually. The labeling process guaranteed the selection of the relevant bones and a more accurate
feature extraction process was performed. Later on, the total areas of selected carpal bones and the distal
epiphysis of the radius bone were calculated for the feature extraction. Additionally, the major axis length and
the minor axis length calculations of the hamate and the capitate carpal bones were performed. Afterwards, the
centers of gravity of the hamate and capitate carpal bones were determined and their distance to each other was
also calculated. Finally, the total area of the hand silhouette in the X-ray image was calculated. The attributes
were later used for the extraction of the three features as follows:
Feature 1:Ac
Ah, (5)
where Ac is the total area of the carpal bones and Ah is the area of the hand silhouette.
Feature 2:Ad
Ah, (6)
where Ad is the area of the distal epiphysis of the radius bone.
Feature 3:Dhc
Majh +Majc +Minh +Minc, (7)
where Maj h is the major axis length of the hamate carpal bone, Maj c is the major axis length of the capitate
carpal bone, Min h is the minor axis length of the hamate carpal bone, and Min c is the minor axis length
capitate carpal bone, and
Dhc =√(xh − xc)2 + (yh − yc)2, (8)
where (xh, yh) is the coordinate of the centroid of the hamate carpal bone and (xc, yc) is the coordinate of the
centroid of the capitate carpal bone.
In Table 2, the mean and standard deviations of Feature 3 are given. In addition, the age groups’
homogeneity of variance was analyzed with Levene’s test (P <0.001). We performed between-group comparisons
with the Kruskal–Wallis nonparametric test because the variances were not homogeneous.
We found at least one statistically significant age group in Table 2 (chi-square = 146.32, P <0.001). The
level of statistical significance was set to P <0.05. As can be seen from the table, Feature 3 is a descriptive
feature for bone age determination. Depending on the nature of the bone growth, the mean of Feature 3
decreases as the age advances. In addition to Table 2, we used the Mann–Whitney U test for the binary group
comparisons given in Table 3.
1701
GURAKSIN et al./Turk J Elec Eng & Comp Sci
Table 2. Mean standard deviation and Kruskal–Wallis test of Feature 3.
Feature 3
Age N Mean SD95% CI for mean
Kruskal–Wallis testLower bound Upper bound
0–1 20 0.656 0.241 0.543 0.769
Chi-square = 146.32 df: 5
1–2 35 0.424 0.069 0.400 0.448
P <0.001
2–3 35 0.370 0.034 0.358 0.3823–4 35 0.335 0.038 0.323 0.3484–5 35 0.314 0.025 0.306 0.3225–6 35 0.284 0.016 0.278 0.289Total 195 0.377 0.135 0.358 0.396
Table 3. The Mann–Whitney U test results for age groups’ binary allowable comparisons.
Age 1–2 2–3 3–4 4–5 5–60–1 Z = –4.061
P <0.001Z = –5.583P <0.001
Z = –5.863P <0.001
Z = –6.091P <0.001
Z = –6.126P <0.001
1–2 Z = –3.741P <0.001
Z = –5.667P <0.001
Z = –6.842P <0.001
Z = –7.194P <0.001
2–3 Z = –3.917P <0.001
Z = –6.020P <0.001
Z = –7.159P <0.001
3–4 Z = –2.379P <0.017
Z = –6.349P <0.001
4–5 Z = –5.186P <0.001
The Mann–Whitney U test results for allowable comparisons of age groups are given in Table 3. Accord-
ingly, the difference in all binary group comparisons was found to be statistically significant. The analysis of
Feature 3 showed that there was a statistically significant difference (P <0.05) between Feature 3 and bone ages
between 0 and 6. From Table 3, it can be seen that Feature 3 is a distinctive feature for bone age determination
between the ages of 0 and 6.
Along with the three features mentioned above, certain parameters, such as individual height, weight,
trunk height, sex, race, and number of carpal bones, were also used for the classification process.
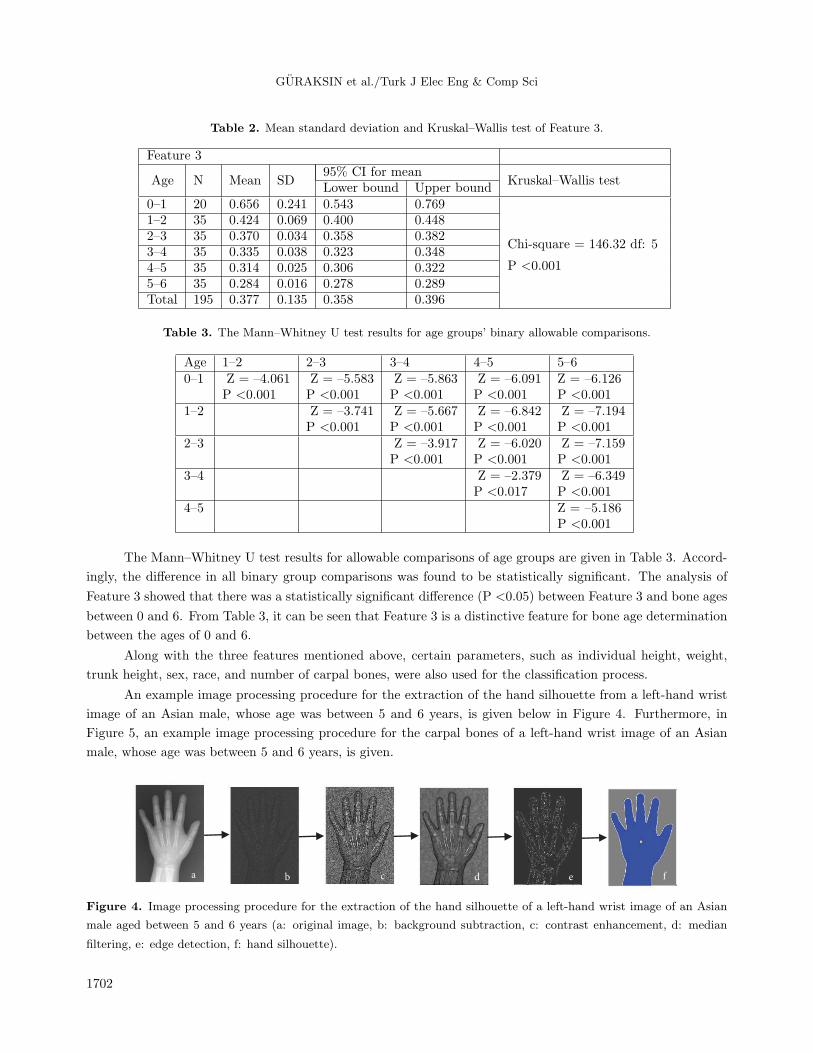
An example image processing procedure for the extraction of the hand silhouette from a left-hand wrist
image of an Asian male, whose age was between 5 and 6 years, is given below in Figure 4. Furthermore, in
Figure 5, an example image processing procedure for the carpal bones of a left-hand wrist image of an Asian
male, whose age was between 5 and 6 years, is given.
a b c d e f
Figure 4. Image processing procedure for the extraction of the hand silhouette of a left-hand wrist image of an Asian
male aged between 5 and 6 years (a: original image, b: background subtraction, c: contrast enhancement, d: median
filtering, e: edge detection, f: hand silhouette).
1702
GURAKSIN et al./Turk J Elec Eng & Comp Sci
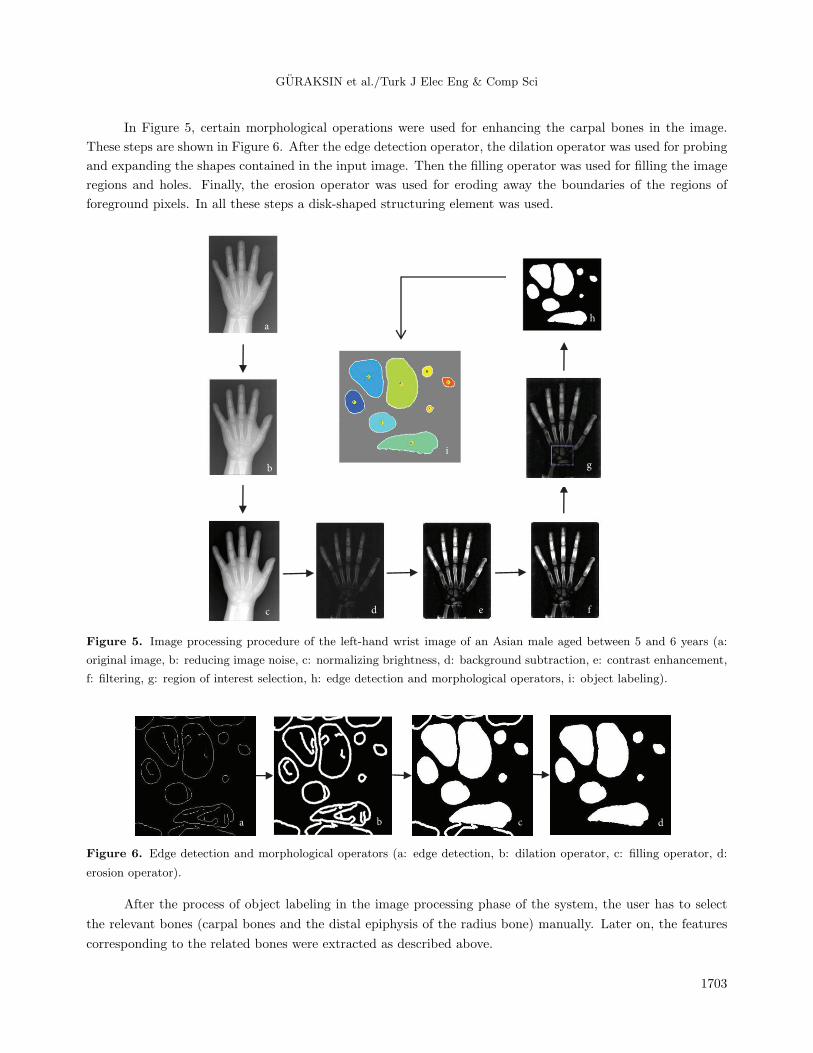
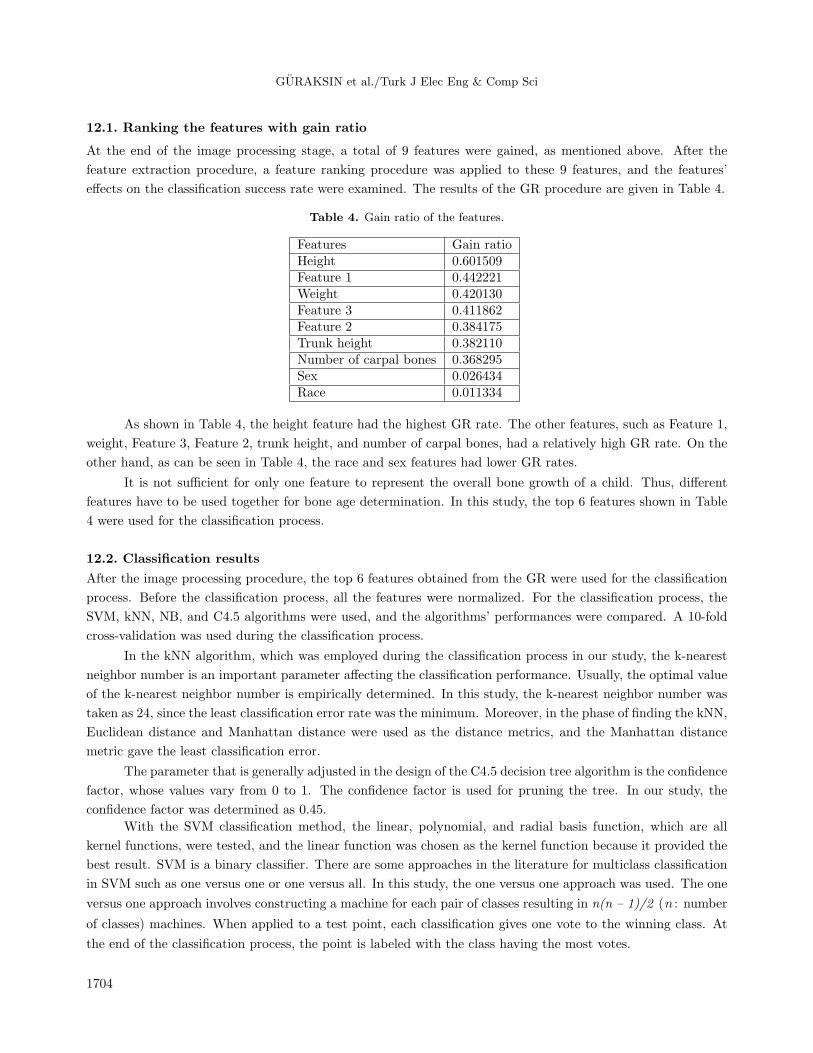
In Figure 5, certain morphological operations were used for enhancing the carpal bones in the image.
These steps are shown in Figure 6. After the edge detection operator, the dilation operator was used for probing
and expanding the shapes contained in the input image. Then the filling operator was used for filling the image
regions and holes. Finally, the erosion operator was used for eroding away the boundaries of the regions of
foreground pixels. In all these steps a disk-shaped structuring element was used.
b
c e f c d
a
g
h
i i
h
Figure 5. Image processing procedure of the left-hand wrist image of an Asian male aged between 5 and 6 years (a:
original image, b: reducing image noise, c: normalizing brightness, d: background subtraction, e: contrast enhancement,
f: filtering, g: region of interest selection, h: edge detection and morphological operators, i: object labeling).
a b ba b c d
Figure 6. Edge detection and morphological operators (a: edge detection, b: dilation operator, c: filling operator, d:
erosion operator).
After the process of object labeling in the image processing phase of the system, the user has to select
the relevant bones (carpal bones and the distal epiphysis of the radius bone) manually. Later on, the features
corresponding to the related bones were extracted as described above.
1703
GURAKSIN et al./Turk J Elec Eng & Comp Sci
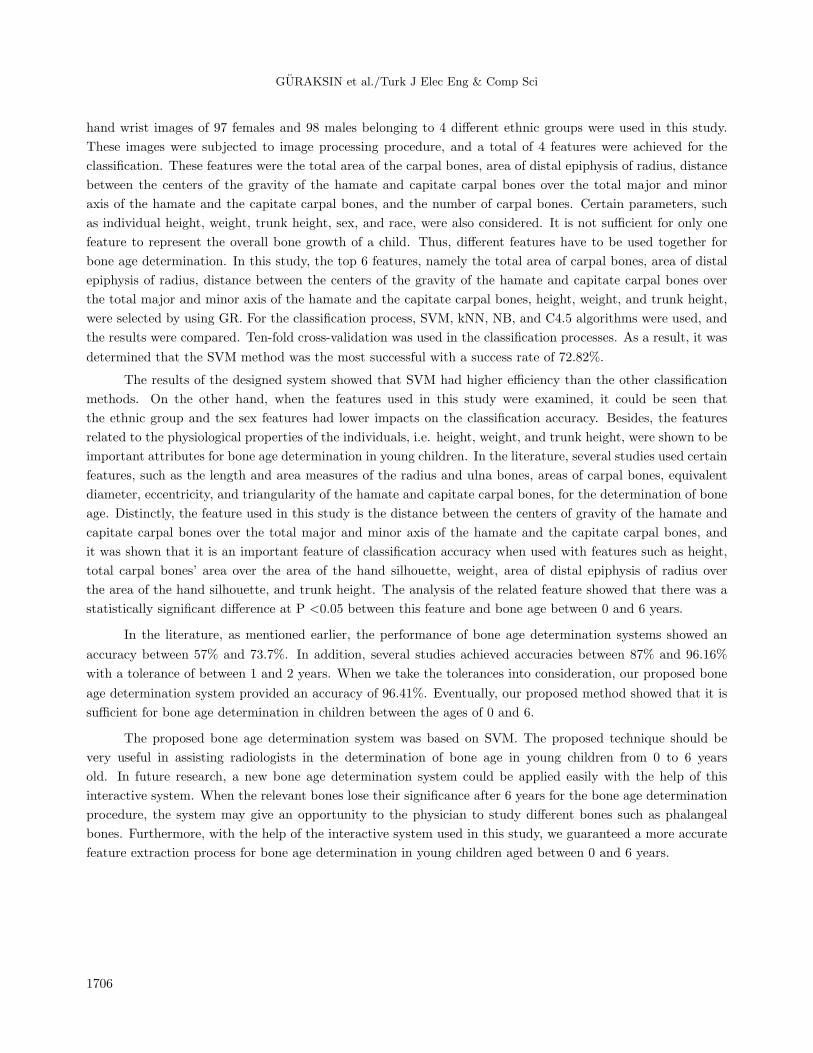
12.1. Ranking the features with gain ratio
At the end of the image processing stage, a total of 9 features were gained, as mentioned above. After the
feature extraction procedure, a feature ranking procedure was applied to these 9 features, and the features’
effects on the classification success rate were examined. The results of the GR procedure are given in Table 4.
Table 4. Gain ratio of the features.
Features Gain ratioHeight 0.601509Feature 1 0.442221Weight 0.420130Feature 3 0.411862Feature 2 0.384175Trunk height 0.382110Number of carpal bones 0.368295Sex 0.026434Race 0.011334
As shown in Table 4, the height feature had the highest GR rate. The other features, such as Feature 1,
weight, Feature 3, Feature 2, trunk height, and number of carpal bones, had a relatively high GR rate. On the
other hand, as can be seen in Table 4, the race and sex features had lower GR rates.
It is not sufficient for only one feature to represent the overall bone growth of a child. Thus, different
features have to be used together for bone age determination. In this study, the top 6 features shown in Table
4 were used for the classification process.
12.2. Classification results
After the image processing procedure, the top 6 features obtained from the GR were used for the classification
process. Before the classification process, all the features were normalized. For the classification process, the
SVM, kNN, NB, and C4.5 algorithms were used, and the algorithms’ performances were compared. A 10-fold
cross-validation was used during the classification process.
In the kNN algorithm, which was employed during the classification process in our study, the k-nearest
neighbor number is an important parameter affecting the classification performance. Usually, the optimal value
of the k-nearest neighbor number is empirically determined. In this study, the k-nearest neighbor number was
taken as 24, since the least classification error rate was the minimum. Moreover, in the phase of finding the kNN,
Euclidean distance and Manhattan distance were used as the distance metrics, and the Manhattan distance
metric gave the least classification error.
The parameter that is generally adjusted in the design of the C4.5 decision tree algorithm is the confidence
factor, whose values vary from 0 to 1. The confidence factor is used for pruning the tree. In our study, the
confidence factor was determined as 0.45.
With the SVM classification method, the linear, polynomial, and radial basis function, which are all
kernel functions, were tested, and the linear function was chosen as the kernel function because it provided the
best result. SVM is a binary classifier. There are some approaches in the literature for multiclass classification
in SVM such as one versus one or one versus all. In this study, the one versus one approach was used. The one
versus one approach involves constructing a machine for each pair of classes resulting in n(n – 1)/2 (n : number
of classes) machines. When applied to a test point, each classification gives one vote to the winning class. At
the end of the classification process, the point is labeled with the class having the most votes.
1704

GURAKSIN et al./Turk J Elec Eng & Comp Sci
Sensitivity and specificity analyses are important measures for the performance of diagnostic tests.
Sensitivity, specificity, and total classification accuracy analyses were carried out to evaluate the performance
of the classifiers. The sensitivity, specificity, and total classification accuracies are shown in Table 5.
Table 5. Classification results.
Methods Classification accuracy Sensitivity SpecificitySVM 0.7282 0.7369 0.9324NB 0.6821 0.7024 0.9171C4.5 0.6718 0.6810 0.9117kNN 0.7026 0.7167 0.9233
As shown in Table 5, the highest success rate was achieved with SVM at 72.82%. In addition, the highest
sensitivity and specificity rates were also achieved with SVM. Together with the sensitivity and specificity
analyses, the confusion matrix of the SVM with the highest performance rate was analyzed. The confusion
matrix of SVM is given in Table 6.
Table 6. Confusion matrix of SVM.
Output/Desired age 0–1 1–2 2–3 3–4 4–5 5–60–1 17 3 0 0 0 01–2 4 28 2 1 0 02–3 0 3 26 4 2 03–4 0 0 5 25 5 04–5 0 0 4 7 17 75–6 0 0 0 1 5 29
When the confusion matrix given in Table 6 was analyzed, it was seen that incorrectly classified samples
were generally collected in either one lower or higher class of the investigated actual age ranges, i.e. for the class
of 1–2 years, 4 incorrectly classified samples occurred in the class of ages between 0 and 1, and 2 incorrectly
classified samples occurred in the class of ages between 2 and 3 years. Only one incorrectly classified sample
occurred for ages between 3 and 4.
After the comparison of the methods, the features’ effects on the performance of the SVM were investi-
gated. The results of the effects of the features on the performance of the SVM are given in Table 7.
Table 7. Effects of the features on the SVM.
Features used Classification accuracy of SVM9 features 0.6564Top 8 features 0.7231Top 7 features 0.6974Top 6 features 0.7282Top 6 features - Feature 3 0.7179
In Table 7, the best classification accuracy was achieved by the top 6 features gained from the GR.
Moreover, it can be seen from Table 7 that Feature 3 was an efficient attribute for the classification accuracy.
13. Discussion and conclusion
In this study, a semiautomatic system was designed for the determination of the bone age of children aged
between 0 and 6, using techniques such as image processing and artificial intelligence. A total of 195 left-
1705
GURAKSIN et al./Turk J Elec Eng & Comp Sci
hand wrist images of 97 females and 98 males belonging to 4 different ethnic groups were used in this study.
These images were subjected to image processing procedure, and a total of 4 features were achieved for the
classification. These features were the total area of the carpal bones, area of distal epiphysis of radius, distance
between the centers of the gravity of the hamate and capitate carpal bones over the total major and minor
axis of the hamate and the capitate carpal bones, and the number of carpal bones. Certain parameters, such
as individual height, weight, trunk height, sex, and race, were also considered. It is not sufficient for only one
feature to represent the overall bone growth of a child. Thus, different features have to be used together for
bone age determination. In this study, the top 6 features, namely the total area of carpal bones, area of distal
epiphysis of radius, distance between the centers of the gravity of the hamate and capitate carpal bones over
the total major and minor axis of the hamate and the capitate carpal bones, height, weight, and trunk height,
were selected by using GR. For the classification process, SVM, kNN, NB, and C4.5 algorithms were used, and
the results were compared. Ten-fold cross-validation was used in the classification processes. As a result, it was
determined that the SVM method was the most successful with a success rate of 72.82%.
The results of the designed system showed that SVM had higher efficiency than the other classification
methods. On the other hand, when the features used in this study were examined, it could be seen that
the ethnic group and the sex features had lower impacts on the classification accuracy. Besides, the features
related to the physiological properties of the individuals, i.e. height, weight, and trunk height, were shown to be
important attributes for bone age determination in young children. In the literature, several studies used certain
features, such as the length and area measures of the radius and ulna bones, areas of carpal bones, equivalent
diameter, eccentricity, and triangularity of the hamate and capitate carpal bones, for the determination of bone
age. Distinctly, the feature used in this study is the distance between the centers of gravity of the hamate and
capitate carpal bones over the total major and minor axis of the hamate and the capitate carpal bones, and
it was shown that it is an important feature of classification accuracy when used with features such as height,
total carpal bones’ area over the area of the hand silhouette, weight, area of distal epiphysis of radius over
the area of the hand silhouette, and trunk height. The analysis of the related feature showed that there was a
statistically significant difference at P <0.05 between this feature and bone age between 0 and 6 years.
In the literature, as mentioned earlier, the performance of bone age determination systems showed an
accuracy between 57% and 73.7%. In addition, several studies achieved accuracies between 87% and 96.16%
with a tolerance of between 1 and 2 years. When we take the tolerances into consideration, our proposed bone
age determination system provided an accuracy of 96.41%. Eventually, our proposed method showed that it is
sufficient for bone age determination in children between the ages of 0 and 6.
The proposed bone age determination system was based on SVM. The proposed technique should be
very useful in assisting radiologists in the determination of bone age in young children from 0 to 6 years
old. In future research, a new bone age determination system could be applied easily with the help of this
interactive system. When the relevant bones lose their significance after 6 years for the bone age determination
procedure, the system may give an opportunity to the physician to study different bones such as phalangeal
bones. Furthermore, with the help of the interactive system used in this study, we guaranteed a more accurate
feature extraction process for bone age determination in young children aged between 0 and 6 years.
1706
GURAKSIN et al./Turk J Elec Eng & Comp Sci
References
[1] Tristan A, Arribas JI. A radius and ulna skeletal age assessment system. In: IEEE 2005 Workshop on Machine
Learning for Signal Processing; 28 September 2005; Mystic, CT, USA. New York, NY, USA: IEEE. pp. 221-226.
[2] Hasaltın E, Besdok E. El–bilek rontgen goruntulerinden radyolojik kemik yasıtespitinde yapay sinir aglarıkullanımı.
In: National Conference of Electrical, Electronics and Computer Engineering; 8–12 December 2004; Bursa, Turkey
(in Turkish).
[3] Darendeliler F, Bundak R. Boy kısalıgına yaklasım. Guncel Pediatri 2005; 3: 49-52 (Turkish).
[4] Boyunaga O. Radyolojik olarak kemik yasıtayini. Klinik Pediatri 2002; 2: 81-85 (in Turkish).
[5] Giordano D, Spampinato C, Scarciofalo G, Leonardi R. An automatic system for skeletal bone age measurement
by robust processing of carpal and epiphysial/metaphysial bones. IEEE T Instrum Meas 2010; 59: 2539-2553.
[6] Kim HJ, Kim WY. Computerized bone age assessment using DCT and LDA. In Gagalowicz A, Philips W,
editors. Computer Vision/Computer Graphics Collaboration Techniques. Berlin, Germany: Springer, 2007. pp.
440-448.
[7] Fernandez MAM, Cardenes R, Moreno EM, Garcıa RL, Fernandez MM, Lopez CA. Automatic articulated regis-
tration of hand radiographs. Image Vision Comput 2009; 27: 1207-1222.
[8] Cao F, Huang HK, Pietka E, Gilsanz V. Digital hand atlas and web-based bone age assessment: system design and
implementation. Comput Med Imag Grap 2000; 24: 297-307.
[9] Hsieh CW, Jong TL, Tiu CM. Bone age estimation based on phalanx information with fuzzy constrain of carpals.
Med Biol Eng Comput 2007; 45: 283-295.
[10] Hsieh CW, Liu TC, Jong TL, Tiu CM. A fuzzy-based growth model with principle component analysis selection
for carpal bone-age assessment. Med Biol Eng Comput 2010; 48: 579-588.
[11] Garcıa RL, Fernandez MM, Arribas JI, Lopez CA. A fully automatic algorithm for contour detection of bones
in hand radiographs using active contours. In: IEEE 2003 International Conference on Image Processing; 14–17
September 2003; Barcelona, Spain. New York, NY, USA. pp. 421-424.
[12] Zhang A, Gertych A, Liu BJ. Automatic bone age assessment for young children from newborn to 7-year-old using
carpal bones. Comput Med Imag Graph 2007; 31: 299-310.
[13] Hsieh CW, Jong TL, Chou YH, Tiu CM. Computerized geometric features of carpal bone for bone age estimation.
Chinese Med J-Peking 2007; 120: 767-770.
[14] Jantan S, Hussain A, Mustafa MM. Distal radius bone age estimation based on fuzzy model. In: IEEE 2010
Conference on Biomedical Engineering and Sciences; 30 November–2 December 2010; Kuala Lumpur, Malaysia.
New York, NY, USA: IEEE. pp. 427-432.
[15] Somkantha K, Umpon NT, Auephanwiriyakul S. Bone age assessment in young children using automatic carpal
bone feature extraction and support vector regression. J Digit Imaging 2011; 24: 1044-1058.
[16] Al-Taani AT. Classification of hand bones for bone age assessment. In: IEEE 1996 International Conference on
Electronics, Circuits and Systems; 13–16 October 1996; Rodos, Greece. New York, NY, USA: IEEE. pp. 1088-1091.
[17] Harmsen M, Fischer B, Schramm H, Seidl T, Deserno TM. Support vector machine classification based on correlation
prototypes applied to bone age assessment. IEEE T Inf Technol B 2013; 17: 190-197.
[18] Gertych A, Zhang A, Sayre J, Kurkowska SP, Huang HK. Bone age assessment of children using a digital hand
atlas. Comput Med Imag Graph 2007; 31: 322-331.
[19] Pietka E. Computer-assisted bone age assessment—database adjustment. Int Congr Ser 2003; 1256: 87-92.
[20] Polaka I. Feature selection approaches in antibody display data analysis. In: RHEI 2011 International Scientific
and Practical Conference on Environment, Technology, and Resources; 20–22 June 2011; Rezekne, Latvia. Rezekne,
Latvia: Rezenke Higher Education Institute. pp. 16-23.
1707

GURAKSIN et al./Turk J Elec Eng & Comp Sci
[21] Grimaldi M, Cunningham P, Kokaram A. An evaluation of alternative feature selection strategies and ensemble
techniques for classifying music. In: Workshop in Multimedia Discovery and Mining; 22 September 2003; Dubrovnik,
Croatia.
[22] Comak E, Arslan A, Turkoglu I. A decision support system based on support machines for diagnosis of the heart
valve diseases. Comput Biol Med 2007; 37: 21-27.
[23] Vapnik V, Golowich S, Smola A. Support vector method for function approximation, regression estimation, and
signal processing. Adv Neur In 1996; 9: 281-287.
[24] Zhang H. The optimality of naive Bayes. In: Proceedings of the Seventeenth Florida Artificial Intelligence Research
Society Conference; 17–19 May 2004; Miami Beach, FL, USA. pp. 562-567.
[25] Wang Q, Garrity GM, Tiedje JM, Cole JR. Naive Bayesian classifier for rapid assignment of rRNA sequences into
the new bacterial taxonomy. Appl Environ Microb 2007; 73: 5261-5267.
[26] Rish I. An empirical study of the naive Bayes classifier. In: IJCAI 2001 Workshop on Empirical Methods in Artificial
Intelligence; 4–10 August 2001; Washington, DC, USA. New York, NY, USA: IBM. pp. 41-46.
[27] Hmeidi I, Hawashin B, El-Qawasmeh E. Performance of KNN and SVM classifiers on full word Arabic articles. Adv
Eng Inform 2008; 22: 106-111.
[28] Perrizo W, Ding Q, Denton A. Lazy classifiers using p-trees. In: ICSA 2002 International Conference on Computer
Applications in Industry and Engineering; 7–9 November 2002; San Diego, CA, USA. Winona, MN, USA: ISCA.
pp. 176-179.
[29] He P, Chen L, Xu XH. Fast C4.5. In: IEEE 2007 International Conference on Machine Learning and Cybernetics;
19–22 August 2007; Hong Kong. New York, NY, USA: IEEE. pp. 2841-2846.
[30] Uguz H. A two stage feature selection method for text categorization by using information gain, principal component
analysis and genetic algorithm. Knowl-Based Syst 2011; 24: 1024-1032.
[31] Sun W, Chen J, Li J. Decision tree and PCA-based fault diagnosis of rotating machinery. Mech Syst Signal Pr 2007;
21: 1300-1317.
[32] Perona P, Malik J, Scale-space and edge detection using anisotropic diffusion. IEEE T Pattern Anal 1990; 12:
629-639.
[33] Wang Q, Yang J. Eye location and eye state detection in facial images with unconstrained background. J Inform
Comput Sci 2006; 1: 284-289.
[34] Pietka E, Gertych A, Pospiech S, Cao F, Huang HK, Gilsanz V. Computer-assisted bone age assessment: image
preprocessing and epiphyseal/metaphyseal ROI extraction. IEEE T Med Imaging 2001; 20: 715-729.
[35] Pisano ED, Zong S, Hemminger BM, DeLuca M, Johnston RE, Muller KE, Brauening MP, Pizer SM. Contrast
limited adaptive histogram equalization image processing to improve the detection of simulated spiculations in dense
mammograms. J Digit Imaging; 1998; 11: 193-200.
[36] McAndrew A. Introduction to Digital Image Processing with MATLAB. Boca Raton, FL, USA: CRC Press, 2004.
[37] Ding L, Goshtasby A. On the Canny edge detector. Pattern Recogn 2001 34: 721-725.
1708