Bond and fatigue characteristics of high-strength cement-based ...
330
New Jersey Institute of Technology New Jersey Institute of Technology Digital Commons @ NJIT Digital Commons @ NJIT Dissertations Electronic Theses and Dissertations Spring 5-31-1989 Bond and fatigue characteristics of high-strength cement-based Bond and fatigue characteristics of high-strength cement-based composites composites Somboon Chimaphant New Jersey Institute of Technology Follow this and additional works at: https://digitalcommons.njit.edu/dissertations Part of the Civil Engineering Commons Recommended Citation Recommended Citation Chimaphant, Somboon, "Bond and fatigue characteristics of high-strength cement-based composites" (1989). Dissertations. 1226. https://digitalcommons.njit.edu/dissertations/1226 This Dissertation is brought to you for free and open access by the Electronic Theses and Dissertations at Digital Commons @ NJIT. It has been accepted for inclusion in Dissertations by an authorized administrator of Digital Commons @ NJIT. For more information, please contact [email protected].
-
Upload
khangminh22 -
Category
Documents
-
view
3 -
download
0
Transcript of Bond and fatigue characteristics of high-strength cement-based ...

New Jersey Institute of Technology New Jersey Institute of Technology
Digital Commons @ NJIT Digital Commons @ NJIT
Dissertations Electronic Theses and Dissertations
Spring 5-31-1989
Bond and fatigue characteristics of high-strength cement-based Bond and fatigue characteristics of high-strength cement-based
composites composites
Somboon Chimaphant New Jersey Institute of Technology
Follow this and additional works at: https://digitalcommons.njit.edu/dissertations
Part of the Civil Engineering Commons
Recommended Citation Recommended Citation Chimaphant, Somboon, "Bond and fatigue characteristics of high-strength cement-based composites" (1989). Dissertations. 1226. https://digitalcommons.njit.edu/dissertations/1226
This Dissertation is brought to you for free and open access by the Electronic Theses and Dissertations at Digital Commons @ NJIT. It has been accepted for inclusion in Dissertations by an authorized administrator of Digital Commons @ NJIT. For more information, please contact [email protected].

Copyright Warning & Restrictions
The copyright law of the United States (Title 17, UnitedStates Code) governs the making of photocopies or other
reproductions of copyrighted material.
Under certain conditions specified in the law, libraries andarchives are authorized to furnish a photocopy or other
reproduction. One of these specified conditions is that thephotocopy or reproduction is not to be “used for any
purpose other than private study, scholarship, or research.”If a, user makes a request for, or later uses, a photocopy orreproduction for purposes in excess of “fair use” that user
may be liable for copyright infringement,
This institution reserves the right to refuse to accept acopying order if, in its judgment, fulfillment of the order
would involve violation of copyright law.
Please Note: The author retains the copyright while theNew Jersey Institute of Technology reserves the right to
distribute this thesis or dissertation
Printing note: If you do not wish to print this page, then select“Pages from: first page # to: last page #” on the print dialog screen

The Van Houten library has removed some of thepersonal information and all signatures from theapproval page and biographical sketches of thesesand dissertations in order to protect the identity ofNJIT graduates and faculty.

BOND AND FATIGUE CHARACTERISTICS OF
HIGH STRENGTH CEMENT-BASED COMPOSITES
by
Somboon Chimamphant
Dissertation submitted to the Faculty of the Graduate School
of the New Jersey Institute of Technology in partial fulfillment
of the requirements for the degree of
Doctor of Engineering Science
1989

APPROVAL SHEET
Title of Dissertation: Bond and Fatigue Characteristics of
High Strength Cement-based Composites
Name of Candidate: Somboon Chimamphant
Doctor of Engineering Science, 1989
Dissertation and Abstract
Approve :
Dr. Methi Wecharatana DateAssociate Prof. of Civil Engineering
Signatures of other members
of the dissertation committee.Dr. C.T. Thomas Hsu DateProfessor of Civil EngineeringDirector of Graduate Studies
Dr. Farhad Ansari Date
Associate Prof. of Civil Engineering
Dr. Namunu Meegoda DateAssistant Prof. of Civil Engineering
Dr. Suebsak Nanthavanij DateAssistant Prof. of IndustrialEngineering

VITA
Name: Somboon Chimamphant
Degree and date to be conferred: D. Eng. Sc., 1989
Collegiate institutions attended Dates Degree Date of Degree
New Jersey Institute of Technology 1985-1988 D.E.S. 1989
Asian Institute of Technology 1977-1978 M.Eng. 1978
Kasetsart University 1973-1976 B.S.C.E. 1976
Major: Civil Engineering
Positions held: 1985-1986 Research Assistant
1986-1988 Teaching Assistant
New Jersey Institute of Technology
Newark, New Jersey 07102
Publications:
1. S. Chimamphant, "Stress Analysis of the Anchorage Zone of the
prestress concrete box girder by finite prism method", Master Thesis,
Asian Institute of Technology, 1978.

2. M. Wecharatana and S. Chimamphant, "Bond Strength of Deformed
Bars and Steel Fibers in High Strength Concrete", Materials Research
Society, Symposium Proceedings, Vol.114, Bond in Cementitious
Composites, Editors S. Mindess and S.P. Shah, Dec. 1987, pp. 245-254.
3. S. Chimamphant and M. Wecharatana, "Fatigue Characteristics of
High Strength Cementitious Composites", The Second East Asia-Pacific
Conference on Structural Engineering and Construction, Jan. 1989.
4. S. Chimamphant and M. Wecharatana, "Bond-Slip Characteristics
of Reinforcement in High Strength Concrete", The Second East
Asia-Pacific Conference on Structural Engineering and Construction,
Jan. 1989.
S. M. Wecharatana, S. Chimamphant and C.C. Lin, "New Polymer
Concrete for Marine Structures", The Second East Asia-Pacific
Conference on Structural Engineering and Construction, Jan. 1989.
6. S. Chimamphant and M. Wecharatana, "Bond-Slip Characteristics
of High Strength Fibrous Concrete", To be submitted for possible
publication in Apr. 1989, ACI Journal.
ABSTRACT
Title of Dissertation: Bond and Fatigue Characteristics of
High Strength Cement-Based Composites
Somboon Chimamphant, Doctor of Engineering Science, 1989
Dissertation directed by: Dr. Methi Wecharatana, Associate Professor
of Civil Engineering
The results of a series of tests on a variety of high strength
cementitious composites yield a model from which an empirical equation
of general normalized pull-out stress vs. pull-out displacement
relationship is developed. A new variable named the "Brittleness Index"
is defined and used in the proposed equation. Additionally, the concept
of maximum strain is used to predict the fatigue life of high strength
concrete.
Three sizes of deformed bars and two types of steel fibers with
four different volume fractions were used to observe bond-slip and
pull-out characteristics of high strength concrete. The results
indicate that the maximum slippage of deformed bars is only about 10 %
of that observed in normal concrete. Consequently, the required
development length may have to be longer for high strength concrete
members as compared to normal concrete. For the fatigue characteristics
study, standard 3x6 in. cylinders were tested at the rates of 6 and 12
Hz. in a closed-loop load-controlled system. The results show that as
the compressive strength of the composites increases from 4000 to 11000
psi., the fatigue strength increases by 17 percents. The rate of
loading does not significantly affect the S-N relationship, fatigue
strength and fatigue limit of the high strength cement-based
composites. The S-N curves of high strength concrete shows a faster
decay rate than those of normal concrete. The maximum strain at any
cycle under cyclic loading is always less than the maximum strain at
failure under monotonic loading. Also observed is that the maximum
strain-cycle relationship is linear. These results indicate that the
design code for flexure of normal concrete cannot be applied to high
strength concrete.


ACKNOWLEDGMENT
I like to express my deepest gratitude to my wife and friends for
their support through this very difficult endeavor. I must make special
thanks to my friend, Allyn Luke, who proofread this manuscript. I would
also like to thank Prof. C.T. Thomas Hsu, Dr. F. Ansari, Dr. N.
Meegoda, and Dr. S. Nanthavanij, who served as members of the
dissertation committee for their advice and criticism. Most of all, I
would like to thank my advisor Dr. Methi Wecharatana for his vital
counseling.

CONTENTS
I. INTRODUCTION 1
1.1 General 1
1.2 Research Significance 3
II. LITERATURE REVIEW 6
2.1 High Strength Concrete 6
2.2 Bond Characteristics 10
2.2.1 Steel Reinforced Concrete 10
2.2.2 Fiber Reinforced Concrete 12
2.3 Fatigue Characteristics 22
2.3.1 Cyclic Compression 23
2.3.2 Cyclic Tension 25
2.3.3 Reverse Loading 29
2.3.4 Factors Affecting Fatigue Characteristics 29
2.3.5 Fatigue on High Strength Concrete 33
III. OBJECTIVE AND SCOPE OF WORK 36
3.1 Objective 36
3.1.1 Experimental Program 36
3.1.2 Empirical Modelling 43
3.2 Scope of Work 45
IV. TESTING PROCEDURE 48
4.1 Material Compositions 48
4.2 Mix Proportions 48
4.3 Specimens 49
4.4 Specimen Casting 51
4.5 Test Setup and Procedure 52
4.5.1 Compression Test 52
4.5.2 Tension Test 53
4.5.3 Beam Test 54
4.5.4 Bond Strength Test 54
4.5.4.1 Bond Strength of Reinforced High Strength
Concrete 54

4.5.4.2 Pull-Out Stress of High Strength Fibrous
Concrete 55
4.5.5 Fatigue Test 55
V. RESULTS AND DISCUSSION 60
5.1 Basic Properties of High Strength Concrete 60
5.1.1 Compressive Strength 60
5.1.2 Mode of Failure 64
5.1.3 Flexural Properties 66
5.1.4 Tensile Strength 69
5.2 Bond Stength-Slip Relationship 71
5.2.1 Reinforced High Strength Concrete 71
5.2.2 Fiber Reinforced High Strength Concrete 74
5.2.2.1 Load Displacement Relationship 74
5.2.2.2 Normalized Load Displacement Relationship 78
5.3 Fatigue Characteristics 80
5.3.1 S-N Curve 80
5.3.2 Fatigue Strength 82
5.3.3 Strain-Cycle Relationship 86
VI. EMPIRICAL MODEL 89
6.1 Bond Strength Characteristic 89
6.1.1 Normalized Pull-Out Stress-Displacement
Relationships 89
6.1.2 Brittleness Index 97
6.1.2.1 Brittleness Index Model 98
6.1.2.2 Statistical Analysis 99
6.2 Fatigue Characteristics 102
6.2.1 S-N Curve 102
6.2.2 Maximum Strain Concept 103
VII. CONCLUSIONS 105
FUTURE RESEARCH 108
APPLICATIONS OF THE OBSERVED BEHAVIORS 109
v

BIBLIOGRAPHY 110
APPENDIX A Uniaxial Compressive Stress vs. Strain Curves 118
APPENDIX B Flexural Stress vs. Deflection Curves 155
APPENDIX C Bond Strength vs. Slip Curves 165
APPENDIX D Pull-Out Stress vs- Displacement Curves of
Concrete 172
APPENDIX E Bond Strength vs. Pull-Out Displacement Curves
of High Strength fibrous Concrete 178
APPENDIX F Normalized Pull-Out Stress vs. Normalized Displace
ment Curves of Concrete 192
APPENDIX G Normalized Bond Strength vs. Normalized Pull-Out
Displacement Curves of HS. Fibrous Concrete 197
APPENDIX H Cyclic Compressive Stress vs. Strain Curves ..... 211
APPENDIX I Normalized Cyclic Compressive Stress vs. Strain
Curves 240
APPENDIX J Monotonic vs. Cyclic Compression Relationship 265
APPENDIX K Strain vs. Number of Loading Cycle Relationship 271
APPENDIX L Experimental Results 290

LIST OF TABLES
Table Page
11.1 Fatigue Load Spectrum 23
111.1 Bond Strength Test 46
111.2 Fatigue Test due to the Effect of Max. Stress Level 47
111.3 Fatigue Test due to the Effect of Rate of Loading 47
V.1 Compression Properties 62
V.2 Flexural Properties of High Strength Concrete 67
V.3 Direct Tension Properties of Cement-Based Composites 69
V.4 Bond Strength Properties of Reinforced High Strength
Concrete 72
V.5 Bond Strength Properties of High Strength Fibrous
Concrete 75
V.6 Number of Cycles to Failure under Repeated Load 83
VI.1 Brittleness Index of the Materials 92
VI.2 Brittleness Index (m) of the specimen from the Proposed
Model 100
VI.3 Two-Factor Analysis of Variance 101
VI.4 Coefficients of A and B 102
v i
LIST OF CHART
Chart Page
I Scheme of Work 38
vii

LIST OF FIGURES
Figure Page
1.1 Stress vs. Strain Curve of High Strength Concrete 5
3.1 Direct Tension, Dog-Bone Specimen 37
3.2 Tapered Specimen 40
3.3 Dog-Bone Specimen 40
4.1 Friction Grips (T. Cintora [90]) 50
4.2 Compression and Fatigue Test 57
4.3 Direct Tension Test, Tapered Specimen 57
4.4 Beam Test 58
4.5 Pull-Out Test (Bars #3, #4) 58
4.6 Pull-Out Test of Deformed Bar #6 59
5.1 Typical Stress vs. Strain Curves of Different High
Strength Concrete compare with Normal Concrete 63
5.2 Stress vs. Strain Curves of Polymer Concrete due to
the Effect of Curing Period 63
5.3 Comparison of Stress vs. Strain Curves of HSC between
Closed-Loop Axial and Circumferential Strain Control 65
5.4 Comparison of Flexural Stress vs. Deflection of
Different Beam Sizes of High Strength Concrete 68
5.5 Typical Tensile Stress vs. Displacement by
Splitting Test Method 68
5.6 Comparison of Pull-Out Stress vs. Displacement
Relationship of Cement-Based Composites 70
5.7 Bond-Slip Relationships of Deformed Bars under
Pull-Out Test 73
5.8 Typical Pull-Out Stress vs. Displacement of High Strength
Fibrous Concrete (Straight-End Fiber) 76
5.9 Typical Pull-Out Stress vs. Displacement of High Strength
Fibrous Concrete (Hooked-End Fiber) 76
viii

PageFigure
5.10 Pull-Out Stress vs. Displacement of Different High
Strength Concrete and High Strength Fibrous Concrete 77
5.11 Comparison of Normalized Pull-Out Stress vs. Displacement
of Cement-Based Composites (Straight-End Fiber) 79
5.12 Comparison of Normalized Pull-Out Stress vs. Displacement
of Cement-Based Composites (Hooked-End Fiber) 79
5.13 Comparison of the S-N Curves of different High
Strength Concrete with Normal Concrete 81
5.14 Typical Stress vs. Strain Curve under Cyclic
Compression Test of Superplasticizer Concrete 84
5.15 Typical Stress vs. Strain Curve under Cyclic
Compression Test of Microsilica Concrete (6 Hz) 84
5.16 Typical Stress vs. Strain Curve under Cyclic
Compression Test of Microsilica Concrete (12 Hz) 85
5.17 Typical Stress vs. Strain Curve under Cyclic
Compression Test of Polymer Concrete 85
5.18 Typical Peak Strain vs. No. of Cycles of different
High Strength Cement-Based Composites 88
5.19 Typical Monotonic vs. Cyclic Loading Relationship
of High Strength Concrete 88
6.1 Maximum Pull-Out Displacement vs. Average Grain Size
of sand 91
6.2 Comparison of the Proposed Equation with
Normal Concrete Data (T. Cintora [90]) 93
6.3 Comparison of the Proposed Equation with
High Strength Concrete Data (Present Study) 93
6.4 Comparison of the Proposed Equation with
Polymer Concrete Data (Present Study) 94
6.5 Comparison of the Proposed Equation with Normal
Fibrous Concrete Data (Shah et.al . and Naaman et.al .) 94
6.6 Comparison of the Proposed Equation with Normal
Fibrous Concrete Equation (M. Wecharatana [19]) 95
6.7 Comparison of the Proposed Equation with
High Strength Fibrous Concrete (Straight-End Fiber) 95
i x

Figure Page
6.8 Comparison of the Proposed Equation with
High Strength Fibrous Concrete (Hooked-End Fiber) 96
6.9 Normalized Pull-Out Stress vs. Displacement Curves of
Cement-Based Composites from the Proposed Equation 96
6.10 Brittleness Index Model 98
6.11 Typical Peak Strain vs. No. of Loading Cycles
Curve of Superplasticizer Concrete 104
6.12 Typical Peak Strain vs. No. of Loading Cycles
Curve of Microsilica Concrete 104

CHAPTER I
INTRODUCTION
1.1 General
High strength concrete has gradually been developed over many
years. Recently the method of making high strength concrete has been
simplified by the simple addition of microsilica, fly ash, polymer and
other types of additives. This has made production of high strength
concrete less expensive and easier, therefore the applications of high
strength concrete have increased.
Definitions of high strength concrete have been made by many
investigators [1-5]. The definition is generally accepted and adopted
by ACI Committee 363-High Strength Concrete which defined high strength
concrete with specified compressive strength for design of 6,000 psi
(41 MPa) or greater. A typical stress-strain curve of high strength
concrete reported by Shah, et. al. [6] is shown in Fig.1.1. As the use
of high strength concrete increases, the need to clearly understand its
properties is obvious. Some properties of high strength concrete such
as compressive strength (f c ), modulus of elasticity (E c)and modulus of
rupture (fr ) have been investigated and reported recently, many remain
unspecified.
Bond strength between concrete and reinforcing bar and the bond
stress-slip relationship are among the most fundamental properties of
reinforced concrete needed for design. One of the purposes of
understanding bond strength properties of reinforced concrete is to
properly specify the required embedment length of steel and the
concrete cover. Most investigations [7-11] which study the bond-slip
characteristics were mostly conducted on normal reinforced concrete.
None of them is on reinforced high strength cementitious composites.
Although a lot of bond stress-slip tests have been conducted, no
statistically dependable curve has ever been developed because of large
scatter of data. These variations are primarily due to many factors
1
such as concrete mix proportions, consistency of the mix, type of steel
bars, testing machine, method of testing and slippage measurement, etc.
The pull-out stress characteristic of steel fiber in cement matrix
is also an important property of fiber reinforced concrete. It
determines the deformability, strength and toughness of the composite.
The pull-out stress properties of fiber reinforced concrete are
influenced by numerous factors, such as, fiber aspect ratio, strength
and shape of the fibers, fiber length and the mix proportion of the
matrix. Many investigators have studied the pull-out stress-slip
relationship of steel fiber reinforced concrete [12-19]. All of these
studies were on normal fibrous concrete, none of them was on high
strength fibrous concrete. From the pull-out studies of normal fibrous
concrete, Visalvanich and Naaman [17] and Wecharatana and Shah [19]
found an interesting unique normalized stress-pull-out displacement
relationship. This relationship can predict the pull-out stress or the
pull-out displacement of the composite independent of the fiber volume
fraction and aspect ratio (dia./length) in the composite.
Another important material property of high strength concrete that
needs to be investigated is the fatigue characteristic. The process of
progressive and irreversible deterioration in a material subjected to
repetitive stresses is called fatigue. Fatigue is always described by a
parameter termed fatigue life which essentially represents the number
of cycles needed to fail the material under a given repetitive load. It
is generally agreed that the relative magnitude of the stress change
under load is the most important variable that influences fatigue life.
Other factors such as maximum stress level, rate of loading, etc. also
affect the fatigue life. Fatigue properties are essential to the design
of structures under cyclic loading. These structures are railway and
highway bridges, airport pavements, marine structures and mass transit
system. There are three different types of fatigue behavior; cyclic
compression, cyclic tension and reverse loading. Many researchers
[20-35] have studied the fatigue properties of cyclic compression
[20 -27], cyclic tension [28-34] and a few on reversed loading [35].
Most of these studies [20-35] are conducted on normal concrete, the
2

fatigue behavior on high strength concrete has never been cited in the
literature.
It is the objective of this investigation to provide experimental
data on these needed and unavailable material properties such as bond
and fatigue characteristics of high strength cementbased composite.
Empirical modelling of these observed behaviors will also be developed
during the course of this studies.
1.2 Research Significance
The significance of this research can be categorized into seven
different areas as follows :
1. At present high strength concrete is a new and useful material
widely used in many countries. Basic properties such as compressive
strength (fc ), tensile strength, modulus of elasticity (Ec ) and modulus
of rupture (fr ) of high strength concrete have been investigated by
many investigators while some other properties like bond strength of
reinforcing bars, fibers and aggregate in high strength concrete as
well as fatigue characteristics have not yet been studied. For
structures using high strength concrete, these two properties, bond and
fatigue, play an important role in engineering design in defining the
steel embedment length, concrete cover and load factor for fatigue
design. These needed properties will be experimentally observed in this
study.
2. The use of high strength concrete together with refined design
procedures have resulted in slender structures. Thus the bond strength
between reinforcing steel and high strength concrete and the amount of
concrete cover are critical. When the structure is slender, the dead
load represents a smaller part of the total load, thus the fatigue
problem will play an important role in the structure design. As high
strength concrete is more widely used, these properties need to be
clarified.
3

3. Marine structures are frequently subjected to fatigue and
dynamic loadings. Use of high strength impervious polymer concrete and
other high strength cementitious composites is often encountered. There
is a need to understand the fatigue characteristics of these new high
strength materials so that these marine structures can be properly
designed.
4. For a general cementitious composites, there is a brittleness
number which can be used to predict the properties of a cement-based
composites. The more brittle the material is, the lower the value of
the brittleness index. In this study, the brittleness index is proposed
in the general normalized pull-out stress-displacement relationship.
This brittleness index can be used to predict the softening response of
a cementitious composite without conducting the direct tension test.
5. A general, unique normalized post-peak pull-out stress -
displacement equation of the cemented composites is proposed in terms
of the brittleness index as follows:
(1.1)
where :
= Post-peak pull-out stress
= Maximum pull-out stress of the cemented compositeτmax
(Max. post-peak pull-out stress for fibrous conc.)
8 = Post-peak pull-out displacement
= Maximum pull-out displacement of the cementedδmax
composite (Half the fiber length for fibrous
concrete)
m = Brittleness index of the composite
6. The S-N curve of high strength concrete which is one of the
most important properties for fatigue design is investigated. These S-N
curves are used to predict the serviceability of structures.
4

Stress vs. Strain CurveHigh Strength Concrete
Uniaxiol Compression Test Under
Circumferential Strain Control
( 20 Microstrain/Sec )
3X6 in. Cylinder Specimen
( Shah. et.al . [6] )
STRAIN
Fig. 1.1 Stress vs. Strain Curve of High Strength Concrete
7. The Maximum strain concept of high strength cementitious
composite is developed to predict the fatigue life. It is believed that
for any cementitious materials under different loading conditions, the
material can sustain only up to a given magnitude of strain. Beyond
that abrupt failure may occur. Knowing the maximum strain of the
concrete used together with the existing condition, the fatigue life
can then be predicted.
5

CHAPTER II
LITERATURE REVIEW
2.1 High Strength Concrete
High strength concrete has gradually been developed over the past
few decades. As the development continues, the definition of high
strength concrete has changed. In recent years, the applications of
high strength concrete have increased and is presently used in many
countries all over the world.
The definition of high strength concrete was given by many
investigators [1-5]. V.V. Bertero [1] defined the definition of high
strength concrete as concrete with compressive strength higher than
6,000 psi for normal weight concrete and higher than 4,000 psi for
light weight concrete. John Albinger and Jaime Moreno [²] also defined
high strength concrete as concrete with compressive strength between
6,000-11,000 psi for normal weight concrete and from 5,000-8,000 psi
for light weight concrete at 56 days. Merlin D. Copen [3] assumed high
strength concrete to be concrete with compressive strength of 10,000
psi (700 kgf/cm²) or greater at 1 year of age. Saucier [4] classified
high strength concrete into three categories, (1) the present range of
5,000-10,000 psi (35-70 MN/m²), (²) the available range of
10,000-15,000 psi (70-105 MN/m²) and (3) the exotic area of 15,000 psi
(105 MN/m²). These definitions and categories are generally accepted
and have been adopted by ACI Committee 363-High Strength Concrete [5]
which defined high strength concrete as concrete with specified
compressive strength for design of 6,000 psi (41 MPa) or greater.
Many attempts to make and to properly proportion the matrix
compositions and admixtures in order to achieve high strength concrete
by many researchers have been successfully made in recent year [36-43].
Katharine Mather [37] produced high strength concrete by using high
density materials. She used magnetite aggregate and ilmenite aggregate
6

whose unit weight is about 230 lb per cu.ft. instead of normal crushed
limestone aggregate. The compressive strength gained was 9,000 psi at 7
days and 11,000 psi at ²8 days. Cameron Macinnis and Donald V. Thomson
[40] have proposed special technique for achieving high compressive
strength concrete by using high speed slurry mixing, seeding and
revibration together with two addition admixtures (fly ash and
lignosulfonic acid water reducing agent). The compressive strength
gained was in the range of 6,000-11000 psi (4²0-770 ksc.). Another
method to produce high compressive strength concrete is to use ultra
fine cement as studied by Ramnath N. Swamy [41]. By using ultra fine
cement and limestone aggregate with the mix proportion of 1 : 1 : 3
(ultra cement : sand : aggregate) and water/cement = 0.35, the
compressive strength was reported to be 1²,600 psi in ²8 days.
The most common practice for making high strength concrete is the
addition of microsilica, fly ash, and superplasticizer to normal
concrete. These methods were investigated by E.J. Sellevold and F.F.
Radjy [4²], and G. Carette and V.M. Malhotra [43]. They reported that
the efficiency of the microsilica in producing compressive strength was
2 to 4 times greater than cement. Adding 10 % of silicafume with
sufficient water reducing agent to make water/cement ratio equal 0.4²
in the mix, increased concrete strength by 50 %.
Due to the increasing use of high strength concrete, it is
necessary to know the material properties and structural behavior of
high strength concrete. Most basic properties needed for structural
design such as compressive strength (fc ), tensile strength , modulus of
elasticity (Ec ), modulus of rupture (fr
), creep, shrinkage, shear
stress, deflection, porosity and stress-strain curve of high strength
concrete have already been reported in the literatures [44-56], but
some have yet to be thoroughly investigated. The bond strength of steel
and fiber in high strength concrete as well as fatigue characteristics
have not yet been studied.
The mode of failure of high strength concrete is totally different
from normal concrete. Normal concrete will gradually fail after it
7

reaches the peak load while high strength concrete will suddenly
explode at the peak load. Possibly because high strength concrete is
more brittle than normal concrete and the descending part of the
stress-strain curve is very steep. Therefore the descending part of the
stress-strain curve of high strength concrete under uniaxial
compression can not be assertained from a conventional testing system
(except for polymer high strength concrete of which the descending part
can be obtained due to its plasticity). Both the ascending and the
descending parts of the stress-strain curve are very important and
necessary for engineering analysis and design. So far only one report
on the complete stress-strain curve of the high strength concrete by
S.P. Shah, Ulker Gokoz and Farhad Ansari [6] has been cited in the
literature. They conducted the uniaxial compression test on three
specimen sizes; 3x6, 4x8, 3x9 in. (75x150, 100x²00 and 75x²²5 mm) at
two strain rates. Instead of using a highly stiffened testing machine
to get the complete stress-strain curve as mentioned by Hudson, J.
Crouch, S.L., and Fairhust, C. [57], they used a servo-controlled
closed-looped testing machine and controlled the test by
circumferential strain. With this method, they obtained the complete
stress-strain curve as shown in Fig.1.1.
Another type of well known high strength concrete is polymer
concrete. Polymer concrete is a new material which has been developed
over the last few decades. The general properties of polymer concrete
are different from normal concrete and other types of high strength
concrete. Deformations and deflections of polymer concrete under load
are much larger than normal concrete and high strength concrete while
its modulus of elasticity is less. The mode of failure of polymer
concrete is the same as normal concrete but different from high
strength concrete which tends to explode at the peak load.
There are many methods of making polymer concrete. The properties
of polymer concrete differ according to the mix proportion, materials
used, curing condition, ages, etc. So far there is no standard mix
proportion for polymer concrete.
8

Polymer concrete is normally made by adding plastic chemicals such
as monomer and catalyst or hardener to normal concrete. These chemicals
form plastic links binding coarse and fine aggregates together. This
chemical process so-called polymerization creates a stronger bond and
results in a stronger matrix than conventional concrete. Depending on
the amount of polymer added, the strength of polymer concrete is partly
generated from polymerization process and partially from the hydration
process of cement.
Although there are many mix proportions of polymer concrete, the
mechanical properties of these polymer concrete are effected by the
same factors such as temperature, curing condition, type of polymer,
etc. The compressive and flexural strength of dry-cured specimen are
higher than the wet-cured one. Similar improvements are also observed
for sulfate resisting properties as well. The durability and energy
absorption of the dry-cured polymer concrete is higher than for
wet-cured. However, the compressive strength, flexural strength and
modulus of elasticity decreased when the testing temperature increased
as mentioned by M.U. Haddad, D.W. Fowler and D.R. Paul [58] and S.A.
Trondistou-Yannas and S.P.Shah [59].
Applications of polymer concrete so far have been limited to small
projects like pavement and bridge deck repairs and overlays. This is
mainly because polymer concrete is too expensive to be used in
construction projects. The cost of polymer concrete is directly
proportional to the amount of polymer added. In general, the cost of
polymer concrete is ranging between $ 1.50 to $ 2.00 per pound.
In order to expand the applications of polymer concrete,
Wecharatana M. and Lin C.C. [60] studied and developed a new polymer
concrete, especially for marine structures. Many trial mix proportions
were made in order to achieve a high compressive strength, flexural
strength, and chemical resistance at a lesser cost.
Because marine structures are frequently subjected not only to
static load and chemical attack from sulphates and chlorides in the sea
9

water, but also dynamic and fatigue loadings. Therefore in this paper,
an attempt will be made to study the flexural strength as well as
fatigue characteristics of this new polymer concrete.
2.2 Bond Chacteristics
2.2.1 Steel Reinforced Concrete
The bond strength between concrete and the reinforcing steel and
the bond stress-slip relationships are among the most fundamental
problems of steel reinforced concrete. In the past, many researchers
[7-11] investigated the bond-slip characteristic. Most of these
investigations were on normal reinforced concrete. None of them were on
reinforced high strength concrete. Although a lot of bond stress-slip
tests were conducted no statistically dependable curves have been
developed because of large scatter of data. These variations were the
effects of many factors such as concrete mix proportion, consistency of
the mix, steel bar, testing machine, method of testing and slippage
measurement, etc.
The pull-out test, mentioned by Martin [7], Windisch [8] and
recommended by RILEM/CEB/FIP [9], is one of the most simplest
reproducible instructive bond test. In studying the bond performance of
Ribbed Bars with different water cement ratios, consistencies and
grading curves, Martin [7] found that the bond strength of Ribbed Bars
could differ by more than 100 %. The relation between tensile splitting
strength and cube compressive strength was fc,t
= 0.²²² (fcube
)²/3,
whereas the relation between tensile bending strength and compressive
strength was fc,t
= 0.³5 (fcube)²/³. The maximum bond factor (bond
stress/cube strength) was about 0.55 with bond slip between 1-² mm.
From pull-out tests, Windisch [8] found that the loaded end slips
were significantly greater than the slip measured at the unloaded end
of the bond length, primarily in the case of larger diameters (0 16mm)
with greater relative rib areas. The unloaded end slip alone did not
give the proper slip-distribution along the bond length. He also
10

observed that the bond stress-slip diagrams derived from the pull-out
test and the beam test could not be the same, even if all other
influencing factors were similar.
A.D. Edwards and P.J. Yannopoulos (10] studied the bond
stress-slip characteristics in reinforced concrete by using 16 mm.
diameter hot rolled deformed bars and mild steel plain bars with ³² and
²5 mm. concrete cover and 4 times the welbond deformed bar slug spacing
which is ³8 mm. for embedment. Concrete cube strength at 28 days was
6293 psi (4³.4 N/mm²). Two types of test were conducted , one with the
bottom end of the reinforcing bar free, and the other with a constant
back load applied at the bottom end of the bar. He found that maximum
bond stress developed by plain bars (600 psi) was about ³5-50 % of that
of the corresponding deformed bar (1500 psi) and the slips at maximum
stress were 0.01-0.06 mm. for plain bars and 0.10-0.³0 mm. for deformed
bars. The maximum bond stress increased with increasing concrete cover
and the direction of bar pulled to the direction of concrete casting.
He also reported that the maximum bond stress was not significantly
affected by the bar back load.
Saeed M. Mirza and Jules Houde [11] conducted the bond stress-slip
tests on 6² concentric tension specimens with different bar sizes, some
of the specimens were internally instrumented. They observed that the
slip increased linearly with stress in the steel, specimen dimensions
up to a certain size, and the ratio of concrete to steel area (A /A )c s
up to a value of 45 to 60. Concrete strength between ³,000 and 5,000
psi had an insignificant effect on the slip value which averaged
²28.6x10⁻⁴ in. The steel stress at the end face was almost equal to the
free bar stress. From this experiment they proposed the following slip
vs. steel stress equation :
(².1)
where : k 1 , k², k³
are constants. (k²=1)
And the bond stress-slip equation is
1 1

U = 1.95x10⁶d - 2.35x10⁹d²
1.39x10¹²d³³ - 0.33x10¹5d4 (2.2)
where :
U = bond stress
d = local slip
There are also other factors that affect the bond strength of
reinforced concrete, most of which have already been studied. For
example, the effects of high range water reducers on bond strength was
studied by Barie B. Brettman, David Darwin, and Rex C. Donahey [61].
The effects of temperature [62-65], cyclic, impact and sustained
loadings [66-70] have also been investigated.
The effects of cyclic loading was studied by N.M. Hawkin, I.J. Lin
and F.L. Jeang [66]. They conducted tests on ³0 reinforced concrete
blocks with different types and sizes of bars, under monotonic and
cyclic loadings. They observed that the maximum bond stress was
affected by the embedment length, and it increased almost
proportionally to the concrete compressive strength until upto 4900 psi
(³4 N/mm2) for monotonic loading. For cyclic loading, the bond
effectiveness at the maximum capacity is less than for monotonic
loading with the decrease in capacity being greater for fully reversed
cyclic loading than for zero to a maximum cyclic loading. To model the
bond stress-slip of reinforced concrete, they found that it comprised
of ³ steps, i.e., uncracked response stage, internal cracked response
stage and sliding shear response stage. They also proposed the bond
stress-slip equations for both monotonic and cyclic loading.
To analyse the bond stress-slip relationships of reinforced
concrete by finite element method, a special element between steel and
concrete is required. Many investigators have proposed different
approaches about this element. Ngo and Scordeles proposed this element
as the bond-link that had no physical dimensions. Hoshiro and Schafer
gave a continuous connection between two elements by using a linear or
higher-order displacement field. binges modified and gave a more
general version of this element by taking into account normal stresses
12
between concrete and reinforcement. To obtain an accurate model of
bond-stress slip relationship of reinforced concrete, Manfred Keuser
and Gerhard Mehlhorn [71] not only considered these general functions
mentioned above but also local factors such as position of bar during
casting of concrete, direction of casting and slip.
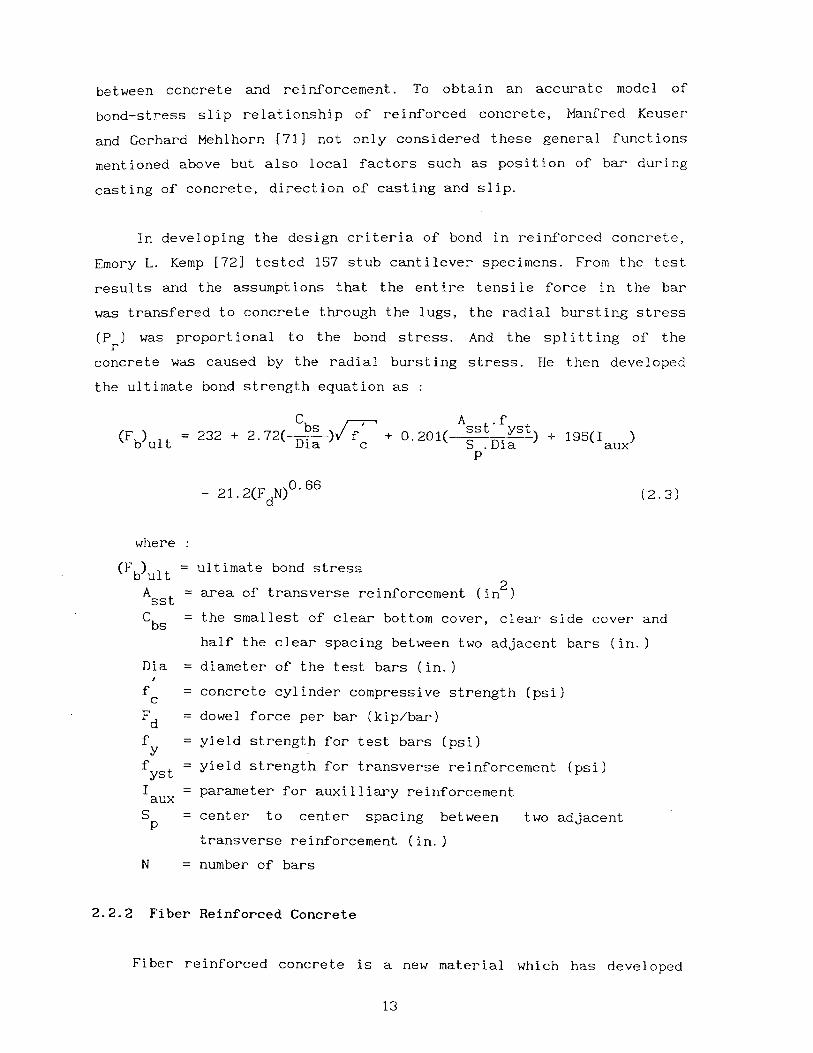
In developing the design criteria of bond in reinforced concrete,
Emory L. Kemp [7²] tested ¹57 stub cantilever specimens. From the test
results and the assumptions that the entire tensile force in the bar
was transfered to concrete through the lugs, the radial bursting stress
(Pr) was proportional to the bond stress. And the splitting of the
concrete was caused by the radial bursting stress. He then developed
the ultimate bond strength equation as :
Cbssst yst)(1 )(F
b)
ault = ²3² + 2.7²( )V f
c + 0.²01( A t .f t
+ 195S .DiaDi aux
²21.2( FdN)0.66 (2.3)
where :
(Fb)ult
= ultimate bond stress
Asst = area of transverse reinforcement (in
²)
Cbs = the smallest of clear bottom cover, clear side cover and
half the clear spacing between two adjacent bars (in.)
Dia = diameter of the test bars (in.)
fc = concrete cylinder compressive strength (psi)
Fd = dowel force per bar (kip/bar)
fy = yield strength for test bars (psi)
fyst = yield strength for transverse reinforcement (psi)
Iaux = parameter for auxilliary reinforcement
Sp = center to center spacing between two adjacent
transverse reinforcement (in.)
N= number of bars
2.2.2 Fiber Reinforced Concrete
Fiber reinforced concrete is a new material which has developed
13

over the past few decades into one of the most useful materials in
civil engineering. The added fibers are generally known to arrest
cracks, increase ductility and energy absorption. Many researchers
[1²-19] have experimentally studied as well as analytically modeled the
pull-out stress-slip relationship of steel fiber reinforced concrete.
Most of these studies only emphasized on normal concrete, none of them
were on high strength concrete. The steel fiber makes up for the
weakness of the concrete under tensile stresses. The stresses at the
interface are transmitted from matrix to the individual fibers or
vice-versa, through the bond at the interface.
The fiber-matrix interfacial bond is one of the basic factors
deciding the deformability, strength and toughness of a composite
material. The bond strength properties of fiber reinforced concrete are
generally influenced by many parameters, such as fiber diameter,
strength and shape of the fibers, fiber length, aspect ratio, the mix
proportions, curing conditions, age of the specimens and etc. [¹² - 17).
A.E. Naaman and S.P. Shah [1²] studied the pull-out behavior of
steel fiber reinforced concrete with different inclination of fibers,
the loading condition, the number of fibers, and the efficiency of the
random orientation. They conducted three series of pull-out tests using
different fiber diameters of 0.016 in. (0.4 mm.), 0.01 in. (0.²5 mm.),
and 0.006 in. (0.¹5 mm.). Each pull-out test consisted of pulling out
two fibers symmetrically oriented with respected to the loading
direction at angles of orientation of 0, ¹5, 30, 45, 60, 75 degrees.
The fibers had a smooth surface and the embedment length was set for
0.5 in. (13 mm.). The fibers with the diameter of 0.01 in. was a brass
coated surface while the other two were high strength music wires. They
found that the bond efficiency of inclined fibers was essentially the
same or better than that of parallel fibers. The final load (the load
prior to the complete pull-out test) was zero for the parallel fibers
while the final load for the inclined fibers increased with the angle
of inclination and could be as high as the corresponding peak load. The
final pull-out distance was equal to the embedment length for the
parallel fibers while it might be less than the embedment length for
14

the inclined fibers. The work required to completely pull-out an
inclined fiber was higher than that for a parallel fiber. The final
pull-out load was zero for parallel fibers while for inclined fibers,
the final load increased with the increasing angle of orientation. No
significant effect on the peak pull-out load or the final pull-out
distance was observed for an increase in number of fibers from 2 sq
in.- 36 sq in. when fibers aligned parallel to the direction of
loading. But for the inclined fibers, the peak pull-out load, the final
load, the final pull-out distance and the total pull-out work decreased
with an increasing number of fibers. The efficiency ratio, defined as
the ratio of modulus of rupture of the randomly oriented fibers to that
of parallel fibers decreased when the volume fraction of fibers
increased.
The bond strength properties due to the effect of vibration, shape
of fibers, strength of the matrix and the fiber volume fraction were
studied by A. Burakiewiez [13]. Be used mortar with water/cement ratio
of 0.55, hooked end (00.4x30 mm.) and round straight fibers (00.38x²5
and 00.30x25 mm.). He conducted the pull-out tests on a single fiber as
well as groups of fibers embeded in the matrix. Be observed that the
shape of the load-displacement curve depended on the fiber type. The
pull-out of hooked end indented fibers required more energy than plain
fibers. The bond strength increased with the strength of the matrix and
the fiber volume content in the matrix which was different from Naaman
and Shah [1²]. He also concluded that there was no significant
influence on the bond strength due to the vibration and orientation of
fibers during setting and hardening of the matrix.
To develop the bond stress of steel fiber reinforced matrix, D.J.
Pinchin and D. Tabor [14] tested cylinder specimens of 3.4² cm.
diameter and 3.05 cm. in length with a centrally embedded wire while
applying a radial compressive force on a specimen. The wire was loaded
with no pressure applied to the specimen until debonding. Pressure was
applied either immediately subsequent to the debonding of the embedded
wire or after a cross head movement of 1.00 mm. The pressure was
applied in 4 stages , 7.5, 14.5, ²1.5, and ²8.5 N/mm² From this tests,
¹5

they observed that the radial compressive force produced an increase in
fiber-matrix contact pressure and fractional stress transfer. The
compaction of the concrete near the wire would increase the frictional
bond. The pull-out load increased linearly with the confinement. The
pull-out load in the wire was found to be relative to the geometry and
material properties of the specimen and also to the wire-matrix misfit.
The wire-matrix misfit was the difference between the radius of the
wire and the radius of the hole in the matrix in the absence of wire.
This misfit, he said, could be produced by shrinkage of the matrix or
an applied pressure on the specimen.
R.J. Gray and C.D. Johnson [¹5] studied the interfacial bond
strength in steel-reinforced cementitious composites by pulling a
single concentric fiber from a block of matrix immersed in water. They
found that the direction of casting affected the bond strength.
Horizontally cast specimens developed lower bond strength than
vertically cast specimens. The average interfacial bond strength
increased slightly with an increase in the rate the fiber is withdrawn.
An increase in the sand cement ratio of the mortar matrix has
contrasting effects on the strength of the interfacial bond in both
vertically and horizontally cast specimens. The interfacial bond
strength decreased for the vertically cast specimens while it increased
for the horizontally cast specimens.
Magne Maage [16] observed that the bond properties between steel
fibers and cement based matrices were of a mechanical nature where the
anchoring effect was more important than the adhesive effect. He also
stated that the mean pull-out load per fiber was unaffected by the
number of fibers, which is in agreement with similar tests reported by
A. E. Naaman and S. P. Shah [12].
The fracture characteristics of steel fiber reinforced
cementitious composites was investigated by K. Visalvanich and A.E.
Naaman [17]. They conducted tests on the 32 double cantilever beam
specimens and 80 tensile prisms of fiber reinforced mortar, concrete
and asbestos cement. Straight cut, brass-coated steel fibers were used
16

with three different lengths of 0.25, 0.50 and 0.75 in. and the
corresponding aspect ratio (length/diameter) of 42, 83 and 47. Three
different volume fractions of fibers of 0.5, 1.0 and ².0 % were used to
study the effect of fiber content. By conducting direct tensile test,
they found that the maximum post cracking stress of steel fiber
reinforced mortar could be expressed in terms of the fiber reinforcing
index (Vf1/ø) as σ = ατVf1/ø. From this analytical relationship, they
proposed the normalized T-8 law which is independent of the steel
volume fraction, aspect ratio, and length of the steel fiber in the
polynomial form as :
(².4)
ατVf(1/ø)
where :
T = post-cracking stress
= displacement
τ = interfacial bond strength
a = efficiency factor (at = 660 psi)
1 = fiber length
Vf = percent fiber volume fraction of cement
= fiber diameter
Whereas the proposed normalized T-8 law for plain concrete is
(².5)
where :
T = maximum post-cracking stress
8 = maximum displacement (half fiber length)
These two equations can predict any stress-displacement response
of fiber reinforced mortar and plain concrete under uniaxial tension.
17

Base on these T-5 laws, they proposed the fracture energy of the
steel fiber reinforced mortar as
where :
2Gc
= 0.171ατV I
Ga = energy per unit crack extension during the slow
crack growth process
Gc = steady state fracture energy
Vellore S. Gopalaratnum and S.P. Shah [18] studied and proposed a
theoretical model for the stress distribution in fiber reinforced
concrete. They conducted experiments with several mixes of concrete,
mortar and paste. Fiber reinforced mortar with 3/16 in. (5.0 mm.)
maximum aggregate size and three fiber volume fractions of 0.5, 1.0 and
1.5 % were selected. Smooth brass-coated steel fibers of 1.0 in. long
and 0.016 in. diameter (25x0.44 mm.) with the aspect ratio of 62.5 were
used. The tension specimen were 3 in. wide (76 mm.), 12 in. long (305
mm.) and 3/4 in. (19 mm.) thick. The direct tension test were conducted
with the loading rate of 1 µstrain/sec. and tested up to a maximum
displacement of 7,000 µin (178pm).
Concrete, mortar and paste specimens exhibited linear elastic
behavior up to about 50 % of their tensile strengths. Increase in
composite strength was linearly related to the fiber content. Fibrous
composites absorbed 500 % more fracture energy than a plain concrete
matrix.
By the assumptions that all nonlinearities in the composite
occurred along two localized zones of cracking, namely interfacial
debonding process and transverse matrix crack, the fiber and the matrix
behaved elastically and the interface transfered the load through the
matrix without yielding or slip, they proposed the theoretical model to
predict the load on fibers under pull-out condition as :
18

P (2.7)
and the fiber slip A as :
(2.8)
The proposed effective crack width, w was
(2.9)
and the matrix stress could be determined from :
= o (1-NAf
) PN (2.10)
This theoretical model gave favorite results when compared with
the experimental data.
M. Wecharatana and S.P. Shah [19] studied the fracture toughness
of fiber reinforced concrete and proposed a theoretical model based on
the concept of nonlinear fracture mechanics to predict resistance
provided by the fiber against the fracture of matrix. The matrix
mix-proportion used in their study was 1 : 2 : 0.5 (cement:sand:water).
Straight cut brass coated steel fiber with specific gravity of 490
lb/ft3
were used. Three different volume fraction of fibers, 0.5, 1.0
and 2.0 % were selected. Two different sizes of fibers, 0.25 in. long
with 0.006 in. diameter and 0.75 in. long with 0.016 in. diameter were
used. With the assumption that the maximum post-cracking strength
19

occurs at the end of the matrix process zone or the beginning of the
fiber bridging zone, and smoothly decreases to zero as the crack
surfaces displacement reaches half of the fiber length, they proposed
the normalized stress-displacement relationships as :
(2.11)
where :
is the post cracking strength
is the maximum post-cracking strengthmax
is the post-peak pull-out displacement
7)max
is the maximum pull-out displacement of fibers
They also proposed stress-displacement relationship for other
types of fiber reinforced composites as :
(2.12)
Where m and n are constants which depend on the type and the
pull-out behavior of fiber. This proposed equation is matched very well
with the experiment data reported by other researchers (S.P. Shah, A.E.
Naaman and K. Visavanich).
To analyse the theoretical model of bond at the interface between
steel fibers and cementitious composites, George Nammur Jr. and A.E.
Naaman [73] assumed that the fibers are aligned squarely within the
specimen. Each individual fiber along with its share of matrix acts and
behaves independently of other fibers and the rest of the matrix body.
They also assumed that the bond slip relationship is a material
property (location independent). In the pre-cracking stage, the
maximum shear stress occurred at both ends of the fibers when the
20
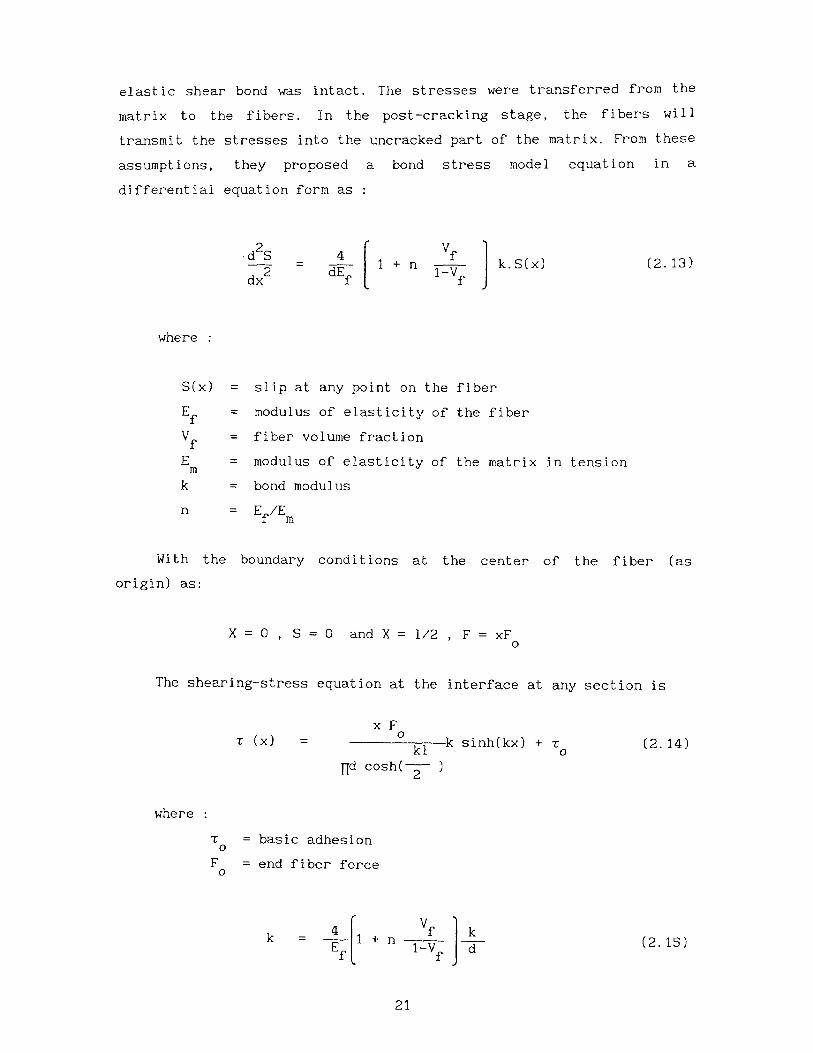
elastic shear bond was intact. The stresses were transferred from the
matrix to the fibers. In the post-cracking stage, the fibers will
transmit the stresses into the uncracked part of the matrix. From these
assumptions, they proposed a bond stress model equation in a
differential equation form as :
(2.13)
where :
S(x) = slip at any point on the fiber
Ef = modulus of elasticity of the fiber
Vf
= fiber volume fraction
Em
= modulus of elasticity of the matrix in tension
k = bond modulus
n = E/Efm
With the boundary conditions at the center of the fiber (as
origin) as:
The shearing-stress equation at the interface at any section is
(2.14)
where :
basic adhesion
end fiber force
21

This equation is valid if the bond stress does not exceed the bond
capacity of the interface. The equation can predict the bond shear
stresses at the interface, as well as the normal tensile stress in the
fibers and the matrix.
All these bond strength properties, both for reinforced concrete
and fibrous concrete reported were on normal concrete. For high
strength concrete no investigations have yet been made.
2.3 Fatigue Characteristics
Fatigue characteristics is one of the most important properties of
concrete. Much of our present knowledge of the fatigue of concrete in
compression is derived from test performed over fifty years ago. Most
of these test were on normal concrete, very few were on high strength
concrete. Fatigue strength basically depends on the range of cycle
stress, maximum stress level, rate of loading, mix-proportion, etc.
Van Ornum [74-75] was the first researcher to study fatigue of
concrete. From his experiment, he observed that brittle engineering
materials, of which cement mixtures were a fair type, possesed the
properties of progressive failure or gradual fracture which became
complete under the repetition of load well within the ultimate strength
of the material. He also stated that the stress-strain curve varied
with the number of load repetitions. The convex upward curve gradually
straightened under repeated load and finally became concave upward near
failure. A similar reduction in modulus of elasticity of concrete was
observed. Also introduced in his study was the S-N curve. These
conclusions were later confirmed by other researcher [76]. Mehmel found
that elastic strain and remaining strain (permanent deformation)
increased with the number of repetitions as long as a certain critical
stress (endurance limit) was not exceed and that the ratio (remaining
strain/elastic strain) grew larger with the number of cycle. Heim
indicated that the remaining deformation was greater than elastic
deformation after a period of repetitive loading and the remaining
deformation did not become constant even after 1,000,000 cycle. Yoshida
22

TABLE II.1 FATIGUE LOAD SPECTRUM
LOW CYCLE FATIGUE HIGH CYCLE FATIGUESUPER HIGH
CYCLE FATIGUE
Structures
Subjected
to Earthquake
Airport
Pavements
and Bridges
Highway and
Railway Bridge,
Highway Pavement
Concrete
Railroad Ties
Rapid
Mass
Transit
Struct-
ures
Sea
Struct-
ures
Number of Cycles
examined the change in Poisson's ratio,µ, with repeated loads. He found
that if m = 1/4, m was about 7-8 after 140,000 cycle and increases to
11-12 in the stage close to failure.
The range of cyclic loading is different according to the type of
structure, for example railroad bridge, highway bridge, airport
pavement, sea structures, mass rapid transit system, etc. T.C. Hsu [77]
has classified the range of cyclic loading into a spectrum of cycles;
low-cycle fatigue, high-cycle fatigue and super-high-cycle fatigue as
shown in Table II.1.
Fatigue of concrete has been studied and mostly directed toward
the compression, flexure, tension, and reverse loading which is
reviewed as follows.
2.3.1 Cyclic Compression
The effect of the minimum stress and the stress range on the
fatigue strength was first determined by Graf and Brenner [20]. They
23

established a Modified Goodman Diagram for the repeated compressive
loading. Both maximum stress and minimum stress level are expressed in
terms of the percentage of the static strength. The fatigue failure is
based on 2 million cycles of loading.
Aas-Jakobsen [21] studied the effect of the minimum stress (f min ).
From Modified Goodman Diagram, he observed that the relationship
between fmax
/fc and f /f was linear for fatigue failure at 2 million
min ccycles of loads. Thus the relationship between f max/fc and R (stress
range) was also linear. With these properties, he derived a general
f-N-R relationship as shown below :
fmax = 1 - β(1-R)logN (2.16)
fc
where :
(3 = slope of the f-N curve when R = 0 ((3 = 0.064)
R = stress range (f /f )min max
This equation is valid only for 0 s R 1.
Ralejs Tepfers and Thomas Kutti [22] studied the fatigue strength
of plain, ordinary and lightweight concrete by experiment and their
results were then compared with the equation proposed by Aas-Jakobsen
[21]. Base on their test data, they found that (3 = 0.0679 for ordinary
concrete and (3 0.0694 for lightweight concrete when R < 0.8. But they
recommended use of the mean value of which was equal to 0.0685, for
estimating the fatigue life for both ordinary and lightweight concrete.
By comparing the Wöhler curves, they observed that the different
strength of concrete had no effect on the fatigue results when they
were set out in nondimensional form as the ratio frmax
/fr. This
equation is not only valid for compression but for tension as well.
Although Tepfers and Kutti's equation is widely accepted, it has
two limitations as pointed out by T.C. Hsu [77]. First, when R = 1, the
24

equation becomes f /f = 1 and f equals to a constant which ismax c max
not correct. This is because when R approaches unity, a repeated load
approaches a sustained load which is time dependent as mentioned by
Rusch [23]. The long time strength may approaches 75 percent of the
short time static strength of concrete if tested under the ASTM loading
rate. Second, the equation does not include the rate of loading as
variable. This equation was developed for the range of high-cycle
fatigue for which the effect of strain rate is small as observed by
many investigators [20, 24-26]. But for low-cycle fatigue, the effect
of strain rate was found to be very significant [26-28]. Therefore Hsu
introduced the element of time (T) into the f-N-R-relationship, where T
is the period of the repetitive loads expressed in sec/cycle. He
proposed two equations, one for high-cycle fatigue and the other for
low-cycle fatigue.
For high-cycle fatigue :
fmax - 1-0.0662(1-0.556R)logN-0.0294logT (2.17)fc
For low-cycle fatigue :
fmax
= 1.20-0.2R-0.133(1 -0.779R)logN-0.0530(1-0.445R)logT (2.18)f
These two equations are valid for :
1. Normal weight concrete with fc
< 8000 psi.
2. When stress range value (R) is between 0 and 1
3. Frequency from 0 - ¹50 cycle/sec
4 Number of cycle from 1 - 20 million cycles
5. Compression and flexure test
2.3.2 Cyclic Tension
The tensile fatigue of concrete has not been widely studied. One
reason is the difficulties in applying the direct tensile load to the
specimen and holding the specimens in such a way that avoids
25

eccentricity of loading. Thus most of the fatigue test in tension were
conducted by indirect tension tests such as splitting test or flexure
test. But these indirect tension tests gave some problems as mentioned
by M. Saito and S. Imai [28].
For direct tension fatigue test, M. Saito and S. Imai [28] used
friction grip to conduct the test on 2.8x2.8x29 in. (7x7x74 cm)
prismatic specimens with enlarged ends. Sinusoidal pulsating loads were
applied to the specimens at a constant speed of 240 cpm.
(cycles/minute). Maximum stress levels varied from 75 to 87.5 % of
static strength while minimum stress level maintained at 8 %. The ratio
of minimum to maximum stress (R) was in the range of 0.09 to 0.11. The
surfaces of all specimens were coated with parafin wax to prevent
drying during fatigue test. From the test, they proposed the S-N
relationship for a 50 % probability of failure as :
S = 98.73-4.12logN (2.19)
Where :
S - Maximum applied stress level (percent of fc )
N - Number of cycle to failure
According to their equation, the fatigue strength for 2 million
cycles under direct tensile loading was 72.8 % of the static strength.
This fatigue strength was considerably higher than fatigue strength
under indirect tension test and compression test. They also observed
that plain concrete exhibited no fatigue limit in tensile fatigue at
less than 2 million cycles.
For indirect tensile fatigue test, Ralejs Tepfers [29] performed
splitting fatigue tests on 6 in. (¹5 cm) cubes specimen. Two types of
concrete with ultimate strength of 5,900 psi and 8,200 psi were used in
this study. The maximum stress range (R = fmin
/fmax
) of 0.20, 0.30 and
0.40 were selected. He observed that the same fatigue strength equation
for compression which is :
26

(2.20)
can also be used to determine the number of load pulse to fatigue
failure for tension. He also found that the concrete strength had no
effect on fatigue strength when they were set out in nondimensional
form as the ratio of frmax
/fc
.
Tepfers, Garlin and Samuelsson [30] observed that there was no
differents in the fatigue stress levels on normal concrete and
lightweight concrete. And the same fatigue strength equation for
compression colud also be used for splitting tensile fatigue on normal
and lightweight concrete.
For the flexure test, W. Murdock and Clyde E. Kesler [31],
conducted an experiments on beam 6x6x60 in. The specimen was loaded at
the third points in order to avoid shear stress at the middle span.
Three different stress ranges R (R = f min/fax
) of 0.25, 0.5 and 0.75
were used for this test. From this test, they observed that there was
no fatigue limit for plain concrete made with sand and aggregate
subjected to repeated flexure loading of at least 10 million
repetitions of stress. The results agreed very well with Kesler [25]
and H.A. Williams [32] but disagreed with thosed reported by Clemmer
[33]. Kesler [25] found no fatigue limit but established fatigue
strength at 10 million repetitions of stress ranging from a small value
in tension to some maximum value. The fatigue limits were approximately
62 % of the static ultimate flexural strength. Williams [32] found that
for lightweight aggregate beams, there was no fatigue limit. But
Clemmer's [33] results indicated that the fatigue limit for plain
concrete was 55 % of the static ultimate flexural strength. Murdock and
Kesler also found that the stress ranges have a significant influence
on the fatigue strength. They proposed a fatigue strength equation in
terms of stress range at ten million cycles as :
F10
= 0.56+0.44M or F10 = 1.3/(2.3-R) (2.21)
27

for value of M and R between 0 and 1
For stress reversal :
(2.22)
To include probability of failure in fatigue analysis, T. John and
Mc. call [34] conducted the test on air-entrained concrete beams
3x3x14.5 in. with natural sand and crush-limestone with maximum size of
3/4 in. They performed the test with the speed of 1,800 cpm until
failure or 20 million cycles with the different maximum flexure stress
which varied from 47-70 % of modulus of rupture. From this test, they
proposed the mathematical model of fatigue strength in terms of stress
range, number of cycle and probability of survival as :
(2.23)
They observed that the S-N curves for concrete did not become
asymptotic to a particular stress level in a range up to 20 million
cycles. The probability of failure at 20 million cycles was slightly
less than one half for concrete tested at a stress level of 50 % of
modulus of rupture.
28

2.3.3 Reverse Loading
There are very few experimental investigations reported on
concrete exposed to cyclic compression-tension stress.
R. Tepfers [35] studied the fatigue of plain concrete subjected to
stress reversals. He conducted experiments on two different types of
samples. One was on transversely compressed cubes with a pulsating
splitting load and the other a concrete prism with axial pulsating
compressive loads and central splitting line loads. He observed that
stress reversal between tension and compression caused a slight
reduction in the fatigue strength of concrete in compression. The
fatigue strength of concrete was obtained from the absolute maximum
static strength ratio and zero minimum stress. But this reduction may
have been due to the difficulties in loading the specimens precisely on
the tensile side of the pulse. Thus he concluded that the fatigue
strength due to stress reversal could be predicted by the fatigue
strength equation which proposed by other investigators [21-22, 29] as:
(2.24)
where :
2.3.4 Factors Affecting Fatigue Characteristics
There are many other factors that affect the fatigue strength of
concrete which have been investigated by many researchers [26, 78-83].
These factors are rate of loading, stress range, stress gradient,
moisture condition, loading waveform, rest period, etc.
29

P.R. Sparks and J.B. Menzies [78] studied the effect of the
loading rate on the static and fatigue strength of plain concrete in
compression by conducting experiments on concrete prisms made with
gravel, limestone and lytag aggregate. The specimens were loaded at a
rate between 10-3
and 10 N/mm²s for static test. For fatigue test, a
triangular wave form was employed with constant loading and unloading.
The rate of loading used in these fatigue tests were 0.5 and 50 N/mm ²s.
The maximum load was between 0.90 fc
and 0.70 fc
whereas the minimum
load was 0.33 fc. They found that the stiffness and the strength for
both static and fatigue of these three types of concrete tested were
enhanced by increases in the rate of application of load. They also
found that the strain in the concrete loaded at the slowest rate was
about ²5 % greater than that loaded at the faster rate, these results
compared favorably with Spooner's work [79]. They concluded that the
relation between the rate of increase of secondary strain per cycle and
the endurance, irrespective of the rate of loading, was linear.
Based on tests of 300 prismatic specimens M.E. Award and H.K.
Hilsdorf [²6] observed that both longitudinal and lateral strain
increased with increasing number of cycles. The strains at failure were
larger with lower applied maximum stress levels or the longer the time
to failure. The effect of frequency of loading was likely to diminish
with decreasing maximum stress level. An increase in the stress rate by
one order of magnitude led to an increase in the number of cycles to
failure by almost one order of magnitude especially for a small stress
range. They also found that damage caused by high repeated loads
depended on both the number of applied cycles and the total time that
concrete had to sustain high stress.
Clyde E. Kesler [²5] studied the effect of speed of testing on 100
concrete beams specimens of two different concrete strength (fc
= 3,600
and 4,600 psi) with three speeds of loading (70, ²30 and 440 cpm). The
results indicated that the speed of testing for this range of
investigation had little or no effect on the fatigue strength. This was
also confirmed by W.H. Gray, J.F. Mc Laughlin and J.D. Antrim [80].
This conclusion was limited to concrete made of round aggregate. He
30

also observed that no specimen failed at a stress less than 55 % of
static strength at 10 million cycles.
axThe stress range R (fc
min /fcmax) of a fatigue test significantly
effects the fatigue strength. The lower the stress range, the shorter
the fatigue life of the specimen is. This has been investigated and
reported by many investigators [²6,31].
The effect of stress gradient on fatigue life of plain concrete
was studied by F.S. Ople Jr., and C.L. Hulsbos [81]. The experiment was
conducted on 4x6x¹² in. prism specimens under repeated compression. The
specimens were tested at the rate of 500 cpm (cycle/minute) with three
different eccentricities (= 0, 1/3 and 1 in.). The tests were performed
until the specimens failed or sustained upto ² million cycles. The
maximum stress level used in this test varied from 65 to 95 % of static
strength while minimum stress kept constant at 10 % of static strength
for all test. When e = 0 (concentricity), the load produced uniform
stress throughout the cross section, and when e > o, the load produced
nonuniform stress. He also observed that the mean S-N curves of both
concentrically loaded and eccentrically loaded samples were parallel
and the slopes of these curves were flat. The fatigue strengths due to
concentrically and eccentrically loads were quite different. The
fatigue strength of nonuniformly stressed specimens was higher than
that of uniformly stressed specimen by about 17 % of static ultimate
strength. They also reported that the fatigue life of both
concentrically and eccentrically loaded samples was highly sensitive to
small changes in maximum stress levels. A change in stress of about
5-75 % could cause the fatigue change from 40,000 to 1,000,000 cycles.
K.D. Raithby and J.W. Galloway [8²] studied the effects of
moisture condition, age and rate of loading on fatigue of plain
concrete. They conducted an experiment on 10²x10²x510 mm beams with
third-point loading. A sinusoidal load was applied to the specimen with
the frequency between ²0 Hz and 4 Hz. He observed that the moisture
condition significantly affected both modulus of rupture and fatigue
performance in a consistent pattern. Oven-dried specimens showed the
31
longest fatigue life while the partially dried specimen gave the
shortest and the fully saturated specimen exhibited intermediate
fatigue life. This difference in fatigue performance was probably due
to different strain generated by moisture gradient within the
specimens. They also found that the fatigue endurance increased with
the age of the specimens, the type of concrete and the stress range.
The mean fatigue life of 2 years old beams was 2000 times the fatigue
life of beams at 4 weeks old.
Based on 185 6x6x60 in. plain concrete beam specimens, H.K.
Hilsdorf and C.E. Kesler [83] investigated the fatigue strength of
concrete under varying flexure stresses. The specimens were loaded at
one-third points of 60 in. span with the rate of 450 cpm. The ratio of
the minimum to the maximum load was 0.17. The specimens were loaded
until failed or reaching one million cycles with 5 different rest
periods of 1, 5, 10, ²0 and 27 minutes. The results indicated that a
periodic rest period increased the fatigue strength for a specified
fatigue life and it became more pronounce when the length of rest
period increased up to 5 minutes. From 5-²7 minutes of rest period, the
fatigue strength did not further increase. Hilsdorf and Kesler also
studied the fatigue strength varying the maximum stress level. Two
different types of maximum stress were selected. In the first, the
maximum stress level was changed only once during the test, while in
the second study, the maximum stress level was changed periodically.
They found that the fatigue strength and life of concrete was
influenced by the sequence in which these loads were applied. The
fatigue life of the specimens in which the maximum stress level was
changed only once in the test was linear if the higher stress level had
been applied first. For the specimens in which the upper stress level
was varied between two values continuously while the lower value was
kept constant, the fatigue life would decrease with an increasing
magnitude of the higher stress level.
S.S. Takhar, I.J. Jordaan and B.R. Gamble [84] investigated the
fatigue behavior of concrete under lateral confining pressure. 96
cylinders were tested with three different confining pressures of 0,
3²

1000 and ²000 psi under a sinusoidal load at a rate of 60 cpm. The
maximum axial fatigue loadings used in this study were 80, 85 and 90
percent of the corresponding static ultimate compressive strength while
the minimum stress level was kept constant at 0.² f c . From this test
they observed that the confining pressure significantly affected the
S-N curve of the specimens and it prolonged the fatigue life. The
effect of the lateral confining pressure was dependent on the maximum
stress level of the fatigue load. For a maximum stress level of 0.90
fc, the difference in fatigue behavior with or without the lateral
confining pressure was not significant while for a maximum stress level
of 0.8 fc, the difference was quite pronounce.
R. Tepfers, J. Gorlin and T. Samuelsson [85] studied the effect on
the fatigue strength due to different loading waveforms. Three
different waveforms, sinusoidal, triangular and rectangular were used
in this study. Their experiment concluded that the triangular waveform
was less damaging than the sinusoidal, while the rectangular waveform
did the most damage and gave the shortest fatigue life. This might be
because of different waveforms caused different rates of loading. Thus
they recommended to use triangular waveform on fatigue test for the
earthquake design in which the effect of loading rate is an important
factor.
2.3.5 Fatigue on High Strength Concrete
Very few investigators have studied fatigue properties on high
strength concrete. W.H. Gray, J.F. Mc Laughlin and J.D. Antrim [80]
studied the fatigue properties of high strength lightweight aggregate
by repeated compression on ¹50 3x6 in. cylinders. Different maximum
stress levels of 40, 50, 60, 70, and 80 % of static compressive
strength and minimum stress level of 70 and 170 psi were selected. Two
speeds of testing, 500 cpm and 1,000 cpm were used to study the effect
of rate of loading. All specimens, after ²8 days of water curing, were
placed in an oven for 4 to 5 days to prevent further hydration during
fatigue test. The test results indicated that there was no difference
in the fatigue properties between low strength and high strength
33

lightweight concrete and normal concrete. The rate of loading between
500-1000 cpm. had no effect on the fatigue properties. They also found
that there was no fatigue limit up to 10 million repetitions of
loading.
E.W. Bennett and S.E. St. J. Muir [86] conducted an experiment
under repeated compression load on 8x3x3 in. prism specimen with four
different capping methods. The compressive strength was between
6000-8500 psi. The specimens were loaded at the rates of ²40 and 480
cpm. with maximum stress level starting from 80 % of the static prism
strength and gradually reduced to the limit that specimens could resist
up to 1 million cycles. The minimum stress level was kept constant at 5
tons or 1²50 psi for all tests. The test concluded that
high-alumina-cement compound gave the highest ratio of prism strength
to cube strength. The mean fatigue strength was 67 % of static cube
strength or 60 % when the minimum stress level was zero which was
almost the same as normal concrete. The elastic strain (immediately
recoverable on removal of the load) became stable after 300,000
repetitions. Both the elastic strain and the remaining strain were
linearly proportional to the upper limit of the maximum stress level of
loading for both strengths of concrete except for the remaining strain
which was less for high strength concrete after one million repetitions
of loading. Therefore the relationship between upper limit of
fluctuating stress and the remaining strain was probably not linear for
lower stress level. Rest periods were also found to have an influence
upon the value of the remaining strain. A recover of 50 % of the
remaining strain was observed during the rest period of ²4 hr. after
190,000 repetitions of load in one test. In another test the recover of
7 % was found in a rest period of 5 days after 3,400,000 loadings at 66
% maximum stress level.
High strength concrete is now generally accepted and used in
practice. The strength of concrete used is up to ¹5,000 psi. But most
structures which used high strength concrete are not only subjected to
static loads but also to fatigue loads. These structures are high rise
building, bridge, pavements, marine structures. Since the fatigue
34

behavior plays an important role in the analysis and design of these
structures, thus fatigue characteristics of high strength concrete need
further investigation.
35

CHAPTER III
OBJECTIVE AND SCOPE OF WORK
3.1 Objective
Recently, due to the widely use of different high strength cement
based composites in engineering construction, it has become necessary
to better understand their properties. Many researchers have
investigated the basic properties such as compressive strength (f c ),
tensile strength and modulus of elasticity (Ec). Other properties such
as bond and fatigue characteristics of high strength cement-based
composites are unaccounted for. In this study, attempts were made to
investigate these properties of high strength cement-based composite
which can be divided into two major aspects; experimental program and
empirical modelling. Three different types of high strength
cement-based composites, superplasticizer concrete, microsilica
concrete and polymer concrete and one type of normal concrete are used
in this study. About 440 specimens were tested in this study.
3.1.1 Experimental Program
The experimental program can be divided into 5 different tests,
compression test (3x6 in. cylinder specimen), direct tension test
(dog-bone specimen), indirect tension test (beam), bond strength test
(tapered and cubed specimens) and fatigue test (3x6 in. cylinder
specimen). All tests were conducted in a MTS hydraulic closed-loop
testing system as shown in Fig.3.1. All specimens were cured in water
at least 56 days before testing with the exception of polymer concrete
specimen which were cured in the air for 3 days prior to testing. All
cylinder specimens were capped with sulphur based-capping compound
before testing. The brief scheme of work on both experimental and
modelling is shown in CHART I.
36

loadstrain
controllerload
sirenstroke
LVDT.—
actuator
/ load cell1 II
cross head hydraulicpower supply data
acquisition
xy-plotter
4„2 extensometersII
dog bone specimen11 (1x1x8)
MTS.
personalcomputer
• strain controlled
servo controlled closed-loop system
Fig.3.1 Direct Tension, Dog-Bone Spec.
37

Hig
h S
tren
gth
Con
c,B
ond
Cha
ract
eris
tics
Fat
igue
Cha
ract
eris
tics
BO
ND
AN
D F
AT
IGU
E C
HA
RA
CT
ER
IST
ICS
OF
HIG
H S
TR
EN
GT
H C
EM
EN
T B
AS
ED
CO
MP
OS
ITE
S
3 typ
es
of h
igh
str
en
gth
co
nc.
•superp
lasticiz
er
conc.
(f -
7600 p
si)
•m
icro
silic
a c
onc.
(f -
12000 p
si)
•poly
mer
conc.
(f -
9000 p
si)
•150 s
pecim
ens
Obj
ectiv
e :
•stu
dy s
tress-s
train
rela
tionsh
ip
•flexura
l str
ess-d
ef.
rela
tionsh
ip
•m
odulu
s o
f ela
sticity(E
)
•m
odulu
s o
f ru
ptu
re(f
)
3 t
ype
s o
f b
on
d s
tre
ng
th
•bond o
f re
in, hig
h s
trength
conc.(
bars
#3,#
4,#
6)
bond o
f ste
el fiber
hig
h
str
ength
conc.
(hooked &
str
aig
hte
d e
nd)
•aggre
gate
matr
ix
Inte
rfacia
l bond
•90 s
pecim
ens
Obl
ectiv
e
•stu
dy b
ond-s
lip r
ela
tion-
ship
of
bars
, fibers
and
aggre
gate
matr
ix in h
igh
str
ength
conc.
•analy
sis
and m
odellin
g o
f
bond-s
lip c
hara
cte
ristics
3 d
iffe
ren
t e
ffe
cts o
n
fatig
ue
str
en
gth
•eff
ect
of
maxim
um
stre
ss level
•eff
ect
of
rate
of
loadin
g
•120 s
pecim
ens
Obj
ectiv
e :
•stu
dy f
atigue s
trength
of
diffe
rent
hig
h s
trength
cem
ent
base
d c
om
posi
tes
•S
N c
urv
e
•analy
sis
and m
odellin
g
of
fatigue c
hara
cte
ristics

3.1.1.1. Compression Test
About 120 of 3x6 in. cylinder specimens were tested in uniaxial
compression under the closed-loop strain control. The objectives of
these tests were as follows :
1. To study the stress-strain relationship and the modulus of
elasticity of these three different high strength cement-based
composites.
2. To differentiate the type of high strength concrete.
3. To use the results of the compression test to predetermine the
maximum and minimum strength for the fatigue test.
4. To determine the bond factor of the bond strength in reinforced
high strength cement-based composite.
3.1.1.2 Tension Test
The lx3x12 in. tapered specimens (Fig.3.2) and the 1x1x9 in
dog-bone specimens (Fig.3.3) of high strength cement-based composites
were tested under NTS closed-loop strain control. The objectives of
these tests were :
1. To study the post peak stress-displacement relationship of high
strength cementitious matrices.
2. To evaluate the tensile strength of a high strength matrix and
compare with normal concrete.
3. To observe the effect of the specimen size on the tensile
strength of high strength cement-based composite.
Also six standard 3x6 in. cylinder specimens of polymer concrete
were tested in split tension in order to find the tensile stress of the
matrix.
39

Fig. 3.2 Tapered Specimen
Fig. 3.3 Dog-Bone Specimen
4 0

3.1.1.3 Beam Test
Five different sizes of microsilica beams 1x2x12, 2x4x12, 2x5x24,
4x6x30, and 6x6x30 in. and two sizes of polymer beams 1x2x12 and 2x4x12¹²
in. were tested under the closed-loop strain control (deflection
control). The objectives of these tests were :
1. To obtain the flexural strength - deflection relationship of
different high strength cement-based composites.
2. To evaluate the modulus of rupture (f r) of high strength
concrete and compare with normal concrete.
3.1.1.4 Bond Strength Test
The bond strength test in this study is divided into 2 areas, bond
strength of reinforced high strength concrete and pull-out stress of
high strength fibrous concrete.
Bond strength of Reinforced High Strength Concrete
Three different deformed bar sizes, #3, #4, and #6 were reinforced
in a high strength concrete cubes of 5x5x5, 5x5x5, and 8x8x8 in.
respectively. The pull-out tests were conducted under the closed-loop
displacement control. The purposes of these tests were as follow :
1. To study the bond-slip relationship of high strength concrete
and compare with normal concrete.
2. To observe the bond strength of the matrix due to different
sizes of deformed bars.
3. To determine the proper embedment length of reinforcing bar in
high strength concrete structures.
Pull-Out Stress of High Strength Fibrous Concrete
Two types of steel fibers, one with hooked-end and the other
straight were selected to study the high strength fibrous concrete.
41
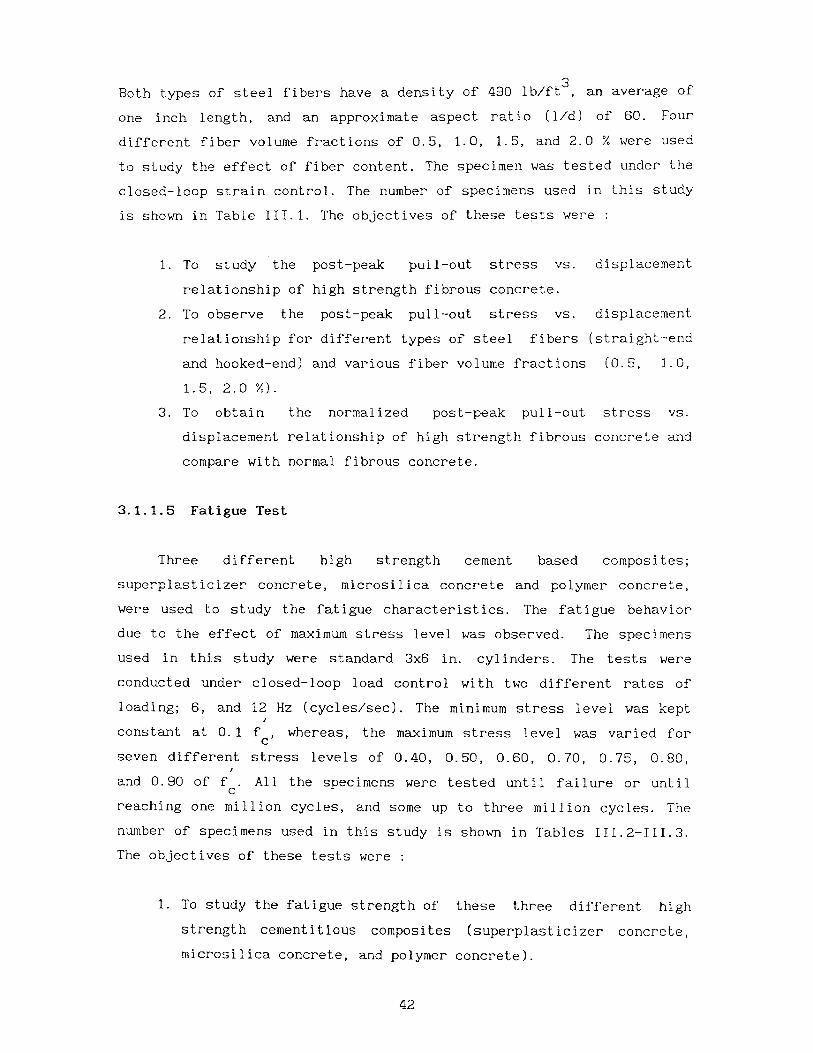
Both types of steel fibers have a density of 490 lb/ft3, an average of
one inch length, and an approximate aspect ratio (l/d) of 60. Four
different fiber volume fractions of 0.5, 1.0, 1.5, and 2.0 % were used
to study the effect of fiber content. The specimen was tested under the
closed-loop strain control. The number of specimens used in this study
is shown in Table III.1. The objectives of these tests were :
1. To study the post-peak pull-out stress vs. displacement
relationship of high strength fibrous concrete.
2. To observe the post-peak pull-out stress vs. displacement
relationship for different types of steel fibers (straight-end
and hooked-end) and various fiber volume fractions (0.5, 1.0,
1.5, 2.0 %).
3. To obtain the normalized post-peak pull-out stress vs.
displacement relationship of high strength fibrous concrete and
compare with normal fibrous concrete.
3.1.1.5 Fatigue Test
Three different high strength cement based composites;
superplasticizer concrete, microsilica concrete and polymer concrete,
were used to study the fatigue characteristics. The fatigue behavior
due to the effect of maximum stress level was observed. The specimens
used in this study were standard 3x6 in. cylinders. The tests were
conducted under closed-loop load control with two different rates of
loading; 6, and 12 Hz (cycles/sec). The minimum stress level was kept
constant at 0.1 fc, whereas, the maximum stress level was varied for
seven different stress levels of 0.40, 0.50, 0.60, 0.70, 0.75, 0.80,
and 0.90 of fc . All the specimens were tested until failure or until
reaching one million cycles, and some up to three million cycles. The
number of specimens used in this study is shown in Tables 111.2-111.3.
The objectives of these tests were :
1. To study the fatigue strength of these three different high
strength cementitious composites (superplasticizer concrete,
microsilica concrete, and polymer concrete).
42

2. To obtain the S-N curves of these high strength concretes and
compare with normal concrete.
3. To observe the fatigue behavior due to the effect of maximum
stress level (0.4 to 0.9 fc), and rate of loading (6, and 12
Hz).
3.1.2 Empirical Modelling
With the aid of experimental results of bond and fatigue
characteristics of high strength cement based composites, the bond-slip
relationship and fatigue strength can be modelled and predicted.
Attempts were made to generate a constitutive law and a general
equation for the normalized pull-out stress-displacement relationship
)f brittle materials (normal concrete, high strength concrete, and
)ther cement-based composites). Also, the general equations for the
'atigue characteristics of high strength cement-based composites was
venerated in order to predict the fatigue strength.
Formalized Stress-Displacement Relationship :
A general unique normalized post-peak pull-out stress vs.
isplacement equation of the cement-based composite has been proposed.
his general equation can be applied to different types of cement-based
atrices. The equation varies with the single term of "brittleness
ndex, of each matrix. This equation can be used to predict the
post-peak response of the composite matrix. The proposed equation is as
llows :
(3.1)
where :
= Post-peak pull-out stress
= Maximum pull-out stress of the cemented compositeimax
= Post-peak pull-out displacement
8 = Maximum pull-out displacement of the cementedmaxcomposites (Half fiber length for fibrous concrete)
43

= Brittleness Index of the composite
Brittleness Index :
During the course of this study, a term called the "Brittleness
Index" has been proposed as defined in Equation 3.1. For a general
cementitious composites; there is a brittleness number which can be
used to predict the basic properties of a cement-based composite. The
lower the value of the brittleness index, the more brittle the material
is. The brittleness index can be used to predict the softening response
of a cementitious composite without conducting the direct tension test.
The brittleness index may also be used to predict the S-N curves of
high strength cement-based composites.
Maximum Strain Concept :
For a given cementitious material, there is a certain amount of
maximum strain that the material can sustain. This maximum strain
property may be used to predict other basic properties such as
compressive strength, tensile strength, etc. In this study, attempts
were made to develop the maximum strain concept to predict the fatigue
behavior of high strength cement-based composites.
S-N Curve :
The fatigue strength characteristic of a material subjected to
repeated stress of constant magnitude is known as the S-N curve, in
which N is the number of cycles of stress (S), which would cause
failure. Each material has its own unique S-N curve equation. In this
study, an attempt was made to develop the general S-N equation for
cement-based composites, especially for high strength concrete, by
using the maximum strain concept.
44

3.2 Scope of Work
In order to study the complete properties of high strength cement -
based composites, both experimental and empirical studies were
performed. For experimental study five different tests, namely,
compression test (3x6 in. cylinder specimen), direct tension test
(dog-bone specimen), indirect tension test (beams), bond strength test
(tapered and cube specimens) and fatigue test (3x6 in. cylinder
specimen) were conducted as mentioned earier. At least three specimens
were tested in each test. About 100 cylinder specimens and 30 beam
specimens were tested for studying the basic properties of high
strength cement-based composites. For bond-slip characteristic study,
51 tapered specimens with 5 different fiber volume fractions and 18
cube specimens with 3 different bar sizes were used. Table III.1
details the specimens used for the bond strength tests. Two types of
steel fibers, straight-end and hooked-end were used. One hundred and
twenty standard 3x6 in. cylinders were tested to study fatigue
characteristics of high strength cement-based composites. Tables
111.2-111.3 show the details of cylinder specimens used in the fatigue
test. All cylinder specimens were capped with sulphur based-capping
compound before testing.
45

TABLE III.1 BOND STRENGTH TEST
NUMBER OF FIBER
TYPE OF HIGH STRENGTH CONCRETENORMAL
SPECIMENCONCRETE Fiber Volume Fractions (Vf ) Deformed Bar (0)
0 0.5 1.0 1.5 ².0 #3 #4 #6
Cylinder 3"x6", - - - - - 3 3 3
* *Dog-Bone Spec. 6 * 10 - - - - - - -
** ** ** **Tapered Spec. - 3 1² 1² 12 1² - - -
Pull-out Spec. - - - - - - 1² 6 6(cube)
Notes : Dog Bone Specimen with a single 3/4" aggregate.
** 6 Specimens with straight end fiber and 6 specimens
with hooked-end fiber.
46

TABLE 111.2 FATIGUE TEST DUE TO THE EFFECT OF MAX. STRESS LEVEL
Number of SpecimensTYPE OF
fmax
fmin '
CONCRETE f fc c Controlled Strength Fatigue
Super 0.90 0.10 9 9Plasticizer Conc.
0.80 0.10 6 9 ,
Microsilica 0.75 0.10 6 9Conc.
0.70 0.10 6 9
Polymer Conc. 0.60 0.10 6 9
0.55 0.10 6 9
0.50 0.10 3 9
0.45 0.10 3 3
0.40 0.10 3 3
TABLE 111.3 FATIGUE TEST DUE TO THE EFFECT OF RATE OF LOADING
Number of Specimens
TYPE OF f fmax max
6 Hz 12 Hz
CONCRETE f fc c
Control Fatigue Control Fatigue
Microsilica 0.9 0.1 4 4 6 6
Concrete 0.8 0.1 4 4 4 6
0.7 0.1 4 4 4 6
0.6 0.1 4 4 4 6
47

CHAPTER IV
TESTING PROCEDURE
4.1 Material Compositions
The process of producing high strength cement-based composite
varies with geographical location. This is due to the fact that the
strength of high strength cement-based composite depends on the type of
aggregate and additive. Guidelines in selecting materials and mix
proportions are presented in the following literatures [36-431.
The material used for the three types of high strength
cement-based composites in this study are Portland Cement Type I, local
siliceous sand passing sieve No.4, river gravel with maximum size of
3/8 in. as aggregate, microsilica (1-5 µm), high range water reducing
admixture (Daracem 100), Linmix and unsaturated polyester resin
solution. Microsilica used in this study is in the powdered form with
96 % of SiO2. Three sizes of deformed bars, No.3, No.4, and No.6 (9,
12, and 18 mm) were selected to evaluate the size effect on bond-slip
characteristics. One-inch, hooked-end and straight, steel fibers were
used for the high strength fibrous concrete to study the effect of end
types. Both types of fibers have approximately the same aspect ratio
(l/d) of 60. Four different fiber volume fractions of 0.5, 1.0, 1.5,
and 2.0 % of cement were used to study the effect of fiber content. The
fiber had a density of 490 lb/ft3
.
4.2 Mix Proportions
Many trial mix proportions were tried in order to achieve higher
compressive strength at lesser cost. Especially for polymer concrete in
which the compressive strength depends on the amount of polymer added
to the mix. The proper mix proportion for superplasticizer concrete
used in this study was 1 : 1.87 : 2.50 (cement : sand : aggregate) with
0.30 water/cement ratio. A 15 fl.oz/100 lb cement dosage of Daracem 100
48

superplasticizer was added to provide workability. The range of
compressive strength obtained from this mix was 7,500 to 8,000 psi. at
56 days For microsilica concrete, the mix proportion was 1 : 1.72 : 2.5
: 0.15 (cement : sand : aggregate : silica fume) with 0.35 water/cement
ratio. A 30 fl.oz/100 lb cement dosage of superplasticizer was added.
The range of compressive strength obtained was between 11,000 to 13,000
psi at 56 days lime water curing. The mix proportion of polymer
concrete used was 1 : 3 : 0.1 : 0.8 : 0.1 (cement : sand : linmix :
resin : water) which gave a compressive strength of approximately
10,000 psi at 35 days after casting.
4.3 Specimens
According to the ASTM (American Society for Testing and Materials)
and RILEM (Materials and Structures) recommendations, different types
and sizes of specimens were used because of the high compressive
strength of high strength cement based composites and maximum capacity
of the testing machine. A 3x6 in. standard cylinder specimen was
selected for the present fatigue characteristic study. The maximum
capacity of the MTS testing system used is 100 kip with the expected
maximum force on the tested 3x6 in. cylinder specimen of 85 kip for a
12,000 psi. concrete. If a bigger size of cylinder is used, the maximum
force will be higher and thus exceeds the maximum capacity of the MTS
testing system.
For a direct tension tests, 1x3x12 in. tapered (Fig.3.2) and 1x1x9
in. dog-bone (Fig.3.3) specimens were used. Teresa Cintora [90]
developed a tapered specimens of 1x3x12 in. to investigate the
softening response of concrete in direct tension. The steel box-shaped
grip with the dimension of 6x4x5 in. was fabricated. Its consisted of 3
steel plates (one 6x5 and 3x6 in.) and two 3/2x3/2x1/8 in. angles. The
two 3x6 in. plates were connected to the edges of the 6x5 in. plate,
using 6 1/2 in. bolts, which in turn were linked to each other using
the two steel angles. Within this box were the two PVC wedges, with
angle complementing those of the specimen, which would secure the
specimen in place (Fig.4.1; Ref [90]).
49

Grip Clang
Notch
Specimen
PVC Wedges
Fig. 4.1 Friction Grips (T. Cintora (901)
For testing bond strength, cube and tapered specimens were used.
Many investigators have observed that the amount of concrete cover
affects the bond strength of reinforced concrete. According to the
RILEM recommendation [9], the proper dimension for a cube specimen of
reinforced concrete is 10 times the bar diameter. In this study, the
deformed bars No.3, No.4, and No.6 were used in order to study the
effect of bar size. Therefore, a 5x5x5 in. concrete cube specimen was
used for bar sizes No.3 and No.4 and a 8x8x8 in. specimem for the No.6
bar. The embedment length of five times the bar diameter was selected
for the expected bond factor (fmax/f), which could be as low as 0.2,
and the ratio of f /f is only equal to 4 for high strength concrete.y c
For the pull-out stress vs. displacement of high strength fibrous
concrete, 1x3x12 in. tapered specimens with the same dimension as those
used in the tension test were used. Two type of 1 in. steel fibers,
50

straight-end and hooked-end, were used with four different fiber volume
fractions of 0.5, 1.0, 1.5 and 2.0 % to study the effect of end
fabrication and the fiber content.
For the flexural test, five different sizes of beams 1x2x12,
2x4x12, 2x5x24, 4x6x30 and 6x6x30 of microsilica and two sizes of
polymer concrete were tested under mid-span point load in order to
study the flexural characteristics and the effect of beam size.
4.4 Specimen Casting
Four different concrete types, normal concrete, superplasticizer
concrete, microsilica concrete, and polymer concrete were used in this
study. The materials used were Portland Cement Type I, local siliceous
sand passing sieve #4, river gravel, microsilica, admixture, linmix and
unsaturated polyester resin solution. All concrete were prepared by in
a mechanical mixer. For each test specimen casted three controlled
compression cylinders were casted. The molds were prepared and
lubricated with oil before concrete was poured. The mixing procedure
for these high strength concretes were similar to the general method
used for conventional concrete. After the mix was poured into the
molds, it was vibrated on a vibrating table to expell the air in order
to obtain a well compacted specimen. For the 4x6x30 in. and 6x6x30 in.
beam specimens, a portable vibrator was used instead of vibrating table
because the specimens were too big for the vibrating table. After 24
hours, the molds were stripped and the specimens were placed in a lime
saturated water solution and left to cure for a period of at least 56
days. The testing age of the specimens varied from 56 days to a year.
For polymer concrete, cement and aggregate were mixed in a conventional
concrete mixture. Latex was then added to the mix to form the plastic
mixture. The mixture was mixed for about 5 minutes before being poured
into the molds and formworks. Setting time of polymer concrete is
approximately 20 to 30 minutes. After 24 hours, the specimens were
removed from their molds and allowed to air dry rather than curing in
water. This is because the presence of water tends to slow down the
polymerization process and thus reduces the strength of polymer
51

concrete. The testing age of the specimens varied from 3 to 35 days to
evaluate the high early strength property of polymer concrete..
For reinforced high strength concrete specimen, the reinforcing
bar was fixed in the mold. The concrete was then poured into the mold
perpendicular to the reinforcing bar in order to have the same
condition as the reinforced concrete beams in actual structures.
4.5 Test Setup and Procedure
Test setup and procedure of testing can be categoried into 5
different types, compression test (3x6 in. cylinder specimen), direct
tension test (tapered and dog-bone specimens), indirect tension test
(beam), bond strength test (tapered and cube specimens) and fatigue
test (3x6 in. cylinder specimen). All tests were conducted on a MTS
hydraulic closed-loop testing system as shown in Fig.3.1. All cylinder
specimens were capped with sulphur based capping compound before
testing.
4.5.1 Compression Test
The 3x6 in. cylinder specimens were tested in uniaxial compression
under closed-loop strain control to study the stress-strain behavior,
the compressive strength (fc ), and the modulus of elasticity (Ec
) of
different high strength cement-based composites. The tests were
conducted at the strain rate of 1x10 -4sec-¹ . The specimen broke
between 3 to 5 minutes. Two strain gages (0.20 in.) were mounted to the
specimen, as shown in the test set up Fig.4.2, in order to record the
average axial displacements. The signals from the two strain gages were
averaged and fed back to the controller to constantly adjust the
applied load. All signals of load, strain, and stroke were recorded
directly onto the computer disk where data manipulation and plotting
could later be done. These cylinder tests were also used to determine
strength parameters for the bond and fatigue tests.
52

4.5.2 Tension Test
The 1x3x12 in. tapered specimens and the 1xlx9 in. dog-bone
specimens of high strength cement-based composites were tested under
MTS closed- loop strain control in order to obtain the complete
stress -strain and stress-displacement curves under uniaxial tension.
The specimens were saw cut in the middle, creating notches on both
sides. The notches provide an exact critical section for crack
initiation, where two extensometers with 5 mm. maximum travel distance
were placed over the two notches to measure the average crack opening
displacement. In order to avoid creating the moment which may occur
during testing, the lower end of the steel grip was held fixed to the
base of MTS testing machine while the upper end was hinge. Due to the
brittle nature of concrete especially high strength concrete, the rate
of loading was set at a very slow rate. In this study, the starting
strain rate of loading is 2.5x10 -7sec-¹ in order to obtain the peak
stress. After the load reached the peak, the loading rate was gradually
increased to speed up the experiment. This step was necessary in order
to reduce the creep effect. The signals from the two extensometers were
averaged and fed back to the controller to constantly adjust the
applied load. The closed-loop strain controlled test allows monitoring
of the whole stable post-peak response. Two AC-LVDTs were also placed
over the critical section on the remaining two faces of the specimen to
monitor large deformation. All signals of load, strain, and LVDT were
recorded directly onto the computer disk where data manipulation and
plotting could later be done. The total time of testing a specimen was
about 4 hrs. The test set up is shown in Figs.3.1 & 4.3 for dog-bone
and tapered specimen respectively.
Six standard 3x6 in. cylinders of polymer concrete were also
tested in split tension in order to find the tensile stress of the
matrix. The indirect tensile strength was used as a reference for
comparing with the direct tensile results.
53

4.5.3 Beam Test
Five different sizes of beams 1x2x12, 2x4x12, 2x5x24, 4x6x30, and
6x6x30 in. of microsilica and polymer concrete were tested in order to
study the flexural characteristics of high strength concrete. These
observed behaviors were then compared with those from normal concrete.
The three-point-load testing method was used for these beam tests.
Fig.4.4 shows the test set up for the beam test. The test was conducted
under the closed-loop deflection control. Because high strength polymer
concrete is more ductile than high strength microsilica concrete due to
the plastic like component in polymer concrete, the rate of loading
used were different. For microsilica concrete, the strain rate of
loading was 4.440x10⁻⁵
sec. -1
whereas for polymer concrete the strain
rate was 1.786x10 -4sec-¹ The average deflection of the beam was
recorded by the two extensometers mounted at the middle of the beam.
And again, the signals from the two extensometers were averaged and fed
back to the controller and all the signals of load, strain, stroke
were recorded onto the computer disk. About 30 beam specimens were used
in this study.
4.5.4 Bond Strength Test
The bond strength test in this study was divided into 2 parts;
bond strength of reinforced high strength concrete and bond strength of
high strength fibrous concrete.
4.5.4.1 Bond strength of Reinforced High Strength Concrete
Three different deformed bar sizes, #3, #4, and #6 were reinforced
in high strength concrete cubes of 5x5x5, 5x5x5, and 8x8x8 in.
respectively. In this study, the embedment length of five times the bar
diameter was used for the expected bond factor (f max/f'c), which could
be as low as 0.2, and the ratio of f y /f
c was about equal to only 4 for
high strength concrete. The test was carried out under displacement
control. Two AC-LVDTs were attached on both sides of the specimen
measured the average pull-out slip of the reinforcing bar. The test
54

-4were performed at the rate of 7.143x10 in./sec. The detail of the test
set up is shown in Fig.4.5. For large bars (#6), pushing instead
pulling was used to observe the bond-slip behavior because the total
pull-out strength exceeded the yield strength of the steel grips shown
in Fig.4.6. All the signals of load, strain, and stroke were recorded
directly onto the computer disk. It should be noted that for both
pull-out test setups the slip must be measured on the side where the
bars is moving out of the concrete specimen. Otherwise, the observed
results are incomparable.
4.5.4.2 Pull-Out Stress of High Strength Fibrous Concrete
Two types of steel fibers, one with hooked-end and the other
straight were used to study the pull-out stress-slip behavior of high
strength fibrous concrete. Four different fiber volume fractions of
0.5, 1.0, 1.5, and 2.0 percent of cement were used to study the effect
of fiber content. The specimens were tested under the closed-loop
strain control. The detail of specimen, test set up and data recording
are the same as explained in Section 4.5.2-Tension Test. The number of
specimens used in this study is shown in Table III.1.
4.5.5 Fatigue Test
The standard 3x6 in. cylinder specimens were used to study the
fatigue characteristics of three different high strength cement-based
composites, superplasticizer concrete, microsilica concrete, and
polymer concrete. The effect of maximum stress level of 0.40, 0.50,
0.60, 0.70, 0.75, 0.80 and 0.90 of fc
were observed. The minimum stress
of 0.10 fc were kept constant. Two different rates of loading of 6, and
¹² Hz (cycle/sec) were conducted to study the effect of rate of
loading. All the specimens were tested until failure or until one
million cycle, some up to three million. Generally for all the test,
the specimen was tested under the closed-loop strain control in order
to control the strain of the specimen during the test and more safer
than other closed-loop control. But for fatigue testing, it is
necessary to use closed-loop load control in order to maintain the same
55

maximum stress level at each loading cycle during the test. The load
was applied to the specimen with the low starting rate of 0.05
cycle/sec. for the first 100 cycles and then gradually increased until
the loading rate reaches the required rate of 6 or 1² Hz. at about 1000
cycles. Then the rate was kept constant throughout the rest of the test
until the specimen failed or one million cycles was reached. The
average strain at different intervals during the fatigue test was
recorded with the corresponding number of loading cycles by the 2
extensometers mounted to the specimen as shown in Fig.4.². Due to the
maximum recording speed of MTS testing machine, only one data point per
second was record. Thus while recording the load and strain in each
loading cycle, the loading rate was slowed down to 0.05 cycle/sec in
order to obtain at least 20 data points per cycle. The average testing
time was about ² days per specimen. The details of specimens used in
this study is shown in Tables 111.² & 111.3.
56

2 extensometers
sulphur
cylinder spec.
controller
• strain control (uniaxial compression test)
• load control (fatigue test)
Fig.4.2 Compression and Fatigue Test
load cell closed-loop
system
load cellclosed - loop
system
2 extensometers
controller
strain controlled
Fig. 4.3 Direct Tension Test, Tapered Spec.
57

load cell closed-loop systembeam specimen system
2 extensometers-steel base
MTS.
• strain controlled
Fig. 4.4 Beam Test
controller
load cellsteel pt. 10 mm. thk
steel grip
rein. bar #3,#4
closed loop
system
steel pl.rubber 10
MTS.
5d embedment length
spec.(5x5 x5 )
2 A.C. LVDT
steel holderfixed to the base
controller
• stroke controlled
Fig. 4.5 Pull-Out Test (bars #3, #4)
58

closed-loop systems st m
controller
steel holderfixed to the base
stroke controlled
Fig. 4.6 Pull-Out Test of Deformed Bar #6
59

CHAPTER V
RESULTS AND DISCUSSION
5.1 Basic Properties of High Strength Concrete
5.1.1 Compressive Strength
The compressive strength of cement-based composites varies
according to the materials used and mix proportion. The highest
compressive strength, specified by manufacturer, obtained from
superplasticizer concrete is between 7000 to 7500 psi. In this study
three different high strength cement-based composites are used,
superplasticizer concrete, microsilica concrete and polymer concrete.
Table V.1 shows the average compression properties of different high
strength concretes as compared to normal concrete. The minimum curing
time for high strength concrete is at least 56 days before test. Longer
curing period (58-400 days) did not significantly affect the
compressive strength, the maximum strain at peak load, nor the modulus
of elasticity of either superplasticizer concrete or microsilica
concrete. Dry cured polymer concrete gives higher compressive strength
than wet cured one. On the contrary, superplasticizer and microsilica
concrete exhibit a lower strength with dry cured condition. This is
because the polymerization process of polymer concrete is dictated by
the temperature and moisture. The higher the temperature the faster the
rate of polymerization which results in a stronger polymer concrete.
The curing period of polymer concrete (3 to 35 days air cured)
significantly affects the compressive strength, peak strain, and
modulus of elasticity as also shown in Table V.1. The average
compressive strengths of superplasticizer concrete, microsilica
concrete and polymer concrete are 7371, 9526, and 9755 psi
respectively. Fig.5.1 shows the typical stress versus strain curves of
different high strength concrete as compared with normal concrete. It
can be seen that polymer concrete is likely to absorb more energy than
other brittle concrete. This may be attributed to the strength of the
60

aggregate-matrix bonding of polymerization in polymer concrete as
compared to normal bonding of cement gel. The effect of the curing
period on the compressive strength versus strain of polymer concrete is
presented in Fig. 5.2. The older the polymer concrete, the more brittle
it behaves. The faster curing process makes polymer concrete a suitable
material for quick repair projects such as underwater structures, etc.
The average strain at the peak load of both superplasticizer and
microsilica concrete are 0.00206 and 0.00218 respectively which is
about one third less than normal concrete (0.00356). While for polymer
concrete, the average strain at peak load is 0.01282 at 35 days dry
cured which is about 4 times of normal concrete. Details of all
compressive stress-strain curves of high strength concrete tested in
this studies are summarized in Appendix A.
61

TABLE V.1 COMPRESSION PROPERTIES
Type of Concrete*
Curing
(days)
Max Compr.
Strength
(psi)
Strain at
Max.Load
-3x 10
Modulus of
Elasticity
x 106psi
Remarks
Normal Concrete 21 5142 3.560 2.044
Superplasticizer 58-70 7371 2.059 3.705
Concrete 65-76 7793 2.020 4.190 **
Microsilica 62-406 9526 2.058 4.524
Concrete 66-630 10121 2.222 4.797 **
Polymer Concrete 3-6 4704 16.69 0.754
13 6696 12.37 1.084
35 9755 12.82 1.570
23-27 8413 9.69 1.575 ***
Remarks :
Normal Concrete, superplasticizer concrete and microsilica
concrete were cured in lime water, while polymer concrete
was cured in the laboratory environment.
** Prefatigue load at least 1,000,000 cycles at the load of
Is 0.70 fc
*** Prefatigue load at least 1,000,000 cycles at the load of
0.40 fc
62
STRESS VS STRAIN CURVEHIGH STRENGTH CONCRETE (COM-COMP)
UNIAXIAL COMPRESSION TEST
A = NORMAL CONCRETE
B SUPERPLASTICIZER CONCRETE
C MICROSILICA CONCRETE.
0 - POLYMER CONCRETE
STRAIN (In/in)
Fig. 5.1 Typical Stress vs. Strain Curves of Different HighStrength Concrete compare with Normal Concrete
STRESS VS. STRAIN CURVE
STRAIN (In/in)
Fig. 5.2 Stress vs. Strain Curve of Polymer Concrete 63due to the Effect of Curing Period
5.1.2 Mode of Failure
The mode of failure of high strength concrete observed during
testing was clearly different from normal concrete. In general, normal
concrete will gradually fail after it reaches the peak load while high
strength concrete suddenly explodes at the peak load. Possibly because
high strength concrete is more brittle than normal concrete and the
descending part of the stress versus strain curve is very steep
indicating low ductile behavior. Therefore the descending part of the
stress versus strain curve of high strength concrete under uniaxial
compression can not be ascertained using a conventional testing system.
Both the ascending and descending part of the stress versus strain
curves of concrete are very important and necessary for engineering
analysis and design. Thus, the test set-up and testing procedure for
this study were carefully designed. MTS closed-loop axial strain
control is used to test the specimen. Fig.5.3 shows the comparison of
stress versus strain curves of microsilica concrete from this present
study as compared to Shah et.al.,s [6]. They conducted the test by
using circumferential closed-loop strain control. The results indicate
that the behavior of stress strain relationship of high strength
concrete obtained from closed-loop axial strain control is the same as
those from closed-loop circumferential strain control. However, due to
the abrupt bursting failure of high strength concrete, closed-loop
circumferential strain control provides a more accurate and faster
response of strain increment over the post-peak region. As a result, a
more stable softening response can be observed even for very brittle
material like high strength concrete.
64

n
Wff
.0VI 0
0W>0
-C
a_200
14
13
12
ii
10
STRESS VS. STRAIN CURVHIGH STRENGTH CONCRETE (COMP—COM)
0 Circumferential Strain Control
(Shah. et.ol. [6])
+ Axial Strain Contral
(Present study)
STRAIN (in./in.)
Fig. 5.3 Comparison of Stress vs. Strain Curves of HSC betweenClosed-Loop Axial and Circumferential Strain Control
65

5.1.3 Flexural Properties
Table V.2 presents the average flexural properties of five
different sizes of beams lx2x12, 2x4x12, 2x5x24, 4x6x30, and 6x6x30 in.
of both microsilica and polymer concrete and compare with values from0.5
ACI flexural strength equation ( f r=7.5(fc) ). The modulus of
rupture decreases with the increase of beam sizes for microsilica
concrete whereas for polymer concrete, the modulus of rupture increases
with the increase of beam size. The modulus of rupture of 6x6x30 in.
beam size decreases about 16 % when compared to a smaller (2x4x12 in.)
beam size of microsilica concrete while it increases 18.5 % for a
2x4x12 in. beam size when compared to a smaller (1x2x12 in.) beam size
of polymer concrete. The flexural strength of both high strength
microsilica and polymer concrete are higher than the calculated values
from the ACI flexural strength equation. The flexural strength of high
strength concrete is about 41 % higher than the ACI recommendation for
microsilica concrete and 281 % for polymer concrete. Thus the ACI
flexural equation is very conservative and may be inaccurate for high
strength cement-based composites. Fig.5.4 shows the typical flexural
stress versus deflection curves of different beam sizes of both
microsilica and polymer concrete.
A typical splitting test result is presented in Fig.5.5. The
average tensile stress of polymer concrete from the six 3x6 in.
cylinder splitting test was 696.70 psi. This tensile stress was about
1.12 times higher than the ACI flexural stress (613.69 psi.) and 0.298
times the flexural test. Details of all other flexural stress -
deflection curves are compiled in Appendix B.
66

TABLE V.2 FLEXURAL PROPERTIES OF
HIGH STRENGTH CONCRETE
Type of
HSC
Size of
Beam
Curing
(day)
Max. P
(lb.)
'fr
(psi.)
Max.Def
-2ix10 in
Modulus
of Elasticity
x10 psi
frtest
frACI
Microsilica 2x4x12 ¹55 2241 1049 1.290 0.306 1.537
Concrete 2x5x24 ¹55 1428 942 1.004 1.532 1.380
4x6x30 ¹55 3355 980 2.762 2.440 1.436
6x6x30 155 4527 880 1.898 1.075 1.289
Polymer 1x2x12 9 644 2098 4.360 0.728 3.419
Concrete 2x4x12 9 5361 2573 7.278 0.201 4.139
Remarks :
ACI flexural equation, fr= 7.5 V f
For microsilica conc. fr= 682.56 psi.
For polymer conc. fr= 613.69 psi.
67

2 4
FLEXURAL SIR ESS VS. DE DEFLECTION
a
z<0U)0,
J
5;)
1- 0
VI 0(I)
JliiX
11-
O.
U)U)Ui
U)Ui_J
zUi
MICROSILICA CONC. and POLYMER CONC.
Microsilica Concrete.
2x4x12 in. Beam
• 2x5x24 in. Beam
4x6x30 in. Beam
.A 6x6x30 in. Beam
Polymer Concrete
• 1x2x12 in. Beam
V 2x4x12 in. Beam
6 8
DEFLECTION (x10"-2 in.)
Fig. 5.4 Comparison of Flexural Stress vs. Deflection ofDifferent Beam Sizes of High Strength Concrete
SPLITTING TEST
POLYMER CONCRETE (PS5)
3x6 in. Cylinder Specimen
6 Days Dry Cured
Load = 21,480 lb.
Tensile Stress = 766.80 psi.
DISPLACEMENT (x10**-2 in.)
Fig. 5.5 Typical Tensile Stress vs. Displacement by 68Splitting Test Method

5.1.4 Tensile Strength
Two types of specimens, tapered and dog-bone specimens, were used
in tension tests for this study. Tapered specimens were used for
microsilica concrete, and dog-bone specimens were used for polymer
concrete to study the post-peak stress displacement relationships.
Table V.3 presents the average tension properties of different
cement-based composites. The results indicate that normal concrete has
lower tensile strength and peak displacement than high strength
concrete. Polymer concrete shows the highest peak tensile stress-2.
(617.50 psi.) and peak displacement (0.141x10 in.). The average peak
tensile stress of microsilica and polymer concrete are about 61 % and
¹54 % higher than normal concrete respectively. The energy absorbtion
of high strength concrete is also higher than normal concrete. Polymer
concrete absorbed the highest energy because of its plastic property as
shown in Fig.5.6. Also observed is that the pull-out displacements of
these high strength concretes differed from each other as well as from
normal concrete. The pull-out displacement at the peak-load of normal
concrete is about 66 % higher than microsilica concrete and ²00 % lower
than polymer concrete. Appendix C summarizes all the direct tension
test results of both normal and high strength concrete.
TABLE V.3 DIRECT TENSION PROPERTIES
OF CEMENT-BASED COMPOSITES
Type of
Concrete
PeakStress(psi.)
PeakDispl.
(x10-²in.)
Type of
Specimen
Normal Concrete 243.14 0.044 Tapered Spec.
Microsilica Conc. 391.50 0.015 Tapered Spec.
Polymer Concrete 617.50 0.141 Dog-Bone Spec.
69

DIRECT-TENSION TESTCEMENT BASED COMPOSITES (N—M—P)
CI Normal Concrete (T.Cintoro [90])
+ MicrosiIica Concrete
O Polymer Concrete
PULL—OUT DISPLACEMENT (x10**-2 in.)
Fig. 5.6 Comparison of Pull-Out Stress vs. Displacement
Relationship of Cement-Based Composites
(J1
H
0
7
70
5.2 Bond Strength-Slip Relationship
The bond strength-slip behaviors reported for normal concrete [7,
10] are widely scattered. These variations were attributed to many
factors, such as loading rate, lateral confinement, monotonic or cyclic
loading, size of specimen and concrete cover, and the embedment length.
In this study, the bond strength properties can be divided into 2
parts, bond strength of reinforced high strength concrete and pull-out
stress of high strength fibrous concrete. Two types of fibers,
straight-end and hooked-end fibers are used.
5.2.1 Reinforced High Strength Concrete
Three different deformed bar sizes, #3, #4, and #6 were reinforced
in a microsilica concrete cubes of 5x5x5, 5x5x5 and 8x8x8 in.
respectively. Embedment length was five times the bar diameter. The
average bond strength properties of reinforced high strength concrete
are detailed in Table V.4. The results indicate that the larger the barmaxdiameter used the lower the bond strength, bond factor (fr
/fc) and
slip obtained. The bond factor and slip per embedment length of
reinforced microsilica concrete are ranging between 0.170 to 0.276 and
1.²13 to 3.068 respectively. The average maximum bond strength observed
from all three deformed bar sizes was ²518 psi. and the average maximum
slip of 0.00767 in. This slip is only 10 % of those reported for normal
concrete of 0.06 to 0.08 in. by Martin [7] and about 77 % if compared
to the value of 0.01 in. given by Edward [10]. A 10-fold decrease in
slippage of high strength matrix may cause some concerns over the
required development length if the present design code is followed.
Fig.5.7 presents the bond-slip relationship of deformed bars in high
strength concrete as compared to normal concrete.
Another interesting parameter studied here is the bond factor, a
ratio defined as the maximum bond strength (fmax ) over the ultimate
compressive strength (f c ). The average bond factor obtained for high
strength concrete in this study was about 0.²1² while most reported
values for normal concrete are ranging from 0.15 and 0.²6 [10,11]
71

TABLE V.4 BOND STRENGTH PROPERTIES OF
REINFORCED HIGH STRENGTH CONCRETE
Bar fc f
max
rSlip Bond Fac.
'Slip/L
d
Sizes (psi.) (psi.) x10-3
infrmax/f c
(x10-3 )
# 3 9113 2518 7.67 0.276 3.068
# 4 8816 167² 6.99 0.189 ².796
# 6 11134 1893 4.55 0.170 1.213
Remarks
fc
- Compressive Stress (psi.)
f ax- Modulus of Rupture (psi.)
fmax/f ' - Bond Factor
r c
respectively to 0.60 [10,6²,66]. Bond factors as high as 1.0 has also
been reported by Hawkin [66]. These high values mostly resulted from
the effect of confinement provided in the test specimens.
Since high strength concrete is generally more brittle than normal
concrete and usually exhibits lesser extent of microcracks, the
pull-out slip in high strength matrix should then be less than those in
normal concrete This behavior was observed and confirmed in the present
study. However, the results in this study also indicate that bond
strength in both high strength concrete and normal concrete are
essentially the same. The present findings may lead to the conclusion
that if high strength concrete is used, sufficient development length
should be provided to ensure proper bonding and to avoid catastropic
failure.
7²

PULL-OUT TESTREINF. HIGH STRENGTH CONC. (BAR #3,4,6)
BOND STRENGTH OF REINFORCEDHIGH STRENGTH CONCRETE (fc = 11000 psi.)# — REINFORCING BAR SIZESPECIMEN DIMENSION :CUBE 5x5x5 in. FOR #3,#4 BARCUBE 8x8x8 in. FOR # 6 BAR
+ EDWARD (f.c = 6293 psi., 16 mm. Dia. Bar)6 MARTIN (fc'= 3887 psi.,cube,18 mm. Dia. Bar)
Fig. 5.7 Bond-Slip Relationships of Deformed Bars under
Pull-Out Test
73

5.2.2 Fiber Reinforced High Strength Concrete
In brittle materials like concrete, the addition of steel fiber
greatly improves the resistance to crack growth, enhanced ductility,
impact resistance, and energy absorption capacity of the unreinforced
matrix. Since these small fibers are, in practice, randomly distributed
in the matrix during the mixing process, thus such random distribution
of fibers was maintained in this study. The tapered fiber reinforced
concrete specimens were tested in direct tension to study the fiber
pulled-out behavior. Table V.5 presents the average pull-out stress
properties of different type of high strength concrete and high
strength fibrous concrete as compared to normal concrete. Included in
the table are the peak stress, peak displacement and the steel fiber
volume fraction used in the mix.
5.2.2.1 Load Displacement Relationship
The typical pull-out stress and displacement relationship of
straight-end steel fiber and hooked-end steel fiber with five different
fiber volume fractions of 0, 0.50, 1.00, 1.50, and ².00 % are shown in
Figs.5.8 & 5.9. It is quite obvious that the presence of fiber has
significant effect on the pull-out behavior. The higher the fiber
volume fraction, the larger are the peak stress and the amount of
energy absorption. More importantly, the post-cracking energy is the
dominating portion of fiber reinforced composites. Depending on the
volume fraction, the length and type of fibers, this post cracking
energy varies. Also interesting is the concept of maximum crack width
where all fibers are completely pulled-out. This critical crack width
is believe to equal half the fiber length. Fig.5.10 shows the typical
pull-out stress versus displacement of different high strength concrete
and high strength fibrous concrete with a ².0 % steel fiber volume
fraction. The results indicate that high strength fibrous concrete with
both straight-end fiber and hooked-end fiber absorbs more energy than
unreinforced high strength concrete and polymer concrete. Also showed
is the effect of end type of the fiber. For straight -end fiber, thepost peak pull -out stress versus displacement is gradually and smoothly
74
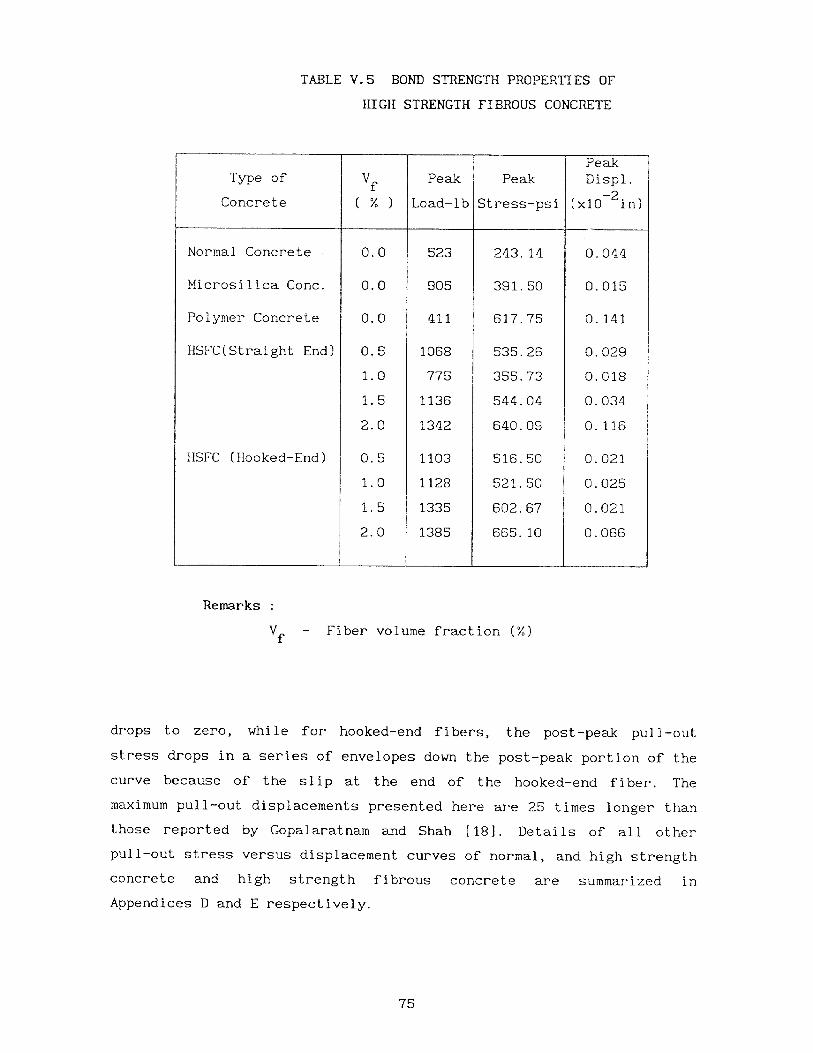
TABLE V.5 BOND STRENGTH PROPERTIES OF
HIGH STRENGTH FIBROUS CONCRETE
Type of
Concrete
Vf
( % )
Peak
Load-lb
Peak
Stress-psi
PeakDispl.
-2(x10 in)
--
Normal Concrete 0.0 523 ²43.14 0.044
Microsilica Conc. 0.0 905 391.50 . 0.015
Polymer Concrete 0.0 411 617.75 0.141
HSFC(Straight End) 0.5 1068 535.²6 0.0²9
1.0 775 355.73 0.018
1.5 1136 544.04 0.034
².0 134² 640.09 0.116
HSFC (Hooked-End) 0.5 1103 516.50 0.021
1.0 11²8 5²1.50 0.025
1.5 1335 60².67 0.0²1
².0 1385 665.10 0.066
Remarks :
Vf
- Fiber volume fraction (%)
drops to zero, while for hooked-end fibers, the post-peak pull-out
stress drops in a series of envelopes down the post-peak portion of the
curve because of the slip at the end of the hooked-end fiber. The
maximum pull-out displacements presented here are ²5 times longer than
those reported by Gopalaratnam and Shah [18]. Details of all other
pull-out stress versus displacement curves of normal, and high strength
concrete and high strength fibrous concrete are summarized in
Appendices D and E respectively.
75

PULL-OUT STRESS VS. D1SPLACEVIENT CURVHSFC (STRAIGHT END FIBER)
Pull-Out Stress of
High Strength Fibrous Concrete
Steel Fiber 1 in. length
Type : Straight End
Fiber Volume Fraction :
PULL-OUT DISPLACEMENT (x10**-2 inch.)
Fig. 5.8 Typical Pull-Out Stress vs. Displacement of HighStrength Fibrous Concrete (Straight-End Fiber)
PULL-OUT STRESS VS. DISPLACEMENT CURVEHSFC (HOOKED END FIBER)
Pull-Out Stress of
High Strength Fibrous Cancrete
Steel Fiber 1 in. length
Type : Hooked End
Aspect Ratio = 60
Fiber Volume Fraction :
A = 0.0 % B = 0.5 %
C = 1.0 7, = 1.5
E = 2.0 %
PULL -OUT DISPLACEMENT (x 1 0**-2 inch.)
Fig. 5.9 Typical Pull-Out Stress vs. Displacement of High 76Strength Fibrous Concrete (Hooked-End Fiber)

PULL-OUT STRESS VS. DISPLACEMENTHSC and HSFC
O High Strength Cancrete
• Polymer Concrete
High Strength Fibraus Concrete
Fiber 1 in. length
Fiber Volume Fraction = 2.0
Fiber Type
El Straight End
+ Hooked End
PULL—OUT DISPLACEMENT (x10**-2 inch.)
Fig. 5.10 Pull-Out Stress vs. Displacement of Different High
Strength Concrete and High Strength Fibrous Concrete
77

5.2.2.2 Normalized Load-Displacement Relationship
It was anticipated that there would be a unique relationship of
the load versus the displacement for cementitious materials. However
due to different mix proportions, different amounts of fiber volume
fractions, and the varying strength of the tested specimens, it was
necessary to normalize the results obtained. The load was normalized
with respect to the peak load and the displacement with respect to the
maximum post-peak displacement. For high strength fibrous concrete, the
maximum pull-out displacement was observed to be about half of the
fiber length. Thus the displacement of high strength fibrous concrete
was normalized with respect to the half fiber length.
The normalized post-peak pull-out stress versus pull-out
displacement relationship for high strength concrete, normal concrete
[90,9²], high strength fibrous concrete, and normal fibrous concrete
[17,19] are compared in Figs.5.11 & 5.12. The results show that such a
normalized relationship is unique for both normal concrete
[17,19,90,9²] and high strength concrete. The shape of the unique
normalized curves is associated with the brittle nature of the
cement-based composites. The lower the curve, the more brittle is the
material. Figs.5.11 & 5.1² also confirm that high strength composites
are generally more brittle than normal cemented materials. Similar
conclusions are observed in both the straight-end and the hooked-end
fibers reinforce high strength concrete. Appendices F and G summarize
all the normalized pull-out stress versus displacement curves of both
normal and high strength concrete and high strength fibrous concrete
respectively.
78

NORMALIZED PULL-OUT STRESS VS. DISPL.CEMENT—BASED COMPOSITES (BFS52O)
NORMALIZED PULL—OUT STRESS OFHIGH STRENGTH FIBROUS CONCRETERECTANGULAR STEEL FIBER (1 in. LENGTH.)TYPE : STRAIGHT ENDVOLUME FRACTION :
NORMALIZED PULL—OUT DISPLACEMENTFig. 5.11 Comparison of Normalized Pull-Out Stress vs. Displ.
of Cement-Based Composites (Straight-End Fiber)
NORMALIZED PULL-OUT STRESS VS. DISPL.CEMENT—BASED COMPOSITES (BFH520)
NORMALIZED PULL—OUT STRESS OFHIGH STRENGTH FIBROUS CONCRETESTEEL FIBER 1 in. LENGTH
TYPE : HOOKED ENDASPECT RATIO = 60VOLUME FRACTION
NORMALIZED PULL—OUT DISPLACEMENT
Fig. 5.12 Comparison of Normalized Pull-Out Stress vs. Displ. 79
of Cement-Based Composites (Hooked-End Fiber)

5.3 Fatigue Characteristics
The fatigue characteristics are among the most important
properties of the cement-based composites, especially for high strength
concrete. It is generally agreed that the relative magnitude of the
stress change under repeated load is the most important variable that
influences fatigue life. The reported fatigue strength of normal
concrete is about 60-65 % of fc . In this study, series of experiments
on uniaxial cyclic compression test were conducted on three types of
high strength concrete; superplasticizer concrete, microsilica concrete
and polymer concrete. Maximum stress level varied from 0.4 f to 0.9 fc
while minimum stress level was kept constant at 0.10 f in order to
prevent stress reversal as well as to minimize the effect of capping
and seating of the test fixure. Two different rates of loading, 6 Hz.
and 12 Hz., were used to examine the effect of loading rate.
5.3.1 S-N Curve
The fatigue characteristics of a material subjected to repeated
stress of constant magnitude is known as the S-N curve, where N is the
number of cycles of stress (S), which would cause failure. Each
material has its own unique S-N curve. With the S-N relationship, we
can predict the fatigue life for a given maximum stress level. Fig.5.13
presents the S-N curves of the high strength cement-based composites as
compared to that of normal concrete. The results indicate that the S-N
curve for high strength concretes are not significantly different from
normal concrete, except for polymer concrete because of the extensive
plasticity.
The S-N curve of normal concrete was reported to be bilinear [77]
whereas for high strength concrete, the reported S-N behavior is
linear. The results observed from this study also indicates that the
S-N curve of high strength concrete is linear.
80

S-N CURVEHIGH STRENGTH CONCRETE (COM S—N )
CYCLIC COMPRESSION
O , A = NORMAL CONCRETE ( f c = 4700 psi.)
+ , B 8 SUPERPLASTICIZER CONCRETE (f c ---- 7500 psi.)
O , C MICROSILICA CONCRETE ( = 10000 pal.)
A , D POLYMER CONCRETE ( = 9500 psi.)
X , E MICROSILICA CONCRETE (Loading Rate = 12 Hz.)
POINT BEYOND 1000000 CYCLE, SPECIMEN NOT FAIL
2 4 6
LOG NUMBER OF CYCLE TO FAILURE (LOG N)
Fig. 5.13 Comparison of the S-N Curves of Different High
Strength Concrete with Normal Concrete
81

5.3.2 Fatigue Strength
The term fatigue strength is generally defined as the strength
that fails a specimen after one million cycle of repeated loading. For
normal concrete, the fatigue strength is between 60-65 % of f c . Table
V.6 presents the number of repeated stress to failure of different high
strength concrete. The effect of loading rate is also included. The
results indicate that the fatigue strength of high strength
superplasticizer concrete and microsilica concrete are not significant
different. Also observed was that there was little effect on the
fatigue strength of microsilica concrete when the loading rate was
changed from 6 to 12 Hz. The fatigue strength of superplasticizer
concrete and microsilica concrete is between 70 - 75 % of fc. The
fatigue limit (stress which specimen fails at 10 million cycles) of
high strength concrete is about 66 % of f c compared to about 55 % of f c
[25] for normal concrete. Apperently there is no fatigue limit for
polymer concrete. Figs. 5.14-5.16 show typical fatigue tests for
different high strength concrete with maximum stress level of 0.80 fc .
For polymer concrete, fatigue characteristics are rather different
from normal concrete and high strength concrete. Due to the plasticity
of the matrix, large excessive deformations can easily be visualized
during fatigue tests. Fig.5.17 presents one of the fatigue curves of
polymer concrete sample loaded under a maximum stress range of 0.70 fc .
It can be seen that the strain increment over the first 8011 cycles was
only 0.017 whereas the plastic strain from 8011 to 8051 cycles was
0.023. It was observed that most of the plastic strain in polymer
concrete occured during the later stages just prior to failure. The S-N
curve of polymer concrete indicates the fatigue strength to be as low
as 45 % of fc compared to 70-75 % for high strength concrete and 60-65
% for normal concrete. The results from this study seem to indicate
that for non-plastic brittle concrete, the higher the compressive
strength, the higher is the fatigue strength. Other details of the
compressive stress-strain curves and normalized stress-strain curves of
each fatigue test specimen of different high strength concrete and rate
of loading can be found in Appendices H and I respectively.
82

TABLE V.6 NUMBER OF CYCLES TO FAILURE
UNDER REPEATED LOAD
Type of
Concrete
Maximum stress level (f /fc/fc)
0.90 0.80 0.75 0.70 0.60 0.50 0.40
*
Superplasti- 26 5,875 430,510 M M IA -
cizer Conc. 300 4,096 - M M M -
F 4,566 - 12,299 - - -
F - - - - - -
*
Microsilica 380 4,014 102,200 M M - -
Concrete 204 8,937 196,546 M M - -
6 - - - - - -
608 - - - - - -
F - - - -*
Polymer - 3,608 - 8,650 24,789 121,431 M
Concrete - 4,476 - 8,052 35,034 127,800 M
- - - - 196,800 M
_ - - - - - 11**
Microsilica 24 3,470 161,210 M - - -
Concrete 21 1,431 353,502 M - - -
204 31,683 1291,367 - - - -
- 50,277 - - - - -
Remarks :
- Rate of loading = 6 Hz.
** - Rate of loading = 12 Hz.
83

FATIGUE TESTSUPERPLAST1CIZER CONC., R-6 Hz.(S1F108)
Max. Stress Level = 0.80 f:
A = 1 Cycle
B = 3 Cycles
C 3,950 Cycles
N = 5,872 Cycles
STRAINFig. 5.14 Typical Stress vs. Strain Curve under Cyclic
Compression Test of Superplasticizer Concrete
FATIGUE TESTMICROSILICA CONC., RATE 6 Hz.(M2F208)
Max. Stress Level = 0.80 fc'
A —g 1-3 Cycles
B = 1,280 Cycles
C = 4,970 Cycles
N = 8,937 Cycles
STRAIN
Fig. 5.15 Typical Stress vs. Strain Curve under Cyclic 84Compression Test of Microsilica Concrete (6 Hz)

FATIGUE TESTMICROSILICA CONC., RATE 12 Hz.(M3TF6)
Max. Stress Level = 0.80 fc'
A = 1 Cycle
B = 10,000 Cycles
8 = 31,000 Cycles
N = 31,683 Cycles
STRAIN
Fig. 5.16 Typical Stress vs. Strain Curve under CyclicCompression Test of Microsilica Concrete (12 Hz)
FATIGUE TESTPOLYMER CONCRETE • RATE 6 Hz. (PF207)
STRAIN (In./in.)
Fig. 5.17 Typical Stress vs. Strain Curve under Cyclic 85Compression Test of Polymer Concrete
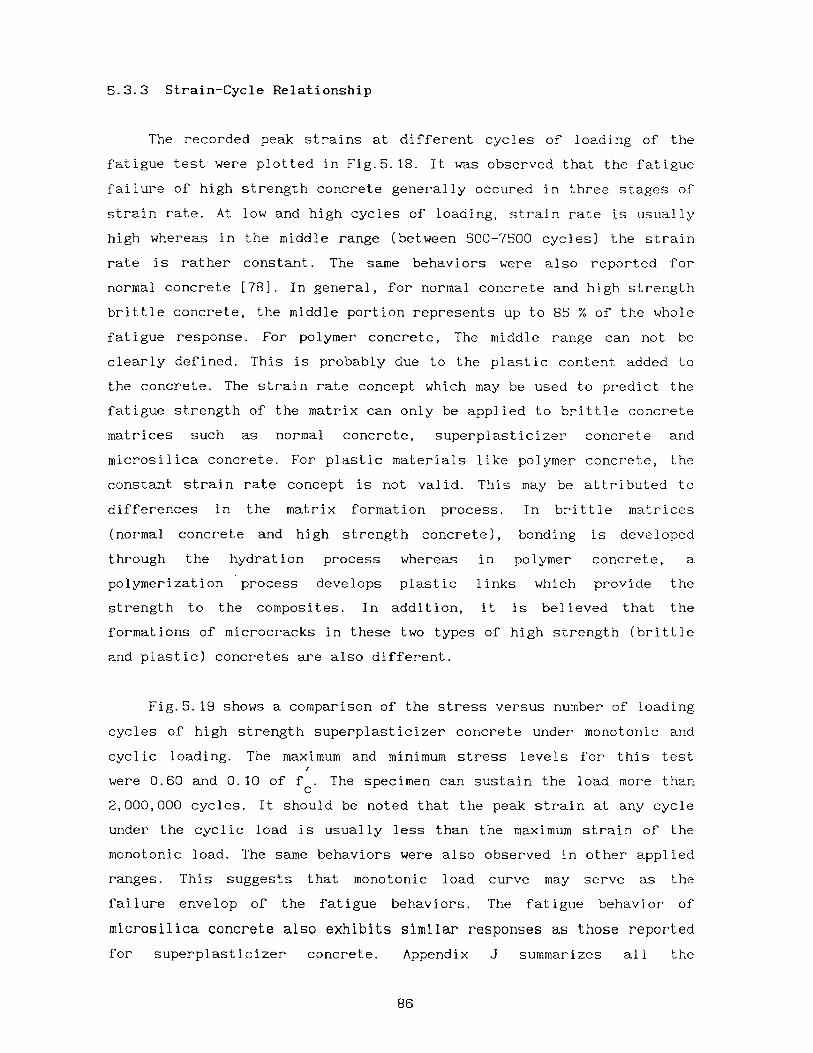
5.3.3 Strain-Cycle Relationship
The recorded peak strains at different cycles of loading of the
fatigue test were plotted in Fig.5.18. It was observed that the fatigue
failure of high strength concrete generally occured in three stages of
strain rate. At low and high cycles of loading, strain rate is usually
high whereas in the middle range (between 500-7500 cycles) the strain
rate is rather constant. The same behaviors were also reported for
normal concrete [78]. In general, for normal concrete and high strength
brittle concrete, the middle portion represents up to 85 % of the whole
fatigue response. For polymer concrete, The middle range can not be
clearly defined. This is probably due to the plastic content added to
the concrete. The strain rate concept which may be used to predict the
fatigue strength of the matrix can only be applied to brittle concrete
matrices such as normal concrete, superplasticizer concrete and
microsilica concrete. For plastic materials like polymer concrete, the
constant strain rate concept is not valid. This may be attributed to
differences in the matrix formation process. In brittle matrices
(normal concrete and high strength concrete), bonding is developed
through the hydration process whereas in polymer concrete, a
polymerization process develops plastic links which provide the
strength to the composites. In addition, it is believed that the
formations of microcracks in these two types of high strength (brittle
and plastic) concretes are also different.
Fig.5.19 shows a comparison of the stress versus number of loading
cycles of high strength superplasticizer concrete under monotonic and
cyclic loading. The maximum and minimum stress levels for this test
were 0.60 and 0.10 of fc . The specimen can sustain the load more than
2,000,000 cycles. It should be noted that the peak strain at any cycle
under the cyclic load is usually less than the maximum strain of the
monotonic load. The same behaviors were also observed in other applied
ranges. This suggests that monotonic load curve may serve as the
failure envelop of the fatigue behaviors. The fatigue behavior of
microsilica concrete also exhibits similar responses as those reported
for superplasticizer concrete. Appendix J summarizes all the
86

compressive stress versus strain curves under monotonic and cyclic
loading of superplasticizer, microsilica and polymer concrete.
87

STRAIN VS. CYCLE CURVEHIGH STRENGTH CONCRETE (COM S—C)
• — NORMAL CONCRETE
+ — SUPERPLASTICIZER CONCRETE
* — MICROSILICA CONCRETE
A — POLYMER CONCRLIE
Fig. 5.18 Typical Peak Strain vs. No. of Cycles of Different
High Strength Cement-Based Composites
MONOTONIC VS. CYCLIC CURVESUPERPLASTICIZER CONCRETE (Si Fl 75)
Monotonic Loading
(Compression Test)
SUPERPLASTICIZER CONCRETE
Monotonic—Cyclic Relationship
Compressive stress, f = 8932 psi.
Max. stress level = 0.603 f:
Min, stress level 0.08 f:
No. of cycle to failure, N > 2,000,000
STRAIN (in./in..)
Fig. 5.19 Typical Monotonic vs. Cyclic Loading 88
Relationship of High Strength Concrete

CHAPTER VI
EMPIRICAL MODEL
6.1 Bond Strength Characteristics
A empirical model of tension softening of concrete is necessary
for analysis and design because to carry out direct tension tests in
brittle material like concrete is very difficult.
6.1.1 Normalized Pull-Out Stress-Displacement Relationships
Since tension softening in brittle composites cannot easily be
obtained from conventional testing machines. Closed-loop testing
machines and very stiff testing machines are the only two means of
obtaining the post-peak tensile responses of concrete. Since these
machines are not commonly available, it is necessary to develop a means
of predicting the tension softening of concrete. The concept of the
normalized stress-displacement law recently developed by Wecharatana
and Shah [19] is revised here to account for post-peak
stress-displacement relationship for cement-based composites as
follows:
(6. 1)
Where
- Post-peak pull-out stress
- Maximum pull-out stress of the cemented compositemax
(Max. post-peak pull-out stress for fibrous concrete)
8 - Post-peak pull-out displacement
- Maximum pull-out displacement of the cemented8max
composite (Half the fiber length for fibrous conc.)
m - Brittleness Index of the composite
89

For Cemented Composite :
τmax - Obtained from the normal testing (pull-out test)
- Obtained from the average grain size of sand as shown` maxin Fig.6.1 [90].
For Fibrous Concrete :
Visalvanich [17] found that the maximum pull-out stress of steel
fiber reinforced mortar can be expressed in terms of the fiber
reinforcing index (Vfl/ø) as :
τmax
= ασVf. 1 (6.2)so
Where
a = Efficiency factor
= Interfacial bond strength
and δmax = Half of the fiber length (l/2)
Since τmax and 6 can be obtained from normal testing methodsmaxand the size of the fiber respectively, the only variable in the
proposed equation is the "BRITTLENESS INDEX". Table VI.1 presents the
values of brittleness index for different types of cement-based
composite, i.e., normal concrete, normal fibrous concrete, high
strength concrete, high strength fibrous concrete with straight-end
fiber, high strength fibrous concrete with hooked-end fiber, and
polymer concrete. Among them, high strength concrete is the most
brittle material and has the lowest brittleness index of 0.20. For
normal concrete, the brittleness index is 0.265.
Figs. 6.2 to 6.8 show comparisons of the proposed equation with
data from the present study and other researchers. The data from
present study are for high strength concrete, high strength fibrous
concrete (straight-end and hooked-end fibers) and polymer concrete. The
data obtained from other researchers are for normal concrete [90], and
normal fibrous concrete [12,17,19]. The results agree closely with the
90

MAXIMUM DISPLACEMENT VS. GRAIN SIZE
7 IC) H z U HX E-+
AVERAGE GRAIN SIZE (x10-2 in.)
Fig.
6.1
Max
imum
Pul
l-Ou
t Di
spla
ceme
nt v
s. A
vera
ge G
rain Size of Sand

value predicted from Equation (6.1) with the different brittleness
index of the composites. The standard errors between the experimental
data and proposed equation are between 0.04 to 0.08 which is very
small. Therefore, the predicted normalized pull-out stress versus
pull-out displacement relationships of the composites obtained from the
proposed equation as shown in Fig.6.8 can then be applied. These
relationships can be used to predict not only the tension softening of
the matrix but also fracture resistance, and energy absorption.
TABLE VI.1 BRITTLENESS INDEX OF THE MATERIALS
Type of MaterialsBrittleness
Index
High Strength Concrete 0.200
High Strength Fibrous Concrete 0.259(Straight End Fiber)
Normal Concrete 0.265
High Strength Fibrous Concrete 0.290(Hooked End Fiber)
Polymer Concrete 0.400
Normal Fibrous Concrete 0.500
92

NORMALIZED STRESS-DISPLACEMENT CURVENORMAL CONCRETE
Normal Concrete
Experiment (Symbols) by T. Cintoro [90]
Proposed Eq. (Solid Line)
Where : Brittleness Index
m = 0.265
Standard Error = .05151
NORMALIZED PULL—OUT DISPLACEMENTFig. 6.2 Comparison of the Proposed Equation with
Normal Concrete Data (T. Cintora [90])
NORMALIZED STRESS-DISPLACEMENT CURVEHIGH STRENGTH CONCRETE
High Strength Concrete
Experiment (Symbols)
Proposed Eq. (Solid Line)
where : Brittleness Index
m 0.20
Standard Error 0.0944
NORMALIZED PULL—OUT DISPLACEMENT
Fig. 6.32 Comparison of the Proposed Equation withHigh Strength Concrete Data (Present Study)
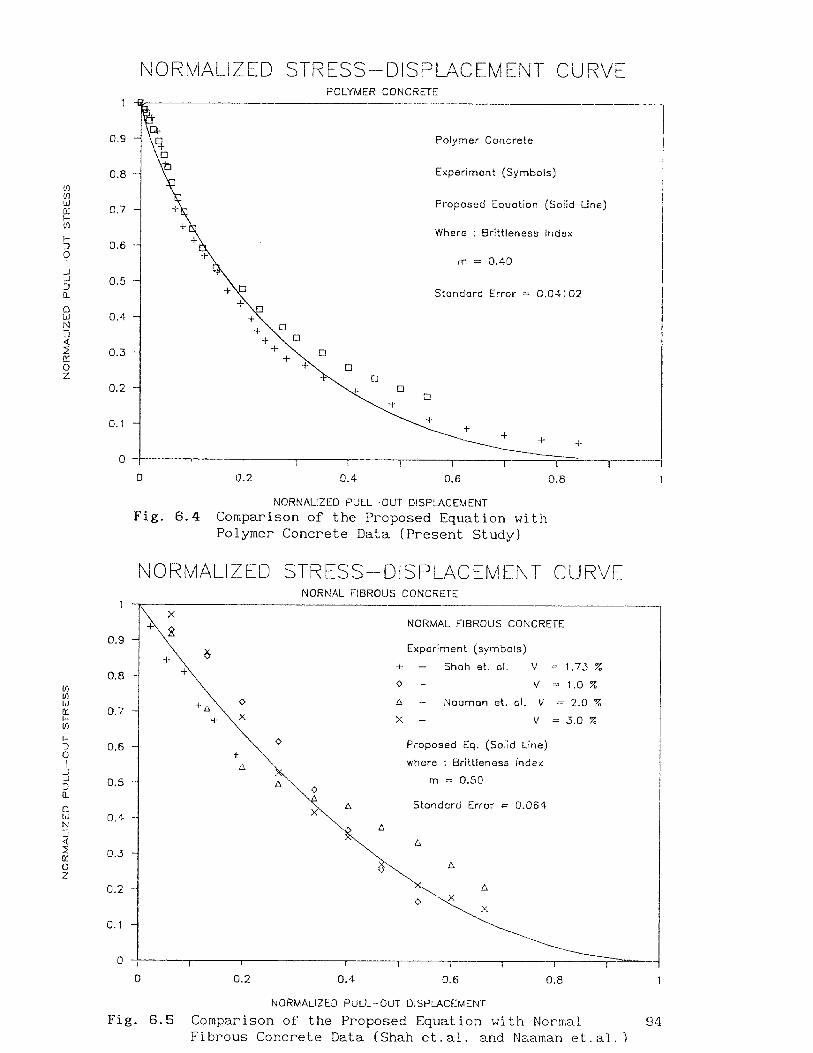
0 0.2 0.4 0.6 0.8
0.9
0.8
0.7
0.6
0.5
0.4
0.3
0.2
0.1
0.9
0.8
0.7
0.6
0.5
0,4
0.3
0.2
0.1
0
NORMALIZED STRESS-DISPLACEMENT CURVEPOLYMER CONCRETE
Polymer Concrete
Experiment (Symbols)
Proposed Equation (Solid Line)
Where Brittleness Index
m = 0.40
Standard Error = 0.04102
NORNALIZED PULL-OUT DISPLACEMENTFig. 6.4 Comparison of the Proposed Equation with
Polymer Concrete Data (Present Study)
NORMALIZED STRESS-DISPLACEMENT CURVNORNAL FIBROUS CONCRETE
XNORMAL FIBROUS CONCRETE
Experiment (symbols)
+ - Shah et. al. V 1.73 %
o - v = 1.0%
A - Naaman et. al. V = 2.0 %X - V = 3.0 %
Proposed Eq. (Solid Line)
where : Brittleness index
m --= 0.50
A Standard Error = 0.064
AA
A
A
0 0.2 0.4 0.6 0.8
NORMALIZED PULL-OUT DISPLACEMENT'
Fig. 6.5 Comparison of the Proposed Equation with Normal 94Fibrous Concrete Data (Shah et.al. and Naaman et.al.)
2

NORMALIZED STRESS-DISPLACEMENT CURVENORMAL FIBROUS CONCRETE
Normal Fibrous Concrete
Proposed Equation (Solid Line)
Where : Brittleness index
m = 0.50
M. Wecharotana's Equation [19] (Symbols)
0 0.2 0.4 0.6 0.8
NORMALIZED PULL—OUT DISPLACEMENT
Fig. 6.6 Comparison of the Proposed Equation with NormalFibrous Concrete Equation (M. Wecharatana [19])
NORMALIZED STRESS-DISPLACEMENT CURVEHSFC (STRAIGHT END FIBER)
High Strength Fibrous Concrete(Straight End Fiber)
Experiment (symbols)
Symbols Fiber Vol. Fraction
2.0 %
1.5 %
A 1.0 %
X 0.5 %
Proposed Equation (Solid Line)
where : Brittleness Index
m = 0.259
Standard Error = 0.072
NORMALIZED PULL—OUT DISPLACEMENT
0
Fig. 6.7 Comparison of the Proposed Equation with High 95Strength Fibrous Concrete (S traight—End Fiber)

NORMALIZED STRESS-DISPLACEMENT CURVEHSFC (HOOKED END FIBER)
High Strength Fibrous Concrete(Hooked End Fiber)
Experiment (symbols)
Symbols Fiber Vol. Fraction
2.0 %
0 1.5 %
A 1.0 %
X 0.5 %
Proposed Equotion (Solid Line)
where : Brittleness Index
m = 0.290
Standard Error = 0.044
NORMALIZED PULL—OUT DISPLACEMENT
Fig. 6.8 Comparison of the Proposed Equation with High
Strength Fibrous Concrete (Hooked-End Fiber)
NORMALIZED STRESS-DISPLACEMENT CURVEPOST—CRACKING (PROPOSED EQUATION)
O = Normal Concrete ( m=0.265
= High Strength Concrete ( m=0.2 )
V = Polymer Cancrete ( m=0.40 )
+ = Normal Fibrous concrete ( m=0.5 )
• = High Strength Fibrous Concrete• (Straight End) ( m=0.259 )
X = High Styrength Fibrous ConcreteX (Hooked End) ( m=0.29 )
NORMALIZED PULL—OUT DISPLACEMENT
Fig. 6.9 Normalized Pull-Out Stress vs. Displacement Curvesnf Cement -Rased Composites from the Pronosed Equation
96
6.1.2 Brittleness Index
For a general cementitious composites, there is a brittleness
number which can be used to predict the basic properties of a
cement-based composite. The lower the value of the brittleness index,
the more brittle the material is. In this study, the brittleness index
(m) has been proposed in the general normalized pull-out stress
displacement relationship. This brittleness index can be used to
predict the softening response of a cementitious composite without
conducting the direct tension test.
In this study, many attempts have been made to define the
brittleness index of the cementitious material. Both compression and
tension behavior (stress and displacement) were evaluated. The more
brittle the material is, the smaller the observed brittleness number.
The stress-strain relationship in compression of brittle material is
quite linear. For the more brittle material, the more linear and
steeper is the compressive stress-strain curve. Thus the brittleness
index cannot be defined from compressive stress-strain relationship.
Furthermore, the direction of the compressive stress is normally
parallel to cracking and therefore not considered to be the direct
crack causing stress.
For tension behavior, many trials were also made on the
load-displacement relationship to evaluate the brittleness index. The
proper definition of the brittleness index found from this present
study is the ratio of the energy absorption at the proportional limit
(Ul ) to the elastic energy absorption at the peak load (Up
) of a direct
tension load-displacement curve (see Fig.6.10).
97

6.1.2.1 BRITTLENESS INDEX MODEL
Pull-Out
Load
Pull-Out Displacement
Fig. 6.10 Pull-Out Test
U1 Brittleness Index, m = (6.3)
Where : U1 = Energy absorption at the proportional limit
U = Elastic energy absorption at the peak load
Energy absorption at the proportional limit (U l ) is the area under
the pull-out load-displacement curve of the pull-out test. The elastic
energy absorption at peak load (U ) is the area under the curve when
the load is released from the peak load to zero. The unloading curve is
assume to be parallel to the initial slope of the load-displacement
curve.
Table VI.2 presents the brittleness index values of all the
pull-out test specimens compared to those from the proposed equation.
The absolute difference between the brittleness index obtained from the
proposed model and equation is between 2 to 8 %, and can be considered
negligible. High strength concrete showed the highest difference in
brittleness index (8.0 %) while high strength fibrous concrete
(straight-end) was the lowest (2.32 %).
98

6.1.2.2 Statistical Analysis
In order to analyse whether the brittleness index of high strength
fibrous concrete is a function of steel fiber volume fraction and/or
fiber type, the two-factor analysis of variance method is employed. The
brittleness index values from different types of fiber and volume
fractions as determined from the proposed model were used in the
analysis (see Table VI.2). The results shown in Table VI.3 indicate
that the brittleness index values are significantly different when
compared among the two fiber types (p < 0.0001) and the four fiber
volume fractions (p < 0.0001). Therefore, it can be stated that the
brittleness index of the high strength fibrous concrete depends on both
the fiber type (Hooked-end and Straight-end) and fiber volume fraction
for the range studied. Thus the normalized pull-out stress-displacement
of high strength fibrous concrete is different according to the fiber
type and fiber volume fraction. However, it should be noted that the
amount of data on which this analysis was performed was relatively
small and could be insufficient to fully justify this conclusion. Thus
the effects of different types of fiber and their volume fractions on
the brittleness index of high strength fibrous concrete still need
further investigation. For normal fibrous concrete, Visalvanich and
Naaman [17] and Wecharatana and Shah [19] stated that the normalized
pull-out stress displacement is unique and independent of fiber volume
fraction. Their conclusions were not, however, confirmed by any
statistical analysis. It is possible that the normalized pull-out
stress displacement may depend on fiber volume fraction and not be
unique if normalized stress-displacement data was statistically
analysed.
From Table VI.2, we can observe that the average values of
brittleness index (m) from the proposed model of high strength fibrous
concrete are very close to the values obtained from the proposed
equation. Since the differences between the brittleness index values
derived from the proposed equation and those obtained from the model
are small (2-8 %), it can be concluded that the values of the
brittleness index established from the model can be used in the
99
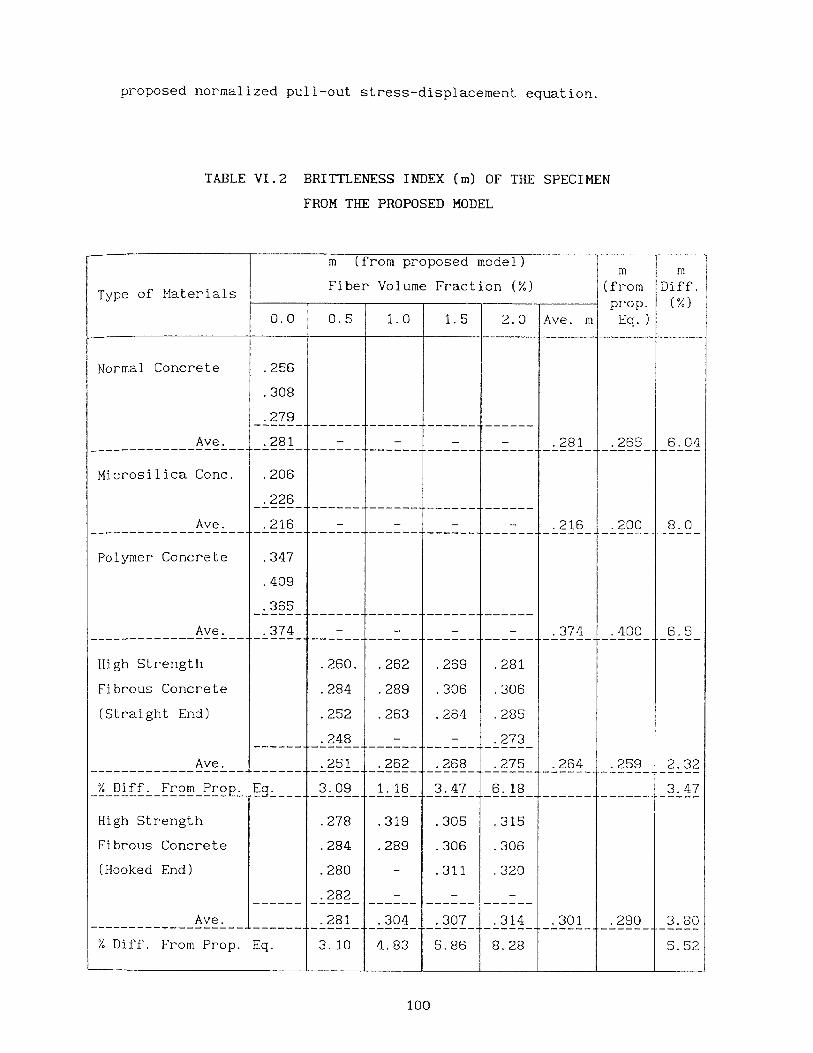
proposed normalized pull-out stress-displacement equation.
TABLE VI.2 BRITTLENESS INDEX (m) OF THE SPECIMEN
FROM THE PROPOSED MODEL
Type of Materials
(from proposed model)
Fiber Volume Fraction (%)
m
(from
prop.
Eq.)
m
Diff.
(%)
0.0 0.5 1.0 1.5 2.0 Ave. m
Normal Concrete .256
.308
.279
Ave. .281 - - - .281 .265 6.04
Microsilica Conc. .206
.226
Ave. .216 - - .216 .200 8.0
Polymer Concrete .347
.409
.365
Ave. .374 - - - - .374 .400 6.5
High Strength .260. .262 .269 .281
Fibrous Concrete .284 .289 .306 .306
(Straight End) .252 .263 .264 .285
.248 - - .273
Ave. .251 .262 .268 .275 .264 .259 2.32
% Diff. From Prop. Eq. 3.09 1.16 3.47 6.18 3.47
High Strength .278 .319 .305 .315
Fibrous Concrete .284 .289 .306 .306
(Hooked End) .280 - .311 .320
.282 - - -
Ave. .281 .304 .307 .314 .301 .290 3.80
% Diff. From Prop. Eq. 3.10 4.83 5.86 8.28 5.52
100

An
ova
tabl
e
Sou
rce:
for
a df:
2-f
act
or
An
aly
sis
of
Va
ria
nce
on
1:
Bri
ttle
ne
ss
Ind
ex
Sum
of S
quar
es:
Mea
n Sq
uar
e:
F-t
est:
P va
lue:
1
Fib
er T
ype
(A)
1.0
09.0
09142.1
66
.000
1%o
(B
)3
.003
.001
17.4
86.0
001
AB3
1.55
2E-4
5.20
7E-5
.853
I .48
33E
rror
I18 S
.001
6.10
6E-5
Ther
e w
ere
no
mis
sin
g ce
lls fo
un
d.
Table
VI.
3 T
wo—
Facto
r A
naly
sis
of
Varia
nce

6.2 Fatigue Characteristics
A theoretical model of fatigue in concrete is desirable in order
to obtain the S-N curve, one of the most important material properties
of concrete, because carrying out fatigue test is difficult and time
consuming.
6.2.1 S-N Curve
Design for fatigue is normally facilitated by the used of a
Modified Goodman diagram or the S-N curve. Fig.5.13 compares the S-N
curves of normal concrete, superplasticizer concrete, microsilica
concrete and polymer concrete. The regression lines shown were obtained
from empirical data and the typical linear equation can be written as
follows :
(6.3)
N = Number of cycle
= Maximum stress levelfmax
fc = Ultimate compressive strength
A,B = Constant coefficients
For different cementitious matrices, these two constants are
listed in Table VI.4
TABLE VI.4 COEFFICIENTS OF A AND B
Type of Concretes A B
Normal Concrete -22.86 21.49
Superplasticizer Concrete -22.40 21.60
Microsilica Concrete -23.66 23.11
Polymer Concrete -5.51 7.87
102

With this proposed S-N equation, we can predict the fatigue life
of the material under a given repeated load.
6.2.2 Maximum Strain Concept
For a given cementitious material, there is a certain amount of
maximum strain that the material can sustain. This maximum strain
property will be used to predict the fatigue behavior of high strength
cement-based composites, namely superplasticizer concrete and
microsilica concrete. For polymer concrete, this maximum strain concept
can not be applied because of the extensive plasticity.
For a cyclic compression test, the maximum strain of the material
is obtained from the uniaxial compression test. In the present study,
the average maximum strain for superplasticizer concrete and
microsilica concrete are 0.00206 and 0.0022 respectively. With these
maximum strain values, we can predict the fatigue life of the specimen.
Figs. 6.11 & 6.12 present the typical peak strain versus number of
cycles of loading which show that the specimens fail within the maximum
strain values. The horizontal dotted lines in these figures are the
maximum strain of the composites obtained from the monotonic
compression test. To predict the number of cycle to failure, the
maximum strain-cycle curve is extrapolated until it intercepts the
horizontal dotted line. The number of load cycle reading at this point
represents the predicted failure cycle of the tested specimen. Figs.
6.11 and 6.12 show that the predicted number of cycle to failure are
4200 and 6 cycles for superplasticizer concrete and microsilica
concrete while the actual number of cycle to failure observed from the
experiments were 4096 and 6 cycles respectively. These relatively good
agreements imply that the concept of maximum strain criteria may be
used to predict the fatigue life of high strength composites. Details
of all other peak strain and number of loading cycles relationships of
superplasticizer, microsilica and polymer concrete are summarized in
Appendix K.
103

STRAIN VS. CYCLE CURVESUPERPLASTICIZER CONCRETE (S1F208)
Max. Stress Level = 0.80 f:
N = 4,096 Cycles
I I I 1 I I I I1 2 3 4
(Thousands)NUMBER OF CYCLES OF LOAD (N)
Fig. 6.11 Typical Peak Strain vs. No. of Loading CyclesCurve of Superplasticizer Concrete
STRAIN VS. CYCLE CURVEMICROSILICA CONCRETE (M2F209)
0
Max. Stress Level = 0.90 fc
N 6 Cycles
2 4 6 8
NUMBER OF CYCLES OF LOAD (N)
Fig. 6.12 Typical Peak Strain vs. No. of Loading Cycles 104Curve of Microsilica

CHAPTER VII
CONCLUSIONS
This investigation yielded a large amount of data on the
compression, tension, and flexural properties as well as the bond
strength-slip relationships and fatigue characteristics of high
strength cement-based composites. The high strength concretes used in
this study were superplasticizer concrete, microsilica concrete and
polymer concrete.
The results from compression tests clearly showed that dry cured
specimens of polymer concrete provided higher strength than wet cured
whereas the same conditions provided lower strength to superplasticizer
and microsilica concrete. This is because the presence of water
interferes with the polymerization process of polymer concrete. Curing
period from 58 to 400 days did not significantly affect the compressive
strength, maximum strain at the peak load, or the modulus of elasticity
of superplasticizer or microsilica concrete. There were, however,
significant differences on these properties for polymer concrete when
tested at 3 and 35 days. The average strain at the peak load of high
strength concrete is about one third less than normal concrete, except
for polymer concrete which is about 4 times higher.
The mode of failure of high strength concrete is different from
normal concrete. High strength concrete will suddenly burst when the
load reaches the peak while for normal concrete the failure process
occurs gradually.
The specimen size affects the flexural strength of high strength
concrete. The ACI flexural equation is very conservative and should be
modified for high strength concrete, especially for polymer concrete.
The tensile strength and energy absorption of high strength
concrete in direct tension tests were 2-3 and 2-7 times higher than
105

normal concrete respectively. Among the high strength concrete, polymer
concrete absorbed the most energy. The pull-out displacement at the
peak load of normal concrete is about 66 % higher than microsilica
concrete but about 200 % lower than polymer concrete.
The results of bond strength in reinforced high strength concrete
study indicated that the larger the bar diameter the lower the bond
strength, bond factor and slip. The bond factor for high strength
concrete was 0.212 which is low when compared to normal concrete
(0.¹5-0.60). The bond slip of these high strength concretes was also
low, about 10 % of normal concrete. Therefore, if high strength
concrete is used, additional development length should be considered.
The results from high strength fibrous concrete tests clearly
indicated that the bond stress-displacement relationship was affected
by the fiber type and fiber content. The higher the fiber volume
fraction, the larger are the peak stress and the amount of energy
absorption. The post-peak pull-out stress versus displacement
relationship gradually drops to zero for straight-end fiber while for
hooked-end fiber it drops in a series of envelopes down the post-peak
portion of the curve. This is probably because of the slip at the end
of the hooked-end fiber.
The unique normalized pull-out stress versus pull-out displacement
of high strength concrete and high strength fibrous concrete (both
straight-end and hooked-end fiber) were obtained. These unique
normalized relationships were statistically found to be dependent of
both the fiber type and the fiber volume fraction.
The normalized post-peak pull-out stress versus normalized
pull-out displacement equation for cementitious composites, contains
only one single material parameter called Brittleness Index, is
proposed. The brittleness index varies with the type of cementitious
composites. The more brittle the material, the lower the brittleness
index is. The proposed brittleness index is defined as the ratio of the
energy absorption at the proportional limit (U l ) to the elastic energy
106

absorption at the peak load (U ) of the direct tension
load-displacement curve. This relationship determines the brittleness
value of the material without conducting the post-peak direct tension
test. The normalized post-peak stress displacement equation can be used
to predict not only the tension softening but also fracture resistance
and energy absorption of cementitious materials.
The fatigue strength of superplasticizer and microsilica concrete
is between 70-75 % of fc
compared to 60-65 % of fc
for normal concrete
and 45 % of fc for polymer concrete. The fatigue limit of high strength
concrete is about 66 % of fc
compared to 55 % of fc
[25] for normal
concrete. There was no fatigue limit for polymer concrete. The results
in this study indicate that the higher the compressive strength, the
higher the fatigue strength of non-plastic concrete is likely to be.
The peak strain at any cycle under the cyclic loading is always
less than the maximum strain of the monotonic load. Therefore the
maximum strain concept may be used to predict the fatigue life. This
maximum strain concept is not valid for polymer concrete because of its
plasticity.
The linear regression equations of S-N curves for different high
strength concrete were proposed in terms of loading stress and number
of cycles. This equation can be used to predict the fatigue life of
high strength cement-based materials.
107

FUTURE RESEARCH
For future investigation on bond and fatigue characteristics of
high strength concrete, the author would like to suggest as follows
1. Different high strength cement-based composites should be used.
2. For bond strength of reinforced high strength concrete study,
strain gauges should be attached to the reinforcing bar in
order to examine the bond-slip relationship and bond stress
distribution.
3. For high strength fibrous concrete study, other sizes and
shapes (rectangular, dog-bone, notched and unnotched and etc.)
of the direct tension specimen should be tested in order to
take into account the possible effects due to geometry and
size. The results should then be compared to the proposed
general equation in this dissertation. Different types and
sizes of fiber should also be studied.
4. For fatigue characteristics, the effect due to different stress
range of cyclic compression should be studied. Also, cyclic
tension and reverse loading of high strength concrete need more
investigation.
108

APPLICATIONS OF THE OBSERVED BEHAVIORS
The applications of the observed behaviors on bond and fatigue
characteristics of high strength cement-based composites in this study
can be summarized as follows
1. In recent years nonlinear finite element analysis and other
numerical methods have proved to be efficient and highly accurate. Thus
information on the softening response of cementitious composites
(complete stress-displacement curve) is necesssry to develop an
accurate crack model. Due to the brittle nature of cementitious
composites and the unavailability of equipment stiff enough to control
the cracking process, it is difficult to obtain the complete
stress-displacement curve. Therefore, in this study, attempts to use
the brittleness index to predict direct tension post-peak responses of
cementitious material will be carried out.
2. From the bond characteristics study, the bond stress-slip
relationship is developed to define the proper embedment length for
steel reinforced high strength concrete.
3. The S-N curve is the most fundamental property of the fatigue
characteristics of the material. In order to determine the S-N curve, a
time consuming fatigue test has to be conducted. In this study,
attempts were made to use the value of brittleness index or the maximum
strain concept of the material to obtain the S-N curve.
4. The S-N curve developed from a compression test may be used to
predict the fatigue life of beam.
109

BIBLIOGRAPHY
[11 V.V. Bertero, "Proc. of High Strength Concrete", Workshop, S.P.Shah, Editor, University of Illinois at Chicago, Circle, Dec. 2-4,1979, pp. 96-167.
[2] John Albinger and Jaime Moreno, S.E., "High Strength Concrete",Chicago Style., Concrete Construction, Vo1.26, March 1981, pp.241-245.
[3] Merlin D. Copen, "Problems Attending Use of High Strength Concretein Thin Arch Dams", ACI Journal, Vol.75, No.4, April 1975, pp.138-140.
[4] Saucier K.L., "High-Strength Concrete, Past, Present, Future".,Paper presented at the 1979 Annual Convention. American ConcreteInstitute, Milwaukee, Wisconsin, March 18-23, 1979, 11 p.
[5] ACI Committee 363, "State-of-the-Art Report on High StrengthConcrete" ACI Journal, July-August 1984, pp. 364-411.
[6] S.P. Shah, Ulker Gokoz and Fahad Ansari, "An Experimental Techniquefor Obtaining Complete Stress-Strain Curves for High StrengthConcrete, Cement, Concrete and Aggregates", CCAGDP, Vol.3, No.1,Summer 1981, pp. 21-27.
[7] H. Martin, Proc. Inter. Conf. on "Bond in Concrete", Paisley,Scotland, June 1982, pp. 289-299.
[8] A. Windisch, "A Modified Pull-Out Test and New Evaluation Methodsfor a More Real Local Bond Slip Relationship", Material andStructure (RILEM) 1985.
[9] RILEM / CEB / FIP RECOMMENDATION. "Bond test reinforcing steel,Materials and Structures, Vol.6, No.32, 1973, pp. 97-105.
[10] A.D. Edwards and P.J. Yannopoulos, "Local Bond-Stress to SlipRelationship for Hot Rolled Deformed bars and Mild Steel PlainBars", ACI Journal, March 1979, pp. 405-420.
[11] Saeed M. Mirza and Jules Houde, "Study of Bond Stress-SlipRelationships in Reinforced Concrete", ACI Journal, January 1979,pp. 19-46.
[12] A.E. Naaman and S.P. Shah, "Pull-Out Mechanism in SteelFiber-Reinforced Concrete", ACI Journal, August 1976, pp.
110

¹537-1547.
[13] A. Burakiewicz, "Testing of Fiber Bond Strength in Cement matrix",Proceedings, RILEM Symposium on Testing and Test Methods of FibreCement Composites, Edited by R.N. Swamy, The Construction Press,1978, pp. 355-365.
[14] D.J. Pinchin and D. Tabor, "Interfacial Contact Pressure andFrictional Stress Transfer in Steel Fiber", Proceedings, RILEMSymposium on Testing and Test Methods of Fibre Cement Composites,Edited by R.N. Swamy, The Construction Press, 1978, pp. 337-344.
[15] R.J. Gray and C.D. Johnson, "The Measurement of Fibre-MatrixInterfacial Bond Strength in Steel Fibre-'Reinforced CementitiousComposites", Proceedings, RILEM Symposium on Testing and TestMethods of Fibre cement Composites, Edited by R.N. Swamy, TheConstruction Press, 1978, pp. 317-328.
[16] Magne Maage, "Fibre Bond and Friction in Cement and Concrete",Proceedings, RILEM Symposium on Testing and Test Methods of FibreCement Composites, Edited by R.N. Swamy, The Construction Press,1978, pp. 329-336.
[17] K. Visalvanich and A.E. Naaman, "Fracture Model for FiberReinforced Concrete", ACI Journal, No, 80-14, March-April 1983,pp. 128-138.
[18] V.S. Gopalaratnum and S.P. Shah, "Tensile Failure of SteelFiber-Reinforced Mortar, Journal of Engineering Mechanics,Vol.113, No.5, May 1987.
[19] M. Wecharatana and S.P.Shah, "A Progress Report on FractureToughness of Fiber Reinforced Concrete", Department of CivilEngineering, Northwestern University, June 1983.
[20] 0. Graf and E. Brenner, "Experiments for Investigating theResistance of Concrete Under Often Repeated Loads", (Versuche ZurErmittlung der Widerstandsfahigkeit Von Beton gegen oftmalsWiederholte Druckbelastung), Bulletins No.76 and No.83, DeutscherAusschuss fur Eisenbeton, 1934, 1936.
[21] K. Aas-Jakobsen, "Fatigue of Concrete Beams and Columns", BulletinNo. 70-1, NTH Institute of Betonkonstruksjoner, Trondheim, Sep.1970, pp. 148.
[22] R. Tepfers and T. Kutti, "Fatigue Strength of Plain, Ordinary, andLightweight Concrete", ACI Journal, Title No.76-29, May 1979, pp.635-653.
[23] H. Rusch, "Researches Toward a General Flexural Theory for
111
Structural Concrete", ACI Journal, Proceedings, Vol.57, No.1, July1960, pp. 1-28.
[24] J.W. Galloway and K.D. Raithby, "Effect of Rate of Loading onFlexural Strength and Fatigue Performance of Concrete", TRRLReport, No. LR547, Transport and Road Research Laboratory,Crownthorne, Berkshire, 1972, 18 p.
[25] C.E. Kesley, "Effect of Speed of Testing on Flexural FatigueStrength of Plain Concrete", Proceedings, Highway ResearchBoard, Vol.32, 1953, pp. 251-258.
[26] M.E. Awad and H.K. Hilsdorf, "Strength and DeformationCharacteristics of Plain Concrete Subjected to High Repeated andSustained Loads", ACI Journal, SP 41-1, 1974, pp. 1-13.
[27] P.R. Spark, "The Influence of Rate of Loading and MaterialVariability on the Fatigue Characteristics of 'Concrete", AmericanConcrete Institute Publication, SP-75, Fatigue of ConcreteStructure, 1982 pp. 331-341.
[28] M. Saito and S. Imai, "Direct Tensile Fatigue of Concrete by theuse of friction grips", ACI Journal, Title No. 80-42, Sep-Oct1983, pp. 431-438.
[29] R. Tepfers, "Tensile Fatigue Strength of Plain Concrete", ACIJournal, Title No.76-39, August 1979, pp. 919-933.
[30] R.Tepfers, J. Carlin and T. Samuelsson, "Concrete subjected toPulsating Load and Pulsating Deformation of Different PulseWaveforms", Nordisk Betong, No.4, 1973, pp. 27-36.
[31] John W. Murdock and Clyde E.Kesler, "Effect of Range of Stress onFatigue Strength of Plain Concrete Beams", ACI Journal, Aug. 1958,pp. 221-231.
[32] H.A. Williams, "Fatigue Tests of Lightweight Aggregate ConcreteBeams", ACI Journal, April 1943, Proceeding Vol.39, pp. 441-448.
[33] H.E. Clemmer, "Fatigue of Concrete", Proceeding, ASTM Vol. 22,Part II, 1922, pp. 408-419.
[34] John T. Mc.Call, "Proability of Fatigue Failure of PlainConcrete", ACI Journal, Aug 1958, pp. 233-244.
[35] R. Tepfers, "Fatigue of Plain Concrete subjected to StressReversals", ACI Publication, SP-75-9, 1986, pp. 195-215.
112

[36] VIP Commission, "Methods of Achieving High Strength Concrete", ACIJournal, Vol.64, No.1, January 1967, pp. 45-48.
[37] Katharine Mather, "High Strength, High Density Concrete", ACIJournal, Vol 62, No.8, Aug. 1965, pp.951-962.
[38] A.J. Harris, "High Strength Concrete : Manufacture andProperties", The Structural Engineer, November 1969, Vol.47,No.11, pp. 441-446.
[39] J.J. Beaudoin and R.F. Feldman, "High-Strength Cement Paste-ACritical Appraisal", Cement and Concrete Research, Vol.15, 1985,pp. 105-116.
[40] Cameron Macinnis and Donald V. Thomson, "Special Techniques forProducing High Strength Concrete", ACI Journal, Dec. 1970, pp.996-1002.
[41] Ramnath N. Swamy, "Properties of High Strength Concrete, AmericanSociety for Testing and Material, 1986.
[42] E.J. Sellevold and F.F. Radjy, "Condensed Silica Fume(Microsilica) in Concrete : Water Demand and StrengthDevelopment", ACI. SP.79-35, June 5, 1986.
[43] G. Carette and V.M. Malhotra, "Early-Age Strength Development ofConcrete-Incorporation Fly Ash and Condensed Silica Fume", ACI,SP.79-35, June 5, 1986.
[44] ACI, "High Strength Concrete Seminar Course Manual/SCM-15(87)",1987, pp. 765-784.
[45] R.L. Carrasquillo, Mater. Res. Soc. Proc. 42 Nov.,1984, pp.¹51-168.
[46] S.H. Ahmad, and S.P. Shah, Mat. Res. Soc. Sym. Proc. 42, pp.169-181.
[47] R.N. Swamy, ASTM, "Cement, Concrete and Aggregates", CCAGDP, 8,No.1, Summer 1986, pp. 33-41.
[48] R.N. Swamy and K.L. Anand, "Shrinkage and Creep Properties of HighStrength Structural Concrete", Civil Engineering and Public Worksand Review, Vol.68, No.807, Oct. 1973, pp. 859-868.
[49] Pierre-Claude Aictin, pierre Laplante and claude Benard,"Development and Experimental use of a 90 MPa(13,000 psi) FieldConcrete", ACI. SP.-87-5, 1986.
113

[50] Arthur H. Nilson (FACI), "Design Implications of Current Researchon High Strength Concrete", ACI, SP.-87-7, 1986.
[51] R.N. Swamy and A.B. Ibrahim, "Shrinkage and Creep Properties ofHigh Early Strength Structural Lightweight Concrete", Institute ofCivil Engineers, Proceedings, Vol.55, Sept 1973, pp. 635-646.
[52] Seven Thaulow, "Tensile Splitting Test and High Strength ConcreteTest Cylinders", ACI, Vol.53, No.7, Jan. 1957, pp. 699-706.
[53] R.N. Swamy, "High Strength Concrete-Material Properties andStructural Behavior", ACI, SP-87-8, 1986.
[54] S.E. Swartz, A. Nikaren, H.D. Narayan Baber, N. Perigakaruppan,T.M.E. Refai, "Structural Bending Properties of high StrengthConcrete", ACI, SP-87-9, 1986.
[55] Andrew G.Mphonde, Gregory C. Frantz, "Shear Test of High and Lowstrength concrete with Stirrups", ACI, SP-87-10, 1986.
[56] Robert C. Chen, Ramon L. Carrasquillo, David W. Power, "Behaviorof High Strength Concrete Under Uniaxial and Bending Compression",ACI, SP-87-14, 1986.
[57] Hudson, J.A., Crouch, S.L., and Fairhurst, C., "Soft, Stiff andServo-Controlled Testing Machines : A Review with Reference toRock Failure", Engineering Geology, Vol.6, No.3, 1972, pp.155-189.
[58] M.U. Haddad, D.W. Fowler, and D.R. Paul, "Factors Affecting theCuring and Strength of Polymer Concrete", ACI Journal, Sep.-Oct.1983, pp. 396-402.
[59] S.A. Frondistou-Yannas and S.P. Shah, "Polymer Latex ModifiedMortor", ACI Journal, January 1972, pp. 61-65.
[60] Wecharatana, M., and Lin, C.C., "New Polymer Concrete for MarineStructures", Final Report, Submitted to the New Jersey MarineSciences Consortium, New Jersey Sea Grant, Grant No. R/N-10,September 1988.
[61] Hanle B. Brettmann, David Darwin, and Rex c. Donahey, "Bond ofReinforcement to Superplasticizer Concrete, ACI Journal,Jan.-Feb., 1986, pp. 98-107.
[62] T.S. Shih, G.C. Lee, and K.C. Chang, "Local Concrete-Steel BondBehavior at Low Temperature", Journal of Structural Engineering,Vol. 113, No.11, Nov 1987.
114

[63] H. Sagar and F.S. Rostasy, "The Effect of Elevated Temperature onthe Bond Behavior of Embedded Reinforcing Bars", Proc. Inter.Conf. on Bond in Concrete, Paisley, Scotland, June 1982, pp.206-216.
[64] R. Bayles, P.D. Morley and M.R. Khan, "The Behavior of ReinforcedConcrete at Elevated Temperatures with Particular Reference toBond Strength", Proc. Inter. Conf. on Bond in Concrete, Paisley,Scotland, June 1982, pp. 217-228.
[65] U. Diederiches and U. Schneider, "Changes in Bond Behavior due toElevated Temperatures" , Proc. Inter. conf. on Bond in Concrete,Paisley, Scotland, June 1982, pp. 229-238.
[66] Neil M. Hawkins, I.J. Lin and F.L. Jeang, "Local Bond Strength ofConcrete for Cyclic Reverse Loading", proc. Inter. Conf. on Bondin Concrete, Paisley, Scotland, June, pp. 151-161.
[67] M. Arnaud, M. Bourabrab and M. Lorrain, "On the ReversibilityProperties of Bond in Concrete", Proc. Inter, Conf. on Bond inConcrete, Paisley, Scotlant, June 1982, pp. 162-172.
[68] E. Vas and H.W. Reinhardt, "Bond Stress-Slip Behavior of DeformedBars, Plain Bars and Strands under Impact Loading", Proc. Inter.Conf. on Bond in Concrete, Paisley, Scotlant, June 1982, pp.173-182.
[69] F.S. Rostasy and B. kepp, "Time-Dependence of Bond", Proc. Inter.Conf. on Bond in Concrete, Paisley, Scotland, June 1982, pp.183-192.
[70] P. Plaines, T. Tassios and E. Vintzileou, "Bond Relaxation andBond Slip Creep under Monotonic and Cyclic Actions", Proc. Inter.Conf. on Bond in Concrete, Paisley, Scotland, June 1982, pp.193-205.
[71] Manfred Keuser and Gerhard Mehlhorn, "Finite Element Models forBond Problems", possible publication on ASCE, Oct. 9, 1988.
[72] Emory L. Kemp, "Bond in Reinforced Concrete : Behavior and DesignCriteria", ACI Journal, No.-83-7, Jan.-Feb., 1986, pp. 50-57.
[73] G. Nammur Jr. and A.E. Naaman, "A Bond Stress Model For FiberReinforced Concrete Based on Bond Stress-Relationship".
[74] Van Ornum, J.L., "Fatigue of Cement Products", Transactions, ASCE,Vol.51, 1903, pp. 443.
115

[75] Van Ornum,J.L., "Fatigue of Concrete", Transactions, ASCE, Vol.58,1907, pp. 294-320.
[76] Gene M. Nordby, "Fatigue of Concrete-A Review of Research", ACIJournal, Aug. 1958, pp. 191-217.
[77] Thomas T.C. Hsu, "Fatigue of Plain Concrete", ACI Journal, TitleNo. 78-27, July-August 1981, pp. 292-305.
[78] P.R. Sparks and J.B. Menzies, "The effect of Rate of Loadingupon the Static and Fatigue Strengths of Plain Concrete inCompression", Magazine of Concrete Research, Vol. 25, No. 83, June1973, pp. 73-80.
[79] D.C. Spooner, "Stress-Strain-Time relationships for Concrete",Magazine of Concrete Research, Vol. 23, No. 75-76, June-September1971, pp. 127-131.
[80] W.H. Gray, J.F. Mc Laughlin and J.D. Antrim, "Fatigue Propertiesof Lightweight Aggregate Concrete", ACI Journal, Title no. 58-6,August 1961, pp. 149-161.
[81] F.S. Ople, Jr. and C.L. Hulsbos, "Probable Fatigue life of PlainConcrete with Stress Gradient", Research Report, ACI Journal,Title No. 63-2, January 1966, pp. 59-81.
[82] K.D. Raithby and J.W. Galloway, "Effects of Moisture Condition,Age, and Rate of Loading on Fatigue of Plain Concrete", ACIPublication, SP-41-2, 1974, pp. ¹5-34.
[83] H.K. Hildorf and Clyde E. Kesler, "Fatigue Strength of ConcreteUnder Varying Flexural Stresses", ACI Journal, Title NO. 63-50,Oct. 1966, pp. 1059-1076.
[84] S.S. Takhar, I.J. Jordaan and B.R. Gamble, "Fatigue of ConcreteUnder Lateral Confining Pressure", ACI Publication, SP.-41-4,1974, pp. 59-69.
[85] R. Tepfers, J. Gorlin and T. Samuelsson, "Concrete Subjected toPulsating Load and Pulsating Deformation of Different PulseWave-Form", Nordisk Betong, No. 4, 1973, pp. 27-36.
[86] E.W. Bennett and S.E. St. J. Muir, "Some Fatigue Tests on HighStrength Concrete in Axial Compression", Magazine of ConcreteResearch, Vol.19, No.59, June 1967, pp. 113-117.
[87] C.M. Eric and Thomas T.C.Hsu, "Biaxial Compression Fatigue of
116

Concrete", Research Report UHCE 86-17, University of Houston,Dept. of Civil Engineering, Dec. 1986.
[88] Wecharatana, M., and Lin, C.C., New Polymer Concrete for ShoreProtection and Marine Structures", Progress Report, submitted tothe New Jersey Sciences Consortium, New Jersey Sea Grant, GrantNo. PIN-10, September 1986, 11 p.
[89] "Polymer Concrete", ACI SP-89, J.T. Dikeou and D.W. Fowler,Editors, American Concrete Institute, 1985, 346 p.
[90] T. Cintora, "Softening Response of Concrete in Direct Tension",Master Thesis, New Jersey Institute of Technology, Nov. 12, 1987,79 p.
[91] "Polymer Modified Concrete", ACI SP-99, D.W. Fowler, Editor,American Concrete Institute, 1987, 214 p.
[92] M. Wecharatana, and W.J. Chiou, Proc. 1986 SEM, Spring Conf., June1986, pp. 23-30.
[93] M. Wecharatana and S. Chimamphant, "Bond Strength of Deformed Barsand Steel Fibers in High Strength Concrete", Materials ResearchSociety, Symposium Proceedings, Vol.114, Bond in CementitiousComposites, Editors S. Mindess and S.P. Shah, Dec. 1987, pp.245-254.
[94] S. Chimamphant and M. Wecharatana, "Fatigue Characteristics ofHigh Strength Cementitious Composites", The Second EastAsia-Pacific Conference on Structural Engineering andConstruction, Jan. 1989.
[95] S. Chimamphant and M. Wecharatana, "Bond-Slip Characteristics ofReinforcement in High Strength Concrete", The Second EastAsia-Pacific Conference on Structural Engineering andConstruction, Jan. 1989.
[96] M. Wecharatana, S. Chimamphant and C.C. Lin, "New Polymer Concretefor Marine Structures", The Second East Asia-Pacific Conference onStructural Engineering and Construction, Jan. 1989.
[97] S. Chimamphant and M. Wecharatana, "Bond-Slip Characteristics ofHigh Strength Fibrous Concrete", To be submitted for possiblepublication in Apr. 1989, ACI Journal.
117

APPENDIX A

Appendix A 119
STRESS VS. STRAIN CURVENORMAL CONCRETE (SN1)
STRAIN (in./in)
STRESS VS. STRAIN CURVENORMAL CONCRETE (SN2)
a
soILI
vtS• 3> 0
Uiv
200
w
13coor
W 3> 0
0U
V) I-

Appendix A 120
STRESS VS. STRAIN CURVENORMAL CONCRETE (SN3)

Appendix A 121
STRESS VS. STRAIN CURVSUPERPLASTICIZER CONCRETE. (S1 S1)
STRESS VS. STRAIN CURVESUPERPLASTICIZER CONCRETE (S1 S2)

Appendix A 122
STRESS VS. S-RAIN CURVESUPERPLASTICIZER CONCRETE (S1S1 06)
STRAIN (in./in.)
STRESS VS. STRAI \CURVESUPERPLASTICIZER CONCRETE (S S206)
STRAIN (in./in.)

Appendix A 123
STRESS VS. STRAIN CURVESUPERPLASTICIZER CONCRETE (S15306)
STRAIN
STRESS VS. STRAIN CURVESUPERPLASTICIZER CONCRETE (S1S406)
STRAIN (in./in.)

Appendix A 124
STRESS VS. STRAIN CURVESUPERPLASTICIZER CONCRETE (S1 S1 09)
STRESS VS. STRAIN\ CURVESUPERPLASTICIZER CONCRETE (S1S209)
STRAIN (in./in.)

Appendix A 125
STRESS VS. STRAIN CURVESUPERPLAST1CIZER CONCRETE (S1 S309)
STRESS VS. STRAIN CURVESUPERPLASTICIZER CONCRETE (Sin 06A)
STRAIN (in./in)

Appendix A 126
STRESS VS. STRAIN CURVSUPERPLASTICIZER CONCRETE (SiF206A)
STRESS VS. STRAIN CURVESUPERPLASTICIZER CONCRETE (Si F207A)
STRAIN (in./in.)

Appendix A 127
STRESS VS. STRAIN CURVESUPERPLASTICIZER CONCRETE (S1 F307A)
STRESS VS. STRAIN CURVESUPERPLASTICIZER CONCRETE (Si Fl 75A)
STRAIN (in./in.)

Appendix A 128
STRESS VS. STRAIN CURVEMICROSILICA CONCRETE. (M1S1)
STRAIN (In./in.)
STRESS VS. STRAIN CJRVEMICROSILICA CONCRETE (M1 S2)
STRAIN (in./in.)

Appendix A 129
STRESS VS. STRAIN CURVEMICROSILICA CONCRETE (M153)
STRESS VS. STRAIN CURVEMICROSILICA CONCRETE NISI 08)
STRAIN (in./in.)
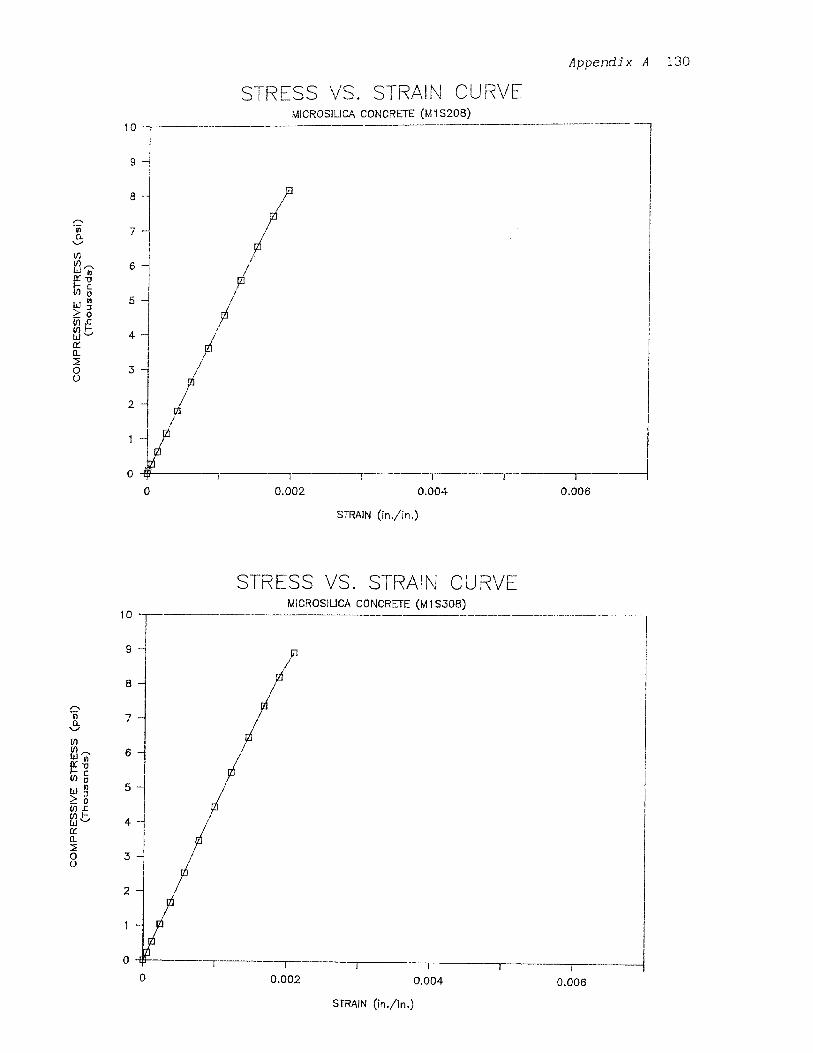
Appendix A 130
STRESS VS. STRAIN CURVE_MICROSILICA CONCRETE (M1 S208)
STRAIN (in./in.)
STRESS VS. STRAIN CURVEMICROSILICA CONCRETE OA 1 S308)
STRAIN (in./in.)

Appendix A 131
STRESS VS. STRAIN CURVMICROSILICA CONCRETE (M1S109)
STRESS VS. STRAIN CURVEMICROSILICA CONCREIE (M1 S209)
STRAIN (in./in.)

Appendix A 132
STRESS VS. STRAIN CURVEMICROSILICA CONCRETEIt (A41 S309)
STRAIN (in./in.)
STRESS VS. STRAIN CL RVEMICROSILICA CONCRETE (M2S107)
STRAIN (in./in.)

Appendix A 133
STRESS VS. STRAIN CURVEMICROSILICA CONCRETE I E (M2S207)
STRESS VS. STRAIN CURVEMICROSILICA CONCRETE (M2S307)
S I STRAIN (in./in.)

Appendix A 134
STRESS VS. STRAIN CURVEMICROSILICA CONCRETE OA I F207A)
STRAIN (In./In.)
STRESS VS. STRAIN CURVEMICROSILICA CONCRETEI (M2F175A)
STRAIN (in./in.)

Appendix A 135
STRESS VS. STRAIN CURVEMICROSILICA CONCRETE (M2F475A)
STRAIN (In./in.)
STRESS VS. STRAIN CURVEMICROSILICA CONCRETE (M3S1)
STRAIN (in./in.)

Appendix A 136
STRESS VS. STRAIN CURVEMICROSILICA CONCRETE (M3S3)
STRAIN (in./in.)
STRESS VS. STRAIN CURVEMiCROSILICA CONCRETE (M3S4)
STRAIN (in./in.)

Appendix A 137
STRESS VS. STRAIN CURVEMICROSILICA CONCRETE (M3TF11A)
STRESS VS. STRAIN CURVEMICROSILICA CONCRETE (M3TF12A)

Appendix A 138
STRESS VS. STRAIN CURVE.MICROSILICA CONCRETE (SS31)
STRESS VS. STRAIN CURVEMICROSILICA CONCRETE (SS32)
0 0.002 0.004 0.006
STRAIN (in./in.)

Appendix A 139
STRESS VS. STRAIN CURVEMICROSILICA CONCRETE (SS33)
9
STRESS VS. STRAIN CURVEMICROSILICA CONCRETE (SS41)
STRAIN (in./in.)

Appendix A 140
STRESS VS. STRAIN CURVEMICROSILICA CONCRETE (SS42)
STRESS VS. STRAIN CURVEMICROSILICA CONCRETE (SS43)
STRAIN (in./in.)

Appendix A 141
STRESS VS. STRAIN CURVEMICROSILICA CONCRETE (SS61)
STRAIN (in./in.)
STRESS VS. STRAIN CURVEMICROSILICA CONCRETE (SS62)
STRAIN (in./in.)
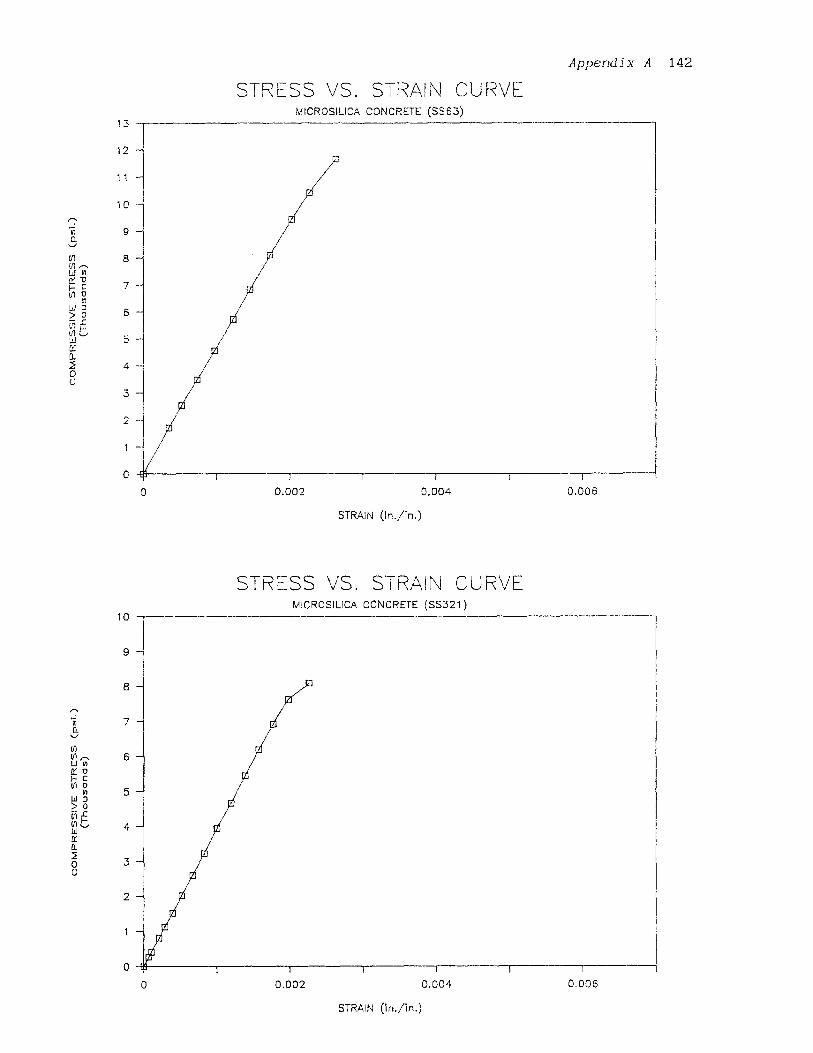
Appendix A 142
STRESS VS. STRAIN CURVEMICROSILICA CONCRETE (SS63)
STRESS VS. STRAIN CURVEMICROSILICA CONCRETE (SS321)
STRAIN (in./in.)

Appendix A 143
STRESS VS. STRAIN CURVEMICROSILICA CONCRETE (SS331)
STRAIN (In./1n.)
STRESS VS. STRAIN CURVEMICROSILICA CONCRETE (Si 1)
STRAIN (in./n.)

Appendix A 144
STRESS VS. STRAIN CURVEMICROSILICA CONCRETE (S12)
0 0.002 0.004 0.006
STRAIN (in./in.)
STRESS VS. STRAIN CURVEMICROSILICA CONCRETE (S13)
STRAIN (in./in.)

Appendix A 145
STRESS VS. STRAIN CURVEMICROSILICA CONCRETE (S21)
STRAIN (in./in.)
STRESS VS. STRAIN CURVEMICROSILICA CONCRETE (S22)
STRAIN (in./in.)

Appendix A 146
STRESS VS. STRAIN CURVEMICROSILICA CONCRETE (S23)
STRAIN (in/in.)
STRESS VS. STRAIN CURVEMICROSILICA CONCRETE (S31)
STRAIN (in./in.)

Appendix A 147
STRESS VS. STRAIN CURVEMICROSILICA CONCRETE (S32)
STRAIN (in./in.)

Appendix A 148
STRESS VS. STRAIN CURVEPOLYMER CONCRETE (POC1 1 )
STRESS VS. STRAIN CURVEPOLYMER CONCRETE (POC1 2)
STRAIN (in./ln.)

Appendix A 149
STRESS VS. STRAIN CURVEPOLYMER CONCRETE (POC13)
STRESS VS. STRAIN CURVEPOLYMER CONCRETE (POC14)
STRAIN (in./in.)

Appendix A 150
STRESS VS. STRAIN CURVEPOLYMER CONCRETE (POC21)
STRESS VS. STRAIN CURVEPOLYMER CONCRETE (POC22)
STRAIN (in./in.)

Appendix A ¹51
STRESS VS. STRAIN CURVEPOLYMER CONCRETE (POC23)
STRESS VS. STRAIN CURVEPOLYMER CONCRETE (POC24)
STRAIN (in./in.)

Appendix A ¹52
STRESS VS. STRAIN CURVEPOLYMER CONCRETE 1E (POC25)
STRAIN (in./in.)
STRESS VS. STRAIN CURVEPOLYMER CONCRETE (POC26)
STRAIN (in/in)

Appendix A 153
STRESS VS. STRAIN CURVEPOLYMER CONCRETE (PFC13A)9
STRAIN (In./in.)
STRESS VS. STRAIN CURVEPOLYMER CONCRETE (PFC15A)
STRAIN (In./in.)
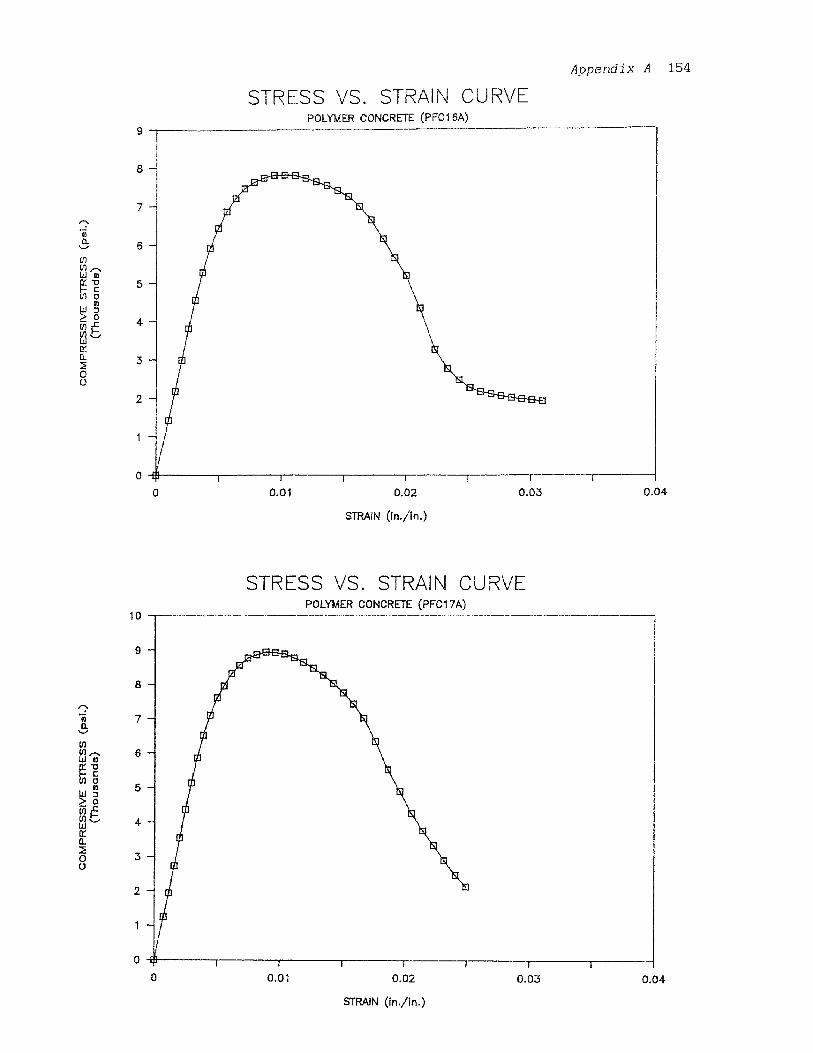
Appendix A ¹54
STRESS VS. STRAIN CURVEPOLYMER CONCRETE PCFC1 6A)
STRESS VS. STRAIN CURVEPOLYMER CONCRETE (PFC1 7A)
STRAIN (in./in.)

APPENDIX B

Appendix B 156
FLEXURAL STRESS VS. DEFLECTIONMICROSILICA CONCRETE (B21)
MICROSILICA CONCRETE
THREE POINT LOADS
BEAM 2x4x12 in.
SPAN LENGTH = 11.00 in.
DEFLECTION .(x10**-2 in.)
FLEXURAL STRESS VS. DEFLECTIONMICROSILICA CONCRETE (B22)
MICROSILICA CONCRETE
THREE POINT LOAD
BEAM 2x4x12 in.
SPAN LENGTH = 11.00 in.
DEFLECTION (x10**-2 in.)

Appendix B 157
FLEXURAL STRESS VS. DEFLECTIONMICROSILICA CONCRETE (B23)
MICROSILICA CONCRETE
THREE POINT LOAD
BEAM 2x4x12 in.
SPAN LENGTH = 11.00 in.
DEFLECTION (x10**-2 in.)
FLEXURAL STRESS VS. DEFLECTIONMICROSILICA CONCRETE (B51)
MICROSILICA CONCRETE
THREE POINT LOAD
BEAM 2x5x24 in.
SPAN LENGTH = 21.50 in.
DEFLECTION (x10**-2 in.)
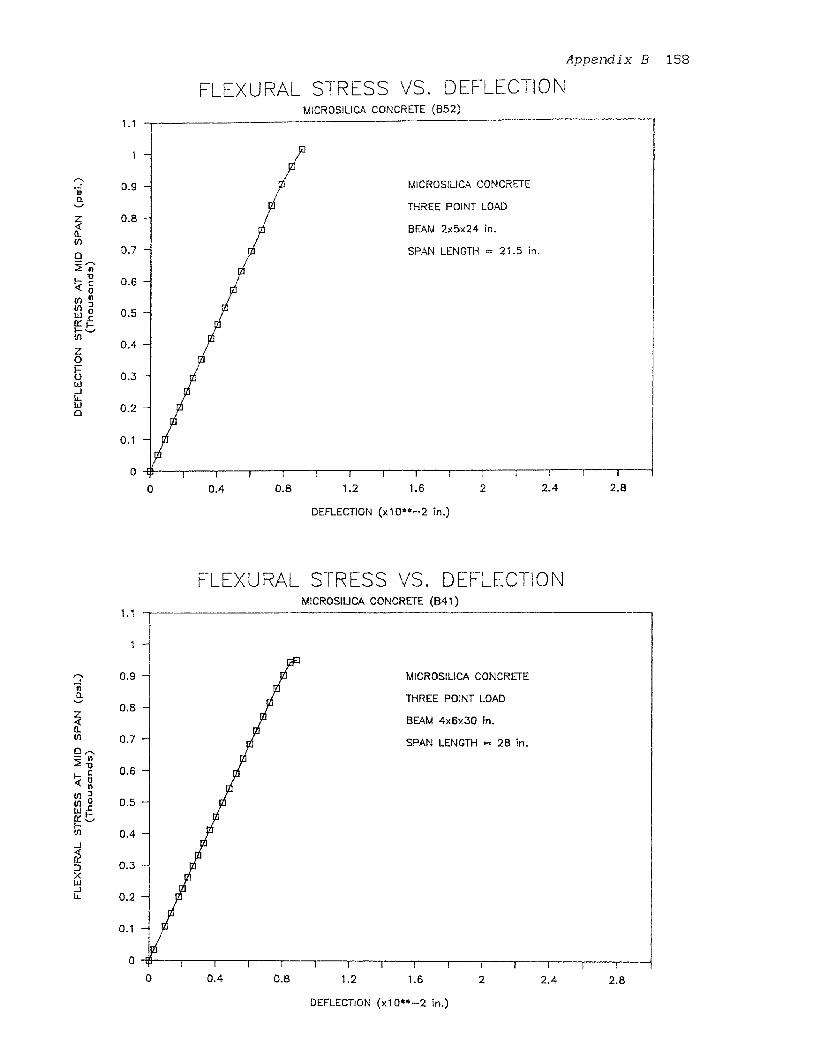
Appendix B 158
FLEXURAL STRESS VS. DEFLECTIONMICROSILICA CONCRETE (352)
MICROSILICA CONCRETE
THREE POINT LOAD
BEAM 2x5x24 in.
SPAN LENGTH = 21.5 in.
DEFLECTION (x10**-2 in.)
FLEXURAL STRESS VS. DEFLECTIONMICROSILICA CONCRETE (841)
MICROSILICA CONCRETE
THREE POINT LOAD
BEAM 4x6x30 in.
SPAN LENGTH = 28 in.
DEFLECTION (x10**-2 in.)

Appendix B ¹59
FLEXURAL STRESS VS. DEFLECTIONMICROSILICA CONCRETE (B42)
MICROSILICA CONCRETE
THREE POINT LOAD
BEAM 4x6x30 in.
SPAN LENGTH = 28 in.
DEFLECTION (x 1 0**-2 in.)
FLEXURAL STRESS VS. DEFLECTIONMICROSILICA CONCRETE (343)
MICROSILICA CONCRETE
THREE POINT LOAD
BEAM 4x6x30 in.
SPAN LENGTH = 28 in.
DEFLECTION (x 0**-2 in.

Appendix B 160
FLEXURAL STRESS - DEFLECTIONMICROSILICA CONCRETE (B61)
MICROSILICA CONCRETE
THREE POINT LOAD
BEAM 6x6x30 in.
SPAN LENGTH = 28 in.
DEFLECTION (x10"--2 in.)
FLEXURAL STRESS VS. DEFLECTIONMICROSILICA CONCRETE (B62)
MICROSILICA CONCRETE
THREE POINT LOAD
BEAM 6x6x30 in.
SPAN LENGTH = 28 in.
DEFLECTION (x10"-2 in.)

Appendix B 161
FLEXURAL STRESS VS. DEFLECTIONMICROSILICA CONCRETE (B63)
MICROSILICA CONCRETE
THREE POINT LOAD
BEAM 6x6x30 in.
SPAN LENGTH r= 28 in.
DEFLECTION (x10**-2 in.)

Appendix B 162
FLEXURAL STRESS VS. DEFLECTIONPOLYMER CONCRETE. (PBM1)
POLYMER CONCRETE
THREE POINT LOAD
BEAM 2x4x12 in.
SPAN LENGTH = 11.00 in.
DEFLECTION (x10**-2 in.)
FLEXURAL STRESS VS. DEFLECTION POLYMER CONCRETE (PBM2)
POLYMER CONCRETE
THREE POINT LOAD
BEAM 2x4x12 in.
SPAN LENGTH = 11.00 in.
DEFLECTION (x10**-2 in.)
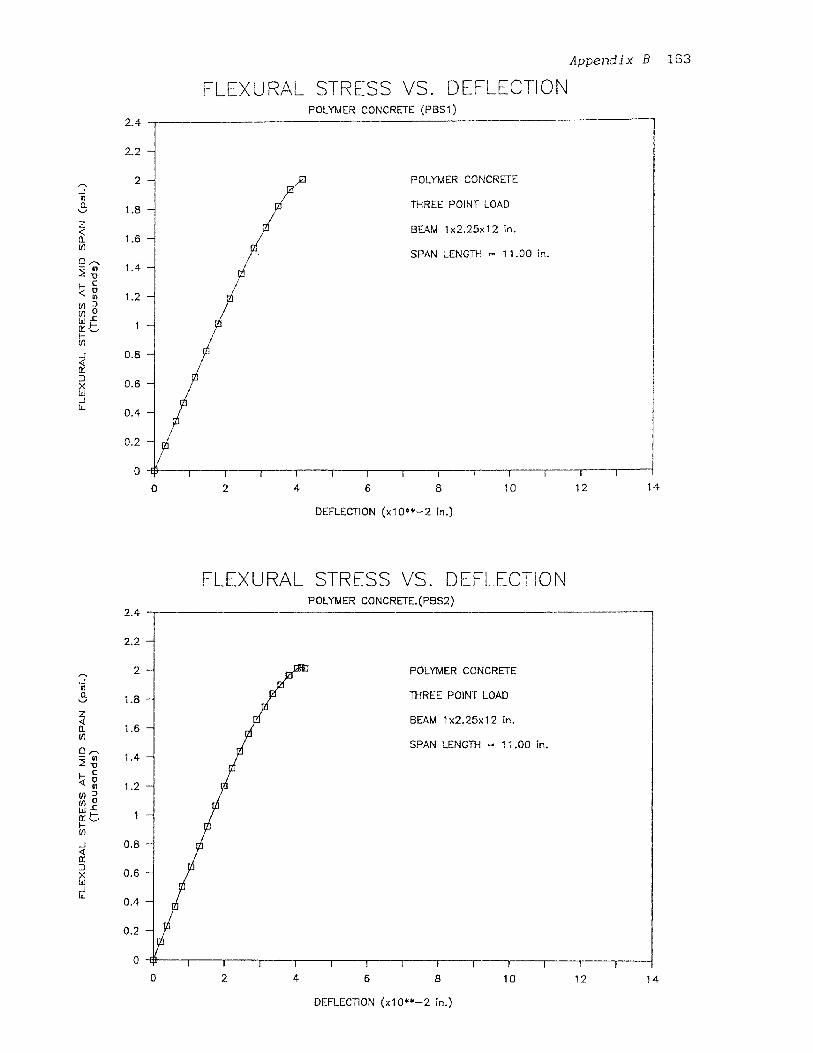
Appendix B 163
FLEXURAL STRESS VS. DEFLECTIONPOLYMER CONCRETE (PBS1)
POLYMER CONCRETE
THREE POINT LOAD
BEAM 1x2.25x12 in.
SPAN LENGTH = 11.00 in.
DEFLECTION (x10**-2 in.)
FLEXURAL STRESS VS. DEFLECTIONPOLYMER CONCRETE.(PBS2)
POLYMER CONCRETE
THREE POINT LOAD
BEAM 1x2.25x12 in.
SPAN LENGTH = 11.00 in.
DEFLECTION (x10**-2 in.)
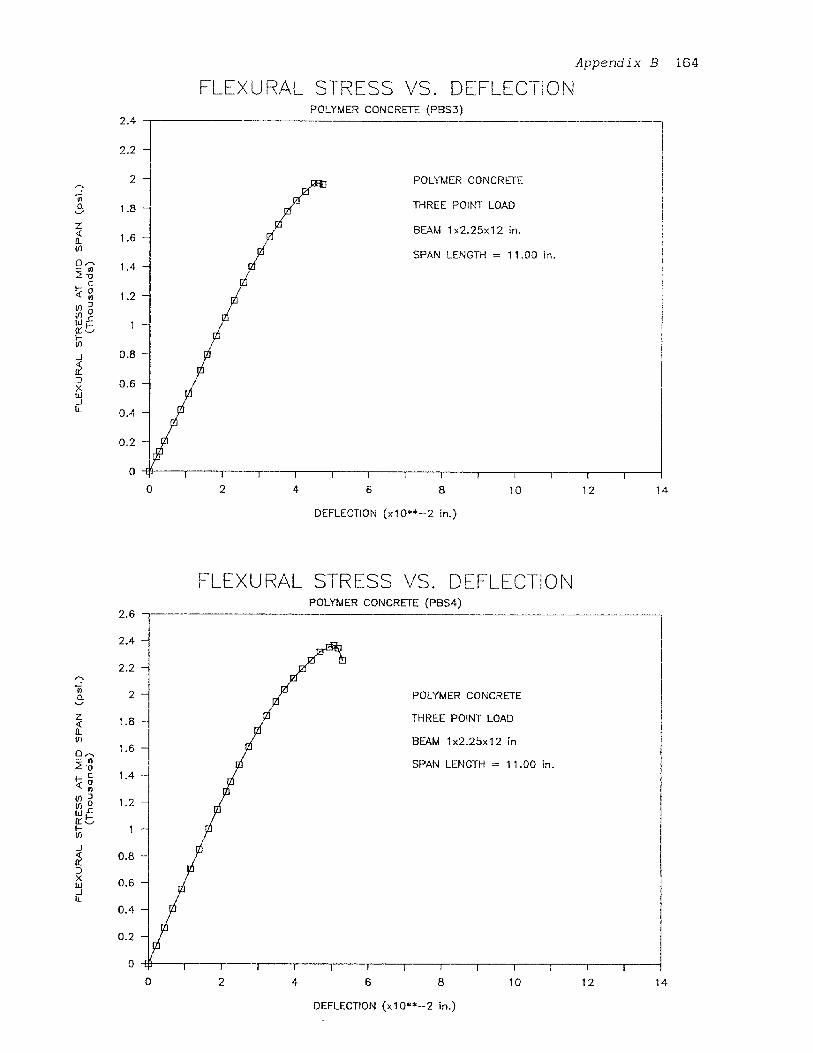
Appendix B 164
FLEXURAL STRESS VS. DEFLECTIONPOLYMER CONCRETE (PBS3)
POLYMER CONCRETE
THREE POINT LOAD
BEAM 1x2.25x12 in.
SPAN LENGTH = 11.00 in.
DEFLECTION (x10**-2 in.)
FLEXURAL STRESS VS. DEFLECTIONPOLYMER CONCRETE (PBS4)
POLYMER CONCRETE
THREE POINT LOAD
BEAM 1x2.25x12 in
SPAN LENGTH = 11.00 in.
DEFLECTION (x10"--2 in.)

APPENDIX C

Appendix C 166
PULL-OUT TESTREINFORCED HIGH STRENGTH CONCRETE(BS31)
MICROSILICA CONCRETE
# 3 REINFORCEMENT
5x5x5 in. CUBE SPECIMENT
SLIP (x1000 -3 inch.)
PULL-OUT TESTREINFORCED HIGH STRENGTH CONCRETE(BS32)
MICROSILICA CONCRETE
# 3 REINFORCEMENT
5x5x5 in. CUBE SPECIMEN
SLIP (x10**-3 inch.)

Appendix C 167
PULL-OUT TESTREINFORCED HIGH STRENGTH CONCRETE(BS33)
MICROSILICA CONCRETE
# 3 REINFORCEMENT
5x5x5 in. CUBE SPECIMEN
PULL-OUT TESTREINFORCED HIGH STRENGTH CONCRETE(8S41)
MICROSILICA CONCRETE
# 4 REINFORCEMENT
5x5x5 in. CUBE SPECIMEN
SLIP (x10**-3 inch.)

Appendix C 168
PULL-OUT TESTREINGORCED HIGH STRENGTH STRENGTH)
MICROSILICA CONCRETE
4 REINFORCEMENT
5x5x5 in. CUBE SPECIMEN
SLIP (x10"-3 inch.)
PULL-OUT TESTREINFORCED HIGH STRENGTH CONCRETE E(BS43)
MICROSILICA CONCRETE
# 4 REINFORCEMENT
5x5x5 in. CUBE SPECIMEN
SLIP (x10**-3 inch.)

Appendix C 169
PULL-OUT TESTREINFORCED HIGH STRENGTH CONCRETE E(BS44)
MICROSILICA CONCRETE
# 3 REINFORCEMENT
5x5x5 in. CUBE SPECIMEN
SLIP (x 1 0*-3 inch.)
PULL-OUT TESTREINFORCED HIGH STRENGTH CONCRETE(BS61)
MICROSILICA CONCRETE
# 6 REINFORCEMENT
8x8x8 in. CUBE SPECIMEN
SLIP 0**-3 (In.)

Appendix C 170
PULL-OUT TESTREINFORCED HIGH STRENGTH CONCRETE (BS62)
MICROSILICA CONCRETE
# 6 REINFORCEMENT
8x8x8 in. CUBE SPECIMEN
SLIP x 10**— 3 (In.)
PULL-OUT TESTREINFORCED HIGH STRENGTH CONCRETE(BS63)
MICROSILICA CONCRETE
# 6 REINFORCEMENT
8x8x8 in. CUBE SPECIMEN

Appendix C 171
PULL-OUT TESTREINFORCED HIGH STRENGTH CONCRETE(BS64)
MICROSILICA CONCRETE
if 6 REINFORCEMENT
8x8x8 in. CUBE SPECIMEN
SUP x1 0**-3 (in.)

APPENDIX D

Appendix D 173
PULL-OUT TESTNORMAL CONCRETE (TC#34)
PULL—OUT DISPLACEMENT (x10•*-2 in.)
PULL-OUT TESTNORMAL CONCRETE (TC#35)
PULL—OUT DISPLACEMENT (x10•-2 in.)

Appendix D 174
PULL-OUT TESTNORMAL CONCRETE (TC#36)
PULL—OUT DISPLACEMENT (x10**-2 in.)

Appendix D 175
PULL-OUT TESTMICROSILICA CONCRETE (MT1 )
TAPERED SPECIMEN
PULL--OUT DISPLACEMENT (x10**-2 in.)
PULL-OUT TESTMICROSILICA CONCRETE (MT2)
TAPERED SPECIMEN
PULL—OUT DISPLACEMENT (x10**-2 in.)
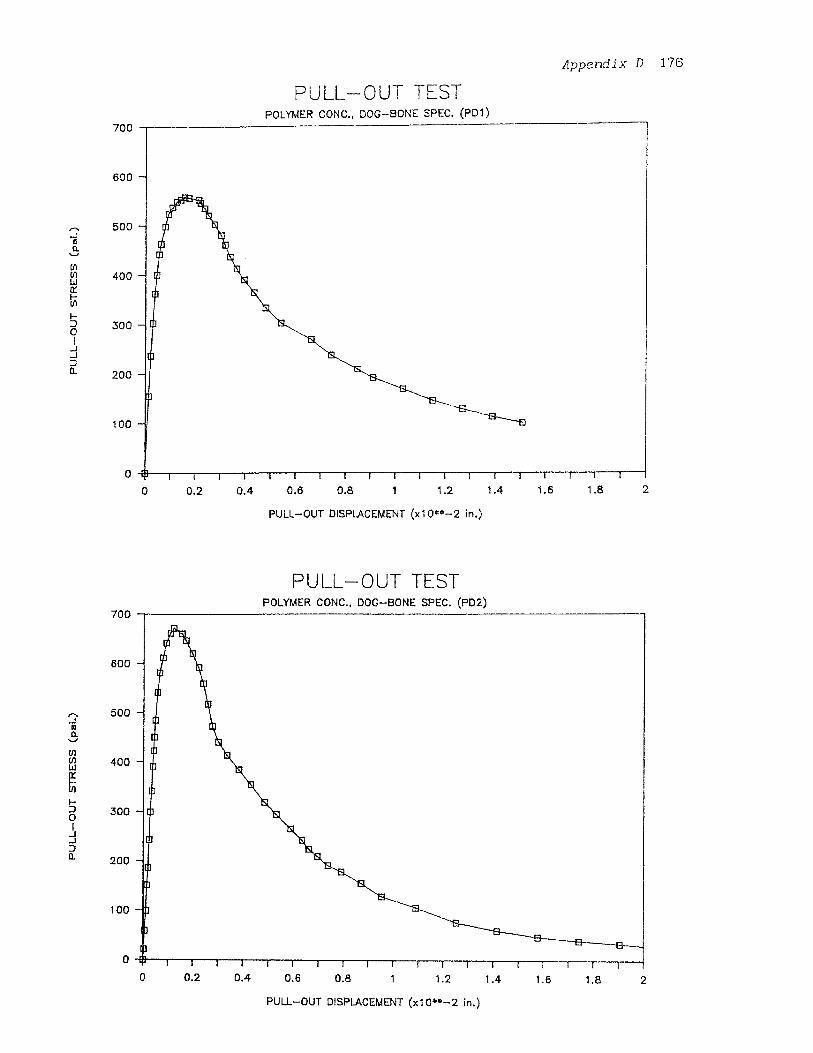
Appendix D 176
PULL-OUT TESTPOLYMER CONC., DOG—BONE SPEC. (PD1)
PULL—OUT DISPLACEMENT (x10"-2 in.)
PULL-OUT TESTPOLYMER CONC., DOG—BONE SPEC. (PD2)
PULL—OUT DISPLACEMENT (x10**-2 in.)

Appendix D 177
PULL-OUT TESTPOLYMER CONC., DOG—BONE SPEC. (PD3)
PULL—OUT DISPLACEMENT (x1 O2 in.)

APPENDIX E

Appendix E 179
PULL-OUT TESTHIGH STRENGTH FIBROUS CONCRETE (BFS054)
STRAIGHT END FIBER
FIBER VOLUME FRACTION 0.50
PULL—OUT DISPLACEMENT ( x10**-2 in.)
PULL-OUT TESTHIGH STRENGTH FIBROUS CONCRETE (BFSO55)
STRAIGHT END FIBER
FIBER VOLUME FRACTION 0.50 %
PULL—OUT DISPLACEMENT (x10"-2 inch.)

Appendix E 180
PULL-OUT TESTHIGH STRENGTH FIBROUS CONCRETE (BFS056)
STRAIGHT END FIBER
FIBER VOLUME FRACTION 0.50 %
PULL—OUT DISPLACEMENT (x10**-2 inch.)
PULL-OUT TESTHIGH STRENGTH FIBROUS CONCRETE (BFS101)
STRAIGHT END FIBER
FIBER VOLUME FRACTION 1.00 %
PULL—OUT DISPLACEMENT (x10**-2 inch.)
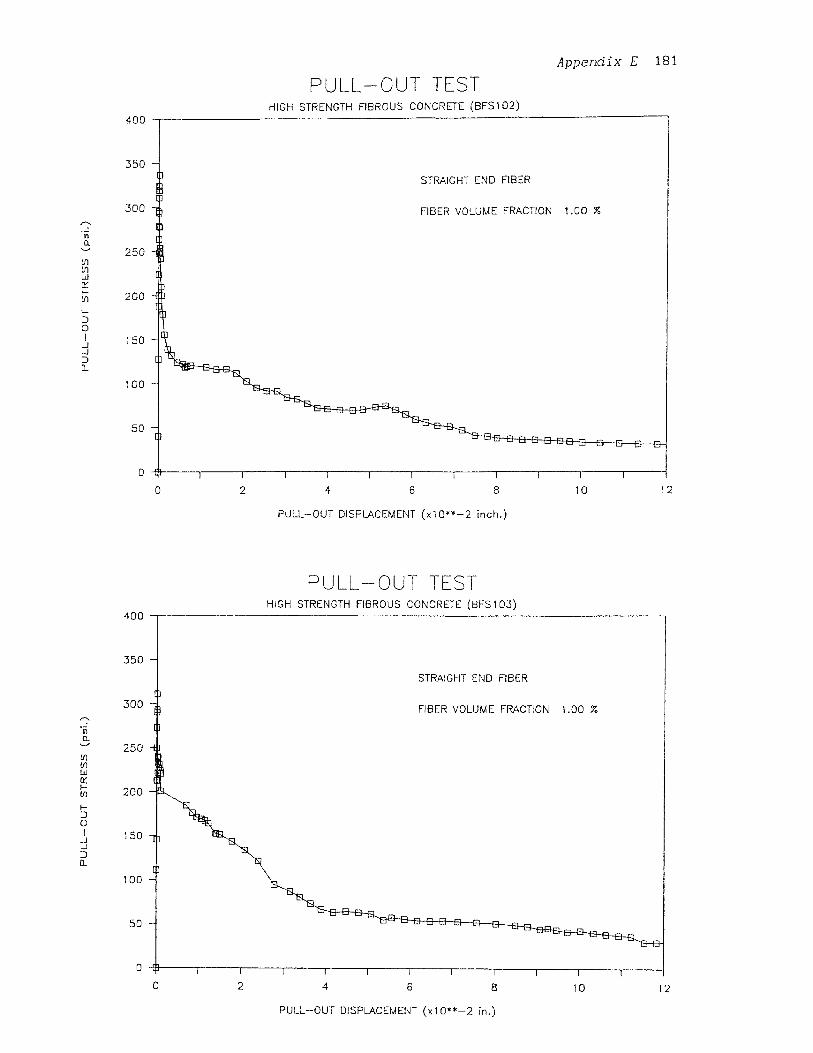
Appendix E 181
PULL-OUT TESTHIGH STRENGTH FIBROUS CONCRETE (BFS1O2)
STRAIGHT END FIBER
FIBER VOLUME FRACTION 1.00 %
PULL—OUT DISPLACEMENT (x10••-2 inch.)
PULL-OUT HSTHIGH STRENGTH FIBROUS CONCRETE (BFS103)
STRAIGHT END FIBER
FIBER VOLUME FRACTION 1.00 %
0 2 4 6 8 10 12
PULL—OUT DISPLACEMENT (x10" —2 in.)

Appendix E 182
PULL-OUT TESTHIGH STRENGTH FIBROUS CONCRETE (BFS151)
STRAIGHT END FIBER
FIBER VOLUME FRACTION 1.50 %
PULL—OUT DISPLACEMENT (x10**-2 inch.)
PUL_-OUT TESTHIGH STRENGTH FIBROUS CONCRETE (BFS152)
STRAIGHT END FIBER
FIBER VOLUME FRACTION 1.50 %
PULL—OUT DISPLACEMENT (x10**-2 inch.)

Appendix E 183
PULL-OUT TESTHIGH STRENGTH FIBROUS CONCRETE (BF5153)
STRAIGHT END FIBER
FIBER VOLUME FRACTION 1.50
PULL—OUT DISPLACEMENT(x 1 0**-2 inch.)
PULL-OUT TESTHIGH STRENGTH FIBROUS CONCRETE (BFS154)
STRAIGHT END FIBER
FIBER VOLUME FRACTION 1.50 %
PULL—OUT DISPLACEMENT (x10**-2 inch.)

Appendix E 184
PULL-OUT STRESSHIGH STRENGTH FIBROUS CONCRETE (BFS202)
STRAIGHT END FIBER
FIBER VOLUME FRACTION 2.00
PULL—OUT DISPLACEMENT (x10"-2 inch.)
PULL-OUT TESTHIGH STRENGTH FIBROUS CONCRETE (BFS203)
STRAIGHT END FIBER
FIBER VOLUME FRACTION 2.00
0 2 4 6 8 10 12 14 16
PULL—OUT DISPLACEMENT (x10"-2 inch.)

Appendix E 185
PULL-OUT TESTHIGH STRENGTH FIBROUS CONCRETE (BFS205)
STRAIGHT END FIBER
FIBER VOLUME FRACTION 2.00 %
PULL—OUT DISPLACEMENT (x10**-2 inch.)
PULL--OUT TESTHIGH STRENGTH FIBROUS CONCRETE (BFS206)
STRAIGHT END FIBER
FIBER VOLUME FRACTION 2.00 %
PULL—OUT DISPLACEMENT (x10**-2 inch.)

Appendix E 186
PULL-OUT TESTHIGH STRENGTH FIBROUS CONCRETE (BFH051)
HOOKED END FIBER
FIBER VOLUME FRACTION 0.50 %
PULL—OUT DISPLACEMENT (x10•*-2 inch.)
PULL-OUT TESTHIGH STRENGTH FIBROUS CONCRETE (BFH052)
HOOKED END FIBER
FIBER VOLUME FRACTION 0.50 %
PULL—OUT DISPLACEMENT (x10**-2 inch.)

Appendix E 187
PULL-OUT TESTHIGH STRENGTH FIBROUS CONCRETE (BFH053)
HOOKED END FIBER
FIBER VOLUME FRACTION 0.50 %
PULL-OUT TESTHIGH STRENGTH FIBROUS CONCRETE (BFH054)
HOOKED END FIBER
FIBER VOLUME FRACTION 0.50 Z
PULL—OUT DISPLACEMENT (x10**-2 inch.)

Appendix E 188
PULL-OUT TESTHIGH STRENGTH FIBROUS CONCRETE (BFH102)
HOOKED END FIBER
FIBER VOLUME FRACTION 1.00
PULL—OUT DISPLACEMENT (x10"-2 inch,)
PULL-OUT TESTHIGH STRENGTH FIBROUS CONCRETE (BFH104)
HOOKED END FIBER
FIBER VOLUME FRACTION 1.00 %
PULL—OUT DISPLACEMENT (x 1 0" —2 inch,)

Appendix E 189
PULL-OUT TESTHIGH STRENGTH FIBROUS CONCRETE (BFH151)
HOOKED END FIBER
FIBER VOLUME FRACTION 1.50
PULL—OUT DISPLACEMENT (x10•-2 inch.)
PULL-OUT TESTHIGH STRENGTH FIBROUS CONCRETE (BFH152)
HOOKED END FIBER
FIBER VOLUME FRACTION 1.50
PULL—OUT DISPLACEMENT (x10•*-2 inch.)

Appendix E 190
PULL-OUT TESTHIGH STRENGTH FIBROUS CONCRETE (BFH153)
HOOKED END FIBER
FIBER VOLUME FRACTION 1.50 %
PULL—OUT DISPLACEMENT (x10•-2 inch.)
PULL-OUT TESTHIGH STRENGTH FIBROUS CONCRETE (BFH201)
HOOKED END FIBER
FIBER VOLUME FRACTION 2.00 %
PULL—OUT DISPLACEMENT (x10•-2 inch.)

Appendix E 191
PULL-OUT TESTHIGH STRENGTH FIBROUS CONCRETE (BFH202)
HOOKED END FIBER
FIBER VOLUME FRACTION 2.00 %
PULL—OUT DISPLACEMENT (x10**-2 inch.)
PULL-OUT -='STHIGH STRENGTH FIBROUS CONCRETE (BFH2O3)
HOOKED END FIBER
FIBER VOLUME FRACTION 2.00
PULL—OUT DISPLACEMENT (x 0**-2 inch.)

APPENDIX F

Appendix F 193
NORMALIZED STRESS VS. DISPLACEMENTNORMAL CONCRETE (TC#34)
NORMALIZED PULL-OUT DISPLACEMENT
NORMALIZED STRESS VS. DISPLACEME\TNORMAL CONCRETE (TC#35)
NORMALIZED PULL-OUT DISPLACEMENT

Appendix F 194
NORMALIZED STRESS VS. DISPLACEMENTNORMAL CONCRETE (TC#36)
NORMALIZED PULL-OUT DISPLACEMENT

Appendix F 195
NORMALIZED STRESS VS. DISPLACEMENTMICROSILICA CONCRETE (MT1)
NORMALICED PULL-OUT DISPLACEMENT
NORMALIZED STRESS VS. DISPLACEMENTMICROSILICA CONCRETE (MT2)
NORMALIZED PULL-OUT DISPLACEMENT

Appendix F 196
NORMALIZED STRESS VS. DISPLACEMENTPOLYMER CONC., DOG-BONE SPEC. (PD1)
NORMALIZED PULL-OUT DISPLACEMENT
NORMALIZED STRESS VS. DISPLACEMENTPOLYMER CONC., DOG-BONE SPEC. (PD2)
NORMALIZED PULL-OUT DISPLACEMENT

APPENDIX G

Appendix G 198
NORMALIZED STRESS VS. DISPLACEMENTHIGH STRENGTH FIBROUS CONCRETE (BFS054)
NORMALIZED STRESS VS. DISPLACEME\THIGH STRENGTH FIBROUS CONCRETE (BFS055)
NORMALIZED PULL-OUT DISPLACEMENT

Appendix G 199
NORMALIZED STRESS VS. DISPLACEMENTHIGH STRENGTH FIBROUS CONCRETE (BFS056)
NORMALIZED PULL-OUT DISPLACEMENT
NORMALIZED STRESS VS. DISPLACEMENTHIGH STRENGTH FIBROUS CONCRETE (BFS101)
NORMALIZED PULL-OUT DISPLACEMENT

Appendix C 200
NORMALIZED STRESS VS. DISPLACEMENTHIGH. STRENGTH FIBROUS CONCRETE (BFS1 02)
NORMALIZED PULL-OUT DISPLACEMENT
NORMALIZED STRESS VS. D DISPLACEMENTHIGH STRENGTH FIBROUS CONCRETE (BFS1 03)
NORMALIZED PULL-OUT DISPLACEMENT

Appendix G 201
NORMALIZED STRESS VS. DISPLACEMENTHIGH STRENGTH FIBROUS CONCRETE (BFS151)
NORMALIZED PULL-OUT DISPLACEMENT
NORMALIZED STRESS VS. DISPLACEMENTHIGH STRENGTH FIBROUS CONCRETE (BFS152)
NORMALIZED PULL-OUT DISPLACEMENT

Appendix G 202
NORMALIZED STRESS VS. DISPLACEMENTHIGH STRENGTH FIBROUS CONCRETE (BFS153)
NORMALIZED PULL-OUT DISPLACEMENT
NORMALIZED STRESS VS. DISPLACEMENTHIGH STRENGTH FIBROUS CONCRETE (6E5154)
NORMALIZED PULL-OUT DISPLACEMENT

Appendix G 203
NORMALIZED STRESS VS. DISPLACEMENTHIGH STRENGTH FIBROUS CONCRETE (BFS202)
NORMALIZED PULL-OUT DISPLACEMENT
NORMALIZED STRESS VS. DISPLACEMENTHIGH STRENGTH FIBROUS CONCRETE (BFS203)
NORMALIZED PULL-OUT DISPLACEMENT
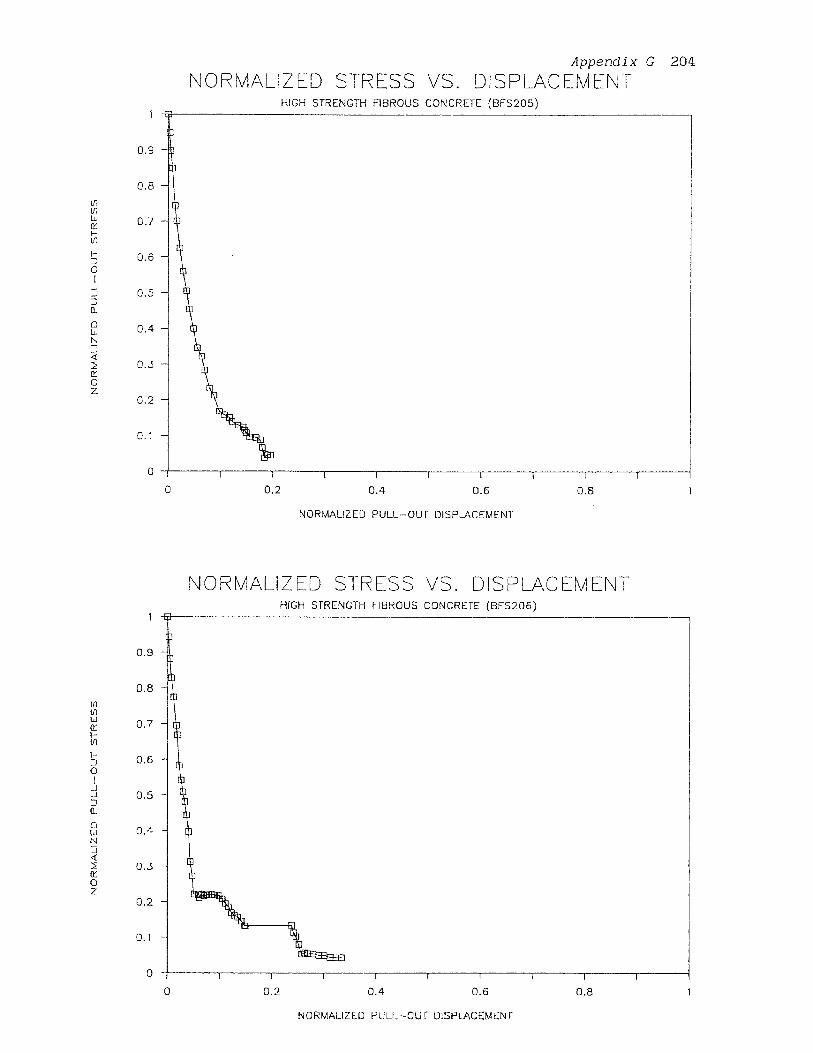
Appendix G 204
NORMALIZED STRESS VS. DISPLACEMENTHIGH STRENGTH FIBROUS CONCRETE (BFS205)
NORMAL ZED STRESS VS. DISPLACEMENTHIGH STRENGTH FIBROUS CONCRETE (BFS206)
NORMALIZED PULL-OUT DISPLACEMENT r
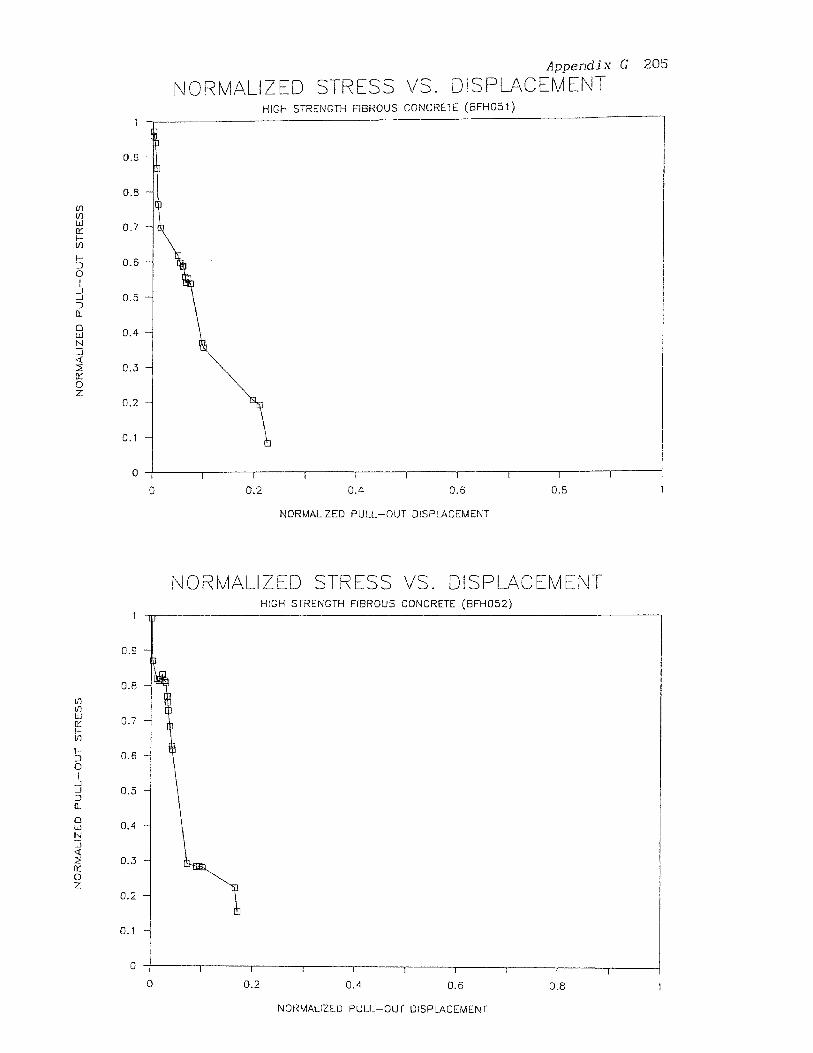
Appendix G 205
NORMALIZED STRESS VS. DISPLACEMENTHIGH STRENGTH FIBROUS CONCRETE (BFHO51)
NORMALIZED PULL-OUT DISPLACEMENT
NORvALIZED STRESS VS. DISPLACEMENTHIGH STRENGTH FIBROUS CONCRETE (BFHO52)
NORMALIZED PULL-OUf DISPLACEMENT

Appendix G 206
NORMALIZED STRESS VS. DISPLACEMENTHIGH STRENGTH FIBROUS CONCRETE (BFH053)
NORMALIZED PULL-OUT DISPLACEMENT
NORMALIZED STRESS VS. DISPLACEMENTHIGH STRENGTH FIBROUS CONCRETE (BFH054)
NORMALIZED PULL-OUT DISPLACEMENT

Appendix G 207
NORMALIZES STRESS VS. DISPLACEMENTHIGH STRENGTH FIBROUS CONCRETE (BFH102)
NORMALIZED PULL-OUT DISPLACEMENT
NORMALIZED STRESS VS.DISPLACEMENT
HIGH STRENGTH FIBROUS CONCRETE (BFH104)
NORMALIZED PULL-OUT DISPLACEMENT

Appendix G 208
NORMALIZED STRESS VS. DISPLACEMENTHIGH STRENGTH FIBROUS CONCRETE (BFH151)
NORMALIZED PULL-OUT DISPLACEMENT
NORMALIZED STRESS VS.DISPLACEMENTHIGH STRENGTH FIBROUS CONCRETE (BFH152)
NORMALIZED PULL--OUT DISPLACEMENT

Appendix G 209
NORMAL :ZED STRESS VS. DISPLACEMENTHIGH STRENGTH FIBROUS CONCRETE (BFH153)
NORMALIZED PULL-OUT DISPLACEMENT
NORMALIZED STRESS VS. DISPLACEMENTHIGH STRENGTH FIBROUS CONCRETE (BFH201)
NORMALIZED PULL-OUT DISPLACEMENT

Appendix G 210
NORMALIZED STRESS VS. DISPLACEMENTHIGH STRENGTH FIBROUS CONCRETE (BFH2O2)
NORMALIZED PULL-OUT DISPLACEMENT
NORMALIZED STRESS VS. DISPLACEMENT HIGH STRENGTH FIBROUS CONCRETE (BFH2O3)
NORMALIZED PULL -OU I DISPLACEMENT

APPENDIX H

Appendix B 212
S-N CURVESUPERPLASTICIZER CONCRETE, RATE = 6 Hz,
+ SPECIMEN NOT FAIL
NUMBER OF CYCLE TO FAILURE (LOG N)

Appendix H 213
S-N CURVEMICROSILICA CONCRETE, RATE 6 Hz.
NUMBER OF CYCLE TO FAILURE (LOG N)

Appendix H 214
S-N CURVEPOLYMER CONCRETE, RATE = 6 Hz
+ SPECIMEN NOT FAIL
NUMBER OF CYCLE TO FAILURE (LOG N)

Appendix H 215
S - N CURVEMICROSILICA CONCRETE, RATE = 12 Hz.
NUMBER OF CYCLE TO FAILURE (LOG N)

Appendix H 216
FATIGUE TESTSUPERPLASTICIZER CONC., R=6 Hz.(S1F309)
Max. Stress Level = 0.90 f c,
A = 1 Cycle
B = 13 Cycles
N = 26 Cycles
FATIGUE TESTSUPERPLASTICIZER CONC., R=6 Hz.(S1F409)
Max. Stress Level 0.90 f c
A = 1-3 Cycles
N = 300 Cycles
STRAIN

Appendix H 217
FATIGUE TESTSUPERPLASTICIZER CONC., R=6 Hz.(S1F108)
Max. Stress Level = 0.80 f,
A = 1 Cycle
B = 3 Cycles
C = 3,950 Cycles
N 5,872 Cycles
STRAIN
FATIGUE TESTSUPERPLASTIC!ZER CONC., R=6 Hz.(S1F208)
Max. Stress Level = 0.80 fc
A — 1-3 Cycles
B 3070 Cycles
N — 4,093 Cycles
STRAIN

Appendix H 218
FATIGUE TESTSUPERPLASTICIZER CONC., R=6 Hz.(S1F308)
Max. Stress Level = 0.80 f:
A = 1-2 Cycles
8 3,355 Cycles
N = 4,566 Cycles
STRAIN
FATIGUE TESTSUPERPLASTICIZER CONC, R=6 Hz.(S1F275)
Max. Stress Level = 0.75 f;
A = 1-3 Cycles
N = 430,510 Cycles
STRAIN

Max. Stress Level = 0.73 fc
A = 1-2 Cycles
B = 121,273 Cycles
C — 693,400 Cycles
N > 1,000,000 Cycles
Appendix H 219
FATIGUE TESTSUPERPLASTICIZER CONC., R=6 Hz.(S1F207)
FATIGUE TESTSUPERPLASTICIZER CONC., R=6 Hz.(S1F1O7)
Max. Stress Level = 0.70 f:
A = 1 Cycles
B = 30 Cycles
N = 12,299 Cycles
STRAIN

Appendix H 220
FATIGUE TESTSUPERPLAST1CIZER CONC, R=6 Hz.(S1F307)
Max. Stress Level = 0.70 f:
A = 1-2 Cycles
B = 1,027,230 Cycles
N > 1,027,230 Cycles
STRAIN
FATIGUE TESTSUPERPLASTICIZER CONC, R=6 Hz.(S1F175)
Max. Stress Level = 0.57 4,
A = 1-2 Cycles
B = 935,750 Cycles
C 1,478,000 Cycles
N > 1,995,263 Cycles
STRAIN

Appendix H 221
FATIGUE TESTSUPERPLASTICIZER CONC, R=6 Hz.(S1F106)
Max. Stress Level = 0.53 f:
A = 1-2 Cycles
B = 127,720 Cycles
C 663,840 Cycles
N > 1,000,000 Cycles
STRAIN
FATIGUE TESTSUPERPLASTICIZER CONC, R=6 Hz.(S1F206)
Max. Stress Level = 0.50 f c
A = 1-2 Cycles
B = 90,300 Cycles
C = 628,030 Cycles
N > 1,000,000 Cycles
STRAIN

Appendix H 222
FATIGUE TESTMICROSILICA CONC., RATE = 6 Hz.(M1F209)
Mc:. Stress Level = 0.90 f c.'
A = 1-2 Cycles
B = 60 Cycles
N = 380 Cycles
FATIGUE TESTMICROSILICA CONC., RATE = 6 Hz.(M1F309)
Max. Stress Level = 0.90 fc '
A = 1,2 Cycles
N = 204 Cycles
STRAIN

Appendix H 223
FATIGUE TESTMICROSILICA CONC., RATE = 6 Hz.(M1F409)
Max. Stress Level = 0.90 f,
A = 1-3 Cycles
B = 400 Cycles
C = 600 Cycles
N = 608 Cycles
STRAIN
FATIGUE TESTMICROSILICA CONC., RATE = 6 Hz.(M2F209)
Max. Stress Level = 0.90 f:
A = 1 Cycle
B = 3 Cycles
N = 6 Cycles
STRAIN

Appendix H 224
FATIGUE TESTMICROSILICA CONC., RATE = 6 Hz.(M2F108)
Max. Stress Level = 0.80 fc.
A = 1-3 Cycles
B — 1,600 Cycles
C = 3,202 Cycles
N =, 4,014 Cycles
FATIGUE TESTMICROSILICA CONC., RATE = 6 Hz.(M2F208)
Max. Stress Level = 0.80 f:
A = 1-3 Cycles
B = 1,280 Cycles
C = 4,970 Cycles
N = 8,937 Cycles
STRAIN

Appendix H 225
FATIGUE TESTMICROSILICA CONC.,RATE = 6 Hz.(M2F2075)
Max. Stress Level = 0.75 f:
A = 1-3 Cycles
B = 4,000 Cycles
C — 39,000 Cycles
D = 91,850 Cycles
N = 102,200 Cycles
STRAIN
FATIGUE TESTMICROSILICA CONC.,RATE = 6 Hz.(M2F3075)
Max. Stress Level = 0.75 fc.
A = 1-3 Cycles
B = 4,000 Cycles
C — 36,050 Cycles
D = 110,720 Cycles
E = 175,930 Cycles
N — 196,540 Cycles
STRAIN

Appendix H 226
FATIGUE TESTMICROSILICA CONC.,RATE 6 Hz.(M2F4075)
Max. Stress Level = 0.723 f:
A = 1-3 Cycles
B = 4,864 Cycles
C = 71,700 Cycles
D 669,860 Cycles
E = 1,074,600 Cycles
N > 1,074,600 Cycles
FATIGUE TESTMICROSILICA CONC.,RATE = 6 Hz.(M2F1075)
Max. Stress Level 0.70 f:
A = 1 Cycle
B = 449,000 Cycles
C = 981,800 Cycles
D = 3,195,300 Cycles
N > 3,200,000 Cycles
STRAIN

Appendix H 227
FATIGUE TESTMICROSILICA CONC., RATE 6 Hz.(M1F107)
Max. Stress Level = 0.605 i:
A 1-2 Cycles
B 600 Cycles
C 20,000 Cycles
D .= 90,000 Cycles
E 513,500 Cycles
N > 1,000,000 Cycles
FATIGUE TESTMICROSILICA CONC., RATE — 6 Hz.(M1F207)
Max. Stress Level = 0.60 f c
A 1-2 Cycles
B = 455,400 Cycles
N > 1,000,000 Cycles
STRAIN
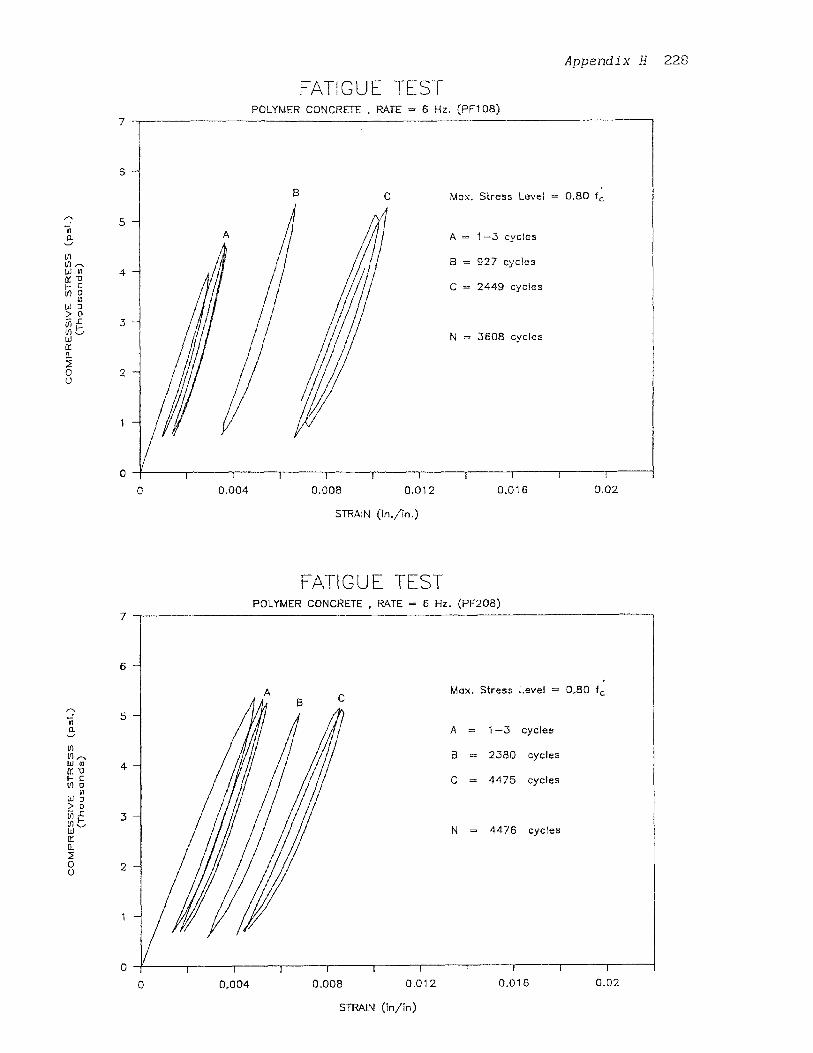
Appendix H 228
EAT CUE TESTPOLYMER CONCRETE , RATE = 6 Hz. (PF108)
Max. Stress Level = 0.80 fc'
A = 1-3 cycles
B = 927 cycles
C = 2449 cycles
N = 3608 cycles
STRAIN (in./in.)
FATIGUE TESTPOLYMER CONCRETE • RATE = 6 Hz. (PF208)
Max. Stress Level = 0.80 f;
A = 1-3 cycles
B = 2380 cycles
C = 4475 cycles
N = 4476 cycles
STRAIN (In/in)

Appendix H 229
FATIGUE TESTPOLYMER CONCRETE , RATE = 6 Hz. (PF107)
Max. Stress Level = 0.70 f:
A = 1-3 cycles
B = 1070 cycles
C = 3000 cycles
D = 6000 cycles
E = 8292 cycles
F = 8304 cycles
N = 8650 cycles
STRAIN (in ./in.)
FATIGUE TESTPOLYMER CONCRETE , RATE = 6 Hz. (PF207)
Max. Stress Level = 0.70 f:
A = 1-3 cycles
B = 1000 cycles
C = 2500 cycles
D = 4000 cycles
E = 5500 cycles
F = 8011 cycles
G = 8051 cycles
N = 8052 cycles
STRAIN (in./in.)

Appendix N 230
FATIGUE TESTPOLYMER CONCRETE, RATE = 6 Hz.(PF106)
Max. Stress Level = 0.60
A = 1-3 cycles
B = 3000 cycles
C 8000 cycles
D = 14000 cycles
E = 17000 cycles
F = 21034 cycles
G = 23038 cycles
H = 24787 cycles
N = 24789 cycles
STRAIN(in./in.)
FATIGUE TESTPOLYMER CONCRETE, RATE = 6 Hz. (PF206)
Max. Stress Level = 0.60 fc.'
A = 1-12 cycles
B = 10000 cycles
C = 26400 cycles
N = 35034 cycles
STRAIN (in./in.)

Appendix H 231
FATIGUE TESTPOLYMER CONCRETE, RATE = 6 Hz. (PF105)
Max. Stress Level = 0.50 fc
A -= 1-3 cycles
B = 4024 cyclesC = 15500 cyclesD = 23000 cyclesE = 34000 cyclesF = 40000 cyclesG -= 46000 yclesH = 55000 cyclesI -= 67000 cyclesJ -= 79000 cyclesK 94000 cyclesL -= 105000 cycles
N = 121431 cycles
STRAIN (in./in.)
FATIGUE TESTPOLYMER CONCRETE, RATE = 6 Hz. (PF205)
STRAIN (in./in.)

Appendix H 232
FATIGUE TESTPOLYMER CONCRETE, RATE = 6 Hz. (PF305)
Max. Stress Level = 0.50 f c'
A = 1-3 cycles
B = 2000 cycles
C = 26000 cycles
D 87500 cycles
E = 104000 cycles
N = 196800 cycles
STRAIN (in./in.)
FATIGUE TESTPOLYMER CONCRETE, RATE = 6 Hz. (PF1045)
Max. Stress Level = 0.40 fct
A = 1-3 cycles
B = 10000 cycles
C = 118500 cycles
= 622500 cycles
N > 1000000 cycles
STRAIN (in./in.)

Appendix H 233
FATIGUE TESTPOLYMER CONCRETE, RATE = 6 Hz. (PF2045)
Max. Stress Level = 0.38 f c'
A = 1-3 cycles
B = 10000 cycles
C 386500 cycles
= 520000 cycles
E = 896500 cycles
F = 997000 cycles
N > 1000000 cycles
STRAIN (in./in.)
FATIGUE TESTPOLYMER CONCRETE, RATE = 6 Hz. (PF3045)
Max. Stress Level = 0.34 fcr
A = 1-3 cycles
B = 10000 cycles
C 377000 cycles
D = 430000 cycles
E 505000 cycles
F = 886500 cycles
G = 996000 cycles
N > 1000000 cycles
STRAIN (in./in.)

Appendix H 234
FATIGUE TESTPOLYMER CONCRETE, RATE = 6 Hz. (PF104)
Max. Stress Level = 0.33 f:
A = 1-3 Cycles
B = 10000 Cycles
C 338000 Cycles
D = 394000 Cycles
E = 552200 Cycles
F = 880000 Cycles
N > 1000000 Cycles
STRAIN (In./in.)
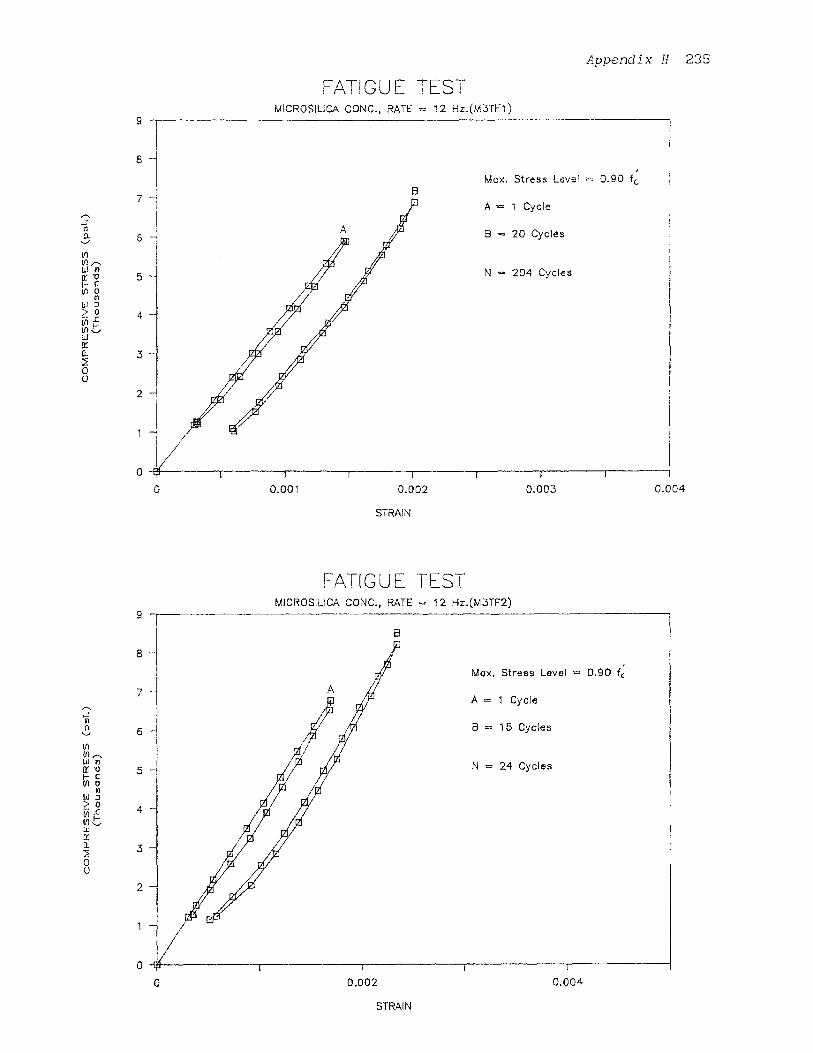
Appendix H 235
FATIGUE TEST -
MICROSILICA CONC., RATE = 12 Hz.(M3TF1)
Max. Stress Level = 0.90 f c'
A = 1 Cycle
= 20 Cycles
N = 204 Cycles
STRAIN
FATIGUE TESTMICROSILICA CONC., RATE = 12 Hz.(M3TF2)
Max. Stress Level = 0.9O f c
A = 1 Cycle
B = 15 Cycles
N 24 Cycles
STRAIN

Appendix H 236
FATIGUE TESTMICROSILICA CONC., RATE = 12 Hz.(M3TF3)
Max. Stress Level = 0.90 f
A ----- 1 Cycle
B = 13 Cycles
C = 20 Cycles
N = 21 Cycles
STRAIN
FATIGU E TESTMICROSILICA CONC., RATE = 12 Hz.(M3TF4)
Max. Stress Level = 0.80 'lc '
A = 1 Cycle
B = 15 Cycles
N = 3,470 Cycles
STRAIN
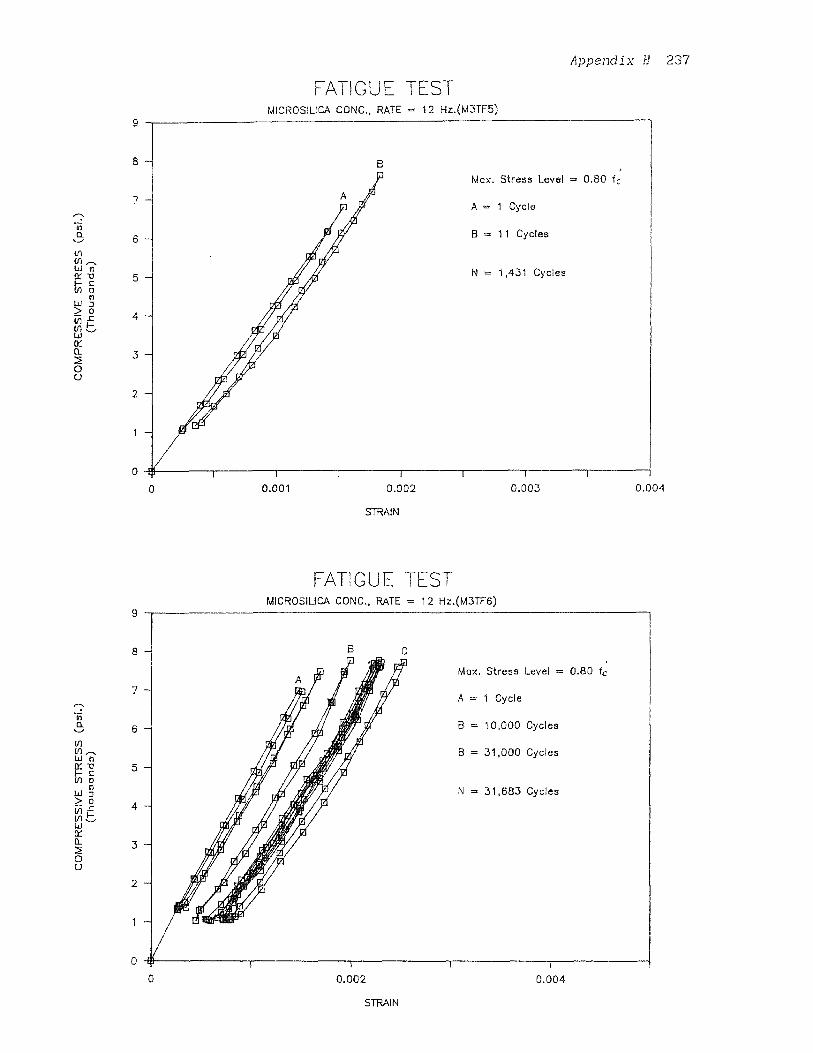
Appendix H 237
FATIGUE TESTMICROSILICA CONC., RATE = 12 Hz.(M3TF5)
Max. Stress Level = 0.80 f c
A = 1 Cycle
= 11 Cycles
N = 1,431 Cycles
STRAIN
FATIGUE TESTMICROSILICA CONC., RATE = 12 Hz.(M3TF6)
Max. Stress Level = 0.80
A 1 Cycle
B = 10,000 Cycles
B = 31,000 Cycles
N = 31,683 Cycles
STRAIN

Appendix H 238
FATIGUE TESTMICROSILICA CONC., RATE = 12 Hz.(M3TF7)
Max. Stress Level = 0.80 fc'
A = 1 Cycle
B 5,000 Cycles
C = 38,500 Cycles
N = 50,277 Cycles
STRAIN
FATIGUE TESTMICROSILICA CONC., RATE = 12 Hz (M3TF8)
Max. Stress Level = 0.75 f;
A = 1 Cycle
B = 52,300 Cycles
C 147,200 Cycles
N = 161,210 Cycles
STRAIN

Appendix H 239
FATIGUE TESTMICROSILICA CONC.,RATE = 12 Hz.(M3TF10)
Max. Stress Level = 0.75 fc.
A = 2,000 Cycles
13 = 425,800 Cycles
C = 1,266,000 Cycles
N 1,291,367 Cycles
STRAIN

APPENDIX I
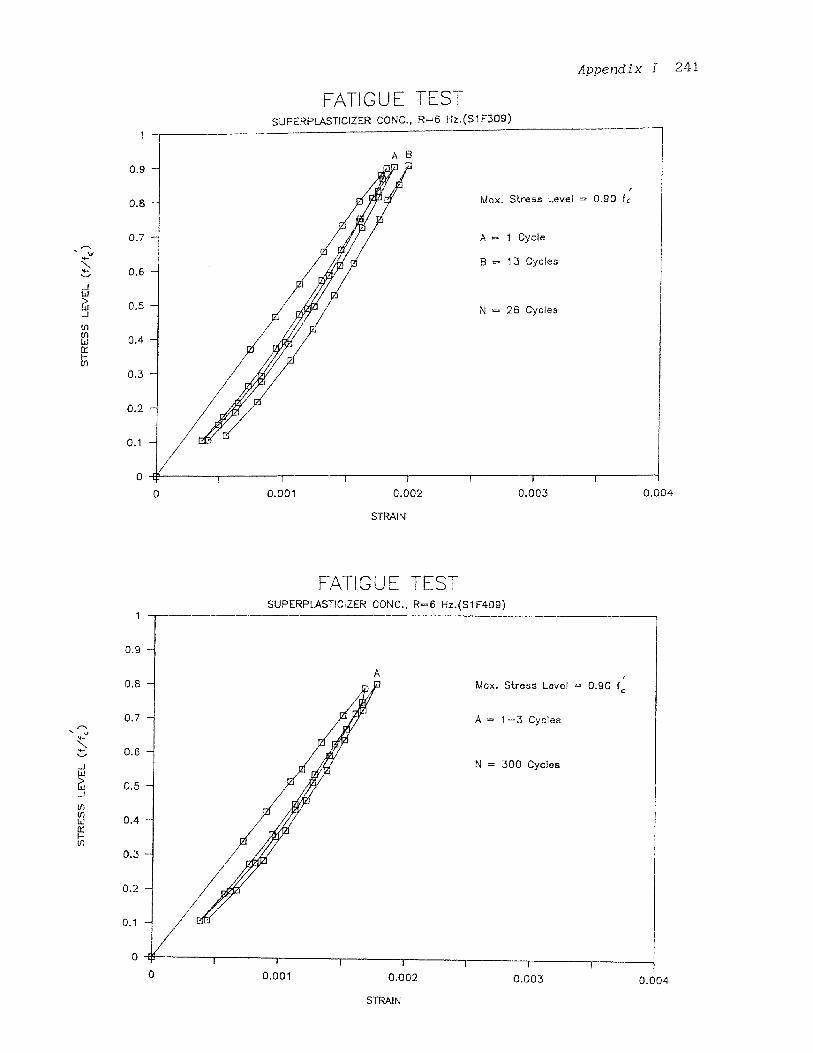
Appendix I 241
FATIGUE TESTSUPERPLASTICIZER CONC., R=6 Hz.(S1F309)
Max. Stress Level = 0.90 fc
A = 1 Cycle
B 13 Cycles
N 26 Cycles
STRAIN
FATIGUE TESTSUPERPLASTICIZER CONC., R=6 Hz.(S1F4-09)
Max. Stress Level = 0.90 f:
A = 1-3 Cycles
N = 300 Cycles
STRAIN

Appendix 1 242
FATIGUE TESTSUPERPLASTICIZER CONC., R=6 Hz.(S1F108)
Max. Stress Level = 0.80 f;
A = 1 Cycle
B = 3 Cycles
C 3,950 Cycles
N = 5,872 Cycles
STRAIN
FATIGUE TESTSUPERPLASTICIZER CONC., R=6 Hz.(S1F208)
Max. Stress Level = 0.80
A 1-3 Cycles
B = 3070 Cycles
N = 4,093 Cycles
STRAIN

Appendix I 243
FATIGUE TESTSUPERPLASTICIZER CONC., R=6 Hz.(S1F308)
Max. Stress Level = 0.80 f;
A = 1-2 Cycles
B = 3,355 Cycles
N = 4,566 Cycles
STRAIN
FATIGUE TESTSUPERPLASTICIZER CONC, R=6 Hz.(S1F275)
Max. Stress Level = 0.75 f:
A = 1-3 Cycles
N = 430,510 Cycles
STRAIN
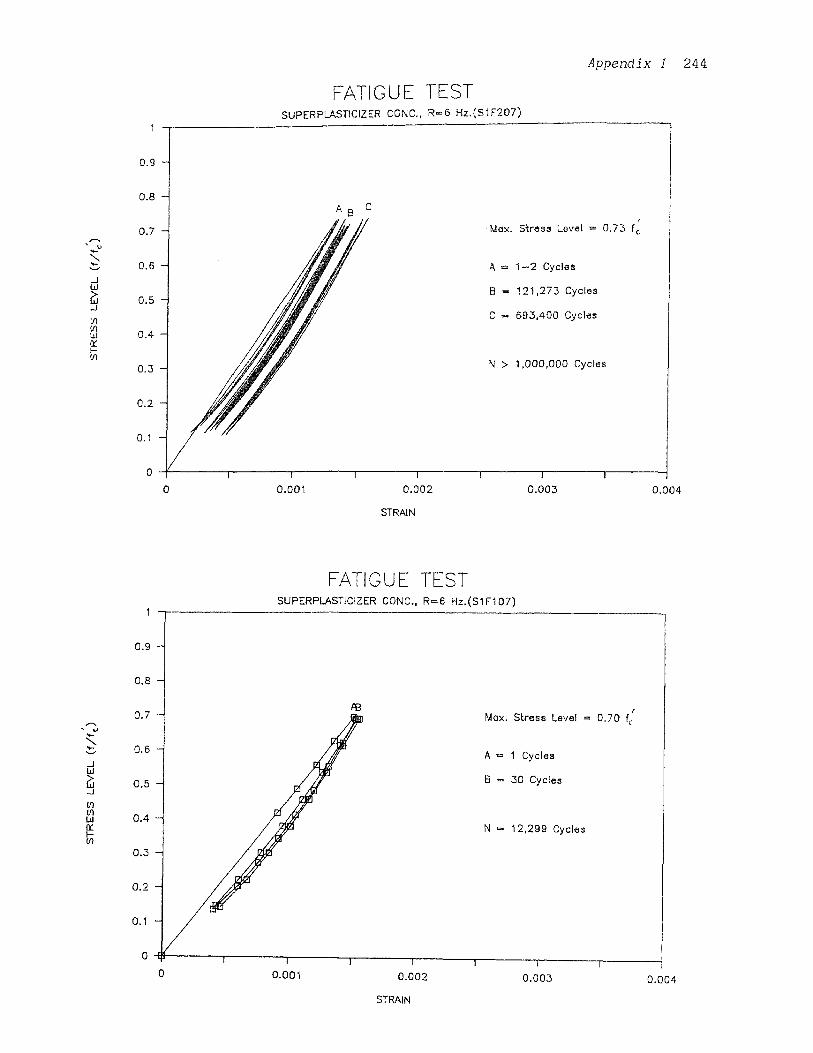
Appendix I 244
FATIGUE TESTSUPERPLASTICIZER CONC., R=6 Hz.(S1F207)
Max. Stress Level = 0.73 f:
A = 1-2 Cycles
B — 121,273 Cycles
C 693,400 Cycles
N > 1,000,000 Cycles
STRAIN
FATIGUE TESTSUPERPLASTICIZER CONC., R=6 Hz.(S1F107)
Max. Stress Level = 0.70 f:
A = 1 Cycles
B = 30 Cycles
N t- 12,299 Cycles
STRAIN

Appendix I 245
FATIGUE TESTSUPERPLASTICIZER CONC, R=6 Hz.(S1F307)
Max. Stress Level = 0.70
A = 1-2 Cycles
B = 1,027,230 Cycles
N > 1,027,230 Cycles
STRAIN
FATIGUE TESTSUPERPLASTICIZER CONC, R=6 Hz.(S1F175)
Max. Stress Level = 0.57 f;
A = 1-2 Cycles
B 935,750 Cycles
C 1,478,000 Cycles
N > 1,995,263 Cycles
STRAIN

Appendix I 246
FATIGUE TESTSUPERPLASTICIZER CONC, R=6 Hz.(S1F106)
Max. Stress Level 0.53 fc'
A = 1-2 Cycles
B = 127,720 Cycles
C = 663,840 Cycles
N > 1,000,000 Cycles
STRAIN
FATIGUE TESTSUPERPLASTICIZER CONC, R=6 Hz.(S1F206)
Max. Stress Level = 0.50
A =. 1-2 Cycles
B = 90,300 Cycles
C 628,030 Cycles
N > 1,000,000 Cycles
STRAIN

Appendix I 247
FATIGUE TESTMICROSILICA CONC., RATE = 6 Hz.(M1F209)
Max. Stress Level = 0.90 f;
A = 1-2 Cycles
B — 60 Cycles
N 380 Cycles
STRAIN
FATIGUE TESTMICROSILICA CONC., RATE = 6 Hz.(M1F309)
Max. Stress Level = 0.90 f:
A — 1,2 Cycles
N = 204 Cycles
STRAIN

Appendix I 248
A11 CUEE TESTMICROSILICA CONC., RATE 6 Hz.(M1F409)
Max. Stress Level = 0.90 f:
A 1-3 Cycles
B 400 Cycles
C 600 Cycles
N 608 Cycles
STRAIN
FATIGUE TESTMICROSILICA CONC., RATE 6 Hz.(M2F209)
Max. Stress Level = 0.90 fc'
A 1 Cycle
B = 3 Cycles
N 6 Cycles
STRAIN

Appendix I 249
FATIGUE TESTMICROSILICA CONC., RATE = 6 Hz.(M2F108)
Max. Stress Level = 0.80 f:
A = 1-3 Cycles
8 — 1,600 Cycles
C = 3,202 Cycles
N = 4,014 Cycles
FATIGUE TES-
MICROSILICA CONC., RATE = 6 Hz.(M2F208)
Max. Stress Level = 0.80 f:
A = 1-3 Cycles
B 1,280 Cycles
C 4,970 Cycles
N = 8,937 Cycles
STRAIN

Appendix I 250
FATIGUE TESTMICROSILICA CONC.,RATE = 6 Hz.(M2F2075)
Max. Stress Level 0.75 fc '
A = 1-3 Cycles
B = 4,000 Cycles
C 39,000 Cycles
D = 91,850 Cycles
N 102,200 Cycles
STRAIN
FATIGUE TESTMICROSILICA CONC.,RATE = 6 Hz.(M2F3075)
Max. Stress Level = 0.75 f:
A = 1-3 Cycles
B 4,000 Cycles
C 36,050 Cycles
D =. 110,720 Cycles
E 175,930 Cycles
N = 196,540 Cycles
STRAIN
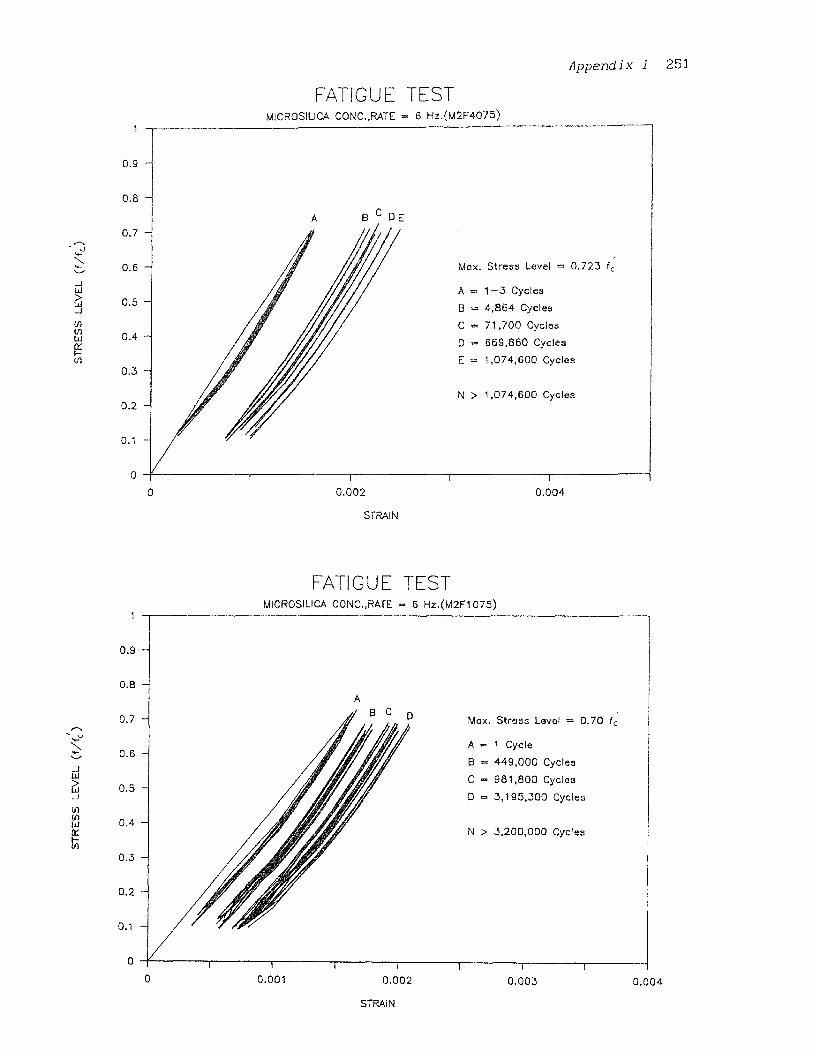
Appendix I 251
FATIGUE TESTMICROSILICA CONC.,RATE 6 Hz.(M2F4075)
Max. Stress Level = 0.723 f:
A = 1-3 Cycles
B 4,864 Cycles
C 71,700 Cycles
669,860 Cycles
E 1,074,600 Cycles
N > 1,074,600 Cycles
STRAIN
FATIGUE TESTMICROSILICA CONC.,RATE = 6 Hz.(M2F1075)
Max. Stress Level = 0.70 f:
A 1 Cycle
B 449,000 Cycles
C — 981,800 Cycles
D = 3,195,300 Cycles
N > 3,200,000 Cycles
STRAIN

Appendix I 252
FATIGUE TESTMICROSILICA CONC., RATE = 6 Hz.(M1F107)
Max. Stress Level = 0.605 f:
A 1-2 Cycles
• 600 Cycles
C = 20,000 Cycles
D = 90,000 Cycles
E = 513,500 Cycles
N > 1,000,000 Cycles
STRAIN
FATIGUE TESTMICROSILICA CONC., RATE B Hz.(M1F207)
Max. Stress Level = 0.60 f
A 1-2 Cycles
B 455,400 Cycles
N > 1,000,000 Cycles
STRAIN

Appendix I 253
FATIGUE TESTPOLYMER CONCRETE , RATE = 6 Hz. (PF108)
Max. Stress Level = 0.80 fc'
A 1-3 cycles
B = 927 cycles
C 2449 cycles
N = 3608 cycles
STRAIN (in./in.)
FATIGUE TESTPOLYMER CONCRETE , RATE = 6 Hz. (PF208)
Max. Stress Level = 0.80 f c'
A = 1-3 cycles
B = 2380 cycles
C = 4475 cycles
N = 4476 cycles
STRAIN (in/in)

Appendix I 254
FATIGUE TESTPOLYMER CONCRETE , RATE = 6 Hz. (PF107)
Max. Stress Level = 0.70 f c.
A = 1-3 cycles
B = 1070 cycles
C = 3000 cycles
0 = 6000 cycles
E 8292 cycles
F 8304 cycles
N = 8650 cycles
STRAIN (in./in.)
FATIGUE TESTPOLYMER CONCRETE , RATE = 6 Hz. (PF207)
Max. Stress Level = 0.70 f c'
A = 1-3 cycles
B = 1000 cycles
C = 2500 cycles
D 4000 cycles
E = 5500 cycles
F = 8011 cycles
G = 8051 cycles
N 8052 cycles
STRAIN (in./in.)

Appendix I 255
FATIGUE TESTPOLYMER CONCRETE, RATE = 6 Hz.(PF106)
Max. Stress Level = 0.60 f c
A = 1-3 cycles
B = 3000 cycles
C 8000 cycles
• 14000 cycles
E 17000 cycles
F = 21034 cycles
G s 23038 cycles
H -= 24787 cycles
N = 24789 cycles
FATIGUE TESTPOLYMER CONCRETE, RATE = 6 Hz. (PF206)
Max. Stress Level = 0.60 f c'
A = 1-12 cycles
B 10000 cycles
C = 26400 cycles
N = 35034 cycles
STRAIN (in./in.)

Appendix I 256
FATIGUE TESTPOLYMER CONCRETE, RATE = 6 Hz. (PF105)
Max. Stress Level = 0.50 t;
A = 1-3 cyclesB 4024 cyclesC = 15500 cyclesD = 23000 cyclesE = 34000 cyclesF = 40000 cyclesC = 46000 yclesH = 55000 cyclesI = 67000 cyclesJ = 79000 cyclesK = 94000 cyclesL = 105000 cycles
N = 121431 cycles
STRAIN (in./in.)
FATIGUE TESTPOLYMER CONCRETE, RATE = 6 Hz. (PF205)
Max. Stress Level = 0.50
A = 1-3 cyclesB = 7000 cyclesC = 25000 cyclesD = 40000 cyclesE = 73000 cyclesF = 85000 cyclesG = 100000 cyclesH = 110000 cyclesI = 121000 cyclesJ = 126500 cyclesK = 127958 cycles
N = 128000 cycles
STRAIN (in./in.)

Appendix I 257
FATIGUE TESTPOLYMER CONCRETE, RATE = 6 Hz. (PF305)
Max. Stress Level = 0.50
A = 1-3 cycles
• = 2000 cycles
C = 26000 cycles
D 87500 cycles
E 104000 cycles
N 196800 cycles
STRAIN (in./in.)
FATIGUE TESTPOLYMER CONCRETE, RATE = 6 Hz. (PF1045)
Max. Stress Level = 0.40 f c'
A = 1-3 cycles
B = 10000 cycles
C = 118500 cycles
D = 622500 cycles
N > 1000000 cycles
STRAIN (In./in.)

Appendix I 258
FATIGUE TESTPOLYMER CONCRETE, RATE = 6 Hz. (PF2045)
Max. Stress Level = 0.38 fc
A = 1-3 cycles
B = 10000 cycles
C = 386500 cycles
D = 520000 cycles
E 896500 cycles
F = 997000 cycles
N > 1000000 cycles
STRAIN (in./in.)
FATIGUE TESTPOLYMER CONCRETE, RATE = 6 Hz. (PF3045)
Max. Stress Level = 0.34 fc
A = 1-3 cycles
B = 10000 cycles
C = 377000 cycles
D = 430000 cycles
E = 505000 cycles
F = 886500 cycles
G 996000 cycles
N > 1000000 cycles
STRAIN (in./in.)

Appendix I 259
FATIGUE TESTPOLYMER CONCRETE, RATE = 6 Hz. (PF104)
Max. Stress Level = 0.33 fc
A = 1-3 Cycles
B 10000 Cycles
C = 338000 Cycles
D = 394000 Cycles
E 552200 Cycles
F = 880000 Cycles
N > 1000000 Cycles
STRAIN (in./in.)

Appendix I 260
FATIGUE TESTMICROSILICA CONC., RATE = 12 Hz.(M3TF1)
Max. Stress Level = 0.90 fc'
A = 1 Cycle
B = 20 Cycles
N = 204 Cycles
STRAIN
FATIGUE TESTMICROSILICA CONC., RATE = 12 Hz.(M3TF2)
Max. Stress Level = 0.90 fc'
A = 1 Cycle
B = 15 Cycles
N = 24 Cycles
STRAIN

Appendix I 261
FATIGUE TESTMICROSILICA CONC., RATE = 12 Hz.(M3TF3)
Max. Stress Level = 0.90 f c
A = 1 Cycle
B = 13 Cycles
C = 20 Cycles
N = 21 Cycles
STRAIN
FATIGUE TESTMICROSILICA CONC., RATE = 12 Hz.(M3TF4)
Max. Stress Level = 0.80 f c'A= 1 Cycle
B = 15 Cycles
N 3,470 Cycles
STRAIN

Appendix 1 ²62
FATIGUE TESTMICROSILICA CONC., RATE = 12 Hz.(M3TF5)
Max. Stress Level = 0.80 f:
A = 1 Cycle
B = 11 Cycles
N = 1,431 Cycles
STRAIN
FATIGUE TESTMICROSILICA CONC., RATE = 12 Hz.(M3TF6)
Max. Stress Level = 0.80 1;
A = 1 Cycle
B 10,000 Cycles
B = 31,000 Cycles
N = 31,683 Cycles
STRAIN

Appendix I ²63
FATIGUE TESTMICROSILICA CONC., RATE = 12 Hz.(M3TF7)
Max. Stress Level = 0.80 fc.
A 1 Cycle
B = 5,000 Cycles
C = 38,500 Cycles
N = 50,277 Cycles
STRAIN
FATIGUE TESTMICROSILICA CONC., RATE = 12 Hz (M3TF8)
Max. Stress Level = 0.75 f,
A = 1 Cycle
B = 52,300 Cycles
C = 147,200 Cycles
N 161,210 Cycles
STRAIN

Appendix I 264
FATIGUE TESTMICROSILICA CONC.,RATE = 12 Hz.(M3T1 0 )
Max. Stress Level = 0.75
A = 2,000 Cycles
B = 425,800 Cycles
C = 1,266,000 Cycles
N = 1,291,367 Cycles
STRAIN

APPENDIX J

Appendix J 266
MONOTONIC VS. CYCLIC CURVESUPERPLASTICIZER CONCRETE (S1F175)
SUPERPLASTICIZER CONCRETE
Monotonic—Cyclic Relationship
Compressive stress, ft = 8932 psi.
Max. stress level = 0.603 f:
Min. stress levet = 0.08 fc .
No. of cycle to failure, N > 2,000,000
STRAIN (in./in.)
MONOTONIC VS. CYCLIC CURVESUPERPLASTICIZER CONCRETE (S1F206)
SUPERPLASTICIZER CONCRETE
Manotonic—Cyclic Relationship
Compressive stress, f 8630 psi.
Max. stress level = 0.502 f;
Min. stress level = 0.084 fc'
No.of cycle to failure, N > 1,000,000
STRAIN (in./in.)

Appendix J 267
MONOTONIC VS. CYCLIC CURVESUPERPLASTICIZER CONC, R=6 Hz.(S1F307)
Max. Stress Level = 0.70 f c
A = 1-2 Cycles
8 = 1.027,230 Cycles
N > 1,027,230 Cycles
STRAIN (in./in.)
MONOTONIC VS. CYCLIC CURVESUPERPLASTICIZER CONC. R=6 Hz.(S1F106)
Max. Stress Level = 0.53 fc
A 1-2 Cycles
= 127,720 Cycles
C = 663,840 Cycles
N > 1,000,000 Cycles
STRAIN (in./in.)
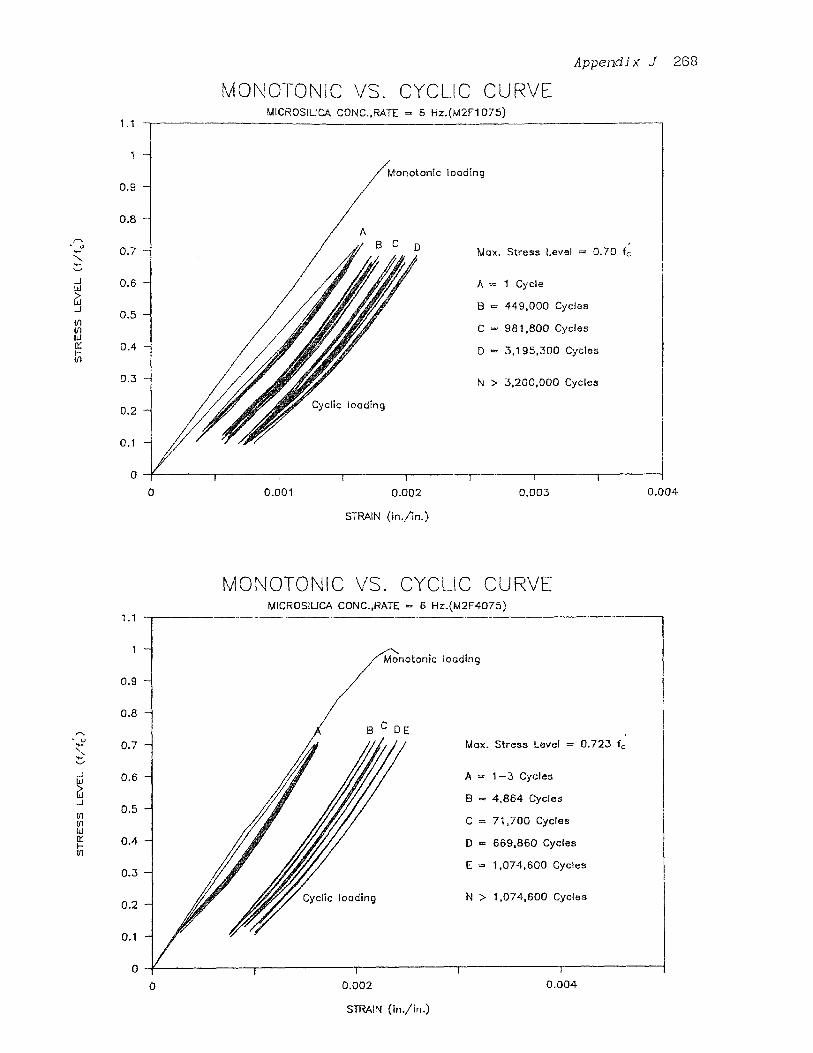
Appendix J 268
MONOTONIC VS. CYCLIC CURVEMICROSILICA CONC.,RATE = 6 Hz.(M2F1075)
/Monotonic loading
Max. Stress Level = 0.70 f c'
A 1 Cycle
B = 449,000 Cycles
C = 981,800 Cycles
ID = 3,195,300 Cycles
N > 3,200,000 Cycles
Cyclic loading
MONOTONIC VS. CYCLIC CURVEMICROSILICA CONC.,RATE = 6 Hz.(M2F4075)
Monotonic loading
• U
J
sw
Cyclic loading
Max. Stress Level = 0.723 f:
A = 1-3 Cycles
= 4,864 Cycles
C 71,700 Cycles
D = 669,860 Cycles
E = 1,074,600 Cycles
N > 1,074,600 Cycles
STRAIN (in./in.)

Appendix J 269
MONOTONIC VS. CYCLIC CURVEPOLYMER CONCRETE, RATE 6 Hz. (PF1045)
Max. Stress Level 0.40
A = 1-3 cycles
• = 10000 cycles
C = 118500 cycles
D = 622500 cycles
N > 1 0 0 0 0 0 0 cycles
MONOTONIC VS. CYCLIC CURVEPOLYMER CONCRETE, RATE = 6 Hz. (PF2045)
Max. Stress Level 0.38 f c
A 1-3 cycles
B=10 0 0 0 cycles
C m 386500 cycles
D 520000 cycles
E 896500 cycles
F o 997000 cycles
N > 100O000 cycles
STRAIN (in./in.)

Appendix J 270
MONOTONIC VS. CYCLIC CURVIPOLYMER CONCRETE, RATE 6 Hz. (PF3045)
Max. Stress Level 0.34 f:
A = 1-3 cycles
B 10000 cycles
C = 377000 cycles
• c-1 430000 cycles
E 505000 cycles
F 886500 cycles
G 996000 cycles
N > 1000000 cycles
STRAIN (in./in.)
MONOTONIC VS. CYCLIC CURVEPOLYMER CONCRETE, RATE 6 Hz. (PF104)
Max. Stress Level = 0.33
A = 1-3 Cycles
10000 Cycles
C 338000 Cycles
D e 394000 Cycles
E 552200 Cycles
F 880000 Cycles
N > 1000O00 Cycles
STRAIN (in./in.)

APPENDIX K

Appendix K 272
STRAIN VS. CYCLE CURVESUPERPLASTICIZER CONCRETE (S1F309)
Max. Stress Level = 0.90 f:
N m 28 Cycles
NUMBER OF CYCLES OF LOAD (N)
STRAIN VS. CYCLE CURVESUPERPLASTICIZER CONCRETE (S1F1 08)
Max. Stress Level = 0.80 f c'
N 5,875 Cycles
(Thousands)NUMBER OF CYCLES OF LOAD (N)

Appendix K 273
STRAIN VS. CYCLE CURVESUPERPLASTICIZER CONCRETE (S1F208)
Max. Stress Level = 0.80 f;
N = 4,096 Cycles
(Thousands)NUMBER OF CYCLES OF LOAD (N)
STRAIN VS. CYCLE CURVESUPERPLASTICIZER CONCRETE (S1F3O8)
Max. Stress Level = 0.80 f:
N = 4,566 Cycles
(Thousands)NUMBER OF CYCLES OF LOAD (N)

Appendix K 274
SRAIN VS. CYCLE CURVESUPERPLASTICIZER CONCRETE (S1F207)
Max. Stress Level = 0.73 fc.
N > 1,000,000 Cycles
(Millions)NUMBER OF CYCLES OF LOAD (N)
STRAIN VS. CYCLE CURVESUPERPLASTICIZER CONCRETE (S1F107)
Max. Stress Level = 0.70
N = 12,299 Cycles
NUMBER OF CYCLES OF LOAD (N)

Appendix K 275
STRAIN VS. CYCLE CURVESUPERPLASTICIZER CONCRETE (51F307)
Max. Stress Level = 0.70 1;
N > 1,027,230 Cycles
(MilIions)NUMBER OF CYCLES OF LOAD (N)
STRAIN VS. CYCLE CURVESUPERPLASTICIZER CONCRETE (S1F175)
Max. Stress Level = 0.57 1:
N > 1,995,263 Cycles
(MillIons)NUMBER OF CYCLES OF LOAD (N)

Appendix K 276
STRAIN VS. CYCLE CURVESUPERPLAST1CIZER CONCRETE (S1F106)
Max. Stress Level 0.53 fc'
N > 1,000,000 Cycles
(Millions)NUMBER OF CYCLES OF LOAD (N)
STRAIN VS. CYCLE CURVESUPERPLASTICIZER CONCRETE (S1F206)
Max. Stress Level 0.50 fc'
N > 1,000,000 Cycles
(Millions)NUMBER OF CYCLES OF LOAD (N)

Appendix K 277
STRAIN VS. CYCLE CURVE
MICROSILICA CONCRETE (M1F209)
Me x. Suess LeveL 0.90 f:
N -4-.• 380 Cycles
NUMBER OF CYCLES OF LOAD (N)
STRAIN VS. CYCLE CURVEMICROSILICA CONCRETE (M1F409)
Mc:<. Stress Level 0.90 f:
N 7-- 608
NUMBER OF CYCLES OF LOAD (N)

Appendix K 278
STRAIN VS. CYCLE CURVE.MICROSILICA CONCRETE (M2F209)
Max. Stress Level = 0.90 -II:
N = 6 Cycles
NUMBER OF CYCLES OF LOAD (N)
STRAIN VS. CYCLE CURVEMICROSILICA CONCRETE (M2F108)
Max. Stress Level = 0.80 f4
N = 4,014 Cycles
(Thausands)NUMBER OF CYCLES OF LOAD (N)

Appendix K 279
STRAIN VS. CYCLE CURVEMICROSILICA CONCRETE (M2F208)
Max. Stress Level = 0.80 f:
N = 8,937 Cycles
4(Thousands)
NUMBER OF CYCLES OF LOAD (N)
STRAIN VS. CYCLE CURVEMICROSILICA CONCRETE (M2F2075)
Max. Stress Level = 0.75 fc
N = 102,200 Cycles
(Thousands)NUMBER OF CYCLES OF LOAD (N)

Appendix K 280
STRAIN VS. CYCLE CURVEMICROSILICA CONCRETE (M2F3075)
Max. Stress Level 0.75 fc
N 196,540 Cycles
(Thousands)NUMBER OF CYCLES OF LOAD (N)
STRAIN VS. CYCLECURVE
MICROSILICA CONCRETE (M2F4075)
Max. Stress Level 0.723 fc'
N > 1,074,600 Cycles
(Millions)NUMBER OF CYCLES OF LOAD (N)

Appendix K 281
STRAIN VS. CYCLE CURVMICROSILICA CONCRETE (M2F1075)
Max. Stress Level 0.70 fc'
N > 3,200,000 Cycles
(Millions)NUMBER OF CYCLES OF LOAD (N)
STRAIN VS. CYCLE CURVEMICROSILICA CONCRETE (M1F1O7)
Max. Stress Level = 0,605 f,
N > 1,000,000 Cycles
(Millions)NUMBER OF CYCLES OF LOAD (N)
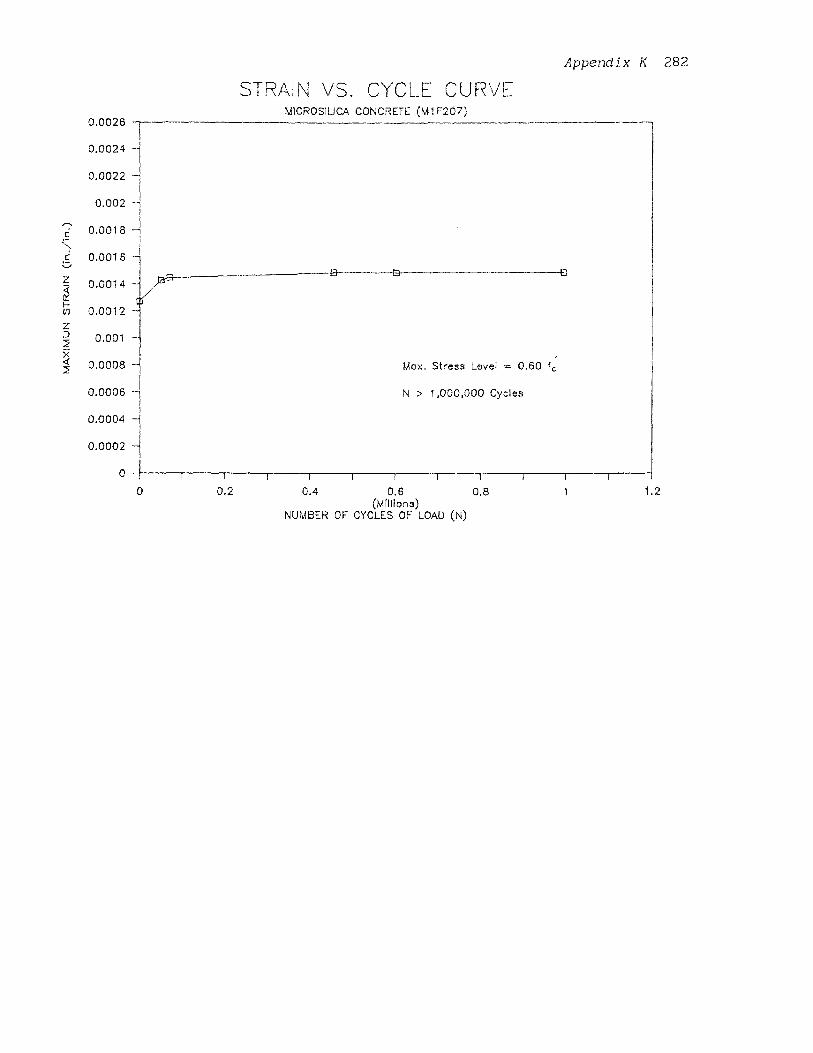
Appendix K 282
STRAIN VS. CYCLE CURVEMICROSILICA CONCRETE (M1F207)
Max. Stress Level = 0.60 f c'
N > 1,000,00O Cycles
U.4(Millions)
NUMBER OF CYCLES OF LOAD (N)

Appendix K 283
STRAIN VS. CYCLE CURVEPOLYMER CONCRETE (PF108)
Max. Stress Level = 0.80 f c'
N = 3,608 Cycles
(Thousands)NUMBER OF CYCLES OF LOAD (N)
STRAIN VS. CYCLE CURVEPOLYMER CONCRETE (PF208)
Max. Stress Level = 0.80 f c'
N = 4,476 Cycles
(Thousands)NUMBER OF CYCLES OF LOAD (N)

Appendix K ²84
STRAIN VS. CYCLE CURVEPOLYMER CONCRETE (PF107)
Max. Stress Level 0.70 f:
N = 8.650 Cycles
(Thousands)NUMBER OF CYCLES OF LOAD (N)
STRAIN VS. CYCLE CURVEPOLYMER CONCRETE (PF207)
Max. Stress Level = 0.70 f c'
N 8.052 Cycles
(Thousands)NUMBER OF CYCLES OF LOAD (N)

Appendix K ²85
STRAIN VS. CYCLE CURVEPOLYMER CONCRETE (PF106)
Max. Stress Level = 0.60 fc'
N = 24,789 Cycles
(Thousands)NUMBER OF CYCLES OF LOAD (N)
STRAIN VS. CYCLE CURVEPOLYMER CONCRETE (PF206)
Max. Stress Level = 0,60 f c'
N 35,O34 Cycles
(Thousands)NUMBER OF CYCLES OF LOAD (N)

Appendix K 286
STRAIN VS. CYCLE CURVEPOLYMER CONCRETE (PF1O5)
Max. Stress Level = 0.50 f;
N = 121,431 Cycles
(Thousands)NUMBER OF CYCLES OF LOAD (N)
STRAIN VS. CYCLE CURVEPOLYMER CONCRETE (PF205)
Max. Stress Level = 0.50 f;
N 127,958 Cycles
(Thousands)NUMBER OF CYCLES OF LOAD (N)

Appendix K 287
STRAIN VS. CYCLE CURVEPOLYMER CONCRETE (PF305)
Max. Stress Level 0.50 fc'
STRAIN VS. CYCLE CURVEPOLYMER CONCRETE (PF1045)
Max. Stress Level = 0.40 fc'
N > 1.000,000 Cycles
0.4 0.6 0.f(Millions)
NUNBER OF CYCLES OF LOAD (N)

Appendix K 288
STRAIN VS. CYCLE CURVEPOLYMER CONCRETE (PF2045)
Max. Stress Level = 0.38 fc'
N > 1,000,000 Cycles
(Millions)NUMBER OF CYCLES OF LOAD (N)
STRAIN VS. CYCLE CURVEPOLYMER CONCRETE. (PF3045)
Max. Stress Level = 0.34 f c'
N > 1,000,000 Cycles
(Millions)NUMBER OF CYCLES OF LOAD (N)

Appendix K 289
STRAIN VS. CYCLE CURVEPOLYMER CONCRETE (PF104)
Max. Stress Level = 0.33 f c
N > 1,000,O00 Cycles
(Millions)NUMBER OF CYCLES OF LOAD (N)

APPENDIX L

Appendix L 291
COMPRESSION PROPERTIES OF
NORMAL CONCRETE
Speci
men
Date
Casted
Date
TestedDay
Unit
wt.
(1b/ft³ )
Max
Load
(lb)
Max
Compr.
Streng
(psi)
Strain
at Max
Load
-³x10 in
Modulus
of Elas
ticity
x106psi
SN1
SN2
SN³
9/1³/87
9/1³/87
9/1³/87
10/³/87
10/³/87
. 10/3/87
21
21
21
¹50.00
149.50
149.20
³7740
³5510
36790
5³³9
5024
506³
³.40
³.42
3.85
2.222
2.101
1.809

Appendix L 29²
COMPRESSION PROPERTIES OF
SUPERPLASTICIZER CONCRETE
Specimen
DateCasted
DateTested
DayUnitwt.
(1b/ft³
)
MaxLoad
(lb)
MaxCompr.Streng
(psi)
Strainat MaxLoad
-³x10 ni
Modulusof Elasticity
x106 psi
S1 9/²2/86 10/²9/86 ³7 ¹50.² ³9040 55²1 1.910 ³.250
S2 9/²2/86 10/²9/86 ³7 ¹50.³ 4²190 5966 1.9³0 ³.³10
S³ 9/²2/86 10/29/86 37 149.6 ³3940 4799 1.900 3.280
S4 9/²²/86 11/21/86 60 149.8 56120 79³6 2.010 ³.510
S5 9/22/86 11/²1/86 60 150.2 51980 7351 ².100 ³.430
S6 9/2²/86 11/²1/86 60 150.4 51³80 7266 1.950 3.450
S7 9/2²/86 11/²1/86 60 150.³ 52110 7³69 2.0³0 ³.550
31S1 12/²²/86 ²/18/87 58 150.2 50280 711³ 1.950 4.180
S1S2² 12/²2/86 2/18/87 58 ¹50.0 50100 7074 1.910 4.150
S1S106 12/²2/86 2/25/87 65 149.7 41000 5800 1.810 ³.910
51S206 12/22/86 2/²5/87 65 149.8 42³10 5986 1.8³0 ³.550
S1S306 1²/2²/86 ²/²5/87 65 ¹50.1 60460 855³ ².³50 ³.910
S1S406 1²/²²/86 2/²5/87 65 150.1 476²0 67³7 1.9²² ³.840
S1S109 12/²2/86 ³/²/87 70 ¹50.³ 51³60 7²66 ².010 ³.740
S19²09 12/2²/86 ³/²/87 70 149.9 529²9 7488 2.³00 ³.510S1S309 1²/²2/86 ³/²/87 70 150.² 4894² 69²4 ².1²0 ³.480
S1F106A 1²/²2/86 ³/2/87 70 150.4 57752 8167 ².100 4.100
S1F206A 1²/²2/86 ³/4/87 7² ¹50.5 60757 859² ².²00 4.²20
S1F207A 12/2²/86 ²/25/87 65 ¹50.³ 49010 69³1 1.9³0 4.030
S1F³07A 12/²2/86 ²/27/87 67 149.8 51621 7³00 1.950 4.160
S1F175A 1²/²2/86 ³/8/87 76 150.2 56³70 7975 1.920 4.440

Appendix L 293
COMPRESSION PROPERTIES OF
MICROSILICA CONCRETE
Speci
men
Date
Carted
Date
TestedDay
Unit
wt.
( b/ft³
Max
Load
(lb)
Max
Compr.
Streng
(psi)
Strain
at Max
Load
x10-³in
Modulus
of Elas
ticity
x106 psi
M1S1 11/5/86 12/10/86 35 150.3 59900 8471 2.070 4.260
M1S2 11/5/86 12/10/86 35 150.6 65610 9278 2.210 4.420
M1S3 11/5/86 12/10/86 35 150.3 65480 9260 2.180 4.760
M1S108 11/5/86 1/6/87 62 150.1 62450 8831 2.120 4.310
M15208 11/5/86 1/6/87 62 150.3 57810 8175 2.010 4.260
M1S308 11/5/86 1/6/87 62 150.5 63650 9001 2.110 4.350
M1S109 11/5/86 1/9/87 65 150.7 66110 9349 2.250 4.450
M1S209 11/5/86 1/9/87 65 150.4 67400 9531 2.220 4.390
M15309 11/5/86 1/9/87 65 150.2 65440 9254 2.160 4.390
M25107 1/13/87 2/23/88 406 150.6 68030 9624 2.390 4.540
M25207 1/13/87 2/23/88 406 150.1 63450 8976 2.360 4.050
M25307 1/13/87 2/23/88 406 149.8 57080 8075 2.180 3.990
M1F107A 11/5/86 1/10/87 66 150.6 76790 10859 N/A N/A
M1F207A 11/5/86 1/12/88 68 150.3 77980 11027 2.100 5.430
M2F175A 1/13/87 2/23/88 406 150.2 67970 9616 1.890 4.540
M2F475A 1/13/87 3/2/88 415 150.3 65220 9227 2.341 4.350
M3S1 2/18/87 10/30/88 622 150.3 59580 8429 2.183 4.611
N3S3 2/18/87 10/30/88 622 149.8 70260 9995 2.192 4.769
M3S4 2/18/87 10/30/88 622 150.3 69010 9763 2.274 4.587
M3TF11A 2/18/87 11/5/88 628 150.1 77920 11024 2.235 5.260
M3TF12A 2/18/87 11/7/88 630 150.2 78800 11148 2.563 4.829
SS31 4/20/87 6/25/87 66 150.5 78320 11080 2.110 5.061
SS32 4/20/87 6/25/87 66 150.0 52580 7439 1.950 3.810
SS33 4/20/87 6/25/87 66 150.1 55570 7862 2.110 3.830
Continued

Appendix L 294
SS41 6/23/87 10/3/87 102 ¹50.1 56940 8055 N/A N/A
SS42 6/23/87 10/3/87 102 ¹50.5 70920 10033 2.680 4.260
SS43 6/23/87 10/3/87 102 149.9 59100 8361 1.960 4.230
SS61 4/27/87 8/25/87 120 ¹50.3 67070 9488 2.080 4.360
SS62 4/27/87 8/25/87 120 ¹50.5 86240 12200 2.490 4.710 '
SS63 27/87 8/25/87 120 ¹50.4 82800 11714 2.630 4.610
SS311 7/14/87 10/3/87 82 ¹50.4 5766 8¹57 N/A N/A
SS321 7/14/87 10/3/87 82 ¹50.2 5732 8109 2.170 3.780
SS331 7/14/87 10/3/87 82 150.4 5489 7765 2.281 4.001
S11 5/24/88 10/30/88 159 ¹50.1 60270 8781 1.779 4.961
S12 5/24/88 10/30/88 ¹59 150.3 52290 7398 1.723 4.278
S13 5/24/88 10/30/88 ¹59 149.8 57840 8283 1.872 4.324
S21 5/25/88 10/30/88 159 149.9 54350 7689 1.871 4.117
S22 5/25/88 10/30/88 158 150.1 75460 10676 2.008 5.641
S23 5/25/88 10/30/88 ¹58 ¹50.2 51870 7338 1.653 4.396
S31 5/25/88 10/30/88 ¹58 150.3 62790 8883 1.988 4.496
S32 5/25/88 10/30/88 158 149.8 50980 7212 1.697 4.420
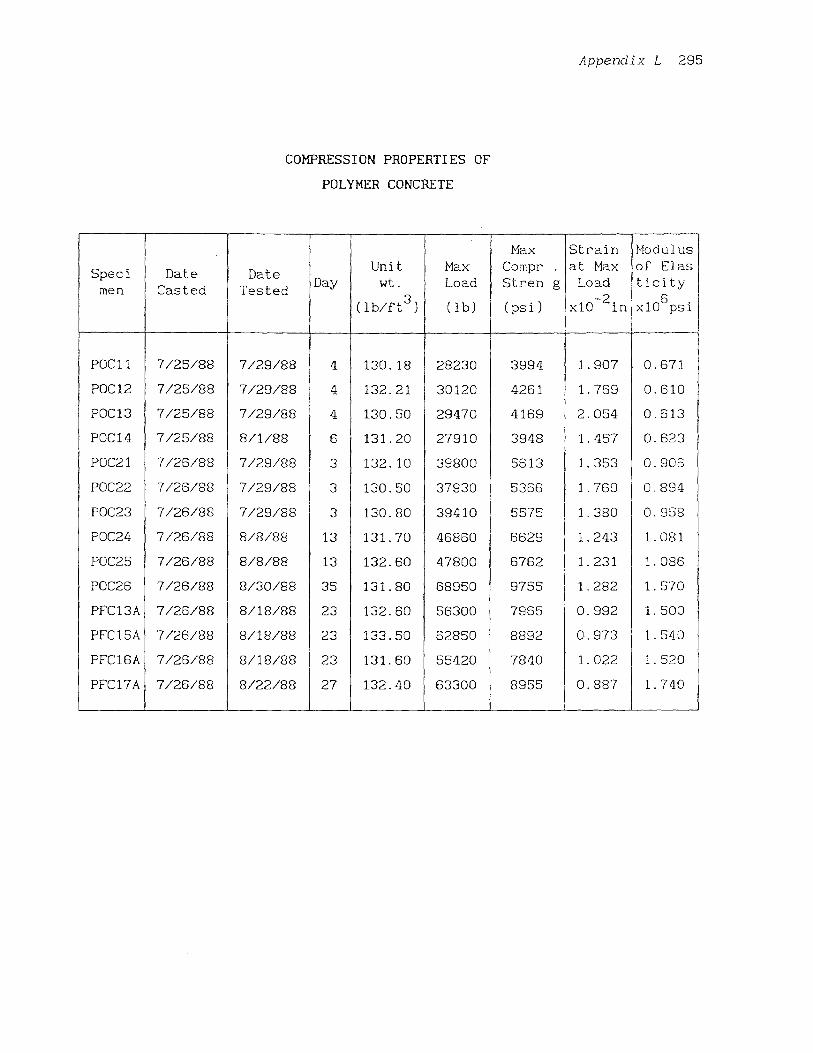
Appendix L 295
COMPRESSION PROPERTIES OF
POLYMER CONCRETE
Specimen
Date
Casted
Date
TestedDay
Unit
wt.
(lb/ft³)
Max
Load
(lb)
Max
Compr.
Stren g
(psi)
Strain
at Max
Load
-2x10 in
Modulus ]of Elas
ticity I
6x10 psi
P0011 7/25/88 7/29/88 4 130.18 28230 3994 1.907 0.671
POC12 7/25/88 7/29/88 4 132.21 30120 4261 1.769 0.610
POC13 7/25/88 7/29/88 4 130.50 29470 4169 2.054 0.613
P0C14 7/25/88 8/1/88 6 131.20 27910 3948 1.457 0.623
POC21 7/26/88 7/29/88 3 132.10 39800 5613 1.353 0.906
P0022 7/26/88 7/29/88 3 130.50 37930 5366 1.769 0.894
P8023 7/26/88 7/29/88 3 130.80 39410 5575 1.380 0,958
P0024 7/26/88 8/8/88 13 131.70 46860 6629 1.243 1.081
P0025 7/26/88 8/8/88 13 132.60 47800 6762 1.231 1.086
P0026 7/26/88 8/30/88 35 131.80 68950 9755 1.282 1.570
PFC13A 7/26/88 8/18/88 23 132.60 56300 7965 0.992 1.500
PFC15A 7/26/88 8/18/88 23 133.50 62850 8892 0.973 1.540
PFC16A 7/26/88 8/18/88 23 131.60 55420 7840 1.022 1.520
PFC17A 7/26/88 8/22/88 27 132.40 63300 8955 0.887 1.740

Appendix L 296
FLEXURAL PROPERTIES OF
MICROSILICA CONCRETE
Size of
Specimen
Speci
men
Date
Casted
Date
TestedDay
Max.M
Load
(lb)
Max.
Flex.
Streng
(psi)
of ElasMax.
Def.
x10-2
in
Modulus
ticity
x106psi
2x4x12 B21 5/24/88 10/28/88 ¹57 1985 929 1.801 0.290
822 5/24/88 10/28/88 ¹57 2519 1178 2.113 0.312
B23 5/24/88 10/28/88 ¹57 2220 1039 1.847 0.316
2x5x24 851 5/24/88 10/28/88 ¹57 1276 842 1.077 1.277
852 5/24/88 10/28/88 157 1579 1041 0.930 1.787
4x6x30 B41 5/25/88 10/27/88 ¹55 3323 970 0.928 2.459
B42 5/25/88 10/27/88 ¹55 3310 967 0.784 2.785
B43 5/25/88 10/27/88 155 3431 1002 1.050 2.076
6x6x30 B61 5/25/88 10/26/88 ¹54 4300 836 1.611 1.129
B62 5/25/88 10/26/88 154 4460 867 2.184 0.858
B63 5/25/88 10/26/88 154 4820 937 1.898 1.075

Appendix L 297
FLEXURAL PROPERTIES OF
POLYMER CONCRETE
Size of
Specimen
Speci
men
Date
Casted
Date
TestedDay
Max.
Load
(lb)
Max.
Flex.
Streng
(psi)
Max.
Def.
-2,x10 in
Modulus
of Elas
ticity i
x106 psi
1x2x12 PBS1 7/26/88 8/3/88 8 6¹5 2005 4.148 0.720
PBS2 7/26/88 8/3/88 8 622 2027 4.143 0.775
PBS3 7/26/88 8/3/88 8 610 1989 4.636 0.635
PBS4 7/26/88 8/4/88 9 728 2372 . 4.512 0.781
2x4x12 PBM1 7/26/88 8/4/88 9 5549 2472 7.300 0.207
PBM2 7/26/88 8/4/88 9 5172 2673 7.255 0.195

Appendix L 298
SPLITTING TEST OF
POLYMER CONCRETE
Speci
men
Date
Casted
Date
Tested
Dry
Cured
(day)
Length
(in.)
Force
(kip.)
Tensile
Stress
(psi.)
PS1 7/25/88 8/1/88 7 6.0 16.85 595.95
PS2 7/25/88 8/1/88 7 6.0 17.53 619.99
PS3 7/25/88 8/1/88 7 6.0 16.29 576.14
PS4 7/26/88 8/1/88 6 5.9 22.22 792.48
PS5 7/26/88 8/1/88 6 5.9 21.48 766.08
PS6 7/26/88 8/1/88 6 5.9 23.26 829.57
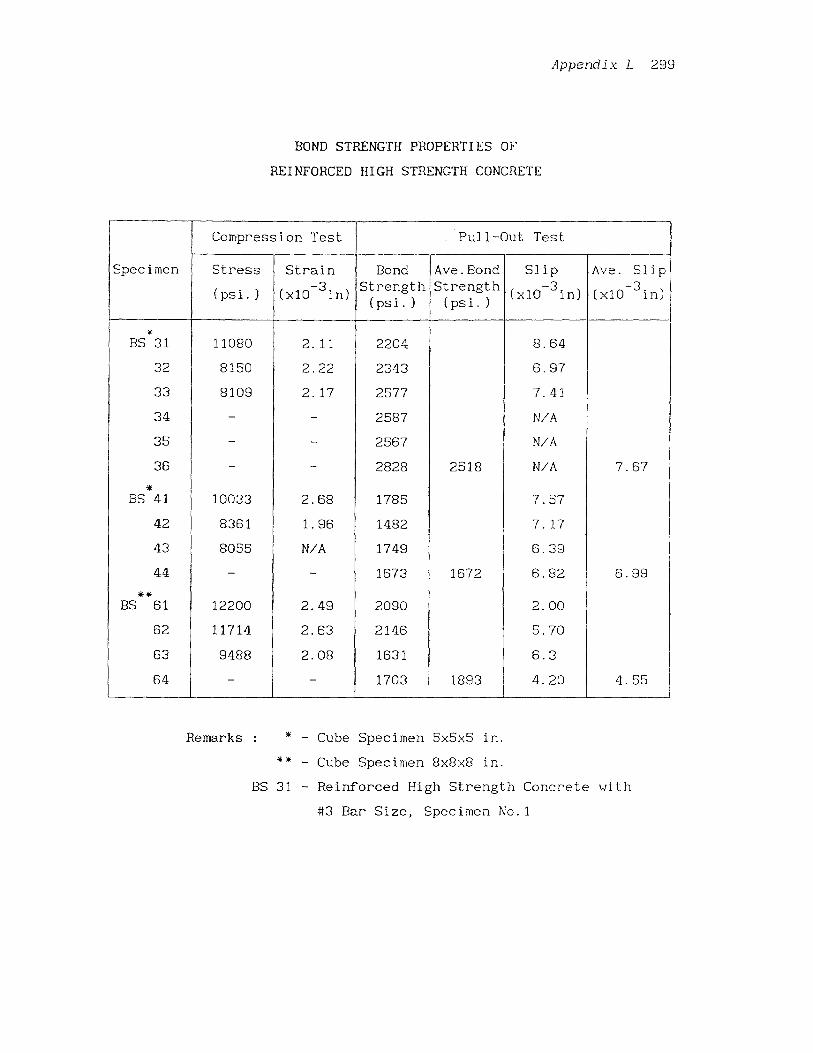
Appendix L 299
BOND STRENGTH PROPERTIES OF
REINFORCED HIGH STRENGTH CONCRETE
Specimen
Compression Test Pull-Out Test
Stress
(psi.)
Strain
-3.(x10 in)
Bond
Strength
(psi.)
Ave.Bond
'Strength
(psi.)
Slip
-3.(x10 in)
Ave. Slip
-3.'(x10 In)
I*
BS 31 11080 2.11 2204 8.64
32 8150 2.22 2343 6.97
33 8109 2.17 2577 7.41
34 - 2587 N/A
35 - 2567 N/A
36 - - 2828 2518 N/A 7.67
*BS 41 10033 2.68 1785 7.57
42 8361 1.96 1482 7.17
43 8055 N/A 1749 6.39
44 - - 1673 1672 6.82 6.99
**BS 61 12200 2.49 2090 2.00
62 11714 2.63 2146 5.70
63 9488 2.08 1631 6.3
64 - - 1703 1893 4.20 4.55
Remarks : * - Cube Specimen 5x5x5 in.
** - Cube Specimen 8x8x8 in.
BS 31 - Reinforced High Strength Concrete with
#3 Bar Size, Specimen No.1

Appendix L 300
DIRECT TENSION TEST OF
CEMENT-BASED COMPOSITES
Type of
Concrete
Specimen WxD
(in.)
Peak
Load
(lb.)
Peak
Stress
(psi.)
Peak
Displ.
-2.x10 in
Brittle
ness
Index
(m)
Normal TC#34 1.1x1.85 502 246.08 0.042 0.2564
Concrte TC#35 1.1x2.00 487 221.36 0.042 0.3079
TC#36 1.1x2.01 579 261.97 0.047 0.2788
HSC MT1 1.1x2.05 609 270.00 0.012 0.2057
(Microsilica) MT2 1.1x2.13 1201 513.00 0.018 0.2255
PD1 1.0x0.67 377 562.84 0.165 0.3472
(Polymer) P02 1.0x0.70 472 674.57 0.132 0.4098
PD3 1.0x0.63 388 615.08 0.125 0.3650
Remarks :
HSC : High Strength Concrete
TC#34 : Normal Concrete, Specimen No.34, reported by
Terasa Cintora [90].
MT : Microsilica Concrete, Tapered Specimen
PD : Polymer Concrete, Dog-bone Specimen

Appendix L 301
PULL-OUT STRESS PROPERTIES OF
HIGH STRENGTH FIBROUS CONCRETE
( MICROSILICA CONCRETE )
Specimen, WxD(in.)
PeakLoad(lb.)
PeakStress(psi.)
PeakDispl.
-2x10 ni
BrittlenessIndex(m)
Remark
MT 001 1.1x2.05 609.00 270.00 0.012 0.206 **
002 1.1x2.13 1201.00 513.00 0.018 0.226 **
BFS 051 1.1x1.80 1112.30 561.76 N/A N/A (Failed)
052 1.1x1.85 1055.50 518.67 N/A 0.260 (Failed)
053 1.1x1.85 N/A N/A N/A N/A (Failed)
054 1.1x1.71 961.80 511.32 0.023 0.246 **
i 055 1.1x1.90 1165.40 557.60 0.033 0.252 **,,
056 1.1x1.80 1043.40 526.97 0.031 0.248 **
BFS 101 1.1x2.05 929.20 412.10 0.012 0.262 **
102 1.1x1.88 705.49 341.10 0.023 0.261 **
103 1.1x2.00 690.00 314.00 0.018 0.263 **
BFS ¹51 . 1.1x2.07 1211.10 531.88 0.032 0.269 **
¹52 1.1x1.75 1004.60 532.87 0.035 0.271 **
¹53 1.1x1.90 1143.00 546.89 0.400 N/A.
¹54 1.1x1.56 651.50 380.00 N/A 0.264
155 1.1x1.91 1186.20 564.50 N/A N/A (Failed)
¹56 1.1x1.80 906.00 458.00 N/A N/A (Failed)
BFS 201 1.1x1.87 1189.90 576.90 N/A N/A **(Failed)
202 1.1x1.91 1358.00 650.10 0.024 0.281 **
203 1.1x1.94 1476.00 692.73 0.407 0.260 **
204 1.1x2.00 1341.00 609.54 N/A N/A **(Failed)
205 1.1x1.78 1254.40 640.65 0.023 0.285 **
206 1.1x1.91 678.70 323.00 0.009 0.273 **
BFH 051 1.1x1.81 808.00 408.00 0.022 0.278 **
Continued

Appendix L 302
BFH 052 1.1x2.05 1172.00 520.00 0.013 0.284 **
053 l. 1x2.00 837.00 380.00 0.030 0.280 **
054 1.1x1.83 1033.00 513.00 0.020 0.282 **
BFH 101 1.1x2.19 1261.00 523.00 N/A N/A **(Failed)
102 1.1x2.07 1195.40 520.00 0.026 0.319 **
103 1.1x2.00 950.00 432.00 N/A N/A **(Failed)
104 1.1x2.13 820.00 350.00 0.023 0.289 **
BFH 151 1.1x1.85 1349.50 660.00 0.022 0.305 **
152 1.1x2.00 1056.00 480.00 0.021 0.306 **
153 1.1x2.18 1600.80 668.00 0.020 0.311 **
BFH 151 1.1x2.00 ¹519.90 690.90 0.170 0.315 **
202 1.1x2.00 1113.40 506.10 0.012 0.306 **
203 1.1x2.05 1485.50 659.00 0.016 0.320 **.
204 1.1x2.00 1419.90 645.40 N/A N/A **(Failed)
Remarks : * - Stroke Control
** - Strain Control
MT - High Strength Concrete
BFS - High Strength Fibrous Concrete (Straight End)
BFH - High Strength Fibrous Concrete (Hooked End)
BFH 051 - Fiber Volume Fraction = 0.05 %, Specimen No.1

Appendix L 303
PERCENTAGE OF THE LINEAR PORTION TO THE PEAK PORTION
OF THE LOAD-DISPLACEMENT CURVE UNDER DIRECT TENSION TEST
Material Specimen m
Model
m
Prop.Eq
Linear
to Peak
Average Remark
Concrete # 34 52.00 **
# 35 55.10
# 36 0.281 0.265 49.57 52.23
High Streng. BT1 46.28
Concrete BT2 0.216 0.200 46.60 46.44
Polymer PDL1 61.26
Concrete PDL2 64.18
PDL3 0.374 0.400 60.83 62.09
High Streng. BFS052 51.17
Fibrous Conc 054 49.50
(Straight) 055 49.85
056 48.12 49.66
BFS101 50.63
102 51.47
103 52.03 51.38
BFS151 52.11
¹52 52.45
¹53 52.73
154 55.41
¹55 43.64 51.27
BFS202 53.08
203 51.42
204 53.28
205 53.91
206 0.264 0.259 59.38 54.21
51.78
Continued

Appendix L 304
1High Streng. BFH051 53.88
Fibrous Cone 052 53.40
(Hooked) 053 53.33
054 54.14 53.69
BFH102 59.05
104 54.24 56.65
BFH151 56.15
152 53.05
¹53 56.06 55.09
BFH2O1 56.07
202 55.88
203 0.301 0.290 56.00 55.98
55.11
Steel Fiber
Rein. Mortar Vf=1.5% 0.263 0.259 48.66 48.66 ***
Remarks :
* Present Study
** Data from T. Cintora [90]
*** Data from V.S. Gopalaratnum and S.P. Shah [18]

Appendix L 305
FATIGUE PROPERTIES DUE TO THE EFFECT OF MAX. STRESS LEVEL OF
SUPERPLASTICIZER CONCRETE
Specimen
fmax
S = S=
fmin
fmin
R =
No. of
Cycle to
Failuremax
'
fc
min '
fc
fmax
S1F109 0.90 0.10 0.111 Failed
S1F209 0.90 0.10 0.111 Failed
S1F309 0.90 0.10 0.111 26
S1F409 0.90 0.10 0.111 300
S1F108 0.80 0.10 0.125 5,875
S1F208 0.80 0.10 0.125 4,096
S1F308 0.80 0.10 0.125 4,566
S1F275 0.75 0.10 0.133 430,510
S1F207 0.73 0.087 8.114 >1,000,000
S1F107 0.70 0.10 0.143 12,299
S1F307 0.70 0.083 0.118 >1,027,230
S1F306 0.63 0.105 0.167 >1,000,000
S1F175 0.57 0.081 0.142 >1,995,263
S1F106 0.53 0.09 0.170 >1,000,000
S1F206 0.BU 0.084 0.168 >1,000,000
Remarks :
* : Rate of Loading = 6.0 Hz (cycle/sec)
S1 : Superplasticizer Concrete, Batch 1
Fl : Fatigue Test, Specimen No.1
09 : Maximum Stress Level, 0.90 f c

Appendix L 306
FATIGUE PROPERTIES DUE TO THE EFFECT OF MAX. STRESS LEVEL OF
MICROSILICA CONCRETE
Specimen
fmax
S =
fmin
S = fmin
R =
1No. of
Cycle to
Failuremax
'
fc
min '
fc
fmax
M1F109 0.90 0.10 0.111 Failed
M1F209 0.90 0.10 0.111 380
M1F309 0.90 0.10 0.111 204
M1F409 0.90 0.10 0.111 608
M2F209 0.90 0.10 0.111 6
M2F108 0.80 0.10 0.125 4,014
M2F208 0.80 0.10 0.125 8,937
M2F2075 0.75 0.10 0.133 102,200
M2F3075 0.75 0.10 0.133 196,540
M2F4075 0.723 0.096 0.133 >1,074,600
M2F1075 0.70 0.092 0.131 >3,200,000
@1F107 0.605 0.086 0.142 >1,000,000
M1F207 0.60 0.085 0.142 >1,000,000
Remarks :
* : Rate of Loading = 6.0 Hz (cycle/sec)
M1 : Microsilica Concrete, Batch 1
Fl : Fatigue Test, Specimen No.1
09 : Maximum Stress Level, 0.90 f_

Appendix L 307
FATIGUE PROPERTIES DUE TO THE EFFECT OF MAX. STRESS LEVEL OF
POLYMER CONCRETE
Specimen
fmax
S =
fmin
S = '
f .min
R =
No. of
Cycle to
Failuremax
'
fc
minfc
fmax
PF108 0.80 0.10 0.125 3,608
PF208 0.80 0.10 0.125 4,476
PF1O7 0.70 0.10 0.143 8,650
PF207 0.70 0.10 0.143 8,052
PF106 0.60 0.10 0.167 24,789
PF206 0.60 0.10 0.167 35,034
PF105 0.50 0.10 0.200 121,431
PF205 0.50 0.10 0.200 127,800
PF305 0.50 0.10 0.200 196,800
PF1045 0.40 0.088 0.220 >1,000,000
PF2045 0.38 0.085 0.224 >1,000,000
PF3045 0.34 0.075 0.221 >1,000,000
PF104 0.33 0.084 0.255 >1,000,000
Remarks :
* : Rate of Loading = 6.0 Hz (cycle/sec)
P : Polymer Concrete
Fl : Fatigue Test, Specimen No.1
08 : Maximum Stress Level, 0.80 f c

Remarks :fmax
fc
fmin
Smax
Smin
fc
min
fmax
R
Appendix L 308
FATIGUE PROPERTIES DUE TO THE EFFECT OF RATE OF LOADING
MICROSILICA CONCRETE
Loading Rate 6 Hz. Loading Rate 12 Hz.
Spec. Smax
smin
R N Spec. Smax
Smin
R N
M1F209 0.90 0.10 0.111 204 M3TF1 0.90 0.10 0.111 204
M1F309 0.90 .0.10 0.111 380 M3TF2 0.90 0.10 0.111 24
M1F409 0.90 0.10 0.111 608 M3TF3 '0.90 0.10 0.111 21
M2F109 0.90 0.10 0.111 6
M2F108 0.80 0.10 0.125 4,014 M3TF4 0.80 0.10 0.125 3,470
M2F208 0.80 0.10 0,125 8,937 M3TF5 0.80 0.10 0.125 1,431
M3TF6 0.80 0.10 0.125 31,683
M3TF7 0.80 0.10 0.125 50,277
M2 F1075 '0.75 0.10 0.133 102,200 M3TF8 0.75 0.10 0.133 161,210
M2F2075 0.75 0.10 0.133 196,540 M3TF9 0.75 0.10 0.133 353,502
M2 F3075 0.723 0.10 0.096 >1,074,600 M3TF10 0.75 0.10 0.133 1,291,367
M2F107 0.70 0.092 0.131 >3,200,000 M3TF11 0.655 0.085 0.130 >1,000,000
M2F207 0.605.0.086 0.142 >1,000,000 M3TF12 0.647 0.084 0.130 >1,000,000
M2F307 0.60 0.085 0.142 >1,000,000
N = Number of cycles to failure

Appendix L 309
1 Brittleness Index I Fiber Type I Cr Fiber
Two-Factor Analysis of Variance

Appendix L 310
Anova table for a 2-factor Analysis of Variance on Y1 : Brittleness Index
Source: di: Sum of Squares: Mean Square: F-test: P value:
Fiber Type (A)
% Fiber (B)
AB
Error
There were no missing cells found.
The AB Incidence table on Y1: Brittleness Index
Two-Factor Analysis of Variance

Appendix L 311
Multiple Regression Y1:Brittleness Index 2 X variables
Analysis of Variance TableSource DF: Sum Squares: Mean Square: F-lest:
REGRESSIONRESiDUAL
TOTAL
No Residual Statistics Computed
Note: 6 cases deleted with missing values.
Multiple Regression Y1:Brittleness Index 2 X variables
BetaCoefficient I Table
Parameter: Value: Ski, Err.: Std. Value: t-Value: Probability:
INTERCEPT
Fiber Type
% Fiber
Multiple Regression Y1:Brittleness Index 2 X variables
Confidence Intervals and Partial F Table
Parameter: 95% Lower: 95% Upper: 90% Lower: 90% Upper: Partial F:
iNTERCEPT
Fiber Type
% Fiber
Two—Factor Analysis of Variance

Appendix L 312
Scattergram for columns: X1 Y 1
Where 1 Represents Straight-End
2 Represents Hooked-End
Scattergram for columns: X2Y 1
Two-Factor Analysis of Variance