Boberg (2005) LVC paper on Canadian Vowel Shift in Montreal
22
The Canadian shift in Montreal Charles Boberg McGill University ABSTRACT Based on an impressionistic study of 16 young Canadians, mostly from Ontario, Clarke, Elms, and Youssef (1995) reported that the short front vowels of Canadian English are involved in a chain shift, the “Canadian Shift,” triggered by the merger of 0Á0 and 0O:0 in low-back position, whereby 0æ0 is retracted to low-central posi- tion, and 0E0 and 0I0 are lowered toward the low-front space vacated by 0æ0. This article extends the study of the Canadian Shift to the English-speaking community of Montreal, Quebec, using acoustic rather than impressionistic analysis and a larger and more diverse sample. The new data motivate a revised view of the Shift, at least as it operates in Montreal, in which the three front vowels are retracted in a set of parallel shifts, rather than rotating in a chain shift. In 1991, Labov demonstrated that the major dialects of North American English could be categorized in three groups, based on two phonological criteria. These involved the organization of the low-front and low-back corners of the vowel space. One criterion was the split of 0æ0 into tense and lax phonemes (tense 0æ:0 in past vs. lax 0æ0 in pat ). The other was the merger of 0Á0 ( cot ) and 0O:0 ( caught ) as a single, low-back phoneme (the “low-back merger”). Labov further showed that these criteria were the structural basis for chain shifts affecting whole sub- systems of vowels in the dialects of two of the groups, giving each a distinctive sound. These chain shifts—the Northern Cities Shift, affecting the Inland North- ern region of the United States, and the Southern Shift, affecting the Southern United States—have been widely reported and discussed since their initial expo- sition in Labov,Yaeger, and Steiner (1972). Labov grouped most of the remaining varieties of North American English—those spoken in New England, Western Pennsylvania, the Western United States, and Canada—into a “Third Dialect.” The basis for this geographically discontinuous group was that all of its members feature single phonemes in both corners of the low vowel space. In the low-front space they have a single 0æ0 phoneme with purely phonetic tensing and raising An earlier version of this paper was presented at NWAVE 32 (University of Pennsylvania, October 10, 2003). Thanks are due to members of the audience at that presentation, as well as to anony- mous reviewers of the present version of the article, for helpful comments. In the preparation of the present version, the author is especially indebted to Anicka Fast and Erika Lawrance for research assistance and to Myrtis Fossey for assistance with statistical analysis. This research received finan- cial support from three sources: the Research Grants Office of McGill University, the Canadian Foundation for Innovation, and the Fonds québécois de la recherche sur la société et la culture (Grant #2003-NC-81927). Language Variation and Change, 17 (2005), 133–154. Printed in the U.S.A. © 2005 Cambridge University Press 0954-3945005 $9.50 DOI: 10.10170S0954394505050064 133
Transcript of Boberg (2005) LVC paper on Canadian Vowel Shift in Montreal
The Canadian shift in Montreal
C h a r l e s B o b e r g
McGill University
A B S T R A C T
Based on an impressionistic study of 16 young Canadians, mostly from Ontario,Clarke, Elms, and Youssef (1995) reported that the short front vowels of CanadianEnglish are involved in a chain shift, the “Canadian Shift,” triggered by the mergerof 0Á0 and0O:0 in low-back position, whereby0æ0 is retracted to low-central posi-tion, and0E0 and0I0 are lowered toward the low-front space vacated by0æ0. Thisarticle extends the study of the Canadian Shift to the English-speaking communityof Montreal, Quebec, using acoustic rather than impressionistic analysis and a largerand more diverse sample. The new data motivate a revised view of the Shift, at leastas it operates in Montreal, in which the three front vowels are retracted in a set ofparallel shifts, rather than rotating in a chain shift.
In 1991, Labov demonstrated that the major dialects of North American Englishcould be categorized in three groups, based on two phonological criteria. Theseinvolved the organization of the low-front and low-back corners of the vowelspace. One criterion was the split of0æ0 into tense and lax phonemes (tense0æ:0in pastvs. lax0æ0 in pat). The other was the merger of0Á0 (cot) and0O:0 (caught)as a single, low-back phoneme (the “low-back merger”). Labov further showedthat these criteria were the structural basis for chain shifts affecting whole sub-systems of vowels in the dialects of two of the groups, giving each a distinctivesound. These chain shifts—the Northern Cities Shift, affecting the Inland North-ern region of the United States, and the Southern Shift, affecting the SouthernUnited States—have been widely reported and discussed since their initial expo-sition in Labov, Yaeger, and Steiner (1972). Labov grouped most of the remainingvarieties of North American English—those spoken in New England, WesternPennsylvania, the Western United States, and Canada—into a “Third Dialect.”The basis for this geographically discontinuous group was that all of its membersfeature single phonemes in both corners of the low vowel space. In the low-frontspace they have a single0æ0 phoneme with purely phonetic tensing and raising
An earlier version of this paper was presented at NWAVE 32 (University of Pennsylvania, October10, 2003). Thanks are due to members of the audience at that presentation, as well as to anony-mous reviewers of the present version of the article, for helpful comments. In the preparation ofthe present version, the author is especially indebted to Anicka Fast and Erika Lawrance for researchassistance and to Myrtis Fossey for assistance with statistical analysis. This research received finan-cial support from three sources: the Research Grants Office of McGill University, the CanadianFoundation for Innovation, and theFonds québécois de la recherche sur la société et la culture(Grant #2003-NC-81927).
Language Variation and Change,17 (2005), 133–154. Printed in the U.S.A.© 2005 Cambridge University Press 0954-3945005 $9.50DOI: 10.10170S0954394505050064
133
only and always before anterior nasal consonants. In the low-back region theyhave a single phoneme created by the merger of pairs of words likecot andcaught, Don anddawn, stockandstalk, andcollar andcaller. The systematiceffect of these structural conditions appeared to be stability. Labov found that thedialects involved were characterized by an absence of the extensive chain shiftsobserved in the Northern and Southern dialects.
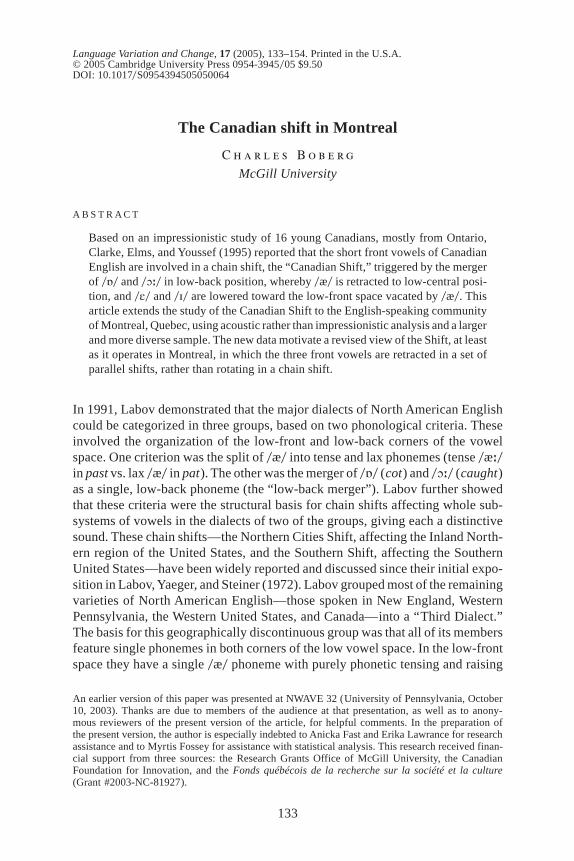
The accuracy of Labov’s characterization of the Third Dialect was challengedin the case of Canadian English by Clarke, Elms, and Youssef (1995), writing afew years later in this journal. They reported that, contrary to Labov’s general-ization, Canadian English exhibits its own set of phonetic shifts. These weresimilar in nature to those Labov had identified in the Northern and Southerndialects and arose from one of Labov’s pivotal conditions—the low-back merger.In a study of 16 young Canadians, Clarke et al. found that0æ0was retracting fromits low-front position into low-central position (a development first observed inVancouver English by Esling & Warkentyne 1993), that0E0 was descending tofill the low-front space vacated by0æ0, and that0I0 was in turn descending to fillthe space vacated by0E0. They labeled this coordinated set of developments theCanadian Shift (Figure 1) and suggested that it was triggered by the large emptyspace made available in the low-central region by the low-back merger (Clarkeet al., 1995:212). An associated development, the centralization or lowering of0ö0, could not be causally linked to the low-back merger in the same way, so thatits status as part of the Canadian Shift was not clear.
Clarke et al.’s article represented an important advance in the study of Cana-dian English, being the first general study of the Canadian vowel system since thewell-known analyses of Canadian Raising (Chambers, 1973; Joos, 1942).1 Labov
figure 1. The Canadian Shift, as reported by Clarke et al. (1995:212)..
134 C H A R L E S B O B E R G
was quick to adopt the Canadian Shift as part of his own view of CanadianEnglish, and it figures prominently in the analysis of Canadian English devel-oped in theAtlas of North American English(Labov, Ash, & Boberg, forth-coming). Its operation in Ontario English has been confirmed by severalsubsequent studies (De Decker, 2001; De Decker & Mackenzie, 1999; Hoff-man, 1998, 1999), while D’Arcy (2002) has examined its adoption by youngwomen in St. John’s, Newfoundland. Its most remarkable aspect is the retrac-tion of 0æ0. In Southern Ontario, home to the largest concentration of speakersof Canadian English, this development of0æ0 contrasts sharply with the tens-ing and raising of0æ0 directly across the border in American cities like Buffaloand Detroit, where the Northern Cities Shift holds sway. As a result of theseopposing shifts, the pronunciation [hat] corresponds to different words on eitherside of the border. In Ontario, it is an item of headwear,0hæt0, whereas inWestern New York State and Southeastern Michigan, it is the opposite ofcold,0hÁt0.2 The operation of the Canadian Shift reinforces not only Canada’s uniquelinguistic identity, but more generally the enduring strength of regional dialectdifferences in North America.
The value of Clarke et al.’s contribution in providing the first description andanalysis of the Canadian Shift cannot be doubted. Like most initial studies, how-ever, theirs gives rise to several questions for further research. The first arisesfrom the fact that all of the participants in their main sample of 16 people were intheir 20s, except one, aged 33. This narrow range of ages prevented the authorsfrom carrying out an apparent-time analysis that might have revealed whether ashift was in fact in progress, and in what direction it was moving. A secondarysample of six older subjects (in their 50s and 60s) was studied in an attempt toaddress this question, but the comparison of the two age groups proved incon-clusive; the authors found the older group was “clearly too small to permit muchin the way of generalization” about the effect of age (Clarke et al., 1995:217). Ananalysis of acoustic data from older and younger speakers involved only twospeakers in each group, one female and one male (1995:218–219). The operationof the Canadian Shift was therefore largely inferred from a comparison withnon-Canadian speech, or from untested assumptions about the original positionof the short front vowels in Canadian speech, rather than directly demonstratedby means of statistically valid generational differences.
A second question arising from Clarke et al.’s study is the application of theirfindings to other regions of Canada, given that all of their participants came fromOntario, except for one from each of Alberta and British Columbia. Apart fromthe question of whether the 14 young Ontarians they studied are in fact represen-tative of Ontario speech as a whole, the limited geographic range of their samplecalls into question whether the Canadian Shift is really just an Ontario Shift, or adevelopment that characterizes Canadian English in general, from British Colum-bia to Newfoundland.Although Ontario is the most populous province in Canada,its 8 million native speakers of English in fact represent less than half of theCanadian total of over 17 million.3 Looking for evidence of the Shift outsideOntario is therefore an important extension of Clarke et al.’s research.
T H E C A N A D I A N S H I F T I N M O N T R E A L 135
A third question concerns Clarke et al.’s method of data collection. They mea-sured a total of 1,900 tokens of0I, E, æ,Á, ö0, approximately 24 tokens per vowelper participant, certainly an adequate number. However, their main analysis wasbased on impressionistic transcription of these tokens rather than on acousticanalysis, which served only to supplement the auditory analysis in a few cases(1995:212). A reliance on impressionistic transcription can sometimes introducevarious sources of error, ranging from the imprecision of the analytical categoriesused in impressionistic transcription to problems of intertoken and intercoderreliability and objectivity. The level of accuracy and reliability attained by Clarkeet al. was no doubt very high. Nevertheless, the inherent limitations of auditory-impressionistic analysis suggest that our knowledge of the nature and progress ofthe Canadian Shift could be advanced by further study using large-scale acousticanalysis.
There are, in fact, independent reasons to reexamine the nature of the Cana-dian Shift. In particular, two subsequent, small-scale, acoustic studies of the Shiftin Ontario have failed to find clear evidence for the lowering of0E0, the centralcomponent that ties the Shift together, linking the retraction of0æ0 with the low-ering of0I0. Data from these studies suggest that the major development of0E0 iscentralization rather than lowering. If this finding were substantiated by a largerstudy, it would indicate that the nature of the Canadian Shift is not so much arotation of the short vowels down and around the front periphery of the vowelspace, as a set of parallel retractions. The mental process underlying this devel-opment would not then be the maintenance of adequate margins of security betweenneighboring phonemes, which is thought to be the basis for chain shifts, but rathera kind of analogy that produces identical alterations in the production of phono-logically similar vowels.
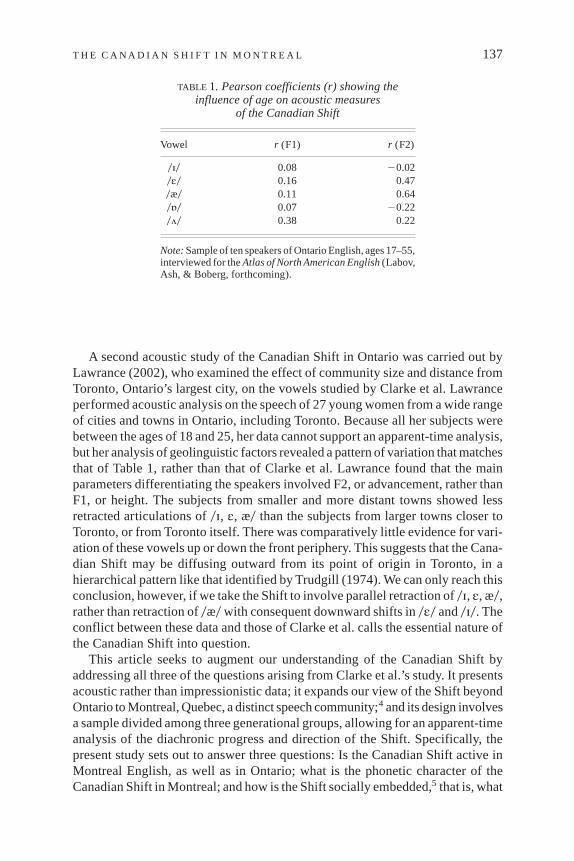
The first indication that0E0 was not following the development reported byClarke et al. came from preliminary analyses of the data collected for theAtlas ofNorth American English(Labov et al., forthcoming). This project interviewedten speakers of Ontario English during the 1990s. The sample included four menand six women, aged 17 to 55, from cities and towns across the province. Acous-tic analysis was performed on tokens of both spontaneous and formally elicitedspeech. Pearson coefficients showing correlations between age and the first andsecond formants of the five vowels studied by Clarke et al. are given in Table 1.Only two of the acoustic measures show a noteworthy correlation with age. Thestrongest of these is the F2 of0æ0, for whichr 5 0.64, a positive correlation: theyounger the speaker (i.e., the lower the age), the lower the F2 of0æ0. Because F2is directly correlated with the advancement of a vowel, this means that youngerspeakers have a more retracted pronunciation of0æ0, a direct confirmation ofwhat was reported by Clarke et al. However, a similar correlation, slightly weakerat r 5 0.47, was found for the F2 of0E0, indicating that0E0 is also more retractedamong younger speakers. By contrast, no correlation was found with the F1 of0E0 (r 50.16), which directly contradicts Clarke et al.’s report that0E0 is descend-ing into the low-front space vacated by0æ0. In short, this small sample of Ontariospeakers suggests that0E0 is retracting rather than descending.
136 C H A R L E S B O B E R G
A second acoustic study of the Canadian Shift in Ontario was carried out byLawrance (2002), who examined the effect of community size and distance fromToronto, Ontario’s largest city, on the vowels studied by Clarke et al. Lawranceperformed acoustic analysis on the speech of 27 young women from a wide rangeof cities and towns in Ontario, including Toronto. Because all her subjects werebetween the ages of 18 and 25, her data cannot support an apparent-time analysis,but her analysis of geolinguistic factors revealed a pattern of variation that matchesthat of Table 1, rather than that of Clarke et al. Lawrance found that the mainparameters differentiating the speakers involved F2, or advancement, rather thanF1, or height. The subjects from smaller and more distant towns showed lessretracted articulations of0I, E, æ0 than the subjects from larger towns closer toToronto, or from Toronto itself. There was comparatively little evidence for vari-ation of these vowels up or down the front periphery. This suggests that the Cana-dian Shift may be diffusing outward from its point of origin in Toronto, in ahierarchical pattern like that identified by Trudgill (1974). We can only reach thisconclusion, however, if we take the Shift to involve parallel retraction of0I, E, æ0,rather than retraction of0æ0with consequent downward shifts in0E0 and0I0. Theconflict between these data and those of Clarke et al. calls the essential nature ofthe Canadian Shift into question.
This article seeks to augment our understanding of the Canadian Shift byaddressing all three of the questions arising from Clarke et al.’s study. It presentsacoustic rather than impressionistic data; it expands our view of the Shift beyondOntario to Montreal, Quebec, a distinct speech community;4 and its design involvesa sample divided among three generational groups, allowing for an apparent-timeanalysis of the diachronic progress and direction of the Shift. Specifically, thepresent study sets out to answer three questions: Is the Canadian Shift active inMontreal English, as well as in Ontario; what is the phonetic character of theCanadian Shift in Montreal; and how is the Shift socially embedded,5 that is, what
TABLE 1. Pearson coefficients (r) showing theinfluence of age on acoustic measures
of the Canadian Shift
Vowel r (F1) r (F2)
0I0 0.08 20.020E0 0.16 0.470æ0 0.11 0.640Á0 0.07 20.220ö0 0.38 0.22
Note:Sample of ten speakers of Ontario English, ages 17–55,interviewed for theAtlas of North American English(Labov,Ash, & Boberg, forthcoming).
T H E C A N A D I A N S H I F T I N M O N T R E A L 137
are the social characteristics of speakers who show relatively more or less advancedforms of the Shift? The next section provides an introduction to this study.
M E T H O D
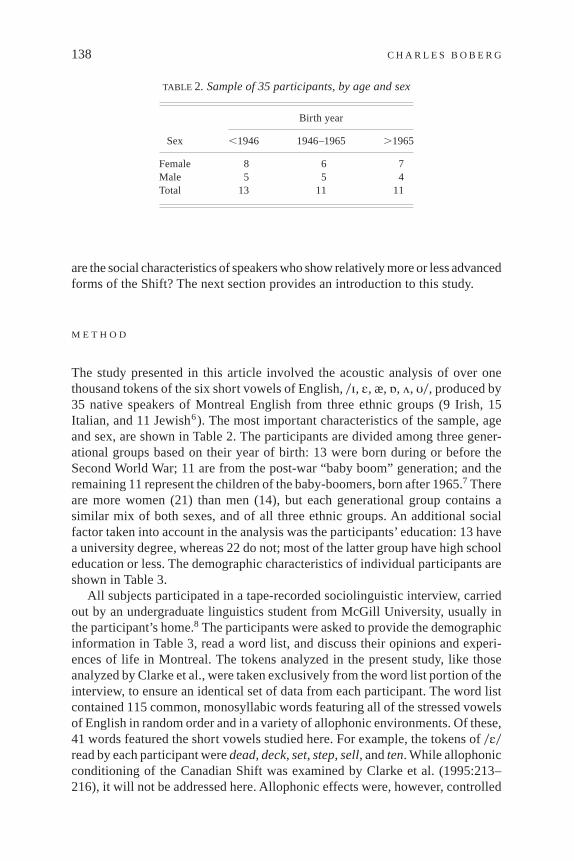
The study presented in this article involved the acoustic analysis of over onethousand tokens of the six short vowels of English,0I, E, æ,Á, ö, U0, produced by35 native speakers of Montreal English from three ethnic groups (9 Irish, 15Italian, and 11 Jewish6). The most important characteristics of the sample, ageand sex, are shown in Table 2. The participants are divided among three gener-ational groups based on their year of birth: 13 were born during or before theSecond World War; 11 are from the post-war “baby boom” generation; and theremaining 11 represent the children of the baby-boomers, born after 1965.7 Thereare more women (21) than men (14), but each generational group contains asimilar mix of both sexes, and of all three ethnic groups. An additional socialfactor taken into account in the analysis was the participants’ education: 13 havea university degree, whereas 22 do not; most of the latter group have high schooleducation or less. The demographic characteristics of individual participants areshown in Table 3.
All subjects participated in a tape-recorded sociolinguistic interview, carriedout by an undergraduate linguistics student from McGill University, usually inthe participant’s home.8 The participants were asked to provide the demographicinformation in Table 3, read a word list, and discuss their opinions and experi-ences of life in Montreal. The tokens analyzed in the present study, like thoseanalyzed by Clarke et al., were taken exclusively from the word list portion of theinterview, to ensure an identical set of data from each participant. The word listcontained 115 common, monosyllabic words featuring all of the stressed vowelsof English in random order and in a variety of allophonic environments. Of these,41 words featured the short vowels studied here. For example, the tokens of0E0read by each participant weredead, deck, set, step, sell, andten. While allophonicconditioning of the Canadian Shift was examined by Clarke et al. (1995:213–216), it will not be addressed here. Allophonic effects were, however, controlled
TABLE 2. Sample of 35 participants, by age and sex
Birth year
Sex ,1946 1946–1965 .1965
Female 8 6 7Male 5 5 4Total 13 11 11
138 C H A R L E S B O B E R G
for by having each participant read the same words, and by ensuring that eachvowel was represented by a comparable set of allophonic environments.9
Acoustic analysis of the word list tokens was performed with the Computer-ized Speech Lab system developed by Kay Elemetrics (Model 4400). Wave-form, spectrogram, and linear predictive coding (LPC) analyses were carried outon each token. The frequency of the first and second formants was measuredusing the LPC analysis. The measurement was made at the point that best repre-sented the central tendency of the vowel. This was usually the maximum value ofF1, or the middle of a steady state in F1. In a few cases, the trajectory of F2 was
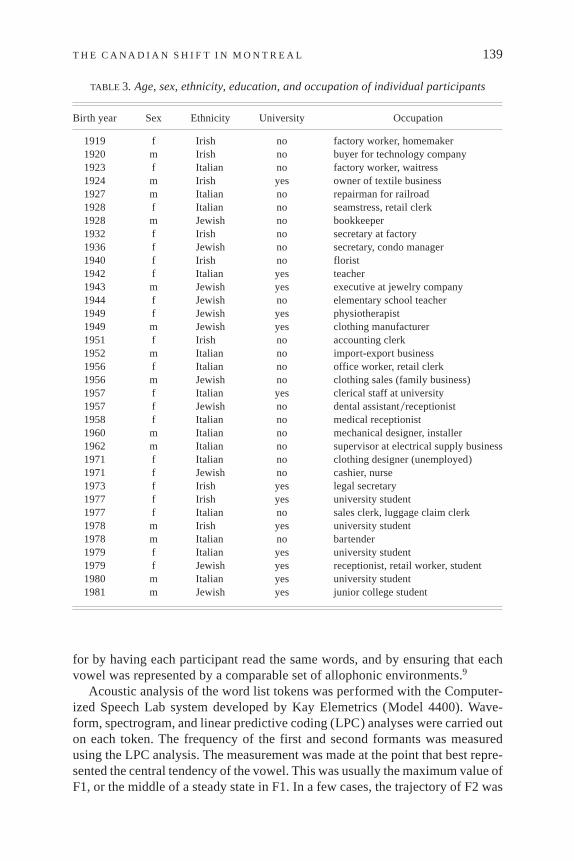
TABLE 3. Age, sex, ethnicity, education, and occupation of individual participants
Birth year Sex Ethnicity University Occupation
1919 f Irish no factory worker, homemaker1920 m Irish no buyer for technology company1923 f Italian no factory worker, waitress1924 m Irish yes owner of textile business1927 m Italian no repairman for railroad1928 f Italian no seamstress, retail clerk1928 m Jewish no bookkeeper1932 f Irish no secretary at factory1936 f Jewish no secretary, condo manager1940 f Irish no florist1942 f Italian yes teacher1943 m Jewish yes executive at jewelry company1944 f Jewish no elementary school teacher1949 f Jewish yes physiotherapist1949 m Jewish yes clothing manufacturer1951 f Irish no accounting clerk1952 m Italian no import-export business1956 f Italian no office worker, retail clerk1956 m Jewish no clothing sales (family business)1957 f Italian yes clerical staff at university1957 f Jewish no dental assistant0receptionist1958 f Italian no medical receptionist1960 m Italian no mechanical designer, installer1962 m Italian no supervisor at electrical supply business1971 f Italian no clothing designer (unemployed)1971 f Jewish no cashier, nurse1973 f Irish yes legal secretary1977 f Irish yes university student1977 f Italian no sales clerk, luggage claim clerk1978 m Irish yes university student1978 m Italian no bartender1979 f Italian yes university student1979 f Jewish yes receptionist, retail worker, student1980 m Italian yes university student1981 m Jewish yes junior college student
T H E C A N A D I A N S H I F T I N M O N T R E A L 139
used as a guide to establishing a more precise point of measurement within an F1steady state. All of the measurements thus obtained were normalized to eliminateinterspeaker differences related to the size or shape of the vocal tract, using theConstant Log Interval procedure of Nearey (1977).10
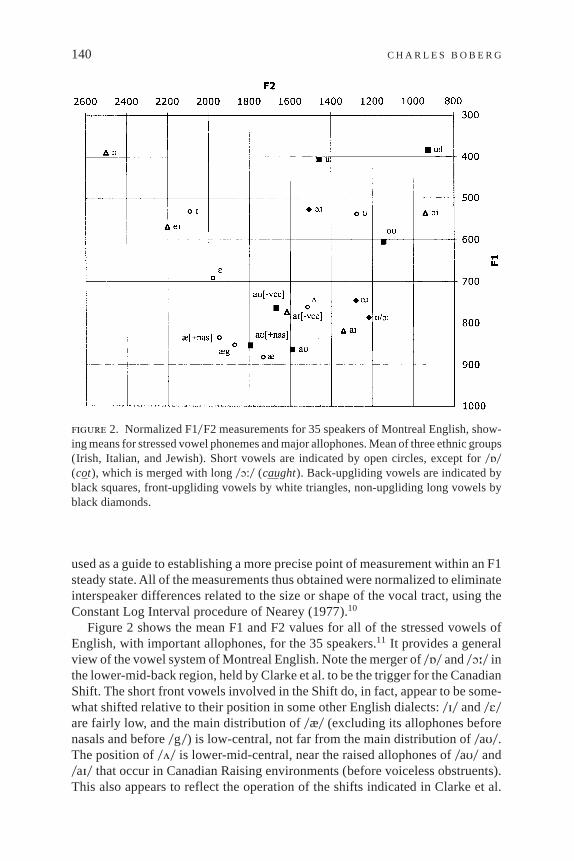
Figure 2 shows the mean F1 and F2 values for all of the stressed vowels ofEnglish, with important allophones, for the 35 speakers.11 It provides a generalview of the vowel system of Montreal English. Note the merger of0Á0 and0O:0 inthe lower-mid-back region, held by Clarke et al. to be the trigger for the CanadianShift. The short front vowels involved in the Shift do, in fact, appear to be some-what shifted relative to their position in some other English dialects:0I0 and0E0are fairly low, and the main distribution of0æ0 (excluding its allophones beforenasals and before0g0) is low-central, not far from the main distribution of0aU0.The position of0ö0 is lower-mid-central, near the raised allophones of0aU0 and0aI0 that occur in Canadian Raising environments (before voiceless obstruents).This also appears to reflect the operation of the shifts indicated in Clarke et al.
figure 2. Normalized F10F2 measurements for 35 speakers of Montreal English, show-ing means for stressed vowel phonemes and major allophones. Mean of three ethnic groups(Irish, Italian, and Jewish). Short vowels are indicated by open circles, except for0Á0(cot), which is merged with long0O:0 (caught). Back-upgliding vowels are indicated byblack squares, front-upgliding vowels by white triangles, non-upgliding long vowels byblack diamonds.
140 C H A R L E S B O B E R G
Other features characteristic of Montreal English are the relatively retracted andraised positions of0aI0 and 0Aò0, and the moderate centralization of the maindistribution of0u:0 relative to its allophone before0 l 0, which remains in backposition. The latter development, without a parallel centralization of0oU0, istypical of Canadian English as a whole.
The mean F1 and F2 values for each vowel for each participant, together witheach participant’s demographic data, were analyzed statistically with the GeneralLinear Model of SPSS (Statistical Package for the Social Sciences, Version 10 forthe Macintosh). The dependent variables were the F1 and F2 of the six shortvowels,0I, E, æ,Á, ö, U0, indicating their height and advancement, respectively.The last of these vowels,0U0, was not included in Clarke et al.’s analysis but wasincluded here so that the behavior of the entire subsystem of short vowels mightbe studied. The independent variables were the generational group, sex, ethnicity,and education of the participants. Table 4 gives descriptive statistics (mean andstandard deviation) for each of the dependent measures according to generationalgroup.
R E S U L T S A N D A N A L Y S I S
The first step in the statistical analysis of the acoustic data was to see whetherthey showed, as a set, a correlation with generational group that might indicate achange in progress of the sort proposed by Clarke et al. A multivariate analysis ofcovariance (MANCOVA) was therefore carried out, with generational group asthe fixed factor; sex, ethnicity, and education as covariates; and the F1 and F2 ofthe six short vowels as dependent variables. The result of this analysis wasF(2,36)52.961;p, .005. From this we can conclude that age does have a significanteffect on the articulation of the short vowels of Montreal English, and that thiseffect is independent of any effect of sex, ethnicity, or education.
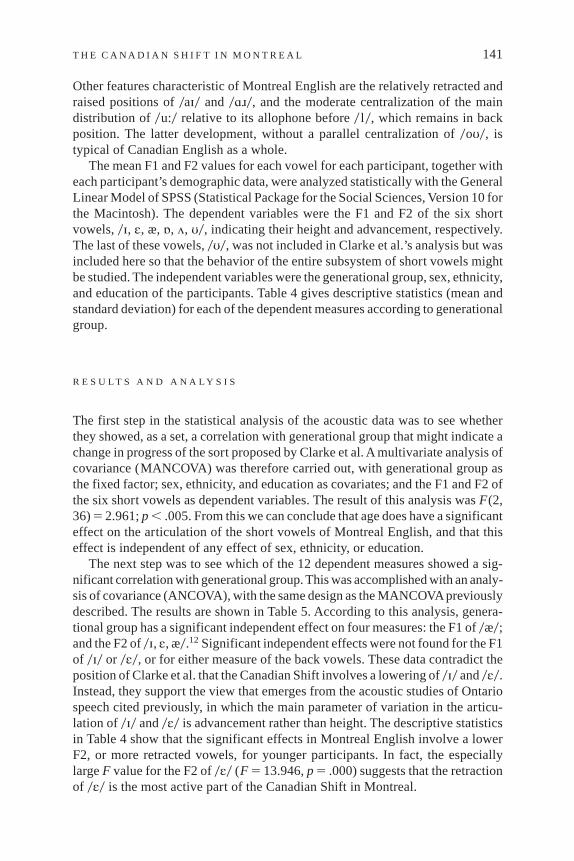
The next step was to see which of the 12 dependent measures showed a sig-nificant correlation with generational group. This was accomplished with an analy-sis of covariance (ANCOVA), with the same design as the MANCOVApreviouslydescribed. The results are shown in Table 5. According to this analysis, genera-tional group has a significant independent effect on four measures: the F1 of0æ0;and the F2 of0I, E, æ0.12 Significant independent effects were not found for the F1of 0I0 or 0E0, or for either measure of the back vowels. These data contradict theposition of Clarke et al. that the Canadian Shift involves a lowering of0I0 and0E0.Instead, they support the view that emerges from the acoustic studies of Ontariospeech cited previously, in which the main parameter of variation in the articu-lation of0I0 and0E0 is advancement rather than height. The descriptive statisticsin Table 4 show that the significant effects in Montreal English involve a lowerF2, or more retracted vowels, for younger participants. In fact, the especiallylargeF value for the F2 of0E0 (F 5 13.946,p5 .000) suggests that the retractionof 0E0 is the most active part of the Canadian Shift in Montreal.
T H E C A N A D I A N S H I F T I N M O N T R E A L 141

TABLE 4. Descriptive statistics (mean and standard deviation) foranalysis of F1 and F2 of short vowels by generational group
Measure Generational Group Mean Standard Deviation
F1 (I) 1 524 532 532 323 537 30
Total 531 40
F2 (I) 1 2133 1152 2097 773 2027 76
Total 2089 100
F1 (E) 1 671 522 690 373 719 66
Total 692 55
F2 (E) 1 2047 712 2009 733 1855 102
Total 1975 116
F1 (æ) 1 851 432 929 423 887 70
Total 887 61
F2 (æ) 1 1776 482 1764 1183 1663 107
Total 1737 104
F1 (Á) 1 786 622 807 763 779 37
Total 790 60
F2 (Á) 1 1220 752 1217 613 1224 64
Total 1220 65
F1 (ö) 1 772 492 773 553 740 61
Total 762 56
F2 (ö) 1 1543 942 1473 693 1524 82
Total 1515 86
F1 (U) 1 537 362 529 333 547 40
Total 537 36
F2 (U) 1 1270 1122 1213 1053 1342 90
Total 1275 113
Note: From oldest to youngest, the groups are: (1) born before 1946, (2) born1946–1965, and (3) born after 1965.
142 C H A R L E S B O B E R G

It must be admitted that the effect of generational group on the F1 or height of0E0was fairly close to being significant, atp5 .126, and that Table 4 shows whatappears to be a steady if moderate increase in the F1 of0E0 with each generation.This suggests that the development of0E0 in Montreal may involve some degreeof lowering as well as retraction, which might attain statistical significance in alarger sample. However, where Clarke et al.’s diagram of the Canadian Shift(Fig. 1) shows lowering to be the primary direction of change in the articulationof 0E0, with the limited degree of associated retraction no more than what mightbe imposed by the shape of the vowel space, in Montreal the trajectory of0E0involves a much greater degree of retraction than of lowering. Both reports iden-tify a diagonal trajectory, but they can be clearly distinguished by the main direc-tion of the diagonal. Moreover, they differ very clearly on the development of0I0.Whereas Clarke et al. reported a lowering of0I0 with virtually no retraction, theMontreal data show a retraction of0I0 with no evidence of lowering.
To develop a more detailed view of generational differences in the articulationof the short vowels, a multivariate analysis of variance (MANOVA) was nextperformed, as a preliminary step in carrying out Tukey HSD post-hoc tests ofthe differences between individual generational groups for each measure. TheMANOVAtested the effect of generational group on the F1 and F2 of the six shortvowels, without the other demographic factors as covariates. Like the MAN-COVA, this test found a significant main effect of generational group:F(2, 42)53.386;p , .001. An analysis of variance (ANOVA) was also performed, forwhich the results are given in Table 6. In general, these data confirm the results ofthe ANCOVA shown in Table 5, with the difference that other demographic fac-
TABLE 5. Analysis of covariance (ANCOVA) ofgenerational group with F1 and F2 of short vowels,
with sex, ethnicity, and education held constant
Measure FSignificance
( p value)
F1 (I) 0.267 (.767)F2 (I) 3.130 .059F1 (E) 2.229 (.126)F2 (E) 13.946 .000F1 (æ) 6.709 .004F2 (æ) 3.722 .036F1 (Á) 0.556 (.580)F2 (Á) 0.184 (.833)F1 (ö) 0.939 (.403)F2 (ö) 2.002 (.153)F1 (U) 0.477 (.626)F2 (U) 2.511 (.099)
Note: Nonsignificant effects (p . .05) are shown inparentheses.
T H E C A N A D I A N S H I F T I N M O N T R E A L 143
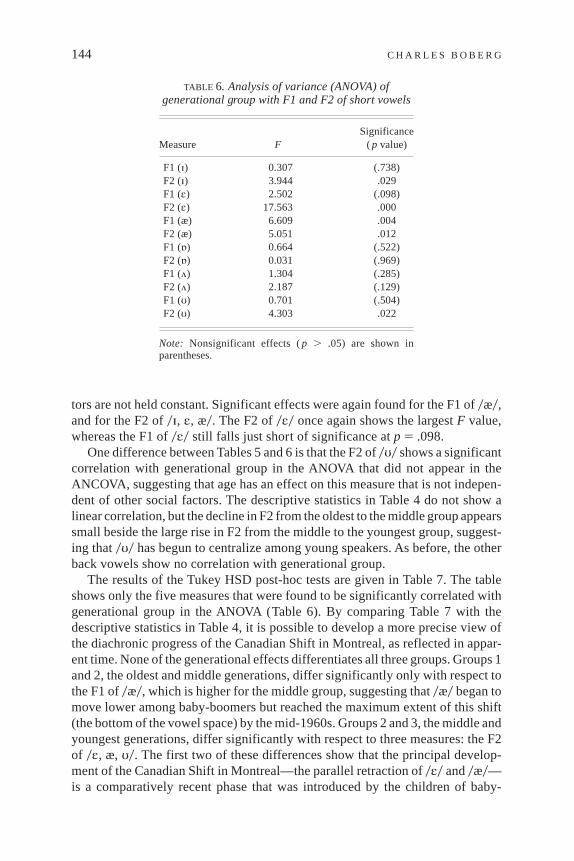
tors are not held constant. Significant effects were again found for the F1 of0æ0,and for the F2 of0I, E, æ0. The F2 of0E0 once again shows the largestF value,whereas the F1 of0E0 still falls just short of significance atp 5 .098.
One difference between Tables 5 and 6 is that the F2 of0U0 shows a significantcorrelation with generational group in the ANOVA that did not appear in theANCOVA, suggesting that age has an effect on this measure that is not indepen-dent of other social factors. The descriptive statistics in Table 4 do not show alinear correlation, but the decline in F2 from the oldest to the middle group appearssmall beside the large rise in F2 from the middle to the youngest group, suggest-ing that0U0 has begun to centralize among young speakers. As before, the otherback vowels show no correlation with generational group.
The results of the Tukey HSD post-hoc tests are given in Table 7. The tableshows only the five measures that were found to be significantly correlated withgenerational group in the ANOVA (Table 6). By comparing Table 7 with thedescriptive statistics in Table 4, it is possible to develop a more precise view ofthe diachronic progress of the Canadian Shift in Montreal, as reflected in appar-ent time. None of the generational effects differentiates all three groups. Groups 1and 2, the oldest and middle generations, differ significantly only with respect tothe F1 of0æ0, which is higher for the middle group, suggesting that0æ0 began tomove lower among baby-boomers but reached the maximum extent of this shift(the bottom of the vowel space) by the mid-1960s. Groups 2 and 3, the middle andyoungest generations, differ significantly with respect to three measures: the F2of 0E, æ,U0. The first two of these differences show that the principal develop-ment of the Canadian Shift in Montreal—the parallel retraction of0E0 and0æ0—is a comparatively recent phase that was introduced by the children of baby-
TABLE 6. Analysis of variance (ANOVA) ofgenerational group with F1 and F2 of short vowels
Measure FSignificance
( p value)
F1 (I) 0.307 (.738)F2 (I) 3.944 .029F1 (E) 2.502 (.098)F2 (E) 17.563 .000F1 (æ) 6.609 .004F2 (æ) 5.051 .012F1 (Á) 0.664 (.522)F2 (Á) 0.031 (.969)F1 (ö) 1.304 (.285)F2 (ö) 2.187 (.129)F1 (U) 0.701 (.504)F2 (U) 4.303 .022
Note: Nonsignificant effects (p . .05) are shown inparentheses.
144 C H A R L E S B O B E R G
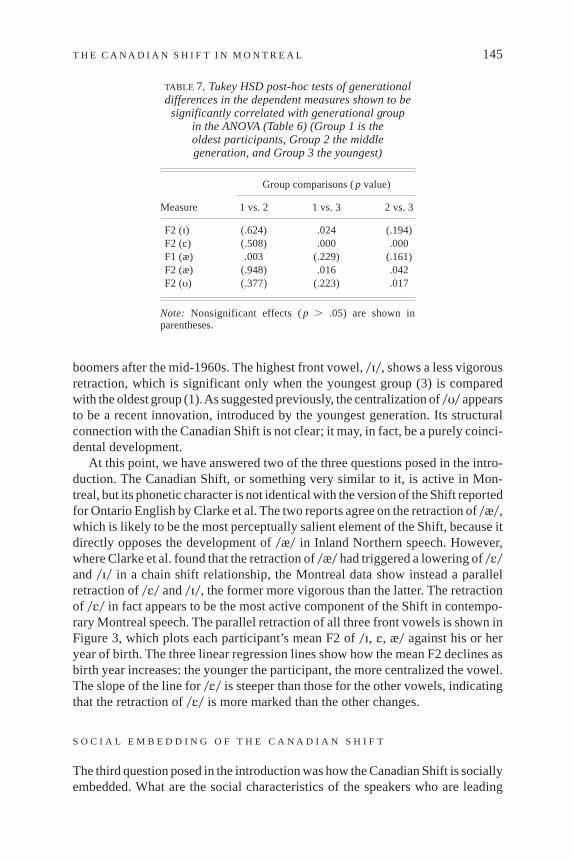
boomers after the mid-1960s. The highest front vowel,0I0, shows a less vigorousretraction, which is significant only when the youngest group (3) is comparedwith the oldest group (1).As suggested previously, the centralization of0U0appearsto be a recent innovation, introduced by the youngest generation. Its structuralconnection with the Canadian Shift is not clear; it may, in fact, be a purely coinci-dental development.
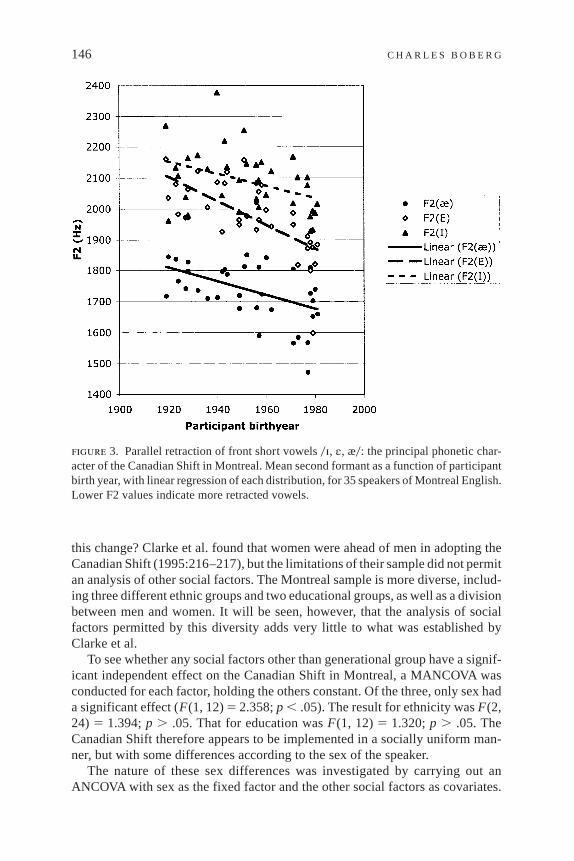
At this point, we have answered two of the three questions posed in the intro-duction. The Canadian Shift, or something very similar to it, is active in Mon-treal, but its phonetic character is not identical with the version of the Shift reportedfor Ontario English by Clarke et al. The two reports agree on the retraction of0æ0,which is likely to be the most perceptually salient element of the Shift, because itdirectly opposes the development of0æ0 in Inland Northern speech. However,where Clarke et al. found that the retraction of0æ0 had triggered a lowering of0E0and0I0 in a chain shift relationship, the Montreal data show instead a parallelretraction of0E0 and0I0, the former more vigorous than the latter. The retractionof 0E0 in fact appears to be the most active component of the Shift in contempo-rary Montreal speech. The parallel retraction of all three front vowels is shown inFigure 3, which plots each participant’s mean F2 of0I, E, æ0 against his or heryear of birth. The three linear regression lines show how the mean F2 declines asbirth year increases: the younger the participant, the more centralized the vowel.The slope of the line for0E0 is steeper than those for the other vowels, indicatingthat the retraction of0E0 is more marked than the other changes.
S O C I A L E M B E D D I N G O F T H E C A N A D I A N S H I F T
The third question posed in the introduction was how the Canadian Shift is sociallyembedded. What are the social characteristics of the speakers who are leading
TABLE 7. Tukey HSD post-hoc tests of generationaldifferences in the dependent measures shown to besignificantly correlated with generational group
in the ANOVA (Table 6) (Group 1 is theoldest participants, Group 2 the middlegeneration, and Group 3 the youngest)
Group comparisons (p value)
Measure 1 vs. 2 1 vs. 3 2 vs. 3
F2 (I) (.624) .024 (.194)F2 (E) (.508) .000 .000F1 (æ) .003 (.229) (.161)F2 (æ) (.948) .016 .042F2 (U) (.377) (.223) .017
Note: Nonsignificant effects (p . .05) are shown inparentheses.
T H E C A N A D I A N S H I F T I N M O N T R E A L 145
this change? Clarke et al. found that women were ahead of men in adopting theCanadian Shift (1995:216–217), but the limitations of their sample did not permitan analysis of other social factors. The Montreal sample is more diverse, includ-ing three different ethnic groups and two educational groups, as well as a divisionbetween men and women. It will be seen, however, that the analysis of socialfactors permitted by this diversity adds very little to what was established byClarke et al.
To see whether any social factors other than generational group have a signif-icant independent effect on the Canadian Shift in Montreal, a MANCOVA wasconducted for each factor, holding the others constant. Of the three, only sex hada significant effect (F(1, 12)5 2.358;p , .05). The result for ethnicity wasF(2,24) 5 1.394;p . .05. That for education wasF(1, 12)5 1.320;p . .05. TheCanadian Shift therefore appears to be implemented in a socially uniform man-ner, but with some differences according to the sex of the speaker.
The nature of these sex differences was investigated by carrying out anANCOVA with sex as the fixed factor and the other social factors as covariates.
figure 3. Parallel retraction of front short vowels0I, E, æ0: the principal phonetic char-acter of the Canadian Shift in Montreal. Mean second formant as a function of participantbirth year, with linear regression of each distribution, for 35 speakers of Montreal English.Lower F2 values indicate more retracted vowels.
146 C H A R L E S B O B E R G
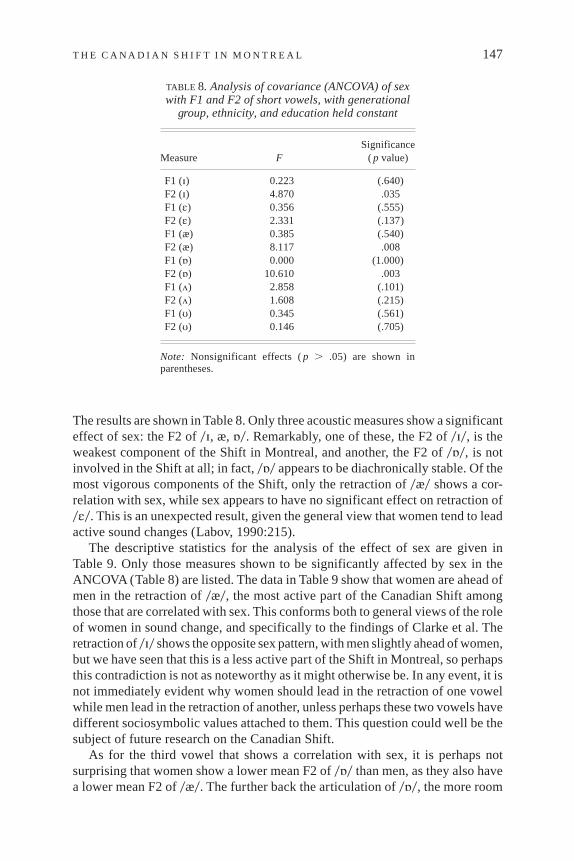
The results are shown in Table 8. Only three acoustic measures show a significanteffect of sex: the F2 of0I, æ,Á0. Remarkably, one of these, the F2 of0I0, is theweakest component of the Shift in Montreal, and another, the F2 of0Á0, is notinvolved in the Shift at all; in fact,0Á0 appears to be diachronically stable. Of themost vigorous components of the Shift, only the retraction of0æ0 shows a cor-relation with sex, while sex appears to have no significant effect on retraction of0E0. This is an unexpected result, given the general view that women tend to leadactive sound changes (Labov, 1990:215).
The descriptive statistics for the analysis of the effect of sex are given inTable 9. Only those measures shown to be significantly affected by sex in theANCOVA (Table 8) are listed. The data in Table 9 show that women are ahead ofmen in the retraction of0æ0, the most active part of the Canadian Shift amongthose that are correlated with sex. This conforms both to general views of the roleof women in sound change, and specifically to the findings of Clarke et al. Theretraction of0I0 shows the opposite sex pattern, with men slightly ahead of women,but we have seen that this is a less active part of the Shift in Montreal, so perhapsthis contradiction is not as noteworthy as it might otherwise be. In any event, it isnot immediately evident why women should lead in the retraction of one vowelwhile men lead in the retraction of another, unless perhaps these two vowels havedifferent sociosymbolic values attached to them. This question could well be thesubject of future research on the Canadian Shift.
As for the third vowel that shows a correlation with sex, it is perhaps notsurprising that women show a lower mean F2 of0Á0 than men, as they also havea lower mean F2 of0æ0. The further back the articulation of0Á0, the more room
TABLE 8. Analysis of covariance (ANCOVA) of sexwith F1 and F2 of short vowels, with generational
group, ethnicity, and education held constant
Measure FSignificance
( p value)
F1 (I) 0.223 (.640)F2 (I) 4.870 .035F1 (E) 0.356 (.555)F2 (E) 2.331 (.137)F1 (æ) 0.385 (.540)F2 (æ) 8.117 .008F1 (Á) 0.000 (1.000)F2 (Á) 10.610 .003F1 (ö) 2.858 (.101)F2 (ö) 1.608 (.215)F1 (U) 0.345 (.561)F2 (U) 0.146 (.705)
Note: Nonsignificant effects (p . .05) are shown inparentheses.
T H E C A N A D I A N S H I F T I N M O N T R E A L 147

there is in the low-central region for the retraction of0æ0. There appears to be amore or less constant distance between the front and back corners of the vowelspace. The entire lower space is further back for women than for men. Clearly,however, the social embedding of the Canadian Shift is a subject that wouldbenefit greatly from further research, both in Montreal and elsewhere.
D I S C U S S I O N
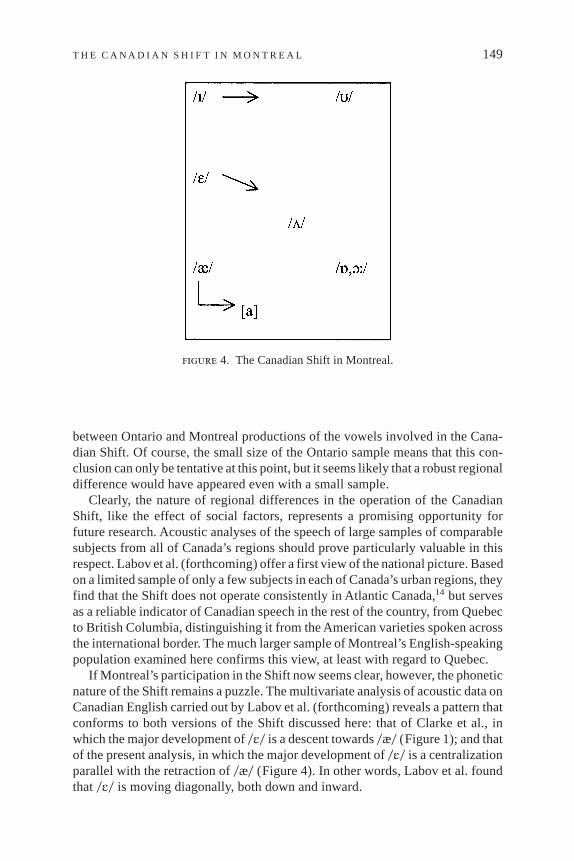
The data we have reported motivate a revised view of the Canadian Shift, at leastas it operates in Montreal, which is illustrated in Figure 4. It is difficult to knowhow to reconcile this view with that of Clarke et al., reproduced in Figure 1, otherthan to suggest that the Shift may operate differently in Ontario and Quebec. Totest this hypothesis, data identical to those on Montreal English reported herewere collected from seven undergraduate students (five women and two men)from several regions of Ontario13 who were attending McGill University. Thissample, while small, is demographically very similar to the sample that served asthe basis for Clarke et al.’s study. If it were found that the Ontario subjects hadlower and less centralized productions of0I0 and0E0 than the Montreal subjects(that is, higher mean F1 and lower mean F2 measurements), the inconsistencybetween the two studies could be confidently ascribed to a regional difference.
In making the regional comparison, the same word list was used for the Ontariosubjects, and their production of the six short vowels was measured in the sameway as for the Montreal participants. Their acoustic data were normalized inreference to the group mean for the Montreal participants, so that the two groupscould be directly compared. A MANCOVA was then carried out to test whetherregion (Ontario vs. Montreal) was correlated with any differences in the acousticmeasures. Sex was held constant as a covariate. The result wasF(1, 12)5 3.191;p . .05; from which it can be concluded that there is no significant difference
TABLE 9. Descriptive statistics (mean and standarddeviation) for analysis of F1 and F2 of short vowels
by sex (n5 21 women and 14 men)
Measure Sex Mean Standard Deviation
F2 (I) f 2117 104m 2046 81
F2 (æ) f 1702 100m 1788 92
F2 (Á) f 1194 61m 1260 51
Note: Only dependent measures selected as significant bythe ANCOVA reported in Table 8 are shown.
148 C H A R L E S B O B E R G
between Ontario and Montreal productions of the vowels involved in the Cana-dian Shift. Of course, the small size of the Ontario sample means that this con-clusion can only be tentative at this point, but it seems likely that a robust regionaldifference would have appeared even with a small sample.
Clearly, the nature of regional differences in the operation of the CanadianShift, like the effect of social factors, represents a promising opportunity forfuture research. Acoustic analyses of the speech of large samples of comparablesubjects from all of Canada’s regions should prove particularly valuable in thisrespect. Labov et al. (forthcoming) offer a first view of the national picture. Basedon a limited sample of only a few subjects in each of Canada’s urban regions, theyfind that the Shift does not operate consistently in Atlantic Canada,14 but servesas a reliable indicator of Canadian speech in the rest of the country, from Quebecto British Columbia, distinguishing it from the American varieties spoken acrossthe international border. The much larger sample of Montreal’s English-speakingpopulation examined here confirms this view, at least with regard to Quebec.
If Montreal’s participation in the Shift now seems clear, however, the phoneticnature of the Shift remains a puzzle. The multivariate analysis of acoustic data onCanadian English carried out by Labov et al. (forthcoming) reveals a pattern thatconforms to both versions of the Shift discussed here: that of Clarke et al., inwhich the major development of0E0 is a descent towards0æ0 (Figure 1); and thatof the present analysis, in which the major development of0E0 is a centralizationparallel with the retraction of0æ0 (Figure 4). In other words, Labov et al. foundthat0E0 is moving diagonally, both down and inward.
figure 4. The Canadian Shift in Montreal.
T H E C A N A D I A N S H I F T I N M O N T R E A L 149
It is particularly difficult to reconcile this result with the preliminary analysisof the Ontario data from Labov et al.’s (forthcoming) study, presented in Table 1,which showed no correlation between age and the F1 of0E0 (r 5 .16). Ontario isthe only region of Canada in which Labov et al. have a large enough sample tosupport an apparent-time analysis without appealing to speakers from otherregions. When the analysis is expanded to include speakers from regions outsideOntario, however, an age correlation with the F1 of0E0 emerges. This analysisprobably raises as many questions as it answers, given the problems of regionaldifferences and a small sample in each city, combined with the fact that the dataon each speaker are not always strictly comparable (unlike in the present analysis,many of the tokens analyzed for each subject were from spontaneous speech, sothat allophonic environment and conditions of elicitation were not controlled).Nevertheless, this view of the development of0E0 gains further support fromanecdotal, impressionistic observations of the speech of young Canadians.Amongyoung Canadian women in particular, the pronunciation of0E0 is sometimes lowenough to produce potential confusion with0æ0, at least when taken out of con-text, as whenleftandbetsound somewhat likelaughedandbat. It is not clear whythis development is not reflected in the data presented here. If it is not simply aregional difference, the discrepancy may result from characteristics of the sampleon which the present study is based, such as the high proportion of certain ethnicgroups, or to the role of aspects of the speech signal other than the height of thefirst two formants. At this point, the development of0E0 represents an interestingopportunity for future research.
Perhaps the most engaging issue in research on the Canadian Shift, particu-larly for linguists not closely concerned with the study of Canadian English, is theextent to which the Shift can be seen as an automatic response to its phonologicalinput condition—the space opened up by the low-back merger—rather than as anidiosyncratic development with a local, sociosymbolic value in Canadian English.Clarke et al. (1995:224) correctly pointed out that the obvious way to answer thisquestion is to examine other dialects in which the same input condition is present:the other members of Labov’s Third Dialect group. Is the retraction of0æ0, withits associated effect on the other short front vowels, found in every dialect thatexhibits the low-back merger? A positive answer would argue for an explanationof the Shift in terms of automatic processes of vowel shifting governed by struc-tural considerations, in particular by the need to maintain equal margins of secu-rity around each vowel phoneme. A negative answer, in the absence of otherstructural impediments to retraction in the other dialects, would suggest that theretraction of0æ0 may have a sociosymbolic value in Canadian English that hasless currency in other regions of North America.
The continental overview of vowel pronunciation offered by Labov et al. (forth-coming) shows little evidence of the Canadian Shift outside Canada, but thisbroad perspective should be confirmed by detailed local studies of larger samplesof speakers in each region. These studies will have to contend with the possibilitythat the presence of a low-back merger may not be the only input condition rel-evant to the operation of the Canadian Shift. In each Third Dialect region, as it
150 C H A R L E S B O B E R G
happens, additional structural factors may come into play. Traditional EasternNew England speech features a low-central vowel,0a:0 ( father, palm, car), notpresent in Canadian English, that might merge with0æ0 if the latter were shiftedto low-central position. It was observed earlier that the Canadian Shift pronun-ciation ofhatas [hat] matches the Inland Northern pronunciation ofhot. In Bos-ton, by contrast, it is similar to the traditional pronunciation ofheart as [ha:t].Does the possibility of this merger prevent the retraction of0æ0? Western Penn-sylvania English (at least the traditional dialect of Pittsburgh, the largest city inthe region) also has a low-central vowel not present in Canadian English, thoughfrom a different historical source, in this case the monophthongization of0aU0.Does the pronunciation ofmouthandmouseas [ma:T] and [ma:s] discourage thepronunciation ofmathandmassin the same way?15The phonemic structure of theEnglish of the Western United States is more similar to that of Canadian English:both0aI0 and0aU0 are diphthongs, and historical0a:0 ( father) is merged with0Á0(bother), which in turn is merged with0O:0. The phonetic realization of this three-way merger, however, is different. In some parts of the West, it is considerablyfurther forward and less rounded than in Canada, approaching the low-centralregion, so thatcot andcaughtare both pronounced as [kAt] rather than as [kÁt].Does this configuration of the low vowel space preclude the retraction of0æ0?16
Further research on the retraction of0æ0 in various dialects may also help toilluminate the mental processes that underlie the Canadian Shift. The version ofthe Shift presented in Clarke et al. is a classic chain shift, suggesting a clear causalrelation between its three principal elements. The basis of this causal relation isthe maintenance of maximal margins of security in phonological space to preventconfusion with neighboring phonemes, a key component of the structural econ-omy of vowel systems, as conceived by Martinet (1955) and further developed byLabov (1994). Structural economy of this sort was shown by Moulton (1960,1962) to explain the articulation of vowels in Northern dialects of Swiss German,in a powerful demonstration of the effect of phonemic structure on phonetic out-put. It has a clear psycholinguistic basis. By contrast, the version of the Shiftpresented in Figure 4 is a parallel shift. Parallel shifts have been observed before(e.g., the parallel centralization of the back upgliding vowels0u:, oU, aU0 in theMidland and South of the United States, or in Southern British English), but theirrelation to structural economy is less obvious than that of chain shifts. Althoughstructural economy can be evoked to explain the original retraction of0æ0 inCanadian English, parallel retractions of0E0 and0I0 can only be explained asanalogical developments, or as the generalization of a phonetic change from onemember to the other members of a vocalic subsystem.
A generalization of this type may achieve a certain mental economy, but it isdifficult to argue that it enhances structural economy. On the contrary, in theNorthern Cities Shift, the retraction of0E0 to [ö] follows in a chain shift behindthe retraction of0ö0 to [O], thereby maintaining margins of security, whereas inthe Canadian Shift,0ö0 remains in place (at least according to the ANCOVAreported in Table 5). Neither Clarke et al. nor the present study found0ö0 to beshifting back toward the rear periphery; in fact, Clarke et al. suggested that it is
T H E C A N A D I A N S H I F T I N M O N T R E A L 151

moving forward. Figure 2 shows it in lower-mid central position in Montreal, notfar from the most retracted allophones of0E0. The retraction of0E0 thereforediminishes the margin of security between0E0 and0ö0, potentially causingdeckand best to sound somewhat likeduck and bust. In this case, apparently, thestructural integrity of vocalic subsystems takes precedence over the need to main-tain maximal contrast between neighboring phonemes. Whether Canadian English,or Montreal English, in fact, shows an approximation or incipient merger of0E0and0ö0 will be left as a subject for future research.
N O T E S
1. Previous work on Canadian English had been dominated by the use of written questionnaires tostudy nonphonetic variables, for example Avis (1954–1956), Scargill and Warkentyne (1972), andChambers (1994). Important exceptions to this tradition include the studies of Canadian Raisingalready referred to, and of several phonetic and phonological variables in Vancouver and Ottawa (DeWolf, 1992), among others. However, general studies of the vowel system like that of Labov, Yaeger,and Steiner (1972) in the United States were not well represented in research on Canadian Englishbefore 1995.An early impressionistic study of the vowels of Vancouver English (Gregg, 1957) did notgive rise to a tradition of similar studies in other regions.2. The transborder opposition of the Inland Northern and Canadian vowel systems was examined
by Boberg (2000).3. These figures refer to the number of people who claimed English as their only mother tongue in
the 2001 Census of Canada. The total populations of Canada and Ontario in 2001 were 30 million and11.3 million, respectively. (Canada. Statistics Canada, 2001.)4. Greater Montreal’s half-million speakers of English are a small minority of the metropolitan
population, which is two-thirds French-speaking. This makes Montreal a speech community distinctfrom Ontario or Toronto in more than the geographic sense. In particular, physical and cultural iso-lation from the majority of English-speaking Canada, along with intense contact with French, mayhave an important influence on Montreal English that has no equivalent elsewhere in North America.Historically, while Montreal’s English-speaking community was established at about the same timeas Ontario’s (the late 18th century), its earliest period was dominated by direct immigration fromBritain, rather than by the northward migration of Loyalist refugees from the American Revolution.5. Labov’s term. See, for example, the discussion of the “embedding problem” in the study of the
mechanism of linguistic change (Labov, 1972:162).6. The sample was originally recruited for a study of ethnic differences in the phonetics of Mon-
treal English (Boberg, 2004), which determined its ethnic composition. In that study, ethnicity wasnot found to influence the articulation of the vowels involved in the Canadian Shift, though it did haveimportant effects on other vowels. The 2001 Census of Canada showed that the 161,235 people ofIrish ancestry in Greater Montreal represent the largest portion of the historically English-speakingcommunity, outnumbering those of English or Scottish ancestry, whereas the 224,460 people of Ital-ian origin and 80,390 people of Jewish origin are the most populous of the groups of non-Britishpeople who have joined the English-speaking community since immigrating to Montreal. (Canada.Statistics Canada, 2001.) The sample of this study therefore represents a cross-section of the ethnicdiversity that characterizes the English-speaking community of Montreal.7. These generational groups are derived from the analysis of Howe and Strauss (1993), who
argued that they represent significant shifts in outlook, experience, and popular culture. The firstgroup’s socialization was dominated by the Depression and the Second World War; the second by theCold War and the counter-cultural and civil rights movements of the 1960s; and the third by theaftermath of the 1960s.8. The interviews were recorded on Type II (CrO2) analog cassette tapes, using Marantz PMD 221
cassette recorders and Audiotechnica AT 803b omnidirectional lavalier microphones.9. Each short vowel was represented by at least one token before0d0, one before0t0, and one
before0 l 0.All of them except0U0were also represented by a token before0n0. There were four tokensof 0æ0 before nasal consonants, but these were not included in the analysis, because prenasal0æ0often shows a clearly separate distribution from other tokens of0æ0 in North American English, andthe degree to which0æ0 is fronted or raised before nasals is subject to ethnic variation in Montreal.
152 C H A R L E S B O B E R G
The word list also included tokens of the short vowels before0r0 (e.g.,spirit, berry, carry), but thesewere excluded from the analysis because prerhotic vowels generally form a separate subsystem fromthe main, nonprerhotic system in most North American dialects. Finally, the representation of themain vowels of interest in the Canadian Shift—0I, E, æ,Á0—was augmented by including tokensbefore0p0 and0k0 as well as0t0. The number of tokens analyzed for each participant was therefore30: six of0I, E, Á0; five of 0æ0; four of 0ö0, and three of0U0.10. Nearey’s Constant Log Interval Hypothesis involves a single scaling factor for F1 and F2. Itcalculates a scaling factor for each participant as the antilog of the difference between the natural logsof the combined F10F2 means of the participant and the group (all 35 participants). The participant’sformant values are then multiplied by the scaling factor to produce the normalized values. The F10F2mean for the group of 35 speakers was 1110.6, of which the natural log is 7.01. The scaling factorsranged from 0.86 for the woman with the highest voice to 1.16 for the man with the lowest voice. Themean F10F2 means were 1184 for women and 1012 for men; the mean scaling factors were 0.94 forwomen and 1.10 for men.11. The values in Figure 2 actually reflect a mean of the means for the three ethnic groups. It will beshown that ethnicity has no effect on the vowels involved in the Canadian Shift, but it does affect othervowels. The interethnic mean prevents the representation of Montreal English as a whole from beingunduly subject to the influence of one ethnic group more than another.12. Probabilities of less than 0.05 were taken to be significant. The probability for the F2 of0I0, p5.059, was taken to be marginally significant, since it is only slightly higher than 0.05.13. Two of the students were from Greater Toronto, one from Southern Ontario, three from EasternOntario, and one from Northern Ontario.14. This finding partly contradicts Clarke et al. (1995:220), who report an incipient retraction of0æ0 in St. John’s, Newfoundland, led by middle-class women. The adoption of0æ0-retraction byyoung women in St. John’s has more recently been confirmed by D’Arcy (2002).15. McCarthy (2004) presented data from an acoustic study of Pittsburgh English that suggested astructural relation between the retraction of0æ0 and the monophthongization of0aU0. Retracted0æ0was only observed among participants for whom monophthongization was strongly recessive orabsent.16. The same condition is true of Newfoundland English, which has a low-central rather than low-back articulation of0Á-O:0. This may help to explain the observation of Labov et al. (forthcoming)that the Canadian Shift does not operate in Newfoundland (but see note 14).
R E F E R E N C E S
Avis, Walter S. (1954–1956). Speech differences along the Ontario–United States border.Journal ofthe Canadian Linguistic Association1:13–18, 1:14–19, and 2:41–59.
Boberg, Charles. (2000). Geolinguistic diffusion and the U.S.–Canada border.Language Variationand Change12:1–24._(2004). Ethnic patterns in the phonetics of Montreal English.Journal of Sociolinguistics
8(4):538–568.Canada. Statistics Canada. (2001).Census, 2001. Ottawa: Minister of Industry, Science and Tech-
nology. 538–568. Also available on-line at www.statcan.ca.Chambers, J. K. (1973). Canadian raising.Canadian Journal of Linguistics18:113–135._(1994). An introduction to dialect topography.English World-Wide15:35–53.Clarke, Sandra, Elms, Ford, & Youssef, Amani. (1995). The third dialect of English: Some Canadian
evidence.Language Variation and Change7:209–228.D’Arcy, Alex. (2002).Caught in the act: Dialect change in St. John’s English. Paper presented at
NWAVE 31, Stanford University, October 12.De Decker, Paul. (2001).Hangin’ & retractin’: Adolescent social practice and sound change in an
Ontario small town. Paper presented at NWAVE 30, North Carolina State University, October 12.De Decker, Paul, & Mackenzie, Sara. (1999).Slept through the ice: A Further look at lax vowel
lowering in Canadian English. Paper presented at NWAVE 28, University of Toronto, October 16.De Wolf, Gaelan Dodds. (1992).Social and regional factors in Canadian English. Toronto: Canadian
Scholar’s Press.Esling, John H., & Warkentyne, Henry J. (1993). Retracting of0æ0 in Vancouver English. In Sandra
Clarke (ed.),Focus on Canada. Amsterdam: Benjamins. 229–246.Gregg, R. J. (1957). Notes on the pronunciation of Canadian English as spoken in Vancouver, B.C.
Journal of the Canadian Linguistic Association3:20–26.
T H E C A N A D I A N S H I F T I N M O N T R E A L 153
Hoffman, Michol. (1998).Looking for a theng: The progress of lax vowel lowering. Paper presentedat NWAVE 27, University of Georgia, October 2._(1999).Really expansive: The progress of lax vowel lowering in a chain shift. Paper presented
at NWAVE 28, University of Toronto, October 16.Howe, Neil, & Strauss, Bill. (1993).13th Gen: Abort, Retry, Ignore, Fail?New York: Vintage Books.Joos, Martin. (1942). A phonological dilemma in Canadian English.Language18:141–144.Labov, William. (1972).Sociolinguistic patterns. Philadelphia: University of Pennsylvania Press._(1990). The intersection of sex and social class in the course of linguistic change.Language
Variation and Change2:205–254._(1991). The three dialects of English. In P. Eckert (ed.),New ways of analyzing sound change.
New York: Academic Press. 1–44._(1994).Principles of linguistic change. Vol. I: Internal factors. Oxford: Blackwell.Labov, William, Ash, Sharon, & Boberg, Charles. (forthcoming).Atlas of North American English:
Phonetics, phonology, and sound change. Berlin: Mouton de Gruyter.Labov, William, Yaeger, Malcah, & Steiner, Richard. (1972).A quantitative study of sound change in
progress(Vol. 1). Philadelphia: U.S. Regional Survey.Lawrance, Erika. (2002).A shift in focus: A new, geolinguistic perspective on the Canadian Shift (and
old questions revisited). Unpublished Master’s paper, McGill University.Martinet, André. (1955).Economie des changements phonétiques. Berne: Francke.McCarthy, Corrine. (2004).Language Change in Pittsburgh: The Decline of0aw0-Monophthongization
and the Canadian Shift. Poster presented at NWAVE 33, University of Michigan, October 1.Moulton, William G. (1960). The short vowel systems of Northern Switzerland: A study in structural
dialectology.Word16:155–182._(1962). Dialect geography and the concept of phonological space.Word18:23–32.Nearey, Terence M. (1977).Phonetic feature systems for vowels. Bloomington, IN: Indiana Univer-
sity Linguistics Club.Scargill, M. H., & Warkentyne, Henry J. (1972). The Survey of Canadian English: A report.English
Quarterly5:47–104.Trudgill, Peter. (1974). Linguistic change and diffusion: Description and explanation in sociolinguis-
tic dialect geography.Language in Society3:215–246.
154 C H A R L E S B O B E R G