Boards of directors and firm performance: The effect of multiple directorships
24
Boards of directors and firm performance: The effect of multiple directorships * Abstract: We analyze the influence of multiple directorships (busyness) on the performance of the Spanish listed firms between 2007 and 2009. We find a nonlinear relation due to the combination of a reputation effect and a dedication effect. For low levels of multiple directorships, the reputation effect prevails, so that serving on more boards of directors means more skills and more incentives to perform directorial duties, with a positive impact on the firm’s performance. After a certain threshold (our results point to around four boards), the dedication effect prevails as directors become overwhelmed attending to the duties of too many boards. Keywords: independent directors, boards of directors, firm performance, corporate governance. Clasificación JEL/JEL Codes: G34 * The authors are grateful to Juan Antonio Rodríguez, Carmen Antón, Isabel Prieto, Isabel Acero, Fernando Tejerina, Nuria Reguera, Cristina Abad, Alisa Larson, Esther del Brío (associated editor), two anonymous referees and the participants in the V Research Forum of the Spanish Journal of Finance and Accounting for their comments on previous versions of the paper. The authors also acknowledge the financial support of the Spanish Ministry of Science and Innovation (project ECO2011-29144-C03-01). All the remaining errors are our only responsibility.
Transcript of Boards of directors and firm performance: The effect of multiple directorships

Boards of directors and firm performance: The effect of multiple directorships*
Abstract: We analyze the influence of multiple directorships (busyness) on the performance of the Spanish listed firms between 2007 and 2009. We find a nonlinear relation due to the combination of a reputation effect and a dedication effect. For low levels of multiple directorships, the reputation effect prevails, so that serving on more boards of directors means more skills and more incentives to perform directorial duties, with a positive impact on the firm’s performance. After a certain threshold (our results point to around four boards), the dedication effect prevails as directors become overwhelmed attending to the duties of too many boards.
Keywords: independent directors, boards of directors, firm performance, corporate governance.
Clasificación JEL/JEL Codes: G34
* The authors are grateful to Juan Antonio Rodríguez, Carmen Antón, Isabel Prieto, Isabel Acero, Fernando Tejerina, Nuria Reguera, Cristina Abad, Alisa Larson, Esther del Brío (associated editor), two anonymous referees and the participants in the V Research Forum of the Spanish Journal of Finance and Accounting for their comments on previous versions of the paper. The authors also acknowledge the financial support of the Spanish Ministry of Science and Innovation (project ECO2011-29144-C03-01). All the remaining errors are our only responsibility.

-1-
1. INTRODUCTION
The board of directors (BD) is a cornerstone in corporate governance (Jensen,
1993; Olivencia, 2004). Although literature has emphasized this importance, the
research has not always reached conclusive results regarding the board’s
influence (Adams, et al., 2010; Dalton and Dalton, 2011; García Meca and
Sánchez Ballesta, 2009). The literature has often stressed its supervisory role and
paid less attention to other board functions (Crespí and Gispert, 2003; Fernández,
et al., 1998; Mínguez and Martín Ugedo, 2005). Nevertheless, both academia and
practitioners have recently acknowledged boards’ advisory role and its influence on
firm strategy (Acero and Alcalde, 2012; Blanco Alcántara, et al., 2012; García
Ramos and García Olalla, 2011). Anderson et al. (2007) show that directors are
increasingly conscious of the redefinition of their role and that they consider
collaboration with the firm’s managers as an important function of their work. An
excessive trend toward supervision could be a detrimental effect of the advisory
function, as it may negatively impact an orientation toward firm performance
(Adams and Ferreira, 2007; Faleye, et al., 2011).
In this framework, the focus of the corporate governance problems is no
longer solely on the conflicts of interests and the distribution of resources but now
includes the problems of coordination among agents and the creation of knowledge
(van Ees, et al., 2009). Consequently, research on BD should be orientated to the
analysis of directors’ skills and abilities, the field to which the study of multiple
directorships (or directors’ busyness) belongs. The effect of multiple directorships
is twofold. On the one hand, there is a reputation effect because a director who sits
on several BDs has a verified ability to provide worthwhile ideas and advice that
will increase the demand of his or her services as an independent director. In
addition, directors are interested in preserving this reputation, which is an incentive
to perform their duties as directors and improve the performance of the firm
(Masulis and Mobbs, 2011; Sharma, 2011). On the other hand, there is a
dedication effect because belonging to too many boards can result in an

-2-
excessively diversified job, with time constraints and the need to collaborate with
very different firms and possibly industries-.
Our paper is related to this emerging direction in research as we analyze the
effect of the multiple directorships on the value and the performance of the firm.
Our research is related to the twenty-sixth recommendation of the Spanish Unified
Code of Good Governance, according to which firms should “set policies
concerning the number of boards to which its directors can belong” (CNMV, 2006).
The European Commission is also very interested in this issue and in 2011 issued
a public consultation about the legal framework of the corporate governance in the
European Union (European Commission, 2011). This green paper addresses
explicitly the debate about the possible legal limitation of the number of BD to
which a director can belong.1
In the same vein, the reports of the Foundation for Financial Studies
(Fundación de Estudios Financieros, 2009, 2010, 2011) for Spain and of the
Watson Wyatt consulting firm in the international arena show a global trend among
institutional investors to set limits both on independent directors’ tenure and on the
number of the BD that they attend, even though no mandatory laws are in place
(Teen and Teo, 2009). These facts, along with the growing accountability of legal
directors (Informe Aldama, 2003) and the growing engagement of directors
(Anderson, et al., 2007), are likely to result in more attention being paid to the
selection of the boards to which independent directors belong.
Our research is based on nonfinancial listed firms in the Spanish continuous
market between 2007 and 2009. The results show a nonlinear relation between
firm performance and the average number of BD to which its independent directors
belong. Initially a reputation effect prevails so that a positive relation exists
between the variables. However, after reaching a threshold (our results suggest
1 In the public consultation stage, 409 contributions were submitted; most of them (93 percent) from firms, professional associations, and public authorities. Although around three out of four participants did not support a legal limit to the number of BDs on which a director can sit, most of them supported suggesting an indicative number between three and five boards.

-3-
that the threshold is around four BDs of listed firms), the relation turns negative due
to a dedication effect as directors can no longer perform because they are sitting
on too many BDs.
Our paper is divided into five sections. In Section 2 we review the most
relevant literature and propose the hypothesis to be tested. In Section 3 we
describe the sample, the empirical method, and the variables. In Section 4 we
report the results of our analysis. Finally, in Section 5, we provide our conclusions.
2. LITERATURE REVIEW AND HYPOTHESIS
Independence is a core characteristic of the BD that potentially affects a firm’s
performance. However, despite support from most codes of good governance and
certain regulatory pressure in favor of more independent directors, the literature
has not yet reached conclusive results regarding the influence of independence on
firm performance (Bøhren and Strøm, 2010; Brick and Chidambaran, 2010; Choi,
et al., 2007; Fahlenbrach, et al., 2010; Monterrey and Sánchez, 2008; Young, et
al., 2008).
This lack of conclusive evidence can be attributed to four reasons. First, the
current definition of independence is too loose, and directors can be affected by
other kinds of ties (Hwang and Kim, 2009). Second, the composition of the BD may
not only be a determinant of the performance of the firm but may also be an
outcome of this performance (Adams, et al., 2010). Third, the view of BDs has
been primarily limited to their supervisory abilities; this view needs to be expanded
to include their cognitive abilities (Barroso, et al., 2011; Guieu and Meschi, 2008).
Finally, prior analysis of BDs has not adequately combined the different levels of
analysis: personal, corporation, and sectorial (Dalton and Dalton, 2011; Pugliese,
et al., 2009). This issue needs to be further addressed.
Our approach takes into account these reasons because we analyze the
factors potentially affecting the ability of independent directors to perform a
supervisory and advisory job in a multilevel framework, combining the individual

-4-
director level with the firm-level of the company on whose BD the director sits. In
addition, as we explain in the empirical design section, we address the possible
endogeneity issues to prevent them from biasing our results.
From a supervisory point of view, independent directors are effective monitors
because they are free from ties with other stakeholders that can put pressure on
their job. However, a wider view of the function of the BD requires a broader view
of role played by independent directors (Jonnergård and Stafsudd, 2011; Kim, et
al., 2009). This approach is consistent with Brick and Chidambaran (2010), who
show that the value creation of a more efficient BD is not an outcome of its
supervisory role but rather of the advisory skills of the independent directors.
Likewise, Coles et al. (2008) and Guest (2008) find that the BD of the firms with the
most need of advice have a higher proportion of independent directors.
In these context, a new view of independent directors emerges as providers
of social capital, defined as a set of factors that includes information, knowledge,
and relations both within and outside of the firm that become a strategic asset
(Duchin, et al., 2010; Kim and Cannella, 2008). Independent directors are not only
independent monitors; they also bring to BD discussions new points of view,
expertise, and outside relations with other firms and institutions. Their contribution
to firm value depends on their skills and the time and the effort that they expend
preparing for the BD meetings (Fahlenbrach, et al., 2010; Fich and Shivdasani,
2006; Kiel and Nicholson, 2006). Therefore, the question on multiple directorships
arises as a relevant determinant of the effectiveness of independent directors. The
literature provides different answers to this question, which can be classified into
two explanations: the reputation effect and the dedication effect.
The seminal papers of Fama (1980) and Fama and Jensen (1983) address
the notion of the reputational capital of directors. According to the reputation effect,
outside directors contribute to firm value through their prestige, visibility, and
relationships. Therefore, directors with the most reputational capital will be
nominated to more BDs. Thus, the number of BDs to which an independent
director belongs will depend on his or her reputation and business skills. This
-5-
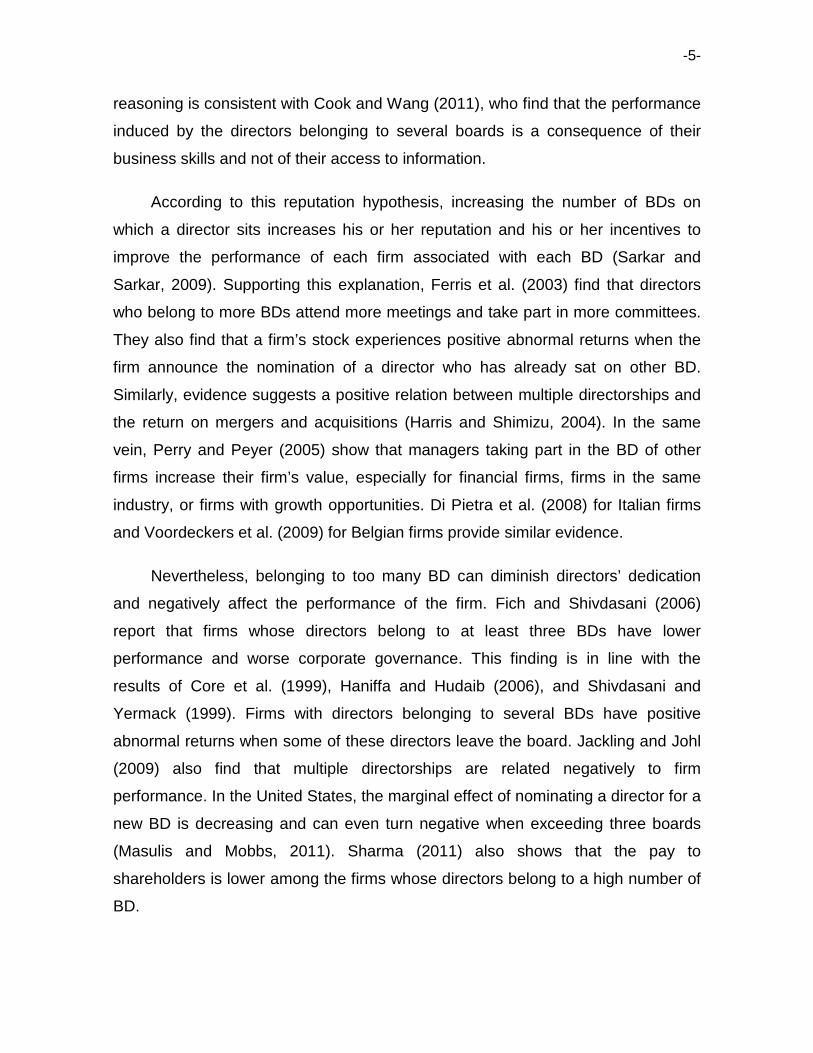
reasoning is consistent with Cook and Wang (2011), who find that the performance
induced by the directors belonging to several boards is a consequence of their
business skills and not of their access to information.
According to this reputation hypothesis, increasing the number of BDs on
which a director sits increases his or her reputation and his or her incentives to
improve the performance of each firm associated with each BD (Sarkar and
Sarkar, 2009). Supporting this explanation, Ferris et al. (2003) find that directors
who belong to more BDs attend more meetings and take part in more committees.
They also find that a firm’s stock experiences positive abnormal returns when the
firm announce the nomination of a director who has already sat on other BD.
Similarly, evidence suggests a positive relation between multiple directorships and
the return on mergers and acquisitions (Harris and Shimizu, 2004). In the same
vein, Perry and Peyer (2005) show that managers taking part in the BD of other
firms increase their firm’s value, especially for financial firms, firms in the same
industry, or firms with growth opportunities. Di Pietra et al. (2008) for Italian firms
and Voordeckers et al. (2009) for Belgian firms provide similar evidence.
Nevertheless, belonging to too many BD can diminish directors’ dedication
and negatively affect the performance of the firm. Fich and Shivdasani (2006)
report that firms whose directors belong to at least three BDs have lower
performance and worse corporate governance. This finding is in line with the
results of Core et al. (1999), Haniffa and Hudaib (2006), and Shivdasani and
Yermack (1999). Firms with directors belonging to several BDs have positive
abnormal returns when some of these directors leave the board. Jackling and Johl
(2009) also find that multiple directorships are related negatively to firm
performance. In the United States, the marginal effect of nominating a director for a
new BD is decreasing and can even turn negative when exceeding three boards
(Masulis and Mobbs, 2011). Sharma (2011) also shows that the pay to
shareholders is lower among the firms whose directors belong to a high number of
BD.

-6-
Consequently, the effect of multiple directorships on the firm’s performance is
an empirical question. There are reasons that justify a positive relation (reputation
effect), a negative relation (dedication effect), and the lack of a relation (Kiel and
Nicholson, 2006). A combination of both effects is also possible: initially the
reputation effect may prevail until a threshold after which the accumulation of too
many BD turns the relation into a negative one. Accordingly we state our
hypothesis threefold:
H1a: A positive relation exists between the number of BDs to which
independent directors belong and the performance of the firm.
H1b: A negative relation exists between the number of BDs to which the
independent directors belong and the performance of the firm.
H1c: A nonlinear relation exists between the number of BDs to which the
independent directors belong and the performance of the firm.
3. METHOD, SAMPLE AND VARIABLES
3.1. Sample
Our initial simple includes all the nonfinancial firms listed in the Spanish continuous
market on December 31, 2009. Out of the 127 listed firms we drop banks because
they must comply with specific sector regulations and are under the additional
supervision of the Bank of Spain and other monetary authorities. We exclude nine
other firms whose information was not available in the public sources of data and
the firms with negative equity market value. We collect information on financial
statements and on corporate governance of all the available firms between 2007
and 2009 and build a sample of 311 firm-year observations. Table 1 provides the
details of the sample. Due to the wide dispersion of some variables, we drop some
outliers, as we explain later. The sector composition of the sample reflects the
composition of Spanish capital markets, in which Basic Materials, Industry and

-7-
Construction and Consumer Goods are overrepresented and Technology and
Communications are underrepresented.
Table 1: Sample sectorial composition
Year and sector distribution of the firms in the sample.
2007 2008 2009
Petrol and Power 11 11 11 Basic Materials, Industry and Construction 28 30 29 Consumer Goods 28 27 28 Consumer Services 13 16 14 Financial Services and Real Estate 15 16 17 Technology and Communications 6 5 6 Total Sample 101 105 105
We collect information from three sources. The list of companies, sector
distribution, and equity market value are collected from the Madrid Stock Exchange
website. The information on the financial statements (balance sheet and profit and
loss account) comes from the Amadeus database. The information on the BD of
the listed firms (number of directors, independent directors’ identity, number of
boards to which each one belongs, etc.) comes from the companies’ corporate
governance reports, available at the Comisión Nacional del Mercado de Valores
(Spanish Stock Exchange Commission) website.
The information on corporate governance requires that we manually collect
the corporate governance report for every firm and every year and identify the BD
to which each independent director belongs.
3.2. Method
Following previous research, we estimate our model through the method of
ordinary least squares (Fich and Shivdasani, 2006; Haniffa and Hudaib, 2006). We
also combine cross-sectional observations with time series to build a panel that we
analyze using a panel data analysis. However, the efficiency of these last
estimates is conditioned by the limited available period of time. Thus, we report
these results as a sensitivity analysis. In addition, panel data procedures allows us

-8-
to address in part the problems of residual correlation and heteroskedasticity
suggested by Petersen (2009).
A key element in panel data is the fixed effects term. This term is intended to
reflect the firm-level characteristics, and it thereby avoids the omission bias and
renders more efficient estimates. The fixed effects term is unobservable and,
consequently, is subsumed in the random disturbance. In these cases, we must
discern the kind of relation between the fixed effects term and the other
explanatory variables since this same relation will exist between the random
disturbance and the explanatory variables. This correlation is analyzed with the
Hausman test, which tests the null hypothesis of the lack of correlation between
the independent variables and the fixed effects term.2 Accordingly, we use the
Hausman test to choose the most suitable estimation method.
In addition to the panel data estimates, the sensitivity analysis also addresses
the endogeneity concern, which often arises in research on corporate governance.
Corporate governance issues may not only be a determinant but also possibly be
an outcome of the performance of the firm (Coles, et al., 2008; Demsetz and Lehn,
1985). To address this problem, we conduct two complementary analyses. First,
we run our analysis with one-year lagged corporate governance variables (Coles,
et al., 2008; Hermalin and Weisbach, 1991). Second, we estimate a system of
simultaneous equations to explain jointly the performance of the firm and the
multiple directorship structure (Bhagat and Black, 2001; Cho, 1998; Thomsen, et
al., 2006). In any case, irrespective of the effort to solve this problem, we must
acknowledge that corporate governance characteristics are highly persistent, and
thus there is no guarantee that the endogeneity is solved.
3.3. Variables
Since we are interested in analyzing how multiple directorship affects the
performance of the firm, our dependent variable must be an accounting indicator of
2 This test follows a chi-squared distribution with so many degrees of freedom as estimated coefficients. When the null hypothesis is not rejected, the fixed effects term must be dropped out with the within groups technique. Otherwise, the random effects method applies.

-9-
performance or value creation. To enable the comparison with previous research
(Coles, et al., 2008; Ferris, et al., 2003; Fich and Shivdasani, 2006; Haniffa and
Hudaib, 2006), we use two dependent variables: a Tobin’s q ratio proxy (Q) and
the return on assets (ROA). The q ratio proxy is defined as the firm market value,
measured as equity market value plus debt book value, to firm book value ratio.
ROA is the ratio of earnings before interests and taxes to total assets.
Our key explanatory variable is the average number of BDs of listed firms to
which the independent directors of a company belong (BOARDS). For each year
and each firm this variable is computed as the average number of different boards
(excluded the BD of the firm under consideration) to which each independent
director belongs. To test nonlinear effects we use the squared variable BOARDS2.
We use three other variables concerning the BD: size (SIZE), defined as the
total number of directors; independence (INDEP), defined as the proportion of
independent directors; and the proportion of shares owned by the directors (OWN).
These variables have been used in previous research and enable the comparability
of our results (Andrés and Rodríguez Sanz, 2011; Coles, et al., 2008; Faleye, et
al., 2011; Fich and Shivdasani, 2006). Regarding the size of the BD, following the
suggestion of Yermack (1996) about oversized boards, we use the squared
variable as Andrés and Vallelado (2008) do. In the same vein, because of the
possibility of a double effect of the managerial ownership (alignment and
entrenchment) as proposed by Morck et al. (1988) and Cho (1998), we include
OWN in linear and squared terms.
We control for three other variables: financial leverage (LEV), defined as the
debt-to-equity ratio in book value; the size of the firm (ASSET), defined as the log
of total assets (Monterrey and Sánchez, 2008); and ownership concentration (C3),
measured by the proportion of shares held by the three largest shareholders. In
addition, since the market value of the firm can be affected by its performance, we
use ROA as an explanatory variable when Q is the dependent variable. We also
control for time and industry effects with dummy variables as explained in Table 1.
Due to the dispersion of some variables, especially the dependent variables—

-10-
possibly as a consequence of the economic crisis of the years under analysis—we
consider as outliers the observations beyond the 5 and 95 percentiles and dropped
them.
Our model is as follows
Qit = α + β1 · BOARDSit + β2 · BOARDSit2 + β3 · ROAit + β4 · LEVit + β5 · ASSETit +
β6 · C3it + β7 · OWNit + β8 · OWNit2 + β9 · SIZEit + β10 · SIZEit2 + β11 ·
INDEPit + ∑ βj2j=1 · DUM_ANjt + ∑ βj5
j=1 · DUM_SECTjt + µi + εit (1)
where the dependent variable can be either Q or ROA. The sub-index i identifies
the individual, and the sub-index t identifies the time μi is the fixed effects term, and
εit is the random disturbance of each firm-year observation. We also control for
time and sector with year and sector dummy variables (DUM_AN and DUM_SECT,
respectively).
Table 2 reports the basic descriptive statistics of the main variables of the
model. On average, BDs have 11.2 directors, and 33.7 percent of directors are
independent. These figures are consistent with the results of the Foundation for
Financial Studies (2011), which finds the average size of the BD of the quoted
firms is 11.24 directors in 2010 and the proportion of independent directors is 33.3
percent. On average, independent directors in our sample sit on 0.7 boards in
addition to the one under study. These data are comparable to the 0.8 boards
reported by Perry and Peyer (2005) for U.S. firms, 0.79 boards reported by Kiel
and Nicholson (2006) for Australian firms, and 0.4 boards reported by Di Pietra et
al. (2008) for Italian firms.

-11-
Table 2: Descriptive statistics This table presents the mean, standard deviation and quartiles of the main variables. Q is the market-to-book ratio; ROA is the return on assets; BOARDS is the average number of boards of other firms to which the independent directors belong; SIZE is the number of directors in the board; INDEP is the proportion of independent directors; OWN is the proportion of shares owned by directors; LEV is the debt-to-equity ratio; ASSET is the log of total assets; and C3 is the proportion of shares held by the three largest shareholders.
Variables Mean Std. dev. Q25 Q50 Q75
Q 2.282 2.026 1.040 1.680 2.787 ROA 0.062 0.110 0.020 0.083 0.203 BOARDS 0.732 1.161 0.000 0.500 1.000 SIZE 11.235 3.633 9.000 10.000 13.000 INDEP 0.337 0.173 0.250 0.325 0.440 OWN 14.020 21.930 0.100 1.910 21.490 LEV 3.172 5.344 0.982 1.848 3.458 ASSET 21.014 1.898 19.432 20.827 22.196 C3 38.920 28.830 16.110 30.750 60.590
Table 3 reports the correlation matrix among the main variables of the model.
Although the correlation coefficients are not high (with the exception of the relation
between the size of the board and the size of the firm), we compute the variance
inflation factor (VIF) to test the lack of multicollinearity in our estimates. The VIF is
well under 10, the threshold value for multicollinearity (Hair, et al., 2008; Kutner, et
al., 2005).

-12-
Table 3: Correlation matrix This table presents the correlation coefficients among the main variables. Q is the market-to-book ratio; ROA is the return on assets; BOARDS is the average number of boards of other firms to which the independent directors belong; SIZE is the number of directors in the board; INDEP is the proportion of independent directors; OWN is the proportion of shares owned by directors; LEV is the debt-to-equity ratio; ASSET is the log of total assets; and C3 is the proportion of shares held by the three largest shareholders.
Q ROA BOARDS SIZE INDEP OWN LEV ASSET
ROA 0.125 BOARDS –0.026 0.115
SIZE –0.073 0.020 –0.051 INDEP 0.003 0.103 0.052 –0.083
OWN 0.154 0.152 0.094 –0.184 –0.011 LEV 0.116 0.035 –0.087 0.194 –0.119 –0.008
ASSET –0.080 0.111 0.026 0.635 0.157 –0.082 0.392 C3 –0.121 0.013 0.006 0.074 –0.136 0.110 0.116 0.256
VIF 3.99 2.44 3.14 3.35 1.31 1.67 2.49 2.03
4. RESULTS
4.1. Explanatory analysis
Table 4 reports the results of the ordinary least squares estimation of model
(1). The dependent variable is the Q ratio (ROA) in columns 1–3 and ROA in
columns 4–6. In columns 1 and 4 we use the average number of BDs of each
independent director only as an explanatory variable. In columns 2 and 5 we add
the year and sector dummy variables, and in columns 3 and 6 we add the other
control variables (size of the board, financial leverage, firm size, and ownership
structure and ROA only for the Q-based regressions).
All the estimates show a nonlinear and significant influence of the number of
BDs on the performance of the firm, in line with Hypothesis 1c. The coefficient of
BOARDS suggests an initially positive relation due to the reputation effect. Thus,
belonging to a higher number of boards can be seen as a signal of independent
directors’ better reputation and increased incentives to perform their duties, which
translates into better firm performance. Nevertheless, the coefficient of BOARDS2
is also significant but negative. This result suggests an inverted U-shape so that

-13-
serving as a director on too many BDs may be detrimental to the director’s
dedication and, thus, negatively affect firm performance. By taking the first
derivative of model (1), we detect that the turning point is between two and three
BDs when Q is the dependent variable and around four BDs when ROA is the
dependent variable.
As far as the control variables are concerned, as we expected, ROA has a
clear and positive effect on the value of the firm. The adjusted explanatory power
of the model increases notably when we introduce new independent variables,
which corroborates the selection of the control variables.
Table 4: Estimation of model (1) with ordinary least squares This table presents the estimated coefficients and (standard errors) of the estimation of model (1) with ordinary least squares. Q is the market-to-book ratio; ROA is the return on assets; BOARDS is the average number of boards of other firms to which the independent directors belong; SIZE is the number of directors in the board; INDEP is the proportion of independent directors; OWN is the proportion of shares owned by directors; LEV is the debt-to-equity ratio; ASSET is the log of total assets; and C3 is the proportion of shares held by the three largest shareholders. *, **, and *** indicate 90 percent, 95 percent, and 99 percent confidence level, respectively. The adjusted-R2 coefficient is informative about the fitting of the model, and the F test about the joint significance of the explanatory variables.
(1) (2) (3) (4) (5) (6) V. dependiente Q Q Q ROA ROA ROA
BOARDS 0.269* 0.272* 0.243* 0.170*** 0.103*** 0.075*** (0.141) (0.143) (0.148) (0.038) (0.022) (0.024) BOARDS2 –0.057** –0.055* –0.054* –0.018** –0.013*** –0.008* (0.028) (0.028) (0.029) (0.007) (0.004) (0.004) ROA 1.674*** (0.321) LEV 0.089** 0.003 (0.041) (0.006) ASSET 0.122** 0.021** (0.059) (0.009) C3 –0.240 0.030 (0.262) (0.041) OWN 0.112 0.046 (0.907) (0.147) OWN2 –0.005 0.001 (0.125) (0.002) SIZE 0.016 0.020 (0.101) (0.015) SIZE2 0.001 –0.001* (0.003) (0.000) INDEP 0.073 –0.077 (0.411) (0.066)
Time effect No Sí Sí No Sí Sí

-14-
Industry effect No Sí Sí No Sí Sí
No. obs. 237 237 237 246 246 246 Adj.-R2 0.020 0.050 0.201 0.111 0.713 0.740 F-test 4.09*** 4.24*** 4.13*** 13.78*** 8.14*** 7.28***
Consequently, we find that the average number of BDs to which an
independent director belongs combines a reputation effect for low levels of the
dependent variable and a dedication effect for a high number of BDs.
4.2. Sensitivity analysis
To test the robustness of our results we rerun the previous analyses using the
panel data method. Table 5 reports the results. The number of BDs has a nonlinear
influence on the firm’s value or performance (Hypothesis 1c), combining the
positive effect of the low values of BOARDS and the negative effect for high
values. The turning point is consistent with the point previously reported. The
explanatory power of the model (adjusted-R2 coefficient) is acceptable in broad
terms.
Table 5: Estimation of the model (1) with panel data This table presents estimated coefficients and (standard errors) of the estimation of model (1) with panel data. The Hausman test for the existence of fixed effects follows a χ2 distribution with so many degrees of freedom as estimated coefficients. Q is the market-to-book ratio; ROA is the return on assets; BOARDS is the average number of boards of other firms to which the independent directors belong; SIZE is the number of directors in the board; INDEP is the proportion of independent directors; OWN is the proportion of shares owned by directors; LEV is the debt-to-equity ratio; ASSET is the log of total assets; and C3 is the proportion of shares held by the three largest shareholders. *, **, and *** indicate 90 percent, 95 percent, and 99 percent confidence level, respectively. The adjusted-R2 coefficient is informative about the fitting of the model, and the F test about the joint significance of the explanatory variables.

-15-
(1) (2) (3) (4) (5) (6) V. dependiente Q Q Q ROA ROA ROA BOARDS 0.385*** 0.405* 0.448* 0.171** 0.099** 0.110** (0.147) (0.214) (0.227) (0.080) (0.043) (0.052) BOARDS2 –0.072** –0.074* –0.085* –0.024* –0.015* –0.018* (0.028) (0.044) (0.045) (0.015) (0.008) (0.009) ROA 1.439*** (0.420) LEV –0.066 –0.012 (0.136) (0.015) ASSET 0.222 0.007 (0.165) (0.024) C3 –0.824 –0.048 (0.513) (0.122) OWN 0.067 –0.426 (0.173) (0.401) OWN2 –0.001 0.005 (0.001) (0.005) SIZE 0.212 0.011 (0.259) (0.059) SIZE2 –0.008 –0.001 (0.011) (0.002) INDEP –0.477 –0.110 (0.630) (0.141) Time effect No Sí Sí No Sí Sí Industry effect No Sí Sí No Sí Sí
No. obs. 237 237 237 246 246 246 Adj.-R2 0.029 0.138 0.293 0.046 0.725 0.734 F Test 7.15** 2.96** 3.23** 7.71** 364.28*** 365.43*** Hausman test 0.18 13.95** 15.26*** 1.08 4.87 5.05
Due to the possibility of endogeneity affecting our results, we perform two
additional analyses with alternative procedures to address this issue (Chang, et al.,
2009). First, we use a one-year lagged BOARDS variable (Coles, et al., 2008;
Hermalin and Weisbach, 1991). Table 6 reports our results. The dependent
variable is Q in the three left-hand estimates and ROA in the three right-hand
estimates.
Tabla 6: Estimation of model (1) with ordinary least squares
This table presents the estimated coefficients and (standard errors) of the estimation of model (1) with ordinary least squares. Q is the market-to-book ratio; ROA is the return on assets; BOARDS is the average number of boards of other firms to which the independent directors belong; SIZE is the number of directors in the board; INDEP is the proportion of independent directors; OWN is the proportion of shares owned by directors; LEV is the debt-to-equity ratio; ASSET is the log of total assets; and C3 is the proportion of shares held by the three largest shareholders. *, **, and *** indicate 90 percent, 95 percent, and 99 percent confidence level, respectively. The adjusted-R2 coefficient is informative about the fitting of the model, and the F test about the joint significance of the explanatory variables.

-16-
(1) (2) (3) (4) (5) (6) V. dependiente Q Q Q ROA ROA ROA
BOARDSt-1 0.190* 0.212* 0.201* 0.073** 0.069** 0.080** (0.111) (0.113) (0.114) (0.034) (0.034) (0.034)
BOARDS2t-1 –0.021* –0.022* –0.022* –0.007* –0.007* –0.007*
(0.012) (0.012) (0.012) (0.003) (0.003) (0.003) ROA 1.797*** (0.299) LEV 0.096** 0.002 (0.042) (0.012) ASSET –0.060 0.023 (0.059) (0.017) C3 –0.791** 0.823 (0.327) (0.567) OWN –0.295 0.135 (0.972) (0. 282) OWN2 0.101 0.002 (0.135) (0.003) SIZE 0.009 0.035 (0.106) (0.030) SIZE2 –0.001 –0.001 (0.003) (0.001) INDEP –0.030 0.141 (0.426) (0.129) Time effect No Sí Sí No Sí Sí Industry effect No Sí Sí No Sí Sí
No. obs. 205 205 205 205 205 205 Adj.-R2 0.016 0.044 0.104 0.020 0.041 0.114 F-test 3.49*** 8.24*** 9.14*** 1.47** 1.42** 1.46**
These results corroborate our previous conclusions. The number of BDs to
which an independent director belonged the previous year has a nonlinear relation
with both the firm’s value and performance of the corresponding year. This
nonlinear relation combines an initially positive effect that turns negative after a
certain threshold. The lagged variables increase slightly the optimal point, which
now is located between four and five BDs.
Second, we use our third set of sensitivity analyses to tackle the endogeneity
problem by conducting an estimation with simultaneous equations (Bhagat and
Black, 2001; Thomsen, et al., 2006; Young, et al., 2008). We estimate a system of
two equations through the three-stages least squares method. The first equation is
model (1), and the second equation attempts to explain the determinants of
multiple directorships. This procedure provides efficient estimates when error terms

-17-
can be correlated across equations. Thus, the estimation of the model is like a
problem of seemingly unrelated regressions with the difference that some
explanatory variables can be endogeneous.
According to the results reported in Table 7, the number of BDs to which an
independent director belongs has an inverted U-shaped influence on the value of
the firm (column 1a) and on the performance of the firm (column 2a). This result is
in line with the findings previously reported. The performance of the firm and some
characteristics of the BD such as its size are among the determinants of the
number of BDs. Masulis and Mobbs (2011), Ferris et al. (2003) and Fich and
Shivdasani (2006) provide similar evidence in the framework of the factors that
explains the appointment of independent directors.

-18-
Table 7: Estimation of model (1) with simultaneous equations This table presents the estimated coefficients and (standard errors) of the estimation of model [1] with simultaneous equations. Q is the market-to-book ratio; ROA is the return on assets; BOARDSt-1 is the average number of boards of other firms to which an independent director belonged the previous year; SIZE is the number of directors in the board; INDEP is the proportion of independent directors; OWN is the proportion of shares held by directors; LEV is the debt-to-equity ratio; ASSET is the log of total assets; and C3 is the proportion of shares held by the three largest shareholders. *, **, and *** indicate 90 percent, 95 percent, and 99 percent confidence level, respectively. The adjusted-R2 coefficient is informative about the fitting of the model, and the F test about the joint significance of the explanatory variables.
(1a) (1b) (2a) (2b) V. dependiente Q BOARDS ROA BOARDS
BOARDS 1.063* 0.324** (0.558) (0.137) BOARDS2 –0.258*** –0.044* (0.092) (0.024) ROA 1.829*** 1.589*** 18.87*** (0.219) (0.502) (6.524) LEV 0.071*** 0.006 (0.016) (0.005) ASSET 0.233*** –0.006 0.017 –0.226 (0.070) (0.051) (0.024) (0.201) C3 –0.002 –0.021 (0.003) (0.062) OWN –0.832 0.030 –0.020 (0.774) (0.274) (0.031) OWN2 0.001 0.001 –0.004 (0.012) (0.004) (0.039) SIZE 0.032 0.047* 0.035 –0.432 (0.085) (0.028) (0.029) (0.308) SIZE2 0.008 –0.012 0.017 (0.307) (0.010) (0.013) INDEP –0.064 0.146*** –0.070 0.101 (0.421) (0.427) (0.083) (1.136) Q 0.687*** 1.151* (0.233) (0.618) Time effect Sí Sí Sí Sí Industry effect Sí Sí Sí Sí
No. obs 236 236 236 236 Adj-R2 0.211 0.391 0.428 0.556
5. CONCLUSIONS
We provide evidence for the Spanish capital markets about how the number
of BDs to which independent directors belong influences firm’s value and
performance. The theoretical foundations are related to two possible explanations:
a reputation effect and a dedication effect. Previous literature provides evidence of

-19-
both effects: Some authors find a negative effect on firm performance because
directors that sit on too many BDs are so busy and dispersed that they cannot
adequately perform their duties, and other authors find a positive effect on firm
performance (specially the future performance) of having directors who belong to
several BDs due to increased reputational concerns and outside connections.
Our research allows us to reconcile these conflicting results as we find a
nonlinear (inverted U-shaped) relation between the average number of BDs on
which independent directors sit and both the value and the performance of the
firms listed in the Spanish continuous market between 2007 and 2009. Initially, a
reputation effect dominates because sitting on more BDs can mean an increase in
a director’s skills and more incentives for him or her to perform his or her duties,
which can have a positive impact on the firm’s performance. Nevertheless, after a
certain threshold (our results suggest that the threshold is around four BDs of listed
companies), a dedication effect prevails as the director cannot fulfill adequately his
or her duties due to too many obligations.
Several directions are available for future research. First, it would be
interesting to expand the scope of the sample. We focus on listed firms due to the
availability of public information and because they are the firms whose directors
are required the most dedication. In addition, the directors of listed firms are
usually directors of nonquoted firms simultaneously. Second, future research may
possibly control for other factors related to the directors’ level of dedication such as
taking part in committees, being chairperson or vice-chairperson of the BD, and so
on. Third, a more detailed description of the ties among the firms to whose BDs
that the director belongs (industry, cross-shareholdings, etc.) could also shed new
light.
Our results are interesting for a wide audience. First, among policymakers
there is a concern about the pertinence of setting a legal limit to the number of BDs
to which a nonexecutive director can belong (CNMV, 2006; European Commission,
2011). Second, managers and shareholders should be interested in our results
since 44 percent of the Spanish listed firms have set a limit on the number of BDs

-20-
on which their directors can sit (Fundación de Estudios Financieros, 2011). Third,
our results are be interesting to the academia because we provide additional and
complementary evidence to previous research on this topic.
Among the implications of our paper we note that the supervisory and
advisory ability of directors is not unlimited. Although in the first stages more firms
can benefit from this ability, a concern exists about the extent to which independent
directors can work for several firms simultaneously. Obviously, this idea must be
understood in connection with the limitations of our paper previously presented.
REFERENCIAS BIBLIOGRÁFICAS
Acero, I. and Alcalde, N. (2012): "Influencia de las funciones de control y asesoramiento sobre la configuración del consejo de administración". Revista Española de Financiación y Contabilidad 41(153), pp. 9-38.
Adams, R.B. and Ferreira, D. (2007): "A theory of friendly boards". Journal of Finance 62(1), pp. 217-250.
Adams, R.B., Hermalin, B.E. and Weisbach, M.S. (2010): "The role of boards of directors in corporate governance: A conceptual framework and survey". Journal of Economic Literature 48(1), pp. 58-107.
Anderson, D.W., Melanson, S.J. and Maly, J. (2007): "The evolution of corporate governance: power redistribution brings boards to life". Corporate Governance: An International Review 15(5), pp. 780-797.
Andrés, P. and Vallelado, E. (2008): "Corporate governance in banking: The role of the board of directors". Journal of Banking & Finance 32(12), pp. 2570-2580.
Andrés, P. and Rodríguez Sanz, J.A. (2011): "Corporate boards in high-tech firms". The Spanish Review of Financial Economics 9(2), pp. 69-79.
Barroso, C., Villegas, M.M. and Pérez-Calero, L. (2011): "Board influence on a firm’s internationalization". Corporate Governance: An International Review 19(4), pp. 351-367.
Bhagat, S. and Black, B.S. (2001): "The non-correlation between board independence and long-term firm performance". Journal of Corporation Law 27, pp. 231-274.
Blanco Alcántara, D., López de Foronda Pérez, O. and Romero Merino, E. (2012): "The Convergence between Continental and Anglo-Saxon Models of Governance: The Role of Banks in Spain and the United Kingdom". Transformations in Business & Economics 11(3), pp. 222-237.
Bøhren, Ø. and Strøm, Ø. (2010): "Governance and politics: Regulating independence and diversity in the board room". Journal of Business Finance & Accounting 37(9-10), pp. 1281-1308.
Brick, I.E. and Chidambaran, N.K. (2010): "Board meetings, committee structure, and firm value". Journal of Corporate Finance 16, pp. 533-553.
CNMV (2006): Código Unificado de Buen Gobierno de las Sociedades Cotizadas. Madrid. Coles, J.L., Daniel, N.D. and Naveen, L. (2008): "Boards: does one size fit all?". Journal of Financial
Economics 87, pp. 329-356. Cook, D.O. and Wang, H. (2011): "The informativeness and ability of independent multi-firm
directors". Journal of Corporate Finance 17, pp. 108-121. Core, J.E., Holthausen, R.W. and Larcker, D.F. (1999): "Corporate governance, chief executive
officer compensation, and firm performance". Journal of Financial Economics 51, pp. 371-406.
Crespí, R. and Gispert, C. (2003): "Total Board Compensation, Governance and Performance of Spanish Listed Companies". Labour 17(1), pp. 103-126.

-21-
Chang, X., Dasgupta, S. and Hilary, G. (2009): "The effect of auditor quality on financing decisions". Accounting Review 84(4), pp. 1085-1117.
Cho, M.H. (1998): "Ownership structure, investment, and the corporate value: an empirical analysis". Journal of Financial Economics 47, pp. 103-121.
Choi, J.J., Park, S.W. and Yoo, S.S. (2007): "The value of outside directors: Evidence from corporate governance reform in Korea". Journal of Financial and Quantitative Analysis 42(4), pp. 941-962.
Dalton, D.R. and Dalton, C.M. (2011): "Integration of micro and macro studies in governance research: CEO duality, board composition, and financial performance". Journal of Management 37(2), pp. 404-411.
Demsetz, H. and Lehn, K. (1985): "The structure of corporate ownership: causes and consequences". Journal of Political Economy 93(6), pp. 1155-1177.
Di Pietra, R., Grambovas, C., Raonic, I. and Riccaboni, A. (2008): "The effects of board size and ‘busy’ directors on the market value of Italian companies". Journal of Management and Governance 12(1), pp. 73-91.
Duchin, R., Matsusaka, J.G. and Ozbas, O. (2010): "When are outside directors effective?". Journal of Financial Economics 96, pp. 195-214.
European Commission (2011): Green paper on the EU corporate governance framework. Brussels. European Commission.
Fahlenbrach, R., Low, A. and Stulz, R.M. (2010): "Why do firms appoint CEOs as outside directors?". Journal of Financial Economics 97, pp. 12-32.
Faleye, O., Hoitash, R. and Hoitash, U. (2011): "The costs of intense board monitoring". Journal of Financial Economics 101, pp. 160-181.
Fama, E.F. (1980): "Agency Problems and the Theory of the Firm". Journal of Political Economy 88(2), pp. 288-307.
Fama, E.F. and Jensen, M.C. (1983): "The separation of ownership and control". Journal of Law & Economics 26, pp. 301-325.
Fernández, A.I., Gómez Ansón, S. and Fernández-Méndez, C. (1998): "El papel supervisor del consejo de administración sobre la actuación gerencial. Evidencia para el caso español". Investigaciones Económicas 22(3), pp. 501-516.
Ferris, S.P., Jagannathan, M. and Pritchard, A.C. (2003): "Too busy to mind the business? Monitoring by directors with multiple board appointments". Journal of Finance 58(3), pp. 1087-1111.
Fich, E.M. and Shivdasani, A. (2006): "Are busy boards effective monitors?". Journal of Finance 61(2), pp. 689-724.
Fundación de Estudios Financieros (2009): "Observatorio de Gobierno Corporativo 2008". Papeles de la Fundación 29.
Fundación de Estudios Financieros (2010): "Observatorio de Gobierno Corporativo 2009". Papeles de la Fundación 32.
Fundación de Estudios Financieros (2011): "Observatorio de Gobierno Corporativo 2010". Papeles de la Fundación 40.
García Meca, E. and Sánchez Ballesta, J.P. (2009): "Corporate governance and earnings management: A meta-analysis". Corporate Governance: An International Review 17(5), pp. 594-610.
García Ramos, R. and García Olalla, M. (2011): "Estructura del consejo de administración en la empresa familiar versus no familiar: Evidencia empírica para España". Revista Española de Financiación y Contabilidad 40(149), pp. 35-64.
Guest, P.M. (2008): "The determinants of board size and composition: Evidence from the UK". Journal of Corporate Finance 14, pp. 51-72.
Guieu, G. and Meschi, P.X. (2008): "Conseils d’administration et réseaux d’administrateurs en Europe". Revue Française de Gestion 185, pp. 21-45.
Hair, J.F., Anderson, R.E., Tatham, R.L. and Black, W.C. (2008): Análisis multivariante. Madrid. Prentice Hall Iberia.
Haniffa, R. and Hudaib, M. (2006): "Corporate governance structure and performance of Malaysian listed companies". Journal of Business Finance & Accounting 33(7-8), pp. 1034-1062.

-22-
Harris, I.C. and Shimizu, K. (2004): "Too Busy To Serve? An Examination of the Influence of Overboarded Directors". Journal of Management Studies 41(5), pp. 775-798.
Hermalin, B.E. and Weisbach, M.S. (1991): "The effects of board composition and direct incentives on firm performance". Financial Management 20, pp. 101-112.
Hwang, B.H. and Kim, S. (2009): "It pays to have friends". Journal of Financial Economics 93, pp. 138-158.
Informe Aldama (2003): "Informe de la comisión especial para el fomento de la transparencia y la seguridad en los mercados y en las sociedades cotizadas". 7870 CNMV.
Jackling, B. and Johl, S. (2009): "Board Structure and Firm Performance: Evidence from India's Top Companies". Corporate Governance: An International Review 17(4), pp. 492-509.
Jensen, M.C. (1993): "The modern industrial revolution, exit, and the failure of internal control systems". Journal of Finance 48(3), pp. 831-880.
Jonnergård, K. and Stafsudd, A. (2011): "The making of active boards in Swedish public companies". Journal of Management and Governance 15(1), pp. 123-155.
Kiel, G.C. and Nicholson, G.J. (2006): "Multiple Directorships and Corporate Performance in Australian Listed Companies". Corporate Governance: An International Review 14(6), pp. 530-546.
Kim, B., Burns, M.L. and Prescott, J.E. (2009): "The Strategic Role of the Board: The Impact of Board Structure on Top Management Team Strategic Action Capability". Corporate Governance: An International Review 17(6), pp. 728-743.
Kim, Y. and Cannella, A.A. (2008): "Toward a social capital theory of director selection". Corporate Governance: An International Review 16(4), pp. 282-293.
Kutner, M.H., Neter, J., Nachtsheim, C.J. and Li, W. (2005): Applied Linear Statistical Models. New York. McGraw Hill.
Masulis, R.W. and Mobbs, S. (2011): "Are all inside directors the same? Evidence from the external directorship market". Journal of Finance 66(3), pp. 823-872.
Mínguez, A. and Martín Ugedo, J.F. (2005): "¿Afectan las características del consejo de administración a su labor supervisora? Nueva evidencia para el mercado español". Revista Europea de Dirección y Economía de la Empresa 14(2), pp. 55-74.
Monterrey, J. and Sánchez, A. (2008): "Gobierno corporativo, conflictos de agencia y elección de auditor". Revista Española de Financiación y Contabilidad 37(137), pp. 113-156.
Morck, R., Shleifer, A. and Vishny, R.W. (1988): "Management ownership and market valuation : An empirical analysis". Journal of Financial Economics 20(1-2), pp. 293-315.
Olivencia, M. (2004): "El gobierno de las sociedades cotizadas y el código de buen gobierno". El gobierno de la empresa. En busca de la transparencia y la confianza Bueno Campos, E. (Ed.). Madrid. Pirámide, pp. 21-39.
Perry, T.O.D. and Peyer, U.R.S. (2005): "Board Seat Accumulation by Executives: A Shareholder's Perspective". The Journal of Finance 60(4), pp. 2083-2123.
Petersen, M.A. (2009): "Estimating Standard Errors in Finance Panel Data Sets: Comparing Approaches". The Review of Financial Studies 22(1), pp. 435-480.
Pugliese, A., Bezemer, P.J., Zattoni, A., Huse, M., van den Bosch, F.A.J. and Volberda, H.W. (2009): "Boards of directors’ contribution to strategy: a literature review and research agenda". Corporate Governance: An International Review 17(3), pp. 292-306.
Sarkar, J. and Sarkar, S. (2009): "Multiple board appointments and firm performance in emerging economies: Evidence from India". Pacific-Basin Finance Journal 17(2), pp. 271-293.
Sharma, V. (2011): "Independent directors and the propensity to pay dividends". Journal of Corporate Finance 17, pp. 1001-1015.
Shivdasani, A. and Yermack, D. (1999): "CEO involvement in the selection of new board members: an empirical analysis". Journal of Finance 54(5), pp. 1829-1853.
Teen, M.Y. and Teo, D. (2009): "A Comparison of Boards of Big Firms across Four Countries". Singapore Corporate Awards, Watson Wyatt.
Thomsen, S., Pedersen, T. and Kvist, H.K. (2006): "Blockholder ownership: Effects on firm value in market and control based governance systems". Journal of Corporate Finance 12, pp. 246-269.
van Ees, H., Gabrielsson, J. and Huse, M. (2009): "Toward a behavioral theory of boards and corporate governance". Corporate Governance: An International Review 17(3), pp. 307-319.

-23-
Voordeckers, W., Steijvers, T. and Mercken, R. (2009): "Multiple directorships in unlisted SMEs". XXII Conference on Research in Entrepreneurship and Small Business, Covilha (Portugal).
Yermack, D. (1996): "Higher market valuation of companies with a small board of directors". Journal of Financial Economics 40, pp. 185-211.
Young, C.-S., Tsai, L.-C. and Hsieh, P.-G. (2008): "Voluntary appointment of independent directors in Taiwan: Motives and consequences". Journal of Business Finance & Accounting 35(9-10), pp. 1103-1137.