An Exploration of Boards of Directors’ Quality: The Development of an Index for Directors...
23
1 An Exploration of Boards of Directors’ Quality: The Development of an Index for Directors Attributes and the Relation with Firm Value and Performance José Elias Feres de Almeida Federal University of Espírito Santo (UFES) [email protected] This version : 12 th October, 2009 Abstract In an environment with poor quality of Corporate Governance Mechanisms, the quality of directors attributes might exert an important role to improve firm’s value and performance. In this paper, an index was developed to explore board quality based on Brazilian corporate governance code and codes comparison (GREGORY, 2000) to measure directors attributes because the quality of directors’ characteristics is still unclear. The sample consist in 24 Brazilian firms with ADR level 2 and 3 traded at NYSE in the period over 1999-2006 totalizing 119 observations. After that, were analyzed around 1.100 directors curriculums available on report 20-F to develop the index of directors’ attributes quality based on codes recommendations. The results of the index of quality show that board of directors with high types of attributes can improve value and some attributes controlled separated that make up the Board of Directors Quality Index (BODQI) can improve value as well. The main results indicate that: high types of professionals, accountants seated in boards, directors with high level of education (master and doctor degrees) and that participate of executive programs contributes to improve firm value. Keywords: Board of Directors’ Quality; Corporate Governance; Firm Value
Transcript of An Exploration of Boards of Directors’ Quality: The Development of an Index for Directors...
1
An Exploration of Boards of Directors’ Quality: The Development of an Index for
Directors Attributes and the Relation with Firm Value and Performance
José Elias Feres de Almeida
Federal University of Espírito Santo (UFES)
This version : 12th October, 2009
Abstract
In an environment with poor quality of Corporate Governance Mechanisms, the quality of
directors attributes might exert an important role to improve firm’s value and performance. In
this paper, an index was developed to explore board quality based on Brazilian corporate
governance code and codes comparison (GREGORY, 2000) to measure directors attributes
because the quality of directors’ characteristics is still unclear. The sample consist in 24
Brazilian firms with ADR level 2 and 3 traded at NYSE in the period over 1999-2006
totalizing 119 observations. After that, were analyzed around 1.100 directors curriculums
available on report 20-F to develop the index of directors’ attributes quality based on codes
recommendations. The results of the index of quality show that board of directors with high
types of attributes can improve value and some attributes controlled separated that make up
the Board of Directors Quality Index (BODQI) can improve value as well. The main results
indicate that: high types of professionals, accountants seated in boards, directors with high
level of education (master and doctor degrees) and that participate of executive programs
contributes to improve firm value.
Keywords: Board of Directors’ Quality; Corporate Governance; Firm Value

2
1 Introduction and Theoretical Motivations
Boards of directors (hereafter, BOD) are one part of internal mechanisms of corporate
governance that is responsible to plan firms long-term strategies to reduce possibilities to the
firms takes wrong ways in the long horizon and to avoid shareholder expropriation by
executives. Considering the conventional view of agency problems BOD as well as auditors
are intermediaries to avoid shareholder expropriation by managers or to act in their interests
(BECHT; BOLTON; RÖELL, 2002).
The optimal performance of firms to improve value depends on the capacity of the
BOD to align interests among minorities and majorities shareholders and monitoring
executives’ decisions (JENSEN; MECKLING, 1976). Complementarily, the performance of
BOD is affected by a composition of mixed low or high attributes of each director.
This paper seeks on a different way from other traditional studies that commonly test
corporate governance mechanisms one by one and after aggregate all mechanisms in an index
of corporate governance quality that limit their explanation creating a “missing link” among
firm value and performance (BHAGAT; BOLTON; ROMANO, 2007). The focus is mainly
on qualitative characteristics of BOD and directors attributes1 composition such as age,
recommended size of BOD, education degrees, post-graduations, directors’ actualization
(participation in executive programs), to attempt to develop an index of board of director’s
quality.
The attributes of each director build the human capital of boards in firms. A
combination of high types of directors can improve their quality in monitoring and planning
as suggested by Zajac and Westphal (1996, p. 508) “directors seek to develop and maintain a
favorable reputation as active representatives of shareholder welfare, thus enhancing their
human capital on the boards on which they sit and increasing their attractiveness as candidates
for board appointments at other firms”. Thus, the high attributes of directors can contributes
to firm in the product market competition and for the person in the job market competition.
Furthermore, the optimal arrangement of these characteristics can improve firm value and
performance.
Leblanc (2003) argues that it is difficult to learn about personal attributes,
notwithstanding, “behavioral characteristics of individual directors are crucial, if not
determinant, of overall board effectiveness” (LEBLANC, 2003, p. 205). As a result, it was
1 Sometimes I use BOD characteristics involving directors’ attributes to avoid repetition of terms. However, characteristics of BOD are internal mechanisms of corporate governance and attributes of directors are qualitative features of each director, both suggested by international codes of corporate governance.
3
considered that quality of BOD measured by the sum of some characteristics recommended
by corporate governance codes and directors’ attributes will allow us to develop an index that
can contribute to maximize returns to shareholders and consequently the firms’ values.
An index could support many researchers and economic agents to evaluate the quality
of board of directors despite their subjectivity feature. This research use few characteristics
tested in many studies and other suggested by us based on different corporate governance
codes. The results for each characteristic will be presented, and all attributes together in a
unique index as well. This index will be tested with firms’ value and performance.
There are no empirical evidences2 in the literature about indices that tries to measure
quality of BOD estimated by directors attributes developed using as guide different countries
codes of corporate governance. In this sense, a comparison among principal codes was done
and organized by Gregory (2000) and I selected some characteristics of BOD and attributes of
director suggested in most part of the time in codes such as experience, skills, capacity to
understand financial statements, age, diversification of formation (different bachelor degrees),
participation in executive education programs, post-graduations, and so on.
Feltovich, Harbaugh and To (2002) and Spencer (2002) show that in signaling models
despite of costs of education, it increase ability with unobserved attribute that contributes
positively to productivity suggesting that continuous education and training in the level of
human capital can contributes to high performances of directors reducing adverse selection of
directors to sit in BODs. Then, high quality of BOD can be related to less adverse selection
and less consequences to investors and shareholders reducing agency costs.
In this way, directors have incentives to develop a reputation to be recognized by the
market and job competition market, and reputation is a construct of the expertise developed
on his/her professional trajectory signaling to the market that they are experts in reduce
conflicts, monitoring firms planning and executives activities. Thus, the quality of the
directors attributes and their expertise signaling to the market their capacity to work as
expected to protect shareholders interests considering reputation as a dynamic concept that
overrides the past seats of the directors or his posture in the market if he (her) never was
seated in a BOD (SHAPIRO, 1983; FAMA; JENSEN, 1983; CARCELO et al, 2002).
As a result, there are two objectives as follow: 1) to verify whether directors’ attributes
recommended by Brazilian corporate governance code and other codes contribute to improve
firms value and performance and; 2) to develop an index of quality of board of directors and
2 To my knowledge, with similar attributes, until 2008.

4
analyze its relation with firm value and performance. Four measures of value was used to
capture the impact of high types of directors to firm value, such as, value as firm market
value, two different estimations of Tobin’s Q and market-to-book and for performance return
on equity (ROE).
In this research, were analyzed in 24 Brazilian boards of directors 1.108 seats of firms
with American Depositary Receipts (ADR) traded at New York Stock Exchange (NYSE) over
1999-2006 period totalizing 119 observations. The participation in two institutional
environments with different legal systems intuitively requires a more qualified BOD,
motivating this research to study Brazilian firms.
Brazil is considered an environment with weak enforcement and poor institutions of
governance, on the other hand, when these firms goes to NYSE its necessary many
adjustment among corporate governance structure (internal and external), production, good
teams of executive officers, employees and directors to perform based on shareholder
interests. Consequently, the political costs of these firms growth together with the reputation
since these firms are monitored by more specialized agents of the market forcing them to
improve their corporate governance mechanisms (WATTS; ZIMMERMAN, 1990).
Different econometric procedures were applied: estimators with panel data with fixed
effects, random effects and ordinary least squares (OLS robust standard errors) regressions,
although, the Breusch-Pagan and Hausman test indicates that the best estimator is OLS. In
general, the main results are: i) The model that tests separated Directors’ attributes
individually shows that directors with high attributes as higher education degrees, types of
expertise and BOD that follows recommendations from corporate governance codes improve
value in almost of all measures of value, and for performance only the attribute of directors
with master and doctor degrees; ii) The second model that verifies the Board of Directors
Quality Index (BODQI) show that the combination of high types of directors seated in BODs
have positive and statistical relation with all measures of value used, but no statistically
significant relation with performance.
This research has five sections. Section 2 presents related research and the
development of hypotheses. Section 3 discusses about corporate governance indices
developed around the world. Section 4 shows the development of Board of Directors Quality
Index (BODQI). Section 5 shows the methodology, sample construction and the analyses of
regressions results. Finally, section 6 concludes.
5
2 Related Researches and Hypotheses Development
Many questions have been inquired about corporate governance mechanisms and
board of directors, and their relations and their impact on firm’s value and performance, but
there is still a long way for new evidences in empirical researches. Murphy and McIntyre
(2007) asked “What characteristics make some boards more effective than other boards, and
what is an appropriate measure of board effectiveness?” Complementarily, Hermalin and
Weisbach (2003) asked “how do board characteristics affect the observable actions of the
board?” The answers for these questions can contribute to the literature, regulators and firms
to do a better arrangement in their boards.
These characteristics are unobservable attributes that each director developed
throughout his/her career building their human capital because high types of qualified director
can do enhanced BOD function as decision control (FAMA; JENSEN, 1983; SPENCE, 2002;
McINTYRE; MURPHY; MITCHELL, 2007).
In the literature there is a gap that tries to link group characteristics into organizational
outcomes, and many times it is simply assumed (YERMACK, 1996). Therefore, I use some
recommendation of Brazilian Corporate Governance Code and others (GREGORY, 2000) and
link with signaling and agency theories, because some characteristics developed with high
quality generate reputation in the market providing us theoretical foundations to create the
proxies in this study.
Looking for Brazilian BODs they are characterized by Silveira (2004) as follow: 1) is
unclear the division between directors and executive officers principally in familiar firms; 2)
Informal structures with absent of committees; 3) Most of directors are outsiders but not
independents; 4) scarcity of qualified directors; and 5) compensation is considered an
irrelevant factor. In this sense, using firms listed in two different institutional environments
the expectation is that high types of directors (combinations of qualifications) can appear in
the sample.
The sample consists of Brazilian firms with ADR traded on NYSE which is
considered the most developed capital market in the world. These firms have a higher political
cost to continue creating value and increase performance considering the monitoring from
internals and externals (WATTS; ZIMMERMAN, 1990), these costs extend to the board
reputation (ZAJAC; WESTPHAL, 1996). Thus, the first hypothesis is: H1: Firms with board
6
composition formed by high types of directors’ attributes affect value and performance
positively.
The attributes explanation will be discussed in section 4, but was mentioned earlier the
characteristics that will be observed. This hypothesis (H1) will allow us to validate the
characteristics individually to develop the board of director’s quality index. Thus, the
functions for firm value and performance is:
Firm value ƒ (Directors Characteristics individually, internal mechanisms, control variables)
Firm Performance ƒ (Directors Characteristics individually, internal mechanisms, control
variables)
To observe the boards and its effectiveness is necessary to join theories to link their
skills to the firm’s outcomes. Because of this gap among theory and variables, results of many
researches can be unclear. In fact many other indices have the same problem considering
many mechanisms of corporate governance together (BHAGAT; BOLTON; ROMANO,
2007). The expectation in this index focuses only in one mechanism of corporate governance
and considers only some characteristics and directors attributes, in this sense, results are less
affected by this gap. As a result, the second hypothesis and functions are: H2: Board of
Director Quality Index can capture directors’ characteristics and is positively related to
Firms value and performance positively.
Firm value ƒ (BOD Characteristics, internal mechanisms, control variables)
Firm Performance ƒ (BOD Characteristics, internal mechanisms, control variables)
Empirical evidences testing recommendations from corporate governance codes are in
a way with positive methodology that test normative inference created in a logical reasoning
using econometrics techniques. If the propositions emanated by regulators or institutions in
codes are not convergent with reality (empirical results) the proxies and index will be
unsuccessful to explain the relation among BOD characteristics and firm value and
performance.
3 Corporate Governance Indices
Many indices that measure corporate governance quality have been developed and
have statistical relation to firms’ performance and value. But some results are controversial
because the lack of theoretical link with indices interpretation and, as well as, their modest
explanatory power. This section reviews some studies that developed indices of corporate
7
governance because Hagan, Bolton and Romano (2007)3 revisited almost all studies with
indices developed in corporate governance literature.
Black (2001) developed an index that when firm have higher score as well weak
corporate governance structure affect negatively the log of firm value. He used a small sample
with the 21 greater Russian firms, because him consider the fragile institutions and
enforcement, private benefits and insider information giving the most weight to disclosure
and transparency. In this study is highlighted that firm with higher quality of corporate
governance structure have ADR traded on the NYSE and increases value too.Klapper and
Love (2002) use a ranking developed by Credit Lyonnais Securities Asia (CLSA) that cover
seven broad categories: management discipline, transparency, independence, accountability,
responsibility, fairness, and social awareness. But, they use the sum of first six categories and
control by firm-level governance, other firm-level characteristics and country-level with legal
environment. They conclude that in environment with ineffective laws and enforcement firms
establish good corporate governance and provide further investor protection.
Many researchers applied their studies in most developed capital markets (United
States and United Kingdom) in these markets the role of corporate governance is for
complementation, on the other hand, in countries defined as emerging markets corporate
governance have an important role with substitution effects.
Beiner et al (2004) use the agency framework to test in Swiss firms a broad corporate
governance index with control variables. They found positive relationship between corporate
governance and Tobin’s Q covering in its index 38 different governance attributes that are not
legally required until the research period. The points observed were corporate governance
commitment, shareholders’ rights, transparency, management and supervisory board matters,
and auditing. In this same direction using a sample of Korean firms Black, Jang and Kim
(2006) found positive relation among the Korean Corporate Governance Index (KCGI) and
market value of firms.
In Brazil and Chile, Leal and Carvalhal-da-Silva (2005) elaborated a corporate
governance index (CGI) with 24 questions concerning four dimensions: disclosure, board
composition and functioning, Ethics and Conflicts of Interest and Shareholder rights. The CGI
is positive related with corporate value.
Board of directors are integrated in many indices of corporate governance as an
internal mechanism that impact value positively when there is quality in governance 3 I suggest reading the Bhagat, Bolton and Romano (2007) paper for further information and for a complete survey about indices.
8
(BEINER et al, 2004; BLACK; JANG; KIM, 2006) or impact value negatively when the
scores are composed by the sum of fragile mechanisms (BLACK, 2001), but the scores of the
BOD rarely are tested separated and are the focus in these studies.
Bhagat, Bolton and Romano (2007) review many studies that developed corporate
governance indices and concluded that there is no consistent relation between governance
indices and measures of corporate performance. Additionally, infer that governance indices
are highly imperfect instruments because it captures different dimensions of corporate
governance and become complicated to separate the impact of each element added inside the
index and corporate value.
As discussed above the most of characteristics of the BOD normally analyzed are
internal mechanisms of corporate governance as independence (composition inside versus
outsiders), chief executive officer is the chairman of the BOD, meeting frequency and
interlocking, on the other hand, tenure on the team, age and size are qualitative characteristic,
but results in many studies are controversial because BOD affect performance/value and
performance/value affects BOD composition (HERMANLIN;WEISBACK, 2003; MURPHY;
McINTYRE, 2007).
Considering all empirical evidences about the impact of corporate governance indices
around the world in firms’ value and performance, and despite the possible gap of theoretical
foundations, these indices can be seen as signaling of high types of corporate governance
quality or low types of quality supporting different dimensions governance structure
(SPENCE, 2002; ZAJAC; WESTPHAL, 1996).
4 Development of Board of Directors Quality Index (BODQI)
The Board of Directors Quality Index (BODQI) was elaborated based on
recommendations of many codes of corporate governance around the world, mainly in Brazil
as described in Gregory (2000) that systematized by topics each mechanism of corporate
governance considered in codes. The main intention is to focus only in Board of Directors
recommendations about mechanisms, skills, expertise, knowledge’s and so on.
The quality of board of directors is complex to state clearly their effects on firm value
and performance. In many studies of corporate governance quality indicates that firm with
good internal or external (or both dimensions) mechanisms have higher value in the market
(SHLEIFER; VISHNY, 1997; FAMA; JENSEN, 1983). In this sense, the role of the quality
of BOD can reduce the possibility of expropriation by executive officers or mitigate earnings
9
management practices when the BOD are formed by outsiders and have independence
(PEASNELL; POPE; YOUNG, 2000; HERMALIN; WEISBACH, 2003; KLEIN, 2006)
Directors are decision makers (LEBLANC, 2003) and the best decision can improve
firm value measured in the stock’s prices and performance measured by accounting ratios
(JENSEN; MECKLING, 1979; FAMA; JENSEN, 1983).
In the corporate governance literature many variables uses diversity (proportion ratios,
as an example, outsider directors divided by board size) in BOD characteristics. In this study,
the diversity (percentage in variables, as will be explained) to categorize parameters to use
binary variables (dummy) to control similar characteristics of firms was used, to finally obtain
score from firms. But, first all categorized attributes will be tested separately.
To develop an index of BOD quality was considered two dimensions together, some
internal mechanisms and the quality of directors attributes to identify high types of directors.
The expected signals of slopes coefficients will be described in tables.
Spencer (2002) and Feltovich, Harbaugh and To (2002) presented signaling models of
individuals with high types of education that contributes to companies growth and to improve
performance, but in some cases these high types do not signaling to the market their
reputation, doing countersignaling phenomena and sometimes the medium types have
signaling more to the market because they need to show their quality or characteristics odd
from others. Because of these models, the intuition is that directors that have higher
education, skills and knowledge can contribute more to firms’ growth opportunities,
performance and value (dependent variables) that will be explained after directors attributes
and control variables.
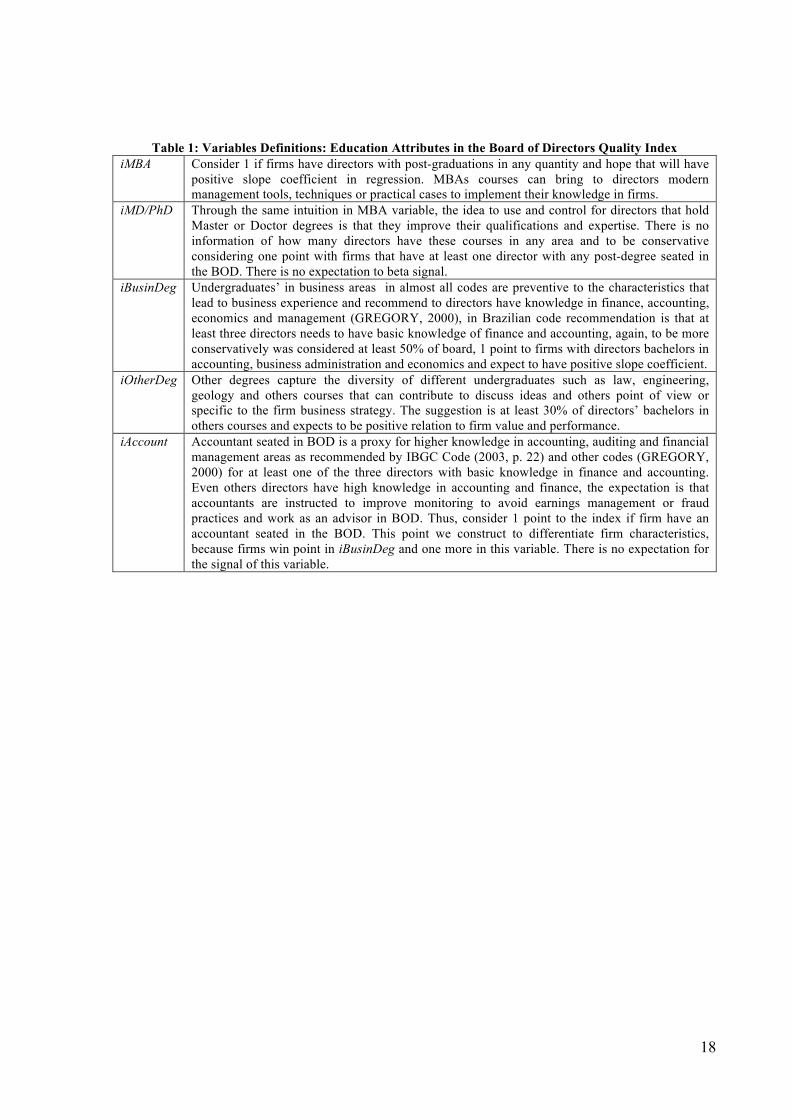
[INSERT TABLE 1 HERE]
The variables presented above suggest that high types of individuals inside the BOD
can contribute better to performance than low types. However, these attributes of directors
need to be aligned with firm corporate governance structure as will show in table 2. Table 4
will present control variables of the models to moderate slope coefficients effects and table 5
contain the explanation of five dependent variables used in this research. Tables will be
present in sequence to preserve tables and number of pages. All tables discussed above will be
present as follow:
10
[INSERT TABLE 2 HERE]
[INSERT TABLE 3 HERE]
[INSERT TABLE 4 HERE]
In this research were applied panel data regressions with fixed effects, random effects
and ordinary least squares estimators for each dependent variable: four measures of value
(firmvl, tobin1, tobin2, market to book) and one of firm performance (OpRoe) to verify the
relation of each variable and after the second regression with BODQI with control variables.
5 Methodology, Sample and Results
Initially, the data contained in 20-f report obtained from NYSE non-US listed
companies it was used, but the lack of some qualitative and standardized data of director’s
curriculums, force us to use together the data provided from Brazilian Securities Exchange
Commission (CVM) to complement or confirm some information as education degrees, ages
or directors occupations. Additionally, some information was taken from Economática’s
database to estimate dependent and control variables.
We analyze in these reports 1.108 short directors’ curriculums to organize the BODQI
as the sum of ten qualitative categories divided by ten. This score change by year, however
with a little variation by firm and year. This sample does not follow the most of assumptions
in social sciences such as random and great number of observations by year; it can affect the
regressions results.
As a result, the sample consist in 24 Brazilian firms with ADR listed at NYSE in the
over period 1999-2006 totalizing 119 observations. The descriptive statistics is presented in
table 5:
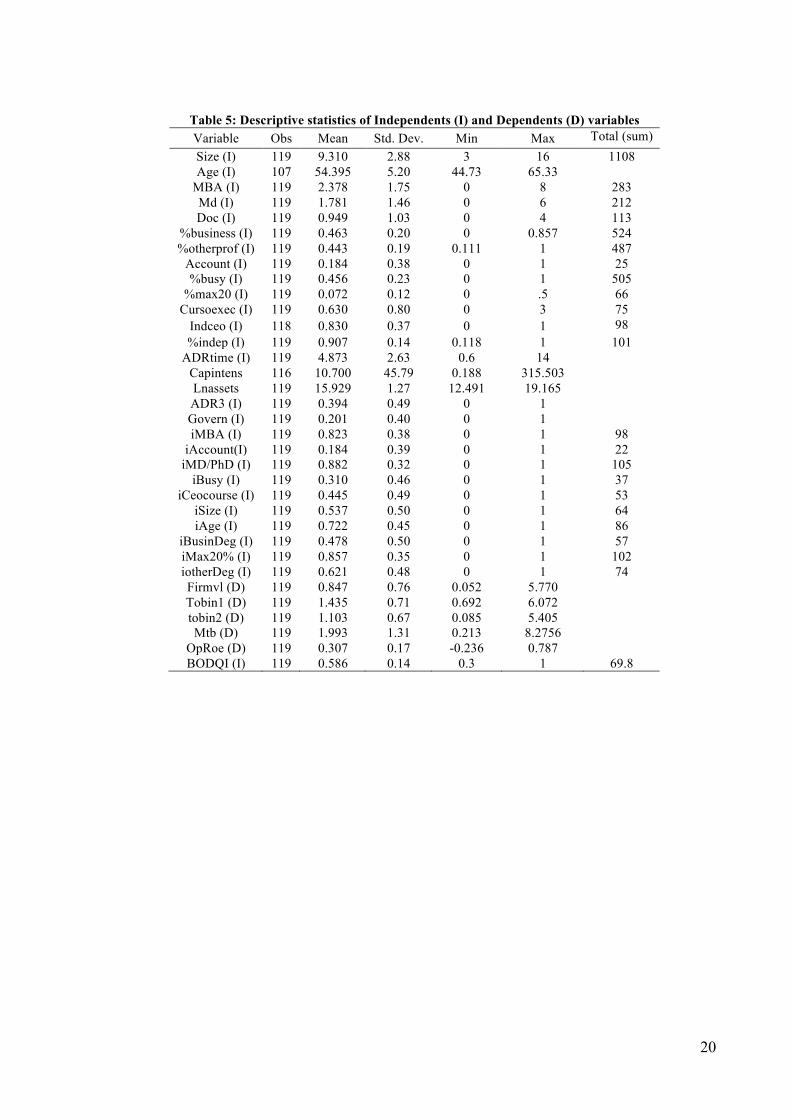
[INSERT TABLE 5 HERE]
There is difference about directors skills across firms when look to the academic
degrees, experience and age. The descriptive statistics show us that a small proportion of all
directors participated in programs of post-graduations such as MBA, Master or Doctor
11
Degrees and, still less management courses for director’s actualization with new management
techniques, taking into account this sample.
Unintentionally underestimate other professions it’s rare to find accountants inside the
board considering the strong recommendations of almost all corporate governance codes that
need professionals to be stay up-to-date and to have deep understanding of financial
statements. In this sample are closer to 2.5% the percentage of accountants seated in these
boards.
The number of directors’ bachelor in business areas and other degrees do not close
exactly for two reasons. First, the report does not disclose information of all directors and,
second, because in some cases directors are too old and/or do not have a bachelor degree. The
BOD need to be diversified to exchange ideas and different points of view, but needs to
consist of professionals with high preparation and background to develop core competencies
and avoid frauds or take decisions in their interests.
Considering the 1.108 seats and the maximum score of 119 points for all firms, and all
qualitative characteristics observed its little to this sample achieving 69.8 points, slightly
surpassed the half score.
The table of correlation matrix was suppressed for the first regression with each
variable of the index because exceed the number of pages and page limit. However, I draw
attention to some points as the correlation 51.45% among iMBA and iMd/PhD. The same
situation occurs with iBusiDeg and iOtherDeg achieving 74.62% of correlation. Other high
correlation is Ceopresi used as control variable with imax20% achieving 52.22%. To reduce
the possibility of regression problems the variance inflation factor (VIF) observes potential
problems of multicolinearity that will be present in regression results.
The final sample totalizes 119 observations from 1999 to 2006. The panel data
regression with fixed effects, random effects and ordinary least squares (OLS robust standard
errors) was applied. The Breusch-Pagan and Hausman statistics shows that random effects are
better specified than fixed effects but OLS are better specified than random effects and the
results will be presented only for OLS robust regression.
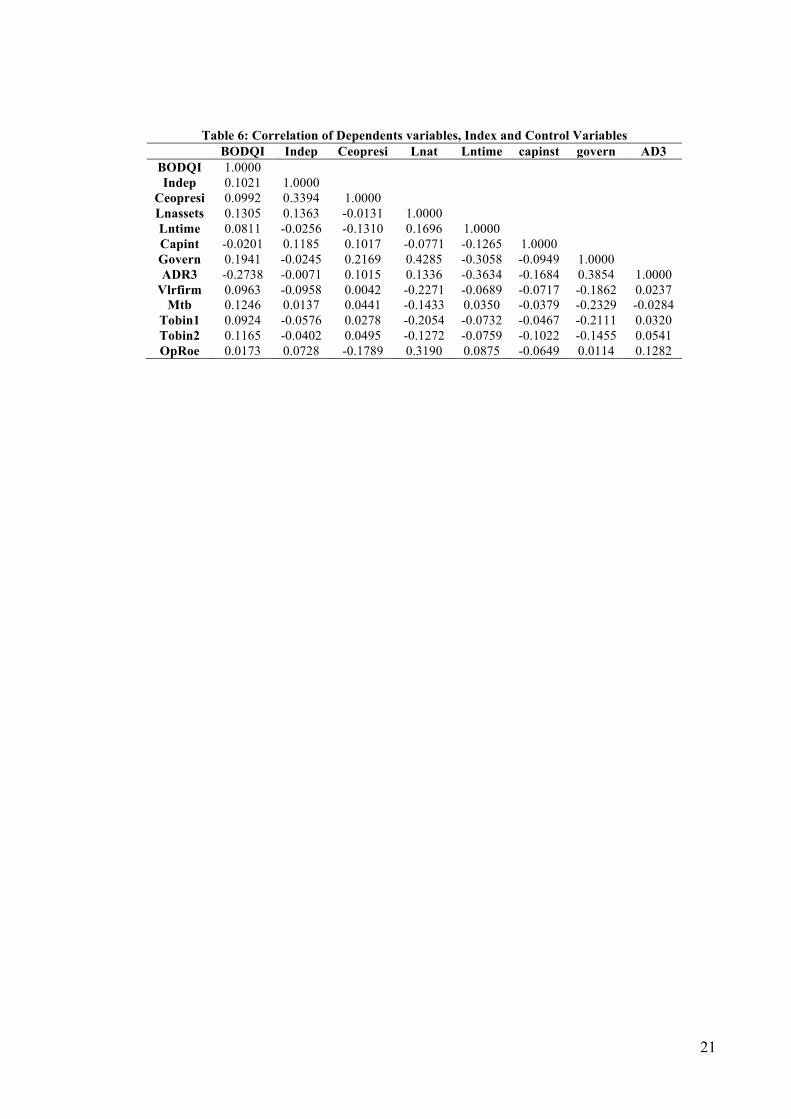
The correlation matrix only for the second regression is:
[INSERT TABLE 6 HERE]
12
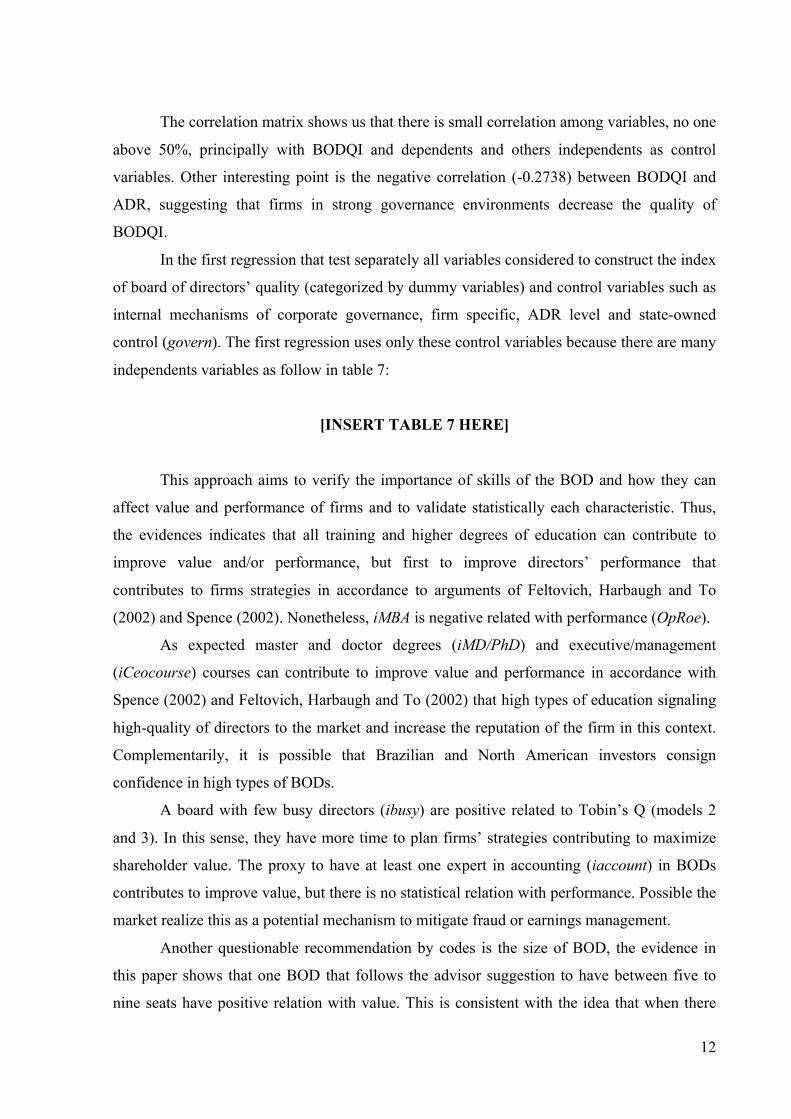
The correlation matrix shows us that there is small correlation among variables, no one
above 50%, principally with BODQI and dependents and others independents as control
variables. Other interesting point is the negative correlation (-0.2738) between BODQI and
ADR, suggesting that firms in strong governance environments decrease the quality of
BODQI.
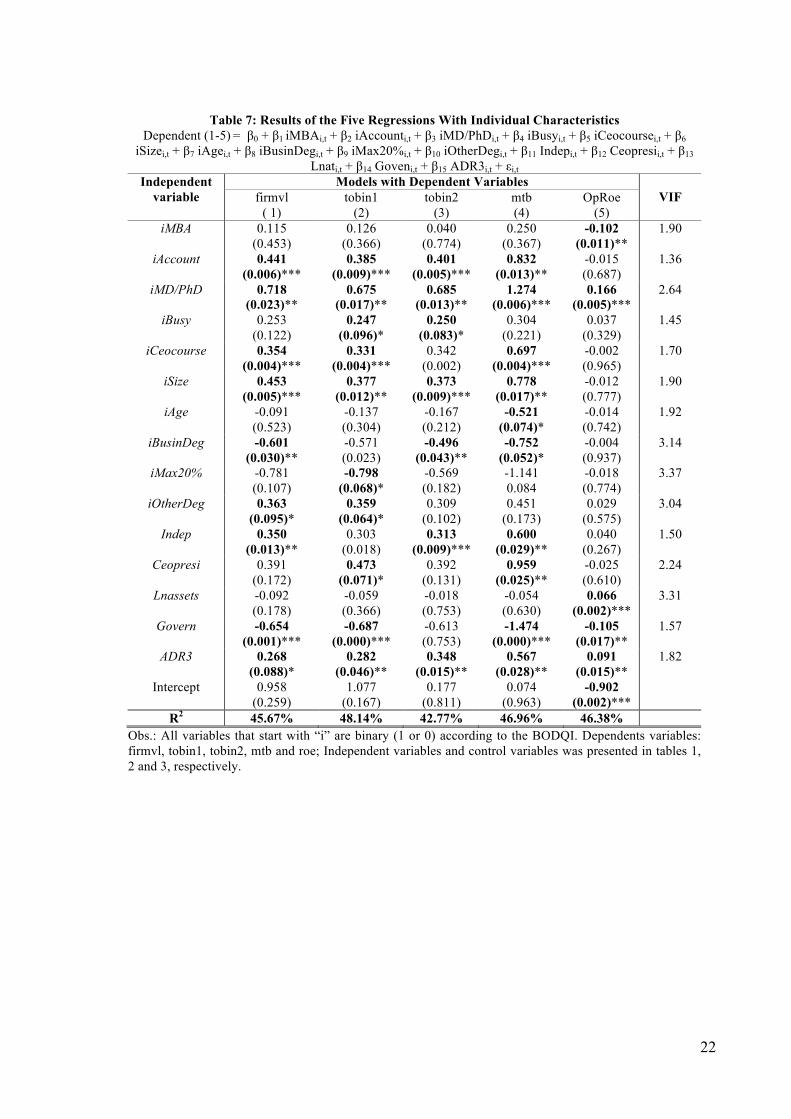
In the first regression that test separately all variables considered to construct the index
of board of directors’ quality (categorized by dummy variables) and control variables such as
internal mechanisms of corporate governance, firm specific, ADR level and state-owned
control (govern). The first regression uses only these control variables because there are many
independents variables as follow in table 7:
[INSERT TABLE 7 HERE]
This approach aims to verify the importance of skills of the BOD and how they can
affect value and performance of firms and to validate statistically each characteristic. Thus,
the evidences indicates that all training and higher degrees of education can contribute to
improve value and/or performance, but first to improve directors’ performance that
contributes to firms strategies in accordance to arguments of Feltovich, Harbaugh and To
(2002) and Spence (2002). Nonetheless, iMBA is negative related with performance (OpRoe).
As expected master and doctor degrees (iMD/PhD) and executive/management
(iCeocourse) courses can contribute to improve value and performance in accordance with
Spence (2002) and Feltovich, Harbaugh and To (2002) that high types of education signaling
high-quality of directors to the market and increase the reputation of the firm in this context.
Complementarily, it is possible that Brazilian and North American investors consign
confidence in high types of BODs.
A board with few busy directors (ibusy) are positive related to Tobin’s Q (models 2
and 3). In this sense, they have more time to plan firms’ strategies contributing to maximize
shareholder value. The proxy to have at least one expert in accounting (iaccount) in BODs
contributes to improve value, but there is no statistical relation with performance. Possible the
market realize this as a potential mechanism to mitigate fraud or earnings management.
Another questionable recommendation by codes is the size of BOD, the evidence in
this paper shows that one BOD that follows the advisor suggestion to have between five to
nine seats have positive relation with value. This is consistent with the idea that when there
13
are fewer people to plan, monitoring executive officers and take decisions, tends to be more
efficient and faster than large BOD avoiding free-rider problem (BECHT; BOLTON;
RÖELL, 2002).
The iAge have negative slope coefficient with all dependent variables but statistically
significant only with market to book suggesting that too much old directors do not contributes
to seize growth opportunities. The characteristic iOtherDeg contributes to increase value but
with small slope coefficient according to the idea that different undergraduates in the BOD
exchange more expertise in specific points.
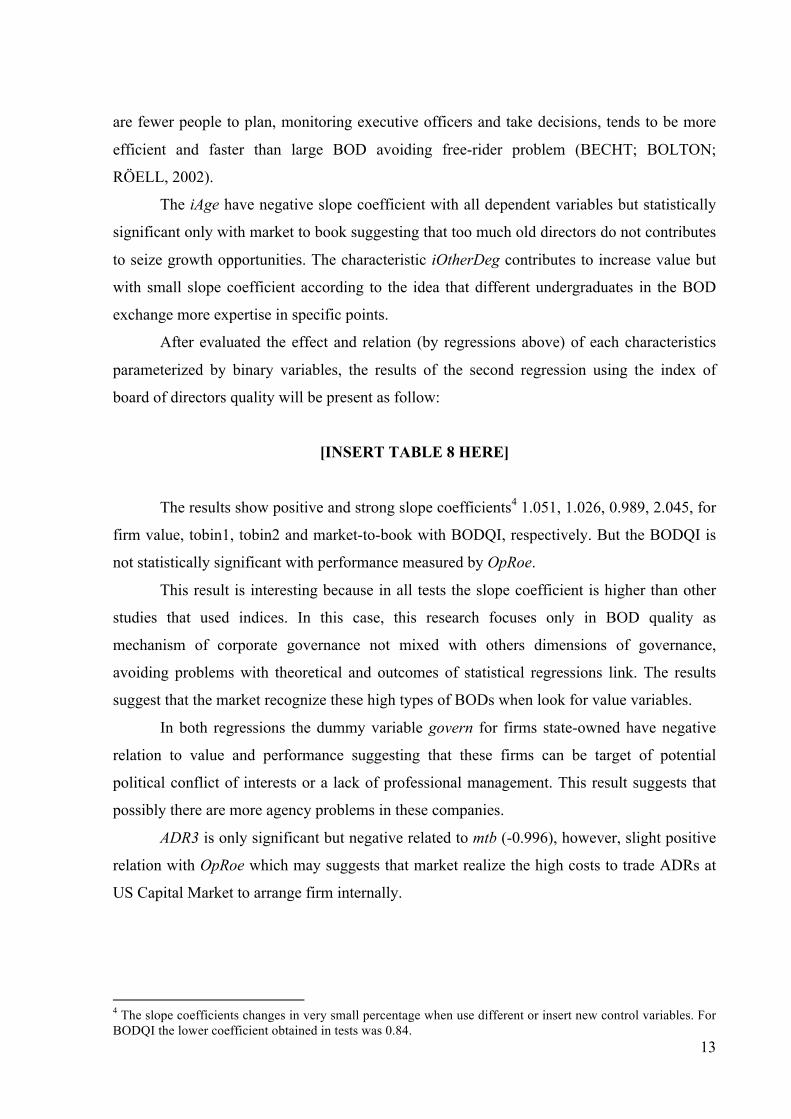
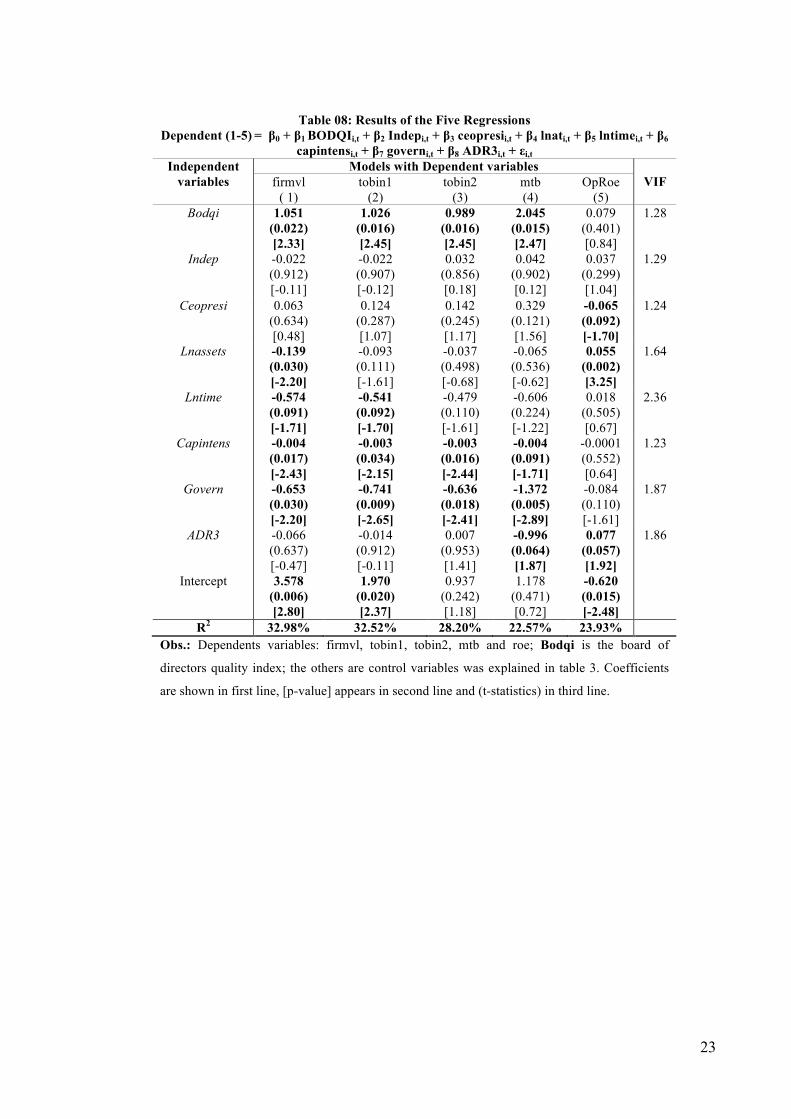
After evaluated the effect and relation (by regressions above) of each characteristics
parameterized by binary variables, the results of the second regression using the index of
board of directors quality will be present as follow:
[INSERT TABLE 8 HERE]
The results show positive and strong slope coefficients4 1.051, 1.026, 0.989, 2.045, for
firm value, tobin1, tobin2 and market-to-book with BODQI, respectively. But the BODQI is
not statistically significant with performance measured by OpRoe.
This result is interesting because in all tests the slope coefficient is higher than other
studies that used indices. In this case, this research focuses only in BOD quality as
mechanism of corporate governance not mixed with others dimensions of governance,
avoiding problems with theoretical and outcomes of statistical regressions link. The results
suggest that the market recognize these high types of BODs when look for value variables.
In both regressions the dummy variable govern for firms state-owned have negative
relation to value and performance suggesting that these firms can be target of potential
political conflict of interests or a lack of professional management. This result suggests that
possibly there are more agency problems in these companies.
ADR3 is only significant but negative related to mtb (-0.996), however, slight positive
relation with OpRoe which may suggests that market realize the high costs to trade ADRs at
US Capital Market to arrange firm internally.
4 The slope coefficients changes in very small percentage when use different or insert new control variables. For BODQI the lower coefficient obtained in tests was 0.84.
14
6 Conclusion and Implications for Future Research
This paper developed a new index that measure the quality of Board of Directors
contributing to the literature about internal corporate governance mechanisms using diversity
on directors’ attributes to categorize the points to the BODQI. The focus in one feature of
corporate governance can improve analysis and the empirical relations among variables, while
in the literature there are many indices linking internal and external mechanisms and put all
together making it difficult to analyze results providing unclear links among indices and firm
value and performance (BHAGAT; BOLTON; ROMANO, 2007).
The results firstly show the relation of each characteristics and their relation with
different measures of value and performance. The main evidences that impact value positively
are: i) directors with higher education degrees; ii) accountants seated in the boards; iii)
directors that participated in management/executive programs (courses) and; iv) the BODQI
impact firm value positively greater than variables separated.
These results show that market recognize growth opportunities of firms (looking to the
market-to-book) and the signaling of higher education degrees and other characteristics
sounds good to the reputation of these directors in the market. Meanwhile, these results lead
us to inconclusive considerations about arrangement of different bachelor’s degrees of the
directors.
The expectation is that the index developed in this study can contributes to the
literature, investors, practitioners and regulators since the BODQI is related with all
dependents variables of value and focus only in qualitative characteristics and attributes that
signaling quality and reputation from board of directors to the market.
As many studies with specific samples using large firms as Carcello et al (2002), this
research have the same limitations such as to use large public firms and a small number of
observations, because of these boundaries this study should be regarded as an exploratory
investigation.
For future research I suggest to use a large sample of firms sorted randomly and an
international comparison of the index to validate their consistency or put new variables
(characteristics) in the context. Another concern is whether board of director’s characteristics
affects firm value or the environment needs boards of directors with high types of
professionals.
15
REFERENCES
BHAGAT, Sanjai; BOLTON, Brian; ROMANO, Roberta. The Promise and Peril of
Corporate Governance Indices. ECGI working paper. oct., 2007
BECHT, Marco, BOLTON, Patrick, RÖELL, Ailsa. Corporate governance and control.
ECGI Finance Working Paper n. 02/2002. Disponível em
<http://ssrn.com/abstract_id=343461>, 2002.
BEINER, Stefan, DROBETZ, Wolfgang, SCHIMD, Markus e ZIMMERMANN, Heinz. An
Integrated framework of corporate governance and firm valuation – Evidence from
Switzerland. ECGI finance working paper series, n. 34/2004, January, 2004. Available at
<http://papers.ssrn.com/abstract_id=489322>.
BLACK, Bernard. The corporate governance behavior and market value of Russian firms.
Emerging Markets Review, v. 2, p. 89-108, 2001.
BLACK, Bernard; JANG, Hasung; KIM, Woochan. Does corporate governance predict firms'
market values? Evidence from Korea. Journal of Law, Economics, and Organization. v.
22, n. 2, Fall, 2006.
CARCELLO, Joseph V.; HERMANSON, Dana R. NEAL, Terry L.; RILEY Jr, Richard A.
Board characteristics and audit fees. Contemporary Accounting Research. 19, 3; Fall, 2002.
DENIS, Diane, McCONNELL, John. International corporate governance. Journal of
Financial and Quantitative Analysis. v. 38, n. 1, p. 1-36, March, 2003.
EISENBERG, T.; SUNDGREN, S.; WELLS, M.T. Larger board size and decreasing firm
value in small firms. Journal of Financial Economics, v. 48 n. 1, pp. 35-54, 1998.
FAMA, Eugene F.; JENSEN, Michael C. Separation of Ownership and Control. Journal of
Law and Economics. Vol. XXVI, June 1983.
FELTOVICH, Nick; HARBAUGH, Richmond; TO, Ted. Too cool for school? Signaling and
countersignaling. The Rand Journal of Economics. 33, 4, 2002.
FICH, Eliezer M.; WHITE, Lawrence J. WHY DO CEOs RECIPROCALLY SIT ON EACH
OTHER'S BOARDS? Journal of Corporate Finance, Vol. 11, pp. 175-195, 2005.
FICH, Eliezer M.; SHIVDASANI, Anil. Financial Fraud, Director Reputation, and
Shareholder Wealth. AFA 2006 Boston Meetings Paper. April, 2006.
GREGORY, Holly J. International comparison of corporate governance: Guidelines and
best practice in emerging markets. Weil, Gotshal & Manges LLP, 2000.
KENNEDY, Peter. A guide to econometrics. 5. th. The MIT Press: USA, 2006.
16
HALLOCK, Kevin. Reciprocally interlocking boards of directors and executive
compensation. Journal of Financial and Quantitative Analysis. 32, 3, Sep., 1997.
HERMALIN, B.; WEISBACH, M. Boards of directors as an endogenously determined
institution: a survey of the economic literature. Economic Policy Review of the Federal
Reserve Bank of New York, v. 9, n. 1, p. 7-36, 2003.
IBGC – Instituto Brasileiro de Governança Corporativa. Código das Melhores Práticas de
Governança Corporativa. Available at <http://www.ibgc.org.br>. January, 2004.
JENSEN, M. C. The modern industrial revolution, exit, and the failure of internal control
systems. Journal of Finance. v. 48, 831-880, 1993.
KLAPPER, Leora, LOVE, Inessa. Corporate governance, investor protection, and
performance in emerging markets. World Bank Policy Research Working Paper n. 2818,
April, 2002.
KLEIN, April. Firm performance and board committee structure. The Journal of Law &
Economics. 41, 275-303, 1998.
LEAL, Ricardo. P., CARVALHAL-DA-SILVA, André L. Corporate governance and value,
in Brazil (and in Chile), Inter-American Development Bank, Latin American Research
Network, Research Network Working Paper #R-514, 2005. Available at
<http://www.iadb.org/res/pub_desc.cfm?pub_id=R-514>. Feb., 2006
LEBLANC, Richard W. Boards of directors: an inside view. Ph.D. Dissertation. Toronto,
Canada 2003.
McINTYRE Michael L.; MURPHY; Steven A.; MITCHELL, Paul. The top team: examining
board composition and firm performance. Corporate Governance. v. 7, n. 5, pp. 547-561,
2007.
MIZRUCHI, Mark S. What do interlocks do? An analysis, critique, and assessment of
research on interlocking directorates. Annual Review of Sociology. v. 22, 1996.
MURPHY; Steven A.; McINTYRE Michael L. Board of director performance: a group
dynamics perspective. Corporate Governance. v. 7 n. 2, , pp. 209-224, 2007.
PEASNELL, K. V.; POPE, P.F.; YOUNG, S. Board monitoring and earnings management:
Do outside directors influence abnormal accruals? Lancaster University Working Paper.
Oct., 2000.
SHAPIRO, Carl. Premiuns for high quality products as returns to reputations. The Quaterly
Journal of Economics. Vol.48, n.4, p.659-680, 1983.

17
SHLEIFER, Andrei, VISHNY, Robert. A survey of corporate governance. Journal of
Finance. v. 52, n. 2, p. 737-783, 1997
SILVEIRA, Alexandre Di Miceli da. Governança Corporativa e estrutura de propriedade:
determinantes e relação com o desempenho das empresas no Brasil. Tese (Doutorado). 2004.
250p. Faculdade de Economia, Administração e Contabilidade, Universidade de São Paulo,
2004
SPENCE, Michael. Signaling in retrospect and the informational structure of markets. The
American Economic Review. 92, 3, Jun 2002.
WATTS, Ross L.; ZIMMERMAN, Jerold L. Positive accounting theory: a ten year
perspective. The Accounting Review. v. 65, n. 1, p. 131-156, jan., 1990.
Yermack, D. Higher market valuation of companies with a small board of directors. Journal
of Financial Economics, Vol. 40 No. 2, pp. 185-211, Fall 2002.
ZAJAC, Edward; WESTPHAL, James D. Director reputation CEO-board power, and the
dynamics of board interlocks. Administrative Science Quarterly. 41, 3, Sep 1996.
18
Table 1: Variables Definitions: Education Attributes in the Board of Directors Quality Index
iMBA Consider 1 if firms have directors with post-graduations in any quantity and hope that will have positive slope coefficient in regression. MBAs courses can bring to directors modern management tools, techniques or practical cases to implement their knowledge in firms.
iMD/PhD Through the same intuition in MBA variable, the idea to use and control for directors that hold Master or Doctor degrees is that they improve their qualifications and expertise. There is no information of how many directors have these courses in any area and to be conservative considering one point with firms that have at least one director with any post-degree seated in the BOD. There is no expectation to beta signal.
iBusinDeg Undergraduates’ in business areas in almost all codes are preventive to the characteristics that lead to business experience and recommend to directors have knowledge in finance, accounting, economics and management (GREGORY, 2000), in Brazilian code recommendation is that at least three directors needs to have basic knowledge of finance and accounting, again, to be more conservatively was considered at least 50% of board, 1 point to firms with directors bachelors in accounting, business administration and economics and expect to have positive slope coefficient.
iOtherDeg Other degrees capture the diversity of different undergraduates such as law, engineering, geology and others courses that can contribute to discuss ideas and others point of view or specific to the firm business strategy. The suggestion is at least 30% of directors’ bachelors in others courses and expects to be positive relation to firm value and performance.
iAccount Accountant seated in BOD is a proxy for higher knowledge in accounting, auditing and financial management areas as recommended by IBGC Code (2003, p. 22) and other codes (GREGORY, 2000) for at least one of the three directors with basic knowledge in finance and accounting. Even others directors have high knowledge in accounting and finance, the expectation is that accountants are instructed to improve monitoring to avoid earnings management or fraud practices and work as an advisor in BOD. Thus, consider 1 point to the index if firm have an accountant seated in the BOD. This point we construct to differentiate firm characteristics, because firms win point in iBusinDeg and one more in this variable. There is no expectation for the signal of this variable.

19
Table 2: Variables Definition: Other Characteristics and Board of Directors Quality Index iSize Board size – there is no conclusive answer in the literature for an adequate board size. Each
firm needs to have sufficient directors to do a better control of executive officers. The Brazilian Institute of Corporate Governance (IBGC) recommends BOD size between 5 and 9 directors. The expectation is positive slope coefficient for firms that follow this recommendation. Finally, BOD size can contribute to improve their performance and monitoring (JENSEN, 1993).
iAge Age as suggested in the literature an adequate amplitude can contributes to directors renew ideas and discuss planning between young and old directors. There is no expectation to the signal of this slope coefficient. Many codes consider age as a relative weight to firm performance. A mean age between 30 and 60 years is a reasonable standard deviation to work together young and old directors.
iCeoCourse Executive/Management Programs is considered a additional contribution in BODs. Education or actualization (participation in these programs) increases BOD quality. Thus, we accept the advice from IBGC that directors must continue improving their performance to act with long-term focus that it is essential submit themselves to training programs for continuing to upgrade and recycling knowledge’s (IBGC, 2003, p. 32).
iBusy Busy Directors/Others activities of directors since they do not assume more than 3 responsibilities beyond the actual board such as another board seats, office functions, work in other firms and so on. This feature agrees with board size, because great BOD can emerge free-rider problem or out of attention with firm long-term planning (JENSEN; MECKLING, 1976). Thus, consider one point for firms with no more than 30% of directors in this condition and zero otherwise. There is no expectation for the signal.
iMax20% No more than 20% of executive officers or internals in the BOD. How there is few studies of BOD characteristics in Brazil, assume that more than 20% (what is a high amount) of executives or employees because IBGC recommend to BOD have more independents directors than internal directors in the same direction of international codes (GREGORY, 2000). If firms have this parameter wins one point or zero otherwise to the score. The signal expectation is that firms that attend this proposition have positive slope coefficient.
BODQI The Board of Directors Quality Index is the sum of points obtained variables discussed above divided by 10. The assumption is that the aggregate composition of attributes can affect positively value and performance and to reduce bias control variables was applied together.
Table 3: Variables Definition: Control Variables
Indep The independence level of the BOD. An internal mechanism of corporate governance measured by outsiders’ directors divided by total size.
Ceopresi Almost all codes recommend that there are different persons seated on officer and BOD. If CEO is different person from the chairman of the BOD obtain 1 and 0 otherwise.
Lntime Time in years that firms have ADRs listed in NYSE (log of years) can show a learning curve to improve corporate governance mechanisms.
ADR3 Higher ADR Level is used only for firms in the third level because the sample consists mainly in firms with ADR level 2 and ADR level 3.
Lnassets Firm Size (log of assets) is a specific characteristic and size can affect governance structure in two points: agency costs and firms’ financing structure.
Capintens Capital Intensity or Tangibility is a proxy for firm’s effectiveness and we suppose to be related to Tobin’s measures and performance.
Govern State-Owned Management firms assuming 1 whether state-owned control or 0 otherwise. Firms managed by government can have weak governance structure and affect value negatively.
Table 4: Variables Definition: Dependent Variables
Firmvl Firm Value is measured by total value of the firm shares divided by total assets. Tobin1 Tobin’s Q 1 is [(book value of assets - book value of equity + firm value of the equity)/book value
of assets]. The expectation is that this formula capture other relations that the traditional measure. Tobin2 Tobin’s Q 2 is (market value of equity + book value of debts defined as the sum of current debt,
long-term debt and inventories less current assets divided by book value of assets). Mtb Market-to-book indicates growth opportunities and expectation of the market. We measure by
market value of the equity divided by book value of the equity. OpRoe To measure performance return on equity is the ratio of net operating income divided by book value
of the equity.
20
Table 5: Descriptive statistics of Independents (I) and Dependents (D) variables Variable Obs Mean Std. Dev. Min Max Total (sum) Size (I) 119 9.310 2.88 3 16 1108 Age (I) 107 54.395 5.20 44.73 65.33
MBA (I) 119 2.378 1.75 0 8 283 Md (I) 119 1.781 1.46 0 6 212 Doc (I) 119 0.949 1.03 0 4 113
%business (I) 119 0.463 0.20 0 0.857 524 %otherprof (I) 119 0.443 0.19 0.111 1 487
Account (I) 119 0.184 0.38 0 1 25 %busy (I) 119 0.456 0.23 0 1 505
%max20 (I) 119 0.072 0.12 0 .5 66 Cursoexec (I) 119 0.630 0.80 0 3 75
Indceo (I) 118 0.830 0.37 0 1 98 %indep (I) 119 0.907 0.14 0.118 1 101
ADRtime (I) 119 4.873 2.63 0.6 14 Capintens 116 10.700 45.79 0.188 315.503 Lnassets 119 15.929 1.27 12.491 19.165 ADR3 (I) 119 0.394 0.49 0 1 Govern (I) 119 0.201 0.40 0 1 iMBA (I) 119 0.823 0.38 0 1 98
iAccount(I) 119 0.184 0.39 0 1 22 iMD/PhD (I) 119 0.882 0.32 0 1 105
iBusy (I) 119 0.310 0.46 0 1 37 iCeocourse (I) 119 0.445 0.49 0 1 53
iSize (I) 119 0.537 0.50 0 1 64 iAge (I) 119 0.722 0.45 0 1 86
iBusinDeg (I) 119 0.478 0.50 0 1 57 iMax20% (I) 119 0.857 0.35 0 1 102 iotherDeg (I) 119 0.621 0.48 0 1 74 Firmvl (D) 119 0.847 0.76 0.052 5.770 Tobin1 (D) 119 1.435 0.71 0.692 6.072 tobin2 (D) 119 1.103 0.67 0.085 5.405 Mtb (D) 119 1.993 1.31 0.213 8.2756
OpRoe (D) 119 0.307 0.17 -0.236 0.787 BODQI (I) 119 0.586 0.14 0.3 1 69.8
21
Table 6: Correlation of Dependents variables, Index and Control Variables
BODQI Indep Ceopresi Lnat Lntime capinst govern AD3 BODQI 1.0000 Indep 0.1021 1.0000
Ceopresi 0.0992 0.3394 1.0000 Lnassets 0.1305 0.1363 -0.0131 1.0000 Lntime 0.0811 -0.0256 -0.1310 0.1696 1.0000 Capint -0.0201 0.1185 0.1017 -0.0771 -0.1265 1.0000 Govern 0.1941 -0.0245 0.2169 0.4285 -0.3058 -0.0949 1.0000 ADR3 -0.2738 -0.0071 0.1015 0.1336 -0.3634 -0.1684 0.3854 1.0000
Vlrfirm 0.0963 -0.0958 0.0042 -0.2271 -0.0689 -0.0717 -0.1862 0.0237 Mtb 0.1246 0.0137 0.0441 -0.1433 0.0350 -0.0379 -0.2329 -0.0284
Tobin1 0.0924 -0.0576 0.0278 -0.2054 -0.0732 -0.0467 -0.2111 0.0320 Tobin2 0.1165 -0.0402 0.0495 -0.1272 -0.0759 -0.1022 -0.1455 0.0541 OpRoe 0.0173 0.0728 -0.1789 0.3190 0.0875 -0.0649 0.0114 0.1282
22
Table 7: Results of the Five Regressions With Individual Characteristics Dependent (1-5) = β0 + β1 iMBAi,t + β2 iAccounti,t + β3 iMD/PhDi,t + β4 iBusyi,t + β5 iCeocoursei,t + β6
iSizei,t + β7 iAgei,t + β8 iBusinDegi,t + β9 iMax20%i,t + β10 iOtherDegi,t + β11 Indepi,t + β12 Ceopresii,t + β13 Lnati,t + β14 Goveni,t + β15 ADR3i,t + εi,t
Independent variable
Models with Dependent Variables VIF firmvl
( 1) tobin1
(2) tobin2
(3) mtb (4)
OpRoe (5)
iMBA
0.115 (0.453)
0.126 (0.366)
0.040 (0.774)
0.250 (0.367)
-0.102 (0.011)**
1.90
iAccount 0.441 (0.006)***
0.385 (0.009)***
0.401 (0.005)***
0.832 (0.013)**
-0.015 (0.687)
1.36
iMD/PhD 0.718 (0.023)**
0.675 (0.017)**
0.685 (0.013)**
1.274 (0.006)***
0.166 (0.005)***
2.64
iBusy 0.253 (0.122)
0.247 (0.096)*
0.250 (0.083)*
0.304 (0.221)
0.037 (0.329)
1.45
iCeocourse 0.354 (0.004)***
0.331 (0.004)***
0.342 (0.002)
0.697 (0.004)***
-0.002 (0.965)
1.70
iSize 0.453 (0.005)***
0.377 (0.012)**
0.373 (0.009)***
0.778 (0.017)**
-0.012 (0.777)
1.90
iAge -0.091 (0.523)
-0.137 (0.304)
-0.167 (0.212)
-0.521 (0.074)*
-0.014 (0.742)
1.92
iBusinDeg -0.601 (0.030)**
-0.571 (0.023)
-0.496 (0.043)**
-0.752 (0.052)*
-0.004 (0.937)
3.14
iMax20% -0.781 (0.107)
-0.798 (0.068)*
-0.569 (0.182)
-1.141 0.084
-0.018 (0.774)
3.37
iOtherDeg 0.363 (0.095)*
0.359 (0.064)*
0.309 (0.102)
0.451 (0.173)
0.029 (0.575)
3.04
Indep 0.350 (0.013)**
0.303 (0.018)
0.313 (0.009)***
0.600 (0.029)**
0.040 (0.267)
1.50
Ceopresi 0.391 (0.172)
0.473 (0.071)*
0.392 (0.131)
0.959 (0.025)**
-0.025 (0.610)
2.24
Lnassets -0.092 (0.178)
-0.059 (0.366)
-0.018 (0.753)
-0.054 (0.630)
0.066 (0.002)***
3.31
Govern -0.654 (0.001)***
-0.687 (0.000)***
-0.613 (0.753)
-1.474 (0.000)***
-0.105 (0.017)**
1.57
ADR3 0.268 (0.088)*
0.282 (0.046)**
0.348 (0.015)**
0.567 (0.028)**
0.091 (0.015)**
1.82
Intercept 0.958 (0.259)
1.077 (0.167)
0.177 (0.811)
0.074 (0.963)
-0.902 (0.002)***
R2 45.67% 48.14% 42.77% 46.96% 46.38% Obs.: All variables that start with “i” are binary (1 or 0) according to the BODQI. Dependents variables: firmvl, tobin1, tobin2, mtb and roe; Independent variables and control variables was presented in tables 1, 2 and 3, respectively.
23
Table 08: Results of the Five Regressions Dependent (1-5) = β0 + β1 BODQIi,t + β2 Indepi,t + β3 ceopresii,t + β4 lnati,t + β5 lntimei,t + β6
capintensi,t + β7 governi,t + β8 ADR3i,t + εi,t Independent
variables Models with Dependent variables
VIF firmvl ( 1)
tobin1 (2)
tobin2 (3)
mtb (4)
OpRoe (5)
Bodqi
1.051 (0.022) [2.33]
1.026 (0.016) [2.45]
0.989 (0.016) [2.45]
2.045 (0.015) [2.47]
0.079 (0.401) [0.84]
1.28
Indep -0.022 (0.912) [-0.11]
-0.022 (0.907) [-0.12]
0.032 (0.856) [0.18]
0.042 (0.902) [0.12]
0.037 (0.299) [1.04]
1.29
Ceopresi 0.063 (0.634) [0.48]
0.124 (0.287) [1.07]
0.142 (0.245) [1.17]
0.329 (0.121) [1.56]
-0.065 (0.092) [-1.70]
1.24
Lnassets -0.139 (0.030) [-2.20]
-0.093 (0.111) [-1.61]
-0.037 (0.498) [-0.68]
-0.065 (0.536) [-0.62]
0.055 (0.002) [3.25]
1.64
Lntime -0.574 (0.091) [-1.71]
-0.541 (0.092) [-1.70]
-0.479 (0.110) [-1.61]
-0.606 (0.224) [-1.22]
0.018 (0.505) [0.67]
2.36
Capintens -0.004 (0.017) [-2.43]
-0.003 (0.034) [-2.15]
-0.003 (0.016) [-2.44]
-0.004 (0.091) [-1.71]
-0.0001 (0.552) [0.64]
1.23
Govern -0.653 (0.030) [-2.20]
-0.741 (0.009) [-2.65]
-0.636 (0.018) [-2.41]
-1.372 (0.005) [-2.89]
-0.084 (0.110) [-1.61]
1.87
ADR3 -0.066 (0.637) [-0.47]
-0.014 (0.912) [-0.11]
0.007 (0.953) [1.41]
-0.996 (0.064) [1.87]
0.077 (0.057) [1.92]
1.86
Intercept 3.578 (0.006) [2.80]
1.970 (0.020) [2.37]
0.937 (0.242) [1.18]
1.178 (0.471) [0.72]
-0.620 (0.015) [-2.48]
R2 32.98% 32.52% 28.20% 22.57% 23.93% Obs.: Dependents variables: firmvl, tobin1, tobin2, mtb and roe; Bodqi is the board of
directors quality index; the others are control variables was explained in table 3. Coefficients
are shown in first line, [p-value] appears in second line and (t-statistics) in third line.